High-End Tube Amplifier Design
A Toolbox for Audio Lovers and Engineers
Academy Pro Title by Zoran M. Dukic
Zoran M. Dukic
● This is an Elektor Publication. Elektor is the media brand of Elektor International Media B.V.
PO Box 11, NL-6114-ZG Susteren, The Netherlands Phone: +31 46 4389444
● All rights reserved. No part of this book may be reproduced in any material form, including photocopying, or storing in any medium by electronic means and whether or not transiently or incidentally to some other use of this publication, without the written permission of the copyright holder except in accordance with the provisions of the Copyright Designs and Patents Act 1988 or under the terms of a licence issued by the Copyright Licencing Agency Ltd., 90 Tottenham Court Road, London, England W1P 9HE. Applications for the copyright holder's permission to reproduce any part of the publication should be addressed to the publishers.
● Declaration
The author and publisher have made every effort to ensure the accuracy of the information contained in this book. They do not assume, or hereby disclaim, any liability to any party for any loss or damage caused by errors or omissions in this book, whether such errors or omissions result from negligence, accident, or any other cause.
● ISBN 978-3-89576-684-8 Print ISBN 978-3-89576-685-5 eBook
● © Copyright 2025 Elektor International Media www.elektor.com
Editor: Jan Buiting, MA Prepress Production: D-Vision, Julian van den Berg Printers: Ipskamp, Enschede, The Netherlands
Elektor is the world's leading source of essential technical information and electronics products for pro engineers, electronics designers, and the companies seeking to engage them. Each day, our international team develops and delivers high-quality content - via a variety of media channels (including magazines, video, digital media, and social media) in several languages - relating to electronics design and DIY electronics. www.elektormagazine.com
To My Daughter Milena
As a focus of the audiophiles, sound is a very complex matter considering its physics and physiology characteristics. Live music sound comes to the audiophile’s home audio systems processed by a sophisticated electronics audio chain: live music, recording processes, sound carrier manufacturing. All specifics of human hearing process and differences in physical ambient of live music and home music listening must be taken into account. Most of the problems, including subjective feeling of sound (equiphonic lines or contour), sound levels, frequency response, reverberation time (adopted to law dimension of home listening room), distortion, noise, dynamics (ratio of the highest and the lowest levels of sound in music rendition…) are solved in recording process by very complicated electronic equipment.
Audiophiles typically want to listen the music in the home environment, with sound reproduction which exhibits the highest order of artistic and subjective resemblance to that of the performance in concert hall. At home, music comes from the electronics audio chain (sound currier, reproduction unit, preamplifier, power amplifier and speaker) instead from the music artists. Physical ambient of the home is totally different than the original ambient where the live music is performed. The music artists, audio scientist and audio equipment constructors packed all this things together to fulfill the audiophile’s desires, guided by the human ear, with its specific hearing mechanism as the final judge.
Without any ambition to present high level science article, this book has to be accepting as a tool box for audiophiles Hi End equipment designers. The elementary theory is present at the form just necessary to the readers to understand and become familiar with the nature of physics, electric, electromagnetic and electronic process present in certain tool. Each tool is explained in a minimum of words and theory with some equations or figures presented “as is”.
So, in the following chapters I will try to guide you through the process of designing quality amplifiers, from the very beginning, fully taking into account both technical and subjective requirements, theory and practice.
Post Scriptum
Some topics are found in unusual places in the book and there is a visible deviation from the methodology of composing a school and science text - the author just wanted to encourage readers on their original path to the realization of their ideas in the world of designing Hi End equipments.
The book is a compilation of the author’s notes used in his professional and educational career, but the book was nevertheless primarily written as a result of true love for the audiophile hobby.
Zoran M. Dukic
SI Basic Quantity
SI Electrical Quantity Unit /
electrical capacitance
conductivity
flux density
induction
SI Electromagnetism Units
Name Symbol Dimension(s)
ampère
(SI base unit) A A
coulomb C A·s
volt V J/C = kg·m2·s−3·A−1
ohm Ω V/A = kg·m2·s−3·A−2
watt W V·A = kg·m2·s−3
Farad F C/V = kg−1·m−2·A2·s4
siemens S Ω−1 = kg−1·m−2·s3·A2
weber Wb V·s = kg·m2·s−2·A−1
tesla T Wb/m2 = kg·s−2·A−1
ampère per meter A/m m−1·A
henry H Wb/A = V·s/A = kg·m2·s−2·A−2
henry per meter H/m kg·m·s−2·A−2
Quantity
Current
Quantity of electricity
Potential difference
Resistance
Electrical power
Capacitance
Conductance
Magnetic flux
Magnetic flux density
Magnetic induction
Inductance
Permeability
Unit multiplies and sub-multiplies Symbol
II. Some Numerical Values and Mathematics
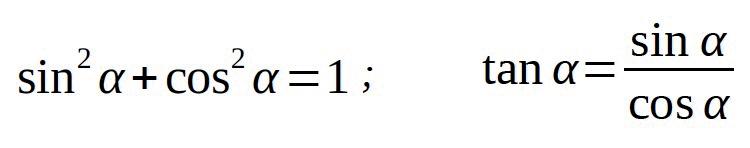
Trigonometry formulas:
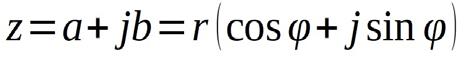
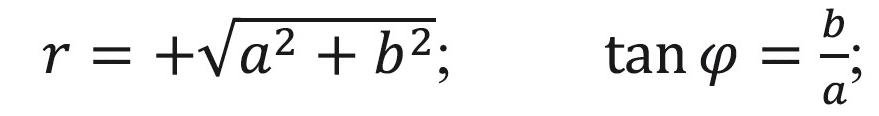
Complex number – trigonometric form:
Rectangular coordinate system
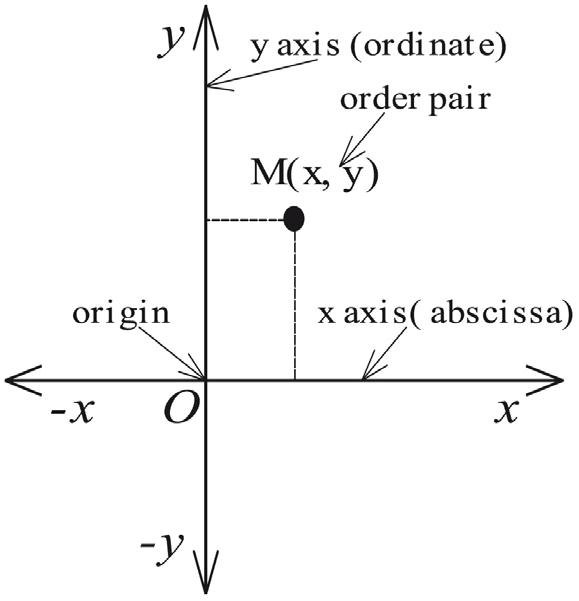
A rectangular coordinate system consists of two real number axes that intersect at right angle. The axes intersect at the point O, which is called the origin. The horizontal axis is called the x axis or abscissa, and the vertical axis is called the y axis or ordinate. These two axes define a flat surface called a plane, and each point on this plane is associated with an ordered pair of real numbers (x, y) i.e., an ordered pair (x, y) represents the position of the point relative to the origin.
A mathematical function is an expression, rule, or law that defines a relationship between one variable (the independent variable denoted as x) and another variable (the dependent variable denoted as y). This relation is commonly symbolized as y = f(x).
A function can be represented by a table, formula, or graph. Very often in electronics, the representation of some functions in a rectangular coordinate system is used. The independent variable is plotted on the x axis and the dependent variable y is plotted on the y axis. The graph of a function is composed of a series of points with coordinates (x, y) where y = f(x).
A simplified definition of a mathematical function applicable in electronics is: a special relationship where each input (variable, electrical signal) has a corresponding (depended variable, output signal response or electrical signal).
The Sine function (Sinusoidal waveform) is a basic function used in analog electronics.
A(t )=Ao×sin (ω×t)
A0 – amplitude (peak or maximum)
ω – angular frequency (radians per second)
The sine function has a very important application in analog electronics. Many of the variables in analog electronics can be described or expressed by a sine function.
A sine function is a periodic function and in the time domain can be written as:
Another way of representing a sine function (sinusoidal wave form) is in terms of a rotating phasor.
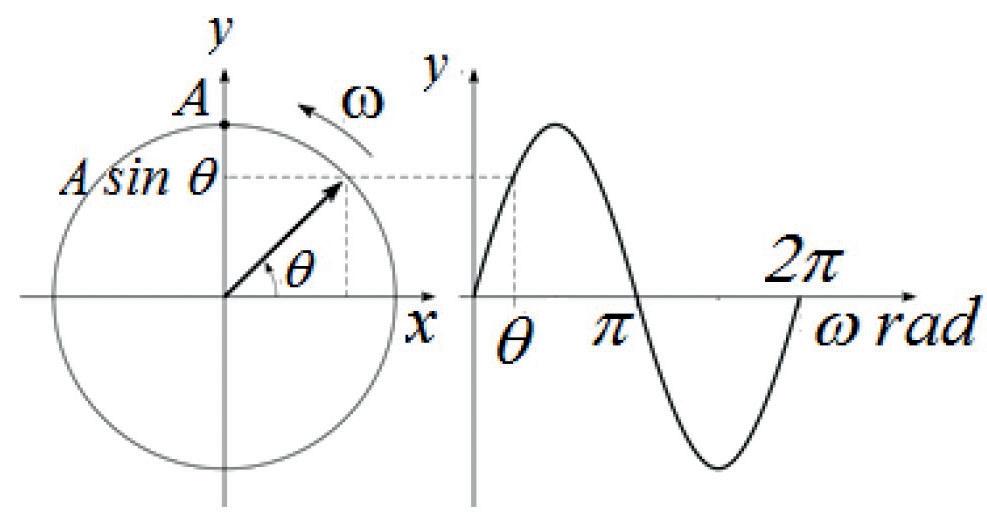
Radian
A phasor has a magnitude A and rotates at a fixed angular speed ω, so that the angle θ from the x-axis to the phasor increases with time.
The y - component of the phasor (i.e. its ‘projection’ y = A sin θ on to the y-axis) varies with θ in the form of a sine function. The magnitude A of the phasor is equal to the amplitude At any time t, the angle θ of the phasor is equal to the phase (generally, ωt + φ).
A Radian (rad) is mathematically defined as a quadrant of a circle where the length of the arc of the circle is equal to the radius (r) of the circle. Since the circumference of a circle is equal to 2π × radius, and since a full circle is 3600 (3600 = 2π radian), that is 1 radian = 3600 /2π = 57.30
Degrees to radians conversion table:
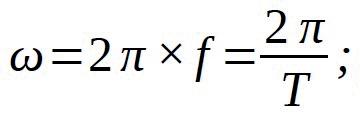
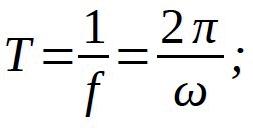
If the time of a cycle or period (the time it takes to complete one full cycle) is denoted by T and if one cycles is taken to be equal to 2π radians:
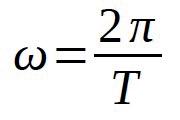
( radian / s )
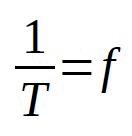
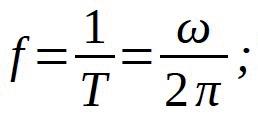
The reciprocal of the cycle time T is the frequency (cycles per second): ( unit: Hz )
In general:
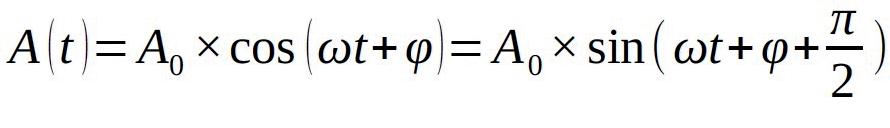
φ – phase angle
Other relations:
The sine function describes alternating voltage (Uac) and curent (Iac).
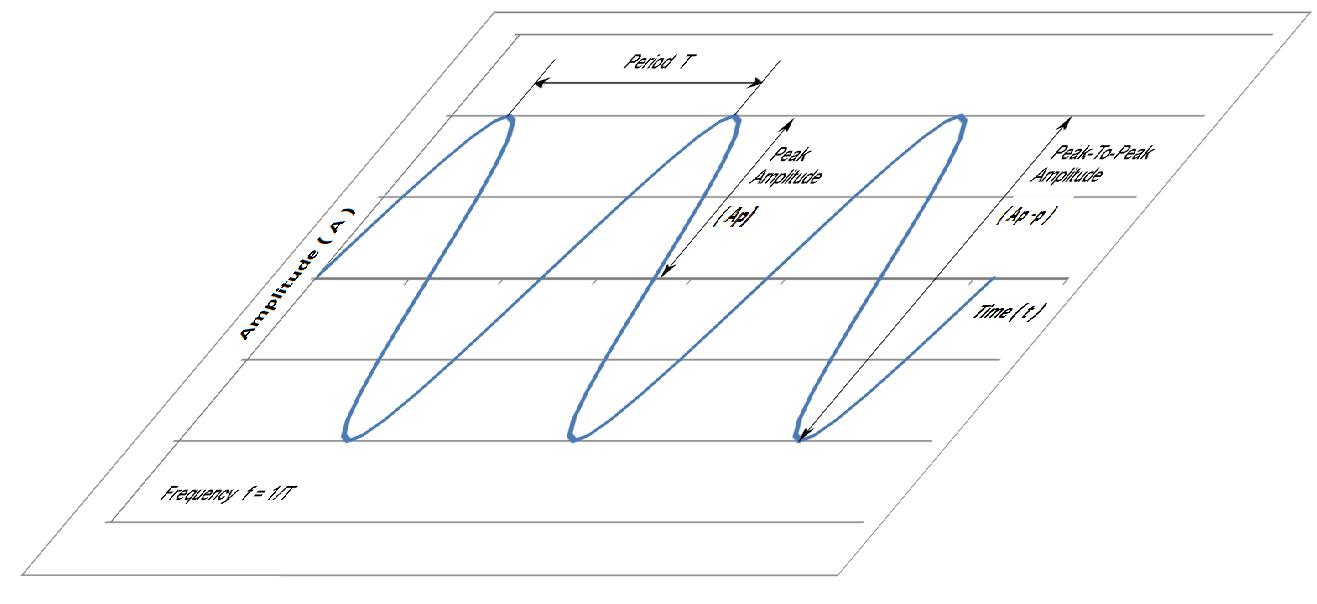
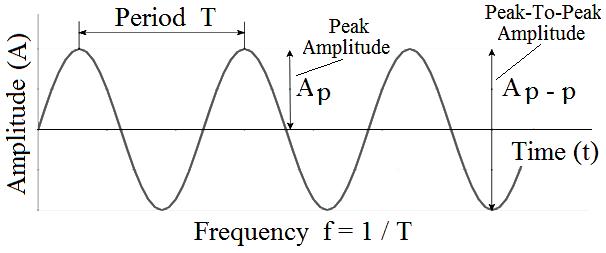
Sinusoidal waveform
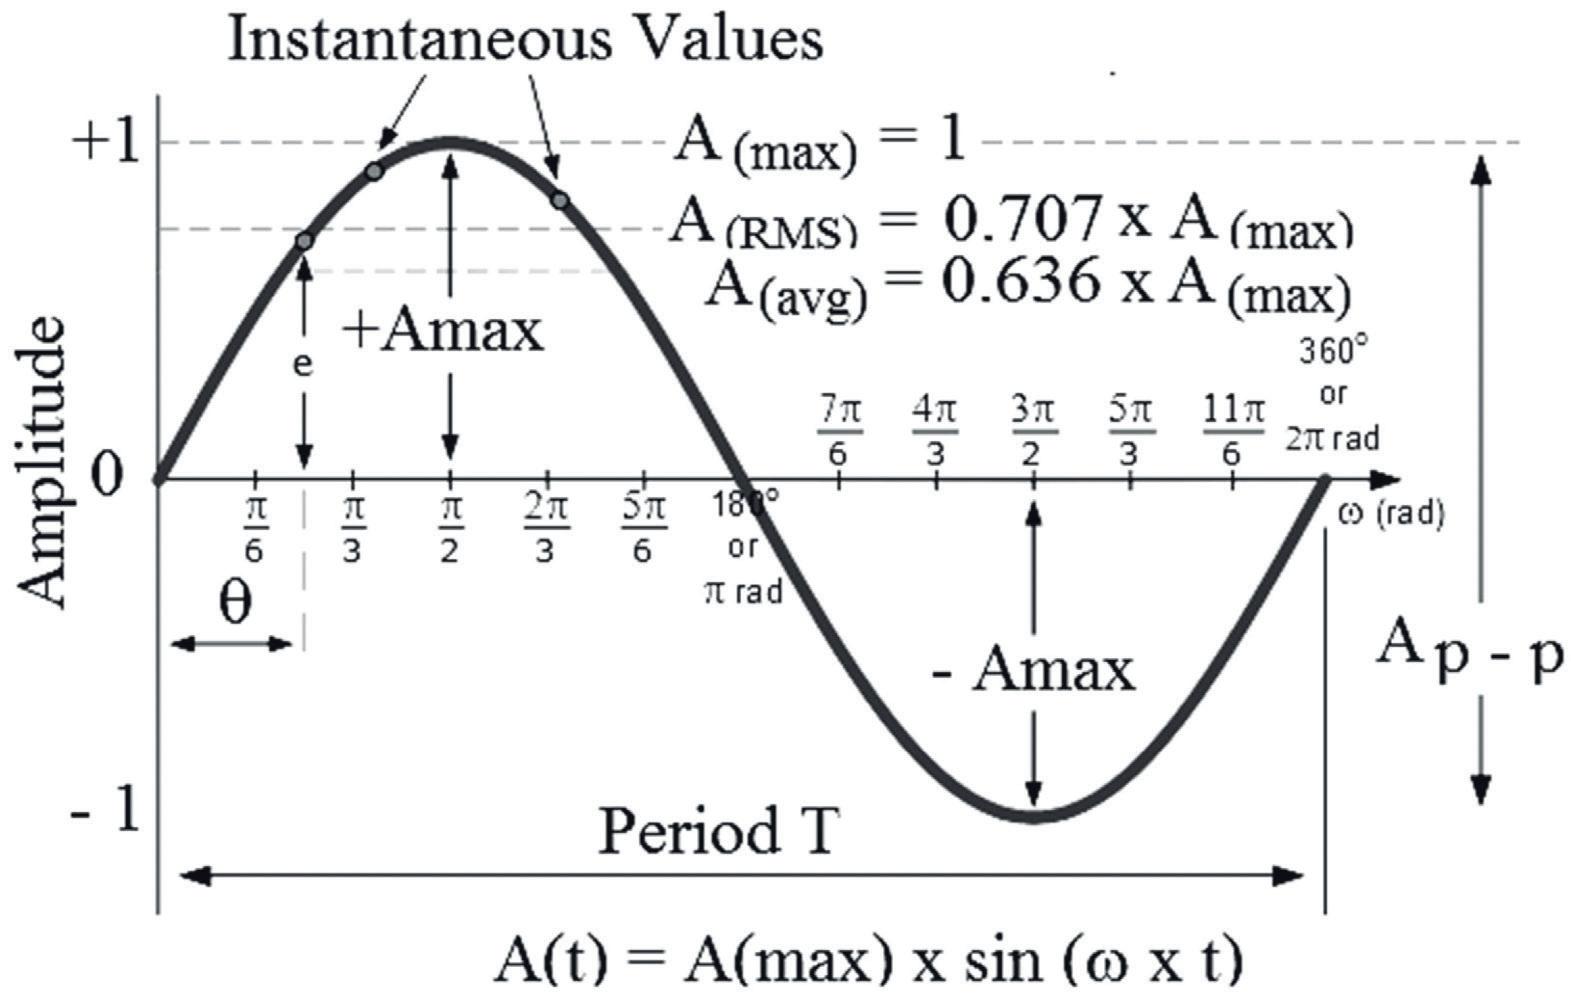
Definitions
▲ Peak value; ( UP )
The peak value is the maximum positive or negative value of an alternating waveform, such as voltage (UP) or current, during a given time interval.
▲ Peak–to–peak (p-p) value; ( UP-P)
Peak – to – peak value is the difference between the maximum positive and negative values of an alternating wave form in a complete cycle.
▲ Amplitude
The amplitude is the value of an alternating waveform in the positive or negative direction at the particular moment. The term is often used to denote a peak value.
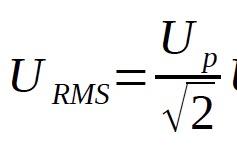
▲ Root – mean – square ( RMS ) value [ effective value ]; ( URMS ), ( Ueff )
The RMS value, or the so-called effective value, is the square root of the arithmetic mean value of the square of the instantaneous current or voltage values, or other periodic quantities during one complete cycle. The RMS value of a sine wave is the peak value divided by the square root of 2. (Electrically: RMS is equal to the value of the DC current that would produce the same power dissipation in a resistive load).
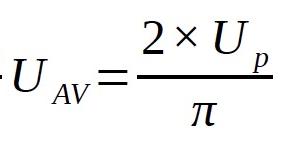
▲ Average value; (UAV )
The average value of an alternating voltage or current is defined as the average of all values of voltage or current during one half-cycle of the waveform.
Technically: The average value of an alternating voltage or current is the value that would be obtained if the original voltage or current were fully rectified. The average value of a sine wave is the peak value multiplied by 2 and divided by π
▲ Phase angle
The phase angle of a waveform is the angular difference between two waveforms of the same frequency.
Two waveforms are said to be in phase when they have the same frequency and there is no phase difference between them. (the two waves should reach maximum, minimum and zero values simultaneously at the same time).
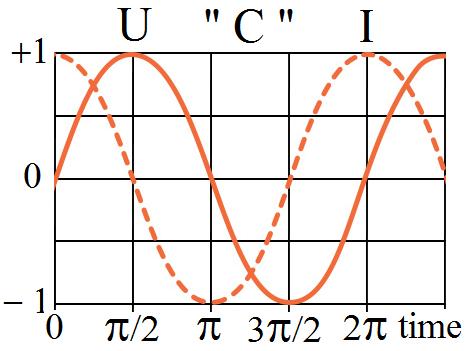
• Leading phase angle
A leading waveform is one that is ahead of a reference wave form of the same frequency.
• Lagging phase angle
A lagging waveform is one that is behind of a reference wave form of the same frequency.
Some types of waveform


IV. Ohm’s Law
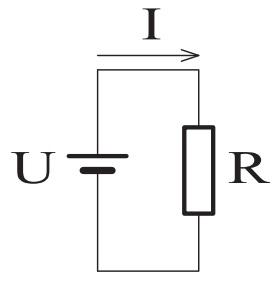
Ohm’s law is an equation that describes the fundamental relationship between voltage, current and resistance, i.e. the law that states that the direct current flowing in a conductor is directly proportional to the potential difference between its ends:
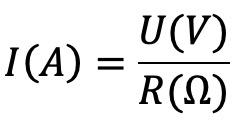
I=current ; U=voltage ; R=resistance
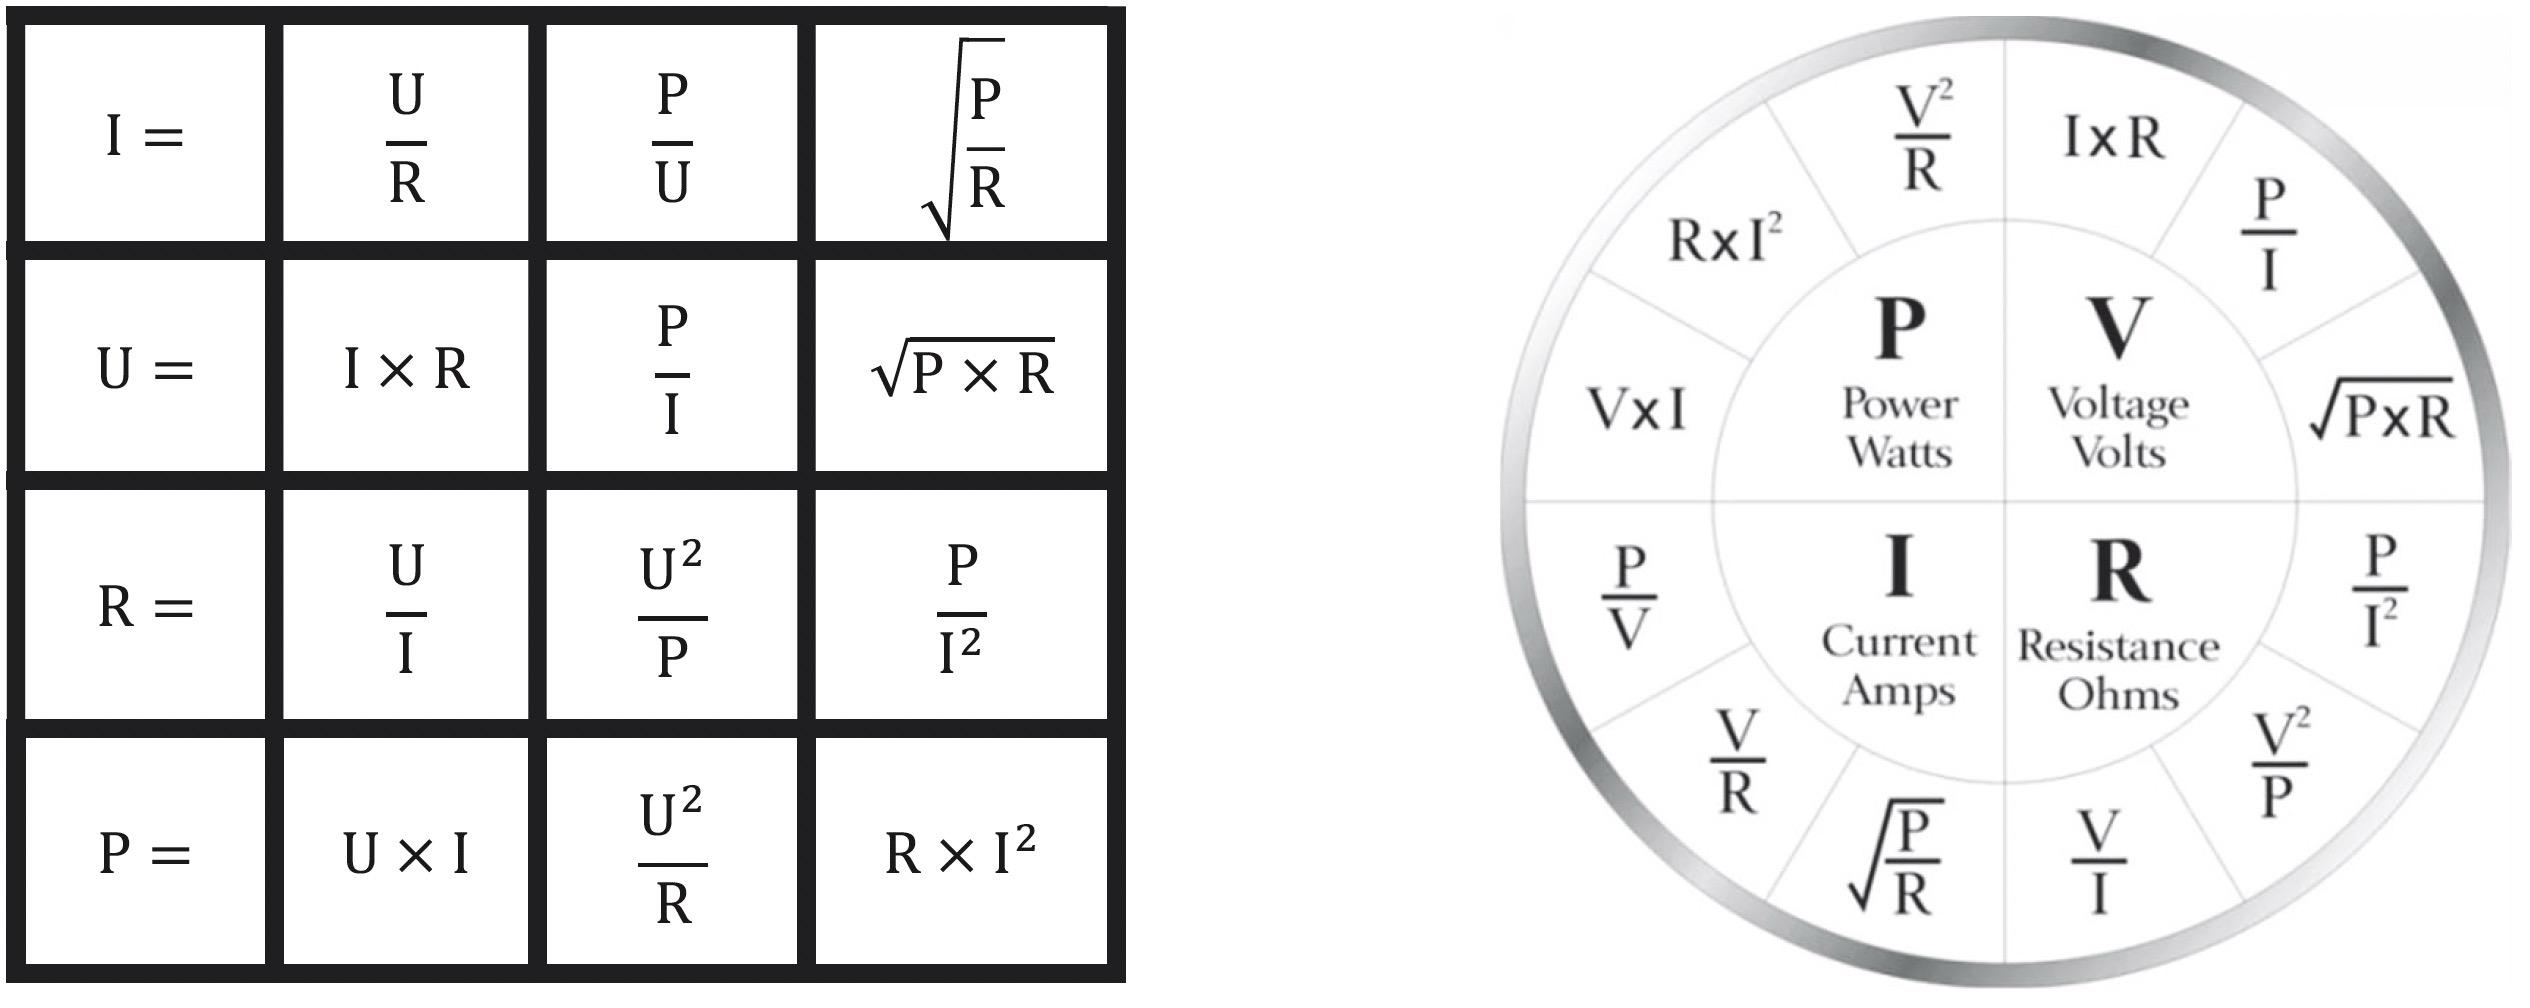
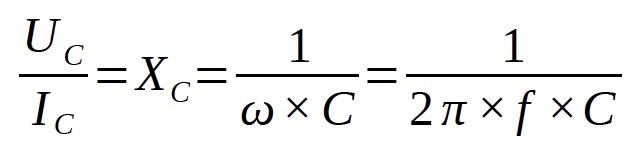
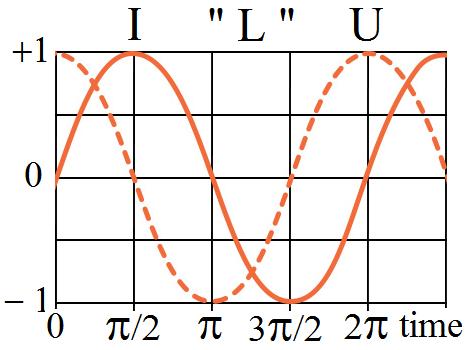
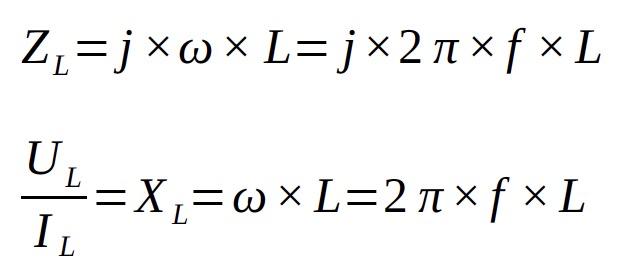
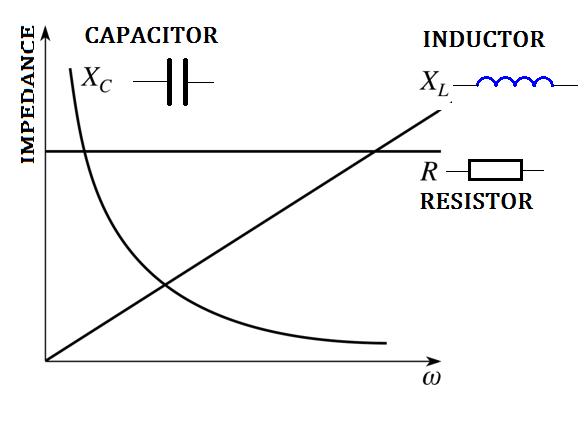
Ohm’s Law is valid for alternating-current circuits consisting of inductance and capacitance as well as resistance:
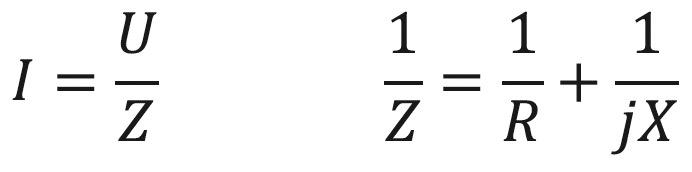
Z = impedance
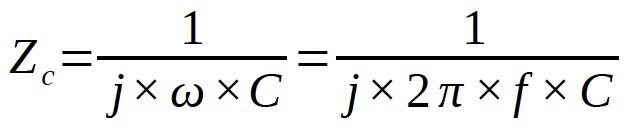
Capacitance, C:
Inductance, L:
Simplified, sound is defined as periodic changes in atmospheric pressure caused by the mechanical vibration of the sound source. From a physiology point of view, only periodic changes in atmospheric pressure in the frequency range between 20 Hz and 20 kHz, with a defined intensity, can be recognized by the human ear as sound.
Pure sound has only one periodic component with a defined frequency (fundamental frequency or fundamental harmonic).
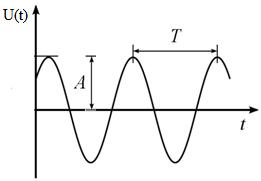
Figure 1-01.
The maximum value of the oscillation excursion is the Amplitude (A). The time taken by a sound wave to complete one cycle (a time span between two consecutive oscillations) is called a Period (T).
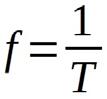
The value that is inversely proportional to the Period (T) is the frequency:
Complex sound: a sound that has more than one frequency component (sine wave).
Music tones have components with frequencies equal to the fundamental frequency multiplied by an integer (fundamental and higher-order harmonics).
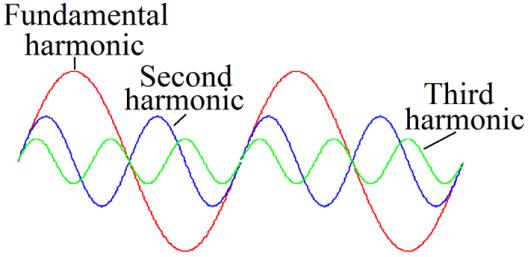
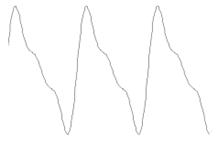
1-02.
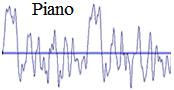
The distribution of higher order harmonics and their intensity are responsible for the specific color of the sound.
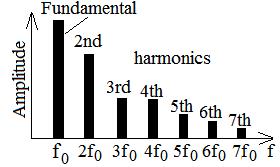
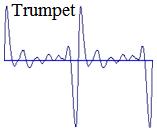
Figure 1-03.
According to physics and physiological research, the sense of sound loudness (sound level) basically depends on sound pressure or sound intensity.
The general equation of sound intensity (J) valid for all types of sound:
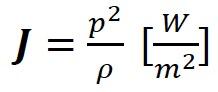
ρ – air density (1.29 kg/m3)
c – sound velocity in air
p – sound pressure (N/m2)
( sound velocity in air at the temperature t)
Pressure units:
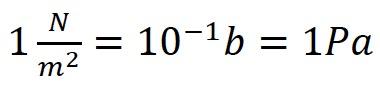
b – bar; Pa – Pascal
The lowest sound pressure below which the human ear cannot perceive sound (the lowest level of audible sound), is the level of hearing or threshold of hearing (threshold of audibility)
As a result of statistic research, the threshold of hearing (audibility) also known as a reference sound pressure at a frequency of 1 kHz is: (1-03)
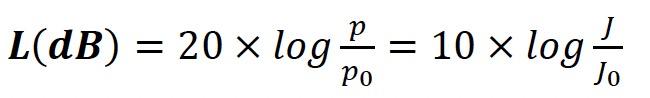
In practice, it is more suitable to use the units that show the relative relation between two values, known as: decibels (dB):
Logarithm
- Decade: base = 10 10x = N x = log10(N) = log( N)
- Natural: base = e = 2.71828... ex = N x = ln N
log(axb) = log(a) + log(b); log(a / b) = log(a) – log(b); log(an) = n x log(a); log(1 / a) = - log(a)
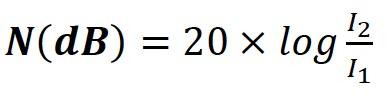
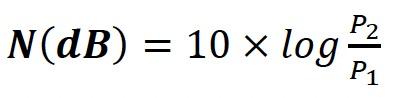
current)
(electrical power) (1-07)
The subjective feeling of sound level or loudness is nearly proportional to the logarithm of physical excitations (e.g., of sound pressure) [Weber–Fechner’s law].
The level of sound that causes pain in the ear is known as the level or pain threshold (130 dB).
Table 1-01. Sound
Table 1-02.
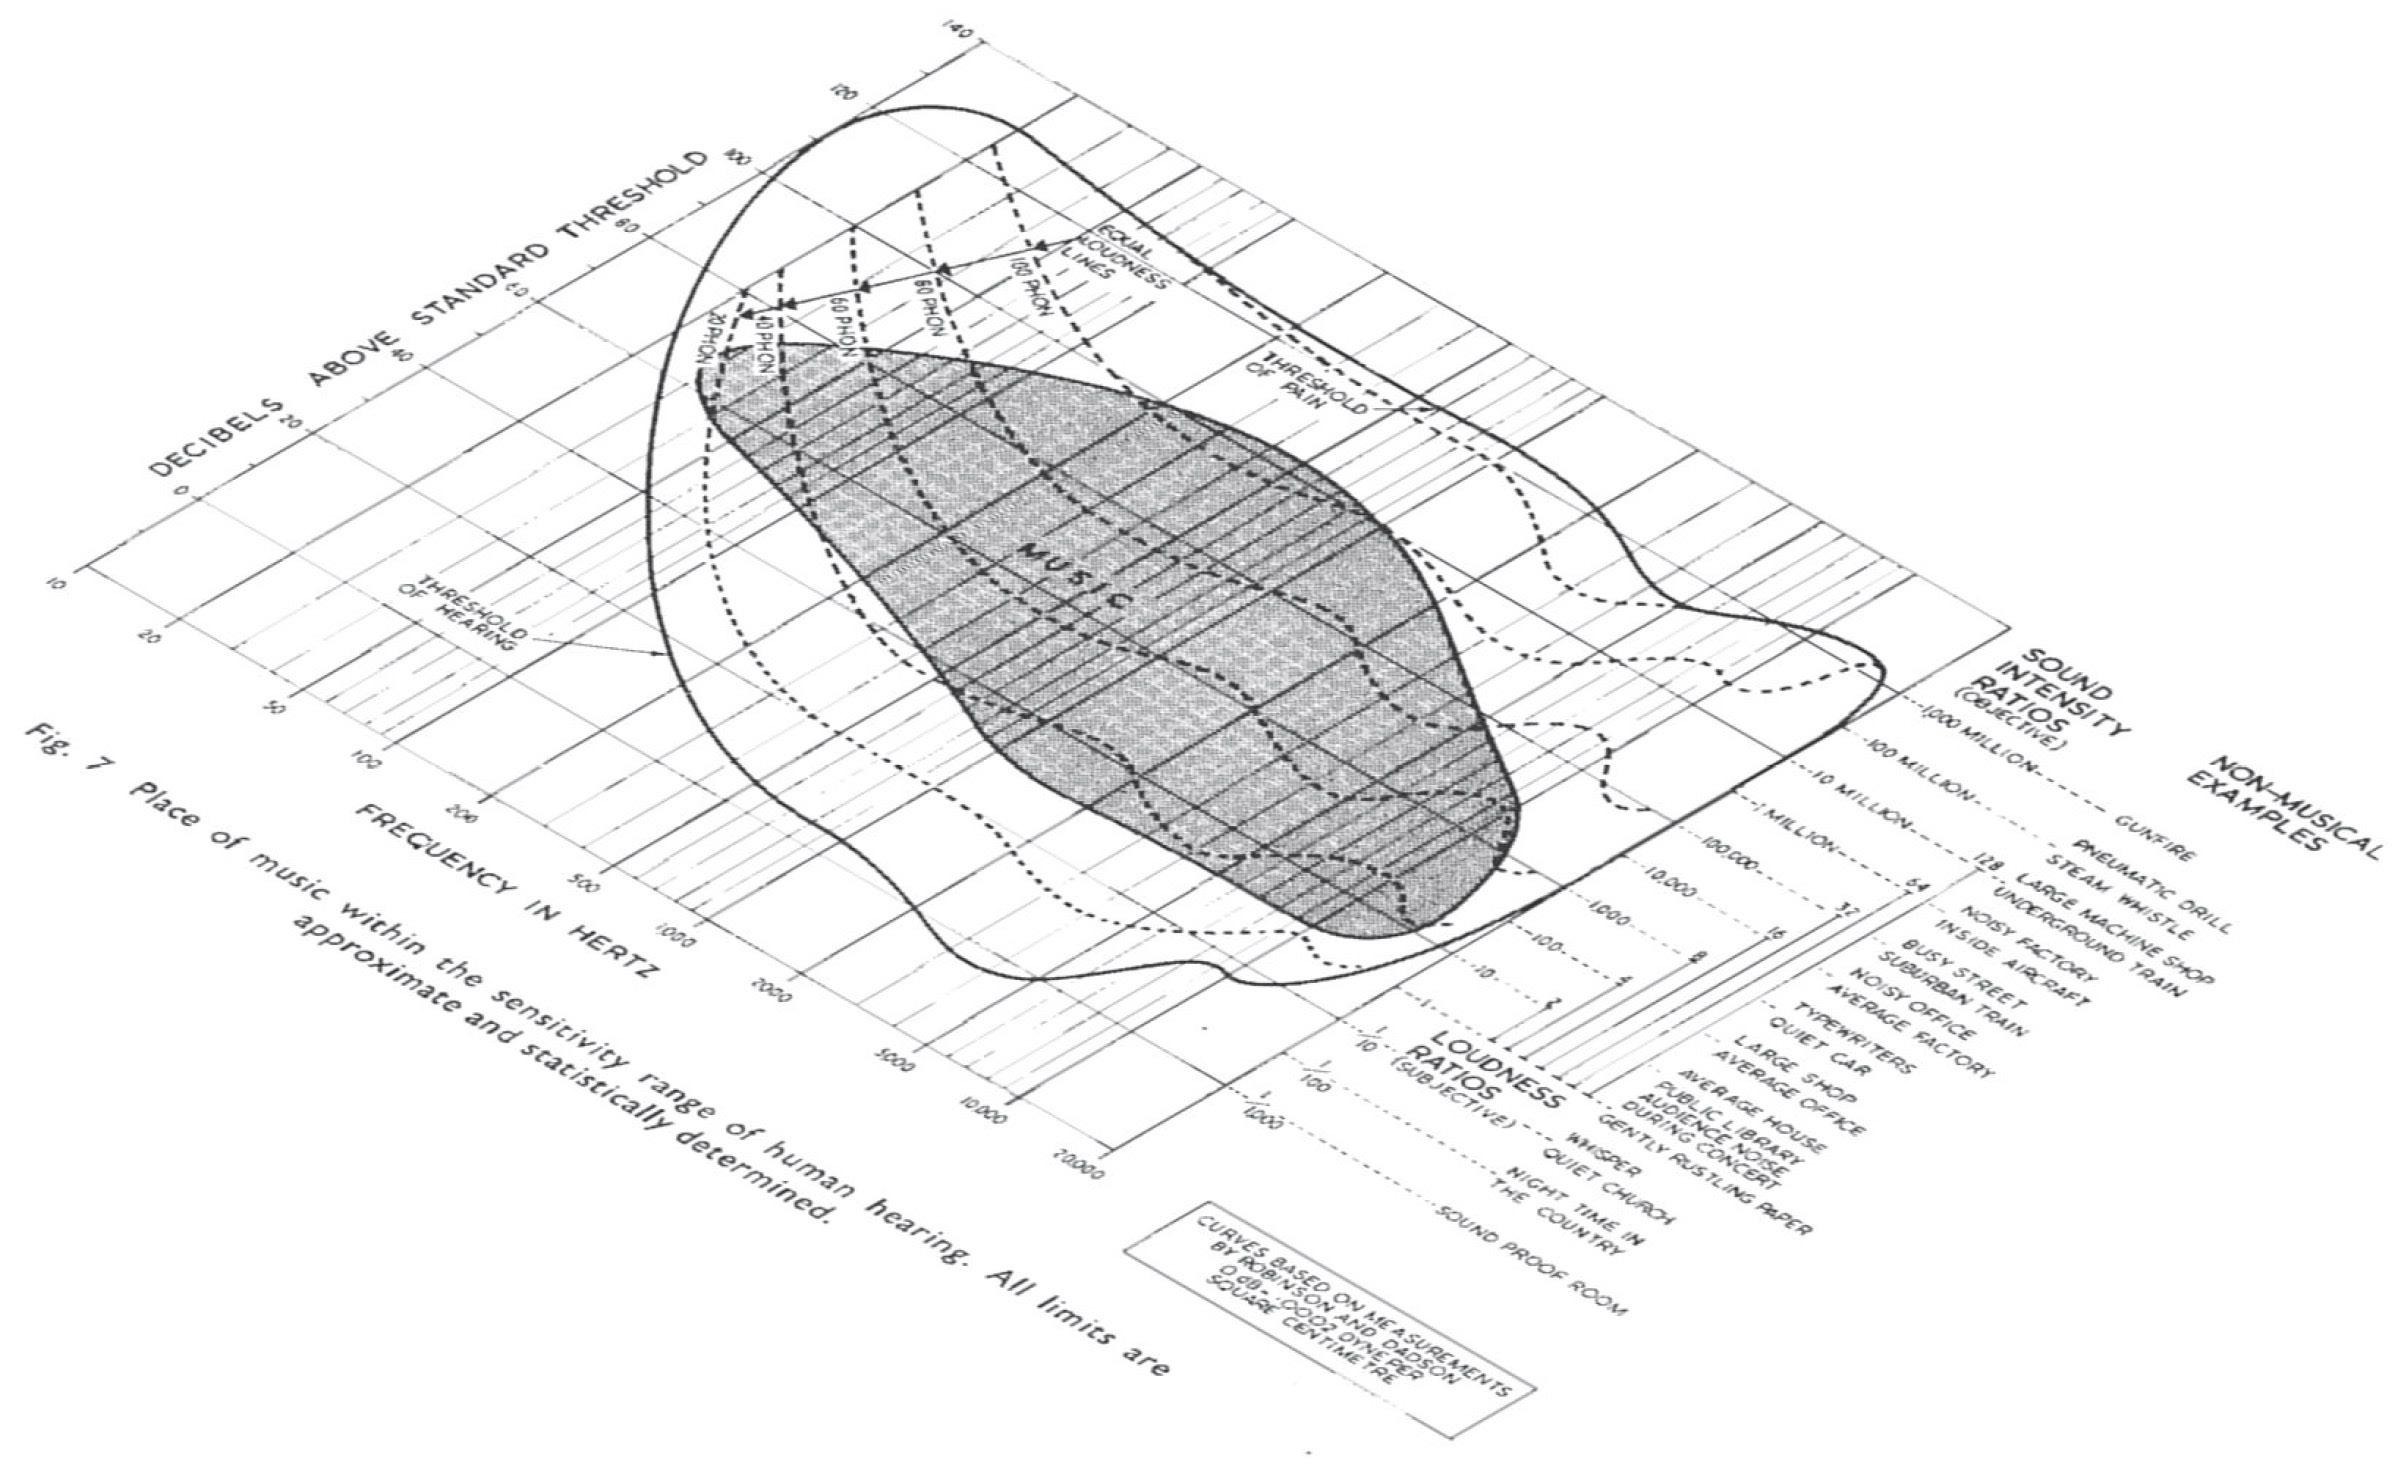
The sensitivity range of human hearing is shown in Figure 1-04.
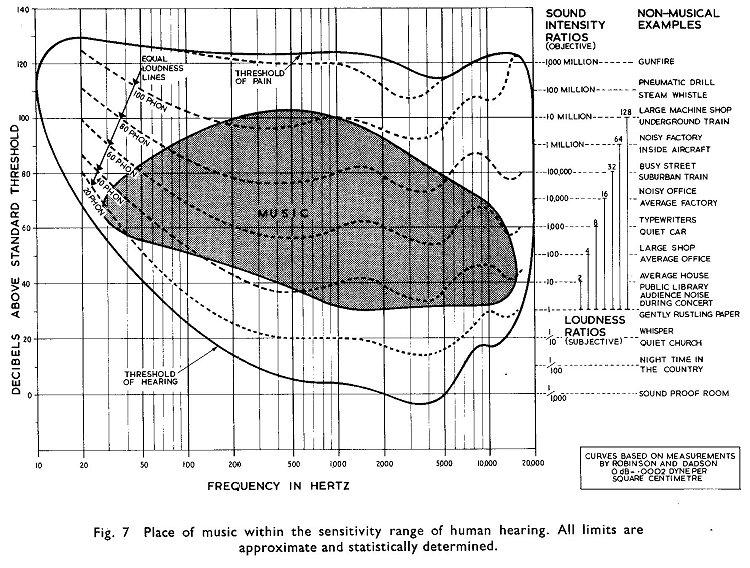
Fig. 1-04.
By analyzing Figure 1-04, a strong dependence of ear sensitivity on sound frequency can be noticed. Statistical studies of subjective feeling of sound of 1 kHz at a known level and the subjective feeling of sound of various frequencies at equal sound pressure give equiphonic lines or lines of equal sound intensity (subjective) in Figure 1-05. But objective measurements that are realized using microphones, audio amplifiers and other measuring instruments, due to their constant sensitivity at all frequencies, always give equal values of sound intensity.
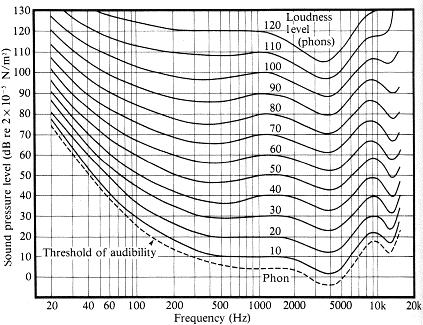
Figure 1-05.
The intensity of sound waves traveling through the air decreases exponentially:
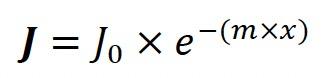
Jo – sound intensity at x = 0
J – sound intensity at distance x m – constant (depends on temperature and humidity of the air)
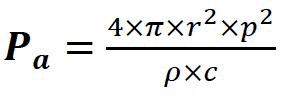
If there are some physical barriers in the path of the sound wave, the sound can be absorbed or reflected. This is very important for sound propagation in an enclosed space such as a home environment. The incident and reflected sound waves form equal angles to a line perpendicular to the surface of the barrier (as in optics). Part of the sound energy is reflected and part is absorbed in the process of collision of the sound wave with the surface of the barrier. The measure of sound absorption is the absorption coefficient α (value between 0 and 1) and depends on the physical characteristics of the barrier material:
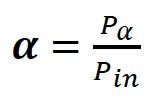
Pin – power of the incident sound wave
Pα – absorbed power
The best sound absorber is an “open window” (α = 1, i.e. total absorption).
The total sound absorption in the room is:
Si – barrier area with absorption coefficient αi
(1-09)
(1-10)
The total sound absorption in the room is the sum of the sound absorptions by all surfaces: the walls of the room (including the sealing and floor) and other furniture in the room.
In practice, it is more convenient to use the so called “absorption” (A) which represents the area of total absorption (α = 1) in relation to sound energy equal to the energy absorbed by the total area covered by the absorption material with the actual value of the absorption coefficient:
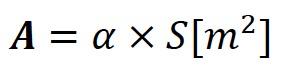
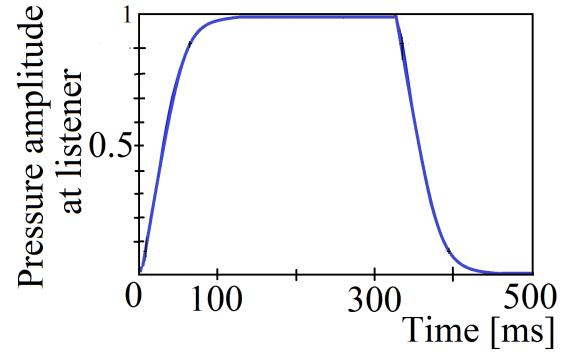
Figure 1-06.
(1-11)
Sound waves that propagate in an enclosed space (room) are constantly in the process of absorption and reflection.
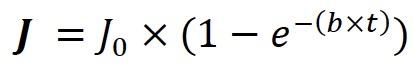
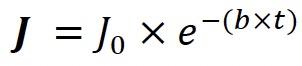
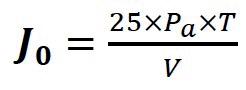
By turning on the sound source in the room, the sound level rises to a stationary value (J0) (incident and absorbed energy in balance). By turning off the sound source in the room, the sound level decreases until it completely disappears (totally absorbed):
(increasing the sound level) (1-12)
(decreasing the sound level) (1-13)
b and J0 : (1-14)
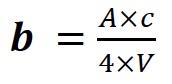
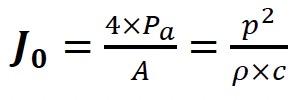
c – velocity of sound
J – sound intensity
V – room volume
Pa – power of the acoustic source
A – absorption
(1-15)
The sound decay time depends on to the acoustic characteristics of the room (dimension, absorption materials). A measure of sound decay time is a reverberation time (the time period in which sound level decreases by 60 dB). (1-18)
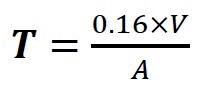
T(s) – reverberation time
V(m3) – room volume
A(m2) – absorption
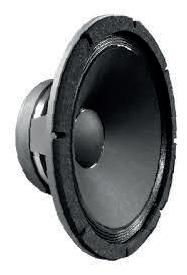
1.2 The Loudspeaker
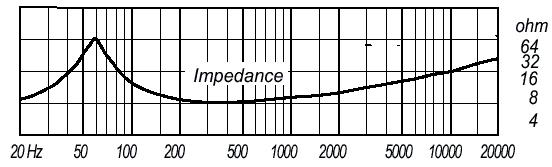
▲ Impedance (Z)
The loudspeaker converts electrical energy into acoustic energy.
Loudspeaker specifications:
▲ Nominal (Rated) power or power handling capacity (P) declared by the manufacturer as the permissible value of electrical power (in a limited frequency range) applied continuously to the loudspeaker without any possible damage to the loudspeaker.
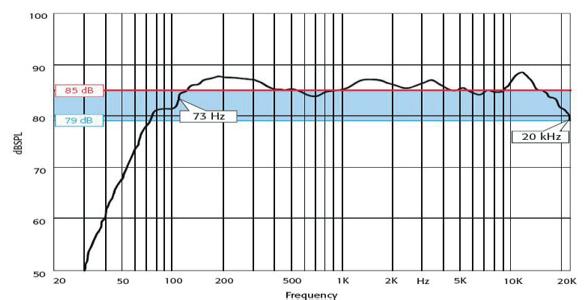
▲ Frequency characteristic
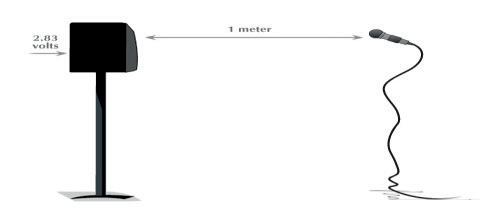
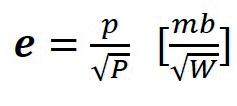
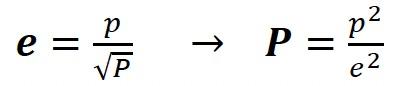
▲ Sensitivity (e)
The impedance is declared by the manufacturer in a limited frequency range. It is dynamic impedance, not DC resistance.
Standardized values: 2Ω, 4Ω, 8 Ω, 16 Ω, 32 Ω, 64 Ω,.800 Ω
Frequency characteristic (frequency response): produced sound pressure as a function of the frequency ata constant voltage applied to the loudspeaker.
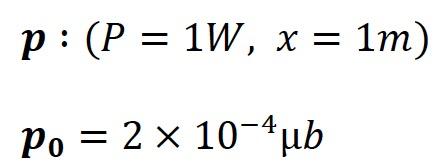
Sensitivity (e): sound pressure at a distance of 1 m produced by a loudspeaker driven by an electric power of 1 W.
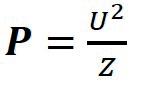
(1-19) (1-20)
U – loudspeaker drive voltage (V)
Z – loudspeaker impedance (Ω)
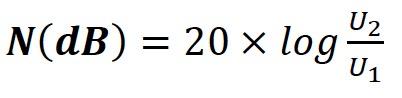
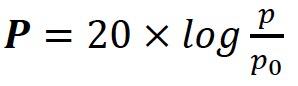
It is common for manufacturers to declare the sensitivity of loudspeaker and loudspeaker boxes in dB: (1-21)
Sound pressure decreases with distance i.e. sound pressure is inversely proportional to distance: (1-22)
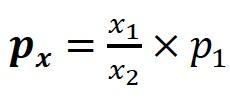
p1 – sound pressure at the distance x1 px – sound pressure at the distance xx
The necessary driving electric power of the loudspeaker to produce the required sound pressure at the distance x is: (1-23)
p – required sound pressure at the distance x
e – loudspeaker efficiency (the percentage of acoustic energy radiated in all directions from a speaker, compared to a specified amount of driving power (amplifier power)).
▲ Efficiency coefficient (η) (1-24)
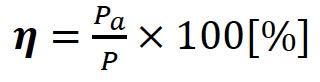
Pa – acoustic power
P – electrical power applied to the loudspeaker
Sound pressure level (J[dB]) produced by a loudspeaker (sensitivity e[dB]) driven by an amplifier P[W], see Table 1-03.
Table 1-03.
1.3 Required output power of an audio amplifier for listening to music at home
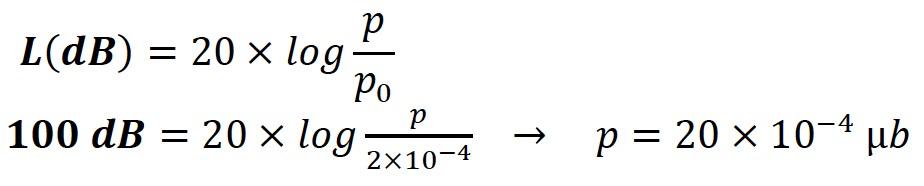
According to statistical measurements, the pick level of sound produced by a symphony orchestra in a concert hall is approximately 100 dB. The average listener at home usually listens to music at a sound level of 80 dB. The needs of extreme audiophiles who enjoy listening to music “a little louder” (in the suburb or in the country house) should not be ignored. In order to avoid criticism about the lack of sound level that an audio amplifier should produce for listening to music at home, it is useful to use a sound level of 100 dB as a design requirement in the amplifier design process.
Using equation (1-04), a sound level of 100 dB means that the audio system must produce a sound pressure of:
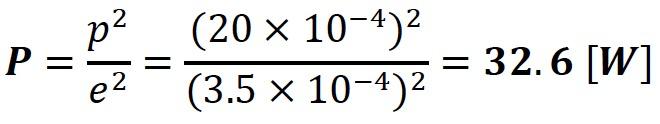
The sound source at home is a loudspeaker driven by an audio amplifier. The electrical power required to drive a loudspeaker of known sensitivity (declared by the manufacturer) and produce a sound pressure of 20 x 10-4μb is:
The average sensitivity of speakers used for listening to music at home is about 85 dB i.e. 3.5 × 10⁻⁴ μb:
A 2 x 16.3 W stereo amplifier loaded with 85 dB sensitivity loudspeakers produces a sound level of 100 dB. In order to more precisely determine the required electrical power or the output power of the amplifier, the acoustic characteristics of the room must be considered.
The main characteristics of the room that significantly affect the sound level in the room are:
• Room volume
• Area of the walls
• Materials and structure of wall and furniture surfaces
• Room architecture
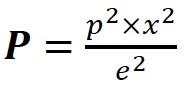
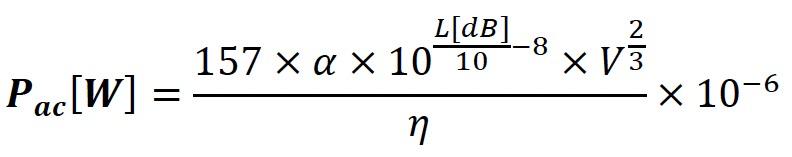
Using the equations of stationary sound level in the room (J0 = 4 x Pac / A = p2 / (ρ × c) and absorption [A = (0.16 × V) / T], the equation of acoustic power can be written as follows:
By simplifying the above equation using the empirical architectural equation of area versus room volume:
S = 6.3 x V2/3 and the equation: A = (0.16 x V) / T:
If, for example, the dimension of an average room for listening to music is: (5.5 x 6.5 x 2.8) m, i.e.:
V = 100 m3
S = 138.7 m2,
and α = 0.5 (fairly “acoustically dead” room) and the efficiency of the loudspeaker η = 0.01 (1%), follows:
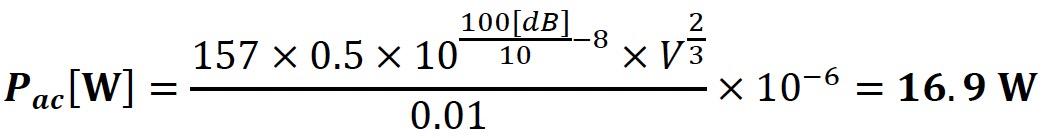
The choice of the output power of the amplifier depends on the required sound level, the efficiency of the loudspeaker and the dimensions and acoustic characteristics of the room for listening to music.
1.4 Conclusion
The above analyses (based on the propagation of sound waves in an enclosed space such as a music listening room) show that in an average-sized room a stereo amplifier with an output power of only 2 × 8.5 W, loaded with 85 dB sensitivity loudspeakers, can fulfill the expectations of a music listener regarding the sound level, which is at the level of sound produced by a symphony orchestra in a concert hall. More exact analyzes require detailed characteristics of each material used in the room (absorption coefficients of each material of the room and furniture, exact area and usable volume of the room, etc.,) including the objective auditory characteristics of the music listener.
It is a well-known fact that continuous operation of any electrical equipment at maximum power is not recommended. If the above-mentioned recommendation is applied to the audio power amplifier regarding the output power required for listening to music at home and taking into account the fact that the total harmonic distortion of the amplifier is maximum when the amplifier is operating at maximum power and that it usually increases proportionally to the power at which the amplifier is operating, the empirical recommendation is that the rated (nominal) output power of the home audio amplifier should be at least twice the power calculated by the acoustic analysis above.
High End home audio amplifier output power: 2 × 12 W up to 2 × 30 W.
It goes without saying that when using high efficiency loudspeakers, lower output power amplifiers can be used like 2 × 7 W.
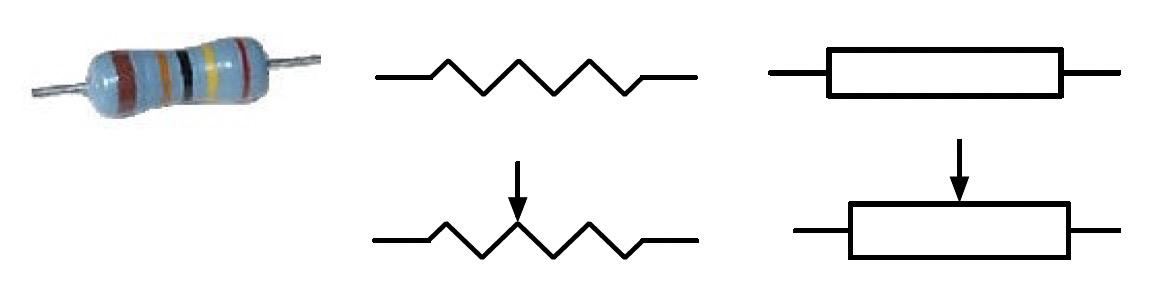
Unit: Ω (ohm) Fixed resistor: Variable resistor:
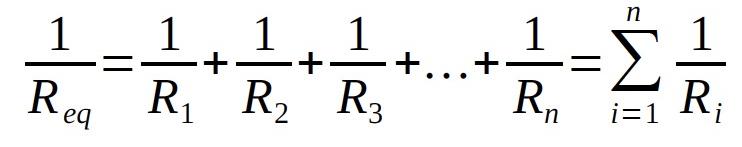
Parallel resistor connection – equivalent resistance:
A passive electronic component with two terminals that has electrical resistance and is used to control the flow of current in an electronic circuit, i.e. in an electronic circuit a resistor opposes the flow of electrical current through itself. It accomplishes this by absorbing some of the electrical energy applied to it, and then dissipating that energy as heat.
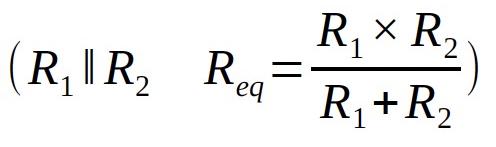
Special case – two resistors connected in parallel:
Series resistor connection - equivalent resistance:
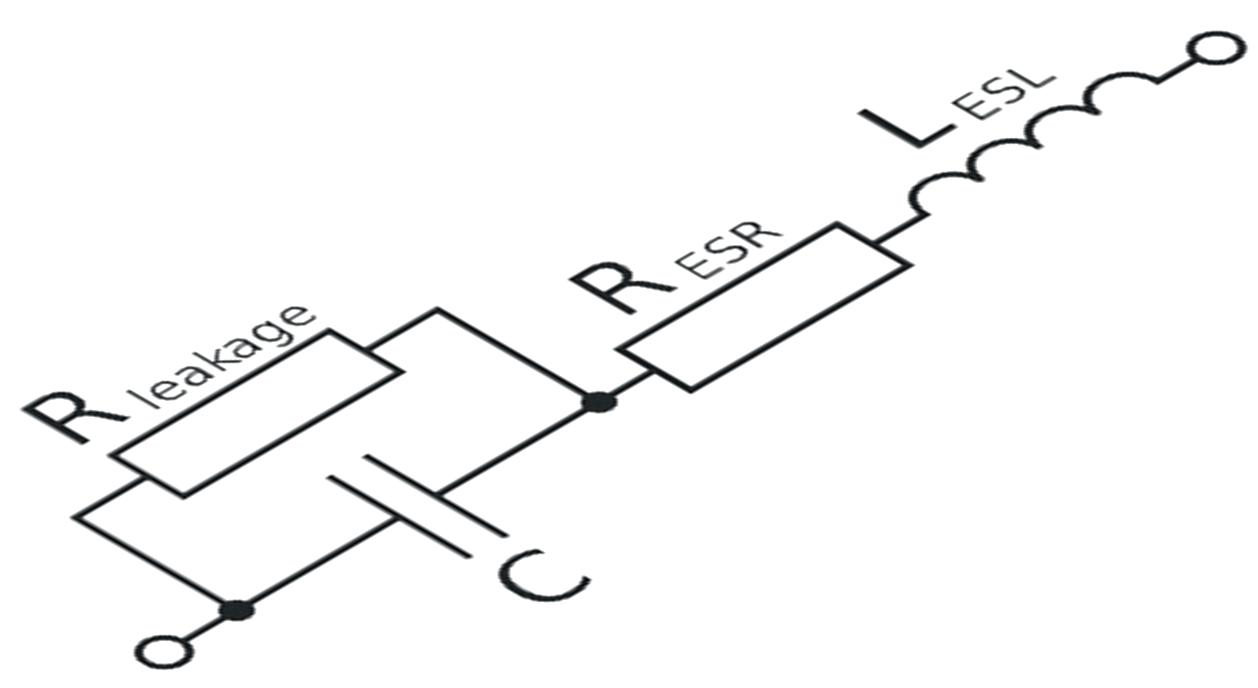
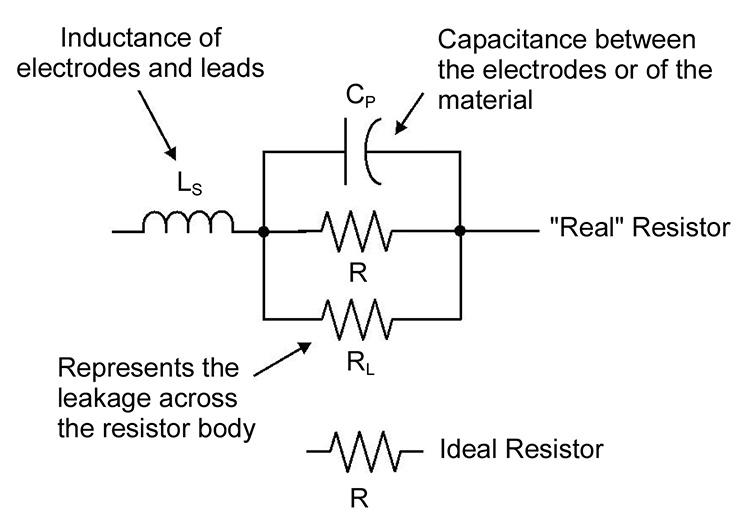
A model of a real resistor
A real resistor is not just resistance. Some secondary effects caused by the technology and materials used in the manufacturing process appear in the characteristic of the final product - the real resistor:
Resistor characteristics:
• Nominal resistance value
Inductance: caused by electrodes and leads, geometry of the resistor design, technology and materials used in the manufacturing process.
Capacitance between the electrodes: caused by the electrodes at the ends of resistor and the geometry of the resistor design.
Leakage resistance: caused by the resistance of the body of the resistor.
The nominal resistance is standardized and specified by the E-series of nominal standard resistance values.
• Nominal power
The maximum electrical power permanently applied to a resistor at a specified ambient temperature without degrading its performance.
• Operating voltage
The maximum DC or the maximum RMS AC voltage that can be continuously applied to a resistor at a specified ambient temperature.
• Operating temperature
The temperature range in which the resistor can be used in continuous operation.
• Temperature coefficient (TK)
Relative change of resistance per degree of temperature change. It is specified in ppm (part per million, 0.0001%) per degree Celsius of temperature change ( ppm / 0C ).
• Tolerance
The tolerance of the resistor refers to the maximum dispersion of the nominal resistance of the resistor (deviation from the nominal value).
# Resistor specific characteristic - Resistor noise.
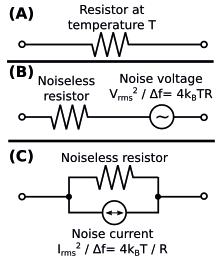
The noise voltage (RMS) is:
There are two types of resistor noise: thermal noise and current noise.
Thermal noise
Resistor noise is an unwanted characteristic of a resistor that affects the useful signal and distorts it. It is always present in a resistor and is caused by a fundamental physics process at the electron level.
A real resistor can be modeled by a voltage source (noise voltage source) connected in series with an ideal resistor, or a current source (noise current source) connected in parallel with resistor.
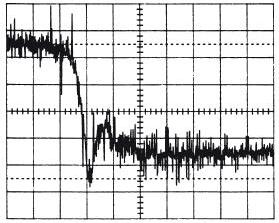
Thermal noise is caused by the random motion of electrons inside the resistor material.
The motion of electrons inside the material depends on the temperature and is random.
These motions of electrons produce an electrical signal that is also random (with spectral density uniformly distributed over the frequency range) between the resistor terminals.
k – Boltzmann’s constant 1.38 x 10⁻²³ J / K
T – Temperature ( K )
R – Resistance ( Ω )
Δf – Frequency range ( Hz )
The thermal noise level is lower if temperature, resistance and frequency bandwidth are lower.
The thermal noise levels of different types of resistors of equal resistance at equal temperatures and at equal frequency bandwidth are equal and are independent of the materials and technology used in resistor manufacturing process.
For example, the thermal noise voltage generated by a 1kΩ resistor at room temperature (300 K) and a frequency bandwidth of 20 kHz is:
# Usually, the resistor noise is specified as microvolt noise (µV) per volt (V) of applied voltage, for a 1MHz bandwidth (µV/V)
Current noise
The current noise of the resistor depends on the materials and technology used in the resistor manufacturing process.
The equation that mathematically expresses the current noise of the resistor is empirical and is usually expressed in µV/V or as a Noise Index in decibels:
u(noise)RMS – RMS noise voltage ( V )
UDC - DC voltage across the resistor ( V )
# A lower Noise Index means a lower level of current noise of the resistor (the resistor is of better quality).
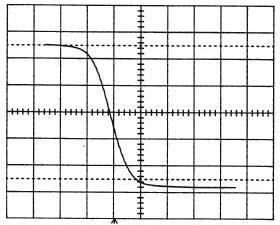
Diagram of the spectral density of the total noise voltage of the resistor:
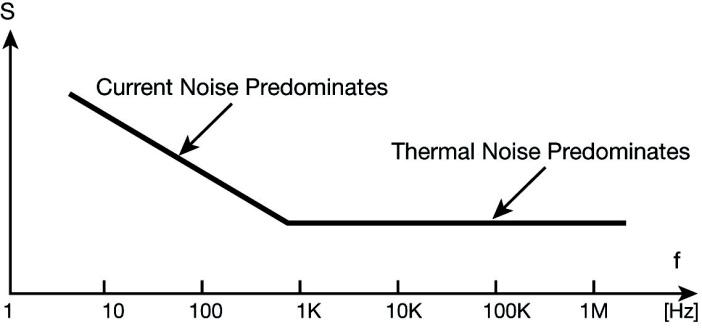
Current noise is frequency-dependent and predominates at low frequencies.
The current noise decreases as the frequency increases.
The thermal noise of the resistor is constant over a wide frequency range.
The noise characteristics of the resistors used in the construction of High End audio equipment play a very important role. It is very important to choose low noise resistors for signal path applications as well as power supply chain application.
For example, the input audio signal may be very low, at the level of a few hundred µV (moving coil cartridge of a turntable), and the noise effect of the input resistor interfering with input signal and degenerating it can be very significant, especially since the thus degenerated signal is amplified by next amplifier stages, i.e. the output of the audio amplifier will be distorted and will differ significantly in shape and characteristics from the original input signal. Also, the noise voltage generated in the high-noise resistor applied in the power supply chain of the audio amplifier can interfere with the useful signal and degenerate it.
To improve resistor characteristics and reduce secondary and unwanted effects in resistors such as parasitic capacitance and inductance, leakage current and noise, many different materials and technologies have been developed to manufacture resistors.
6BQ5
6SN7
229, 239, 300
242, 246 Aluminum
65, 67, 87, 90, 104, 111, 119, 122, 130, 131, 140 amplification coefficient
61 amplifier 17, 21, 71, 72, 88, 353
Amplitude
139, 451
Capacitance
EC900
ECC81
ECC82
ECC 83
ECC83 88, 94, 112, 402 ECC88
cross-section
Ei Nis Radio Tube Factory
Ei Radio Tube Factory
I
EL34
170, 193
EL84 167, 169, 181, 192
46, 99, 196, 199, 210,
88, 399, 446
171, 193, 245, 397
Graphical analysis
106, 123, 153, 174 GRID
Grounded cathode
HALF - WAVE RECTIFIER
138, 139
167, 358, 396, 406, 470
331, 407, 410, 412, 435 , 458
, 367, 409, 447 PSRR
128 push pull 172, 173, 174, 178, 184, 250, 280, 396, 397 Push Pull
31, 366 RIAA 142, 143, 144, 147, 462, 463
198, 382, 454
Ultra – linear 91, 187, 188, 245, 246, 248, 396, 397, 431 Units
Without any ambition to reach scientific levels, this book aims to be a toolbox for both audio lovers and high-end equipment designers. The elementary theory presented is the bare minimum for readers to grasp the operation and practical use of electrical, electromagnetic, physics, and electronic operations available in the designers’ toolbox. Each tool is explained in a minimum of words and theory without needless coverage of underlying equations or figures.
The book chapters guide you through the process of designing quality amplifiers with vacuum tubes, from the very beginning, considering both technical and subjective requirements — in theory and practice.
The book is a compilation of the author’s notes used in his professional and educational career but was nevertheless primarily written as a result of true love for the audiophile hobby.

Zoran M. Dukic was born in Kraljevo, Serbia in 1953. He was Winner of the Yugoslavian National High School Physics Competition in 1971 and graduated in 1972. In 1978, he graduated from the Faculty of Electronics at the University of Nis. Zoran began his professional career at the Ei Radio Tube Factory, continued at the Ei Radio Acoustics Factory, and ended as Deputy General Director of Ei Holding Corporation. He is an external expert associate at the Faculty of Electronics in Nis (quantum and optical electronics).