

eFields is a program at The Ohio State University dedicated to advancing production agriculture through the use of fieldscale research. The 2021 eFields Report is a culmination of the research conducted over the past year on partner farms throughout Ohio. Current research is focused on precision nutrient management strategies and technologies to improve efficiency of fertilizer placement, enable on-farm evaluation, automate machine functionality, enhance placement of pesticides and seed, and to develop analytical tools for digital agriculture.
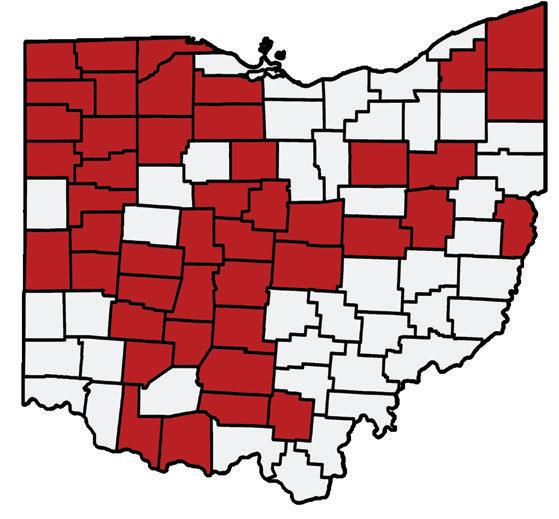
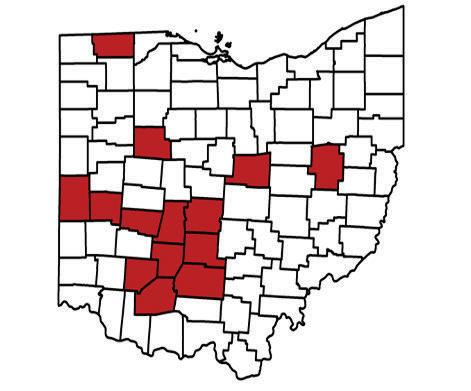
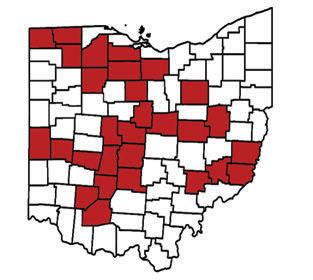
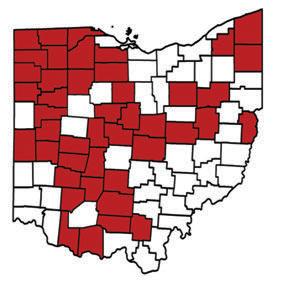
eFields has expanded from 39 on-farm research sites in 13 counties in 2017, to 95 on-farm research sites covering 25 counties in 2018, 88 on-farm research sites in 30 counties in 2019, 218 on-farm research sites in 39 counties in 2020, and 249 on-farm research sites in 45 counties in 2021.
New for 2021
• Trials in over 50% of Ohio counties
• Knowledge Exchange (KX) Searchable Online Database
5,122 Total Acres
45 Counties
249 On-Farm Research Sites
Disclaimer Notice: The information provided in this document is intended for educational purposes only. Mention or use of specific products or services, along with illustrations, does not constitute endorsement by The Ohio State University. The Ohio State University assumes no responsibility for any damages that may occur through adoption of the programs/techniques described in this document.
Welcome to the 2021 edition of the Ohio State eFields Report. We are excited this is our 5th edition of the report and we want to extend our sincere thanks to all of those who have made the Ohio State eFields Report possible over the past five years. This project would not have happened without the support of our on-farm cooperators, OSU Extension educators, field specialists, faculty, staff, students, industry partners, and countless others who have devoted their time, energy, and expertise. It is truly the collaborative nature of everyone that allows us to ultimately provide data-driven information to thousands of farmers and their advisors in a timely, relevant, and actionable manner.
With this being our 5th year for the eFields Report, we are offering it as a special edition in commemoration of the farmers and others who have challenged the team to develop this program. We are grateful to everyone for their time and vision from the creation of the report and the needed on-farm linkages with farmers and their advisors. Specifically, we would like to thank people like EJ Miller, who believe that the land-grant mission still exists and want to see CFAES expand its efforts helping Ohio farmers improve their operations. He has continued to challenge us in thinking through how to get timely information into the hands of farmers and supported getting eFields off the ground. We appreciate the essential support of EJ and others that allowed the program to grow into what it is today. This special edition is dedicated to them.
As we reflect on 2021, the COVID-19 pandemic continued to impact the agriculture industry and beyond. As the year progressed, supply chain and labor issues created unique challenges. Shortages in parts and electronic components made making repairs difficult by harvest time. Some crop protection products were difficult to buy in late summer Unfortunately, supply shortages, labor, and now energy costs have impacted the supply and costs of inputs. Fertilizer prices are at an all-time high as 2021 comes to end with it being difficult to purchase crop protection products. Fortunately for Ohio farmers, the 2021 growing season was favorable, leading to high yields that have helped offset input price increases.
The eFields team was able to report on 249 studies from 45 counties in 2021. We are excited about this continued growth of the program, and the eFields team members are looking forward to more exciting projects in the future. You can find the library of eFields Reports ranging from 2017-2021 online at: go.osu.edu/efieldsreports.
We hope you find the 2021 eFields Report informative and valuable. If you are interested in cooperating with us in 2021 or have any feedback, please contact us at digitalag@osu.edu.
Sincerely,
2021 eFields Team



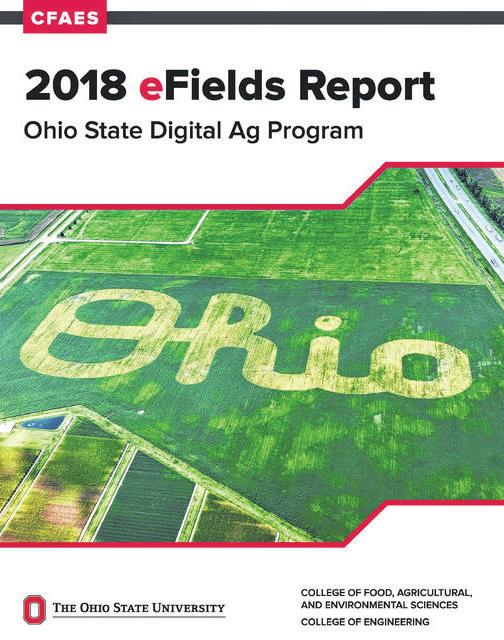
The first eFields report. Covered corn seeding rate, soybean seeding rate, compaction, nutrient management, manure, and planter technology trials.
Added season weather, farm business analysis, economics, soybean fungicide, farm safety, and mobile apps to the report.




Added Soybean SCN, sulfur, small grains, forages, cover crops, imagery tech, planting progress, farm custom rates, and farm bill updates to the report.
Added water quality, soil health, virtual field demos, and hemp to the report.
eFields projects in over half of Ohio counties, added the Knowledge Exchange searchable online database (kx.osu.edu/efields).


Are you interested in contributing to the 2022 eFields Report? If so, visit go.osu.edu/efields to review study implementation plus tips and tricks. See below for details on how to get involved and who to contact. We look forward to working with you!
Growers interested in hosting on-farm research trials for publication in the annual eFields report should reach out to their county Agriculture and Natural Resources Extension Educator (agcrops.osu.edu/people). To view a list of those educators who are already involved, see page 14. Standard protocols for seeding rates, nitrogen rates, and other management practices have been developed for statewide implementation. Contact us today to find out how to get involved. Additional protocols and topics are being developed and can be customized to fit your questions and needs!
We are always looking for new partners to conduct on-farm trials! If you are interested in determining how you can support Ohio State University On-Farm Research, reach out to your county Agriculture and Natural Resources (ANR) Extension Educator, email the Digital Ag Team (digitalag@osu.edu) or Dr. Elizabeth Hawkins (hawkins.301@osu.edu). We would love to discuss your involvement with the eFields program!
If you are a current ANR Educator and are interested in getting involved with eFields, contact us at digitalag@osu.edu or reach out to Dr. Elizabeth Hawkins (hawkins.301@osu.edu).

WHEN January 5th, 12th and February 1st and 8th at 9AM EST
Join the OSU Digital Ag Team in January and February for #AgTechTuesday. Precision U will take place in January with two webinars, January 5th and 12th. The webinars continue in Febrary and shifts focus to provide a more in-depth look at ongoing eFields research projects. All webinars are free to attend so plan to attend one or all of the sessions. Find more information at go.osu.edu/AgTechTues.


We have been involved with eFields since it began in 2017. Most of our research has focused on corn and soybean seeding rates. This has allowed us to reduce input costs and improve profitability. We strongly encourage other farmers to get involved with the eFields program.
- Durbin Farms
Congratulations to Durbin Farms for their selection as a 2021 Friend of OSU Extension!
Working with Ohio State University Extension has been very educational and beneficial to our operation. Through different tests and being able to analyze the data, Ohio State has helped us maximize our ROI. With help from Ohio State we were able to find the most effective application of our fungicide and nitrogen, we are confident that we can learn and improve for years to come.
- Miller Brothers Farm
“
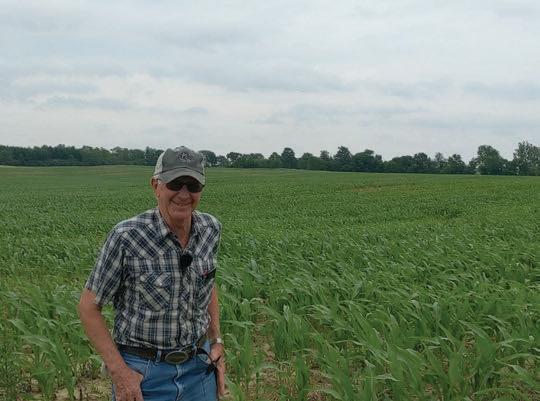
I really like the idea of being able to do a scientific study on questions that I have on my farm and the idea that the results can be shared with others who may have similar questions on their farms.
-Jack Sommers, Mark IV Farm
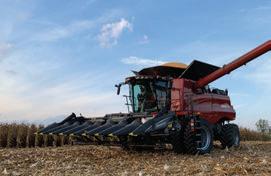
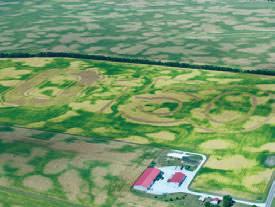
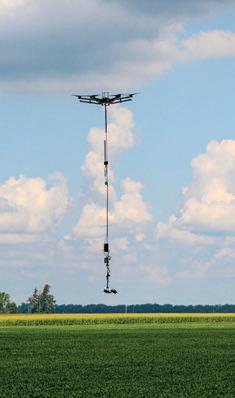
The Digital Agriculture Program at The Ohio State University embodies the best of the land grant mission – creation, validation, and dissemination of cutting-edge agricultural production technologies. The central focus of this program is the interaction of automation, sensing, and data analytics to optimize crop production in order to address environmental quality, sustainability, and profitability. Research is focused on execution of site-specific nutrient management practices, development of handheld devices for in-field data capture, autonomous functionality of machinery, remote sensing solutions, and data analytics to enhance timing, placement and efficacy of inputs within cropping systems.
The Digital Agriculture Program at The Ohio State University strives to be the premier source of research-based information in the age of digital agriculture.
• Uniting the private and public sectors to drive innovation for the benefit of farmers.
• Partnering with farmers to translate innovation into long-term profitability for production agriculture.
• Delivering timely and relevant information for the advancement of digital agriculture technologies.
The premise of digital agriculture includes the advancement of farm operations through implementation of precision agriculture strategies, prescriptive agriculture and data-based decision making. Digital agriculture is a holistic picture of the data space in agriculture, trends related to services directing input management and the value of data usage for improving productivity and profitability of farm operations.
“Digital Agriculture” combines multiple data sources with advanced crop and environmental analyses to provide support for on-farm decision making.
“Helping growers make the most of Precision and Digital Ag technologies”


PRECISION SEEDING
Utilizing the latest digital ag technologies to place every seed in an environment optimized for its growth and development.
ON-FARM RESEARCH
Deploying field-scale studies to advance production agriculture through efficiency and profitability using data-driven decisions.
PRECISION CROP MANAGEMENT
Management of crop inputs in a manner that maximizes efficiency and profitability
HARVEST TECHNOLOGIES
Taking advantage of available technologies to improve harvest efficiencies and improve data quality.
SOIL COMPACTION MANAGEMENT
Mitigation of soil compaction to enhance crop health and soil structure.
REMOTE SENSING
Providing the ability to remotely assess field conditions, crop health, nutrient needs, and productivity levels on a sub-field scale.
APPS FOR AGRICULTURE
Embracing the power of smart phones and tablets to utilize mobile applications and farming smarter.
PRECISION NUTRIENT MANAGEMENT
Ensuring that all applied nutrients are in a position to maximize crop uptake. Right source, right rate, right time, right place, right technology.
PRECISION LIVESTOCK
Making use of data and digital tools to manage or automate animal well-being, food safety, pasture sustainability, waste products and more.
DATA ANALYSIS AND MANAGEMENT
Developing a digital strategy and making actionable decisions using data, from operational insights to field execution.
Find study information, objectives, study design, weather graph, and summary on the left page. Find results, summaries, project contact, and statistical summary on the right page.
Planting Date 5/3/2021
Harvest Date 10/20/2021
VarietyBecks 6076V2P
Population 34,000 sds/ac
Acres 70
Treatments 5
Reps 7
Treatment Width40 ft.
TillageConventional
Management Fertilizer, Herbicide, Insecticide
Previous Crop Soybeans
Row Spacing30 in.
Soil Type Crosby silt loam, 52% Celina silt loam, 48%
The study design provides a background on the study. This could include a brief history of research, observations that led to the implementation of this study, explanation of the study design, etc.

Location
Look to see the county where the study was conducted.

Here you will find visuals of the study with short descriptions.
The observations section of the report allows us to provide any relevant information that the researchers noticed throughout the growing season. Observations allow for a deeper understanding of the study results.
Treatments (XXX)
• The summary section proves results and findings from the study.
• Thank you for taking the time to explore our 2021 eFields Report!

Treatment Means with the same letter are not significantly different according to Fisher’s Protected Least Significant Differences (LSD) test at alpha = 0.1.
This section allows us to display the tools and technology used to make each study possible.

The Project Contact section provides the name of the researcher along with their email address. We encourage you to contact them if you have questions about an indvidual study.
To effectively collect, analyze, and interpret data, statistical calculations were made for each eFields study when possible. All statistical calculations were conducted using the OSU PLOTS Research App or calculated using the ANOVA spreadsheet, using Fisher’s Protected Least Significant Differences (LSD, alpha = 0.1) method to determine if treatment differences are statistically significant.
Stand Counts and Harvest Data:
All stand counts were conducted for individual plots by counting the number of plants in 30 linear feet along two adjacent rows. All yield data was collected using calibrated yield monitors or weigh wagons. Data was processed and cleaned to ensure accuracy with yields adjusted to a standard moisture prior to analysis.
Take a look at this example from a study: Treatments
Replication
• Allows one to estimate the error associated with carrying out the experiment itself.
• Without replication, it would be impossible to determine what factor contributed to any treatment differences.
• A minimum of 3 replications is required for a proper evaluation, with 4 or more recommended for field-scale research.
Randomization
• Randomization is as important as replication to help account for any variations in production practices and field conditions.
• Even if treatments are replicated, the conclusions you reach may not be correct if a treatment was always applied to the same part of the field.
• Randomization prevents data from being biased due to its field location.
Results show the average of the response variable (i.e. yield) for each treatment.


Least Significant Difference (LSD) is used to compare means of different treatments that have an equal number of replications. For this report, a significance level of 0.1 (or 10%) was used, which means when a treatment is statistically significant, a 90% confidence is attributed to that treatment actually being different from the comparisons.
• For treatment A to be statistically significant from treatment B, they must differ by at least 3.38 bu/ac. (They do not, so they are not statistically different and are marked using the same letter). “NS” denotes not significant in the results table.
• For treatment D to be statistically different from treatment A, they must differ by at least 3.38 bu/ac (here they differ by 5 bu/ac, so they are statistically significant and are marked using different letters).

Defined as the coefficient of variation (CV) is a measure of the variability between treatments (i.e. yields) reported as a percentage (%). CV is an indicator of data uniformity. Higher CV’s indicate more treatment or environmental variability.
In this example, since treatment A is different from treatment D by 3.38 bu/ac, there is 90% certainity that the results of the treatments were indeed different. Treatment differences are represented by using a letter beside the reported value. Since the averages for treatment A and treatment B differ by less than 3.38, it cannot be concluded that the treatments are different from each other, so the same letter (e.g. “a”) is used to indicate they are the same.
For more information and examples on statistics and experimental setup, visit go.osu.edu/efieldsinvolved.
Return above analysis allows farmers to consider not only yield increase, but also economic return which ultimately impacts the farm’s bottom line. For studies where economics were calculated, return above is labeled in the rightmost column of the results table. To standardize return above calculations state-wide, the OSU Extension budgets were used for a partial profit calculation, farmoffice.osu.edu.
For the seeding rate studies, a uniform corn seed cost of $3.58/1,000 seeds was used. Soybean seed cost was $0.432/1,000 seeds. These are based on the Ohio Crop Enterprise Budgets developed by Barry Ward, OSU Extension. Learn more about the budgets on page 22.
Price received was determined by the Chicago price at planting and adjusted with a historical basis to represent an Ohio price. The corn price used in the 2021 report is $5.30/ bu and the soybean price is $12.00/bu. We then calculated a 10% price increase and decrease to reflect price variability.
A nitrogen cost of $0.73/lb used in this report is from the 2022 Corn Production Budget. For the nitrogen timing studies, application costs were also considered. The average costs of application the report uses are from the 2021 Ohio Custom Farm Rates. Learn more about the 2021 custom rates on page 32.
Price
The “Return above” line includes only the input expense of what was being studied (i.e. seed cost) to provide a clear indication of economic return. To calculate your own economic return, you can access the eFields Economic Calculators at: go.osu.edu/econcalculator.

Glen Arnold Field Specialist OSU Extension

Mark Badertscher Extension Educator Hardin County OSU Extension

Brooke Beam Extension Educator Highland County OSU Extension

Jordan Beck Water Quality Extension Associate OSU Extension

John Barker Extension Educator Knox County OSU Extension
Tim Barnes Extension Educator Marion County OSU Extension

Lee Beers Extension Educator Trumbull County OSU Extension

Kathleen Bridges Post Doctoral Scholar
Stark Sustainable Soil Initiative, CFAES Rattan Lal Carbon Management and Sequestration Center
Bruce Clevenger Extension Educator Defiance County OSU Extension
Rachel Cochran Water Quality Extension Associate OSU Extension
Amanda Bennett Extension Educator Miami County OSU Extension
Trevor Corboy Extension Educator Greene County OSU Extension

Steve Culman Assistant Professor School of Environment and Natural Resources

Amanda Douridas Extension Educator Champaign County OSU Extension

Boden Fisher Water Quality Extension Associate OSU Extension
Sam Custer Extension Educator Darke County OSU Extension

Nate Douridas Farm Manager Molly Caren Agricultural Center

Ken Ford Extension Educator Fayette County OSU Extension

Wayne Dellinger Extension Educator Union County OSU Extension

Nick Eckel Water Quality Extension Associate OSU Extension

John Fulton Professor Department of Food, Agricultural and Biological Engineering

Taylor Dill Extension Educator Darke County OSU Extension

Mike Estadt Extension Educator Pickaway County OSU Extension

Allen Gahler Extension Educator Sandusky County OSU Extension

Alysa Gauci Graduate Research Associate Department of Food, Agricultural and Biological Engineering

Jason Hartschuh Extension Educator Crawford County OSU Extension

Stephanie Karhoff Extension Educator Williams County OSU Extension
Mary Griffith Extension Educator Madison County OSU Extension

Will Hamman Extension Educator Pike County OSU Extension

Elizabeth Hawkins Assistant Professor, Field Specialist OSU Extension

Sami Khanal Assistant Professor Department of Food, Agricultural and Biological Engineering
Carri Jagger Extension Educator Morrow County OSU Extension

Andrew Klopfenstein Sr. Research Associate Engineer Department of Food, Agricultural and Biological Engineering
Jamie Hampton Extension Educator Auglaize County OSU Extension

Dee Jepsen Associate Professor Department of Food, Agricultural and Biological Engineering

Dean Kreager Extension Educator Licking County OSU Extension

Rattan Lal
Distinguished University Professor School of Environment and Natural Resources

Ed Lentz Extension Educator Hancock County OSU Extension
Cori Lee Student Assistant Department of Food, Agricultural and Biological Engineering
Laura Lindsey Associate Professor Department of Horticulture and Crop Science

James Morris Extension Educator Brown County OSU Extension

Heather Neikirk Extension Educator Stark County OSU Extension
Rob Leeds Extension Educator Delaware County OSU Extension

Alan Leininger Extension Educator Henry County OSU Extension

David Marrison Extension Educator Coshcocton County OSU Extension

Sarah Noggle Extension Educator Paulding County OSU Extension
Brigitte Moneymaker Water Quality Extension Associate OSU Extension

Tony Nye Extension Educator Clinton County OSU Extension

Eryn Oldham Student Assistant Department of Food, Agricultural and Biological Engineering

Matthew Romanko Water Quality Extension Associate OSU Extension

Clint Schroeder Extension Educator Allen County OSU Extension
Pierce Paul Professor Department of Plant Pathology

Richard Purdin Extension Educator Adams County OSU Extension

Eric Richer Extension Educator Fulton County OSU Extension

Kaitlin Ruetz Student Assistant Delaware County OSU Extension
Beth Scheckelhoff Extension Educator Putnam County OSU Extension

Scott Shearer Professor and Chair Department of Food, Agricultural and Biological Engineering

Dianne Shoemaker Field Specialist OSU Extension
Matt Schmerge Extension Educator Shelby County OSU Extension
Haley Shoemaker Program Coordinator OSU Extension

Chris Shoup Graduate Research Associate Department of Food, Agricultural and Biological Engineering

Chip Tuson Program Manager Department of Food, Agricultural and Biological Engineering
Jacci Smith Extension Educator Delaware County OSU Extension

Barry Ward Leader, Production Business Management OSU Extension
Kassidy Thompson Student Assistant Department of Food, Agricultural and Biological Engineering

Aaron Wilson Extension Climatologist Byrd-Polar Climate Center
Stay on top of what is happening in the field and the farm office. This podcast takes a bi-monthly dive into specific issues that impact agriculture, such as: weather, land value, policies, commodity outlooks, and more.

Ryanna Tietje Student Assistant Department of Food, Agricultural and Biological Engineering

Chris Zoller Extension Educator Tuscarawas County OSU Extension
Haley Zynda Extension Educator Wayne County OSU Extension
New episodes released every other Wednesday Listen and subscribe on iTunes or Stitcher Learn more at go.osu.edu/AFM


Continuing last year’s trend, 2021 delivered decent weather conditions for this year’s growing season for most farmers around Ohio. Highlights include one the driest winter and springs of the last decade, timely summer rainfall, and good fall harvest weather (for everyone not living in northwest Ohio). Through November, 2021 ranks as the 9th warmest and 47th wettest on record (1895-present) for Ohio according the National Centers for Environmental Information. The following is a summary of the growing season and seasonal breakdown of 2021.
Spring got off to a warm start across the Buckeye State, as March ranked as the 13th warmest March on record (1895-present). This was followed by a modestly warm April but cooler than average May. Despite the cool late season conditions, most of Ohio experienced typical final freeze dates between April 21 and May 10 (Fig. 1). It was the driest spring since 2013, with an average of 8.34” or about 75% of normal rainfall. All three months averaged below normal. The dryness was widespread across much of the state, with the driest areas found across the northern counties. Ohio’s maximum coverage of drought conditions occurred on April 27 when 70% of the state was classified as abnormally dry and 22% was in moderate drought conditions. The dry weather allowed for a bump up in the reported number of suitable fieldwork days to NASS with 14.5 days in April, countering the declining trend experienced since 1995 (Fig. 2). Spring 2021 ranks as the 25th warmest and 40th driest for Ohio.

Figure 1: Date of Last 32°F temperature in Spring 2021. Figure courtesy of the Midwestern Regional Climate Center (https:// mrcc.purdue.edu/).
Summer was warmer than average with the 17th and 10th warmest June and August on record, respectively. Overnight low temperatures were particularly warm (tied with 1995, 2005, and 2010 as the 2nd warmest). Sandwiched in between was July, a rather mild and wet month. In fact, it was the 13th wettest July on record. July also featured frequent wildfire smoke-filled skies that helped limit incoming solar radiation and lead to a cooler than average month for Ohio.
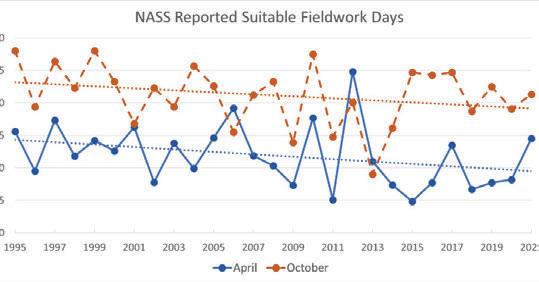
Figure 2: Suitable fieldwork days as reported to NASS for April (blue – solid) and October (orange – dashed) for 1995-2021. Dotted lines show the trends over the period for each month.

Figure 3: Left) Total precipitation in inches for June –August 2021. Right) Percent of normal precipitation in percentage for June – August 2021. Figure courtesy of the Midwestern Regional Climate Center (https://mrcc. purdue.edu/).
Figure 3 shows the rainfall distribution and percent of normal for the season. The state picked up between 10-20 inches of rainfall (statewide average of 14.15 inches or 117% of normal), about 40% of this falling in July. In August, western counties turned dry, running 1–3-inch deficits for the month across portions of Williams, Fulton, Henry, and Hardin Counties. Conditions dried considerably across Pickaway, Ross, and Pike Counties as well. However, drought coverage this summer was held to a minimum with only pockets of abnormally dry conditions scattered across the state. There were short periods of low stream flows and soil moisture deficits, but these challenges had minimal impact overall. Summer 2021 ranks as the 13th warmest and 15th wettest on record.
Autumn (September – November)
Fall was a bit of a roller coaster temperature wise. After a warmer than average September, which ranks as the 27th warmest on record, Ohio experienced its warmest October on record. This record warmth was driven strongly by overnight lows, averaging 51.3°F or 8.5°F above normal. This signifiantly delayed first freeze, with much of the state not experiecing the first 32°F temperature until November (Fig. 4). November turned chilly, about 2°F below average and ranks as the 55th coolest November on record.
Precipitation varied across the season as well, starting and ending dry with a very wet October. Defiance, Fulton, Henry, Lucas, Williams, and Wood Counties all experienced their wettest October on record with 7-9 inches of rain across the area, more than double the normal monthly rainfall (Fig. 5). Conditions were much dier in November (ranks right in the middle third of the 127-year record), which helped much of the state complete fall harvest and activies, with slow improvement to field conditions in northwest Ohio. Fall 2021 ranks as the 6th warmest and 35th wettest on record.
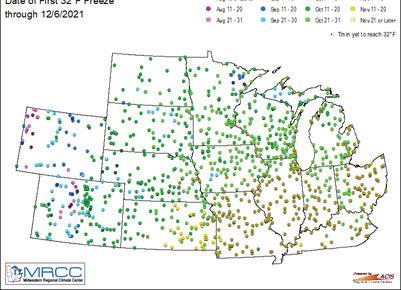
Figure 4: Date of First 32°F temperature in Autumn 2021. Figure courtesy of the Midwestern Regional Climate Center (https://mrcc.purdue.edu/).
FARM (Field Application Resource Monitor)
This tool (farm.bpcrc.osu.edu) allows users to define their locations of interest and receive 12- and 24-hour precipitation forecasts (current and historical) to aid in the application of fertilizer, manure, and/or pesticides.

Figure 5: Percent of normal precipitation in percentage for October 2021. Figure courtesy of the Midwestern Regional Climate Center (https://mrcc.purdue.edu/).

For inquiries about this project, contact Dr. Aaron B. Wilson Extension Climate Specialist (wilson.1010@osu.edu).
Summarize Ohio planting progress and days suitable for fieldwork reported each year the National Agricultural Statistics Service (USDA-NASS).

OSU Extension Statewide
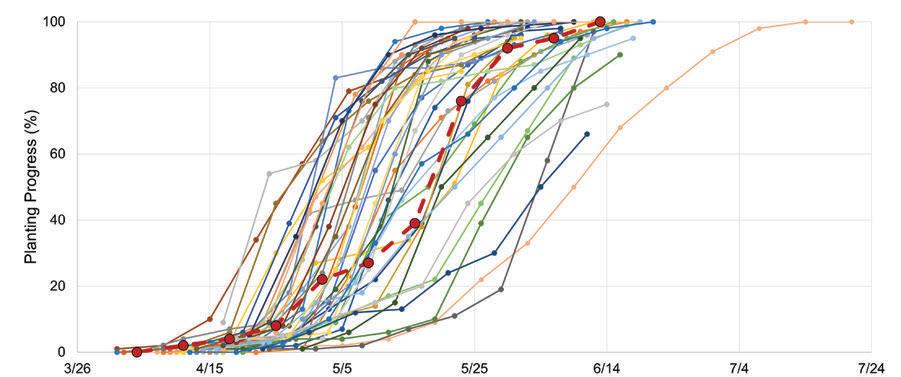
Corn planting pace was slower than normal due to cooler than average temperatures in early spring and wet weather in some areas of the state. In 2021, Ohio farmers reached the 50% planted mark for corn on May 23rd and completed planting by June 13th. Figure 1 illustrates Ohio’s corn planting progress for all years between 1979 and 2021. NASS reported corn planting was completed in Ohio on the week ending June 13, 2021. Snowfall events in late April and early May slowed planting progress across the state. Despite big gains in progress in mid-May, 2021 still was the eleventh latest finish on record. Table 1 shows the years with the five latest corn planting completion dates on record.
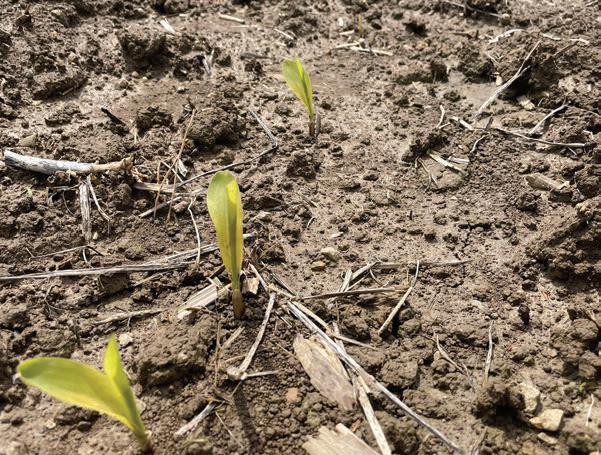
Soybean planting progress was fairly normal in 2021. Figure 2 shows Ohio’s soybean planting progress for all years between 1979 and 2021. Ohio reached 50% planted on May 23rd and soybean planting was reported completed on June 20th. Table 2 shows the years with the ten latest corn planting completion dates on record.
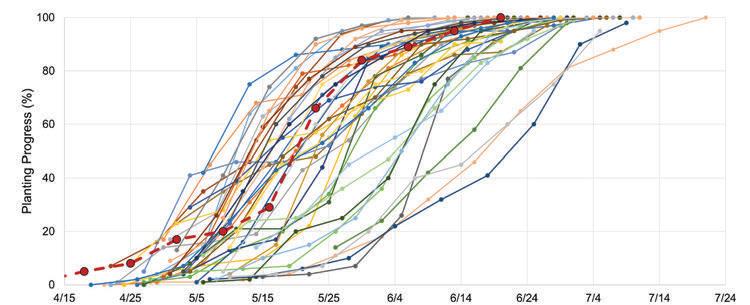
Figure 2. Ohio soybean planting progress reported by USDA NASS from 1979 – 2021. 2021 progress is shown by the scarlet dashed line. Data source: USDA NASS
Table 2. Ten latest reported planting completion dates in Ohio since 1979. Data source: USDA NASS
Year
2019 7/21/2019
1986 7/6/1986
2015 7/5/2015
1983 7/3/1983
1984 7/1/1984
1985 6/30/1985
2014 6/29/2014
1980 6/29/1980
2020 6/28/2020
1998 6/28/1998
The 2021 season got off to a fast start with a higher than average days suitable for fieldwork in April and May, despite the late snow events. A wet September delayed the start of harvest, but a near average October and November enabled a timely harvest in most of the state (Figure 3).
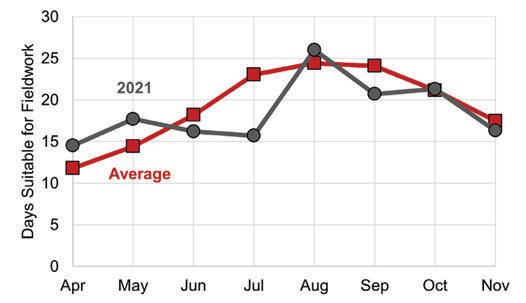
Figure 3. Monthly days suitable for fieldwork. The average number of days per month from 1995 to 2020 (scarlet squares) compared to the number of days available for fieldwork per month in 2021 (gray circles). Monthly totals are calculated based on weekly reports. Data source: USDA NASS
Overall, the 2021 spring planting season was favorable with most of the state completed within a timely window. Snowfall events caused some concern in late April and early May but many early planted fields faired well through the weather and still achieved excellent yields. Most of May provided good planting conditions and statewide planting was completed with the earliest finish date in recent years.
For inquiries about this project, contact Elizabeth Hawkins (hawkins.301@osu.edu), Aaron Wilson (wilson.1010@osu.edu), or John Fulton (fulton.20@osu.edu).
Help Ohio’s farm families achieve financial success in today’s challenging marketplaces.
In 2021, 51 farms with more than 44,000 acres enrolled in the 2020 Farm Business Analysis and Benchmarking Program. Thirty-nine farms with 33,930 crop acres completed the analysis meeting all internal accuracy checks. These 39 farms provided detailed financial and production information completing a whole farm analysis. 37 farms also completed analysis of their crop enterprises. Farms ranged in size from 85 to more than 3,500 acres with 14 farms farming more than 1,000 crop acres.
The 2020 summary contains enterprise reports for grain crops including corn, soybeans and winter wheat. Forage enterprises include corn silage, alfalfa and mixed hay. Results are reported for the average of all farms and the high 20% based on net return per acre. Enterprises are also reported by land tenure for owned acres and cash rented acres. Benchmark reports are available for all enterprises and for each crop with both owned and rented land combined.
Find the full report at farmprofitability.osu.edu
Technicians work directly with farms to develop and complete:
• Balance Sheets, cost and market, beginning and end of year
• Income Statement, accrual adjusted
• Statement of Cash Flows
• Enterprise Analysis
• Cost of Production
• Per acre, per bushel, or per ton


Shaded counties indicate farms participating in analysis.

Trish Levering levering.43@osu.edu


Chris Pfaff pfaff.55@osu.edu

With better weather and improving markets by year-end, average yields and price received per bushel were higher for all farms as well as the high 20% (sorted by net return per acre), except for corn on rented ground, compared to 2019. Soybeans generated higher net returns than corn.
In 2020, CFAP 2 payments were included as income to the crop enterprises as they were tied directly to the 2020 crop. For farms performing at or below the average, this income comprised a large proportion of the net returns. For the high 20% farms, these payments comprised a much smaller and much less important percentage of net returns. Other government payments are not included as income to the crop enterprises.
Combined benchmark reports, including the crop grown on both owned and rented acres, for all farms and for the high 40% of farms, are available in the 2020 Crop Summary. These tools allow farms to benchmark their performance against a larger database and to compare their performance to the most competitive farms.
• Average net returns for corn were positive in 2020. 30 of the 51 enterprises generated positive net returns. 21 generated net returns above $100 per acre, averaging $225 per acre. 10 enterprises generated more than $200 per acre, netting an average of $305 per acre.
• Average net returns for soybeans were above $50 per acre in 2020 with only 6 of 44 enterprises generating negative returns. 28 (64%) of the enterprises generated net returns greater than $100 per acre. 13 generated net returns greater than $200 per acre, averaging $297 per acre.
• Over time, net returns must be positive and of sufficient quantity to cover family living needs, make principal payments and pay income tax liabilities. Additional dollars can be invested either in or outside of the farm business.
2020 Ohio Farm Business Summary
Whole farm business analysis monitors overall profitability, working capital and net worth change. Enterprise analysis provides cost of production data to effectively inform marketing and management decisions. Personalized benchmark reports identify opportunities to control costs and increase profitability.

For inquiries about this project, contact Dianne Shoemaker (shoemaker.3@ osu.edu), Haley Shoemaker (shoemaker.306@osu.edu), Clint Schroeder (schroeder.307@osu.edu), or Trish Levering (levering.43@osu.edu).
Enterprise Budgets have been developed by faculty of the College of Food, Agricultural, and Environmental Sciences (CFAES) for several decades. The 2022 Ohio Crop Enterprise Budgets were developed by Barry Ward, Leader, Production Business Management at Ohio State. The budgets are tools that growers can use to examine different
on their operation to help in decision making. The Enterprise Budgets can be found on Excel spreadsheets that users can download. Growers can then input their own production and price levels to calculate their own outputs. As seen below, the budgets have color coded cells that will allow users to plug in their own numbers and calculate bottom lines for different scenarios.

Gold: Values may be changed to assist in computing the “Your Budget” Column using macros embedded within the spreadsheet.
Light Blue: Values will be calculated for the user based on data entered. These cells may be input manually, but macros will be overwritten!
Gray: Values are stand-alone cells that require direct input from the user.
Key points to remember when utilizing the budget sheets:
• The budgets represent common, workable, combinations of inputs that can achieve a given output.
• Amounts of seed, types and quantities of fertilizer, chemicals, and other items reflect University recommendations and the experience of many Ohio farmers.
• The combinations of inputs and prices presented will not likely precisely reflect any given farm.
• In practice, actual costs will be higher or lower than shown. Thus the most important column is “Your Budget”.
Characteristics of an Enterprise Budget:
• Estimates the costs and returns expected for a single enterprise.
• Represents one combination (from among hundreds available) of inputs such as seed, chemicals, and fertilizer to produce some level of output.
• A written plan for a future course of action including estimated costs and returns for that particular enterprise.
• Provides a format and a basis for developing enterprise budgets appropriate for a given farm situation.
Things not implied by an Enterprise Budget:
• It is not the only combination of inputs that can be used to produce this crop.
• It does not imply that anyone whose costs are different from this must have incorrect data or poor records.
• It does not imply that all producers can achieve these costs and yields. Different soil types, different ways in which the soil has been utilized and cared for in the past, and different weather in a given season all can cause the actual results to vary greatly from what is presented.
Three yields are provided in each budget sheet. The middle yield is the long term trend yield for Ohio. The other two yields are 20% lower and higher than the middle yield. These yields levels reflect differing yield potential.
Seed, fertilizer, and chemical requirements are based on agronomists’ recommendations. Fertilizer amounts vary by yield level to reflect crop removal, based on typical soil test values for P2O5 and K2O. These quantities and prices can changed to reflect your soil tests and local prices to provide a more accurate estimate of your costs of production.
Five items are included as fixed costs, some of which may or may not be fixed for a particular operation. These items include labor, management, machinery and equipment, land, and miscellaneous charges.
The budgets report all costs including cash, depreciation, and opportunity costs. Cash costs likely include categories such as seed, fertilizer, and chemical costs. Depreciation on machinery is included in the “Machinery and Equipment Charge.” Some items may contain opportunity costs, which reflect returns to a producer’s labor, capital, and managerial resources. Opportunity costs should be included in budgeting because they account for the use of a producer’s resources.
Prices for crops and inputs reflect estimates for the given year. Crop prices are estimates of harvest prices. No costs are included for grain storage. If an improved price is acheived by your farm due to storage or marketing strategies, then any increased costs to achieve that price should either be netted out of returns or added to costs.
All budgets report “return above variable costs” and “return above total costs”. Return above variable costs is useful in examining decisions that must be made within a year. Return above total costs would be used to examine “long-run” decisions.
Enterprise Budget
You can access the Ohio Crop Enterprise Budgets by visiting go.osu.edu/enterprise_ budgets or by using the QR code to visit the site.

For inquiries about this information, contact Barry Ward (ward.8@osu.edu).
Custom work is common in farming, especially for tasks that require specialized equipment or expert knowledge of that task. Barry Ward, Leader, Production Business Management along with John Barker and Eric Richer (Extension Educators) worked to develop the 2020 Ohio Farm Custom Rates. This publication provides an extensive list of average custom rates that were derived from a statewide survey of 377 farmers, custom operators, farm managers, and landowners. The Ohio Farm Custom Rates publication is a resource you can use on your operation as a reference in your economic analyses. All the provided rates (except where noted) include the implement and tractor if required, all variable machinery costs such as fuel, oil, lube, twine, etc., and the labor for the operation.
Some of the custom rates provided in the publication vary widely, due to the following variables:
• Type or size of equipment used
• Size and shape of fields
• Condition of the crop
• Skill level of labor
• Amount of labor needed in relation to the equipment capabilities
• Cost margin differences for full-time custom operators compared to farmers supplementing current income
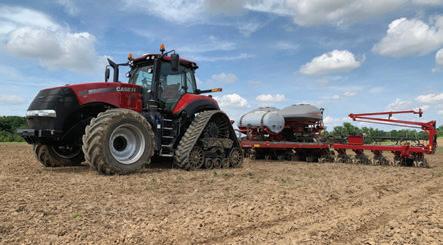
The custom rates provided in the publication summarize the survey respondents. The reported numbers are the average (or mean), standard deviation, median, minimum, maximum, and range. Average custom rates are a simple average of all survey responses. As a custom provider, the average rates reported in this publication may not cover your total costs for performing the custom service. As a customer, you may not be able to hire a custom service for the average rate noted in this fact sheet. Calculate your own costs carefully before determining the rate to charge or pay. The data from this survey are intended to show a representative farming industry cost for specified machines and operations in Ohio. The Ohio Farm Custom Rates publication includes other resources that can help you calculate and consider the total costs of performing a given machinery operation.
The eFields nitrogen studies utilize the Ohio Farm Custom Rates to calculate return above total N. As you read through our nitrogen studies, you can reference these rates to better understand our calculations. Below is a sample of how we utilize these rates for our return above N calculations. The treatment data below is from an eFields Late
Nitrogen study. The total nitrogen rate and yield were inputted in the Nitrogen Timing Calculator that is found in a downloadable Excel file at go.osu.edu/econcalculator
In this example, the “Late Season N ApplicationCoulters/Acre” rate of $13.20 was used to calculate the return above N. After inputting the application rate, yield, and total N rate into the calculator, the Return Above N for this treatment is $772.00 per acre.
Enterprise Budget
You can access the Ohio Farm Custom Rates by visiting go.osu.edu/customrates20 or by using the QR code to visit the site.
You can access the Ohio Crop Enterprise Budgets by visiting go.osu.edu/enterprisebudgets or by using the QR code to visit the site.

For inquiries about this information, contact Barry Ward (ward.8@osu.edu).
Gibberella zeae (also known as Fusarium graminearum), is the pathogen that causes stalk rot and Gibberella ear rot of corn. The fungus typically infects via the silk channel, causing a pinkish-white mold to develop at the tip of the ear. Relatively warm, wet weather (rainfall or high relative humidity) during and after silking (R1 growth stage) provides optimal conditions for the development of ear rot. During infection and colonization of the ear, the fungus produces several mycotoxins, including deoxynivalenol (DON), also called vomitoxin. As a result, high levels of Gibberella ear rot severity and resulting moldy grain are usually accompanied by high levels of vomitoxin.
Moldy leaves and stubble
It is not uncommon to see dust during harvest as fragments of dead, dry plant parts and soil particles become suspended into the air as the combine drives though the field. However, the concern in some years is that the dust can be excessive and particularly darker in color than usual. One possible explanation is that leaves died prematurely as a result for midto late-season diseases such as tar spot, gray leaf spot, and northern corn leaf blight. When exposed to wet, humid conditions these leaves will produce lots of fungal spores. For instance, under wet conditions, northern corn leaf blight lesions produce large amounts of dark-colored spore that are easily suspended in the air once the plants are disturbed by the combine. In addition, saprophytic fungi such as Alternaria, which also produce dark-colored spores, may also grow on dead plant tissue exposed to wet, humid late-season conditions, adding to the amount of dark particles in the dust cloud during harvest.
Ear rot contributes to vomitoxin
Anytime there is slow grain dry-down or late-season rainfall, there is potential for high levels of one or more ear rots (Gibberella, Fusarium, Diplodia and Trichoderma). Of these, Gibberella ear rot (GER) has been the most frequently reported and is the ear rot of greatest concerns since grain harvested from GER-affected fields will be contaminated with vomitoxin and other mycotoxins. One of the primary consequences of GER is vomitoxin contamination of dried distiller ’s grains with solubles (DDGS), a nutrient-rich co-product of ethanol production that is commonly sold as an ingredient for animal feed. Vomitoxin is not destroyed during ethanol production, nor is it removed in the ethanol fraction, but rather becomes concentrated in the grain fraction. This leads to three-fold higher levels of the toxin in DDGS over the levels found in the original grain. Consequently, ethanol plants may reject GER-affect grain with high levels of vomitoxin. Sampling and testing to detect molds
Moldy kernels are typically not evenly distributed in a grain lot, and as a result, toxin-contaminated grain are found in pockets (hot spots). Consequently, poor sampling and/or testing technique may lead to incorrect estimation of vomitoxin in the grain lot. For instance, a sample pulled from a hot spot may lead to an overestimation of the overall level of contamination on the load. Prior to testing, producers (or their agents) may request a second sample be drawn if they feel the first sample was not representative of the entire lot. Following vomitoxin testing, producers/agents have the right to reject the commodity testers’ results and ask the handler to send the sample to a federally licensed grain inspector for a re-test. Refer to Ohio Code 926.31 for details.
Severely diseased and toxin contaminated grain are usually smaller than healthy grain and covered with fungal mycelium (mold). Compared to healthy grain, diseased grain break easily during harvest, transport, and other forms of grain handling, increasing the number of fine particles and the amount of dust in the grain lot. Fields with ear rot problems should be harvested as soon as possible and handled separately from healthy field, even if it means harvesting those field at a higher-than-usual moisture content. Adjust the combine to minimize damage to the grain and increasing the fan speed will help to remove lightweight grain and dust particles, and as a result, reduce the level of mycotoxin in the grain lot. Once harvested, grain should be dried down to below 15% moisture and storage in a clean dry bin.
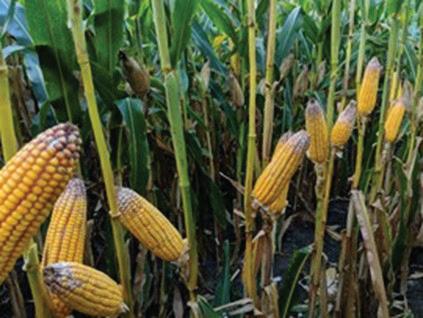
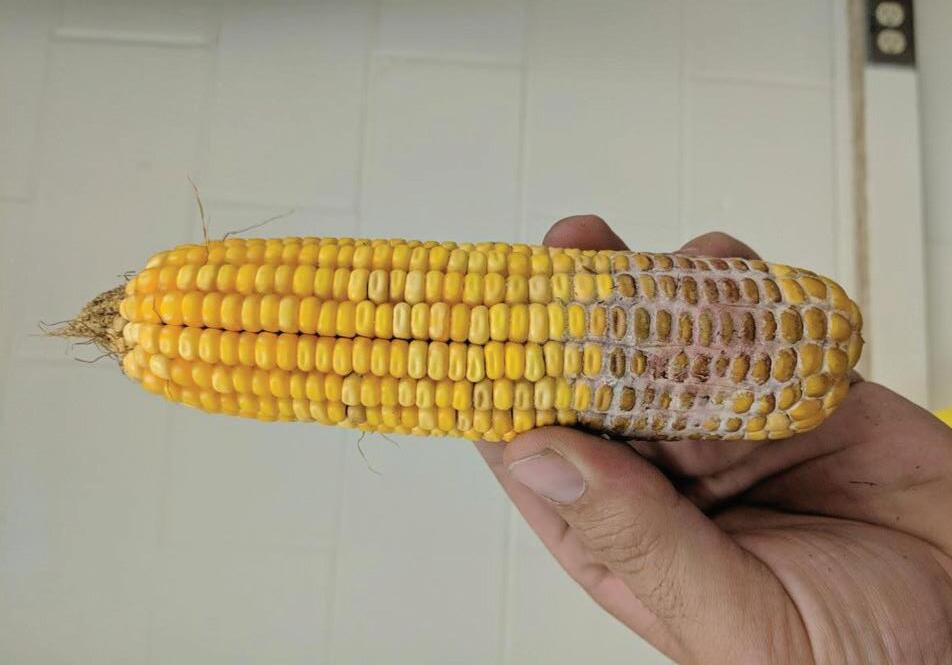
There are no commercially available treatments for reliably reducing vomitoxin in harvested grain. Planting Gibberella ear rot resistant hybrids is the best approach for reducing the disease and toxin contamination in the field. Fungicide applications at R1 have shown promising results, but further research is needed. Toxin levels can increase in storage if conditions are not dry and cool. Warm, moist pockets in the grain promote mold development, causing the grain quality to deteriorate and toxin levels to increase. Aeration is important to keep the grain dry and cool. However, it should be noted that while cool temperatures, air circulation, and low moisture levels will minimize fungal growth and toxin production, these will not decrease the level of toxin that was already present in grain going into storage. Vomitoxin is very stable and will not be reduced with drying.
Respiratory Alert – Harvesting and handling moldy grain may expose workers to mycotoxin and high dust concentrations
Wear a respirator to protect against dusty, moldy and toxic substances. There are two types of disposable models to choose, either the N95 (which filters out 95% of airborne particulates) or the N99 (which filters out 99% of airborne particulates).
The P100 mask is form fitting and is not disposable. This style requires a respirator fit test to ensure the right size. It uses disposable air cartridges to offer the best protection against dusts and molds in the air
Never wear a 1-strap mask on the farm, as they do not offer the level of protection needed in agricultural environments with high organic particles.
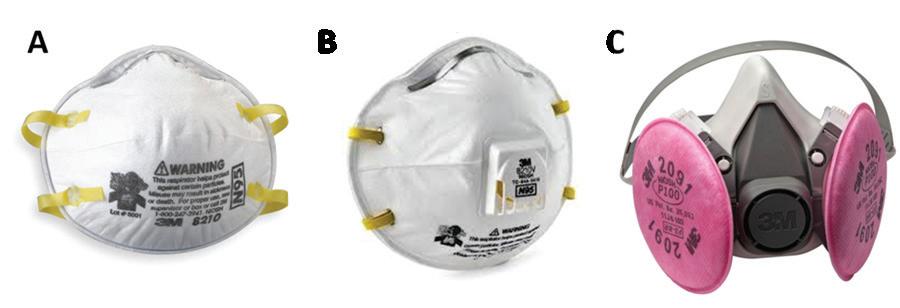
How to wear the respirators correctly
Make sure to wear either an N95, N99 or P100 mask whenever working in dusty and moldy environments, especially at the grain storage and handling bins.
1. The mask should have a tight fit over your nose and mouth, and requires contact with smooth skin. Facial hair, eyeglasses and certain dental appliances can prevent the mask from making a seal around your face.
2. The respirators are available in many sizes and various configurations, making sure the proper fit can be made.
3. Always use both straps to hold the mask in place and prevent air from leaking in around the edges.
When to throw out the N95 mask
Consider the N95 and N99 respirators similar to the air filter in your vehicle.
1. When the mask gets clogged beyond a comfortable condition, replace it with a new mask. Likewise, if the inside of the mask becomes dirty, dispose of it.
2. Replace masks if they become wet, torn or have stretched out straps.
3. N95 and N99 masks are made to be disposable, they cannot be cleaned or disinfected.
There are no recommendations for how many minutes or hours a mask will last in agricultural environments. A face mask filter is rated to absorb a total mass of 200mg, however on the farm, the time to reach this level is not known. Each respirator will be affected by personal hygiene, breathing resistance and density of the air contaminants. Each job will vary - as will the heat, humidity and other environmental conditions while performing the job.
Summary
High moisture corn has the potential to mold and emit mold spores during harvest and storage periods. Workers should protect themselves from grain dust, including the mycotoxins and fungi, with N95, N99 or P100 respirators. Single strap dust masks are worthless in many agricultural environments, especially moldy grain.
For inquiries about this article contact Dee Jepsen (jepsen.4@osu.edu), Pierce Paul (paul.661@osu.edu), or Lisa Pfeifer (pfeifer.6@osu.edu).
You count on research about the latest processes and techniques to help your operation grow. Now, discover the other world-class research from the College of Food, Agricultural, and Environmental Sciences (CFAES). We work with researchers and Extension professionals to get new knowledge into the hands of people who need it. Search on our site to find the latest research, links to related CFAES websites, or KX originals.

Interact with the new Ohio Food System Map to explore connections between every aspect of the food system. View maps, charts, and publicly sourced data about your county with our Community Profiles. Watch videos on current topics and research. Our Broadband for Agriculture Technology video covers
current and future connection speeds to support on-farm technology. Take a look at KX Insights, our one-page handouts about current research. Or try the searchable version of the eFields Report as an easy way to access the latest on-farm research from Ohio State.
Discover the wealth of knowledge available in the yearly eFields Report online at kx.osu.edu/efields Easily find and print specific research reports from the last several years through the eFields searchable database. Filter your search by year, crop, topic, county, or report author. The latest 2021 reports will be available on our site in the spring.
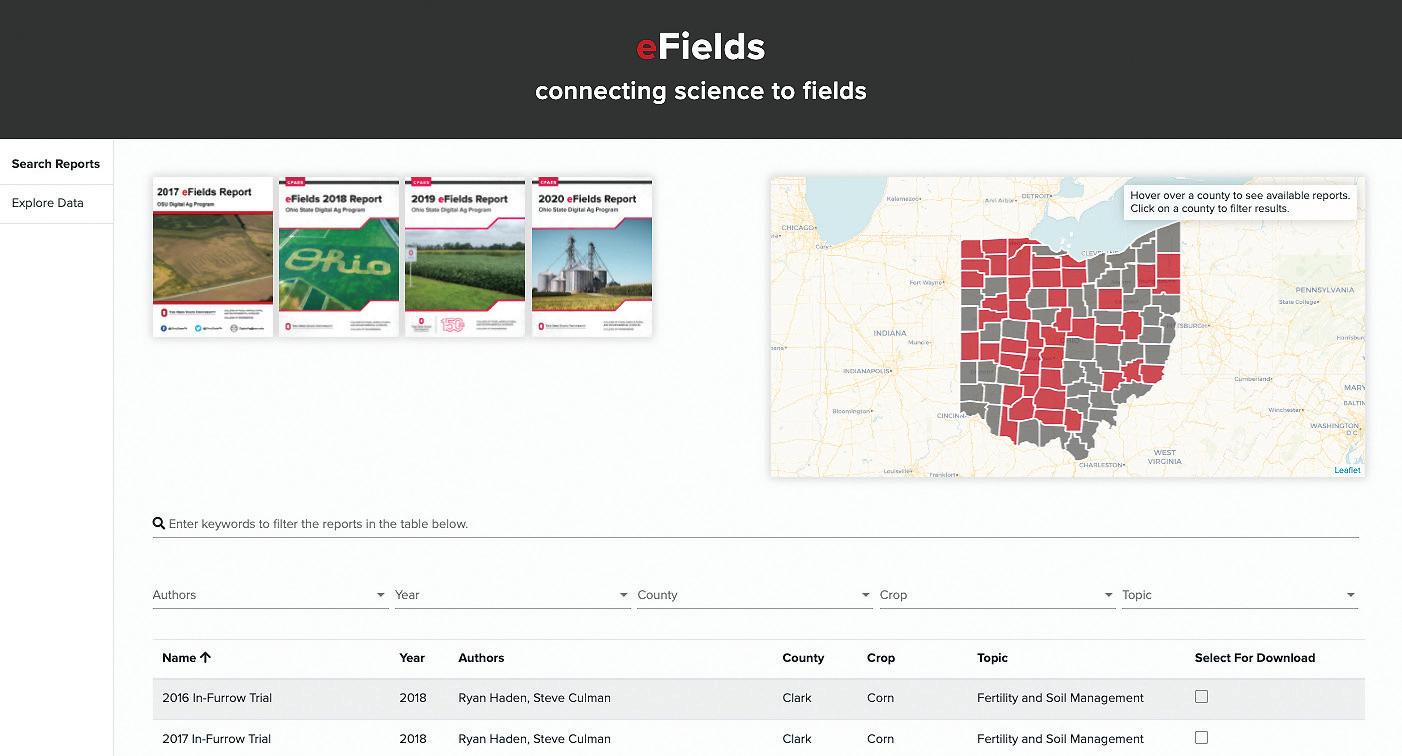
Over 60 researchers and educators have contributed to eFields research. To search by author, simply start typing the name, or select an author from the dropdown menu to see a list of the reports they’ve published.
You can also filter the 321 eFields reports based on the year of publication. To view reports from specific years, click the dropdown menu and select the year. Our database starts with the 2017 edition.
More than 40 counties participate in eFields each year. To learn more about trials in a specific county, select the desired county in the dropdown to get started.
Looking for reports on a specific crop? Check out the “crop” filter to read about forages, corn, soybeans, small grains, and other crops.
Are you more interested in overall topics? Use our “topic” filter to discover more about equipment, management practices, crop protection. and other important topics.
Want to print a report or save a PDF? Select the reports you want, check the download box in the far-right column, and click Download at the top of the column.
For 2021, eFields corn research was focused on improving the production and profitability of corn in the greater Ohio area. Some exciting and innovating projects were conducted this year, with 64 unique studies implemented across the state. 2021 eFields corn research investigated many of the topics listed in the eFields focus areas. Highlights include high speed planting, multi-hybrid planting, corn seeding rates, and many other innovative practices. Here is the 2021 eFields corn research by the numbers:
64 corn studies 3,230 acres
For more corn research from Ohio State University Extension, explore the following resources:
The purpose of the Ohio Corn Performance Trials is to evaluate corn varieties for yield and other agronomic characteristics. This evaluation gives corn producers comparative information for selecting the best varieties for their unique production systems. For more information visit: go.osu.edu/corntrials
The Agronomic Crops Team performs interesting research studies on a yearly basis. Resources, fact sheets, and articles on corn research can be found here on the Agronomic Crops Team website: go.osu.edu/ CropsTeamCorn.
The Ohio State Digital Ag Program conducts studies related to all aspects of corn production. Research related to planting, inputs, and harvesting technology can be found on the Digital Ag website: digitalag.osu.edu.


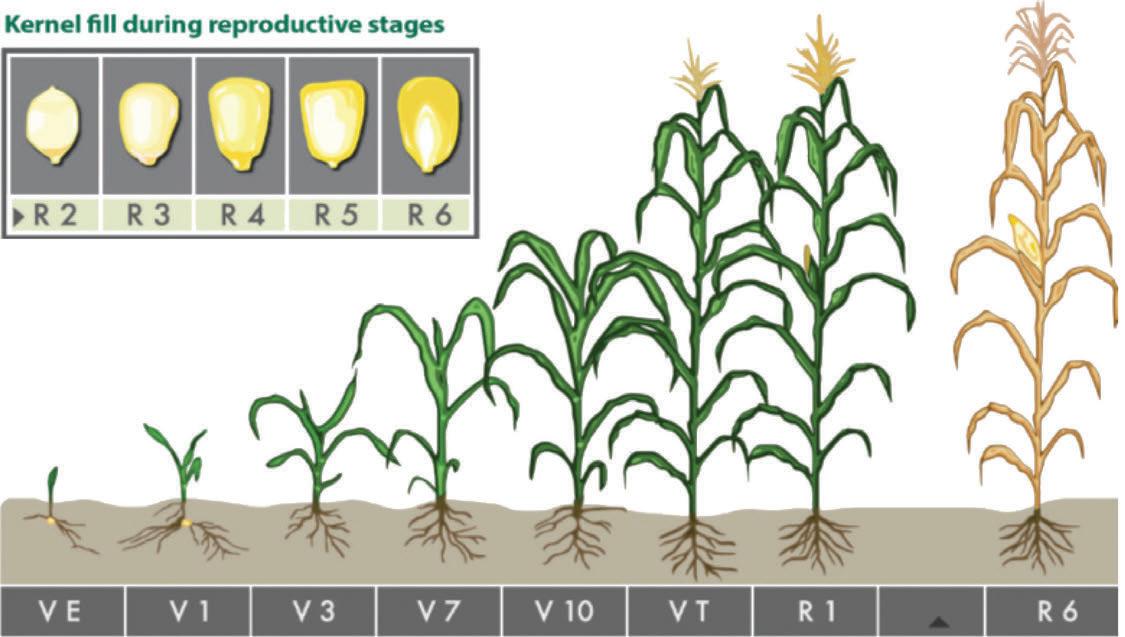
For all corn studies in this eFields report, we define corn growth stages as the following:
VE - Emergence - coleoptile is fully visible, yet no leaves are fully developed.
V1 - Full development of the first (flag) leaf, achieved when the collar of the leaf is fully visible.
VN - N fully developed leaves with collars visible.
VT - Tassels fully visible and silks will emerge in 2-3 days.
R1 - Silking - silks are visible and pollination begins.
R2 - Blister - silks darken and dry out, kernels are white and form a blister containing clear fluid.
R3 - Milk - kernels are yellow and clear fluid turns milky white as starch accumulates, kernels contain 80% moisture.
R4 - Dough - starchy liquid inside kernels has dough-like consistency, kernels contain 70% moisture and begin to dent at the top.
R5 - Dent - nearly all kernels are dented and contain about 55% moisture.
R6 - Black layer - physiological maturity is reached and kernels have attained maximum dry weight at 30-35% moisture.
Compare the rate of nitrogen needed after a legume cover crop using a pre-sidedress soil nitrate test (PSNT).
Planting Date 5/15/2021
Harvest Date 11/9/2021
Variety Pioneer 1283AM
Population Variable Rate
Acres61
Treatments2
Reps 5
Treatment Width90 ft.
Tillage No-Till
Management Fertilizer, Herbicide, Insecticide
Previous Crop Soybeans
Row Spacing30 in.
Soil Type Miami Silt Loam, 59% Crosby Silt Loam, 29% Brookston Silty Clay Loam, 9%
Starter fertilizer was applied evenly across the field. Sidedress rate was determined by PSNT samples to see how much nitrogen legume cover crops provide. The check was the farmer’s typical nitrogen program attributing 30 lbs of N from the clover. Typically a variable rate of N is used. For this trial, we averaged that rate at 129 lbs N/ac and applied 129 lbs N/ ac as a flat rate check.


OSU Extension
Champaign County
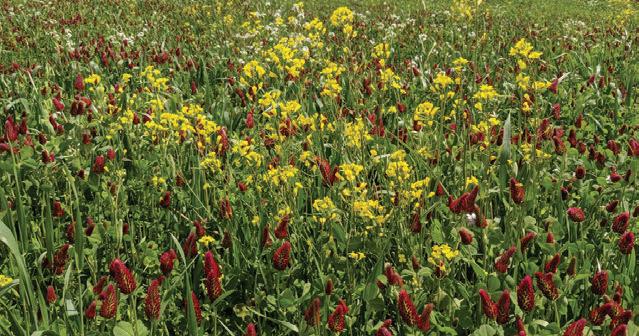
Legume cover crop mix prior to termination.
The field has had cover crops on it since 2013. Predominate soil types are Brookston (30%) and Miami (60%) with slopes in the 2-6% and 6-12% categories. The cover crop may have taken up the pre-plant nitrogen and tied it up for most of the season. This was a flat rate across all treatments so likely would not have caused a difference between treatments but may have impacted overall yield. However, the 5 year yield history for this field is 173 bu/ac so this was still one of the higher yields for this field.
• The results of the PSNT test did not show strong carryover nitrogen availability.
• Yields were not statistically different between the lower and higher rates.

• The PSNT recommendation was 200 lbs of N for a 200 bu/ac crop. 50 lbs of N was applied pre-plant. An additional 130 lbs was applied to the check (280 lbs Super U). This is the rate that was typically used in the past. An additional 15 lbs of Super U was applied to the treatment area.
Treatment Means with the same letter are not significantly different according to Fisher’s Protected Least Significant Differences (LSD) test at alpha = 0.1.

For inquiries about this project, contact Amanda Douridas (douridas.9@osu.edu).
Assess the effect of a slant screen grain cleaner on corn vomotoxin (DON) levels.
Crop2021 Corn
Cleaning Date 2/3/2021
Wind Speed 5.5 mph
Wind Direction North
Fill Speed 1,500 bu/hr
Treatments3
Reps4
Bushels 2,000
Grain Cleaner Type 10 inch homemade slant with 1/4 inch screen
This study was designed to look at the ability of a 1/4 inch slant screen to clean corn and reduce the DON levels in the corn. Samples were pulled as the corn entered the cleaner and as it left the cleaner and was loaded in the truck. Samples of the screening which were removed from the corn were also tested for DON levels.

OSU Extension
Crawford County
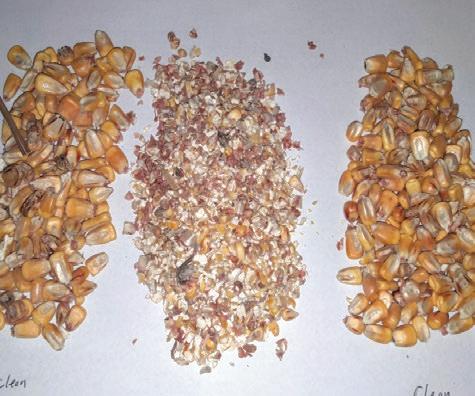
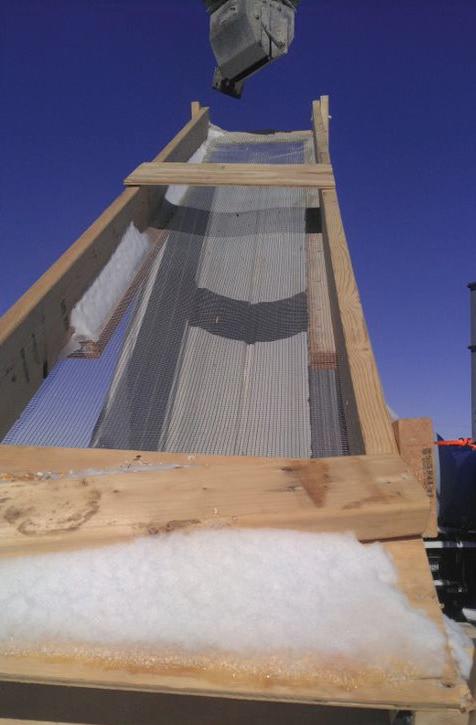
Grain cleaning slant.
During grain cleaning we could see visual differences between the sample entering the grain cleaner and exiting the grain cleaner. The sample going in the truck had less fines, broken kernels, and small black kernels in it.
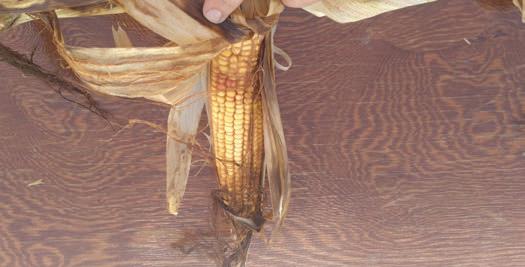
Treatment Means with the same letter are not significantly different according to Fisher’s Protected Least Significant Differences (LSD) test at alpha = 0.1.
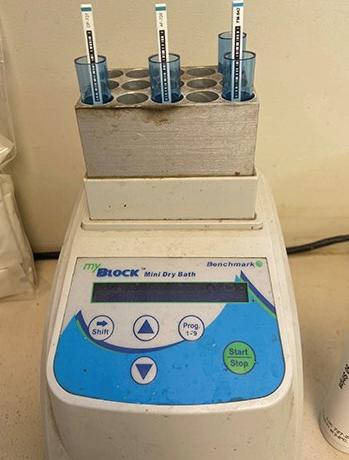
DON quick test to determine the level of DON in corn at the elevator before unloading the corn into there storage facility.
• Grain cleaning did not significantly lower DON levels in this trial.
• We have seen instances where grain cleaning has lowered DON levels from the teens to single digits.

• In this case through the grain was already in the single digits and we were not able to lower it as much as we were wanting.
For inquiries about this project, contact Jason Hartschuh (hartschuh.11@osu.edu).
Evaluate the yield and economic effects of fungicide applications on corn at R2.
Planting Date 5/20/2021
Harvest Date 10/25/2021
VarietyBeck's 5909, Pioneer 1197
Population 35,000 sds/ac
Acres80
Treatments2
Reps3
Treatment Width90 ft.
Tillage No-Till
Management Fertilizer, Fungicide, Herbicide
Previous Crop Soybeans
Row Spacing30 in.
Soil Type Crosby Silt Loam, 56% Celina Silt Loam, 22% Brookston Silty Clay, 9%
The experiment was a randomized complete block design with three replications. Plots were 90 feet wide and field length. The combine was calibrated in season. The treatments were fungicide application and a control.


OSU Extension Darke County
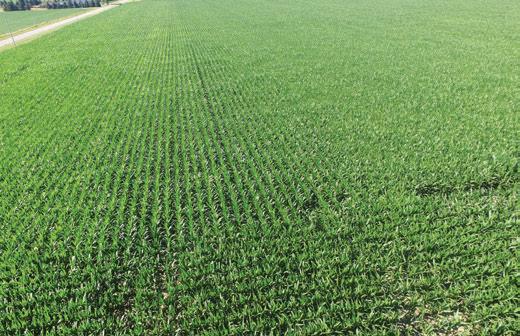
Aerial image of corn field early in the season.
There was no significant yield difference between the fungicide and control treatments. The fungicide application had improved visual efficacy on northern corn leaf blight.
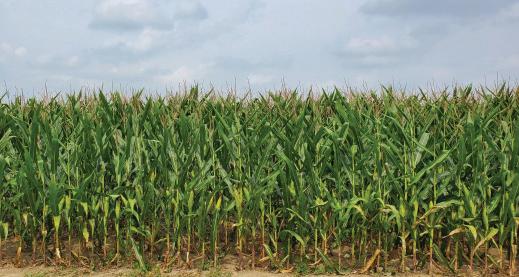
• This study had disease pressure post fungicide application.
• Though both treatments had disease pressure, northern corn leaf blight appeared to be more prevalent in the control treatment.

• Gray leaf spot was equally prevalent in both treatments.
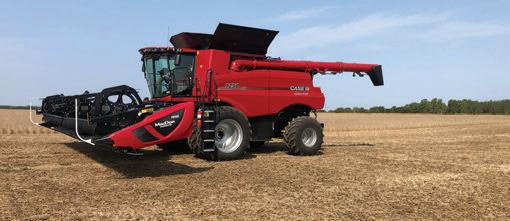
Treatment Means with the same letter are not significantly different according to Fisher’s Protected Least Significant Differences (LSD) test at alpha = 0.1.
Scan here to watch an aerial fungicide application video that features the historical advancements of aerial applications in agriculture.

For inquiries about this project, contact Taylor Dill (dill.138@osu.edu).
To see if tiled or not tiled plots germinated and grew better and to see if fungicide applications will help increase yield.
Planting Date 5/22/2021
Harvest Date 11/5/2021
VarietyBeck’s 4905VR
Population 30,600 sds/ac
Acres 5
Treatments8
Reps12
Treatment Width60 ft.
TillageMinimal
Management Fertilizer, Fungicide, Herbicide
Previous CropCover Crop
Row Spacing30 in.
Soil Type Centerburg Silt Loam, 64%
Bennington Silt Loam, 21%
Amanda Silt Loam, 15%
We had six reps with two plots in each rep. Three plots were not tiled and three were for a total of six plots on tiled ground and six on non tiled ground. Fungicide was appled to six plots total three tiled and three untiled. We checked the emergence of each plot and checked the yields of each plot when we harvested the corn.
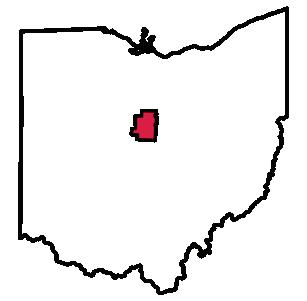

OSU Extension
Morrow County

The plots that received fungicide did not apear to be much different than the plots that did not receive fungicide. The disease preasure was very simular and the yields were also very simular in some cases they were better.
• We found that the fungicide application did not make a difference in the yield average.
• The fungicide would not have paid for itself since there was not a yield difference between the treated and untreated plots.
Treatment Means with the same letter are not significantly different according to Fisher’s Protected Least Significant Differences (LSD) test at alpha = 0.1.
Means with the same letter are not significantly different according to Fisher’s Protected Least Significant Differences (LSD) test at alpha = 0.1.
For inquiries about this project, contact Carri Jagger (jagger.6@osu.edu).
Evaluate the effect of foliar fungicide on corn silage yield and quality.

Planting Date 5/18/2021
Harvest Date 9/10/2021
VarietyDeKalb 57-99
Population 35,000 sds/ac
Acres49
Treatments2
Reps3
Treatment Width 15 ft.
TillageConventional
Management Fertilizer, Fungicide, Herbicide
Previous CropCorn
Row Spacing30 in.
Soil Type Cardington Silt Loam, 65%
Tiro Silt Loam, 16%
Bennington Silt Loam, 14%
This study was designed as a randomized complete block study comparing the application of Miravas Neo fungicide utilizing undercover drops to no fungicide application. The crop was harvest and silage and moistures corrected to 65% moisture for all treatments. Samples were then submitted for laboratory analysis of feed quality and vomitoxin concentration.

OSU Extension
Crawford County
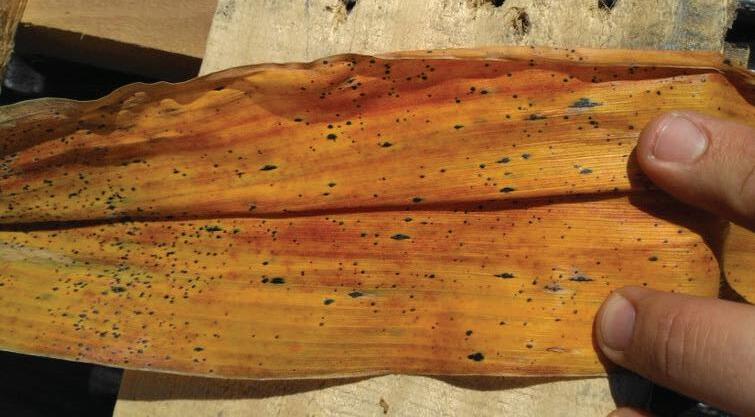
Low disease pressure was present during VT fungicide application but gray leaf spot was present. At corn silage harvest time there was significant tarspot and gray leaf spot pressure the disease level ratings for both were significantly higher though for the untreated control.
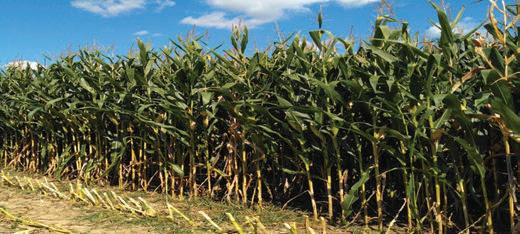
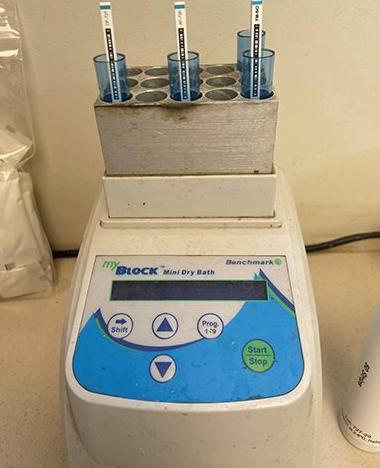
Lab DON analysis to assess the level of mycotoxins present in the silage. High levels of mycotoxins can cause health and productivity issues in livestock.
• Miravis Neo fungicide application on corn intended for silage had a significant effect on yield, moisture, and vomitoxin levels.
• Silage yield corrected to 65% moisture saw a 3 ton advantage to fungicide application.

• The silage was also six percent wetter where fungicide was applied.
• There was also a significant difference in vomotxoin levels with the untreated plots having DON levels of 3.1 which is higher than the recommendation of 1 ppm for high producing dairy cows.
• The treated plots only had DON levels of 0.5 which is low enough for high producing dairy cow consumption.
For inquiries about this project, contact Jason Hartschuh (hartschuh.11@osu.edu).
Investigate the effects of fungicide and application method on corn yield and DON concentration.
Planting Date 5/18/2021
Harvest Date 11/15/2021
VarietyChannel 210-79DGVT2PRIB
Population 36,000 sds/ac
Acres60
Treatments3
Reps4
Treatment Width20 ft.
Tillage No-Till
Management Fertilizer, Fungicide, Herbicide, Insecticide
Previous Crop Soybeans
Row Spacing30 in.
Soil Type Elliott Silt Loam, 45% Blount Silt Loam, 32% Pewamo Silty Clay Loam, 18%
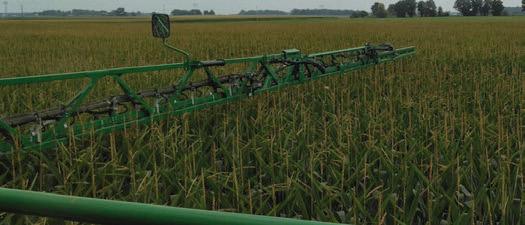
The experiment was designed as a randomized complete block trial with approximately 1.75 acres per treatment pass. Treatments were 20 feet wide, applied with a 60 foot sprayer that had 8 rows of undercover drops on one side of the machine and 8 rows on the other side used for applying over the top of the corn tassels. The center pass of the sprayer with sprayer tracks was not part of the trial. Fungicide Proline was applied at 15 gallons per acre using water as the carrier.


OSU Extension
Crawford County
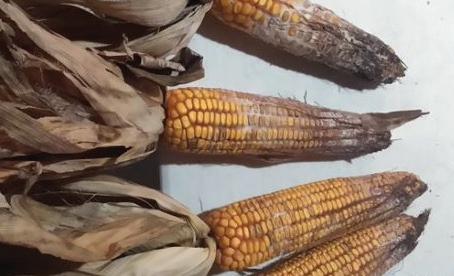
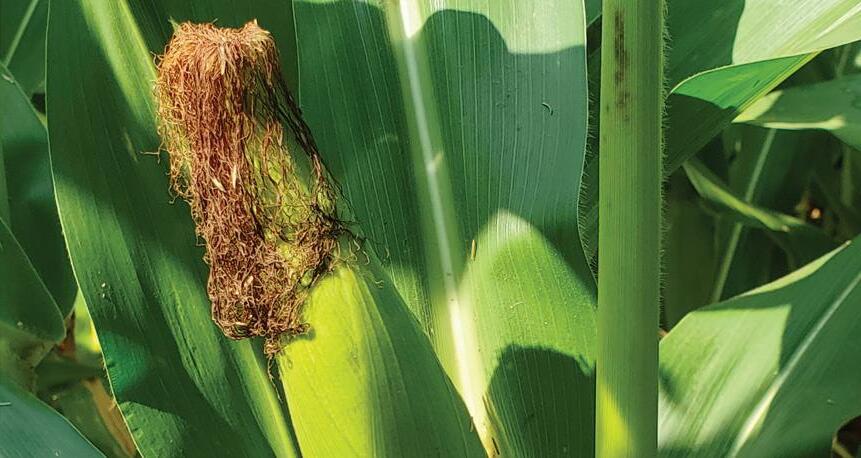
Gibberella ear rot levels from natural infection were low across all treatments. However at R5 there was a difference in gray leaf spot severity between the untreated and fungicide treated plots. When comparing the two application methods of undercover drops to the boom over the top, the boom over the top did not have good coverage at ear level but the undercover drops were able to have uniform coverage from ear to tassel.
• Fungicide application had positive trend on yield but it was not a significant or consistent effect.
• There was also no effect on grain moisture.

• Early disease pressure was low and the hybrid had very good genetic resistance.
• Gray leaf spot did move in late in the season and showed significantly lower disease pressure in the plots treated with fungicide.
Treatment Means with the same letter are not significantly different according to Fisher’s Protected Least Significant Differences (LSD) test at alpha = 0.1.
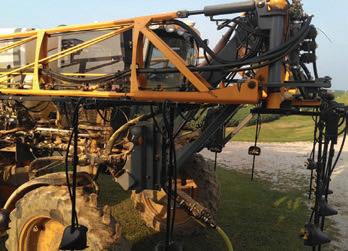
360 UnderCover drops for applying fungicide to corn at tassel to get better plant coverage to ear level than an over the top ground application.
For inquiries about this project, contact Jason Hartschuh (hartschuh.11@osu.edu).
Investigate the benefits of fungicide and application method on corn yield and DON concentration.
Planting Date 4//27/2021
Harvest Date 10/23/2021
VarietyDeKalb 55-53
Population 34,400 sds/ac
Acres 71
Treatments3
Reps4
Treatment Width60 ft.
TillageConventional
Management Fertilizer, Herbicide, Fungicide
Previous Crop Soybeans
Row Spacing30 in.
Soil Type Luray Silty Clay Loam, 40%
Pewamo Silty Clay Loam, 16% Tiro Silt Loam, 12%
High DON levels in corn can be a major problem for livestock producers. Some fungicides such as Mirvas Neo may help lower DON levels and increase corn yield. This study investigated the fungicides ability to lower DON levels compared to an untreated control and if drops improve fungicide coverage at the ear level to better control Fusarium Graninearum.


OSU Extension
Crawford County
When applying fungicide at VT, no disease pressure was observed. There was a difference in fungicide coverage between the two application methods of over the top versus using drops. The drops had much better coverage at ear level than the boom over the top. The drops however did not have good coverage on the top sixth of the plant that was above the drops.
• Fungicide application had a significant effect on yield when applied using drops but not when applied with the boom over the top of the crop.

• Fungicide over the top did not significantly increase yield but trended toward a yield increase.
• DON levels are still being lab analyzed. Rapid test showed no difference and low disease pressure.
Treatment Means with the same letter are not significantly different according to Fisher’s Protected Least Significant Differences (LSD) test at alpha = 0.1.
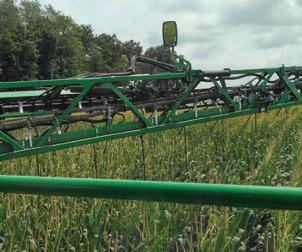
TeeJet 24-inch drops allow fungicide or herbicide to be applied under the crop canopy.
For inquiries about this project, contact Jason Hartschuh (hartschuh.11@osu.edu).
Measure the yield response of corn to fungicide application and the fungicides ability to lower DON levels with different application methods.
Planting Date 5/19/2021
Harvest Date 10/21/2021
VarietyDeKalb 53-27
Population 33,200 sds/ac
Acres40
Treatments3
Reps4
Treatment Width60 ft.
TillageMinimum
Management Fertilizer, Fungicide, Herbicide
Previous Crop Soybeans
Row Spacing30 in.
Soil Type Pewamo Silty Clay Loam, 70%
Tiro Silt Loam, 15%
Bennington Silt Loam, 15%
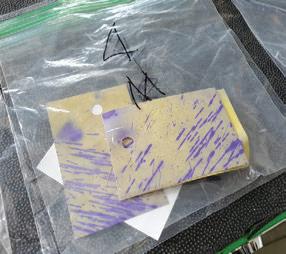
Proline fungicide was applied at tassel using two application methods and a control to assess the effect on yield and disease level. One of the goals of the project is to assess the fungicides effect on grain vomontoxin levels. The two application methods were applied over the top and 24 inch drops utilizing 20 gallons per acre of carrier to attempt to maximize plant coverage at ear height.


OSU Extension
Crawford County
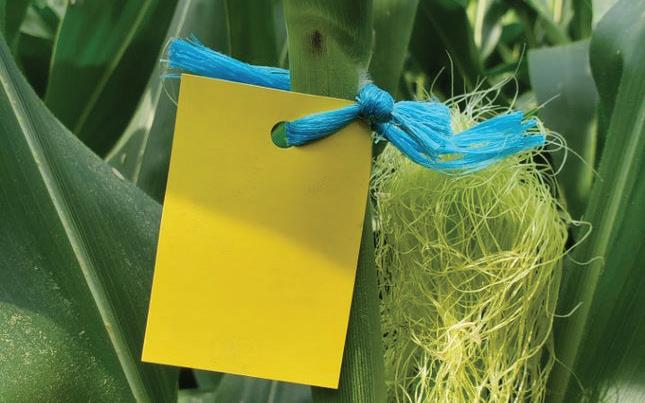
Water sensitive paper at ear height.
At fungicide application time a low level of gray leaf spot was present and uniformly infected across the field. By R5, there was a significant difference in disease levels between the untreated plots and the plots with fungicide applied. The was no difference in disease pressure between the two application methods.
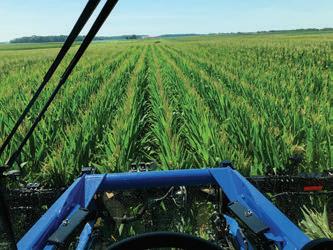
• Fungicide application of Proline provided a significant increase in corn yield over the untreated control.

• The application method of applying the fungicide over the top of the plant versus applying it using 24 inch drops did not cause a significant difference in yield.
Fungicide with Drops 198 ab
Fungicide over the top 199 a No Fungicide
191 c
Treatment Means with the same letter are not significantly different according to Fisher’s Protected Least Significant Differences (LSD) test at alpha = 0.1. LSD: 5.4
Water sensitive paper was utilized to compare coverage of different spray application methods.
2.0%
For inquiries about this project, contact Jason Hartschuh (hartschuh.11@osu.edu).
Determine the feasibility of using automated closing systems across soil landscapes.
Planting Date 5/16/2021
Harvest Date 10/28/2021
VarietyBeck's 5140HR
Population 32,000 sds/ac
Acres40
Treatments4 Reps4
Treatment Width20 ft.
TillageMinimum
Management Fertilizer, Fungicide, Herbicide, Insectide
Previous Crop Soybeans
Row Spacing30 in.
Soil Type Miamian Silt Loam, 36%
Carlisle Muck, 34%
Miamian Silty Clay Loam, 25%

OSU Extension
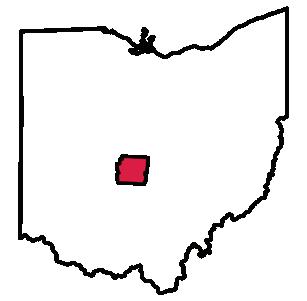
Franklin County
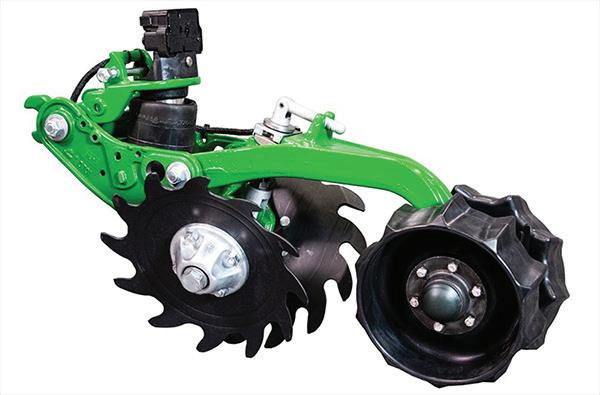
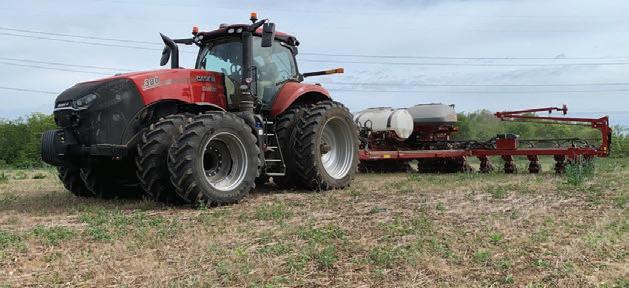
This trial was designed to compare different FurrowForce margin settings across changing field conditions. Four different settings were tested 15, 30, 45, and 60 pounds. FurrowForce is an automated two stage closing system with fundamental differences from traditional closing systems. The first stage notched wheels work to close the seed furrow from the bottom up, eliminating air pockets. The second stage stitch wheels carry weight on them to firm the soil over the seed and maintain the first stage notched wheels at your chosen depth. The average weight carried by these stitch wheels is called “Closing Margin” and is measured by a loadcell. When the loadcell measures more or less weight than has been set on the 20|20, the FurrowForce system will automatically adjust row-by-row the force applied to the closing system.
Planting conditions were good with soil moistures normal to high at planting. This field was planted into rye cover crop. Extreme field variability in soil types in this field and differences were seen from different set points for different soil types. In some soils, lightest setting had trouble closing the furrow while heaviest setting would over close the furrow.
• No statistical difference in yield existed between treatments.
• A margin setting of 30 lbs was the highest yielding for this field and was observed to do the best job in all soil types.
• 30 lbs closing margin seemed to perform best and provides a good starting point in normal planting conditions.
• In wet conditions, closing margin can be reduced to around 15 lbs to minimize compaction.
• Closing margin can be increased to around 55 lbs to firm the soil in dry and loose conditions where moisture retention is needed.
Treatment Means with the same letter are not significantly different according to Fisher’s Protected Least Significant Differences (LSD) test at alpha = 0.1.
For inquiries about this project, contact Andrew Klopfenstein (klopfenstein.34@osu.edu).
Determine the feasibility of using automated closing systems across soil landscapes.
Planting Date 5/17/2021
Harvest Date 10/26/2021
VarietyBeck's 5140HR
Population Variable Rate
Acres 35
Treatments4
Reps 5
Treatment Width20 ft.
TillageMinimum
Management Fertilizer, Fungicide, Herbicide, Insecticide
Previous Crop Soybeans
Row Spacing30 in.
Soil Type Warsaw Silt Loam, 68%
Genesee Silt Loam, 29%


OSU Extension
Franklin County
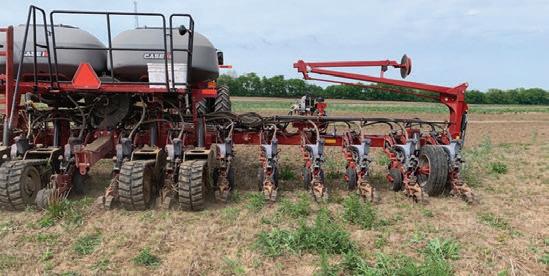
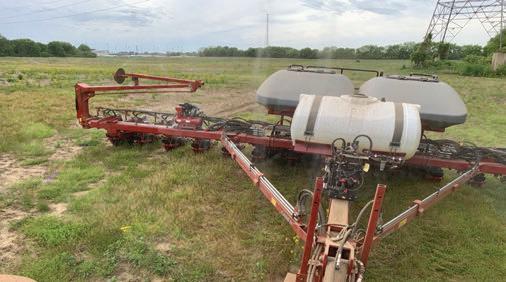
This trial was designed to compare different FurrowForce margin settings across changing field conditions. Four different settings were tested 15, 30, 45, and 60 pounds. FurrowForce is an automated two stage closing system with fundamental differences from traditional closing systems. The first stage notched wheels work to close the seed furrow from the bottom up, eliminating air pockets. The second stage stitch wheels carry weight on them to firm the soil over the seed and maintain the first stage notched wheels at your chosen depth. The average weight carried by these stitch wheels is called “Closing Margin” and is measured by a loadcell. When the loadcell measures more or less weight than has been set on the 20|20, the FurrowForce system will automatically adjust row-by-row the force applied to the closing system.

Planting conditions were good with soil moistures normal to high at planting. During planting, it was lightly raining. Some areas were high speed disced to deal with some weed escapes. Overall, this field was more uniform in soil type and not as many differences seen with settings during planting.
• No statistical difference in corn yield existed between treatments.
• A margin setting of 30 lbs was the highest yielding for this field and was observed to do the best job in all soil types.
Treatment Means with the same letter are not significantly different according to Fisher’s Protected Least Significant Differences (LSD) test at alpha = 0.1.

For inquiries about this project, contact Andrew Klopfenstein (klopfenstein.34@osu.edu).
Understand planter and tractor power/ speed limitations with respect to emergence and corn yield.
Planting Date 5/22/2021
Harvest Date 10/28/2021
VarietyBeck's 6589RR
Population 34,000 sds/ac
Acres 50
Treatments4 Reps 5
Treatment Width40 ft.
Tillage Vertical
Management Fertilizer, Fungicide, Herbicide, Insecticide
Previous Crop Soybeans
Row Spacing30 in.
Soil Type Miamian-Kendallville Silt Loams, 35%
Miamian Silt Loam, 26%
Westland Silty Clay Loam, 21%
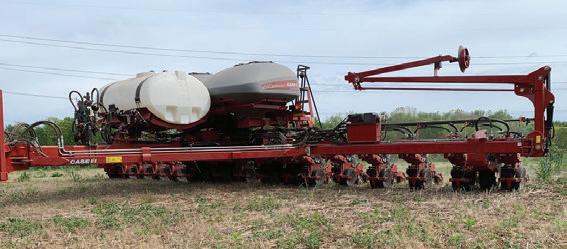
High speed planter systems have become more common on modern planters. We continue to evaluate this technology pushing the limits to find the top end as well as the “sweet spot” for optimal planting. This study evaluates four speeds of planting in central Ohio and their effects on yield and emergence. Heavy downforce (150) was applied using a Precision Planting 20|20 monitor and DeltaForce. This planter was also equipped with Precision Planting vDrive, vSet and SpeedTube.

Beck’s Hybrids
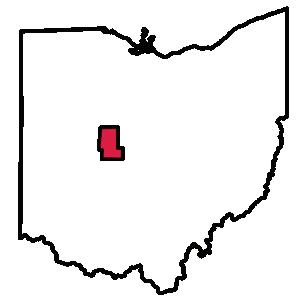
Pickaway County
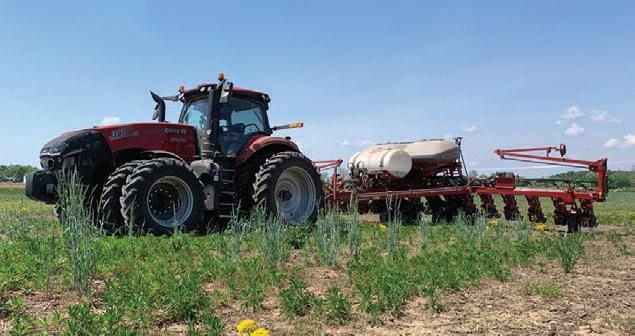
High speed planter setting up to plant trial.
Stand counts show little difference between speeds. Uniform emergence allowed the crop to get off to a good start thanks to hydraulic downforce keeping the planting depth consistent. Growing conditions were very favorable throughout the entire growing season but lack of rain was the yield limiting factor for this field and late planting date.

• No significant difference in yield indicated speed was not a limitation when it comes to potential.
• Three necessary components for this to be successful are hydraulic downforce, electric drive meters, and speed tubes.
• We continue to see these results time and time again with minimal impact on yield. On several occasions over the years, a yield advantage to planting faster has resulted.
• Planting faster allows more acres to be completed per hour without increasing the number of row units on a farm.
Treatment Means with the same letter are not significantly different according to Fisher’s Protected Least Significant Differences (LSD) test at alpha = 0.1.
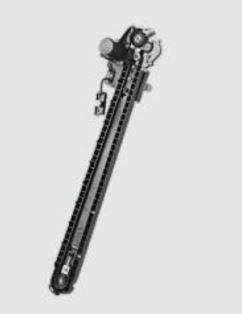
Precision Planting’s SpeedTube
This tool allows for increased speed and spacing consistency while maximizing the planters capability during tight weather windows. The belted design “hand delivers” seed right into the furrow.
For inquiries about this project, contact Andrew Klopfenstein (klopfenstein.34@osu.edu).
Evaluate the effect of planter speed on corn emergence and yield.
Planting Date 5/19/2021
Harvest Date 11/6/2021
VarietyDeKalb C63-57
Population 34,000 sds/ac
Acres40
Treatments9
Reps4
Treatment Width40 ft.
Tillage Vertical
Management Fertilizer, Herbicide, Insecticide
Previous Crop Soybeans
Row Spacing30 in.
Soil Type Blount Silt Loam, 35%
Glynwood Silt Loam, 23%
Pewamo Silty Clay Loam, 19%
Four planting speeds were randomized and replicated four times across the field. A constant population rate was used across all plots. Data collection included stand counts for emergence evaluation, yield, and harvest moisture.

Extension Union County
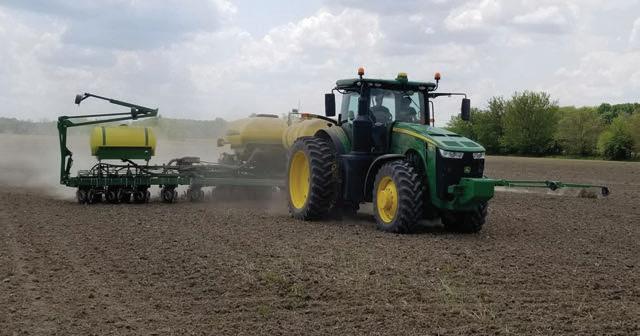
OBSERVATIONS
No differences were observed across all plots and treatments while collecting emergence data. The weather in the 2021 growing season was favorable in this part of the county.
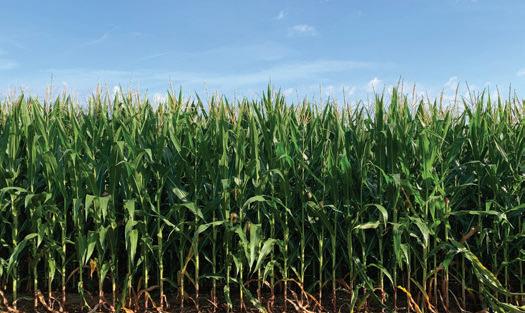
• A slight difference was statistically realized between the two slowest speeds with the slowest speed having the advantage.
• No significant emergence or yield difference was measured when comparing the slowest and fastest speed treatments.
• With this result, more acreage may be planting in less time using equipment to its fullest potential.
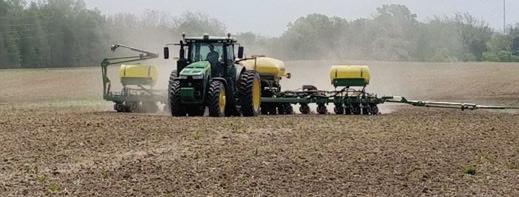
Treatment Means with the same letter are not significantly different according to Fisher’s Protected Least Significant Differences (LSD) test at alpha = 0.1.
YouTube link to video featuring a partner farmer who conducted a high speed planting trial.

For inquiries about this project, contact Wayne Dellinger (dellinger.6@osu.edu).
Study the effect of different downforce settings on crop emergence and final yield.
Planting Date 5/22/2021
Harvest Date 10/28/2021
VarietyBeck's 6589RR
Population 34,000 sds/ac
Acres 50
Treatments 5 Reps 5
Treatment Width40 ft.
Tillage Vertical
Management Fertilizer, Fungicide, Herbicide, Insecticide
Previous Crop Soybeans
Row Spacing30 in.
Soil Type Westland Silty Clay Loam, 32%
Miamian-Kendallville Silt Loams, 28%
Miamian Silt Loam, 26%
There have often been questions about spring vs pneumatic vs hydraulic downforce and the potential ROI on each system. To test this, hydraulic cylinders in a constant pressure were used to simulate springs set to standard settings that surveyed growers’ use in a light and a heavy application. The “optimal” active downforce was also used to see what the system could do to keep the seed at the perfect depth. Additionally, this planter was equipped with wing downforce to help distribute weight and keep the planter level during operation.


Growing Season Weather Summary
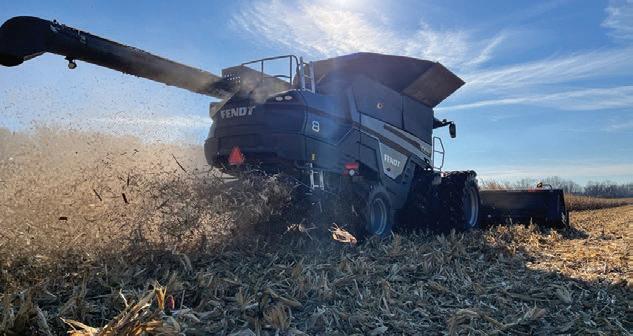
The normal planting date would be the end of April and was delayed due to a wet spring. However, planting conditions were optimal with planting depth of 2.25 inches at a speed of 7 to 9 mph. This field had significant terrain change and washouts during planting due to heavy rainfall in the spring. During the middle of the growing season corn was stressed due to high temperatures and small amounts of rain during reproduction times of the corn plant. Additionally, the gravel and clay hill sides burnt up due to temperature.
• There was no significant difference in corn yield between treatments for this growing season.
• No difference in grain moisture at harvest between treatments.
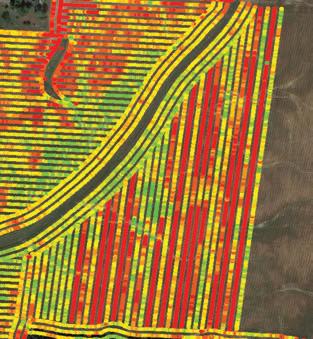
Treatment Means with the same letter are not significantly different according to Fisher’s Protected Least Significant Differences (LSD) test at alpha = 0.1.
Delta Downforce, a product of Precision Planting, is a hydraulic cylinder that replaces springs or air bags on your existing planter. It works in coordination with a sensor on the gauge wheels measuring back pressure with readings 10 times per second. This allows the row unit to maintain depth and the seed to have optimal conditions across all soil types as soil types change across a field

For inquiries about this project, contact Andrew Klopfenstein (klopfenstein.34@osu.edu).
Determine if starter fertilizer rates can be reduced by applying only in furrow near the seed compared to continuous band application.
Planting Date 5/16/2021
Harvest Date 11/14/2021
Variety Pioneer P1380AM
Population 34,500 sds/ac
Acres 58
Treatments4
Reps4
Treatment Width60 ft.
TillageConventional
Management Fertilizer, Fungicide, Herbicide, Insecticide
Previous Crop Soybeans
Row Spacing30 in.
Soil Type Dunham Silty Clay Loam, 81%
Xenia Silt Loam, 9%
Randolph Silt Loam, 8%
The trial was designed to compare two fertilizer rates and three fertilizer placements. 5.25 gallons of Nachurs Impulse starter and Nachurs CropMax was applied in furrow during the planter pass. Treatments included a no starter check compared to the starter product applied in a continuous stream, a 2-inch DASH, and a 3-inch DASH centered on the seed. The treatments were replicated four times in a randomized complete block design.
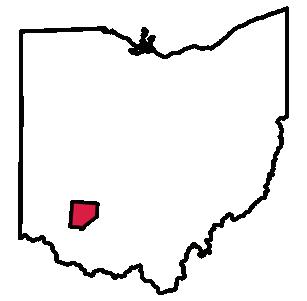

OSU Extension
Clinton County
Growing Season Weather Summary
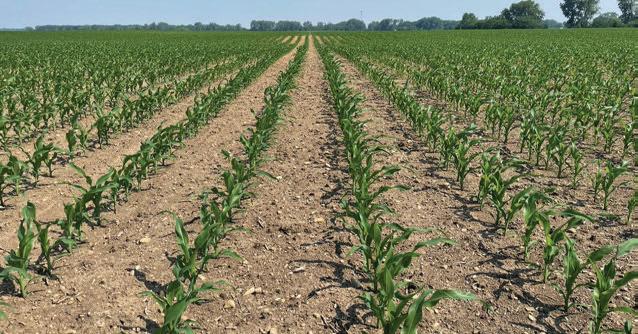
Corn stand was consistent among treatments.
No visual differences were observed between the treatments at any point in the season. Weather conditions were favorable and yields were good. Warm soil temperatures at planting may have reduced the benefit of starter fertilizer.
• No statistically yield differences were measured.
• Lack of yield response was most likely due to warm soil temperatures at planting.
• The Dash system allowed for a reduction in starter fertilizer rate without reducing yield in this field for 2021.

Treatment Means with the same letter are not significantly different according to Fisher’s Protected Least Significant Differences (LSD) test at alpha = 0.1.
360 DASH - Rather than a continuous stream of liquid fertilizer, the 360 DASH valve meters a two- or three-inch “dash” of fertilizer and positions it for rapid interception by seedling roots.

For inquiries about this project, contact Elizabeth Hawkins (hawkins.301@osu.edu) or Tony Nye (nye.1@osu.edu).
Determine if starter fertilizer rates can be reduced by applying only in furrow near the seed compared to continuous band application.
Planting Date 5/31/2021
Harvest Date 11/17/2021
VarietyBeck's 5829A4
Population 34,000 sds/ac
Acres 45
Treatments6
Reps6
Treatment Width40 ft.
Tillage Vertical
Management Fertilizer, Fungicide, Herbicide
Previous Crop Soybeans
Row Spacing30 in.
Soil Type Brookston Silty Clay Loam, 50% Crosby Silt Loam, 50%
The trial was designed to compare two fertilizer rates and three fertilizer placements. 3 and 5 gallons of 10-34-0 was applied in furrow during the planter pass. The 10-34-0 starter was applied in a continuous stream, a 2-inch DASH, and a 3-inch DASH centered on the seed. The treatments were replicated six times in a randomized complete block design.
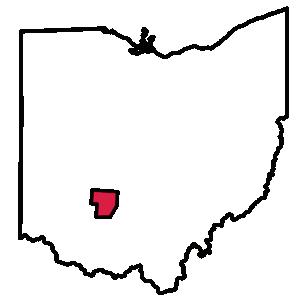

OSU Extension Fayette County
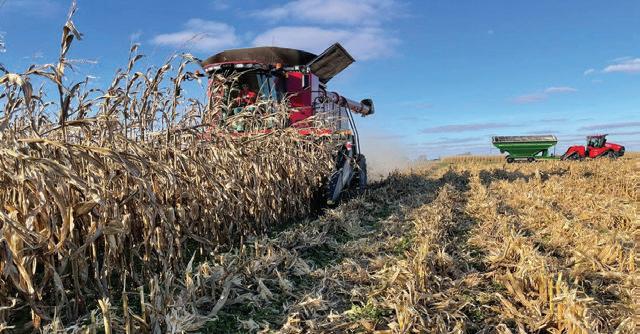
A minor plant height difference was observed early in the season with the higher rate plots being taller. This difference disappeared by sidedress. Weather conditions were favorable and yields were good. Planting was delayed at this location and warm soil temperatures may have reduced the benefit of starter fertilizer.

• No statistically significant yield differences were observed.
• Lack of yield response may be due to warm soil temperatures at planting.
• The Dash system allowed for a reduction in starter fertilizer rate without reducing yield in this field in 2021.
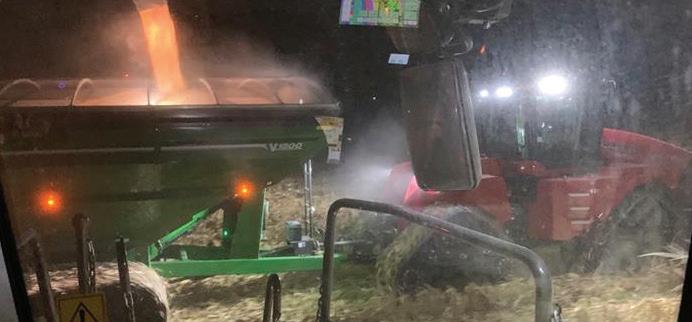
Treatment Means with the same letter are not significantly different according to Fisher’s Protected Least Significant Differences (LSD) test at alpha = 0.1.

9.2
4.1%
For inquiries about this project, contact Elizabeth Hawkins (hawkins.301@osu.edu) or Ken Ford (ford.70@osu.edu) or Andrew Klopfenstein (klopfenstein.34@osu.edu).
Determine if starter fertilizer rates can be reduced by applying only in furrow near the seed compared to continuous band application.
Planting Date 6/14/2021
Harvest Date 11/5/2021
VarietyBeck's 4905VR
Population 34,000 sds/ac
Acres 70
Treatments6
Reps3
Treatment Width40 ft.
TillageConventional Management Fertilizer, Herbicide
Previous Crop Soybeans
Row Spacing30 in.
Soil Type Crosby-Lewisburg Silt Loam, 24%
Sloan Silty Clay Loam, 19%
Westland Silty Clay Loam, 14%
The trial was designed to compare two fertilizer rates and three fertilizer placements. 3 and 5 gallons of 6-24-6 was applied in furrow during the planter pass. The 6-24-6 starter was applied in a continuous stream, a 2-inch DASH, and a 3-inch DASH centered on the seed. The treatments were replicated three times in a randomized complete block design.
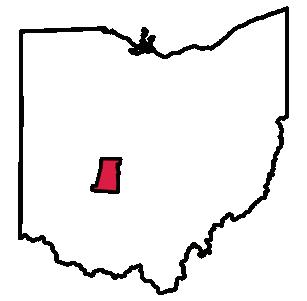


Planting date was later than normal which may have limited the benefit of the starter fertilizer.
No visual differences were observed between the treatments at any point in the season. This plot was planted in mid-June and warm soil temperatures may have limited the benefit of starter fertilizer. The delay in planting may have also limited yields at this location.

• Statistically significant yield differences were observed with the 3 gal continuous stream being the highest yielding treatment. Other treatments were not statistically different.
• Lack of yield response may be due to warm soil temperatures at planting.
• At the higher application rate, the Dash system allowed for a reduction in starter fertilizer rate without reducing yield in this field in 2021.
Treatment Means with the same letter are not significantly different according to Fisher’s Protected Least Significant Differences (LSD) test at alpha = 0.1.

6.0
2.5%
For inquiries about this project, contact Elizabeth Hawkins (hawkins.301@osu.edu) or Andrew Klopfenstein (klopfenstein.34@osu.edu).
Determine if the application of Capture insecticide in a T-band with the planter would increase yields in a sandy, high productivity field with little historic insect pressure.
Planting Date 4/27/2021
Harvest Date 10/20/2021
VarietyPioneer 0720AM
Population 32,234 sds/ac
Acres4
Treatments1
Reps3
Treatment Width60 ft.
Tillage No-Till
Management Fertilizer, Fungicide, Herbicide, Insecticide
Previous Crop Soybeans
Row Spacing30 in.
Soil Type Kibbie Fine Sandy Loam, 89% Glenford Silt Loam, 7%
This trial was conducted with a complete randomized block design. It was replicated in three plots. The treatments included Capture insecticide, which was applied at planting in a T-band with the planter, and no insecticide application that served as the control for yield comparison at harvest.


OSU Extension Sandusky County
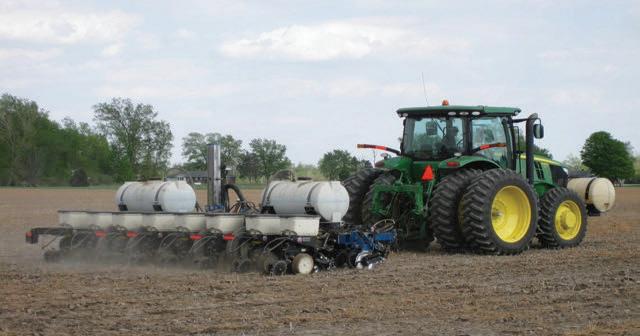
Applying Capture insecticide while planting the corn crop.
Stand counts at V6 indicated very uniform stands across all treatments, with just a 100 plants per acre difference between the average of the treated (higher) vs untreated plots. Moisture at harvest was consistent across all plots with no more than a 0.5% range of variance.

• With a 7 bushels yield advantage over the untreated plots, the harvest data would indicate a slight, yet not statistically significant advantage for the plots treated with Capture insecticide.
• An in-depth economic analysis would be needed to indicate whether the cost of the product and application costs would be a warranted expense based on the slight yield bump.
• Overall there were no other noticeable differences in the plots regarding plant health, grain quality, or moisture content.
Treatment Means with the same letter are not significantly different according to Fisher’s Protected Least Significant Differences (LSD) test at alpha = 0.1.
Capture® LFR® insecticide is a liquid, in-furrow insecticide that offers protection against insect pests from day one. It delivers the first line of defense against soil pests in corn, soybeans and certain vegetables, controlling insects before they get a chance to feed on seeds and roots.

2.5%
For inquiries about this project, contact Allen Gahler (gahler.2@osu.edu).
Investigate the effect on corn yield of increasing corn row spacing to 60 inch and planting an interseeded cover crop compared to 30 inch corn without a cover crop.
Planting Date 5/16/2021
Harvest Date 10/17/2021
Variety Pioneer 0806
Population 30,000 sds/ac
Acres2
Treatments2
Reps4
Treatment Width30 ft.
TillageMinimum
Management Fertilizer, Herbicide
Previous Crop Soybeans
Row SpacingTreatments
Soil Type Blount Silt Loam, 22%
Luray Silty Clay Loam, 26%
Pewamp Silty Clay Loam, 19%
This experiment was designed to look at a way to establish a cover in corn sooner so that it will thrive. Corn row spacing was increased to 60 inches to allow for better light penetration into the canopy. Round-up ready canola was seeded in the 60 inch corn. This was compared to the farmers traditional 30 inch row spacing.


OSU Extension
Crawford County
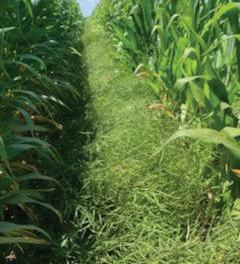
OBSERVATIONS
Round-up ready canola grew very well in between the 60 inch corn rows and allowed for easy weed control. Planting of the 60 inch was a challenge with the planter planting more plants than expected causing plants to be very spindly but all plants produced an ear.
• Conventional 30 inch non interseeded corn significantly out yielded the 60 inch interseeded corn.
• The canola grew and was a very well established cover crop in the 60 inch corn.
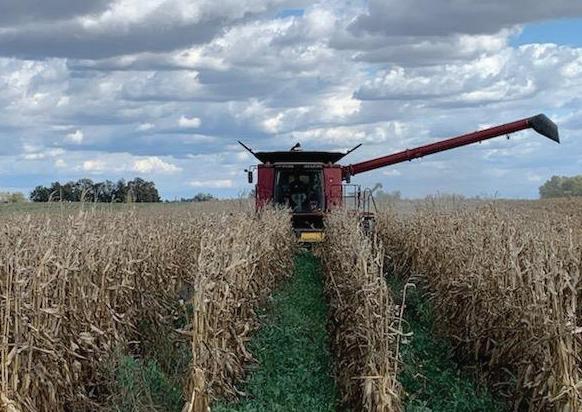

Treatment Means with the same letter are not significantly different according to Fisher’s Protected Least Significant Differences (LSD) test at alpha = 0.1.
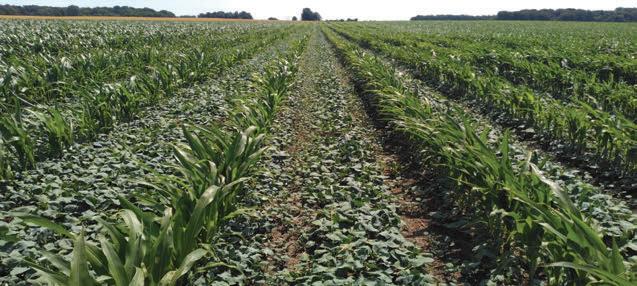
For inquiries about this project, contact Jason Hartschuh (hartschuh.11@osu.edu).
Determine if interseeding cereal rye at the time of planting is a viable avenue for establishing a cover crop in corn.
Planting Date 4/27/2021
Harvest Date 10/20/2021
VarietyPioneer 0720AM
Population 30,468 sds/ac
Acres1
Treatments1
Reps3
Treatment Width20 ft.
Tillage No-Till
Management Fertilizer, Herbicide
Previous Crop Soybeans
Row Spacing30 in.
Soil Type Kibbie Fine Sandy Loam, 89% Glenford Silt Loam, 7%
Three replicated plots were randomized, with the control being no rye interseeded. Yield was recorded at harvest. Effects of the interseeded treatment areas were recorded.


OSU Extension Sandusky County
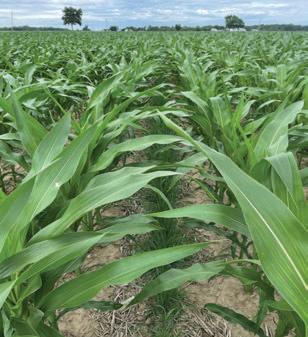
Establishment and early growth of the cereal rye was excellent and encouraging. However, in late summer the cereal rye got very ‘leggy’ and by August 17, 99% was dead. Plenty of rainfall was experienced. Lack of light likely resulted in the cover dying.

• The cover crop was successfully established, but did not obtain significant enough growth to provide fully desirable cover, and whether it was contributed to competition, lack of light, excessive rainfall, or a combination of these, the cover crop did not survive.

• Further, the yield data showed no significant difference between the interseeded area and the control, with the control actually yielding slightly higher.
• Further study may be warranted but there is no conclusive benefit based on this initial study.
Treatment Means with the same letter are not significantly different according to Fisher’s Protected Least Significant Differences (LSD) test at alpha = 0.1.
Kinze 3500 split row planter. The front units were used to plant cereal rye with wheat discs at approximately 20 lb/ac directly in between the corn rows. The sidedress application was offset 3 inches as to not run down the cereal rye.
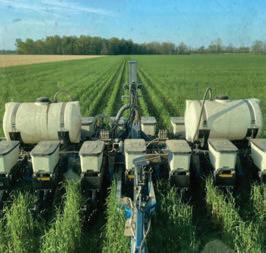
1.9%
For inquiries about this project, contact Allen Gahler (gahler.2@osu.edu).
Understand how soil moisture information can be used for scheduling pivot irrigation.
Planting Date 5/10/2021
Harvest Date 10/9/2021
VarietyChannel 216-36STXRIB
Population 34,000 sds/ac
Acres 500
Treatments1
Reps3
Treatment Width40 ft.
TillageMinimum
Management Fertilizer, Fungicide, Herbicide, Insecticide
Previous CropCorn
Row Spacing30 in.
Soil Type Huntington Silt Loam, 87% Stonelick Loam, 13%
This study was conducted in a field with a center pivot and corn grown in 2021. A soil moisture probe connected wirelessly to the internet was installed just after planting. The probe included a total of two sensosr located at 8 and 18 inches deep in the ground measuring soil moisture, temperature and salinity at each location. Daily data and graphs could be viewed using a mobile application that was used to monitor soil moisture within the soil profile plus schedule irrigation events. Yield monitor data was used to estimate final corn yield around each probe and compare irrigated and non-irrigated yields.
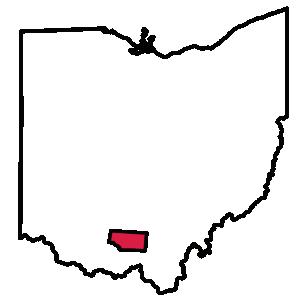

OSU Extension
Pike County
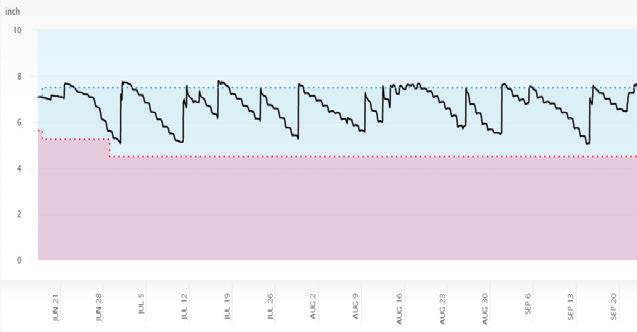
Moisture levels throughout the trial.
The virtual optimizer program through CropX provided real-time feed back on soil moisture. This allowed the producer to determine when to run the irrigation system. The graph will show upward spikes when the irrigation was turned on and downward steps as moisture is removed from the soil. The green area represents the optimal moisture range and the red is the critical moisture level indicating that water is needed.
• The 2021 growing season saw many favorable rains throughout the year. However, timeliness and volume were crucial to raising increased yields over yearly averages.
• By utilizing the soil moisture data the grower could make an informed decision to add more water at critical growth stages when the plant was needing it most.
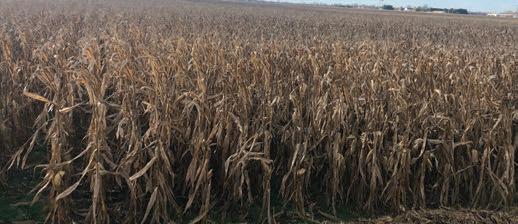
Since plots were not replicated, statistical analysis could not be conducted for this demonstration.
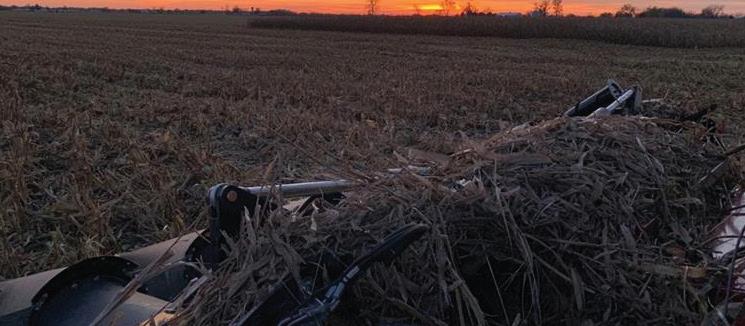
For inquiries about this project, contact Will Hamman (william.hamman@basf.com).
Understand how soil moisture information can be used for scheduling pivot irrigation.
Planting Date 5/20/2021
Harvest Date 10/21/2021
VarietyAgrigold 645-16, Pioneer 1359
Population 33,000 sds/ac
Acres 250
Treatments1
Reps3
Treatment Width40 ft.
TillageMinimum
Management Fertilizer, Fungicide, Herbicide, Insecticide
Previous Crop Soybeans
Row Spacing30 in.
Soil Type Genesee Silt Loam, 64% Stonelick Loam, 33%
This study was conducted in a field with a center pivot and corn grown in 2021. A soil moisture probe connected wirelessly to the internet was installed just after planting. The probe included a total of two sensors located at 8 and 18 inches deep in the ground measuring soil moisture, temperature and salinity at each location. Daily data and graphs could be viewed using a mobile application that was used to monitor soil moisture within the soil profile plus schedule irrigation events. Yield monitor data was used to estimate final corn yield around each probe and compare irrigated and non-irrigated yields.


OSU Extension
Pike County

Moisture levels throughout the trial.
The virtual optimizer program through CropX provided real-time feed back on soil moisture. This allowed the producer to determine when to run the irrigation system. The graph will show upward spikes when the irrigation was turned on and downward steps as moisture is removed from the soil. The green area represents the optimal moisture range and the red is the critical moisture level indicating that water is needed.
• The 2021 growing season saw many favorable rains throughout the year. However, timeliness and volume were crucial to raising increased yields over yearly averages.
• By utilizing the soil moisture data the grower could make an informed decision to add more water at critical growth stages when the plant was needing it most.

Since plots were not replicated, statistical analysis could not be conducted for this demonstration.

For inquiries about this project, contact Will Hamman (william.hamman@basf.com).
Determine the effect of nitrogen stabilizer on preplant swine manure applications ability to provide enough nitrogen to produce a corn crop with two different injection tool bar styles.
Planting Date 5/19/2021
Harvest Date 10/9/2021, 10/19/2021
VarietyBrevant 05M87AM, Croplan 4444VT2P
Population 32,000 sds/ac
Acres40
Treatments4
Reps4
Treatment Width60 ft.
TillageMinimum
Management Fertilizer, Herbicide
Previous Crop Soybeans
Row Spacing30 in.
Soil Type Bennington Silt Loam, 47%
Cardington Silt Loam, 19%
Condit-Bennington Silt Loam, 15%
Liquid swine manure has the ability to provide all the nitrogen a high yielding corn needs when spring applied if the nitrogen is not lost. This study looked at two different manure injectors. One covered the manure well, which was a sweep injector with cover spikes. The other one left 50% of the manure uncovered, this injector just used cover discs. With both applicators we compared the use of Instinct II versus just manure. All plots received starter fertilizer at planting and 350 pounds of nitrogen from the swine manure applied preplant. The pre-plant manure applicator rate was based on the rate of phosphorous needed for the corn and following soybean crop. Plots were organized as a randomized complete block split plot design to best compare the applicators and the Instinct II.


OSU Extension
Crawford County
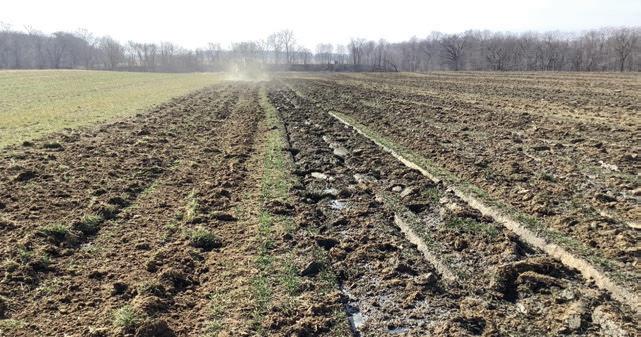
Manure application with 100% cover on the left and 50% cover on the right.
There was never a visual difference in the corn between plots. Besides how well the manure was covered we also observed an odor difference during application the manure that was not covered as well had a stronger oder after application. At V6 we took PSNT tests which ranged form 30-87 ppm across all plots signaling that there should be enough nitrogen present to grow a high yielding corn crop. At tassel there was also no difference in NDVI readings between the plots.
• Instinct II can be a valuable tool to decrease nitrogen losses but the first step is covering the manure completely.
• The Instinct II did significantly increase yield when the injectors only covered half of the manure but when the manure was well covered it didn’t effect yield.
• Nitrogen was applied at a high enough level though that some nitrogen could of been lost and not impacted yield.
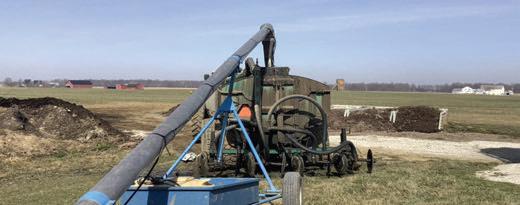
Cover disc injector with instinct
Cover disc injector only
Sweep injector with cover spikes with instinct
Sweep injector with cover spikes
Treatment Means with the same letter are not significantly different according to Fisher’s Protected Least Significant Differences (LSD) test at alpha = 0.1.
Instinct II nitrogen stabilizer to delay nitrification of ammonia nitrogen in the soil.

213 a
206 b
215 a
217 a
LSD: 8.3
CV: 3.0%
For inquiries about this project, contact Jason Hartschuh (hartschuh.11@osu.edu).
Assess the agronomic efficacy of using swine manure as a sidedress application compared to commercial fertilizer application.
Planting Date 5/21/2021
Harvest Date 10/22/2021
VarietyCroplan 5073 VT2P, Seed Consultants 1087
Population 32,000 sds/ac
Acres40
Treatments2
Reps3
Treatment Width30 ft.
Tillage No-Till
Management Fertilizer, Fungicide, Herbicide
Previous Crop Soybeans
Row Spacing30 in.
Soil Type Blount Silt Loam, 40% Pewamo Silty Clay Loam, 39% Glynwood Silt Loam, 21%
The experimental design of this study is a randomized complete block design. There were three replications of each manure and 28% UAN treatment. Treatments were applied at V3. 28% UAN treatments were 200 total pounds of nitrogen and the manure was applied at 6,000 gallons an acre. The combine yield monitor was calibrated in season.
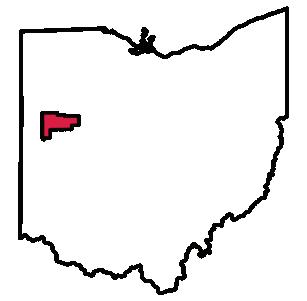

OSU Extension
Auglaize County
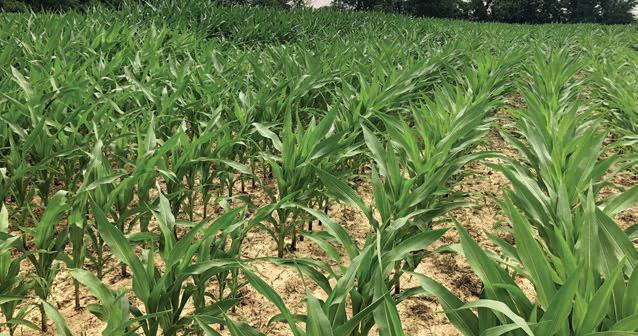
Average emergence did not significantly vary between treatments.
This field had adequate rainfall and low disease pressure throughout the season
• No significant treatment differences were observed.
• Yield was statistically similar, therefore an economic and environmental advantage is with a manure application.
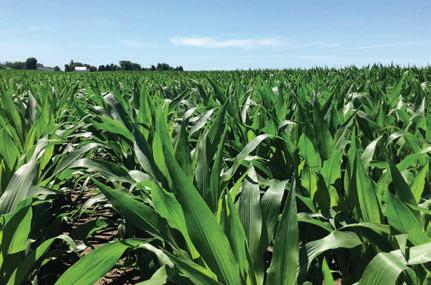
Treatment Means with the same letter are not significantly different according to Fisher’s Protected Least Significant Differences (LSD) test at alpha = 0.1.

For inquiries about this project, contact Jamie Hampton (hampton.27@osu.edu).
Observe the efficacy of side dress applied liquid hog and steer manure in comparison to commercial nitrogen applications.
Planting Date 5/15/2021
Harvest Date 10/11/2021
VarietyEnogen 109Y2-5122
Population 34,000 sds/ac
Acres80
Treatments2
Reps3
Treatment Width30 ft.
Tillage No-Till
Management Fertilizer, Fungicide, Herbicide, Insecticide
Previous Crop Soybeans
Row Spacing30 in.
Soil Type Miamian Silt Loam, 61%
Brookston Silty Clay Loam, 38% Crosby Silt Loam, 1%
The experimental design of this study is a randomized complete block design. There were three replications of each manure and anhydrous treatment. Treatments were applied at V3. Anhydrous treatments were 150 total pounds of nitrogen and the manure was applied at 6,000 gallons an acre. The combine yield monitor was calibrated in season.


OSU Extension Darke County

Two weeks post application.
The manure was side dressed at V3. The manure was a blend of swine finishing and beef manure from a mono slope pit barn. The drag hose did not effect overall stand. Though parts of the county had issues with too much rain, precipitation in this area optimized yield.
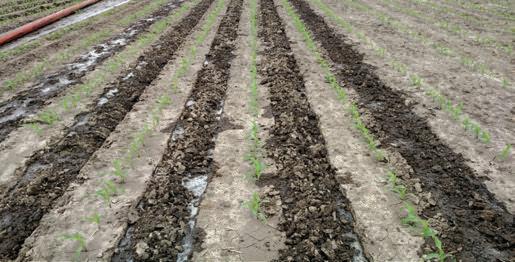
• The treatments were statistically different.
• The manure treatment had an increase in yield by 16 bu/acre compared to the anhydrous.
• Manure was applied in a growing crop which reduces runoff and maximizes nutrient use.
• Grain moisture is not significantly different between treatments.
Treatment Means with the same letter are not significantly different according to Fisher’s Protected Least Significant Differences (LSD) test at alpha = 0.1.
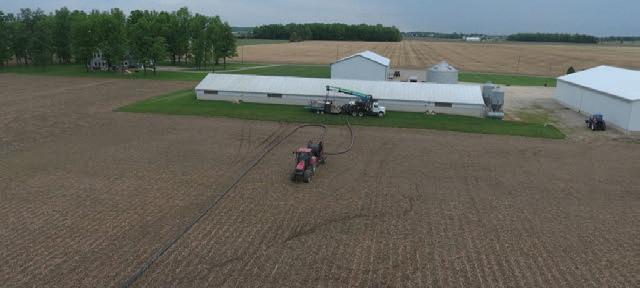
3.3%
For inquiries about this project, contact Taylor Dill (dill.138@osu.edu).
Assess the agronomic efficacy of using swine manure as a sidedress application compared to commercial fertilizer application.
Planting Date 5/2/2021
Harvest Date 10/14/2021
VarietyPioneer 0307AM and 0075AM
Population 35,000 sds/ac
Acres60
Treatments2
Reps6
Treatment Width30 ft.
Tillage No-Till
Management Fertilizer, Fungicide, Herbicide
Previous Crop Soybeans
Row Spacing30 in.
Soil Type Pewmo Silty Clay Loam, 70%
Blount Silt Loam, 27%
Patton Silty Clay Loam, 3%
The experimental design of this study is a randomized complete block design. There were six replications of each manure and 28% UAN treatment. Treatments were applied at V3. 28% UAN treatments were 200 total pounds of nitrogen and the manure was applied at 6,000 gallons an acre. The combine yield monitor was calibrated in season.


OSU Extension
Darke County

Aerial image of the manure application.
This study was planted into a rye cover crop and had delayed emergence because of early season heavy rains and cold temperatures. There was low disease pressure in this field.
• No significant treatment differences were observed, with a p-value of 0.25.
• Yield was statistically similar, therefore an economic and environmental advantage is with a manure application.
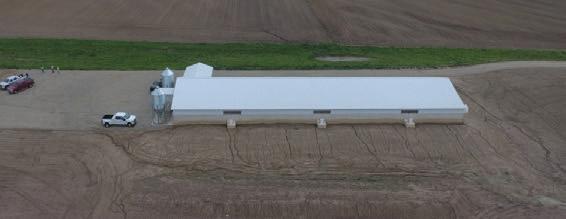
Treatment Means with the same letter are not significantly different according to Fisher’s Protected Least Significant Differences (LSD) test at alpha = 0.1.
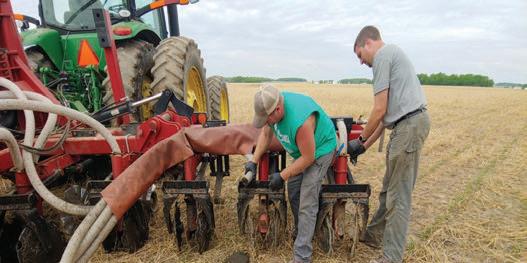
For inquiries about this project, contact Taylor Dill (dill.138@osu.edu).
Determine the effect of sidedressing corn with liquid swine manure, applied with a tanker, as an economic and environmental alternative to commercial fertilizer .
Planting Date 5/16/2021
Harvest Date 10/24/2021
VarietyBeck's 5829
Population 32,500 sds/ac
Acres4
Treatments3
Reps3
Treatment Width 15 ft.
TillageConventional
Management Fertilizer, Herbicide
Previous CropWheat
Row Spacing30 in.
Soil Type Glynwood Loam, 41% Blout Loam, 38% Pewamo Clay Loam, 22%
This study was randomized complete block design. The three treatments included 5,000 gal/acre swine manure, 50 gal/acre 28% UAN and a no sidedress check to compare with compost and commercial fertilizer. All treatments received 20 lbs/ac of nitrogen at planting and the treatments were applied at V5 sidedress. All other field operations were consistent across all treatments.
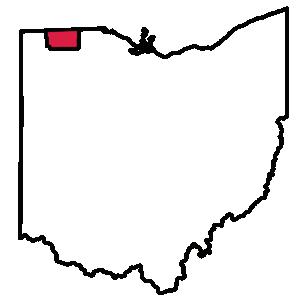

OSU Extension Fulton County
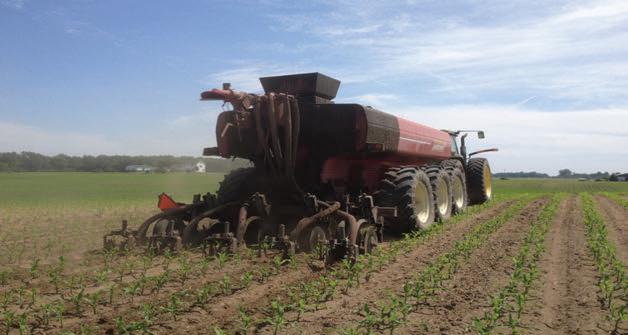
In some situations, tankers are still used to apply liquid manure instead of drag hose.
This field had a history of periodic manure application. Soil analyses showed a soil test phosphorus (STP) and soil test potassium (STK) in appropriate maintenance ranges. All treatments were made on June 11 with subsurface injection equipment. This field received excess moisture throughout the growing season. The check treatment showed signs of nitrogen deficiency by the end of the season.
• There was no significant yield difference between the liquid swine manure and 28% UAN treatment. However, there was a significant difference in yield between the check and the two treatments with nutrients.
• Multi-year, multi-site manure sidedress research has shown that liquid swine manure is an economic and environmental alternative to commercial nitrogen when applied at sidedress.
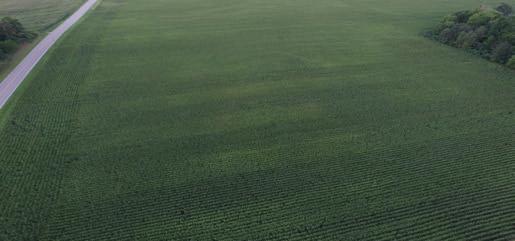
Treatment Means with the same letter are not significantly different according to Fisher’s Protected Least Significant Differences (LSD) test at alpha = 0.1.
The VTI rolling coulter with 3 inch manure boot allows for subsurface injection of manure and efficient application speed.
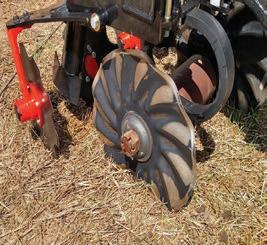
For inquiries about this project, contact Eric Richer (richer.5@osu.edu), Jordan Beck (beck.320@osu.edu), or Glen Arnold (arnold.2@osu.edu).
Evaluate the yield impact when compost or manure are used as the nutrient source in corn.
Planting Date 4/27/2021
Harvest Date 11/3/2021
Variety Seed Consultants 1112AM
Population 34,000 sds/ac
Acres3
Treatments2
Reps3
Treatment Width30 ft.
TillageConventional
Management Fertilizer, Herbicide
Previous Crop Soybeans
Row Spacing30 in.
Soil Type Mermill Loam, 81% Nappanee Loam, 9% Haskins Loam, 7%
This study was designed in a randomized complete block design. The two treatments were approximately 5 tons/ac of composted cattle manure and 10 tons/ac pen pack cattle manure (direct from the barn). Composted manure was turned in a windrow weekly for 7 weeks prior to field application. Nutrient analyses indicated that the compost was twice the nutrient density of manure for key nutrients P, K, S, and Ca. All organic nutrients were applied in April prior to corn planting and lightly incorporated the next day. All field operations, starter application rates and sidedress nitrogen were consistent across all treatments.


OSU Extension
Fulton County
Growing Season Weather Summary

Manure (lighter) and compost (darker) treatments prior to incorporation.
Compost and manure were applied to this field on April 17, 2021 prior to planting. Organic nutrients were incorporated immediately to conserve plant available nitrogen. This field experienced excellent growing conditions all season long. No plant health differences were observed between the treatments.
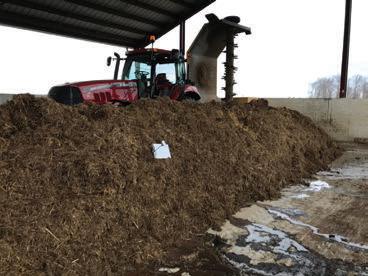
• There was no statistical difference in yield between the treatments.
• The compost treatment resulted in a slightly higher grain moisture percentage at harvest.
• While there was no statistical yield difference, the numerical yield advantage in favor of the manure treatment is likely from the more plant available nitrogen at planting.
• Additional replications of this study, especially in variable weather conditions, are needed to confirm the results of this study.
Treatment Means with the same letter are not significantly different according to Fisher’s Protected Least Significant Differences (LSD) test at alpha = 0.1.
Aerial Photography with DJI Mavic 2 Pro with Hasselblad camera - this imagery helps confirm layout and application consistency for this manure trial.
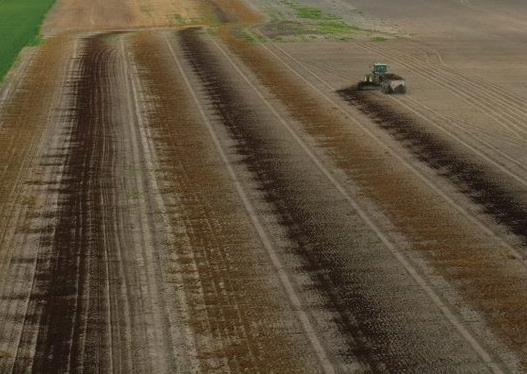
For inquiries about this project, contact Eric Richer (richer.5@osu.edu) or Jordan Beck (beck.320@osu.edu).
Evaluate the yield impact when compost or manure are used as the nutrient source in corn.
Planting Date 5/1/2021
Harvest Date 9/9/2021
VarietyBeck's 5929
Population 33,250 sds/ac
Acres20
Treatments2
Reps3
Treatment Width40 ft.
TillageMinimum
Management Fertilizer, Herbicide, Insecticide
Previous CropCorn
Row Spacing30 in.
Soil Type Colonie Fine Sand, 48%
Tedrow Loamy Fine Sand, 17%
Granby Loamy Fine Sand, 14%
This study was designed in a randomized complete block design. The two treatments were approximately 5 tons/ac of composted cattle manure and 10 tons/ac pen pack cattle manure (direct from the barn). Composted manure was turned in a windrow weekly for 7 weeks prior to field application. Nutrient analyses indicated that the compost was twice the nutrient density of manure for key nutrients P, K, S, and Ca. All organic nutrients were applied in April prior to corn planting and lightly incorporated the next day. All field operations, starter application rates and sidedress nitrogen were consistent across all treatments.


Compost being applied at 5 ton per acre.
This trial site did not have a history of manure application. Soil analyses showed soil test phosphorus (STP) in the maintenance range, soil test potassium (STK) below the maintenance range, organic matter of 1.7% and 5.0 CEC. There were no visual differences between the manure and compost treatments. This farm received adequate rainfall during pollination. Generally, weather conditions were excellent for growing corn at this location. Visual observation of the corn silage from both treatments indicated ‘excellent’ quality.
• There was no statistical difference in yield between the treatments.
• While there was no statistical yield difference, the numerical yield advantage in favor of the manure treatment is likely from the more plant available nitrogen at planting.
• Additional replications of this study are needed to confirm the results of this study.

Treatment Means with the same letter are not significantly different according to Fisher’s Protected Least Significant Differences (LSD) test at alpha = 0.1.
This HCL Machine Works CT-12 pull-type compost turner can accommodate a 6 foot x 12 foot windrow. The compost turner serves to mix and add oxygen to the compost windrow. Case IH Magnum 190 with continuously variable transmission (CVT) is invaluable for composting at ultra slow speeds.
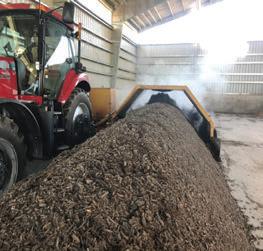
For inquiries about this project, contact Eric Richer (richer.5@osu.edu) or Jordan Beck (beck.320@osu.edu).
Evaluate the yield impact when compost or manure are used as the nutrient source in corn.
Planting Date 5/19/2021
Harvest Date 10/22/2021
Variety Pioneer 0843AM
Population 34,000 sds/ac
Acres10
Treatments3
Reps3
Treatment Width 15 ft.
TillageConventional
Management Fertilizer, Insecticide
Previous CropWheat
Row Spacing30 in.
Soil Type Del Rey Silt Loam, 41%
Lenawee Silty Clay Loam, 28%
Kibbie Loam, 13%
This study was designed in a randomized complete block design. The three treatments were 3 tons/ac of composted cattle manure, 6 ton/ac pen pack cattle manure (direct from the barn) and check strip without organic nutrients. Composted manure was turned in a windrow weekly for 6 weeks prior to field application. Nutrient analyses indicated that the compost was twice the nutrient density of manure for key nutrients P, K, S, and Ca. All organic nutrients were applied in the fall of 2020 and lightly incorporated the next day. All field operations, starter application rates and sidedress nitrogen were consistent across all treatments.


OSU Extension
Fulton County

Compost strips to the left (darker) and manure strips on the right.
Stand counts were taken approximately one month after planting and there were no significant differences in emergence. This field had no history of manure since 2003. This farm’s soil has excellent water and nutrientholding capacity as it had 4.4% organic matter. Growing conditions for corn were excellent at this field site in 2021.
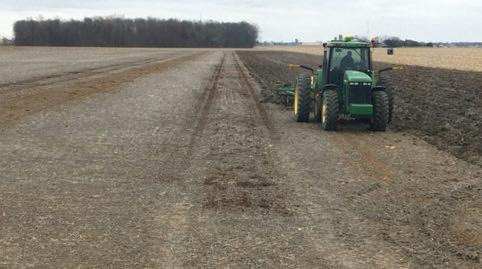
• There was no statistical difference in yield or moisture among all three treatments.
• Additional replications of this study and yearover-year data, especially in variable weather conditions, are needed to confirm the results of this study.
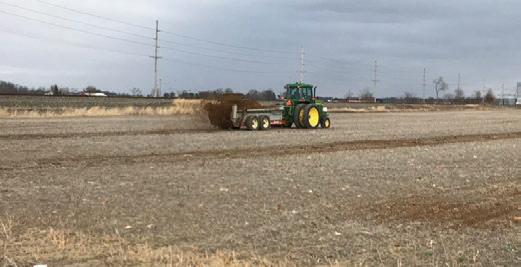
Treatment Means with the same letter are not significantly different according to Fisher’s Protected Least Significant Differences (LSD) test at alpha = 0.1.
This New Idea box spreader and John Deere skid loader are valuable tools for applying organic nutrients in a efficient and effective manner.
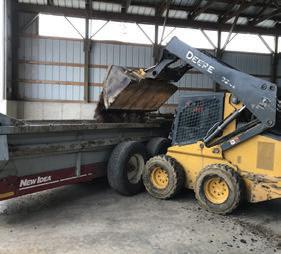
For inquiries about this project, contact Eric Richer (richer.5@osu.edu) or Jordan Beck (beck.320@osu.edu).
Evaluate the use of manure, compost or commercial fertilizer to meet the TriState fertility needs of corn.
Planting Date 5/19/2021
Harvest Date 11/4/2021
VarietyPioneer 0963, Pioneer 0720Q, Rupp D09-42
Population 30,000 sds/ac
Acres16
Treatments3
Reps3
Treatment Width40 ft.
TillageMinimum
Management Fertilizer, Herbicide
Previous CropCorn
Row Spacing30 in.
Soil Type Tedrow Loamy Fine Sand, 24% Ottokee Fine Sand, 23%
Gilford Fine Sandy Loam, 17%
This study was randomized complete block design. The three treatments included manure, compost and commercial fertilizer. All treatments were applied at actual rates designed to meet the target 2-year crop removal rate of approximately 120 lbs K20, 55 lbs P2O5 and 12 lbs sulfate. All treatments received 40 lbs/ac of nitrogen at planting and 155 lbs/ac of nitrogen at sidedress. All other field operations were consistent across all treatments.


OSU Extension
Fulton County

Finished compost after 8 weekly turns.
This field had no history of manure application. Soil analyses showed a soil test phosphorus (STP) in the maintenance range, soil test potassium (STK) below maintenance range, organic matter 1.7% and 4.4 CEC. All fertility treatments were applied on April 16 and incorporated the same day. Planting conditions were optimal. Planter setup led to a lower than preferred planting rate; emergence was consistent across all treatments. Replication number three showed signs of some water damage but damage was consistent across all treatments. This site received excess moisture in July and September. In general, there appeared to be no visual plant health differences among treatments.
• The results of this study showed that there was a statistically significant yield increase when using manure over the Tri-State (commercial) fertilizer rate.
• There was no significant yield difference between the manure and compost treatments; similarly, there was no significant yield difference between the compost and fertilizer treatments.
• Some of the yield increase in the manured treatment is believed to be associated with the additional nitrogen available from the spring applied manure.
• If possible, data from the soybean rotation in 2022 will be collected on this trial.
Treatment Means with the same letter are not significantly different according to Fisher’s Protected Least Significant Differences (LSD) test at alpha = 0.1.
Kuhn Knight ProTwin Slinger
The manure spreader was used in compost studies. The spreader allows for consistent, even spreading while improving material breakup.

For inquiries about this project, contact Eric Richer (richer.5@osu.edu).
Observe the effects of various commercial products and sulfur on corn yields.
Planting Date 5/17/2021
Harvest Date 11/10/2021
VarietyPioneer 0720AM
Population 34,000 sds/ac
Acres1
Treatments4
Reps4
Treatment Width 5 ft.
Tillage No-Till
Management Fertilizer, Fungicide
Previous CropWheat
Row Spacing30 in.
Soil Type Hoytville Silty Clay Loam, 99%
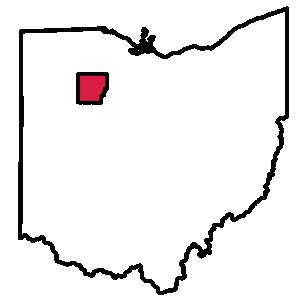

OSU Extension
Hancock County
The study consisted of four treatments: treatment with no additive, a treatment with 20 pound per acre of sulfur, treatment with Instinct II (a nitrification inhibitor) and a treatment with Radiant (a growth regulator). Each treatment received 30 pounds per acre of nitrogen from urea-ammonium nitrate (UAN) aplied one day after planting. Sulfur was added to the 30 pounds nitrogen at planting. Instinct II and Radiant were added to the sidedress nitrogen. All nitrogen application were soil injected between the rows. Plots consisted of four rows. The center 2 rows were harvested for grain yield. Experimental design was a completely randomized block replicated four times.

Variance between ear development.
The plots were not stressed delayed until the end of the growing season. Harvest was delayed approximately three weeks because of wet field conditions; however, very little stalk lodging had occurred during the delay. Instinct II is a nitrification inhibitor. Yields were similar among all treatments. Yields for the nitrogen curve were 0 rate: 120 bu/acre, 180 rate: 247 bu/acre, and the 240 rate: 255 bu/acre.
• At this site, yields were not affected by adding Instinct II, Radiate, and sulfur. However, growing conditions were excellent through the season and plants were not under any moderate to severe stress.
• Nitrogen loss was not a factor, one would not expect a benefit from a nitrification inhibitor produce such as Instinct II.
• If Radiate enhanced growth and root development, it did not express itself with larger yields. However, since yields did not respond to nitrogen rates above 180 lb/acre, the 180 comparative rate may have been too high to detect differences among treatments. Differences may have been observable at a nitrogen rate somewhere below 180 lb/acre.
Treatment Means with the same letter are not significantly different according to Fisher’s Protected Least Significant Differences (LSD) test at alpha = 0.1.

22.1
7.1%
For inquiries about this project, contact Ed Lentz (lentz.38@osu.edu).
Determine the effect of cover crop residue on nitrogen need in corn.
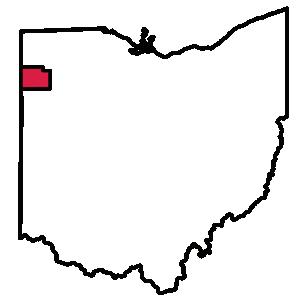
Planting Date 5/20/2021
Harvest Date 11/8/2021
Variety See study design
Population 32,000 sds/ac
Acres10
Treatments3
Reps4
Treatment Width30 ft.
Tillage No-Till
Management Fertilizer, Herbicide
Previous CropWheat
Row Spacing30 in.
Soil Type Latty Silty Clay, 84%
Mermill Loam, 7%
Saranac Silty Clay Loam, 6%
In this study, we wanted to evaluate the levels of nitrogen the crop could pull out of the decaying cover crop residue. This study was a randomized complete block design. The three treatments were applied in rows of twelve, across four varieties of corn, replicated four times. The treatments all received the same amount of 28% UAN at planting, but the sidedress rates of nitrogen were varied: 0 additional lb N/ac, 20 additional lb N/ac, and 40 additional lb N/ac. All other cropping practices were consistent across the field. Agrigold A63190, Beck’s 5140, Cappel 4313, and Beck’s 5077 were the four hybrids planted throughout the trial.

OSU Extension Paulding County
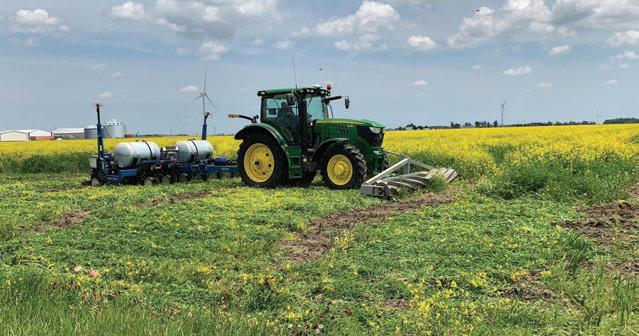
Trial machinery setup with roller crimper and planter equipped with fertilizer.
During the growing season, all treatments looked visually indistinguishable from one another. Wet weather during the beginning of the growing season may have affected nitrogen availability during early crop development.
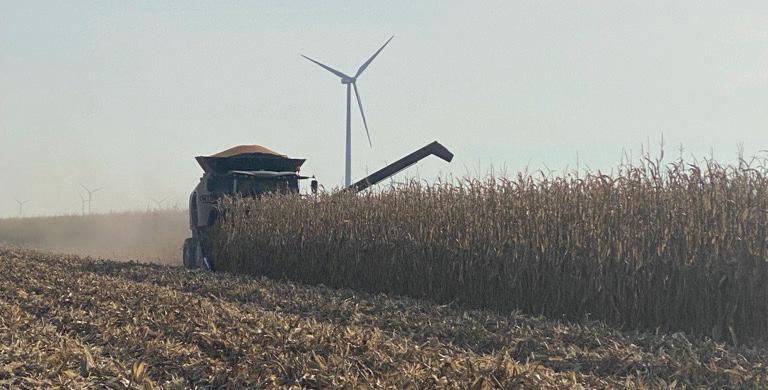
• The differences between the three treatments were statistically significantly different from each other.
• 20 additional pounds of nitrogen yielded 6 bu/ac more than 0 additional pounds of nitrogen, which was statistically significant.
• In addition, the 40 lb additional N treatment yielded 13.7 bu/ac higher than the 20 lb additional N treatment, which was also statistically significant.
Treatment Means with the same letter are not significantly different according to Fisher’s Protected Least Significant Differences (LSD) test at alpha = 0.1.
Cover Crop Biomass Analysis was used to determine the levels of different nutrients in the cover crop upon termination and planting of the corn crop. This gave a ballpark of what levels of nutrients we could expect to gain from the cover crop residue.
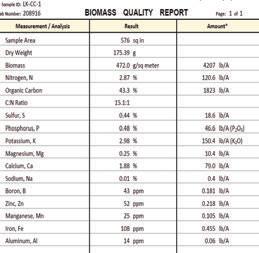
5.1
2.0%
For inquiries about this project, contact Rachel Cochran (cochran.474@osu.edu) or Sarah Noggle (noggle.17@osu.edu).
Determine the effect of nitrogen source on corn yield.

Planting Date 5/16/2021
Harvest Date 11/20/2021
Variety Pioneer 0843AM
Population 33,500 sds/ac
Acres16
Treatments4
Reps4
Treatment Width30 ft.
Tillage No-Till
Management Fertilizer, Fungicide, Herbicide
Previous Crop Soybeans
Row Spacing30 in.
Soil Type Haskins Loam, 25%
Fulton Silty Clay Loam, 19%
Latty Silty Clay, 15%
This three-year study used a randomized complete block design with four replications each year. This study evaluated four nitrogen source systems after 85 lbs/acre of nitrogen was applied at planting. All nitrogen treatments were injected subsurface. Treatments included sidedress applications of 28% UAN (42 gal/ ac), 82% anhydrous ammonia (152 lbs/ac), 46% dry urea (272 lbs/ac), and 45% dry ESN (278 lbs/ac). All treatments were the equivalent of 125 units of nitrogen per acre. A calibrated yield monitor was used to collect yield data and moistures.

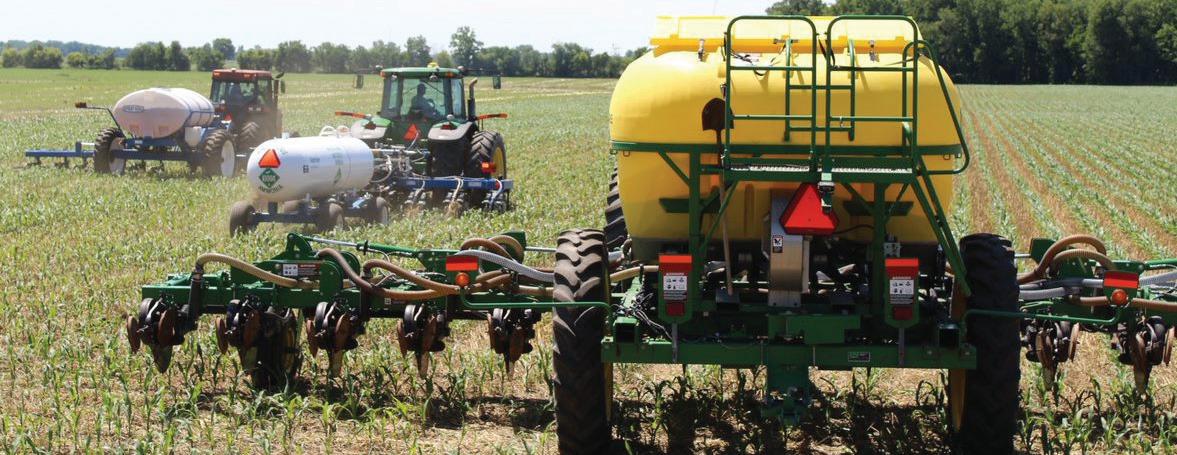
All nitrogen applications were made at a “Field Day on the Fly”.
On June 16, 2021, all sidedress nitrogen applications were made. Throughout the growing season, plant growth was monitored for any potential treatment differences. No treatment differences were observed. The crop had excess moisture in July and September. The 28% UAN treatments showed weaker stalks and more lodging at harvest. Observations from the threeyear study: the field site received excess rainfall soon after nitrogen application in 2017 and 2021. The field site was drier than normal in 2018.

Treatment Means with the same letter are not significantly different according to Fisher’s Protected Least Significant Differences (LSD) test at alpha = 0.1.
The Yetter 4000 Nutrient-Pro coulter with spiked closing wheel and depth band is an excellent choice for high-speed nutrient application in no-till situations.
• In 2021, there was no statistical difference in yield among all nitrogen sources.
• Across all three years of this study, there was only one instance of significantly lower yield for 28% UAN (2017) and based on field observations, that was due in part to equipment malfunction and excess rainfall.
• The 28% applicator was improved for the 2018 and 2021 studies leading to no significant difference in yield among all nitrogen sources. The source of nitrogen used by farmers continues to be a function of comfort/safety, price, availability and equipment.

For inquiries about this project, contact Eric Richer (richer.5@osu.edu).
Investigate the yield and plant health impacts provided by a nitrogen stabilizer in spring applied anhydrous ammonia.
Planting Date 5/22/2021
Harvest Date 11/8/2021
VarietyStine 9656-G/0
Population 34,000 sds/ac
Acres16
Treatments2
Reps4
Treatment Width30 ft.
TillageConventional
Management Fertilizer, Herbicide
Previous Crop Soybeans
Row Spacing30 in.
Soil Type Toledo Silty Clay, 35%
Hoytville Silty Clay Loam, 18% Haskins Loam, 14%
A randomized complete block design with four replications was used for this study. Plots were 30 feet wide and field length (2860 ft). The treatments included a target rate of 200lbs/ acre of anhydrous ammonia (82-0-0) as a control, and the same rate blended with a quart/acre of N-Serve.
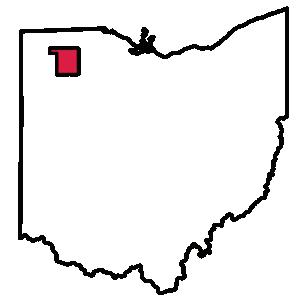

OSU Extension Henry County
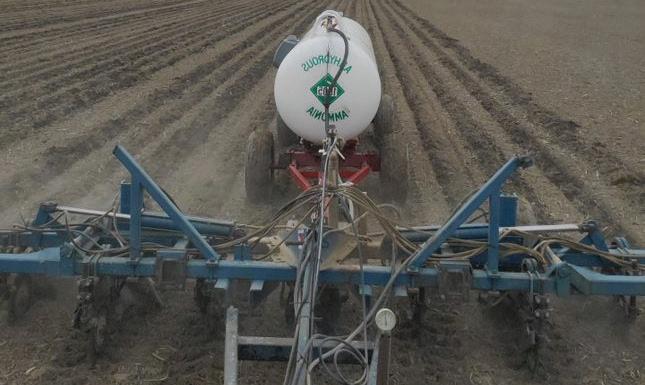
12-row anhydrous ammonia applicator.
This plot suffered from dry conditions during grain fill period and later season development of Tar Spot. Weed control was good. Yield and moistures were determined using a calibrated yield monitor.
• No statistical difference in yield was observed between control treatment and N-Serve treatment.
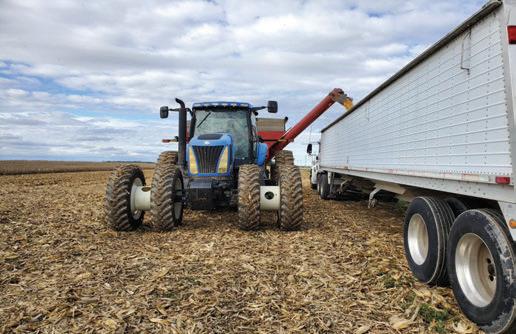
Treatment Means with the same letter are not significantly different according to Fisher’s Protected Least Significant Differences (LSD) test at alpha = 0.1.
N-Serve Nitrogen Stabilizer N-Serve slows the conversion of ammonium to nitrates, reducing leaching and denitrification.
For inquiries about this project, contact Clint Schroeder (schroeder.307@osu.edu).
Investigate the yield and plant health impacts provided by a nitrogen stabilizer in spring applied anhydrous ammonia.
Planting Date 5/21/2021
Harvest Date 11/5/2021
VarietyStine 9728E-G
Population 34,000 sds/ac
Acres 7
Treatments2
Reps4
Treatment Width30 ft.
TillageConventional
Management Fertilizer, Herbicide
Previous Crop Soybeans
Row Spacing30 in.
Soil Type Hoytville Silty Clay, 55% Nappanee Silty Clay Loam, 43%

OSU Extension
Putnam County
A randomized complete block design with four replications was used for this study. Plots were 30 feet wide and field length (1154 feet). The treatments included a target rate of 200lbs/ acre of anhydrous ammonia (82-0-0) as a control, and the same rate blended with a quart/acre of N-Serve.
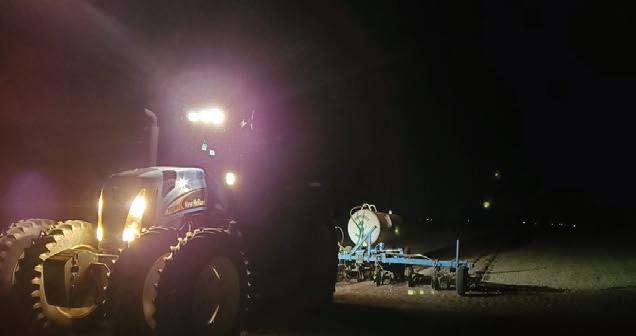
Tractor and applicator setup for trials.
This plot suffered from dry conditions during grain fill period. Weed control was good. Yield and moistures were determined using a calibrated yield monitor.
• No statistical difference in yield was observed between control treatment and N-Serve treatment.

Treatment Means with the same letter are not significantly different according to Fisher’s Protected Least Significant Differences (LSD) test at alpha = 0.1.
Ag Leader Edge allows monitoring of application rate and mapping from the tractor cab.
For inquiries about this project, contact Clint Schroeder (schroeder.307@osu.edu).
Observe the effects of different nitrogen combinations in a split nitrogen application program on yield.
Planting Date 5/17/2021
Harvest Date 11/10/2021
VarietyPioneer 0720AM
Population 34,000 sds/ac
Acres1
Treatments4
Reps4
Treatment Width 5 ft.
Tillage No-Till
Management Fertilizer, Herbicide
Previous CropWheat
Row Spacing30 in.
Soil Type Hoytville Silty Clay Loam, 99%


OSU Extension
Hancock County
Study consisted of four treatments applying 180 pound of nitrogen from urea-ammonium nitrate as single applications at different growth stages and split applications with different nitrogen rates. Specifically, 1) single application one day after planting, 2) single application at GS 4, 3) 30 pounds one day after planting followed by 150 pounds at GS 4, and 4) 150 pounds one day after planting followed by 30 pounds at GS 4. Treatments were applied to 10 feet wide and 75 feet long plots. Experimental design was a completely randomized block replicated four times.
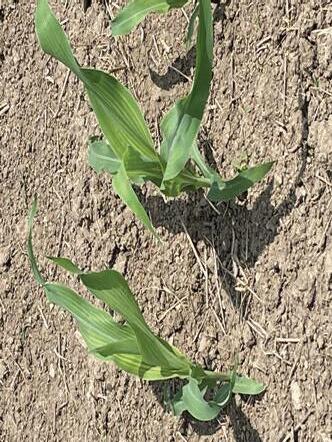
Corn plants from the nitrogen timing study.
Yields were similar among the treatments. The site was responsive to nitrogen. Yields for the nitrogen curve were 0 rate: 120, 180 rate: 247, and the 240 rate: 255. There was no statistical difference between the 180 and 240 rate.

• For 2021, different nitrogen application times and rates did not affect yields.
• Lack of nitrogen loss during the growing season may have been a factor that differences were not detected.
• Historically, split applications at this site have larger yields than a single application at planting.
• Differences among treatments may have been detected if a nitrogen rate less than 180 lbs was used since yields were similar between the 180 lbs and 240 lbs nitrogen rate on the nitrogen rate curve.
• The 180 lb rate provided more than adequate nitrogen for the growing season.
Treatment Means with the same letter are not significantly different according to Fisher’s Protected Least Significant Differences (LSD) test at alpha = 0.1.

For inquiries about this project, contact Ed Lentz (lentz.38@osu.edu).
Understand the impact of nitrogen timing on corn yield.

Planting Date 5/25/201
Harvest Date 11/24/2021
VarietyBrevant 13H87
Population Variable Rate
Acres23
Treatments6
Reps4
Treatment Width40 ft.
Tillage Strip-Till
Management Fertilizer, Fungicide, Herbicide, Insecticide
Previous Crop Soybeans
Row Spacing30 in.
Soil Type Crosby-Lewisberg Silt Loams, 63% Kokomo Silty Clay Loam, 37%
A randomized complete block design (RCBD) with 6 treatments and 4 replications was used in this corn N study. The Maximum Return to Nitrogen (MRTN) tool (http://cnrc.agron.iastate.edu/) was used to determine the economic optimum N rate for this field in 2021. The MRTN analysis was run prior to planting to compute the economic optimum N rate at 200 lb N/ac. The 200 lbs N/ac value was then used to establish the N rates for each treatments other than the 0 lbs N/ac. One treatment included applying all the N at planting with another applying all the N at sidedress. The other 3 treatment included splitting the N applied between planting and sidedress; 50-150, 100-100 and 150-50. Statistical analysis was conducted using SAS at a significance level of 0.10.

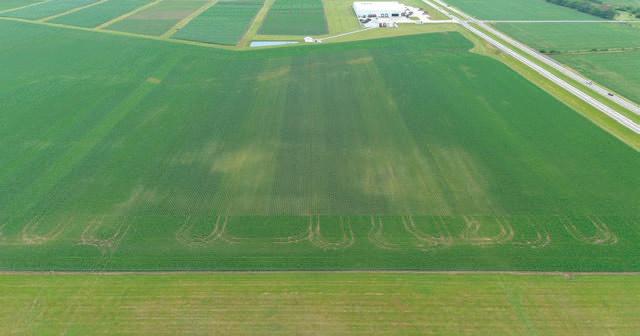
Mid-season Aerial view of strip trial.
Good and routine rain occurred in this field over the growing season. The corn emerged uniformly across the study site. By V3, the 0 lbs N/ac and the sidedress full-rate (0-200) treatments showed an off-green color indicating N deficiency. The slight off-green color persisted for the 0 lbs/ac through the R stages. For the sidress full-rate (0-200), the light green occurred from V3 to V8 before the corn plants started to green up. As in past years with N timing studies, differences in plant height and growth stage existed with the 0 lbs/ac and sidedress full-rate being at least a 1/2 growth stage behind the other treatments. Mid-season scouting that noted no plant stress (other than the 0 lbs N treatment) along with good soil moisture over the growing season provided insight into well above average yield for this field.
J&M’s 5000 Series NitroGro Nitrogen Applicators provide an option to apply N accurately during side-dress. Features of the toolbar includes a flexing main frame and hydraulic down force to maintain the target placement depth even as soil conditions vary. The VRT capabilities allows for simple N or liquid fertilizer studies to be conducted on-farm.
• A significant yield difference existed between the 0 lbs N/ac versus these treatments receiving 200 lbs N/ac.
• There was no significant yield difference between treatments receiving N in this study regardless of timing. All yields were around 251 bu/ac.
• There were no difference in grain moisture at harvest among any of the treatments.
• In summary, N application timing using 200 lbs N/ ac determined by the MRTN tool did not impact final corn yield in this field for the 2021 growing season.

For inquiries about this project, contact John Fulton (fulton.20@osu.edu).
Determine the effect of different starter packages on yield and potential P removal from soil.
Planting Date 4/19/2021
Harvest Date 11/1/2021
VarietyDeKalb 60-80
Population 33,000 sds/ac
Acres20
Treatments3
Reps4
Treatment Width40 ft.
Tillage Vertical
Management Fertilizer, Fungicide, Herbicide, Insecticide
Previous Crop Soybeans
Row Spacing30 in.
Soil Type Grabby Loamy Fine Sand, 69%
Tedrow Fine Sand, 20%
Bixler Loamy Fine Sand, 11%
This study was designed using a randomized complete block with four replications. Plot width was 40 feet and plot length was 1,265 feet. Treatments were planter applied 2x2. Yield and moisture data were collected from grain inspection tickets. Soil test phosphorus (STP) levels were analyzed using Mehlich 3. All treatments were nutrient balanced for nitrogen at planting. Nutrasyst is a blend of organic acids designed to improve fertilizer efficiency by increasing plant nutrient uptake.
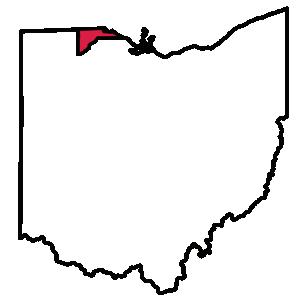

OSU Extension
Lucas County
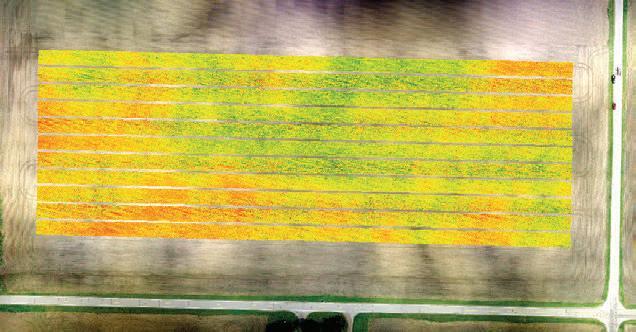
On June 3, 2021, the treatment with Starter + Nutrasyst visually looked better in terms of plant color and height. On June 22, 2021, all treatments were visually similar in color and height. Tissue samples on August 12, 2021, showed sufficient levels for all nutrients. Soil samples were taken at planting and harvest. Soil test phosphorus (STP) was above maintenance in all three treatment zones, the phosphorus level of the starter plus nutrasyst treatment was approximately 50% of the crop removal rate.
• This study is in the second year of a multi year study in identical soil types/conditions.
• There was no statistical difference in yield between the three treatments.
• Soil test phosphorus (STP) dropped noticeably in the two treatments where no starter phosphorus was used, STP remained the same in the treatment with starter phosphorus + Nutrasyst.
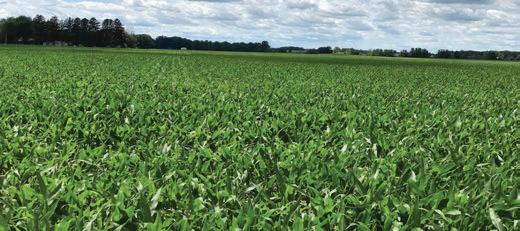
Treatment Means with the same letter are not significantly different according to Fisher’s Protected Least Significant Differences (LSD) test at alpha = 0.1.
DJI Phantom 4 Drone, with P4 multi-spectral sensor. The P4 Multi-spectral consolidates the process of capturing data that gives insight into crop health and vegetation management.

For inquiries about this project, contact Jordan Beck (beck.320@osu.edu).
Determine the feasibility of changing depth and its effects on yield.

Planting Date 5/18/2021
Harvest Date 10/25/2021
VarietyBeck’s 5140HR
Population 34,000 sds/ac
Acres42
Treatments 5 Reps 5
Treatment Width20 ft.
TillageMinimum
Management Fertilizer, Fungicide, Herbicide, Insecticide
Previous Crop Soybeans
Row Spacing30 in.
Soil Type Warsaw Silt Loam, 68% Genesee Silt Loam, 29%
This trial was designed to compare different planting depths over varying soil landscapes. Five different treatments were used ranging from 1.75 inches to 2.75 inches in planting depth. The planter was calibrated before planting to ensure correct depth across the width of the planter for split planter comparisons. A Case IH 2150 16 row Early Riser planter was used with a Case IH 380 Magnum CVT tractor.

OSU Extension
Franklin County
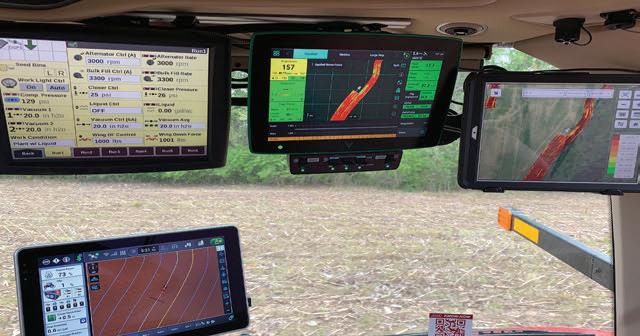
Monitor setup in tractor to track planting treatments and adjustments.
Planting was completed in ideal planting conditions. There was some weed breakouts prior to planting. Some areas were worked with high speed disc to prep for planting. Throughout the growing season, timely rains were received and weed, pest, and fungal pressure were not yield limiting factors for this growing season.
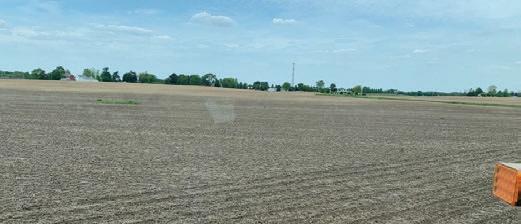
• No statistically significant yield differences between treatments were seen in this field.
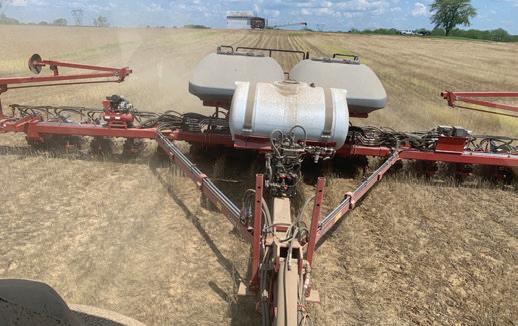
Treatment Means with the same letter are not significantly different according to Fisher’s Protected Least Significant Differences (LSD) test at alpha = 0.1.
Precision Planting SmartDepth
Allows planting depth adjustments to be made quickly from in the tractor cab as field conditions change.
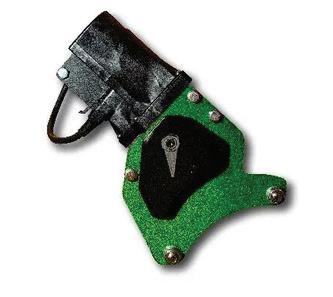
For inquiries about this project, contact Andrew Klopfenstein (klopfenstein.34@osu.edu).
Determine the feasibility of changing depth and its effects on yield.

Planting Date 5/19/2021
Harvest Date 10/8/2021
VarietyBeck’s 5507AM
Population 34,000 sds/ac
Acres82
Treatments 5 Reps 5
Treatment Width20 ft.
TillageMinimum
Management Fertilizer, Fungicide, Herbicide, Insecticde
Previous Crop Soybeans
Row Spacing30 in.
Soil Type Miamian-Kendallville Silt Loams, 35%
Westland Silty Clay Loam, 22%
Kokomo Silty Clay Loam, 16%
This trial was designed to compare different planting depths over varying soil landscapes. Five different treatments were used ranging from 1.75 inches to 2.75 inches in planting depth. The planter was calibrated before planting to ensure correct depth across the width of the planter for split planter comparisons. A Case IH 2150 16 row Early Riser planter was used with a Case IH 380 Magnum CVT tractor.

OSU Extension Pickaway County

Planting was completed in ideal planting conditions. There was some weed breakouts prior to planting. Some areas were worked with high speed disc to prep for planting. Throughout the growing season, timely rains were received and weed, pest, and fungal pressure were not yield limiting factors for this growing season.
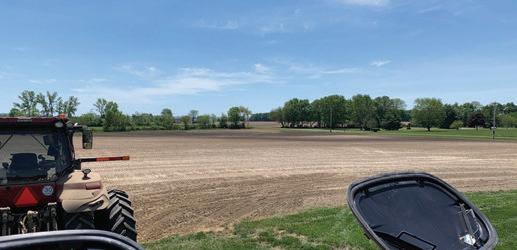
• No statistically significant yield differences between treatments were seen in this field.
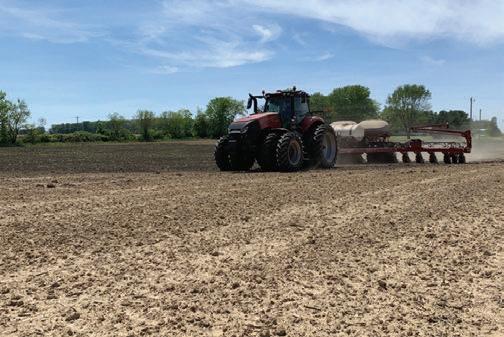
Treatment Means with the same letter are not significantly different according to Fisher’s Protected Least Significant Differences (LSD) test at alpha = 0.1.

For inquiries about this project, contact Andrew Klopfenstein (klopfenstein.34@osu.edu).
Determine the feasibility of changing depth and its effects on yield.

Planting Date 5/19/2021
Harvest Date 10/11/2021
VarietyBeck's 6374V2P
Population Variable Rate
Acres 72
Treatments 5
Reps 5
Treatment Width20 ft.
Tillage No-Till
Management Fertilizer, Fungicide, Herbicide, Insecticide
Previous Crop Soybeans
Row Spacing30 in.
Soil Type Miamian-Kendallville Silt Loams, 39%
Kokomo Silty Clay Loam, 29% Crosby Silt Loam, 22%
This trial was designed to compare different planting depths over varying soil landscapes. Five different treatments were used ranging from 1.75 inches to 2.75 inches in planting depth. The planter was calibrated before planting to ensure correct depth across the width of the planter for split planter comparisons. A Case IH 2150 16 row Early Riser planter was used with a Case IH 380 Magnum CVT tractor.

OSU Extension
Pickaway County

Planting was completed in ideal planting conditions. There was some weed breakouts prior to planting. Some areas were worked with high speed disc to prep for planting. Throughout the growing season, timely rains were received and weed, pest, and fungal pressure were not yield limiting factors for this growing season.
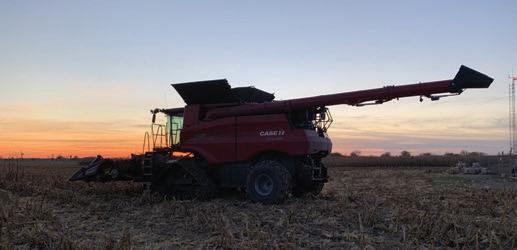
• Statistical differences were seen between the 2 and 2.25 inch planting depths versus 2.5 and 2.75 inch planting depths

Means with the same letter are not significantly different according to Fisher’s Protected Least Significant Differences (LSD) test at alpha = 0.1.
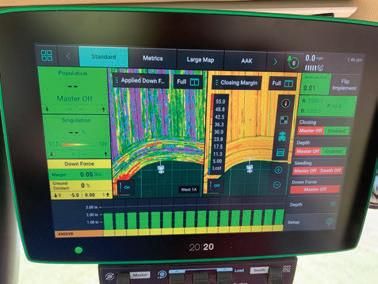
For inquiries about this project, contact Andrew Klopfenstein (klopfenstein.34@osu.edu).
Determine the feasibility of changing planting depth and its effects on yield.

Planting Date 5/20/2021
Harvest Date 10/10/2021
VarietyBeck's 6374V2P
Population 34,000 sds/ac
Acres 56
Treatments 5 Reps 5
Treatment Width20 ft.
Tillage No-Till
Management Fertilizer, Fungicide, Herbicide, Insecticide
Previous Crop Soybeans
Row Spacing30 in.
Soil Type Westland Silty Clay Loam, 36%
Kokomo Silty Clay Loam, 11%
Kendallville Silt Loam, 11%
This trial was designed to compare different planting depths over varying soil landscapes. Five different treatments were used ranging from 1.75 inches to 2.75 inches in planting depth. The planter was calibrated before planting to ensure correct depth across the width of the planter for split planter comparisons. A Case IH 2150 16 row Early Riser planter was used with a Case IH 380 Magnum CVT tractor.

OSU Extension
Pickaway County
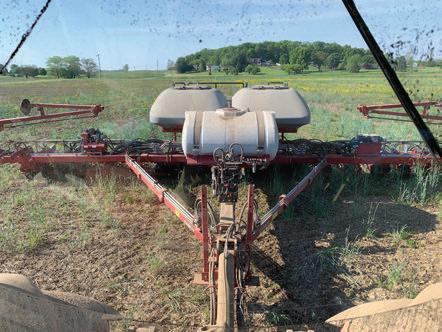
The Case IH 2150 planter during spring planting.
Planting was completed in ideal planting conditions. There was some weed breakouts prior to planting. Some areas were worked with high speed disc to prep for planting. Throughout the growing season, timely rains were received and weed, pest, and fungal pressure were not yield limiting factors for this growing season.

• No statistically significant yield differences between treatments were seen in this field.

Treatment Means with the same letter are not significantly different according to Fisher’s Protected Least Significant Differences (LSD) test at alpha = 0.1.

For inquiries about this project, contact Andrew Klopfenstein (klopfenstein.34@osu.edu).
Evaluate the yield as a function of 15, 20, and 30 inch row corn spacing and seeding rates.
Planting Date 5/16/2021
Harvest Date 10/26/2021
Variety Beck's 6282AM
Population See Treatments
Acres80
Treatments6 Reps4
Treatment Width40 ft.
Tillage No-Till
Management Fertilizer, Fungicide, Herbicide, Insecticide
Previous Crop Soybeans
Row Spacing See Treatments
Soil Type Celina Silt Loam, 81% Miamian Silt, 16%
Given the recent volatility in the grain markets, it is increasingly important for growers to optimize the productivity of agricultural lands, some growers are looking to increase plant populations with a corresponding reduction in row spacing as means to increase returns to their operations. The vast majority of corn acres in the U.S. and Canada are planted in 30 inch rows. The goal of this study was to evaluate the effects on yield of 15, 20, and 30 inch row spacing with cooperating growers in Ohio.


OSU Extension Franklin County
Growing Season Weather Summary

A Case IH 2140 24R20 and 16/32R planters were used to complete the treatments. They were both equipped with electric drive and hydraulic downforce along with applying starter fertilizer during planting.
The corn got off to a really good start with favorable planting and growing conditions that continued throughout the entire season. Across all row widths, the corn had a very dark green color and it all stood well for the entire season through harvest. Disease and weeds were not a concern at any point during the growing season.
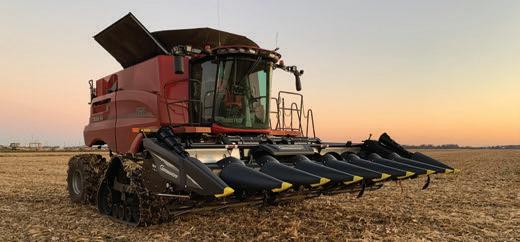
• Statistical differences were seen between several of the treatments but no consistent trend was seen.
• No visual differences were observed through the growing season or during harvest.
• All treatments seemed very consistent throughout the entire field for stand quality and stalk health.

Treatment Means with the same letter are not significantly different according to Fisher’s Protected Least Significant Differences (LSD) test at alpha = 0.1.
Geringhoff Freedom Head
Higher yields mean higher populations, and a trend toward narrow row spacing. The Gerringhoff Freedom allows an easy transition from 30 inch rows to 15 inch rows. The low profile design makes it unmatched in down corn situations.
For inquiries about this project, contact Andrew Klopfenstein (klopfenstein.34@osu.edu).
Determine the impact of row width and various populations on weed pressure and final yield.
Planting Date 4/28/2021
Harvest Date 11/3/2021


OSU Extension Ashland County
VarietyNK 1452
VarietyNK1452
Population See Treatments
Acres20
Treatments6
Reps3
Treatment Width 30 ft.
Tillage No-Till
Management Fertilizer, Herbicide
Previous CropCorn
Row Spacing See Treatments
Soil Type Wheeling Silt Loam, 86% Chili Loam, 14%
This study used a strip-trial format replicated multiple times across the field to evaluate yield differences between 15 inch and 30 inch plantings. A weigh wagon and combine monitor data were used to determine yield.

Corn in one of the 30 inch row plots.
No visual differences in weed pressure were observed throughout the growing season. There was no evidence of insect damage or diseases.
• In this study, no significant difference in yield was found comparing 15 inch and 30 inch rows.
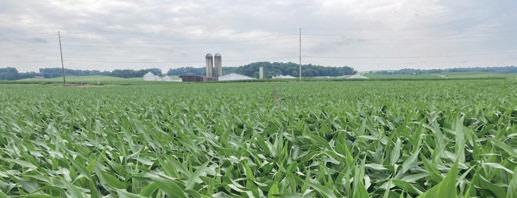
Treatment Means with the same letter are not significantly different according to Fisher’s Protected Least Significant Differences (LSD) test at alpha = 0.1.

For inquiries about this project, contact Chris Zoller (zoller.1@osu.edu).
Understand the yield impact of varying corn seeding rates within Ohio considering in-field variability and cultural practices implemented.
Planting Date 4/27/2021
Harvest Date 10/20/2021
VarietyEbberts 6883
Population 36,000 sds/ac Nominal
Acres120
Treatments 7
Reps4
Treatment Width30 ft.
TillageConventional
Management Fertilizer, Fungicide, Herbicide, Insecticide
Previous Crop Soybeans
Row Spacing30 in.
Soil Type Eldean Lom, 75% Westland Silty Clay Loam, 14% Warsaw Silt Loam, 9%
A randomized complete block design was used for this corn study with 4 replications. Five treatments included 4 fixed seeding rates (28,000, 32,000, 36,000 and 40,000) and a variable-rate (RX). The study site was located under pivot irrigation. The farmer typically uses 36,000 seeds/ ac for this field. The RX included seeding rates ranging from 30,000 seeds/ac up to 38,000 seeds/ac with an average of 35,110 seeds per acre for the field. Stand counts were collected across 3 transects. A John Deere S680 combine with a calibrated yield monitor was used at harvest.


OSU Extension
Miami County

24-row planter used in this study with treatments assigned to each half.
Timely rains coupled with pivot irrigation maintained excellent soil moisture throughout the growing season. The corn emerged uniformly and had an excellent stand. Stand counts indicated that the planter planted at a slightly higher population than the target seeding rate. The 40,000 seeding rate had a few locations within the study area where corn was leaning due to smaller stalk diameter. There was no leaning observed at harvest for treatments less than 40,000 or within the RX treatment. The smaller diameter stalks for the 40,000 seeds/ac treatment was the main, visual observed at harvest.
• Significant yield differences occurred in this study. The 28,000 and 32,000 treatments had the lowest yields at 255 and 265 bu/ac, respectively.
• There were no significant differences in yield between the RX treatment and the 36,000 and 40,000 fixed seeding rate treatments with all yielding >270 bu/ac.
• While yield differences did not exist between the 36,000 (normal fixed seeding rate), RX, on average the RX seeding rate was lower than the 36,000 treatment but provided a seed savings.
Treatment Means with the same letter are not significantly different according to Fisher’s Protected Least Significant Differences (LSD) test at alpha = 0.1.
The use of corn prescription seeding rates continues to increase in Ohio. There are different strategies to create corn RX maps but conducting seeding rate trials helps to establish the optimum seeding rate by zone for a field and evaluate the value.

4.1
1.3%
For inquiries about this project, contact John Fulton (fulton.20@osu.edu).
Determine the feasibility of using Precision Planting SmartFirmer organic matter estimates to select corn seeding rates on the go.
Planting Date 6/1/2021
Harvest Date 11/19/2021
Variety Seed Consultants 1105AM
Population See Treatment Acres 11
Treatments 5
Reps4
Treatment Width40 ft.
Tillage Vertical
Management Fertilizer, Herbicide
Previous Crop Soybeans
Row Spacing30 in.
Soil Type Brookston Silty Clay Loam, 62% Crosby Silt Loam, 34%
The trial was designed to compare three corn seeding rates across the field and a variable rate treatment that was determined by the SmartFirmer organic matter estimates on the go. A low, medium, and high seeding rate were chosen. The treatments were replicated five times in a randomized complete block design. This study used a Case IH 380 Magnum tractor pulling a Case IH 2150 Early Riser 16row 30 inch planter.


OSU Extension
Fayette County

Planting was delayed at this location; however, due to warm soil condition, emergence was rapid and even. Weather conditions were favorable throughout the growing season, with timely rainfalls in June and August. The site received above average rainfall in July, but this did not appear to negatively impact yield.

• No statistically significant yield response was observed at this location.
• Due to good weather conditions, yields trended higher as population increased.
• Allowing the SmartFirmer organic matter readings to drive the prescription on-the-go resulted in yield parity at this location in this year.
• This technology can make prescription generation easier.
Treatment Means with the same letter are not significantly different according to Fisher’s Protected Least Significant Differences (LSD) test at alpha = 0.1.
Precision Planting SmartFirmer
The SmartFirmer enables on-the-go estimates of soil properties at planting. The estimates of soil organic matter were used to guide the seeding prescription.

For inquiries about this project, contact Elizabeth Hawkins (hawkins.301@osu.edu).
Determine the feasibility of using Precision Planting SmartFirmer organic matter estimates to select corn seeding rates on the go.
Planting Date 5/25/2021
Harvest Date 10/28/2021
VarietyBeck's 6589RR
Population See Treatments
Acres30
Treatments2
Reps4
Treatment Width40 ft.
Tillage Vertical
Management Fertilizer, Fungicide, Herbicide, Insecticide
Previous Crop Soybeans
Row Spacing30 in.
Soil Type Westland Silty Clay Loam, 33%
Miamian-Kendallville
Silt Loams, 28%
Miamian Silt Loam, 25%
The trial was designed to compare a base corn seeding rate and a variable rate treatment that was determined by the SmartFirmer organic matter estimates on the go. The treatments were replicated four times in a randomized complete block design. This study used a Case IH 380 Magnum tractor pulling a Case IH 2150 Early Riser 16-row 30 inch planter.


OSU Extension Pickaway County
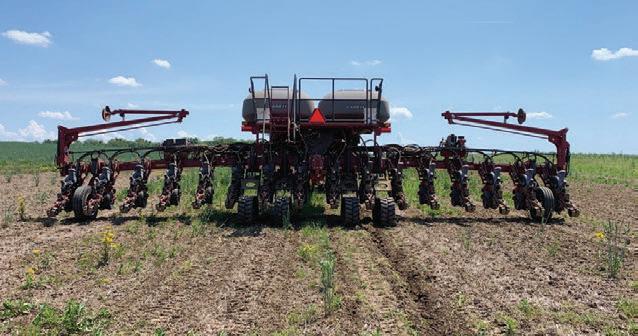
Planter equipped with Precision Planting SmartFirmer technology used to sense organic matter on the go and adjust seeding rate.
Planting was delayed due to wet springtime conditions. At planting time conditions were near optimal with good soil temperatures and good soil moisture. Conditions throughout the growing season were good with minimal disease pressure. The high gravel tops in this field did burn up due to the lack of rain which is normal for this location.

• No statistical significance was seen between the treatments for this field.
• More rate treatments are needed to better understand the effects of seeding rate for this location.

Treatment Means with the same letter are not significantly different according to Fisher’s Protected Least Significant Differences (LSD) test at alpha = 0.1.
Scan here to watch video about planting with speed and accuracy featuring information about hydraulic downforce and using SmartFirmer for seeding rates.

For inquiries about this project, contact Andrew Klopfenstein (klopfenstein.34@osu.edu).
Determine the feasibility of using Precision Planting SmartFirmer organic matter estimates to select corn seeding rates on the go.
Planting Date 5/25/2021
Harvest Date 11/2/2021
VarietyBeck's 6589RR
Population See Treatment
Acres 35
Treatments2 Reps 7
Treatment Width40 ft.
Tillage Vertical
Management Fertilizer, Fungicide, Herbicide, Insecticide
Previous Crop Soybeans
Row Spacing30 in.
Soil Type Westland Silty Clay Loam, 33%
Miamian-Kendallville
Silt Loams, 28%
Miamian Silt Loam, 25%
The trial was designed to compare a base corn seeding rate and a variable rate treatment that was determined by the SmartFirmer organic matter estimates on the go. The treatments were replicated four times in a randomized complete block design. This study used a Case IH 380 Magnum tractor pulling a Case IH 2150 Early Riser 16-row 30 inch planter.


OSU Extension Pickaway County

Planter equipped with Precision Planting SmartFirmer technology used to sense organic matter on the go and adjust seeding rate.
Planting was delayed due to wet springtime conditions. At planting time conditions were near optimal with good soil temperatures and good soil moisture. Conditions throughout the growing season were good with minimal disease pressure. The high gravel tops in this field did burn up due to the lack of rain which is normal for this location.
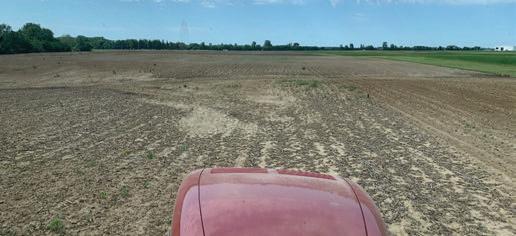
• No statistical significance was seen between the treatments for this field.
• More rate treatments are needed to better understand the effects of seeding rate for this location.
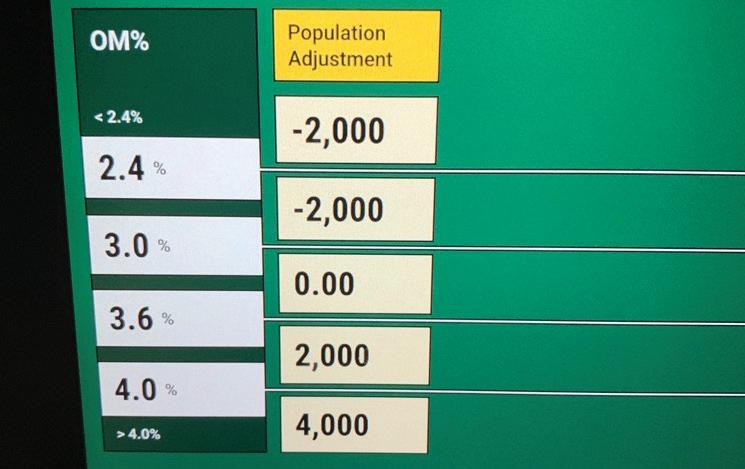
Treatment Means with the same letter are not significantly different according to Fisher’s Protected Least Significant Differences (LSD) test at alpha = 0.1.

For inquiries about this project, contact Andrew Klopfenstein (klopfenstein.34@osu.edu).
Determine the feasibility of using Precision Planting SmartFirmer organic matter estimates to select corn seeding rates on the go.
Planting Date 5/19/2021
Harvest Date 10/11/2021
VarietyBeck's 6374V2P
Population See Treatment
Acres 45
Treatments2
Reps 7
Treatment Width40 ft.
TillageConventional
Management Fertilizer, Fungicide, Herbicide, Insecticide
Previous Crop Soybeans
Row Spacing30 in.
Soil Type Kokomo Silty Clay Loam, 29%
Miamian-Kendallville
Silt Loams, 29%
Crosby Silt Loam, 22%
The trial was designed to compare a base corn seeding rate and a variable rate treatment that was determined by the SmartFirmer organic matter estimates on the go. The treatments were replicated four times in a randomized complete block design. This study used a Case IH 380 Magnum tractor pulling a Case IH 2150 Early Riser 16-row 30 inch planter.


OSU Extension Pickaway County

Planter equipped with Precision Planting SmartFirmer technology used to sense organic matter on the go and adjust seeding rate.
Planting was delayed due to wet springtime conditions. At planting time conditions were near optimal with good soil temperatures and good soil moisture. Conditions throughout the growing season were good with minimal disease pressure. Crop conditions were excellent through growing season and received adequate rain to produce crop.
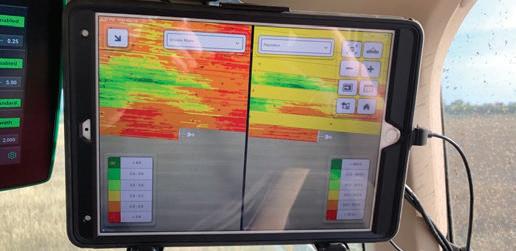
• No statistical significance was seen between the treatments for this field.
• More rate treatments are needed to better understand the effects of seeding rate for this location.
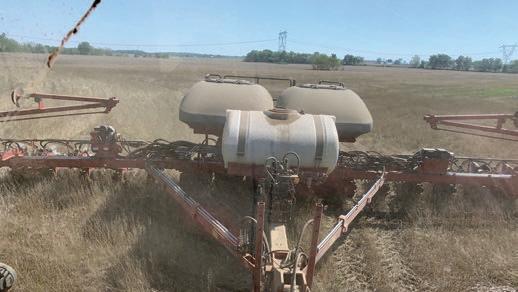
Treatment Means with the same letter are not significantly different according to Fisher’s Protected Least Significant Differences (LSD) test at alpha = 0.1.
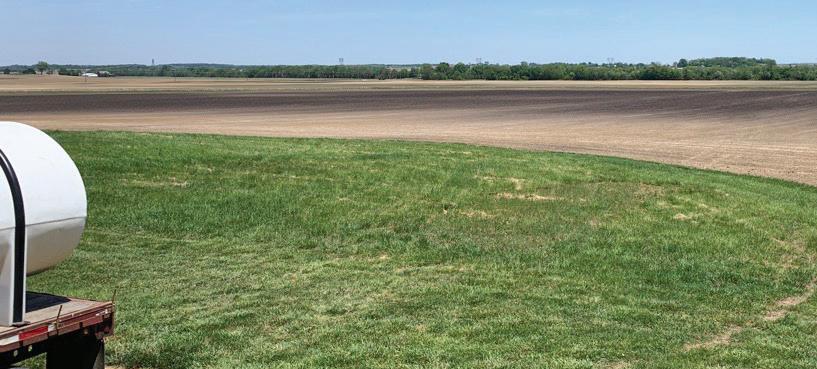
For inquiries about this project, contact Andrew Klopfenstein (klopfenstein.34@osu.edu).
Determine the feasibility of using Precision Planting SmartFirmer organic matter estimates to select corn seeding rates on the go.
Planting Date 5/19/2021
Harvest Date 10/11/2021
VarietyBeck's 6374V2P
Population See Treatments
Acres 15
Treatments2
Reps 5
Treatment Width40 ft.
TillageConventional
Management Fertilizer, Fungicide, Herbicide, Insecticide
Previous Crop Soybeans
Row Spacing30 in.
Soil Type Kokomo Silty Clay Loam, 61% Montgomery Silty Clay Loam, 24% Kinn Silt Loam, 15%
The trial was designed to compare a base corn seeding rate and a variable rate treatment that was determined by the SmartFirmer organic matter estimates on the go. The treatments were replicated four times in a randomized complete block design. This study used a Case IH 380 Magnum tractor pulling a Case IH 2150 Early Riser 16-row 30 inch planter.


OSU Extension Pickaway County

Planter equipped with Precision Planting SmartFirmer technology used to sense organic matter on the go and adjust seeding rate.
Planting was delayed due to wet springtime conditions. At planting time conditions were near optimal with good soil temperatures and good soil moisture. Conditions throughout the growing season were good with minimal disease pressure. Crop conditions were excellent through growing season and received adequate rain to produce crop.
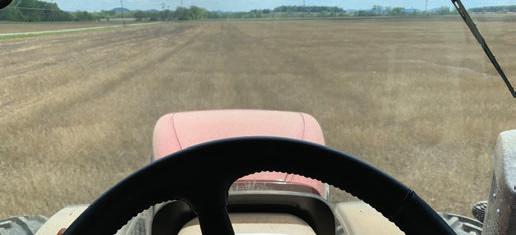
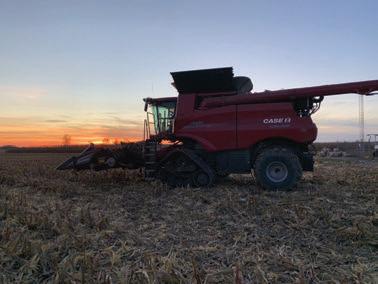
• No statistical significance was seen between the treatments for this field.
• More rate treatments are needed to better understand the effects of seeding rate for this location.
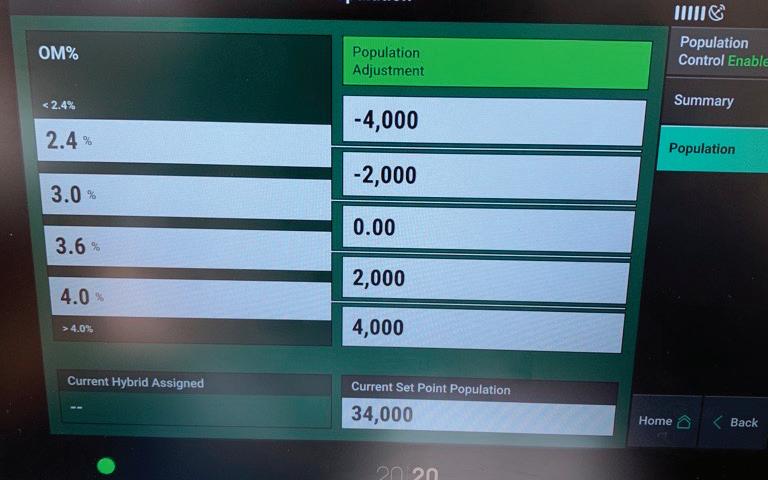
For inquiries about this project, contact Andrew Klopfenstein (klopfenstein.34@osu.edu).
Determine the feasibility of using Precision Planting SmartFirmer organic matter estimates to select corn seeding rates on the go.
Planting Date 5/20/2021
Harvest Date 10/9/2021
Variety Beck's 6481AM
Population See Treatments
Acres 71
Treatments2
Reps14
Treatment Width40 ft.
TillageConventional
Management Fertilizer, Fungicide, Herbicide, Insecticide
Previous Crop Soybeans
Row Spacing30 in.
Soil Type Kokomo Silty Clay Loam, 69% Celina Silt Loam, 20%
Crosby Silt Loam, 10%
The trial was designed to compare a base corn seeding rate and a variable rate treatment that was determined by the SmartFirmer organic matter estimates on the go. The treatments were replicated four times in a randomized complete block design. This study used a Case IH 380 Magnum tractor pulling a Case IH 2150 Early Riser 16-row 30 inch planter.


OSU Extension
Ross County

Planter equipped with Precision Planting SmartFirmer technology used to sense organic matter on the go and adjust seeding rate.
OBSERVATIONS
Planting was delayed due to wet springtime conditions. At planting time conditions were near optimal with good soil temperatures and good soil moisture. Conditions throughout the growing season were good with minimal disease pressure. Crop conditions were excellent through growing season and received adequate rain to produce crop.

• No statistical significance was seen between the treatments for this field.
• More rate treatments are needed to better understand the effects of seeding rate for this location.
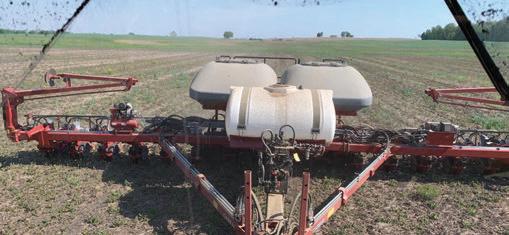
Treatment Means with the same letter are not significantly different according to Fisher’s Protected Least Significant Differences (LSD) test at alpha = 0.1.
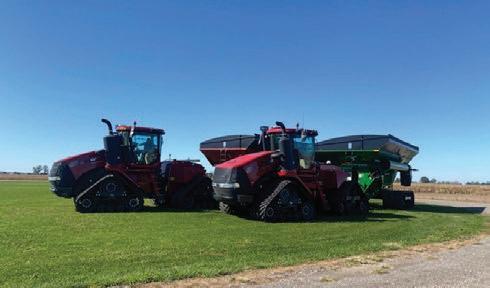
For inquiries about this project, contact Andrew Klopfenstein (klopfenstein.34@osu.edu).
Determine use and effectivness of soil moisture probes in irrigated fields.

Planting Date 5/5/2021 & 5/10/2021
Harvest Date 9/20/2021 & 9/25/2021
Variety Seed Corn
Population 28,000 sds/ac
Acres 85 & 160
Treatments1
Reps2
Treatment WidthWhole Field
Tillage Strip-Till
Management Fertilizer, Fungicide, Herbicide, Insecticide
Previous Crop Soybeans
Row Spacing30 in.
Soil Type Lippincot Silty Clay Loam, 43%
Fox Silt Loam, 26%
Ionia Silt Loam, 25%
One sensor was placed under irrigation in two different fields.

OSU Extension
Champaign County
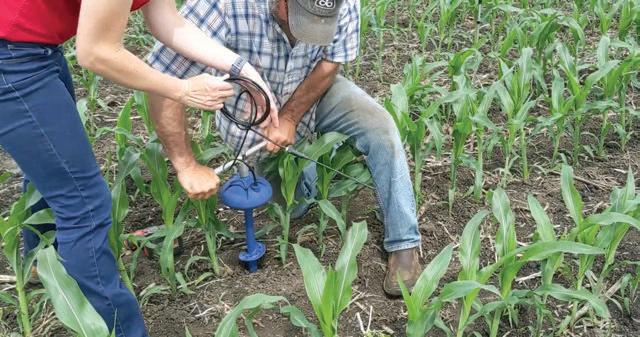
Installing the CropX soil moisture sensor.
Seed corn was the crop in these fields so no yield data was collected. Due to recent rainfall, irrigation was not need as much in 2021. Saturating rains were helpful in determining full and refill levels of the crop to more accurately set sensor levels. The corresponding smart phone application was easy to use and check moisture levels from anywhere.

• These fields have had Sentek sensors installed for two years prior.
• The ease of installation and removal was a big benefit of the CropX style, especially in silt loam and clay soils.
• The screenshots of the soil profile moisture summary display how the information was used to run irrigations systems to avoid the refill (red) level.
• The CropX app was an easy way to check soil moisture levels throughout the growing season.


CropX Soil Moisture Sensors. See video of install at go.osu.edu/ CropXInstall.

For inquiries about this project, contact Amanda Douridas (douridas.9@osu.edu).
Evaluate yield response of corn between strip-till with injected fertilizer and no-till with broadcast applied fertilizer.
Planting Date 5/21/2021
Harvest Date 12/7/2021
VarietyBeck’s 5829RR
Population 32,000 sds/ac
Acres160
Treatments2
Reps4
Treatment Width60 ft.
Tillage Strip-Till
Management Fertilizer, Fungicide, Herbicide
Previous Crop Soybeans
Row Spacing30 in.
Soil Type Hoytville Silty Clay Loam, 100%


A randomized complete block design was used in this study with four replications. The two treatments included no-till with broadcasted P and K and strip-till with subsurface banded P and K. Fertilizer was applied in the Fall of 2020. Strip-till was conducted using an 8-row Orthman 1tRIPr implement with the main tillage shank set to run 8” deep with fertilizer placed at 4”. The fertilizer was applied using a Salford STS 10 dual-bin dry fertilizer cart with VR capabilities. MAP and potash were applied based on soil sample analysis and Tristate Recommendations within the H2Ohio Compliance criteria. At V5, whole plant samples were collected and analyzed for nitrogen and phosphorus content. Yield was collected at harvest with weigh scales on a grain cart used to check accumulated weights per strip.
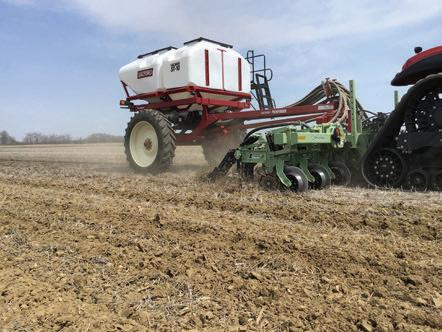
This was the last field of corn to be planted on the farm, nearly a month after the first because of cold temperatures and rain. When field conditions were suited for planting, the corn was planted into ideal soil conditions. After the first 6 weeks, nothing was ideal in terms of field conditions. Heavy amounts of rain weekly continued for the remainder of the growing season. The field received 10 inches of rain in 10 days from July 10th-17th. During this time, there was severe winds, hail, and green snap. Late in the season, Tar Spot, NCLB, and Grey leaf spot all infected this field. Fungicide was applied with a Hagie sprayer limiting damage to the corn. In summary, corn was planted late under ideal field conditions but excessive amounts of rain stressed this crop especially in the latter parts of the growing season.
• More consistent and uniform emergence existed for the strip-till treatment over the no-till treatment. Emergence was also slightly earlier for the strip-till
• During harvest, it was noted many areas with thin stand this being the affect of the July high winds/rain causing green snap among the crop.
• No significant yield differences existed between the strip-till and no-till though the strip-till averaged 6 bu/ac higher.
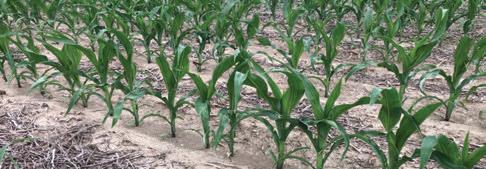
Treatment Means with the same letter are not significantly different according to Fisher’s Protected Least Significant Differences (LSD) test at alpha = 0.1.
The Salford STS-10 is a steerable, dual-bin fertilizer cart. It has hydraulic drive capabilities that allow for independently metering product from each bin plus providing variable-rate capabilities. It can also be ordered as ISOBUS compatible including variable-rate allowing it to be used with most newer tractors.

For inquiries about this project, contact John Fulton (fulton.20@osu.edu) or Ryanna Tietje (tietje.9@osu.edu).
Determine the benefit of fall strip-till and if it would alleviate compaction caused by the planter and side-dress passes.
Planting Date 5/19/2021
Harvest Date 11/9/2021
VarietyDeKalb 6220
Population 32,035 sds/ac
Acres4
Treatments4
Reps4
Treatment Width 15 ft.
Tillage Strip-Till
Management Fertilizer, Herbicide, Insecticide
Previous Crop Soybeans
Row Spacing30 in.
Soil Type Hoytville Clay Loam, 79%
Haskins Sandy Loam, 13%
Dunbridge Sandy Loam, 8%
Strip tillage was performed in the fall prior to planting, and yield was then monitored in the treatment areas. The 6 rows with the planter tracks were harvested as trafficked areas and the 6 rows on the ‘wings’ were harvested as un-trafficked areas. This trial was on a field with mostly clay loam soil.


OSU Extension
Sandusky County
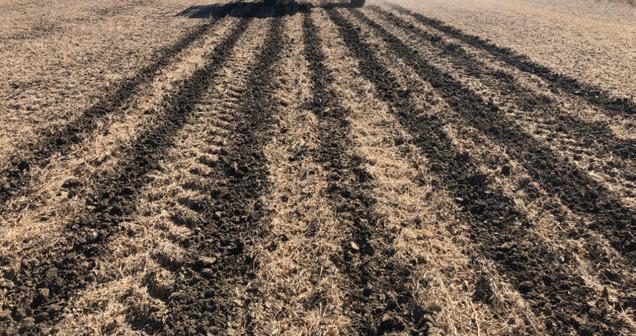
Strip tillage combine precise nutrient application with compaction management.
The passes trafficked by the sprayer, planter, and sidedress tires should have the highest level of compaction and benefit the most from strip-tilling. However the greatest benefit for strip-tilling actually occurred in the untrafficked areas. While there is definite benefit to strip-tilling as it equates to overall yield, it does not necessarily equate to negating the effects of compaction and improving yield in that regard. In studying yield results there is significantly different yield data showing a 13 bushel improvement from no-till to strip till in the trafficked area, and a 14 bushel improvement in the untrafficked area, and as suspected, the yields are lower in the trafficked area, but with similar differences from no-till to strip-till in both areas.
• Fall Strip-till increased yields whether conducted in the trafficked or un-trafficked areas of the field.
• However, the difference between the trafficked and un-trafficked pass was not reduced by striptilling.
• No major visual differences in the stands were observed throughout the season.

Treatment Means with the same letter are not significantly different according to Fisher’s Protected Least Significant Differences (LSD) test at alpha = 0.1.
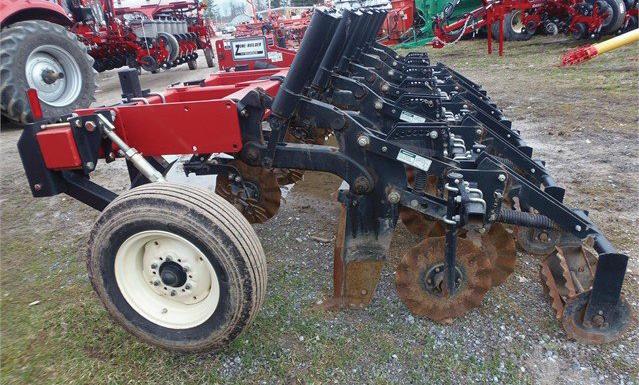
For inquiries about this project, contact Allen Gahler (gahler.2@osu.edu).
Determine if fall strip-till would increase yield, by alleviating compaction, if conducted in the sprayer tracks.
Planting Date 5/19/2021
Harvest Date 11/9/2021
VarietyDeKalb 6220
Population 32,035 sds/ac
Acres4
Treatments4
Reps4
Treatment Width 15 ft.
Tillage Strip-Till
Management Fertilizer, Herbicide
Previous Crop Soybeans
Row Spacing30 in.
Soil Type Hoytville Clay Loam, 82%
Haskins Sandy Loam, 18%
Strip tillage was performed in the fall prior to planting season, and yield was then monitored in the treatment areas.


OSU Extension Sandusky County
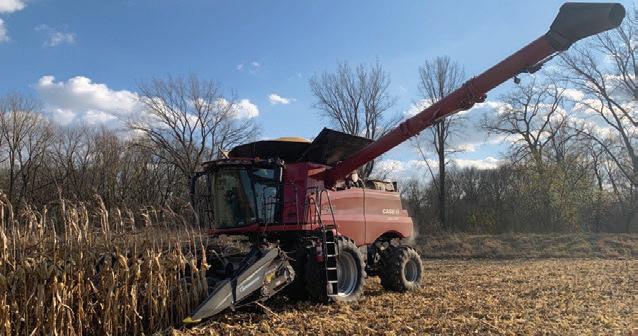
No major visual differences in the stands were observed throughout the season. Yield was the only factor to look to for differences.
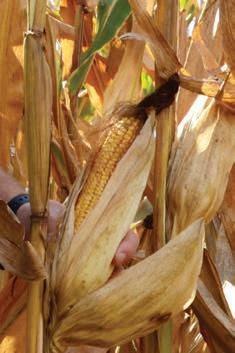
• Fall strip-till significantly increased yields in this trial, but what is not known is how much the increase was simply from the strip-till itself, or if it was from alleviating the compaction.
• Further studies would be warranted to measure yield from no-till vs strip till in the sprayer tracks, and compare that to yield from no-till vs strip-till in areas not compacted by sprayer tracks.
• We reached this conclusion by looking at a similar study performed on planter and sidedress tracks where the yields were actually compared from no-till and strip-till in both trafficked and untrafficked areas, and the bump in yield from strip-till in both trafficked and untrafficked was similar, indicating that strip-till is an advantage, but not necessarily as a reliever of yield loss to compaction.
Treatment Means with the same letter are not significantly different according to Fisher’s Protected Least Significant Differences (LSD) test at alpha = 0.1. LSD: 4.4
1.2%
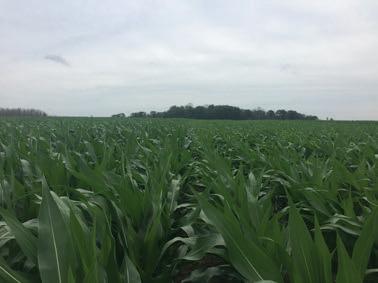

For inquiries about this project, contact Allen Gahler (gahler.2@osu.edu).
Determine if fall strip-till in sandy fields increases yield.

Planting Date 5/2/2021
Harvest Date 10/18/2021
VarietyPioneer 0935AM
Population 30,927
Acres3
Treatments2
Reps4
Treatment Width30 ft.
Tillage Strip-Till
Management Fertilizer, Herbicide, Insecticide
Previous Crop Soybeans
Row Spacing30 in.
Soil Type Tedrow-Dixboro Complex, 56% Colwood Fine Sandy Loam, 42%
Four replicated and randomized plots were utilized to compare strip-till vs no-till, with yield measurements taken at harvest for results. This study was conducted on sandy soils.

OSU Extension Sandusky County
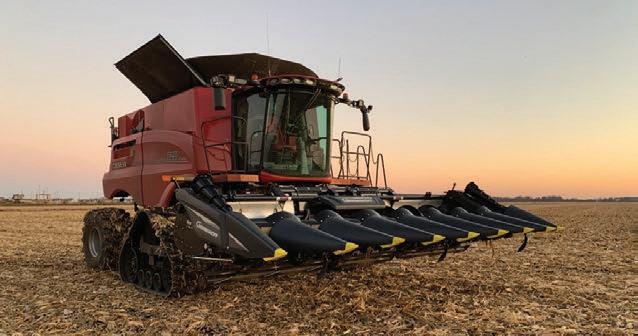
No noticeable visual effects were documented on the overall stands or plant health amongst the plots, and moisture at harvest did not appear to be affected. When stand counts were made at the time of sidedress, the strip-till treatment plots averaged 1,933 more plants per acre than the no-till plots.
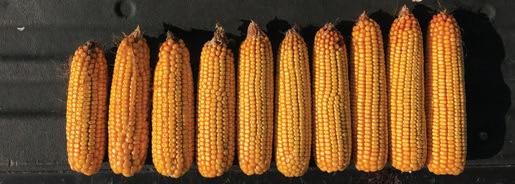
• With stand population being almost 2,000 plants per acre higher in the strip-till plots, we would expect to see a slight yield advantage here, which yield results did prove to be true.
• While not statistically significant, the differences in yield gave a 3 bushels per acre advantage to the strip-till plots.
• While other studies may show an agronomic and economic advantage to strip-till vs. no-till, the same cannot be said for this trial on sandy soils.
• Additional research may be warranted to analyze soil type and structure within each treatment area on future studies, and run an economic comparison of costs associated with the strip-till procedure against added yield.
Treatment Means with the same letter are not significantly different according to Fisher’s Protected Least Significant Differences (LSD) test at alpha = 0.1.

LSD: 7.5 CV: 1.9%
For inquiries about this project, contact Allen Gahler (gahler.2@osu.edu).
Evaluate the effectiveness of preemergence treatments sulfur to corn.
Planting Date 4/24/2021
Harvest Date 10/15/2021
Variety Seed Consultants 1141
Population 34,000 sds/ac
Acres6
Treatments1
Reps4
Treatment Width40 ft.
Tillage Vertical
Management Fertilizer, Herbicide
Previous Crop Soybeans
Row Spacing30 in.
Soil Type Bogart Silt Loam, 40%
Chili Silt Loam 21%
Fitchville Silt Loam, 16%
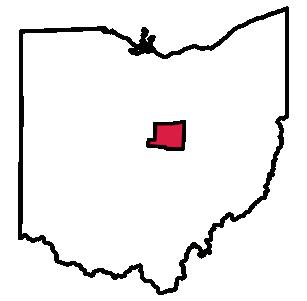

OSU Extension
Knox County
This study was designed as a randomized complete block study. Each plot was 60 feet wide and encompassed the full length of the field. Treatments consisted of no sulfur (control) vs Extract at a rate of 2 qt/ac and BLACKMAX at a rate of 2 qt/ac applied through the planter at planting. A calibrated yield monitor was used to collect yield data.
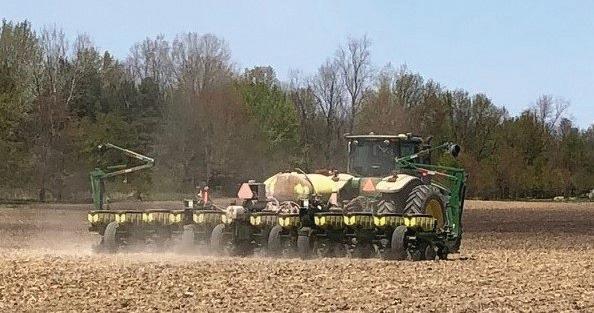
This trial was able to be planted in late April.
Throughout the year the treated areas in the field appeared “slightly” greener. This growing season was a good growing season for corn. County corn yields were significantly above average.
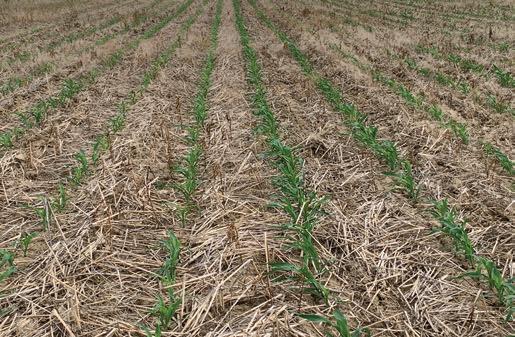
• The yield average of the 4 treatment replications in this study was 260.8 bu/ac.
• The average of the no treatment (control) replications was 260.3 bu/ac.
• This resulted in a yield increase of .5 bu/ac and a reduction in net returns of $15.23/ac.
Treatment Means with the same letter are not significantly different according to Fisher’s Protected Least Significant Differences (LSD) test at alpha = 0.1.
Dickey-John GAC 2500
The GAC 2500-AGRI Grain Analysis Computer use the newest analysis technology to provide repeatable results. Additionally, the GAC 2500-AGRI has more accurate temperature sensing capabilities, allowing you to measure in extreme temperature conditions including frozen and hot grain.
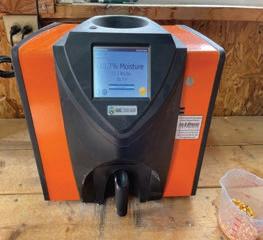
For inquiries about this project, contact John Barker (barker.41@osu.edu).
Determine if supplemental sulfur applied with sidedress (V6) Nitrogen would increase yield on corn in sandy soils.
Planting Date 4/28/2021
Harvest Date 10/14/2021
VarietyPioneer 0977AM
Population 31,490 sds/ac
Acres 11
Treatments1
Reps4
Treatment Width 45 ft.
Tillage No-Till
Management Fertilizer, Herbicide, Insecticide
Previous Crop Soybeans
Row Spacing30 in.
Soil Type Tedrow-Dixboro Complex, 49% Hoytville Clay Loam, 17% Tedrow Loamy Fine Sand, 11%
The trial was conducted with four randomized, replicated plots, each containing one control rep with no supplemental sulfur, and one treatment rep which received 6 gallons/acre of 5-0-0-38.


OSU Extension Sandusky County

A sulfur treatment did not appear to have any significant visual effects on stand or moisture at harvest.
The sulfur treatment did not appear to have any significant visual effects on the stand, and no effect on moisture at harvest. Disregarding statistical significance, we did find differences in stand population at the time of sidedress, with populations ranging from 29,911 to 33,250 across individual plots in the trial. In studying individual plot yields and stand counts, there does appear to be a more direct correlation of higher population to yield than to sulfur treatment, however the average population on treated plots was only 700 plants per acre higher than the average of control plot populations.
• The major takeaway from this trial is to compare yields from treated plots vs control or untreated plots that had similar stand counts at the time of sidedress and sulfur treatment.
• Overall, the sulfur treated plots averaged 5 bushels per acre more yield than the non-treated plots, which also equated to 3 bushels more than the overall trial average.
• In general, sulfur treatments at sidedress may provide a small yield boost, but a detailed economic comparison would be warranted to determine if that yield resulted in economic gains.
Treatment Means with the same letter are not significantly different according to Fisher’s Protected Least Significant Differences (LSD) test at alpha = 0.1.
Sulvaris’s Micronized Sulphur Technology
Micronized Sulphur Technology (MST) was applied with standard knifed liquid sidedress applicator.

For inquiries about this project, contact Allen Gahler (gahler.2@osu.edu).
Investigate the agronomic benefits of distributing weight from the center section of a planter to the wings.
Planting Date 5/22/2021
Harvest Date 10/28/2021
VarietyBeck's 6589RR
Population 34,000 sds/ac
Acres 50
Treatments4
Reps4
Treatment Width40 ft.
Tillage Vertical
Management Fertilizer, Fungicide, Herbicide, Insecticide
Previous Crop Soybeans
Row Spacing30 in.
Soil Type Westland Silty
Clay Loam, 32%
Miamian Silt Loam, 30%
Miamian Kendallville Silt Loam, 18%
This study used a 2150 16-row 30 inch Case IH Early Riser planter equipped with wing downforce. Four treatments ranging from 0-800 lbs were replicated four times using a Case IH 380 Magnum. Hydraulic downforce was set to heavy auto for the duration of this study. Seed levels were at 50% when study began.


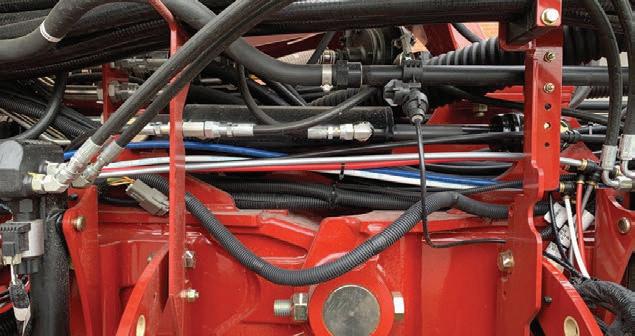
Hydraulic cylinders were added to the planter to help transfer the weight from the center section of the planter to the wings, redistributing the weight more evenly across the entire bar.
The normal planting date would be at the end of April, but was delayed due to a wet spring. However, planting conditions were optimal with a planting depth of 2.25 inches at a speed of 9.5 mph. It was observed that 500 lbs did the best job keeping the planter frame level. The lack of rain during the growing season was the limiting factor to yield potential.
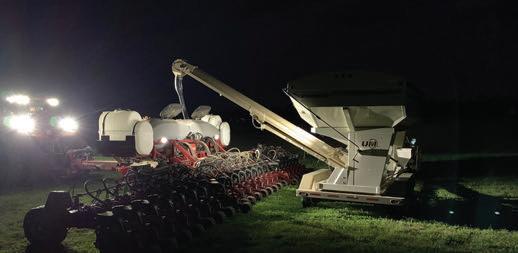
• There was no statistical difference between treatments.
• It was noticed that 300 lbs did the best job during field operating this spring.
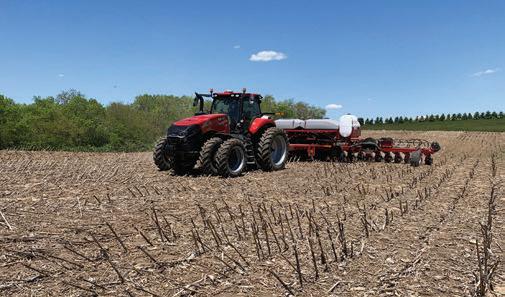
Treatment Means with the same letter are not significantly different according to Fisher’s Protected Least Significant Differences (LSD) test at alpha = 0.1.
Miller Nitro 7310
The Miller Nitro with 72 inches of ground clearance allows growers to apply fungicide, nitrogen, and covercrops to the corn crop late in the growing season.
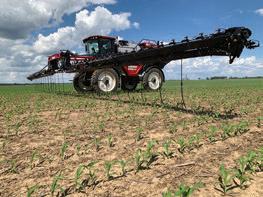
For inquiries about this project, contact Andrew Klopfenstein (klopfenstein.34@osu.edu).
Determine the agronomic benefits to using Yetter Stalk Devastators for the crimping corn stalks during harvest.
Planting Date 5/31/2021
Harvest Date 11/17/2020
Variety Beck's 3992FP
Population 140,000 sds/ac
Acres 50
Treatments2
Reps4
Treatment Width30 ft.
Tillage No-Till
Management Fertilizer, Fungicide, Herbicide, Insecticide
Previous Crop Soybeans
Row Spacing30 in.
Soil Type Genesee Silt Loam, 56%
Ross Silt Loam, 24% Ross Loam, 10%
This study was designed to test the feasibility of using Yetter Stalk Devastators for stalk breakdown and traction device protection. The Devastators were installed on a Case IH 8250 combine and Case IH 4412 corn header. This study was completed with and without devastators installed. After harvest and winter we went out and performed counts to look at what percent of stalks that were crimped and breaking down.


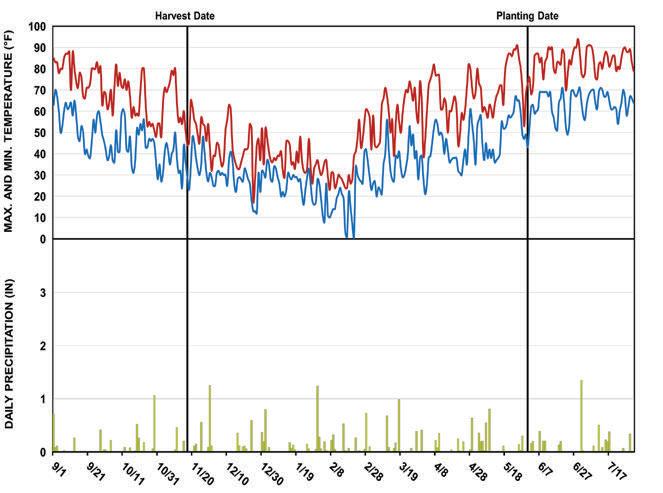
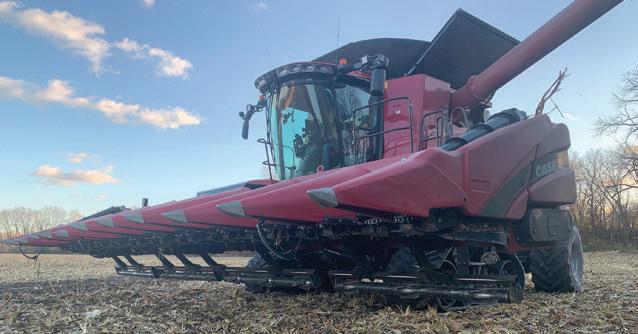
The Yetter Stalk Devastator was installed to protect both wheeled and tracked machines..
This study was completed in a long-term no-till field. Throughout the fall we used Devastators and noticed that it did an excellent job protecting both wheeled and tracked machines for wear on the machine. Extra care needs to be taken to setup header cart and ensure compatability with header and Devastators for installing and removing header on combine. We had no issues with plugging from rocks or use in heavy residue environments.

• Devastators were statistically significant seen to aid in breakdown of stalks versus a stock corn header.
• Even though soybean emergence following corn crop was not seen to be statistically significant, it was seen that there were generally more beans emerged in devastator passes.

Treatment Means with the same letter are not significantly different according to Fisher’s Protected Least Significant Differences (LSD) test at alpha = 0.1.
Yetter Stalk Devastator
The Yetter Stalk Devastator is a stalk roller designed to protect tracks and tires during harvest and speed up stalk residue breakdown. Stalk Devastator rollers use flat steel bars that knock over and crimp stalks. This allows water and air to enter stalks, facilitating faster decomposition.
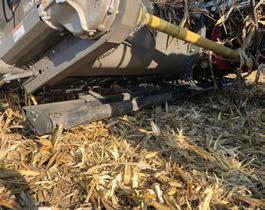
For inquiries about this project, contact Andrew Klopfenstein (klopfenstein.34@osu.edu).
Understand the yield impact of varying corn seeding rate within Ohio considering in-field variability and cultural practices implemented. Information from these trials are being used to improve management recommendations for growers throughout Ohio and help understand how variable-rate seeding may impact field by field profitability.
The primary recommendations for seeding rates in Ohio are determined by target final stands and average soil productivity. Variable rate seeding prescriptions have the potential to better match seeding rate to productivity zones in an effort to optimize profits. Field studies were implemented in a strip-trial format and replicated at least three times within fields. Results for individual sites plus aggregated pooled analyses were conducted.
• Across all sites, the average corn stand was 100% of the target rate with individual sites ranging between 95% and 103%.
• Variation in corn yield was caused by both differences in location differences in seeding rate in 2021.
• There was a significant response to corn seeding rate at 3 out 4 sites in 2021.
• The economic optimum seeding rate had slight variations based on corn yield levels for different areas of Ohio. Areas receiving adequate rainfall had above average yields, resulting in an economic optimum between 33,000 and 36,000 seeds per acre.

Sound information and data to improve decision making for corn variety selection, target seeding rate, and final population.


Planting Date 5/1/2021
Harvest Date 10/23/2021
VarietyRupp J 10-91
Population See Treatments
Acres26
Treatments 5
Reps3
Treatment Width30 ft.
TillageMinimum
Management Fertilizer, Herbicide
Previous CropCorn
Row Spacing30 in.
Soil Type Gilford Fine Sandy Loam, 46% Ottokee Fine Sand, 32%
Tedrow Loamy Fine Sand, 19%
For inquiries about this project, contact Eric Richer (richer.5@osu.edu).

OSU Extension
Fulton County
Planting Date 4/27/2021
Harvest Date 10/20/2021
VarietyEbberts 6883VT
Population See Treatments
Acres120
Treatments 5
Reps4
Treatment Width30 ft.
TillageConventional
Management Fertilizer, Fungicide, Herbicide, Insecticide
Previous Crop Soybenas
Row Spacing30 in.
Soil Type Eldean Loam, 75% Westland Silty Clay Loam, 14% Warsaw Silt Loam, 9%
For inquiries about this project, contact Amanda Bennett (bennett.709@osu.edu) or John Fulton (fulton.20@osu.edu).


Planting Date 5/21/2021
Harvest Date 10/22/2021
VarietyStine 9714-20
Population See Treartments
Acres 17
Treatments 5
Reps4
Treatment Width30 ft.
TillageConventional
Management Fertilizer, Herbicide
Previous Crop Soybeans
Row Spacing30 in.
Soil Type Toledo Silty Clay Loam, 28% Tuscola-Shinrock Complex, 24%
Del Rey-Fulton Silt Loams, 23%
For inquiries about this project, contact Beth Scheckelhoff (scheckekhoff.11@osu.edu).

OSU Extension Putnam County
Planting Date 4/26/2021
Harvest Date 10/28/2021
VarietyChannel 210-79 DGVT2
Population See Treatments
Acres28
Treatments 5
Reps3
Treatment Width30 ft.
Tillage No-Till
Management Fertilizer, Herbicide
Previous Crop Soybeans
Row Spacing30 in.
Soil Type Rush Silt Loam, 100%
For inquiries about this project, contact Chris Zoller (zoller.1@osu.edu)

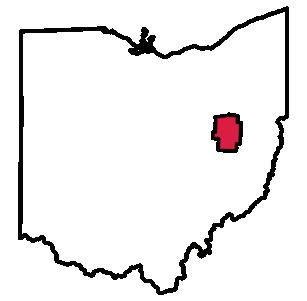

EMBRACING TIME AND CHANGE
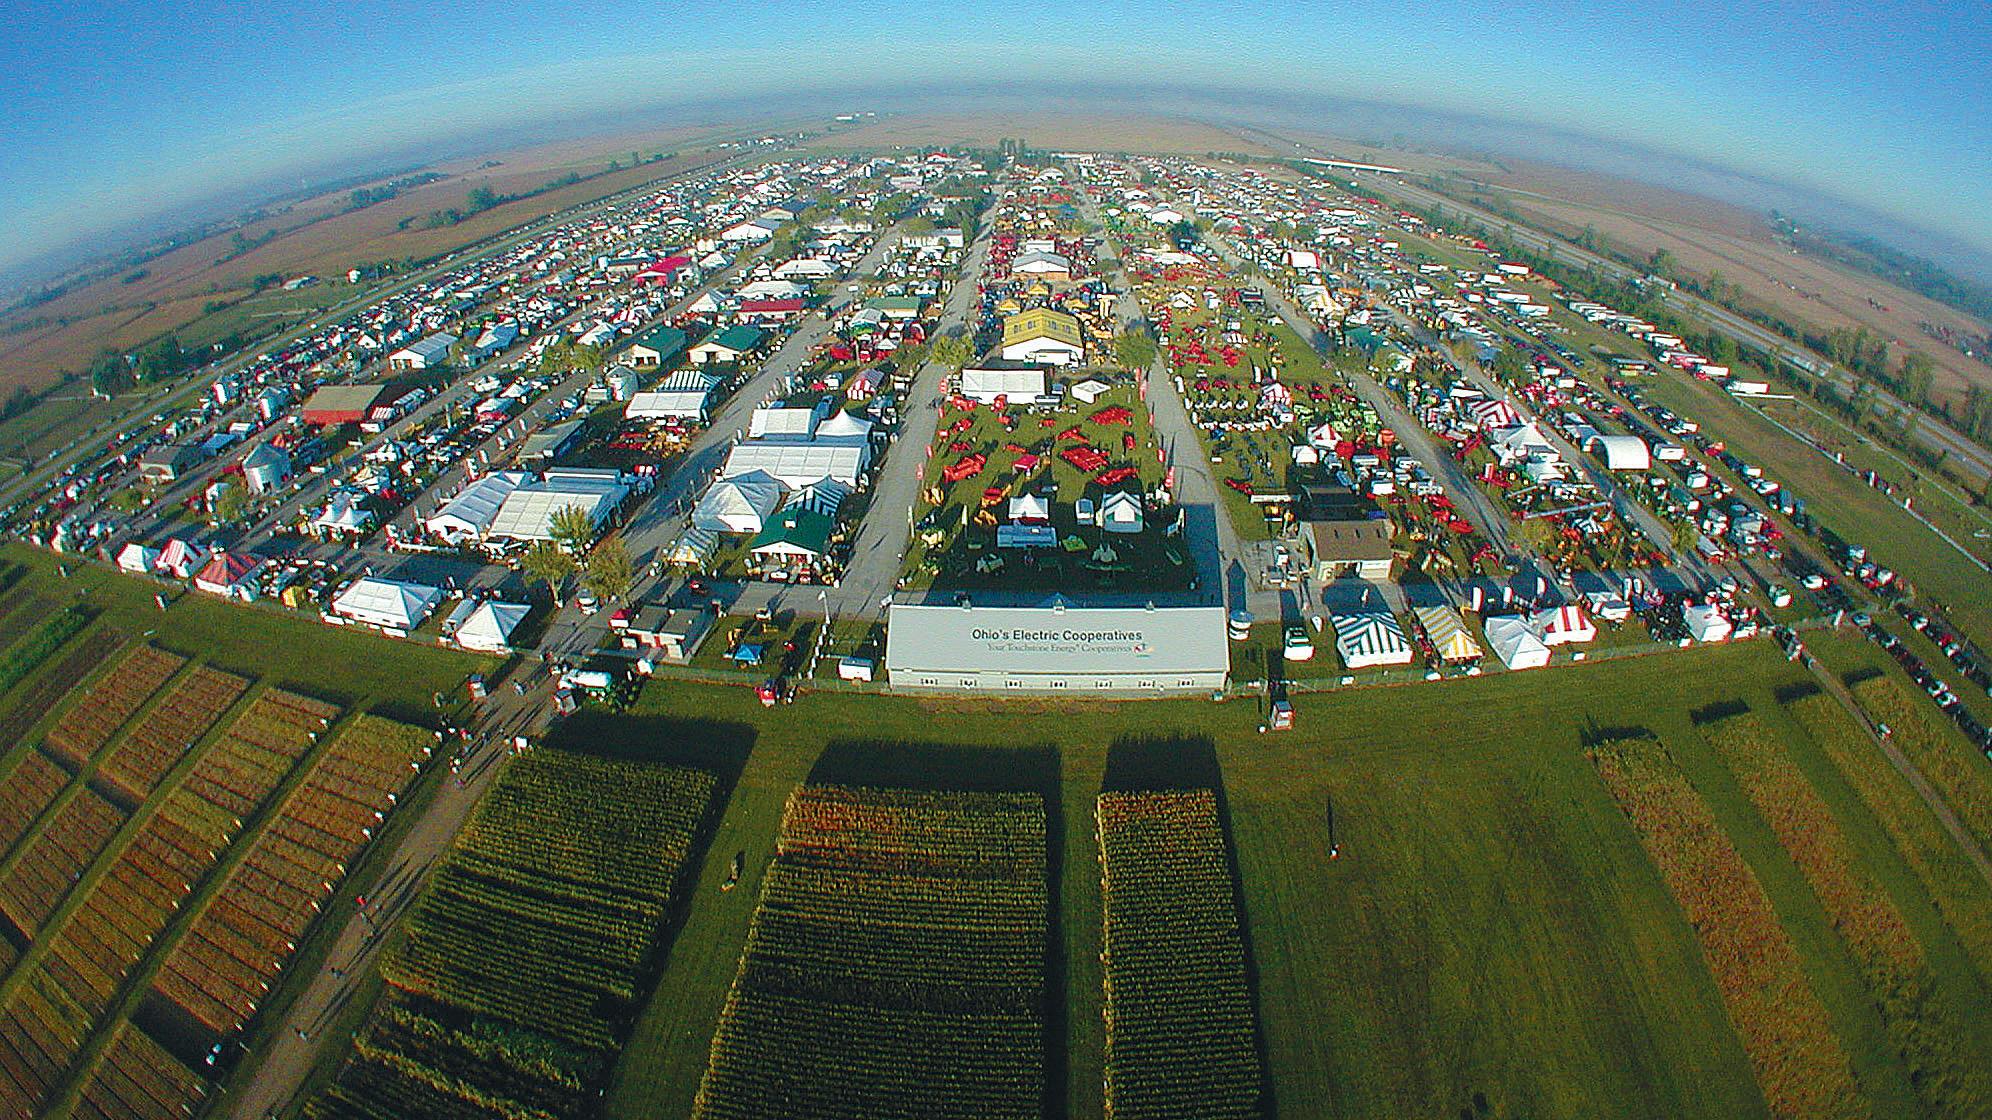
For 2021, eFields soybean research was focused on improving the production and profitability of soybeans in the greater Ohio area. Some exciting and innovating projects were executed this year, with 43 studies being conducted across the state. 2021 soybean research presented in eFields covers both precision seeding and compaction management. Below are highlights of the 2021 eFields soybean research:
43 soybean studies 1,754 acres
For more soybean research from Ohio State University Extension, explore the following resources:
The purpose of the Ohio Soybean Performance Trials is to evaluate soybean varieties for yield and other agronomic characteristics. This evaluation gives soybean producers comparative information for selecting the best varieties for their unique production systems. For more information visit: go.osu.edu/OhioSoybean.
The Agronomic Crops Team performs interesting research studies on a yearly basis. Resources, fact sheets, and articles on soybean research can be found here on the Agronomic Crops Team website: go.osu.edu/ CropsTeamSoybean.
The Ohio State Digital Ag Program conducts studies related to all aspects of the soybean production cycle. Research related to soybean planting, inputs, and harvesting technology can be found on the Digital Ag website: digitalag.osu.edu.


For all soybean studies in this eFields report, we define soybean growth stages as the following:
VE - Emergence - Cotyledons appear above the soil surface and provide nutrients for 7 to 10 days.
VC - Cotyledons have fully expanded and unifoliate leaves have unfolded.
V1 - First Trifoliate: Second true node, first node at which a trifoliate leaf is produced. Nodules visible.
V2 - Two fully developed trifoliates unfolded. The plant is roughly 8 in. tall. Nodules are actively fixing nitrogen. Cotyledons have fallen off plant.
V3 - V4 - A dramatic increase in the number of nodules visible on roots takes place by these stages.
V5 - VN - Lateral roots extend 15 in. away from main stem and grow to the center of 30 in. rows. Branches begin developing on the lowest nodes. Total number of nodes the plant may produce is set at V5.
R1 - Beginning Bloom - one flower is open at any node on the main stem.
R2 - Full Bloom - An open flower at one of the two uppermost nodes of the main stem with a fully developed leaf.
R3 - Beginning Pod - Pods are 3/16 in. long at one of the four uppermost nodes on the main stem.
R4 - Full Pod - Pod is 3/4 in. long at one of the four uppermost nodes on the main stem. This the most critical period for seed yield.
R5 - Beginning Seed - Seed in one of the four uppermost nodes with fully developed leaves is 1/8 in. long.
R6 - Full Seed - Pod containing a green seed filling the pod cavity is present at one of the top four nodes.
R7 - Beginning Maturity - One normal pod on the main stem has reached its mature pod color
R8 - Full Maturity - Ninety-five percent of the pods on the plant have reached their mature color Approximately 5 to 10 days of good drying weather is needed to bring crop to less than 15% moisture. Image Source: University of Illinois Agronomy Guide, 1999.
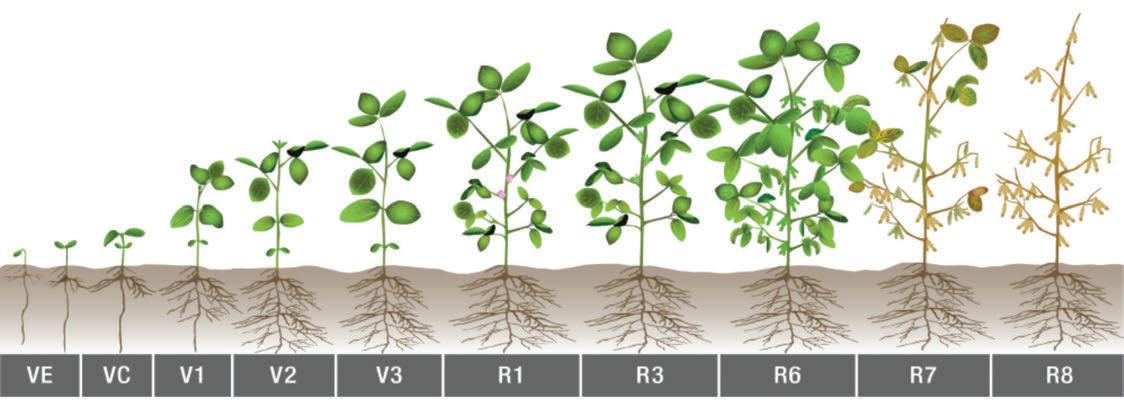
Understand the economically viable seeding rate of double cropped soybeans to determine the optium rate in a high priced commodity scenario.
Planting Date 7/7/2021
Harvest Date 11/8/2021
VarietyBeck's 3546
Population See Treatments
Acres9
Treatments3
Reps3
Treatment Width40 ft.
Tillage No-Till
Management Herbicide
Previous CropWheat
Row Spacing 15 in.
Soil Type Crosby Silt Loam, 46% Kokomo Silty Clay Loam, 38%
Miamian-Lewisburg Silt Loams, 16%
The primary recommendations for seeding rates in Ohio are determined by target final stands and average soil productivity. Variable rate seeding prescriptions have the potential to better match seeding rate to productivity zones in an effort to optimize profits. Field studies were implemented in a strip trial format and replicated at least three times with the fields.


OSU Extension
Pickaway County
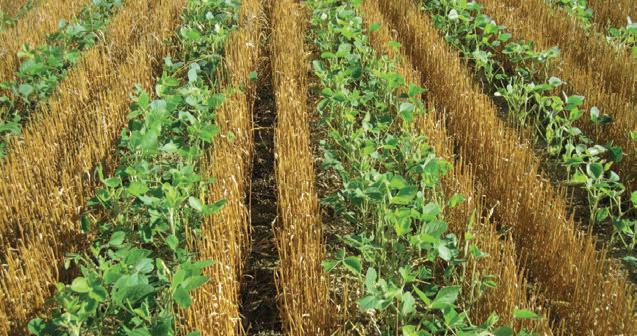
The objective of this study was to evaluate a standard double crop seeding rate and compare it to a lower and higher rate. The standard system of 250,000 seeds per acre was compared to a 200,000 and 300,000 rate. There was no significant difference in yield between the three seeding rates.
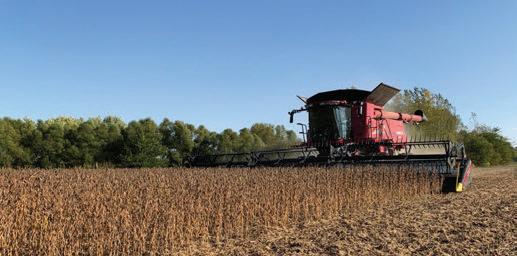
• Very limited amounts of rainfall. Not one single event in excess of 1 inch but a series of smaller rainfalls.
• Growing season was extended far into October because of the lack of a killing frost.
• The 250,000 population resulted in a $15 advantage on the 200,000 population and an overall profit of $30/ac.
• In this high priced commodity scenario 300,000 population resulted in a negative net revenue of $31/ac compared to the 200,000 population .
Treatment Means with the same letter are not significantly different according to Fisher’s Protected Least Significant Differences (LSD) test at alpha = 0.1. LSD: 3.4
3.8%

Ohioline Factsheet links for referance material on double-cropping soybeans. For inquiries about this project, contact Mike Estadt (estadt.3@osu.edu).
Understand the economically viable seeding rate of double cropped soybeans to determine the optium rate in a high-priced commodity scenario.
Planting Date 7/6/2021
Harvest Date 11/8/2021
Variety Channel 3222RXF
Population See Treatments
Acres20
Treatments3
Reps4
Treatment Width30 ft.
Tillage No-Till
Management Fertilizer. Herbicide
Previous CropWheat
Row Spacing 15 in.
Soil Type Rush Silt Loam, 100%


OSU Extension Tuscarawas County
The primary recommendations for seeding rates in Ohio are determined by target final stands and average soil productivity. Variable rate seeding prescriptions have the potential to better match seeding rate to productivity zones in an effort to optimize profits. Field studies were implemented in a strip-trial format and replicated at least three times with the fields.
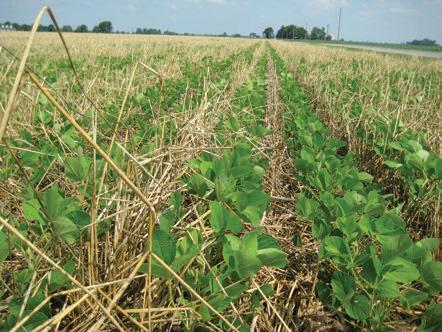
Soybeans were able to planted in early July.
Timely rains during the growing season aided in soybean growth and development. There were no visible signs of disease, insect, or weed pressure in this plot.

• Double-crop soybeans in this trial had an exceptional yield.
• While not significant, the lowest seeding rate resulted in the highest yield.
• Further study is needed to evaluate and determine the optimum seeding rate for soybeans following wheat.
• An economic analysis to determine the return above seed cost ranged from a low of $446 per acre to a high of $513 per acre.
• The 200,000 seeding rate achieved the highest return above seed cost.
Treatment Means with the same letter are not significantly different according to Fisher’s Protected Least Significant Differences (LSD) test at alpha = 0.1.
The Ohio Agronomy Guide provides information to help monitor plant health through the season.
LSD: 1.9
CV: 2.9%
For inquiries about this project, contact Chris Zoller (zoller.1@osu.edu).
Measure soybean yield response to foliar fungicide applications.
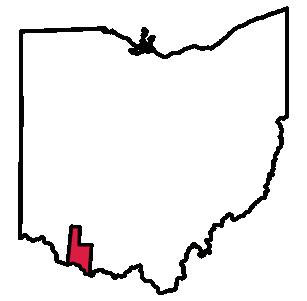
Planting Date 5/17/2021
Harvest Date 10/12/2021
Variety Pioneer 34T21SE
Population 103,000 sds/ac
Acres12
Treatments3
Reps3
Treatment Width80 ft.
Tillage No-Till
Management Fertilizer, Fungicide, Herbicide
Previous CropCorn
Row Spacing 15 in.
Soil Type Westboro-Schaffer Silt Loams, 54%
Jonesboro-Rossmoyne
Silt Loams, 40%
Clermont Silt Loam, 4%
Experiment was a complete randomized block design with 3 treatments and 3 replications. Treatment width was 80 feet and plot length was 300 feet. Zolera FX Fungicide was used at a rate 5.0 oz/acre. A 35 foot header was used to harvest the center 70 feet of each plot. Yields were recorded from each row using a calibrated yield moinitor.

OSU Extension
Brown County
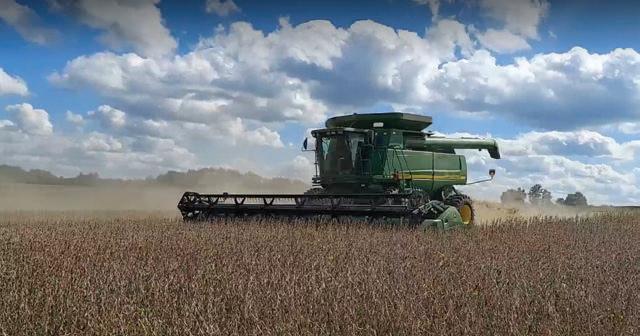
Harvest was completed in mid-October with a good stand but variable yield results.
The field showed no signs of insect pressure over economic thresholds. Light pressure from frogeye leaf spot was present in the control. Populations were lower than anticpated within this field and the control did average the lowest population among the 3 treatments. No significant plant health or size differences were observed.
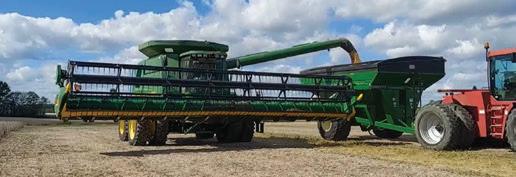
• Overall, the stand health was good but yield results lead us to believe that there was likely some disease pressure that was overlooked.
• We did observe some light pressure from frogeye leaf spot within the control.
• The control yield average was 15.3 bushels/ acre lower than the first application treatment and 11.3 bushels/acre lower than the second application treatment.
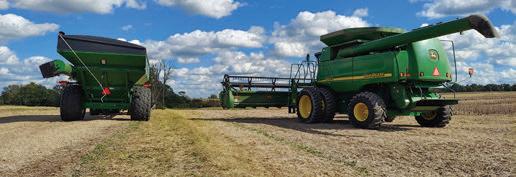
Treatment Means with the same letter are not significantly different according to Fisher’s Protected Least Significant Differences (LSD) test at alpha = 0.1.
RoGator 844
This sprayer was used to apply all fungicide treatments for this study. The 80 foot boom provided optimum treatment width to be harvested by a 35 foot combine header.
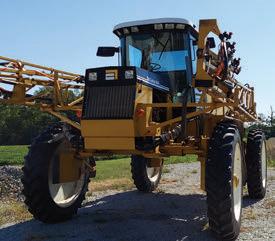
For inquiries about this project, contact James Morris (morris.1677@osu.edu).
Determine soybean yield response to foliar fungicide.

Planting Date 5/21/2021
Harvest Date 10/20/2021
VarietyAgrigold G3630XF
Population 160,000 sds/ac
Acres 172
Treatments2
Reps4
Treatment Width40 ft.
TillageMinimum
Management Fertilizer, Fungicide, Herbicide, Insecticide
Previous CropCorn
Row Spacing 15 in.
Soil Type Genesee Silt Loam, 64% Stonelick Loam, 43%
Two fungicide strips were randomized and replicated four times across the field. Soybeans were sprayed at late R3 stage. Sprayer strips were 120 feet wide and center 40 feet of each strip was harvested for yield data.

OSU Extension
Pike County

The soybeans remained in good condition throughout the growing season.
There was no foliar diseases at the time of application or before leaf drop. The soybeans were in good condition through the time of the fungicide application.
• There was no statistical difference between the two fungicide products when measured by yield.

Treatment Means with the same letter are not significantly different according to Fisher’s Protected Least Significant Differences (LSD) test at alpha = 0.1.
Modern Sprayer
Today’s sprayers allow for very accurate applications including turning individual nozzles on and off based upon previously sprayed areas.
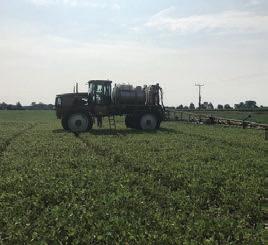
For inquiries about this project, contact Will Hamman (william.hamman@basf.com).
Assess the effectiveness of a sole fungicide application and a fungicideinsecticide mixture.
Planting Date 5/24/2021
Harvest Date 10/20/2021
Variety Beck's 3082FP
Population See Treatments
Acres30
Treatments3
Reps3
Treatment Width40 ft.
Tillage No-Till
Management Fungicide, Herbicide, Insecticide
Previous CropCorn
Row Spacing 15 in.
Soil Type Crosby Silt Loam, 60% Celina Silt Loam, 21% Brookston Silty Clay Loam, 17%
The experimental design was a randomized complete block design. There were three replications and three treatments, a control, fungicide, and a fungicide/insecticide mixture. The plots were 35 feet wide and field length. The yield and moisture was measured with the combine yield monitor.


OSU Extension Darke County
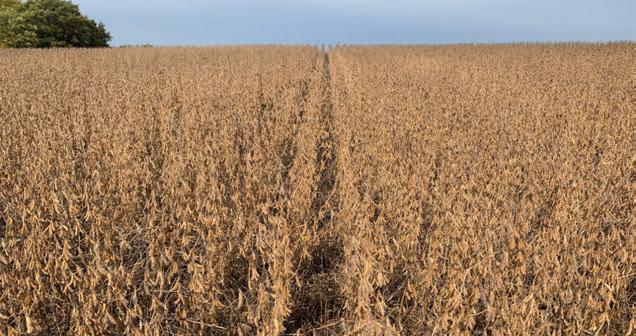
Soybeans before harvest in October.
The field that housed this plot got sufficient rainfall but was not on the top ground in the county. Disease issues did not appear until later into the season.
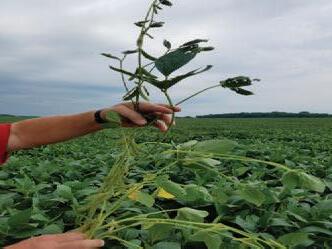
• The treatment with both fungicide and insecticide had both the highest yield and was also significantly different than both other treatments.
• This suggests that there was more insect than disease pressure at the end of the season in this field.
• As seen, most chemicals cause a yield difference when the disease or pest is present.
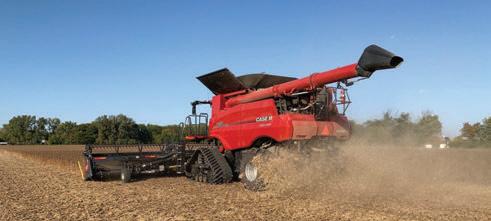
Treatment Means with the same letter are not significantly different according to Fisher’s Protected Least Significant Differences (LSD) test at alpha = 0.1.

For inquiries about this project, contact Taylor Dill (dill.138@osu.edu).
Study individual row downforce on soybeans and how that effects emergence as well as final yield.
Planting Date 5/31/2021
Harvest Date 10/15/2021
Variety Beck's 3992FP
Population 140,000 sds/ac
Acres100
Treatments 5 Reps9
Treatment Width40 ft.
Tillage Vertical
Management Fungicide, Herbicide, Insecticide
Previous CropCorn
Row Spacing 15 in.
Soil Type Genesse Silt Loam, 53% Ross Silt Loam, 42%


OSU Extension
Pickaway County
There have often been many questions about spring vs pneumatic vs hydraulic downforce and the potential ROI on each system. Although corn continues to be the main focus across the Midwest, we wanted to see if there was a benefit to utilizing DeltaForce on soybeans as well. To test this hydraulic cylinders in a constant pressure to simulate springs set to standard settings that surveyed growers use in a light and a heavy application were used. Additionally, this planter was equipped with wing downforce to help distribute weight and keep the planter level during operation.

Preparing to plant the hydraulic downforce trial.
During planting, field conditions were wet to slightly tacky. There was very little disease and weed pressure present in the crop during the growing season.
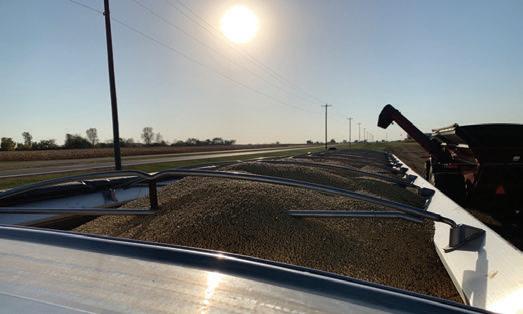
• There were statistically significant differences between treatments.
• It was noticed during field operations that heavy auto would have performed the best for the given field operations.

Treatment Means with the same letter are not significantly different according to Fisher’s Protected Least Significant Differences (LSD) test at alpha = 0.1.
vDrive from Precision Planting
vDrive is a maintenance-free electric drive system, simplifying your planter. A vDrive motor mounts to each vSet meter and makes that row a single row planter, because that row is controlled individually.
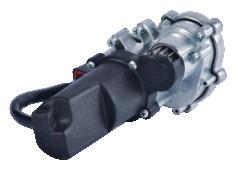
For inquiries about this project, contact Andrew Klopfenstein (klopfenstein.34@ osu.edu).
Research the effects tillage vs no-till has on seed emergance, crop growth, and yield.
Planting Date 5/24/2021
Harvest Date 11/8/2021
VarietyBiogene BG9370E3
Population 161,000 sds/ac
Acres 5
Treatments2
Reps10
Treatment Width40 ft.
TillageMinimum
Management Fertilizer, Herbicide
Previous CropCorn
Row Spacing 15 in.
Soil Type Loudon Silt Loam, 76%
Westboro-Schaffer Silt Loams, 23%
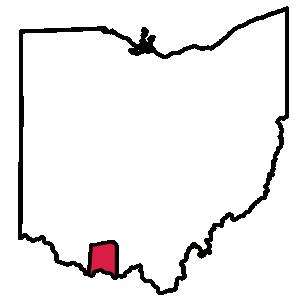

OSU Extension
Adams County
Growing Season Weather Summary
With more producers in Adams County changing tillage practices from conventional tillage to conservation tillage practices, this trial will be conducted to show the effects of no-till vs tillage on soybean emergance, growth, and yield. Trials will be replicated 5 times and have two treatments that consist of tillage with 3 passes with a disk and no-till. The same fertilizer, pesticide, and seed variety was used across the whole plot. Stand counts will be made 2 weeks after planting and again prior to harvest. Crop growth will be monitored throughout the growing season. Yield will be calculated during harvest.
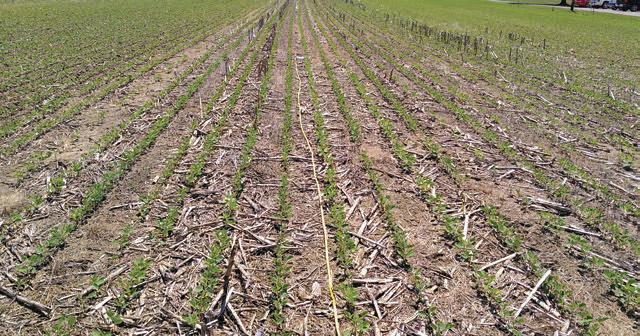
No-till plot early in the growing season.
During the growing season mutiple growth observations between treatments were recorded. Germination rate was higher in the tillage treatments vs. the no-tillage treatment. The weather throughout the growing season was very favorable for growth and reproduction. Yield estimates and growth evaluations were made in midAugust. During evaluations the tillage treatment has slightly higher estimated yields compared to the no-till treatment. Harvest moisture, test weight, and standibility was also very similar between treatments.
• The tillage plot incured $15.70/ac in extra expenses.
• After cost of production, the tillage still averaged a $42.25/ac above the no-till plot.

Treatment Means with the same letter are not significantly different according to Fisher’s Protected Least Significant Differences (LSD) test at alpha = 0.1.
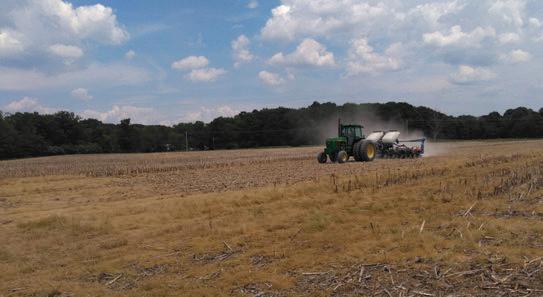
For inquiries about this project, contact Richard Purdin (purdin.19@osu.edu).
Increase yields with a foliar treatment of NKB at 1 qt/acre and a PGR applied at 3 oz/ac applied as an additional pass at R4.
Planting Date 5/12/2021
Harvest Date 9/29/2021
Variety Channel 3108XF
Population 175,000 sds/ac
Acres 54
Treatments1 Reps4
Treatment Width90 ft.
Tillage No-Till
Management Fertilizer
Previous Crop Soybeans
Row Spacing 15 in.
Soil Type Pewamo Silty Clay Loam, 54%
Blount Silt Loam, 45%
Research if a foliar applied potash 16%, Boron 2.5% and Nitrogen 2% as well as a PGR will gain an increase in yield. This trial had 2 treatments, a control, and a soluble potash product combined with a plant growth regulator product at the same time. This potash product was applied at a rate of 1 qt/ac and it contains 16% of soluble potash as well as 2.5% of Boron and 2% Nitrogen. The plant growth regulator product was applied at 3 oz. per acre. All products were applied at growth stage R4 as an additional pass to the field. These treatments were replicated 10 times across the field for a total of 37.6 acres.


OSU Extension
Morrow County
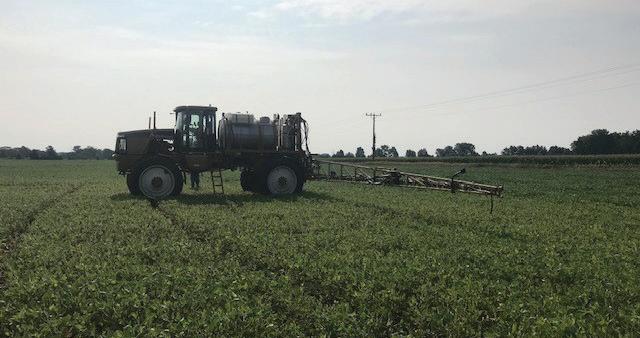
Applying foliar fertilizer treatments.
Spraying the foliar applications of Homestretch NKB did not make an over all difference in the field and did not give us a yield bump.
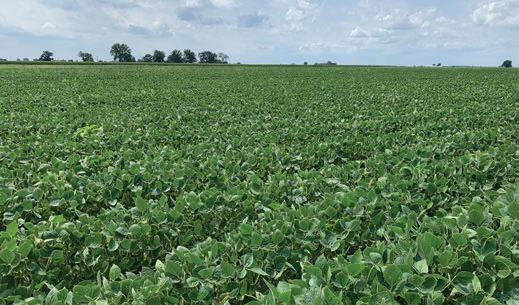
• The averages for the control treatments were 52 bu/ac.
• The average for the treated area was 52 bu/ac.
• Given the variability in each the treatments in this trail these results are not statistically significant.
Treatment Means with the same letter are not significantly different according to Fisher’s Protected Least Significant Differences (LSD) test at alpha = 0.1.
YouTube link to video featuring a partner farmer who conducted a foliar fertilizer treatment study.

For inquiries about this project, contact Carri Jagger (jagger.6@osu.edu).
Evaluate a standard soybean production system compared to an enhanced soybean production system.
Planting Date 4/19/2021
Harvest Date 11/15/2021
VarietySpecialty 3703XF
Population See Treatments
Acres 78
Treatments2
Reps3
Treatment Width80 ft.
Tillage No-Till
Management Fertilizer, Fungicide, Herbicide, Insecticide
Previous CropCorn
Row Spacing 15 in.
Soil Type Blount Silt Loam, 60% Pewamo Silty Clay Loam 35% Haskins Loam, 6%
This study was organized as a randomized complete block design with three replications of treatments. Treatments included:
1) Standard production system
a. Soybeans planted in mid-to late May
b. Seeding rate of 160,000 seeds/acre
2) Enhanced production system
a. Soybeans planted in late April to mid-May
b. Seeding rate of 130,000 seeds/acre
c. Foliar fungicide and insecticide application at the R3 growth stage


OSU Extension
Auglaize County

Soybeans in the middle of the season.
This field received a late snow covering in April of 4 inches. The stand counts indicated that the snow and cold reduced the emergence of the planting. The early planting emergence averaged 135,000 plants, and the standard planting averaged 180,000.
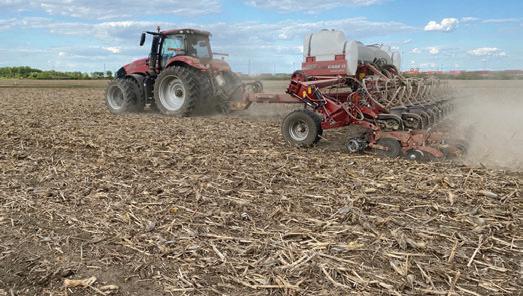
• Weather events following the early planting date led to a significant difference in yield between the two planting dates.
• Snow following planting led to a reduced stand in the early planting date.
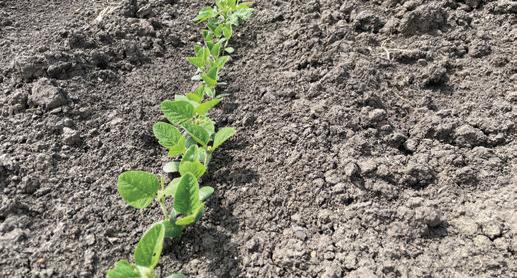
Enhanced (Early Plant, Low Seeding Rate, Fungicide and Insecticide)
(Late Planting, High Seeding Rate)
Treatment Means with the same letter are not significantly different according to Fisher’s Protected Least Significant Differences (LSD) test at alpha = 0.1.
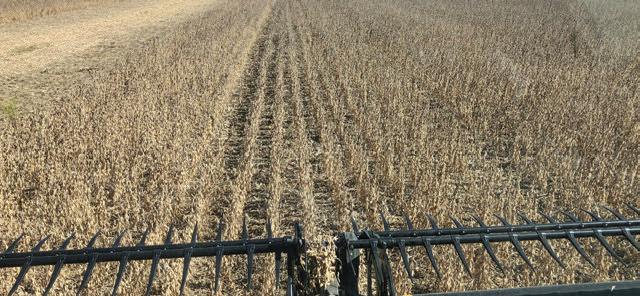
For inquiries about this project, contact Jamie Hampton (hampton.297@osu.edu).
Evaluate a standard soybean production system compared to an enhanced soybean production system.
Planting Date 4/17/21 & 5/15/21
Harvest Date 11/7/2021
VarietyPioneer 33A95BX
Population See Treatments
Acres80
Treatments2
Reps3
Treatment Width60 ft.
Tillage No-Till
Management Fungicide, Herbicide
Previous CropCorn
Row Spacing 15 in.
Soil Type Celina Silt Loam, 59% Kokomo Silty Clay Loam, 40%
This study was organized as a randomized complete block design with three replications of treatments. Treatments included:
1) Standard production system
a. Soybeans planted in mid to late May
b. Seeding rate of 160,000 seeds/acre
2) Enhanced production system
a. Soybeans planted in late April to mid-May
b. Seeding rate of 130,000 seeds/acre
c. Foliar fungicide and insecticide application at the R3 growth stage


OSU Extension
Clark County
Both treatments had similar yields for this year's study.
OBSERVATIONS
Disease and insect pressure were minimal. Early planted soybeans could have developed slowly in April and May due to cooler than normal conditions.
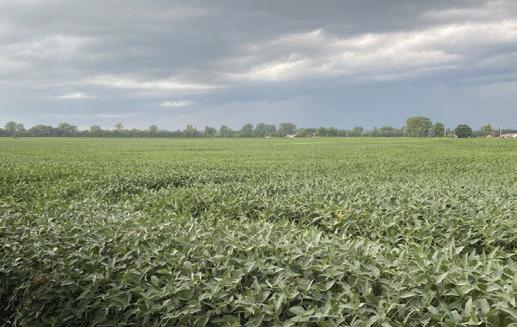
(Early Plant, Low Seeding Rate, Fungicide and Insecticide)
• There was no statistical difference in yields between the systems observed at harvest this year.
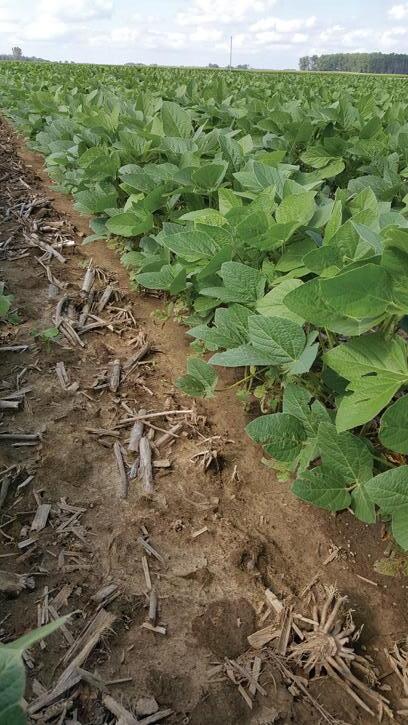
Treatment Means with the same letter are not significantly different according to Fisher’s Protected Least Significant Differences (LSD) test at alpha = 0.1.
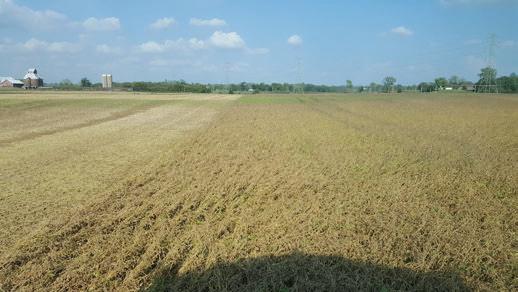
For inquiries about this project, contact Mary Griffith or Laura Lindsey (lindsey.233@osu.edu).
Evaluate a standard soybean production system compared to an enhanced soybean production system.
Planting Date 5/19/2021 & 6/7/2021
Harvest Date 11/5/2021
Variety Pioneer P31T64E
Population See Treatments
Acres34
Treatments2
Reps6
Treatment Width40 ft.
Tillage No-Till
Management Fungicide, Herbicide, Insecticide
Previous Crop Soybeans
Row Spacing 15 in.
Soil Type Chili Loam, 86%
Watertown Sandy Loam, 13%
This study was organized as a randomized complete block design with three replications of treatments. Treatments included:
1) Standard production system
a. Soybeans planted in mid to late May
b. Seeding rate of 160,000 seeds/acre
2) Enhanced production system
a. Soybeans planted in late April to mid-May
b. Seeding rate of 130,000 seeds/acre
c. Foliar fungicide and insecticide application at the R3 growth stage
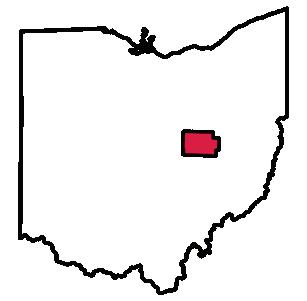

OSU Extension Coshocton County
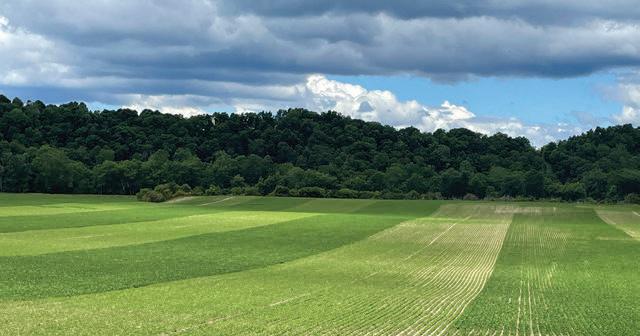
Two plots side-by-side with the standard and enhanced production systems.
The spring of 2021 was challenging for research trials due to excessive rain. However, we were able to plant the first trial on May 19 and were able to 19 days later (planted 2 days early as rain was back in forecast). The average stand count for the early plant trial was 116,222 plants per acre (130,000 seeds planted) and 144,333 plants per acre (160,000 seeds planted). Throughout the summer, plant growth was monitored for any potential treatment differences. No significant disease or insect pressures were obstereved. Drier weather during July and August most likely reduced yield.
• The enhanced system planted at 130,000 seeds per acre with a foliar and insecticide application targeted for R3 growth stage was compared to the standard system planted 3 weeks later at 160,000 seeds per acre with no foliar treatement.
• At harvest, there was no significant difference in yield between the two systems.
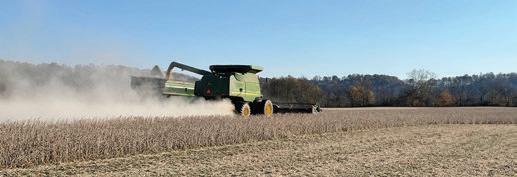
(Early Plant, Low Seeding Rate, Fungicide and Insecticide)
Treatment Means with the same letter are not significantly different according to Fisher’s Protected Least Significant Differences (LSD) test at alpha = 0.1.

For inquiries about this project, contact David Marrison (marrison.2@osu.edu)
Evaluate a standard soybean production system compared to an enhanced soybean production system.
Planting Date 4/19/2021 & 5/14/2021
Harvest Date 9/28/2021
VarietyGolden Harvest 32A24
Population See Treatments
Acres90
Treatments2 Reps3
Treatment Width90 ft.
Tillage No-Till
Management Fertilizer, Fungicide, Insecticide, Herbicide
Previous CropCorn
Row Spacing 15 in.
Soil Type Miamian Silt Loam, 61% Brookston Silt Loam, 27%
This study was organized as a randomized complete block design with three replications of treatments. Treatments included:
1) Standard production system
a. Soybeans planted in mid to late May
b. Seeding rate of 160,000 seeds/acre
2) Enhanced production system
a. Soybeans planted in late April to mid-May
b. Seeding rate of 130,000 seeds/acre
c. Foliar fungicide and insecticide application at the R3 growth stage


OSU Extension Darke County
Growing Season Weather Summary
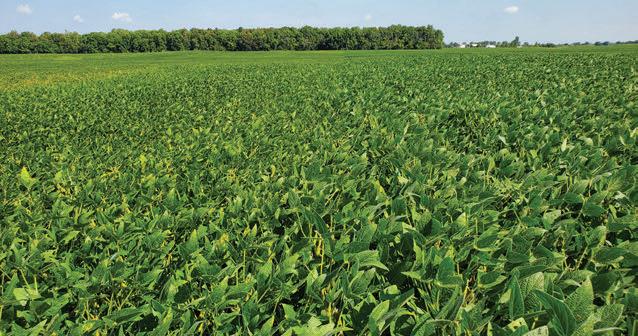
Soybeans that were planted earlier in the season continued to look consistent.
Delaro burned the leaves of the improved plots and gave SDS like symptoms. However, there was no yield drag based on these symptoms. The early planted soybeans also endured snow and 3 inch pounding rains less than one week after planting.
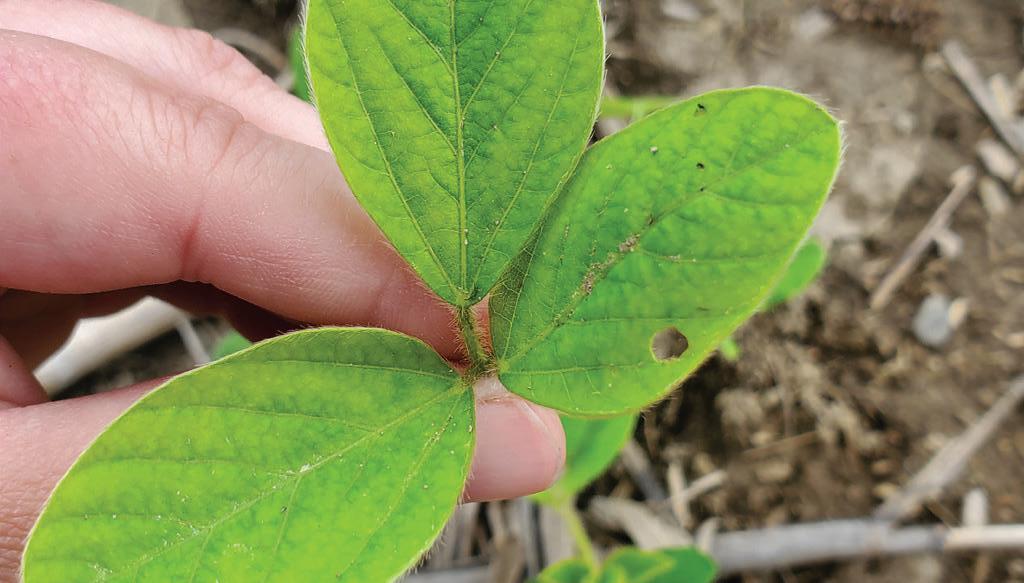
(Early Plant, Low Seeding Rate, Fungicide and Insecticide)
• There was no significant yield difference between either management system.
• Soybeans are versatile being able to emerge after snow and rain in earlier planted systems.
• Lower populations yield statistically similar to higher populations of soybeans.

Treatment Means with the same letter are not significantly different according to Fisher’s Protected Least Significant Differences (LSD) test at alpha = 0.1.
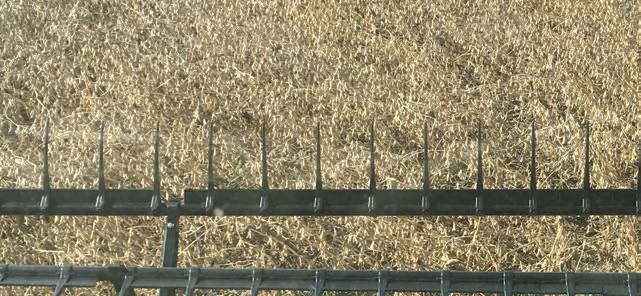
For inquiries about this project, contact Taylor Dill (dill.138@osu.edu).
Evaluate a standard soybean production system compared to an enhanced soybean production system.
Planting Date 4/19/2021 & 5/21/2021
Harvest Date 10/19/2021
Variety Proharvest 36X11
Population See Treatments
Acres30
Treatments2
Reps4
Treatment Width60 ft.
Tillage No-Till
Management Fertilizer, Fungicide, Herbicide, Insecticide
Previous CropCorn
Row Spacing Twin Row, 30 in.
Soil Type Pewamo Silty Clay Loam, 49%
Blount Silt Loam, 36%
Minster Silty Loam, 15%
This study was organized as a randomized complete block design with three replications of treatments. Treatments included:
1) Standard production system
a. Soybeans planted in mid to late May
b. Seeding rate of 160,000 seeds/acre
2) Enhanced production system
a. Soybeans planted in late April to mid-May
b. Seeding rate of 130,000 seeds/acre
c. Foliar fungicide and insecticide application at the R3 growth stage


eFields
OSU Extension Darke County
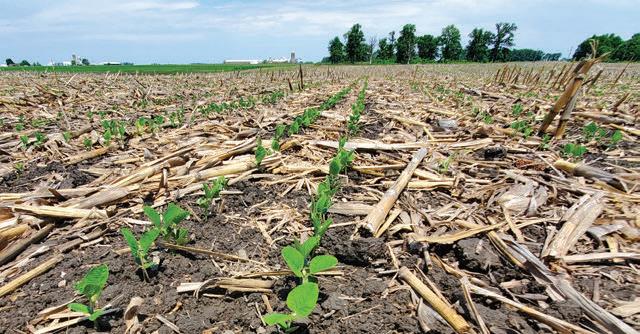
This field endured heavy bean leaf beetle feeding in the early planted plots, as well as some intense weed pressure in one plot. Though the rest of the season there was adequate rainfall and little disease pressure.
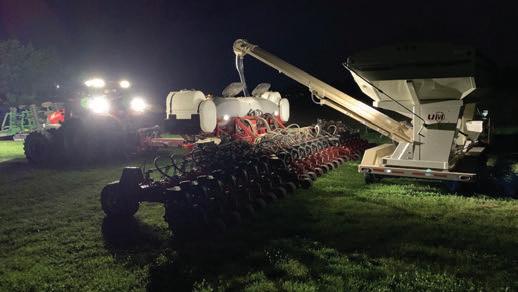
• There was no significant yield difference between either management system.
• Soybeans are versatile being able to emerge after snow and rain in earlier planted systems.
• Lower populations yield statistically similar to higher populations of soybeans.
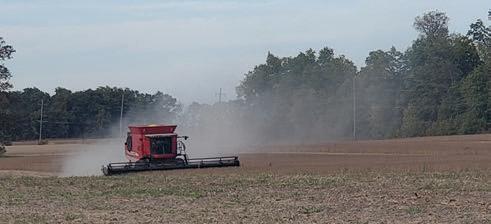
(Early Plant, Low Seeding Rate, Fungicide and Insecticide)
9.4
Treatment Means with the same letter are not significantly different according to Fisher’s Protected Least Significant Differences (LSD) test at alpha = 0.1.

For inquiries about this project, contact Taylor Dill (dill.138@osu.edu).
Evaluate a standard soybean production system compared to an enhanced soybean production system.
Planting Date 4/27/2021 & 5/27/2021
Harvest Date 11/5/2021
Variety Golden Harvest 3582 E3
Population See Treatments
Acres 65
Treatments2
Reps3
Treatment Width60 ft.
Tillage No-Till
Management Fungicide, Herbicide, Insecticide
Previous CropCorn
Row Spacing 15 in.
Soil Type Crosby Silt Loam, 77% Brookston Silty Clay Loam, 23%
This study was organized as a randomized complete block design with three replications of treatments. Treatments included:
1) Standard production system
a. Soybeans planted in mid to late May
b. Seeding rate of 160,000 seeds/acre
2) Enhanced production system
a. Soybeans planted in late April to mid-May
b. Seeding rate of 130,000 seeds/acre
c. Foliar fungicide and insecticide application at the R3 growth stage


OSU Extension Darke County
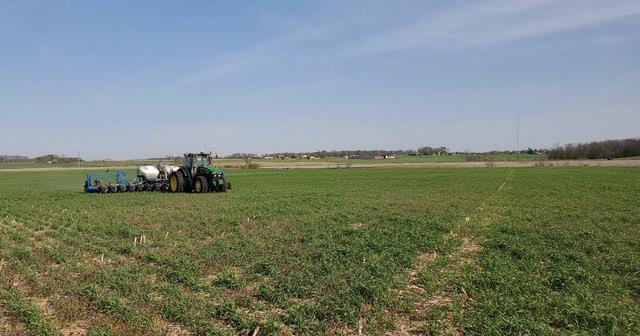
Planting into a rye cover crop.
Populations in this study were thin in both treatments in comparison to seeding rate. This study was seeded into a rye cover crop that was planted into corn stuble. The thin population may have been due to the fodder left in the field.

• There was no significant yield difference between either management system.
• Soybeans are versatile being able to yield statistically similar between low and high populations.
• Darke county faced a wet spring and early planted soybeans endured wet conditions.

(Early Plant, Low Seeding Rate, Fungicide and Insecticide)
Treatment Means with the same letter are not significantly different according to Fisher’s Protected Least Significant Differences (LSD) test at alpha = 0.1.
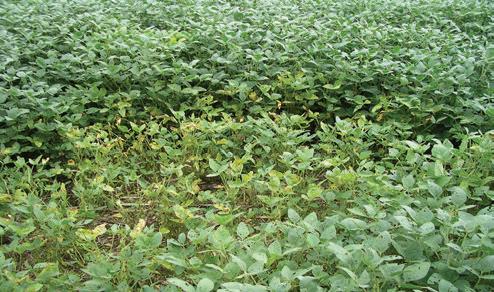
For inquiries about this project, contact Taylor Dill (dill.138@osu.edu).
Evaluate a standard soybean production system compared to an enhanced soybean production system.
Planting Date 4/26/2021 & 5/24/2021
Harvest Date 9/30/2021
Variety Beck's 3082FP
Population See Treatments
Acres100
Treatments2 Reps4
Treatment Width40 ft.
Tillage No-Till
Management Fungicide, Herbicide, Insecticide
Previous CropCorn
Row Spacing 15 in.
Soil Type Crosby Silt Loam, 61%
Celina Silt Loam, 19%
Brookston Silty Clay Loam, 18%
This study was organized as a randomized complete block design with three replications of treatments. Treatments included:
1) Standard production system
a. Soybeans planted in mid to late May
b. Seeding rate of 160,000 seeds/acre
2) Enhanced production system
a. Soybeans planted in late April to mid-May
b. Seeding rate of 130,000 seeds/acre
c. Foliar fungicide and insecticide application at the R3 growth stage


OSU Extension Darke County
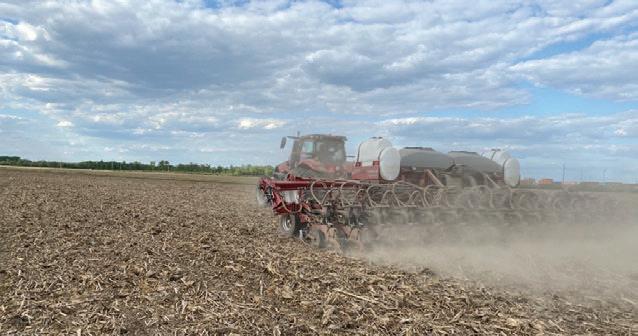
Emergence and stand were not a concern for this study after planting.
Emergence and stand in this study was not an issue but was placed in a low spot in the field. There was water damage in this study, however, the damage was even throughout. There was little to no disease pressure and moderate insect pressure early on with bean leaf beetle.
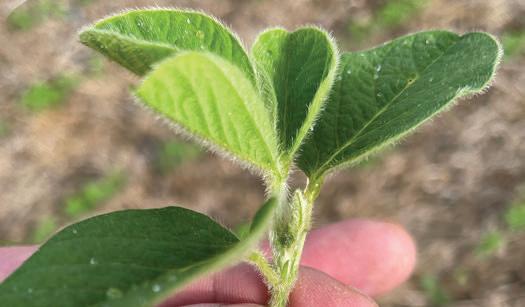
(Early Plant, Low Seeding Rate, Fungicide and Insecticide)
• There was no significant yield difference between either management system.
• Soybeans are versatile being able to yield statistically similar between low and high populations.
• Darke county faced a wet spring and early planted soybeans endured wet conditions.
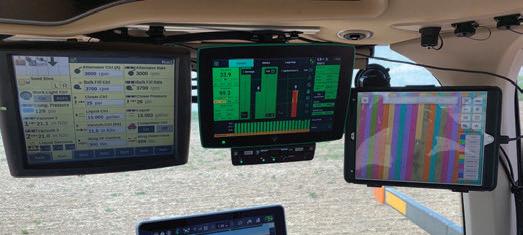
Treatment Means with the same letter are not significantly different according to Fisher’s Protected Least Significant Differences (LSD) test at alpha = 0.1.
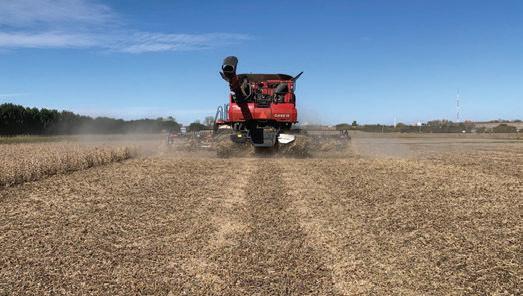
For inquiries about this project, contact Taylor Dill (dill.138@osu.edu).
Evaluate the effect of planter speed on soybean emergence and yield.

Planting Date 4/28/2021
Harvest Date 10/10/2021
VarietyBeck's 3665XF
Population 130,000 sds/ac
Acres102
Treatments4
Reps4
Treatment Width60 ft.
Tillage Vertical
Management Fertilizer, Fungicide, Herbicide, Insecticide
Previous CropCorn
Row Spacing30 in.
Soil Type Brookston Silty Clay Loam, 88%
Crosby Silt Loam, 12%
Four planting speeds were randomized and replicated four times across the field. A constant population rate was used across all plots. Data collection included stand counts for emergence evaluation, yield, and harvest moisture.

OSU Extension Union County
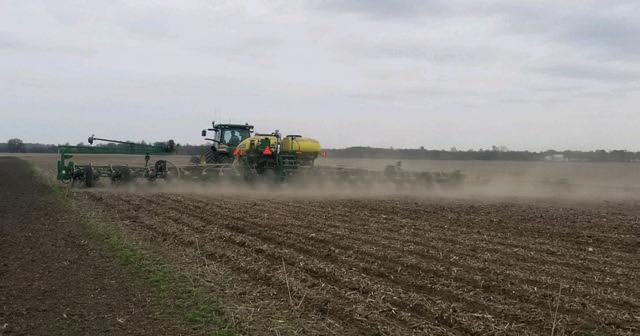
Conducting the high speed planting trial.
OBSERVATIONS
No differences were observed across all plots and treatments while collecting emergence data. The weather in the 2021 growing season was favorable in this part of the county.
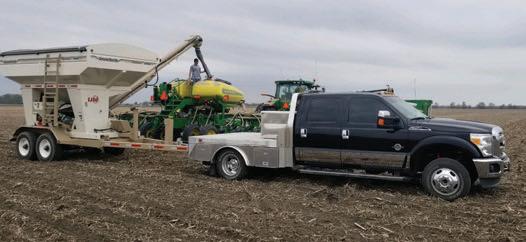
• No significant emergence or yield difference was measured across the four planting speed treatments.
• With this result, more acreage may be planted in less time using equipment to its fullest potential.
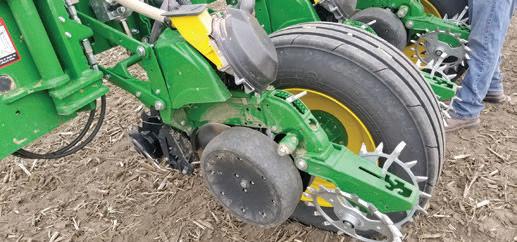
Treatment Means with the same letter are not significantly different according to Fisher’s Protected Least Significant Differences (LSD) test at alpha = 0.1.
John Deere 1775NT Planter
The John Deere 1775NT16 row planter was used for planting corn in 30 inch rows with ExactEmerge row units.
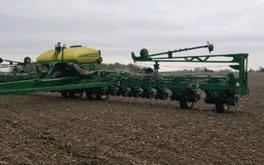
For inquiries about this project, contact Wayne Dellinger (dellinger.6@osu.edu).
Evaluate impact of rolling soybeans at planting and V1 to determine the impact stress can have on pod set.
Planting Date 4/28/2021
Harvest Date 10/20/2021
Variety Pioneer P26A10
Population 155,000 sds/ac
Acres4
Treatments3
Reps4
Treatment Width40 ft.
Tillage No-Till
Management Fertilizer, Fungicide, Herbicide
Previous CropCorn
Row Spacing 15 in.
Soil Type Fitchville Silt Loam, 37%
Haskins Loam, 37%
Sebring Silt Loam, 26%
This study included three treatments - no rolling, rolling at planting, and at V1. This was a randomized complete block design with four replicates for each treatment.
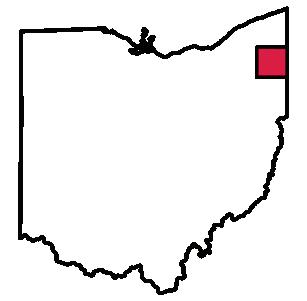

OSU Extension Trumbull County

Rolled on the right and no rolling on the left.
Planting conditions were favorable in late April, but a cold spell arrived in NE Ohio that stalled germination of the beans. Good growing conditions returned in the second week of May and the soybean stand recovered well. There was no difference between treatments in regards to emergence. Heavy rains in June and July stressed the beans, evidenced by a yellowing in some low lying areas of the field. One side of the research plot had poorer drainage and this resulted in lower yields compared to treatment plots on the opposite side. The farmer mentioned that header height can be lowered as the roller pushes rocks into the ground reducing the chance of picking up a rock into the combine. Since implementing rolling on the farm, combine downtime from rocks entering the combine has decreased. Personal stress of watching for rocks also has been reduced.
roller
A land roller can be used to roll beans at various stages.
• Rolling beans at various stages had no significant effect on yield of soybeans. Variability in the research plots can be attributed to weather conditions throughout the growing season. Benefits of rolling soybeans other than yield can not be ignored.
• This study is planned to continue in 2022 and will include soil health metrics.

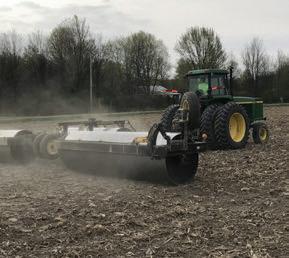
For inquiries about this project, contact Lee Beers (beers.66@osu.edu).
Determine if row cleaners had an effect on soybean population and establishment.
Planting Date 5/24/2021
Harvest Date 10/15/2021
VarietyBeck’s 2555XF
Population 151,000 sds/ac
Acres40
Treatments2
Reps12
Treatment Width 15 in.
Tillage No-Till
Management Herbicide
Previous CropCorn
Row Spacing 15 in.
Soil Type Latty Silty Clay, 89% Nappanee Silty Clay Loam, 11%


OSU Extension Paulding County
Soybeans were planted into standing rye. The study compared use of row cleaners with the absence of row cleaners when planting green. Row cleaners were installed on alternating rows of the planter. Stand counts were used to determine differences in emergence.
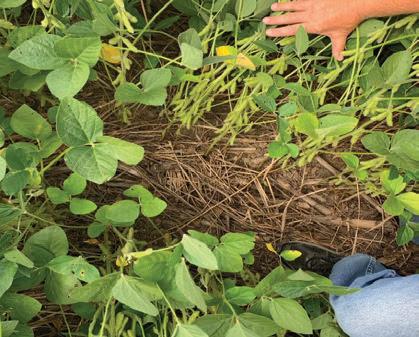
Even emergence through field residue.
Visually, the two treatments looked similar in terms of plant populations. However, after performing stand counts, we could see a difference between treatments.

Treatment Means with the same letter are not significantly different according to Fisher’s Protected Least Significant Differences (LSD) test at alpha = 0.1.
• Because row cleaners were in alternating rows, we weren’t able to collect yield data.
• The planter alternated rows of row cleaner and no row cleaner treatments.
• The plant population differences were statistically significant between the two treatments, with the no row cleaner treatment having a significantly higher population than the treatment with row cleaners.
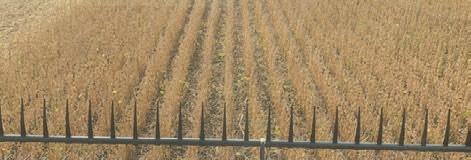
6,507
7.8%
Row cleaners
Row cleaners were used to move the standing rye out of the way of the planter track to improve seed-to-soil contact.
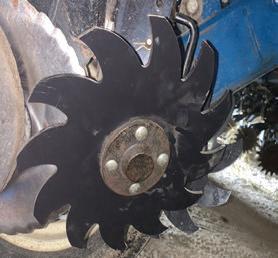
For inquiries about this project, contact Rachel Cochran (cochran.474@osu.edu) or Sarah Noggle (noggle.17@osu.edu).
Evaluate the yield as a function of 15, 20, and 30 inch soybean spacing.

Planting Date 5/14/2021
Harvest Date 11/7/2021
Variety Beck's 3992FP
Population 155,000 sds/ac
Acres 150
Treatments3
Reps4
Treatment Width120 ft.
Tillage Vertical
Management Fungicide, Herbicide, Insecticide
Previous CropCorn
Row SpacingSee study design
Soil Type Celina Silt Loam, 81% Miamian Silt Loam, 16%
The study was planted with a pair of Case IH 380 Magnum and 2140 planters. One planter was a 15 inch and the other was a 20 inch. After the 15 inch planter was used to complete all the 15 inch treatments, then every other row was lifted to plant the 30 inch strips. The planter was only filled with the necessary amount of seed for each treatment to reduce weight and keep the treatments as consistent as possible between the 15 inch and 30 inch. The tractors were also weighted and equipped the same. This was setup was a random block design negating the possibility of influence from the adjacent treatments.

OSU Extension
Pickaway County
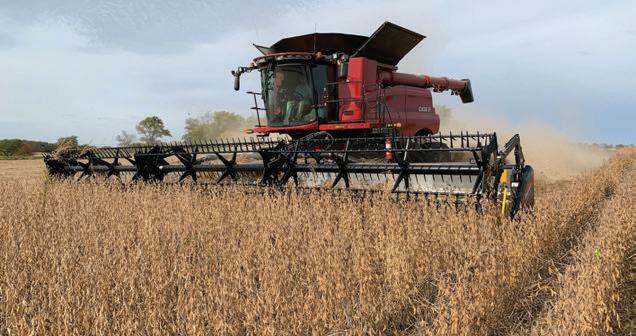
Harvesting the soybean row spacing trial.
This trial was planted into a vertical tilled, sprayed field. Notice that average emergence was lower than the target planted population. There were no yield limiting factors as sufficient rainfall was received.
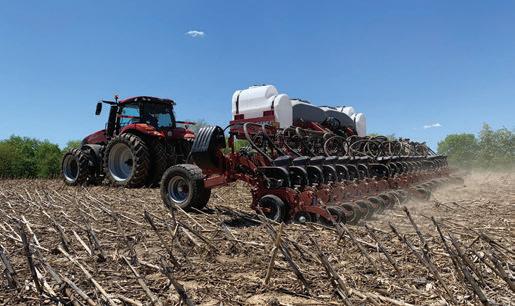
• A statistically significant difference in yield was observed between all treatments, with 30 inch beans outyielding the narrow rows.
• All treatments were virtually weed free.
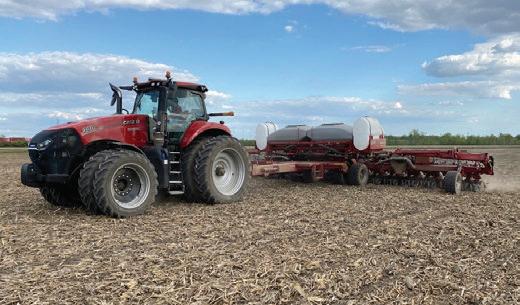
Treatment Means with the same letter are not significantly different according to Fisher’s Protected Least Significant Differences (LSD) test at alpha = 0.1.
Gerringhoff TrueFlex Razor
A 40 ft. head was used to harvest this trial. This head has a 3 section reel, as well as a 3 section frame which helps it harvest in challenging terrain. This head was also equipped with an integrated air system which is a blast of air behind the cutter bar that blows crop back into the header onto the gathering belts.
For inquiries about this project, contact Andrew Klopfenstein (klopfenstein.34@osu.edu).
Compare cereal rye cover crop for weed control suitability when terminated by crimping or herbicide at two different seeding rates.
Planting Date 5/17/2021
Harvest Date 11/8/2021
Variety Xitavo X03131E
Population 160,000 sds/ac
Acres2
Treatments4
Reps4
Treatment Width10 ft.
Tillage No-Till
Management Herbicide
Previous CropCorn
Row Spacing 15 in.
Soil Type Hoytville Silty Clay Loam, 100%


OSU Extension Putnam County
Complete randomized block design with four replications. Plots with rye crimped at anthesis were compared to plots with rye terminated using a herbicide treatment.
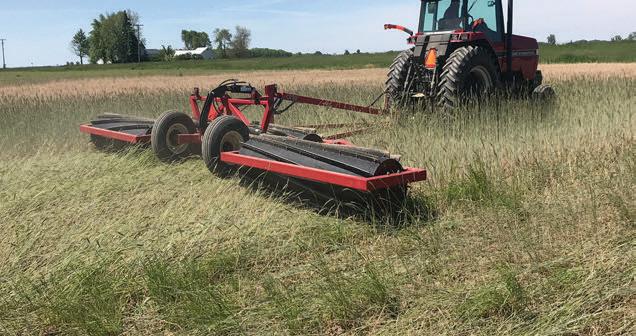
Crimped cereal rye needed to be crimped again one week later as some had not reached antithesis at time of crimping and continued to develop, likely taking moisture from developing soybeans in dry summer conditions.

• Cereal rye has been shown to reduce competition from weeds in soybean production when terminated near or at anthesis.
• In this trial, cereal rye stands were crimped but crimping did not kill all plants and flowering resumed.
• Termination of rye cover crop was more effective using herbicides in 2021 compared to crimping rye stands.
• In both cases, the cereal rye cover crop reduced soybean yield compared to the control, likely due to dry soil conditions experienced during the growing season.
Treatment Means with the same letter are not significantly different according to Fisher’s Protected Least Significant Differences (LSD) test at alpha = 0.1.
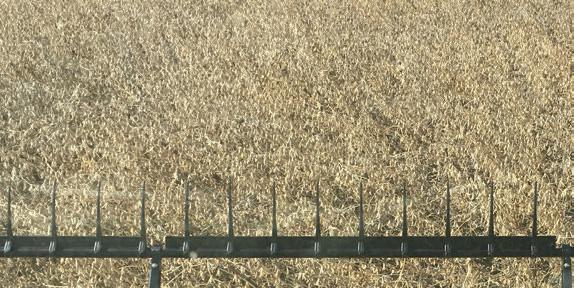
For inquiries about this project, contact Beth Scheckelhoff (scheckelhoff.11@osu.edu).
Evaluate effect of topdressing rye on soybean yield.

Planting Date 5/24/2021
Harvest Date 10/15/2021
VarietyBeck’s 255XF
Population 151,000 sds/ac
Acres40
Treatments3
Reps4
Treatment Width 45 ft.
Tillage No-Till
Management Fertilizer, Herbicide
Previous CropCorn
Row Spacing 15 in.
Soil Type Latty Silty Clay, 89% Nappanee Silty Clay Loam, 11%

OSU Extension Paulding County
In this study, a cover crop rye field was treated with three rates of nitrogen to determine if any effects could be seen on the yield of the following soybean crop. Four replications compared the use of different topdress rates of nitrogen on rye preceding soybean: 0 lb N/ac, 15 lb N/ac, and 20 lb N/ac. Soybean yield was calculated at the end of the season to determine if any effect was seen from N application on rye.
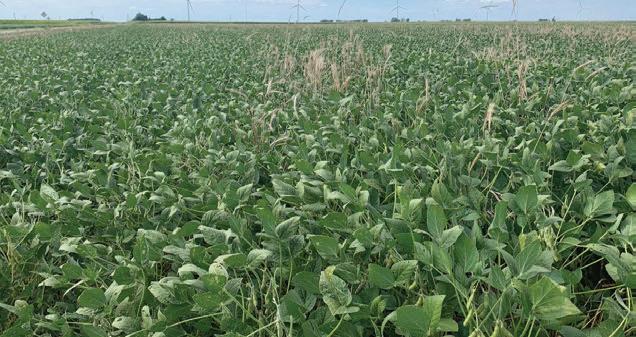
Trial image of mid season growth.
There were no visual differences in the green color or size of the soybeans based on the different rates of nitrogen applied to the rye planted before.

• The soybeans planted to the area of the field where the previous rye cover crop received no additional nitrogen yielded significantly higher than the sections of the field where the rye received 15 or 20 lbs of nitrogen.
• The difference between the 15 lb and 20 lb treatments was not statistically significant.
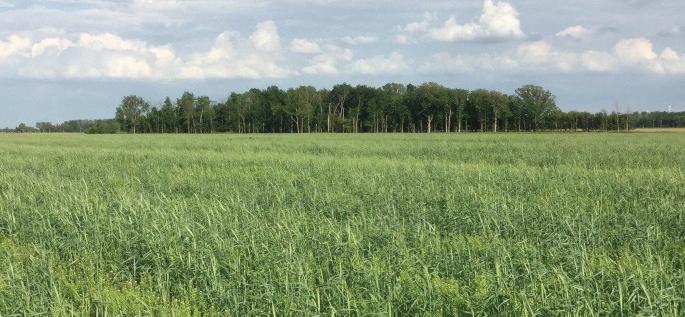
Treatment Means with the same letter are not significantly different according to Fisher’s Protected Least Significant Differences (LSD) test at alpha = 0.1.

For inquiries about this project, contact Rachel Cochran (cochran.474@osu.edu) or Sarah Noggle (noggle.17@osu.edu).
Determine if the biological additive of MVP (formally SP-1) applied in-furrow at soybean planting would increase yields.
Planting Date 5/15/2021
Harvest Date 10/1/2021
Variety Pioneer 30T99E
Population 126,905 sds/ac
Acres38
Treatments1
Reps4
Treatment Width120 ft.
Tillage No-Till
Management Herbicide
Previous CropCorn
Row Spacing 15 in.
Soil Type Hoytville Clay Loam, 70%
Dunbridge Sandy Loam, 16%
Millsdale Silty Clay Loam, 14%
The additive was applied in four replicated plots, with a control replicated with no treatment, and yield was recorded at harvest for comparison.


OSU Extension Sandusky County
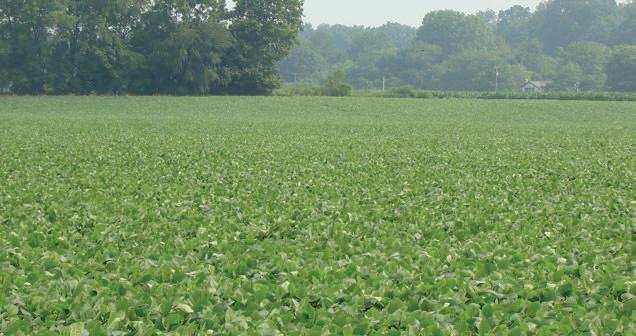
Soybean plot during the growing season.
No noticeable visual differences between treated and untreated plots were observed. Stand counts indicated an average of 435 more plants per acre in the untreated plots, with the overall average stand across the trial at 126,904 plants per acre.
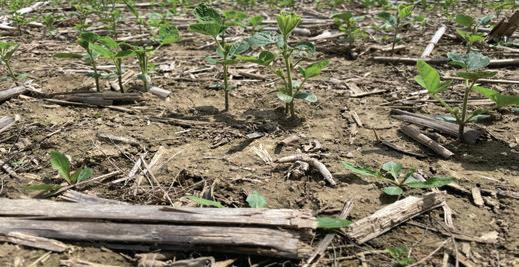
• With just a 0.5 bushels per acre yield advantage for the treated plots, and no difference in moisture, the conclusion could be made that there was no significant benefit to utilizing the MVP biological additive, and although an indepth economic analysis was not performed, with no yield increase, this would naturally relate to no economic benefit.

Treatment Means with the same letter are not significantly different according to Fisher’s Protected Least Significant Differences (LSD) test at alpha = 0.1.
MVP biological additive
MVP biological additive (SP-1) is a naturally derived broad spectrum microbial with additional specific beneficial organisms added during the stabilization process.
For inquiries about this project, contact Allen Gahler (gahler.2@osu.edu).
Understand the benefit of using fertilizer and biological in furrow to help with seed vigor in cold soils and if it will effect overall yield.
Planting Date 4/27/2021
Harvest Date 10/1/2021
VarietyAsgrow G27XF1
Population 140,000 sds/ac
Acres10
Treatments1
Reps3
Treatment Width80 ft.
TillageConventional
Management Fertilizer, Herbicide
Previous CropCorn
Row Spacing30 in.
Soil Type Hoytville Clay Loam, 90% Aurand Loam, 10%


OSU Extension
Wood County
This study was designed in a complete block design. The two treatments consisted of a check and 3.5 gal/ac of in furrow soybean starter that consisted of a blend of a biological and 5-13-8 liquid fertilizer as a carrier. A calibrated yield monitor was used to collect yield data.
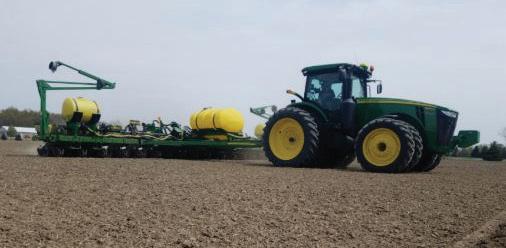
The treated areas had better early season vigor getting out of the ground in the cool wet conditions compared to the untreated sections.
• Due to the wet conditions and the inconsistencies across the field we still saw no statistical difference between the control and treated areas.
• We hope to replicate this study next year.
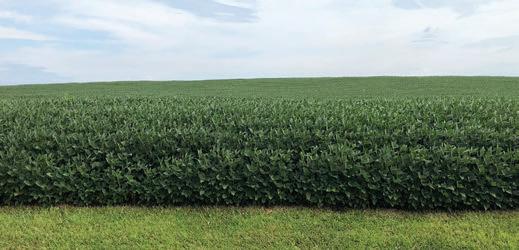
Treatment Means with the same letter are not significantly different according to Fisher’s Protected Least Significant Differences (LSD) test at alpha = 0.1.
Keeton seed firmer
A Keeton seed firmer can improve seed to soil contact by pressing the seed into the furrow.
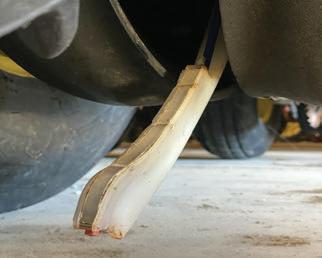
For inquiries about this project, contact Nick Eckel (eckel.21@osu.edu).
Evaluate the effectiveness of preemergence sulfur treatment to soybeans.
Planting Date 4/27/2021, 4/28/2021
Harvest Date 9/30/2021
VarietyAGI 3.1
Population 154,000 sds/ac
Acres40
Treatments2
Reps4
Treatment Width90 ft.
Tillage No-Till
Management Fertilizer, Herbicide
Previous Crop Soybeans
Row Spacing20 in.
Soil Type Pewamo Silty Clay Loam, 67%
Blount Silt Loam, 17% Glynwood Silt Loam, 10%
This study was designed as a randomized complete block study. Each plot was 90 feet wide and encompassed the full length of the field. Treatments consisted of no sulfur (control) versus Tarus at a rate of 1 gal/ac. A calibrated yield monitor was used to collect data.
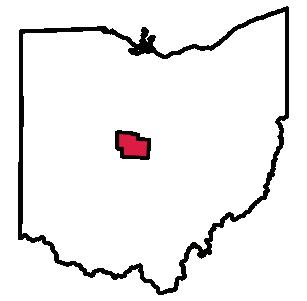

OSU Extension
Delaware County
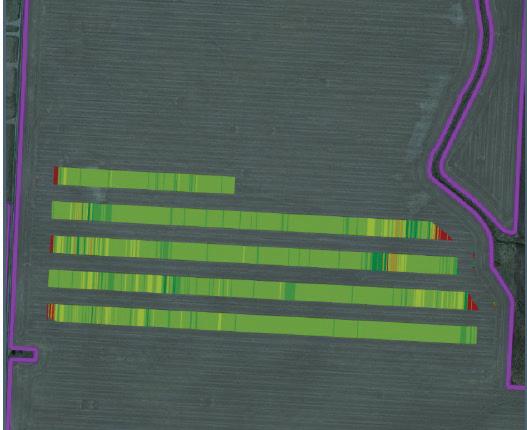
Great weather during the growing season with low weed and insect pressure. Some signs of SDS were observed in August. One plant in the no sulfur area was found to have over 90 pods.
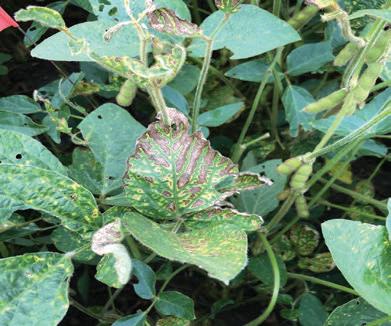
• There was no statistically significant difference observed between the two treatments.
• One of the four replications of the sulfur had a wet area of the field bringing the average yield down.
• However, when looking at the economics of the entire situation we can see a loss of $10.62 per acre with the sulfur treated beans over the no sulfur treatment.

Scan here for a video about this trial.
Treatment Means with the same letter are not significantly different according to Fisher’s Protected Least Significant Differences (LSD) test at alpha = 0.1.
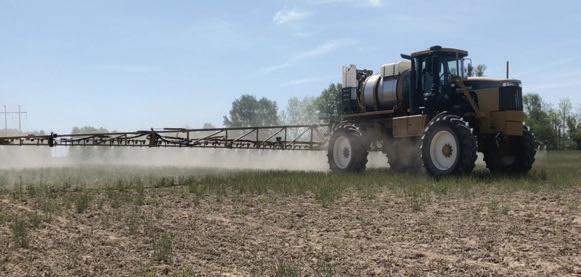
For inquiries about this project, contact Jacci Smith (smith.11005@osu.edu) or Rob Leeds (leeds.2@osu.edu).
Evaluate the effectiveness of preemergence treatments of sulfur to soybeans.
Planting Date 5/17/2021
Harvest Date 9/27/2021
Variety Seed Consultants 7280E
Population 140,000 sds/ac
Acres6
Treatments1
Reps4
Treatment Width60 ft.
Tillage No-Till
Management Fertilizer, Herbicide
Previous CropCorn
Row Spacing 15 in.
Soil Type Condit Silt Loam, 34%
Centerburg Silt Loam, 26%
Pewamo Silty Clay Loam, 15%
This study was designed as a randomized complete block study. Each plot was 60 feet wide and encompassed the full length of the field. Treatments consisted of no sulfur (control) vs Extract at a rate of 1 gallon/ acre. Treatment applications were made with burndown herbicide application. A calibrated yield monitor was used to collect yield data.


OSU Extension
Knox County
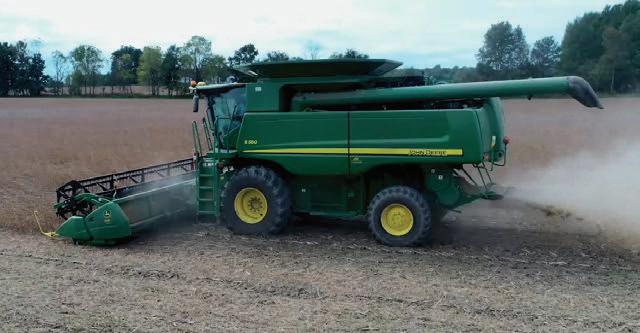
Throughout the year the treated areas in the field appeared slightly greener. 2021 was a good growing season for soybeans. County soybean yields were above average.

• The yield average of the 4 treatment replications in this study was 55 bu/ac.
• The average of the no treatment (control) replications was 60 bu/ac.
• No statistically significant yield response was observed; however, the sulfur application resulted in a reduction in net returns of $81.78/ acre.
Treatment Means with the same letter are not significantly different according to Fisher’s Protected Least Significant Differences (LSD) test at alpha = 0.1.
Extract (6-0-0-13S)
Marketed as “a biocatalyst specifically formulated to maximize nutrient release from a grower’s fertilizer investment. It is optimized to help growers easily and effectively manage nutrients tied up in the soil and in crop residue by accelerating release of existing nutrition while also increasing nutrient availability.”

For inquiries about this project, contact John Barker (barker.41@osu.edu).
Evaluate the effectiveness of preemergence treatments of sulfur to soybeans.
Planting Date 5/19/2021
Harvest Date 10/2/2021
Variety Xitavo O2921E
Population 140,000 sds/ac
Acres9
Treatments1
Reps4
Treatment Width60 ft.
Tillage No-Till
Management Fertilizer, Herbicide
Previous CropCorn
Row Spacing 15 in.
Soil Type Bennington Silt Loam, 66% Pewamo Silty Clay Loam, 34%
This study was designed as a randomized complete block study. Each plot was 60 feet wide and encompassed the full length of the field. Treatments consisted of no sulfur (control) vs Extract at a rate of 1 gallon/ acre. Treatment applications were made with burndown herbicide application. A calibrated yield monitor was used to collect yield data.


Throughout the year the treated areas in the field appeared slightly greener. 2021 was a good growing season for soybeans. County soybean yields were above average.

Scan here for a video about this trial.
• The yield average of the four treatment replications in this study was 55 bu/ac.
• The average of the no treatment (control) replications was 53 bu/ac.
• No statistically significant yield response was observed between the two treatments.

Treatment Means with the same letter are not significantly different according to Fisher’s Protected Least Significant Differences (LSD) test at alpha = 0.1.
DJI Inspire Drone
Aerial imagery from drones such as the DJI Inspire can help to better visualize spatial variation in crop health and can be used for targeted scouting.

For inquiries about this project, contact John Barker (barker.41@osu.edu).
Learn how broadcast liquid sulfur application affects soybean growth and yield.
Planting Date 6/17/2021
Harvest Date 11/4/2021
VarietyPioneer 35T058
Population 176,378 sds/ac
Acres 5
Treatments2
Reps4
Treatment Width90 ft.
Tillage Vertical
Management Fertilizer, Fungicide, Herbicide, Insecticide
Previous CropCorn
Row Spacing 15 in.
Soil Type Jessup Silt Loam, 63% Faywood Silt Loam, 37%

Interest in sulfur application has grown in the area. Two treatments took place with no sulfur application and liquid application of sulfur (Sulfpak 17%) taking place at or near growth stage R1. Four replications were applied across the whole plot. The same variety with the same planting population were planted. The fertilizer type and amount applied were consistent across the plot. Stand counts took place two weeks after planting and then again prior to harvest. The growth of soybeans was monitored throughout the growing season and yields were calculated at harvest.

Extension
Adams County
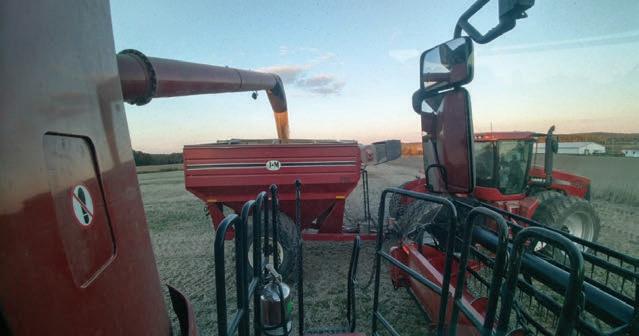
Harvest of trial comparing combine yield to grain cart weight.
Two weeks after the sulfur application, plot treatments had a deeper green color throughout the remaining growing season.
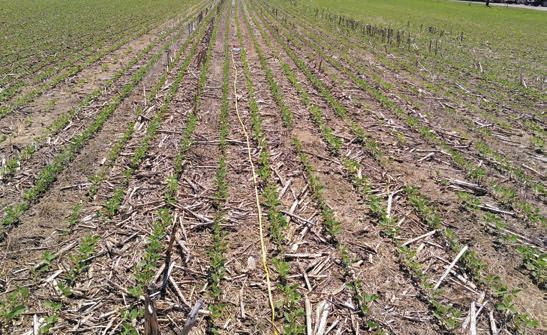
• No statistically significant yield response was observed between the treatments.
• Cost of production for the plot with sulfur application was $1,092 or $223 per acre.
• The cost of production for the plot without sulfur application was $1,067 or $218 per acre.
Treatment Means with the same letter are not significantly different according to Fisher’s Protected Least Significant Differences (LSD) test at alpha = 0.1.
Case IH 3320 Sprayer
This self propelled sprayer has a 1,000 gallon stainless steel tank and 90’ booms with adjustable nozzles.

For inquiries about this project, contact Richard Purdin (purdin.19@osu.edu).
Evaluate the effectiveness of two different sulfur rates on soybean yield.

Planting Date 5/24/2021
Harvest Date 10/22/2021
VarietyBeck's 2775X
Population 125,000 sds/ac
Acres 11
Treatments3
Reps4
Treatment Width40 ft.
Tillage No-Till
Management Herbicide
Previous Crop Soybeans
Row Spacing30 in.
Soil Type Zeigenfuss Clay Loam, 55% Nappanee Silt Loam, 42%
This design was a randomized complete block design with four replications. Treatments consisted of 0 lbs, 10 lbs and 20 lbs of sulfate in the ammonium thiosulfate (ATS) form. Treatments were applied with the planter 2x2 in 40 foot widths. A calibrated yield monitor was used to collect yield data from the treatment centers (35 feet).

OSU Extension
Fulton County

The Case IH Early Riser planter with 2 x 2 fertilizer coulters applied 2 different rates of sulfur at planting.
This trial was planted in ideal conditions in May, received adequate rainfall in June and excess rainfall in July. The soybeans finished with average weather conditions during August. There were generally no noticeable differences among the treatments but the highest rate of sulfate showed a slightly higher final stand at harvest.
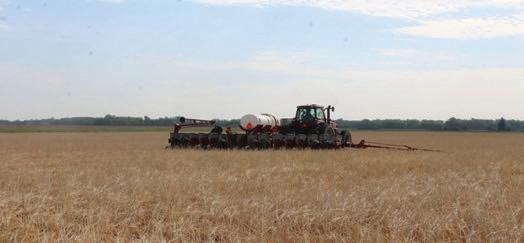
• There was no statistical yield difference among the three rates of sulfate in this trial.
• Additional sulfur at planting did not increase yield at this site.
• Different growing conditions or soil types may produce different results.
• Additional replications of this study and yearover-year data are needed to confirm the results of this study.
Treatment Means with the same letter are not significantly different according to Fisher’s Protected Least Significant Differences (LSD) test at alpha = 0.1.
Single-cell seed disc plates (right) like found on this Case IH 1250 Early Riser planter allow for excellent singularization of soybeans and offer the option of applying starter fertilizer to soybeans in furrow or 2x2.
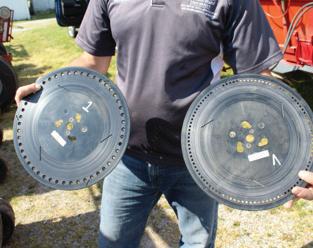
For inquiries about this project, contact Eric Richer (richer.5@osu.edu).
Evaluate the effectiveness of sulfur on soybean yield.

Planting Date 5/17/2021
Harvest Date 10/22/2021
VarietyPioneer 34A59PR
Population 160,000 sds/ac
Acres 17
Treatments2
Reps 5
Treatment Width40 ft.
Tillage No-Till
Management Fungicide, Herbicide
Previous CropCorn
Row Spacing 15 in.
Soil Type Wauseon Fine Sandy Loam, 57%
Mermill Loam, 31%
Rimer Loamy Fine Sand, 7%
This design was a randomized complete block design with five replications. The treatments included a no sulfate check and 85 lbs/acre of dry ammonium sulfate (AMS 21-0-0-24) broadcast. The AMS treatment resulted in 20 units/acre of available sulfate. A calibrated yield monitor was used to collect yield data from the treatment centers (30 feet).

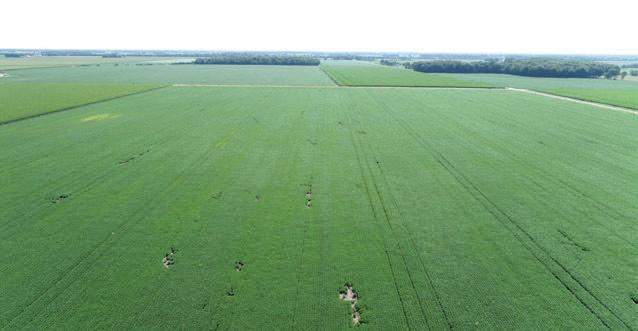
Aerial photography mid-season showed no noticeable treatment differences.
During the growing season very few differences were noticed between the treatments. Due to an equipment malfunction, replication 3 was not used in the data analysis. In July and October, the field site received excess rainfall.

• There was no statistical yield difference between the treatments in this trial.
• Sulfur at planting did not increase yield at this site.
• Different growing conditions or soil types may produce different results.
• Additional replications of this study and yearover-year data are needed to confirm the results of this study.
Treatment Means with the same letter are not significantly different according to Fisher’s Protected Least Significant Differences (LSD) test at alpha = 0.1.
Grain Cart
Grain carts like this J&M 750 allow for better harvest efficiency and were critical for getting grain out of the field an onto trucks in the fall of 2021.
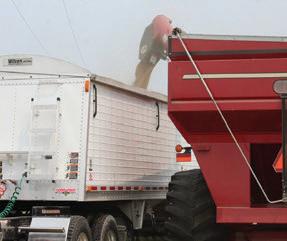
For inquiries about this project, contact Eric Richer (richer.5@osu.edu).
Evaluate the effectiveness of sulfur on soybean yield.

Planting Date 5/15/2021
Harvest Date 11/8/2021
VarietyIA 3051
Population 170,000 sds/ac
Acres18
Treatments2 Reps4
Treatment Width40 ft.
Tillage No-Till
Management Fertilizer, Fungicide, Herbicide
Previous CropCorn
Row Spacing 15 in.
Soil Type Mermill Loam , 37% Hoytville Clay Loam, 23% Glynwood Loam, 9%
This design was a randomized complete block design with five replications. The treatments included a no sulfate check and 85 lbs/acre of dry ammonium sulfate (AMS 21-0-0-24) broadcast. The AMS treatment resulted in 20 units/acre of available sulfate. A calibrated yield monitor was used to collect yield data from the treatment centers (30 feet).


Field markers to represent where strips begin and end.
During the growing season there appeared to be no visual advantage to using additional sulfur in this field.

Sulfate)
• There was no statistical yield difference between the treatments in this trial.
• Sulfur at planting did not increase yield at this site.
• Different growing conditions or soil types may produce different results.
• Additional replications of this study and yearover-year data are needed to confirm the results of this study.
Treatment Means with the same letter are not significantly different according to Fisher’s Protected Least Significant Differences (LSD) test at alpha = 0.1.
Dry Ammonium Sulfate
Dry ammonium sulfate (AMS 21-0-0-24) is one preferred product to use when sulfur is deficient.
For inquiries about this project, contact Eric Richer (richer.5@osu.edu).
Evaluate soybean yield response to two different sources of sulfur.

Planting Date 5/24/2021
Harvest Date 10/22/2021
VarietyBeck's 2775X
Population 125,000 sds/ac
Acres 11
Treatments3
Reps4
Treatment Width40 ft.
Tillage No-Till
Management Fertilizer, Herbicide
Previous Crop Soybeans
Row Spacing30 in.
Soil Type Zeigenfuss Clay Loam, 55%
Nappanee Silt Loam, 42%
Wallkill Loam, 2%
This design was a randomized complete block design with four replications. The three treatments were a no sulfate check, 85 lbs/ acre of dry ammonium sulfate (AMS 21-0-0-24) broadcast and 7 gal/acre of liquid ammonium thiosulfate (ATS 12-0-0-26) applied 2x2 with a planter. The second and third treatments resulted in 20 units/acre of available sulfate. A calibrated yield monitor was used to collect yield data from the treatment centers (35 feet).

OSU Extension Fulton County
All sulfur treatments were applied on the day of planting.
This trial was planted in ideal conditions in May, received adequate rainfall in June and excess rainfall in July. The soybeans finished with average weather conditions during August. There were generally no noticeable differences between the treatments.
• This trial showed no statistical yield difference across all treatments.
• Additional sulfur at planting did not increase yield at this site.
• Different growing conditions or soil types may produce different results.
• Additional replications of this study and yearover-year data are needed to confirm the results of this study.
Treatment Means with the same letter are not significantly different according to Fisher’s Protected Least Significant Differences (LSD) test at alpha = 0.1.
Spinner Spreader
A Will-Mar pull-type spinner-spreader is an effective and efficient way to spread dry nutrients like ammonium sulfate (AMS). Modern spinner-spreaders can spread consistently 40 to 80 feet swaths.

For inquiries about this project, contact Eric Richer (richer.5@osu.edu).
Evaluate soybean response to sulfur application planting.

Planting Date 5/19/2021
Harvest Date 10/8/2021
VarietyPioneer 34A59PR
Population 132,000 sds/ac
Acres 25
Treatments4
Reps4
Treatment Width 45 ft.
Tillage No-Till
Management Fertilizer, Fungicide, Herbicide
Previous CropCorn
Row Spacing 15 in.
Soil Type Nappanee Loam, 67% Mermill Loam, 18%
This trial was layed out as a randomized complete block design comparing various sources of sulfur to no sulfur application. 25 lbs of sulfur per treatment was applied for each treatment. Thiosol and potassium thiosol were planter applied using 2x2 placement. Ammonim sulfate was applied using a calibrated dry box spreader.

OSU Extension
Henry County
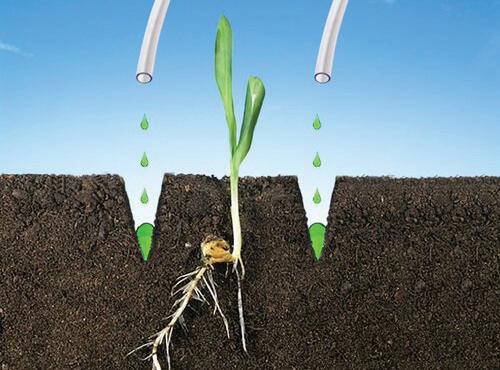
OBSERVATIONS
One replication was removed due to lack of available product to treat the area with. This plot was planted with a no-till system into a cereal rye cover crop. Weather conditions at planting were ideal with adequate rain through the month of July. August proved to be a dry month which may have affected the grain fill stages of plant development.
• There were no statistical differences in yield between the different treatments and control.
• Sulfur was not a limiting factor in this plot.
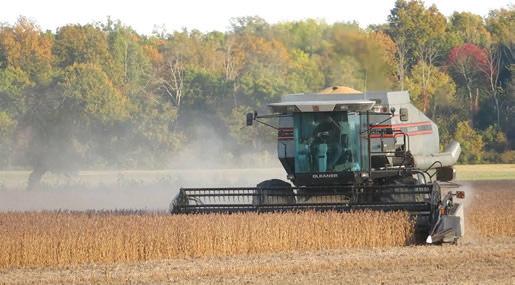
Treatment Means with the same letter are not significantly different according to Fisher’s Protected Least Significant Differences (LSD) test at alpha = 0.1.
Precision Fabrication Dual Placement Fertilizer Brackets
Allow you to accurately apply liquid fertilizer at planting. Liquid is streamed into the root zone for access by the plant. Installation is quick and brackets are made to fit most planter manufactures and models.
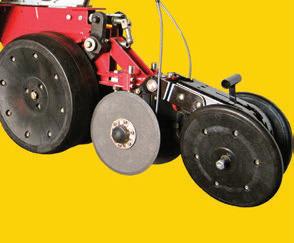
For inquiries about this project, contact Alan Leininger (leininger.17@osu.edu).
Evaluate the effect of sulfur from multiple sources on soybean yield.

Planting Date 4/27/2021, 5/25/2021
Harvest Date 10/1/2021
VarietyCredenz 2760
Population 120,000 sds/ac
Acres2
Treatments8
Reps4
Treatment Width10 ft.
TillageMinimum
Management Herbicide
Previous CropCorn
Row Spacing30 in.
Soil Type Hoytville Silty Clay Loam, 100%

This study was designed to evaluate the influence of planting date and sulfur source on soybean yield using a randomized complete block split plot design. Planting dates were on April 27th and May 25th to represent early and late planting. 20 pounds of sulfur per acre were applied using three different sources, which included dry ammonium sulfate broadcast preplanting, liquid thiosol, and potassium thiosol both applied 2X2 at planting.
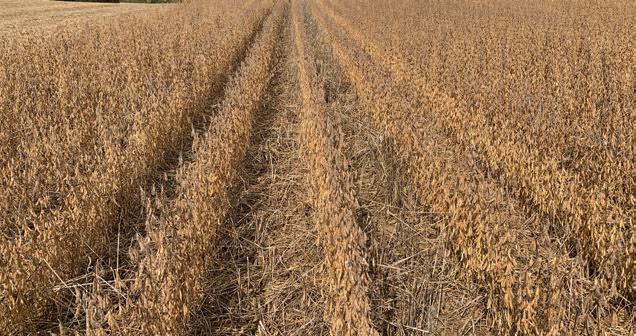
field right before harvest on 10/1/2021.
OBSERVATIONS
At emergence plots that received potassium thoisol showed a small amount of salt burn. The untreated, AMS, and thiosol all appeared the same. The stunting on the potassium thoisol remained untiled R1. At R2 the AMS and thiosol plots had a darker green color than the untreated plot.
• There was no significant yield difference between the untreated plots and the sulfur/ nitrogen treatment but the sulfur/ potassium had significantly lower yields. This was at both planting dates.
• The early planting date in late April though had significantly higher yields that the late May planting date. These results are similar to other research in Ohio showing variable yield response to sulfur treatments but no negative effects to sulfur/nitrogen sources at planting that provide 20 pounds of Sulfur.
Treatment Means with the same letter are not significantly different according to Fisher’s Protected Least Significant Differences (LSD) test at alpha = 0.1.
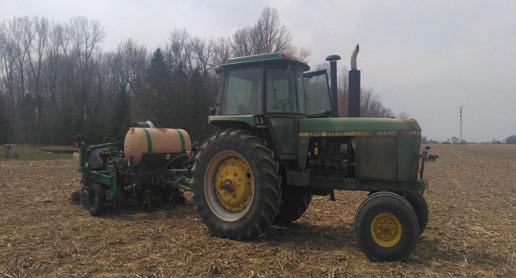
• The potassium sulfate had lower yields potentially due to higher salt concentration. Even though it was placed 2x2, soybeans showed early stunting resembling salt damage.
3.3
3.8%
For inquiries about this project, contact Jason Hartschuh (hartschuh.11@osu. edu) or Nick Eckel (eckel.21@osu.edu).
Evaluate soil temperature and moisture to determine if tillage timing impacts soil temperature and moisture that could allow for earlier planting and effects on yield.
Planting Date 5/15/2021
Harvest Date 9/28/2021
VarietyCroplan 2920E & NK S30-E3
Population 94,300 sds/ac
Acres4
Treatments4
Reps4
Treatment Width20 ft.
Tillage No-Till
Management Fertilizer, Fungicide, Herbicide
Previous CropCorn Row Spacing30 in.
Soil Type Glenford Silt Loam, 42% Del Rey Silt Loam, 31% Colwood Fine Sandy Loam, 13%
Soil moisture and temperature was recorded beginning 2 weeks prior to planting, continuing for 3 months after planting. Readings occurred in four separate locations for each of the four tillage practices, no-till, spring till, fall till, and spring and fall till. Moisture readings were recorded with VG Meter-200 soil moisture tester.


OSU Extension Sandusky County
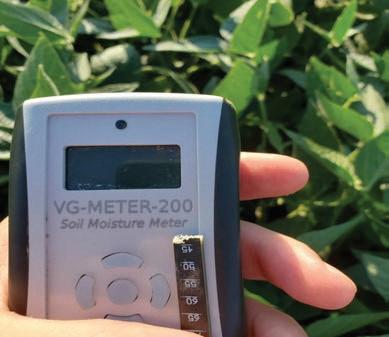
Soil moisture meter used to collect soil moisture for the trial.
Intent was to monitor population and ultimately yield in each of the 4 treatment areas, but during soil measurements prior to planting, we realized tillage and planter operations were not going to match well enough for accurate stand count and yield data. We did however continue to monitor soil temperature and moisture content to make comparisons that could be utilized in tillage and planting decisions going forward.
For inquiries about this project, contact Allen Gahler (gahler.2@osu.edu).
• The no-till areas started out and remained the lowest soil temperatures until well into the growing season, with the fall tillage areas warming slightly quicker in early spring, but by mid-May fall and spring tillage readings were similar.
• The differences in temperature were not significantly different; however, when looking at no-till passes that remained a few degrees cooler up until mid June.
• Double tillage and spring tillage areas had similar but drier readings than the fall tilled and no-tilled areas throughout the early spring and into early summer.
• Spring and double tilled soils remained drier right up until late July when all 4 areas came tightly together on moisture readings.
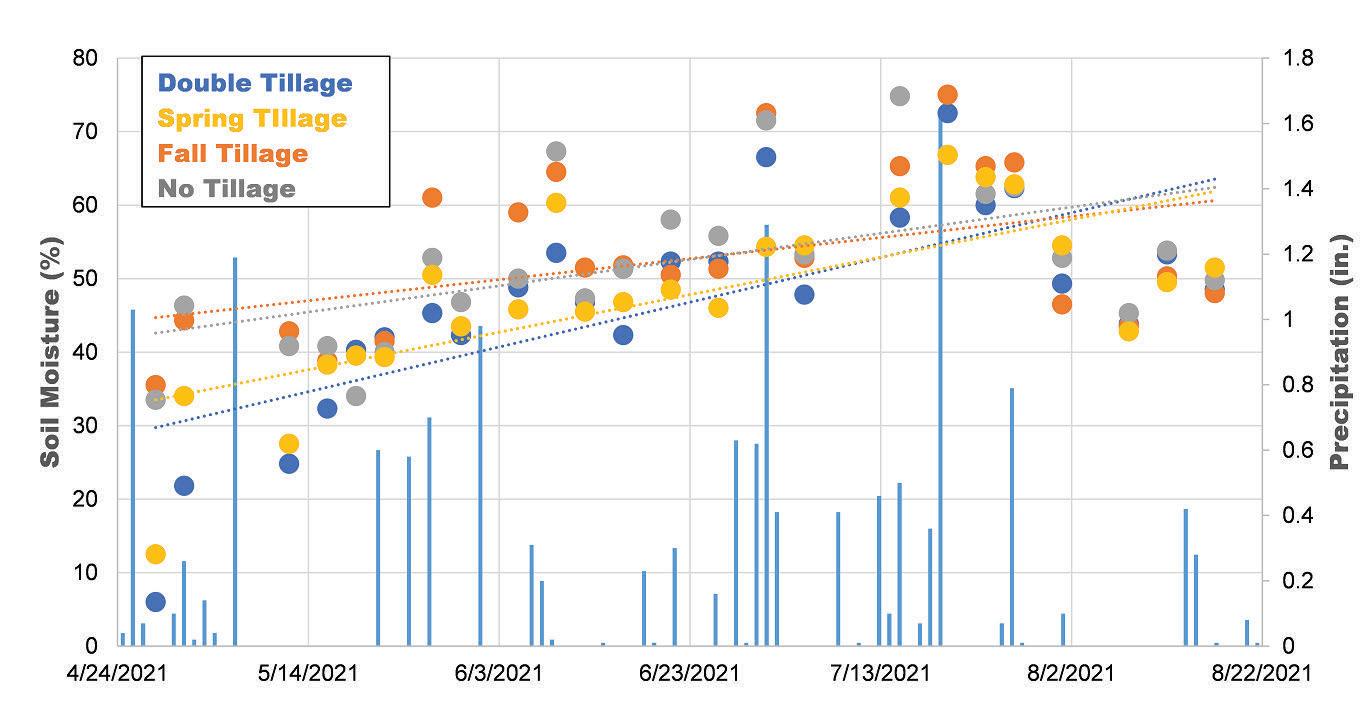
Soil moisture is shown for each tillage type. Daily precipitation is indicated by blue bars.

Soil temperature is shown for each tillage type. Daily precipitation is indicated by blue bars.
Investigate the agronomic benefits of distributing weight from planter center section to wings increasing ground contact with the gauge wheels on wing ends and reducing the pinch row compaction effect.
Planting Date 5/14/2021
Harvest Date 11/7/2021
Variety Beck's 3992FP
Population 155,000 sds/ac
Acres 95
Treatments4
Reps8
Treatment Width40 ft.
Tillage No-Till
Management Herbicide, Insecticide
Previous CropCorn
Row Spacing20 in.
Soil Type Crosby-Lewisburg Silt Loam, 41%
Kokomo Silty Clay Loam, 28%
Miamian-Eldean Silt Loam, 24%
Wing downforce control systems have recently been encouraged for modern planters as a means to prevent planter wings from rising during the planting operation and reduce the weight of the center section of the planter. Potentially, as the planter moves through the field, the wings of the planter could lift, resulting in less than optimal performance of the outside rows. Additionally, the weight from the center section of the planter can cause pinch row compaction on the center rows decreasing yield.


Extension
Pickaway County
Growing Season Weather Summary

No noticeable differences were observed between treatments during the growing season. It was also observed that transferring weight from the center of the planter to the wings kept the planter wings level during planting. Planting conditions were excellent. An extremely uniform stand for all treatments was noticed and the beans were disease free throughout the growing season. The quick canopy development prevented weed pressure through harvest.
• There were no statistically significant differences between treatments.
• For the given field conditions, 900 lbs of wing downforce kept the planter in the correct planting orientation.

Treatment Means with the same letter are not significantly different according to Fisher’s Protected Least Significant Differences (LSD) test at alpha = 0.1.
Hydraulic cylinders are added to the planter to help transfer weight from the center section of the planter to the wings, redistributing the weight more evenly across the entire bar. This can lead to more even emergence, better seed to soil contact, and consistent seeding depth.

For inquiries about this project, contact Andrew Klopfenstein (klopfenstein.34@osu.edu).
Understand the yield impact of varying soybean seeding rate within Ohio considering in-field variability and cultural practices implemented. Information from these trials are being used to improve management recommendations for growers throughout Ohio and help understand how variable rate seeding may impact field by field profitability.
The primary recommendations for seeding rates in Ohio are determined by target final stands and average soil productivity. Variable rate seeding prescriptions have the potential to better match seeding rate to productivity zones in an effort to optimize profits. Field studies were implemented in a strip trial format and replicated at least three times within fields. Results for individual sites plus aggregated pooled analyses were conducted.
• Across all sites, the average soybean stand was 80% of the target rate with individual site ranging between 68% and 94%.
• Variation in soybean yield was driven by differences in location and in seeding rate in 2021.
• There was a significant yield response to soybean seeding rate at 7 out of 8 sites in 2021.
• Favorable weather conditions across the state led to increased yields with higher seeding rates in 2021.
• The economic optimum across all sites remained near 120,000 seeds per acre.
• Testing low seeding rates can also help provide information to improve replant decisions.

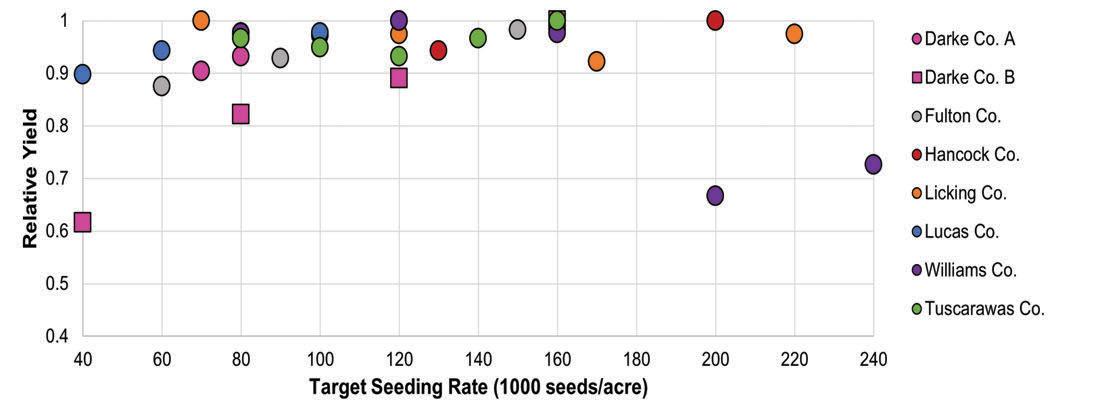
Youtube link to video featuring a partner farmer who conducted a seeding rate trial.


Planting Date 4/26/2021
Harvest Date 11/6/2021
Variety Beck's 3082FP
Population See Treatments
Acres80
Treatments4
Reps4
Treatment Width40 ft.
Tillage No-Till
Management Fungicide, Herbicide, Insecticide
Previous CropCorn
Row Spacing 15 in.
Soil Type Brookston Silty Clay Loam, 62% Crosby Silt Loam, 38%
For inquiries about this project, contact Taylor Dill (dill.138@osu.edu).

Planting Date 4/26/2021
Harvest Date 10/20/2021
Variety Beck's 3082FP
Population See Treatments
Acres100
Treatments4
Reps4
Treatment Width40 ft.
Tillage No-Till
Management Fungicide, Herbicide, Insecticide
Previous CropCorn
Row Spacing 15 in.
Soil Type Crosby Silt Loam, 75% Brookston Silty Clay Loam, 19%
For inquiries about this project, contact Taylor Dill (dill.138@osu.edu).
Treatment


Planting Date 5/24/2021
Harvest Date 10/22/2021
VarietyBeck's 2775X
Population See Treatments
Acres 11
Treatments6
Reps4
Treatment Width40 ft.
Tillage No-Till
Management Herbicide
Previous Crop Soybeans
Row Spacing30 in.
Soil Type Zeigenfuss Clay Loam, 55% Nappanee Silt Loam, 42%
For inquiries about this project, contact Eric Richer (richer.5@osu.edu).
RESULTS

OSU Extension
Fulton County
Planting Date 5/19/2021
Harvest Date 9/30/2021
VarietyUSA 330-E3
Population See Treatments
Acres 2.5
Treatments4
Reps 5
Treatment Width 25 ft.
Tillage No-Till
ManagementFungicide
Previous CropCorn
Row Spacing 15 in.
Soil Type Blount Silt Loam, 71% Pewamo Silty Clay Loam, 29%
For inquiries about this project, contact Ed Lentz (lentz.38@osu.edu).

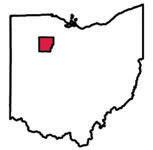
Planting Date 5/22/2021
Harvest Date 11/8/2021
VarietyChannel 3521RFX
Population See Treatments
Acres8
Treatments 5
Reps3
Treatment Width30 ft.
Tillage Vertical
Management Fertilizer, Herbicide
Previous CropCorn
Row Spacing30 in.
Soil Type Homewood Silt Loam, 79% Glenford Silt Loam, 20%
For inquiries about this project, contact Dean Kreager (kreager.5@osu.edu).

Licking County
Planting Date 5/19/2021
Harvest Date 10/14/2021
VarietyLG 3777
Population See Treatments
Acres 15
Treatments 5
Reps3
Treatment Width30 ft.
Tillage No-Till
Management Fertilizer, Fungicide, Herbicide, Insecticide
Previous CropCorn Row Spacing22 in.
Soil Type Mermill Loam, 45% Hoytville Clay Loam, 27% Haskins Loam, 17%
For inquiries about this project, contact Jordan Beck (beck.320@osu.edu).

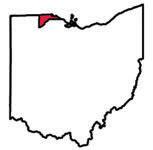
Planting Date 5/17/2021
Harvest Date 10/11/2021
VarietySeed Consultants 8279X
Population See Treatments
Acres86
Treatments 5
Reps3
Treatment Width40 ft.
Tillage No-Till
Management Fertilizer, Fungicide, Herbicide
Previous CropCorn
Row Spacing 15 in.
Soil Type Rush Silt Loam, 73% Weinbach Silt Loam, 27%
For inquiries about this project, contact Chris Zoller (zoller.1@osu.edu).
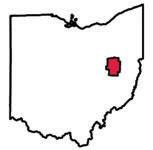
Planting Date 4/27/2021
Harvest Date 10/28/2021
Variety Pioneer 39A82S
Population See Treatments
Acres 114
Treatments 5
Reps4
Treatment Width40 ft.
TillageConventional
Management Fertilizer, Fungicide, Herbicide
Previous CropCorn Row Spacing20 in.
Soil Type Haskins Sandy Loam, 39% Blount Loam, 27% Mermill Loam, 14%
For inquiries about this project, contact Stephanie Karhoff (karhoff.41@osu.edu).

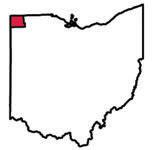
OSU Extension
Williams County
We are tackling today’s grand challenges in every corner of Ohio.
Sustaining Life
We focus on viable agriculture production, food security and safety, and environmental and ecosystem sustainability simultaneously.
One Health
We study the nexus where human, animal, plant, and environmental health intersect or interact.
Rural-Urban Interface
We explore the tensions and opportunities created in the communities, industries, policies, economies, and communications between rural and urban residents.
Leadership
We are preparing the next generation of scientists and leaders.
The Ohio State University College of Food, Agricultural, and Environmental Sciences is Ohio State’s cornerstone college. Through our research, teaching, and engagement with Ohioans and the world, we sustain life

Co
For 2021, eFields small grains research was focused on improving the production and profitability of wheat and malting barley in Ohio. Some exciting and innovating projects were executed this year, with 6 studies being conducted across the state. 2021 small grains research presented in eFields covers both precision crop and nutrient management initiatives. Below are highlights of the 2021 eFields small grains research:
95 acres of small grains
6 small grains studies
For more small grains research from Ohio State University Extension, explore the following resources:
The purpose of the Ohio Wheat Performance Test is to evaluate wheat varieties for yield and other agronomic characteristics. This evaluation gives wheat producers comparative information for selecting the best varieties for their unique production systems. For more information visit: go.osu.edu/OhioWheat.
The Agronomic Crops Team performs interesting research studies on a yearly basis. Resources, fact sheets, and articles on wheat and barley research can be found here on the Agronomic Crops Team website: go.osu.edu/CropsTeamWheat and go.osu.edu/CropsTeamBarley.
The Soybean and Small Grain Crop Agronomy Program in the Department of Horticulture and Crop Science at The Ohio State University is directed by Dr. Laura Lindsey. The goal of the research program is to meet the needs of Ohio farmers through research-based agronomic recommendations. Research related to small grains planting, cropping inputs, and harvesting technology can be found on the program’s website: stepupsoy.osu.edu/home.


For all wheat and barley trials in this eFields report, we define growth stages as the following:
Feeke’s 1.0 - Germination period to the first emerged leaf.
Feeke’s 2.0 – Tillers become visible.
Feeke’s 3.0-4.0 – Tiller formation.
Feeke’s 5.0 – Strongly erect leaf sheaths. Growing point is still below the soil surface.
Feeke’s 6.0 – First node visible. The growing point is above this node. Tiller production is complete.
Feeke’s 7.0 – Second node visible. Rapid stem elongation is occurring.
Feeke’s 8.0 – Flag leaf visible.
Feeke’s 9.0 – Flag leaf completely emerged and leaf ligule is visible.
Feeke’s 10.0 – Boot stage. Head is fully developed and can be seen in the swollen section of the lead sheath below the flag leaf.
Feeke’s 10.5 – Heading and flowering. Head is fully emerged.
Feeke’s 10.5.1 – Early flowering, anthers are extruded in the center of the head.
Feeke’s 10.5.2 – Mid flowering, anthers are extruded in the center and top of the head.
Feeke’s 10.5.3 – Late flowering, anthers are extruded in the center, top, and base of the head.
Feeke’s 11.0 – Ripening.
Feeke’s 11.1 – Milk stage.
Feeke’s 11.2 – Mealy stage.
Feeke’s 11.3 – Hard kernel.
Feeke’s 11.4 – Harvest ready.
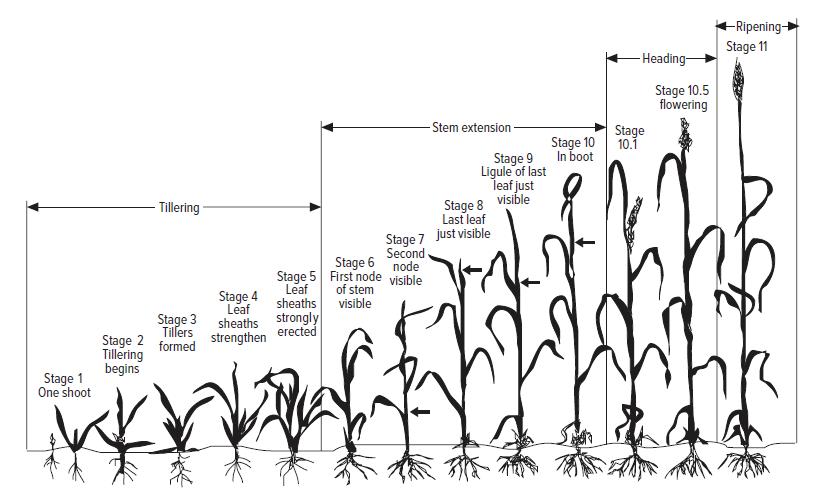
Evaluate the yield impact of adding topdressed compost to wheat as an additional nutrient source.
Planting Date 9/24/2020
Harvest Date 7/16/2021
VarietyPioneer 25R61
Population 1.8 million sds/ac
Acres3
Treatments2
Reps3
Treatment Width30 ft.
Tillage No-Till
Management Fertilizer
Previous Crop Soybeans
Row Spacing 7.5 in.
Soil Type Kibbie Loam, 50%
Del Ray Silt Loam, 21%
Lenawee Silty Clay Loam, 19%


This study was designed in a randomized complete block design. The two treatments were 3 tons/acre of compost topdressed and a no compost check. All field operations were consistent across all treatments.

Compost was not noticeable at green up.
The compost treatment was applied on March 6th. There were no noticeable plant health differences between the treatments. Wheat growing conditions this year were considered excellent at this site.

• There was no statistical difference in yield between the two treatments.
• In the future, the compost product may provide better value as a starter fertilizer if logistics allow for it.

Treatment Means with the same letter are not significantly different according to Fisher’s Protected Least Significant Differences (LSD) test at alpha = 0.1.
Compost Thermometer
A 36 inch compost thermometer is a valuable tool to monitor compost temperature in the middle of the windrow. Ideal composting occurs at 120-140 degrees Fahrenheit.

For inquiries about this project, contact Eric Richer (richer.5@osu.edu) or Jordan Beck (beck.320@osu.edu).
Determine the effect of fungicide for the management of fusarium head scab on grain quality and yield.
Planting Date 10/11/2020
Harvest Date 7/5/2021
VarietyWellman W305
Population 1.8 million sds/ac
Acres6
Treatments2
Reps3
Treatment Width90 ft.
Tillage No-Till
Management Fertilizer, Fungicide, Herbicide
Previous Crop Soybeans
Row Spacing 7.5 in.
Soil Type Paulding Clay, 51% Roselms Silty Clay, 49%
A fungicide treatment vs control check were each replicated three times in a randomized complete block design. Fungicide was applied by the private applicator/grower with ground equipment with a 90 foot boom. Control plots had no fungicide and no wheel tracks. The yield was determined by harvesting the center 40 feet of the 90 foot applied plot with an average plot length of 1,035 feet.


OSU Extension
Defiance County

Wheat quality samples from each plot.
The Fusarium Risk Assessment Tool (wheatscab. psu.edu) was used on May 25, 2021 to determine the risk level for disease and the treatment plan. For winter wheat varieties rated as very susceptible to moderately resistant, the risk assessment for the plot area was “low.” Although it had rained near the time of anthesis, the temperatures had dropped in the upper 50's and lower 60's with nighttime temperatures in the mid-to-upper 40's, which contributed to the low risk assessment. Risk levels remained low for a 14 day period after this field was in anthesis.
LSD: 0.2
24.4%
• In this study, the fungicide treatment had a significant effect in reducing the level of vomitoxin in the grain samples compared to the control.
• The fungicide treatment did not have a significant effect on grain percent moisture, grain test weight nor grain yield.
• The cost of the fungicide material was $18 per acre plus the cost of application.
• The 2020 OSU Farm Custom Rates were used to estimate a private applicator cost of application at $7.70 per acre.
• The total cost per acre of the fungicide application was $25.70 per acre.
• The cash price of wheat locally at harvest was $6.60 per bushel.
2.2
1.2%
Treatment Means with the same letter are not significantly different according to Fisher’s Protected Least Significant Differences (LSD) test at alpha = 0.1.
Fusarium Risk Tool
(Sponsored by the U.S. Wheat & Barley Scab Initiative, Ohio State University, Penn State University, Kansas State University). A data driven, real-time model that uses the local weather conditions and the producer determined flowering date to forcast the risk of Fusarium Head Scab and risk of grain vomitoxin.
For inquiries about this project, contact Bruce Clevenger (clevenger.10@osu.edu).
Observe the effects of application time of spring nitrogen on wheat yields.

Planting Date 9/23/2020
Harvest Date 7/6/2021
VarietyAGI 217B
Population 1.4 million sds/ac
Acres1
Treatments4
Reps4
Treatment Width 7 ft.
Tillage No-Till
ManagementFungicide
Previous Crop Soybeans
Row Spacing 7.5 in.
Soil Type Hoytville Silty Clay Loam, 100%

Hancock County
Growing Season Weather Summary
AGI217B, a medium-maturity soft red wheat variety, was planted by a drill at the OARDC Northwest Agricultural Research Station. 90 pounds per acre of nitrogen from ureaammonium nitrate (UAN) was applied at three different times: Greenup, Feekes GS 7, and Feekes GS 9. A fourth treatment received 40 pounds of nitrogen per acre from UAN at Greenup followed by 50 pound of nitrogen applied a Feekes GS 7. All treatments received 30 pounds of nitrogen per acre prior to planting. The center 11 rows were harvested for grain yield. Experimental design was a completely randomized block replicated four times. Analysis was a simple ANOVA.
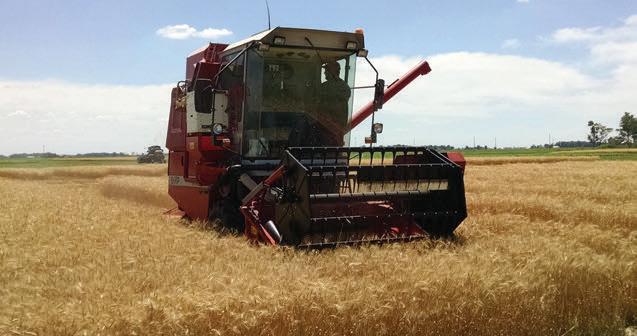
Harvest results from this study confirmed the recommendation for N application between greenup and Feekes GS 6.
Earlier research has shown no yield difference between a greenup and Feekes GS 6 spring nitrogen application. Wet field conditions prevented an application at Feekes GS 6, delaying the application to Feekes GS 7. This study suggests that waiting until Feekes GS 7 may reduce yields in a high yielding environment. Current recommendations are to apply spring N when field conditions are fit between greenup and Feekes GS 6. This study would validate that recommendation. There was no advantage to the split application compared to a single application. If weather delays spring application to Feekes GS 9, a producer may still get enough return to justify an application compared to adding none depending on the cost of nitrogen.
• Greenup application of spring N had the largest yields.
• There was no difference between the Feekes GS 7 application and the split application (Greenup and Feekes GS 7).
• Significant yields losses were observed if nitrogen was not applied until Feekes GS 9.
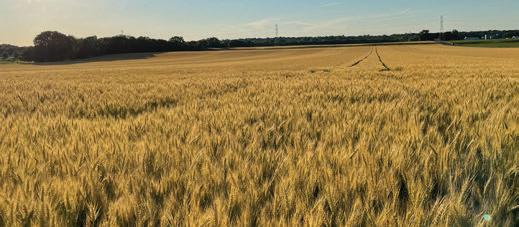
Treatment Means with the same letter are not significantly different according to Fisher’s Protected Least Significant Differences (LSD) test at alpha = 0.1.
For inquiries about this project, contact Ed Lentz (lentz.38@osu.edu).
Test the effects of Instinct II and Radiate on wheat yields.

Planting Date 9/23/2020
Harvest Date 7/6/2021
VarietyAGI 217B
Population 1.4 million sds/ac
Acres1
Treatments3
Reps4
Treatment Width 7 ft.
Tillage No-Till
ManagementFungicide
Previous Crop Soybeans
Row Spacing 7.5 in.
Soil Type Hoytville Silty Clay Loam, 100%

OARDC
Hancock County
Growing Season Weather Summary
AGI217B, a medium-maturity soft red wheat variety, was planted at the OARDC Northwest Agricultural Research Station. The study consisted of three treatments: treatment with no additive, treatment with Instinct II (a nitrification inhibitor) and a treatment with Radiant (a growth regulator). Each treatment received 90 pounds per acre of nitrogen from urea-ammonium nitrate (UAN) applied at Greenup. The two additives were blended with UAN before application. All treatments received 30 pounds of nitrogen per acre prior to planting. Experimental design was a completely randomized block replicated four times. Analysis was simple ANOVA.

Nitrogen loss conditions were minimal during the summer.
Yields were significantly reduced with the addition of Instinct II or Radiate. It would be expected to see little benefit from Instinct II since nitrogen loss conditions were minimal during the growing season. It was a high yielding environment in 2021, so the additives may have performed differently in a more stressful year.
• For this site in 2021, yields were reduced with the addition of Instinct II or Radiate.
• This was unexpected and generally these products may not increase yields but they not decrease yields.
• However, the yield differences were not large but were statistically significant.
Treatment Means with the same letter are not significantly different according to Fisher’s Protected Least Significant Differences (LSD) test at alpha = 0.1.
For inquiries about this project, contact Ed Lentz (lentz.38@osu.edu).
Measure the effects of spring nitrogen rate on wheat yields.

Planting Date 9/23/2020
Harvest Date 7/6/2021
VarietyAGI 217B
Population 1.4 million sds/ac
Acres1
Treatments 7 Reps4
Treatment Width 7 ft.
Tillage No-Till
ManagementFungicide
Previous Crop Soybeans
Row Spacing 7.5 in.
Soil Type Hoytville Silty Clay Loam, 100%

OARDC
Hancock County
Growing Season Weather Summary
AGI 217B, a medium-maturity soft red wheat variety, was planted by a drill on the OARDC Northwest Agricultural Research Station near Custar, Ohio. Seven nitrogen rate treatments were applied as urea-ammonium nitrate at greenup . Rates included in the study were 0, 40, 70, 90, 110, 130, and 150 pounds per acre. All treatments received 30 pounds of nitrogen per acre prior to planting. Treatments were applied to plots 10 feet wide and 60 feet long. The center 11 rows were harvested for grain yield. Experimental design was a completely randomized block replicated four times. Analysis was a simple ANOVA.

The lowest two treatments were noticeably less green.
Yields increased with each larger increment of nitrogen applied until about the 90 lb rate. However, the most yield came from the largest rate, implying that yields may have even been larger with more nitrogen. Compared to other years at this site, yields were unusually large in 2021. Visually, the 0 and 40 lb/A treatments were considerably less green than the other treatments the latter part of the growing season. The other treatments looked visually the same.

• For nitrogen rate curve studies, it is desirable to have several upper end rates that have similar yields (plateau).
• This partiuclar site generally does not have a response above the 110 lb rate, so larger rates would be similar to 110.
• However, 2021 was a high yielding environment with little or no nitrogen loss, no disease issue, and excellent harvesting conditions.
• Wheat continued to respond to more nitrogen even at the largest rate, implying that yield may have been higher with additional nitrogen.
• Thus, in 2021, this site was unable to define the optimal rate for maximum yields.
Treatment Means with the same letter are not significantly different according to Fisher’s Protected Least Significant Differences (LSD) test at alpha = 0.1.
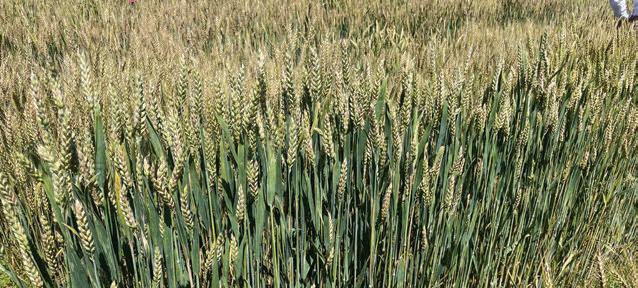
For inquiries about this project, contact Ed Lentz (lentz.38@osu.edu).
Compare nitrogen rates in wheat with soil health testing recommendations and with Tri-State Fertilizer recommendations.
Planting Date 9/25/2020
Harvest Date 7/6/2021
VarietyAGI 217B
Population 3.17 bu/ac
Acres40
Treatments2
Reps3
Treatment Width60 ft.
Tillage No-Till
Management Fertilizer
Previous Crop Soybeans
Row Spacing 7.5 in.
Soil Type Hoytville Clay Loam, 100%


OSU Extension Wood County
This study was laid out in an randomized block design. The Tri-State treatments received an additional 47 lbs of N above what was applied in the Haney treatments. This additional N was applied 3 days after the initial 60 lbs due to logistics, but in future studies, the goal should be to apply the whole amount (relative to each treatment) to both treatments on the same day in order to eliminate potential effects of application timing factors.
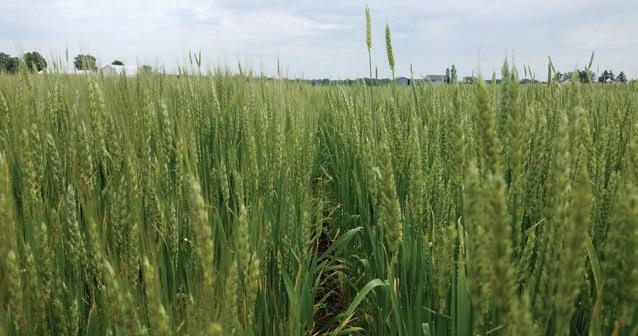
Visual differences did appear later in the growing season, well after jointing. The relative differences can be visualized in the drone imagery.
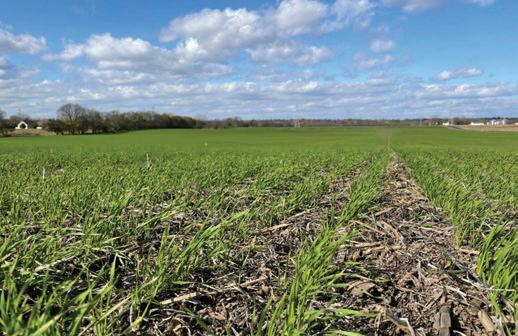
Treatment Means with the same letter are not significantly different according to Fisher’s Protected Least Significant Differences (LSD) test at alpha = 0.1.
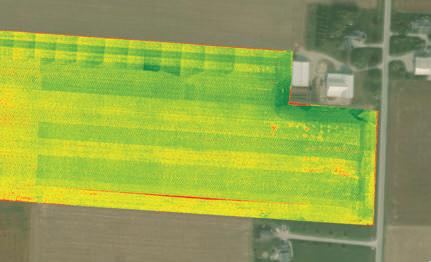
• This year was better than average across the state for wheat yields.
• Sufficient moisture during the early summer allowed for good yields, although test weights were observed to be less than expected in the locale.
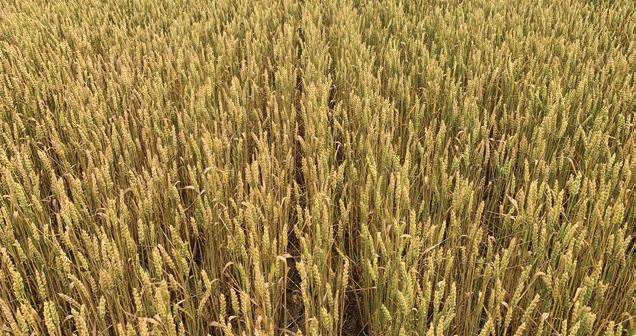
For inquiries about this project, contact Boden Fisher (fisher.1466@osu.edu) or Beth Scheckelhoff (scheckelhoff.11@osu.edu).
For 2021, eFields forage research was focused on increasing forage production in Ohio. Some exciting and innovating projects were executed this year, with 4 unique studies being conducted across the state. 2021 Forage research presented in eFields covers both precision nutrient management and species selection. Below are highlights of the 2021 eFields Forage research:
6 acres of forage 4 forage studies
For more forage research and feeding management from Ohio State University Extension, explore the following resources:
The purpose of the Ohio Forage Performance Test is to evaluate forage varieties of alfalfa, annual ryegrass, and cover crops for yield and other agronomic characteristics. This evaluation gives rorage producers comparative information for selecting the best varieties for their unique production systems. For more information visit: go.osu.edu/OhioForages.
The Agronomic Crops Team performs interesting research studies on a yearly basis. Resources, fact sheets, and articles on alfalfa, winter annuals, and summer annuals can be found here on the Agronomic Crops Team website: go.osu.edu/CropTeamForages.


Corn Plant Silage
Forage Sorghum Sorghum Sudangrass Sudangrass
Soybean Silage
Teff Grass
Millets
Mixtures of annual grasses with soybean
Highest single cut forage yield potential of all choices. Silage quality will be lower than with normal planting dates. Risk will be getting it harvested at right moisture for good fermentation.
Best harvested as silage. Brown midrib (BMR) varieties are best for lactating cows. Conventional varieties are okay if BMR seed is not available. Can produce 3-4 tons of dry matter/acre. Risk of prussic acid (hydrogen cyanide gas) if frosted.
Reasonable alternative to replace alfalfa forage. Check seed treatment and herbicide labels, many restrict forage use.
Best suited to beef and sheep; lower yield than sorghum grasses. Can harvest as hay or silage.
Best suited to beef and sheep; many produce a single harvest. Best harvested as silage. Pearl millet does not produce prussic acid after frost damage.
Best harvested as silage. Mixtures of sorghum grasses or millets or even oats and spring triticale with soybean are feasible and can improve forage quality characteristics.
Oat or Spring Triticale
Oat or Spring Triticale Plus Winter Cereals
Oat or Spring Triticale Plus Field Peas
Italian Ryegrass
Can be mowed and wilted to correct harvest moisture. Harvesting as hay can be challenging. Earlier planting dates provide more autumn yield.
Winter cereals (Winter rye, Winter wheat, Winter triticale) can be added to oat or spring triticale to add a forage harvest early next spring. Winter rye can also contribute a little extra autumn yield to the mixture.
Field peas can improve forage quality (especially crude protein content) but will increase seed cost.
Earlier planting dates provide more autumn yield. Excellent forage quality in the fall. Potential for three harvests next year starting in late April.
Observe the yield of alternative annual forages for late summer and fall grazing opportunities.
Planting Date 8/9/2021
Harvest Date 10/8/2021
Variety See Treatments
Population Variable
Acres1.4
Treatments 7
Reps4
Treatment Width20 ft.
Tillage No-Till
Management Fertilizer, Insecticide
Previous CropFescue pasture
Row SpacingBroadcast
Soil Type Ravenna Silt Loam, 44%
Canfield Silt Loam, 31%
Wooster-Riddles Silt Loams, 24%
Seven alternative forage varieties, utilized for grazing by sheep, were planted in 4 replicate plots at the OARDC Small Ruminant Facility in August 2021. Varieties included both warm and cool season forages and came from the small grain, brassica, legume, and grass families. In October 2021, samples were collected for dry matter and yield measurements and nutritional analysis. Forage yield was measured by cutting and collecting all forage that laid within the forage square. The contents of each square were weighed, and a subsample was taken and dried in a 55C oven to determine dry matter content. This was an observational study, therefore is without random effects and blocking.
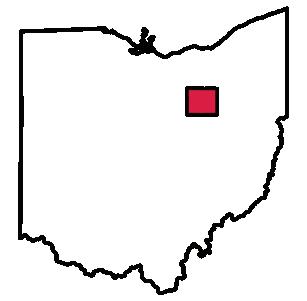

OARDC
Wayne County
Growing Season Weather Summary
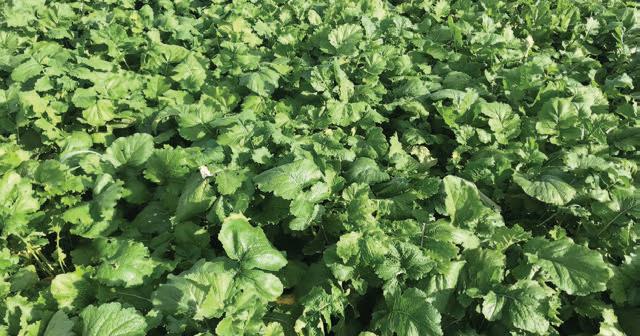
Plots were burned down with glyphosate and UAN (60 lb/ac) was applied. Turnip, forage brassica, radish, and clover seeds were broadcasted and subsequently cultimulched. Oats, sorghum-sudan, and Egyptian wheat were drill-seeded. Timely rain occurred approximately 2 days post-seeding. Slight burning of the turnips was observed; may be because of insecticide application tank residue.
2x2 Forage Square
A 2x2 forage square was used for data collection of forage yield. This tool ensures a uniform harvest area for comparison.
• In summary of this study, we have found several alternative annual forage species to be viable options in extending the grazing season.
• Please reference the 2022 eBarns publication for nutritional analyses of the tested forages.

For inquiries about this project, contact Haley Zynda (zynda.7@osu.edu) or Braden Campbell (campbell.1279@osu. edu).
Evaluate four winter annual small grains for the forage value when harvested at boot stage and flowering.
Planting Date 10/8/2020
Harvest Date 5/11/2021 & 6/2/2021
Variety See Treatments
Population 2 bu/ac
Acres2
Treatments8
Reps4
Treatment Width10 ft.
TillageMinimum
Management Fertilizer
Previous CropPasture
Row Spacing 7.5 in.
Soil Type Piopolis Silt Loam, 63% Omulga Silt Loam, 30%
Winter annual forages are a great way to maximize returns per acre for livestock farmers. Selecting the best winter annual cereal crop affects yield, forage quality, and speed of maturity. All treatments received 50 pounds of nitrogen and were planted at the same time. Harvest was determined by growth state for each species with the first harvest at Feekes 10.0 when the head was still in the boot and second harvest as at Feekes 10.5 during early pollination.
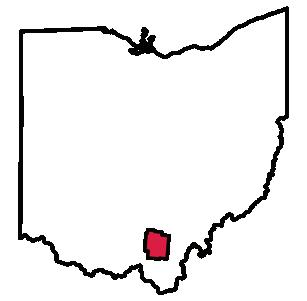

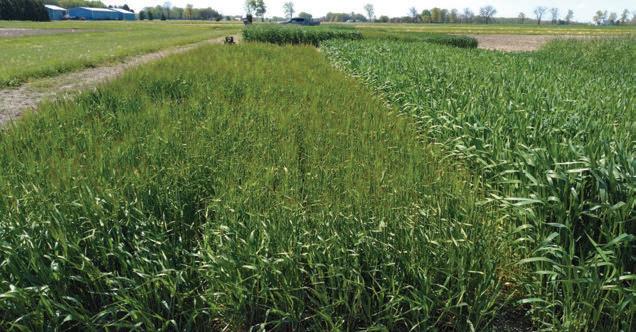
All species greened up quickly in the spring and grew well. They were slow growing to start following cooler spring temperatures. A stark example of this is that it took 3 weeks to progress from head in the boot to flowering. This usual takes one week in cereal rye and 2 weeks in other species.
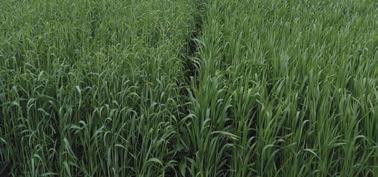
Treatment Means with the same letter are not significantly different according to Fisher’s Protected Least Significant Differences (LSD) test at alpha = 0.1.
Grain Drill
Grain drill for seeding cereal grains with good seed to soil contact and uniform seeding rate.
• Species and harvest date had a significant effect on both forage yield and quality.
• All species took about three weeks to change from head in the boot to head fully emerged which is one week longer than usual.
• As plants matured, all species saw a significant increase in NDF.
• Only cereal rye had a significant yield increase between the two harvest dates.
• Unlike other studies crude protein did not significantly change between maturities but TDN significantly decreased with maturity.
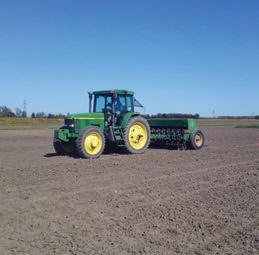
For inquiries about this project, contact Will Hamman (william.hamman@basf.com) or Jason Hartschuh (hartschuh.11@osu.edu).
Assess the effect of nitrogen rate on oats yield at multiple planting dates.

Planting Date 8/3/2021, 8/17/2021, 9/3/2021
Harvest Date 10/15/2021, 11/15/2021
VarietyFeed Grade Oats
Population 100 lbs/ac
Acres1
Treatments3
Reps4
Treatment Width10 ft.
Tillage No-Till
Management Fertilizer, Fungicide
Previous CropWheat
Row Spacing 7.5 in.
Soil Type Hoytville Clay Loam, 100%

Sandusky County
Growing Season Weather Summary
This study was designed to assess effect of nitrogen rate and planting date on fall oats. Nitrogen rates were 46, 92, and 138 pounds of nitrogen per acre. Planting dates were August 3, August 17 and September 3. Plots were harvested just after the heads were emerged for the first two plantings dates and after a stunting frost for the third planting date. The study was laid out in a randomized complete block design.
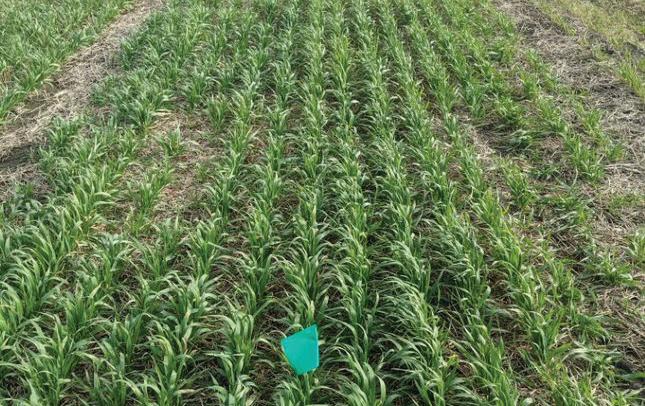
Oats were much slower growing this year with oats heading out around 75 days for the August planting date instead of 60 days. The September planting was still not in head when harvested. All three plantings had some crown rust at harvest, which we often only see in our early August plantings. We did have warmer weather later in the growing season this than normal.
• Both planting date and nitrogen rate had a significant effect on both oats yield and forage quality.
• The higher nitrogen rate of 138 lbs had a significantly higher yield than 46 lbs at the first two planting days.
• The middle nitrogen rate of 92 lbs had similar yields at the first planting date and significantly less yield with a mid-August planting date.
• Nitrogen rate had a significant effect on crude protein with the higher nitrogen rates having higher crude protein.
• Planting date had the most significant effect on NDF.
• The September planting date had the lowest NDF but it was also the least mature at harvest.
Treatment Means with the same letter are not significantly different according to Fisher’s Protected Least Significant Differences (LSD) test at alpha = 0.1.
Precison Nitrogen Applicator
Precision nitrogen applicator was used to apply the exact amount of nitrogen to each plot for consistent research on nitrogen rates.
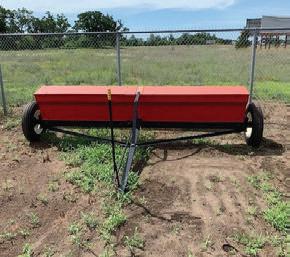
For inquiries about this project, contact Jason Hartschuh (hartschuh.11@osu.edu).
Evaluate four winter annual small grains for their forage value when harvested at Feekes 10 and 10.5.
Planting Date 10/7/2020
Harvest Date 4/27/2021, 5/4/2021, 5/11/2021, 5/18/2021
Variety Winter Annual Cereal Species
Population 2 bu/ac
Acres2
Treatments8
Reps4
Treatment Width10 ft.
TillageMinimum
Management Fertilizer
Previous CropWheat
Row Spacing 7.5 in.
Soil Type Hoytville Clay Loam, 100%
Winter annual forages are a great way to maximize returns per acre for livestock farmers. Selecting the best winter annual cereal crop affects yield, forage quality, and speed of maturity. All treatments received 50 pounds of nitrogen and were planted at the same time. Harvest was determined by growth stage for each species with the first harvest at Feekes 10.0 when the head was still in the boot and second harvest as at Feekes 10.5 during early pollination. Plots were randomized complete block split plots to allow us to best compare maturity harvest differences and species.


Growing Season Weather Summary

All species had zero lodging. There were large differences in the speed that species matured from boot stage 10.0 to anthesis 10.5. Rye still moved between these two growth stages with in a week. Other species such as Triticale took two weeks to move between growth stages.
• This is the third year conducting this winter annual forage variety trial.
• We saw similar results this year with the yields significantly increasing across all species as the plants matured.
• We also saw the similar trend with all species experiencing a quality decline as they matured. The quality decline was not the same for all species.
• One example of this was wheat which saw no significant change in TDN as it matured.
Treatment Means with the same letter are not significantly different according to Fisher’s Protected Least Significant Differences (LSD) test at alpha = 0.1.
Wet Chemistry Forage Analysis
Wet chemistry forage analysis was used to test the nutrient concentration of forages to determine its feed value.
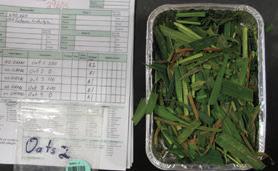
For inquiries about this project, contact Jason Hartschuh (hartschuh.11@osu. edu).
Agriculture plays a key role in meeting water quality challenges in Ohio. In 2021, eFields research was expanded to better understand how management practices can help improve environmental stewardship, sustainability, and profitabilty. This research aims to help Ohio farmers improve the resiliency of their farm operations. Below are highlights of some of the 2021 eFields soil health and water quality research:
120 soil health trials 2 other studies
For more soil health and water quality research from The Ohio State University’s College of Food, Agricultural, and Environmental Sciences and the Department of Extension, explore the following resources:
Faculty and staff in the College of Food, Agricultural, and Environmental Sciences have a long and productive record of conducting research, teaching, and extension/outreach activities to address Ohio’s pressing water quality challenges. For more information, please visit: waterquality.osu.edu/
Local solutions will be critical to solving water quality challenges. OSU Extension has assembled a team of water quality associates to help meet local needs of farmers in Northwest Ohio. Learn more at the OSU Extension Water Quality website here: go.osu.edu/waterqualityextension
Soil health is a critical impact for many areas of agronomy, horticulture, and natural resources, with ties to entomology, plant pathology, engineering, chemistry, and many other disciplines. Information related to soil health assessment, management, and research can be found on the Soil Health website: soilhealth.osu.edu



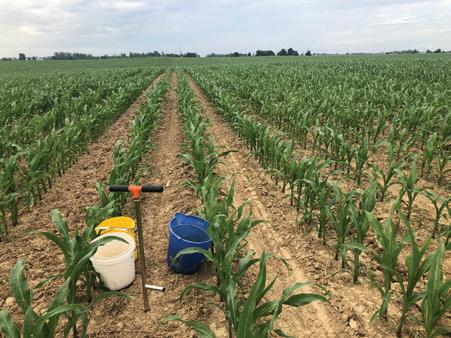

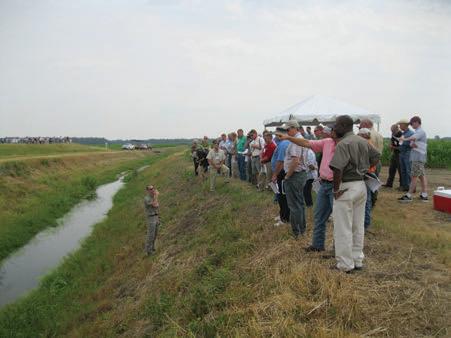
Selecting the most effective best management practices (BMPs) for the specific field situation is critical for success. Learn about critical concerns and the BMPs that can help address them at the Ag BMP website here: agbmps.osu.edu
H2Ohio is Governor Mike DeWine’s initiative to ensure safe and clean water for all Ohioans. It is a comprehensive, data-driven approach to improving water quality over the long term. H2Ohio focuses specifically on reducing phosphorus, creating wetlands, addressing failing septic systems, and preventing lead contamination. Learn more at: h2.ohio.gov


Determine how tillage and fertilizer methods impact soil microbial abundance and enzyme activities in Stark County OH.


OSU Extension
Stark County
Soil microorganisms are the workhorses of the soil. They are responsible for breaking down decomposing material (organic matter) and releasing nutrients (N, P, S, etc.) back into the soil for plants to take up. Through this process of decomposition, soil organisms release CO2 making them an important part of the soil carbon cycle. Soil microorganisms must produce enzymes to carry out decomposition. The enzymes studied here are acid phosphatase responsible for making P plant available and NAGase and glucosidase which cycle carbon and N. These biological measurements contribute to soil health assessment.
Soils were sampled at the 0-6 inches soil depth across 12 farms in Stark County OH in Sept/Oct 2020. All sampling locations were in Canfield silt loam soil. Fertilizer methods: 6 farms use manure in fertilizer method, 6 farms do not include manure Tillage methods: 2 farms have perennial orchardgrass/alfalfa hay production, 2 farms use no-till, 4 farms use moldboard plow, 4 farms use vertical tillage. Soils analyses included microbial abundance and structure using fatty acid methyl esters and microbial enzyme activities of 3 different enzymes.
There is a strong positive relationship between soil organic matter and soil microbial abundance (Figure 1). Organic matter provides more habitat and food for soil microorganisms. Soil microbial enzyme activity was greatest in hay fields and not different among cultivated fields (Figure 2). The high microbial populations in hay fields were likely due to the constant presence of living plants, lack of soil disturbance, and diversity of plant species. The lack of difference between no-till and moldboard plow fields may be due to the inclusion of manure (an excellent food source for microorganisms) as a fertilizer in the fields under moldboard plow. One observation not depicted here is that the one organic farm in the project had the most soil fungi among all cultivated fields. The reason for this is still to be determined.
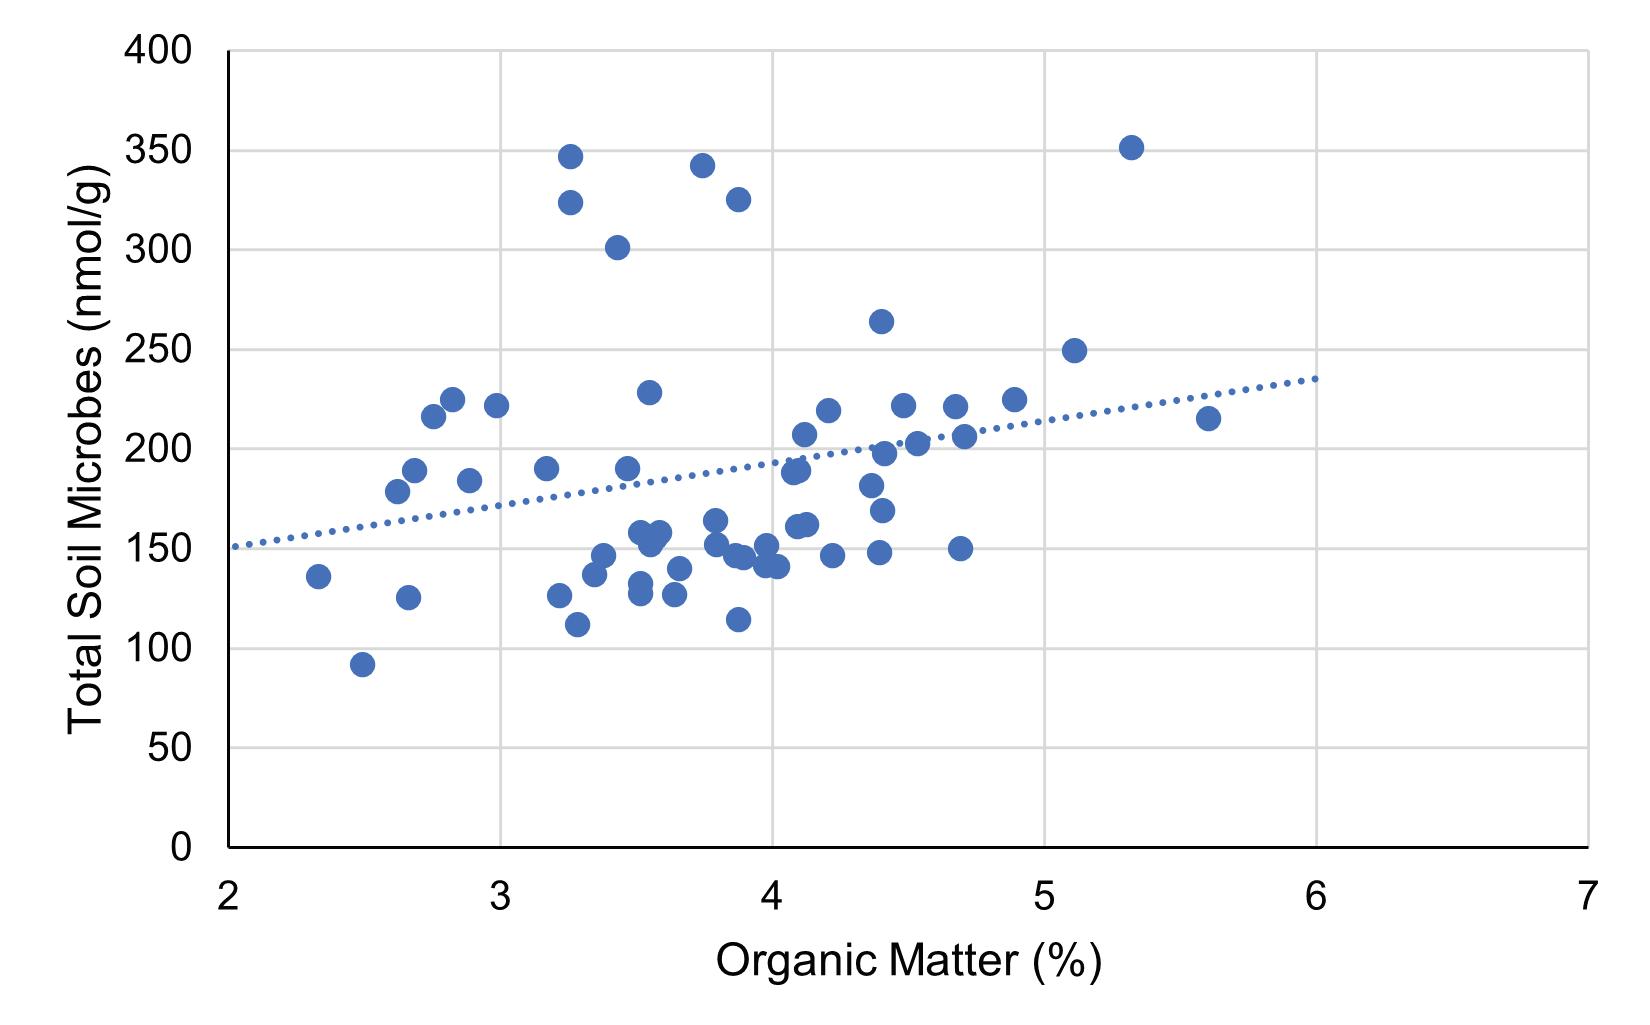
Figure 1. Strong positive relationship between soil organic matter and soil microbial abundance at the 0-6 inches soil depth

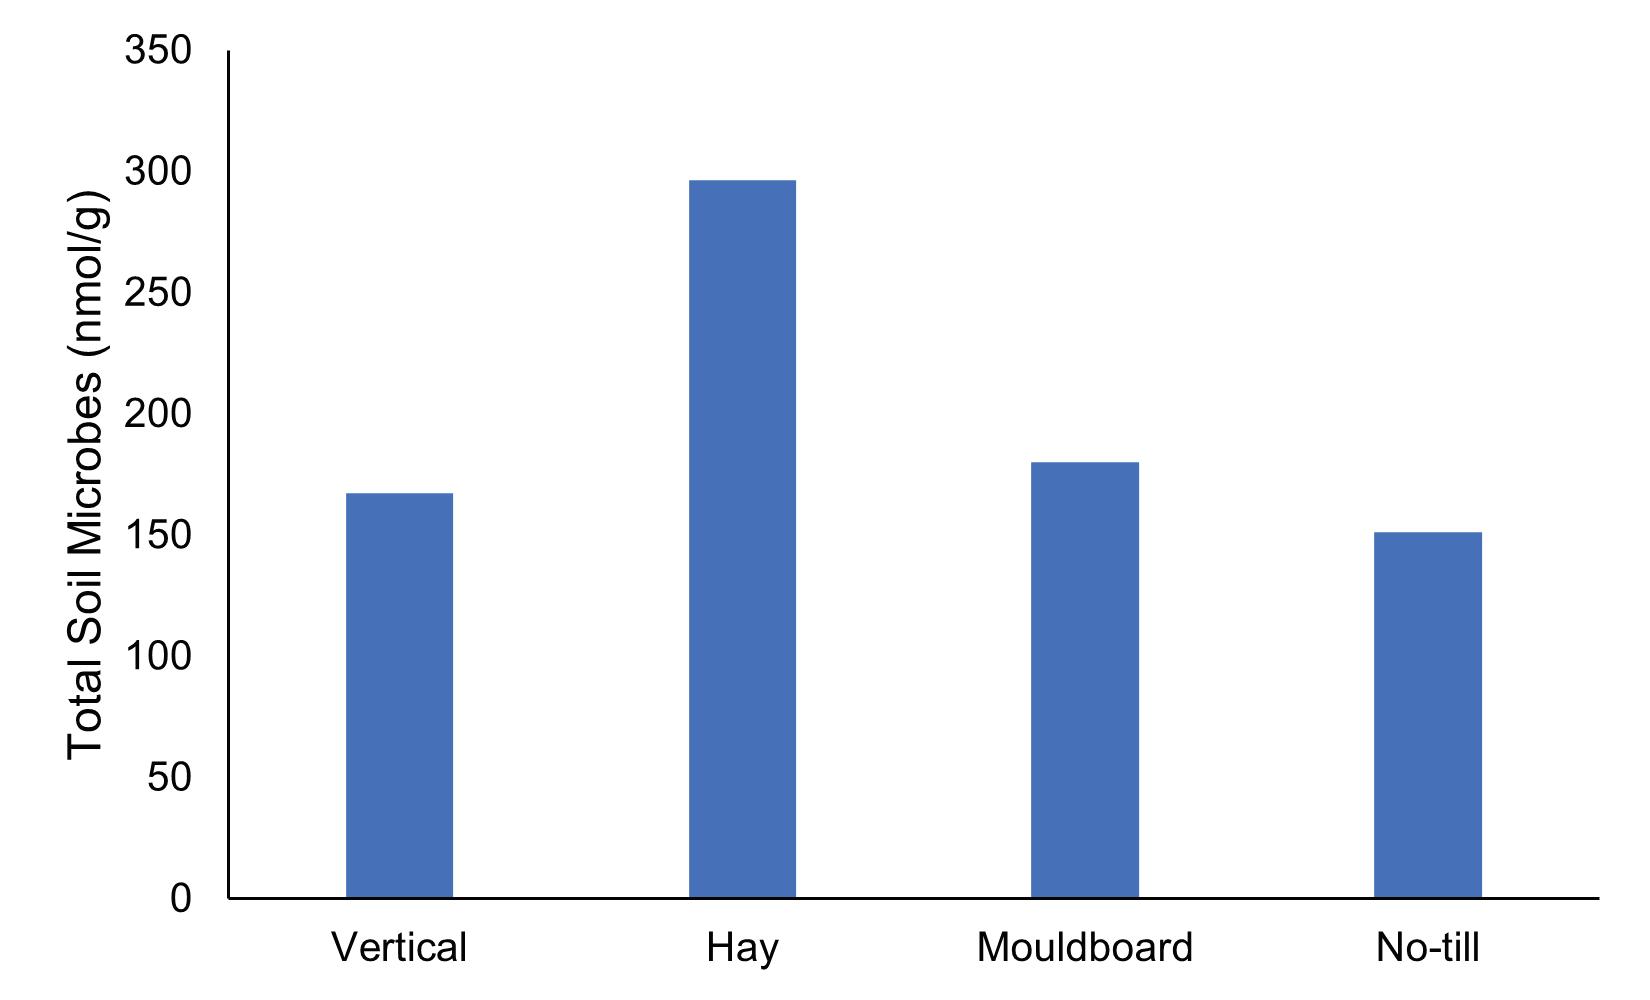
Figure 2. (a) Enzyme activity of three soil enzymes according to tillage methods. (b) Soil microbial population according to tillage methods. These observations are at the 0-6 inches soil depth.
• There was no difference of soil microbial abundance or activity among no-till, vertical tillage, and moldboard plow which is unexpected. It may be that inclusion of manure as a fertilizer in tilled fields sustains the soil microbial population.
• Enzyme activity and microbial abundance were greatest in hay fields probably due to lack of soil disturbance, constant vegetative cover, and a diversity of plant species”
OSU Dr. Richard Dick Soil Microbiology Laboratory
This project is supported by funding from the Paul C. and Edna H. Warner Endowment Fund for Sustainable Agriculture for On-Farm Research in collaboration with the Stark Sustainable Soils Initiative which is funded by the Herbert W. Hoover Foundation.
For inquiries about this project, contact Dr. Kathleen Bridges (bridges.200@osu. edu), or Heather Neikirk (neikirk.2@osu. edu).
Survey Ohio farmer fields to better understand how soil health values are influenced by soil type and CEC, sampling depth, and past management practices such as manure use, no-till and cover cropping.


Measuring soil health properties represents a great opportunity to better understand how farm management practices impact key soil functions. Soil health testing builds on our current methods of soil testing to provide additional information to farmers. Rather than focusing solely on soil chemistry, additional biological and physical components of soil are incorporated into a common framework. Building and maintaining high functioning soils require that all three key components (chemistry, biology and physical structure) to be consciously managed and optimized. There are many potential soil health measurements or indicators to choose from. Total organic matter is a very important soil property that is commonly measured in standardized soil tests. However total organic matter is not an ideal indicator of nutrient availability – because the majority of this pool is not plant available and typically changes very slowly over time. Active organic matter is only a small fraction (5-20%) of the soil’s total organic matter, but is very important to crop nutrition since nutrients in this fraction are rapidly cycled and taken up by crops.
Total Organic Matter
• Loss-on-Ignition
(Routine soil test)
• POXC
• Respiration
Figure 1. Not all organic matter is created equal. Total organic matter is made up of passive, slow and active pools. The active pool is small but very important for crop nutrient cycling and update.
Since soil organic matter influences so many soil properties, organic matter tests are of particular interest. Roughly half of organic matter is made up of carbon. Carbon is the backbone of life and is the currency that plants and the soil food web use to cycle nutrients and energy throughout the soil. For this study, we selected the following three indicators of organic matter:
1. Total Organic Matter. A very important soil property that is has long been recognized as a master variable in soil. This is commonly measured in routine soil testing.
2. Permanganate Oxidizable Carbon (POXC). POXC is a simple, inexpensive test that uses a weak oxidizing solution to measure readily available carbon. Oxidation is the chemical process of decomposition with oxygen. We can think of it the same way as a fire using oxygen to react with wood. In the case of the soil, it’s a microorganism using oxygen to get energy (fire) from soil organic matter (wood). The more oxidation that happens, the more POXC there is in the soil. Research has shown POXC to be very sensitive to management changes (cover crops, tillage, rotations, etc.) and it is therefore a good indicator of recent changes to management.
3. Soil Respiration. This method measures the burst of CO2 from a dried soil over 24 hours after it has been rewetted with water. Drying and wetting cycles occur naturally in soils. When soils dry down, organisms go into a resting state to survive. This method measures how fast the soil food web can ‘wake back up’ and become active again. Carbon dioxide (CO2) is the product of oxidation of active organic matter. (We can use the same analogy here as the burning wood with a fire.) The more CO2 that is respired, the more active organic matter is in the soil. Note the Solvita® test is based on this method. This test is also very sensitive to changes in management.
Soils were sampled from 120 fields across 29 counties in Ohio in May-July 2021 (Figure 2). Soil cores (10-15 cores per sample) were taken from 3 different depths:
• 0 – 4 inch
• 0 – 6 inch
• 0 – 8 inch
Soil cores from each depth were pulled from the same locations. Fields represented different soil types and management histories (ex., long-term no-till vs. recently tilled, history of cover crops vs. no recent cover crops). All soils were mailed to the Ohio State Soil Fertility Lab for analyses. Analysis included:
• Routine nutrient analysis:
◦ Soil pH
◦ Mehlich-3 extractable P and K
◦ Cation exchange capacity (CEC)
◦ Soil health analysis
◦ Total organic matter
◦ Permanganate oxidizable carbon (POXC)
◦ Respiration
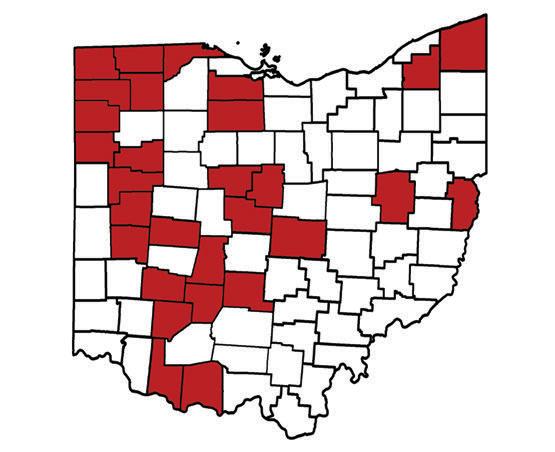
Figure 2. Soil samples were collected from fields across Ohio (counties highlighted in red are where samples were collected) and lab analyses that help characterize soil health.
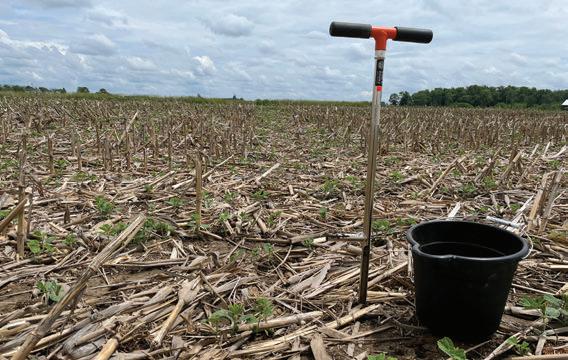


A primary challenge of quantifying soil health is to know how soil type influences your values and what represents a ‘good’ vs. ‘bad’ value. Cation exchange capacity (CEC) is a reasonable predictor of soil type, with sandy soils having low CECs and clay soils having higher CECs. We examined how CEC was related to total soil organic matter, POXC, and respiration (Figure 3). Overall, all three measurements increased as CEC increased. However, the slope (steepness) of the blue line represents the influence the CEC has on the soil variable. Total organic matter had the strongest relationship with CEC, followed by POXC and then respiration having the weakest with CEC. This suggests that POXC and respiration are less influenced by soil type, and more reflective of soil management history than total organic matter This agrees with other studies that have shown this same trend.
Figure 3. The influence of cation exchange capacity (CEC) on total soil organic matter, permanganate oxidizable carbon (POXC) and respiration. Total organic matter is more strongly driven CEC than POXC and respiration.
As expected, most soil properties differed according to the depth the soil was sampled. The shallower depth (0-4”) yielded greater values than the deeper sampled soils (0-6 inches or 0-8 inches). Nutrients and organic matter are naturally stratified in soil (enriched at the surface) relative to deeper depths. This underscores the importance of keeping sampling depth consistent between samplings and over time to be able to evaluate trends in soil test values.
Table 1. Soil properties by depth, averaged across all fields. Nutrients and organic matter pools were enriched in shallow depths (0-4 inches) relative to lower depths (0-8 inches).
Using manure as a nutrient source has great potential to increase soil health. Figure 4 shows the distribution of values across all fields. Soils that have received manure over the past 5 years (blue distribution) had greater total organic matter, POXC and Respiration values compared to fields that had not received manure (red distribution). This aligns with past work that demonstrates the positive impacts that manure can have on both soils and crops.
Figure 4. The distribution of organic matter, POXC and respiration values in fields receiving manure in the past 5 years (blue) vs. fields that have not (red).
Years in no-tillage had mixed effects on soil health in farmers’ fields (Figure 5). Measurements of total organic matter, POXC and respiration had weak relationships with years in a no-till. Similar to our results from 2020, no-till did not show a clear trend in soil health, likely indicating that differences in soil type and other management practices need to be examined when considered effects of long-term no-till practices. Previous studies have shown the potential of no-till to build soil organic matter, but these effects are likely soil specific and interact strongly with other management practices which need to be considered.
Figure 5. The influence of years in no-till on soil organic matter, POXC and respiration.

The number of years a field was in cover crops was associated with positive increases in all three soil health measurements (Figure 6). When considering shorter timeframes, soils that had cover crops or perennials over the past 5 years (blue distribution; Figure 7) had greater total organic matter, POXC and Respiration values compared to fields that did not (red distribution; Figure 7). Our results suggest growing cover crops or rotating with perennials can improve soil health in both the short and long-term.
Figure 6. The influence of years growing cover crops on soil organic matter, POXC and respiration.
CC.or.Per No Yes
(ppm)
Figure 7. The distribution of organic matter, POXC and respiration values in fields with cover crops or perennials in the past 5 years (blue) vs. fields that did not (red).
• Soil type matters. The type of soil has a major influence on soil health properties. We need to adjust what a ‘good’ soil health value is based on the type of soil. As CEC increases:
◦ Total organic matter, POXC and respiration increase
◦ We are developing baseline values for what an average, low and high value is for different soil types
• Depth of soil sampling matters. As sampling depth increases, soil values typically decrease. We need to consider the depth sampled when we examine soil health values and be consistent with depth the soil is sampled over the years.
• Management matters. The way soils are managed over time have large impacts on soil health. Across 120 fields, we found that:
◦ Fields receiving manure within the last 5 years had greater average soil organic matter values than those not receiving manure
◦ Years a field was in no-till had little influence on measured soil organic matter values
• It is likely that we need to consider both soil type and other management practices in order to fully understand the impacts of no-till on soil health.
◦ Fields in cover crops and perennials had increased soil organic matter values, including
• The number of years a field was in cover crops or included perennials in the rotation
• The presence of cover crops or perennials within the last 5 years
• Managing soil carbon inputs vs. losses. Our data suggest that carbon inputs (manure, cover crops, perennials) drive soil health to a larger degree than managing carbon losses via no-tillage. This is an active area of research needed to untangle the complexities of management on soil health in real working farms across Ohio.
• Much more work is needed. Although we analyzed 347 soil samples from 120 fields, this dataset in no way is comprehensive and additional work is needed to better understand the trends observed here.
• Observing trends over all fields vs. individual fields? This analysis considers all fields together, but there are worthwhile stories to be told on individual fields. The power of soil health analysis is that it provides more insight on individual fields, therefore empowering farmers to become better managers of soils.
Soil Health Evaluation
Soil samples can be used to better understand changes in the soil over time. Total organic matter, POXC, and respiration are lab tests to consider when tracking soil health.
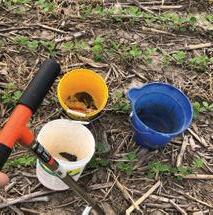
For inquiries about this project, contact Steve Culman (culman.2@osu.edu), John Fulton (fulton.20@osu.edu), or Elizabeth Hawkins (hawkins.301@osu. edu).
The Stark Sustainable Soil Initiative was started in 2020 in Stark County OH to determine how tillage and fertilizer methods affect soil carbon and other soil health properties on a silt loam soil.


OSU Extension
Stark County
Soils were sampled at the 0-6 inches and 6-12 inches soil depths across 12 farms and 2 woodlands in Stark County OH in Sept/Oct 2020. All sampling locations were in Canfield silt loam soil. Fertilizer methods: 6 farms use manure in fertilizer method, 6 farms do not include manure Tillage methods: 2 farms have perennial orchardgrass/alfalfa hay production, 2 farms use no-till, 4 farms use moldboard plow, 4 farms use vertical tillage. Soils analyses included routine nutrient analysis, soil organic matter, total carbon and total nitrogen, aggregate stability, and bulk density.
These soil samples were all collected from the same silt loam soil type therefore texture is not a factor in the results. The maintenance of soil organic carbon in soils under moldboard plow compared to no-till and reduced till (Figure 1) may be due to inclusion of manure. This is the first year of a five year project. More years of data will determine if these results continue over time. There is a strong relationship between organic matter and yield and a negative relationship between bulk density and yield (Figure 2). As organic matter increases, bulk density decreases, and aggregate stability increases. These results are consistent with other studies.
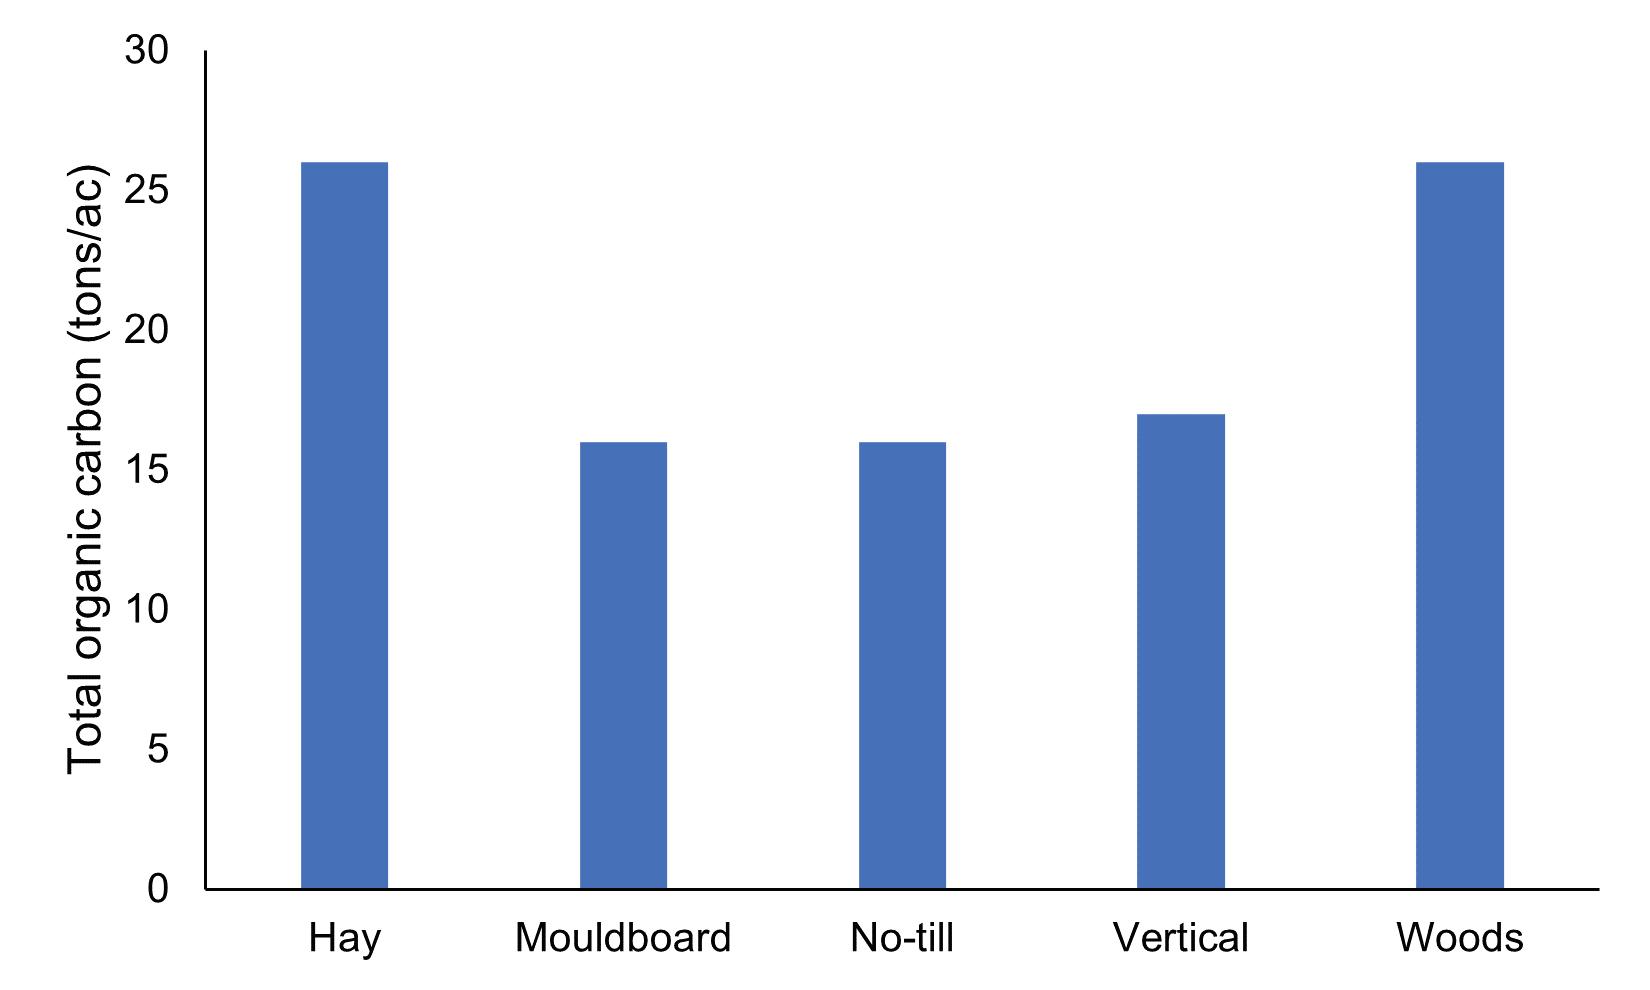
Figure 1. Soil organic carbon in top 6 inches of soil under different tillage methods
CFAES Rattan Lal Carbon Management and Sequestration Center
Funding for this on-farm research project is provided by the Herbert W. Hoover Foundation

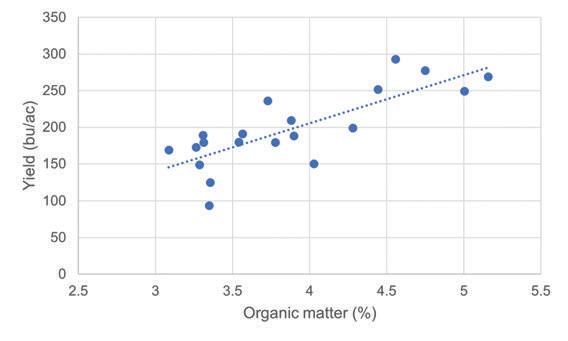

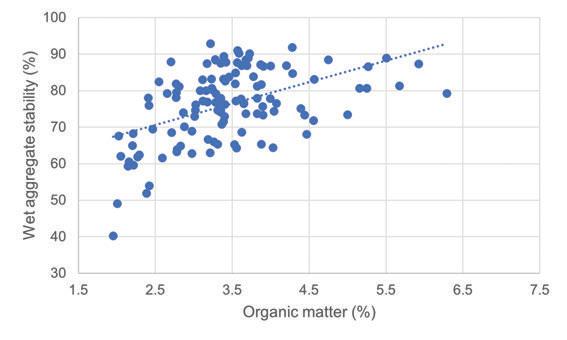
Figure 2. Relationships between (a) soil organic matter and yield, (b) soil bulk density, and (c) aggregate stability. Yield is reported as individual small plot corn yields not whole field averages.
• Inclusion of manure may mitigate negative tillage impacts as more intense tillage (moldboard plow) did not result in less soil organic carbon compared to no-till
• Manure and soil need regular testing to avoid nutrient loading
• Increased soil organic matter may increase crop yield by improving soil physical properties such as reduced bulk density and increased aggregate stability
Perennial pasture
Perennial pasture in the rotation can increase soil organic carbon. Regular nutrient testing of manure fertilizers as well as soils will aid in reducing over application of fertilizers that could be detrimental to environmental and water quality as well as save producers money.
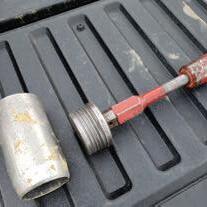
For inquiries about this project, contact Dr. Kathleen Bridges (bridges.200@osu. edu), Dr. Rattan Lal (lal.1@osu.edu), or Heather Neikirk (neikirk.2@osu.edu).
Helping growers make the most of precision and digital ag technologies.
The Digital Ag program at The Ohio State University embodies the best of the land grant mission - creation, validation and dissemination of cutting-edge agricultural production technologies. The central focus of this program is the interactions of automation, sensing and data analytics to optimize crop production in order to address environmental quality, sustainability and profitability. The team works on the development of hand-held devices for in-field data collection, apps that aid in calibration of applicators, remote sensing and monitoring, and enhanced data analysis for shorter turnaround time.
For more technology research and information from The Ohio State University’s Department of Food Agricultural and Biological Engineering and industry partners, explore the following resources:
Today’s agricultural community relies on data and tools to help support decision making at the field level. Data-driven insights help agronomists and farmers to predict what is coming, and decide how to act upon this information more effectively, which can improve on-farm decision making and execution. Ohioline is The Ohio State University’s Fact sheet database with helpful information on a variety of subjects. For the full database visit: ohioline.osu.edu/findafactsheet
On-farm technology and data management services help farmers maximize production and become more sustainable. Tech Toolshed is a soy checkoff resource to help you maximize the technology you currently have while integrating new technology and managing the data available. The USB- Tech Toolshed website can be found at: unitedsoybean.org/techtoolshed/
The Ohio State Digital Ag Program conducts studies related to all aspects of the corn production cycle. Research related to corn planting, cropping inputs, and harvesting technology can be found on the Precision Ag website: digitalag.osu.edu


Experience and learn about cover crops, nutrient management, soil health, no-till equipment, digital ag, and other topics essentials for success.
2022 Events:
March 8-9
Virtual Conservation Tillage Conference
ctc.osu.edu
April 8
Ohio No-Till Spring Field Day
Fairfield County - David Brandt Farm
6100 Basil Western Road, Carroll, OH
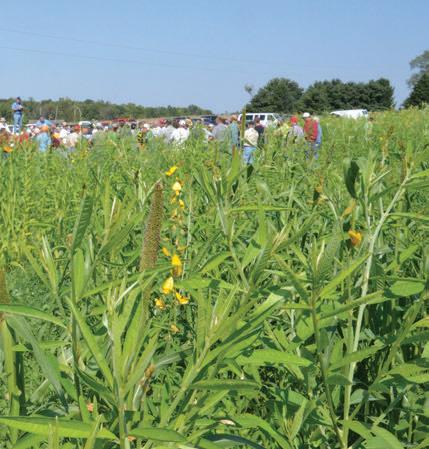

Ohio No-till Summer Events
August, date and locations TBA
December 7
Ohio No-Till Winter Conference
Details TBA
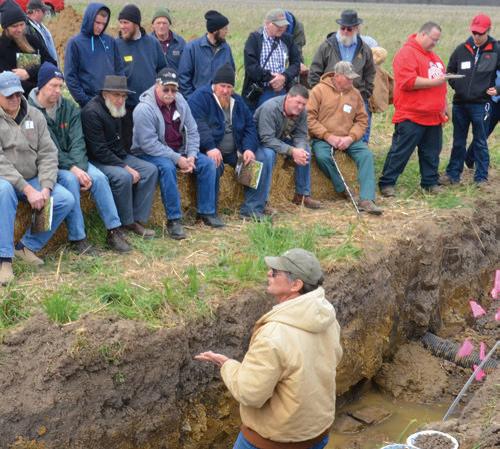
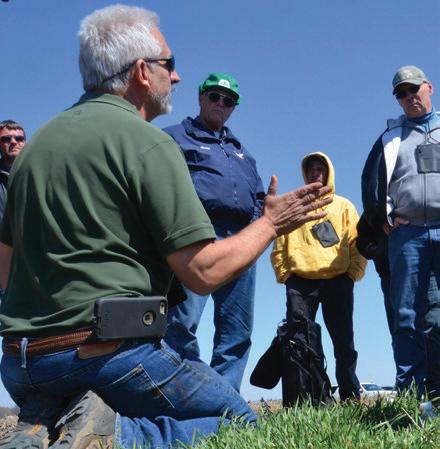
Visit ohionotillcouncil.com to view event details and register.
Look for an updated “Ohio No-Till News” page in each mid-month issue of Ohio’s Country Journal.
Understand the relationship between dry matter and NPK nutrients in liquid manure during application.


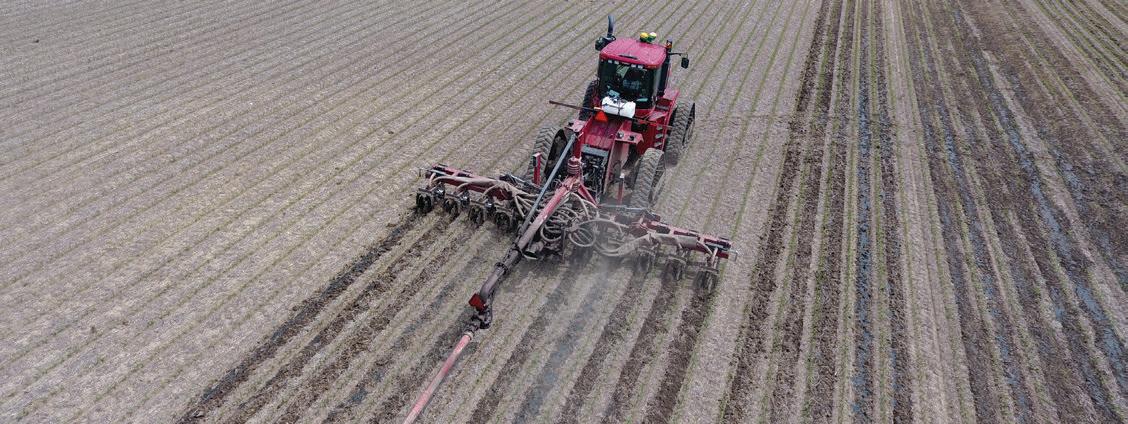
Illustration of side-dressing liquid manure using draghose and an injection toolbar
A multi-farm study was conducted from May 2020 through September 2021 during liquid manure application in Darke, Auglaize, Wayne, and Williams Counties, with all manure sources being from swine pits along with additional support across the state. Manure was applied via a dragline applicator with sampling ports installed on the outermost rows of the toolbar. During field application, manure samples were collected for the duration of pumping a pit at a time interval of 15 to 20 minutes. A complete sample analysis was done at Brookside Laboratories and the samples were evaluated for changes in manure dry matter and NPK concentrations. Data analysis was run on the sample test results comparing the changes of dry matter (DM) to NPK (Total N, P2O5 and K2O) using correlation analysis to determine the strength of the relationship of each nutrient to Dry Matter. A correlation of 1.00 is perfect and a correlation of 0.99 - 0.75 is highly and any correlation that is negative expresses an inverse relationship.


Sources of variation are present in all aspects of manure storage and management. Pit management varied from one collaborator to the next beyond agitation. The use of pit additives and pit management were unique to each farm. The variation in manure color changed as the dry matter changed throughout application. Depending on the manure pump, as the capacity of manure supplied to the field increased larger amount of concentrated solids were seen after application.
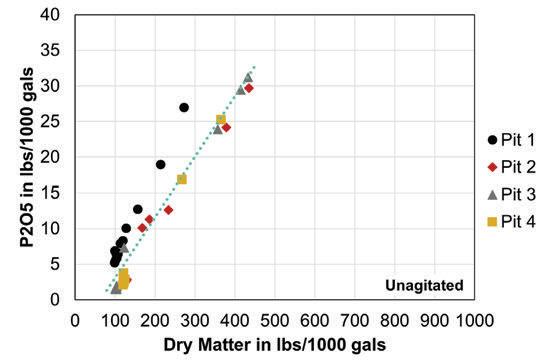
• Total N was correlated with DM for six of the eight pits with pits 1 and 8 resulting in low R values.
• P2O5 concentrations were highly correlated with DM for both the agitated and unagitated pits (R ranged from 0.79 and 1.00; see table and figures).
• K2O concentration was not correlated with DM for any of the pits.
• Of interest, agitation generated more consistency and higher N and P concentrations causing the N and P2O5 versus DM data to cluster more (see agitation figures).
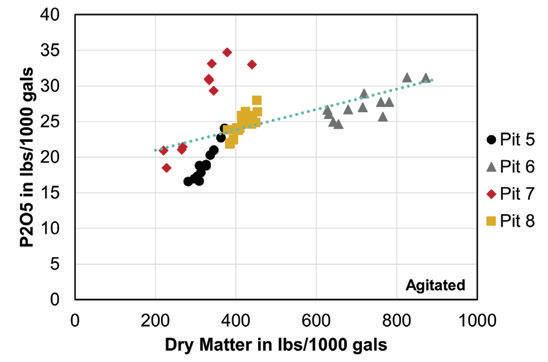
Correlation coefficients (R) comparing DM and nutrient concentrations.
Pits
Pits
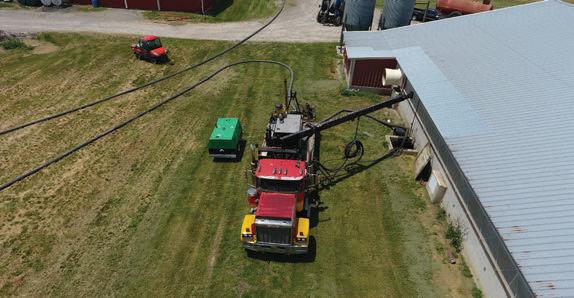
For inquiries about this project, contact Chris Shoup (shoup.83@osu.edu) or John Fulton (fulton.20@osu.edu).

Technology is quickly advancing worldwide, and we are becoming more dependent on it for both our work and personal lives. Agriculture is utilizing these advancements to improve precision agriculture (PA) technologies on farms to maximize profits and increase efficiency. Today, as many farm machines leave factories with data collecting technologies installed, there is potential to collect large volumes of data from a farm including yield maps, as-applied maps, as-planted data, remote sensed imagery, weather, and scouting data. However, this technology tends to require complex methods for accessing and interpreting data collected. Creating a digital strategy for the farm helps farmers plan for, manage, and implement the findings of collected data. A digital farm strategy is a plan for collecting, organizing, storing, sharing, and securing farm data that improves operations by maximizing revenue and reducing costs and risks. Setting goals and outlining ways to collect and use data is important to the strategy as many farms already collect data but do not realize it or understand how to use the data. The focus should be placed on saving, securing, and sharing the data as the outline is created. The use of data in agriculture has been proven to provide value for a farm, so follow the steps below to develop a digital strategy.
In today’s world where we are using mobile applications and online sites for both business and personal purposes, it has become important to be using good practices for creating and managing our log-in details; in particular passwords. In 2021, there have been several cybersecurity attacks including two agriculture retailers being hit with ransomware. For an individual, having a plan in place and using available resources to help with managing log-in details is important especially for farmers. Here are several tips and suggestions for managing passwords.
• Use password management software or platforms such as LastPass or 1Password
• Make each password unique, using combinations of upper and lowercase letters, numbers, and symbols
• Use Two-Step Verification such as DuoPush, text, or email when available
• Enable alerts for suspicious activity
• Change passwords when made aware of a security breach
• Don’t share passwords
• Delete old and inactive accounts
• Don’t use common phrases or default passwords such as “12345” or “password”
• Consider using long phrases or a short quote and rearrange it and add in numbers or symbols when possible
• String “random” words together
• Do not use personal information such as your birth date or part of your name
Finally, it is not if a data breach will happen today but rather when. Most companies have good cybersecurity in place and contingency plans if there is an attack on their platform. Here are a few suggestions if a data breach occurs.
• Identify the specifics to what data was breached
• Change passwords immediately
• If it contains financial information, notify banks and check your credit report

1. Identify the precision agriculture technologies being used on the farm.
2. Identify the data collected by these technologies.
3. What is your objective for the data being collected?
4. What data and digital tools do you plan to use to meet that objective and why?
5. Are you using any digital tools? If so, list.
6. If not using any digital tools today, do you plan to use any in the future?
7. What, person and/or entity, do you plan to share data with? List all.
8. What specific data do they require you to share with them? List all.
9. How do you plant to share data both internally and externally?
10. What is your internal plan to store, archive, and secure data?
• Do you have a local storage device at the farm (i.e., laptop, external hard drive, server)?
• Do you use an agriculture cloud storage service (i.e., Box, DropBox, Google Drive, etc.)
• Do you use an agriculture cloud platform (i.e., JD Operations Center, Climate FieldView, Encirca, etc.)?
• How do you back-up or have a second copy of your data?
11. Do you have a means to review and understand data agreements?
12. How do you define success and evaluate the outcomes of your strategy?
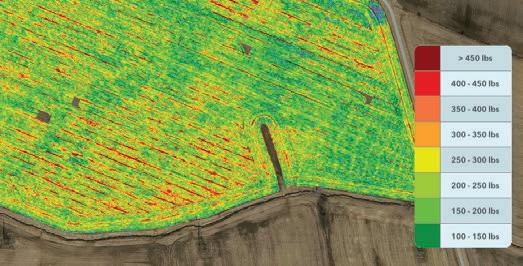
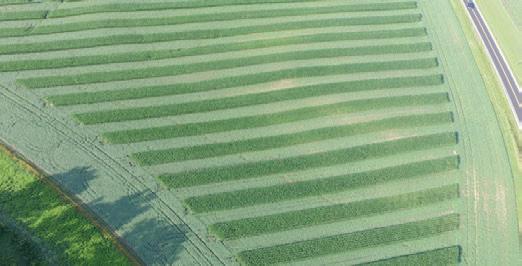
Data compatibility creates challenges as transferring and sharing data collected from various brands of equipment can be difficult. File formats create another hurdle as they require special software to view and use them. Most file formats generated by precision agriculture technologies are proprietary in nature meaning you need special software to read and use it. Other aspects to consider is data storage, sharing and legal aspects around farm data. Storing data properly is a critical part of using data effectively. Data should be archived in both an on-farm and off-farm storage location (i.e., “in the cloud”) to ensure there is a backup that can be accessed in any scenario. On-farm data storage should be in a locked, fireproof safe, while cloud solutions should be password-protected and should utilize any available cyber security features. The ability to efficiently share farm data is becoming important as companies and consultants provide PA services and the use of digital technologies on the farm. Sharing farm data can be difficult if a clear plan for storing and organizing data has not been outlined in a digital strategy. Finally, When dealing with mobile applications, digital tools, and equipment and devices connected to the internet, farmers must adhere to any legal agreements that have been established. These data agreements will outline important considerations, such as data privacy and how data can be used within or outside of a company, including by affiliates. It is therefore important to incorporate the legal implications of collecting and sharing farm data into one’s farm digital strategy. While precision technology presents some challenges, the amount and variety of data can significantly benefit farming operations.
You can learn more by reviewing the Fact Sheets located on Ohioline:
• FABE 555 Developing a Farm Digital Strategy 1 – Introduction: https://ohioline.osu.edu/factsheet/fabe-555
• FABE 556 Developing a Farm Digital Strategy 2 – Precision Technology and Data Generation: https://ohioline.osu.edu/ factsheet/fabe-556
• FABE 557 Developing a Farm Digital Strategy 3 – Data Management Considerations: https://ohioline.osu.edu/factsheet/ fabe-557
Characterize potential variations in liquid swine manure nutrient concentrations as pits are pumped for field application.
A multi-farm study was conducted from May 2020 through September 2021 while liquid manure was being applied before planting, at side-dress in corn, or after harvest. The cooperating farms were in Darke, Auglaize, Wayne, and Williams Counties with all manure sources being from swine pits along with additional support across the state. During manure application samples were collected at the applicator to develop a data set of as-applied nutrients over time. Samples were collected for the duration of the application process at a time interval of 15 to 20 minutes. Sample bottles were labeled and then taken to Brookside Laboratories for complete sample analysis to determine Lost by Ignition + Mineral Matter (Dry Matter), Total N, Ammonia N, P2O5, K2O. Lab results were then summarized and then analyzed to evaluate changes in manure dry matter and nutrient concentration for the pits. Pumping rate, agitation, and timing of sample collection were noted at each pit to clarify changes in nutrient concentration and identify trends from the data.


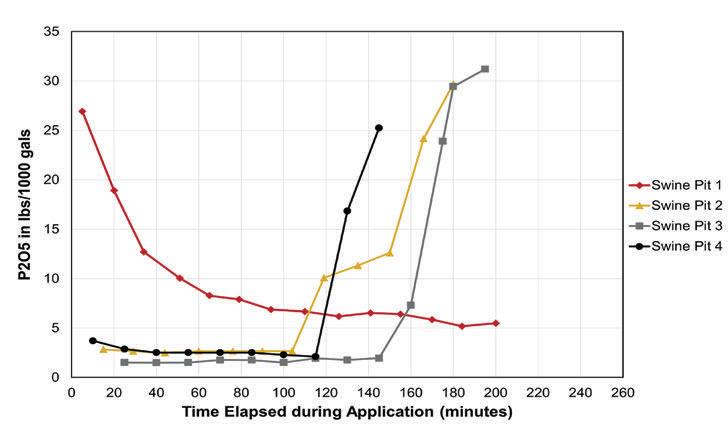
P2O5 results collected from unagitated swine pits.
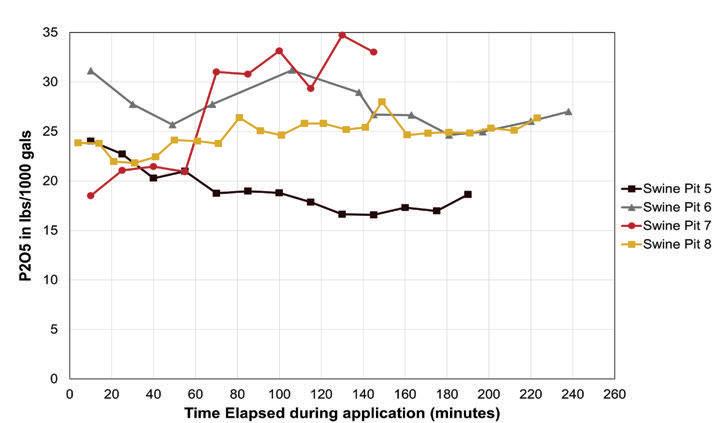
results collected from agitated swine pits.

During application, manure from the unagitated pits had visual changes in consistency from the beginning to the end of pumping in both color and viscosity. ln the unagitated pits manure became darker in color, the flow of the manure slowed as the pit emptied, and viscosity increased. The agitated pits were more consistent regarding flow during pumping, and the color change was not as noticeable from beginning to end. Agitation did not break up all the solids, but it eliminated the visual inconsistency of color and minimized changes in viscosity. Of note, pit 1 had no pit additive used and had a noticeably higher amount of suspended solids near the surface. Application was also ended before emptying the pit, leaving a third of the pit to be applied in the spring, while pits 2, 3, and 4 used additives and were pumped completely.
Manure sample collection is important for sound nutrient management on livestock operations. The development of a multiple year sampling reference is the best management practice to develop accurate application rates. Collect a sample during each application, avoiding crusted areas on the surface of the pit. These samples can be used together to calculate an ongoing optimal application rate.
• For the unagitated pits, P2O5 tended to change as the pit was pumped whereas P2O5 varied for the agitated pits but was more constant over the time of application (see Figures).
• Concentration differences in Total N, P2O5 and K2O were different between pits (see Table).
• Total N varied for both the unagitated and agitated pits with Total N variation much higher for the unagitated pits (CV=9.1% to 23.2%; see Table). Of note, the average Total N (35-49 lbs/1000 gals) was higher for the agitated pits.
• The average P2O5 was significantly higher for the agitiated pits (19-27 lbs/1000 gals) but the variation in P2O5 concentration was very high for the unagitated pits with the CVs ranging between 64.8% and 131.7%.
• Agitation during pumping created a more homogenous liquid manure as can be seen with the lower CVs for P2O5 and K20.

For inquiries about this project, contact Chris Shoup (shoup.83@osu.edu) or John Fulton (fulton.20@osu.edu).
Understand how Near Infrared sensors can be utilized to estimate as-applied manure nutrients during liquid manure application.
An on-farm collaboration was set up between Ohio State, eFields collaborating farms, and John Deere to use the Harvest Lab 3000. The Harvest Lab 3000 is an NIR sensor that senses as-applied manure nutrients within slurry manure which can be installed on any liquid manure application equipment equipped with a flow meter. During application the sensor communicates with a GPS receiver mapping as-applied manure nutrients. The sensor displays all readings on the in cab display similar to the yield results in a combine. For this study, a calibration curve developed for swine manure was used to determine as applied nutrients. Throughout application samples were collected at the toolbar and then compared to the sensor readings looking for trends/bias and to see if ithe nutrient changes from beginning to end were captured in the maps.


OSU Extension Statewide
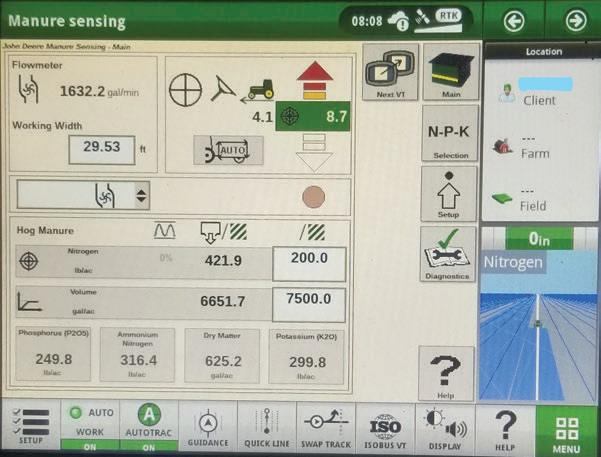
Cab display screen of the sensor during application.
There were visual differences in the manure during application at each location. As seen in the difference between Figures 1 and 2 if a single pit sample could be relied upon to predict the nutrients during application the maps should be the same. A singlular pit sample concludes that all nutrients vary proportionally to each other but the Figures below show how the nutrients vary independently of one another. NIR sensors by design are very precise but are only as accurate as the calibration curves the sensors are referencing to determine nutrient value. The NIR calibration curves calibrated for the livestock production system here in North America are still be updated and developed to become as accurate as possible. With time the sensors could be as accurate as a lab but by creating a compact and mobil sensor, labs have an advantage in computing/processing capacity. As technology continues to progress so will the calibration curves and capacity of the sensor increasing the accuracy of this system. Of note, pit 2 was a mixed manure source 85% beef manure and 15% swine manure which a calibration curve does not exist for.
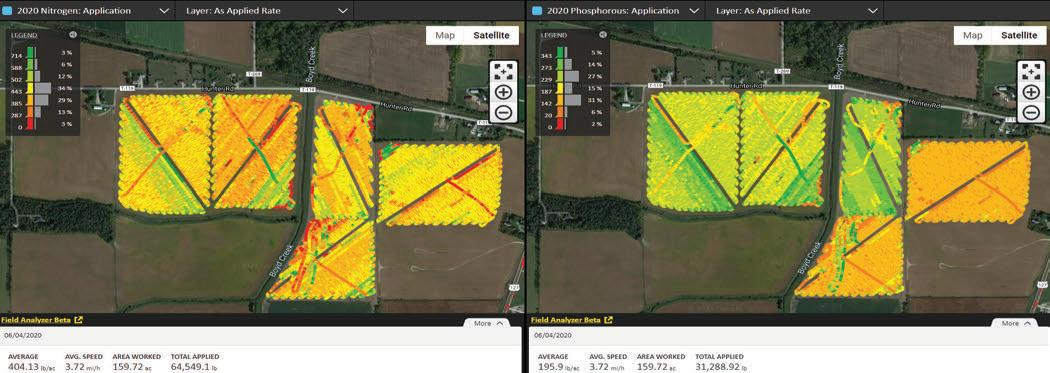
• The sensor calibration curves used in this study were not developed for the mixed manure sources that were field applied.
• Results indicated the NIR sensor did a good job of relatively estimating the P2O5 and Total Nitrogen variations during field application.
• Calibration curves for the type of swine/beef manure mix applied during this study would adjust the results more to the 1:1 line.
• A value of the technology was the feedback with the in-cab display to the operator during application to show changes in N and P concentrations allowing an operator the opportunity in the field and at the pump to adjust or maintain the recommended N and P rates (see as-applied maps).
• The variation in Total Nitrogen and P2O5 within the asapplied maps illustrates the challenge of a single point pit sample to inform field application.

Near-infrared (NIR) liquid manure sensors provide the capability to estimate NPK, DM and more during the pumping of pits and field applications. The sensor technology provides operators realtime feedback during field application especially indicating changes in nutrient concentrations at the time of application. This technology also generates as-applied maps for target NPK recommendation.
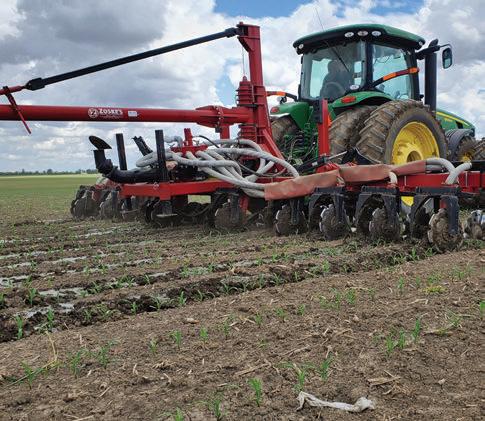
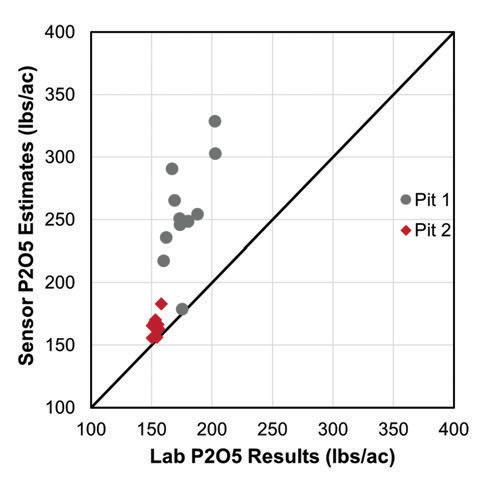
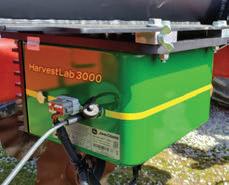
For inquiries about this project, contact Chris Shoup (shoup.83@osu.edu) or John Fulton (fulton.20@osu.edu).
Evaluate the accuracy of yield monitor data by applying post-harvest spatial adjustments.
Planting Date 5/28/2020
Harvest Date 11/5/2020
Variety Pioneer 0843AM
Population 35,500 sds/ac
Acres 15
Treatments6
Reps3
Treatment Width30 ft.
TillageConventional
Management Fertilizer, Herbicide
Previous Crop Soybean
Row Spacing30 in.
Soil Type Strawn-Crosby Complex, 52%
Kokomo Silty Clay, 48%


This study was conducted at the Ohio State Western Agricultural Research Station (WARS) near South Charleston, Ohio with corn as the crop. A randomized complete block design (RCBD) was used that included 6 treatments replicated 3 times. To measure the sensitivity of the mass flow sensors, high and low yield areas were intentionally created by alternating the amount of nitrogen applied (0 lbs N/ac and 180 lbs N/ac) over 800 ft. These yield differences were alternated across the study site at the following treatment lengths: 25 ft., 50 ft., 100 ft., 200 ft., 400 ft., and 800 ft. Each pass was 1,000 ft. long and included 100 ft. of entry to allow the field combine to reach operating capacity and speed along with 100 ft. of exit area so the combine was outside the plot area before grain flow started to decrease. Each treatment pass included 12 corn rows: 8 harvested using a commercial combine and 2 rows by a plot combine leaving a buffer row on each side. The commercial combine harvested in the same direction at a constant speed of 5 mph and was equipped with two commercially available yield monitors. Yield Monitor 1 (YM 1) was a single-point calibrated yield monitor and Yield Monitor 2 (YM 2) was calibrated with multi-point; both were calibrated per operator manuals. No initial lag times were set for either yield monitor. The plot combine stopped every 25 ft. to record yield and grain moisture. Data from both yield monitors and the plot combine were summarized into 25 ft. plots. Shifts were applied in ArcMap at 0.82 ft. (0.25 m) intervals and yield data was re-averaged per 25 ft. plot. Differences were taken between the yield monitor data and plot combine data using absolute values. The shift where the minimum error occurred was recorded for each yield monitor.
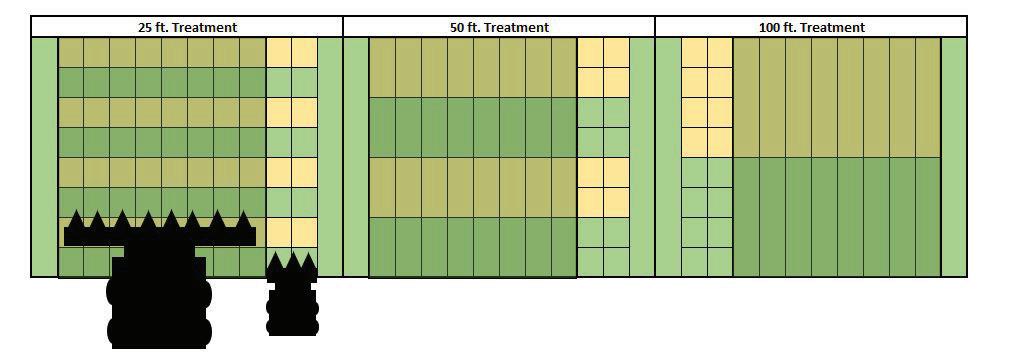
Example field layout illustrating the intentional yield variances being harvested by the commercial combine and the plot combine.
The in-cab displays for both yield monitors illustrated the inability to estimate yield differences between high and low yield plots at shorter treatment lengths. The sensitivity of the yield monitors improved with increased plot length.
Example of a partial 25 ft. treatment where both yield monitors are unable to detect flow changes between the high and low yield plots.

• At shorter plot lengths, the mass flow sensor was unable to detect the change in flow rate between high and low yield zones. Due to this, shifting data at these treatments was not appropriate for this methodology. If using a block or grid layout without sufficient size, potential shifts could influence average yield estimates for a given area.
• Yield Monitor 1 required shifting data back (-21 to -28 ft.; -2.8 to -3.8 seconds) whereas Yield Monitor 2 reduced error with forward shifts (2 to 7 ft.; 0.3 to 0.95 seconds). Since significant differences were seen in shifts between yield monitors, it is recommended to use one combine and one yield monitor when harvesting for an on-farm research study to minimize error.
• Shifting yield data had more of an impact on the 100 ft., 200 ft., and 400 ft. treatments as compared to 800 ft. Initial differences (error) between the yield monitor data and plot combine data decreased as plot length increased.
• In summary, there was not an individual shift that could be applied across all plot lengths and yield monitors. Thereby, for those conducting on-farm research or using yield data for zone analyses, including a sufficient plot length is needed to ensure accurate yield analysis within that area.
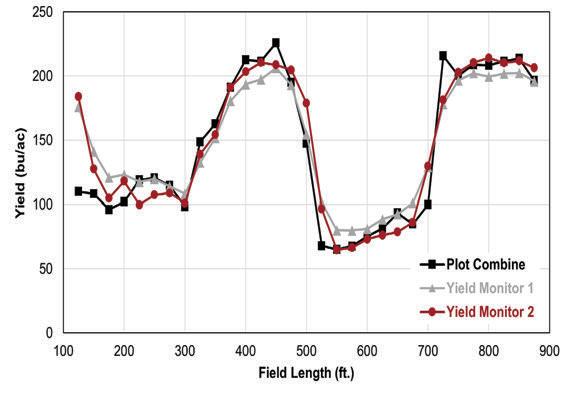
Data from YM 1, YM 2, and plot combine for a 200 ft. treatment with zero shift (left) and shifts applied (right). YM 1 and YM 2 were shifted approximately -21 ft. (-2.8 seconds) and 5 ft. (0.7 seconds), respectively.
ArcMap by Esri
ArcMap is part of a geospatial processing program from Esri. Yield data can be uploaded as shape (.shp) files and viewed, edited, and analyzed within the software.

For inquiries about this project, contact Alysa Gauci (gauci.1@osu.edu) or John Fulton (fulton.20@osu.edu).
Determine if imposed yield variances within a strip trial will impact yield monitor accuracy of accumulated weights.
Planting Date 5/28/2020
Harvest Date 11/5/2020
Variety Pioneer 0843AM
Population 35,500 sds/ac
Acres 15
Treatments 7
Reps3
Treatment Width30 ft.
TillageConventional Management Fertilizer, Herbicide
Previous Crop Soybean
Row Spacing30 in.
Soil Type Strawn-Crosby Complex, 52%
Kokomo Silty Clay, 48%


This study was conducted at the Ohio State Western Agricultural Research Station (WARS) and included a randomized complete block design (RCBD) replicated three times. Intentional yield variances were created in corn by alternating the amount of nitrogen applied (0 lbs N/ac versus 180 lbs N/ac) over 800 ft within a pass. These yield differences were alternated across the study site at the following treatment lengths: 12.5 ft., 25 ft., 50 ft., 100 ft., 200 ft., 400 ft., and 800 ft. Each pass was 1,000 ft. long and included 100 ft. of entry to allow the field combine to reach operating capacity and speed along with 100 ft. of exit area so the combine was outside the plot area before grain flow started to decrease. Harvest occurred in the same direction at a constant speed of 5 mph. Accumulated weights were measured with a commercial combine equipped with two grain yield monitors in addition to a weigh wagon. Yield Monitor 1 (YM 1) was a single-point calibrated yield monitor and Yield Monitor 2 (YM 2) was calibrated with multi-point; both were calibrated per operator manuals. Percent differences were computed between the yield monitor and weigh wagon weights. Accumulated weights between the yield monitors versus weigh wagon were plotted with linear regression lines fit for comparison. The statistical software SAS was also used for analysis.
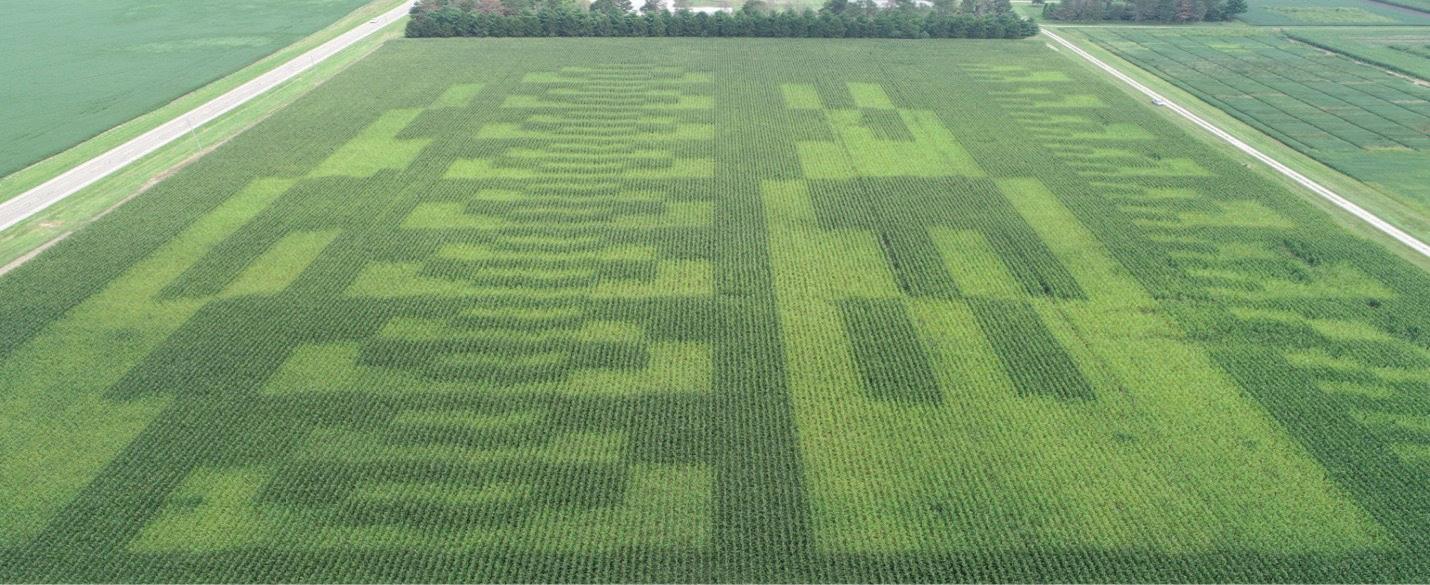
RCBD featuring treatment lengths with alternating nitrogen application for each strip.
Intentional yield variances within each pass were clearly visible both prior to and during harvest. However, when viewing the in-cab displays at smaller treatment lengths, neither yield monitor was able to pick up the low and high yield plots within those treatment passes. Yield differences became more prominent on the display at longer plot lengths for both yield monitors.
• Differences in accumulated weights between the yield monitors (YM 1 and YM 2) and weigh wagon were all less than 3%.
• A strong linear relationship existed between the weigh wagon and yield monitors across all strips (R² ≈ 1). Further, a one-to-one relationship existed between YMs and weigh wagon (slopes = 1).
• There were no significant differences between the two grain yield monitors tested for reporting accumulated weights (p-value = 0.18).
• In summary, when strip trials are used, yield monitors can inform onfarm research and allow for yield comparisons between treatments.

Percent differences between yield monitors and weigh wagon.
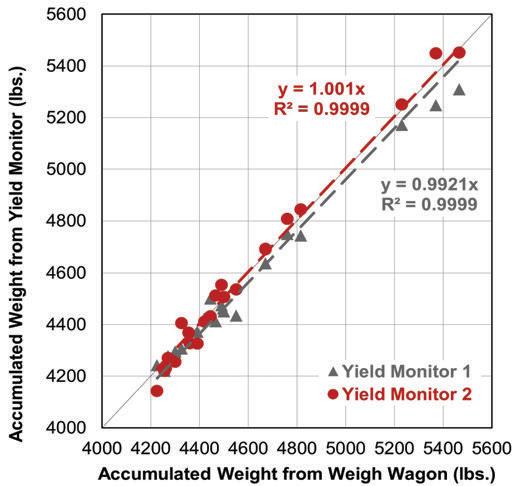
Linear regression lines fit for comparison between yield monitors and weigh wagon.

Most yield monitors in the US use an impactstyle mass flow sensor to measure the clean grain flow (lbs/sec) on a combine. Mass flow sensors require calibration since their output is non-linear as flow varies through the clean grain elevator. Multi-point calibration has become necessary where the combine operator harvests 4 to 8 calibration loads > 3,000 lbs. and then compares the accumulated weight values between the yield monitor and weigh wagon or scaled weights. The key to calibrating the mass flow sensor is to ensure the loads are harvested at different flow rates by adjusting header cut width or ground speed. Calibration load errors should be less than 3% across these different flows to achieve accurate yield results for on-farm studies.
For inquiries about this project, contact Alysa Gauci (gauci.1@osu. edu) or John Fulton (fulton.20@osu. edu).
Use UAV imagery to estimate biomass and nitrogen uptake in cereal rye cover crop fields.
Study areaWestern Lake Erie Basin
Cover crop typeCereal rye
Total fields15
Sampling events3 (T1 to T3)
Sub-field samples 6
Data collectionMarch to May 2021
UAV imagesPhantom Multispectral, Wingtra/ MicasenseAltum
Plant tissue analysis Biomass (T1, T2, T3), Plant tissue chemistry (T3)
Soil testStandard ag soil test (T1), Nitrate and Ammonia (T1&T3)


OSU Extension Statewide
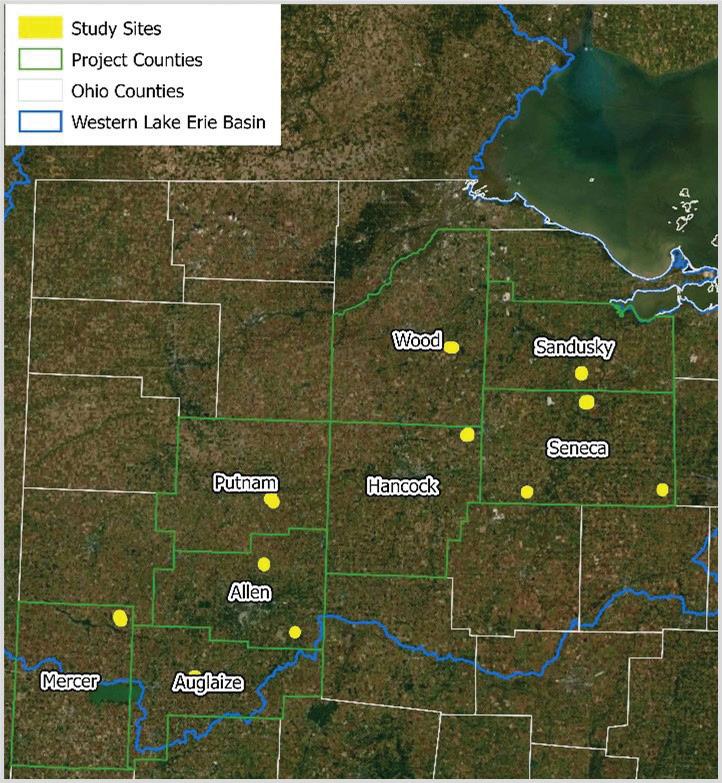
Fifteen farm fields planted with cereal rye across the western Lake Erie basin were sampled three times from March to May. Ground truth data was collected from six sample locations within each field. This data included soil chemistry, plant tissue chemistry, biomass, weed infestation, plant height, Canopeo (% ground cover) measurements, and hyperspectral reflectance measurements. The spectral data from the UAV sensors were used to model biomass and nitrogen uptake at the sample locations. That model was then applied to the full image to estimate biomass and nitrogen uptake across each field.


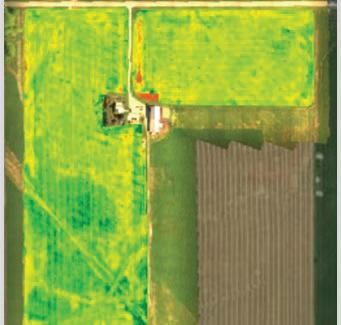
• Model results from a best subsets multiple regression analysis yield an adjusted r-square value of 0.65 and standard error of 20.5g for dry wight biomass, and an adjusted r-square value of 0.46 and standard error of 0.03 g for total nitrogen content.
• Applying this model to the whole image for each field results in a mean estimate of 0.17 tons per acre of dry weight biomass produced by T3, with a minimum estimate of 0.03 tons per acre and a maximum estimate of 0.43 tons per acre.
• Estimated average nitrogen uptake across all sites was 6.2 pounds per acre with a minimum estimate 1.0 pound per acre and a maximum estimate of 12.6 pounds per acre at T3.
• Change in soil nitrogen and ammonia concentration was not significantly correlated with an increase in biomass. On average soil nitrogen decreased 0.85 ppm and soil ammonia decreased 1.18 ppm. However, soil nitrogen increased in 20% of all samples and ammonia increased in 31% of all samples.
• Further analysis is needed to improve the accuracy of the UAV derived models for estimating biomass and plant tissue chemistry in cereal rye. More advanced modeling techniques incorporating artificial intelligence or machine learning could improve on model accuracies and decrease the standard error for estimating the different bio-physical parameters of interest. Future work should also consider the effects of bare soil on the model estimates. Here, several fields showed higher values for nitrogen uptake in areas with very low or no biomass.
• Hyperspectral measurements and satellite imagery also need to be analyzed to assess the effects of spatial scale and spectral resolution on the analysis. Ultimately, we want to apply what we learn from UAV analysis to satellite imagery that is collected continuously over time and could provide a cheap effective method for farmers and others to quantify the environmental impact of cover crops at the field scale.
Unmanned Aerial Vehicles (UAVs)
UAVs are used to capture imagery of crop fields throughout the season to monitor changes in biophysical and chemical parameters important to crop health.
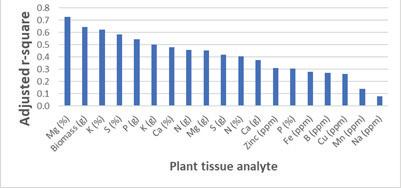
Adjusted r-square for the UAV derived best subset index identified for each plant tissue analyte measured at T3.

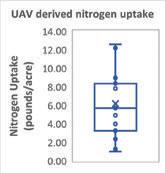
UAV derived estimates for total field biomass and nitrogen uptake for all sites at T3.

For inquiries about this project, contact Sami Khanal (khanal.3@osu.edu), Matthew Romanko (romanko.7@ osu.edu), Brigitte Moneymaker (moneymaker.4@osu.edu), or Boden Fisher.
Demonstrate strip intercropping, utilizing alternating strips of corn and soybeans to identify the relationship between them and maximize yield potential.
Planting Date 5/31/2021
Harvest Date 12/9/2021
HybridBeck's 5892A4
VarietyBeck's 3546FP
Corn Population 35,416 sds/ac
Soybean Population 135,000 sds/ac
Acres 72
Treatments4
Reps 11
Treatment Width10 ft. and 60 ft.
TillageMinimal
Management Fertilizer, Herbicide, Insecticide
Previous Crop Corn/Soybean Rotation
Row Spacing30 in. Twin Row
Soil Type Brookston Silty Clay Loam, 57%
Crosby Silt Loam, 35%
This location is at a much larger scale than any of the others. A full production 72 acres has been planted in these strips. The MCAC is only a small representation of what is being accomplished at this location. The rows are in a perfectly polar North/South orientation studying the effects of the sun and the row direction. This year all strips were harvested as full passes. For this year's configuration we did 60 feet of 10 feet alternating strips followed by 60 feet of corn then 60 feet of beans. This allowed for full evaluation of monoculture crops.


OSU Extension Fayette County
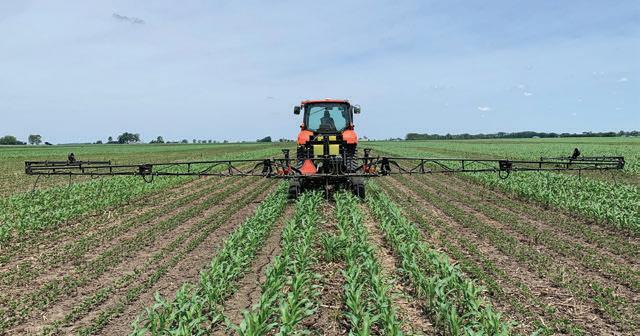
Making a nitrogen application to the corn strips.
A nice, dark green color was consistent throughout the season and the field remained weed free. This was one of the wetter areas of the state, receiving excellent rainfall during the growing season. The crop remained healthy throughout the entire year. The limitation to yield was planting date.

• The results this year were all statistically significant, both for corn and beans.
• The strip concept continues to intrigue many from all over the world with different iterations trying to break through the next yield threshold.
• Harvest date was over four weeks apart from each other for soybeans.
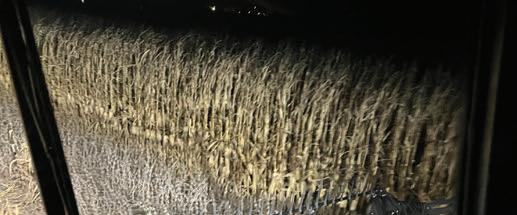
Treatment Means with the same letter are not significantly different according to Fisher’s Protected Least Significant Differences (LSD) test at alpha = 0.1.
Veris iScan
Veris-i Scan can be pulled behind any UTV or ATV. The Veris is similar to a planter row unit its pulled through the ground taking soil temperature, OM, CEC. The information can be used to make VR seeding prescriptions and aid in fertility recommendation for the coming years. In the trials we use this information as an additional data layer to make management decisions.
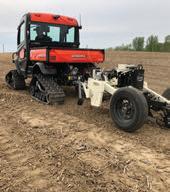
For inquiries about this project, contact Andrew Klopfenstein (klopfenstein.34@osu.edu).
Demonstrate strip intercropping, utilizing alternating strips of corn and soybeans to identify the relationship between them and maximize yield potential.
Planting Date 5/25/2021
Harvest Date 11/9/2021
Hybrid Pioneer 9880AM
VarietyLG P28A42X
Corn Population VR - 36,000 sds/ac
Soybean Population VR - 129,081 sds/ac
Acres 11
Treatments4
Reps4
Treatment Width10 ft. and 60 ft.
Tillage No-Till
Management Fertilizer, Fungicide, Herbicide, Insecticide
Previous Crop Corn/Soybean Rotation
Row Spacing30 in. Twin Row
Soil Type Crosby-Lewisburg Silt Loam, 66% Sloan Silty
Clay Loam, 21%
Miamian Silt Loam, 13%
The Farm of the Future is the longest running continuous strip intercropping demonstration. The orientation remained the same East-West outputting strips. The strips were harvested in full passes with two independent machines. Each strip was harvested in the same single direction and weighed individually. For this year's configuration we did 60 feet of 10 feet alternating strips followed by 60 feet of corn then 60 feet of beans. This allowed for full evaluation of monoculture crops.


Madison County
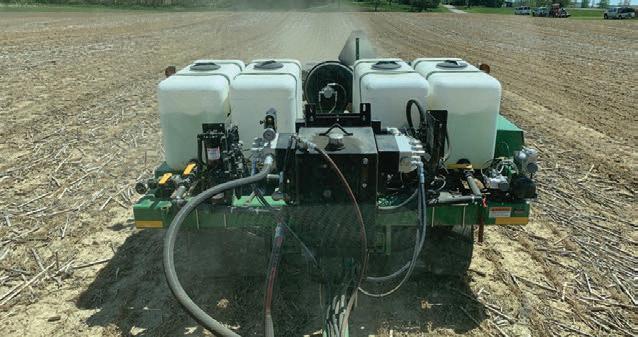
A nice, dark green color was consistent throughout the season and the field remained weed free. This was one of the wet areas of the state, receiving excellent rainfall. during the growing season. The crop remained healthy throughout the entire year.
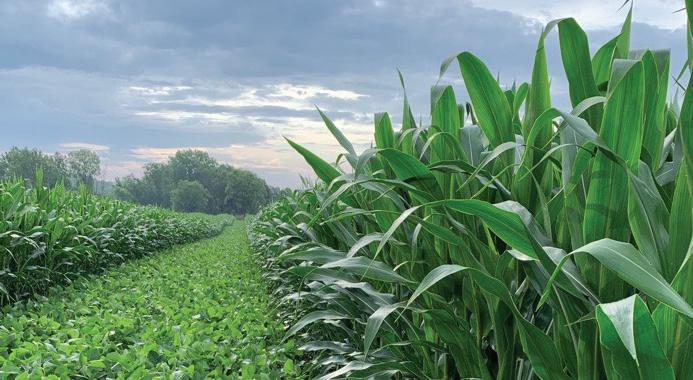
• The results this year were all statistically significant, both for corn and beans.
• The strip concept continues to intrigue many from all over the world with different iterations trying to break through the next yield threshold.

Treatment Means with the same letter are not significantly different according to Fisher’s Protected Least Significant Differences (LSD) test at alpha = 0.1.
Unverferth Seed Tender
The Unverferth seed tender 3995XL can hold 400 units of seed for delivery right to the planter in the spring. This is also used to weigh test plots and test strips in the fall. Its equipped with an on board scale system for precise seed distribution in the spring or a weigh cart in the fall to validate yield monitor data.
For inquiries about this project, contact Andrew Klopfenstein (klopfenstein.34@osu.edu).











































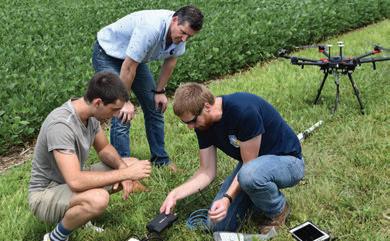
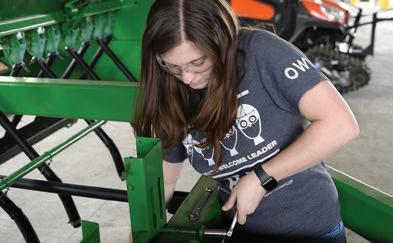
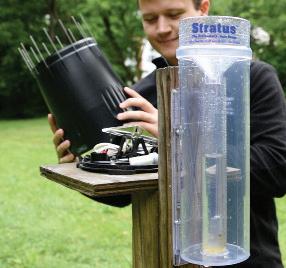
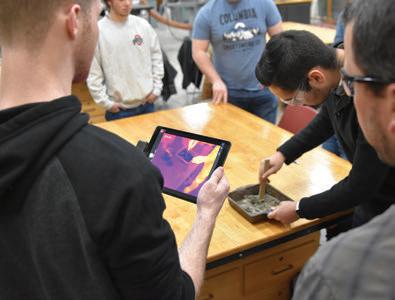


Adams Spraying LLC
Aeschliman Family Farms
Bill Apple
Toney Arend
Armstrong Farms
Austin Arps
Amos Aurand
Ayers Farms
Mica Ballard
Bruce Baltzly
Barnes Unlimited
Gene Baumgardner
Beam Precision Ag
Rick Bell
Jessica Berlekamp
Kenny Blim
Randy Boes
Adam Bolender
Bolender Farms
Tony Bornhorst
Box Farms
Joyce Brahler
David Brautigam
Bridgewater Farms (Dave Cunningham)
Brinkman Farms
Don Buehler
Matt Burkholder
Daniel Call
Ned Campbell
Jared Chester
Parker Clark
Rick Clifton
Chris Collett
Conrad Farms
Corcoran Farms
Corry Farms
Crosswind Farm (Dave Lutz)
DARA Site
Matt Davis
Joe Davlin
Chris Dean
Deer Run Farms (Martha Winters)
Department of Food, Agricultural, and Biological Engineering
Glenn Dickerhoof
Bethany Dickess
Alex Dragovich
Nicolas Dubuc
Duer Farm
Duling Farms (Jeff Duling)
Durbin Farms
Eckel Grain Farms
Matt Eggers
Ewing and Son Farms
Fayette County Agronomy Club
David Felumlee
Flatrock Dairy, LLC
Flatrun Farm
Ron Frank
Ryan Fritsch
Rick Gable
Gebhardt farms
Generations Family Farm
Gene Gerten
Arden Good
Ethan Grum
Andrew Hagerty
Jon Hanson
Tom and Korey Harrod
Hartschuh Dairy Farm
Scott Hauenstein
Les Heeringa
Nick Heitz
Aaron Herrmann
Jacob Hoffman
John Hoffman
Homan Seed - BioDyne
Hord Family Farms
John Ickes
Jim Jacobs
JCW Farms
Clint Jenkins
Brandon Johnson
Josiah Hoops
Judge Farms
Sharon Keister
Kenworthy Farms (Brett Kenworthy)
Ben Klick
Leon Klopfenstein
Brianna, Ryan, and Ethan Klopfenstein
Evan Klopfenstein
Roy Klopfenstein
Gary Klopfenstein
Mike Kryling
Lapp Farms (David Lapp, Jason Massie & Pat Snyder)
Lee Farms
Greg Leffel
Bill Lehmkuhl
Licking Valley FFA
Cliff Linder
Little Scioto
Ted Logan
Louiso Farms
Jim Love
Jim Lyle
M&W Farms
Machan Farms
Mark Erwin Farm
Mark IV Farms
Curt Maurer
McAdams Farm
McGuire Ag
Gabe Medinger
Jason Meyers
Dave Mielke
Miller Brothers
Mitchell Farms
Mitchem Farms
MKH Farms
Morrow Soil and Water Conservation District
Moser Farms
Erin Neal
Tim Neiset
Nolan Newman
Eric Niemeyer
Seth Nofziger
Vicki Nofziger
Jonathan Norman
Northwest State Community College
Garrett Nowak
Celeste Nye
OARDC Jackson Ag Research Station
OARDC Molly Caren Ag Center
OARDC North Central Ag Research Station
OARDC Northwest Ag Research Station
OARDC Small Ruminant Research Center
OARDC Western Ag Research Station
Ohio Valley CTC FFA
Overholser Farms (Stirling and Aaron Overholser)
Alex Parsio
Nate Parsons
Nathan Patton
Steve Payne
Pitstick Farms
Mike Poling
Chris Pugh
Purdin Farms
Putnam Co. SHARP site/ SWCD
Radcliff Farms (Dug, Lee, Asa, Richard, and Mav)
Dennis Reer
John Rethmel
Camilla Richards
RT Family Farms (Randy, Ryan, and Rex Tietje)
Justin Rupp
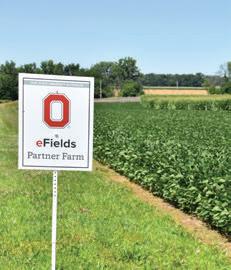
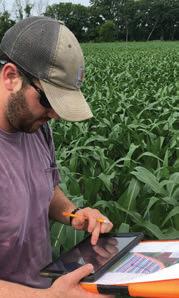
Luke Saygar
Phil Schaffer
Michael Schmid
Ben Schmitmeyer
Bryce Schott
Marv Schroeder
Scioto Valley Farms
Seiler Farms
Tyler Shindel
Tanner Shinkle
Dave Shively
Shupert Farm
Brian Simon
Doug Simpson
Skinners- Hardscrable Farms
Alex Smith
Dusty Smith
Cory Smith
Ron Snyder
Southwest Ohio Corn Growers
Keith Sowell
Spillman Farms
Jeff Staab
Tom Stannard
Doug Steinberger

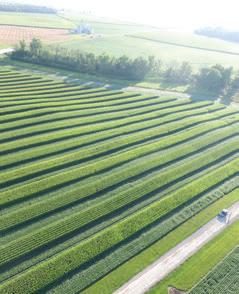
Mark and Matt Stucke
Aaron Stuckey
Jon Studebaker
Matt Sullivan
Sun Mountain Dairy
Sunnyville Farms
Kris Swartz
Mike Sword
Chris Tkach
Brett Unverferth
Ramarao Venkatesh
Vermillion Farm
Chris Vorst
W.R. Hamiel Farms
Clayton Waddle
Ross L. Weaver
Aaron Weinhold
JT Welte
West Pines LLC (Bill Evans)
Westhoven
Chris Wiegman
Bruce Wyatt
Ron Wyss
Nick Zachrich
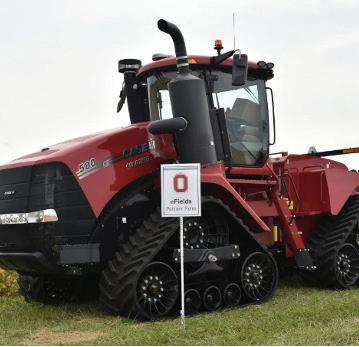


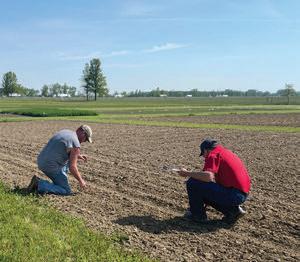
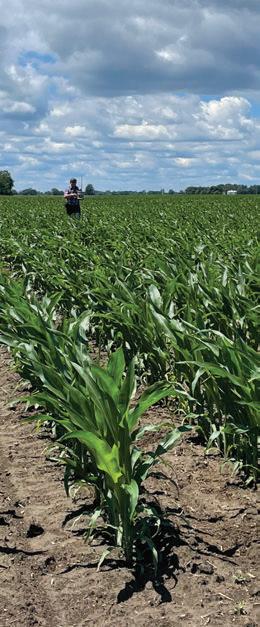
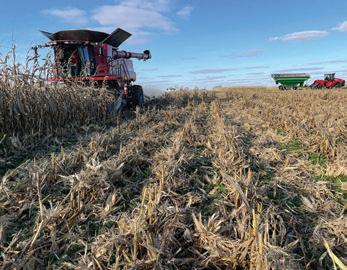
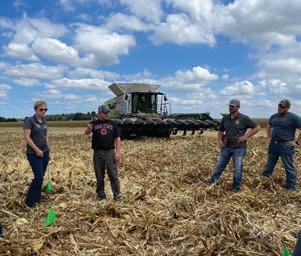

eFields is a The Ohio State University program dedicated to advancing production agriculture through the use of field-scale research. eFields utilizes modern technologies and information to conduct on-farm studies with an educational and demonstration component used to help farmers and their advisors understand how new practices and techniques can improve farm efficiency and profitability. The program is dedicated to delivering timely and relevant, data-driven, actionable information to farmers throughout Ohio.


(in.)

