Barns Report


COLLEGE OF FOOD, AGRICULTURAL, AND ENVIRONMENTAL SCIENCES
COLLEGE OF VETERINARY MEDICINE


COLLEGE OF FOOD, AGRICULTURAL, AND ENVIRONMENTAL SCIENCES
COLLEGE OF VETERINARY MEDICINE
eBarns is a program at The Ohio State University dedicated to advancing production agriculture through the use of field-scale and applied research. The 2023eBarns Report is a combination of the research conducted on partner farms and Ohio State agricultural research stations throughout Ohio. Current research is focused on enhancing animal production, growing high-quality forages, precision nutrient management and to develop analytical tools for digital agriculture.
In this second addition of eBarns we have included research studies not only from the past year, but studies from previous years that have yet to be summarized in a producer friendly manner. It is our goal to continue to share results from applied livestock, forage, and manure nutrient management in this publication for years to come.
25 Total Studies
• 4 Forages
• 4 Dairy
• 3 Beef
• 6 Small Ruminant
• 5 Manure Nutrients
16 Counties
19 Research Sites
Disclaimer Notice: The information provided in this document is intended for educational purposes only. Mention or use of specific products or services, along with illustrations, does not constitute Endorsement by The Ohio State University. The Ohio State University assumes no responsibility for any damages that may occur through adoption of the programs/techniques described in this document.
Welcome to the 2023 edition of the Ohio State eBarns Report. We are excited this is our second edition of the report and we want to extend our sincere thanks to all of those who have made the Ohio State eBarns Report possible in 2023. This project would not have happened without the support of our on-farm cooperators, OSU Extension educators, field specialists, faculty, staff, students, industry partners, and countless others who have devoted their time, energy, and expertise. It is truly the collaborative nature of everyone that allows us to ultimately provide data-driven information to thousands of farmers and their advisors in a timely, relevant, and actionable manner.
With this being our second year for the eBarns Report we are grateful to everyone for their time and vision from the creation of the report and the needed on-farm linkages with farmers and their advisors. This special edition is dedicated to them.
As we reflect on the past couple of years, the COVID-19 pandemic continued to impact the agriculture industry and beyond. As we work through the pandemic, supply chain and labor issues created unique challenges. Some livestock research was able to continue during this time while other projects were delayed. Recently, supply shortages, labor, and now energy costs have impacted the supply and costs of inputs. Fertilizer prices are at an all-time high this year with it being difficult to purchase crop protection products. Fortunately for Ohio farmers, the 2022 growing season was favorable and livestock prices are at or near record highs, allowing for profit potential this year.
The eBarns team was able to report on 25 studies in 16 counties in this publication. We are excited about this continued growth of the program, and the eBarns team members are looking forward to more exciting projects in the future.
We hope you find the 2023 eBarns Report informative and valuable. We look forward to continuing sharing all of the quality and variety of livestock, forage, nutrient management and research happening across the state of Ohio. If you are interested in cooperating with us in future years or have any feedback, please contact us at ruff.72@osu.edu.
Sincerely,
The eBarns Report is published on an annual basis. To view past reports, visit our website at go.osu.edu/ebarnsreports
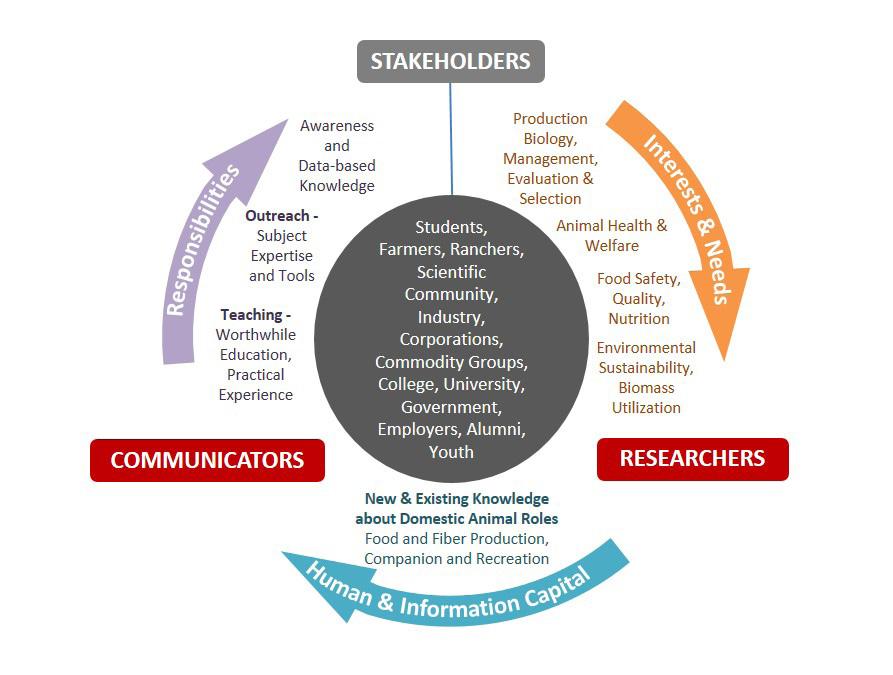
Advancing knowledge of animal sciences for the betterment of animals and humans…
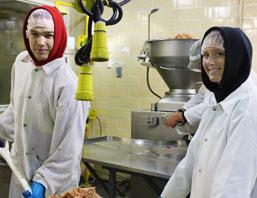
Our areas of research and teaching includes,
• Growth, development, and meat science
• Breeding, genetics, & reproduction
• Mammary biology & milk quality
• Animal welfare & behavior
• Nutrition & microbiology
• Waste management & bio-fuels
• Human-Animal interactions
The Digital Agriculture Program at The Ohio State University embodies the best of the land grant mission – creation, validation, and dissemination of cutting-edge agricultural production technologies. The central focus of this program is the interaction of automation, sensing, and data analytics to optimize crop production in order to address environmental quality, sustainability, and profitability. Research is focused on execution of site-specific nutrient management practices, development of handheld devices for in-field data capture, autonomous functionality of machinery, remote sensing solutions, and data analytics to enhance timing, placement and efficacy of inputs within cropping systems.
The Digital Agriculture Program at The Ohio State University strives to be the premier source of research-based information in the age of digital agriculture.
• Uniting the private and public sectors to drive innovation for the benefit of farmers.
• Partnering with farmers to translate innovation into long-term profitability for production agriculture.
• Delivering timely and relevant information for the advancement of digital agriculture technologies.
The premise of digital agriculture includes the advancement of farm operations through implementation of precision agriculture strategies, prescriptive agriculture and data-based decision making. Digital agriculture is a holistic picture of the data space in agriculture, trends related to services directing input management and the value of data usage for improving productivity and profitability of farm operations.
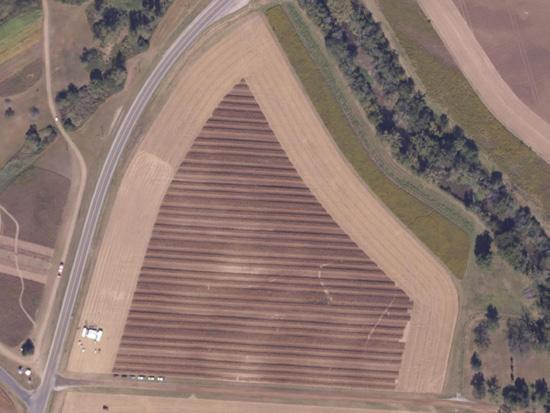
“Digital Agriculture” combines multiple data sources with advanced crop and environmental analyses to provide support for on-farm decision making.
Pasture comprises of more than 1.4 million of Ohio farm land. For more information visit the Integrated Forage Management Team at forages.osu.edu.
Dairy Cattle
Ohio is the number one Swiss cheese producing state. For more information on dairy production visit the Ohio Dairy Resource Center at dairy.osu.edu.
Beef Cattle
Since 2018, Ohio ranks in the top five for Beef Quality Assurance certifications. For more information on beef production visit the OSU Extension Beef Team at beef.osu.edu.
Small Ruminants
Ohio is the largest sheep producing state East of the Mississippi River
For more information on small ruminant production visit the OSU Extension Sheep Team at sheep.osu.edu.
Manure Nutrients
Right source, right rate, right time, right place, right technology

For more information visit the Ohio Composting and Manure Management at ocamm.osu.edu.
Equine
Ohio has the 6th largest horse population in the country. For more information visit the Ohio Equine Resource Center at equine.osu.edu
Poultry
Ohio is ranked number two in the Nation for egg production. For more information visit the OSU Poultry Team at u.osu.edu/poultry.
Find study information, objectives, study design, graphs, and summary on the left page. Find results, summaries, project contact, and statistical summary on the right page.
Planting Date 5/3/2021
Harvest Date 10/20/2021
Variety Becks 6076V2P
Population 34,000 sds/ac
Acres 70
Treatments 5 Reps 7
Treatment Width 40 ft.
Tillage Conventional
Management Fertilizer, Herbicide, Insecticide
Previous Crop Soybeans
Row Spacing 30 in.
Soil Type Crosby silt loam, 52% Celina silt loam, 48%
The study design provides a background on the study. This could include a brief history of research, observations that led to the implementation of this study, explanation of the study design, etc.
Look to see the county where the study was conducted.

Start Date 10/15/2015
End Date 8/1/2016
Species Swine
Start Point 50 lb. (DOF, DOA, DIM)
End Point 300 lb (DOF, DOA, DIM)
Treatments 5 Reps 4
Experimental Unit Pen
Genetics Commercial Line
Breed Yorkshire Cross x Duroc
Sex Equal Barrow:Gilt
Health Protection As needed
Feed Access Ad libitum
IACUC #
The observations section of the report allows us to provide any relevant information that the researchers noticed throughout the duration of the project. Observations allow for a deeper understanding of the study results.
• The summary section proves results and findings from the study.
• Thank you for taking the time to explore our 2022 eBarns Report!
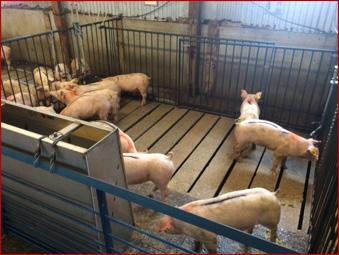
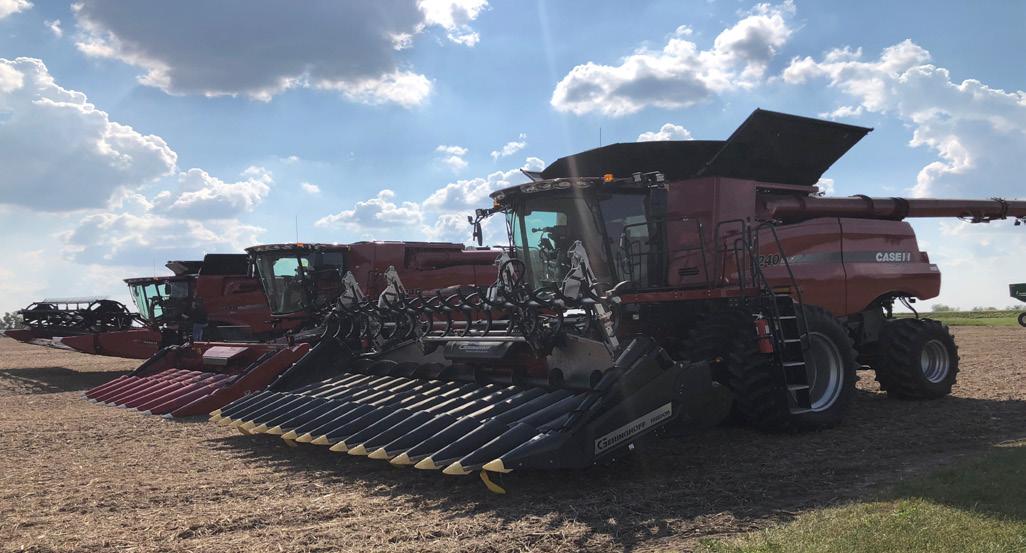
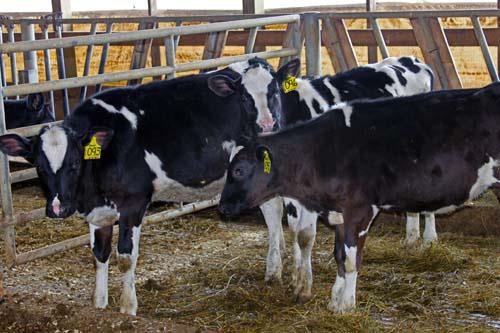
Treatment Means with the same letter are not significantly different according to Fisher’s Protected Least Significant Differences (LSD) test at alpha = 0.1.
This section allows us to display the tools and technology used to make each study possible.
The Project Contact section provides the name of the researcher along with their email address. We encourage you to contact them if you have questions about an individual study.


 Alejandro Relling Associate Professor Department of Animal Sciences
Jason Hartschuh Field Specialist OSU Extension
Elizabeth Hawkins Assistant Professor, Field Specialist OSU Extension
Christina Pfaff Farm Business Technician OSU Extension
Brady Campbell Assistant Professor Department of Animal Sciences
Tim Barnes Extension Educator Marion County OSU Extension
Pierce Paul Professor and Associate Chair Department of Plant Pathology
Alyssa Essman Assistant Professor Department of Horticulture and Crop Science









 Jacci Smith Extension Educator Delaware County OSU Extension
Examine the world of agricultural production in more detail than ever before with the eBarns Hub, a new way to access on-farm research from Ohio producers and Extension at kx.osu.edu/ebarns.
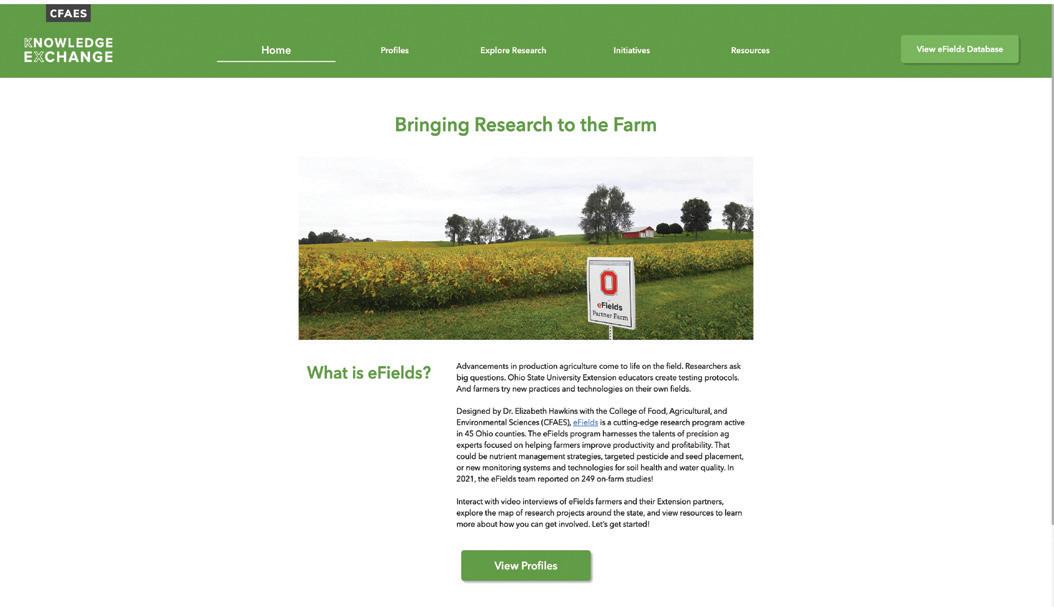
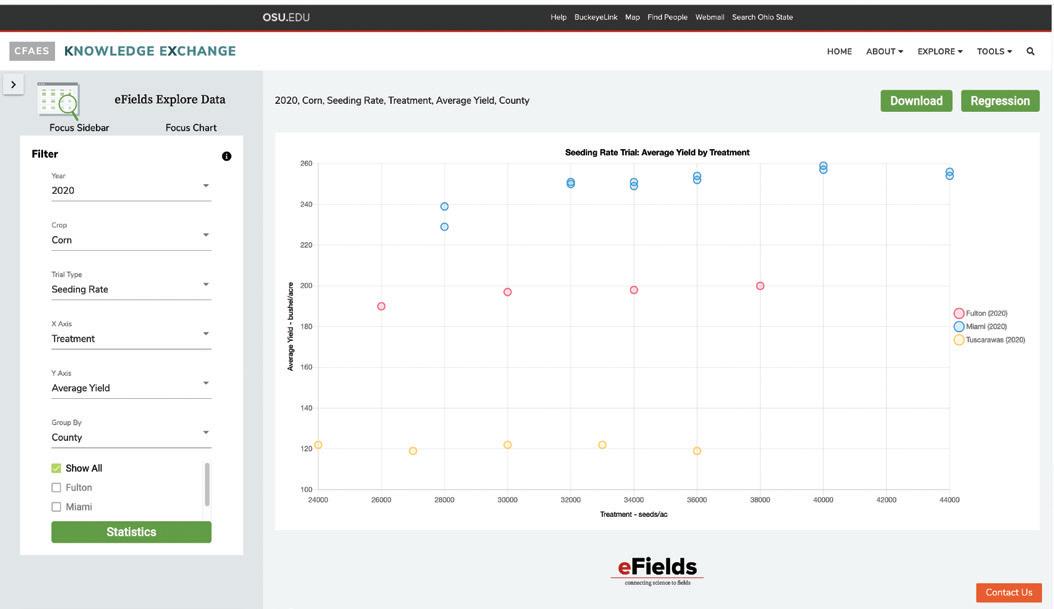
Visualize data from eBarns reports with our new Explore Data tool. Now you can easily pull charts to help make decisions for the farm.
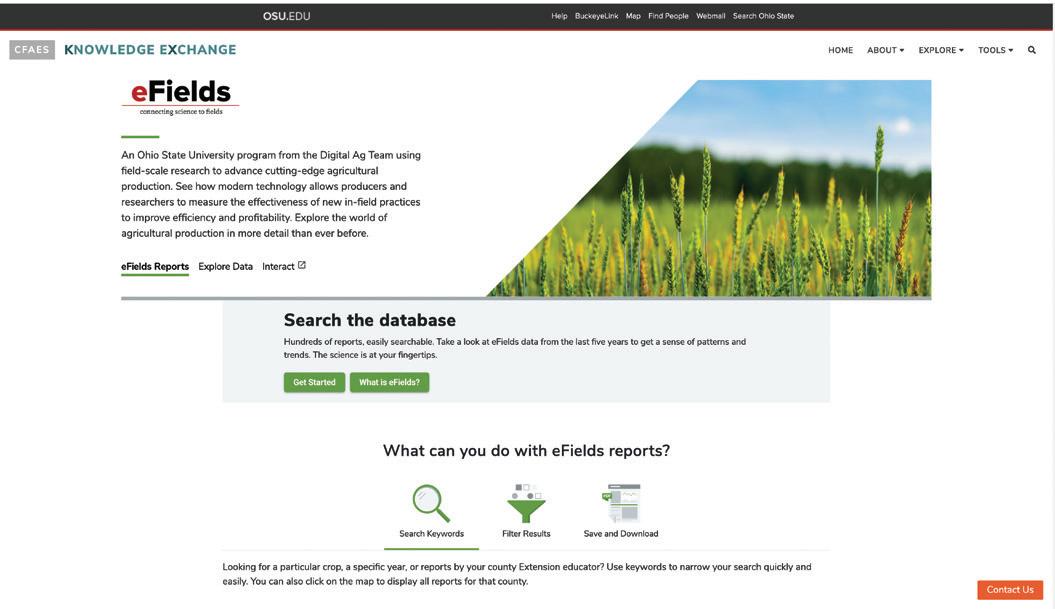
Interact with field-scale data by changing variables based on year, crop, and trial type. Group data by fall or spring tillage type or by county. Try it today!
Explore the world of digital ag with our eBarns Experience. Interact with eBarns data on an Ohio map and see where on-farm research happens. Listen to Extension and producer partners explain how they work together to develop effective trials and learn how you can get involved.
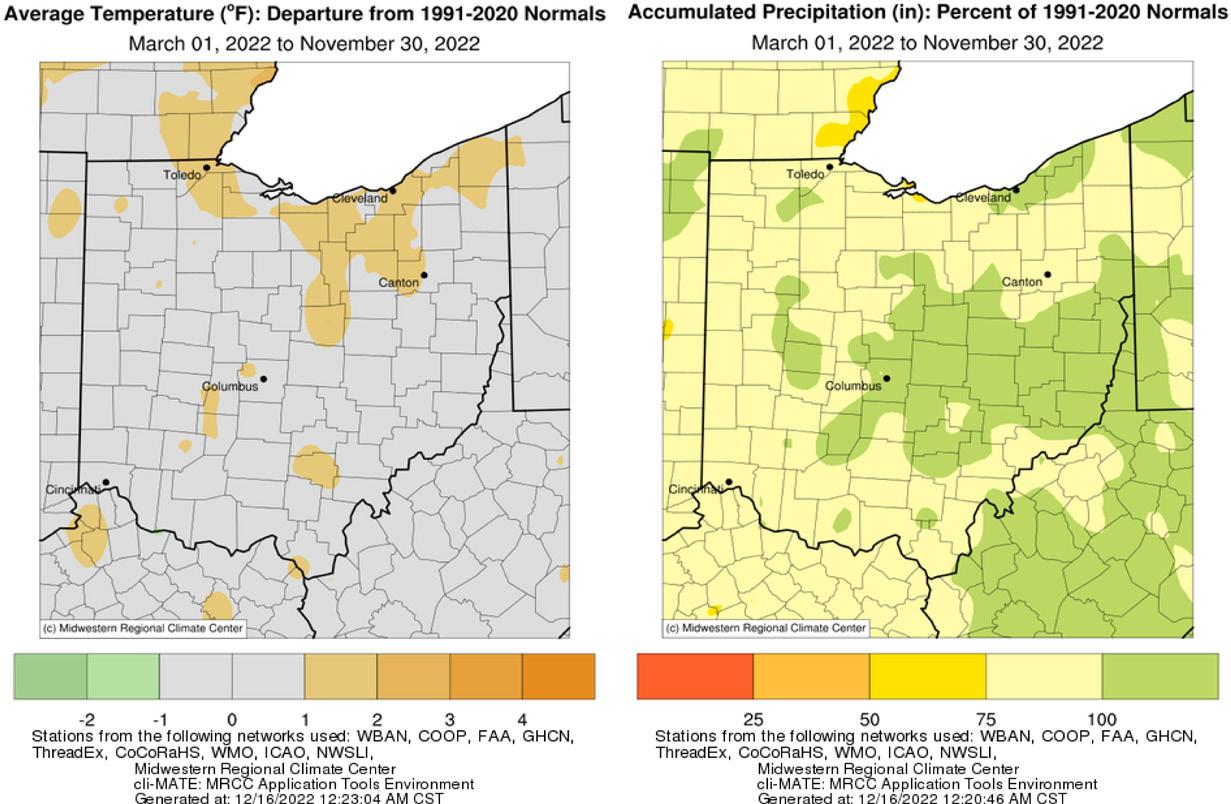
What a ride 2022’s growing season weather has been! From excess spring moisture to one of the driest falls in recent memory, the weather of 2022 brought a handul of challenges and benefits to agriculture in Ohio. Compared to our long-term average (1991-2020), growing season temperatures (March – November) were about average (Fig. 1). This led to a total Modified Growing Degree Day accumulation for April – November of 3000-4000 days, up to 400 days above average across the north. Precipitation was above average (100-125% of normal) for the season across central and eastern counties and a bit below average (75-100% of normal) elsewhere. Through November 2022 ranks as the 26th warmest and 35th wettest on record (1895-present) for Ohio according the National Centers for Environmental Information. For more in-season climate analysis, please visit the State Climate Office of Ohio. The following is a summary of the growing season and seasonal breakdown of 2022.
Spring (March – May)
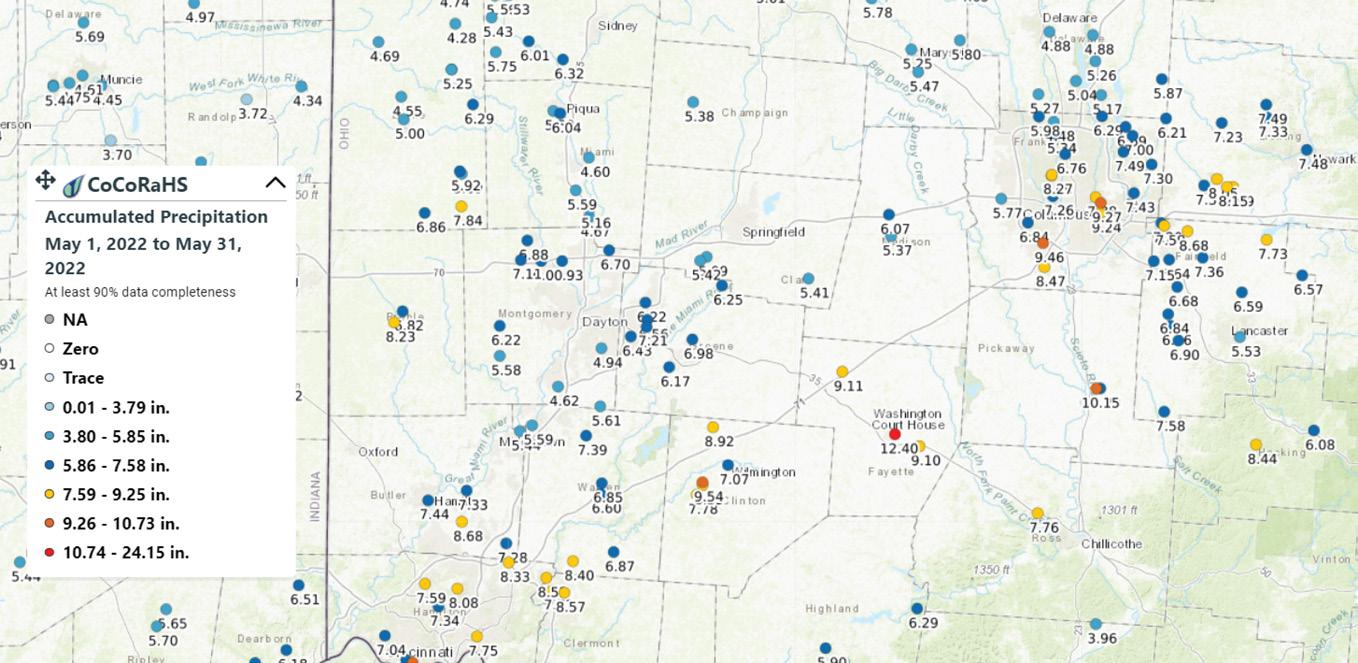
Spring got off to another warm start again across the Buckeye State, as March 2022 ranks as the 21st warmest March on record (1895-present). Cooler than average conditions followed in April, but May was warmer than average. The last spring freeze (32°F) occurred when expected, between April 21-30. Precipitation was on a bit of a rollercoaster as well, oscillating between wet and dry periods. While April was drier than average, March and May provided excess moisture across the state, especially across the southern Ohio. Areas from Clinton County northeastward to Fairfield County were particularly hard hit, with a swath of 10-12.5” of rain during May alone (Fig. 2). This led to severe planting delays and interruptions in spring activities in this area. Spring 2022 ranks as the 20th warmest and 56th wettest for Ohio.
FARM (Field Application Resource Monitor)

This tool (farm.bpcrc.osu.edu) allows users to define their locations of interest and receive 12- and 24-hour precipitation forecasts (current and historical) to aid in the application of fertilizer, manure, and/or pesticides.
For inquiries about this project, contact Dr. Aaron B. Wilson, Extension Field Specialist - Ag Weather & Climate (wilson.1010@osu.edu).
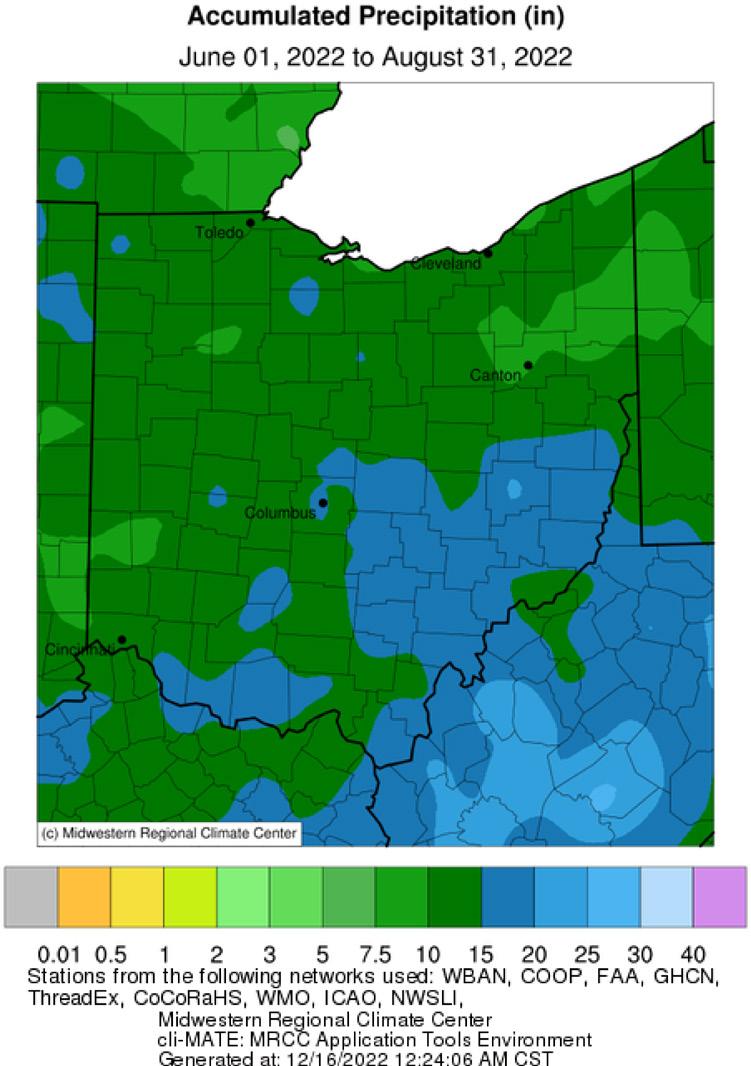
Summer got off to a very warm start as temperatures across the state frequently soared well into the 90s in June and the first couple of weeks of July. On June 14th, Columbus officially recorded a dewpoint temperature (a measure of humidity) of 84°F, tying Miami, Florida for their all-time highest dewpoint temperature on record. While July started off warm as well, temperatures moderated throughout the remainder of the month and through August. Consistent with long-term trends, summer overnight lows were much warmer than average, ranking as the 14th warmest on record. Precipitation varied across the state throughout the summer. Southeastern counties experienced a wet June with up to three inches of above average rainfall while western counties remained dry. July and August featured plentiful and timely rainfall for all but west central and northeastern counties. This stretch of dry weather hampered grain development in these areas as soil moisutre decline, streamflows dropped, and drought conditions set in toward the end of summer. Figure 3 shows the total rainfall for the state for June – August 2022. Overall, the state averaged 12.97” of rain, about 0.89” above average. Summer 2022 ranks as the 32nd warmest and 38th wettest on record.
Temperature-wise, fall provided everthing in terms of weather (cold, warmth, rain, snow, drought, and deluge). September was about average, with a cool October then a warmer than average November. The cool October was highlighted by a bit of an early freeze to some parts of the state during the first week of the month. This may have contributed to extended
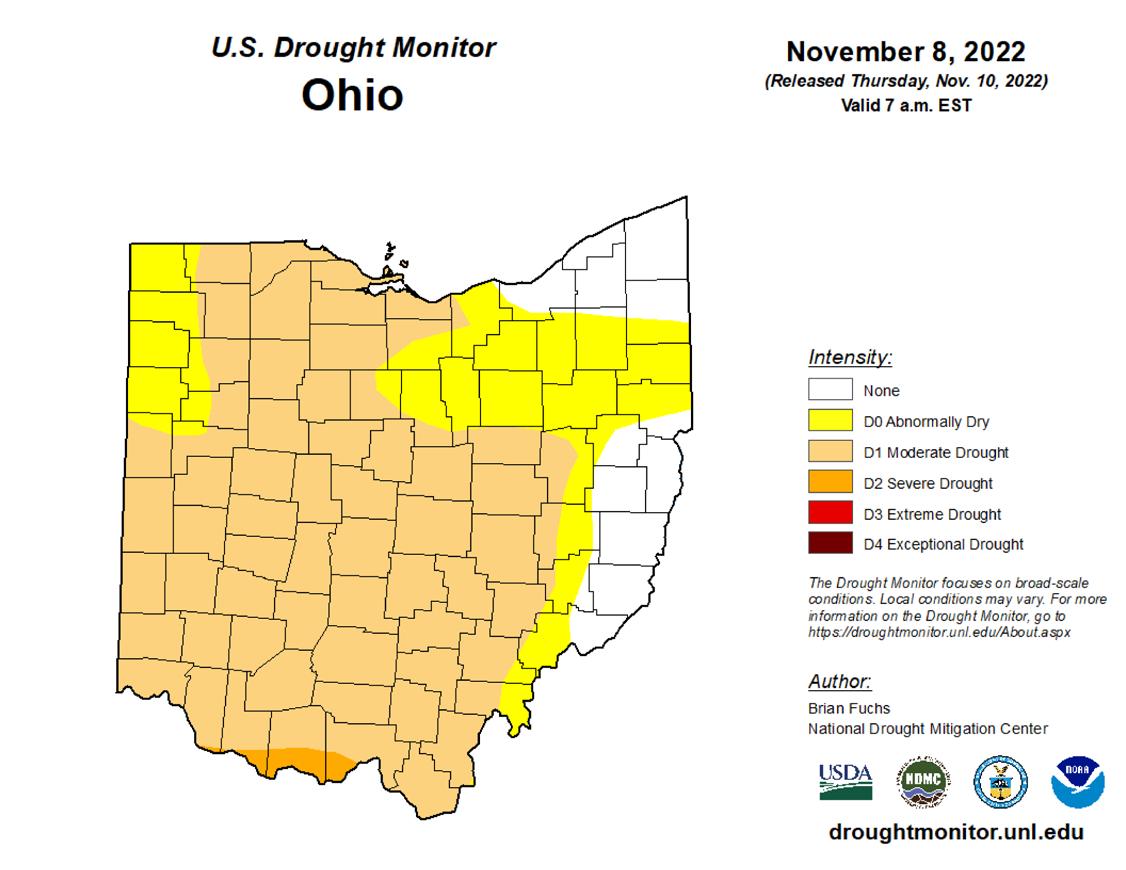
dry down times for impacted corn and soybeans and hit some late-season berry growers in the colder valleys. The cool October conditions however helped offset impacts from one of the driest Octobers in recent memory. Over a three-week stretch between the end of September and into October, western Ohio only received about 0.1” of rainfall. This created optimal conditions for numerous equipment and field fires as well as a prolonged 1300 acre fire in the Wayne National Forest in Lawrence County. These condtions, combined with decreaing soil moisture and stream flows led to an expansion of drought across Ohio, reaching peak coverage on November 8, 2022 (Fig. 4). The dry October created quite the reversal in the trend of suitable fieldwork days with many areas experiencing 25-30 suitable field work days and non-stop fall activities. The overall trend has seen a decline of about 5 days for the month of October since 1995. As November wore on and the calendar turned to December, a wetter pattern was becoming established across Ohio with wet winter conditions in the outlook. Fall 2022 ranks as the 46th warmest and 37th driest on record.
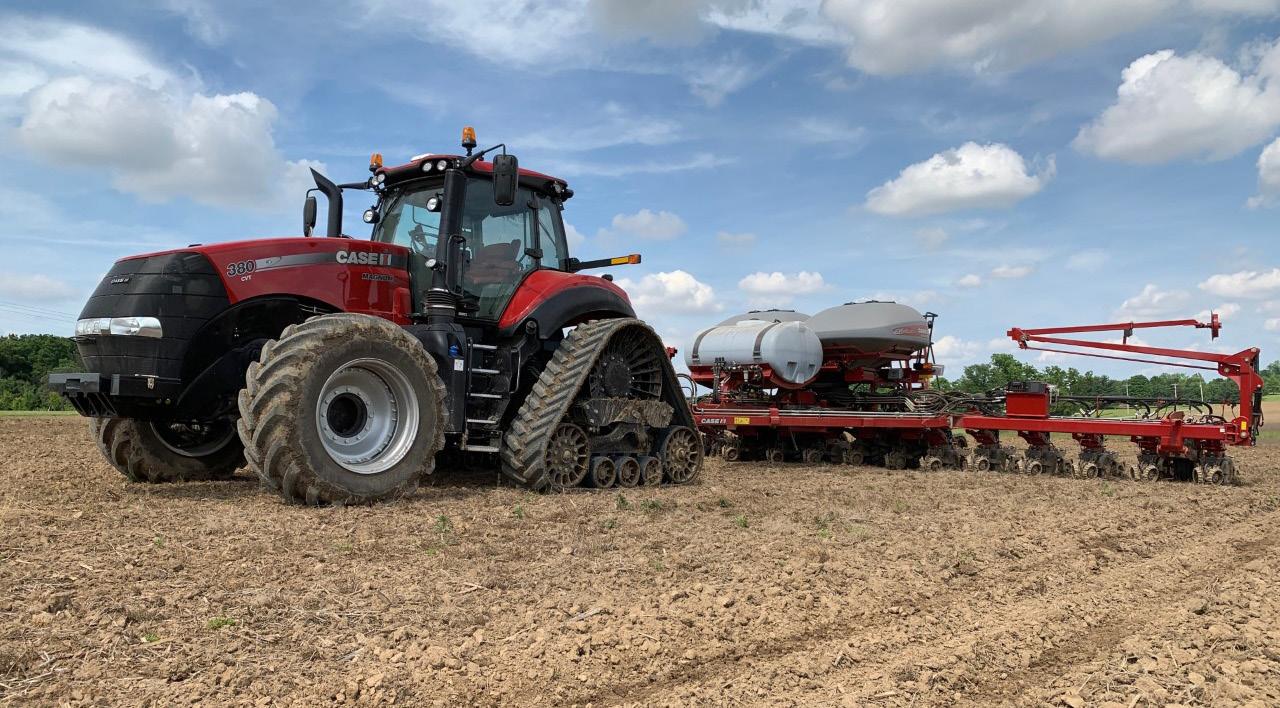
Custom work is common in farming, especially for tasks that require specialized equipment or expert knowledge of that task. Barry Ward, Leader, Production Business Management along with John Barker and Eric Richer (Extension Educators) worked to develop the 2020 Ohio Farm Custom Rates. This publication provides an extensive list of average custom rates that were derived from a statewide survey of 377 farmers, custom operators, farm managers, and landowners. The Ohio Farm Custom Rates publication is a resource you can use on your operation as a reference in your economic analyses. All the provided rates (except where noted) include the implement and tractor if required, all variable machinery costs such as fuel, oil, lube, twine, etc., and the labor for the operation.
Some of the custom rates provided in the publication vary widely, due to the following variables:
• Type or size of equipment used
• Size and shape of fields
• Condition of the crop
• Skill level of labor
• Amount of labor needed in relation to the equipment capabilities
• Cost margin differences for full-time custom operators compared to farmers supplementing current income
The custom rates provided in the publication summarize the survey respondents. The reported numbers are the average (or mean), standard deviation, median, minimum, maximum, and range. Average custom rates are a simple average of all survey responses. As a custom provider, the average rates reported in this publication may not cover your total costs for performing the custom service. As a customer, you may not be able to hire a custom service for the average rate noted in this fact sheet. Calculate your own costs carefully before determining the rate to charge or pay. The data from this survey are intended to show a representative farming industry cost for specified machines and operations in Ohio. The Ohio Farm Custom Rates publication includes other resources that can help you calculate and consider the total costs of performing a given machinery operation.
Enterprise Budget
You can access the Ohio Crop Enterprise Budgets by visiting go.osu.edu/enterprisebudgets or by using the QR code to visit the site.

You can access the Ohio Farm Custom Rates by visiting go.osu.edu/customrates20 or by using the QR code to visit the site.
For inquiries about this information, contact...
Barry Ward
Production Business Management
ward.8@osu.edu
For 2022, eFields forage research was focused on increasing forage production in Ohio. Some exciting and innovating projects were executed this year, with 2 unique studies being conducted across the state. 2022 Forage research presented in eFields covers both precision nutrient management and species selection. Below are highlights of the 2022 eFields Forage research:
15 acres of forage
2 forage studies
For more forage research and feeding management from Ohio State University Extension, explore the following resources:


The purpose of the Ohio Forage Performance Test is to evaluate forage varieties of alfalfa, annual rye grass, and cover crops for yield and other agronomic characteristics. This evaluation gives forage producers comparative information for selecting the best varieties for their unique production systems. For more information visit: go.osu.edu/OhioForages.
The Agronomic Crops Team performs interesting research studies on a yearly basis. Resources, fact sheets, and articles on alfalfa, winter annuals, and summer annuals can be found here on the Agronomic Crops Team website: go.osu.edu/CropTeamForages.
Corn Plant Silage
Forage Sorghum Sorghum Sudangrass Sudangrass
Soybean Silage
Teff Grass
Millets
Mixtures of annual grasses with soybean
Highest single cut forage yield potential of all choices. Silage quality will be lower than with normal planting dates. Risk will be getting it harvested at right moisture for good fermentation.
Best harvested as silage. Brown midrib (BMR) varieties are best for lactating cows. Conventional varieties are okay if BMR seed is not available. Can produce 3-4 tons of dry matter/acre. Risk of prussic acid (hydrogen cyanide gas) if frosted.
Reasonable alternative to replace alfalfa forage. Check seed treatment and herbicide labels, many restrict forage use.
Best suited to beef and sheep; lower yield than sorghum grasses. Can harvest as hay or silage.
Best suited to beef and sheep; many produce a single harvest. Best harvested as silage. Pearl millet does not produce prussic acid after frost damage.
Best harvested as silage. Mixtures of sorghum grasses or millets or even oats and spring triticale with soybean are feasible and can improve forage quality characteristics.
Oat or Spring Triticale
Oat or Spring Triticale Plus Winter Cereals
Oat or Spring Triticale Plus Field Peas
Italian Rye grass
Can be mowed and wilted to correct harvest moisture. Harvesting as hay can be challenging. Earlier planting dates provide more autumn yield.
Winter cereals (Winter rye, Winter wheat, Winter triticale) can be added to oat or spring triticale to add a forage harvest early next spring. Winter rye can also contribute a little extra autumn yield to the mixture.
Field peas can improve forage quality (especially crude protein content) but will increase seed cost.
Earlier planting dates provide more autumn yield. Excellent forage quality in the fall. Potential for three harvests next year starting in late April.
Autumn olive is a non-native and invasive shrub/tree that can be found in Ohio woodlands, pastures, and abandoned fields. The objective of this study was to evaluate treatments for the management of Autumn olive in pasture systems.
Application Date 2/15/2023
Evaluation Date 5/25/2023
Species Autumn olive
System Pasture

Location Caldwell, OH
Treatments 6
Reps 5
Application cut stump, basal bark, or dormant stem
Location EARS

This study currently has one year of data at one location evaluating six autumn olive treatments. The experimental design was a completely randomized design. The study was conducted near the Eastern Ag Research Station in Caldwell, OH. Applications were made in late-winter and treatments were evaluated approximately three months later.
All treatments except treatment 2 provided adequate control of Autumn olive with little to no regrowth.
• Several options exist for control of Autumn olive in pasture systems.
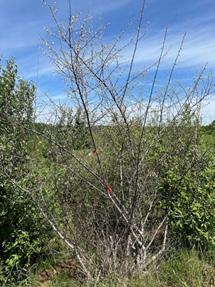
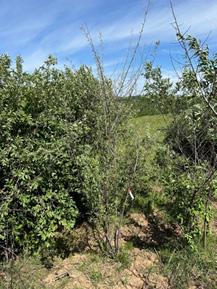
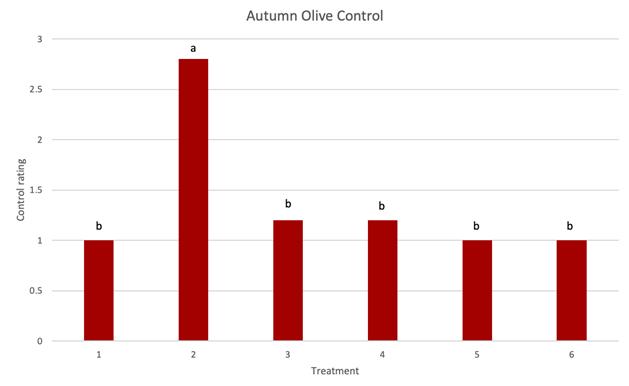
• With the right product selection, applications can be made in late-winter to cut stumps, basal bark or dormant stems.
Rating structure, based on regrowth following applications:
1: none
2: slight regrowth
3: moderate regrowth
4: extensive regrowth
Weed Identification and Control
You can find more information on the identification and control of problematic weed species by visiting https://u.osu.edu/ osuweeds/ or using the QR code to visit the site.

For inquiries about this project, contact...
Alyssa Essman
essman.42@osu.edu or Chris Zoller zoller.1@osu.edu
Assess the effect of nitrogen fertilizer rate on oats planted as soon as wheat is harvested versus the first of August.
Planting Date 7/15/22, 8/1/22
Harvest Date 9/16/2022, 10/7/2022
Planting Date 8/3/2021, 8/17/2021, 9/3/2021
Variety VNS
Harvest Date 10/15/2021, 11/15/2021
Population 100 lbs/ac
Variety Feed Grade Oats
Acres 5
Population 100 lbs/ac
Acres 1
Treatments 10 Reps 4
Treatment Width 10 ft.
Treatments 3 Reps 4
Treatment Width 10 ft.

Tillage No-Till
Management Fertilizer, Fungicide
Tillage No-Till
Previous Crop Wheat
Management Fertilizer, Fungicide
Row Spacing 15 in.
Previous Crop Wheat
Row Spacing 7.5 in.
Soil Type Hoytville Clay Loam, 100%
Soil Type Hoytville Clay Loam, 100%
This trial was designed as a randomized complete block design with 2 planting dates and 5 nitrogen rates. Nitrogen rates were 0 lbs, 50 lbs, 100 lbs, 150 lbs, and 200 lbs of nitrogen applied as urea using a drop spreader. Plots were harvested once the oats heads had just emerged but before they tried to pollinate.
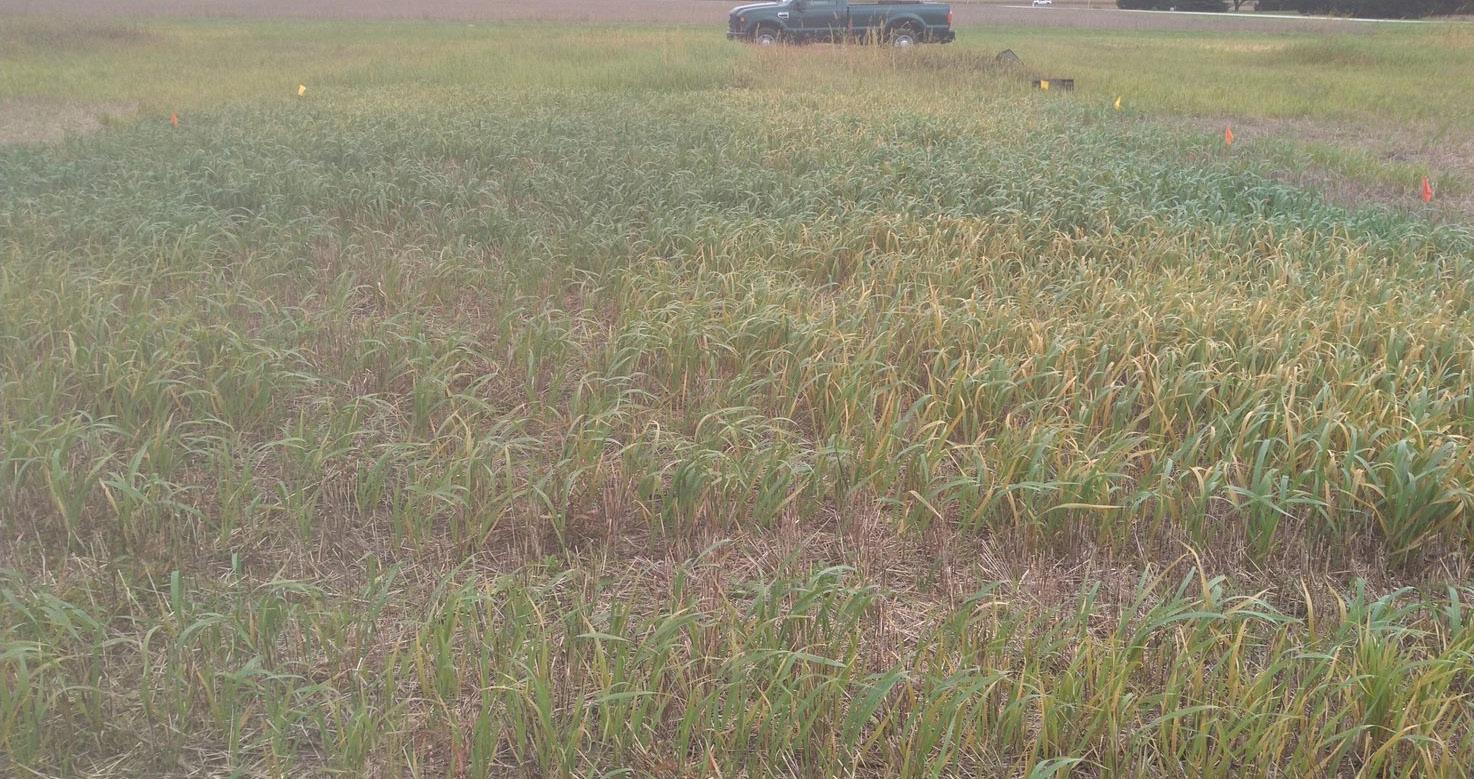
Nitrogen rate had a very visual effect on oats color and growth. Plots with 0 pounds of nitrogen were 50% volunteer wheat with very yellow oats. Plots with 100 lbs of nitrogen or more had dark color with increased nitrogen rates having visually larger leaves.
For inquiries about this project, contact Jason Hartschuh (hartschuh.11@osu.edu) or Allen Gahler (gahler.2@osu.edu).
• Both planting date and nitrogen rate had an effect on oats yield.
• Unlike prior years when the early planting date yielded less than the later planting this year the early planting significantly out yielded the later planting.
• Nitrogen application increased crop yield but didn’t have an effect on crude protein with the early planting date.
• 200 lbs of nitrogen maximized yield with the early planting date, but the later planting only needed 100 lbs of nitrogen to maximize yield but protein per acre was maximized with 200 lbs of nitrogen.
Treatment Means with the same letter are not significantly different according to Fisher’s Protected Least Significant Differences (LSD) test at alpha = 0.1.
Determine the nitrogen and sulfur needs of cereal rye with both fall and spring application timing.
Planting Date 10/7/2020
5/13/2022
Harvest Date 4/27/2021, 5/4/2021, 5/11/2021, 5/18/2021
Variety VNS
Population 120 lbs/ac
Variety Winter Annual Cereal Species
Acres 10
Population 2 bu/ac
Acres 2
Treatments 6 Reps 4
Treatment Width 10 ft.
Treatments 8 Reps 4
Treatment Width 10 ft.

Tillage No-Till
Management Fertilizer
Tillage Minimum Management Fertilizer
Previous Crop Soybeans
Row Spacing 7.5 in.
Previous Crop Wheat
Row Spacing 7.5 in.
Soil Type Rimer Loamy Fine Sand, 98% Hoytville Clay Loam, 2%
Soil Type Hoytville Clay Loam, 100%
A randomized complete block design was used for this study with 6 treatments. A base of 0 or 20 pounds of nitrogen was applied in the fall as urea using a drop spreader. At green-up, 50 or 70 pounds of additional nitrogen was applied as urea with a drop spreader. An additional treatment of 20 pounds of sulfur as ammonium sulfate was applied with a drop spreader, nitrogen balanced in the spring to treatments with 20 pounds of fall nitrogen and 50 or 70 pounds of spring nitrogen.
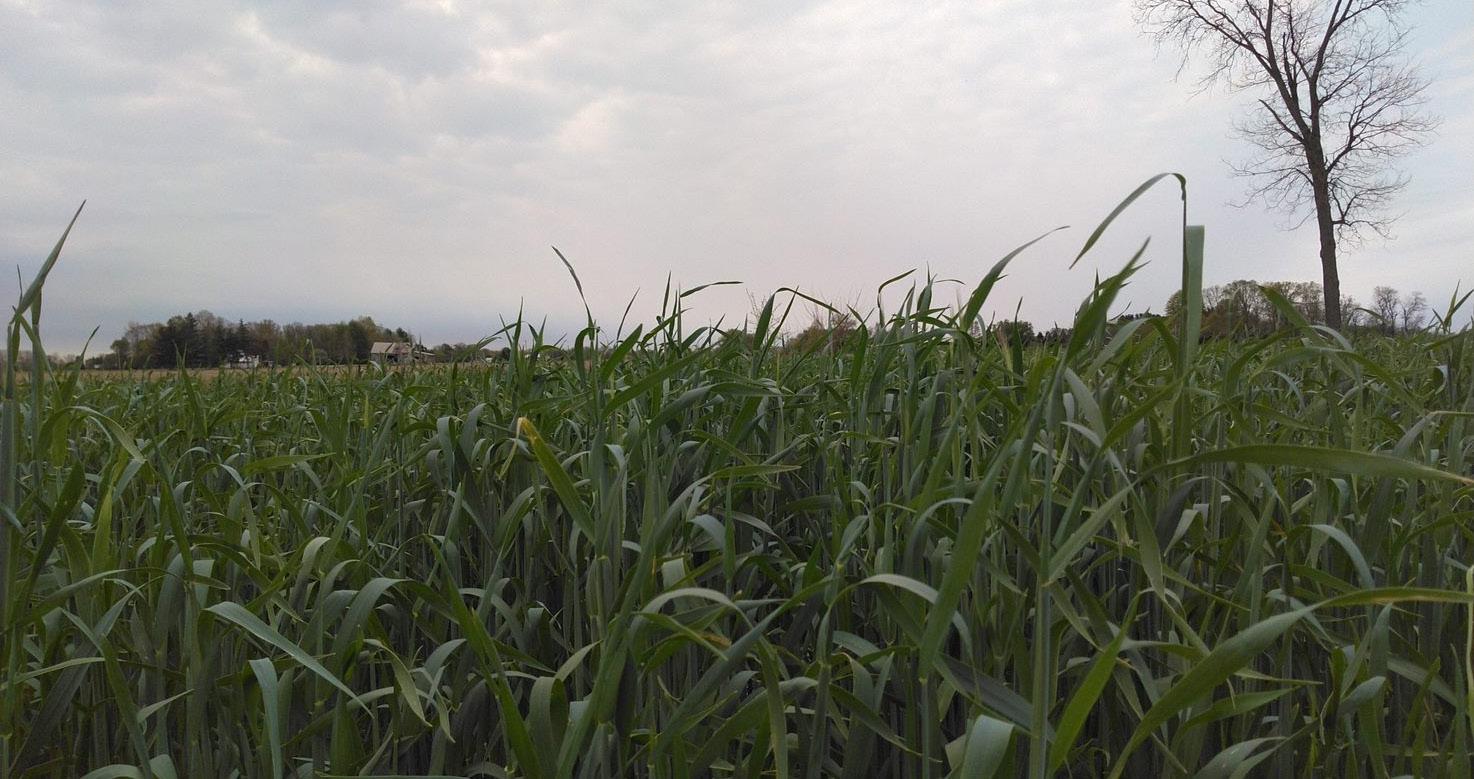
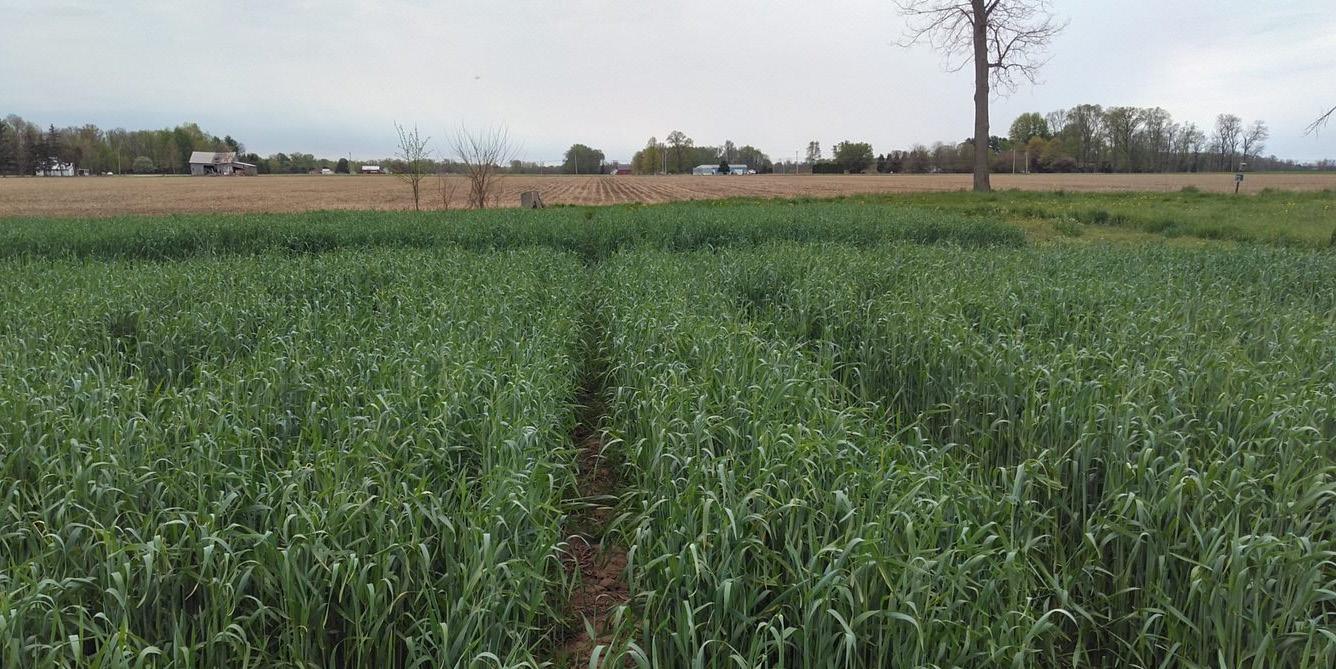
Plots that received fall nitrogen had a darker green color to them in the spring than plots that didn’t have any fall nitrogen. After spring nitrogen application plot color evened out. The sulfur plots were then darker green at harvest.
• Cereal rye when grown for forage benefits from nitrogen applications in the fall and spring.
• The fall nitrogen application trended toward higher yields with the fall nitrogen application in combination with 50 lbs of spring nitrogen and 20 lbs of sulfur yielding significantly more than the no fall nitrogen treatments.
• 70 lbs of spring nitrogen without sulfur regardless of fall nitrogen treatment significantly increased crude protein.
• The additional 20 lbs of nitrogen cost $18 but increased the feed value by an average of $35 per acre for the increased crude protein.
Treatment Means with the same letter are not significantly different according to Fisher’s Protected Least Significant Differences (LSD) test at alpha = 0.1.
Forage analysis was used to determine the nutritional value of the forage for livestock performance.
For inquiries about this project, contact Jason Hartschuh (hartschuh.11@osu.edu) or Allen Gahler (gahler.2@osu.edu).
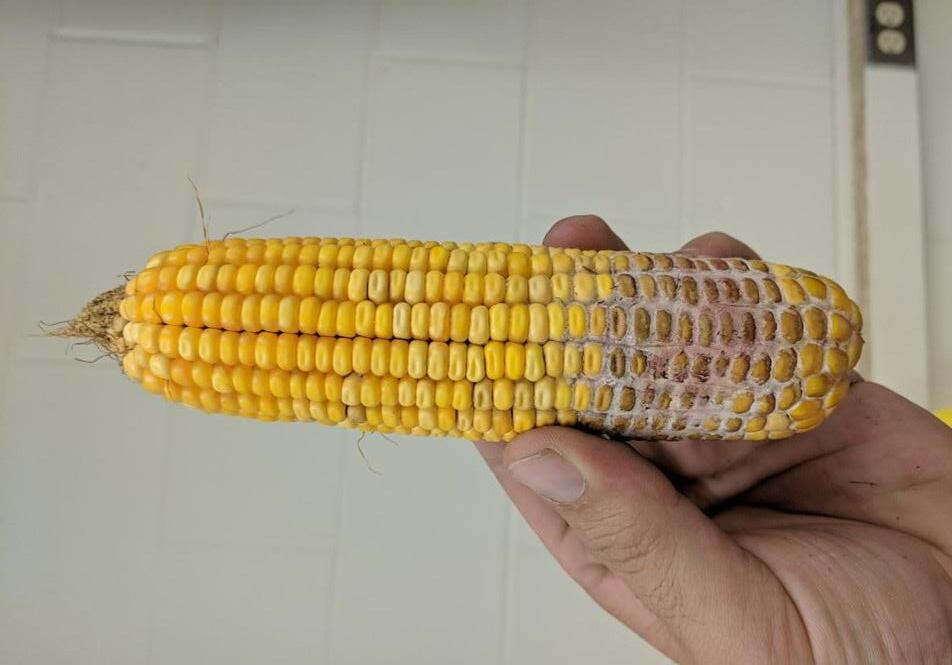
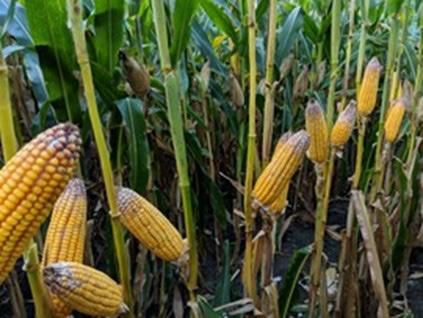
Gibberella zeae (also known as Fusarium graminearum), is the pathogen that causes stalk rot and Gibberella ear rot of corn. The fungus typically infects via the silk channel, causing a pinkish-white mold to develop at the tip of the ear. Relatively warm, wet weather (rainfall or high relative humidity) during and after silking (R1 growth stage) provides optimal conditions for the development of ear rot. During infection and colonization of the ear, the fungus produces several mycotoxins, including deoxynivalenol (DON), also called vomitoxin. As a result, high levels of Gibberella ear rot severity and resulting moldy grain are usually accompanied by high levels of vomitoxin.
Moldy leaves and stubble
It is not uncommon to see dust during harvest as fragments of dead, dry plant parts and soil particles become suspended into the air as the combine drives though the field. However, the concern in some years is that the dust can be excessive and particularly darker in color than usual. One possible explanation is that leaves died prematurely as a result for midto late-season diseases such as tar spot, gray leaf spot, and northern corn leaf blight. When exposed to wet, humid conditions these leaves will produce lots of fungal spores. For instance, under wet conditions, northern corn leaf blight lesions produce large amounts of dark-colored spore that are easily suspended in the air once the plants are disturbed by the combine. In addition, saprophytic fungi such as Alternaria, which also produce dark-colored spores, may also grow on dead plant tissue exposed to wet, humid late-season conditions, adding to the amount of dark particles in the dust cloud during harvest.
Anytime there is slow grain dry-down or late-season rainfall, there is potential for high levels of one or more ear rots (Gibberella, Fusarium, Diplodia and Trichoderma). Of these, Gibberella ear rot (GER) has been the most frequently reported and is the ear rot of greatest concerns since grain harvested from GER-affected fields will be contaminated with vomitoxin and other mycotoxins. One of the primary consequences of GER is vomitoxin contamination of dried distiller ’s grains with solubles (DDGS), a nutrient-rich co-product of ethanol production that is commonly sold as an ingredient for animal feed. Vomitoxin is not destroyed during ethanol production, nor is it removed in the ethanol fraction, but rather becomes concentrated in the grain fraction. This leads to three-fold higher levels of the toxin in DDGS over the levels found in the original grain. Consequently, ethanol plants may reject GER-affect grain with high levels of vomitoxin.
Moldy kernels are typically not evenly distributed in a grain lot, and as a result, toxin-contaminated grain are found in pockets (hot spots). Consequently, poor sampling and/or testing technique may lead to incorrect estimation of vomitoxin in the grain lot. For instance, a sample pulled from a hot spot may lead to an overestimation of the overall level of contamination on the load. Prior to testing, producers (or their agents) may request a second sample be drawn if they feel the first sample was not representative of the entire lot. Following vomitoxin testing, producers/agents have the right to reject the commodity testers’ results and ask the handler to send the sample to a federally licensed grain inspector for a re-test. Refer to Ohio Code 926.31 for details.
Severely diseased and toxin contaminated grain are usually smaller than healthy grain and covered with fungal mycelium (mold). Compared to healthy grain, diseased grain break easily during harvest, transport, and other forms of grain handling, increasing the number of fine particles and the amount of dust in the grain lot. Fields with ear rot problems should be harvested as soon as possible and handled separately from healthy field, even if it means harvesting those field at a higher-than-usual moisture content. Adjust the combine to minimize damage to the grain and increasing the fan speed will help to remove lightweight grain and dust particles, and as a result, reduce the level of mycotoxin in the grain lot. Once harvested, grain should be dried down to below 15% moisture and storage in a clean dry bin.
There are no commercially available treatments for reliably reducing vomitoxin in harvested grain. Planting Gibberella ear rot resistant hybrids is the best approach for reducing the disease and toxin contamination in the field. Fungicide applications at R1 have shown promising results, but further research is needed. Toxin levels can increase in storage if conditions are not dry and cool. Warm, moist pockets in the grain promote mold development, causing the grain quality to deteriorate and toxin levels to increase. Aeration is important to keep the grain dry and cool. However, it should be noted that while cool temperatures, air circulation, and low moisture levels will minimize fungal growth and toxin production, these will not decrease the level of toxin that was already present in grain going into storage. Vomitoxin is very stable and will not be reduced with drying.
Respiratory Alert – Harvesting and handling moldy grain may expose workers to mycotoxin and high dust concentrations
Wear a respirator to protect against dusty, moldy and toxic substances. There are two types of disposable models to choose, either the N95 (which filters out 95% of airborne particulates) or the N99 (which filters out 99% of airborne particulates).
The P100 mask is form fitting and is not disposable. This style requires a respirator fit test to ensure the right size. It uses disposable air cartridges to offer the best protection against dusts and molds in the air
Never wear a 1-strap mask on the farm, as they do not offer the level of protection needed in agricultural environments with high organic particles.
Make sure to wear either an N95, N99 or P100 mask whenever working in dusty and moldy environments, especially at the grain storage and handling bins.
1. The mask should have a tight fit over your nose and mouth, and requires contact with smooth skin. Facial hair, eyeglasses and certain dental appliances can prevent the mask from making a seal around your face.
2. The respirators are available in many sizes and various configurations, making sure the proper fit can be made.
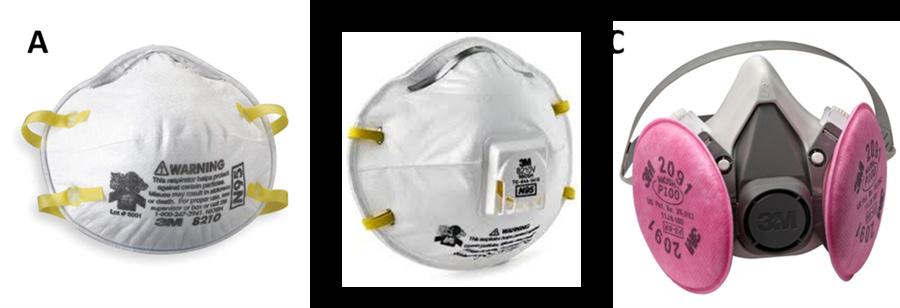
3. Always use both straps to hold the mask in place and prevent air from leaking in around the edges.
Consider the N95 and N99 respirators similar to the air filter in your vehicle.
1. When the mask gets clogged beyond a comfortable condition, replace it with a new mask. Likewise, if the inside of the mask becomes dirty, dispose of it.
2. Replace masks if they become wet, torn or have stretched out straps.
3. N95 and N99 masks are made to be disposable, they cannot be cleaned or disinfected.
There are no recommendations for how many minutes or hours a mask will last in agricultural environments. A face mask filter is rated to absorb a total mass of 200mg, however on the farm, the time to reach this level is not known. Each respirator will be affected by personal hygiene, breathing resistance and density of the air contaminants. Each job will vary - as will the heat, humidity and other environmental conditions while performing the job.
High moisture corn has the potential to mold and emit mold spores during harvest and storage periods. Workers should protect themselves from grain dust, including the mycotoxins and fungi, with N95, N99 or P100 respirators. Single strap dust masks are worthless in many agricultural environments, especially moldy grain.
For inquiries about this article contact Dee Jepsen (jepsen.4@osu.edu) or Pierce Paul (paul.661@osu.edu)
To asses the effect of nitrogen rate and planting date on late-season oasts for forage.
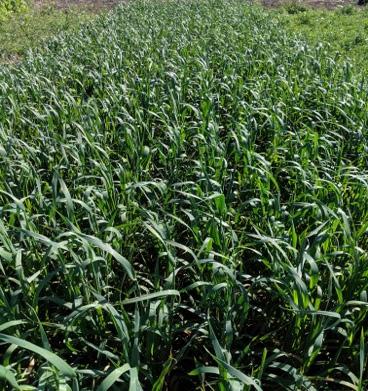
Planting Date Treatment
Harvest Date Heading
Variety Feed Oats
Crop 2021 Corn
Population 100 lbs/ac
Acres 20
Cleaning Date 2/3/2021
Wind Speed 5.5 mph
Wind Direction North
Treatments 5 Reps 4
Treatment Width 10 ft.
Fill Speed 1,500 bu/hr
Management Fungicide
Previous Crop Wheat
Treatments 3 Reps 4
Row Spacing 40

Bushels 2,000
Grain Cleaner Type 10 inch homemade slant with 1/4 inch screen
Soil Type Rimer Loamy Fine Sand, 98% Hoytville Clay Loam, 2%
This study was a randomized complete block split-plot design. Planting dates consist of every 15 days from August 15th through September 15th. Nitrogen rates were 0, 46,92, 138, and 184 pounds per acre applied at planting as urea. Plots were harvest after heading for the first 2 planting dates and after first hard frost for the later planting date. All plots were sprayed with headline fungicide to manage crown rust.
Both planting date and nitrogen rate have a significant effect on lateplanted fall oats yield and quality. The first two planting dates did not see a planting date effect on yield but the third planting date was significantly less. All planting dates followed the same trend of higher nitrogen rates increasing yield and crude protein. Planting date and nitrogen rate also had an effect on TDN, increasing nitrogen rate also increased planted TDN with the greatest increase when the first 46 pounds of nitrogen was applied. NDF saw its greatest effect with planting date. The mid September planting date had the lowest NDF as it never reached heading.
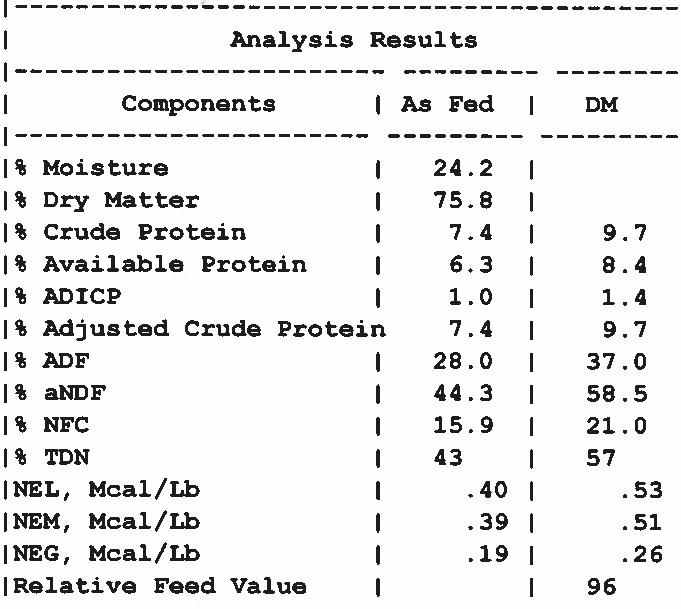
NIR forage nutrient content analysis is used to determine the value for forage to the livestock that will be consuming it.
• Visual color differences were present across all nitrogen rates.
• The first two planting dates initially struggled with excess rainfall.
• The latest planting date never reached heading before a hard frost which we harvested after.
For inquiries about this project, contact...
Jason HartschuhExtension Educator, Crawford County
hartschuh.11@osu.edu
(419) 562-8731
To determine the benefit of sulfur, nitrogen rate, and fall nitrogen application on cereal rye forage yield and quality.

Planting Date 10/5/2022
Harvest Date 5/2/2023
Variety Cereal Rye
Population 2 bushels
Acres 10
Treatments 6 Reps 4
Treatment Width 10

Tillage Conventional
Management Fertilizer
Previous Crop Soybeans
Row Spacing 30 in.
Soil Type Cardington Silt Loam, 65% Tiro Silt Loam, 16% Bennington Silt Loam, 14%
This study was a randomized complete block design with 4 replications. Treatments consisted of a fall nitrogen application at planting of 20 pounds of nitrogen or no fall nitrogen. In the spring after green up either 50 or 70 pounds of nitrogen as urea was applied along with either 20 pounds of sulfur or no sulfur. Plots were harvested with a small plot forage harvested at head in the boot to determine yield and quality.
Fall nitrogen increased plant tillering compared to the no-fall nitrogen plots. Neither nitrogen or sulfur applications had an effect on the heading date. No visual color difference could be seen between treatments.
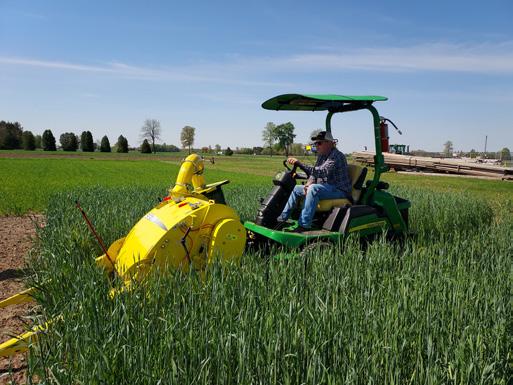
Small plot forage harvester to obtain accurate yields of forage crops. This harvest chops the forage and weights it, then a sample is pulled for moisture and quality analysis.
• Both spring and fall nitrogen rate has a significant effect on cereal rye dry matter yield. 20 Pounds of fall nitrogen had a significant increase in cereal rye yield of at least one ton of dry matter. The addition of 20 more pounds of spring nitrogen over the current base recommendation of 50 pounds also significantly increased the yield by half to one ton. The spring application of sulfur did not provide a significant yield or protein increase. Fall nitrogen did have a slight increase in NDF compared to no fall nitogen.






Help Ohio’s farm families achieve financial success in today’s challenging marketplaces.




In 2021, 16 dairy farms participated in the Farm Business Analysis and Benchmarking Program. Fifteen conventionally managed farms and one organic farm with 7,155 cows completed the analysis meeting all internal accuracy checks. These 15 farms provided detailed financial and production information to complete a whole farm analysis. They also completed analysis of their dairy and crop enterprises. Herd size ranged from 108 to more than 1,200 cows.
Dairy enterprise results are reported for the average of all farms and the high 25% sorted by net return per cow. Results are also summarized by profitability group and by herd size. Benchmark reports are available both per cow and per hundredweight (cwt) of milk.
Find the full report at https://farmprofitability.osu.edu
Technicians work directly with farms to develop and complete:
• Balance Sheets, cost and market valuations, beginning and end of year
• Income Statement, accrual adjusted




• Statement of Cash Flows


• Enterprise Analysis
• Cost of Production


• Per cow, per cwt, per acre, per bushel, or per ton



2021’s milk prices were higher than 2020’s, and a welcome return to a more stable monthly price following the wild swings due to the Covid-19 Pandemic. Most Ohio dairy farmers market their milk in Federal Order 33, although some milk does flow into the eastern and southern Orders. The F.O. 33 Statistical Uniform Price for 2021 was $16.99 per hundredweight (cwt.), $1.14 per cwt. higher than 2020, and $0.22 lower than 2019’s $17.21 per cwt.
Feed costs are the number one expense for dairy farms, averaging $9.95 per cwt, or 53.6% of total direct and overhead costs for all farms, and $9.13 per cwt, or 59.7% of total direct and overhead costs for the high 20%of herds. Monitoring and controlling feed cost is clearly an important management function on dairy farms.
1 Before labor and management charge.
2 Farms sorted by net return per cow.
3 Conventional herds only.
• These 15 herds generated an average net return of $776 per cow. Thirteen herds generated positive net returns per cow, averaging $974 per cow. Only two herds generated negative net returns, consistent with what was observed in 2020.
• We typically see a large range in net return per cow among the farms in the analysis.
• 2020 was no exception with a difference of more than $2,700 per cow, ranging from a loss of $749 per cow to a positive net return of more than $2,000 per cow. This wide range in net return per cow was $800 more than the 2020 analysis.
• Over time, net returns must be positive and of sufficient quantity to cover family living needs, principal payments and pay income tax liabilities. Additional dollars can be invested either in or outside of the farm business.
2021 Ohio Farm Business Summary
Whole farm business analysis monitors overall profitability, working capital and net worth change. Enterprise analysis provides complete cost of production data to effectively inform marketing and management decisions. Personalized benchmark reports identify opportunities to control costs and increase profitability.
For inquiries about this project, contact...
Christina Pfaff (pfaff.58@osu.edu)
Haley Shoemaker (shoemaker.306@osu.edu)
Clint Schroeder (schroeder.307@osu.edu)
Dianne Shoemaker (shoemaker.3@osu.edu)
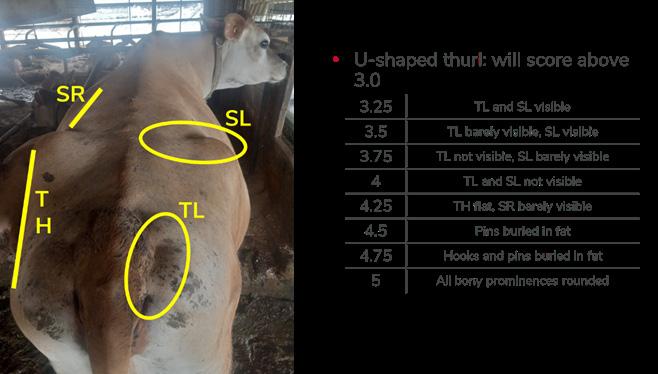
Evaluate whether using a ½ point body condition score for dairy cows could save time without affecting interpretative value.
Start Date 2/1/2023
End Date 3/31/2023
Species Cattle
Treatments 5 Reps 3
Experimental Unit Head
Genetics Commercial
Breed Jersey
Sex Cows
Health Protection As needed
Feed Access Ad libitum

OSU Animal Science
Franklin County
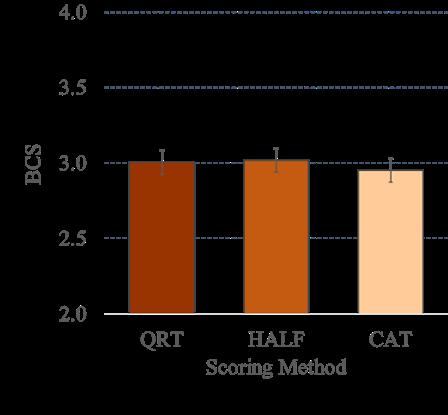
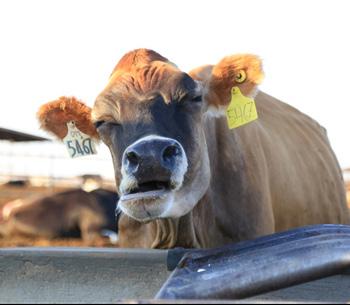
Students (n = 14) were trained to evaluate BCS of Jersey dairy cows (n = 20) classified to stage of lactation (fresh = 0-28, early lactation = 29-100, mid lactation = 101-200, late = 201+).
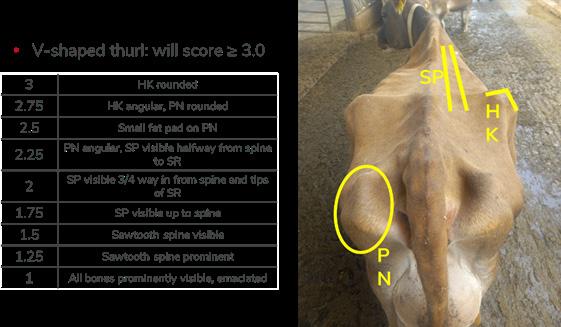
Three body condition scoring methods were utilized: a standard ¼ pt BCS for dairy cows (Edmonson et al., 1989); a ½ pt BCS where students were required to round to the nearest half point, and a low/ok/high approach where students scored cows relative to their desired BCS based on DIM.
Both figures detail the body condition scoring system utilized for this study
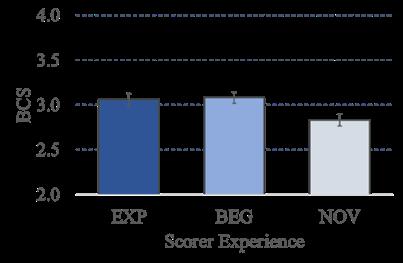
Both the QTR and HALF were lower than the categorical approach, but the difference was very small (0.06 pts). Variance of both methods was not different.
Scores were also analyzed by experience level of the scorer and we found that novice scorers tended to score cows lower (0.24 pt) than scorers who identified as beginners or experienced.
If there is no interpretative difference for scoring method (cows in a pen still average the same score), then a half-point scoring system may enable the producer to save some time, estimated at 15 seconds saved per cow scored. For a 1,000 cow herd this represents >27 labor hours saved by simplifying the scoring system. This savings could be significant if scoring is conducted by a farm consultant at a high hourly wage.
• This study found that there was no affect on interpretative value.
• It was confirmed that this method did save time with its effects being more apparent as herd size increases.
Body condition scoring is widely utilized as a way of quickly and effectively assessing the relative thinness or fatness of cattle on a scale from 1 to 5.
For inquiries about this project, contact...
Dr. Ben Wenner (wenner.20@osu.edu) Associate Professor
To determine the correlation between calf rectal temperature and the rumen temperature as measured by the Farm Fit™ rumen bolus. Compare the time trend of rumen bolus temperature to the time of rectal temperature
Species Dairy Calves
Start Point 2 Weeks
End Point 4 Weeks
Experimental Unit Pen
Genetics Commercial
Breed Holstein
Sex Heifers
Health Protection As needed
• This study investigates the correlation between the gold standard of rectal temperature monitoring to the rumen-reticular bolus monitoring system. It compared the onehour bolus monitored temperature over a 5-hour period to the calf’s rectally measured temperature after feeding. Calf temperature was taken between 18:00-19:00 hours each night and then compared to the bolus readings from 17:00-21:00 hours along with various averages in that range.
• Both rectal temperate and rumen-reticular temperatures of dairy calves move in the same direction as each other but not always at the same rate.
• Lin’s Correlation coefficient, which is how closely the temperature readings fall to the line of the exact same temperature is weak but positive. The Bias Correlation across all temperatures is strong though with the strongest comparisons being close to 1 which is perfect.
• When comparing the rumen-reticular temperature to rectal temperature the stongest relationships come from averageing the time closest to rectal temperature taking followed by the 5 hour average around that time.
• Rumen bolus temperature can be a useful management tool to determine when a calf is sick with a fever.
The time lag between a calf’s current temperature and the last time the bolus synced with the collector and management app can cause producers to think a calf who drank slowly doesn’t have a fever but a few hours later it will show a fever in the app that it really had at feeding.
The natural daily change in a calf’s temperature also causes many calves to have fever alerts late in the day and rectal temperature may be lower than the fever threshold in the morning.
Lin’s Correlation Coefficent of 0.3 or greater is considered as a moderate/acceptable positive correlation
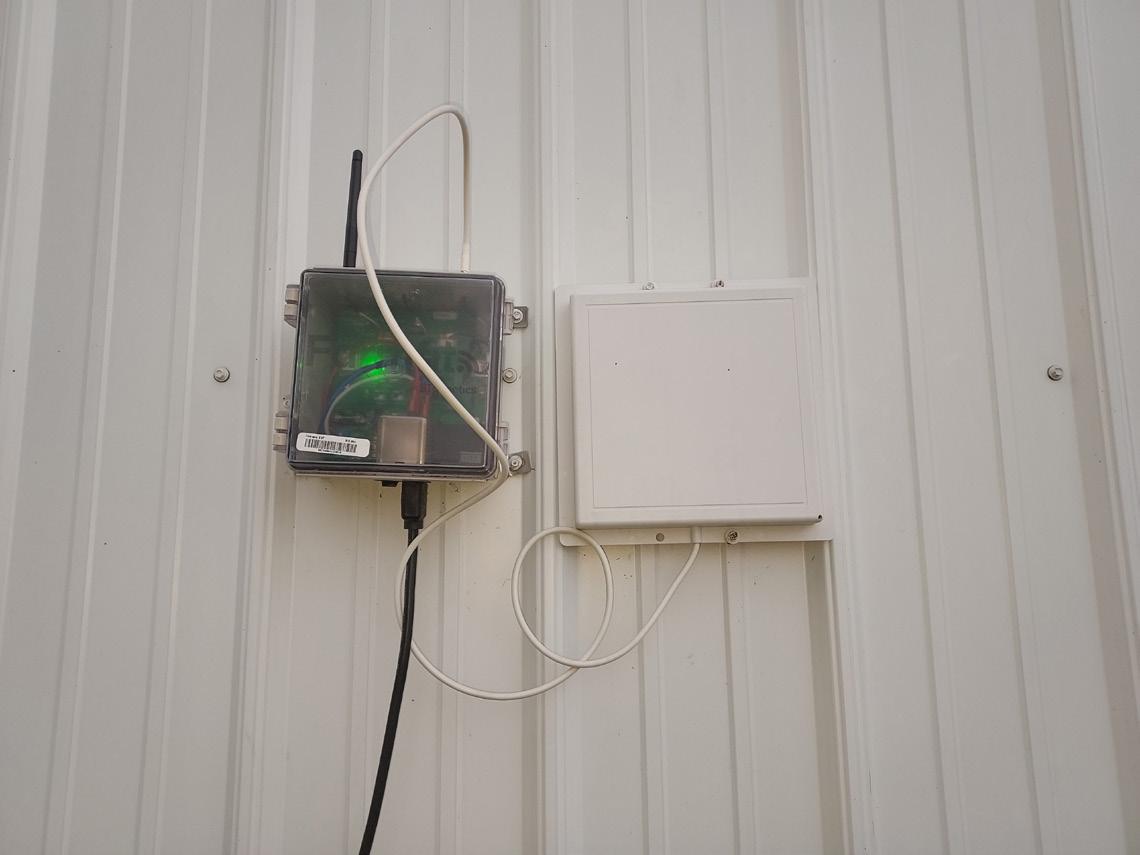
Farm Fit™
Farm Fit™ rumen-reticular temperature and activity monitoring system.

Including a rumen bolus administered to each calf and a management app.
For inquiries about this project, contact... Jason Hartschuh
Extension Educator, Crawford County hartschuh.11@osu.edu
(419) 562-8731

Test efficacy of organic-certified essential oil product for methane mitigation in dairy cows.
Start Date 4/1/2021
End Date 2/28/2023
Species Cattle
Treatments 4 Reps 3
Experimental Unit Head
Genetics Commercial
Breed Jersey
Sex Cows
Health Protection As needed
Feed Access Ad libitum

IACUC # 2019A00000001
OSU Animal Science
Franklin County
Using donor cows from Waterman Dairy, rumen fluid was adapted to dual-flow continuous culture fermenters (n = 4) and several potential feed additives for methane mitigation were evaluated over 4 experimental periods in a 4 x 4 Latin square.
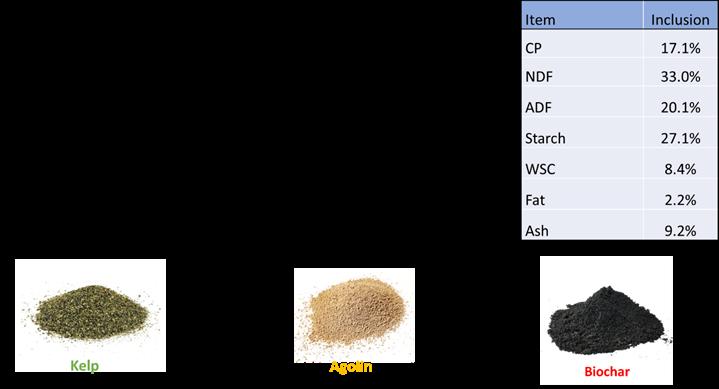
Diet utilized for study
Comparison of relative effectiveness of organic methane inhibitors
Two of the treatments (biochar made from hulls and dried kelp product) were not effective in decreasing methane production in continuous culture. However, the Agolin product did decrease methane production by 10% without loss in energy production by the rumen microbes. Early indications are that several microbial genera are enriched by the essential oil treatment to increase succinate production pathways to perhaps increase microbial energy efficiency
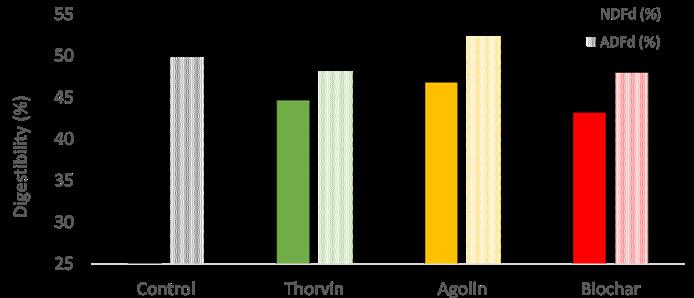
It is important to note that many methane inhibitors function at a cost to fiber digestibility. However, in this study the essential oil product did not decrease fiber digestibility. In fact, while not statistically significant, numerical increases in fiber digestibility with the essential oil treatment are reassuring as to the efficacy of this product for application in dairy herd nutrition.
Digestibility of organic methane inhibitors
• Biochar and dried kelp were not effective at reducing methane production.
• Agolin did result in some decreases in methane production.
• The methane inhibitors tested did not reduce fiber digestibility and the essential oil treatments did show slight improvements in fiber digestibility(not statistically significant).
Continuous Culture Fermenters
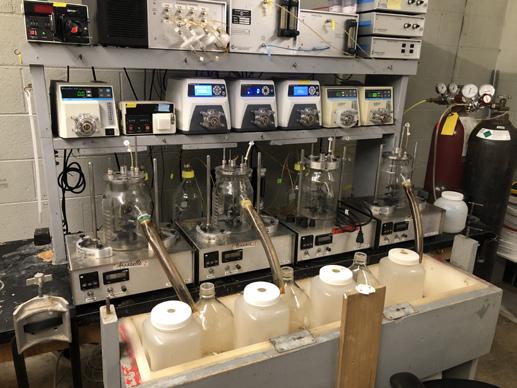
Fermenters simulate rumen activity and allow for greater replication in a more controlled environment when compared to using live cows.
For inquiries about this project, contact...
Dr. Ben Wenner (wenner.20@osu.edu) Associate ProfessorTicks and the diseases that they vector to livestock, companion animals and humans have become an increasingly larger public health risk. There are five tick species of medical importance in Ohio including the American Dog tick, the Black Legged or Deer tick, the Lone Star tick, the Gulf Coast tick and the Asian Longhorned tick.
A common misconception is that ticks are only active in the spring and summer. While ticks are more active in April through September, ticks have a multi-year life cycle, and can be encountered any month of the year. Ticks hatch from eggs as larvae, then as they feed and mature, they progress through their life cycle next becoming a nymph then an adult, feeding from multiple hosts in this process and it can take two to three years to fully complete this process depending on their species. Ticks hunt via questing, where the tick uses its back two pairs of legs to hold onto vegetation and its front two pairs of legs to grab prey as it walks past.
The American Dog Tick prefers a more open habitat including pasture, meadows, and lawns. This tick is a prominent vector of Rocky Mountain Spotted Fever and Tularemia.
The Black Legged or Deer Tick prefers to live in wooded habitat. This tick is the primary vector for Lyme disease plus can also vector Babesia, Anaplasmosis and viral disease.
The Lone Star Tick is an aggressive feeder and prefers wooded habitat. This tick is the reported causative agent for the Alpha-gal or Mammalian Muscle Allergy reaction where person who has an allergic reaction when bitten can become allergic to meat including beef, pork, and venison.
The Gulf Coast Tick has recently become established in southwestern Ohio. This tick is worrisome as it has the potential to vector the zoonotic disease, Leptospirosis, to multiple species. This is tick prefers an open environment including meadows, pasture, and lawns.
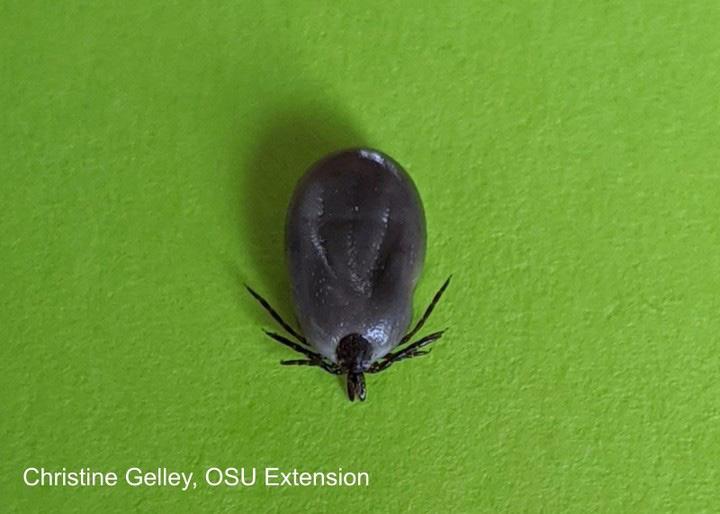
The Asian Longhorned Tick is an invasive tick that was recently identified in Ohio in 2020. This tick is unique in that it reproduces via parthenogenesis, meaning the female does not need a male to breed, allowing it to produce extreme numbers of ticks on its host or in a pasture. This tick has the ability to vector disease to cattle as well as cause mortality through feeding.
• Wear light colored long sleeve/long pant clothing when entering tick habitat.
• Make sure to wear permethrin treated clothing and use repellents as labeled for prevention. Remember to read, understand, and follow all label instructions.
• Talk to your veterinarian about what products you can use for your animals.
• Frequently scout your animals as this tick can reproduce in large numbers.
• While we have had detection as early as April, this tick is known to prefer heat and tall grass. The largest numbers of ticks on cattle in Ohio have been detected in July.
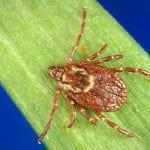
• This tick has been known to vector Theileria, a protozoal blood parasite, to cattle.
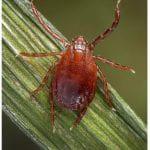
• Work with your veterinarian if you think you have ALHT on your animals. The products we have labelled for cattle tick control have shown to be effective against ALHT so far.
• Management intensive grazing with rotation through paddocks to let your animals maintain the pasture will be an important integrated pest management strategy.
• There are products labelled for pasture application to control ticks that have shown to be effective, but they need to contact the tick to work. Application on top of tall grass or mowed grass residue may not contact the tick directly and therefore may not be effective for control. Remember to read, understand, and follow all pesticide labels.
• For more information on Asian Longhorned ticks including pictures for identification check out the OSU Extension Ohioline fact sheet publication: “Asian Longhorned Ticks in Ohio” at https://ohioline.osu.edu/factsheet/vme-1035.
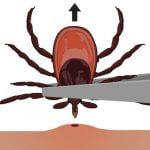
For inquiries about this project, contact...
Timothy S. McDermottExtension
Educator,Franklin County
mcdermott.15@osu.edu
(614)-292-7916

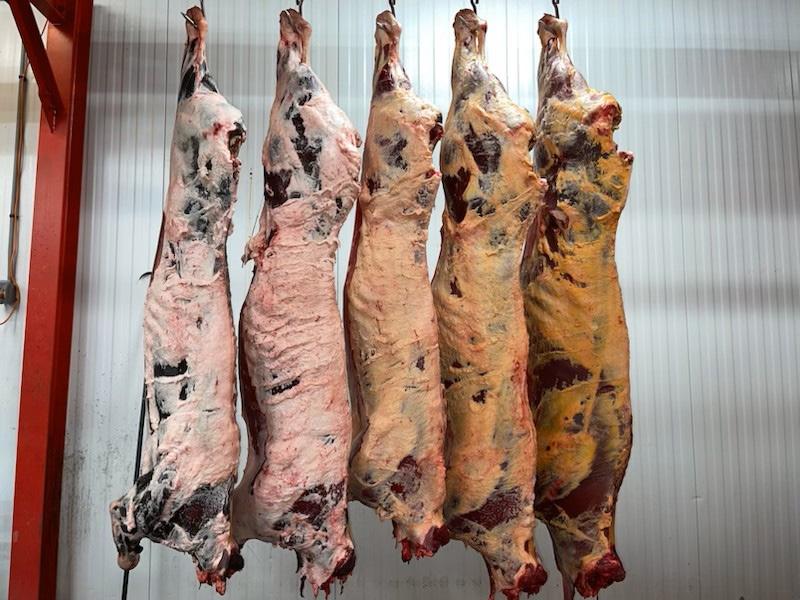
Audit various small-scale meat processing facilities to provide carcass characteristics of the type of beef produced in Ohio.
Start Date 2021
End Date 2021
Species Beef
Sex Steer/Heifer/Cow
The National Beef Quality Audit (NBQA) was developed to “benchmark” the status of the US beef industry. To date, a beef quality audit has yet to be conducted in individual states, such as Ohio. With nearly 300 federally inspected, state inspected, and custom meat processing facilities, collecting beef carcass data could serve to assist beef producers in modifying their livestock practices to reach their end goal of producing high quality beef.
Ohio Beef Quality Audit- Percentage distribution of carcasses stratified by Quality and Yield Grades
*Other column includes Quality Grades: Commercial, Utility, Cutter, Canner
Beef carcass data shows that Ohio is producing higher yielding carcasses with less back fat that are comparable in quality grade and marbling score. In a questionnaire, meat processors highlighted opportunities for increased educationin the realm of fundamental meat science for livestock producers, meat processors, and meat consumers.
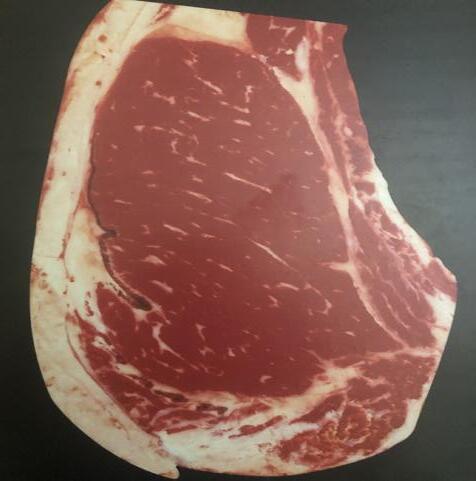
• Ohio is producing the majority(68%) of its cattle at a Quality Grade Choice or higher.
• The majoroty of cattle in Ohio are of a Yield Grade 3 or better.
²100=Canner. 200=Cutter, 300=Utility, 400=Commercial, 500=Standard, 600=Select, 700=Choice, 800=Prime
³100=A00(youthful), 200=B00, 300=C00, 400=D00, 500=E00
⁴100=Practically Devoid00, 200=Traces00, 300=Slight00, 400=Small00, 500=Modest00, 600=Moderate00, 700=Slightly Abundant00, 800=Moderately Abundant00, 900=Abundant00
⁵1=White, 2=Creamy White, 3=Slightly Yellow, 4=Moderately Yellow, 5=Yellow
USDA Beef Carcass Grading
USDA beef carcass grades are based off of the percentage of intramuscular fat within the ribeye (longissimus dorsi) between the 12th and 13th rib. Quality grades are used to help predict consumer eating satisfaction of beef. The grading card shown is a marbling score of Modest 0, Average Choice.
For inquiries about this project, contact...
Lyda G. Garcia, Associate Professor State Meat Science Extension Specialist garcia.625@osu.eduThe objective of the present study was to evaluate the effect of GnRH dose administered at initiation (GnRH-1) of a 5-day CO-Synch + P4 protocol on ovulatory response, expression of estrus, and fertility in suckled beef cows.
Species Beef
Start Point Day 0
End Point Day 5
Treatments 2
Reps 4
Experimental Unit Cow
Genetics Commercial
Breed Angus x Simmental
Sex cow
Health Protection As needed
Feed Access Ad libitum
IACUC # #2018A00000041

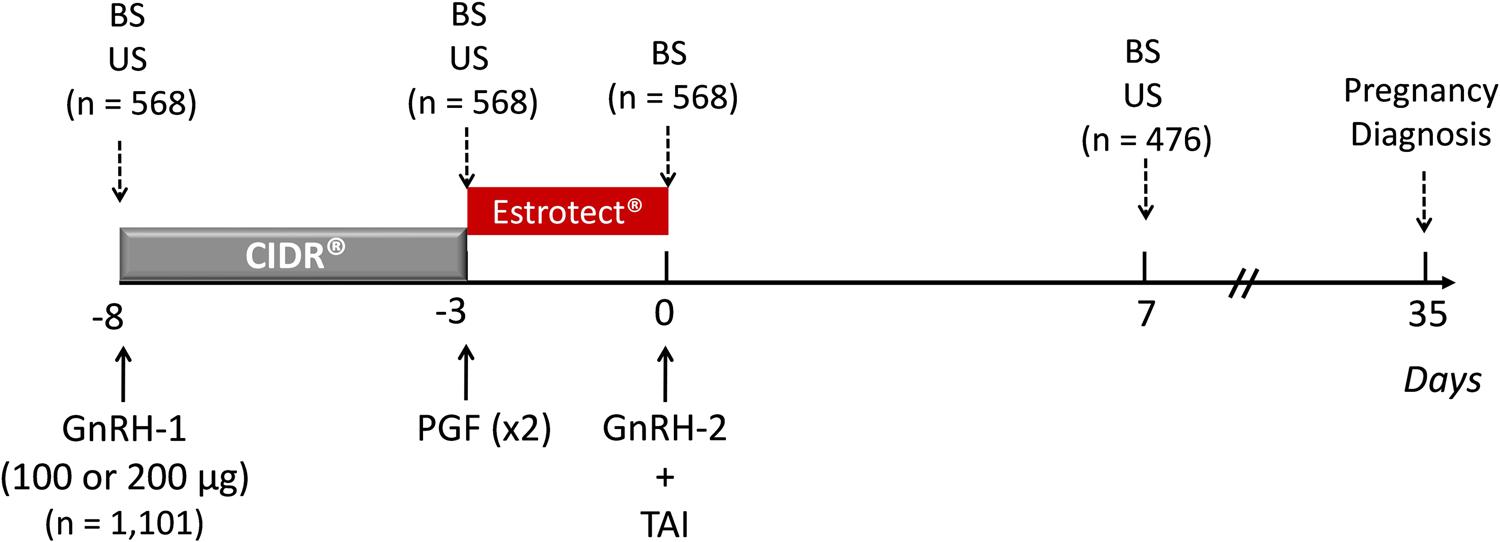
At each location, cows were randomly assigned to receive either a Single (100 μg of gonadorelin acetate; n = 548) or a Double (200μg of gonadorelin acetate; n = 553) dose of GnRH (GONAbreed®, Parnell, Overland Park, KS) at initiation (GnRH-1) of a 5-day COSynch+ P4 (D-8; Fig. 1) (Bridges et al., 2012). Briefly, cows received a controlled internal drug releasing insert (CIDR, Eazi-Breed cattle insert, 1.38 g of P4, Zoetis, Kalamazoo, MI, USA) and were administered 100 or 200 μg (i. m.) of GnRH at random stages of the estrous cycle (D-8). Five days later (D-3) the P4 device was removed and two doses (i. m.) of prostaglandin F2α (PGF, 500 μg/each of cloprostenol sodium, EstroPLAN®, Parnell) were administered concurrently. Cows were artificially inseminated with frozen-thawed semen 72 h after removal of the P4 device (D0) concurrently with administration of 100 μg of GnRH (i. m.; GnRH-2) to assure ovulation. Estrus detection patches (Estrotect®, Rockway Inc. Spring Valley, WI) were placed on cows on D-3 and evaluated at the time of AI (Estrus: > 50% activated; No estrus: ≤ 50% activated). In addition, in a subset of cows (n = 248) patches were evaluated every 12h between D-3 and D0.
Schedule of treatment and data collection for suckled beef cows administered 100 or 200 μg of gonadorelin acetate at GnRH-1 of a 5-day COSynch+ P4. BS: Blood sample collection. US: Ovarian ultrasonography. PGF: 500 μg of cloprostenol sodium. TAI: timed artificial insemination. GnRH-2: 100 μg of gonadorelin acetate.
The percentage of cows with a CL on D-8 was not different (P = 0.43) between treatment groups. The probability of ovulation after GnRH-1 increased with increasing follicle diameter and reached a maximum at 13.7 mm, and subsequently decreased as follicle diameter increased. Ovulatory response to GnRH-1 was 56.2% and did not differ (P = 0.57) between treatment groups.
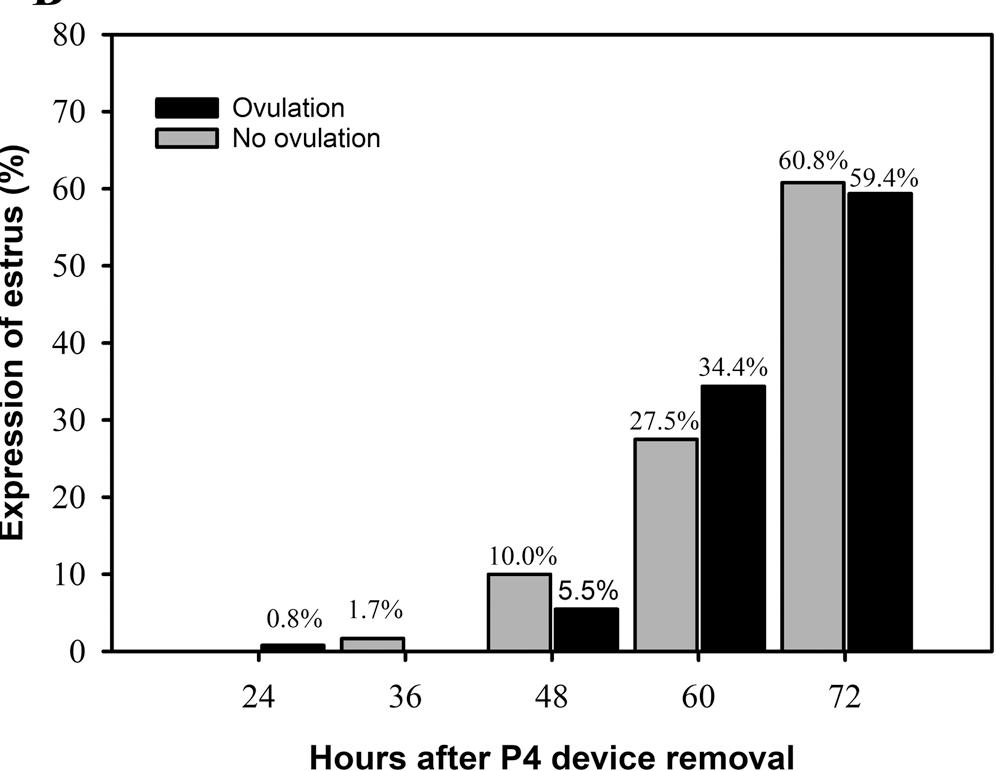
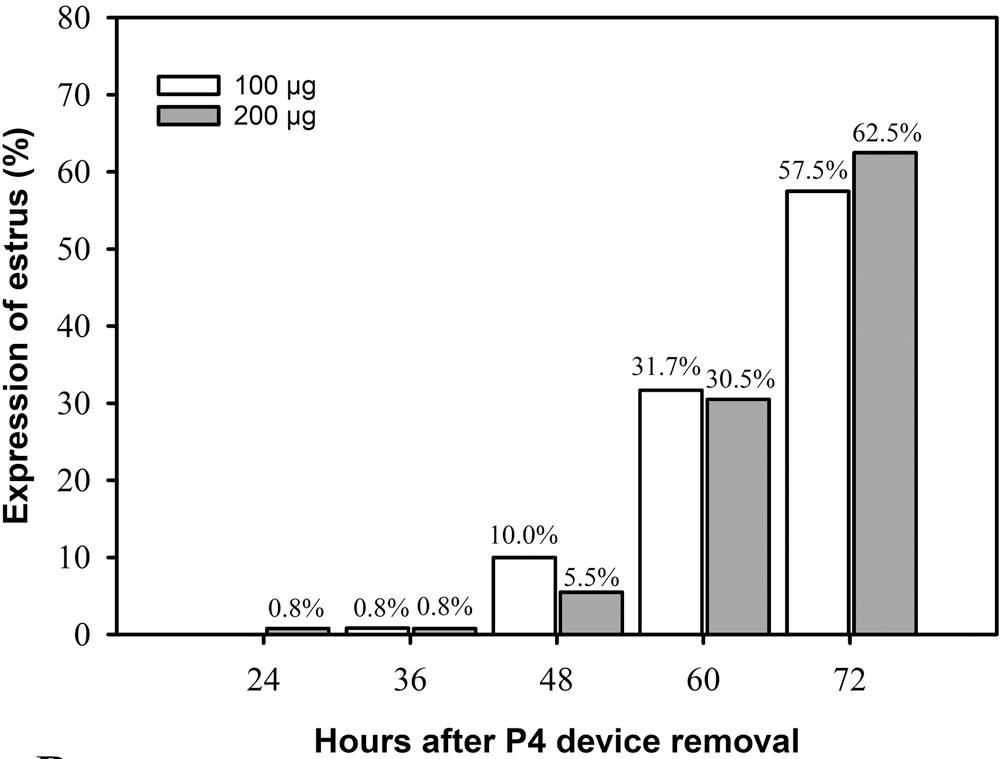
Overall expression of estrus was 56.6% and was not different between treatment groups (P = 0.79). Expression of estrus was greater (P = 0.05) for cows without ovulation to GnRH-1. However, expression of estrus was not affected (P > 0.10) by BCS, postpartum interval, or presence of a CL on D-8. Finally, there were no differences (P ≥ 0.13) in the distributionof expression of estrus between treatment groups nor between cows that had or did not have ovulation to GnRH-1.
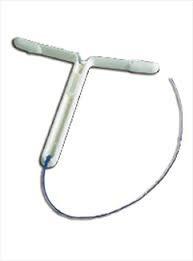
CIDR
Controlled internal drug release (CIDR) is utilized to syncronize estrus in various livestock species.
• The amount of GnRH at CIDR insertion had no effect on the expression and detection of estrus(heat).
• Additionally, the GnRH dose did not have an effect on ovulation.
• There was no statistically significant difference in conception rate when cows were ultrasounded at 35 days.
• A single dose of GnRH is equally as effective as a double dose and therefore a cost savings to the producer.
For inquiries about this project, contact...
Dr. Alvaro Garcia Guerra Assistant Professorgarciaguerra.1@osu.edu
(614)-292-6583
The objective of these experiments were to evaluate the effect of protein supplementation and pasture contamination with gastrointestinal nematodes on the growth and health parameters of growing grazing lambs.
Start Date 6/12/18:6/11/19
End Date 10/2/18:10/1/19
Species Sheep
Start Point ~60 days
End Point ~172 days
Treatments 4
Reps 4/year
Experimental Unit Pen
Genetics Commercial
Breed Hampshire x Dorset and Suffolk x Dorset Crossbred lambs
Health Protection As needed
Feed Access Ad libitum

IACUC # 2017A00000029
A total of 192 spring born Dorset × Hampshire × Suffolk crossbred lambs from the Ohio Agricultural Research and Development Center (OARDC) Sheep Unit Wooster, Ohio were evaluated over the course of 2 years (2018, 2019). Each year, grazing events were initiated in June and concluded in October with a total grazing period of 112 days.
Lambs were weaned at 60 days of age, with an initial average starting body weight of ~65 lbs. Lambs were born, reared, and housed indoors for the first 60 d of life to reduce exposure to parasitic infection prior to the initiation of the grazing periods. As a result, prior to each experimental grazing period, lambs were not exposed to parasitic infection nor treated with an anthelmintic or de-worming product.
Lambs were were randomly assigned to one of four treatments: 1) new pasture without supplementation (NN); 2) new pasture with supplementation (NS); 3) established pasture without supplementation (EN); and 4) established pasture with supplementation (ES).
• Protein supplementation increases lamb body weight and improves lamb parasite resilience.
• Decreasing pasture parasite burden by converting previous crop ground to pasture increases lamb body weight.
• Soil cultivation, cropland renovation, and limiting grazing activity reduces overall parasite burden, but does not eliminate parasite challenges entirely.
• Financially, providing lambs with a protein rich supplement demonstrated greater profit.
Lambs in the NN and NS treatment groups were placed on a new pasture, described as newly sown pasture converted from cropland that had never been fertilized with livestock manure nor grazed by sheep or other ruminant livestock. Lambs assigned to the EN and ES treatment groups were placed on established pasture, described as permeant sheep pasture that is rotationally grazed year-round by the existing OARDC ewe flock. Forages in both pastures were primarily dominant (90%) in tall fescue. Lambs in the NS and ES treatment groups were supplemented with a plant-derived protein rich supplement (soybean meal, distillers grains, and corn gluten meal). Supplement treated groups were given supplement in a portable feed trough on pasture and were fed at a rate of 1% live body weight per day, with supplementation rates adjusted every 14 days.
In terms of lamb growth, lambs that grazed on established pastures had a greater body weight gain than compared with those grazing on the newly established pasture. Additionally, supplementation also had an effect on lamb growht whereas those lambs that were provided supplement, regardless of pasture type, had a greater growth rate when compared with lambs that were not supplmented. As it relates to lamb health, there were some notable differences in FAMACHA eye scores and packed cell volume as shown in Table 4. In general, according to these metrics, lambs that were provided supplemental feed, regardless of pasture type, had a lesser parasite burden when compared with lambs not provided a supplement. As for the economics of each production system; descriptively, Table 6 shows that when using a base price, lambs provided with supplemental feed when grazing tall fescue pastures in the context of this experiment resulted in 5x increase in net value per lamb. However, there was little difference when comparing pasture type.
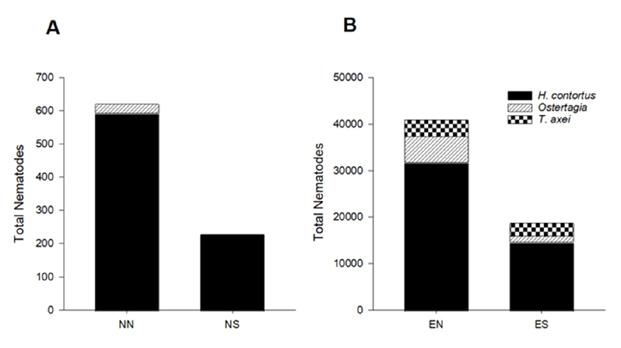
Total Worm Counts
Although the most intensive method of identifying parasite burden wihtin a host, this practice provides the most in depth view of the current parasite challenge may be facing. Total worm counts are conducted by harvesting adult parasites directly from the animal post harvest. Once collected, parasites can be individually evaluated to identify species and quantify the intensity of infection.
For inquiries about this project, contact...
Brady CampbellState Small Ruminant Extension Specialist
campbell.1279@osu.edu
(330) 263-5563
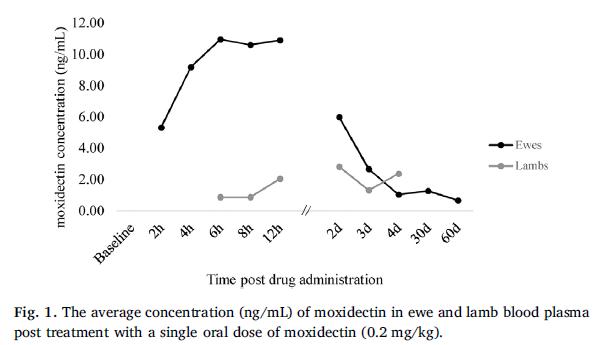
The objectives of this experiment were to 1.) determine the metabolization of moxidectin (the active drug in Cydectin oral drench for sheep) in lactating ewes and 2.) quantify moxidectin carryover to nursing lambs via milk.
Species Sheep
Reps 4
Health Protection As needed
Feed Access Hand fed IACUC # 2015A00000061

Four, fall lambing Border Leister × Dorset cross ewes (~3 years of age) were mated to a Dorset x Hampshire cross ram. Each ewe reared a single lamb born between September 24 and September 27, 2015, with average lamb age of ~26 days of age at the onset of trial. All sheep were housed indoors in one group pen.
Additional Study Notes:
The ewes in this experiment had a 157 day wash out period from their last Cydectin treatments to ensure that moxidectin would be cleared of their systems. Ewes on trial were dosed Cydectin orally at 1cc/11lbs. of body as outlined on the manufacturers label. Blood and milk samples were collected from the ewes and blood samples was collected from their nursing lambs in order to determine the amount of moxidectin in all sheep at any given time point.
As shown in Fig. 1, moxidectin was detected in the blood of lactating ewes ewe 2 hours post adminstration, peaked around 6-12 hours, and remained at a detectable level 60 days post adminstration. Interestingly, moxidectin was also detected in the lambs 6 hours post ewe treatment, but only remianed in the system of the lambs for a short period of time, becoming undetectable after 4 days.
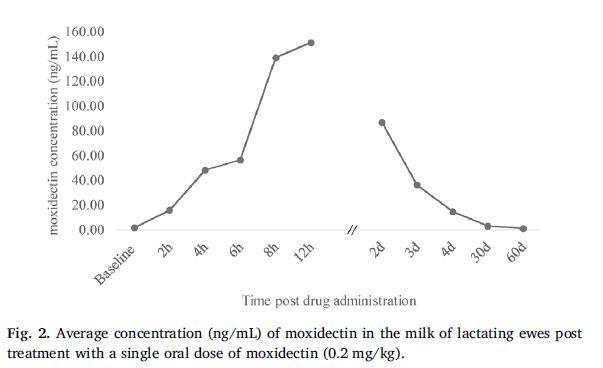
Fig. 2 shows the concentration of moxidectin in the milk of the four lactating ewes. As noted in the baseline sample, moxidectin residues were still present in the system of the ewes even after providing them with a wash out period of 157 days. Furthermore, moxidectin concentrations peaked 12 hours post administration and remained in the system of the ewes until 60 days post treatment.
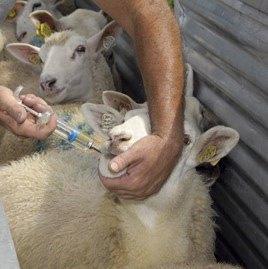
The most common practice used to treat parasitic infection in small ruminants is with the use of an anthelmintic or de-wormer using an oral drench. In order to provide an effective dose, producers must ensure that their equipment is in tip top shape. Rubber gaskets around the plunger of the syringe will dry out and crack over time, leading to air mixing with the oral soltuion. To ensure that sheep and goats are recieving the exact dosage required for treatment according to the manufacturers label, time should be spent cleaning, lubricating, and replacing eqiupment on an as needed basis.
• Moxidectin concentrations were detected in the milk of sheep up to 157 days post administration. This is in part due to the bind efficiency that this anthelminitic has with fat within the body.
• Moxidectin drug residues were present in the plasma of nursing lambs indicating a transfer of the antiparasitic from the lacting ewe to the nursing lamb.
• Further research is needed to evaluate the effect of drug residue in milk on anthelmintic resistance in young, nursing lambs.
For inquiries about this project, contact...
Brady Campbell
State Small Ruminant Extension
Specialist
campbell.1279@osu.edu
(330) 263-5563
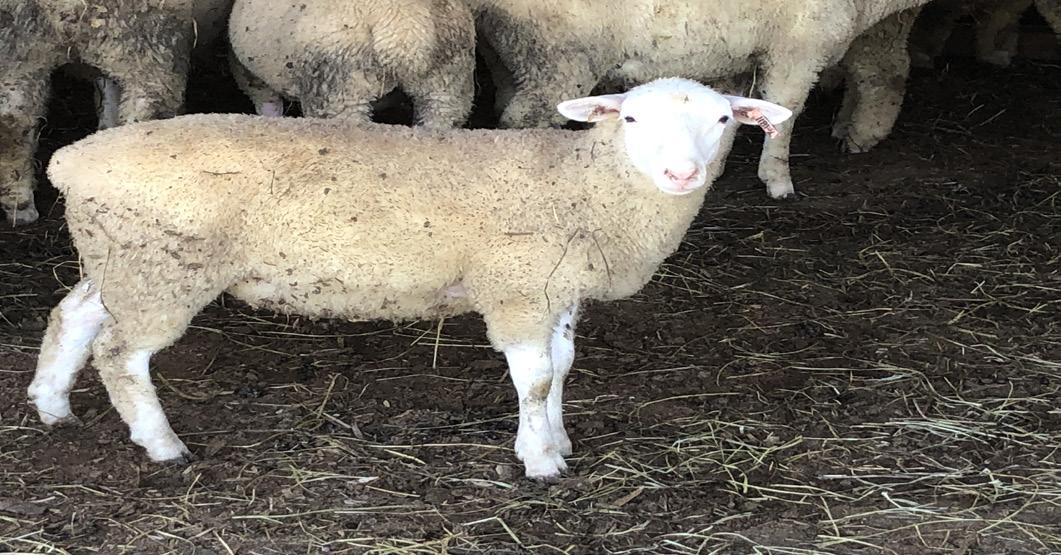
The main objective of this experiment was to evaluate performance, energy metabolism, and meat quality of market lambs that were offered different feed intake programs following fatty acid fetal programming while in-utero.
Start Date 3/15/2020
End Date 12/1/21
Species Sheep
Start Point Gestation
End Point Harvest
Treatments 4
Reps 6
Experimental Unit Soybeans
Genetics Commercial
Breed Dorset
Sex Ewes
Health Protection As needed
Feed Access Ad libitum/Restricted

IACUC # 2019A00000001
The study was designed to evaluate if supplementation during mid gestation affects the offspring development and growth, but the effects depend on the level of nutirion of the animal.
Treatment 1
Short Name Detailed Treatment
Dam saturated fatty acids/ offspring ad libitum
Treatment 2
Dam saturated fatty acids/ offspring restricted
Treatment 3
Dam polyunsaturated fatty acids/offspring ad libitum
Dams were supplemented with a saturated fatty acid during mid gestation and the offspring was fed adlibitum during the growing phase.
Dams were supplemented with a saturated fatty acid during mid gestation and the offspring was fed a restricted diet during the growing phase.
Dams were supplemented with a polyunsaturated fatty acid during mid gestation and the offspring was fed ad-libitum during the growing phase.
Treatment 4
Dam polyunsaturated fatty acids/offspring restricted
Dams were supplemented with a polyunsaturated fatty acid during mid gestation and the offspring was fed a restricted diet during the growing phase.
Treatment 4 of the study showed the least amount of backfat amongst all treatments in addition to the least body wall thickness and produced Yield Grade 1 lambs. Treatment 1 showed similar results as the group produced Yield Grade 1 lambs, however these lambs had increased amounts of fat. Treatment 1 also had the largest ribeyes of all the treatments. Treatments 2 and 3 produced the most similar lambs, both groups producing Yield Grade 2 carcasses.
• Maternal fatty acid supplementation during midgestation as well as feeding program of the progeny did not have any direct impacts on progeny growth performance, carcass weight, ribeye area, or the estimation for the percentage of boneless trimmed retail cuts.
• There was evidence in this study that showedmaternal FA supplementation and finishing strategy can affect body fat accretion of the progeny. However, feed restriction to lambs during the finishing period does not affect lamb growth or change the quality of their meat.
Supplementation to the dam during mid gestation with different fatty acids affects offspring growth depending on the level of nutrition during the growing phase.
For inquiries about this project, contact...
Alejandro E. Relling relling.1@osu.edu Associate Professor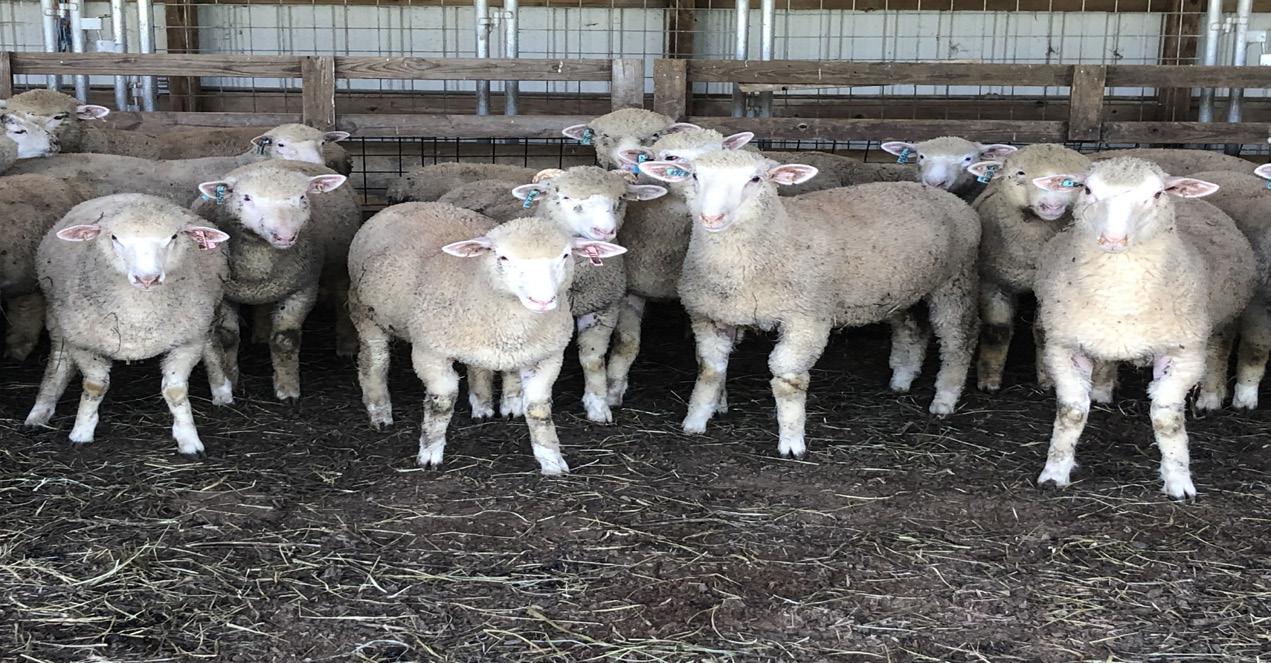
The objective of the present experiment was to evaluate the effect of maternal supplementation with fatty acids and methionine during late gestation on offspring growth, energy metabolism, and carcass characteristics.
Start Date 3/15/2019
End Date 12/15/2020
Species Sheep
Start Point Gestation
End Point Harvest
Treatments 4
Reps 6
Experimental Unit Pen
Genetics Commercial Breed Dorset
Sex Ewes
Health Protection As needed
The study was design to evaluate if supplementation during late gestation with some essential nutrients affect the offspring development and growth.
Short
1 Control No supplementation with
fatty acids
acids
4
Fatty

Maternal supplementation during late gestation with fatty acid or methionine has an effect on offspring development, increasing offspring growth.
When utilized together, fatty acids and methionine did not show significant improvements to lamb weights.
• The interaction of fatty acids and methionine when fed to ewes during the last third of gestation did not show a synergistic effect on postnatal growth and metabolism of the offspring when compared to lambs born to ewes supplemented with either fatty acids and methionine.
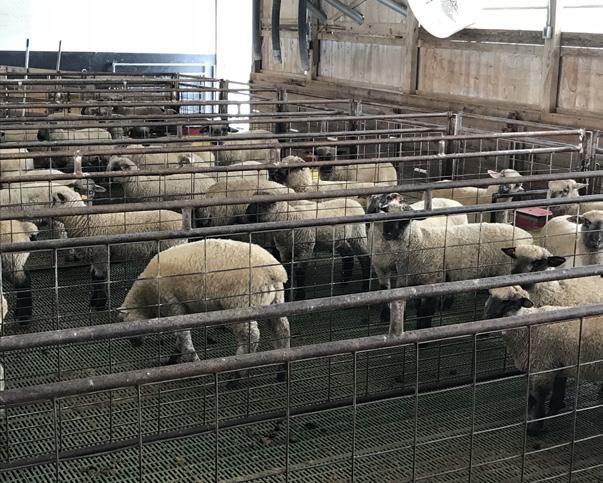
Results of offspring growth characteristics in response to the various treatments.
OARDC Sheep Research Center
Small pen design allows for inensive reproduction and nutrition sheep research.
For inquiries about this project, contact...
Alejandro E. Relling relling.1@osu.edu Associate ProfessorMeasure the Lambing Rate in Ohio Seedstock Sheep Flocks with an extended history of using frozen semen for Laparoscopic Artificial Insemination.
Start Date MD/DD/2021



End Date MD/DD/2021 Breed/Genetics
Start Date 2017
End Date 2023
M:F 00:00
Sheep
Point >1 year End Point <8 years
Lambing Rate, %
0
Laparoscopic artificial insemination (LAI) is an intrauterine method of insemination, to bypass the unique anatomically tortuous cervix in sheep.
Success of LAI programs depend on proper implementation of the estrus synchronization program, animal selection, and knowledge of the LAI process.
The data was collected from seedstock flocks using LAI technicians with multiple annual LAI opportunities.
Variables to influence the observed lower birthing rate: 1.ewe age and body condition of insemination group, 2. total number of ewes in insemination group, 3.uniform timing from CIDR pull to insemination, and 4. use of teaser ram to detect heat after CIDR removal.
• 2023 data exhibits a lower birthing rate compared to the average of the six previous years.
• Within the 2023 data,10 insemination dates were recorded results ranged from 16% to 100%.
• There was a range of insemination dates from August 1 to September 30, three breeds were inseminated (Shropshire, Hampshire,Tunis) by three different technicians.
• Numerous variable continue to exist for individual flocks.
• The seven year average birthing rate for frozen semen LAI is 57.36%
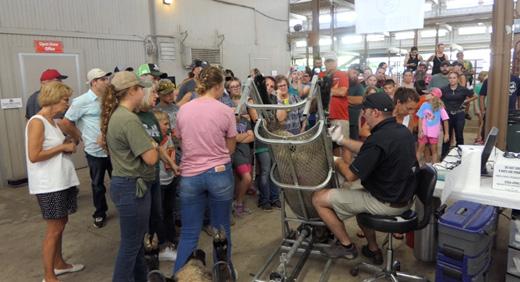
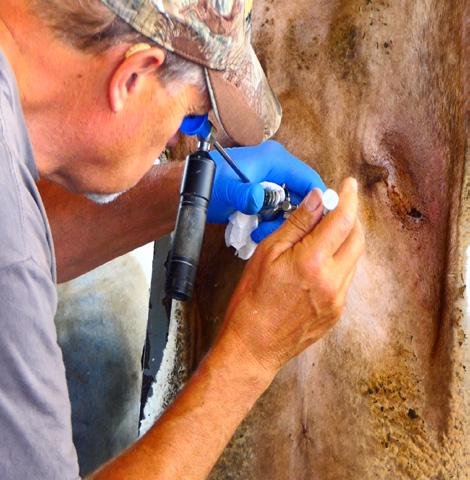
Laparoscope
Use veterinarian accepted procedures for Laparoscopic Artificial Insemination using frozen semen.
For inquiries about this project, contact...
Tim BarnesExtension Educator, Marion County
barnes.821@osu.edu
(740) 914-3020
In order to better understand the need for small ruminant dystocia education, a baseline of birthing assistance given to small ruminants needs to be determined.
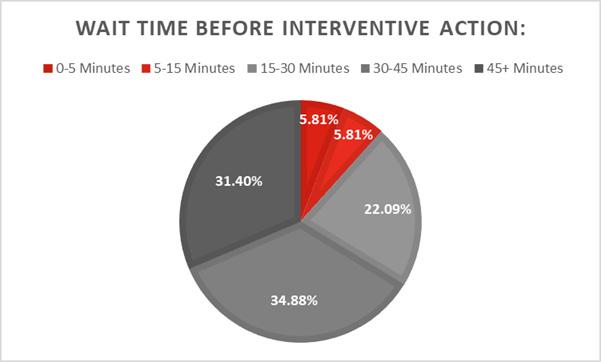
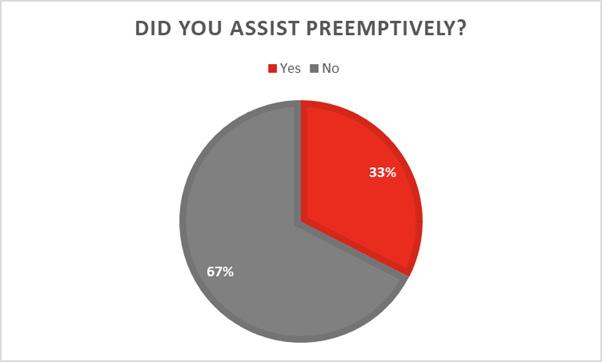
124 participants completed a survey indicating their flock size and location, number of births assisted, this season assistance level compared to average, the wait time for intervention, the level of assistance given, and if they intervened prematurely.
For more information and videos, follow the QR code:

Total ewes/does represented in survey: 4000
Total assisted ewes does in survey: 477
Assistance Rate: 11.93%
https://go.osu.edu/23ebarnsvideo

• To ensure farmers understand how and when to intervene in birthing, educational curriculum can be built of off knowing the baseline of assistance that is currently given.
• The “Lambing and Kidding Assistance Prevalence” survey had 124 individuals participate, which represented 34 states in the USA as well as Australia, Canada, and Portugal.
• Under the conditions of the survey, there were 4,000 total ewes/does represented and 477 total assisted, this equates to an assistance rate of 11.93%. Farms sized varied from 1-500 head.
• The data for this year’s season compared to an average season is what we would expect with 48.6% of respondents reporting the same as average aid given. The wait time for assistance trends to the longer side with 66.28% of respondents that indicates they gave assistance, waiting 30 mins or longer to intervene. 67.44% of individuals who indicated they gave assistance, reported that they did not assist prematurely. Of those that indicated giving assistance, over half (58.26%) responded that they gently pull to assist with the birthing.

• As the survey provided a response rate that exceeded expectations, we were able to gather a wide range of information to be able to produce content for our future lambing and kidding programs.

The Qualtrics survey platform allowed us to generate a survey to gather information virtually, we were able to reach different sheep and goat producers from around the globe.
For inquiries about this project, contact... Jacci Smith smith.11005@osu.edu or Kate Hornyak
hornyak.26@osu.edu
The presence of toxic gas on a livestock operation is not uncommon due to the biological nature of feedstocks and manure. Decomposition of organic material in this environment leads to a continuous source for the creation of gas. It’s important to understand the dangers of these gases and how to detect their concentration level.
When gases dissipate in open air their hazards are minimized. However, gases in confined spaces are different, often having deadly impact on humans and livestock. Manure pits, upright silos, grain bins, sewers, wells, or waste water holding areas are examples of confined spaces on the farm. The accumulation of gases can also occur without an enclosed structure, especially around areas like manure lagoons, bunker silos and freshly filled silage bags.
You can think about confined space gases similar to a can of soda. When the can is sealed, the gases remain inside. If the soda is shaken, the gases become agitated and try to explode out of the container. Once the gases are released, and especially over time, they dissipate. This is similar in an agricultural confined space, except that ag gases do not fully dissipate. Their volume (measured in parts per million, ppm) is reduced when mixed with oxygen from the environment. Either natural air or ventilation systems provide a good source of oxygen to help dilute the gas concentration level. Gases are less deadly when mixed with oxygen because their concentration by volume has been decreased.
The following management strategies should be practiced every time a person works in or around a confined space. Turn off - and lock out - all electrical equipment that could cause additional injury to the entrant. It is important that pumps, sweep augers, and other auxiliary equipment within the confined space not be turned on while a person is within the structure. Measure the gas concentrations present in the confined space. To do this, use an electronic monitor (with a long probe) or wear a personal gas monitoring device to test the atmospheric conditions before entering. Gases will stratify within the structure, so it is important to collect samples at different points and depths of the space to be entered. Oxygen levels should be at 19.5% for safe entry.
Add ventilation to the area. Depending on the type of confined space a person is entering, consider an appropriate ventilation system or a fan that can be used to ventilate the area being entered. Wear a harness and lifeline to enter the space. Harnesses need to be attached to an anchorage point that can withstand a 5,000 pound force. Ideally manufacturers should supply these within agricultural structures they design. However, many structures are missing these safety features leaving it to the worker to decide where to attach their harness. A harness tripod is a good alternative source when no other attachment point is available to enter below ground confined spaces like pits, sewers and wells. These tripods are also portable and collapsible for easy storage. A belay system is a good option for grain bin entry.
Have an observer present to monitor the person in the confined space. A worker should never enter a confined space without an observer present. The person in that role has the responsibility to call for help if needed and also retract the entrant from the space should they become unconscious or unable to evacuate the confined space on their own.
Have a rescue plan established if an emergency occurs. It is good to know who will be called, and how an emergency will be handled. Rescue plans should be discussed with any new hires and practiced annually with all workers. Post the local emergency numbers for police and fire in case 911 calls get routed to first responders outside the service area. It is also advised to post phone numbers for utility suppliers and equipment dealers in the event utilities need to be quickly suspended or first responders are unfamiliar with the equipment on the scene.
Gases are called the “invisible farm hazard” because they are often odorless and unable to be seen. Gases will behave like the atmosphere around them; they are affected by temperature, humidity, wind, and other barometric conditions that are constantly changing. When feedstocks ferment or manure decomposes, the organic materials change in their biological content. As the natural fermentation process occurs, off-gassing occurs. In the case of manure storage, temperature plays a significant role in that higher temperatures increase the microbial action and off-gassing within the materials. Gas concentration levels can increase rapidly without warning during high temperature seasons.
Common gases found on farms includes: ammonia, carbon dioxide, carbon monoxide, hydrogen sulfide, methane and nitrogen dioxide. Each gas has its own chemical property and will behave differently in a confined space. Table 1 provides the characteristics of each gas and when it is harmful to humans.
For inquiries about this project, contact...Dee Jepsen, PhD (jepsen.4@osu.edu) Extension State Specialist, Agricultural Safety and Health Program.


Hydrogen Sulfide Colorless gas with a strong odor of rotten eggs.
Methane An odorless, colorless gas. Highly flammable.
Nitrogen Dioxide Yellowish-brown liquid or reddish-brown gas (above 70°F). Can range from odorless to a strong pungent, acrid odor.
*PEL-TWA stands for personal exposure limit (Time Weighted Average). The levels are listed are for 25°C (77°F). The concentration of these gases is temperature dependent. Source: NIOSH Pocket Guide to Chemical Hazards and ASABE Standards.
Gas Sampling Equipment
There are different types of monitors available to detect gases on the farm. Follow manufacturer recommendations for using these devices, including proper calibration, to ensure the accuracy of sample. Never compromise the health of the entrant without knowing the oxygen content and gas concentration level of the confined space to be entered.
Electronic gas detectors
• Takes accurate measurements of various gases in a confined space.
• Some units can be specific for a single gas, like Oxygen.
• Some units can detect multiple gases, like Oxygen, Hydrogen Sulfide, Methane and Carbon Monoxide.
• Best used with a long cord or probe to measure various depths of the space – as gases will stratify within the confined space.
• Regular calibration of each gas is required.
Personal gas badges or monitors
• Worn by worker entering a confined space for their personal exposure.
• Have a built-in calibration detector that expires after a certain amount of time. This feature makes them disposable upon the expiration date.
Add warning signs in areas that gases can be present.

Commercially available gas detection kits provide monitoring device, long probe, and calibration gas/gases.
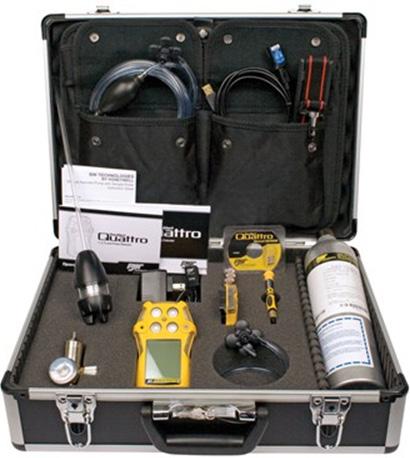
Note: Monitoring devices are shown as examples. No endorsement of specific products are intended. Contact safety suppliers for a range of gas detection equipment and prices. Always follow manufacturer recommendations for use, maintenance and calibration.
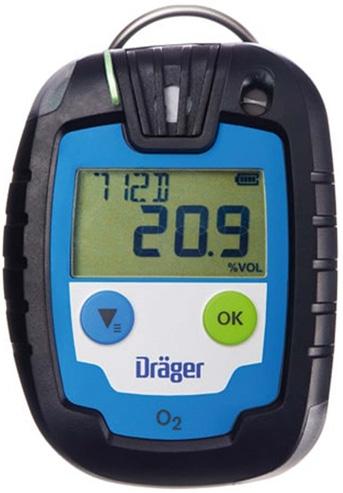

Summary
Gases from feedstocks and manure are invisible farm hazards and have the potential to cause great harm to livestock and humans. Workers should be aware of atmospheric conditions and other practices that increase generation of gases. Having a gas monitor, a harness, and an attendant is important when entering a confined space. Conditions change rapidly and need continuous monitoring to ensure the area is safe for human occupancy

The increased interest in valuing manure and using it as a viable source of organic crop nutrients which provides producers an alternative to commerical fertilizer. In part, this interest has supported the livestock industry in recent years.
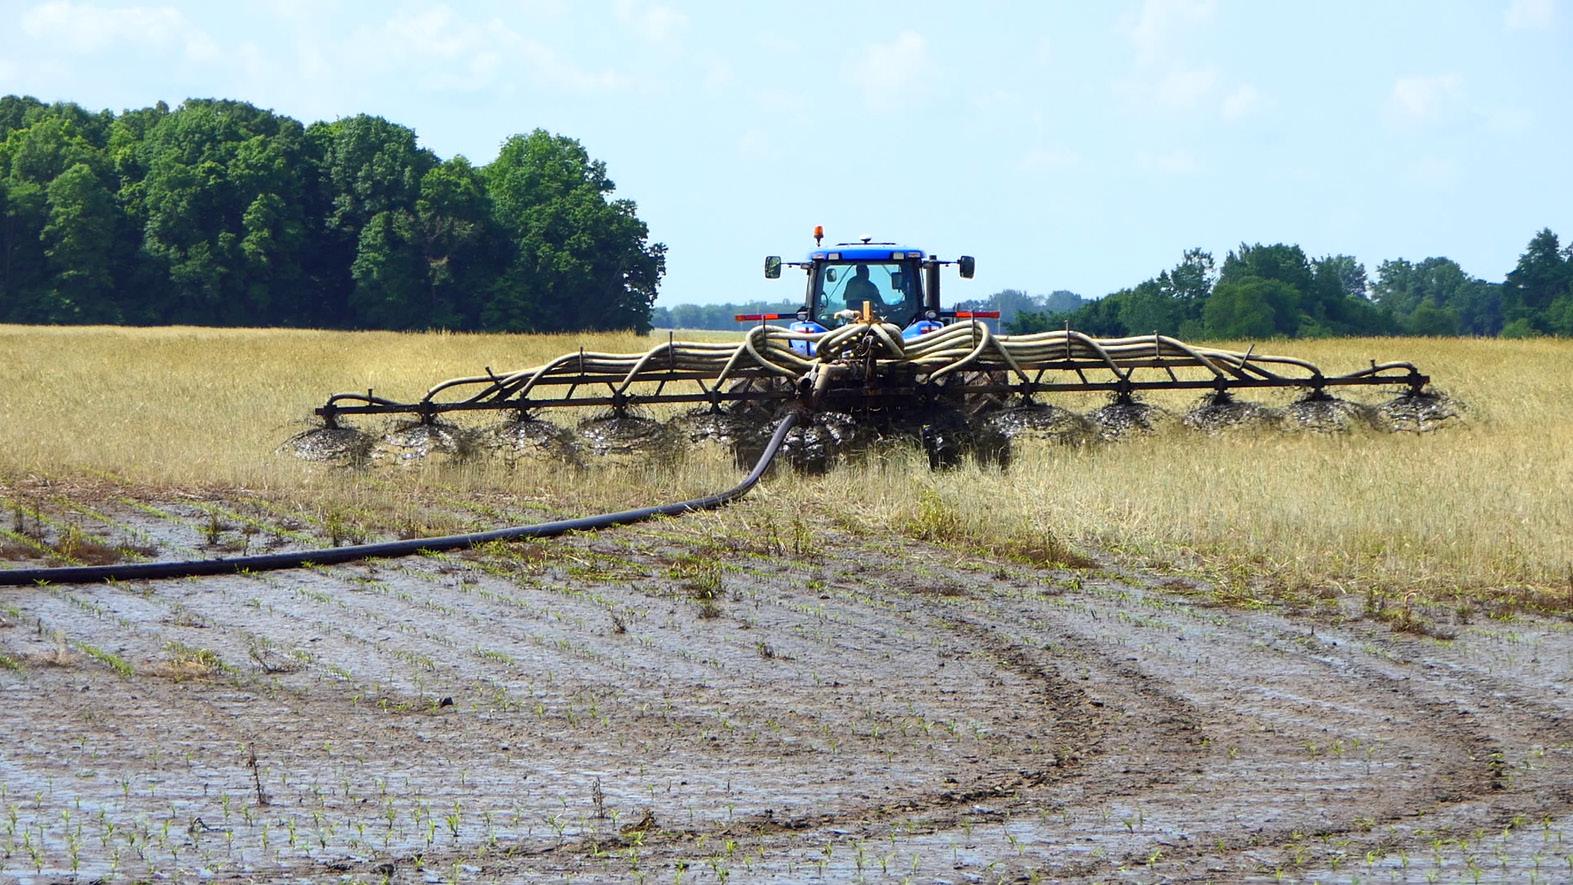
Ohio Certified Livestock Managers upon removal of the manure are required to record the nutrient anaylsis. The data has been collected from 13 farms with 39 current samples. This is a summary of the samples from 2022 and 2023. With the flucation in the price of commerical fertilizer this nutrient data combined with the market price of nutients provide a benchmark for value of manure. This method does not consider nitrogen losses and crop utilization
Average manure prices with corresponding application rates
Manure is not always a uniform product. There are differences in manure nutrient values from each farm. There are year to year variation to changes in swine diets, stocking density, and pit management.
• There is no good standard value for manure, and it is important to get an accurate determination of the swine manure nutrient profile.
• All farm samples have been submitted to Spectrium Analytic Inc. for Nitrogen, Phosphorus, and Potassium components.
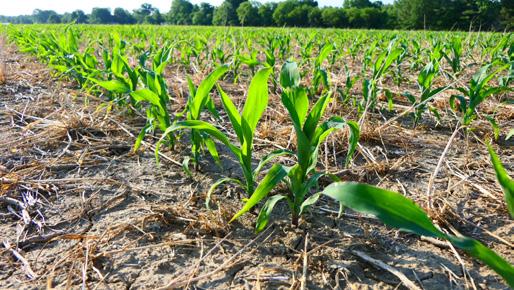
• The swine manure applications have been broadcast pre-plant or no later than V4 on corn and after V2 in soybeans.
• The swine manure application is applied at rates that limit potential enviromental impacts and excessive nutrient builduyp in the soil.
Component Pricing
The most common method of valuing manure is component pricing. The manure is sampled and tested to determine nutrient content. The analysis isused to determine the value based on commercial fertilizer prices.
Access the corn yield reduction incurred by a tractor/splash bar application of liquid swine manure to growing corn at the V3 stage.
Planting Date 5/13/2022
Harvest Date 10/14/2022
Variety Beck’s 6481
Population 32,000 sds/ac
Acres 63
Treatments 2
Reps 3
Treatment Width 40 ft.
Tillage No-Till
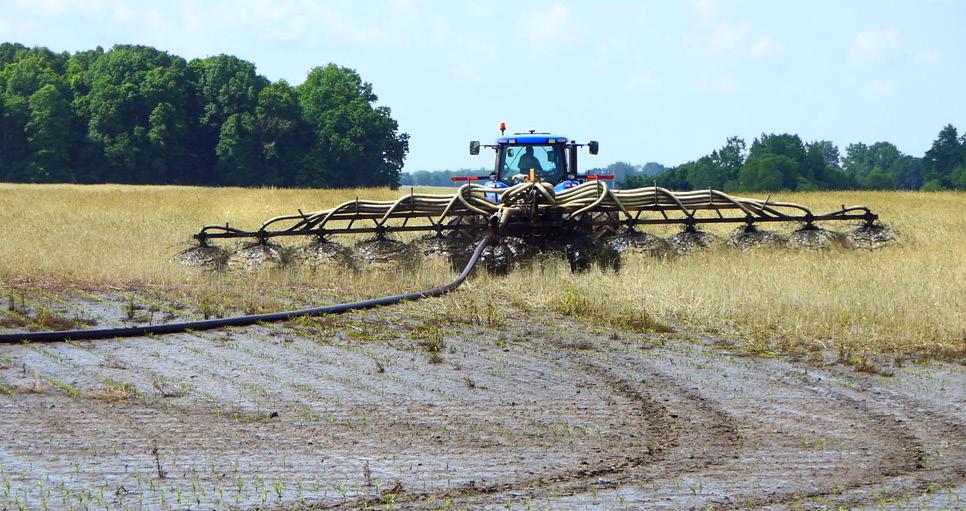
Management Fertilizer, Fungicide, Herbicide
Previous Crop Soybeans
Row Spacing 30 in.
Soil Type Blount Silt Loam, 60% Pewamo Silty Clay Loam, 40%
The experimental design of this study was a randomized block design. There were three replications of the diagonal tractor application (20 degrees to planted corn rows) path. Each tractor path included six rows of damaged corn and two control rows. Yield was calculated from hand collection of ears for 1/1000th of an acre.

The tractor traveling at an angle to the planted corn rows provided stress to only 3% of the corn plants per acre. Planting into growing no-till corn with rye cover crop cushioned the hose movement across the field. Plants impacted by the tractor were stressed but did produce an ear. Final plant population was 27,000 for the plots. Ears were harvest at 29% moisture.
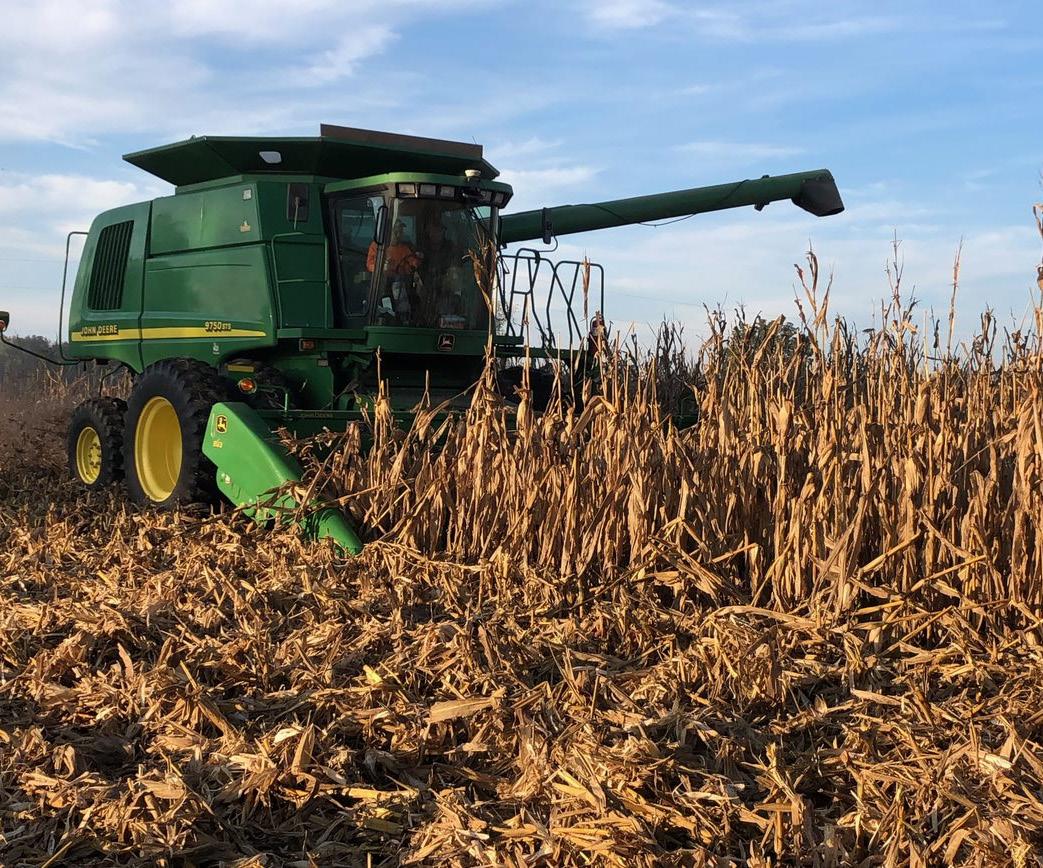
• Each of the three plots showed no significant yield difference across their group of eight rows.
• Rows one and eight (no application tractor tracks) were the control in each plot.
LSD: 7 CV: 2.9%
Use the QR code to view a video and learn more about this study.

Evaluate the potential yield difference between finishing swine-beef manure and anhydrous applied at sidedress.
Planting Date 5/14/2022
Harvest Date 10/3/2022
Variety Golden Harvest E109Y2, E111V7
Population 33,500 sds/ac
Acres 100
Treatments 2
Reps 3
Treatment Width 30 ft.

Tillage No-Till
Management Fertilizer, Fungicide, Herbicide
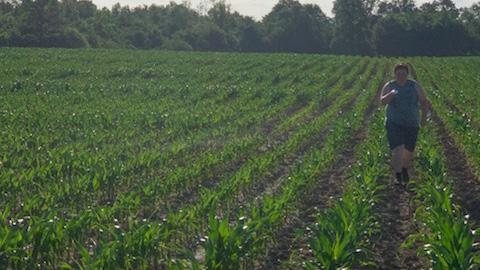
Previous Crop Soybeans
Row Spacing 30 in.
Soil Type Crosby Silt Loam, 49% Brookston Silty Clay Loam, 38% Celina Silt Loam, 5%
The design of this study is a randomized complete block design. There are two treatments, an 8,000 gallon/acre manure application and a 200 lbs/acre anhydrous application. There were three replications.
The drag hose sidedress application did not impact the corn population across the field. Throughout the season, there was low disease and insect pressure. The location of this field was in a part of the county that had adequate rainfall over the growing season and during grain fill.
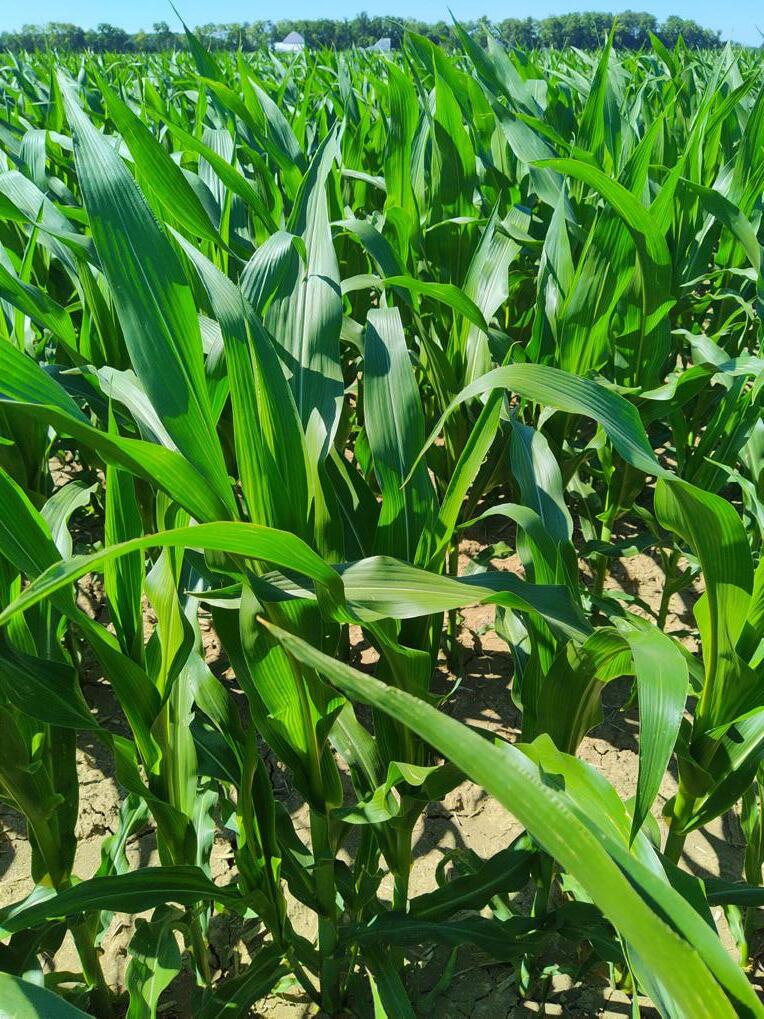
• There was a significant yield difference between anhydrous and the manure application providing a 12 bu/ac advantage.
• At harvest, grain moisture of the corn was similar, but the manure treatment was about a point higher.
Treatment Means with the same letter are not significantly different according to Fisher’s Protected Least Significant Differences (LSD) test at alpha = 0.1.
LSD: 11 CV: 1.3%
A Case IH 470 Quadtrac is effective in pulling the draghose for manure sidedressing and large tillage implements.
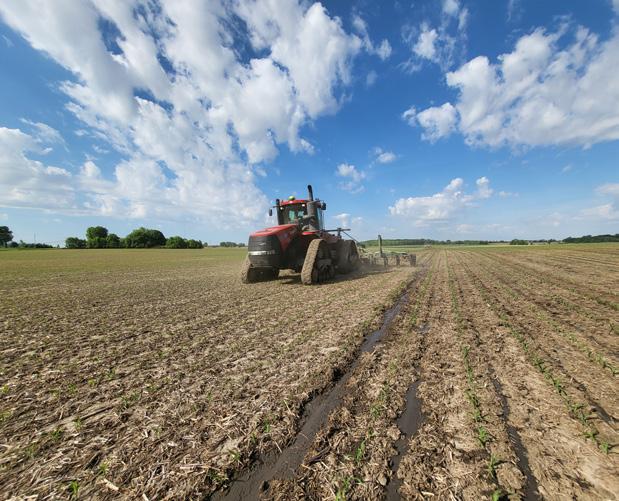
For inquiries about this project, contact Taylor Dill (dill.138@osu.edu).
Quantify the yield differences between a finishing swine manure sidedress application and a 28% UAN sidedress application using equal pounds of N per acre.
Planting Date 5/13/2022
Harvest Date 10/24/2022
Variety Stine 9713, Seed Consultants 1067
Population 35,000 sds/ac
Acres 10
Treatments 2 Reps 3
Treatment Width 30 ft.

Tillage No-Till
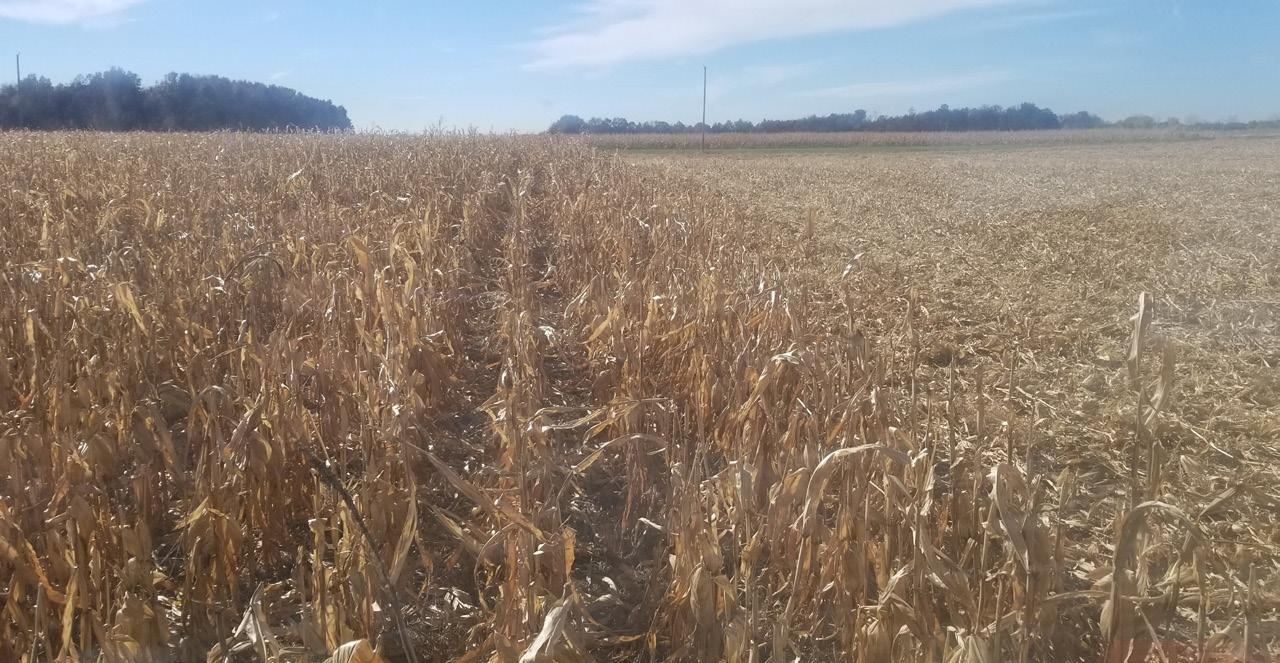
Management Fertilizer, Herbicide
Previous Crop Soybeans
Row Spacing 30 in.
Soil Type Blount Silt Loam, 66% Glynwood Silt Loam, 28% Pewamo Silty Clay Loam, 7%
This study design is a randomized complete block design. This experiment has two treatments which are finishing swine manure at 5,000 gallons per acre and 100 gallons of UAN. There were also three replications.
The field was uniform in stand after the sidedress application. This location had adequate rain and low insect and disease pressure.
SUMMARY
• In this study, there was a significant difference between the manure and the UAN application.
• The manure treatment had an increased yield of 5 bushels per acre in comparison to the UAN application.
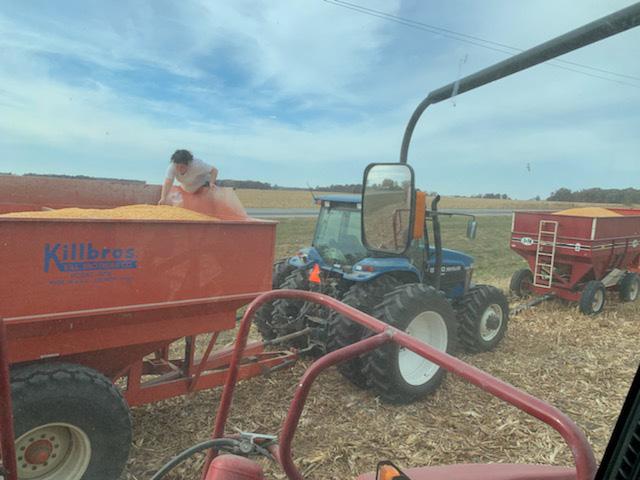
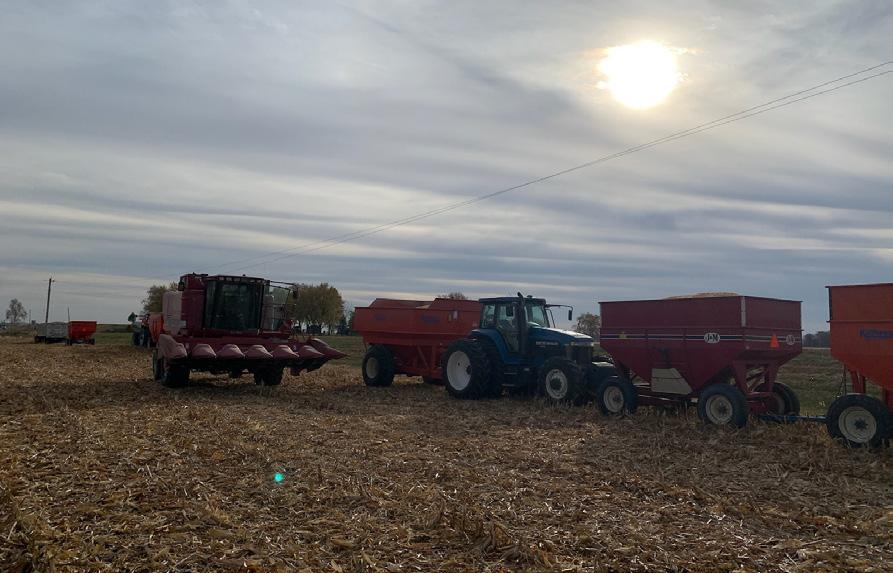
• Because the amount of N applied was coordinated to the amount of N in the manure applied, this shows the added benefit of using manure.
Treatment Means with the same letter are not significantly different according to Fisher’s Protected Least Significant Differences (LSD) test at alpha = 0.1.
LSD: 1 CV: 0.2%
For inquiries about this project, contact Taylor Dill (dill.138@osu.edu).
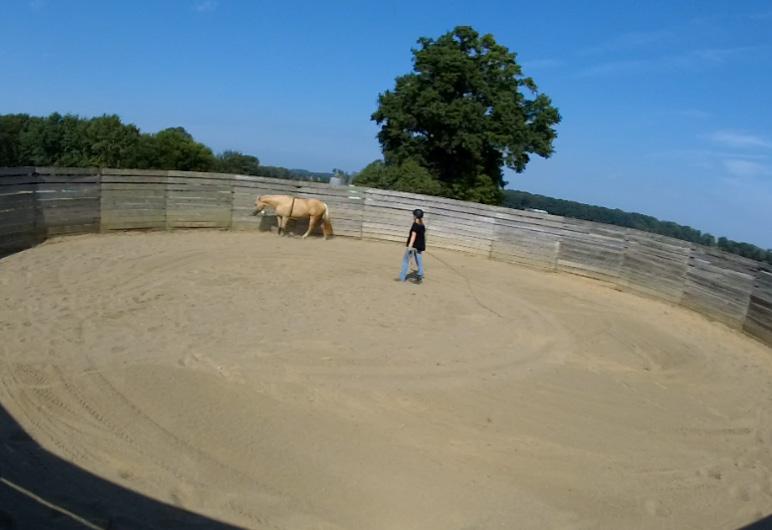
The objective of this study was to validate the HOBO Pendant G Data Logger for use in determining step count with being over 80% accurate compared to the manual counting of steps.

Start Date 8/5/2021
End Date 8/8/2021
Species Equine
Treatments 6
Reps 1
Experimental Unit Head
Breed Assorted
Sex Mare:Gelding
Health Protection As needed
Feed Access Ab libitum
IACUC # 2021A00000063

Having an economical way to quantify horse activity could inform future research. Most activity monitoring systems are made for cattle, but horses move much more quickly. Horses have three distinct gaits and footfall patterns vary with direction of travel (left vs right). Horses wore accelerometers and heart rate monitors.
Steps were manually counted by watching video clips. To automatically estimate step counts using the accelerometer data the following actions were taken. First, the absolute value of accelerations on all three axes were summed. Peaks of the summed accelerations were considered to indicate steps.
As the height of the peaks varied between horses, measurements were considered to indicate peaks when they were at or above the 98.7th, 98.4th, and 98.4th, percentile of summed accelerations for that horse during the walk, trot, and canter, respectively. The accelerometer predicted step counts were 101 ± 6%, 99 ± 10%, and 103 ± 9% of the step counts as determined from video footage at the walk, trot, and canter, respectively.
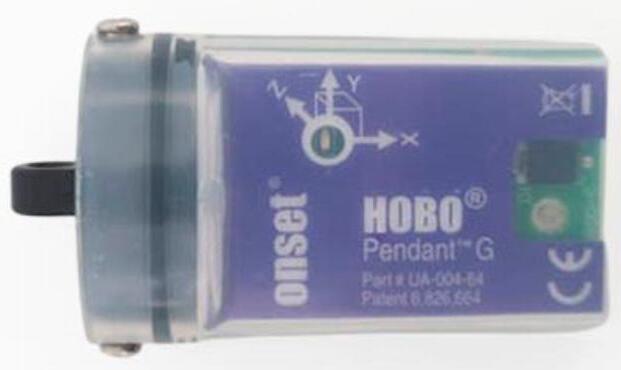
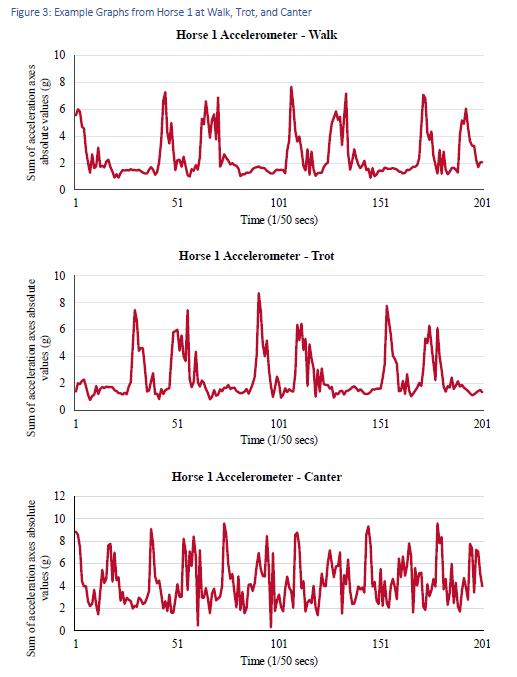
• In conclusion, the pedometer can be used to estimate step count. This device can be used in future studies for activity monitoring and the step count of horses for the possibility for gait identification. Potential next steps for this work include:
• 1. Refine mathematical methods of automatically determining step counts from accelerometer data.
• 2. Evaluation of interpeak variation between steps within gaits to be able to determine gait from the accelerometer data.
• 3. Validation of gait and step determination on varied terrain (e.g., pasture or trails).
For inquiries about this project, contact... Dr. Sara
Mastellarmastellar.1@osu.edu or Kallie
AllenThe objective of this study is to determine if horses prefer to drink out of certain colors of buckets and if horses prefer to eat out of certain color buckets, especially if the horses were previously used in preference testing.
Start Date 10/9//2021
End Date 10/17/2021
Species Equine
Treatments 8
Reps 8
Experimental Unit Bucket
Breed Assorted
Sex Mare:Gelding
Health Protection As needed
Feed Access Ab libitum
IACUC # 2021A00000063

Eight stock horses were used, four of which had been subjected to hay preference testing ten months prior with the same eight colored buckets. The other four horses were naïve to preference testing.
The buckets were mounted to stall walls and placed in random order. Each bucket was filled with 50-60g of the same chopped hay for each individual trial.
Each stall was also fitted with a foaling camera to observe the horses during the duration of the study. The stall was set up prior to bringing the horses in for observation. Each horse was fasted for at least 20 mins prior to being placed in the stall. The horse was then released in the stall and had access to the buckets for 20 minutes. The weight consumed was then recorded while the horses were fasting for the next trial. The test was repeated eight times to ensure each bucket was in every position to eliminate placement preference.
No significant preference for either bucket order and bucket color (P > 0.05). Horses that were previously used in preference testing did not have first choices statistically different than the naïve horses (P = 0.78) or chance (P = 0.86). However, one horse did tend to have a different first choice frequency (P = 0.051) but did not consume more from his first-choice buckets.
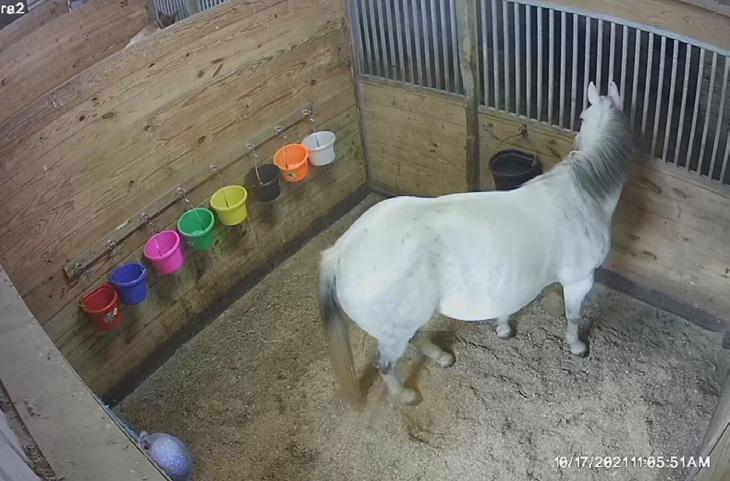
Video Cameras
Utilizing video cameras allows researchers to observe natural animal behaviors and prefrences.
• Color coding buckets is widely used in both nutritional research and daily barn management.
• Bucket color did not significantly affect equine consumption of either hay or water in these studies.
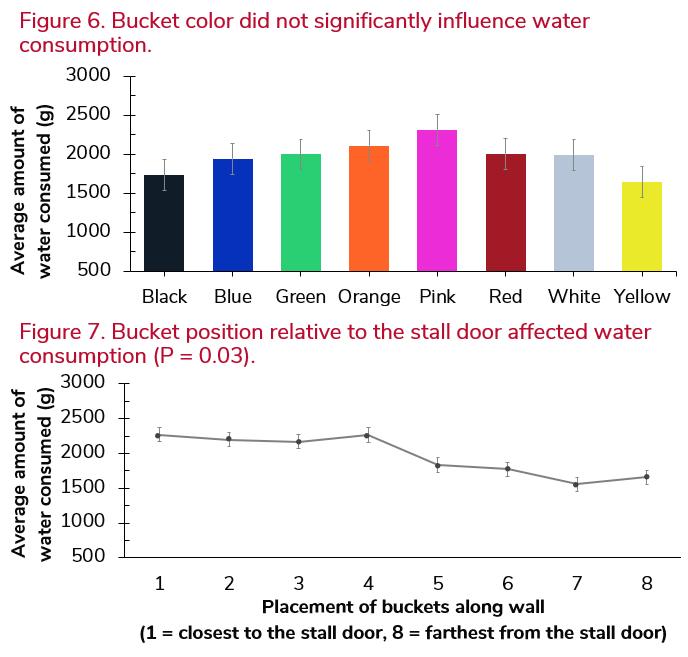
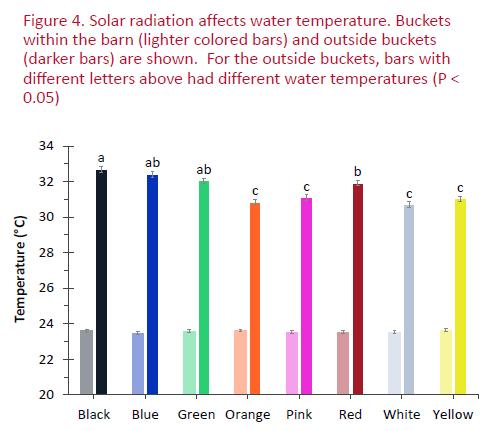
• This data supports the use of color coding for nutritionists and barn managers.
• Placement of the buckets should be randomized in future nutrition studies to avoid horses choosing buckets based on their position as opposed to contents.
For inquiries about this project, contact...
Dr. Sara Mastellar
mastellar.1@osu.edu or Alora Brown
Avian influenza is a viral disease that can affect multiple species of birds. It can exist in a low pathogenic form that causes mild symptoms of disease and can also mutate into a highly pathogenic form that can cause high mortality in multiple avian species including domestic poultry such as chickens and turkeys, shore birds, and raptors including hawks, owls, and eagles.
Highly pathogenic avian influenza (HPAI) is devastating in that it is highly contagious with no treatment available. It can be spread widely in migratory waterfowl such as where it can exist in an asymptomatic carrier state. Two of the four major migratory pathways pass through Ohio which increases our risk of outbreaks.
The Highly Pathogenic Avian Influenza (HPAI) outbreak of 2022-203 affected over 58.79 million birds, making it even more devastating than the 2014-2015 outbreak. The first confirmed case of Highly Pathogenic Avian Influenza detected in Ohio was confirmed on March 30th, 2022, in Franklin County in a non-commercial backyard flock. In total, Ohio had one affected commercial flock, 8 affected backyard flocks, 3,749,446 total birds affected with the most recent detection made on January 18th, 2023.
Confirmed Detections in the United States for HPAI 2022-2023. Source: USDA APHIS https:// www.aphis.usda.gov/aphis/ourfocus/animalhealth/animal-disease-information/avian/avianinfluenza/hpai-2022/2022-hpai-commercial-backyard-flocks
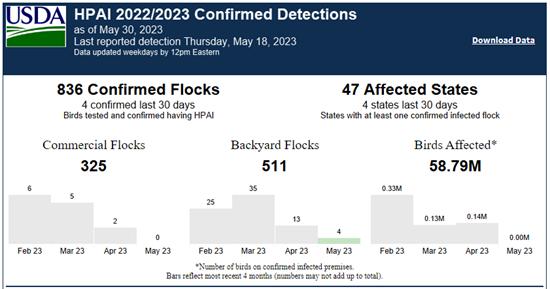
The key to preventing outbreaks in both backyard poultry and the poultry industry is bio-security. Bio-security is the strategy of prioritizing the health by preventing disease from entering the flock or herd. It comes in two main forms, direct bio-security, and indirect bio-security.
Direct poultry bio-security is preventing disease transmission from bird to bird. Disease can be spread from wild birds if they can encounter the flock or can be spread within the flock from a sick bird to another bird. Make sure that your flock cannot encounter wild birds through the use of fencing, bird netting or other exclusion, including keeping your birds indoors during an HPAI outbreak.
Indirect poultry bio-security involves something else transmitting disease into the flock. Make sure to limit or exclude visitors to your flock whenever possible. Make sure to use proper sanitation procedures as well as include the use of personal protective equipment, disposable boot covers and gloves, and boot wash stations. Understand the risks of bringing disease into your flock through encounters with other domestic poultry or wild birds to make sure you are not the indirect spreader of disease.
For more poultry bio-security information visit the USDA Defend the Flock Program @ #defendtheflock.
Bio-security to prevent disease introduction to flocks. A line of separation around flock house should be maintained with only select workers allowed to enter houses from a limited entry point. Entry point should allow workers to change into building-specific clothing, disinfect boots into and out of the house, and allow employees to keep personal belongings out of the house. Adapted from Iowa State University Center for Food Security & Public Health (Iowa State University, College of Veterinary Medicine 2018).
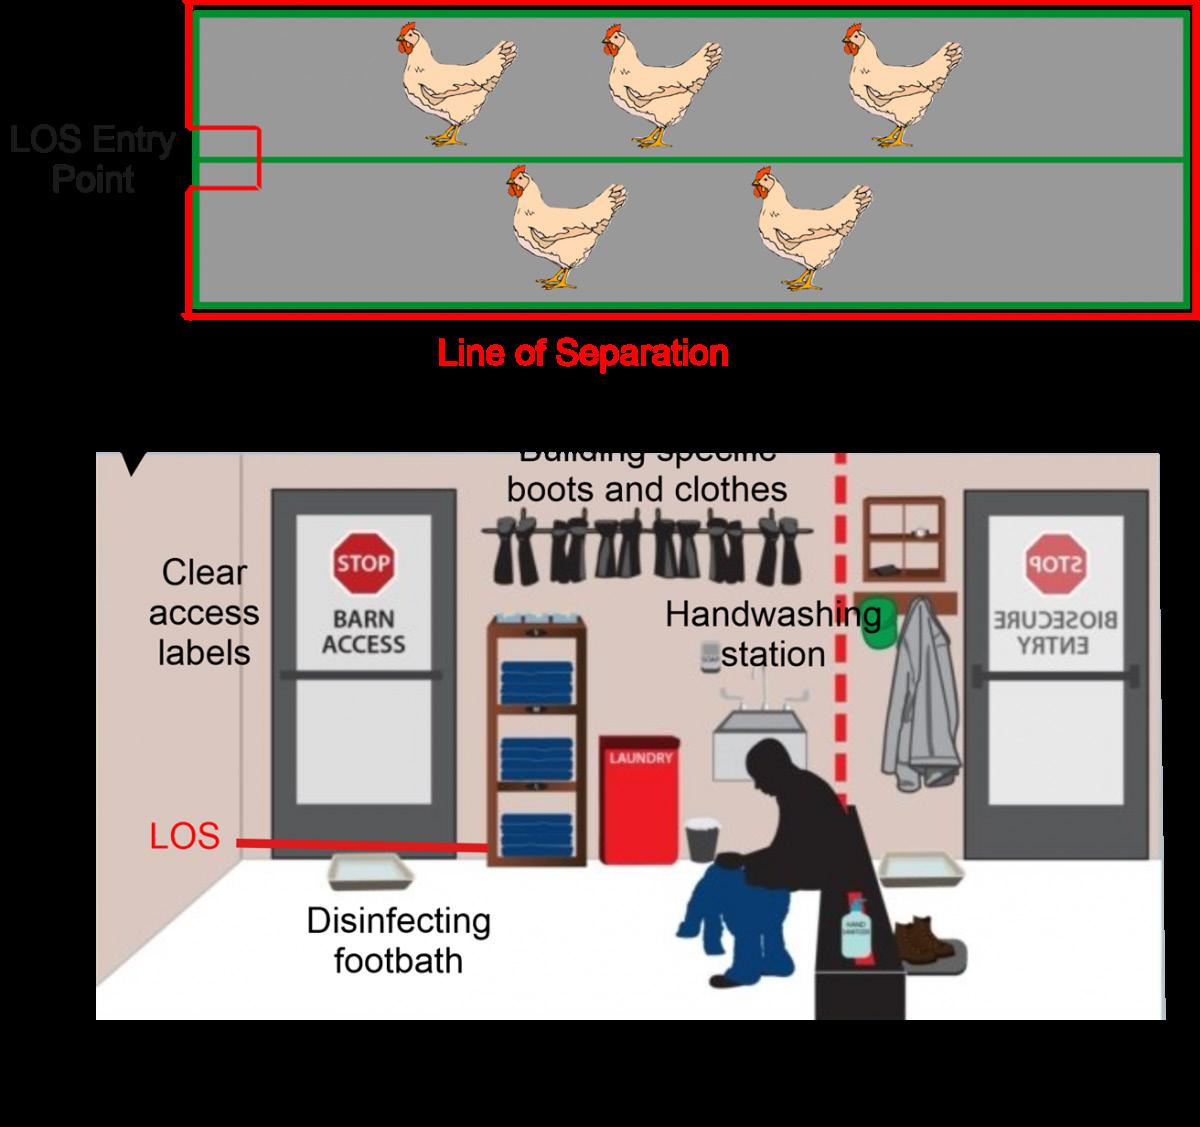
For inquiries about this project, contact...
Timothy S. McDermott
Extension Educator, Franklin County
mcdermott.15@osu.edu
(614)-292-7916
Aspen Adams
Nikki Berry
Joel Bielke
Jeremy Block
Ting-Yu Chen
Chris Clark
Douglas Clevenger
Bo Garcia
Hailey Jermolowicz
Jerad Jaborek
Licking County Sheep Producers
Kellie Enger
OARDC Farm Shop Crew
Ohio Sheep and Wool
BWB Farms
Nicole Hardy
Dalton Huhn
Clif Little
Dr. Mark Loux
Kyle Miller
Kirsten Nickles
Wanderson Novais
Edwin Pickenpaugh
OARDC Seeds Grant Program
Merit Seed in Berlin,OH
Colton Tom
Roger Shearer
Wayne Shriver
Hannah Slykerman
ST Genetics
OARDC Small Ruminant Research Unit Staff
Kevin Stottsberry
Drew Toth
Erin Weisgarber
Ted Wiseman
Rick Whiting
Robin Zendejas
2022 Small Ruminant Production Lab


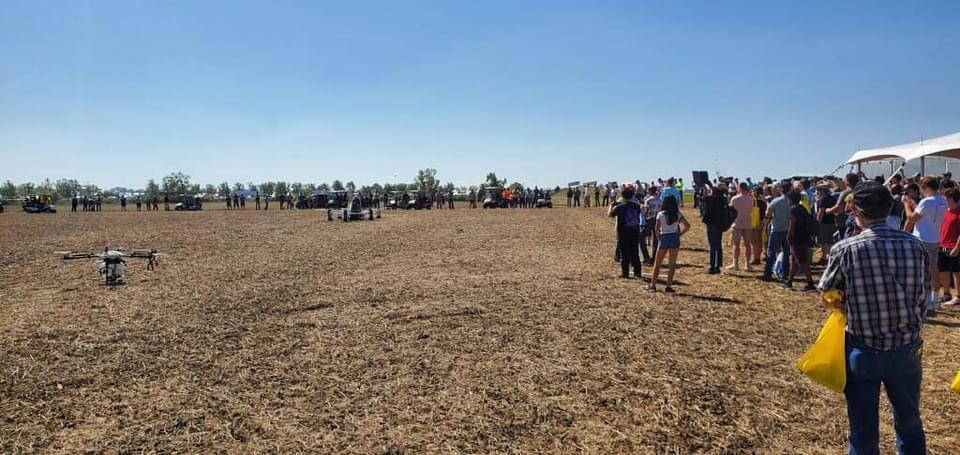
95% CI – Confidence Interval, range of values that can be certain to contain the true mean of a population
Ad Libitium – A feeding management in which animals are fed without any restrictions
ADF – Acid Detergent Fiber, least digestible plant compounds, including lignin and cellulose
ADFI – Average Daily Feed Intake, amount of feed (As Fed) consumed per animal, per day
ADG – Average Daily Gain, weight gained per animal, per day
Bob Veal – Veal calves marketed up to three weeks of age
BW – Body Weight
CP – Crude Protein, measures nitrogen content of feedstuffs, including true protein and nonprotein nitrogen
DCAD – Dietary Cation Anion Difference, measurement used when formulating diets for dry or lactating cows using positively and negatively charged minerals on animal performance
DDG – Dried Distillers’ Grain with Soluble, co-product of ethanol production and often used as a protein source in a diet
DIM – Days In Milk, number of days a dairy cow has been lactating
DM – Dry Matter, fiber and nutrients remaining once water is removed from a feedstuff or diet
DMI – Dry Matter Intake, amount of dry matter consumed per animal, per day
DON – Deoxynivalenol, Vomitoxin, a common mycotoxin found in grain
Dressing Percent – (Hot Carcass Weight divided by Live Weight) x 100
GDD – Growing Degree Days, heat units used to estimate growth and development of crop and pests during the growing season
FAMACHA © – Selective treatment method for controlling the level of parasitic barber ’s pole worm in small ruminants
FEC – Fecal Egg Count, quantitative assessment of how many parasite eggs an animal is shedding at a particular time
Feekes Growth Stages
10.0 – Grass Forage at Boot Stage
10.5 – Grass Forage at Heading
FTPI – Failed Transfer of Passive Immunity, when a calf fails to absorb adequate immunoglobulins via colostrum
Gain : Feed – Measure of Feed Efficiency, ratio of total pounds gained to total pounds of feed fed
Hot Carcass Weight – Carcass Weight prior to chilling
Hypoglycemic – Low Blood Sugar
K2O – Potassium fertilizer form, Potash
Laparoscopic Artificial Insemination – Intrauterine method of insemination used in small ruminants
Mycotoxin – Toxin produced by certain molds or fungi in grains
N – Nitrogen
NDF – Neutral Detergent Fiber, structural components of plants, specifically the cell wall and predicts voluntary intake because it provides bulk or fill
NEL – Net Energy Lactation, amount of energy in a feedstuff that is available for milk production and body maintenance
NIR – Near Infrared Reflectance, measures light energy reflected by the feed sample to determine the chemical composition of forages
OC% – Percent of Organic Carbon
OM% – Percent Organic Matter
P205 – Phosphorus fertilizer form
Passive Immunity – Immunity acquired via colostrum intake shortly after birth
PCV – Packed Cell Volume, a measurement of the proportion of blood that is made up of cells
RFID – Radio Frequency Identification, method used to track livestock
SEM – Standard Error of the Mean, indicates how different the population mean is likely to be from a sample mean
TDN – Total Digestible Nutrients, sum of digestible proteins, fiber, lipids, and carbohydrates in feedstuff
TKN – Total Kjeldahl Nitrogen, total concentration of nitrogen and ammonia
TMR – Total Mixed Ration, method of feeding that combines feeds to a specific nutrient content
Wet Chemistry – Chemistry based analytical methods used to measure chemical compounds in plant material
eBarns is a The Ohio State University program dedicated to advancing production agriculture through the use of field-scale research. eBarns utilizes modern technologies and information to conduct on-farm studies with an educational and demonstration component used to help farmers and their advisors understand how new practices and techniques can improve farm efficiency and profitability. The program is dedicated to delivering timely and relevant, data-driven, actionable information to farmers throughout Ohio.