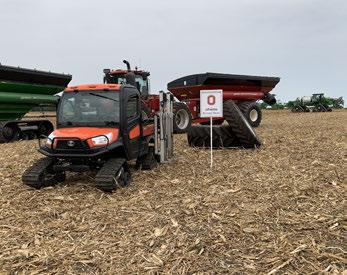


eFields is a program at The Ohio State University dedicated to advancing production agriculture through the use of fieldscale research. The 2020 eFields Report is a culmination of the research conducted over the past year on partner farms throughout Ohio. Current research is focused on precision nutrient management strategies and technologies to improve efficiency of fertilizer placement, enable on-farm evaluation, automate machine functionality, enhance placement of pesticides and seed, and to develop analytical tools for digital agriculture.
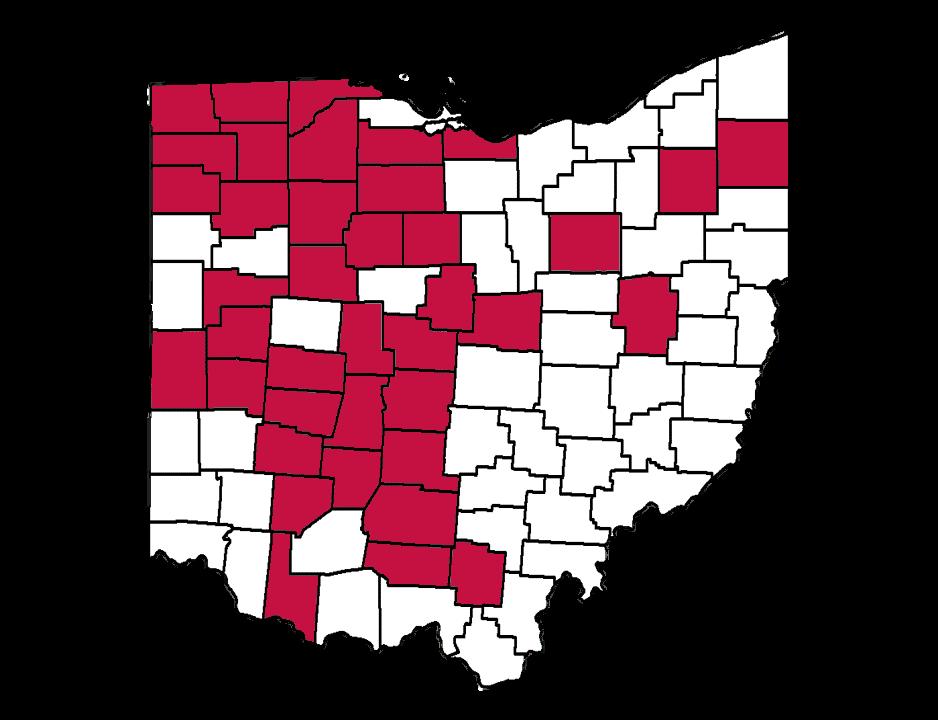
eFields has expanded from 39 on-farm research sites in 13 counties in 2017, to 95 on-farm research sites covering 25 counties in 2018, 88 on-farm research sites in 30 counties in 2019, and 218 on-farm research sites in 39 counties in 2020.
New for 2020
• Soil Health
• Production Budget Information
• Alternative Crops
• Water Quality
218 On-Farm Research Sites
Disclaimer Notice: The information provided in this document is intended for educational purposes only. Mention or use of specific products or services, along with illustrations, does not constitute endorsement by The Ohio State University. The Ohio State University assumes no responsibility for any damages that may occur through adoption of the programs/techniques described in this document.

Welcome to the 2020 edition of the Ohio State eFields Report. We would like to begin by extending our sincere thanks to all of those who have made the Ohio State eFields Research Report possible over the past four years. This project would not have happened without the support of our on-farm cooperators, Extension educators, field specialists, faculty, staff, students, industry partners, and countless others who have devoted their time, energy, and expertise. It is truly the collaborative nature of everyone that allows us to ultimately provide data-driven information to thousands of farmers and their advisors in a timely, relevant, and actionable manner.
We began 2020 with a lot of hope after the challenges of 2019, but 2020 tested us in different ways. Early in the year, the COVID-19 pandemic reached the U.S. and forced many of us to rethink how we conducted business. The agriculture industry pivoted with countless meetings, field days, conferences and farm shows shifted to virtual programs to ensure the safety of attendees. Farm Science Review Online is just one example of the resiliency of the agriculture community as the annual in-person event that draws crowds of over 100,000 attendees went 100% online. One advantage was that the excellent information shared is still available online with program summaries like the Virtual Reality field demonstrations are featured in this report. As we write this, we are dealing with a second wave of cancelations and many of our traditional winter meetings and trade shows will be virtual. We are looking forward to “seeing” many of you at these events!
Fortunately, many of our research activities continued despite the challenges of 2020. The eFields team was able to report on 218 studies from 39 counties. We are excited about this continued growth of the program and the eFields team members are looking forward to more exciting projects in the future.
The 2020 report covers more counties across Ohio and the topics have expanded to include soil health, water quality, and alternative crops. The eFields report has impacted 40 US states and 38 countries globally. You can find the library of eFields Reports ranging from 2017-2020 online at: go.osu.edu/efieldsreports.
We hope you find the 2020 eFields Report informative and valuable. If you are interested in cooperating with us in 2021 or have any feedback, please contact us at digitalag@osu.edu.
Sincerely,
2020 eFields Team


Are you interested in contributing to the 2021 eFields Report? If so, visit go.osu.edu/efields to review study implementation plus tips and tricks. See below for details on how to get involved and who to contact. We look forward to working with you!
Growers interested in hosting on-farm research trials for publication in the annual eFields report should reach out to their county Agriculture and Natural Resources Extension Educator (agcrops.osu.edu/people). To view a list of those educators who are already involved, see page 14. Standard protocols for seeding rates, nitrogen rates, and other management practices have been developed for statewide implementation. Contact us today to find out how to get involved. Additional protocols and topics are being developed and can be customized to fit your questions and needs!
We are always looking for new partners to conduct on-farm trials! If you are interested in determining how you can support Ohio On-Farm Research, reach out to your county Agriculture and Natural Resources (ANR) Extension Educator, email the Digital Ag Team (digitalag@osu.edu) or Dr. Elizabeth Hawkins (hawkins.301@osu.edu). We would love to discuss your involvement with the eFields program!
If you are a current ANR Educator and are interested in getting involved with eFields, contact us at digitalag@osu.edu or reach out to Dr. Elizabeth Hawkins (hawkins.301@osu.edu).

WHEN
Every Tuesday in January and February at 10AM EST WHERE Online Zoom Webinars HOW Registration Cost: FREE RSVP at go.osu.edu/precisionu

Join the OSU Digital Ag Team every Tuesday morning in January and February for #AgTechTuesday. This series of hour-long webinars will focus on a variety of topics related to digital agriculture. The January webinars will replace the annual in-person Precision University event and focuses on “Tackling Spring Operations with Reduced Working Days.” The series continues in Febrary and shifts focus to provide a more indepth look at on-going eFields research projects. Plan to attend one or all of the sessions. Find more information at go.osu.edu/AgTechTues


In a world full of data, eFields helps sort the grain from the chaff.
- Stirling Overholser
Don’t become resistant to change, get a full dose of what’s new in eFields.
- Aaron Overholser
Congratulations to Overholser Farms for their selection as a 2020 Friend of OSU Extension! We appreciate your partnership with eFields!
We are grateful for the OSU eFields Team because they assist in the hardest part of the scientific method, sharing your results. And running statistical analysis for us so we know how much weight to give those results. It is an ideal extension service. We are excited to continue working with them in order to determine the most efficient management system for our fields.
- Deer Run Farms
The respect that growers like me across the state have for eFields is tremendous. We talk to people outside the university that ask questions about what we’re doing, what the results are, not only with our on-farm research, but everything that eFields is doing. I’m proud to be a part of that.”
-Dug Radcliff


The Digital Agriculture Program at The Ohio State University embodies the best of the land grant mission – creation, validation, and dissemination of cutting-edge agricultural production technologies. The central focus of this program is the interaction of automation, sensing, and data analytics to optimize crop production in order to address environmental quality, sustainability, and profitability. Research is focused on execution of site-specific nutrient management practices, development of handheld devices for in-field data capture, autonomous functionality of machinery, remote sensing solutions, and data analytics to enhance timing, placement and efficacy of inputs within cropping systems.
The Digital Agriculture Program at The Ohio State University strives to be the premier source of research-based information in the age of digital agriculture.
• Uniting the private and public sectors to drive innovation for the benefit of farmers.
• Partnering with farmers to translate innovation into long-term profitability for production agriculture.
• Delivering timely and relevant information for the advancement of digital agriculture technologies.
The premise of digital agriculture includes the advancement of farm operations through implementation of precision agriculture strategies, prescriptive agriculture and data-based decision making. Digital agriculture is a holistic picture of the data space in agriculture, trends related to services directing input management and the value of data usage for improving productivity and profitability of farm operations.
“Digital Agriculture” combines multiple data sources with advanced crop and environmental analyses to provide support for on-farm decision making.
“Helping growers make the most of Precision and Digital Ag technologies”


PRECISION SEEDING
Utilizing the latest digital ag technologies to place every seed in an environment optimized for its growth and development.
ON-FARM RESEARCH
Deploying field-scale studies to advance production agriculture through efficiency and profitability using data-driven decisions.
PRECISION CROP MANAGEMENT
Management of crop inputs in a manner that maximizes efficiency and profitability
HARVEST TECHNOLOGIES
Taking advantage of available technologies to improve harvest efficiencies and improve data quality.
SOIL COMPACTION MANAGEMENT
Mitigation of soil compaction to enhance crop health and soil structure.
REMOTE SENSING
Providing the ability to remotely assess field conditions, crop health, nutrient needs, and productivity levels on a sub-field scale.
APPS FOR AGRICULTURE
Embracing the power of smart phones and tablets to utilize mobile applications and farming smarter.
PRECISION NUTRIENT MANAGEMENT
Ensuring that all applied nutrients are in a position to maximize crop uptake. Right source, right rate, right time, right place, right technology.
PRECISION LIVESTOCK
Making use of data and digital tools to manage or automate animal well-being, food safety, pasture sustainability, waste products and more.
DATA ANALYSIS AND MANAGEMENT
Developing a digital strategy and making actionable decisions using data, from operational insights to field execution.
Find study information, objectives, study design, weather graph, and summary on the left page. Find results, summaries, project contact, and statistical summary on the right page.
Planting Date 5/3/2020
Harvest Date 10/20/2020
Variety Becks 6076V2P
Population 34,000 sds/ac
Acres 70
Treatments 5
Reps 7
Treatment Width 40 ft.
TillageConventional
Management Fertilizer, Herbicide, Insecticide
Previous Crop Soybeans
Row Spacing30 in.
Soil Type Crosby silt loam, 52% Celina silt loam, 48%
The study design provides a background on the study. This could include a brief history of research, observations that led to the implementation of this study, explanation of the study design, etc.

Location
Look to see the county where the study was conducted.


Here you will find visuals of the study with short descriptions.
The observations section of the report allows us to provide any relevant information that the researchers noticed throughout the growing season. Observations allow for a deeper understanding of the study results.

Treatments (XXX)
• The summary section proves results and findings from the study.
• Thank you for taking the time to explore our 2020 eFields Report!

Treatment Means with the same letter are not significantly different according to Fisher’s Protected Least Significant Differences (LSD) test at alpha = 0.1.
This section allows us to display the tools and technology used to make each study possible.
The Project Contact section provides the name of the researcher along with their email address. We encourage you to contact them if you have questions about an indvidual study.
To effectively collect, analyze, and interpret data, statistical calculations were made for each eFields study when possible. All statistical calculations were conducted using the OSU PLOTS Research App or calculated using the ANOVA spreadsheet, using Fisher’s Protected Least Significant Differences (LSD, alpha = 0.1) method to determine if treatment differences are statistically significant.
Stand Counts and Harvest Data:
All stand counts were conducted for individual plots by counting the number of plants in 30 linear feet along two adjacent rows. All yield data was collected using calibrated yield monitors or weigh wagons. Data was processed and cleaned to ensure accuracy with yields adjusted to a standard moisture prior to analysis.
Take a look at this example from a study: Treatments
Replication
• Allows one to estimate the error associated with carrying out the experiment itself.
• Without replication, it would be impossible to determine what factor contributed to any treatment differences.
• A minimum of 3 replications is required for a proper evaluation, with 4 or more recommended for field-scale research.
Randomization
• Randomization is as important as replication to help account for any variations in production practices and field conditions.
• Even if treatments are replicated, the conclusions you reach may not be correct if a treatment was always applied to the same part of the field.
• Randomization prevents data from being biased due to its field location.
Results show the average of the response variable (i.e. yield) for each treatment.


Least Significant Difference (LSD) is used to compare means of different treatments that have an equal number of replications. For this report, a significance level of 0.1 (or 10%) was used, which means when a treatment is statistically significant, a 90% confidence is attributed to that treatment actually being different from the comparisons.
• For treatment A to be statistically significant from treatment B, they must differ by at least 3.38 bu/ac. (They do not, so they are not statistically different and are marked using the same letter). “NS” denotes not significant in the results table.
• For treatment D to be statistically different from treatment A, they must differ by at least 3.38 bu/ac (here they differ by 5 bu/ac, so they are statistically significant and are marked using different letters).

Defined as the coefficient of variation (CV) is a measure of the variability between treatments (i.e. yields) reported as a percentage (%). CV is an indicator of data uniformity. Higher CV’s indicate more treatment or environmental variability.
In this example, since treatment A is different from treatment D by 3.38 bu/ac, there is 90% certainity that the results of the treatments were indeed different. Treatment differences are represented by using a letter beside the reported value. Since the averages for treatment A and treatment B differ by less than 3.38, it cannot be concluded that the treatments are different from each other, so the same letter (e.g. “a”) is used to indicate they are the same.
For more information and examples on statistics and experimental setup, visit go.osu.edu/efieldsinvolved.
Return above analysis allows farmers to consider not only yield increase, but also economic return which ultimately impacts the farm’s bottom line. For studies where economics were calculated, return above is labeled in the rightmost column of the results table. To standardize return above calculations state-wide, the OSU Extension budgets were used for a partial profit calculation, farmoffice.osu.edu.
For the seeding rate studies, a uniform corn seed cost of $3.25/1,000 seeds was used. Soybean seed cost was $0.393/1,000 seeds. These are based on the Ohio Crop Enterprise Budgets developed by Barry Ward, OSU Extension. Learn more about the budgets on page 22.
Price received was determined by the October WASDE (World Agricultural Supply and Demand Estimates) report with a corn price of $3.70/bu and a soybean price of $9.40/ bu. We then calculated a 10% price increase and decrease to reflect price variability.
A nitrogen cost of $0.28/lb used in this report is from the 2020 Corn Production Budget. For the nitrogen timing studies, application costs were also considered. The average costs of application the report uses are from the 2020 Ohio Custom Farm Rates. Learn more about the 2020 custom rates on page 32.
The “Return above” line includes only the input expense of what was being studied (i.e. seed cost) to provide a clear indication of economic return. To calculate your own economic return, you can access the eFields Economic Calculators at: go.osu.edu/econcalculator.

Angie Arnold Extension Educator
Portage County
OSU Extension
Brooke Beam Extension Educator Highland County
OSU Extension

Ben Brown Assistant Professor of Professional Practice
Department of Agricultural, Environmental, and Development Economics
Glen Arnold Field Specialist OSU Extension
Mark Badertscher Extension Educator
Hardin County
OSU Extension

John Barker Extension Educator Knox County OSU Extension
Jordan Beck Water Quality Extension Associate OSU Extension
Lee Beers Extension Educator
Trumbull County
OSU Extension
Amanda Bennett Extension Educator Miami County OSU Extension
Bruce Clevenger Extension Educator
Defiance County
OSU Extension
Rachel Cochran Water Quality Extension Associate
OSU Extension
Trevor Corboy Extension Educator
Greene County
OSU Extension

Steve Culman Assistant Professor School of Environment and Natural Resources

Nate Douridas Farm Manager Molly Caren Agricultural Center

Ken Ford Extension Educator Fayette County OSU Extension
Sam Custer Extension Educator Darke County OSU Extension

Wayne Dellinger Extension Educator Union County OSU Extension

Nick Eckel Water Quality Extension Associate OSU Extension

John Fulton Professor Department of Food, Agricultural and Biological Engineering
Mike Estadt Extension Educator Pickaway County OSU Extension

Allen Gahler Extension Educator Sandusky County OSU Extension

Amanda Douridas Extension Educator Champaign County OSU Extension
Boden Fisher Water Quality Extension Associate OSU Extension

Alysa Gauci Graduate Research Associate Department of Food, Agricultural and Biological Engineering


Christine Gelley Extension Educator Noble County OSU Extension

Elizabeth Hawkins Assistant Professor, Field Specialist OSU Extension

Sami Khanal
Assistant Professor Department of Food, Agricultural and Biological Engineering
Mary Griffith Extension Educator Madison County OSU Extension
Will Hamman Extension Educator Pike County OSU Extension
Jason Hartschuh Extension Educator Crawford County OSU Extension

Carri Jagger Extension Educator Morrow County OSU Extension

Andrew Klopfenstein
Sr. Research Associate Engineer Department of Food, Agricultural and Biological Engineering
Dee Jepsen Associate Professor Department of Food, Agricultural and Biological Engineering

Cori Lee
Student Assistant Department of Food, Agricultural and Biological Engineering

Stephanie Karhoff Extension Educator Williams County OSU Extension
Robert Leeds Extension Educator Delaware County OSU Extension

Ed Lentz Extension Educator Hancock County OSU Extension

Rory Lewandowski Extension Educator Wayne County OSU Extension
Laura Lindsey Associate Professor Department of Horticulture and Crop Science

David Marrison Extension Educator Coshcocton County OSU Extension
Brigitte Moneymaker Water Quality Extension Associate OSU Extension

Tony Nye Extension Educator Clinton County OSU Extension
James Morris Extension Educator Brown County OSU Extension

Lisa Pfeifer Program Manager Department of Food, Agricultural and Biological Engineering
Sarah Noggle Extension Educator Paulding County OSU Extension
Matthew Nussbaum Extension Educator Wayne County OSU Extension

Eric Richer Extension Educator Fulton County OSU Extension
Matthew Romanko Water Quality Extension Associate OSU Extension

Kaitlin Ruetz Student Assistant Fulton County
Clint Schroeder Extension Educator
Allen County OSU Extension
Garth Ruff Extension Educator
Henry County
OSU Extension

Scott Shearer Professor and Chair Department of Food, Agricultural and Biological Engineering

Chris Shoup
Graduate Research Associate
Department of Food, Agricultural and Biological Engineering
Jacci Smith Extension Educator
Delaware County
OSU Extension
Beth Scheckelhoff Extension Educator
Putnam County
OSU Extension

Dianne Shoemaker Field Specialist OSU Extension
Matthew Schmerge Extension Educator
Shelby County OSU Extension
Jeff Stachler Extension Educator
Auglaize County
OSU Extension
Haley Shoemaker Program Coordinator Ohio Farm Business Analysis

Ryan Tietje Research Associate Engineer
Department of Food, Agricultural and Biological Engineering
Ryanna Tietje Student Assistant Department of Food, Agricultural and Biological Engineering

Chris Zoller Extension Educator Tuscarawas County OSU Extension

Chip Tuson Program Manager Department of Food, Agricultural and Biological Engineering
Barry Ward Field Specialist OSU Extension

Aaron Wilson Extension Climatologist Byrd-Polar Climate Center
Hosted by OSU Extension’s Amanda Douridas and Elizabeth Hawkins

Stay on top of what is happening in the field and the farm office. This podcast takes a bi-monthly dive into specific issues that impact agriculture, such as: weather, land value, policies, commodity outlooks, and more.
New episodes released every other Wednesday
Listen and subscribe at: go.osu.edu/AFM


After the enormous weather obstacles that 2019 presented to Ohio farmers, it was time that 2020 delivered a perfect season, right? While not without its challenges, in many respects the weather of 2020 was a bit more favorable for a successful season. November 2020 ranks as the 6th warmest and 22nd wettest on record (1895-present) for Ohio according the National Centers for Environmental Information. The following is a summary of the growing season, seasonal breakdown, and impactful weather events of 2020.
Spring 2020 followed a very warm winter (December -February), one that ranks as the 5th warmest on record for Ohio with above average precipitation. This warmth carried over into March as well, which ranks as the 11th warmest March on record. By month’s end, near-surface soil temperatures ranged from the upper 40s to upper 50s across the state. Conditions dramatically turned in April and May with much cooler temperatures. In fact, Ohio experienced frequent late season freeze conditions into May (Fig. 1). Temperatures on the morning of April 22, 2020 dipped into the low to mid 20s across southern counties, an event with less than a 10% chance of occurring any given year this late in the season. These cool conditions combined with above average precipitation hampered early planting activities and had major impacts on specialty crops across the state. Climatologically speaking, March-May 2020 ranks as the 42nd warmest and 17th wettest for the state.
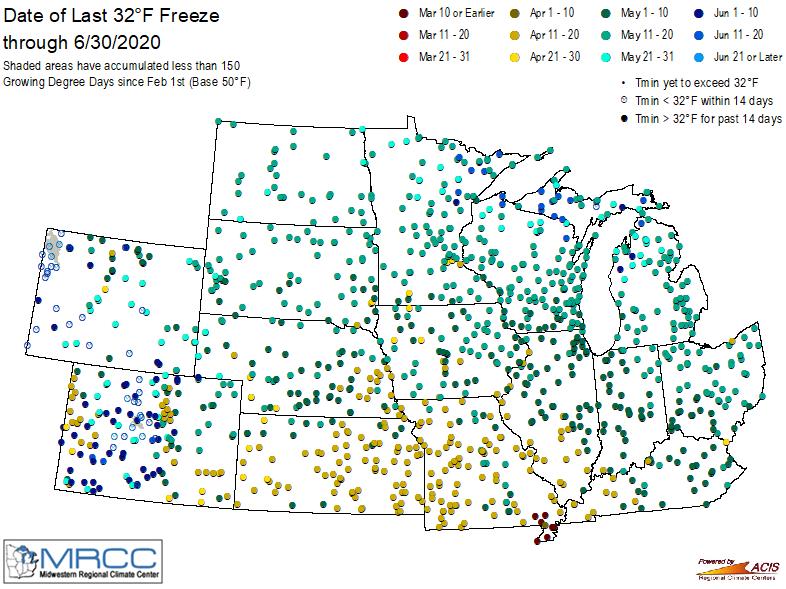
Figure 1: Date of last 32°F temperature in Spring 2020. Figure courtesy of the Midwest Regional Climate Center.
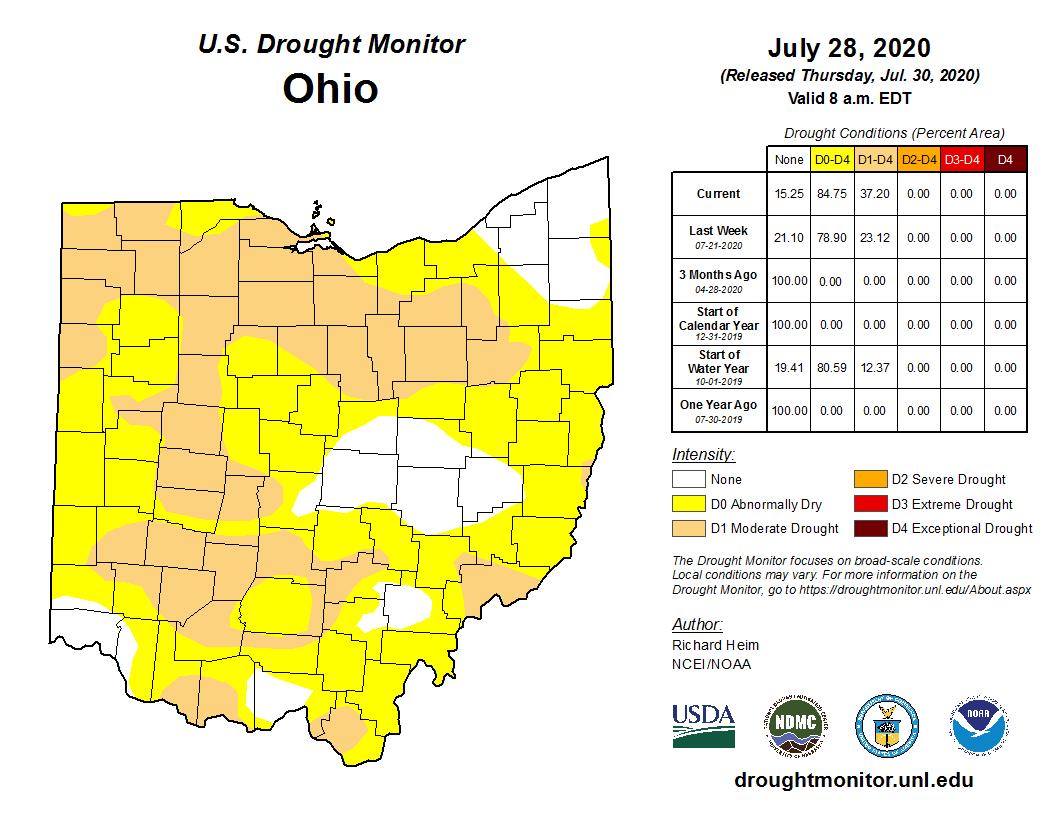
Figure 2: Maximum drought coverage across Ohio as reported on July 28, 2020. Figure courtesy of the U.S. Drought Monitor.
The story of summer was one of increasing warmth and dryness. Summer 2020 ranks as the 11th warmest and 29th driest on record. It was particularly hot and dry in July, which ranks as the 6th warmest and 26th driest for the state. Daily averaged temperatures ranged from 2-6°F above average across Ohio. Hot temperatures and below average precipitation combined to create abnormally dry to moderate drought conditions across the region, first in the northwest and west central counties, then spreading across the state throughout the summer. By July 28, 2020, 85% of the state was categorized as abnormally dry or worse, with 37% of the state in D1-moderate drought conditions according to the U.S. Drought Monitor (Fig. 2). While stream flows remained near average except in northwestern counties, soil moisture deficits became quite large. This challenged corn production on poorer soils and in the driest areas of the state (e.g., along the Bellefontaine Ridge) (Fig.3). August rainfall was a little more plentiful which helped many areas recover to abnormally dry conditions, but soil moisture deficits continued into fall.
After average temperatures during September and October, November turned unseasonably warm, ranking as the 6th warmest November on record. Many locations experienced their latest upper-70°F, even low-80°F weather on record! This left the season ranked as the 16th warmest fall on record (Fig. 4). Precipitation varied across the season as well. Ohio recorded near average precipitation during September allowing a decent start to the harvest season. However, mid to late October turned a bit soggier, and with above average precipitation during the month (18th wettest), harvest activities began to slow. Drier and warmer than average temperatures during November were a blessing for many, allowing most harvest activities to finish up by the end of the month. November ended with Ohio’s first widespread snow event of the season, leaving 1-4” of snow across southern counties, and nearly 25” of snow across Lake and Geauga Counties by December 2.
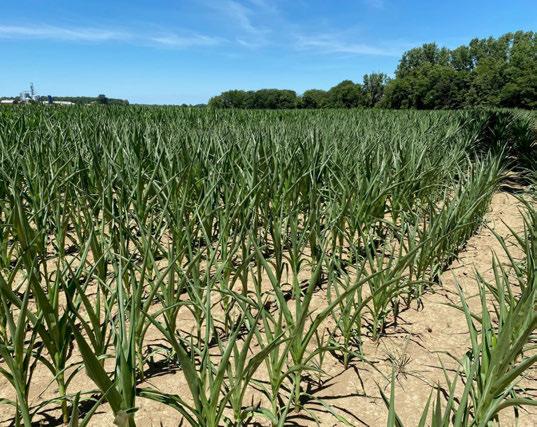
Figure 3: Corn rolled due to intensifying drought conditions across Hardin County in July. Photo courtesy of Mark Badertscher.

Figure 4: Statewide average temperature ranks for September - November 2020. Figure courtesy of the National Centers for Environmental Information.
There were a few notable severe weather events to contend with this season. On June 6, an outer band from Tropical Storm Cristobal brought a derecho (long-lived line of thunderstorms) through the state, dropping a few tornadoes and leading to numerous severe wind damage reports (Fig. 5). Another, stronger derecho that decimated corn fields across Iowa and Illinois led to some minor damage in western Ohio on August 10. On November 15, a powerful jet stream and upper level trough combined to bring wind gusts between 60-80 mph across a wide swath of the state, with the strongest winds reported across northern counties.
This was also a record-breaking hurricane season for the Atlantic Basin with 31 total storms, 13 of which became hurricanes with 6 major hurricanes. Twelve of these storms made landfall in the U.S., but despite this number, Ohio was relatively spared from the worst of the damage or rainfall. Tropical Storm Bertha moved across the state in May, with Tropcial Storm Cristobal bringing a derecho through in June. Stronger systems, including Laura and Beta brought some moisture across Ohio in August and September, mostly to southern counties.
FARM (Field Application Resource Monitor)
This tool (farm.bpcrc.osu.edu) allows users to define their locations of interest and receive 12- and 24-hour precipitation forecasts (current and historical) to aid in the application of fertilizer, manure, and/or pesticides.


For inquiries about this project, contact Dr. Aaron B. Wilson Extension Climatologist (wilson.1010@osu.edu).
Summarize Ohio planting progress and days suitable for fieldwork reported each year the National Agricultural Statistics Service (USDA-NASS).
Corn Planting Progress

OSU Extension Statewide
Corn planting pace was slower than normal due to cooler than average temperatures in early spring and wet weather in some areas of the state. In 2020, Ohio farmers reached the 50% planted mark for corn on May 17th and completed planting by June 21st. Figure 1 illustrates Ohio’s corn planting progress for all years between 1979 and 2020. NASS reported corn planting was completed in Ohio on the week ending June 21, 2020. This is the second latest finish on record, with only 2019 having a later recorded completion date. It is worth noting 2020 was still three weeks ahead of 2019’s corn completion date! Table 1 shows the years with the five latest corn planting completion dates on record.

Data source: USDA NASS

Soybean planting progress proceeded closer to normal in 2020. Figure 2 shows Ohio’s soybean planting progress for all years between 1979 and 2020. Ohio reached 50% planted on May 24th and soybean planting was reported completed on June 28th. This is the ninth latest finish on record. Table 2 shows the years with the ten latest corn planting completion dates on record.
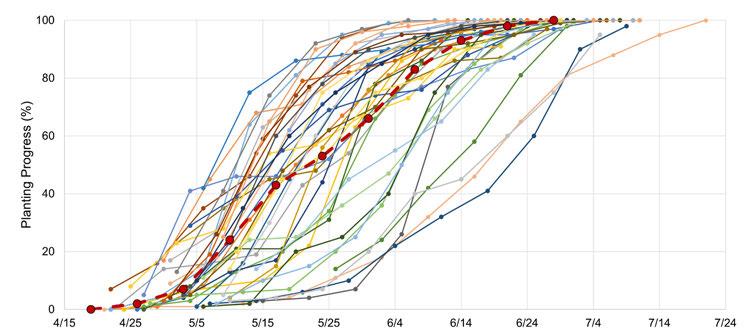
Figure 2. Ohio soybean planting progress reported by USDA NASS from 1979 – 2020. 2020 progress is shown by the scarlet dashed line. Data source: USDA NASS
Table 2. Ten latest reported planting completion dates in Ohio since 1979. Data source: USDA NASS Year Week of Reported Completion 2019 7/21/2019 1986 7/6/1986
7/5/2015
7/3/1983
7/1/1984
6/30/1985
6/29/2014
6/28/2020
6/28/1998
The 2020 season got off to a slow start with a cold and wet April. We were able to make up time in the field quickly due to having close to the average number of days available for field work in May and above average number of days during June through August (Figure 3).
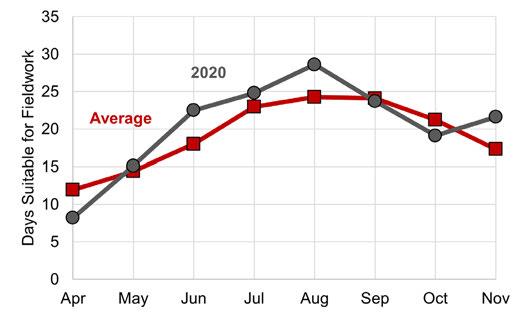
Figure 3. Monthly days suitable for fieldwork. The average number of days per month from 1995 to 2019 (scarlet squares) compared to the number of days available for fieldwork per month in 2020 (gray circles). Monthly totals are calculated based on weekly reports. Data source: USDA NASS
Overall, the 2020 spring planting season presented a few challenges but none as widespread as in 2019. A warm March primed soils early, but late April and early May sub-freezing conditions nipped early emerged corn and soybeans with some reported replanting taking place. Early season wet conditions led to poor planting soil conditions and a few reported flooded fields as well. The weather improved significantly by mid-May through June, leading to six weeks of steady progress.
For inquiries about this project, contact Elizabeth Hawkins (hawkins.301@osu.edu), Aaron Wilson (wilson.1010@osu.edu), or John Fulton (fulton.20@osu.edu).
Help Ohio’s farm families achieve financial success in today’s challenging marketplace.
In 2020, fifty-three farms worked on analysis for their farm businesses with 49 farms completing a whole farm or a whole farm with enterprise analysis. Crop production was the primary enterprise with additional enterprises including dairy, beef cow calf, beef finishing, custom heifer raising, and custom field operations. All farm analyses include both beginning and end-of-year balance sheets.
Farms ranged in size from pasture only to 82 crop acres to more than 3,900 crop acres. The 2019 summary contains enterprise reports for corn harvested as dry shell corn and corn silage, soybeans, winter wheat harvested as grain, alfalfa hay, mixed hay, sorghum silage, and small grain double crops harvested as silage. Results are reported by land tenure for owned acres and rented acres. While some farms do evaluate share-rental arrangements, specifics of each rental arrangement varies by farm and are not summarized.
Benchmark reports are generated for crop enterprises when possible and can be found in the enterprise summaries. Find the full Crop Enterprise Report under the “Farm Profitability” tab at: farmoffice.osu.edu.
Technicians work directly with farms to develop and complete:
• Balance Sheets (beginning and end of year), cost and market basis
• Income Statement, accrual adjusted
• Statement of Cash Flows
• Enterprise Analysis

Shaded counties indicate farms participating in analysis.

Trish Levering levering.43@osu.edu

David Jenner jenner.12@osu.edu


Chris Pfaff pfaff.55@osu.edu

Knowing the farm business’s accrual adjusted net farm income and costs of production allow farm managers to identify overall business issues up to several years before they become apparent if managing the farm business on a cash basis. Personalized benchmark reports (sample below) allow the farm to benchmark income and expenses against farms similar Ohio farms.

2019 Ohio Farm Business Summary
A complete farm business analysis monitors profitability, working capital, cash flow and net worth change. Personalized benchmark reports generated for financial standards and by crop enterprise identify opportunities to increase profitability.

For inquiries about this project, contact Dianne Shoemaker (shoemaker.3@ osu.edu), Haley Shoemaker (shoemaker.306@osu.edu), or Clint Schroeder (schroeder.307@osu.edu).
Enterprise Budgets have been developed by faculty of the College of Food, Agricultural, and Environmental Sciences (CFAES) for several decades. The 2021 Ohio Crop Enterprise Budgets were developed by Barry Ward, Leader, Production Business Management at Ohio State. The budgets are tools that growers can use to examine different scenarios on their operation to help in decision making. The Enterprise Budgets can be found on Excel spreadsheets that users can download. Growers can then input their own production and price levels to calculate their own outputs. As seen below, the budgets have color coded cells that will allow users to plug in their own numbers and calculate bottom lines for different scenarios.

Cell Color Key:
Gold: Values may be changed to assist in computing the “Your Budget” Column using macros embedded within the spreadsheet.
Light Blue: Values will be calculated for the user based on data entered. These cells may be input manually, but macros will be overwritten!
Gray: Values are stand-alone cells that require direct input from the user.
Key points to remember when utilizing the budget sheets:
• The budgets represent common, workable, combinations of inputs that can achieve a given output.
• Amounts of seed, types and quantities of fertilizer, chemicals, and other items reflect University recommendations and the experience of many Ohio farmers.
• The combinations of inputs and prices presented will not likely precisely reflect any given farm.
• In practice, actual costs will be higher or lower than shown. Thus the most important column is “Your Budget”.
Characteristics of an Enterprise Budget:
• Estimates the costs and returns expected for a single enterprise.
• Represents one combination (from among hundreds available) of inputs such as seed, chemicals, and fertilizer to produce some level of output.
• A written plan for a future course of action including estimated costs and returns for that particular enterprise.
• Provides a format and a basis for developing enterprise budgets appropriate for a given farm situation.
Things not implied by an Enterprise Budget:
• It is not the only combination of inputs that can be used to produce this crop.
• It does not imply that anyone whose costs are different from this must have incorrect data or poor records.
• It does not imply that all producers can achieve these costs and yields. Different soil types, different ways in which the soil has been utilized and cared for in the past, and different weather in a given season all can cause the actual results to vary greatly from what is presented.
Three yields are provided in each budget sheet. The middle yield is the long term trend yield for Ohio. The other two yields are 20% lower and higher than the middle yield. These yields levels reflect differing yield potential.
Seed, fertilizer, and chemical requirements are based on agronomists’ recommendations. Fertilizer amounts vary by yield level to reflect crop removal, based on typical soil test values for P2O5 and K2O. These quantities and prices can changed to reflect your soil tests and local prices to provide a more accurate estimate of your costs of production.
Five items are included as fixed costs, some of which may or may not be fixed for a particular operation. These items include labor, management, machinery and equipment, land, and miscellaneous charges.
The budgets report all costs including cash, depreciation, and opportunity costs. Cash costs likely include categories such as seed, fertilizer, and chemical costs. Depreciation on machinery is included in the “Machinery and Equipment Charge.” Some items may contain opportunity costs, which reflect returns to a producer’s labor, capital, and managerial resources. Opportunity costs should be included in budgeting because they account for the use of a producer’s resources.
Prices for crops and inputs reflect estimates for the given year. Crop prices are estimates of harvest prices. No costs are included for grain storage. If an improved price is acheived by your farm due to storage or marketing strategies, then any increased costs to achieve that price should either be netted out of returns or added to costs.
All budgets report “return above variable costs” and “return above total costs”. Return above variable costs is useful in examining decisions that must be made within a year. Return above total costs would be used to examine “long-run” decisions.
Enterprise Budget
You can access the Ohio Crop Enterprise Budgets by visiting go.osu.edu/enterprisebudgets or by using the QR code to visit the site.

For inquiries about this information, contact Barry Ward (ward.8@osu.edu).
Custom work is common in farming, especially for tasks that require specialized equipment or expert knowledge of that task. Barry Ward, Leader, Production Business Management along with John Barker and Eric Richer (Extension Educators) worked to develop the 2020 Ohio Farm Custom Rates. This publication provides an extensive list of average custom rates that were derived from a statewide survey of 377 farmers, custom operators, farm managers, and landowners. The Ohio Farm Custom Rates publication is a resource you can use on your operation as a reference in your economic analyses. All the provided rates (except where noted) include the implement and tractor if required, all variable machinery costs such as fuel, oil, lube, twine, etc., and the labor for the operation.
Some of the custom rates provided in the publication vary widely, due to the following variables:
• Type or size of equipment used
• Size and shape of fields
• Condition of the crop
• Skill level of labor
• Amount of labor needed in relation to the equipment capabilities
• Cost margin differences for full-time custom operators compared to farmers supplementing current income

The custom rates provided in the publication summarize the survey respondents. The reported numbers are the average (or mean), standard deviation, median, minimum, maximum, and range. Average custom rates are a simple average of all survey responses. As a custom provider, the average rates reported in this publication may not cover your total costs for performing the custom service. As a customer, you may not be able to hire a custom service for the average rate noted in this fact sheet. Calculate your own costs carefully before determining the rate to charge or pay. The data from this survey are intended to show a representative farming industry cost for specified machines and operations in Ohio. The Ohio Farm Custom Rates publication includes other resources that can help you calculate and consider the total costs of performing a given machinery operation.
The eFields nitrogen studies utilize the Ohio Farm Custom Rates to calculate return above total N. As you read through our nitrogen studies, you can reference these rates to better understand our calculations. Below is a sample of how we utilize these rates for our return above N calculations. The treatment data below is from an eFields Late Season Nitrogen study. The total nitrogen rate and yield were input in the Nitrogen Timing Calculator that is found in a downloadable Excel file at go.osu.edu/econcalculator
In this example, the “Late Season N ApplicationCoulters/Acre” rate of $13.20 was used to calculate the return above N. After inputting the application rate, yield, and total N rate into the calculator, the Return Above N for this treatment is $772.00 per acre.
Enterprise Budget
You can access the Ohio Farm Custom Rates by visiting go.osu.edu/customrates20 or by using the QR code to visit the site.
You can access the Ohio Crop Enterprise Budgets by visiting go.osu.edu/enterprisebudgets or by using the QR code to visit the site.

For inquiries about this information, contact Barry Ward (ward.8@osu.edu).
The agriculture community is no stranger to fluctuation. Each farm season brings an ebb and flow to the workload, employee structure, and other principles driven by commodity markets, weather, machinery breakdowns, pest and weed management, technology advancements, and cash. The wild card for 2020, with foreseeable drift to 2021, was the introduction of a worldwide pandemic.
Agriculture as a whole grit its teeth and kept right on humming. What was learned? Farm management response required monitoring workers’ personal health, not often on the radar. In 2020, a focus on the human capital of businesses had to make way to the forefront. To do so, new protocols and best practices on farms were required for essential workers to remain on their busy schedules.
The basics of a COVID-19 conscience farm plan start with examining and planning in four areas.
• Maintaining Critical Management Functions
• Eliminating Threats to Overall Workforce
• Preparing for On-Site Custom Services
• Handling Positive Cases
Numerous business tasks, decisions, and operations fall solely to an owner operator or farm manager to execute. In the event the farm owner/manager should fall ill, it is important a plan be established for how to move the operation forward in the absence of that key person. In times of uncertainty this type of planning can be the difference in whether or not an operation survives. Even a two-week set back from illness can hit a farm operation at a critical window, causing residual implications for the course of a particular year. It is best not to underestimate the importance of a continuity plan.
Examine critical functions of your business by considering the processes involved with crops, livestock, finance and bookkeeping, and employee management. Identify employees, neighbors, or other contracted services to help keep an operation functioning in the event of unexpected absence. Communicate the plan to the support network positioned to step in during a time of need. Prepare information on contacts for veterinary care, equipment service, feed and seed supply. Map out the farm property, including all rented ground and buildings. Note whether or not you have any tenants in housing and layout the payment agreements.
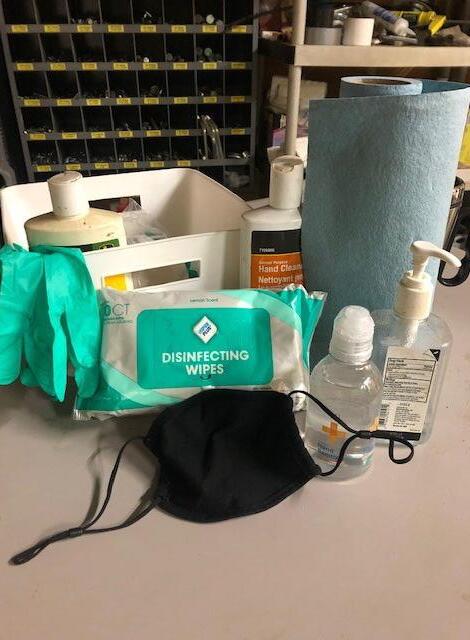
• Make sure to provide a place where employees can wash hands and have disposable towels available. There should be no shared towels, including shop rags.
• Provide alcohol-based hand sanitizer for remote locations and places where handwashing is not possible.
• Wear a mask when working together or riding in farm vehicles. Face coverings must be laundered or replaced (if disposable) after daily use. Masks should be properly stored in plastic bags when not in use; they should not be laying around the farm shop.
• Establish protocols for sanitizing common gathering places like the shop, lunch areas, and offices spaces. Cleaning and disinfecting high touch areas, like door handles, phones, 2-way radios, keyboards, light switches, monitors/touchpads, faucets/sinks, and restroom areas. Discourage workers from using other workers’ phones, desks, offices, or other work tools and equipment, when possible.
• Discourage sharing of any food or beverages.
• Avoid ride sharing in company vehicles, when possible.
• Workers with a fever 100.4 should stay home or work in their own isolated pod.
Agricultural Safety and Health Program
For inquiries about this article contact Dee Jepsen (jepsen.4@osu.edu) or Lisa Pfeifer (pfeifer.6@osu.edu).
Establish plans of work for employees built around health and safety considerations. Setting the tone as an employer, will help guide employees in taking COVID-19 safety practices seriously
• Assign jobs/tasks that can be done without the presence of another, if possible.
• Instruct employees to physically distance six feet if a shared worksite is necessary.
• Look at the functions of your farm operation and consider grouping employees into work teams, to limit individual exposure. Creating workforce teams can help ensure an operation minimizes the impacts should a worker become ill or test positive for coronavirus. Work teams that had no interaction with the affected employee will be safely able to continue working.
• Utilize separate transportation. Assign employees to specific farm vehicles or equipment. Knowing which vehicles will be used for various tasks, who will operate tractors or combines, who will bring lunch to the field and whether that person will use the UTV or farm truck for delivery is a good starting point.
• Keep all employees out of equipment and vehicle cabs, even to hand off tools or receive communication, unless they are the assigned operator.
• Set sanitation protocols for high touch points within tractors, equipment, and transport vehicles. Workers should have access to hand sanitizer and/or cleaning supplies for the equipment they operate. Have a procedure established for who is responsible for cleaning shared equipment; is it the entrant, or the person who exits.
Establish how daily health checks and reporting illness will be handled. Follow your local health department requirements by asking sick employees to stay home or self-quarantine from the rest of the farm workforce.
• Create a health screening assessment questionnaire for employees to complete at the beginning of work each day, asking about COVID-19 symptoms, positive COVID-19 test, and/or close contact with confirmed or suspected COVID-19 cases.
• Ask employees to take their own temperature and tell employer if it registers over 100.4⁰F. As an employer, be cautious not to record data that violates HIPPA guidelines. A simple YES/NO question maintains employee rights: “Was your temperature over 100.4⁰F before reporting to work today?” If yes, they stay home, if no they are permitted to work.
• Encourage employees to reduce out-of-state travel, participation in mass-group events and practice recommendations from state for social distancing in their off-work environments. Employees should report to their employer if they fall into any high-risk situation that may jeopardize the other workers. In some cases, the employee may be asked not to report to work for two weeks, depending on the exposure level.
• Send sick employees to get tested as soon as possible. Treat employees who are feeling sick or waiting for test results the same, and assume they are positive for coronavirus.
When an outside source will be providing on-site services make a plan before their arrival. Instruct technicians, mechanics, and applicators to utilize their own transportation to and from the field if the work or service is to be performed off site. Meet in open areas and maintain distance. Sanitize shop tables and other surfaces after team meetings.
Establish how illness and positive coronavirus test results will be handled. Putting some thought into the types of tasks employees do, or the number of people they encounter during their shift, will help you create safe distancing environments for other employees.
• Follow your local health department requirements by asking symptomatic employees or workers with a temperature of 100.4 to stay home and self-quarantine from the rest of the farm workforce.
• Send sick employees to get tested as soon as possible. Treat employees who are feeling sick or waiting for the results the same, and assume they are positive for coronavirus.
• Can employees who want to come to work be permitted? The employer needs to weigh out this risk and consider how the consequences will affect the entire operation. In these situations, it will be important to identify tasks that can be performed in isolation.
The COVID-19 landscape changes quickly and often, exploring ways to incorporate protections and precautions into a normal workday on the farm will foster continued viability in this environment.
For 2020, eFields corn research was focused on improving the production and profitability of corn in the greater Ohio area. Some exciting and innovating projects were conducted this year, with 47 unique studies implemented across the state. 2020 eFields corn research investigated many of the topics listed in the eFields focus areas. Highlights include high speed planting, multi-hybrid planting, corn seeding rates, and many other innovative practices. Here is the 2020 eFields corn research by the numbers:
47 corn studies 2,433 acres
For more corn research from Ohio State University Extension, explore the following resources:
The purpose of the Ohio Corn Performance Trials is to evaluate corn varieties for yield and other agronomic characteristics. This evaluation gives corn producers comparative information for selecting the best varieties for their unique production systems. For more information visit: go.osu.edu/corntrials
The Agronomic Crops Team performs interesting research studies on a yearly basis. Resources, fact sheets, and articles on corn research can be found here on the Agronomic Crops Team website: go.osu.edu/CropsTeamCorn
The Ohio State Digital Ag Program conducts studies related to all aspects of corn production. Research related to planting, inputs, and harvesting technology can be found on the Digital Ag website: digitalag.osu.edu


For all corn studies in this eFields report, we define corn growth stages as the following:
VE - Emergence - coleoptile is fully visible, yet no leaves are fully developed.
V1 - Full development of the first (flag) leaf, achieved when the collar of the leaf is fully visible.
VN - N fully developed leaves with collars visible.
VT - Tassels fully visible and silks will emerge in 2-3 days.
R1 - Silking - silks are visible and pollination begins.
R2 - Blister - silks darken and dry out, kernels are white and form a blister containing clear fluid.
R3 - Milk - kernels are yellow and clear fluid turns milky white as starch accumulates, kernels contain 80% moisture.
R4 - Dough - starchy liquid inside kernels has dough-like consistency, kernels contain 70% moisture and begin to dent at the top.
R5 - Dent - nearly all kernels are dented and contain about 55% moisture.
R6 - Black layer - physiological maturity is reached and kernels have attained maximum dry weight at 30-35% moisture.

To evaluate corn yield and economics when planting corn into various cover crop treatments.
Planting Date 4/28/2020
Harvest Date 10/29/2020
Variety P1197AM
Population 33,500 sds/ac
Acres 12
Treatments3
Reps3
Treatment Width20 ft.
Tillage No-Till
Management Fertilizer, Herbicide
Previous CropFallow
Row Spacing30 in.
Soil Type Haskins Loam, 60%
Nappanee Loam, 23%
Hoytville Clay Loam, 17%
This study was designed with three treatments replicated three times in a randomized complete block design. The treatments included cereal rye cover crop; a 14-way, multi-species cover crop mix; and a cover crop soybean check. Cover crop species were planted September 3, 2019 on prevent plant/fallow acres. All cover crops were direct seeded with a drill. Rye was drilled at 60 lbs/acre, and the multi-species mix was drilled at approximately 35 lbs/acre. All field operations were identical across treatments except a burndown application on the check as that was normal for that system. Nitrogen was sidedressed at 180 lb/ac on June 2.


OSU Extension
Fulton County

The cover crop treatments did not have a significant effect on the corn stand, despite being planted into 18 inch tall cereal rye. While spring biomass on the multispecies mix was sufficient when planting by September 3, additional growth could have been achieved with planting in mid-August. Planting cereal rye by September 3 created excellent spring biomass. Additionally, hot and dry temperatures in July may have limited the yield at this site.
• The corn following a multi-species cover crop mix yielded significantly better than the other treatments.

• The results at this site suggest corn following cereal rye has a nominal moisture and test weight disadvantage to the other treatments.
• Furthermore, the cereal rye cover crop treatment showed the least return above seed cost as compared to the other treatments.
Treatment Means with the same letter are not significantly different according to Fisher’s Protected Least Significant Differences (LSD) test at alpha = 0.1. LSD: 7.13 CV: 2.22%
Multi-species cover crop mixes
Multi-species cover crop mixes add to the biodiversity in crop rotation systems. This mix included legumes, summer and winter cereals, and brassicas for a cost of $31/acre.
Photo credit: Paulding Co. OSU Extension

For inquiries about this project, contact Eric Richer (richer.5@osu.edu).
To measure the effects of foliar fungicide on corn and impact on yield.
Planting Date 4/20/2020
Harvest Date 9/22/2020
Variety 5994V2P
Population 32,500 sds/ac
Acres90
Treatments2
Reps3
Treatment Width30 ft.
Tillage No-Till
Management Herbicide, Fungicide
Previous Crop Soybeans
Row Spacing30 in.
Soil Type Crosby Silt Loam, 63%
Celina Silt Loam, 19%
Brookston Silty Clay, 18%
The experiment was a randomized block with 3 replications. Plots were 90 feet wide and field length. The center passes of the treatments were harvested for grain yield. The combine was calibrated in season. Fungicide Trivapro was applied at a rate of 13.7 oz per acre which was compared to no fungicide application.


Extension Darke County

This corn was planted early and emerged well, but it was frozen off in the Mother’s Day weekend freeze. The corn rebounded well and became a very even field that yielded well. This field received ample rains throughout the growing season. There was no leaf disease pressure at pollination.

• There was no significant difference in grain moisture or yield in this high producing corn crop.
• The calculated cost per acre of fungicide application was $23/acre.
• At harvest, grain moisture was not different between treatments.


Treatment Means with the same letter are not significantly different according to Fisher’s Protected Least Significant Differences (LSD) test at alpha = 0.1.
John Deere self propelled sprayer is used to make fungicide application at VT growth stage.

For inquiries about this project, contact Sam Custer (custer.2@osu.edu).
To understand planter and tractor power/speed limitations with respect to emergence and corn yield.
Planting Date 6/6/2020
Harvest Date 11/17/2020
Variety 5829 RR
Population 33,000 sds/ac
Acres99
Treatments 4
Reps 7
Treatment Width 60 ft.
TillageVertical
Management Fungicide, Insecticide, Herbicide, Fertilizer
Previous Crop Soybeans
Row Spacing30 in.
Soil Type Genesse Silt Loam, 53%
Ross Silt Loam, 42%
High speed planter systems have become more common on modern planters. We continue to evaluate this technology pushing the limits to find the top end as well as the “sweet spot” for optimal planting. This study evaluates four speeds of planting in central Ohio and their effects on yield and emergence. Heavy downforce (150) was applied using a Precision Planting 20/20 Seed Sense monitor and Delta Downforce. This planter was also equipped with CleanSweep and Yetter shark tooth residue managers to allow management of residue in front of the row units.


Growing Season Weather Summary

Planting was conducted with a Case IH 2150 24-row planter with Precision Planting high speed technology components.
Stand counts show little difference between speeds but highest stand count area resulted in highest yield. Uniform emergence allowed the crop to get off to a good start thanks to hydraulic downforce keeping the planting depth consistent. Growing conditions were very favorable throughout the entire growing season but lack of rain was the yield limiting factor for this field and planting date as well.

• No significant difference indicates speed is not a limitation when it comes to yield potential.
• 3 necessary components for this to be successful are hydraulic down force, electric drive meters, and speed tubes.
• We continue to see these results time and time again with minimal impact to yield. On several occasions over the years a yield advantage to planting faster has resulted.
• Planting faster allows more acres to be completed per hour without increasing the number of row units on a farm.
Treatment Means with the same letter are not significantly different according to Fisher’s Protected Least Significant Differences (LSD) test at alpha = 0.1.

This tool allows for increased speed and spacing consistency while maximizing the planters capability during tight weather windows. The belted design “hand delivers seed right into the furrow. For inquiries about this project, contact Andrew Klopfenstein (klopfenstein.34@osu.edu) or Ryan Tietje (tietje.4@osu.edu).
To study the effect of different downforce settings on crop emergance and final yield.
Planting Date 6/9/2020
Harvest Date 11/14/2020
Variety 5829RR
Population 34,000 sds/ac
Acres90
Treatments 5 Reps 4
Treatment Width 60 ft.
Tillage No-Till
Management Insecticide, Fertilizer, Herbicide, Fungicide
Previous Crop Soybeans
Row Spacing30 in.
Soil Type Gessie Silt Loam, 77% Ross Silt Loam, 23%
There have often been questions about spring vs pneumatic vs hydraulic downforce and the potential ROI on each system. To test this, hydraulic cylinders in a constant pressure were used to simulate springs set to standard settings that surveyed growers’ use in a light and a heavy application. The “optimal” active downforce was also used to see what the system could do to keep the seed at the perfect depth. Additionally, this planter was equipped with wing downforce to help distribute weight and keep the planter level during operation.


Beck's Hybrids
Ross County

A Case IH 2150 24R30 equipped with Precision Planting SpeedTube, vDrive, vSet, and Delta Force was used to plant this trial.
The normal planting date would be end of April and was delayed due to a wet spring. The levy in the field also broke, further delaying planting. However, planting conditions were optimal with planting depth of 2.25 inches at a speed of 9.5 mph.

Delta Downforce, a product of Precision Planting, is a hydraulic cylinder that replaces springs or air bags on your existing planter. It works in coordination with a sensor on the guage wheels measuring back pressure with readings 10 times per second. This allows the row unit to maintain depth and the seed to have optimal conditions across all soil types as soil types change across a feld.
• There was no statistically significant difference between treatments for this growing season.
• It was observed that heavy auto had a more uniform stand during stand counts and this was reflected in the yield results.

Treatment Means with the same letter are not significantly different according to Fisher’s Protected Least Significant Differences (LSD) test at alpha = 0.1.

For inquiries about this project, contact Andrew Klopfenstein (klopfenstein.34@osu.edu) or Ryan Tietje (tietje.4@osu.edu).
Characterize the potential changes that may occur in liquid manure nutrient concentrations as pits are pumped during field application.


A multi-farm study was conducted during June 2020 while liquid manure was being side-dress into corn ranging in growth stages between V2 and V5. The cooperating farms were located in Darke County with all manure sources being from swine pits. All manure was applied using a dragline system, Zoske Kodiak injection toolbar and a tractor equipped with RTK autoguidance. RTK was used to keep the tractor and the toolbar rotary coulters operating between corn rows. A sampling port was installed in-line to allow collection of manure samples during pumping and field application. During field application, manure samples were collected every 20 minutes. Bottles were labeled and then taken to Brookside Labs for complete sample analysis to determine Lost by Ignition + Mineral Matter (Dry Matter), Total N, Ammonia N, P2O5, K2O. Sample analysis was then compiled and processed to characterize any changes in manure nutrient concentration during field application.
During application, the manure from the non-agitated pit had visual changes in consistency from the beginning to the end in both color and viscosity linked to the stratification of the solids within the manure profile. The manure grew continually darker throughout the process of pumping both non-agitated barns as well as the flow of the manure slowed as the pit emptied. The agitated barns were more consistent regarding flow, and color was not as noticeable from beginning to end. Samples were collected at the toolbar to collect the most accurate as-applied manure due to homogenization within the hose between the pit and field.

Zoske Kodiak Injection Toolbar
This toolbar was used to apply manure via a 6 inch dragline into standing corn. Sample ports were outfitted on the outermost injector for as-applied samples to be collected.
• P2O5 concentration increased in both Pit 3 and 4 with Pits 1 and 2 remaining fairly consistent during field application.
• Similarly, Dry Matter (DM) content increased for Pits 3 and 4, remained consistent for Pit 2, but Pit 1 had a decreasing trend.
• The variability of Dry Matter in Pit 1 occurred even though agitation was completed before application.
• Both P2O5 and Dry Matter varied as manure was applied from pits that were not agitated prior to application.
• In summary, the variation in nutrient concentration from some pits highlighted a potential means to sense manure constituents in real-time allowing operations to adjust field speed or pumping volume to match target application rates.


For inquiries about this project, contact Chris Shoup (shoup.83@osu.edu) or John Fulton (fulton.20@osu.edu).
To compare the results of commercial 28% fertilizer versus liquid swine manure applied via tanker on corn yield.
Planting Date 5/2/2020
Harvest Date 10/12/2020
Variety SC1117
Population 32,500 sds/ac
Acres 6
Treatments2
Reps3
Treatment Width30 ft.
Tillage Minimum Till
Management Fertilizer, Fungicide, Herbicide
Previous Crop Soybeans
Row Spacing30 in.
Soil Type Blount Silt Loam, 57%
Pewamo Silty Clay Loam, 27%
Glynwood Silt Loam, 15%
This trial was designed as a randomized complete block with three replications. Liquid swine manure was applied at 8,456 gallons per acre on June 1, 2020 to V3 corn and 28% nitrogen was applied at 37 gallons per acre on the same day. The plot size was approximately 0.798 acres (1931.6 ft by 18 ft). Treatments were balanced for total nitrogen. All other cropping practices were the same across the field.


OSU Extension
Auglaize County

Corn plots following the manure application.
The manure tanker used for this study was not setup with narrow wheels to apply liquid manure as a sidedress corn; therefore, the manure tanker wheels ran over and flattened some of the corn during the application of the manure. The loaded manure tanker should also be considered as a source of soil compaction. Additionally, the producer noted that he observed a drier than normal summer, which could have impacted yields.

• There was no difference in corn grain yield between liquid swine manure and 28% nitrogen for this field in 2020.
• Liquid swine manure applied to growing corn has usually improved corn yield compared to commercial nitrogen fertilizers, allowing for the use of manure at the appropriate time of the year.
• At harvest, there was a difference in grain moisture between the treatments.
Treatment Means with the same letter are not significantly different according to Fisher’s Protected Least Significant Differences (LSD) test at alpha = 0.1.
Liquid manure tanker and applicator tool bar places manure sub suurface during the growing season. For inquiries about this project, contact Brigitte Moneymaker (moneymaker.4@ osu.edu), Glen Arnold (arnold.2@osu. edu), or Jeff Stachler (jeff.stachler@ ndsu.edu).

To compare the results of commercial 28% fertilizer versus liquid swine manure applied as a sidedress on corn yield.
Planting Date 5/9/2020
Harvest Date 11/4/2020
Variety NK0886, SC1090
Population 32,000 sds/ac
Acres 6
Treatments2
Reps3
Treatment Width30 ft.
Tillage No-Till
Management Fertilizer
Previous Crop Soybeans
Row Spacing30 in.
Soil Type Blount Silt Loam, 53%
Pewamo Silty Clay Loam, 35%
Glynwood Silt Loam, 12%
This study was a split-plot with randomized treatments. The two different fertilizer treatments were applied in rows of twelve, on two separate hybrids of corn, replicated three times. The plot size was approximately 0.83A (30 ft x 1201 ft). Treatments were balanced for total nitrogen. All other cropping practices were consistent across the field.


Auglaize County
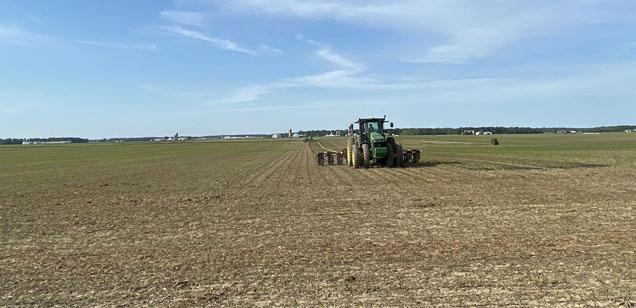
Manure sidedress in the field.
About two weeks after application of the manure the corn was taller and greener than the corn applied with 28% nitrogen. The corn appeared to grow with some stress during the season, but this area of the county received more rainfall than other parts of the county.
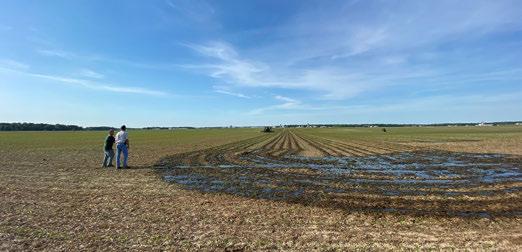
• There was a difference of an additional 14 bu/A for NK0886 fertilized with manure and an additional 26 bu/A for SC1090 fertilized with manure.
• Statistically, the fertilizer source and hybrid type were both significant.
• Liquid swine manure applied to growing corn can improve corn yield compared to commercial nitrogen fertilizers, allowing for the use of manure at the appropriate time of the year. Treatments
Treatment Means with the same letter are not significantly different according to Fisher’s Protected Least Significant Differences (LSD) test at alpha = 0.1.
The swine finishing manure was applied using a 12-row coulter till liquid manure side-dress drag hose toolbar. This implement allows for subsurface placement of liquid manure between corn rows.

9.06
3.65%
For inquiries about this project, contact Brigitte Moneymaker (moneymaker.4@ osu.edu), Glen Arnold (arnold.2@osu. edu), or Jeff Stachler (jeff.stachler@ ndsu.edu).
To evaluate the effectiveness of dragline application of liquid swine and beef manure as an economic and environemtal alternative to commercial corn sidedress fertilizer.
Planting Date 5/7/2020
Harvest Date 11/7/2020
Variety P0306AM
Population 35,000 sds/ac
Acres 70
Treatments2
Reps3
Treatment Width30 ft.
Tillage No-Till
Management Fertilizer, Herbicide
Previous Crop Soybeans
Row Spacing30 in.
Soil Type Blount Silt Loam, 85% Pewamo Silty Clay Loam, 15%


OSU Extension
Darke County
In this study, three replications were used to compare the use of swine manure versus anhydrous at sidedress. Treatments were implemented at the V3 growth stage. The combine yield monitor was calibrated in season. Passes from the centers of the plots were harvested for treatment comparisons. Treatments were balanced for total nitrogen.

Manure injection with the toolbar.
This field was planted in rye and was pretty wet when we performed the manure side dress. We had some issues with plugging up the toolbar with the high degree of solids from this specific finisher barn.
• We will continue to look at this field as it is not what we found in our other manure sidedress trials this year.
• We will look at the pit additives and managements as a source of understanding.
• Economically they are basically the same because of the elimination of the nitrogen cost.
Treatment Means with the same letter are not significantly different according to Fisher’s Protected Least Significant Differences (LSD) test at alpha = 0.1.
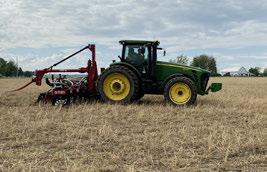
Zoeske Side Dress Tool Bar and John Deere Harvest 3000 Nutrient Sensor allow for the use of a dragline to apply liquid swine manure in the growing crop up to V4.
For inquiries about this project, contact Sam Custer (custer.2@osu.edu).
To evaluate the effectiveness of dragline apllication of liquid swine and beef manure as an economic and environmental alternative to commercial corn sidedress fertilizer.
Planting Date 5/10/2020
Harvest Date 10/12/2020
Variety E112J1-3011
Population 34,000 sds/ac
Acres 150
Treatments2
Reps3
Treatment Width30 ft.
TillageMinimal
Management Fertilizer, Herbicide
Previous Crop Soybeans
Row Spacing30 in.
Soil Type Miamian Silt Loam, 29%
Brookston Silty Clay Loam, 29%
Crosby Silt Loam, 25%
In this study three replications were completed comparing the use of swine manure versus anhydrous at sidedress. Treatments were implemented at the V3 growth stage in this study. Nitrogen was applied to each treatment for a total nitrogen rate of 160 pounds/acre. The combine yield monitor was calibrated in season. Passes from the centers of the plots were harvested for treatment comparisons.


OSU Extension
Darke County
Manure sidedress application in corn.
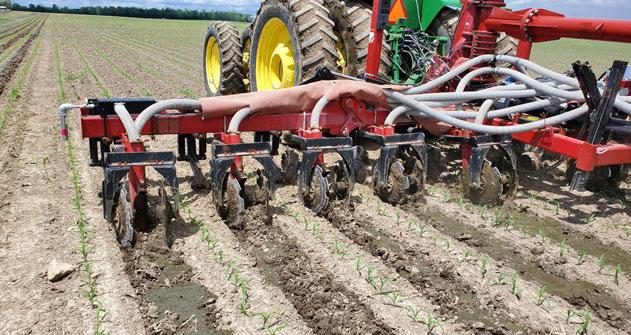
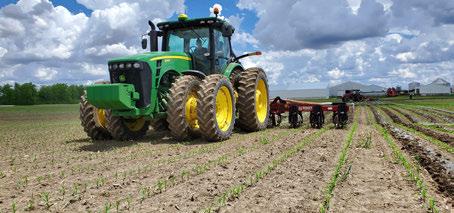
Manure sidedress performed at V3. The manure was a blended swine finishing and beef from a mono slope pit barn. The corn was planted into a spring killed rye. The stand was very good before the application and little to no damage was done with the dragline. Ideal rains were received in July and early September to maximize yields in this field.
• A statistical difference in yield existed between treatments.
• The manure out-performed the commercial nitrogen sidedress at more than 32 bushels/acre.
• The manure was used in a growing crop and maximized its use while being applied at time to reduce runoff.
• Grain moisture was not different at harvest.
Treatment Means with the same letter are not significantly different according to Fisher’s Protected Least Significant Differences (LSD) test at alpha = 0.1.
Zoeske Side Dress Tool Bar and John Deere Harvest 3000 Nutrient Sensor place the liquid manure in the growing crop while creating as applied maps.

1.02%
For inquiries about this project, contact Sam Custer (custer.2@osu.edu).
To evaluate the effectiveness of dragline application of liquid swine manure as an economic and environmental alternative to commercial corn sidedress fertilizer.
Planting Date 5/5/2020
Harvest Date 10/16/2020
Variety SCS1037AM
Population 32,000 sds/ac
Acres 56
Treatments2
Reps3
Treatment Width 60 ft.
Tillage No-Till
Management Fertilizer, Herbicide
Previous Crop Soybeans
Row Spacing30 in.
Soil Type Hoytville Silty Clay Loam, 100%


In this study three replications were completed comparing the use of swine manure versus 28% UAN at sidedress. Treatments were implemented at the V3 growth stage in this study. Treatments were balanced for total nitrogen. Swine manure was applied at a rate of 5,000 gallons/acre and 28% UAN was applied at a rate of 60 gallons/acre. Plots were 24 corn rows wide and field length 1055 to 1182 feet long. All 24 rows were harvested from each plot and taken across certified scales individually. Moisture and test weight were determined by the licensed grain facility.

Following the sidedress application of 28% UAN.
Corn population was reduced due to a large rain event shortly after planting. Population was reduced by approximately 11% and necessitated some replant corn on June 3 on about 5 acres of the 55 acre field not significant to the plot area. This study location had below average rainfall to slight drought conditions from June 1 to harvest.

• There was no statistical difference in corn yield.
• In this study, the utilization of available swine manure to sidedress corn reduced the farmers outof-pocket expenses by approximately $74 per acre for the cost of 28% UAN ($230 per ton/$0.41 per pound) on the acres where swine manure was used instead.
• A sidedress manure toolbar helps utilize existing equipment and provides an additional time of field application.
• A manure analysis taken on 9/25/2020 indicated nutrients per 1,000 gallons of 35.9 lbs of total nitrogen available in the 1st year, 15.3 lbs of P2O5, and 34.3 lbs of K2O.
Treatment Means with the same letter are not significantly different according to Fisher’s Protected Least Significant Differences (LSD) test at alpha = 0.1.
Bazooka Farmstar Injection Toolbar
15.36
This toolbar was used with a 6 inch drag hose to inject manure into a standing corn crop at V3 growth stage. For inquiries about this project, contact Bruce Clevenger (clevenger.10@osu. edu).

To determine the effect of side dressing corn with liquid swine manure applied with a tanker as an economic and environmental alternative to commercial fertilizer.
Planting Date 4/27/2020
Harvest Date 10/12/2020
Variety 5818BR
Population 30,000 sds/ac
Acres30
Treatments2 Reps 5
Treatment Width 15 ft.
TillageConventional Management Fertilizer
Previous CropWheat
Row Spacing30 in.
Soil Type Hotyville Clay Loam, 51% Nappanee Loam, 48%
Liquid swine manure and 28% UAN were applied at sidedress (V3). Five replications were completed. The study was setup in a randomized complete block design. Plot size was 15 ft wide and 2,550 ft long. Treatments were balanced for total nitrogen. All other cropping practices were constistent across the field.


Extension
Fulton County
A Pre-Sidedress Nirtate Test (PSNT) showed 7 ppm of Nitrate Nitrogen in the soil at the time of sidedress. There was an extended period of dry weather during the application period. Therefore, the application was done at the proper plant stage, and the added benefit of liquid from the manure helped the crop during the dry weather.
• A statistical difference in corn yield existed.
• Sidedressing with liquid swine manure yielded an additional 8 bushels per acre and saved $42/acre in 28% UAN costs.
• Side-dressing liquid manure can provide yield benefits in corn while offering savings.
• Grain moisture was not different at the time of harvest.
Treatment Means with the same letter are not significantly different according to Fisher’s Protected Least Significant Differences (LSD) test at alpha = 0.1.
Manure tanker setup with sweeps on 30 inch centers to side dress corn in season. This tool allows for more flexibility in manure application for swine producers.

For inquiries about this project, contact Jordan Beck (beck.320@osu.edu), Eric Richer (richer.5@osu.edu), or Glen Arnold (arnold.2@osu.edu).
To determine the effect of side dressing corn with liquid swine manure, applied with a tanker as an economic and environmental alternative to commercial fertilizer.
Planting Date 5/5/2020
Harvest Date 10/20/2020
Variety Rupp A07-32
Population 30,100 sds/ac
Acres 4
Treatments2
Reps 4
Treatment Width 15 ft.
Tillage No-Till
Management Fertilizer
Previous Crop Soybeans
Row Spacing30 in.
Soil Type Nappanee Loam, 54%
Hotyville Clay Loam, 46%


OSU Extension
Fulton County
Liquid swine manure and anhydrous were applied at sidedress (V3), and four replications were completed. The study was setup in a complete randomized block design, plot size was 15 ft wide and 1,200 ft long. Treatments were balanced for total nitrogen.

Harvesting corn on 10/20/2020 with Gleaner R52 combine.
A Pre-Sidedress Nitrate Test (PSNT) showed 6 ppm of Nitrate Nitrogen in the soil at the time of sidedress. There was an extended period of dry weather during the application period. Therefore, the application was done at the proper plant stage, and the added benefit of liquid from the manure helped the crop during the dry weather.
• There was a significant difference in corn yield between treatments.
• Sidedressing with liquid swine manure showed an 18 bushel/acre yield advantage over the anhydrous treatment.
• An anhydrous cost of $46/acre could be saved by using liquid swine manure at side-dress.
• There was no difference in grain moisture at the time of harvest.
Treatment Means with the same letter are not significantly different according to Fisher’s Protected Least Significant Differences (LSD) test at alpha = 0.1.
Deitrich injection sweep with closing coulter wheels
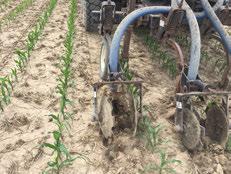
The sweeps are modified to 5” width to prevent corn knockdown.
For inquiries about this project, contact Jordan Beck (beck.320@osu.edu).
To evaluate the effectiveness of liquid swine manure as a nitrogen source in an organic corn system.
Planting Date 6/6/2020
Harvest Date 11/7/2020
Variety Blue River 48G35
Population 32,000 sds/ac
Acres20
Treatments2
Reps 4
Treatment Width20 ft.
TillageConventional Management Fertilizer
Previous CropAlfalfa
Row Spacing30 in.
Soil Type Blount Loam, 53% Pewamo Clay Loam, 35% Glynwood Loam, 12%
This study compared a pre-plant incorporated cattle manure system versus a pre-plant cattle manure plus sidedressed swine manure system of nutrient management. The sidedress treatment was applied at growth stage V1. Preplant manure was incorporated with a field cultivator and sidedress manure was injected with Balzer tank with Dietrich injection sweeps. All other field operations were consistent across both treatments. Yield data was collected with weigh wagon and shrunk to 15% moisture.


OSU Extension
Fulton County
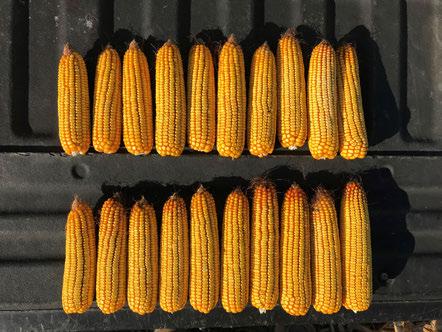
Ten-ear weights were 4.47 lbs for the check (top) and 5.03 lbs for the treatment with sidedress manure (bottom).
The corn crop was monitored field limiting factors throughout the growing season. At the time of the sidedress application, a Pre-Sidedress Nitrate Test (PSNT) indicated 7 ppm of Nitrate Nitrogen was in the soil. Four Corn Stalk Nitrate Tests (CSNT) were pulled after black layer for each treament and averaged. CSNTs indicated that the check treatment was “low” in nitrogen and that the sidedressed treatment was “high” (Purdue Extension CSNT guidelines). At harvest, ears with the sidedressed manure had more weight and girth.
• A significant difference in corn yield existed.
• The addition of sidedressed swine manure showed a 25 bu/acre yield advantage over the check treatment.
• There was no difference in harvest moisture nor test weight for either treatment at harvest.
Treatment Means with the same letter are not significantly different according to Fisher’s Protected Least Significant Differences (LSD) test at alpha = 0.1.
The USDA National Organic Program (NOP) provides a materials list of approved and unapproved products to be used in certified organic systems. Raw manure is an approved nutrient source when it is applied to land used for a crop not intended for human consumption. It may also be used in food crops at the appropriate 90-120 preharvest interval (Source: USDA-NOP Standards).

For inquiries about this project, contact Eric Richer (richer.5@osu.edu).
To evaluate the effectiveness of liquid swine manure as a nitrogen source in an organic corn system.
Planting Date 6/6/2020
Harvest Date 11/7/2020
Variety Great Harvest 58E4
Population 32,000 sds/ac
Acres20
Treatments2
Reps 4
Treatment Width20 ft.
TillageConventional Management Fertilizer
Previous CropAlfafa
Row Spacing30 in.
Soil Type Blount Loam, 53% Pewamo Clay Loam, 35% Glynwood Loam, 12%
This study compared a pre-plant incorporated cattle manure system versus a pre-plant cattle manure plus sidedressed swine manure system of nutrient management. The sidedress treatment was applied at growth stage V1. Preplant manure was incorporated with a field cultivator and sidedress manure was injected with Balzer tank with Dietrich injection sweeps. All other field operations were consistent across both treatments. Yield data was collected with weigh wagon and shrunk to 15% moisture.


OSU Extension
Fulton County
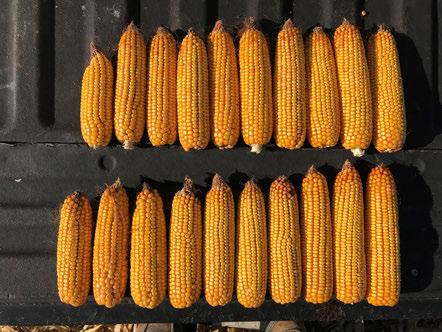
Ten-ear weights were 5.06 lbs for the check (top) and 5.86 lbs for the treatment with sidedress manure (bottom).
OBSERVATIONS
The corn crop was monitored for yield limiting factors throughout the growing season. At the time of the sidedress application, a Pre-Sidedress Nitrate Test (PSNT) indicated 7 ppm of nitrate nitrogen was in the soil. Four Corn Stalk Nitrate Tests (CSNT) were pulled after black layer for each treament and averaged. CSNTs indicated that the preplant manure only treatment was “low” in nitrogen and the manured treatment was “optimal” (Purdue Extension CSNT guidelines). At harvest, ears with the sidedressed manure had more weight and girth.
• A significant difference in corn yield existed for this study.
• The addition of sidedressed swine manure showed a 16 bu/acre yield advantage over the check treatment.
• At this site, the swine manure treatment resulted in a five-point higher grain moisture.
Treatment Means with the same letter are not significantly different according to Fisher’s Protected Least Significant Differences (LSD) test at alpha = 0.1.
Manure Analysis
A basic manure analysis will provide farmers with the amount of first-year available N, P, and K per 1,000 gallons (liquid manure) or per ton (solid manure or compost) as well as the percent moisture and solids in the manure.
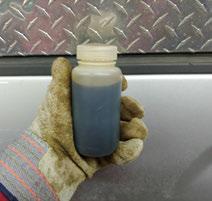
For inquiries about this project, contact Eric Richer (richer.5@osu.edu).
To evaluate the effectiveness of liquid swine manure versus poultry litter as a nitrogen source in an organic corn system.
Planting Date 5/31/2020
Harvest Date 10/28/2020
VarietySpectrum Seeds Organic 5111
Population 32,000 sds/ac
Acres 13
Treatments 4
Reps3
Treatment Width 15 ft.
TillageConventional
Management Fertilizer
Previous Crop Soybeans
Row Spacing30 in.
Soil Type Colwood Loam, 40%
Kibbie Loam, 38%
Tuscola Loam, 17%
This study was designed in an alternating complete block design. The two treatments were 4 tons/acre of poultry litter incorporated pre-plant and 4 tons/ac of poultry plus 2,000 gal/acre of liquid swine manure. All field operations (tillage, rotary hoe, cultivation) were consistent across all treatments. Yield data was collected with a weigh wagon and shrunk to 15% moisture.


OSU Extension
Henry County
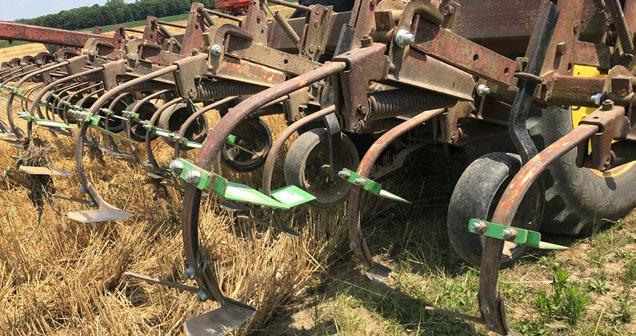
This 12-row cultivator with wider sweeps and Flow-Shields was used for the last pass of weed control in order to ridge soil around the corn row.
The corn crop was monitored for field limiting factors throughout the growing season. At the time of the sidedress application, a Pre-Sidedress Nitrate Test (PSNT) indicated 5 ppm of nitrate nitrogen was in the soil. Four Corn Stalk Nitrate Tests (CSNT) were pulled after black layer for each treament and averaged. CSNTs indicated that the poultry litter only treatment was “low” in nitrogen (Purdue Extension CSNT guidelines).
• There was no statistical difference in yield between the two treatments despite the poultry litter treatment having a “low” CSNT rating at the end of the season.
• The sidedress treatment may have slightly reduced the stand count in the poultry litter plus swine manure treatment.
• Additional replications and year-over-year data will add to the validity of these results.
Treatment Means with the same letter are not significantly different according to Fisher’s Protected Least Significant Differences (LSD) test at alpha = 0.1.
Poultry litter is an excellent source of organic nutrients, often supplying sufficient amounts of nitrogen, phosphorus, potassium and calcium for a corn crop when applied at 3-5 tons/acre.

For inquiries about this project, contact Eric Richer (richer.5@osu.edu).
To compare corn yield and economics of applying liquid swine finishing manure as a sidedress nitrogen source against that of commercial nitrogen fertilizer.
Planting Date 5/1/2020
Harvest Date 11/8/2020
Variety P0720AM, P1197AM
Population 34,500 sds/ac
Acres 60
Treatments2
Reps3
Treatment Width30 ft.
Tillage No-Till
Management Fertilizer, Herbicide
Previous CropWheat
Row Spacing30 in.
Soil Type Hoytville Silty Clay Loam, 56% Nappanee Silty Clay Loam, 44%
Liquid swine manure (6,000 gallons) was applied to the majority of the corn field with no manure applied to three (3) randomly selected 24 row check strips across the field. 28% UAN was applied to the check strips following the manure application. Treatments were balanced for total nitrogen.


Extension
Henry County

Weighing the grain from each plot with a weigh wagon.
Manure was applied to V3-V4 corn. Some plants that were approaching V5 were broken off during the application. Dry conditions and drought stress during the growing season were yield limiting. Disease and insect pressure were minimal.

• As previous OSU Extension research has indicated, corn sidedressed with swine finishing manure had a statistically significant greater yield than plots sidedressed with 28% UAN fertilizer.
• The dry growing conditions of 2020 in NW Ohio seem to have benefited plots sidedressed with manure.
• Swine finishing manure continues to be a comparable, and economic nitrogen source for corn.
Treatment Means with the same letter are not significantly different according to Fisher’s Protected Least Significant Differences (LSD) test at alpha = 0.1. LSD: 15.57 CV: 4.47%
Bazooka Farmstar sidedressing unit for liquid manure.

For inquiries about this project, contact Garth Ruff (ruff.72@osu.edu).
To compare corn yield and economics of applying liquid swine finishing manure as a sidedress nitrogen source against that of commercial nitrogen fertilizer.
Planting Date 5/7/2020
Harvest Date 11/5/2020
Variety 5928AM
Population 31,800 sds/ac
Acres 36
Treatments2
Reps3
Treatment Width30 ft.
Tillage No-Till
Management Fertilizer, Herbicide
Previous Crop Soybeans
Row Spacing30 in.
Soil Type Hoytville Silty Clay Loam, 100%


OSU Extension
Henry County
Liquid swine manure (5,500 gallons) was applied to the majority of the corn field with no manure applied to three (3) randomly selected 12 row check strips across the field. 28% UAN was applied to the check strips following the manure application. Treatments were balanced for total nitrogen.

Due to slow emergence, spot replanting occurred in the field, primarily in the manured treatments and endrows. The field was also cultivated post manure application to loosen soil. Dry conditions during the growing season were yield limiting. Fall dry down during harvest was slower that usual even after a dry growing season.

• As previous OSU Extension research has indicated, corn sidedressed with swine finishing manure had a statistically significant greater yield than plots sidedressed with 28% UAN fertilizer.
• The dry growing conditions of 2020 in NW Ohio seem to have benefited plots sidedressed with manure.
• Swine finishing manure continues to be a comparable, and economic nitrogen source for corn.
Treatment Means with the same letter are not significantly different according to Fisher’s Protected Least Significant Differences (LSD) test at alpha = 0.1.
Hose reel (humper) used to anchor and pull dragline hose across the field of straight row planted corn.

For inquiries about this project, contact Garth Ruff (ruff.72@osu.edu).
To determine the effect of different inputs on the development and yield of corn.
Planting Date 6/3/2020
Harvest Date 11/6/2020
Variety Wellman 2310
Population 34,000 sds/ac
Acres 6
Treatments2
Reps3
Treatment Width 40 ft.
Tillage No-Till
Management Fertilizer, Herbicide
Previous CropFallow
Row Spacing30 in.
Soil Type Blount Silt Loam, 53%
Glynwood Silt Loam, 24% Pewamo Silty Clay Loam, 19%


eFields
Farm OSU Extension Auglaize County
A randomized complete block design with four replications was used for this trial. Treatments included no inputs other than 200 pounds/ac of nitrogen applied at planting and sidedress and another treatment having the following inputs: 7.5 gallons/A of 10-34-0 plus 1 quart/A of zinc plus 5 gallon/A of ammonium thiosulfate plus 22.25 gallons/A of 28% nitrogen applied in a 2 inch by 2 inch band and 3 gallons/A of 6-23-6 applied as a pop up at planting; and 86 pounds/A of nitrogen applied as annhydrous ammonia at a 7 inch depth on June 24, 2020 to V4 corn; and 10.5 fluid ounces/A of Propaz applied on June 26, 2020 to V5 corn; and 6.76 gallons/A of 28% nitrogen plus 2 gallons/A of ammonium thiosulfate plus 1 gallon/A of Finisher plus 1 quart/A of zinc plus 1 quart/A of copper applied thru a Y-Drop tube and 14 fluid ounces/A of Gold Rush Duo plus 3.2 fluid ounces/A of Lambda plus 1 gallon/A of Finisher sprayed into the corn canopy from the Y-drops to R1 corn on August 3, 2020. Only 5 rows were harvested per treatment.

Multiple input treatment applied on the right of the picture.
The corn was taller and greener on June 24, 2020 and June 26, 2020, respectively for the treatment with multiple inputs. There was not obvious leaf diseases at the time of the fungicide application. The Multiple Inputs treatment was greener early but did not appear different later in the season.

• NDVI and plant heigth was greater and the number of Gray Leaf Spot lesions were fewer for the Multiple Inputs treatment compared to the check.
• The Multiple Inputs treatment improved corn grain yield by 9.5 bushels per acre compared to the check; however, the return lost $188.
Treatment Means with the same letter are not significantly different according to Fisher’s Protected Least Significant Differences (LSD) test at alpha = 0.1.
The Ohio Agronomy Guide provides information to help monitor plant health through the season.
For inquiries about this project, contact Jeff Stachler (jeff.stachler@ndsu.edu) or Brigitte Moneymaker (moneymaker.4@ osu.edu).
To determine the effect of nitrogen timing on corn yield.

Planting Date 6/1/2020
Harvest Date 11/6/2020
Variety Wellman 2807 DP
Population 34,000 sds/ac
Acres 15
Treatments 5
Reps3
Treatment Width 40 ft.
Tillage No-Till
Management Fertilizer, Herbicide
Previous CropFallow
Row Spacing30 in.
Soil Type Blount Silt Loam, 25% Pewamo Silty Clay Loam, 25%
A randomized complete block design having three replications was used for this trial. Treatment plot width was 40 feet (16 rows) and plot length was 1138 Feet. A 2 inch by 2 inch band of 13.4 gal/ac of 10-34-0 plus 13.4 gal/ ac of 28% nitrogen plus 5 gal/ac of ammonium thiosulfate plus 1 qt/ac of zinc was applied with the planter. Anhydrous ammonia was applied 7 inches deep to V3 corn on June 19, 2020 at treatment rates. 28% nitrogen was applied with a Y-drop applicator to R1 corn at either 20 or 40 lbs/ac on August 3, 2020. Only 5 rows of corn were harvested from each plot to obtain corn grain yield.

OSU Extension
Auglaize County

There were no visual differences in the green color of the corn based upon the diffferent rates of nitrogen at the time of the R1 application.

• Applying late-season nitrogen at silking (R1) corn with a Y-Drop system did not improve corn grain yield.
• This is the third year of similar results. However, if you wanted to apply lower rates of nitrogen earlier in the season to reduce nitrogen losses and make an application late in the season, corn grain yield can be maintained with this type of application, but there will be added costs due to the additional trip across the field.
• The highest rate of return was the application of 180 pounds of nitrogen between planting and sidedressing, and the lowest rate of return wa the application of 231 pounds of nitrogen per acre.
Treatment Means with the same letter are not significantly different according to Fisher’s Protected Least Significant Differences (LSD) test at alpha = 0.1.
Y-Drops were used in this trial to apply late season nitrogen, placing nitrogen at the base of the plant. For inquiries about this project, contact Jeff Stachler (jeff.stachler@ndsu.edu) osu.edu.

To determine whether the use of coulters or Y-drops make a difference in corn yield.
Planting Date 5/17/2020
Harvest Date 9/16/2020
Variety Channel 206-11 VT2
Population 31,000 sds/ac
Acres 10
Treatments2
Reps 4
Treatment Width30 ft.
Tillage No-Till
Management Fertilizer, Herbicide
Previous Crop Soybeans
Row Spacing30 in.
Soil Type Chili Loam, 57% Chili Gravelly Loam, 35.9%


This study analyzed two treatments, coulters and Y-drops, replicated four times. 45 gallons of 28% nitrogen was applied using each application method to directly compare and determine if either contributed to an increase in corn yield.

Nitrogen application at early growth stage.
This field was planted in mid-May and grew well, with very little evidence of insect or disease pressure. While planted timely, this site was very dry near the time of pollination and resulted in lower that what is generally produced.
• The results of this study did not show any statistically significant difference in final yield.
• It will be important to repeat this study over multiple years and various growing conditions to evaluate these application methods.

Treatment Means with the same letter are not significantly different according to Fisher’s Protected Least Significant Differences (LSD) test at alpha = 0.1.
Y-Drops
Y-drops place nitrogen at the base of the plant and coulters incorporate nitrogen several inches from the plant row.

For inquiries about this project, contact Chris Zoller (zoller.1@osu.edu).
Determine the effect of nitrogen rates on corn yield following a pre-plant poultry litter application.
Planting Date 5/2/2020
Harvest Date 10/17/2020
VarietyFBN F2FIC
Population 33,765 sds/ac
Acres 15
Treatments 5
Reps3
Treatment Width 40 ft.
TillageMinimal
Management Fertilizer, Fungicide, Herbicide
Previous Crop Soybeans
Row Spacing30 in.
Soil Type Blount Silt Loam, 83% Glynwood Silt Loam, 16%
A randomized complete block design having three replications was used for this trial. Chicken litter was applied at 3 tons/ac and incorporated before planting. Five rates of nitrogen, 42 lbs/ac, 117 lbs/ac, 142 lbs/ac, 192 lbs/ac, and 242 lbs/ac were applied in this trial. 42 lbs/ac nitrogen was applied at planting for all treatments in the form of 9 gal/ac of 28-0-0, plus 9 gal/ac 10-34-0 in a 2 inch by 2 inch strip and 3 gal/ac of 6-23-6 as a pop-up. 82-0-0 was applied as a sidedress on June, 2020 to V4 corn to a depth of 6 inches at 0, 75, 100, 150, and 200 lbs/ac. Twelve rows of corn were harvested on October 17, 2020 with a John Deere combine.


OSU Extension
Auglaize County

The corn was at the V4 stage when the anhydrous ammonia was applied.
OBSERVATIONS
The corn was very green at the time of the sidedress application. There were no visual differences in green color of the plants.
• In this trial, the rate of nitrogen had no effect upon yield.
• The lowest rate of nitrogen was enough because of the chicken litter that was applied at planting and it was dry in July and August.
• The highest rate of return was with the application of the least nitrogen and the lowest return was with the highest rate of nitrogen.

Treatment Means with the same letter are not significantly different according to Fisher’s Protected Least Significant Differences (LSD) test at alpha = 0.1. LSD: 21.16 CV: 8.51%
Flow Meter
Anhydrous ammonia flow meters make changing the nitrogen application rate very easy.

For inquiries about this project, contact Jeff Stachler (jeff.stachler@ndsu.edu) or Brigitte Moneymaker (moneymaker.4@osu.edu).
Determine the optimum nitrogen rate to maximize yield and economics on highly productive soils when utilizing dry broadcast urea.
Planting Date 5/27/2020
Harvest Date 11/9/2020
Variety Dekalb 57-97
Population 32,500 sds/ac
Acres 80
Treatments3
Reps 4
Treatment Width 60 ft.
TillageVertical
Management Fertilizer, Herbicide
Previous Crop Soybeans
Row Spacing30 in.
Soil Type Pewamo Silty Clay Loam, 47%
Cardington Silt Loam, 26%
Bono Silty Clay Loam, 18%
Previous local trials have shown an advantage to increased nitrogen rates on high yield potential soils. Treatment rates were determined based on the farmer’s current practice and previous trials with a rate above and below the current practice. The trial was a randomized complete block design to account for variation within the field and to make sure each treatment was applied to multiple soil types in the field. For the applied nitrogen, 25 lbs/ac was applied during planting with the balance on the nitrogen by treatment applied at sidedress.


OSU Extension
Crawford County
Growing Season Weather Summary

Corn harvested from high nitrogen treatments.
This field was replanted after the first planting was mechanically terminated. A nitrogen treatment of 159 lbs showed visual crop stress in late July. For the other two treatments, differences could not be observed from the air. The visual color differences were only present for two weeks.

• No yield difference was detected between treatments.
• The limiting factor this year was rainfall. The conditions also favored organic nitrogen availability with small rainfall events followed by dry conditions.
• Soils were not saturated after nitrogen application, decreasing chances of potential nitrogen loss.
Treatment Means with the same letter are not significantly different according to Fisher’s Protected Least Significant Differences (LSD) test at alpha = 0.1.
The high clearance dry fertilizer spreader allows for the application of dry fertilizer in season.

LSD: 8.06
CV: 2.26%
For inquiries about this project, contact Jason Hartschuh (hartschuh.11@osu.edu).
Investigate the effects of nitrogen rate on corn yield and profitability when planted into standing cereal rye cover crop.
Planting Date 4/24/2020
Harvest Date 10/17/2020
Variety P0506AM
Population 34,000 sds/ac
Acres 21
Treatments3
Reps3
Treatment Width 40 ft.
Tillage No-Till
Management Fertilizer, Herbicide
Previous CropCover Crop Rye
Row Spacing30 in.
Soil Type Hoytville Clay Loam, 100%
Three nitrogen rates were replicated three times in a sequential block design. All treatments received 45 units of N/acre at planting. Corn was planted with a no-till John Deere 1770NT planter. The remainder of the nitrogen treatments were applied on June 9 as anhydrous ammonia (82-0-0). All plant health applications were consistent across all treatments.


OSU Extension
Fulton County

There were no noticeable yield limiting factors observed. Cereal rye cover crop was approximately 20” at termination, 10 days after planting. Nitrogen treatments were made during a relatively dry period in June. Corn Stalk Nitrate Tests (CSNTs) taken prior to harvest indicated all treatments were in the “optimal” nitrogen rate range. Yields and moistures were determined using a calibrated yield monitor.

• There was no statistical yield difference between the two nitrogen highest rates but the lowest nitrogen rate did result in lower yield and economics.
• Corn Stalk Nitrate Tests (CSNTs) indicated all treatments were in the “optimal” nitrate-nitrogen with all exceeding 250 ppm.
• No differences in harvested grain moisture were observed.
Treatment Means with the same letter are not significantly different according to Fisher’s Protected Least Significant Differences (LSD) test at alpha = 0.1.
CSNTs are used to evaluate the effectiveness of a nitrogen management program. Sampling should be done 10 days after black layer, prior to harvest. Generally, <250 ppm NO3- is considered a “low” level for stalk nitrates, 2502,000 ppm is “optimal”, and >2,000 ppm is excessive (Purdue CSNT guidelines).

7.80
2.56%
For inquiries about this project, contact Eric Richer (richer.5@osu.edu).
To determine the effects of multiple nitrogen sidedress rates on corn yield and profitability.
Planting Date 4/25/2020
Harvest Date 10/24/2020
Variety Becks 5997
Population 36,000 sds/ac
Acres 10
Treatments 4
Reps3
Treatment Width30 ft.
TillageMinimal
Management Fertilizer, Herbicide
Previous Crop Soybeans
Row Spacing30 in.
Soil Type Homewood Silt Loam, 57% Titusvillle Silt Loam, 34%


OSU Extension
Knox County
Growing Season Weather Summary
This corn nitrogen sidedress study was designed as a randomized complete block study. Each plot was 30 feet wide and encompassed the full length of the field. Treatments consisted of 28% Nitrogen applied at 3 different rates: Normal sidedress rate: 44 gal/ac (132# N), 54 gal/ac (162# N), and 62 gal/ac (186# N). 10-34-0 at a rate of 68 gal/ac (80# N and 270# P) was also compared in this study. A calibrated yield monitor was used to collect yield data.

Applying nitrogen through sidedress.
Approximately 2 weeks after the sidedress applications the plots with the high rate of 10-34-0 visually appeared greener. However, this did not translate into a significant yield difference. 2020 was a good growing season for corn. This plot received adequate rainfall throughout the season and the plants rarely exhibited any visual stress. Weed control was good and there was little insect or disease pressure
• The 54 gal/ac (162# N) produced the highest yield and the greatest return. The 62 ga/ac treatment also exhibited an increase in net return when compared to the farms normal rate of 44 ga/ac. The high rate of 10-34-0 produced the second highest yield, but due to the high fertilizer cost it resulted in the lowest net return of the 4 treatments.

Treatment Means with the same letter are not significantly different according to Fisher’s Protected Least Significant Differences (LSD) test at alpha = 0.1.
Liquid Fertilizer Applicators
Liquid fertilizer applicators allow producers to apply nitrogen below the soil surface at various growth stages.

For inquiries about this project, contact John Barker (barker.41@osu.edu).
To understand the impact of N timing on corn yield.

Planting Date 5/26/2020
Harvest Date 11/9/2020
Variety P1077AM
PopulationVR
Acres 75
Treatments 6
Reps 4
Treatment Width 40 ft.
Tillage No-Till
Management Fertilizer
Previous Crop Soybeans
Row Spacing30 in.
Soil Type Crosby-Lewisburg Silt Loam, 41% Kokomo
Silty Clay Loam, 31%
Westland Silty Clay Loam, 26%
A randomized complete block design with 6 treatments and 4 reps was used. Maximum Return for Nitrogen (MRTN) was used to compute the economic optimum N rate for 2020 at 170 lbs N / ac for this field. The 170 lbs N per acre was used as the applied rate of N for all treatments other than the 0 lbs N /ac. Planter nitrogen rates were 30, 50, and 90 pounds with the balance being applied at sidedress.


ADVI image of the field.
A later than normal planting season was followed by a very dry growing season especially in July and August. At emergence, all plants came up uniformly but as early as V3 there were differences in plant height observed. The zero N applied strips also were showing N stress early in the season. Remote sensed imagery was used to evaluate corn status during the growing season. By V6, there were significant differences in plant height and growth stage between treatments not receiving any N at planting (No N Applied and 0-170 split) being a ½ growth stage behind those that had received N at planting. Further, the 170-0 and 90-80 split treatments ½ almost a full growth stage ahead of the treatments that receive 0 lbs N / ac at planting. Consequently, there were visual differences between treatments throughout the growing season but water ended up being the most limiting yield factor in this field.
• A significant difference in yield existed with those treatments receiving N at planting having a higher yield than treatments that received 0 N at planting.
• The yield trend in this study indicated that N applied at planting provided a significant yield advantage with yield increasing with an increase in applied N at side-dress.
• There were no difference in grain moisture at harvest except that the Planter Full-Rate of N was below 19%.
• In summary, though the growing season turned dry and hot in the middle of the growing season, treatments that received N at planting had a yield advantage over treatments that received 0 N at planting.
Treatment Means with the same letter are not significantly different according to Fisher’s Protected Least Significant Differences (LSD) test at alpha = 0.1.
J&M’s 5000 Series NitroGro Nitrogen Applicators get nitrogen to the plants consistently and efficiently to help maximize yields. The toolbar flex and hydraulic down force ensures nitrogen is being placed at your desired depth, no matter the soil conditions. 5000 Series NitroGro with models are available in either 1,000 gallon (5010) or 1,600 gallon (5016) tank capacities.

For inquiries about this project, contact Nate Douridas (douridas.2@osu.edu) or John Fulton (fulton.20@osu.edu).
Determine the effect of nitrogen rate and timing on corn yield.

Planting Date 6/1/2020
Harvest Date 11/6/2020
Variety Wellman 2807
Population 34,000 sds/ac
Acres 12
Treatments 4
Reps3
Treatment Width 40 ft.
Tillage No-Till
Management Fertilizer, Herbicide
Previous CropCover Crop
Row Spacing30 in.
Soil Type Blount Silt Loam, 25% Pewamo Silty Clay Loam, 25%
A randomized complete block design having three replications was used to conduct this trial. All treatments started with 62 pounds nitrogen per acre as 13.38 gallons per acre of 10-34-0, 13.38 gallons per acre of 28% nitrogen, and 5 gallons per acre of 12-0-0-26 plus 1 quart per acre of zinc applied in a 2-inch by 2-inch placement with the planter. Only 11 rows of the 16 were harvested.

OSU Extension
Auglaize County

Corn nitrogen trial at early season.
There were no obvious visual differences in the green color of corn in the various treatments at the time of the R1 application.

Treatment Means with the same letter are not significantly different according to Fisher’s Protected Least Significant Differences (LSD) test at alpha = 0.1.
• In this trial, 118 pounds of nitrogen/A applied at side-dress was enough to maximize corn grain yield and rate of return.
• Applying 68 pounds of nitrogen/A at R1 (silking) with a Y-drop system kept the corn grain yield similar to 118 pounds of nitrogen applied at sidedress. The lowest rate of return was with the lowest rate of nitrogen.
5.98
Y-Drops
Y-drops were used in this study to place nitrogen at the base of the plant; coulters incorporate nitrogen several inches from the plant row for late season application.

For inquiries about this project, contact Jeff Stachler (jeff.stachler@ndsu.edu) or Brigitte Moneymaker (moneymaker.4@osu.edu).
Determine the usefulness and economic viability of using a pre-sidedress N test to guide N application rate on fields with history of manure application and to determine the effect of N application timing on yield.
Planting Date 6/22/2020
Harvest Date 11/18/2020
Variety Synergy 10203VT2
Population 29,000 sds/ac
Acres 4
Treatments2
Reps 4
Treatment Width30 ft.
TillageVertical
Management Fertilizer, Herbicide
Previous CropCorn
Row Spacing30 in.
Soil Type Euclid Silt Loam, 50% Bogart Loam, 36%
This study was conducted using a randomized complete block by the OSU Plots app, using 5 treatments and 4 replications. Plot width was 30 feet and plot length was 300 feet. Specific treatments included 0 lbs. of nitrogen at planting followed by a sidedress nitrogen treatment of either the Maximum Return for Nitrogen (MRTN) or the MRTN minus a credit based on the pre-sidedress N soil test result (PSNT), 50 lbs of nitrogen at planting followed by either the remainder of the MRTN amount or the remainder of MRTN - the PSNT credit, and one treatment of the MRTN applied at planting with no nitrogen sidedress.


OSU Extension
Wayne County
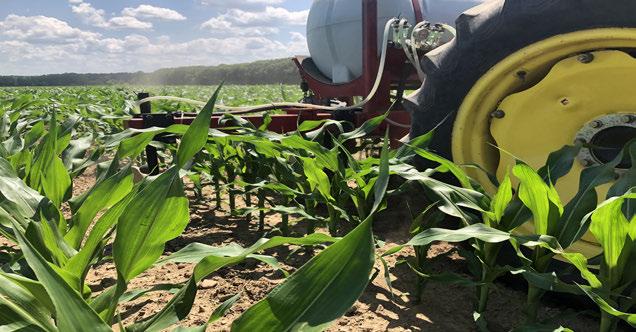
Applying sidedress nitrogen to V-7 corn on June 30.
This field was selected for the study because it has a history of manure applications, swine, beef and dairy manure. Manure is typically applied as a surface application. The PSNT is useful on fields with a history of manure application, providing an estimate of nitrogen mineralization and credit from previous years manure applications.
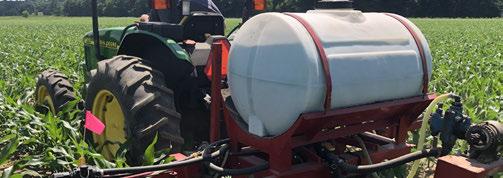
Treatment Means with the same letter are not significantly different according to Fisher’s Protected Least Significant Differences (LSD) test at alpha = 0.1.
MRTN calculator to determine an overall nitrogen rate based on cost of nitrogen and projected corn market price. Pre-sidedress Nitrate Test (PSNT) to determine nitrogen credit from manure applications and reduce the amount of sidedress nitrogen applied.
• Savings may be possible on a per-acre basis with a strategy that includes reducing chemical nitrogen applications based on PSNT and applying additional nitrogen needs over PSNT as a side-dress several weeks after germination (approximately V7 corn) rather than at planting.
• Note: The two lowest return over nitrogen treatments could be increased (net gain $15) to account for the savings in one less application pass in the field under those treatment strategies.

For inquiries about this project, contact Matthew Nussbaum (nussbaum.53@osu.edu).
To investigate the yield and plant health impacts provided by a nitrogen stabilizer in spring applied anhydrous ammonia.
Planting Date 5/12/2020
Harvest Date 11/4/2020
Variety Stine 9714-0
Population 35,000 sds/ac
Acres 10
Treatments2
Reps 4
Treatment Width30 ft.
TillageCoventional
Management Fertilizer, Herbicide
Previous CropFallow
Row Spacing30 in.
Soil Type Hoytville Silty Clay Loam, 57% Haskins Loam, 27% Mermill Loam, 11%
A randomized complete block design with four replications was used for this study. Plots were 30 feet wide and field length.


OSU Extension
Allen County

Heavy rains led to soil crusting and negatively impacted uniform emergence in this field.
Heavy rainfall following planting reduced emergence and caused variation in plant growth stage across both treatments. Drought conditions later in the growing season limited yield potential.

• No statistical difference in yield was observed between control treatment and N-Serve treatment.
• No difference in grain moisture at harvest existed.

Treatment Means with the same letter are not significantly different according to Fisher’s Protected Least Significant Differences (LSD) test at alpha = 0.1.
N-Serve Nitrogen Stabilizer
N-Serve Nitrogen Stabilizer - N-Serve slows the conversion of ammonium to nitrates, reducing leaching and denitrification.

For inquiries about this project, contact Clint Schroeder (schroeder.307@osu.edu).
To evaluate a soil applied biostimulant on corn yield.

Planting Date 04/27/2020
Harvest Date 10/17/2020
Variety P0720Q
Population 34,000 sds/ac
Acres 28
Treatments3
Reps3
Treatment Width 40 ft.
Tillage No-Till
Management Fertilizer, Herbicide
Previous CropFallow
Row Spacing30 in.
Soil Type Hoytville Clay Loam, 42% Mermill Loam, 32% Haskins Loam, 12%
This study was to evaluate three nitrogen systems in corn. It was organized in a sequential complete block design. In the right cropping conditions, BioDyne Biocast may increase the efficiency of nitrogen. As such, the treatments were set up to evaluate this efficiency. A check of 165 lbs nitrogen was compared to 25 lbs less for 140 lbs nitrogen plus BioDyne and 165 lbs nitrogen plus BioDyne. All crop protection applications were consistent across all treatments.


mounted on this
allow for a separate, in-furrow fertilizer and biologicals to be applied at planting independent of 2x2 placed products.
There were no noticeable yield limiting factors observed. However, nitrogen treatments were made during a relatively dry period in June. Yields and moistures were determined using a calibrated yield monitor.
• The BD Biocast plus 140 lbs N/ac resulted in a statistically lower yield than the other two treatments, suggesting that the application of biostimulant did not make up for the reduced application of nitrogen at this site.
• The check treatment resulted in the greatest economic return.
• More replications and year-over-year data will add to the validity of these results.
Treatment Means with the same letter are not significantly different according to Fisher’s Protected Least Significant Differences (LSD) test at alpha = 0.1.
BioDyne Biocast. BD Biocast is a soil applied biostimulant technology that is designed to build good microbes in the soil, fix nitrogen and other benefits. It can be applied pre-plant, infurrow, 2x2 or late season all with liquid nitrogen as the carrier. (www.biodyne-usa.com). In the right conditions, it may improve the efficiency of applied nitrogen.

3.38
1.07%
For inquiries about this project, contact Eric Richer (richer.5@osu.edu).
Evaluate if utilizing tracks on a central fill planter would reduce soil compaction and effect yield in corn.
Planting Date 6/9/2020
Harvest Date 11/14/2020
Variety 5829RR
Population 34,000 sds/ac
Acres 41
Treatments3
Reps 5
Treatment Width 60 ft.
Tillage No-Till
Management Fertilizer, Fungicide, Herbicide, Insecticide
Previous Crop Soybeans
Row Spacing30 in.
Soil Type Gessie Silt Loam, 77% Ross Silt Loam, 23%
This study was completed using a Case IH 2150 24-row planter. Soucy tracks were installed on the planter to be used in the treatments in addition to using the factory tire configuration. Starter fertilizer was not used but tanks were filled with water to simulate a loaded planter across all treatments. Additionally, hydraulic downforce was set to 150 lbs heavy auto mode in 20/20. This planter was also equipped with wing downforce that was set on 500 lbs throughout the duration of the study.


Tire imprints behind the Case IH 2150 planter.
The normal planting date would be end of April and was delayed due to a wet spring. The levy in the field also broke, furrther delaying planting. However, planting conditions were optimal with planting depth of 2.25 inches at a speed of 9.5 mph. The pinch row effects could be seen between V6-V8 and followed through harvest. Rain was the limiting factor for yield during 2020.
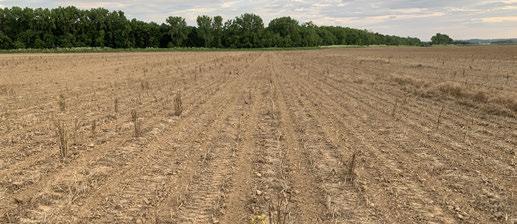
• There were no statistical differences between treatments for 2020.
• Although average yield for wing control was the same as the pinch rows, most treatments saw a 4 to 7 bushel difference.

Treatment Means with the same letter are not significantly different according to Fisher’s Protected Least Significant Differences (LSD) test at alpha = 0.1.
The Soucy S-TECH planter track system provides the opportunity to reduce the amount of soil compaction while planting. These tracks increase the soil track contact surface area, distributing the planter weight evenly.

For inquiries about this project, contact Andrew Klopfenstein (klopfenstein.34@osu.edu) or Ryan Tietje (tietje.4@osu.edu).
Evaluate the yield as a function of 15, 20, and 30 inch row corn spacing and seeding rates.
Planting Date 5/29/2020
Harvest Date 11/12/2020
Variety 6282AM
Population 30,000 & 35,000 sds/ac
Acres 150
Treatments 6
Reps 4
Treatment Width 120 ft.
TillageCoventional
Management Fertilizer, Herbicide
Previous Crop Soybeans
Row Spacing See Treatments
Soil Type Westland Silty Clay Loam, 45% Crosby Silt Loam, 25% Warsaw Loam, 14%
Given the recent volatility in the grain markets, it is increasingly important for growers to optimize the productivity of agricultural lands. Some growers are looking to increase plant populations with a corresponding reduction in row spacing as a means to increase returns to their operations. The vast majority of corn acres in the U.S. and Canada are planted in 30 inch rows with a small percentage of growers using 15, 20, or 22 inch row spacing. The goal of this study was to evaluate the effects on yield of 15, 20, and 30 inch row spacing with cooperating growers in Ohio.


OSU Extension Pickaway County

A Case IH 2140 24R20 and 16/32R planters were used to complete the treatments. They were both equipped with electric drive and hydraulic downforce along with putting down starter fertilizer during planting.
The corn got off to a really good start with favorable planting and growing conditions that continued throughout the entire season. Across all row widths, the corn had a very dark green color and it all stood well for the entire season through harvest. Disease and weeds were not a concern at any point during the growing season.

• The 30 inch corn at the high population was statistically significant over all other treatments for this growing season.
• No visual differences were observed through the growing season or during harvest.
• All treatments seemed very consistent throughout the entire field for stand quality and stalk health.

Treatment Means with the same letter are not significantly different according to Fisher’s Protected Least Significant Differences (LSD) test at alpha = 0.1.
Geringhoff Freedom Head
Higher yields mean higher populations, and a trend toward narrow row spacing. The Gerringhoff Freedom allows an easy transition from 30 inch rows to 15 inch rows. The low profile design makes it unmatched in down corn situations.
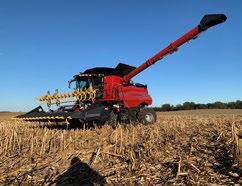
For inquiries about this project, contact Andrew Klopfenstein (klopfenstein.34@osu.edu) or Ryan Tietje (tietje.4@osu.edu).
Determine the feasibility of using SmartFirmer organic matter estimates to select corn seeding rates on the go.
Planting Date 5/27/2020
Harvest Date 10/16/2020
Variety Stewart's 17CV387
PopulationTreatments
Acres 84
Treatments 4
Reps 4
Treatment Width 40 ft.
Tillage No-Till
Management Fertilizer, Herbicide
Previous Crop Soybeans
Row Spacing30 in.
Soil Type Treaty Silty Clay Loam, 41% Celina Silt Loam, 27% Crosby, Celina Silt Loam, 25%
The trial was designed to compare three corn seeding rates across the field and a variable rate treatment that was determined by the SmartFirmer organic matter estimates on the go. A low, medium, and high seeding rate were chosen. The treatments were replicated four times in a randomized complete block design.


Clinton County

Target seeding rates for two ranges of organic matter against yield.
Planting was delayed in spring due to very wet and cool conditions in April and May. After planting, the season turned dry and this field received less than normal rainfall through July and August. These conditions caused a reduction in yield in zones where the topographically higher zones in the field. Lower lying zones with greater organic matter content produced better and responded more favorably to increased seeding rates.

• A statistical difference in yield was observed with the Smart Firmer treatment yielding higher than both the highest and lowest seeding rate treatments and yielding the same as the 30,000 sds/ ac treatment.
• The response to yield varied by zones delineated by soil organic matter.
• Organic matter content was a good way to delineate zones given the weather conditions that were observed in 2020.
Treatment Means with the same letter are not significantly different according to Fisher’s Protected Least Significant Differences (LSD) test at alpha = 0.1.
The SmartFirmer enables on-the-go estimates of soil properties at planting. The estimates of soil organic matter were used to guide the seeding prescription.

For inquiries about this project, contact Tony Nye (nye.1@osu.edu) or Elizabeth Hawkins (hawkins.301@osu.edu)
To determine the spacing impact of using SP-1 soil microbes on plant health, soil health, and crop yields.
Planting Date 05/3/2020
Harvest Date 11/4/2020
Variety P0843C
Population 32,000-34,000 sds/ac
Acres 40
Treatments2
Reps 4
Treatment Width 105 ft.
Tillage No-Till
Management Fertilizer, Herbicide
Previous Crop Soybeans
Row Spacing30 in.
Soil Type Hoytville Sandy Loam, 70% Dunbridge Sandy Loam, 17% Millsdale Silty Clay Loam, 13%
This study evaluated the use of SP-1 Soil biological amendment in corn production. SP-1 is a diverse mix of microbes known to build soil biology. The SP-1 formula supplies bacteria, fungi, and algae to the soil and includes carbon substrates, vitamins and minerals to support the growth of microbial life. According to the supplier, the microbes in SP-1 prefer aerobic conditions and thrive in the upper portion of the soil near the plant roots.


Trial map showing the layout of the four replications.
Average stand count on June 18, 2020 was 28,833 plants per acre for treated, and 30,667 plants per acre for the untreated reps. Average penetrometer reading on June 18, 2020 was 8.75 inches for treated, and 6.83 inches for untreated. Overall soil health was considered good to excellent at the start of the experiment, with slightly low readings for phosphorous, sulfur, and zinc, and little to no earthworm activity found but minimal compaction restrictions and overall good soil tilth. Emergence was excellent across the entire trial, with minimal root restriction, quickly warmed soils, and good water holding capacity as well as drainage.
• Noticeable stand difference, plant health, and ultimately yield difference that was statistically significant led the researchers to believe the SP-1 biological soil amendment may have a true impact on soil health, plant health, and crop yield.
• Further studies would be warranted with additional crops and replication of the same crop in order to validate this year's data.

(SP-1)
Treatment Means with the same letter are not significantly different according to Fisher’s Protected Least Significant Differences (LSD) test at alpha = 0.1.
Sp-1 soil biological microbes
SP-1 enhances the productivity of soils by improving the bacterial profile of the rhizosphere, ultimately boosting yield and crop health. The microbes in SP1™ prefer aerobic conditions and thrive in the upper portion of the soil near the plant roots, helping to improve germination, water use and fertilizer efficiency.

For inquiries about this project, contact Allen Gahler (gahler.2@osu.edu).
Determine if soil moisture monitors in irrigated fields improve water use efficiency.
Planting Date 4/25/2020, 5/7/2020, 5/20/2020
Harvest Date Mid-September
Variety Pioneer Inbred, Dekalb 63-90, Dekalb 62-52, White Potatoes
Population 28,000, 36,000, 38,000 sds/ac
Acres 586
Treatments2
Reps 5
Treatment Width Entire Field
Previous Crop Corn, Soybeans
Row Spacing30 in.


OSU Extension
Champaign County
CropX soil moisture sensors were installed in 5 fields of 3 different farms around Champaign County. Producers managing fields 1 and 2 had access to the real-time soil moisture data to determine when to run the center pivots. Managers of fields 3-5 did not and managed as they had in past years.
”I think the technology could help conserve water resources by preventing over watering. It could also be used in a controlled study to really determine how much water is required for optimum yield.”Field 3 Grower.
“We use the virtual optimizer and the soil moisture probes to keep ourselves apprised of oncoming soil moisture deficiencies on our irrigated acres. We have found that with watching the soil moisture probes we can be more proactive with starting our systems ahead of the drought rather than waiting until it is too late and it helps us also know when we have the soil saturated enough to shut the systems down. It is especially useful in the situation where we have a towable pivot that we are moving to multiple locations so that we can plan a few days ahead and keep up with the hot dry weather. We have found the data that the website provides to be very helpful in managing our irrigated acres.” Todd McGuire, McGuire Ag (Fields 1&2).
• Producers with access to real-time data on soil moisture were able to stay within the recommended soil moisture ranges. Those without access dropped into the “refill” or critically low area more often.
• This may result in yield loss but the feasibility and expense of this study did not allow the comparison of different management strategies within a field to determine yield difference.


CropX Weather Station
The CropX field stations combine real-time measurements of soil moisture with rainfall data at a filed level basis. In combination with their data visualization tools, these stations can inform precision irrigation decisions.
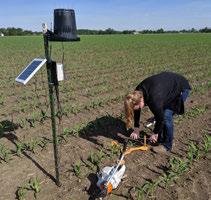
For inquiries about this project, contact Amanda Douridas (douridas.9@osu.edu).
To understand how soil moisture information can be used for scheduling pivot irrigation.
Planting Date 5/28/2020
Harvest Date 11/27/2020
Variety Agrigold 641-54
Population 33,000 sds/ac
Acres 125
Treatments2
Reps 1
Treatment Width 40 ft.
TillageConventional
Management Fertilizer, Fungicide, Herbicide
Previous Crop Soybeans
Row Spacing30 in.
Soil Type Lippincott Silty Clay Loam, 98%


Champaign County
This study was conducted in a field with a center pivot and corn grown in 2020. A soil moisture probe connected wirelessly to the internet was installed just after planting. The probe included a total of 9 sensor spaced 4 inches apart measuring soil moisture, temperature and salinity at each location. Daily data and graphs could be viewed using a mobile application that was used to monitor soil moisture within the soil profile plus schedule irrigation events. Yield monitor data was used to estimate final corn yield around each probe and compare irrigated and non-irrigated yields.

Harvest was done with modern combines with yield monitoring technology.
The virtual optimizer program through CropX provided real-time feed back on soil moisture. This allowed the producer to determine when to run the irrigation system. The graph will show upward spikes when the irrigation was turned on and downward steps as moisture is removed from the soil. The green area represents the optimal moisture range and the red is the critical moisture level indicating that water is needed.
• 2020 was a challenging growing season in Southern Ohio with a wet spring and dry summer. Producers used the moisture probe to schedule irrigation timing based on when the soil moisture was approaching the critical level.
CropX Virtual Optimizer App
The CropX app can help figure out exactly how much to irrigate the field, by providing an irrigation prescription that is constantly adapting to the changing conditions of the field.

For inquiries about this project, contact Will Hamman (hamman.41@osu.edu).
To understand how soil moisture information can be used for scheduling pivot irrigation.
Planting Date 5/6/2020
Harvest Date 10/25/2020
VarietySeed Consultants 1139AM
Population 33,000 sds/ac
Acres 250
Treatments2
Reps 1
Treatment Width 40 ft.
TillageConventional
Management Fertilizer, Fungicide, Herbicide
Previous CropCorn
Row Spacing30 in.
Soil Type Gessie Silt Loam, 61%
Stonelink Fine Sandy Loam, 36%
This study was conducted in a field with a center pivot and corn grown in 2020. A soil moisture probe connected wirelessly to the internet was installed just after planting. The probe included a total of 9 sensor spaced 4 inches apart measuring soil moisture, temperature and salinity at each location. Daily data and graphs could be viewed using a mobile application that was used to monitor soil moisture within the soil profile plus schedule irrigation events. Yield monitor data was used to estimate final corn yield around each probe and compare irrigated and non-irrigated yields.


OSU Extension
Ross County

Weather stations with soil probes were used to collect data for use with scheduling pivot irrigation.
The virtual optimizer program through CropX provided real-time feed back on soil moisture. This allowed the producer to determine when to run the irrigation system. The graph will show upward spikes when the irrigation was turned on and downward steps as moisture is removed from the soil. The green area represents the optimal moisture range and the red is the critical moisture level indicating that water is needed.
• 2020 was a challenging growing season in Southern Ohio with a wet spring and dry summer. Producers used the moisture probe to schedule irrigation timing based on when the soil moisture was approaching the critical level.
Each sensor collects moisture, temperature and electrical conductivity (EC) at multiple depths. All of the data is geo-tagged based on GPS coordinates creating geospatial time series for all measured data.

For inquiries about this project, contact Will Hamman (hamman.41@osu.edu).
To understand how soil moisture information can be used for scheduling pivot irrigation.
Planting Date 5/27/2020
Harvest Date 11/10/2020
Variety P1197AM
Population 34,200 sds/ac
Acres300
Treatments2
Reps 1
Treatment Width 40 ft.
TillageConventional
Management Fertilizer, Fungicide, Herbicide
Previous CropCorn
Row Spacing30 in.
Soil Type Huntington Silt Loam, 76%
Stonelick Loam, 18%
This study was conducted in a field with a center pivot and corn grown in 2020. A soil moisture probe connected wirelessly to the internet was installed just after planting. The probe included a total of 9 sensor spaced 4 inches apart measuring soil moisture, temperature and salinity at each location. Daily data and graphs could be viewed using a mobile application that was used to monitor soil moisture within the soil profile plus schedule irrigation events. Yield monitor data was used to estimate final corn yield around each probe and compare irrigated and non-irrigated yields.


OSU Extension
Pike County

Early fall image of corn under pivot illustrating differences in maturity between irrigated and non-irrigated areas.
The virtual optimizer program through CropX provided real-time feed back on soil moisture. This allowed the producer to determine when to run the irrigation system. The graph will show upward spikes when the irrigation was turned on and downward steps as moisture is removed from the soil. The green area represents the optimal moisture range and the red is the critical moisture level indicating that water is needed.
• 2020 was a challenging growing season in Southern Ohio with a wet spring and dry summer. Producers used the moisture probe to schedule irrigation timing based on when the soil moisture was approaching the critical level.
AgSense App
The AgSense app allows you to control and monitor your irrigation pivots. Users can log in to view real-time data and send commands to their pivots.

For inquiries about this project, contact Will Hamman (hamman.41@osu.edu).
To understand how soil moisture information can be used for scheduling pivot irrigation.
Planting Date 5/15/2020
Harvest Date 10/24/2020
Variety P1380
Population 33,800 sds/ac
Acres 350
Treatments2
Reps 1
Treatment Width 40 ft.
TillageConventional
Management Fertilizer, Fungicide, Herbicide, Insecticide
Previous CropCorn
Row Spacing30 in.
Soil Type Huntington Silt Loam, 89%
This study was conducted in a field with a center pivot and corn grown in 2020. A soil moisture probe connected wirelessly to the internet was installed just after planting. The probe included a total of 9 sensor spaced 4 inches apart measuring soil moisture, temperature and salinity at each location. Daily data and graphs could be viewed using a mobile application that was used to monitor soil moisture within the soil profile plus schedule irrigation events. Yield monitor data was used to estimate final corn yield around each probe and compare irrigated and non-irrigated yields.


OSU Extension
Pike County

Utilizing soil moisture sensors enabled producers to schedule irrigation timing based on when the soil moisture was approaching the critical level.
The virtual optimizer program through CropX provided real-time feed back on soil moisture. This allowed the producer to determine when to run the irrigation system. The graph will show upward spikes when the irrigation was turned on and downward steps as moisture is removed from the soil. The green area represents the optimal moisture range and the red is the critical moisture level indicating that water is needed.
• 2020 was a challenging growing season in Southern Ohio with a wet spring and dry summer. Producers used the moisture probe to schedule irrigation timing based on when the soil moisture was approaching the critical level.
CropX uses various weather data services to obtain precise and relevant weather information. Weather information includes air temperature, humidity, wind speed, evapotranspiration (ET), precipitation, min and max temperatures and more. One-week forecasts are presented and all data can be exported.

For inquiries about this project, contact Will Hamman (hamman.41@osu.edu).
Determine the effect of different starter packages on yield, profitability, and potential P removal from soil with Zypro additive.
Planting Date 4/27/2020
Harvest Date 10/30/2020
Variety Dekalb 61-42
Population 33,000 sds/ac
Acres20
Treatments 4
Reps3
Treatment Width 40 ft.
TillageConventional
Management Fertilizer, Herbicide
Previous Crop Soybeans
Row Spacing30 in.
Soil Type Granby Loamy Fine Sand, 56% Tedrow Fine Sand, 32%


OSU Extension
Lucas County
This study was designed using a randomized complete block with 3 replications. Plot width was 40 ft and plot length was 1,280 feet. Treatments were planter applied 2x2. A calibrated weigh wagon was used to collect yield data, soil tests were analyzed using Melich 3.

On 06/09/2020 during a visit to the plot, the reps with Starter + Nutrasyst visually looked better in terms of plant color and plant height, this happened to be during a time of dry weather.

• The treatment containing Starter & Nutrasyst was the highest yielding treatment.
• The treatment of 28% & Zypro had the lowest significant yield. This data suggests Zypro did not improve nutrient uptake of phosphorus in the plant for this treatment.
• There was no significant difference between the Starter treatment and the 28% treatment, yet they were significantly lower than the Starter + Nutrasyst treatment.
Treatment Means with the same letter are not significantly different according to Fisher’s Protected Least Significant Differences (LSD) test at alpha = 0.1.
Zypro and Nutrasyst
Zypro is a biological product designed to optimize soil microbial community and boost nutrient uptake. Nutrasyst is a blend of organic acids designed to improve fertilizer efficiency by increasing plant uptake.

For inquiries about this project, contact Jordan Beck (beck.320@osu.edu).
Determine corn response and yield differences to starter fertilizer treatments containing ortho- and polyphosphate in addition to treatments containing micronutrient fertilizer.
Planting Date 5/13/2020
Harvest Date 11/15/2020
Variety P0720AM
Population 32,000 sds/ac
Acres 27
Treatments 5
Reps3
Treatment Width 40 ft.
Tillage No-Till
Management Fertilizer, Herbicide, Insecticide
Previous CropRye
Row Spacing30 in.
Soil Type Wadsworth Silt Loam, 44% Rittman Silt Loam, 20% Ravenna Silt Loam, 17%
Four different starter fertilizers treatments were applied to corn as a pop-up application at planting time in a no-till field with cereal rye as a pervious cover crop. This study was a non-randomized controlled field study replicated three times. Treatments were all the same except in the final replication where treatment five (10-43-0 (3gal/ac) + Versa MaxEDTA micropak (2qt)) was not included. All treatments received the same fertilizer, herbicide, and insecticide treatments. Soil test values were P 36ppm, and K 85ppm (Mehlich III). Treatments were applied using a JD 1770NT with Precision Planting vApplyHD modules.


OSU Extension
Portage County


Corn plot after pollination.
No visual differences were observed post planting V4, V8, and at R1. Treatment five was omitted in replicate three due to little product in the tank. Since this study was a non-randomized controlled field study there is probability of biased results. However, when treatment mean yields were analyzed they were not significantly different from each other. Grain test weight and moisture was also not significantly different from each other for each treatment.
• No statistical yield differences were observed for any of the five treatments across each rep.
• There were also no statistical differences across each rep for test weight and moisture.

(3 gal/ac)+VersaMax
Treatment Means with the same letter are not significantly different according to Fisher’s Protected Least Significant Differences (LSD) test at alpha = 0.1.
Precision Planting vApplyHD modules
These modules control the amount of fertilizer applied to each row. Traditional liquid application systems typically used today are much more variable in the amount of fertilizer applied in each row.
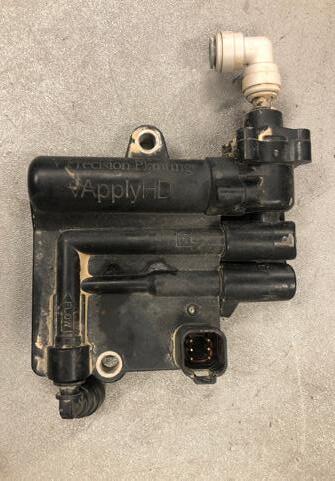
For inquiries about this project, contact Angie Arnold (arnold.1143@osu.edu).
To investigate the yield impacts of fallow syndrome and efficacy of potential remediation options.
Planting Date 5/13/2020
Harvest Date 11/2/2020
Variety Stine 9654-0
Population 35,000 sds/ac
Acres 21
Treatments 4
Reps 4
Treatment Width30 ft.
TillageConventional
Management Fertilizer, Fungicide, Herbicide
Previous CropFallow
Row Spacing30 in.
Soil Type Hoytville Silty Clay Loam, 57% Haskins Loam, 27% Mermill Loam, 11%
Wet weather conditions last spring prevented Ohio farmers from planting over 1.5 million acres. When fields are left unplanted or fallow, there may be a decline in beneficial mycorrhizal fungi, which is commonly referred to as fallow syndrome. This study was conducted in a field that was left fallow in 2019 and planted to corn in 2020. A complete block design was used in this study. The four treatments were starter phosphorus fertilizer (7-16-3), 3Bar Bio-YIELD® microbial inoculant, Valent MycoApply® EndoPrime® SC mycorrhizal inoculant, and a control with no phosphorus applied.


OSU Extension
Henry County

Drought conditions occurred later in the growing season, limiting yields.
OBSERVATIONS
Heavy rainfall following planting reduced emergence and caused plant growth stage differences across all treatments. Drought conditions occurred later in the growing season, limiting yield. Soil testing at planting showed a P Soil Test Value of 26 ppm in control plots where no phosphorus was applied. This is above the TriState Fertility Guidelines critical level of 20 ppm.

• No statistical difference in yield was observed between control treatment with no phosphorus applied, starter phosphorus treatment, and 3Bar Bio-YIELD®
• A statistical yield difference was observed between Valent MycoApply® EndoPrime® SC Mycorrhizal Inoculant and all other treatments.
Treatment Means with the same letter are not significantly different according to Fisher’s Protected Least Significant Differences (LSD) test at alpha = 0.1.
3Bar Bio-YIELD® microbial inoculant containing Pseudomonas brassicacearum and Valent MycoApply® EndoPrime® SC mycorrhizal inoculant containing four unique species of mycorrhizae.

3.29
1.58%
For inquiries about this project, contact Clint Schroeder (schroeder.307@osu.edu) or Stephanie Karhoff (karhoff.41@osu.edu).
Investigate the use of tracks vs tires for all passes throughout the growing season.
Planting Date 6/2/2020
Harvest Date 11/3/2020
Variety USA1093GT
Population 32,205 sds/ac
Acres 101
Treatments2
Reps 8
Treatment Width 120 ft.
TillageMinimal
Management Fertilizer, Fungicide, Herbicide, Insecticide
Previous Crop Soybeans
Row Spacing30 in.
Soil Type Crosby-Lewisburg Silt Loam, 58% Kokomo Silty Clay Loam, 38%
The use of tires versus tracks has been a long standing question and what piece of equipment to place tracks on first. The following operations have tracks versus tires: planter, planter tractor, sprayer, sidedress, grain cart, grain cart tractor, combine, fall tillage. This was laid out in a random block design trial of 120’ strips to best fit the equipment . This is the first year of a 5 year study. A fall tillage reset is planned for 2020 and then all operations will be either tracked or tired machines respectively in those replications.


Growing Season Weather Summary

Harvesting the tires versus tracks trial.
The planting conditions in this field were close to ideal. It was noted that more soil disturbance occurred from the tires compared to the tracks over the planter pinch rows. The tracks on the sprayer did not cause as much burming on the crop ends as expected. There were no visual differences observed druing the growing season and crop color remained consistent.

Treatments
• As with many compaction studies, it takes several years for the soil structure to change and see significant results.
• Due to the dry and ideal planting conditions, it is not surprising that the tires yielded better. This occurred in other studies as well. The seed to soil contact is increased because of the soil displacement from the tires.
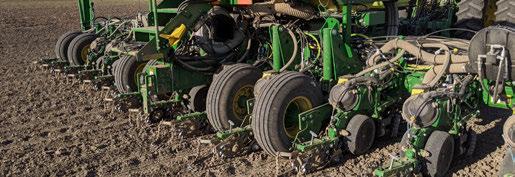
Treatment Means with the same letter are not significantly different according to Fisher’s Protected Least Significant Differences (LSD) test at alpha = 0.1.
A critical component to this study is the R4030 sprayer track conversion kit. This is a kit that will mount directly to the sprayer without any modifications to the factory unit. With the addition of these tracks, it opens up the window of opportunity for field operations in less than optimal conditions.

For inquiries about this project, contact Andrew Klopfenstein (klopfenstein.34@osu.edu) or Ryan Tietje (tietje.4@osu.edu).
Investigate the agronomic benefits of distributing weight from the center section of a planter to the wings.
Planting Date 6/9/2020
Harvest Date 11/14/2020
Variety 5829RR
Population 34,000 sds/ac
Acres 50
Treatments 4 Reps 4
Treatment Width 60 ft.
Tillage No-Till
Management Fertilizer, Fungicide, Herbicide, Insecticide
Previous Crop Soybeans
Row Spacing30 in.
Soil Type Gessie Silt Loam, 77% Ross Silt Loam, 23%
This study used a 2150 24-row 30 inch Case IH Early Riser planter equipped with wing downforce. Four treatments ranging from 0-600 lbs were replicated four times using a Case IH 500 CVX Rowtrac Steiger. Additional water in a fertilizer tank was used to make sure the weight was consistent between treatments and simulate a loaded planter. Hydraulic downforce was set to heavy auto for the duration of this study.


Hydraulic cylinders were added to the planter to help transfer the weight from the center section of the planter to the wings, redistributing the weight more evenly across the entire bar.
The normal planting date would be at the end of April, but was delayed due to a wet spring. The levy in the field also broke, further delaying planting. However, planting conditions were optimal with a planting depth of 2.25 inches at a speed of 9.5 mph. It was observed that 500 lbs did the best job keeping the planter frame level. The lack of rain during the growing season was the limiting factor to yield potential.

• Statistical significance was found between no weight and 500 lbs of wing downforce.
• Statistical significance was found between 300 and 600 lbs of wing downforce.
• Statistical significance was found between 500 and 600 lbs of wing downforce.
• Based off results and observations, 500 lbs of wing downforce are recommended for planting.

Treatment Means with the same letter are not significantly different according to Fisher’s Protected Least Significant Differences (LSD) test at alpha = 0.1.
The Miller Nitro with 72 inches of ground clearance allows growers to apply fungicide, nitrogen and covercrops to the corn crop late in the growing season.

For inquiries about this project, contact Andrew Klopfenstein (klopfenstein.34@osu.edu) or Ryan Tietje (tietje.4@osu.edu).
Understand the yield impact of varying soybean seeding rate within Ohio considering in-field variability and cultural practices implemented. Information from these trials are being used to improve management recommendations for growers throughout Ohio and help understand how variable-rate seeding may impact field by field profitability.
The primary recommendations for seeding rates in Ohio are determined by target final stands and average soil productivity. Variable rate seeding prescriptions have the potential to better match seeding rate to productivity zones in an effort to optimize profits. Field studies were implemented in a strip-trial format and replicated at least three times within fields. Results for individual sites plus aggregated pooled analyses were conducted.
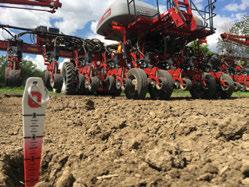

Sound information and data to improve decision-making for corn variety selection, target seeding rate, and final population.
• Across all sites, the average corn stand was 93% of the target rate with individual sites ranging between 79% and 99%.
• Variation in corn yield was primarily caused by differences in location and not differences in seeding rate in 2020.
• There was a significant response to corn seeding rate at 3 out 4 sites in 2020.

• Corn yield varied significantly across Ohio driven mainly by rainfall variability and hot temperatures in July and August.
• The economic optimum seeding rate had slight variations based on corn yield levels for different areas of Ohio. Areas receiving adequate rainfall had above average yields, resulting in an economic optimum between 33,000 and 36,000 seeds per acre.


Scan here for a video about one of the corn seeding rate trials!
Planting Date 5/3/2020
Harvest Date 10/24/2020
Variety J10 91
Population See Treatments
Acres 21
Treatments 5
Reps3
Treatment Width30 ft.
Tillage Minimum Till
Management Fertilizer, Herbicide
Previous CropCorn
Row Spacing30 in.
Soil Type Gilford Fine Sandy Loam, 46% Ottokee
Fine Sand, 33% Tedrow
Loamy Fine Sand, 19%
For inquiries about this project, contact Eric Richer (richer.5@osu.edu).

OSU Extension
Fulton County
Planting Date 5/2/2020
Harvest Date 10/27/2020
Variety Ebberts 9121
Population See Treatments
Acres 48 Treatments 6 Reps3
Treatment Width 40 ft.
TillageConventional
Management Fungicide, Herbicide, Insecticide
Previous CropCorn Row Spacing30 in.
Soil Type Eldean Loam, 35% Eldean-Casco Gravelley Loam, 23% Westland Silty Clay Loam, 19%
For inquiries about this project, contact Amanda Bennett (bennett.709@osu.edu).


Planting Date 5/2/2020
Harvest Date 10/27/2020
Variety Ebberts 9121
Population See Treatments
Acres 43
Treatments 6
Reps3
Treatment Width 40 ft.
TillageConventional
Management Fungicide, Herbicide, Insecticide
Previous CropCorn
Row Spacing30 in.
Soil Type Eldean Loam, 83% Warsaw Silt Loam, 12%
For inquiries about this project, contact Amanda Bennett (bennett.709@osu.edu).

OSU Extension
Miami County B
Planting Date 5/7/2020
Harvest Date 10/1/2020
Variety Channel 210-95 STX
Population See Treatments
Acres 25
Treatments 5
Reps 4
Treatment Width30 ft.
Tillage No-Till
Management Fertilizer, Herbicide
Previous Crop Soybeans
Row Spacing30 in.
Soil Type Chili Silt Loam, 63% Conotton Gravelly Loam, 37%
For inquiries about this project, contact Chris Zoller (zoller.1@osu.edu).


For 2020, eFields soybean research was focused on improving the production and profitability of soybeans in the greater Ohio area. Some exciting and innovating projects were executed this year, with 35 studies being conducted across the state. 2020 soybean research presented in eFields covers both precision seeding and compaction management. Below are highlights of the 2020 eFields soybean research:
35 soybean studies 1,767 acres
For more soybean research from Ohio State University Extension, explore the following resources:
The purpose of the Ohio Soybean Performance Trials is to evaluate soybean varieties for yield and other agronomic characteristics. This evaluation gives soybean producers comparative information for selecting the best varieties for their unique production systems. For more information visit: go.osu.edu/OhioSoybean.
The Agronomic Crops Team performs interesting research studies on a yearly basis. Resources, fact sheets, and articles on soybean research can be found here on the Agronomic Crops Team website: go.osu.edu/CropsTeamSoybean.
The Ohio State Digital Ag Program conducts studies related to all aspects of the soybean production cycle. Research related to soybean planting, inputs, and harvesting technology can be found on the Digital Ag website: digitalag.osu.edu.


For all soybean studies in this eFields report, we define soybean growth stages as the following:
VE - Emergence - Cotyledons appear above the soil surface and provide nutrients for 7 to 10 days.
VC - Cotyledons have fully expanded and unifoliate leaves have unfolded.
V1 - First Trifoliate: Second true node, first node at which a trifoliate leaf is produced. Nodules visible.
V2 - Two fully developed trifoliates unfolded. The plant is roughly 8 in. tall. Nodules are actively fixing nitrogen. Cotyledons have fallen off plant.
V3 - V4 - A dramatic increase in the number of nodules visible on roots takes place by these stages.
V5 - VN - Lateral roots extend 15 in. away from main stem and grow to the center of 30 in. rows. Branches begin developing on the lowest nodes. Total number of nodes the plant may produce is set at V5.
R1 - Beginning Bloom - one flower is open at any node on the main stem.
R2 - Full Bloom - An open flower at one of the two uppermost nodes of the main stem with a fully developed leaf.
R3 - Beginning Pod - Pods are 3/16 in. long at one of the four uppermost nodes on the main stem.
R4 - Full Pod - Pod is 3/4 in. long at one of the four uppermost nodes on the main stem. This the most critical period for seed yield.
R5 - Beginning Seed - Seed in one of the four uppermost nodes with fully developed leaves is 1/8 in. long.
R6 - Full Seed - Pod containing a green seed filling the pod cavity is present at one of the top four nodes.
R7 - Beginning Maturity - One normal pod on the main stem has reached its mature pod color
R8 - Full Maturity - Ninety-five percent of the pods on the plant have reached their mature color Approximately 5 to 10 days of good drying weather is needed to bring crop to less than 15% moisture. Image Source: University of Illinois Agronomy Guide, 1999.

To evaluate the effectiveness of nutrient enhancement products applied prior to planting.
Planting Date 5/27/2020
Harvest Date 10/10/2020
Variety SC8279X
Population 145,000 sds/ac
Acres 10
Treatments3
Reps 4
Treatment Width 60 ft.
TillageVertical
Management Fertilizer, Herbicide
Previous CropCorn
Row Spacing 15 in.
Soil Type Bennington Silt Loam, 70% Pewamo Silty Clay Loam, 20%


OSU Extension
Knox County
This study was designed as a randomized complete block study. Each plot was 60 feet wide and encompassed the full length of the field. Nutrisync was applied at 2 rates – 1 quart/acre and 2 quarts/acre. Each treatment was replicated 4 times. A calibrated yield monitor was used to collect yield data.

No visual differences were observed in this plot throughout the goriwng season.
OBSERVATIONS
There were no visual differences in this plot throughout the growing season. 2020 was a good growing season for soybeans. The plot received adequate rainfall throughout the season.

• The average yield of the 4 replications at the 1-quart rate in this study was 70 bu/ac.
• The average yield of the 4 replications at the 2-quart rate was 69 bu/ac.
• The average yield of the 4 no treatment (Control) replications was 69 bu/ac.
• The treatment cost plus an application charge resulted in a reduction in net return of $8.00 per acre at the 1 qt. rate and a $21.87 reduction at the 2 qt. rate.
Treatment Means with the same letter are not significantly different according to Fisher’s Protected Least Significant Differences (LSD) test at alpha = 0.1.
NutriSync Complete
A fully formulated foliar nutrition tool with “proprietary nutrient transport technology” that contains key plant major and micronutrients. Helps growers load, haul and deliver nutrients critical for growth and development to areas that are most needed - providing better utilization of nutrients to fulfill plant demands.

For inquiries about this project, contact John Barker (barker.41@osu.edu).
Determine the effect of an insecticide plus fungicide applied at R3 on soybean yield.
Planting Date 5/7/2020
Harvest Date 11/7/2020
Variety BA Genetics BA36EN0
Population 148,182 sds/ac
Acres 4
Treatments2
Reps3
Treatment Width90 ft.
Tillage No-Till
Management Fungicide, Herbicide, Insecticide
Previous CropFallow
Row Spacing 7.5 in.
Soil Type Blount Silt Loam, 56%
Digby Loam, 25%
Glynwood Clay Loam, 11%
A randomized complete block design having 3 replications was used for this trial. Soybeans were planted on May 7, 2020. Treatment plot size was 90 feet wide by 360 feet in length. On July 29, 2020, Gold Rush at 8.13 fluid ounces/A, a fungicide plus Lambda at 2.48 fluid ounces/A, an insecticide was applied to R3 soybean. Only 80 feet of the 90 feet was harvested.


Growing Season Weather Summary

Soybeans were in good condition through the time of the fungicide application.
There was no foliar diseases at the time of application or before leaf drop. The soybeans were in good condition through the time of the fungicide application, but moisture stress was apparent in some of the plots which may have caused the large amount of variability in the trial.

• The difference in yield was not significant.
• The additional cost of the fungicide application would not be offset.
Treatment Means with the same letter are not significantly different according to Fisher’s Protected Least Significant Differences (LSD) test at alpha = 0.1.
Modern Sprayer
Today’s sprayers allow for very accurate applications including turning individual nozzles on and off based upon previously sprayed areas.

For inquiries about this project, contact Jeff Stachler (jeff.stachler@ndsu.edu) or Brigitte Moneymaker (moneymaker.4@ osu.edu).
Measure soybean yields to show impacts of fungicide and insecticide treatments.
Planting Date 4/27/2020
Harvest Date 9/19/2020
Variety 3082FP
Population 160,000 sds/ac
Acres 65
Treatments3
Reps3
Treatment Width30 ft.
Tillage No-Till
Management Fungicide, Herbicide, Insecticide
Previous CropCorn
Row Spacing 15 in.
Soil Type Crosby Silt Loam, 64%
Celina Silt Loam, 19% Brookston Silty Clay Loam, 18%
This study was organized as a randomized complete block with three replications. Treatment widths were 90 feet at field length. Combine yield monitor was used for measurement of yields and it was calibrated in season. Three treatments were made. The control was no treatment, fungicide only was 8 oz. of Delaro, and the fungicide and insecticide was 1.5 oz of Warrior 2 and 8 oz of Delaro.


OSU Extension
Darke County

Insect damage during the growing season.
Darke County had significant frogeye pressure in 2020. The application of the fungicide gave a positive visual results as it appeared to slow the expansion of the pressure. There was no visible difference in th pesticide treatments. Darke County received adequate to above adequate rainfall during the growing season. July was very wet.
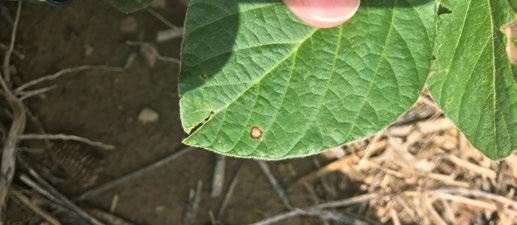
• The fungicide and fungicide/insecticides treatments showed a statistical yield and economic return on investment in this scenario.
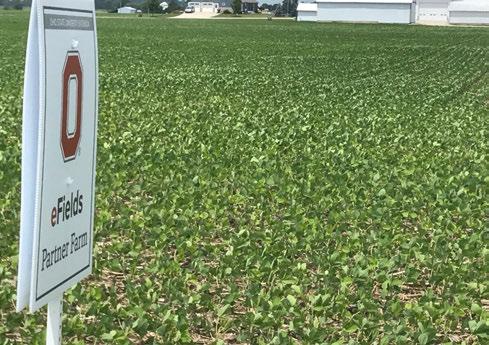
Treatment Means with the same letter are not significantly different according to Fisher’s Protected Least Significant Differences (LSD) test at alpha = 0.1.
A drone was used for scouting in-season to determine crop stress across treatments, providing a quick and easy way to check fields.
For inquiries about this project, contact Sam Custer (custer.2@osu.edu).
Determine soybean yield response to foliar fungicide

Planting Date 6/2/2020
Harvest Date 11/5/2020
Variety GL3500
Population 165,000 sds/ac
Acres 115
Treatments3
Reps 4
Treatment Width 120 ft.
TillageVertical
Management Fertilizer, Fungicide, Herbicide
Previous CropCorn
Row Spacing 15 in.
Soil Type Blount Silt Loam, 62% Pewamo Silty Clay Loam, 22% Glynwood Silt Loam, 13%
Two fungicide strips and a check strip were randomized and replicated four times across the field. Soybeans were sprayed at late R3 stage. Sprayer strips were 120 feet wide and center 40 feet of each strip was harvested for yield data.

Extension Union County

This field continued to look good and stay clean through harvest.
Sporatic frog eye lesions were noted prior to fungicide application on August 7th. The field had low weed pressure and looked good at the late R3 stage. Later visits noted low frog eye lesions in all plots of the study until just prior to R7. Weather conditions were somewhat dry during this period which may have contributed to the lack of spread.
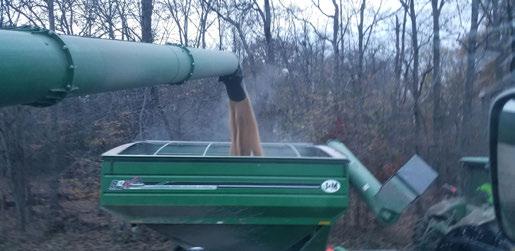
• There was no statistical difference between the two fungicide products when measured by yield.
• A significant yield difference was achieved when comparing fungicide treatments to non-fungicide treatment even though observed presence of disease pressure was low.

Treatment Means with the same letter are not significantly different according to Fisher’s Protected Least Significant Differences (LSD) test at alpha = 0.1.
The Case IH Patriot 3330 with 120’ boom has the cab in the front and the engine in the rear for even weight distribution. Also uses the AIM Command spray systems that are designed to maintain both a constant rate and constant pressure under a range of speeds and conditions.

For inquiries about this project, contact Wayne Dellinger (dellinger.6@osu.edu).
Study individual row downforce on soybeans and how that effects emergence as well as final yield.
Planting Date 6/11/2020
Harvest Date 10/10/2020
Variety 3555XF
Population 150,000 sds/ac
Acres 252
Treatments 5
Reps 5
Treatment Width 80 ft.
TillageConventional
Management Fungicide, Herbicide, Insecticide
Previous CropCorn
Row Spacing 15 in.
Soil Type Crosby Silt Loam, 55%
Miamian-Kendallville
Silt Loam, 26% Kokomo
Silty Clay Loam, 19%
There have often been many questions about spring vs pneumatic vs hydraulic downforce and the potential ROI on each system. Although corn continues to be the main focus across the Midwest, we wanted to see if there was a benefit to utilizing DeltaForce on soybeans as well. To test this hydraulic cylinders in a constant pressure to simulate springs set to standard settings that surveyed growers use in a light and a heavy application were used. Additionally, this planter was equipped with wing downforce to help distribute weight and keep the planter level during operation.


OSU Extension
Pickaway County
Growing Season Weather Summary

Harvesting the hydraulic downforce trial.
OBSERVATIONS
During planting, field conditions were dry and depth had to be deeper to plant in moisture. There was very little disease and weed pressure present in the crop during the growing season.

• There were no statistically significant differences between treatments.
• It was noticed during field operations that heavy auto would have performed the best for the given field operations.

Treatment Means with the same letter are not significantly different according to Fisher’s Protected Least Significant Differences (LSD) test at alpha = 0.1.
vDrive from Precision Planting
vDrive is a maintenance-free electric drive system, simplifying your planter. A vDrive motor mounts to each vSet meter and makes that row a single row planter, because that row is controlled individually.

For inquiries about this project, contact Andrew Klopfenstein (klopfenstein.34@osu.edu) or Ryan Tietje (tietje.4@osu.edu).
Determine the effect of planting date, planting population, and fungicide plus insecticide application on the yield of soybean.
Planting Date 5/7/2020 & 6/2/2020
Harvest Date 11/7/2020
Variety BA Genetics BA36EN0
Population See Treatments
Acres 5
Treatments2
Reps3
Treatment Width90 ft.
Tillage No-Till
Management Fungicide, Herbicide, Insecticide
Previous CropFallow
Row Spacing 7.5 in.
Soil Type Blount Silt Loam, 53% Glynwood Silt Loam, 24% Pewamo Silty Clay Loam, 19%
A strip trial design having three replications was used. Treatment plot width was 90 feet, but harvest width was 80 feet. Plot length was 404 feet. There are two treatments in the trial, an Improved System and a Standard System. The Improved System included a May 7, 2020 planting date seeded at 130,000 seeds per acre with Gold Rush, a fungicide plus Lambda, an insecticide applied on July 29, 2020. The Standard System included a June 2, 2020 planting date seeded at 160,000 seeds per acre with no fungicide plus insecticide application. A John Deere 30 foot air seeder was used to plant the soybean. Herbicides were applied as needed.


OSU Extension

This study had two planting dates, one in early May and the second one in early June.
The soybean in the Improved System were taller than the soybean in the Standard System. There was no obvious disease symptoms in the trial before or after the fungicide application.
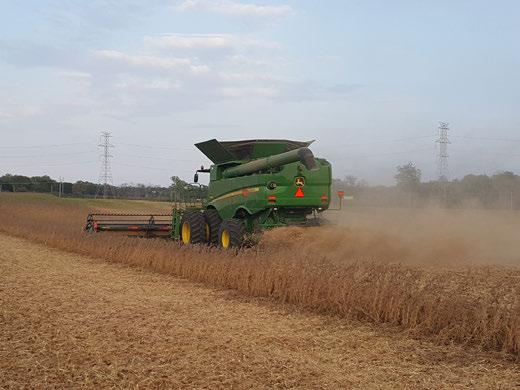
• The improved soybean system yielded more and had a higher return than the Standard System.
• Therefore early planting along with a fungicide plus insecticide application can improve soybean yield.
• When planting early, soybean populations can be decreased drastically compared to the past.
Treatment Means with the same letter are not significantly different according to Fisher’s Protected Least Significant Differences (LSD) test at alpha = 0.1.
John Deere Air Seeder
Adjusting the seeding rate of an air seeder at any time is easily accomplished with adjustments made in the cab.

3.54
2.46%
For inquiries about this project, contact Jeff Stachler (jeff.stachler@ndsu.edu) or Brigitte Moneymaker (moneymaker.4@osu.edu).
Evaluate a standard soybean production system compared to an enhanced soybean production system.
Planting Date 6/3/2020 & 5/13/2020
Harvest Date 11/3/2020
Variety P31A22X
Population See Treatments
Acres220
Treatments2
Reps3
Treatment Width 80 ft.
Tillage No-Till
Management Fungicide, Herbicide
Previous CropCorn
Row Spacing 15 in.
Soil Type Kokomo Silty Clay Loam, 42% Crosby Silt Loam, 26% Celina Silt Loam, 18%
This study was organized as a randomized complete block design with three replications of treatments. Treatments included:
1) Standard production system
a. Soybeans planted in mid-to late May
b. Seeding rate of 160,000 seeds/acre
2) Enhanced production system
a. Soybeans planted in late April to mid-May
b. Seeding rate of 130,000 seeds/acre
c. Foliar fungicide and insecticide application at the R3 growth stage


OSU Extension
Clark County
Growing Season Weather Summary

Disease and insect pressure were minimal. The spring growing season was wetter than normal, followed by a long period of drier than normal months. Some drought stress was observed due to very few rain events during July, August, and September.

• This study compared a standard soybean production system with an enhanced system.
• The enhanced system, planted at 125,000 seeds per acre with a foliar fungicide & an insecticide application at R3 was compared to the standard system planted 3 weeks later at 150,000 with no R3 foliar treatment.
• At harvest there was no statistical difference in yields between the systems observed this year. In 2020, the enhanced system yields observed in this trial were 3 bushels greater than the yields observed in the standard system, but the this difference was not statistically different. This could be partly attributed to low disease and insect pressure and dry weather conditions.
Treatment Means with the same letter are not significantly different according to Fisher’s Protected Least Significant Differences (LSD) test at alpha = 0.1.
Canopeo App
The Canopeo app was used to measure canopy cover to track progress in crop growth.

For inquiries about this project, contact Mary Griffith (griffith.483@osu.edu).
Evaluate a standard soybean production system compared to an enhanced soybean production system.
Planting Date 4/6/2020 & 5/14/2020
Harvest Date 10/9/2020
VarietySeed Consultants SE7280E
Population See Treatments
Acres 40
Treatments2
Reps3
Treatment Width 40 ft.
Tillage No-Till
Management Fungicide, Insecticide, Herbicide
Previous CropCorn
Row Spacing 15 in.
Soil Type Crosby-Lewisburg Silt Loam, 55% Kokomo
Silty Clay Loam, 26%
Miamian-Lewisburg Silt Loam, 19%
This study was organized as a randomized complete block design with three replications of treatments. Treatments included:
1) Standard production system
a. Soybeans planted in mid-to late May
b. Seeding rate of 150,000 seeds/acre
2) Enhanced production system
a. Soybeans planted in late April to mid-May
b. Seeding rate of 125,000 seeds/acre
c. Foliar fungicide and insecticide application at the R3 growth stage


OSU Extension Pickaway County
Growing Season Weather Summary

Soybeans were planted inoto a green cover crop of rye in early April.
The enhanced system was planted into a green cover crop of rye early in April. Emergence was very good but a hard frost occurred on May 9th and May 12th that reduced the overall stand count of the enhanced system. One month later, the standard system was planted in less than ideal conditions (wet seedbed, no till). There were some issues with trench closure, but subsequential rainfall followed planting provided for satisfactory emergence.
Summer rainfall was extremely spotty. The area of the county that this research plot was planted received less than average rainfall July-September.
• The enhanced system, planted at 125,000 seeds per acre with a foliar fungicide and an insecticide application at R3 was compared to the standard system planted 3 weeks later at 150,000 with no R3 foliar treatment.
• At harvest, there was no significant difference in yield between the two systems.

Treatment Means with the same letter are not significantly different according to Fisher’s Protected Least Significant Differences (LSD) test at alpha = 0.1.
PROVINCE®II Insecticide
Province is an insecticide that contains Lambda-cyhalothrin, for broad spectrum control of soybean insect pests.

For inquiries about this project, contact Mike Estadt (estadt.3@osu.edu).
To evaluate the effectiveness of nutrient enhancement products applied prior to planting.
Planting Date 5/27/2020
Harvest Date 10/10/2020
Variety Asgrow 30X8
Population 146,000 sds/ac
Acres3
Treatments2 Reps 4
Treatment Width 60 ft.
TillageVertical
Management Fertilizer, Herbicide
Previous CropCorn
Row Spacing 15 in.
Soil Type Bennington Silt Loam, 43% Pewamo Silty Clay Loam, 39% Centerburg Silt Loam, 18%
This study was designed as a randomized complete block study. Each plot was 60 feet wide and encompassed the full length of the field. Treatments consisted of BLACKMAX 22 at a rate of 1 gallon/acre and a second treatment with no application (control). Each treatment was replicated 4 times. A calibrated yield monitor was used to collect yield data and provide yield and grain moisture results by plot.


Image captured of the field during the growing season.
There were no visual differences in this plot throughout the growing season. 2020 was a good growing season for soybeans. The plot received adequate rainfall throughout the season.

• The yield differences were not statistically significant for this trial.
• The treatment cost plus an application charge resulted in a reduction in net return per acre.
Treatment Means with the same letter are not significantly different according to Fisher’s Protected Least Significant Differences (LSD) test at alpha = 0.1.
BLACKMAX 22
BLACKMAX 22 is marketed as “ a combination of extracted carbon and carbohydrates designed to react with your fertility program to increase nutrient availability and support positive soil attributes.”

For inquiries about this project, contact John Barker (barker.41@osu.edu).
To evaluate the effectiveness of nutrient enhancement products applied prior to planting.
Planting Date 5/7/2020
Harvest Date 9/27/2020
Variety SC8279X
Population 145,000 sds/ac
Acres 6.7
Treatments2
Reps 6
Treatment Width 60 ft.
TillageVertical
Management Fertilizer, Herbicide
Previous CropCorn
Row Spacing 15 in.
Soil Type Bennington Silt Loam, 76%
This study was designed as a randomized complete block study. Each plot was 60 feet wide and encompassed the full length of the field. Treatments consisted of BLACKMAX 22 at a rate of .5 gallon/acre (1/2 Rate) and a second treatment with no application (control). Each treatment was replicated 6 times. A calibrated yield monitor was used to collect yield data and provide yield and grain moisture results by plot.


OSU Extension County

Soybean plot during the growing season
There were no visual differences in this plot throughout the growing season. 2020 was a good growing season for soybeans. The plot received adequate rainfall throughout the season.

• The average yield of the 6 treatment replications in this study was 82 bu/ac.
• The average of the no treatment (control) replications was 74 bu/ac.
• The treatment cost plus an application charge resulted in an increase in net return of $57.83 per acre.
2.59
Treatment Means with the same letter are not significantly different according to Fisher’s Protected Least Significant Differences (LSD) test at alpha = 0.1.
Remote Sensing and Aerial Imagery
Images taken from satellites and aircraft/ drones to assess field conditions. Observing the colors of leaves or the overall appearances of plants can help determine plant health.
For inquiries about this project, contact John Barker (barker.41@osu.edu).
To understand the differences in phosphorus uptake through various fertilizer application methods, timings, and strategies for soybean production.
Planting Date 5/29/2020
Harvest Date 10/8/2020
Variety AG36X6
Population VRS 120,000-160,00 sds/ac
Acres 50
Treatments 6
Reps 4
Treatment Width 40 ft.
TillageConventional Management Fertilizer
Previous CropCorn
Row Spacing 15 in.
Soil Type Crosby-Lewisburg Silt Loam, 62% Kokomo Silty Clay Loam, 38%
This study evaluated the uptake of phosphorus in soybean from fall 2018 placed dry fertilizer in strip till at 2 year maintenance rates and 2 year maintenance plus 75 lbs. During spring of 2019, there was starter fertilizer applied with the planter providing additional treatments labeled as spring planter applied liquid at 10 GPA, 20 GPA, and a 1-year maintenance rate. In 2020, soybeans were planted in 15-inch rows in between the corn rows or offset by 5.7 inches. Stand counts and whole plant samples were collected on June 24 at the V4 growth stage. Twenty random soybean plants were collected and sent for lab analysis.


Growing Season Weather Summary
This trial represents a 2-year study where P was applied in the fall of 2018 in the form of MAP, during 2018 planting as starter fertilizer (10-34-0), or a combination. The P management strategy has been variable rate application and applying P to cover two years of the corn-soybean rotation. For the 2020 soybean crop, there were no noticeable visual differences in plant color or plant size between the treatments. A later than normal planting season was followed by a very dry growing season. Across the study site, emergence was fairly uniform for the soybeans.

0.1.
Orthman 1tRipr Row Unit
This shank-style strip-till unit has an adjustable heavy duty shank that allows for seedbed preparation. Can be equipped with dry, liquid, or anhydrous fertilizer attachments. It can also place multiple products at varying depths.
• There were no significant differences in soybean yield and grain moisture at harvest among the different treatments with an overall plot average of 47 bu/ac.
• At these soybean yields, P was not the limiting yield factor in this field for the 2020 growing season.
• There was no statistical difference in P Uptake (lb/ac), average dry matter per plant (g) or average plant moisture content at the V4 growth stage. The overall average P Uptake was 1.9 lbs/ac in this field for the 2020 growing season.

For inquiries about this project, contact Nate Douridas (douridas.2@osu.edu) or John Fulton (fulton.20@osu.edu)
Understand the benefits of using row residue managers in soybeans.

Planting Date 6/1/2020
Harvest Date 11/5/2020
Variety 4268FP
Population 130,000 sds/ac
Acres 45
Treatments2
Reps 7
Treatment Width 40 ft.
Tillage No-Till
Management Herbicide, Insecticide
Previous CropCorn
Row Spacing 15 in.
Soil Type Brookston Silty Clay Loam, 65% Crosby Silt Loam, 34%
The use of row cleaners and their benefits has been a long standing question. This study looks at the use of row cleaners in heavy no till residue conditions. This was a random block design in 40 foot strips. This plot was planted with a Case IH Magnum 380 CVT Rowtrac and a Case IH 2140 Early Riser 16/32 planter equipped with Precision Planting technology. This planter had Delta Force, CleanSweep, vSet, vDrive, and Case IH 2-stage closing system controlled from the Pro 700 display.

OSU Extension
Fayette County

Row cleaners in action in heavy corn residue.
Clean sweep was utilized to perform this study, with the row cleaners in the 40 psi up position and completely out of the ground. No-till corn stalks on the row cleaners made easy work of the soil surface, clearing a clean path for the gauge wheels. No noticeable differences were observed between treatments.

• The results did not show an advantage with the use of row cleaners, but they did help brush away some areas where flood water pushed up stalks in piles.

Treatment Means with the same letter are not significantly different according to Fisher’s Protected Least Significant Differences (LSD) test at alpha = 0.1.
Row cleaners help to remove any leftover residue, rocks, or other surface debris that could cause the gauge wheels to lose contact with the soil surface. It allows the operator to make adjustments for the variable amounts of residue from the cab as those conditions change through the field.

For inquiries about this project, contact Andrew Klopfenstein (klopfenstein.34@osu.edu) or Ryan Tietje (tietje.4@osu.edu).
Evaluate the yield as a function of 15, 20, and 30 inch soybean spacing.

Planting Date 5/27/2020
Harvest Date 10/14/2020
Variety 3546FP
Population VRS 147,000 sds/ac
Acres 136
Treatments3 Reps 8
Treatment Width 40 ft.
TillageMinimal
Management Fungicide, Herbicide, Insecticide
Previous CropCorn
Row Spacing See Treatments
Soil Type Celina Silt Loam, 81% Miamian Silt Loam, 16%
This study was planted with a pair of Case IH 380 Magnum half tracks and 2140 planters. One planter was a 15 inch and the other was a 20 inch. After the 15 inch planter was used to complete all the 15 inch treatments, then every other row was lifted to plant the 30 inch strips as well. The planter was only filled with the necessary amount of seed for each treatment to reduce weight and keep the treatments as consistent as possible between the 15 inch and 30 inch. The tractors were also weighted and equipped the same. This was setup as a random block design negating the possibility of influence from the adjacent treatments.

Extension
Franklin County
Growing Season Weather Summary

Harvesting the soybean row spacing trial.
This trial was planted into a rye cover crop and due to a wet spring, it was never sprayed. Therefore, the rye was planted green. Notice that average emergence was significantly different from planted population. The limiting factor of this study was rain during the growing season and a late planting date. While harvesting, there was a noticeable difference between treatments with the sounds and flow of the material.

• A statistically significant difference in yiels was observed between all treatments, with 15 inch beans outyielding the wider rows.
• All treatments were virtually weed free. However, this was aided by the rye cover crop.
• Although during harvest you could notice the 30 inch soybeans tried to bush out more compared to the 15 inch, this did not show up in the yield.

Treatment Means with the same letter are not significantly different according to Fisher’s Protected Least Significant Differences (LSD) test at alpha = 0.1.
A 40 ft. head was used to harvest this trial. This head has a 3 section reel as well as a 3 section frame which helps it harvest in challenging terrain. This head was also equipped with an integrated air system which is a blast of air behind the cutter bar that blows crop back into the header onto the gathering belts.

For inquiries about this project, contact Andrew Klopfenstein (klopfenstein.34@osu.edu) or Ryan Tietje (tietje.4@osu.edu).
Compare two methods of termination for cereal rye: chemical termination prior to planting and crimper termination after emergence.
Planting Date 5/7/2020
Harvest Date 10/8/2020
Variety 2559X2
Population 180,000 sds/ac
Acres 26
Treatments2
Reps 4
Treatment Width 120 ft.
Tillage No-Till
Management Herbicide
Previous CropFallow
Row Spacing 15 in.
Soil Type Nappanee Silt Loam, 52% Ziegenfuss Clay Loam, 36%


OSU Extension Fulton County
The study was designed as a randomized complete block including four replications. Plot width was 120 ft and plot length was 1,200 ft. Rye was crimped on 06/01/2020, chemical termination happened on 05/07/2020. Data was collected using a calibrated combine yield monitor.

For soybean plant population, chemical termination averaged 164,000 plants/ac while crimper termination averaged 164,000 plants/ac. In order to get a highly effective crimped mat, a higher seeding rate should be used for cereal rye, 70-100 lbs/ac.
• There was no statistical difference in yield between the two treatments or weed emergence.
• The data suggests a crimper can be utilized as a part of a comprehensive weed control and soil health strategy without a yield penalty.

Treatment Means with the same letter are not significantly different according to Fisher’s Protected Least Significant Differences (LSD) test at alpha = 0.1.
Smyth Crimper
The Smyth Crimper, designed with chevron pattern blades, was used to terminate standing rye following planting of soybeans. The crimped rye creates a weed suppressing, moisture retaining mat.

For inquiries about this project, contact Jordan Beck (beck.320@osu.edu).
Evaluate the effects of applying foliar fertilizer to soybeans.
Planting Date 6/15/2020
Harvest Date 11/6/2020
Variety EnlistOne
Population 180,000 sds/ac
Acres 8
Treatments2
Reps3
Treatment Width 66 ft.
Tillage No-Till
Management Fertilizer, Herbicide
Previous Crop Soybeans
Row Spacing 7.5 in.
Soil Type Clermont Silt Loam, 56% Westboro-Schaffer Silt Loam, 41%
This study was designed as a randomized complete block with 3 replications. The plot width was 66’ and the row length was 625ft. A foliar fertilizer (8-4-6-0.1B-0.2Cu-1Mn-1Zn) was sprayed on 07/13/20 when the soybeans were at the V5 growth stage The center 50 feet of each plot was harvested on November 6.


OSU Extension Brown County

No nutrient deficiencies were observed at the time of application and had an overall healthy appearance. No visual differences were observed between the two treatments at the time of harvest. Minimal weed, and insect pest damage was observed. However, each treatment had slight damage from scleritonia.

• The application of Finish Line Foliar product did not improve the yield in this soybean field and there were no moisture differences between the two treatments.
• The foliar fertilizer was sprayed at the same time as herbicide treatments and due to weed pressure and weather conditions, the crop field was sprayed earlier than recommended for the fertilizer application.
• As demonstrated in this study, environmental conditionals can easily effect the ability to use products as originally intended. Economically this application negatively impacted the producer’s profitability.
Treatment Means with the same letter are not significantly different according to Fisher’s Protected Least Significant Differences (LSD) test at alpha = 0.1.
Top Air 110 with 66’ booms. This sprayer was used to apply foliar fertilizer. This pull type sprayer provides the clearance and versatility necessary to apply foliar fertilizer and herbicides to the soybeans in the tall, reproductive growth stages.

For inquiries about this project, contact James Morris (morris.1677@osu.edu).
Understand the affect of starter fertilizer on soybean yield.

Planting Date 5/8/2020
Harvest Date 9/27/2020
Variety 2899X2
Population 125,000 sds/ac
Acres 7
Treatments2
Reps3
Treatment Width 40 ft.
Tillage No-Till
Management Herbicide
Previous CropFallow
Row Spacing30 in.
Soil Type Ziegenfuss Clay Loam, 55% Nappanee Silt Loam, 40%
The experiment used a randomized complete block design with three replications. Plot size was 40 ft. wide and a calibrated combine yield monitor was used to collect the data. Till-It Blue zone Ultra is a 6-24-6 fertilizer. It was applied 2x2 at 2 gallons per acre.


Harvesting soybeans on 10/08/2020 with a Case IH 7230 combine.
There were no observed differences during the growing season. During the month of July there was an extended period of hot and dry weather.
• There was no significant yield difference between the two treatments in this trial. Therefore, starter fertilizer did not provide a yield advantage.
• There was no difference in soybean moisture at harvest.

2.58
Treatment Means with the same letter are not significantly different according to Fisher’s Protected Least Significant Differences (LSD) test at alpha = 0.1.
Till-It Blue-Zone Ultra
Till-It Blue-Zone Ultra is a fertilizer designed for starter or pop-up applications. This product can be applied below, to the side or in furrow during planting.

For inquiries about this project, contact Jordan Beck (beck.320@osu.edu).
Understand the affect of starter fertilizer on soybean yield.

Planting Date 5/9/2020
Harvest Date 9/27/2020
Variety 3091X2
Population 125,000 sds/ac
Acres 6
Treatments2
Reps3
Treatment Width 40 ft.
Tillage No-Till
Management Herbicide
Previous CropFallow
Row Spacing30 in.
Soil Type Nappanee Silt Loam, 62% Ziegenfuss Clay Loam, 38%
The experiment used a randomized complete block design with three replications. Plot size was 40 ft wide and 1,000 ft long A calibrated combine yield monitor was used to collect the data. Till-It Blue-Zone Ultra is a 6-24-6 fertilizer designed for pop-up application. It was applied 2x2 at 2 gallons per acre.

Extension County

Case IH 7230 used for plot harvest.
There were no observed differences during the growing season. During the month of July there was an extended period of hot and dry weather.
• There was no significant yield difference between the two treatments, However, the starter fertilizer had a slightly higher yield.

Treatment Means with the same letter are not significantly different according to Fisher’s Protected Least Significant Differences (LSD) test at alpha = 0.1.
Case IH 1250 Planter
The Case IH 1250 planter was used for planting soybeans in 30 inch rows and applying starter fertilizer 2x2. By using the planter unit associated with this Early Riser planter you can achieve better singulation.

For inquiries about this project, contact Jordan Beck (beck.320@osu.edu).
To evaluate the effectiveness of postemergence treatments of sulfur to soybeans.
Planting Date 5/16/2020
Harvest Date 10/1/2020
Variety AGI 31MO4
Population 160,000 sds/ac
Acres 67
Treatments2
Reps 4
Treatment Width 60 ft.
TillageVertical
Management Fertilizer, Herbicide
Previous Crop Soybeans
Row Spacing20 in.
Soil Type Pewamo Silty
Clay Loam, 74%
Blount Silt Loam, 22%


OSU Extension
Delaware County
This study was designed as a randomized complete block with 4 replications. Treatments consisted of no sulfur vs Taurus at a rate of 1 qt/acre. Treatment widths were 60 feet and run the length of the field. A calibrated yield monitor was used to collect yield data and grain moisture estimates. Sulfur was applied July 1 using a high clearance sprayer with a 60 ft. boom.
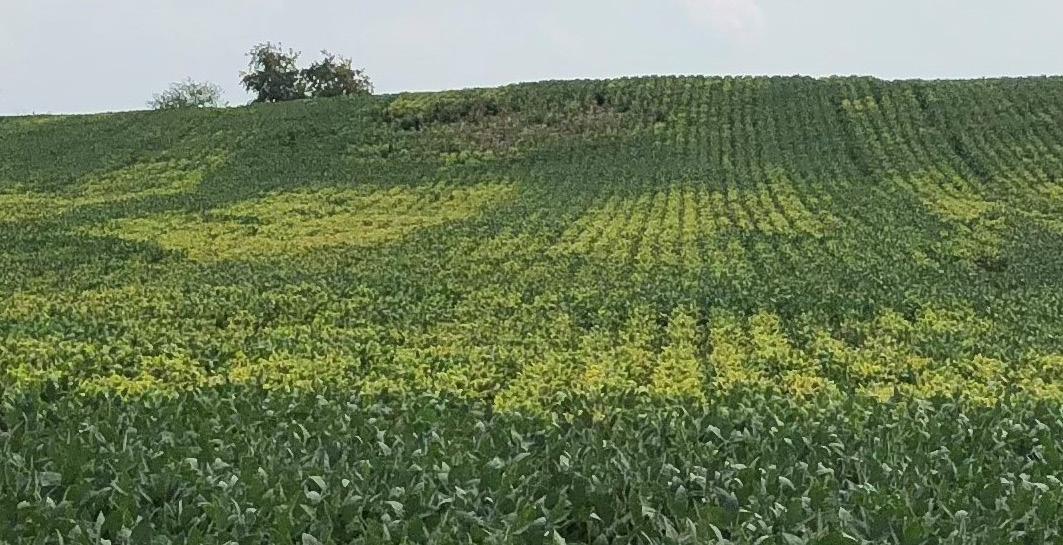
The bare spot and it’s surroundings observed during the trial.
2020 was considered a good growing season for soybeans in this area. The plots received adequate rainfall throughout the growing season. For replication 4, the sulfur strip had a bare spot. Origin of this issue was unknown but was the only bare spot in the field. No visual differences between treatments during the growing season.

• All three of the four replications receiving sulfur recorded yields higher than the control.
• The replications receiving sulfur showed a yield increase, but the results were not statistically different from the control.
• There was not a statistical difference between the no sulfur applied and the soybeans that received Taurus as a sulfur amendment.
Scan here for a video about this trial!

Treatment Means with the same letter are not significantly different according to Fisher’s Protected Least Significant Differences (LSD) test at alpha = 0.1.
Grid sampling is a technology used to systematically map a field to locate regions deficient in certain nutrients.

For inquiries about this project, contact Rob Leeds (leeds.2@osu.edu).
To evaluate the effectiveness of preemergence sulfur treatments to soybeans.
Planting Date 5/27/2020
Harvest Date 10/12/2020
Variety SC 8320X
Population 145,000 sds/ac
Acres9
Treatments2
Reps 4
Treatment Width 60 ft.
TillageVertical
Management Fertilizer, Insecticide
Previous CropCorn
Row Spacing 15 in.
Soil Type Bennington Silt Loam, 77% Pewamo Silty Clay Loam, 21%


OSU Extension
Knox County
This study was designed as a randomized complete block study. Each plot was 60 feet wide and encompassed the full length of the field. Treatments consisted of no sulfur (control) versus extract at a rate of 1 gallon/acre. A calibrated yield monitor was used to collect yield data.

Greener areas were treated with sulfur.
Throughout the year the treated areas in the field appeared “slightly” greener. 2020 was a good growing season for soybeans. The plots received adequate rainfall throughout the growing season.

• The yield average of the 4 treatment replications in this study was 70 bu/ac.
• The average of the no treatment (control) replications was 67 bu/ac.
• This resulted in a yield increase of 3.25 bushels.
• This yield increase produced an increase in net returns of $12.62 per acre.
• The application of sulfur did not result in a yield response.
• Past research shows that yield responses to sulfur applications are rare.
• Scouting for sulfur deficiencies can help determine if sulfur applications are necessary.
Treatment Means with the same letter are not significantly different according to Fisher’s Protected Least Significant Differences (LSD) test at alpha = 0.1.
Extract (6-0-0-13S) is marketed as a “biocatalyst specifically formulated to maximize nutrient release from a grower’s fertilizer investment. It is optimized to help growers easily and effectively manage nutrients tied up in the soil and in crop residue by accelerating release of existing nutrition while also increasing nutrient availability.”

For inquiries about this project, contact John Barker (barker.41@osu.edu).
To evaluate the effectiveness of preemergence treatments sulfur to soybeans.
Planting Date 5/9/2020
Harvest Date 9/26/2020
Variety SC 8279X
Population 146,000 sds/ac
Acres 6
Treatments2
Reps 4
Treatment Width 60 ft.
TillageVertical
Management Fertilizer, Herbicide
Previous CropCorn
Row Spacing 15 in.
Soil Type Bennington Silt Loam, 78% Condit Silt Loam, 13%


OSU Extension
Knox County
This study was designed as a randomized complete block study. Each plot was 60 feet wide and encompassed the full length of the field. Treatments consisted of no sulfur (control) versus extract at a rate of 1 gallon/acre. A calibrated yield monitor was used to collect yield data.

Scouting fields for diesease and pest damage.
Throughout the year the treated areas in the field appeareed “slightly” greener. 2020 was a good growing season for soybeans. The plots received adequate rainfall throughout the growing season.
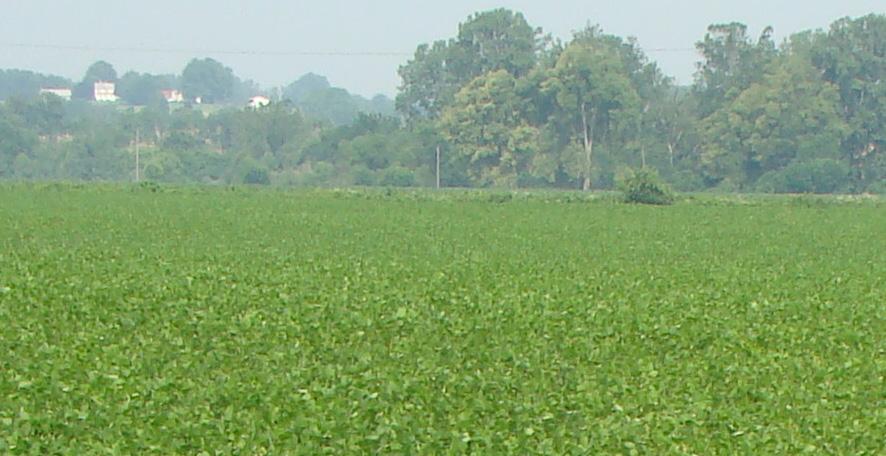
• At this location, a yield increase was observed when sulfur was applied.
• This yield increase produced an increase in net returns of $27.55 per acre.
Scan here for a video about this trial!

Treatment Means with the same letter are not significantly different according to Fisher’s Protected Least Significant Differences (LSD) test at alpha = 0.1.
DJI Inspire Drone
Aerial imagery from drones such as the DJI Inspire can help to better visualize spatial variation in crop health and can be used for targeted scouting.
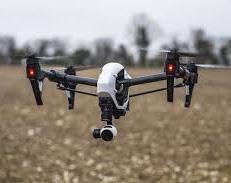
For inquiries about this project, contact John Barker (barker.41@osu.edu).
Evaluate soybean yield response to sulfur application at planting.

Planting Date 5/6/2020
Harvest Date 9/27/2020
Variety P28A42X
Population 125,000 sds/ac
Acres 16
Treatments 4
Reps3
Treatment Width30 ft.
Tillage No-Till
Management Fertilizer, Herbicide
Previous CropWheat
Row Spacing30 in.
Soil Type Hoytville Silty Clay Loam, 51% Nappanee Silty Clay Loam, 31%
St. Clair Silty Clay Loam, 13%
Completely randomized block design across field. Comparing various sources of sulfur to no sulfur application. 20 lbs of sulfur per treatment was applied for each treatment Thiosol and Potassium Thiosol were planter applied using 2x2 placement. Ammonium Sulfate was applied using a calibrated dry box spreader.

OSU Extension
Henry County

Sulfur applied at planting.
During planting one row unit on planter was not functioning properly leaving bare spots across all plots. Drought stress, disease, and insect pressure was minimal considering the dry conditions in the area. Beans matured evenly across all treatments.
• There were no statistical differences in yield across the sulfur treatments and control.
• In this particular field, sulfur is not a yield limiting nutrient for soybean production.

Treatment Means with the same letter are not significantly different according to Fisher’s Protected Least Significant Differences (LSD) test at alpha = 0.1.
2x2 fertilizer application placement was used to apply thiosol and potassium thiosol products. This places the nutrients on either side of the plant as a source throughout the growing season.

For inquiries about this project, contact Garth Ruff (ruff.72@osu.edu).
Investigate the agronomic benefits of distributing weight from the center section of a planter to the wings increasing ground countact with the gague wheels on the ends of the wings as well as help to reduce some pinch row compaction effect.
Planting Date 5/30/2020
Harvest Date 10/7/2020
Variety 3789X2
Population 150,000 sds/ac
Acres 35
Treatments 4 Reps 4
Treatment Width 40 ft.
TillageConventional
Management Fungicide, Herbicide, Insecticide
Previous CropCorn
Row Spacing 15 in.
Soil Type Crosby-Lewisburg Silt Loam, 41% Miamian
Silt Loam, 20% Sloan Silty Clay Loam, 16%
Wing downforce control systems have recently been encouraged for modern planters as a means to prevent planter wings from rising during the planting operation and reduce the weight of the center section of the planter. Potentionally, as the planter moves through the field, the wings of the planter could lift, resulting is less than optimal peformance of the outside rows. Additionally, the weight from the center section of the planter can cause pinch row compaction on the center rows decreasing yield.


OSU Extension
Madison County

Trial layout and applied dowforce map in FieldView.
OBSERVATIONS
Transferring the weight from the center of the planter to the wings kept the planter wings level during planting. An extremely uniform stand for all treatments was noticed and beans were disease free throughout the growing season.

• There were no statistically significant differences between treatments.
• For the given field conditions, 900 lbs of wing downforce kept the planter in the correct planting orientation.

Treatment Means with the same letter are not significantly different according to Fisher’s Protected Least Significant Differences (LSD) test at alpha = 0.1.
Hydraulic cylinders are added to the planter to help transfer weight from the center section of the planter to the wings, redistributing the weight more evenly across the entire bar. This can lead to more even emergence, better seed to soil contact, and consistent seeding depth.
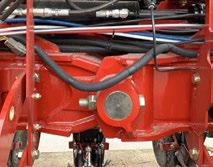
For inquiries about this project, contact Andrew Klopfenstein (klopfenstein.34@osu.edu) or Ryan Tietje (tietje.4@osu.edu).
Investigate the agronomic benefits of distributing weight from the center section of a planter to the wings increasing ground countact with the gague wheels on the ends of the wings as well as help to reduce some pinch row compaction effect.
Planting Date 5/30/2020
Harvest Date 10/7/2020
Variety 3789X2
Population 150,000 sds/ac
Acres 35
Treatments 4 Reps 4
Treatment Width 40 ft.
Tillage No-Till
Management Fungicide, Herbicide, Insecticide
Previous CropCorn
Row Spacing 15 in.
Soil Type Crosby-Lewisburg Silt Loam, 41% Kokomo
Silty Clay Loam, 28%
Miamian-Eldean Silt Loam, 24%
Wing downforce control systems have recently been encouraged for modern planters as a means to prevent planter wings from rising during the planting operation and reduce the weight of the center section of the planter. Potentionally, as the planter moves through the field, the wings of the planter could lift, resulting is less than optimal peformance of the outside rows. Additionally, the weight from the center section of the planter can cause pinch row compaction on the center rows decresing yield.


OSU Extension
Madison County

Trial layout and applied dowforce map in FieldView.
No noticeable differences were observed between treatments during the growing season. It was also observed that transferring weight from the center of the planter to the wings kept the planter wings level during planting. Planting conditions were slightly wet. An extremely uniform stand for all treatments was noticed and the beans were disease free throughout the growing season. The quick canopy development prevented weed pressure through harvest.

• There were no statistically significant differences between treatments.
• For the given field conditions, 900 lbs of wing downforce kept the planter in the correct planting orientation.

Treatment Means with the same letter are not significantly different according to Fisher’s Protected Least Significant Differences (LSD) test at alpha = 0.1.
This planter was used in the study and was equipped with some of the latest technology, including hydraulic downforce, row cleaners, and electric drive meters.

For inquiries about this project, contact Andrew Klopfenstein (klopfenstein.34@osu.edu) or Ryan Tietje (tietje.4@osu.edu).
Understand the yield impact of varying soybean seeding rate within Ohio considering in-field variability and cultural practices implemented. Information from these trials are being used to improve management recommendations for growers throughout Ohio and help understand how variable-rate seeding may impact field by field profitability.
The primary recommendations for seeding rates in Ohio are determined by target final stands and average soil productivity. Variable rate seeding prescriptions have the potential to better match seeding rate to productivity zones in an effort to optimize profits. Field studies were implemented in a strip-trial format and replicated at least three times with the fields. Results for individual sites plus aggregated pooled analyses were conducted.


Sound information and data to improve decisionmaking for soybean variety selection, target seeding rate, and final population.
• Across all sites, the average soybean stand was 83% of the target rate with individual sites ranging between 68% and 100%.
• Variation in soybean yield was primarily caused by differences in location and not differences in seeding rate in 2020.
• There was a significant response to soybean seeding rate at 6 out 11 sites in 2020.

Several trials have reported stand counts higher than the target seeding rate. This is likely due to limitations of the meter to singulate seeds at very low soybean seeding rates.
Testing low seeding rates can also help provide information to improve replant decisions.

Planting Date 5/8/2020
Harvest Date 10/7/2020
Variety 33X8
Population See Treatments
Acres 53
Treatments 4
Reps 4
Treatment Width 10 ft.
Tillage Minimum Till
Management Fertilizer
Previous Crop Soybeans
Row Spacing 7.5 in.
Soil Type Luray Silty Clay Loam, 73% Glynwood Silt Loam, 19%
For inquiries about this project, contact Jason Hartschuh (hartschuh.11@osu.edu).

OSU Extension
Crawford County A
Planting Date 5/5/2020
Harvest Date 10/15/2020
Variety 2820R2X
Population See Treatments
Acres 100
Treatments 4
Reps 4
Treatment Width 10 ft.
Tillage Minimum Till
Management Herbicide
Previous Crop Soybeans
Row Spacing 7.5 in.
Soil Type Pewamo Silty Clay Loam, 50% Bennington Silt Loam, 49%
For inquiries about this project, contact Jason Hartschuh (hartschuh.11@osu.edu).


Treatment Means with the same letter are not significantly different according to Fisher’s Protected Least Significant Differences (LSD) test at
Planting Date 5/9/2020
Harvest Date 10/9/2020
Variety 3842FP
Population See Treatments
Acres 40
Treatments 4
Reps3
Treatment Width30 ft.
Tillage No-Till
Management Fungicide, Herbicide, Insecticide
Previous Crop Soybeans
Row Spacing 15 in.
Soil Type Crosby Silt Loam, 60% Brookston Silty Clay Loam, 34%
For inquiries about this project, contact Sam Custer (custer.2@osu.edu).

OSU Extension
Darke County
Planting Date 6/2/2020
Harvest Date 11/6/2020
Variety SC7341E
Population See Treatments
Acres 11
Treatments 5
Reps 4
Treatment Width 40 ft.
TillageConventional
Management Herbicide
Previous CropCorn
Row Spacing 15 in.
Soil Type Brookston Silty Clay Loam, 64% Crosby Silt Loam, 32%
For inquiries about this project, contact Ken Ford (ford.70@osu.edu).


Planting Date 5/8/2020
Harvest Date 10/8/2020
Variety 2899X2
Population See Treatments
Acres 28
Treatments 5
Reps 4
Treatment Width 40 ft.
Tillage No-Till
Management Herbicide
Previous Crop Prevent Plant Covercrop
Row Spacing30 in.
Soil Type Ziegenfuss Clay Loam, 55% Nappanee Silt Loam, 40%
For inquiries about this project, contact Eric Richer (richer.5@osu.edu).
RESULTS

OSU Extension
Fulton County
Planting Date 5/8/2020
Harvest Date 10/13/2020
Variety P31T44E
Population See Treatments
Acres 8
Treatments 4
Reps3
Treatment Width 60 ft.
Tillage No-Till
Management Herbicide
Previous CropCorn
Row Spacing 15 in.
Soil Type Houcktown-GlynwoodJenera Complex, 67% Pewamo Silty Clay Loam, 32%
For inquiries about this project, contact Ed Lentz (lentz.38@osu.edu).


Treatment Means with the same letter are not significantly different according to Fisher’s Protected Least Significant Differences (LSD)
Planting Date 5/9/2020
Harvest Date 10/8/2020
Variety 3546FP
Population See Treatments
Acres 60
Treatments 4
Reps3
Treatment Width30 ft.
Tillage No-Till
Management Fertilizer, Herbicide
Previous CropWheat
Row Spacing30 in.
Soil Type Hoytville Silty Clay Loam, 100%

Henry County
For inquiries about this project, contact Elizabeth Hawkins (hawkins.301@osu.edu) or Garth Ruff (ruff.72@osu.edu).
RESULTS
Planting Date 5/2/2020
Harvest Date 10/3/2020
Variety Ebberts 330 RTX
Population See Treatments
Acres 88 Treatments 4
Reps3
Treatment Width 40 ft.
Tillage No-Till
Management Fungicide, Herbicide, Insecticide
Previous CropCorn
Row Spacing 15 in.
Soil Type Eldean Loam, 74% Westland Silty Clay Loam, 15%
For inquiries about this project, contact Amanda Bennett (bennett.709@osu.edu).


Treatment
Planting Date 4/25/2020
Harvest Date 10/9/2020
Variety P36A83X
Population See Treatments
Acres 25
Treatments 4
Reps 4
Treatment Width 40 ft.
Tillage No-Till
Management Herbicide
Previous CropCorn
Row Spacing 15 in.
Soil Type Tedrow-Dixboro Complex, 55% Colwood Fine Sandy Loam, 43%
For inquiries about this project, contact Allen Gahler (gahler.2@osu.edu).
RESULTS

OSU Extension Sandusky County
Planting Date 4/25/2020
Harvest Date 9/25/2020
Variety 3546FP
Population See Treatments
Acres39
Treatments 5
Reps 4
Treatment Width20 ft.
Tillage Vertical Till
Management Fertilizer, Fungicide, Herbicide, Insecticide
Previous CropCorn
Row Spacing30 in.
Soil Type Brookston Silty Clay Loam, 70% Crosby Silt Loam, 30%
For inquiries about this project, contact Wayne Dellinger (dellinger.6@osu.edu).


Planting Date 6/8/2020
Harvest Date 10/28/2020
Variety 38A10
Population See Treatments
Acres 150
Treatments 5
Reps3
Treatment Width 40 ft.
TillageConventional
Management Fertilizer, Fungicide, Herbicide
Previous CropCorn
Row Spacing20 in.
Soil Type Brookston Silty Clay Loam, 70% Crosby Silt Loam, 30%
For inquiries about this project, contact Stephanie Karhoff (karhoff.41@osu.edu).
RESULTS

OSU Extension
Williams County
For 2020, eFields small grains research was focused on improving the production and profitability of wheat and malting barley in Ohio. Some exciting and innovating projects were executed this year, with 32 studies being conducted across the state. 2020 small grains research presented in eFields covers both precision crop and nutrient management initiatives. Below are highlights of the 2020 eFields small grains research:
1,263 acres of small grains
32 small grains studies
For more small grains research from Ohio State University Extension, explore the following resources:
The purpose of the Ohio Wheat Performance Test is to evaluate wheat varieties for yield and other agronomic characteristics. This evaluation gives wheat producers comparative information for selecting the best varieties for their unique production systems. For more information visit: go.osu.edu/OhioWheat.
The Agronomic Crops Team performs interesting research studies on a yearly basis. Resources, fact sheets, and articles on wheat and barley research can be found here on the Agronomic Crops Team website: go.osu.edu/CropsTeamWheat and go.osu.edu/CropsTeamBarley.
The Soybean and Small Grain Crop Agronomy Program in the Department of Horticulture and Crop Science at The Ohio State University is directed by Dr. Laura Lindsey. The goal of the research program is to meet the needs of Ohio farmers through research-based agronomic recommendations. Research related to small grains planting, cropping inputs, and harvesting technology can be found on the program’s website: stepupsoy.osu.edu/home.


For all wheat and barley trials in this eFields report, we define growth stages as the following:
Feeke’s 1.0 - Germination period to the first emerged leaf.
Feeke’s 2.0 – Tillers become visible.
Feeke’s 3.0-4.0 – Tiller formation.
Feeke’s 5.0 – Strongly erect leaf sheaths. Growing point is still below the soil surface.
Feeke’s 6.0 – First node visible. The growing point is above this node. Tiller production is complete.
Feeke’s 7.0 – Second node visible. Rapid stem elongation is occurring.
Feeke’s 8.0 – Flag leaf visible.
Feeke’s 9.0 – Flag leaf completely emerged and leaf ligule is visible.
Feeke’s 10.0 – Boot stage. Head is fully developed and can be seen in the swollen section of the lead sheath below the flag leaf.
Feeke’s 10.5 – Heading and flowering. Head is fully emerged.
Feeke’s 10.5.1 – Early flowering, anthers are extruded in the center of the head.
Feeke’s 10.5.2 – Mid flowering, anthers are extruded in the center and top of the head.
Feeke’s 10.5.3 – Late flowering, anthers are extruded in the center, top, and base of the head.
Feeke’s 11.0 – Ripening.
Feeke’s 11.1 – Milk stage.
Feeke’s 11.2 – Mealy stage.
Feeke’s 11.3 – Hard kernel.
Feeke’s 11.4 – Harvest ready.

To evaluate the impact of planting date on winter malting barley yield, harvest date and quality.
Planting Date See Treatments
Harvest Date 6/24/2020
Variety Puffin
Population 1.29 million sds/ac
Acres 21
Treatments9
Reps 4
Treatment Width30 ft.
Tillage Minimum Till
Management Fertilizer, Fungicide, Herbicide, Insecticide
Previous CropFallow
Row Spacing 7.5 in.
Soil Type Haskins Loam, 23%
Hoytville Clay Loam, 23% Mermill Loam, 19%
Prevented planting in 2019, improved early soybean maturities and corn silage systems allowed for early planting of small grains like winter barley. Fulton County’s fly-free date is September 22. Intended planting dates were 10 days prior to, on, and 10 days after the fly-free date. Actual treatment dates were September 18, September 21, and October 10 based on ideal field and weather conditions. All barley was drilled with a Great Plains 3010NT drill in 30-foot swaths. Fall starter fertilizer was variable-rate applied based on soil tests with 86 lbs/ac of N applied to all treatments on April 6. All fertilizer, tillage and crop protection passes were uniform across treatments.


OSU Extension
Fulton County

Growing Season Weather Summary

Heading differences in barley.
Yield limiting factors included significant freeze events on May 9 and 13 followed by heavy rains. However, the grain fill period had very limited rainfall. Spring head counts (and clipped heads) per foot were counted on June 11th, the same day the barley was treated for armyworms. Heavy armyworm damage occurred to the September planted treatments. Spring head counts per foot showed an advantage for the September treatments, but the resulting armyworm damage occured in those treatments as well. Quality analyses showed an increase in thins and a decrease in plumpness but vomitoxin or high protein was not an issue in any treatment.
• In 2020, there was a significant yield advantage (20+ bu/ac) to the late planted treatment. However, that same treatment had mimimal armyworm damage and the least spring head counts per foot.
• Barley planted in September also had a 2 day harvest advantage that could result in early double crop soybean planting.
• Grain quality was significantly affected by weather this year resulting in low plumpness and high thins levels for the September treatments. The resulting protein, germination and DON levels were excellent across all treatments.
Treatment Means with the same letter are not significantly different according to Fisher’s Protected Least Significant Differences (LSD) test at alpha = 0.1.
Drone imagery
Simple aerial imagery can help evaluate emergence and weather issues. Emergence differences associated with this study can easily be documented. Photo credit: Ricardo Costa, MSU Extension.

For inquiries about this project, contact Eric Richer (richer.5@osu.edu).
Evaluate the effects of nitrogen timing and fungicide treatments (Prosaro, Caramba, Miravis Ace) on malting barley grain quality.
Planting Date 9/22/2020
Harvest Date 6/24/2020
Variety Puffin
Population 1.45 million sds/ac
Acres20
Treatments 5
Reps 4
Treatment Width 60 ft.
Tillage No-Till
Management Fertilizer, Herbicide
Previous CropWheat
Row Spacing 7.5 in.
Soil Type Hoytville Clay Loam, 92%
Nitrogen was applied to the entire field on April 3, 2020, with three 60-foot strips receiving half the the total rate. The second fertilizer pass was made later to those strips. Miravis Ace was the control fungicide applied to the majority of the field. The fungicide treatments were applied in a randomized complete block design across the field. There were four replications for each of the four treatments. The center 20 feet of each plot was harvested for yield data using a combine equipped with a yield monitor. The monitor was calibrated prior to harvesting the trial.


OSU Extension
Henry County


The Polaris Ranger used for in-season applications.
This study was conducted in a prevented planting field in 2019. Barley was noticably shorter in 2020 due to cold weather in the early spring. Head damage due to the the cold weather was minimal and estimated around 2%.
Conditions during the month of June, prior to harvest were hot and dry, potentially affecting kernel fill. Severe armyworm damage resulted in an estimated 25-40% yield loss in trial.
• There were a number of factors that potentially had an impact on this trial. A split application of nitrogen did sigficantly increase yield, however part of the difference can be attributed to armyworm damage.
• A split application of N also increased the percent protein in the grain, but not to a point where malting quality was compromised.
• There were no differences in malting quality parameters or yield across fungicide treatments.
Treatment Means with the same letter are not significantly different according to Fisher’s Protected Least Significant Differences (LSD) test at alpha = 0.1.
LSD: 16.42 CV: 6.96%
Polaris Ranger
An ATV sprayer pulled by a Polaris Ranger with Ag Leader technology was used to make timely nitrogen and fungicide applications.

For inquiries about this project, contact Garth Ruff (ruff.72@osu.edu).
Measure the effects of fusariam head scab fungicide and wheeled traffic and its impact on wheat yield.
Planting Date 9/25/2019
Harvest Date 7/7/2020
Variety P25R61
Population 1.8 million sds/ac
Acres 15
Treatments3
Reps 4
Treatment Width90 ft.
TillageConventional
Management Fertilizer, Fungicide
Previous CropFallow
Row Spacing 7.5 in.
Soil Type Paulding Clay, 57% Roselms Silty Clay, 43%
The experiment was randomized block with four replications. Plots were 90 feet wide and field length varied by location in the field. The entire 90 foot wide by varied length plot area was harvested for grain yield. The combine yield monitor was calibrated prior to harvesting the plots. Fungicide Prosaro was appliced at a rate of 6.5 fl oz per acre at 15 gallons per acre at Feeke’s growth stage 10.5.3 (late flowering). The wheeled traffic treatment was applied by covering plots without a fungicide application.


OSU Extension
Defiance County


Hagie STS 12 applying fungicide application.
The Fusarium Risk Assessment Tool (wheatscab.psu. edu) was used on May 31, 2020 to determine the risk level for disease and the treatment plan. For winter wheat varieties rated as moderately susceptible, the risk assessment for the plot area was High. For winter wheat varieties rated as moderately resistant, the risk assessment for the plot area was Medium. Weather conditions from June 1-6 trended drier and the risk assessment decreased from High/Medium on May 31 to Low by June 3.
• Fungicides are risk management tools to decrease the impact of diseases that have the potential to reduce grain yields and or grain quality. This study used an Integrated Pest Management approach that included disease resistant variety, the Fusarium Risk Tool, and an appropriate fungicide application.
• In 2020, the dry weather trend shortly after assessment resulted in no yield response to the fungicide application.
• In season cost of the Prosaro at 6.8 oz per acre was $17.21 per acre. Application cost was $6.85 per acre.
• The wheeled traffic treatment was not significant ly different in this trial.
Treatment Means with the same letter are not significantly different according to Fisher’s Protected Least Significant Differences (LSD) test at alpha = 0.1.
Hagie STS 12
This high clearance sprayer (self-propelled) provides the capability to apply fungicide with a 90-foot boom width with a clearance of 72 inches.
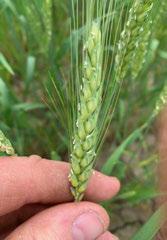
For inquiries about this project, contact Bruce Clevenger (clevenger.10@osu. edu).
Determine the response of wheat yield to sulfur application.

Planting Date 9/27/2019
Harvest Date 6/30/2020
Variety Wellman 304
Population 1.53 million sds/ac
Acres 6
Treatments2
Reps3
Treatment Width90 ft.
Tillage No-Till
Management Fertilizer
Previous Crop Soybeans
Row Spacing 7.5 in.
Soil Type Pewamo Silt Loam, 51% Glynwood Clay Loam, 26% Glynwood Silt Loam, 19%
This trial was designed as a randomized complete block with three replications. The trial was establishd on March 26, 2020 with the application of sulfur at 20 pounds/A compared to no sulfur. The source of sulfur was Ammonium Thiosulfate applied at 7 gallons per acre (9.3 pounds of nitrogen per acre with 12 gallons of 28% nitrogen (36.0 pound of Nitrogen per acre). In the no-sulfur treatment 15 gallons of 28% nitrogen per acre (44.8 pounds nitrogen per acre) was applied on the same day. Grain samples were collected for each plot and analyzed.

OSU Extension
Auglaize County

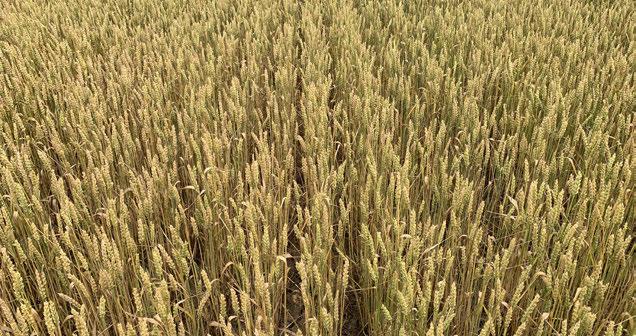
Above average rainfall occurred during the spring and early summer 2020. There was no visual color difference in the treated strips during the growing season. Further, there was no obvious disease in the trial area in 2020.

• In a previous trial in 2018 in Auglaize County, the application of sulfur at 20 pounds per acre to wheat at early green up improved wheat yield.
• This trial showed an increase in wheat yield by 5 bu/ac with the application of sulfur at early greenup.
• There was no difference in the sulfur content of the analyzed grain samples.
• Grain moisture was higher at harvest for the plots that received sulfur.
Treatment Means with the same letter are not significantly different according to Fisher’s Protected Least Significant Differences (LSD) test at alpha = 0.1.
Yield monitors make data collection of research trials simple during harvest. They allow for yield and grain moisture estimates to be collected spatially or by treatment.

For inquiries about this project, contact Jeff Stachler (jeff.stachler@ndsu.edu) or Brigitte Moneymaker (moneymaker.4@ osu.edu).
To evaluate the impact of planting date on winter wheat yield.

Planting Date See Treatments
Harvest Date 7/7/2020
Variety DynaGro 9941
Population 1.4 million sds/ac
Acres 17
Treatments3
Reps 4
Treatment Width30 ft.
TillageConventional
Management Fertilizer, Herbicide
Previous CropFallow
Row Spacing 7.5 in.
Soil Type Galen Loamy Fine Sand, 35% Colwood Loam, 20% Bixler Loamy Fine Sand, 15%
Prevented planting (2019), improved early soybean maturities and corn silage systems allow for early planting of winter wheat--in many cases, prior to the fly-free date. Fulton County’s fly-free date is September 22. Intended planting dates were 10 days prior to, on, and 10 days after the fly-free date. Actual treatment dates were September 11, September 21, and October 9 based on ideal field and weather conditions. Fall starter fertilizer was applied based on soil tests and 96 lbs/ac of N was applied to all treatments on April 21. All fertilizer, crop protection and tillage passes were uniform across treatments.

OSU Extension
Fulton County


Prevented planting acres in 2019 allowed for earlier than normal planting of winter wheat.
The earliest planted wheat (Sept. 11) produced the greatest tillers per plant and foliage height in the fall. It also showed fall yellowing, presumably from nitrogen deficiency. The latest planting (Oct. 9) resulted in some competition with winter annual weeds as well as the least biomass at Feeke’s stage 6. Spring head counts showed that the planting on the fly-free date (Sept. 21) resulted in the greatest number of harvestable heads. Rainfall was limited during grain fill at this site in 2020. Vomitoxin was not an issue in any treatment.

Treatments
Treatment Means with the same letter are not significantly different according to Fisher’s Protected Least Significant Differences (LSD) test at alpha = 0.1.
John Deere 750 No-till Drill
Equipped with single-disc openers and cast closing wheels, this drill was used in this trial and allowed for simple implementation of planting date treatments.
• There was no significant difference in yield between the Sept. 11 and Sept. 21 plantings.
• However, the Oct. 9th planted wheat yielded significantly lower than either of the September plantings.
• The results of this study support Ohio State’s small plot findings that suggest planting wheat as near to the fly-free date will result in maximum yield.
• Grain moisture was significantly different for the October 9 planting,
• Test weight was not significantly between treatments.
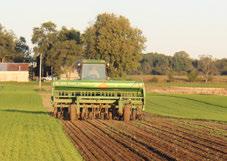
For inquiries about this project, contact Eric Richer (richer.5@osu.edu).
To evaluate the impact of planting date on winter wheat yield.

Planting Date See Treatments
Harvest Date 7/4/2020, 7/6/2020
Variety Rupp 968
Population 1.25 million sds/ac
Acres 18
Treatments2
Reps 4
Treatment Width30 ft.
Tillage Minimum Till
Management Fertilizer, Fungicide, Herbicide, Insecticide
Previous CropFallow
Row Spacing 7.5 in.
Soil Type Mermill Loam, 32% Rimer Loamy Fine Sand, 22% Haskins Loam, 17%
Prevented planting (2019) and improved early soybean maturities allow for early planting of winter wheat--in many cases, prior to or at the fly-free date. This study was designed with two planting date treatments (DoP) replicated four times in an sequential block design. Fulton County’s fly-free date is September 22. Intended planting dates were on and 10 days after the fly-free date. Actual treatment dates were September 21 and October 9 based on ideal field and weather conditions. Fall starter fertilizer was applied based on soil tests and 130 lbs/ac of N was applied in the spring. All fertilizer, tillage and crop protection passes were uniform across treatments.

OSU Extension
Fulton County
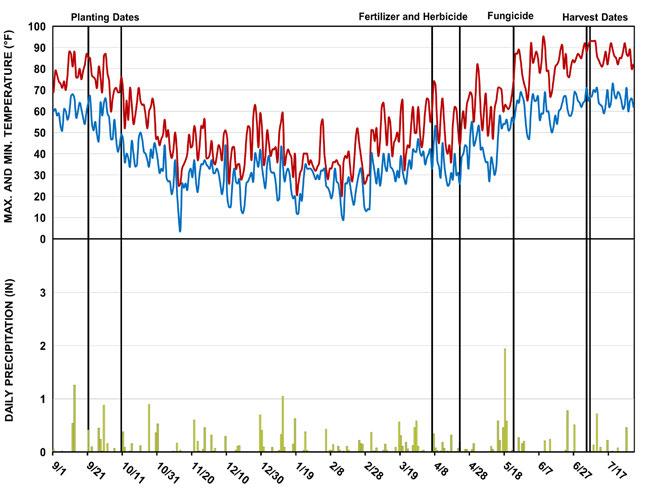

Planting
Yield limiting factors included significant freeze events on May 9 and 13 followed by heavy rains. However, the grain fill period was very dry and hot. Spring head counts per foot showed only a nominal difference in treatments. Vomitoxin was not an issue in any treatment.

• No significant difference in yield was found between the plant date treatments. However, the numerical yield advantage suggested by this study supports Ohio State’s small plot data encouraging farmers to plant winter wheat as close to the fly-free date as possible.
• Additionally, the earlier planted wheat became ready for harvest two days prior to the late planted wheat even under the ideal harvest conditions of 2020.
• Grain moisture was not different at harvest.
• Test weight was higher for the earlier planted wheat.
Treatment Means with the same letter are not significantly different according to Fisher’s Protected Least Significant Differences (LSD) test at alpha = 0.1.
Fall tiller counts
While winter wheat can add additional tillers in the spring, fall tillers are considered to make up a majority of the yield potential. Here, late planted (left) wheat tillers at 1 tiller/plant are compared with early planted (right) tillers at approximatley 3 tillers/plant.

For inquiries about this project, contact Eric Richer (richer.5@osu.edu).
To determine if high quality, high yielding winter barley can be grown at field-scale in Northwest Ohio.


OSU Extension Fulton County
Several Northwest Ohio growers have been participating in field-scale winter (malting) barley production research since 2018 in an effort to determine yield and production economics. All barley fields considered were planted with the variety Puffin. Growers were asked to plant barley within 10 days of the Hessian fly-free date (September 22-27 for NW Ohio sites), if possible. Fields were soil tested and nutrients applied accordingly on a per site basis. Each grower applied approximately 20-30 lbs of starter nitrogen and 60-80 lbs of spring nitrogen. All field operations were performed with commercial equipment. In each of the three years, grower participation increased: eight growers (nine sites) in 2018, six growers (11 sites) in 2019 and 13 growers (26 sites). Simple averages of key data points like moisture, yield, straw yield, protein, germination and DON were calculated.
Data
To determine the double-crop soybean yield after winter barley.
Simultaneously, growers who wished to participate were asked to create a ‘paired-site’ field of first crop soybeans adjacent to their barley field with the goal of comparing yields of double crop soybeans after barley to the yield of first crop beans (check). Participation in this portion of the cohort was eight growers (9 sites) in 2018, four growers (seven sites) in 2019, and 12 growers (20 sites) in 2020. Where possible, participating growers compared double crop soybean yields after barley and after wheat. Simple averages of key data points like plant date, harvest date, seeding rate, moisture, final stand and yield were calculated for comparison.

Freeze events on May 8 and 13 caused stress/damage on some (left) but not all heads.
• In 2020, average yield for the cohort was 71.7 bu/ac of barley grain and 1.31 T/ac of barley straw.
• Quality data for 2020 indicated that all components of quality were excellent except plumpness.
• Double crop soybean yields after barley showed a 3 bu/ac advantage over double crop soybeans after wheat in 2020, despite an 11 day earlier planting window.
Farmer Peer Learning Groups
Peer learning groups or cohorts are an opportunity to get like-minded growers to work together and share ideas, observations, management practices and data on a particular topic. The data for this eFields study is a result of the 2018-2020 Northwest Ohio On-Farm Research Cohort for Malt Barley.

For inquiries about this project, contact Eric Richer (richer.5@osu.edu).
For 2020, eFields forage research was focused on increasing forage production in Ohio. Some exciting and innovating projects were executed this year, with 6 unique studies being conducted across the state. 2020 Forage research presented in eFields covers both precision nutrient management and species selection. Below are highlights of the 2020 eFields Forage research:
23 acres of forage 6 forage studies
For more forage research and feeding management from Ohio State University Extension, explore the following resources:
The purpose of the Ohio Forage Performance Test is to evaluate forage varieties of alfalfa, annual ryegrass, and cover crops for yield and other agronomic characteristics. This evaluation gives rorage producers comparative information for selecting the best varieties for their unique production systems. For more information visit: go.osu.edu/OhioForages.
The Agronomic Crops Team performs interesting research studies on a yearly basis. Resources, fact sheets, and articles on alfalfa, winter annuals, and summer annuals can be found here on the Agronomic Crops Team website: go.osu.edu/CropTeamForages.


Corn Plant Silage
Forage Sorghum Sorghum Sudangrass Sudangrass
Soybean Silage
Teff Grass
Millets
Mixtures of annual grasses with soybean
Highest single cut forage yield potential of all choices. Silage quality will be lower than with normal planting dates. Risk will be getting it harvested at right moisture for good fermentation.
Best harvested as silage. Brown midrib (BMR) varieties are best for lactating cows. Conventional varieties are okay if BMR seed is not available. Can produce 3-4 tons of dry matter/acre. Risk of prussic acid (hydrogen cyanide gas) if frosted.
Reasonable alternative to replace alfalfa forage. Check seed treatment and herbicide labels, many restrict forage use.
Best suited to beef and sheep; lower yield than sorghum grasses. Can harvest as hay or silage.
Best suited to beef and sheep; many produce a single harvest. Best harvested as silage. Pearl millet does not produce prussic acid after frost damage.
Best harvested as silage. Mixtures of sorghum grasses or millets or even oats and spring triticale with soybean are feasible and can improve forage quality characteristics.
Oat or Spring Triticale
Oat or Spring Triticale Plus Winter Cereals
Oat or Spring Triticale Plus Field Peas
Italian Ryegrass
Can be mowed and wilted to correct harvest moisture. Harvesting as hay can be challenging. Earlier planting dates provide more autumn yield.
Winter cereals (Winter rye, Winter wheat, Winter triticale) can be added to oat or spring triticale to add a forage harvest early next spring. Winter rye can also contribute a little extra autumn yield to the mixture.
Field peas can improve forage quality (especially crude protein content) but will increase seed cost.
Earlier planting dates provide more autumn yield. Excellent forage quality in the fall. Potential for three harvests next year starting in late April.
Compare three different annual forage grasses to see which ones performed best and contained the most crude protein, TDN and NDF.
Planting Date 7/31/2020
Harvest Date 9/30/2020
Variety See Treatments
Population 10-50 lbs/ac
Acres 5
Treatments3
Reps 4
Treatment Width 60 ft.
Tillage No-Till
Management Fertilizer, Herbicide
Previous CropWheat
Row Spacing 7.5 in.
Soil Type Centerburg Silt Loam, 74% Amanda Silt Loam, 15% Bennington Silt Loam, 11%
Morrow Soil and Water Conservation District and OSU Extension Morrow County have a 20 acre field donated by the county commissioners that we use for research. The area of the trial was 5 acres. Three species of summer annual forage crops (forage oats, teff grass and sorghum sudangrass) were planted with a John Deere 1590 no-till drill on July 31st and fertilized with MAP at 80 lbs/ac, potash at 61 lbs/ac, and urea at 48lbs/ac two weeks before planting. The plots were mowed on September 30th and baled on October 3rd. Each bale was weighed and samples for forage tests were taken.


OSU Extension
Morrow County

Oats in the forage plot.
OBSERVATIONS
All forage species tested emerged after wheat but the teff grass and sorghum sudangrass performed the best. The teff grass could have been harvested twice and if given a longer growing period the sorghum sudangrass could have had two cuttings, as well. Both are great options to plant after wheat if needing additional forage for livestock in the winter.
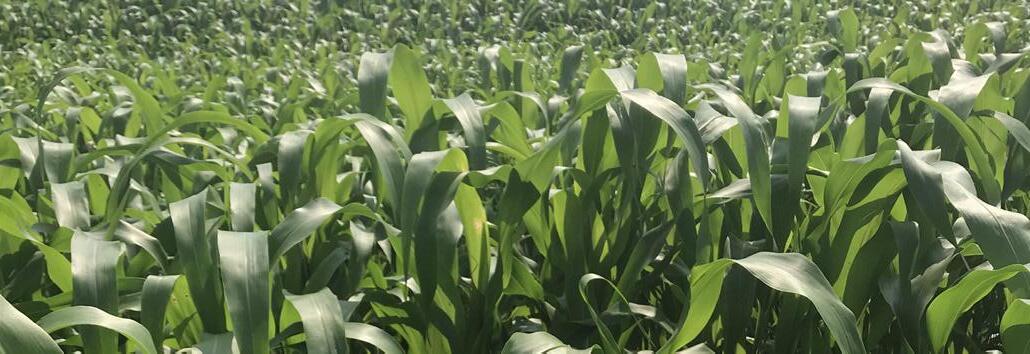
• A significant difference in yield was observed where the teff grass and sorghum sudangrass were over 2.5 times the yield of oats.
• Crude protein was higher for the oats by just over 6%.
• Teff grass produced the highest energy or TDN, followed by sorghum then by oats.
• Based on crude protein, total digestible nutrients, relative feed values and dry matter any of these species would be acceptable as forages. The key is to plant what works best for your farm operation.
Treatment Means with the same letter are not significantly different according to Fisher’s Protected Least Significant Differences (LSD) test at alpha = 0.1.
Demonstration plots
Demonstration plots are an effective method for sharing experiences with new crops and management practices. They can be easily installed and placed in a visible loaction on the farm.

For inquiries about this project, contact Carri Jagger (jagger.6@osu.edu).
Determine the correct nitrogen rate for mid-fall planted oats to maximize yield on forage forage quality.
Planting Date 9/15/2020
Harvest Date 11/18/2020
Population 100 lbs/ac
Acres2
Treatments3
Reps 4
Treatment Width 10 ft.
Tillage No-Till
Management Fertilizer
Previous CropWheat
Row Spacing 7.5 in.
Soil Type Rimer Loamy Fine Sand, 58% Hoytville Clay Loam, 42%

This study compared three nitrogen rates applied to fall planted oats. Rates of 0, 46, and 92 lbs/ac of nitrogen were chosen. Previous research showed yield and quality of fall oats planted in July was maximized at 46 lbs/ac of nitrogen, but later planting dates required more nitrogen. All treatments were replicated three times in a no-till field. Plots were 10-feet wide. All treatments were hand harvested and dried for analysis.

Extension
Sandusky County


Oats in the forage plot.
There was a stark visual difference between treatments during the growing season. The no nitrogen treatment was very yellow and contained a lot of volunteer wheat. Leaves were visually bigger in the 92 pounds of nitrogen treatment plus plants were taller.

• Nitrogen is a key factor in fall forage oat production.
• Yield was significantly different between the three treatments.
• The energy content (TDN) was similar between treatments.
• Applying 46 pounds of nitrogen improved yield but not quality.
• Applying 92 pounds of nitrogen doubled yield with crude protein increasing.
• While this study was planted after wheat, there were soybeans harvested in the area by this planting date.
• When nitrogen is added to oats after early harvested soybeans, mid-September is a viable oats planting date if silage or baleage is a harvest option.
Treatment Means with the same letter are not significantly different according to Fisher’s Protected Least Significant Differences (LSD) test at alpha = 0.1.
Plot flags
Plot flags allow producers to easily ground truth treatment application area and make sure application area and harvest area are aligned.

For inquiries about this project, contact Allen Gahler (gahler.2@osu.edu) or Jason Hartschuh (hartschuh.11@osu. edu).
Analyze the forage potential of five different species planted after wheat harvest comparing yield and quality.
Planting Date 7/15/2020
Harvest Date 9/21/2020
Variety See Treatments
Population See Treatments
Acres 5
Treatments 5 Reps 4
Treatment Width 10 ft.
Tillage Minimum TIll
Management Fertilizer
Previous Crop Soybeans
Row Spacing 7.5 in.
Soil Type Rimer Loamy Fine Sand, 58% Hoytville Clay Loam, 42%


OSU Extension Sandusky County

Growing two crops in one season can increase farm profitability. By planting a summer annual forage after wheat, you can feed livestock on unused ground. Species selection affects yield and quality. This trial used a randomized complete block designwith four replicationsto compare summer annual forage species. All species received 100 lb/ac nitrogen. All treatments were hand harvested and dried for analysis.

sorghum in the forage plot.
Corn struggled to emerge, with the weak stand harming overall yield. All crops were planted with a grain drill, utilizing a corn planter may help with corn yield. Other species all emerged and grew well. Moisture was barely adequate at this location during the growing season.

• Summer annual forages can make an excellent source of feed.
• Species selection affects yield and forage quality.
• The highest yielding species were sorghum sudan and oats.
• Soybeans which are typically thought of as a grain crop can be utilized as a forage. While it was the lowest yielding, it had the most protein and highest TDN per ton.
• Selecting the best forage for your operation depends on the nutrient needs of your livestock and current forage inventory.
Treatment Means with the same letter are not significantly different according to Fisher’s Protected Least Significant Differences (LSD) test at alpha = 0.1.
Many summer annual forages do not dry well to be made as dry hay. They can be made wet as silage or baleage using fermentation to preserve the forage.

0.75
27.00%
For inquiries about this project, contact Jason Hartschuh (hartschuh.11@osu. edu) or Allen Gahler (gahler.2@osu. edu).
Compare four winter annual grass crops for efficacy in terms of forage quality and tonnage over two harvest dates when planted after a summer annual crop.
Planting Date 10/14/2019
Harvest Date 4/28/2020, 5/7/2020, 5/26/2020
Variety See Treatments
Population 2.5 bu/ac
Acres 5
Treatments 8
Reps 4
Treatment Width 10 ft.
Tillage Minimum Till Management Fertilizer
Previous CropPasture
Row Spacing 7.5 in.
Soil Type Piopolis Silt Loam, 61% Allegheny Loam, 28% Omulga Silt Loam, 10%
The study was a randomized complete block split plot design with four replications. Winter annuals are a great way for livestock producers to expand their production by planting after soybeans. Harvest timing and species affect yield and quality. All treatments received 50 lbs/ac nitrogen. All treatments were hand harvested and dried for analysis.


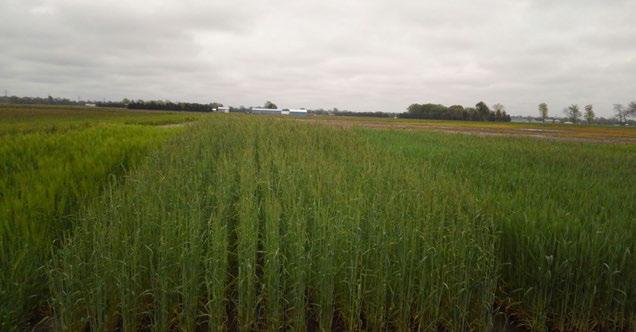
There was no termination of existing orchard grass stand. Orchard grass was thin and smothered out by cover crops in spring of 2020. Winter conditons were mild and all cover crop plots survived into spring. Some winter annual weeds established in early spring, but no summer annuals were present in the plots.
• For yield, there was no difference between varieties but there was a difference between harvest dates.
• Later harvest yielded more tonnage but declined in quality.
• Quality factors did show significant differences between varieties and harvest timing.
• Cereal rye was the highest quality early on but declined to the lowest quality at Feeke’s 10.5.
Treatment Means with the same letter are not significantly different according to Fisher’s Protected Least Significant Differences (LSD) test at alpha = 0.1.
Canopeo
Canopeo is used to help with stand assesment of before winter and at spring green up to help determine if the stand is dense enough to make a crop.

For inquiries about this project, contact Jason Hartschuh (hartschuh.11@osu. edu), Will Hamman (hamman.41@osu. edu), or Christine Gelley (gelley.2@osu. edu).
Analyze the nutritional value and yield of four winter annual cereal forage crops harvested at boot and flower growth stage.
Planting Date 10/9/2019
Harvest Date 5/13/2020, 5/22/2020
Variety See Treatments
Population 2.5 bu/ac
Acres 5
Treatments 8 Reps 4
Treatment Width 10 ft.
Tillage Minimum Till Management Fertilizer
Previous Crop Soybeans
Row Spacing 7.5 in.
Soil Type Hoytville Clay Loam, 100%
Utilizing winter annuals helps livestock producers grow both a forage and agronomic crop in one year on the same acres. Increased spring weather volatility has lead producers to look for options that mature slower than rye. The decision on which crop to grow is driven by yield, quality, and maturity rate. Species were determined by winter annual cereal grains that can also make good forages. The trial was designed as a randomized complete block trial with eight treatments replicated four times. The treatments for this trial were the various species and harvest date. All treatments were hand harvested.


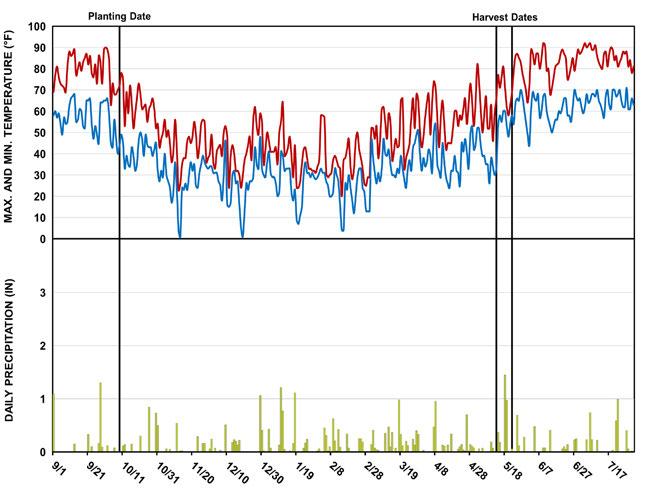

Winter annual forage plot.
All crops were weed free and handled water stress well when being flooded early in the spring. Rye was the earliest maturing species, maturing three days before hybrid rye. Tritcale was ready for harvest six days after rye and and wheat at Feeke’s 10.0 and twelve days after rye. Rye matured to Feeke’s 10.5 in four days, wheat and triticale each took about seven days.
• All species made the highest quality forage when harvested at Feeke’s 10.0.
• Wheat and triticale declined in quality the least with TDN decreasing about 1 point for both.
• Crude Protein declined the least for hybrid rye, then triticale, followed by wheat than rye.
• Harvest date also had a significant effect on yield with all varieties yielding more when harvested at Feeke’s 10.5 compared to Feeke’s 10.0.
Treatment Means with the same letter are not significantly different according to Fisher’s Protected Least Significant Differences (LSD) test at alpha = 0.1.
Wet Chemistry Forage Analysis
Each forage crop has a different nutritional value based on growing conditions and maturity. By testing the forage livestock producers can better meet their livestocks growth and maintenance potential.

For inquiries about this project, contact Jason Hartschuh (hartschuh.11@osu. edu) or Allen Gahler (gahler.2@osu. edu).
Determine yield and feed quality of winter annual forages.

Planting Date 10/24/2019
Harvest Date 5/20/2020, 5/27/2020
Variety See Treatments
Population 150 lbs/ac
Acres 1
Treatments 10
Reps3
Treatment Width 10 ft.
Tillage Minimum Till
Management Fertilizer, Herbicide
Previous Crop Soybeans
Row Spacing 7.5 in.
Soil Type Hoytville Clay Loam, 100%
This study used a small plot, randomized complete block design.Plots were sampled at Feeke’s 10.0 (boot stage) and Feeke’s 10.5 (heading). Samples were then sent for analysis at a commercial forage testing lab. All treatments were hand harvested and dried for analysis.

County

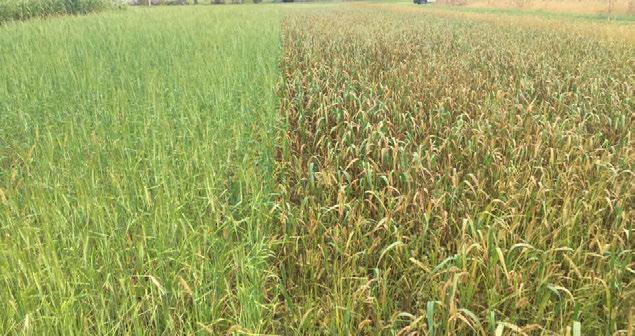
Forage barley had poor germination and stand; therefore; was only measured for forage quality. Forage barley, wheat, and triticale matured at similar rates, whereas rye varieties were slower maturing.
• Rye varieties were the most productive; however, when evaluating forage quality wheat and barley proved to be more digestible.
• Harvesting in the boot stage of growth, Feeke’s 10.0 will resulting in higher quality forages.
• Consider tonnage and feed quality needs when selecting forage varieties to plant.
Treatment Means with the same letter are not significantly different according to Fisher’s Protected Least Significant Differences (LSD) test at alpha = 0.1.
Harvest Lab
Harvest Lab allows producers to monitor dry matter in real-time throughout the field. This data combined with mass flow allows for yield mapping during silage harvest.

For inquiries about this project, contact Jason Hartschuh (hartschuh.11@osu. edu) or Garth Ruff (ruff.72@osu.edu).
Agriculture plays a key role in meeting water quality challenges in Ohio. In 2020, eFields research was expanded to better understand how management practices can help improve environmental stewardship, sustainability, and profitabilty. This research aims to help Ohio farmers improve the resiliency of their farm operations. Below are highlights of the 2020 eFields soil health and water quality research:
88 soil health trials 2 other studies
For more soil health and water quality research from The Ohio State University’s College of Food, Agricultural, and Environmental Sciences and Ohio State University Extension, explore the following resources:
Faculty and staff in the College of Food, Agricultural, and Environmental Sciences have a long and productive record of conducting research, teaching, and extension/outreach activities to address Ohio’s pressing water quality challenges. For more information, please visit: waterquality.osu.edu/
Local solutions will be critical to solving water quality challenges. OSU Extension has assembled a team of water quality associates to help meet local needs of farmers in Northwest Ohio. Learn more at the OSU Extension Water Quality website here: go.osu.edu/waterqualityextension
Soil health is a critical impact for many areas of agronomy, horticulture, and natural resources, with ties to entomology, plant pathology, engineering, chemistry, and many other disciplines. Information related to soil health assessment, management, and research can be found on the Soil Health website: soilhealth.osu.edu




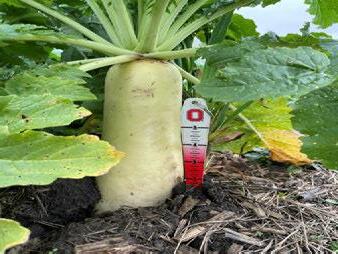

Selecting the most effective best management practices (BMPs) for the specific field situation is critical for success. Learn about critical concerns and the BMPs that can help address them at the Ag BMP website here: agbmps.osu.edu
H2Ohio is Governor Mike DeWine’s initiative to ensure safe and clean water for all Ohioans. It is a comprehensive, datadriven approach to improving water quality over the long term. H2Ohio focuses specifically on reducing phosphorus, creating wetlands, addressing failing septic systems, and preventing lead contamination. Learn more at: h2.ohio.gov


Examine the effect of agricultural management practices on soil organic carbon, crop yield, and greenhouse gas emissions using an ecosystem model.
Model Inputs
• Ground-truth data: water and nitrate leaching (daily) and crop yield (annual) collected for years 2016-2017
• Soil: pH (6.6), bulk density (1.24 g/cm3), clay fraction (0.58%)
• Climate: Daily max/min temperature and precipitation from the National Weather Service
• The model was calibrated and validated before simulation of various alternative scenarios.


Collaborating Farm OSU Extension Statewide

Six crop production management scenarios were evaluated in this study. These management scenarios included current practice in the study site, current practice without winter wheat, and a combination of corn-soybean rotations with and without winter wheat and tillage and no tillage. Soil organic carbon (SOC), crop yield, and greenhouse gas fluxes such as CO2, N2O and NH4 were evaluated across these scenarios. The biogeochemical model, DeNitrification DeComposition (DNDC), was run over a 30-year period using climate data for the period of 1989-2019.
Scenarios
Abbreviation Tillage Cover Crop Fertilizer
Current practice: Corn-winter wheat– alfalfa (x 3 years) CP-W-A3 Mixed Yes M + I
Current practice: no cover crop (corn-alfalfa (x 3 years) CP-A3 Mixed No M + I
Corn-winter wheat-soybean, conventional till C-W-S-CT Yes Yes I
Corn-winter wheat-soybean, no-till C-W-S-NT No Yes I
Corn-soybean, conventional till C-S-CT Yes No I
Corn-soybean, no-till C-S-NT No No I M—Manure application, I—Inorganic or synthetic fertilizer application; alfalfa (x 3 years) - alfalfa for 3 years
May 21-Corn planting
May 21-N fertilization(52 kg N/ha)
Jun 16 –Side dress (52 kg N/ha)
Sep 22 - Corn harvest (35 Mg silage/ha)
Oct 10 - Wheat planting
Management and Crop Rotation Details
Mar 29 - N fertilization (78 kg N/ha)
July 4 - Wheat harvest (5Mg grain/ ha)
August 16 - Chisel till Aug 22 - Disc & harrow till Aug 23 - Manure application (313 kg N/ha, 82 kg P/ha)
Aug 28 - Alfalfa planting
The preliminary results indicated that the current management practice involving corn, winter wheat and alfalfa for three years in rotation can result in higher soil organic carbon compared to other rotational practices using only corn and soybean.
In general, winter wheat and no-till practices can result in higher than average net increase in soil organic carbon compared to conventional tillage practices and no winter wheat.
Crop yield did not vary significantly across management scenarios.
Management practices involving alfalfa and winter wheat resulted in higher greenhouse gas fluxes than other practices, suggesting additional evaluations of these practices under various soil and weather conditions.
Jun 30 - Alfalfa harvest (4033 kg/ha)
Jul 6 - Gypsum fertilization (9 Mg/ ha)
Aug 5 - Alfalfa harvest (2 Mg/ha)
Sep 15 - Alfalfa harvest (1.7 Mg/ha)

Percent change in 30-year average annual crop yield, soil organic carbon and greenhouse gas fluxes for five alternative scenarios relative to the current practice (CP-W-A3).
• Management practices incorporating no-till and winter wheat have the potential to increase soil organic carbon. Cover crop and no-till practices had a negligible impact on corn yield based on these data.
• Greenhouse gas fluxes were found to be higher with winter wheat in the cropping rotation, but additional research is needed on this topic.
DeNitrification DeComposition (DNDC) Model
DNDC is a computer simulation model of carbon and nitrogen biogeochemistry in agroecosystems. It can be used for predicting cropsoil-water-nutrient dynamics under a range of management practices in the agricultural production systems.

For inquiries about this project, contact Sami Khanal, Assistant Professor, Food, Agricultural and Biological Engineering (khanal.3@osu.edu).
Examine spatial and temporal patterns of cover cropping practices using satellite imagery.
Study area Maumee River Watershed
Total area 6,690 square miles
Total cropland area 70% (4,683 square miles)
Cover crops All winter species
Intra-annual period October to March
Inter-annual period 2008-09 to 2018-19
Satellite images Sentinel 2 and Landsat 7/8
Cropland DataUSDA Cropland Data layer


Cloud-free satellite images collected during the months of October to March for the period of 2008-2019 were selected for this study. These satellite images cover visible-Near infrared (vis-NIR) spectral region in the electromagnetic spectrum. Three meter resolution imagery from PlanetScope, collected during fall, were manually digitized based on the reflectance in green waveband to create a ground-truth database comprising of cover crop and non-cover crop fields. Spectral reflectance data for each field were then considered during the calibration of the random forest classification algorithm. While 80% of the groundtruth data were used to calibrate the algorithm, 20% were used for validation. The classified imagery were then masked using cropland data layers from USDA to consider only the fields that were in corn or soybean as summer crops prior to cover crop planting. Once trained and validated, imagery between 2008 and 2019 were processed to estimate the acres of cover crops present during the winter months.

Illustration of the data processing and classification framework used.
Preliminary results indicated that less than 20% of total agricultural areas of the Maumee River watershed were in cover crops during the period of 2008-2019. The 2014/15 and 2015/16 period had the lowest cover crop percentage of agricultural areas in the region but were also the years where crop production increased based on USDA data. Fall precipitation and cover cropped fields were found to be negatively correlated, indicating that higher precipitation in the fall can have adverse impacts on overall establishment and acres planted for cover crops within the watershed.

Spatial pattern of cover crop areas in the Maumee River Watershed for 2015 and 2016.

Satellite-based cover crop areas in the Maumee River Watershed during the fall of 2008-2018 period.
Based on preliminary analyses, a trend existed between fall precipitation and the amount of cover crop planted in the Maumee River watershed. The analyses also indicated that less than 20% of the crop production acres have cover crops planted on them between 2008 and 2019. However, there remains a lot of work to be done on this study including analyzing weather and tillage transect data.
Google Earth Engine
Google Earth Engine (GEE) is a cloud-based platform that allows visualization and analyses of more than 40 years of historical and current satellite imagery.

For inquiries about this project, contact Sami Khanal, Assistant Professor, Food, Agricultural and Biological Engineering (khanal.3@osu.edu).
Survey farm fields to better understand how soil health values are influenced by i) soil type and CEC, ii) sampling depth, and iii) past management practices such as no-till and cover cropping.


Measuring soil health properties represents a great opportunity to better understand how farm management practices impact key soil functions. Soil health testing builds on our current methods of soil testing to provide additional information to farmers. Rather than focusing solely on soil chemistry, additional biological and physical components of soil are incorporated into a common framework. Building and maintaining high functioning soils require that all three key components (chemistry, biology and physical structure) to be consciously managed and optimized. There are many potential soil health measurements or indicators to choose from. For this study, we selected the following three indicators:
1. Total organic matter. A very important soil property that is has long been recognized as a master variable in soil. This is commonly measured in routine soil testing.
2. POXC (permanganate oxidizable carbon). POXC (aka, ‘Active C’) is a biologically active pool that represents a small fraction (<5%) of total organic matter. POXC is a more sensitive indicator of changes in management practices compared with total organic matter, which changes slowly over time. In contrast POXC represents a more dynamic pool of organic matter and nutrients that are more rapidly cycled and plant available.
3. Aggregate stability. Soil aggregation is the essence of a soil’s structure. Soil minerals (sand, silt, clay) are bound together by organic matter to form micro-aggregates which, in turn assemble to form macro-aggregates. Aggregate stability is measured as the ability of a soil to hold together and not slake in water. This relates to greater pore space for gas exchange, faster water infiltration, resistance to water and wind erosion and compaction by traffic.
Soils were sampled from 88 fields across 26 counties in Ohio in May-July 2020. Soil cores (10-15 cores per sample) were taken from 3 different depths:
• 0 – 4 inch
• 0 – 6 inch
• 0 – 8 inch
Soil cores from each depth were pulled from the same locations. Fields represented different soil types and management histories (ex., long-term no-till vs. recently tilled, history of cover crops vs. no recent cover crops). All soils were mailed to the Ohio State Soil Fertility Lab for analyses. Analysis included:
• Routine nutrient analysis: pH, total organic matter, cation exchange capacity (CEC), Mehlich-3 extractable nutrients
• Permanganate oxidizable carbon (POXC)
• Aggregate stability (only run on a subset of samples)
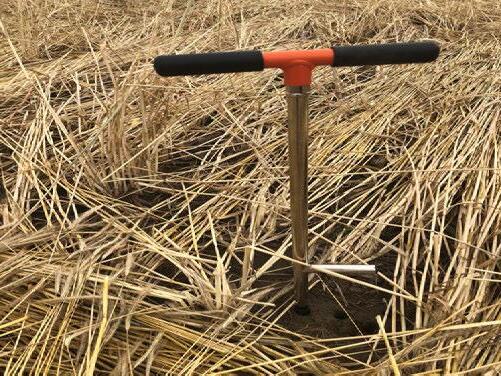
A primary challenge of quantifying soil health is to know how soil type influences your values and what represents a ‘good’ vs. ‘bad’ value. Cation exchange capacity (CEC) is a reasonable predictor of soil type, with sandy soils having low CECs and clay soils having higher CECs. We examined how CEC was related to total soil organic matter, POXC (a biologically pool of organic matter), and aggregate stability (Figure 1). Overall, all three measurements increased as CEC increased. However, the slope (steepness) of the blue line represents the influence the CEC has on the soil health variable. Both total organic matter and aggregate stability had a stronger relationship with CEC than POXC. This suggests that POXC is less influenced by soil type, and more reflective of soil management history than total organic matter. This agrees with other studies that have shown this same trend.

Figure 1. The influence of cation exchange capacity (CEC) on total soil organic matter, permanganate oxidizable carbon (POXC) and aggregate stability. Total organic matter is strongly driven by soil type, that is CEC, but POXC is influenced more by management.
As expected, most soil properties differed according to the depth the soil was sampled. The shallower depth (0-4”) yielded greater values than the deeper sampled soils (0-6” or 0-8”). Nutrients and organic matter are naturally stratified in soil (enriched at the surface) relative to deeper depths. This underscores the importance of keeping sampling depth consistent between samplings and over time to be able to evaluate trends in soil test values.
Table 1. Soil properties by depth, averaged across all fields. Nutrients and organic matter were enriched in shallow depths (0-4”) relative to lower depths (0-8”).
Survey farm fields to better understand how soil health values are influenced by i) soil type and CEC, ii) sampling depth, and iii) past management practices such as no-till and cover cropping.
Influence of No-Tillage


Years in no-tillage had mixed effects on soil health in farmers’ fields (Figure 2). Measurements of total organic matter and POXC had a weak, but slight negative relationship with years in a no-till. However, aggregate stability increased on average as years in no-till increased. Overall, no-till did not show a clear trend in soil health, likely indicating that differences in soil type and other management practices need to be examined when considered effects of long-term no-till practices.

Figure 2. The influence of years in no-till on soil organic matter, POXC and aggregate stability.
Influence of Cover Crops
The number of years a field was in continuous cover crops was associated with positive increases in all three soil health measurements (Figure 3). These relationships were weak, but suggest that long-term cover cropping is associated with positive increases in soil health.

Figure 3. The influence of years growing cover crops on soil organic matter, POXC and aggregate stability.
• Soil type matters. The type of soil has a major influence on soil health properties. We need to adjust what a ‘good’ soil health value is based on the type of soil. As CEC increases:
• Total organic matter, POXC and aggregate stability increase
• Depth of soil sampling matters. As sampling depth increases, soil values typically decrease. We need to consider the depth sampled when we examine soil health values and be consistent with depth the soil is sampled over the years.
• Management matters. The way soils are managed over time have large impacts on soil health. Across 88 fields, we found that:
• Years in no-till was associated with both increase and decreasing soil health values
• Years in cover crops was associated with increases in soil health values
• Much more work is needed. Although we analyzed 261 soil samples from 88 fields, this dataset in no way is comprehensive and additional work is needed to better understand the trends observed here.

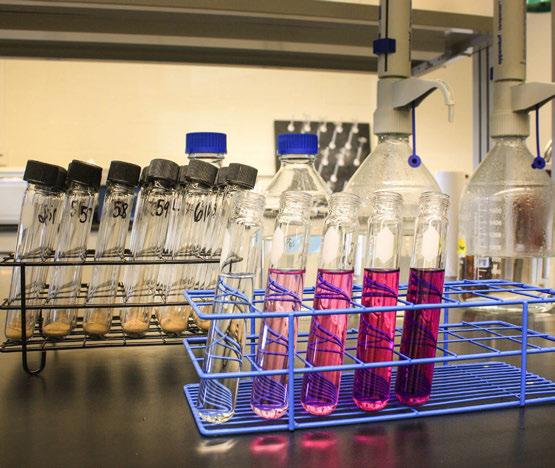
Soil samples were collected from fields across Ohio (counties highlighted in red are where samples were collected) and lab analyses that help characterize soil health.
Soil Health Evaluation
Soil samples can be used to better understand changes in the soil over time. Total organic matter, POXC, and aggregate stability are lab tests to consider when tracking soil health.
For inquiries about this project, contact Steve Culman (culman.2@osu.edu), John Fulton (fulton.20@osu.edu), or Elizabeth Hawkins (hawkins.301@osu. edu).
Helping growers make the most of precision and digital ag technologies.
The Digital Ag program at The Ohio State University embodies the best of the land grant mission - creation, validation and dissemination of cutting-edge agricultural production technologies. The central focus of this program is the interactions of automation, sensing and data analytics to optimize crop production in order to address environmental quality, sustainability and profitability. The team works on the development of hand-held devices for in-field data collection, apps that aid in calibration of applicators, remote sensing and monitoring, and enhanced data analysis for shorter turnaround time.
For more technology research and information from The Ohio State University’s Department of Food Agricultural and Biological Engineering and industry partners, explore the following resources:
Today’s agricultural community relies on data and tools to help support decision making at the field level. Data-driven insights help agronomists and farmers to predict what is coming, and decide how to act upon this information more effectively, which can improve on-farm decision making and execution. Ohioline is The Ohio State University’s Fact sheet database with helpful information on a variety of subjects. For the full database visit: ohioline.osu.edu/findafactsheet
On-farm technology and data management services help farmers maximize production and become more sustainable. Tech Toolshed is a soy checkoff resource to help you maximize the technology you currently have while integrating new technology and managing the data available. The USB- Tech Toolshed website can be found at: unitedsoybean.org/techtoolshed/
The Ohio State Digital Ag Program conducts studies related to all aspects of the corn production cycle. Research related to corn planting, cropping inputs, and harvesting technology can be found on the Precision Ag website: digitalag.osu.edu


Experience and learn about cover crops, nutrient management, soil health, no-till equipment, digital ag, and other topics essentials for success.
2021 Events: March 9-12
Virtual Conservation Tillage Conference ctc.osu.edu
April 7
Ohio No-Till Spring Field Day
Fairfield County - David Brandt Farm 6100 Basil Western Road, Carroll, OH
August 18
Ohio No-Till Summer Field Evening
Highland County - Nathan Brown Farm 6110 Panhandle Road, Hillsboro, OH


August 19
Ohio No-Till Summer Field - Morning Madison County - Fred Yoder Farm 7050 Butler Avenue, Plain City, OH
August 19
Ohio No-Till Summer Field - Evening
Darke County - Keith Kemp Farm 959 Georgetown-Verona Rd., West Manchester, OH
December 3
Ohio No-Till Conference
Union County - Der Dutchman Restaurant 445 S. Jefferson Avenue, Plain City, OH
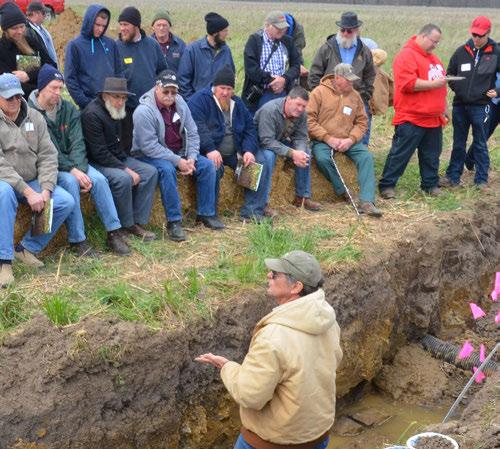


Technology is quickly advancing worldwide, and we are becoming more dependent on it for both our work and personal lives. Agriculture is utilizing these advancements to improve precision agriculture (PA) technologies on farms to maximize profits and increase efficiency. Today, as many farm machines leave factories with data collecting technologies installed, there is potential to collect large volumes of data from a farm including yield maps, as-applied maps, as-planted data, remote sensed imagery, weather, and scouting data. However, this technology tends to require complex methods for accessing and interpreting data collected. Creating a digital strategy for the farm helps farmers plan for, manage, and implement the findings of collected data. A digital farm strategy is a plan for collecting, organizing, storing, sharing, and securing farm data that improves operations by maximizing revenue and reducing costs and risks. Setting goals and outlining ways to collect and use data is important to the strategy as many farms already collect data but do not realize it or understand how to use the data. The focus should be placed on saving, securing, and sharing the data as the outline is created. The use of data in agriculture has been proven to provide value for a farm, so follow the steps below to develop a digital strategy
1. Identify the precision agriculture technologies being used on the farm.
2. Identify the data collected by these technologies.
3. What is your objective for the data being collected?
4. What data and digital tools do you plan to use to meet that objective and why?
5. Are you using any digital tools? If so, list.
6. If not using any digital tools today, do you plan to use any in the future?
7. What, person and/or entity, do you plan to share data with? List all.
8. What specific data do they require you to share with them? List all.
9. How do you plant to share data both internally and externally?
10. What is your internal plan to store, archive, and secure data?
• Do you have a local storage device at the farm (i.e., laptop, external hard drive, server)?
• Do you use an agriculture cloud storage service (i.e., Box, DropBox, Google Drive, etc.)
• Do you use an agriculture cloud platform (i.e., JD Operations Center, Climate FieldView, Encirca, etc.)?
• How do you back-up or have a 2nd copy of your data?
11. Do you have a means to review and understand data agreements?
12. How do you define success and evaluate the outcomes of your strategy?
Farms have collected and used data for a long time, but in the 1990s data collection transitioned to digital forms that allow machinery to collect and store data. Today, it is common for new equipment to already have precision agriculture technology installed when it leaves the factor. These tools help farms become more efficient, yet there are hurdles necessary toovercome to maximize the benefits of the technologies. For example, the learning curve of farmers is steep. In addition, data compatibility creates challenges as connecting data collected from various brands of equipment can be difficult. File formats create another hurdle as they require special technology to view and use them. While precision technology presents some challenges, the amount and variety of data can significantly benefit farming operations.


• agronomy- based information
• includes: yield, soil type, soil texture, soil fertility, pesticides applied, and scouting information
• data supports fertilizer and environmental decisions
• used to track pests and diseases and make spraying decisions
• machinery-based information
• includes: engine RPM, ground speed, slip, gear selection, GPS location, and hydraulic pressure
• used to analyze operating costs and field capacity
• collected data is transformed into a prescription that is used by a machine’s display
• provides:shade, moisture, weeds, insects, sunlight, and soil nutrients information
• used to determine inputs, application rates, and other practices that maximize yields and profits
• data collected by drones
• includes: soil patterns, drainage patterns, and subsurface tile locations in addition to imagery that collects information not seen by the human eye such as infrared
• used to create variable rate prescription maps
• all other data including farm data, notes, weather data, application dates, and planting dates
Data compatibility creates challenges as transferring and sharing data collected from various brands of equipment can be difficult. File formats create another hurdle as they require special software to view and use them. Most file formats generated by precision agriculture technologies are proprietary in nature meaning you need special software to read and use it. Other aspects to consider is data storage, sharing and legal aspects around farm data. Storing data properly is a critical part of using data effectively. Data should be archived in both an on-farm and off-farm storage location (i.e., “in the cloud”) to ensure there is a backup that can be accessed in any scenario. On-farm data storage should be in a locked, fireproof safe, while cloud solutions should be password-protected and should utilize any available cyber security features. The ability to efficiently share farm data is becoming important as companies and consultants provide PA services and the use of digital technologies on the farm. Sharing farm data can be difficult if a clear plan for storing and organizing data has not been outlined in a digital strategy. Finally, When dealing with mobile applications, digital tools, and equipment and devices connected to the internet, farmers must adhere to any legal agreements that have been established. These data agreements will outline important considerations, such as data privacy and how data can be used within or outside of a company, including by affiliates. It is therefore important to incorporate the legal implications of collecting and sharing farm data into one’s farm digital strategy. While precision technology presents some challenges, the amount and variety of data can significantly benefit farming operations.
You can learn more by reviewing the Fact Sheets located on Ohioline:
• FABE 555 Developing a Farm Digital Strategy 1 - Introduction: https://ohioline.osu.edu/factsheet/fabe-555
• FABE 556 Developing a Farm Digital Strategy 2 – Precision Technology and Data Generation: https://ohioline.osu.edu/ factsheet/fabe-556
• FABE 557 Developing a Farm Digital Strategy 3 – Data Management Considerations: https://ohioline.osu.edu/factsheet/ fabe-557
The objective of this study was to assimilate and categorize current digital technologies available to farmers today. A variety of digital technologies that aid in collecting and analyzing data for farmers were evaluated. The digital technologies and associated information were organized and thereby reported within six categories: data warehousing, production benchmarking, production analysis, in-season monitoring, crop modeling, and recommendations. The main objectives of the study were three-fold: provide a clearer understanding of technology adoption and limitations, consider alignment of a digital tool to a producer’s intended use if adopted, and to give insight to producers considering the adoption of digital technologies in each of the six categories.


Ohio State Digital Ag Program
Franklin County
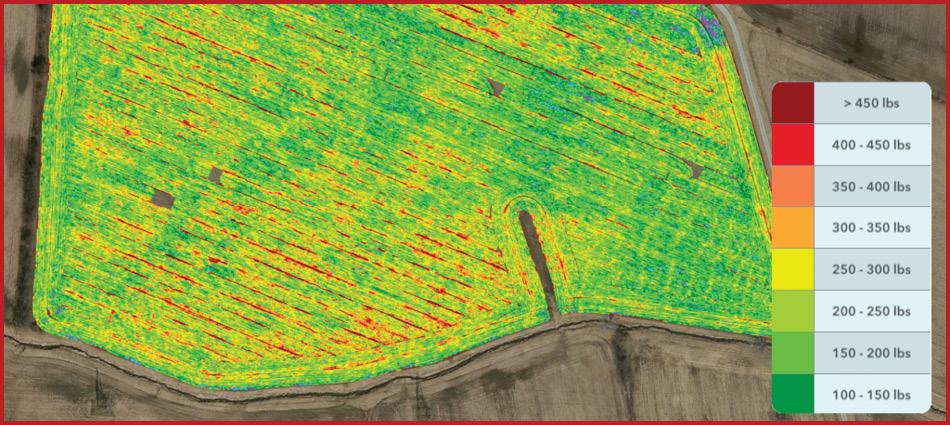
The digital tools available today are critical for making data layers such as yield accessible and usable for consultants and farmers.
Research was completed using online sources, print materials, and other media outlets to identify commercially available digital tools and services. Websites and personal phone calls were used to better understand the intent of each digital technology and characterize it into one of the categories. This information was also used to establish a description for each digital technology category.
The categories listed below define how digital technologies fit the needs of farmers depending on product capability and services that are offered. Categories ranged from data storage to evaluation of crop performance and illustrated the diverse solutions available to farmers and consultants using these digital technologies.
Data Warehousing - Cloud storage for any type of data. Technologies that allow producers to have a centralized location to store data. Data sharing and organization may or may not be functionality provided by a platform.
Production Benchmarking - Ability for producers to benchmark themselves against other similar farms. These technologies provide comparative insights regarding agronomic response, yield, costs, profit margins, and possibly other aspects.
Production Analysis - Platforms where producers can analyze their production data (agronomic, machine, imagery, etc.) and information permitting insights to support decisions.
In-Season Monitoring - Facilitate in-season monitoring of crop health, development, and stress during the growing season. These technologies may harness imagery or organize/simplify scouting notes to identify problem areas quickly
Crop Modeling - Includes crop modeling to estimate crop needs (e.g. nutrients) and crop development providing information to support in-season decisions or provide information such as yield estimates.
Recommendations - Most platforms providing recommendation capabilities can link producers to trusted consultants and advisors so they can support the recommendation process.
Although some digital technologies identified in 2017 are no longer offered, there has been a significant increase in the number of digital technologies and associated precision ag services available to farmers. There are more companies offering extensive digital ag tools with others constantly coming to the market.
Many companies have consolidated and merged their technologies, integrating separate products into one comprehensive platform or mobile application. These technologies require farmers to share data in order to receive the full benefits of the services and recommendations provided.
The biggest limitations of these tools have been the limited value provided to farmers and the time and data required to setup the tool. Time and data requirements to setup a tool can be challenging to farmers primarily due to the lack of data sharing between tools or platforms.
Mobile devices like smartphones and tablets can place information and data tools in the hands of producers like never before. Apps are available to check weather, track equipment, monitor crop health, calculate crop nutrient uptake and requirements, and much more.
• In 2020, it was found that over 200 digital technologies are currently available to farmers and consultants.
• Because of the volume of technologies offered and challenges associated with comparing available products, it can be difficult for farmers to identify their value and how these services and tools can be implemented within their farm operations.
• The highest growth of digital tools has been in the categories of data warehousing and inseason monitoring (APPs to support scouting).
• Once the ag tech community finds solutions to the logistical problems of data management, these technologies will be able to translate data into information that can bring further value to farmers and consultants.

For inquiries about this project, contact Cori Lee (lee.8889@osu.edu) or John Fulton (fulton.20@osu.edu).
Unfortunately, given the realities of the COVID-19 pandemic, the Farm Science Review (FSR) was forced to go viral this year. To preserve a portion of field demonstration activities, the eFields Team banded together to provide a virtual experience that we believe improves on traditional field demos. Using technology, we attempted to create experiences that allow farmers to view field machinery performance from perspectives never imagined before. The tables below and on the next page provide links to multiple video formats (i.e., 3D, 2D, drone and high speed) that enable farmers to enter the virtual world. Our hope is to improve on these experiences and extend access to FSR field demonstrations available year-round, and to farmers from around the world. As always, we appreciate your comments and suggestions. Please email the Digital Ag Team at digitalag@osu.edu as we value your input!
We express our sincere appreciation to Chris Lursen, Roger Lewno and CJ Parker of Case IH; Brooke Beam, Elizabeth Hawkins, Andrew Klopfenstein, Chris Wiegman, Ryan Tietje, Nate Parsons, Forrest Lang, Chip Tuson and John Fulton of OSU-FABE; and Nate Douridas, Garrett Nowak, Matt Sullivan and Nick Zachrich of OSU-FSR for their assistance with staging and chronicling the field demonstrations. We also thank DEWEsoft, Dytran Instruments, Inc. and GRAS Sound and Vibration for their helpful suggestions and instrumentation supplied in support of field data collection.
The information provided on these web sites is intended for educational purposes only. Mention or use of specific products or services, along with illustrations, does not constitute endorsement by The Ohio State University. The Ohio State University assumes no responsibility for any damages that may occur through adoption of the programs/techniques described in this document.


Video


Video Description
Chris Lursen (Case IH) Overviews Tillage Considerations and Features of the EcoloTiger 875 Disk Ripper
Composite Video of EcoloTiger 875 Disk Ripper Tillage Tool During Field Operations
View from within Front Disk Gang of EcoloTiger 875 Tillage Tool During Field Operation
View from within Ripper Shanks of EcoloTiger 875 Tillage Tool During Field Operation


Video Description
View from Tractor Hitch Towards EcoloTiger 875 Tillage Tool During Field Operation
View from Center Rear of EcoloTiger 875 Tillage Tool During Field Operation
Dashboard
View of Tractor Monitor and Rear View from Tractor Cab with Synchronized Tillage Tool Draft Force Data During Field Operation

Video Type QR Code


Video Description
In-Cab View of John Deere S770 Combine During Corn Harvest
Video Type QR Code


View of Head from John Deere S770
Combine During Harvest
View from Grain Tank of John Deere S770
Combine During Corn Harvest
View from Unloading Auger on ohn Deere S770
Combine During Corn Harvest


Video Description
View from Grain Cart of John Deere S770
Combine During Corn Harvest
Composite Views of John Deere S770
Combine During Corn Harvest
View of Deck Plates on John Deere S770
Combine During Corn Harvest (Full Speed Video)
View of Deck Plates on John Deere S770
Combine During Corn Harvest (Slow Motion Video)

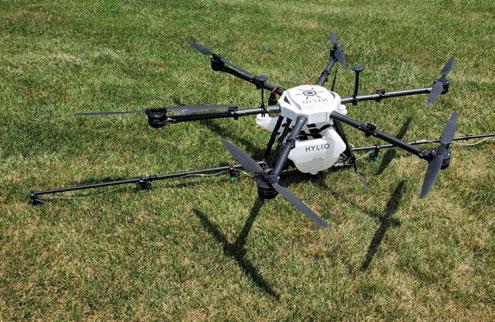
Air Tractor AT-504 Aerial Applicator
Video Type QR Code


Video Description
Brooke Beam Discusses Aerial Application using the Air Tractor AT504 and Crop Surveying using Drones

Hylio AG-116 Spray Application Drone
Video Type QR Code


Video Description
John Fulton Discussing Hylio AG116 Spray Drones and Other Drone Applications in Agriculture
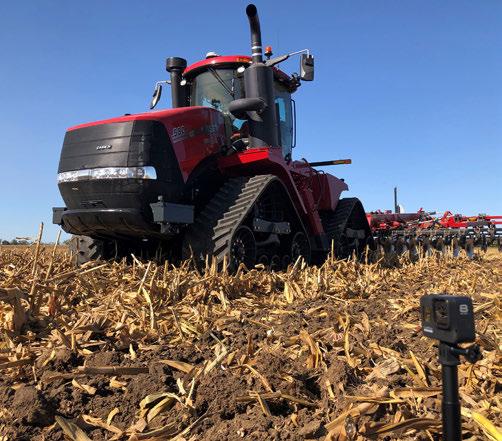
To evaluate the effect of vane design on spread width for dual-disc spinner spreaders.
Fertilizer – Potash (KCl) Treatments
• 4 vane designs
• 3 disc speeds (600, 700 and 800 rpm)
• 2 application rates (200 and 400 lb/ac)
Reps – 3


eFields Collaborating Farm
OSU Extension Statewide

A common dual-disc spinner spreader was used for this study with the spreader and control system calibrated prior to testing. Four different vane shapes were evaluated. The first two vanes were common to this type of spinner spreader which were tapered and open faced. However, Vane 1 had a forward tapered top edge at an angle of 32° while Vane 2 had a top edge which was tapered backwards at 15°. Vanes 3 and 4 both had C-channel cross sections with Vane 3 tapered from inside out but Vane 4 with a constant height. Treatments included application rates of 200 lb/ac and 400 lb/ac using three spinner disc speeds (600, 700 and 800 rpm). Single-pass pan testing was conducted at a ground speed of 8 mph. ASABE Standard 341.4 was followed to quantify distribution patterns by vane design over the different rates and disc-speed treatments. A single-row of 49 pans was used to capture material applied by the spreader. Pans were uniformly spaced 2.5 ft apart with the pans on either side of the center pan removed to allow the tractor and spreader to pass unobstructed. All tests used potash (KCl) and were replicated 3 times. A weather station was used to document wind speed and direction during testing.


Differences in exit location of fertilizer from the spinner disc and vane combination were observed during tests. In particular, ricocheting off the vane was visually different for each vane type and considered as a non-desirable aspect of fertilizer application with spinner spreaders. Experiences from this study showed the importance of testing and properly designing the spinner disc and vanes to maintain uniform application of dry fertilizer across cropland and pastures especially as spinner disc speed increases to attain higher spread widths. Higher disc speeds increased material ricocheting and can negatively impact spread width and uniformity. It was also obvious that the effective spread width varied by vane shape over the three spinner-disc speeds with the effective spread width increased with spinner disc speed for all four vane shapes.


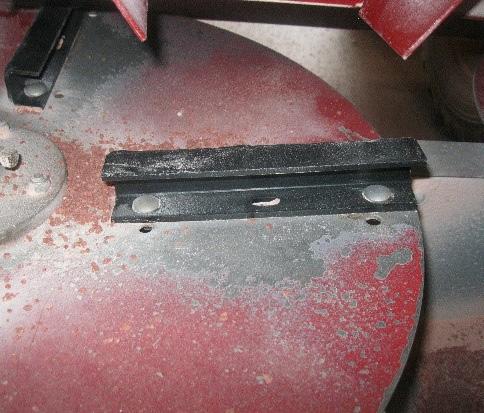
• The effective spread width for each style of vane increased as disc speed increased.
• The increase in spinner-disc speed from 600 to 700 rpm increased the effective spread width by 10 feet regardless of the vane shape.
• All four vane shapes generated equal effective spread widths of 60-feet and 70-feet at 600 and 700 rpm, respectively. However, at 800 rpm, Vane 4 generated the greatest effective spread width of 80 feet compared to 75 feet for the other three vanes (A, B, and C).
• The wider spread width for Vane 4 was contributed to the rectangular U cross-section maximizing the horizontal velocity of potash particles when exiting the vanes compared to the other three, more open faced vanes.
• In summary, vane design influenced effective spread width over the different spinner disc speeds in these tests. However, future research on different vane shapes is needed to provide more insights on designing vanes that provide more accurate and uniform surface application of granular fertilizers by spinner-disc spreaders.
SpreadCAL
SpreadCAL is an APP being developed at the Ohio State University to support pan calibration of dry fertilizer spreaders. The APP utilizes a smartphone camera to estimate the amount of material captured within collection pans then generate spread pattern results.

For inquiries about this project, contact John Fulton (fulton.20@osu.edu).
Evaluate at what scale yield monitors can be used to support on-farm, fieldscale research.
Planting Date 5/28/2020
Harvest Date 11/5/2020
Variety P0843AM
Population 35,500 sds/ac
Acres 15
Treatments 7
Reps3
Treatment Width30 ft.
TillageConventional
Management Fertilizer, Herbicide
Previous Crop Soybeans
Row Spacing30 in.
Soil Type Strawn-Crosby complex, 52% Kokomo Silty Clay, 48%


Clark County
This study took place at the Western Agricultural Research Station and was arranged as a randomized complete block design with 7 treatments across 3 blocks. The purpose of this study was to determine the length needed for an accurate representation of data when using yield as the response variable. The site dimensions were 1,000-ft. long by 630-ft. wide. Intentional yield differences were created by alternating 0 lbs N/ac nitrogen with 180 lbs N/ac. These yield differences alternated across the length of the field for the treatments at 12.5 ft., 25 ft., 50 ft., 100 ft., 200 ft., 400 ft., and 800 ft. Harvest was conducted using 2 yield monitors (Case IH yield monitor and Precision Planting yield monitor) that were mounted on a Case IH 8250 combine, a Kincaid 8-XP plot combine, and weigh wagon. The plot combine stopped every 25 ft. to allow for ground truthing of yield data while the field combine ran the entire pass without stopping at 5 mph. Data from the yield monitors was downloaded and then compared to the plot combine data.

Alternating plots were clearly delineated throughout the season. Lower temperatures and heavy rain delayed initial harvest, but did not have any negative impacts on the study. At harvest, the differences in corn height were clearly visible for the majority of the field. Yield differences while watching the yield monitors in the combine during harvest were not noticeable until the 50 ft. length treatments. Also during harvest, it was observed that some corn was lodged from animal crossings or high wind and there appeared to be a planter issue as a section had a skip. These field conditions and problematic areas were noted and not included in the analysis.
Data from the Precision Planting yield monitor compared with yield collected from the plot combine for a 100 ft. treatment.
• Preliminary observations showed no yield differences of the alternating blocks seen at 12.5 ft. or 25 ft. on the yield monitors.
• The pattern of yield differences were seen at the 50 ft. and 100 ft. treatments; however, the actual yield estimates from the yield monitor were not accurate when compared to the plot combine.
• The 200 ft. treatment more closely matched both the pattern and actual yield estimates; however, it was not until 400 ft. where estimates began to converge more frequently and accurately between the yield monitor data and plot combine yield.
Data from the Precision Planting yield monitor compared with yield collected from the plot combine for a 400 ft. treatment.
Case IH Yield Monitor
One of the yield monitors used in this study was a CASE IH (AgLeader) yield monitor that has the ability to estimate yield variations spatially across the field, supporting on-farm research trials.
• It is critical to consider to what scale yield monitor data can be accurately used to support on farm research. From preliminary results, it appears this length is around 400 ft.; however, this project and data analysis is ongoing and will aim to establish best management practices for utilizing yield monitor data.

For inquiries about this project, contact Alysa Gauci (gauci.1@osu.edu) or John Fulton (fulton.20@osu.edu).
Demonstrate strip intercropping, utilizing alternating strips of corn and soybeans to identify the relationship between them and maximize yield potential.

Planting Date 5/27/2020
Harvest Date 9/24/2020
HybridUSA 958RR
Variety LG-P28A42X
Corn Population VR - 43,000 sds/ac
Soybean Population 138,000 sds/ac
Acres 11
Treatments 4
Reps 27
Treatment Width 10 ft. and 20 ft.
Tillage No-Till
Management Fertilizer, Fungicide, Herbicide, Insecticide
Previous CropWheat
Row SpacingSee Spacing
Soil Type Crosby-Lewisburg Silt Loam, 66% Sloan Silty
Clay Loam, 21%
Miamian Silt Loam, 13%
The Farm of the Future is the longest running continuous strip intercropping demonstration. The orientation remained the same East-West outputting strips that have a north half and a south half. Previous year’s study trends developed between these two sides. This year the crop followed rotation corn on last years soybean strips and soybeans on corn. The strips were harvested in full passes with two independent machines. Each strip was harvested in the same single direction and weighed individually. Corn and soybeans were both in twin 30 inch rows.

OSU Extension
Madison County

Harvesting the strip intercropping trial.
A nice, dark, green color was consistent throughout the season and the field remained weed free. This was one of the drier areas of the state, receiving minimal rainfall during the growing season and thus was a limiting yield. The sand hills quickly burned up with the lack of rain and high July temperatures.

• The results this year were not as drastically different as previous years.
• The most yield limiting factors were lack of rain, high temperatures, and the short season crops.
• The strip concept continues to intrigue many from all over the world with different iterations trying to break through the next yield threshold.

Treatment Means with the same letter are not significantly different according to Fisher’s Protected Least Significant Differences (LSD) test at alpha = 0.1.
Unverferth Seed Tender
The Unverferth seed tender 3995XL can hold 400 units of seed for delivery right to the planter in the spring. This is also used to weigh test plots and test strips in the fall. Its equipped with an on board scales system for precise seed distribution in the spring or a weigh cart in the fall to validate yield monitor data.

For inquiries about this project, contact Andrew Klopfenstein (klopfenstein.34@osu.edu) or Ryan Tietje (tietje.4@osu.edu).
Demonstrate strip intercropping, utilizing alternating strips of corn and soybeans to identify the relationship between them and maximize yield potential.

Planting Date 6/1/2020
Harvest Date 11/7/2020
Hybrid6386SX
Variety 4668FP
Corn Population 53,000 sds/ac
Soybean Population 130,000 sds/ac
Acres 76
Treatments 6
Reps 86
Treatment Width 10 ft. and 20 ft.
TillageMinimal
Management Fertilizer, Herbicide, Insecticide
Previous Crop Corn/ Soybean Rotation
Row SpacingSee Spacing
Soil Type Brookston Silty Clay Loam, 57%
Crosby Silt Loam, 35%
This location is at a much larger scale that any of the others a full production 72 acres has been planted in these strips. The MCAC is only a small representation of what is being accomplished at this location. The rows are in a perfectly polar North/South orientation studying the effects of the sun and the row direction. This year all strips were harvested as full passes instead of incremental sections as has been done previously.

Extension
Fayette County
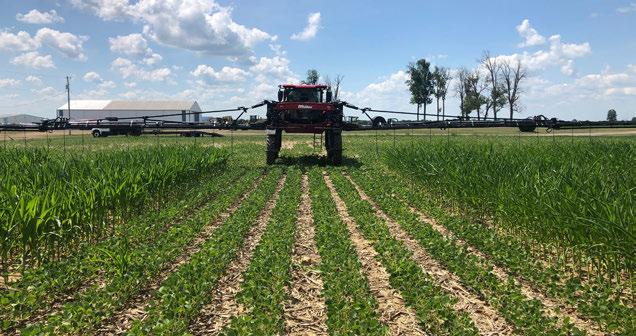
Making a nitrogen application to the corn strips.
This field had many weather extremes. Two days after planting, it got a hard pounding rain, leaving standing water in several areas. This was the last of the major rain for the rest of the season. It turned very dry and hot. Weed pressure was a challenge all year long, but stems back to the wet fall in 2019 and not getting a fall burn down or tillage pass completed.

• The results were not as drastic as in 2019, but this is most likely due to the lack of rain.
• The continuing challenge with this study is the feasibility and current equipment compliments.

Treatment Means with the same letter are not significantly different according to Fisher’s Protected Least Significant Differences (LSD) test at alpha = 0.1.
Harvest International Planter
This is one of the most current planters on the market when it comes to technology. It was originally built in 2018 by the precision ag team and continues to be updated with technology each and every year to keep up with current industry developments. Hydraulic downforce, multi hybrid on row hoppers, speedtube, 2x2x2 fertlizer and much more!

For inquiries about this project, contact Andrew Klopfenstein (klopfenstein.34@osu.edu) or Ryan Tietje (tietje.4@osu.edu).
Demonstrate strip intercropping, utilizing alternating strips of corn and soybeans to identify the relationship between them and maximize yield potential.
Planting Date 6/8/2020
Harvest Date 11/19/2020
HybridPB7250VIP3110
Variety 9728AE
Corn Population 46,000 sds/ac
Soybean Population 130,000 sds/ac
Acres 45
Treatments 4
Reps 70
Treatment Width 10 ft. and 20 ft.
TillageVertical
Management Fertilizer, Fungicide, Herbicide, Insecticide
Previous Crop Soybeans
Row SpacingSee Spacing
Soil Type Wooster-Riddles Silt Loam, 46%
Ravenna Silt Loam, 45%
This is the first year for this location with a strip intercropping system. A strip intercropping system has not been studied this far north within the eFields program, as other trials are located in central and southwestern Ohio. This location utilizes a production scale field that is a typical size for this area. Strips were in alternating 10 foot sections with a 20 foot strip of soybeans every 90 feet. This was designed for sprayer tracks and to be able to access the crop at any point in the season and not rely on a high clearance sprayer to do so. All soybean strips were 30 inch twin row beans and the corn was all 15 inch.


OSU Extension
Wayne County

Corn and soybeans in alternating strips in the trial.
This crop was in ideal conditions for the growing season. Although planting was slightly dry, the remainder of the year this field could be described as a garden spot in the state. For a short time after sidedressing, there was a little yellowing in the corn, but it quickly recovered. Harvest went smoothly even with a few strong wind storms that occurred mid-fall. The crop stayed standing very well.
• For the first year of this study in this location, the results were favorable, especially for the corn.
• Further study over the next several years will help to determine the viability of this practice.

Treatment Means with the same letter are not significantly different according to Fisher’s Protected Least Significant Differences (LSD) test at alpha = 0.1.
Veris iScan
Veris-i Scan can be pulled behind any UTV or ATV in the spring before the planter. The Veris is similar to a planter row unit its pulled through the ground taking soil temperature, OM, CEC. The information can be used to make VR seeding prescriptions and aid in fertility recommendation for the coming years. In the trials we use this information as an additional data layer to make management decisions.

1.53
8.09%
For inquiries about this project, contact Andrew Klopfenstein (klopfenstein.34@osu.edu) or Ryan Tietje (tietje.4@osu.edu).
Evaluate two hemp varieties for fiber production at various seeding rates.

Planting Date 7/1/2020
Harvest Date 10/9/2020
Variety See Treatments
Population See Treatments
Acres2
Treatments2 Reps 1
Treatment Width30 ft.
TillageVertical
Management Fertilizer
Previous Crop Soybeans
Row Spacing 7.5 in.
Soil Type Mahoning Silt Loam, 90% Haskins Loam, 10%
Seeding rate trials for two hemp varieties (Felina-32 and CRS-1) were conducted at two locations - one in Trumbull county, and the other in Tuscarawas county. Seeding rates for Felina-32 were limited to 50lb/acre 60lb/ acre due to seed availability, but CRS-1 was planted at 10lb/acre increments from 50lb/acre to 120lb/ac Trumbull county.

OSU Extension Trumbull County

Inspecting for diesease in hemp.
No herbicides are labeled for use in hemp. A good preplant weed burndown is necessary followed by a heavy stand to suppress weeds. Poor germination, or low stand counts can result in heavy weed pressure.
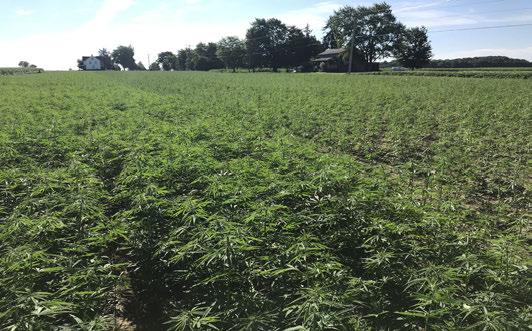
Grain Drill
This was the drill used to plant the hemp at a consistent rate. Rows allow for consistent plant spacing and allow the plants to canopy as soon as possible to suppress weeds.
• CRS-1 variety had very low germination resulting in low plant populations and a significant weed problem even with higher planting rates.
• Felina-32 outperformed CRS-1 in germination, stand establishment, weed suppression, and yield.
• Hemp was harvested and baled by variety, and due to the weediness of the CRS-1 planting, an accurate weight of yield could not be obtained.
• Due to the small nature of this study statistical analysis cannot be conducted, but plans for a replicated trial is planned for 2021.

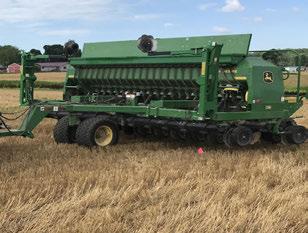
For inquiries about this project, contact Lee Beers (beers.66@osu.edu) or Chris Zoller (zoller.1@osu.edu
CV (Coefficient variation): A measure of the variability between treatment yields. Calculated as a percentage.
Interpolation: Mathematical procedure for estimating unknown values from neighboring known data.
Kriging: An interpolation technique for obtaining statistically unbiased estimates of field characteristics, such as surface elevations, nutrient levels, or crop yields, from a set of neighboring points.
LSD (Least Significant Difference): Used to compare means of different treatments that have an equal number of replications. For this report, a significance level of 0.1 (or 10%) is used. This means, when a treatment is statistically significant, a 90% confidence is attributed to that treatment actually being different from the comparison.
Mean: The average value.
Median: The midpoint of a set of observed values.
P-Value: The probability of obtaining similar results if the null hypothesis is true.
Randomization: Helps account for any variations in production and prevents data from being biased based on its location in a field.
Replication: Allows for the estimation of the error associated with carrying out the experiment. A minimum of three replications is required for proper evaluation.
Standard Deviation: A measure of dispersion in the data set. The standard deviation is used to calculate the confidence intervals.
T–Test: Also called a Student’s t-test. A statistical approach that can be used to determine if two treatments are different from each other.
AAB Line: An imaginary reference line set for each field that a tractor/sprayer guidance system to follow. There are different reference lines that can be set in a field to fit a particular geography or layout.
Active Downforce: A system that automatically adjusts the force in the air spring circuit based on soil condition information gathered from row unit gauge wheel sensors.
Aerial Imaging: Photos taken, or images collected, from aircraft to assist growers and consultants in determining variations within an area of interest such as a farm field.
Agronomic Data: Represents data compiled from a specific farming operation or at the field level generally related to agronomy based information such as yield, population, hybrid, nutrient application. Agronomic Data is tied to the land or field where it was generated. Types of Agronomic Data include (but are not limited to) hybrid selections, plant populations, yield data, soils data, pesticide application details, and scouting information. Data generated from a yield monitor can be used to document yields, and for on-farm seed trials. In addition, yield monitor data can be used to make genetic, environmental, and management effect analyses. Soils data is being used to make fertilizer and regional environmental compliance decisions, while scouting data is being used to make spraying decisions as well as regional pest or disease analytics.
Algorithm: An ordered set of rules or instructions written as a computer program designed to assist in finding a solution to a problem. For example, an algorithm can be created to permit a microprocessor to relate sensor input to actuator output on board a crop chemical applicator.
Application Rate: Amount of seed distributed, expressed as a number, mass or volume of seed per unity of length or surface.
As-Applied Map: Is a map containing site-specific information about the location and rate of application for fertilizer or chemical input. Usually created with a GPS equipped applicator and data logger.
Automatic Section Control (Auto Swath): Turns application equipment OFF in areas that have been previously covered, or ON and OFF at headland turns, point rows, terraces, and/or no-spray zones such as grass waterways. Sections of a boom or planter or individual nozzles/rows may be controlled.
Autonomous Operation: Vehicle guidance without the need for human intervention. A tractor may be driven by a series of on-boards sensors and GPS for precision driving without damage to crops.
Auto-Steer: A GPS guidance system that steers agricultural equipment with centimeter accuracy. This level of accuracy requires real time kinematic (RTK) correction of GPS signals. Auto-steer is an add-on component for equipment. It includes both the GPS system to receive and process the signals, software and hardware to allow the input of control maps and the mechanical equipment to actually steer the tractor. Some new tractors are available “auto-steer ready.”
Base Map: A simple map that shows the boundaries of a field or section and information about any unique feature (sinkholes, or streams).
Base Station: The RTK-GPS receiver and radio that are placed in a stationary position, functioning as the corrections source for roving tractor units in an area. These stations can be either portable or permanently installed systems and their coverage can range from 5 to 10 miles depending on topographic conditions, antenna height, and radio-transmit power. Also called a reference station, is a receiver located at a surveyed benchmark. The base station calculates the error for each satellite and through differential correction, improves the accuracy of GPS positions collected at unknown locations by a roving GPS receiver.
Baud Rate: Rate at which information is transferred in a communication channel. Refers to the number of signal or symbol changes that occur per second. Higher baud rates have more bits per second transferred.
CCAN-Bus (in tractors and implements): CAN-Bus is a high-speed, wired data network connection between electronic devices. The hardware/wiring of CAN-Bus networks are generally the same, while the protocols for communication can be different and vary depending on the industry where they are used. These networks are used to link multiple sensors to an electronic controller, which can be linked to relays or other devices on a single set of wires. This reduces the amount of wires needed for a system and allows for a cleaner way to connect additional devices as system demands change.
Cation Exchange Capacity (CEC): Represents the total quantity of negative charge that is available in the soil to attract positively-charged ions in the soil solution.
Cloud: A global network of servers, each with a unique function. The cloud is not a physical entity, but rather an extensive network of remote servers around the globe that are connected online and operate as a single ecosystem. One access a cloud platform online from any internet connected device.
Cloud Platform: Represents the hardware and software infrastructure for a cloud computing service that includes
application enabling users to create and manage their own accounts and data within their accounts and/or others. John Deere’s Operation Center and Climate Corp’s Fieldview would be example cloud platforms built for agriculture.
CLU (Common Land Unit boundary): The smallest unit of land that has a permanent, contiguous boundary, a common land cover and land management, a common owner and a common farmer in agricultural land associated with USDA farm programs (source USDA). CLU boundaries are delineated from relatively permanent features such as fence lines, roads and/or grassed waterways. They have attributes geospatially linked in a database format and also information in a tabular format, which is not geospatially referenced, but it can be queried for each producer.
Cluster sampling: A technique in which observation units in a population are aggregated into larger sampling units known as primary units.
Survey grade communication & differential corrections. There are three different forms (CMR, CMR+, and CMRx) and the difference between them is the amount of correction data that can be obtained due to the amount of satellites. It’s common to see this term using Trimble GPS systems.
Confidence Interval: The confidence interval represents the range of values for a given level of significance.
Contour Map: Yield map that combines dots of the same intensity and/or yield level by interpolating (or kriging).
Coordinate System: Used in GPS/GNSS navigational systems to reference locations on Earth. There are many coordinate systems but frequently used ones include: latitude and longitude, Universal Transverse Mercator (UTM), and State Plane coordinate systems.
Continuously Operating Reference Station (CORS) [Network]: A network managed by the U.S. office of National Ocean Service (NOAA) to provide GNSS data consisting of carrier phase measurements throughout the United States. CORS eliminates the need for producers to purchase a personal base station, thereby lowering investment costs for RTK applications, and initial research has indicated that CORS can provide RTK-level correction within a 20 mile radius of the station’s location. Because CORS data is transmitted over the internet there are no line of sight requirements as with radio transmitted signals.
Crop Practice: The customary and systematic husbandry actions undertaken in establishing and caring for the crop.
CV (Coefficient variation): A measure of the variability between treatment yields. Calculated as a percentage.
Data Layer: A layer of information on a GIS map. A map can have many layers to present different types of information. For example, the first layer of a map may be a satellite image of an area. The next layer may have only lines that represent roads or highways. The next layer may contain topographic information and so forth.
Database: A collection of different pieces of georeferenced information (yield, soil type, fertility) that can be manipulated (layered) in a GIS model.
Differential Global Positioning System (DGPS): A method of using GPS which attains the position accuracy needed for precision farming through differential correction.
Differential Correction: Correction of a GPS signal that is used to improve its accuracy (to less than 100 m/~330 ft) by using a stationary GPS receiver whose location is known. A second receiver computes the error in signal by comparing the true distance from the satellites to the GPS measured distance
Digital Elevation Model (DEM): A digital representation of a surface, used for topography. A DEM is often used in reference to a set of elevation values representing the elevations at points in a rectangular- grid on the Earth’s surface. Some definitions expand DEM to include any digital representation of the land surface, including digital contours.
Dilution of Precision (DOP): One of many quality measurements to evaluate solutions derived by a positioning receiver. This is a numeric value that relates relative geometries between positioning satellites as well as the geometries between the satellites and the receiver; the lower the value, the higher the probability of accuracy. DOP can be further classified to other variables: GDOP (three-dimensional position plus clock offset), HDOP (horizontal position), PDOP (threedimensional position), TDOP (clock offset), and VDOP (vertical position). A DOP value of 4 or less is typically desired for best accuracy.
Directed Sampling: Simple technique of incorporating prior knowledge about soil variability into the sampling design to match sampling distribution and intensity with known soil patterns.
Downforce: Weight being measured by the gauge wheels for those row units equipped with a sensor.
EElectromagnetic Spectrum: All wavelengths of electromagnetic energy including x-rays, ultraviolet rays, visible light, infrared light, microwaves, and radio waves.
Elevation: For agriculture applications, elevation typically represents the height above sea level for a physical object such as a field or farm structure. Elevation is
typically collected in meters but converted to feet within in-cab displays or farm software packages.
Experimental Design: The experiment planning procedure that results in the experimental layout. This process should be conducted prior to conducting the experiment.
FFarm Management Information System (FMIS): A management information system designed to assist farmers and precision ag service providers to perform various tasks ranging from operational planning such as creating prescriptions along with implementation and documentation for assessment of performed field work.
Feature: A geographic component of the earth’s surface that has both spatial and attribute data associated with it. Examples include a field, well, or waterway.
Field Capacity: The moisture content of soil in the field asmeasured two or three days after the thorough wetting of a well-drained soil by rain or irrigation water.
Field Trial: A test of a new technique or variety, including biotech-derived varieties, done outside the laboratory but with specific requirements on location, plot size, and methodology.
Fix: A single position calculated by a GPS receiver with latitude, longitude, altitude, time, and date.
Geographic Coordinate System: A reference system using latitude and longitude to define the locations of points on the surface of a sphere or spheroid.
Geographic Data: Data that contain not only the attribute being monitored but also the spatial location of the attribute. Also known as spatial data.
Geographic Information System (GIS): A computer based system that is capable of collecting, managing and analyzing geographic spatial data. This capability includes storing and utilizing maps, displaying the results of data queries and conducting spatial analysis. GIS is usually composed of map-like spatial representations called layers which contain information on a number of attributes such as elevation, land ownership and use, crop yield and soil nutrient levels.
Global Positioning System (GPS): A system using satellite signals (radio-waves) to locate and track the position of a receiver and/or antenna on the Earth. GPS is a technology that originated in the U.S. It is currently maintained by the U.S. government and available to users worldwide free of charge.
GLONASS (GLObal`naya NAvigatsionnaya Sputnickovaya Sistema): The satellite-navigation network maintained by the Russian government. The English translation of this name is “GLObal NAvigation Satellite System,” or more
commonly named “GLONASS.” Utilizing GLONASS enabled receivers for precision ag applications provides additional satellite coverage and often improved performance of guidance systems. See also GNSS. Russian version of the American GPS satellite system. It is a radio-based satellite navigation system operated for the Russian government by the Russian Space Forces with a constellation of 24 operational satellites in 2010.
GNSS: The collective group of satellite-based positioning systems.
GNSS Receiver: A computer-radio device that receives satellite information by radio waves to determine the position of the antenna relative to earth’s surface.
GNSS Satellite: A communication vehicle that orbits the earth. Satellites send time-stamped signals to GPS or GNSS receivers to determine positions on earth.
Grid Soil Sampling: Laying a grid over a map of a field and taking soil samples at the middle of each grid on the map. May be done at much higher densities (up to 42 samples per acre) to approximate the true spatial variability of a number of soil nutrient levels.
Ground Sampling Distance (GSD): Pixel size of remotely sensed imagery. Example: 30-meter; 1-meter; 20-centimeters.
Guidance: The determination of the desired path of travel (the “trajectory”) from the vehicle’s current location to a designated target, as well as desired changes in velocity, rotation and acceleration for following that path. There are two basic categories of guidance products: lightbar/visual guidance and auto-guidance. For lightbar/visual guidance, the operator responds to visual cues to steer the equipment based on positional information provided by a GPS. For auto-guidance, the driver makes the initial steering decisions and turns the equipment toward the following pass prior to engaging the auto-guidance mechanism. Auto-guidance can use differential correction such as WAAS, subscription services, and RTK. RTK is the most accurate level of auto-guidance available, typically +/- 1 inch. Benefits include improved field efficiency, reduced overlap of pesticide applications, time management and reduced driver fatigue. See also WAAS, Subscription Correction Signal and RTK.
HHybrid: The offspring of any cross between two organisms of different genotypes.
IIndustrial Internet: A term coined by Frost & Sullivan and refers to the integration of complex physical machinery with networked sensors and software. The industrial Internet draws together fields such as machine learning,
big data, the Internet of things, machine-to-machine communication and Cyber-physical system to ingest data from machines, analyze it (often in real-time), and use it to adjust operations. Some consider the evolution of digital agriculture today (e.g. 2015) as leading to the Industrial Internet in agriculture.
Internet: An international network comprised of many possible dispersed local and regional computer networks in which one can share information and resources. Developed originally for military and then academic use, it is now accessible through commercial on-line services to the general public.
Internet of Things (IoT): The network of physical objects or “things” embedded with electronics, software, sensors, and network connectivity, which enables these objects to collect and exchange data. The Internet of Things (IoT) allows objects to be sensed and controlled remotely across existing network infrastructure, creating opportunities for more direct integration between the physical world and computer-based systems, and resulting in improved efficiency, accuracy and economic benefit. Each thing is uniquely identifiable through its embedded computing system but is able to interpret within the existing Internet infrastructure. Experts estimate that the IoT will consist of almost 50 billion objects by 2020.
Interpolation: Mathematical procedure for estimating unknown values from neighboring known data.
ISOBUS: ISOBUS standard 11783 is a communication protocol for the agricultural industry that is used to specify a serial data network for control and communications on forestry or agricultural tractors and implements. ISOBUS-compliant tractors and implements come with round 9-pin connectors.
KKriging: An interpolation technique for obtaining statistically unbiased estimates of field characteristics, such as surface elevations, nutrient levels, or crop yields, from a set of neighboring points.
LLANDSAT (LAND SATellite): A series of U.S. satellites used to study the earth’s surface using remote sensing techniques.
Legal Boundary: Area or parcel of land defined that is owned. Typically used for real estate transactions and tax purposes. Could differ significantly from an operational boundary due to tree and fence lines and the inclusion of woods or areas not farmed.
Lightbar: Is a navigation tool coupled with a GPS designed to keep the driver on-course. Applications include planting and fertilizer applications to reduce skips and
Latitude: A north/south measurement of position perpendicular to the earth’s polar axis.
Longitude: An east/west measurement of position in relation to the Prime Meridian, an imaginary circle that passes through the north and south poles.
LSD (Least Significant Difference): Used to compare means of different treatments that have an equal number of replications. For this report, a significance level of 0.1 (or 10%) is used. This means, when a treatment is statistically significant, a 90% confidence is attributed to that treatment actually being different from the comparison.
MMachine Data: Data that is compiled using multiple sensors located on agricultural machinery. Most relate machine data to the information that can be collected from the CAN (controlled area network) on machines and implements. Machine data can also include guidance system information (autosteer, GPS path files, bearing, etc.), Variable rate control/technology and seeding rate controllers. Data in these forms is transmitted to Agricultural Technical Providers (ATPs) via CANBus, which is a high-speed, wired data network connection between devices. This device utilizes a single wire set to relay information, which reduces the amount of wires needed for a system and allows for a cleaner way to transfer data.
Management Zone: Management zones are created by subdividing a field into 10-20 acre areas with similar characteristics. Yield maps, soil texture maps, elevation data, EC data, sensor data and farmer knowledge can be used to create management zones in GIS software. There are several methods available for creating management zones.
Mass Flow Sensor: Is a sensor that measures grain flow in a yield monitor system.
Mean: The average value.
Median: The midpoint of a set of observed values.
Metadata: A term used to describe information about data. Metadata usually includes information on data quality, content, currency, lineage, ownership, and feature classification.
Moisture Sensor: Is a sensor that measures grain moisture in a yield monitor system.
National Mariene Electronics Association (NMEA): Set communications standards for GPS data.
Near Infrared (NIR): The preferred term for the shorter wavelengths in the infrared region extending from about 750 nm to 2000 nm. Near infrared is the portion ranging
from 0.75 to 1.4 µm, short wave radiation is the portion of spectrum from 1.4 to 3 µm, mid-wavelength radiation is the portion of the spectrum from 3 to 8 µm, and longwave radiation is the portion of the spectrum from 8 to 15 µm.
Normalized Difference Vegetation Index (NDVI): The ratio of the difference between the red and near-infrared bands divided by their sum used to identify and enhance the vegetation contribution in a digital remote sensing analysis; a simple graphical indicator that can be used to analyze remote sensing measurements and assess whether the target being observed contains live green vegetation or not.
NAVSTAR (NAVigation by Satellite Timing and Ranging): The U.S. based global navigation satellite system that was funded by taxpayers and controlled by the DOD.
OOmniSTAR: A subscription based differential GPS source. Omnistar is a satellite-based DGPS source that requires a special GPS antenna.
On-Farm Research: Research that is conducted on a farm that is designed to answer specific questions. While not necessary, mistakes can be minimized by consulting with a statistician prior to the experiment.
Operational Boundary: Actual tilled or managed area in which inputs are purchased and cropping or livestock practices implemented.
PPlant Spacing: Most commonly the distance in inches between plants within a row, but may be a consideration of distance both within and between rows.
Precision Agriculture: Precision agriculture is a farming management concept based on observing, measuring and responding to variability in crops. These variabilities contain many components that can be difficult to compute and as a result, technology has advanced to off-set these difficulties. Two types of technology can generally be found within precision agriculture: those which ensure accuracy, and those that are meant to enhance farming operations. By combining these two technologies, farmers are able to create a decision support system for an entire operation, thereby maximizing profits and minimizing excessive resource use. This may include managing crop production inputs (seed, fertilizer, lime, pesticides, etc.) on a site-specific basis to increase profits, reduce waste and maintain environmental quality.
Prescribed Application: The dispensing of a material or chemical into the field on a prescribed or predetermined basis. A prescription map is generated by an expert (grower and/or agronomist) based on information about
the field in use before an application. The prescription determines how much of something will be applied.
Prescription Map: A prescription map tells the rate controller how much product to apply based on the location of the equipment in the field. Commonly used for variable rate seeding, fertilizer, lime and irrigation.
Proximal Sensing: Remote sensing sensors are positioned very close to the target. These sensors could be in physical contact with the target to a few meters away.
P-Value: The probability of obtaining similar results if the null hypothesis is true.
RRandomization: Helps account for any variations in production and prevents data from being biased based on its location in a field.
Rate Controller: An electronic device that varies the amount of chemical/plant nutrient applied to a given area.
Remote Sensing: The act of monitoring an object without direct contact between the sensor and object.
Replication: Allows for the estimation of the error associated with carrying out the experiment. A minimum of three replications is required for proper evaluation.
Resolution: A way of detecting variation. In remote sensing, one has spatial resolution (the variation caused by distance separating adjacent pixels), spectral resolution (the variation from the range of spectral responses covered by a wavelength band), and temporal resolution (the variation caused by time over the same location).
SScale: The ratio or fraction between the distance on a map, chart, or photograph and the corresponding distance on the ground. A topographic map has a scale of 1:24,000 meaning that 1 inch on the map equals 24,000 inches (2,000 feet) on the ground.
Singulation: The percentage of seeds properly singulated by a seed meter.
Site Specific Crop Management (SSCM): The use of yield maps, grid sampling and other precision tools to manage the variability of soil and crop parameters and aid decisions on production inputs (also referred to as Precision Farming).
Sensor Technologies: Sensor technology refers to on-thego optical sensors used to measure crop status. These sensors utilize an active LED light source to measure NDVI (Normalized Difference Vegetative Index) to predict crop yield potential. NDVI values reflect the health or “greenness” of a crop and can also provide a relative biomass measurement. Data collected from these sensors are being used to direct variable rate nitrogen applications in grain crops and plant growth
regulator and defoliants in cotton.
Shortwave Infrared (SIR): Shortwave infrared (red), near infrared (green), and green (blue) used to show flooding or newly burned land.
Soil Electrical Conductivity (EC): A measurement that correlates with soil properties that affect crop productivity, including soil texture, cation exchange capacity (CEC), drainage conditions, organic matter level, salinity, and subsoil characteristics. EC is the ability of a soil to carry an electrical current. The EC measurement is dependent on how it is measured.
Soil Moisture Content: Moisture content (MC) is the weight of water contained soil. The moisture content is generally reported on the dry weight basis.
Spatial Data: Data that contains information about the spatial location (position) and the attribute being monitored such as yield, soil properties, plant variables, seed population, etc. Synonymous with geographic data.
Spatial Resolution: The size of the smallest object that can be distinguished by a remote sensing. A measure of the ability of a machine or device to vary application rate or treatment - defined by the smallest area in a field that can receive a treatment or input that is purposely different from that received by an adjacent area. The term also applies to measuring systems such as crop yield monitors.
Spatial Variability: Differences in field conditions, such as plant, soil, or environmental characteristics from one location in a field to another.
SSURGO (Soil SURvey GeOgraphic) Database: A digital version of the NRCS soil books. Each soil type is represented as a polygon and tied with associated soil type properties.
Standard Deviation: A measure of dispersion in the data set. The standard deviation is used to calculate the confidence intervals.
Strip Trial: Experiments that contain treatments that are applied in a strip across an entire field. On-farm replicated strip trials are field experiments that, when well executed, can be used to draw statistically valid cause and effect relationships between factors measured across and within fields.
TTemporal Resolution: The time period over which data was collected. A measure of how often a remote-sensing system can collect data from a particular site on the ground. Also known as “frequency of coverage.” Some satellite systems return to the same location every 16 days, some every four or five days, and others daily, depending on their orbits. Airborne sensors (manned and unmanned) can be scheduled as desired.
Temporal Variability: Fluctuations in field conditions, such as plant, soil, or environmental characteristics, from one point in time to another.
Terrain Compensation: An add-on feature for autoguidance systems which correct position error that may occur when equipment travels over rolling terrain. Roll, pitch and yaw are commonly referred to when discussing terrain compensation. Roll refers to the change in elevation between the left and right sides of the vehicle; pitch refers to the change in elevation between the front and rear of the vehicle; and yaw refers to any sliding or turning motion of the vehicle to the left or right.
Thermal Infrared (TIR): Shown in gray tones to illustrate temperature. It measures radiation from the plant and soil surface.
T–Test: Also called a Student’s t-test. A statistical approach that can be used to determine if two treatments are different from each other.
UUniversal Transverse Mercator (UTM): Coordinate system that represents the earth’s spherical shape as 2-D zones that are evenly spaced grid lines.
Unmanned Aerial Vehicle (UAV): An unmanned aerial vehicle (UAV), commonly know as a drone and also referred to by several other names, is an aircraft without a human pilot aboard. The flight of UAVs may be controlled either autonomously by onboard computers or by the remote control of a pilot on the ground or in another vehicle. In agriculture, UAVs are typically used to survey crops. The available two types of UAVs, fixedwing and rotary-wing, are both equipped with cameras and are guided by GPS. The can travel along a fixed flight path or be controlled remotely.
VVariable Rate Technology (VRT): GPS and precise placement technology that uses an “application guidance” map to direct the application of a product to a specific, identifiable location within a field. Instrumentation such as a variable-rate controller for varying the rates of application of fertilizer, pesticides and seed as one travels across a field. VRT consists of the machines and systems for applying a desired rate of crop production materials at a specific time (and by implication, a specific location); a system of sensors, controllers and agricultural machinery used to perform varible-rate applications of crop production inputs; refers to a system that varies the rate of agricultural inputs such as seed, fertilizer and crop protection chemicals in response to changing local conditions.
Variety: A group of individuals within a species that differs from the rest of the species.
Vegetation Index (VI): A ratio created by dividing the red by the near-infrared spectral bands used to identify and enhance the vegetation contribution in a digital remote sensing analysis.
Variable Rate Application (VRA): Adjustment of the amount of crop input such as seed, fertilizer, lime or pesticides to match conditions (yield potential) in a field.
WWireless Communication: Data transfer and voice communications using radio frequencies or infrared light.
YYield Calibration: Procedures used to calibrate a yield monitor for specific harvest conditions such as grain type, grain flow and grain moisture.
Yield Goal: The yield that a producer expects to achieve, based on overall management imposed and past production records.
Yield Limiting Factor: The plant, soil, or environ mental characteristic or condition that keeps a crop from reaching its full yield potential within any specific area in a farm field.
Yield Mapping: Is a yield monitor coupled with a GPS. Each yield reading is tagged with a latitude and longitude coordinate, which is then used to produce a yield map. Refers to the process of collecting geo-referenced data on crop yield and characteristics, such as moisture content, while the crop is being harvested.
Yield Monitor: A yield-measuring device installed on harvest machines. Yield monitors measure grain flow, gain moisture, and other parameters for real-time information relating to field productivity.
ZZone Management: The information-based division of large areas into smaller areas for site specific management applications.
(Definitions from AgGlossary, PrecisionAg, Precision Ag Basics Book, University of Nebraska-Lincoln, Alabama Cooperative Extension System, and Ohio State Precision Ag)
We are tackling today’s grand challenges in every corner of Ohio.
Sustaining Life
We focus on viable agriculture production, food security and safety, and environmental and ecosystem sustainability simultaneously.
One Health
We study the nexus where human, animal, plant, and environmental health intersect or interact.
Rural-Urban Interface
We explore the tensions and opportunities created in the communities, industries, policies, economies, and communications between rural and urban residents.
Leadership
We are preparing the next generation of scientists and leaders.
The Ohio State University College of Food, Agricultural, and Environmental Sciences is Ohio State’s cornerstone college. Through our research, teaching, and engagement with Ohioans and the world, we sustain life

Co











Allen Armstrong
Austin Arps
Amos Aurand
Gene Baumgardner
Mica Ballard
Tyler Schindel
Bernath Farms
Jeffry Billenstein, BFD, Ltd.
Caitlyn Black
Steve Bowman
Box Farms
Brian Breece
Tim Brinkman
Daniel Call
Joe Callow
Brett Carnes
Scioto Valley Farms
Jared Chester
Colburn Farms
Scott & Evan Conrad
Corcoran Farms
Rachel Cornell
Mike Counts
Dave Cunningham, Bridgewater Farm
Tom Deeds
John Deeds, Jodbark Farm
Deerfield Farms
Defiance Agricultural Research Association
Bethany Dickess
Pete & Wayne Dinius
Nicolas Dubuc
Jeff Duling, Duling Family Farms
Matt & Luke Durbin, Durbin Farms
Eberhard Family Farms
Nathan Eckel- Eckel Grain Farms
Matt Eggers, Freedom Farms
Schylar Epler
Erie Conservation District
Wilson Ett
Brian Farmer
Nick Farquhar, Assistant Crops Manager, OSU: OARDC/ATI
Fayette County Agronomy Club
Fayette County Commissioners
Fayette County Research and Demonstration Farm
Mark Fisher
Ryan Fritsch
Generations Family Farm
Chad Hamilton
Mason Hanna
Hardscrabble Farms
Harrod and Harrod LLC
Jeff and Kyle Hartman
Greg Hartschuh- Hartschuh Dairy Farm
Steve Hayes
Les Heeringa
Austin Heil, Heil Farms
Tony Heitbrink Farms
Nick Heitz
Henricks & Krieger Farms
Kurt Heyman
Matt Hofelich - OSU NCARS
John Hoffman
Josiah Hoops
Jackson Agricultural Research Station
Jim Jacobs
Kenworthy Farms, Brett Kenworthy
Brianna and Ryan Klopfenstein
Leon Klopfenstein
John Krock
Mike Kryling
L & L Farms
Forrest Lang
Jan & Laura Leaders
Ryan & Greg Lee, Lee Farms
Bill Lehmkuhl
Harold and Larry Leonhard
Jacob Lesch
Lighthill Farms
Steve & Brad Loeffler
Jim Love
Michael Matesick
Curt Maurer
McGuire Ag
Nathan McKee
Michael Beam
Michael Family Farms
Dave Mielke
Mike Sword Superintendent Crops OSU OARDC/ATI
Tom and Luke Miller
Tyler and Fred Miller
David Mitchem
Molly Caren Agricultural Center
Morrow County Commissioners
Morrow Soil and Water Conservation District
Lenny Muhlenkamp
Bennett Mussleman
Ewing and Son Farms
Erin Neal
Tim Neiset
Chuck Niese
Vicki Nofziger
Noggle Farms
Garrett Nowak
Ohio Agricultural Research and Development Center: Eastern Station Staff
Ohio Agricultural Research and Development Center: North Staff
Ohio Agricultural Research and Development Center: Northwest Staff
Ohio Agricultural Research and Development Center: Western Staff
Ohio Agricultural Research and Development Center: Wooster Staff
Ohio State ATI
Overholser Farms
Nate Hole Dozer Parsons
Denny Person
Keith Peters
Fred Pond
R&S Farms
Asa Radcliff
Dug Radcliff
Lee Radcliff
Mav Radcliff
Radcliff Farms
Paul Ralston, Ralston Farms
Steve Rienhard
John Ritz
Romanko Farms
Charlie Scheckelhoff
John Scheuerman
Matt & Joe Schmerge
Michael Schmidt
Ben Schmitmeyer
Marvin and Clint Schroeder
Garrick Schroeder
Chris Schroeder, CAD Farms
Ron Schweibert
Seiler Farms
Seneca County Soil and Water Conservation District
Richard Shaw
Chuck Smith
Corey Smith
Jason Sneed
Southwest Ohio Corn Growers Association
Spillman Farms LTD
Jeff Staab
Stateler Family Farms
Dan Stevenson
Stucke Livestock Farms
Matt Sullivan
Randy, Ryan and Rex Tietje
Brett Unverferth
USDA-ARS
Ramarao Venkatesh
Kyle Vennekotter
Sparky Weilnau
WI Miller and Sons
Jake & John Wilson, JCW Farms
Martha Winters, Deer Run Farm
Nathan & Frank Young- Young Farms
Nick Zachrich




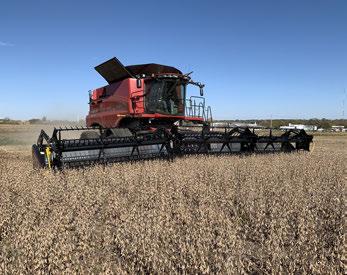


eFields is a The Ohio State University program dedicated to advancing production agriculture through the use of field-scale research. eFields utilizes modern technologies and information to conduct on-farm studies with an educational and demonstration component used to help farmers and their advisors understand how new practices and techniques can improve farm efficiency and profitability. The program is dedicated to delivering timely and relevant, data-driven, actionable information to farmers throughout Ohio.

