2025 eBarns Report
Ohio State Digital Ag Program
COLLEGE OF FOOD, AGRICULTURAL, AND ENVIRONMENTAL SCIENCES
COLLEGE OF VETERINARY MEDICINE


COLLEGE OF FOOD, AGRICULTURAL, AND ENVIRONMENTAL SCIENCES
COLLEGE OF VETERINARY MEDICINE

“connecting
eBarns is a program at The Ohio State University dedicated to advancing production agriculture through the use of field-scale and applied research. The 2025 eBarns Report is a combination of the research conducted on partner farms and Ohio State agricultural research stations throughout Ohio. Current research is focused on enhancing animal production, growing high-quality forages, precision nutrient management, and to develop analytical tools for digital agriculture.
In the fourth edition of eBarns we have included research studies not only from the past year, but studies from previous years that have yet to be summarized in a producer friendly manner. It is our goal to continue to share results from applied livestock, forage, and manure nutrient management in this publication for years to come.
30 Total Studies
• 10 Forages
• 4 Manure Nutrients and Management
• 5 Cattle
• 5 Small Ruminant
• 4 Equine
• 1 Swine
• 1 Poultry


Disclaimer Notice: The information provided in this document is intended for educational purposes only. Mention or use of specific products or services, along with illustrations, does not constitute Endorsement by The Ohio State University. The Ohio State University assumes no responsibility for any damages that may occur through adoption of the programs/techniques described in this document.

Welcome to the 2025 Ohio State eBarns Report.


This is the fourth edition of the eBarns report, where we share and highlight applied research on forages, pasture management, livestock, and equine topics. These studies are a collection of both individual studies and statewide efforts across Ohio on farms and at university research facilities. We appreciate the faculty, staff, and students that contributed to this year’s report. Their combined contributions make this work possible.
The past year has been an interesting one in Ohio and the livestock industry. The drought from mid to late 2024 created poor pasture conditions, especially in southern and eastern Ohio. The state experienced temperature swings, and eventually some precipitation that provided some drought relief. This impacted management decisions for many livestock owners and brought up questions about how to handle drought conditions in the future.
There is increased interest in having more control over feed sources and managing pastures efficiently, to protect against potential shortages due to weather issues. Pasture improvement and avoiding high corn deoxynivalenol (DON) levels were primary questions we tried to tackle in this edition. Small ruminants continue to remain a topic of discussion with small farm clientele, and work is being done to evaluate grazing in alternative spaces, like solar energy fields. Overall, animal evaluation, feeding strategies, and improving management approaches are common areas of interest for Ohio producers.
Infestation of the Longhorned Tick has continued across the state, and more work is being done to help communities better understand tick impacts in their respective areas of the state. Highly Pathogenic Avian Influenza (HPAI) hit Ohio in late 2024, and into 2025. Continued work at the state level and at Ohio State provided support and guidance throughout the year for poultry producers. One precaution was to restrict movement on poultry moving between counties close to the impacted areas. This seems to have been effective in the short term, but HPAI is continuing to be monitored in Ohio.
For the 2025 report, the eBarns team conducted 30 studies in 26 counties, spanning 101 research sites. We hope the data presented in this year’s report will provide value to Ohio’s livestock farmers and equine owners. If you have an interest in conducting on-farm research for next year ’s report learn more on page 18 or contact your local OSU Extension office to get started!
Sincerely,
The eBarnsTeam

The eBarns Report is published on an annual basis. To view past reports, visit our website: go.osu.edu/ebarnsreports


The Digital Agriculture Program at The Ohio State University embodies the best of the land grant mission – creation, validation, and dissemination of cutting-edge agricultural production technologies. The central focus of this program is the interaction of automation, sensing, and data analytics to optimize crop production in order to address environmental quality, sustainability, and profitability. Research is focused on execution of sitespecific nutrient management practices, development of hand-held devices for in-field data capture, autonomous functionality of machinery, remote sensing solutions, and data analytics to enhance timing, placement and efficacy of inputs within cropping systems.
The Digital Agriculture Program at The Ohio State University strives to be the premier source of researchbased information in the age of digital agriculture.
• Uniting the private and public sectors to drive innovation for the benefit of farmers.
• Partnering with farmers to translate innovation into long-term profitability for production agriculture.
• Delivering timely and relevant information for the advancement of digital agriculture technologies.
The premise of digital agriculture includes the advancement of farm operations through implementation of precision agriculture strategies, prescriptive agriculture and databased decision making. Digital agriculture is a holistic picture of the data space in agriculture, trends related to services directing input management and the value of data usage for improving productivity and profitability of farm operations.
“Digital Agriculture” combines multiple data sources with advanced crop and environmental analyses to provide support for on-farm decision making.


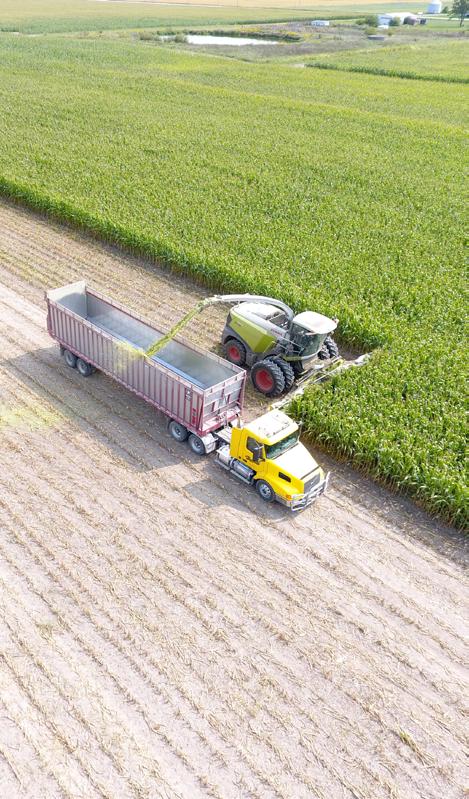
Pasture comprises 7.5% of Ohio's farm land. For more information visit the Integrated Forage Management Team at forages.osu.edu
Since 2018, Ohio ranks in the top five for Beef Quality Assurance certifications. For more information on beef production visit the OSU Extension Beef Team at beef.osu.edu
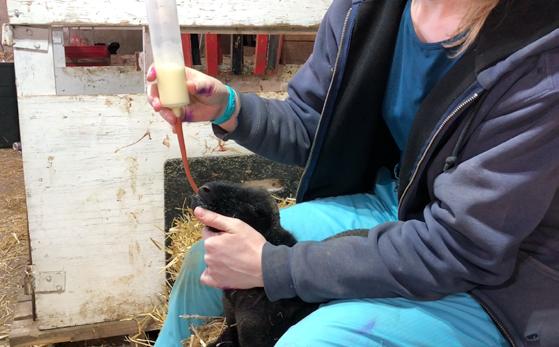
Ohio is the largest sheep producing state East of the Mississippi River. For more information on small ruminant production visit the OSU Extension Sheep Team at sheep.osu.edu

See Ohio State's new Ohio Pork Information Center: porkinfo.osu.edu

Making use of data and digital tools to manage or automate animal well-being, food safety, pasture sustainability, waste products and more.

Developing a digital strategy and making actionable decisions using data, from operational insights to farm level execution.

Right source, right rate, right time, right place, right technology. For more information visit the Ohio Composting and Manure Management at ocamm.osu.edu
Ohio is the number one Swiss cheese producing state.
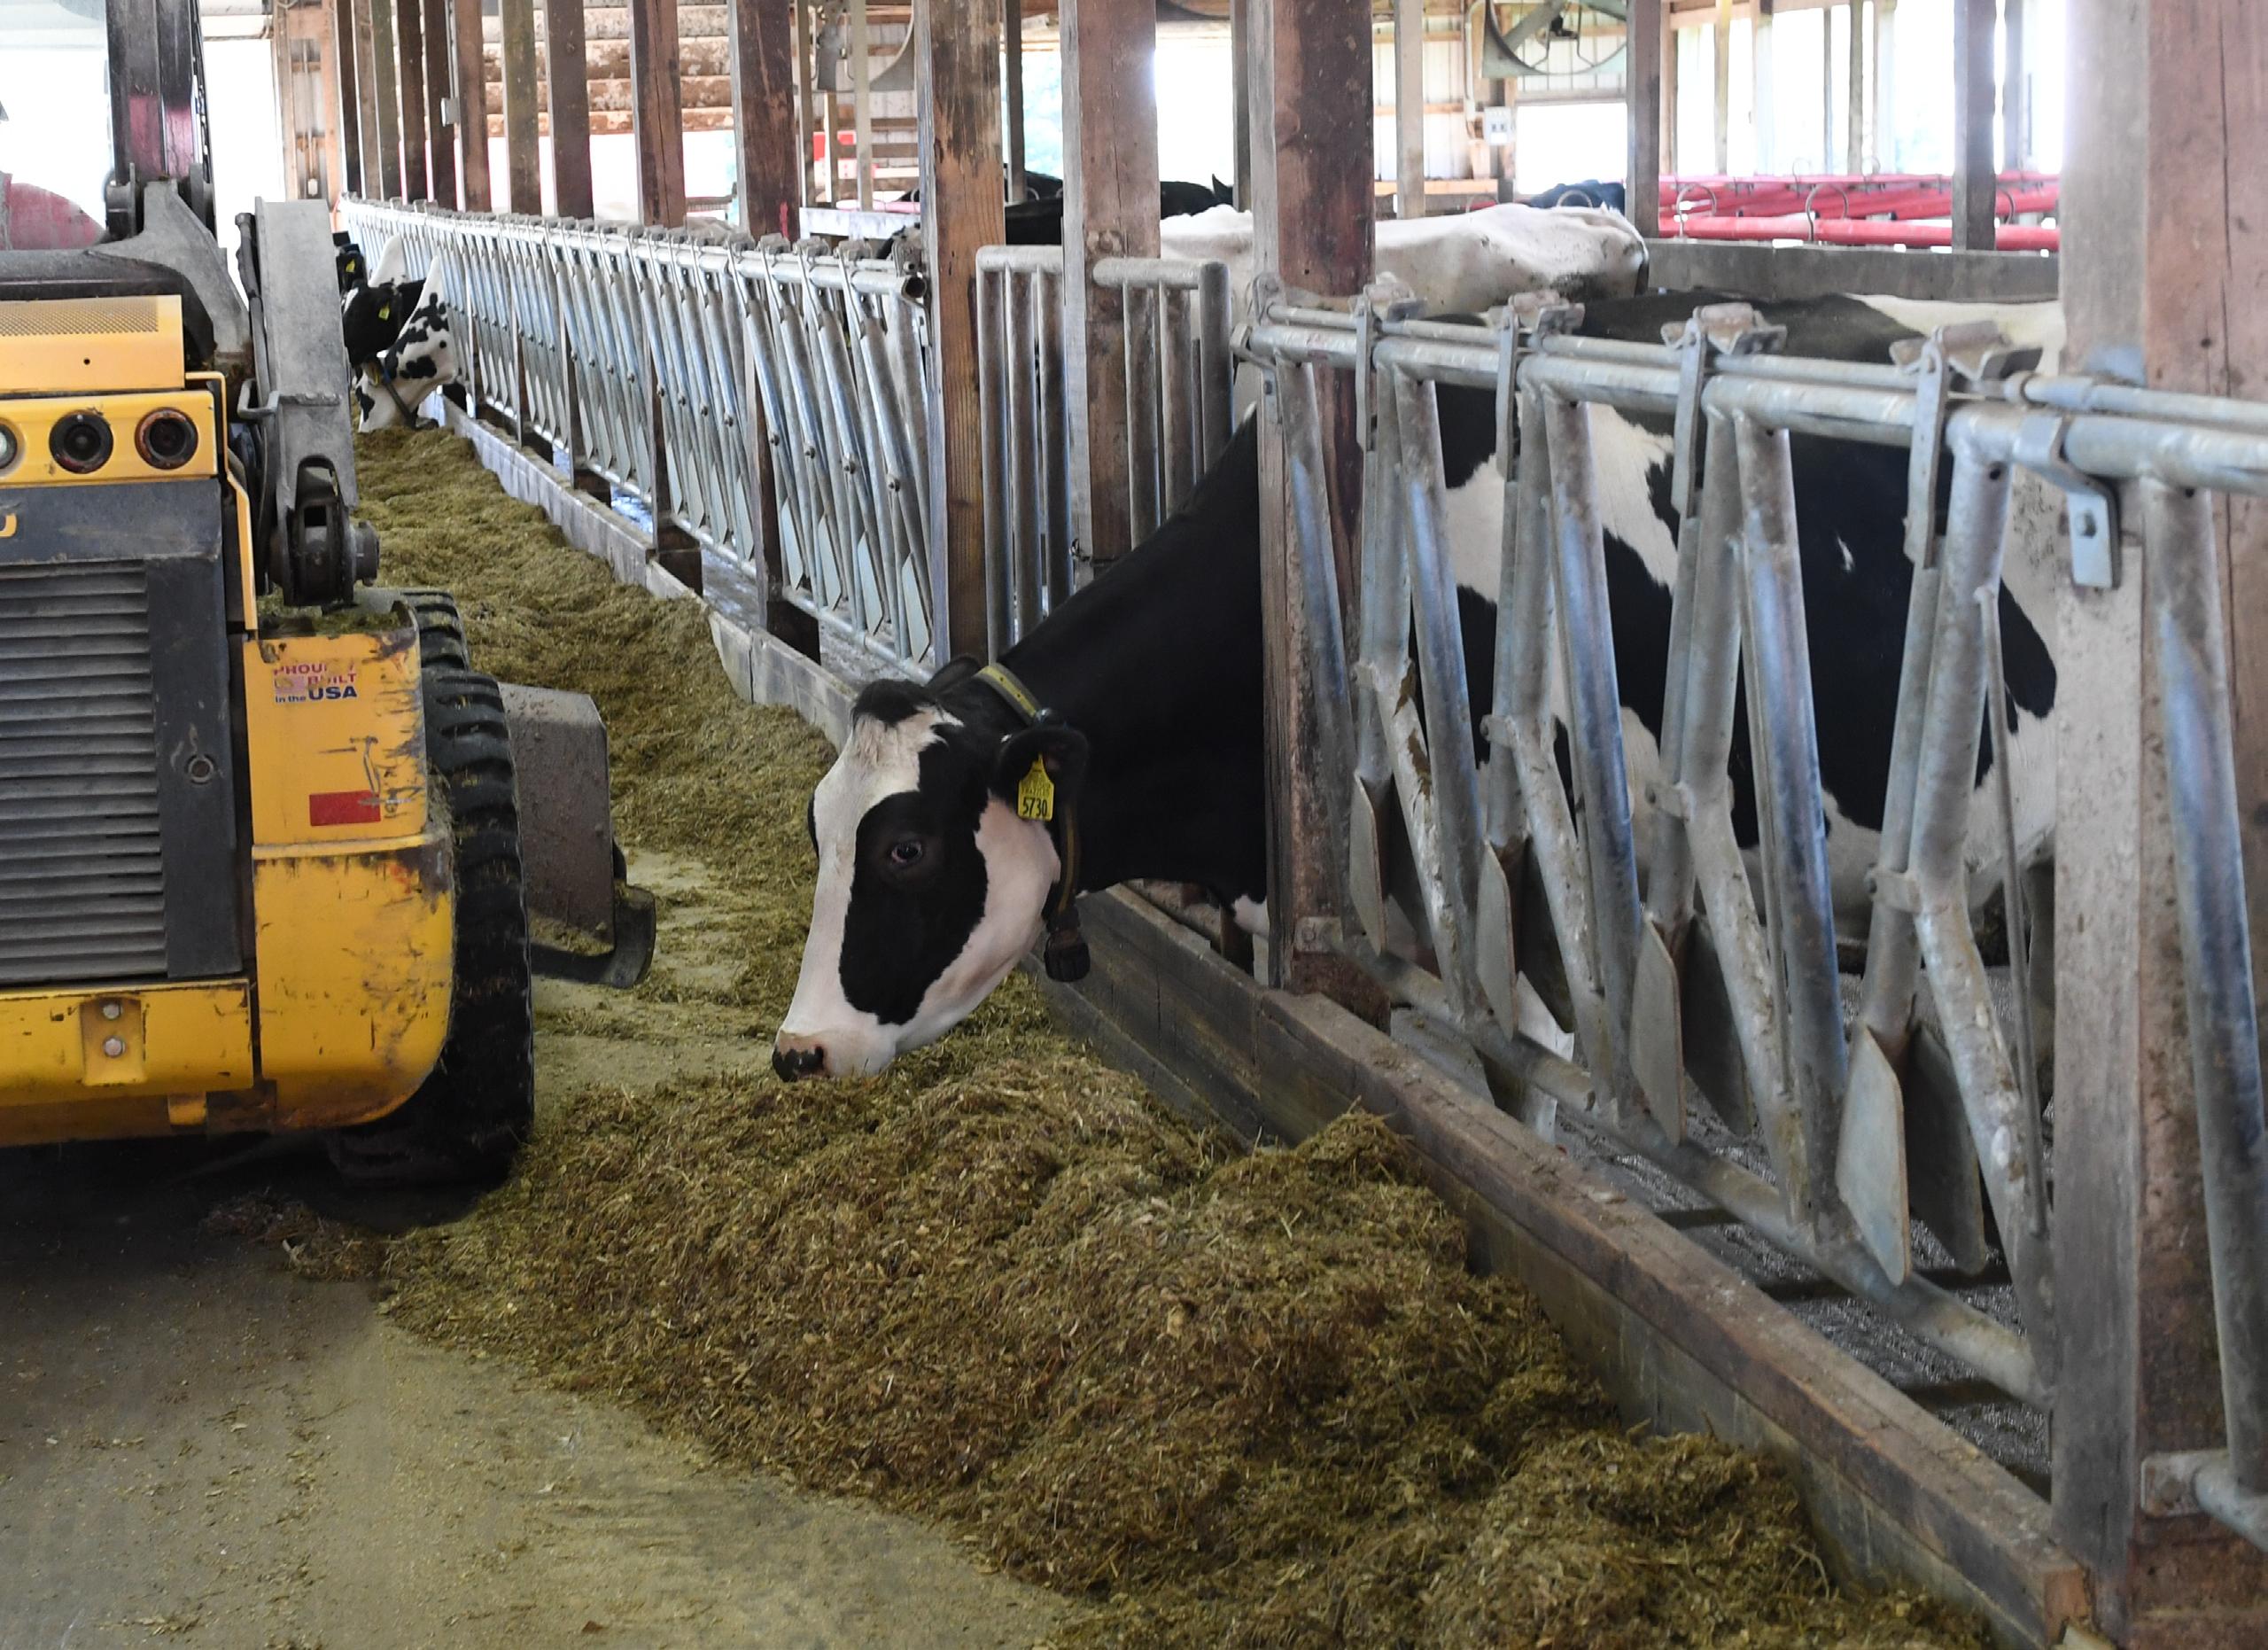
For more information on dairy production visit the Ohio Dairy Resource Center at dairy.osu.edu
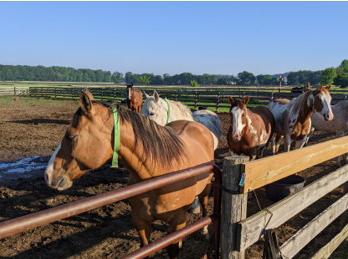
Ohio has the 6th largest horse population in the country.
For more information visit the Ohio Equine Resource Center at equine.osu.edu
Ohio is ranked number two in the nation for egg production. For more information visit the OSU Poultry Team at u.osu.edu/poultry

Deploying field-scale studies to advance production agriculture through efficiency and profitability using data-driven decisions.

Embracing the power of smart phones and tablets to utilize mobile applications and farming smarter.
Find study information, objectives, study design, graphs, and summary on the left page. Find results, summaries, project contact, and statistical summary on the right page.
Planting Date 05/03/2023
Harvest Date 10/20/2023
Variety Becks 6076V2P
Population 34,000 sds/ac
Acres 70
Treatments 5
Reps 7
Treatment Width 40 ft.
Tillage Conventional
Management Fertilizer, Herbicide, Insecticide
Previous Crop Soybeans
Row Spacing 30 in.
Soil Type Crosby silt loam, 52% Celina silt loam, 48%

Look to see the county where the study was conducted.
Start Date 10/15/2023
End Date 08/01/2024
Species Swine
Start Point 50 lb. (DOF, DOA, DIM)
End Point 300 lb (DOF, DOA, DIM)
Treatments 5
Reps 4
Experimental Unit Pen
Breed, Genetics Commercial Line, Yorkshire Cross x Duroc
Sex Equal Barrow:Gilt
Health Protection As needed
Feeding System Self Feeder, Ad libitum
IACUC #
The study design provides a background on the study. This could include a brief history of research, observations that led to the implementation of this study, explanation of the study design, etc.

The observations section of the report allows us to provide any relevant information that the researchers noticed throughout the duration of the project.
Observations allow for a deeper understanding of the study results.
Treatments (XXX)
Emergence (plants/ac)


• The summary section proves results and findings from the study.
• Thank you for taking the time to explore our eBarns Report!
Treatment Means with the same letter are not significantly different according to Fisher’s Protected Least Significant Differences (LSD) test at alpha = 0.1.
This section allows us to display the tools and technology used to make each study possible.
The Project Contact section provides the name of the researcher along with their email address. We encourage you to contact them if you have questions about an individual study.
To effectively collect, analyze, and interpret data, statistical calculations were made for each eFields study when possible. All statistical calculations were conducted using the OSU PLOTS Research App or calculated using the ANOVA spreadsheet, using Fisher’s Protected Least Significant Differences (LSD, alpha = 0.1) method to determine if treatment differences are statistically significant.
Stand Counts and Harvest Data:
All stand counts were conducted for individual plots by counting the number of plants in 30 linear feet along two adjacent rows. All yield data was collected using calibrated yield monitors or weigh wagons. Data was processed and cleaned to ensure accuracy with yields adjusted to a standard moisture prior to analysis.
Replication
• Allows one to estimate the error associated with carrying out the experiment itself.
• Without replication, it would be impossible to determine what factor contributed to any treatment differences.
• A minimum of 3 replications is required for a proper evaluation, with 4 or more recommended for field-scale research.
• Randomization is as important as replication to help account for any variations in production practices and field conditions.
• Even if treatments are replicated, the conclusions you reach may not be correct if a treatment was always applied to the same part of the field.
• Randomization prevents data from being biased due to its field location.
Results show the average of the response variable (i.e. yield) for each treatment.


Least Significant Difference (LSD) is used to compare means of different treatments that have an equal number of replications. For this report, a significance level of 0.1 (or 10%) was used, which means when a treatment is statistically significant, a 90% confidence is attributed to that treatment actually being different from the comparisons.
• For treatment A to be statistically significant from treatment B, they must differ by at least 3 bu/ac. (They do not, so they are not statistically different and are marked using the same letter).
• For treatment D to be statistically different from treatment A, they must differ by at least 3 bu/ac (here they differ by 5 bu/ac, so they are statistically significant and are marked using different letters).

Defined as the coefficient of variation (CV) is a measure of the variability between treatments (i.e. yields) reported as a percentage (%). CV is an indicator of data uniformity. Higher CV’s indicate more treatment or environmental variability.
In this example, since treatment A is different from treatment D by 5 bu/ac, there is 90% certainity that the results of the treatments were indeed different. Treatment differences are represented by using a letter beside the reported value. Since the averages for treatment A and treatment B differ by less than 3, it cannot be concluded that the treatments are different from each other, so the same letter (e.g. “a”) is used to indicate they are the same.
For more information and examples on statistics and experimental setup, visit go.osu.edu/efieldsinvolved.


Return above analysis allows farmers to consider not only yield increase, but also economic return which ultimately impacts the farm’s bottom line. For studies where economics were calculated, return above is labeled in the right-most column of the results table. To standardize return above calculations state-wide, the OSU Extension budgets were used for a partial profit calculation, farmoffice.osu.edu.
For the seeding rate studies, a uniform corn seed cost of $3.75/1,000 seeds was used. Soybean seed cost was $0.452/1,000 seeds. These are based on the Ohio Crop Enterprise Budgets developed by Barry Ward, OSU Extension. Learn more about the budgets on page 26.
Price received was determined by the Chicago price at planting and adjusted with a historical basis to represent an Ohio price. The corn price used in the 2024 report is $4.20/bu and the soybean price is $10.00/bu. We then calculated a 10% price increase and decrease to reflect price variability.
A nitrogen cost of $0.43/lb used in this report is from the 2025 Corn Production Budget. For the nitrogen timing studies, application costs were also considered. The average costs of application the report uses are from the 2024 Ohio Custom Farm Rates. Learn more about the 2024 custom rates on page 28.
The “Return above” line includes only the input expense of what was being studied (i.e. seed cost) to provide a clear indication of economic return. To calculate your own economic return, you can access the eFields Economic Calculators at: go.osu.edu/econcalculator.

Alejandra Arevalo Graduate Research Associate, College of Veterinary Medicine, Department of Veterinary Preventive Medicine

Frank Becker Extension Educator Wayne County OSU Extension

Steve Boyles Professor Emeritus Department of Animal Sciences

Dara Barclay Program Manager, eFields & eBarns OSU Extension

Amanda Bennett Extension Educator Miami County OSU Extension

Cassandra Brown Program Manager School of Environment and Natural Resources
John Barker Extension Educator Knox County OSU Extension

Tim Barnes Extension Educator Marion County OSU Extension

Karen BennettWimbush Associate Professor OSU ATI

Braden Campbell Assistant Professor Department of Animal Sciences
Benjamin Bohrer Assistant Professor Department of Animal Sciences

Marilia Chiavegato Assistant Professor Department of Horticulture and Crop Science and Department of Animal Sciences


Trevor Corboy Extension Educator
Brown County OSU Extension

Amanda Douridas Extension Educator
Madison County OSU Extension

Kara Flaherty Education Program Specialist, College of Veterinary Medicine, Department of Veterinary Preventive Medicine

Christine Gelley Extension Educator Noble County
OSU Extension
Louceline Fleuridor Postdoctoral Scholar School of Environment and Natural Resources

Greg Habing Professor and Vice Chair College of Veterinary Medicine, Department of Veterinary Preventive Medicine


Maurice Eastridge Professor Department of Animal Sciences


Mike Estadt Assistant Professor, Extension Educator Pickaway County OSU Extension

John Fulton Professor Department of Food, Agricultural and Biological Engineering

Ryan Haden Associate Professor OSU ATI
Caitlyn Geisheimer Student Intern OSU Research Internship Program Ohio State ATI

Jason Hartschuh Assistant Professor, Field Specialist OSU Extension

Elizabeth Hawkins Associate Professor, Field Specialist
OSU Extension

Armando Hoet Professor College of Veterinary Medicine, Department of Veterinary Preventive Medicine

Katherine Jones Undergraduate Researcher
OSU ATI

Stephanie Karhoff Assistant Professor, Field Specialist
OSU Extension

Dean Kreager Extension Educator Licking County
OSU Extension

Seungki Lee Assistant Professor Department of Agricultural, Environmental, and Development Economics

Douglas JacksonSmith Professor and Kellogg Endowed Chair School of Environment and Natural Resources

Andrew Klopfenstein Sr. Research Associate Engineer Department of Food, Agricultural and Biological Engineering

Rob Leeds Extension Educator Delaware County
OSU Extension

Helen Jones Graduate Research Associate, College of Veterinary Medicine, Department of Veterinary Preventive Medicine

Grace Koppleman Graduate Research Associate Department of Food, Agricultural and Biological Engineering

Samantha Locke Postdoctoral Scholar College of Veterinary Medicine, Department of Veterinary Preventive Medicine

Steve Lyon Professor, Assistant Director Wooster Operations School of Environment and Natural Resources

Ryan McMichael Extension Educator Mercer County OSU Extension

Talita Resende Former Assistant Professor, Swine Health Extension Specialist Department of Animal Sciences


Clifton Martin Extension Educator Muskingum County OSU Extension


Sara Mastellar Associate Professor OSU ATI

Richard Minyo Research Specialist Department of Horticulture and Crop Science

Eric Richer Associate Professor, Field Specialist
OSU Extension
Pierce Paul Professor and Chair Department of Plant Pathology

Eric Romich Professor, Field Specialist OSU Extension


Tim McDermott Extension Educator Franklin County OSU Extension

Alejandro Relling Associate Professor Department of Animal Sciences

Kendra Rose Extension Educator Crawford County OSU Extension

Garth Ruff Field Specialist
OSU Extension

Joy Rumble Associate Professor Department of Agricultural Communication, Education, and Leadership

Ajay Shah Professor Department of Food, Agricultural and Biological Engineering

Stan Smith Program Assistant Fairfield County
OSU Extension

Madelyn Schramm Undergraduate Summer Research Intern Department of Animal Sciences

Elizabeth Share Program Specialist Department of Animal Sciences

Melva Tacuri Vera Graduate Research Associate Department of Animal Sciences

Kayla Scott Graduate Research Associate Department of Animal Sciences

Scott Shearer Professor and Chair Department of Food, Agricultural and Biological Engineering

Alex Thomas Graduate Research Associate Department of Food, Agricultural and Biological Engineering
Jacci Smith Extension Educator Delaware County OSU Extension

Amit Prasad Timilsina Postdoctoral Scholar Department of Food, Agricultural and Biological Engineering


Valerie Van Meter Graduate Researcher Department of Animal Sciences

Barry Ward Leader, Production Business Management OSU Extension


Aaron Wilson Assistant Professor, Field Specialist OSU Extension


Ted Wiseman Extension Educator Perry County OSU Extension
Tiffany Woods Graduate Resarcher School of Environment and Natural Resources
John Yost Extension Educator Wayne County OSU Extension
Chris Zoller Assistant Director, Agriculture and Natural Resources OSU Extension

On-farm research, also known as applied research, is when agricultural experiments are done on a working farm. This allows farmers to participate directly and learn more about what works well on their farm. Testing and evaluating practices and products in real-world conditions is beneficial for farmers wanting to be efficient and innovative. OSU Extension partners with farmers to choose the research trials and complete data collection. On-farm research partners then receive recommendations and results that provide insights to improve their farm.
Industry Representatives
There
three on-farm research programs that provide a wide range of applied research and relevant health and safety updates. These include eFields, eBarns, and ePLUS. Reports for each program are published annually. These reports are collections
On-farm research, also known as applied research, is when agricultural experiments are done on a working farm. This allows farmers to participate directly and learn more about what works well on their farm. Testing and evaluating practices and products in real-world conditions is beneficial for farmers wanting to be efficient and innovative. OSU Extension partners with farmers to choose the research trials and complete data collection. On-farm research partners then receive recommendations and results that provide insights to improve their farm.
There are a variety of experiments
How is the research shared?
There are three on-farm research programs that provide a wide range of applied research and relevant health and safety updates. These include eFields, eBarns, and ePLUS. Reports for each program are published annually.
studies can also be designed around specific production and management questions. Start by contacting your county Agriculture and Natural Resources Extension Educator.
These reports are collections of the latest applied agricultural research from The Ohio State University Digital Ag Team, CFAES Researchers, Extension professionals, and Ohio producers.
Get Involved!
There are a variety of experiments prepared and pre-written for easy use across the state. New studies can also be designed around specific production and management questions. Start by contacting your county Agriculture and Natural Resources Extension Educator.
Not sure who to contact?
Start with locating your county office: extension.osu.edu/LAO
We are always looking for new partners to conduct on-farm trials! If you are interested in determining how you can support Ohio State University On-Farm Research, reach out to your county Agriculture and Natural Resources (ANR) Extension Educator, or contact a team member for the program you are most interested in supporting.
Not sure who to contact? Start with locating your county office: extension.osu.edu/LAO



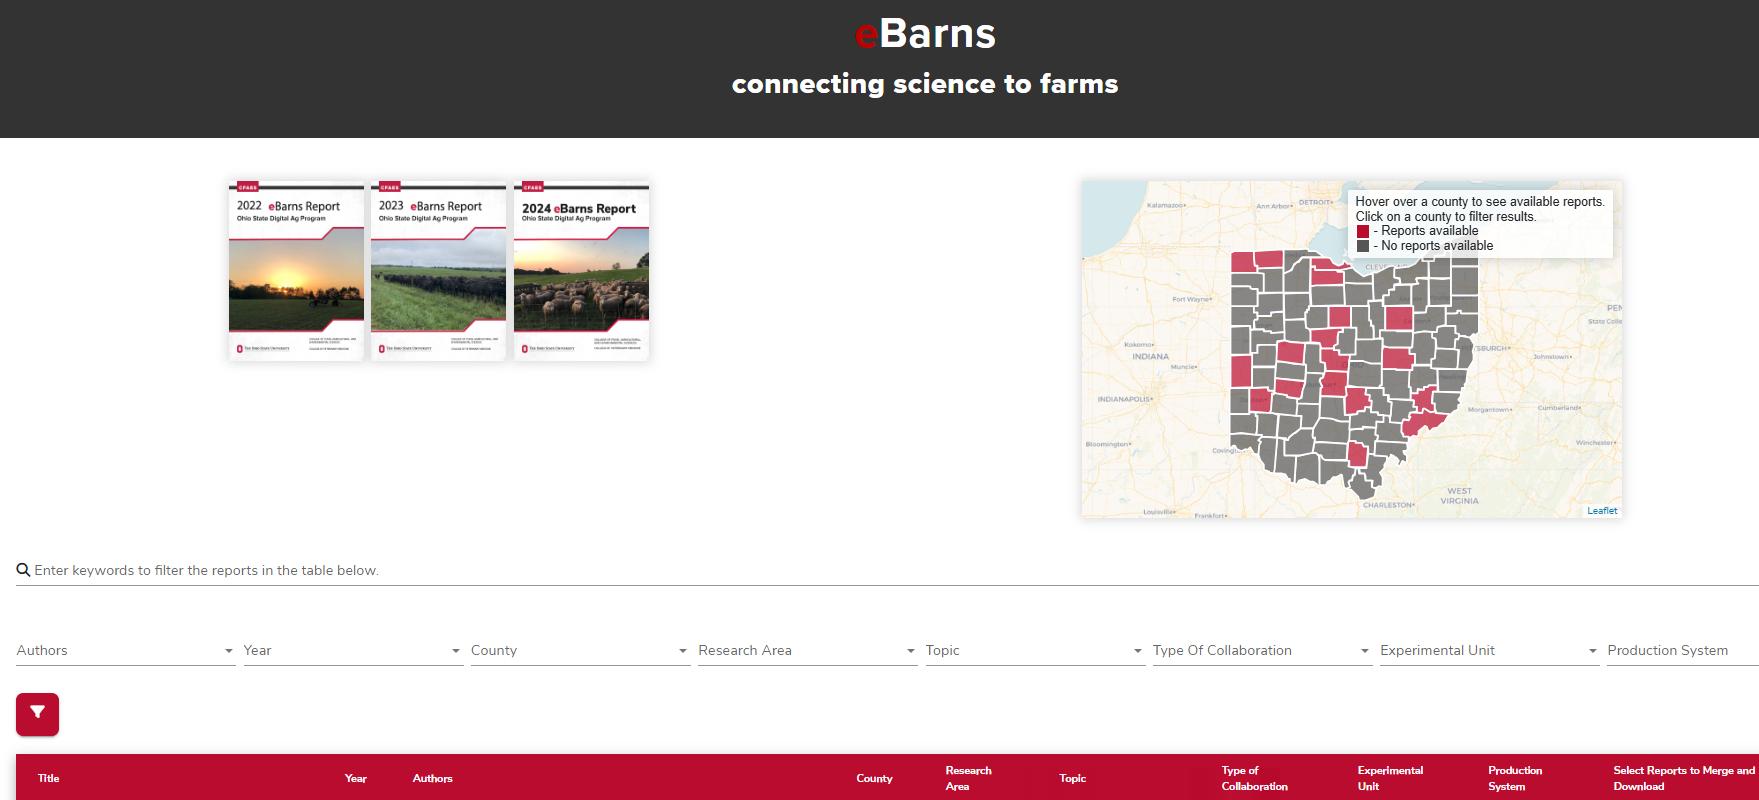
Examine the world of agricultural production in more detail than ever before with the eBarns Hub. Access on-farm research from Ohio producers and Extension through the searchable database, linked on digitalag.osu.edu/ebarns

Discover a wealth of knowledge available in the yearly eBarns Report now online. Easily find and print specific research reports from every report edition at once.
Filter your search by year, county, report author, research area, and topics.
To Print a Report or Save as a PDF: Select the reports, check the download box in the far-right column, and click Download at the top of the column.
June 2024 - May 2025 Weather
The weather of 2024 presented a significant challenge to the agricultural community, particulary livestock producers. Ohio had one of its historically most intense droughts on record, with significant impacts to central and southeastern counties. While March moisture had brought pastures back to life, dry conditions set in by mid-spring in 2024 and extreme heat ensued in June. This launched a lengthy stretch of hot dry weather throughout the growing season. Little relief came during the winter of 20242025, but the “faucet” turned on in earnest during spring of 2025 and has continued into summer. Overall, 2024 (calendar year) was Ohio’s warmest year on record (1895-2024), and ranks as the 51st driest over the 130year span according to the National Centers for Environmental Information (ncdc.noaa.gov/sotc/index.php). Figure 1 shows temperature and precipitation rankings for individual counties in Ohio for June 2024 - May 2025. For more in-season climate analysis, visit the State Climate Office of Ohio (climate.osu.edu)
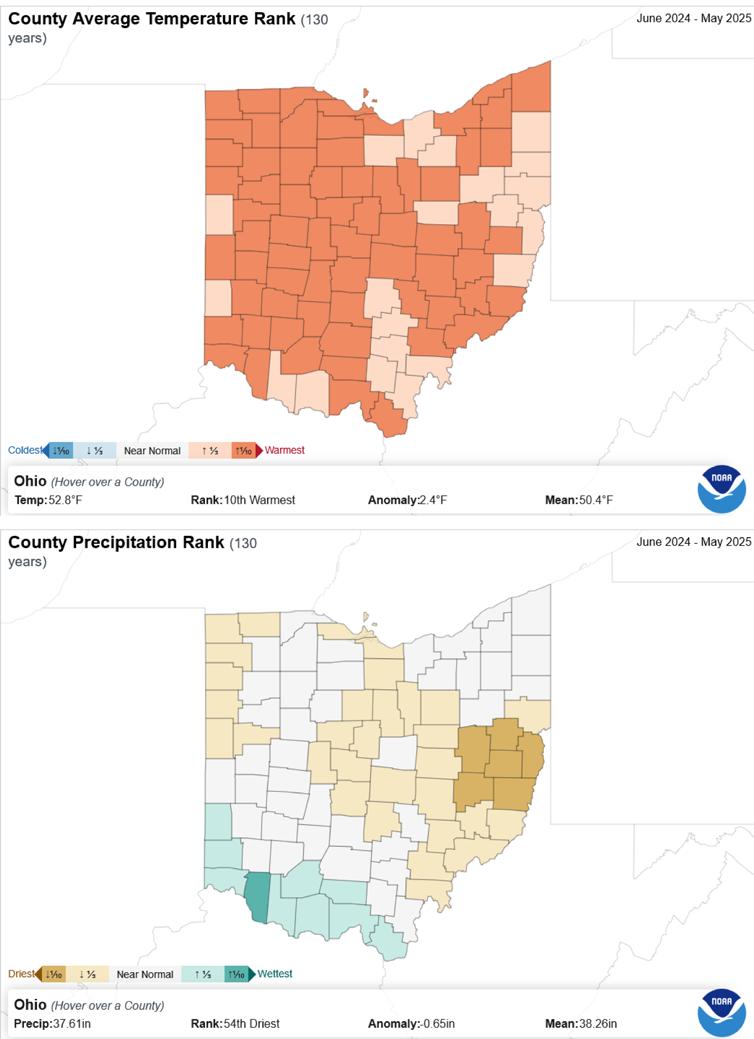
1. County rankings for avg. temp. (top) and total precip. (bottom) for the 12-month period June 2024 - May 2025 over 1895 - 2025. Courtesy of NOAA ncei.noaa.gov/ access/monitoring/climate-at-a-glance

Summer 2024 (June - August)
Summer began with an intense heat wave in June, with a stretch of seven to ten days with highs above 90°F. June 2024 ranks as the 15th warmest June on record (1895-2024), and temperatures in July and August remained above average. According to the U.S. Drought Monitor (U.S. DM, droughtmonitor.unl.edu/CurrentMap. aspx), drought officially started on June 25, 2024 with D1-moderate drought conditions across southwest, northeast, and southeast Ohio. By this time, pasture conditions were deteriorating across southeast Ohio, but the drought continued to intensify throughout July. Soil moisture loss accelerated, farm pond levels dropped, creeks and streams ran dry, and livestock producers began to haul water for operations. Except for an intense band of heavy rain across eastern Ohio associated with a remnant tropical system in early August, drought conditions worsened. Total summer precipitation for central and southeastern Ohio was less than 7.5 inches, 6-8 inches below normal (50% of normal). Small areas received less than 5 inches during the summer period, while wet conditions prevailed in far southwest and northeast Ohio (Fig. 2). Summer 2024 ranks as the 25th warmest and 7th driest summer on record.
The drought of 2024 peaked on Sept. 24, 2024 with more than 12% of the state in D4-exceptional drought conditions and nearly 65% of the state with at least D2-severe drought conditions or worse. This was the first year since the U.S. DM’s (droughtmonitor.unl.edu) inception (circa 2000) that D4 conditions have been designated in Ohio. Many southeastern counties spent at least 13 weeks in D3-extreme drought and/ or D4 conditions (Fig. 3). The only relief during fall came in the form of the remnants from Hurricane Helene in late September. Areas in southern Ohio that had expericenced significant
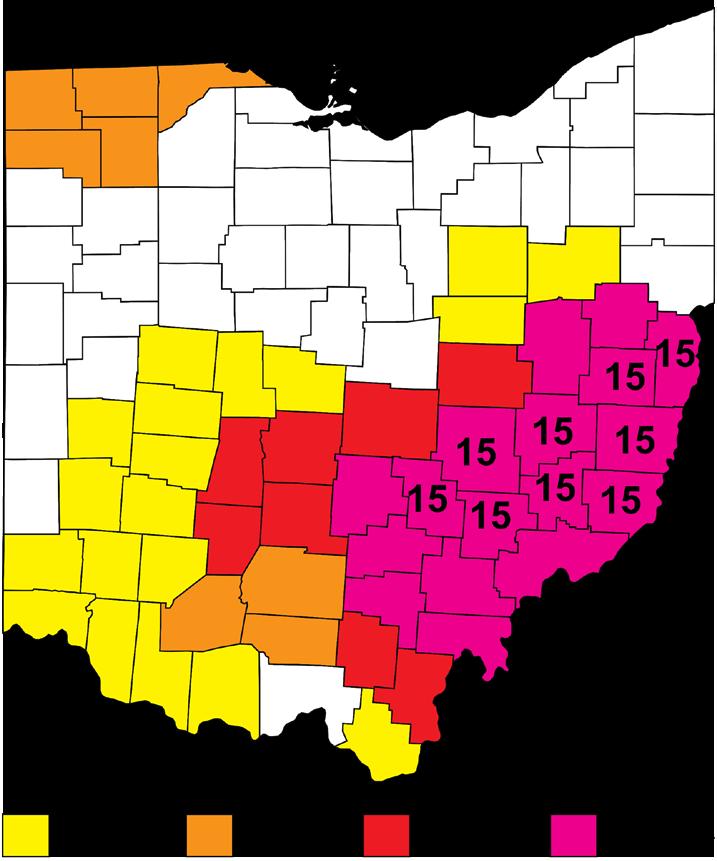
3. Total number of weeks that at least part of the county spent in D3 or D4 drought in 2024.

drought conditions received 6-10 inches of rain from Helene (e.g., Fayette, Ross, Pike, and Scioto Counties), along with strong winds that caused additional lodging and other crop issues. Much of southeast Ohio missed out on the benefical rains from this system. Dry conditions returned in October, ranking as the 7th driest October on record. All three fall months rank near or in the top 10 warmest on record as well. As November ended, an early season cold snap brought major lake effect snow to Lake and Ashtabula Counties with more than five feet of snow in some locations. Fall 2024 ranks as the 3rd warmest and 38th driest fall on record.
Winter 2024 - 2025 (Dec. - Feb.)
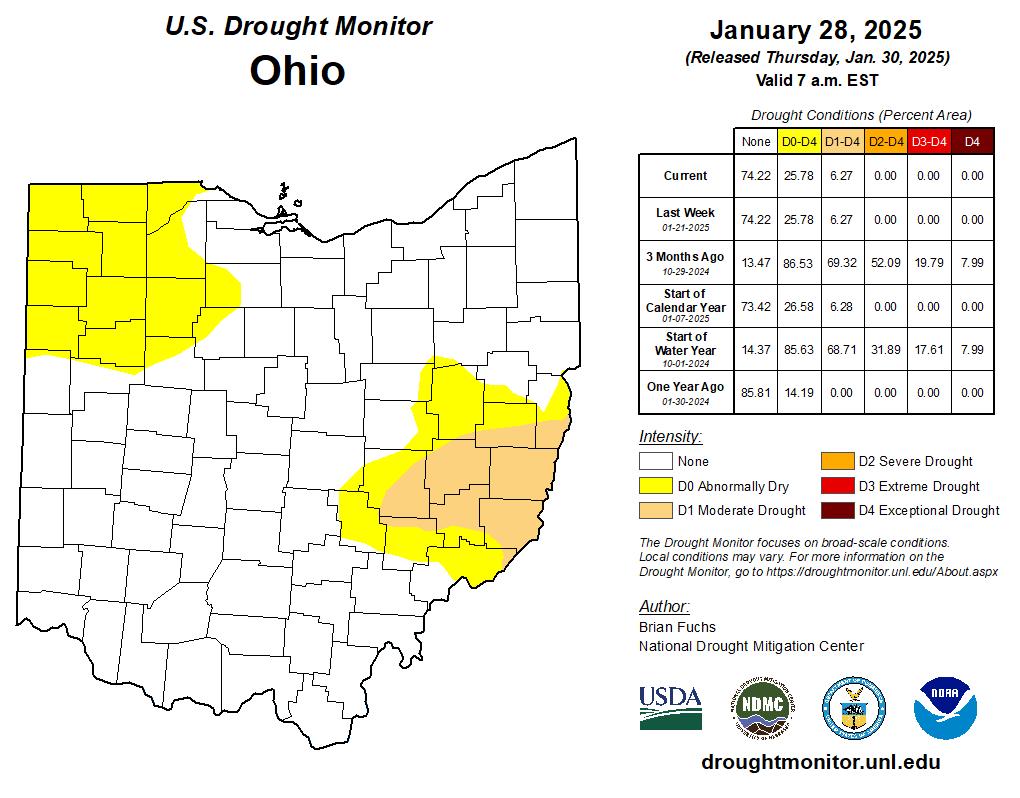
Winter started fairly volatile in December with major week-to-week temperature swings across the state and windy conditions; although average temperatures ended above normal in nearly all counties. Ohio’s final tornado of the year, the 74th tornado and a new record, touched down in Union County on Dec. 29, 2024. Above normal temperatures did not last however, as the thermometer dropped below average for January before settling close to normal in February. Weak La Niña conditions in the tropical Pacific brought hope for replenished soil moisture and continued drought relief. However, this did not materialize until February for southeastern counties. After experiencing the 13th driest January on record, more than 6% of Ohio still had D1-moderate drought conditions present on Jan. 28, 2025 (Fig. 4). Finally, above normal precipitation occurred across most of the state in February, ranking as the 26th wettest February on record. This included several days of light snow in early
Dr. Aaron B. Wilson, Extension Field SpecialistAg Weather & Climate (wilson.1010@osu.edu)
February followed by 1-3 inches of rain on Feb. 15 - 17.
Places like Athens, Ohio, which had experienced some of its lowest levels on the Hocking River the previous summer, were now experiencing flooding conditions. Winter 2024 - 2025 ranks as the 61st coldest and 51st wettest winter on record.


Still lacking soil moisture at the end of winter, March temperatures warmed quickly. March 2025 was nearly 7°F above normal and ranks as the 9th warmest March on record. Precipitation was hard to come by across eastern Ohio, and concerns for drought conditions returned. Similar to 2024, severe weather started early with several tornadoes and large hail reported at the end of the month. Though April temperatures were also above normal (1-2°F), multiple systems finally led to significant rainfall across the state, with southern counties picking up 4-8 inches for the month. On April 8, 2025, the U.S. DM indicated no areas of
abnormal dryness or drought, ending a 43-consecutive week stretch of drought classification. Pastures began to respond positively to the warmth and wetter conditions. May however, brought too much of a good thing as colder than normal temperatures began to hamper hay making conditions. Much of eastern Ohio had 2-6 inches of rain in May, with 18-25 days of at least of trace of rainfall. This limited farmers’ ability to cut and bale first cutting. The lack of warmth, especially during the second half of May led to a deficit of 30-90 growing degree days for many locations (Fig. 5). Despite the chilly May, Spring 2025 ranks as the 14th warmest and 16th wettest spring on record.

Figure 5. Growing Degree Day (GDD, base 50°F, ceiling 86°F) for 2025 (red solid line) and normal (black solid line). Blue shading indicates range of GDD accumulation for all Mays in record (1896-present). Differences compared to normal are in the bottom panel (red dotted line). Courtesy: Iowa Environmental Mesonet
Farming is a complex business, and many Ohio farmers utilize outside assistance for specific farmrelated work. This option is appealing for tasks requiring specialized equipment or technical expertise. Often, having someone else with specialized tools perform tasks is more cost effective and saves time. Farm work completed by others is often referred to as “custom farm work” or more simply, “custom work”. A “custom rate” is the amount agreed upon by both parties to be paid by the custom work customer to the custom work provider.
The 2024 publication, released on July 1, 2024, reports custom rates based on a statewide survey. Surveys were mailed/emailed to past respondents and distributed at various Extension programs through the winter of 2024 (beginning of 2024). The summary information included in the publication is based on the responses of 333 farmers, custom operators, farm managers, and landowners. These rates, except where noted, include the implement and tractor if required, all variable machinery costs such as fuel, oil, lube, twine, etc., and labor for the operation.
Some custom rates published in this study vary widely, possibly influenced by type or size of equipment used (e.g. 20-shank chisel plow versus a 9-shank), size and shape of fields, condition of the crop (for harvesting operations), skill level of labor, amount of labor needed in relation to the equipment capabilities, cost margin differences for full-time custom operators compared to farmers supplementing current income, and region of Ohio with different custom services supply and demand characteristics. Some custom rates reflect discounted rates as the parties involved have family or community relationships. Discounted rates may also occur when the custom work provider is attempting to strengthen a relationship to help secure the custom farmed land in a future purchase, cash rental or other rental agreement. Some providers charge differently because they are simply attempting to spread their fixed costs over

To review the full publication, visit the Custom Rates and Machinery Costs on the OSU Extension, Farm Office website: go.osu.edu/FarmCustomRates2024
more acreage to decrease fixed costs per acre and are willing to forgo complete cost recovery. Charges may be added if the custom provider considers a job abnormal such as distance from the operator’s base location, difficulty of terrain, amount of product or labor involved with the operation, or other special requirements of the custom work customer.
As a custom provider, the average rates reported in this publication may not cover your total costs for performing the custom service. As a customer, you may not be able to hire a custom service for the average rate published in this factsheet. It is recommended that you calculate your own costs carefully before determining the rate to charge or pay.
The measures shown are the summary of the survey respondents. The measures are the Average (Mean), Responses, Maximum, Minimum, Median, Standard Deviation, and Statistical Range. The Average reported in this publication is a simple average of all the survey responses for each operation. Responses indicates the number of survey responses for each given operation. The Maximum and Minimum reported in the table are the maximum and minimum amounts reported from the survey data for a given custom operation. The median represents the middle value of the survey responses. Standard Deviation is a measure of variability. Statistical Range identified in the tables consists of two numbers. The first is the average plus the standard deviation. The second number of the range is the average minus the standard deviation. In cases where there were too few responses to statistically analyze, statistics are not presented due to the low response rate. The data from this survey are intended to show a representative farming industry cost for specified machines and operations in Ohio.
Barry Ward Leader, Production Business Management ward.8@osu.edu
Eric Richer Field Specialist, Farm Management richer.5@osu.edu
John Barker
Extension Educator, Agriculture and Natural Resources barker.41@osu.edu
Amanda Bennett
Extension Educator, Agriculture and Natural Resources bennett.709@osu.edu
- Farm Labor


What are Enterprise Budgets?
Enterprise Budgets have been developed by faculty of the College of Food, Agricultural, and Environmental Sciences (CFAES) for several decades. The 2025 Freezer Beef Budget was developed by a team of OSU Extension faculty and staff. The budgets are tools that growers can use to examine different scenarios on their operation to help in decision making. The full offering of Enterprise Budgets can be found on Excel spreadsheets that users can download. Growers can then input their own production and price levels to calculate their own outputs. The budgets have color coded cells that will allow users to plug in their own numbers and calculate bottom lines for different scenarios.
Key points to remember:
• The budgets represent common, workable, combinations of inputs that can achieve a given output.
• Amounts of feed, bedding, supplies, machinery, labor, and other items reflect University recommendations and the experience of many Ohio farmers.
• The combinations of inputs and prices presented will not likely precisely reflect any given farm.
• In practice, actual costs will be higher or lower than shown. Thus the most important column is “Your Budget”.
Characteristics of an Enterprise Budget:
• Estimates the costs and returns expected for a single enterprise.
• Represents one combination (from among hundreds available) of inputs such as feed, supplies, and labor to produce some level of output.
• A written plan for a future course of action including estimated costs and returns for that particular enterprise.
• Provides a format and a basis for developing enterprise budgets appropriate for a given farm situation.
Stan Smith Extension Program Assistant smith.263@osu.edu
Garth Ruff Field Specialist, Beef Cattle ruff.72@osu.edu
Things not implied by an Enterprise Budget:
• It is not the only combination of inputs that can be used to produce this crop.
• It does not imply that anyone whose costs are different from this must have incorrect data or poor records.
• It does not imply that all producers can achieve these costs and yields. Different genetics, pasture quality, and local cost of supplies in a given season all can cause the actual results to vary greatly from what is presented.
Context for the Budget, seen to the right:
1 Sex and class of animal alters beginning weight, finish weight, feed per lb. of gain and estimated daily gain.
Death loss will vary based on age, weight, feeding regime and husbandry of animal.
2 Costs of health program estimated by authors based on industry experience and expertise, includes dewormer, fly control, two rounds of vaccinations and growth promoters
3 - 6 Costs of marketing estimated by authors based on industry experience and expertise, includes transportation
7 Costs of marketing estimated by authors based on industry experience and expertise, includes transportation.
• Insurance of 0.5%, and Repairs of 2%.
• Click into the 'Buildings and Equipment' tab of the budget sheet for specific cost calculations
8 Assumes purchase of new building, straight-line depreciation over applicable life, Interest of 5%, Property Taxes of 0.5%
• Insurance of 0.5%, and Repairs of 1%.
• Click into the 'Buildings and Equipment' tab of the budget sheet for specific cost calculations
9 1% of Total Receipts
10 Return to labor and management is the revenue less total expenses except operator labor and management. It is a measure of the returns to the operator's labor and management.
Barry Ward Leader, Production Business Management ward.8@osu.edu
Steve Boyles Extension Beef Specialist
Mike Estadt Extension Educator, Agriculture and Natural Resources estadt.3@osu.edu
Chris Zoller
Assistant Director, Agriculture and Natural Resources, OSU Extension zoller.1@osu.edu


Market Beef Budget (Bunk-Fed Daily) - 2025 Ranging from 650-1450 lbs
Values highlighted in gold may be changed to assist in computing "Your Budget" Column using macros embeded within Values highlighted in light blue are cells embedded with macros and will be calculated for the user based on data entered. Values highlighted in gray are stand alone cells that require direct input from the user.
Find your local office and contact your Agriculture and Natural Resources Extension Educator with questions and more information on available programs: extension.osu.edu/lao
Find 4-H books, Extension bulletins, Field Guides, and more! extension.osu.edu/extension-publishing
Information for new and small farms
Mission: To provide a greater understanding of production practices, economics of land use choices, assessment of personal and natural resources, marketing alternatives, and the identification of sources of assistance for new and small farms in Ohio.
Events:
• New and Small Farm Conference (annually)
• New and Small Farm Management Colleges

Connect with the Team: u.osu.edu/gofarmohio (QR code to the left)
YouTube: @osusmallfarmteam5974
Facebook: @GoFarmOhio
Learn. Grow. Connect. Inspire. Empower.
Mission: To help women improve their quality of life by providing them with resources to make better business decisions while maintaining a balance with family and personal obligations. Ohio Women in Agriculture partners with Annie’s Project (anniesproject.org) to provide workshops and networking opportunities.
Events:
• Regional Women in Ag Conferences
• Wednesday Women in Ag Webinar Series (monthly)
• Networking opportunities, resources, and more!
Connect with the Team: u.osu.edu/ohwomeninag
A team of experts that represents OSU Extension programs in Agricultural and Resource Law, Farm Management, Production Business Management, and Tax. We've collaborated to form the Farm Office, a one-stop shop for navigating the legal and economic challenges of agricultural production.
Events:
• Ag Lender Seminars
• Agri-Law Summit
• Workshops (Grain Marketing, Planning for the Future of Your Farm, and more)
• Webinars
Resources:
• Ag Law Library (online)
• Farm Management (Cash Rents and Farmland Values, Custom Rates and Costs, Data and Statistics, Decision Aids, Enterprise Budgets, online courses, and more!)
• Income Tax Schools
• Farm Transition Planning
• Ohio Farm Resolution Services (OFRS) - Ohio's Certified Agricultural Mediation Program
• Farm Financial Management and Policy Institute (FFMPI)
Connect with the Team: farmoffice.osu.edu
YouTube: @osufarmoffice Ag Law Facebook: @OhioAgLaw
Fulfilling the land-grant mission by interpreting knowledge and research so Ohioans can apply scientifically based information to better their lives, businesses, and communities.
The Ohio State University Extension, part of Ohio's land-grant institution, serves all 88 counties with a focus on Agriculture and Natural Resources, 4-H Youth Development, Family and Consumer Sciences, and Community Development. Established in 1974, the Veterinary Extension Unit continues to adapt and confront challenges, ensuring that valuable information reaches those who need it.
Find Resources and Veterinary Extension Specilalists, here: vet.osu.edu/departments-offices/extension

Forage Management, Pastures and Grazing, Research and Resources: Forages.osu.edu
Fact Sheets:
• Forage Testing for Beef Cattle ohioline.osu.edu/factsheet/anr-0149
• Giving New Life to Tired Pastures ohioline.osu.edu/factsheet/anr-0159
• Determining the Grazing Intensity and Move Frequency for Your Rotational Grazing System ohioline.osu.edu/factsheet/anr-0160
• Maximizing Forage Quality Through Targeted Grazing of Native Warm-Season Grasses ohioline.osu.edu/factsheet/anr-0166
• Forage as Vegetative Cover for Utility-Scale Solar in Ohio ohioline.osu.edu/factsheet/cdfs-4106
Ohio Composting and Manure Management Program (ocamm.osu.edu). Goal: To facilitate research, development, and communication of sustainable strategies for the management of animal manures and other organics for Ohio farms and communities. Ohio State Extension Environmental and Manure Management Facebook: @OSUnutrients
Fact Sheets:
• Manure and Compost: Nitrogen Availability in Organic Production ohioline.osu.edu/factsheet/anr-34
• Horse Manure Management ohioline.osu.edu/factsheet/AGF-212
• Manure to Energy Through Anaerobic Digestion ohioline.osu.edu/factsheet/AEX-653.1
Buckeye Dairy News: dairy.osu.edu/newsletter/buckeye-dairy-news
Ohio Dairy Industry Resources Center dairy.osu.edu
Fact Sheets:
• Calving Management in Dairy Herds: Timing of Intervention and Stillbirth ohioline.osu.edu/factsheet/VME-29
• Bird Flu: Health, Nutrition, and Food Safety in the Face of an Outbreak ohioline.osu.edu/factsheet/fcs-1010
Ohio Pork Information Center porkinfo.osu.edu/


Providing information and educational materials on topics like beef cattle management, feeds and feeding, pasture management, marketing, and more.
Events and Programs:
• Ohio Beef School
• Grazing and Pasture Walks, Forage Nights
• Clinics
• Beef Quality Assurance Certifications
• Bovine Emergency Response Planning (BERP)
Resources:
• BEEF Cattle Newsletter: u.osu.edu/beef
• Evaluating Beef Cattle Stockmanship Fact Sheet: ohioline.osu.edu/factsheet/anr-0164
Connect with the Beef Team: u.osu.edu/beefteam
Tours, Reproduction Services, Training Services: ati.osu.edu/aboutus/facilities/equine-center
Connect on Facebook: ATIEquineCenter
Equine Fact Sheets:
• Plants Poisonous or Injurious to Horses ohioline.osu.edu/factsheet/1028
• Management Considerations for the Cribbing Horse ohioline.osu.edu/factsheet/anr-89
• Feeding Horses ohioline.osu.edu/factsheet/anr-6
• The Role of Macronutrients in Equine Nutrition ohioline.osu.edu/factsheet/1023
• The Role of Micronutrients in Equine Nutrition ohioline.osu.edu/factsheet/1021
Supporting Ohio small ruminant producers by providing educational information, research conducted at The Ohio State University, resources, and contact information for leaders in Ohio's small ruminant industry.
Connect with the Team: u.osu.edu/sheep
Resources:
• Small Ruminant Production: Are CIDRs Reusable? Fact Sheet: ohioline.osu.edu/factsheet/as-1025
Resource: Backyard Poultry Certification Course (online) Connect and find resources: u.osu.edu/poultry/
For 2025, eBarns forage research was focused on incorporating technology into forage production, improving pasture management, and growing high quality forages. Below are highlights of the 2025 eBarns Forage research:
32.5 acres of forages 10 forage studies
For more forage research and feeding management from Ohio State University Extension, explore the following resources:
The purpose of the Ohio Forage Performance Test is to evaluate forage varieties of alfalfa, annual ryegrass, and cover crops for yield and other agronomic characteristics. This evaluation gives forage producers comparative information for selecting the best varieties for their unique production systems. The most recent test was completed in 2019. For more information visit: go.osu.edu/OhioForages.
The Agronomic Crops Team performs interesting research studies on a yearly basis. Resources, fact sheets, and articles on alfalfa, winter annuals, and summer annuals can be found here on the Agronomic Crops Team website: go.osu.edu/CropTeamForages.


Corn Plant Silage
Forage Sorghum Sorghum Sudangrass Sudangrass
Soybean Silage
Teff Grass
Millets
Mixtures of annual grasses with soybean


Highest single cut forage yield potential of all choices. Silage quality will be lower than with normal planting dates. Risk will be getting it harvested at right moisture for good fermentation.
Best harvested as silage. Brown midrib (BMR) varieties are best for lactating cows. Conventional varieties are okay if BMR seed is not available. Can produce 3-4 tons of dry matter/acre. Risk of prussic acid (hydrogen cyanide gas) if frosted.
Reasonable alternative to replace alfalfa forage. Check seed treatment and herbicide labels, many restrict forage use.
Best suited to beef and sheep; lower yield than sorghum grasses. Can harvest as hay or silage.
Best suited to beef and sheep; many produce a single harvest. Best harvested as silage. Pearl millet does not produce prussic acid after frost damage.
Best harvested as silage. Mixtures of sorghum grasses or millets or even oats and spring triticale with soybean are feasible and can improve forage quality characteristics.
Oat or Spring Triticale
Oat or Spring Triticale Plus Winter Cereals
Oat or Spring Triticale Plus Field Peas
Italian Ryegrass
Can be mowed and wilted to correct harvest moisture. Harvesting as hay can be challenging. Earlier planting dates provide more autumn yield.
Winter cereals (Winter rye, Winter wheat, Winter triticale) can be added to oat or spring triticale to add a forage harvest early next spring. Winter rye can also contribute a little extra autumn yield to the mixture.
Field peas can improve forage quality (especially crude protein content) but will increase seed cost.
Earlier planting dates provide more autumn yield. Excellent forage quality in the fall. Potential for three harvests next year starting in late April.
Evaluate the effects of application method and fungicide on corn yield and deoxynivalenol (DON) levels.
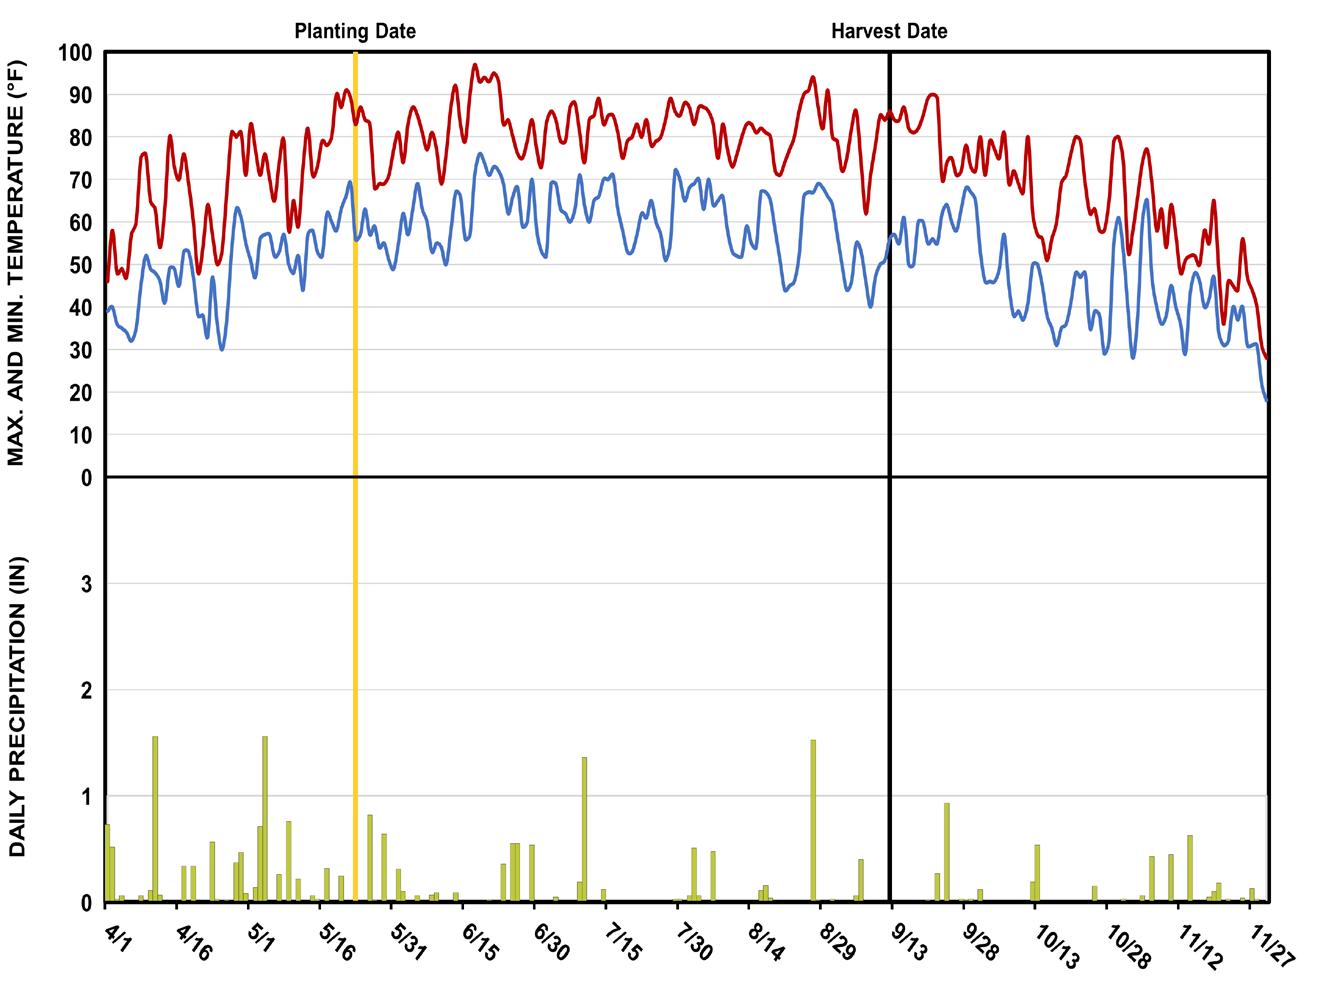
Planting Date 5/23/2024
Harvest Date 10/28/2024
Population 34,000 sds/ac
Acres 1.5
Treatments 14
Reps 3
Treatment Width 10 ft.
Tillage Minimum Till
Management Fertilizer, Fungicide, Herbicide
Previous Crop Corn
Row Spacing 30 in.
Soil Type Hoytville clay loam 95%
This study was a randomized complete block split block, split-plot design with the block split between ground and drone applications and the plot split by fungicide product, with a control for every split plot. The fungicides used were Miravis Neo at 13.7 fluid oz/ac and Proline at 5.7 fluid oz/ac. Application methods used were a ground sprayer with a boom over the top (applying either 15 or 20 gal/ac of product), a ground sprayer with 360 yield under covers (applying 15 or 20 gal/ac of product), three drones (DJI T25, Hylio with cone nozzles, and Hylio with turbo teejet air induction (TTAI) nozzles) applying 2.5 gal/ac of product. Plots were inoculated with Fusarium graminearum 24 hours after fungicide application.

NW Ag Research Station
OSU Extension
Wood County

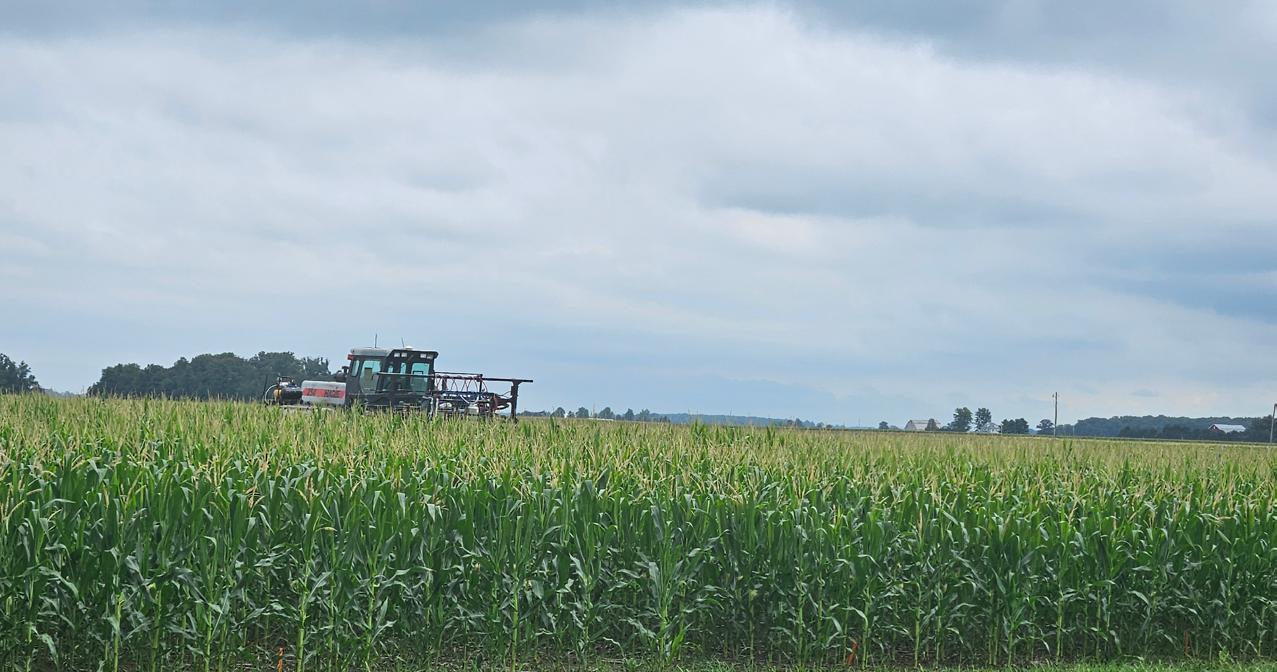
The high clearance sprayer making an application.

Plots experienced too much rain early on and experienced water damage from early-season flooding, followed by drier conditions later in the season. Corn disease levels, both foliar and ear rots, were very low. At tassel total corn height was only 5-7 feet tall.

Treatment Means with the same letter are not significantly different according to Fisher’s Protected Least Significant Differences (LSD) test at alpha = 0.1.
Turbo Teejet Air Induction Nozzles
These nozzles are for applying fungicide with a consistent spray droplet size.


• Application method did not have a significant effect, and there was no interaction between application method and fungicide.
• However, fungicide did have a significant effect on the DON level. Since only fungicide was significant, only those results are reported.
• DON levels were very low, and additional research is needed under higher DON levels to determine if these results are consistent.
• There was no significant effect of application method or fungicide on yield. Plots had very low levels of foliar disease pressure. Weather conditions at this location did not favor foliar or ear disease developement.

For inquiries about this project, contact: Jason Hartschuh (hartschuh.11@osu.edu)
Stephanie Karhoff (karhoff.41@osu.edu)
Pierce Paul (paul.661@osu.edu)
Rich Minyo (minyo.1@osu.edu)
Evaluate the effects of application method and fungicide on corn yield and deoxynivalenol (DON) levels.
Planting Date 5/31/2024
Harvest Date 10/23/2024
Population 34,000 sds/ac
Acres 2
Treatments 16
Reps 4
Treatment Width 10 ft.
Tillage Minimum Till
Management Fertilizer, Fungicide, Herbicide
Previous Crop Corn
Row Spacing 30 in.
Soil Type
Kokomo silty clay loam 83%, Strawn-Crosby complex 17%
This study was a randomized complete block split block, split-plot design with the block split between ground and drone applications and the plot split by fungicide product, with a control for every split plot. The fungicides used were Miravis Neo at 13.7 fluid oz/ac and Proline at 5.7 fluid oz/ac. Application methods used were a ground sprayer with a boom over the top (applying either 15 or 20 gal/ac of product), a ground sprayer with 360 yield under covers (applying 15 or 20 gal/ac of product), and four drone treatments. For the drone treatments, three applied 2.5 gal/ac of product (DJI T25, Hylio with cone nozzles, and Hylio with turbo teejet air induction (TTAI) nozzles), while the fourth (a DJI T25) was the applying 5 gal/ac. Plots were inoculated with Fusarium graminearum 24 hours after fungicide application.

OSU Extension
Clark County

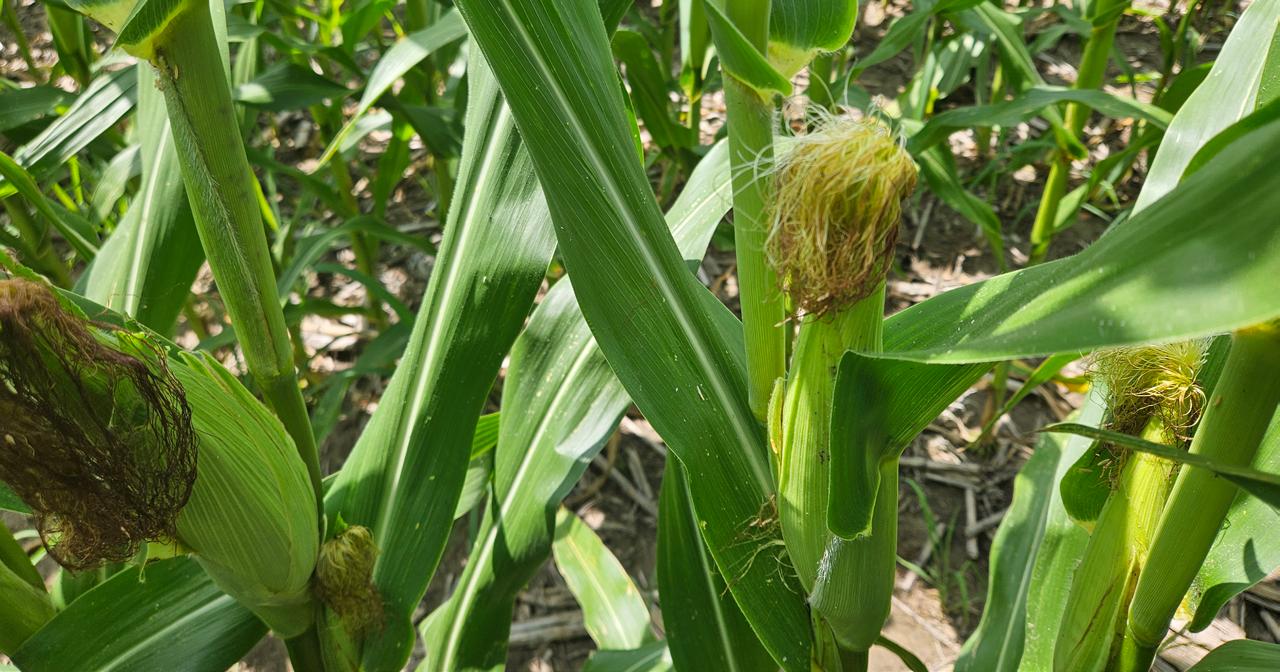
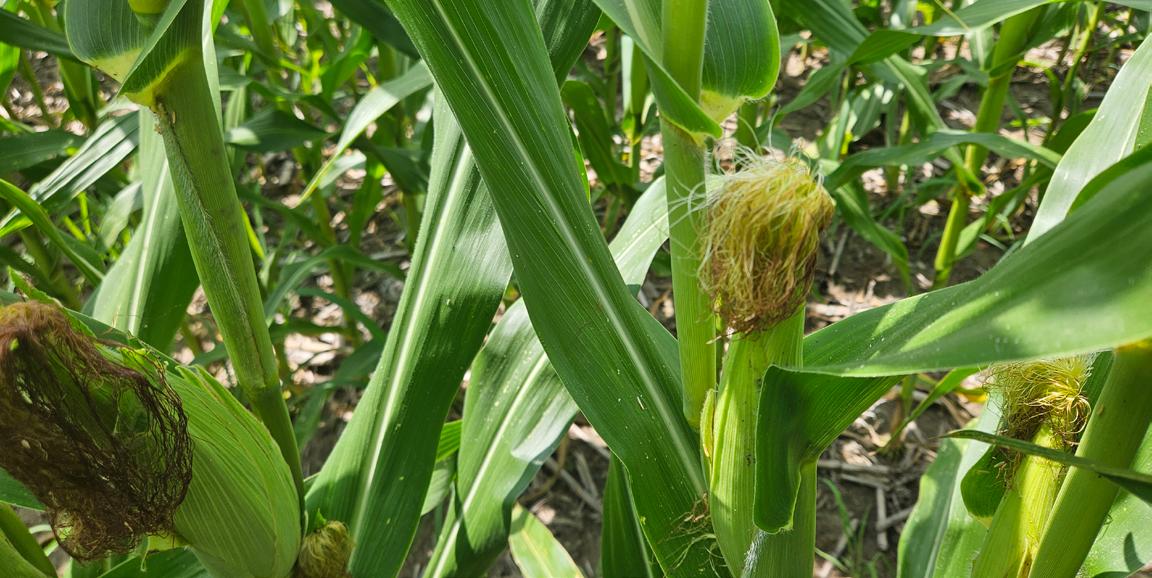
A view of silks at application.

A windstorm in October lodged the plots significantly, but less lodging was experienced when Miravis Neo was applied. The lodging created some difficulty with the harvest, leading to header plugging. Foliar disease was significant, with greater disease pressure in the control and Proline treatments than in Miravis Neo. Plots also experienced significant weed pressure from giant ragweed and morning glory.
• Application method did not have a significant effect, and there was no interaction between application method and fungicide. However, fungicide did have a significant effect on yield. Since only fungicide was significant, only those results are reported.
• Miravis Neo significantly increased the yield compared to Proline and the control. Miravis Neo contains 3 modes of action and is good to excellent for tar spot, gray leaf spot, and Northern corn leaf blight.
• DON levels were very low. Plots had high levels of foliar disease pressure.
Means with the same letter are not significantly different according to Fisher’s Protected Least Significant Differences (LSD) test at alpha = 0.1.
High Clearance Ground Sprayer
Used for applying fungicide to corn after tassel.


For inquiries about this project, contact: Jason Hartschuh (hartschuh.11@osu.edu)
Stephanie Karhoff (karhoff.41@osu.edu)
Pierce Paul (paul.661@osu.edu)
Rich Minyo (minyo.1@osu.edu)
Assess the difference between hybrids in resistance to deoxynivalenol (DON) mycotoxin production from Gibberella Ear Rot (GER).


With support from Ohio Corn and Wheat through the Corn Check Off, OSU conducted its second year of corn deoxynivalenol (DON) hybrid susceptibility screening. The objective of this project was to identify hybrids with partial genetic resistance to DON.
Use these results with caution as we were not able to evaluate the effects of all possible weather environments on DON production.
This trial was conducted at three locations across the state that represent different production regions: Apple Creek, Bucyrus, and South Charleston. Hybrids varied in maturity, so weather conditions may not have been conducive for ear infection and DON production by the fungus Fusarium graminearum during each individual hybrid pollination window, despite using three different environments. All locations had low levels of natural infection across all maturity groups. To increase Gibberella ear rot (GER) development, and consequently, DON contamination of grain, plots were also inoculated at all three locations. DON levels were significantly different between inoculated and naturally infected plots at all locations. Results were summarized, and hybrids are compared, by location and if inoculated or naturally infected.

OSU Extension Statewide
In 2024, 89 hybrids were submitted from 11 seed companies. Although weather conditions were less favorable for GER development in 2024 than in 2023, statistically significant differences were still observed among hybrids in terms of average levels of DON contamination. These results can be used to select hybrids with natural partial resistance to DON, or at the very minimum, avoid highly susceptible hybrids. While only 21 hybrids were included in both years, comparing hybrid performance across years is encouraged as it represents a wider range of weather conditions. Keep in mind, hybrids with low DON in 2024 are not guaranteed to have low DON in future years or environments. However, hybrids with consistently high DON across environments are likely susceptible and should not be planted when possible if DON contamination is a concern for your operation.
The weather conditions at all locations in 2024 deviated from normal. All locations had below-average rainfall during the growing season and above-average temperatures compared to the 10- and 30-year averages. In South Charleston, the month of September received aboveaverage rainfall, with hurricane force wind and rain. Wooster rainfall was about a half inch above-average in May, August, and September, whereas at Bucyrus, rainfall was more than an inch aboveaverage in April and May, but only slightly above average in September. Excessive rainfall in May in Bucyrus created a few emergence challenges. The complete set of monthly weather data is available at: OhioCropTest.cfaes.osu.edu/CornTrials
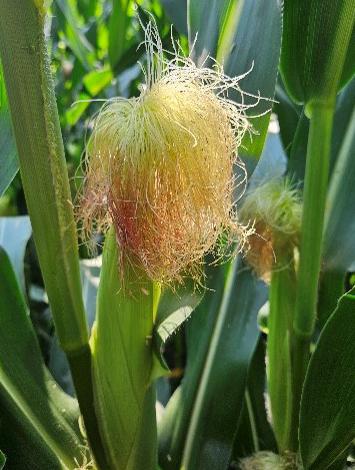

The table on the following pages summarizes DON contamination (in ppm) by hybrid and inoculated and naturally infected treatments at each location. DON values with an asterisk (*) are not statistically different from the lowest average DON level at that location. DON levels at all locations were low, with 54 plots having contamination between the limit of detection (considered equivalent to 0 ppm) at Bucyrus, three at South Charleston and one at Wooster. Only four plots had greater than 1 ppm in Bucyrus, nine in Wooster, and 16 in South Charleston. At Bucyrus, the effect of hybrid on DON contamination was not statistically significant (i.e. contamination was comparable across hybrids) in inoculated plots. However, the hybrid effect on DON contamination was statistically significant in naturally infected plots, meaning that the


average level of contamination varied with hybrid. While DON levels were low this year, there are a few trends to look for. For instance, two hybrids had significantly higher DON than other hybrids at all six inoculation treatment by location combinations, while another 8 had statistically higher DON at 4 of the 6 inoculation treatment by location combinations. Thirty-seven hybrids had comparable levels of DON to the least contaminated hybrid at all locations, while another 17 had low DON at all but one inoculation treatment by location combination. When using these results to help with your hybrid selection, look for trends where a hybrid consistently has low DON to increase your chance of selecting those that might have partial genetic resistance. More information on Vomitoxin research being done at OSU can be found at go.osu.edu/vomitoxin
Numbers with an asterisk (*) are not significantly different from the lowest DON level at the location - Table continues on following pages -
Our Corn Checkoff


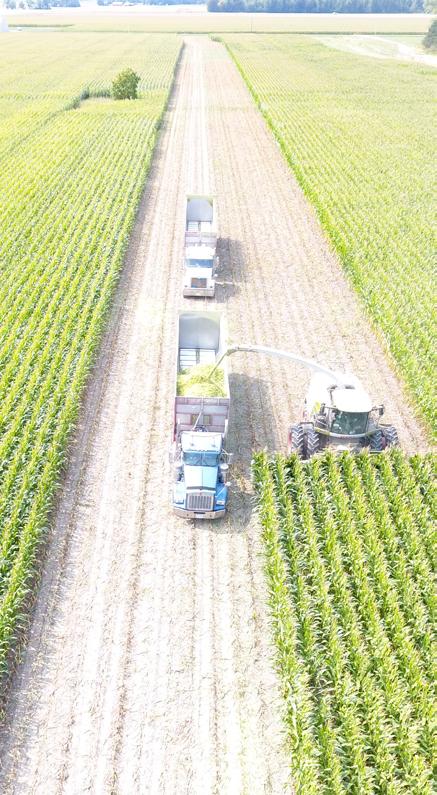
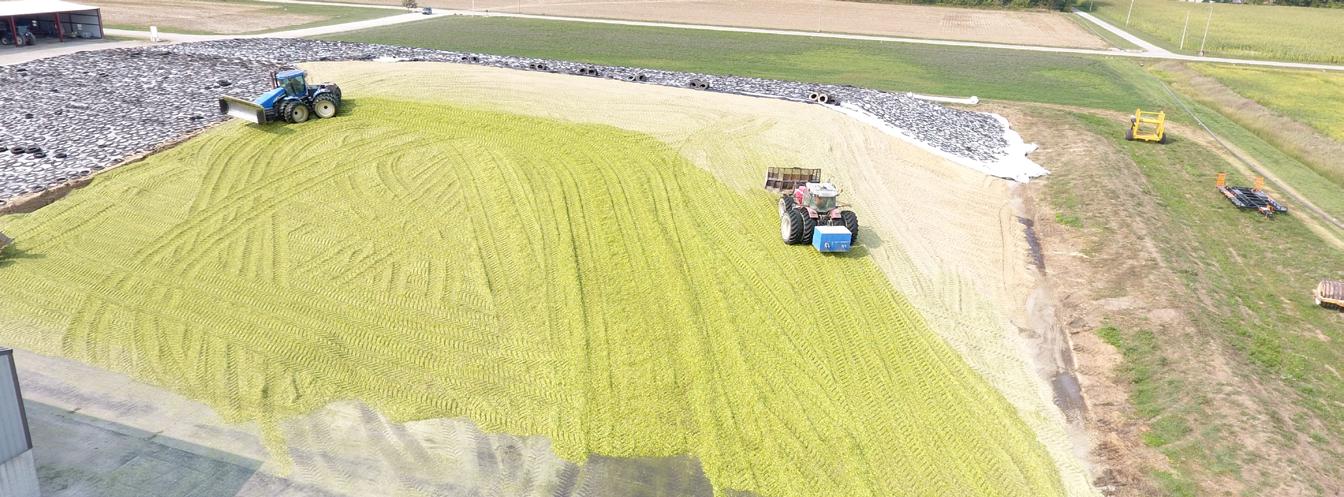
The process of pricing corn silage can be challenging due to the lack of a public market providing official prices, unlike corn grain. Typically, corn silage prices are established through individual contracts and negotiations, which can lead to concerns about the asymmetry of information.
Given that region-specific information, such as local cash corn prices, hay bids, and harvest costs must be entered into the formula for determining corn silage value, it is critical to have a pricing tool that is grounded in timely and localized information from Ohio. While other corn silage pricing tools exist, we have a downloadable decision tool to assist buyers and sellers in determining corn silage pricing in Ohio.
This tool provides a transparent process for determining the value of silage, requiring only the estimate of either corn grain yield or silage yield wet basis from users. Users can also adjust other parameters, such as operational costs and who pays silage harvest costs, to reflect their unique circumstances. The tool allows for the inclusion of often forgotten costs such as silage shrink and field loss of corn grain during field dry down. The tool provides a reasonable ”range” of corn silage values for negotiation in three units: dollars per acre, dollars per ton wet basis, and dollars per ton dry matter.
The back-end data, including Ohio farm operation costs and county-level cash corn prices, are updated annually. Specifically, in this update for the 2025 version, there are four major remarks:
1. The default corn grain yield is set at 190.1 bushels per acre – same as the OSU Enterprise Budget, based on the trend-based prediction. Accordingly the default silage yield basis is updated to reflect this assumption.
2. County-specific cash prices are updated based on Barchart data (accessed on July 10, 2025).
3. Hay price is updated based on the Ohio listings from AllHay.com (accessed on July 10, 2025).
4. Other input costs reference the 2024 OSU Custom Rates, which are updated every other year.
Finally, we would like to emphasize that this tool should be used for reference only, and users are encouraged to adjust the value of silage based on their individual circumstances when negotiating silage sales.
The downloadable spreadsheet includes 4 stages. To begin, enter the necessary values on the User tab to get the per-acre gross value of silage:
1. Quantity Estimates: Grain and silage yield
Enter “Estimated grain yield” and “Dry matter of silage” (%). Then, the tool provides guided “Estimated silage yield wet basis” and “Silage yield dry basis.” If users have a better estimate of silage yield wet basis instead of grain yield, they can enter their own silage yield wet basis (D7) instead of entering the “guided value” (E7).
2. Prices
To estimate the price of silage, we refer to cash price* and 2nd hay auction prices**. For corn grain discount and average grain loss for harvest before black layer, the guiding values draw on a conventional estimate and Nielsen et al. (1996), respectively. Users can change these values.
The two stages report the per-acre gross value of silage. Sellers mainly rely on the value of grain, while the buyers take hay values—opportunity costs—into account as well as the grain value. The tool shows the potential negotiation range.
3. Price adjustment for harvest cost
Reflect on additional opportunity costs (harvest costs of grain and nutrient removal) and who will be in charge of silage harvest expenses.
4. Range to negotiate
Find the complete range to negotiate based on the inputs entered. The range is displayed in three different units: dollars per acre, dollars per ton wet basis, and dollars per ton dry matter.
*Prices from barchart.com
**Prices from farmanddairy.com
Access spreadsheet, here: go.osu.edu/CornSilagePrice


For inquiries about this project, contact: Jason Hartschuh (hartschuh.11@osu.edu)
Seungki Lee (lee.10168@osu.edu)
Evaluate the resistance of corn silage hybrids to deoxynivalenol (DON) contamination.
Planting Date 5/23/2024
Harvest Date 9/12/2024
Hybrid See Treatments
Population 34,000 sds/ac
Acres 2
Treatments 11
Reps 3
Treatment Width 10 ft.
Tillage Minimum Till
Previous Crop Corn
Row Spacing 30 in.
Soil Type Hoytville silty clay loam 100%

NW Ag Research Station
OSU Extension
Wood County
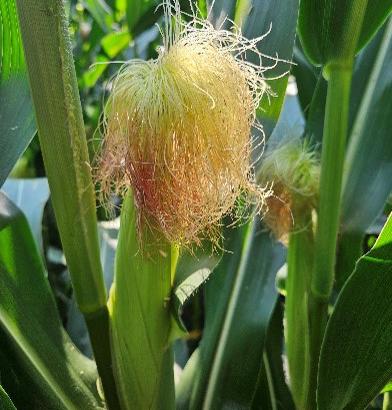
This study was designed as a randomized complete block. Hybrids for the trial were recruited from any company that entered hybrids into the grain deoxynivalenol (DON) screening trial. However, water damage in the early season significantly damaged stands in all but one section of the plots that had the identity-preserved corn. At R1, corn was inoculated with Fusarium graminearum spores sprayed on the silks. Corn was harvested at about 2/3 milk line average. Silage samples were vacuum sealed and fermented for 30 days, then submitted for laboratory analysis.
While other companies' hybrids were entered in this trial, the section that only had the identity-preserved Enogen corn was not significantly affected by early-season flood damage. The section with the other hybrids had significant stand reductions.


• Even in a year with very low DON levels, there was a significant difference between corn silage hybrids.
• Weather conditions after pollination did not favor disease development, even though the risk during pollination was moderate.
• DON in corn silage can come from both the stalk and the ear. For dairy rations, keeping the total ration DON below one ppm is a good goal. When corn silage makes up 50-70% of the ration, 3 of these hybrids have high enough DON levels to increase the risk of immunosuppression.
Small plot forage harvester
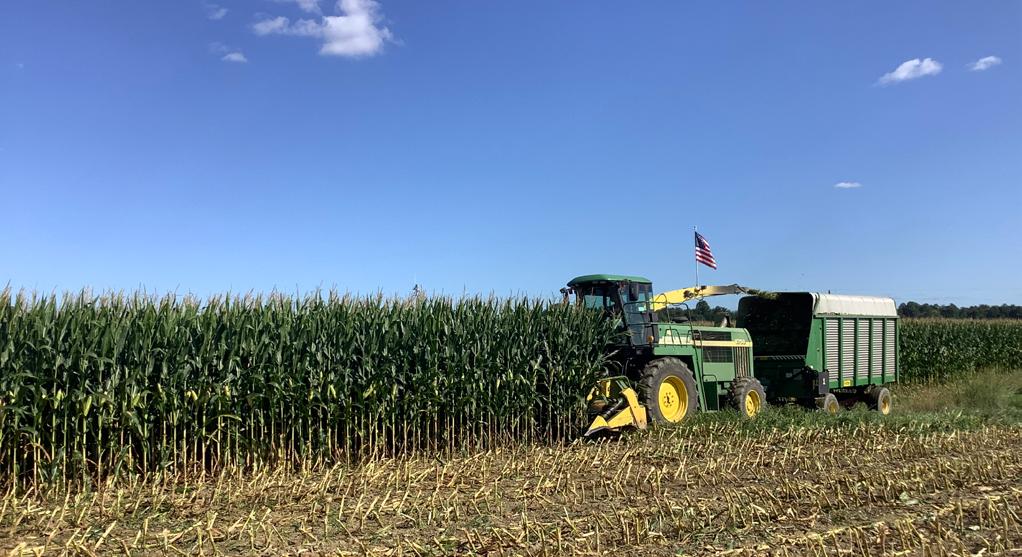
Used for harvesting corn silage and taking forage samples.


Treatment Means with the same letter are not significantly different according to Fisher’s Protected Least Significant Differences (LSD) test at alpha = 0.1. LSD: 0.64 CV: 61.7%

For inquiries about this project, contact: Jason Hartschuh (hartschuh.11@osu.edu) Rich Minyo (minyo.1@osu.edu)
Identify the ideal route spacing for broadcasting various cover crops, including mixes, using an unmanned aerial system (UAS).

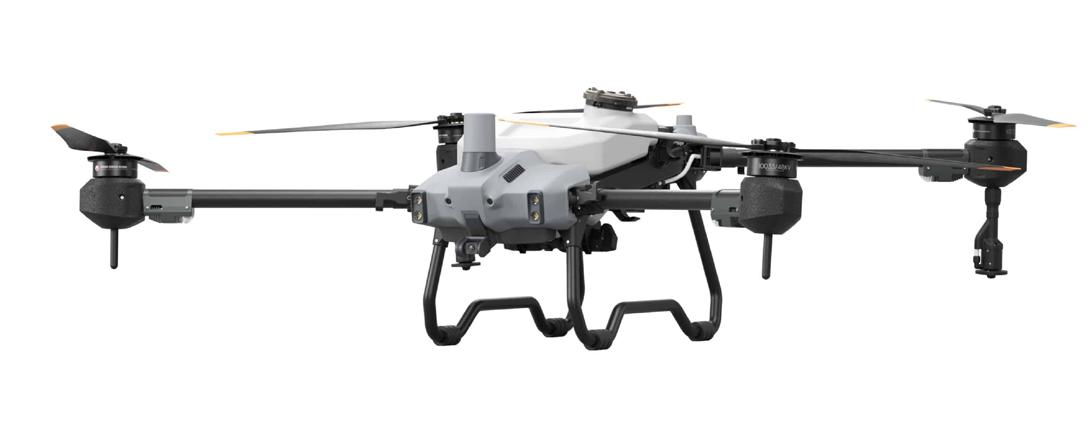
A DJI Agras T20P drone, equipped with a single-disk spreading system, was used with standardized collection pans placed in rows at least 2 feet apart, with no space between each pan. The drone spreader was flown transversely and over the center of the row of pans. The five treatments were cereal rye, crimson clover, radish, cereal rye/crimson clover, and cereal rye/radish. The application rates for the single seed type tested were according to the USDA NRCS Appendix -A (Cover Crops). When broadcasting seeds, due to the possibility of lower emergence, the rates included a 20% increase to the recommended rates. These rates were 60 lbs/ac of cereal rye, 22 lbs/ac of crimson clover, and 4 lbs/ac of radish. The application rate for the seed mixes was the single seed type rates added together and mixed appropriately for comparing when the seed is spread when mixed and not mixed. All tests were replicated four times. For the seed mixes, the different seed types were separated and weighed individually. This data was then used to calculate the average single pass pattern for each cover crop treatment. These patterns were then used to calculate the uniformity of spread (CV) and route spacing by product. A CV of 30% or less was considered acceptable spread uniformity for a drone spreader to achieve a wider route spacing.


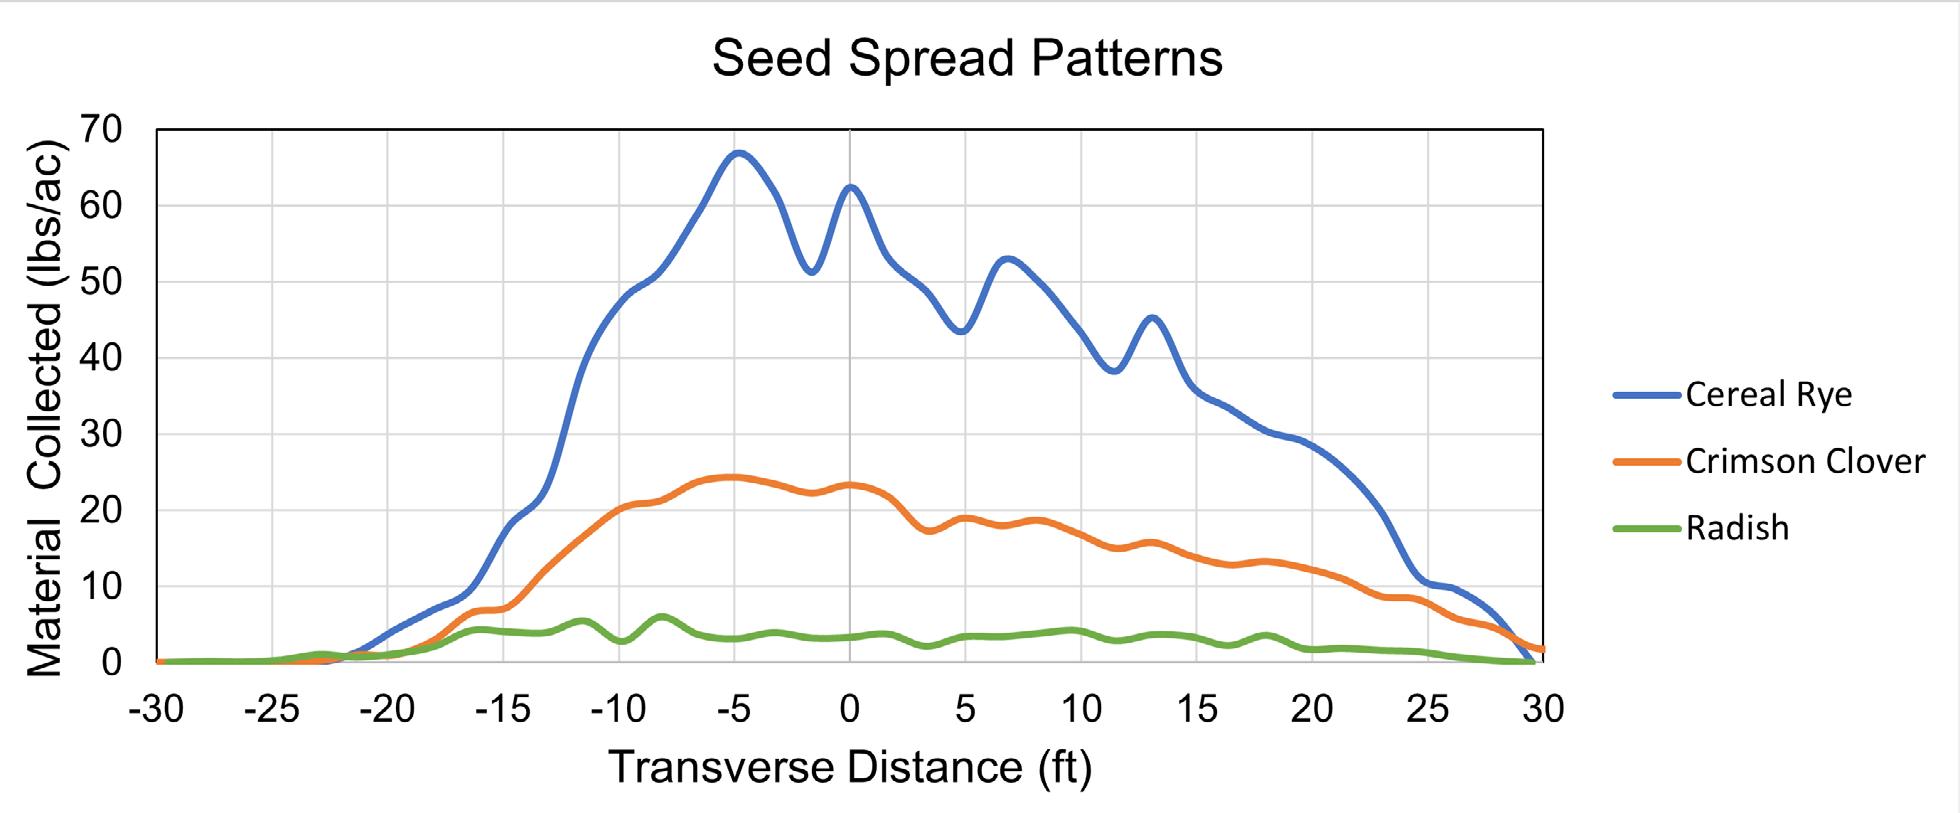
This graph shows the averages of the data collected for each seed.

The change in the variation from when the seed is spread by itself versus when it is mixed with other materials is likely from the change in the flow of each seed type. The short optimal route spacing of the radish is likely due to the testing being done with the large hopper gate, but trying to apply a low rate. Further testing will be done using the small hopper gate, which will better meter the seed at the lower rates. The shorter optimal route spacing of radish in Mix B is likely because the difference between the cereal rye seed mixed with the radish seed. Further testing will adjust the rates to follow the USDA Appendix - A recommendations.


• Route spacings for a seed was different when spread individually and when mixed with another seed type with different physical characteristics.
• Using the correct hopper gate for metering of product is important. Small seeds at low rates will need the smaller hopper gate. Larger seeds being applied at higher rates will need the large hopper gate.
• Pattern testing should be done if you are looking to spread at wider route spacings and maintain consistent spreading.

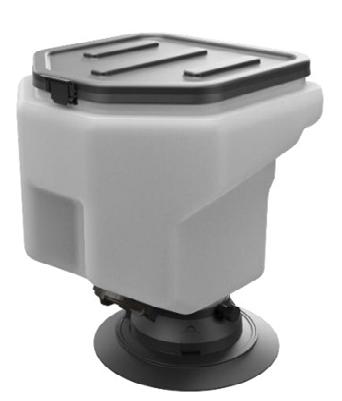
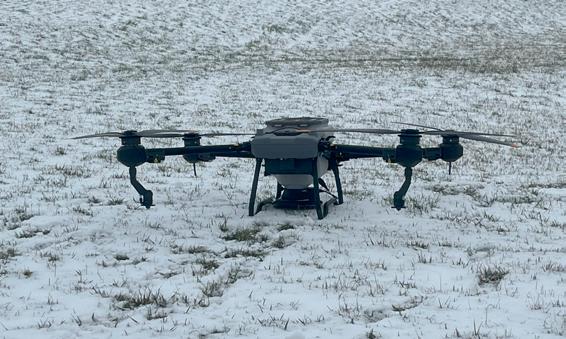
The DJI Agras T20P Drone can be equipped with a single disk spreading system provided through DJI. The spreader box is capable of carrying approximately 55 lbs. of dry product. The spreader comes with different hopper gates (small and large) in order to meter product onto the spinner disk depending on the target rate.
For inquiries about this project, contact: John Fulton (fulton.20@osu.edu) Alex Thomas
Evaluate the ability to use a drone versus an ATV spreader for frost seeding a pasture.
Planting Date 3/6/2024
Harvest Date 8/15/2024
Variety See Treatments
Population See Treatments
Acres 10
Treatments 5
Reps 4
Treatment Width 20 ft.
Soil Type
Zanesville silt loam, 90% Berks channery silt loam, 8%
Vandalia-Guernsey silty clay loams, 2%
This study utilized a randomized complete block split-block design where the blocks were split by ground application using an ATV spinner spreader and drone application using a DJI T20 with a dry spreader. For the clover treatment 6 lbs. of clover were applied (3 lbs. of red clover and 3 lbs. of white clover). The grass mix treatment consisted of 3 lbs. of orchard grass and 2 lbs. of annual rye grass.

OSU Extension
Noble County

Measuring forage yield using a 2 ft x 2 ft square, equivalent to 1/10,000th of an acre.
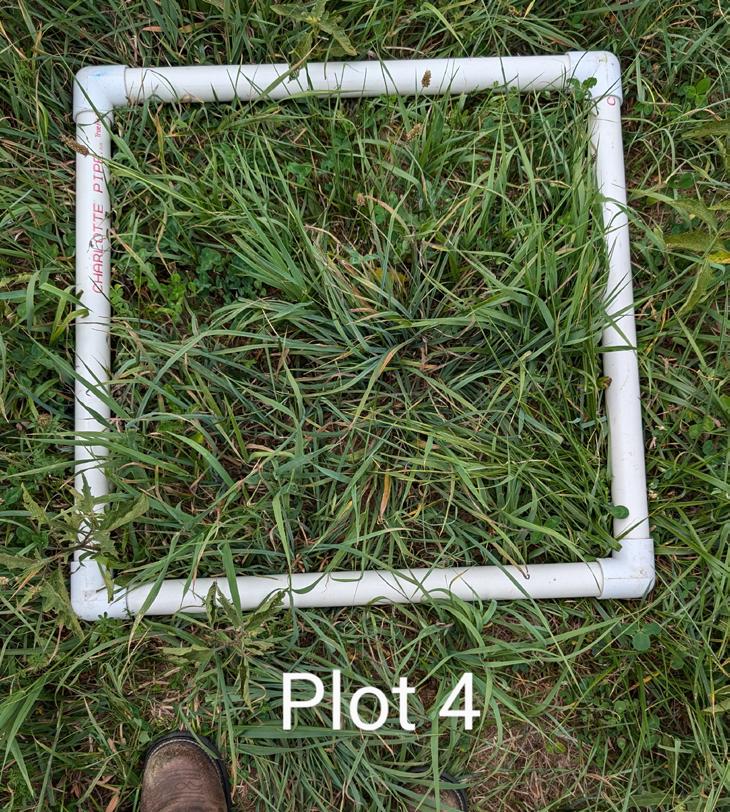


The annual rye grass seed was easily caught in the wind while spreading, leading to annual rye grass in both the plot it was seeded in and additional plots downwind. Plots were seeded into a thin hay field which grew back stronger than expected limited seedling growth which was followed by drought conditions later in the growing season.

Filling drone with seed.


• Both frost seeding with a drone and a ground spinner spreader increased the visual percentage of clover in plots over the control or grass plots.
• The grass drone seeding had more off-target seed drift than ground applications.
• Frost seeding had little effect on forage quality, besides the drone grass mix, which increased digestability and potassium showing a slight species shift to annual rye grass.
Treatment Means with the same letter are not significantly different according to Fisher’s Protected Least Significant Differences (LSD) test at alpha = 0.1.
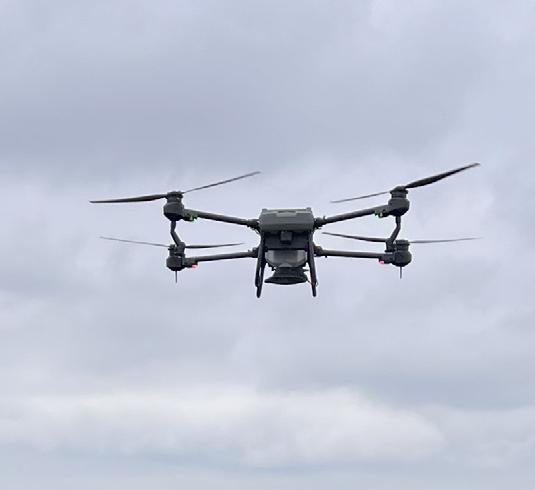
DJI T20 Drone with Hopper Spreader
Used for applying dry products.
For inquiries about this project, contact:
Jason Hartschuh (hartschuh.11@osu.edu)
Garth Ruff (ruff.72@osu.edu)
Christine Gelley (gelley.2@osu.edu)
Alex Thomas
Evaluate the use of a drone to control woody invasive weeds on formally strip mined pastures.
Start Date August 2024
End Date May 2025
Variety Pasture
Population N/A
Acres 10
Treatments 2
Reps 4
Treatment Width 10 ft.
Management Herbicide
Guernsey silt loam, 60%
Fairpoint silt loam, 19%
Soil Type
Bethesda channery loam, 18%
This study employed a randomized complete block design, where four pasture paddocks were selected for treatment, and the treated and untreated areas were randomly assigned. Weed control was rated as percent weed control in the fall and again in the spring, with the untreated area considered 100% alive. Capparal, Preference, and Remedy Ultra, were applied by a drone at a rate of 5 gal/ac.

OSU Extension
Noble County


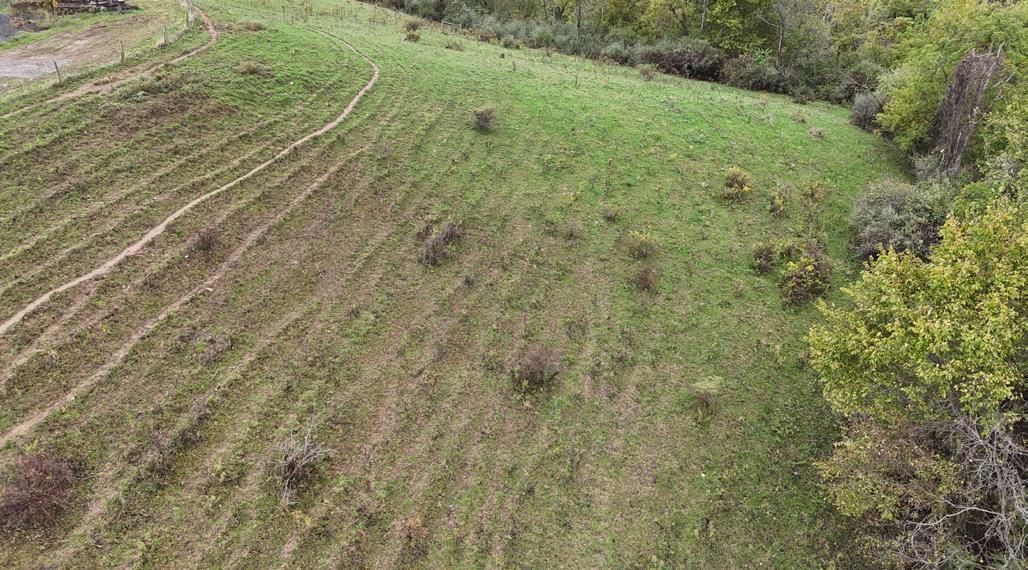

When applying herbicide with drones on steep grades, such as reclaimed strip mine land, the collision avoidance system can pose challenges, especially when large woody perennials are present that you want to target for spraying. Utilizing the manual flight mode can help with this issue. When flying in manual mode, application paths did not always overlap properly. Other broadleaf weeds, such as thistle and yellow rocket, were also controlled.


• The drone application significantly reduced greenness one month following herbicide application. The following spring, the portion of the plant that was alive was significantly reduced in both Multifloral Rose and Autumn Olive.
• Woody perennials often require multiple applications to achieve 100% control. The plants that were over 10% alive often had a side alive, most likely from missed application from to wide of swath width. One hedge apple that had herbicide applied to it by flying around the sides did not leaf out the following spring.

Hedge apple after herbicide application.
DJI T20 Drone
Used for herbicide applications.

For inquiries about this project, contact:
Jason Hartschuh (hartschuh.11@osu.edu)
Garth Ruff (ruff.72@osu.edu)
Christine Gelley (gelley.2@osu.edu)
Alex Thomas
Evaluate the effect of spinner disk speed (RPM) on the distribution patterns of granular products when using a drone spreader.
Application Rate 60 lbs/ac
Flight Speed 32.8 ft/sec = 22.4 mph
Spinner Disk Speed See Results
Altitude 15 ft.
Standard pattern testing protocol for fertilizer application equipment was used in this study. Standardized collection pans are available through Rauch (Practical Test Set kit; Rheinmünster, Germany) with pan dimensions of 0.5 meter by 0.5 meter pans were used. Baffles that minimize product bouncing out of the pans were used. For this study, 29 collection pans were placed in one row and spaced 2 feet apart. A DJI T20P drone with its spreader box was used in this study. The spreader uses a single spinner disk to spread products. Four spinner disk speeds were selected as treatments: 550, 800, 1050 and 1300 RPM. It is common for this particular drone and spreader box to use 1300 RPM for the application of cover crops and fertilizers. The drone was flown over the center of the row pans. After each test, material was collected and weighed to characterize the spread pattern. Cereal rye seed was used for this trial. Each spinner disk speed was replicated four times, and the materials were collected after each pass. The results were then averaged for analysis to characterize the single pass pattern for each spinner disk speed. The patterns were then used to determine the maximum spread width at each spread setting.


Madison County


Graph showing the results of the averages of each spinner disk speed. The drone flew over the pans at the 0 ft. transverse distance.

When this testing was conducted, wind speeds remained at or below 5 mph and the flight route was flown towards the wind so there was no effect to pattern due to cross-wind. When doing a single pass, each of the spinner disk speeds showed to have a skewed pattern to the left of the drones flight path. Previous studies have shown that that spreaders with a single spinner disk will have a skewed pattern, applying more material to the left or the right of the spreader. The general understanding is as spinner disk speed increases, route spacing increases. It is expected that the light seed weight for cereal rye along with the impact rotor wash caused these results. Further testing should be done to determine how altitude will effect the ideal spinner disk speed.
The Rauch Practical Test Set
This comes with standard half meter by half meter collection pans, baffled dividers, measuring cylinders, and a tape measure. The baffled dividers are needed to keep materials from bouncing out of the collection pans are required for standardized pan testing.


• The 550 RPM did not spread the seed far enough and resulted in a highly skewed pattern.
• Increasing spinner disk speed reduced skewness and achieved wider route spacings.
• A CV goal of less than 30% should be considered as single disk spreaders will produce a skewness that can only be managed using spinner disk speed, but there will still be skewing.
• Adjustments to the application rate will be needed and further pattern testing to ensure the target rate is being met.
• Results highlight the need for additional testing using different products to fully understand the relationship between spinner disk speed and route spacing for drone applications.

For inquiries about this project, contact: John Fulton (fulton.20@osu.edu) Alex Thomas
Evaluate the impact of the solar site on forage crop growth and identify soil health impacts and remediation strategies.
Agrivoltaics is the practice of farming within solar sites including under the panels, between the rows, and around the border of the site. The primary goal of this project is to build upon the understanding of forage production in solar farms to reduce land use impacts of utility-scale solar installations by developing best practices for establishing forages, integrating complimentary grazing strategies, maximizing soil health, and utilizing precision agriculture technologies and equipment to minimize error and risk. Overall, results from this research will be used to identify strategies to implement hay, grazing, and solar production with key developer considerations such as system design, equipment, contracts, liabilities, and economic gain or loss.


OSU Extension Madison County

Cone penetrometer sampling was conducted to evaluate soil compaction caused by site construction. Figure 1 shows compaction for both preconstruction (2023 – red) and post construction (2024 – black). Compaction through the root zone increased postconstruction, on average. A distinct compaction layer is now present near an 8-inch depth on average across the site. Various cover crops are being compared for their ability to remediate this compaction. Compaction data will be collected on a yearly basis during the spring of each year.
This project is being funded in part by

Logo was developed by the U.S. Department of Energy to indicate receipt of DOE funding. Not an endorsement by DOE.

Figure 1. Cone penetrometer readings taken to 18-inches pre- and post-construction. Dashed lines indicate +/- 1 standard deviation.
For inquiries about this project, contact Christine Gelley (gelley.2@osu.edu), Amanda Douridas (douridas.9@osu. edu), Brady Campbell (campbell.1279@osu.edu), Elizabeth Hawkins, Eric Romich, Trevor Corboy, Scott Shearer, or Andrew Klopfenstein.
Special thanks to Savion Energy, Sarah Moser, and Kubota Tractor Corporation for their collaboration on this research effort.

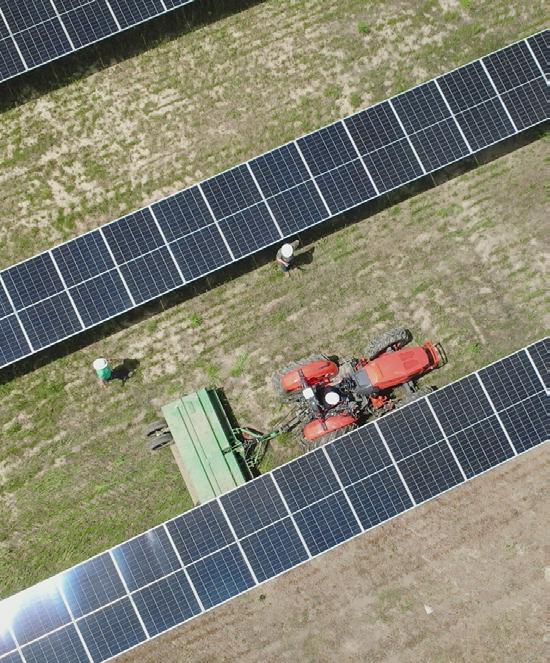
To evaluate the impacts of the solar site on the production of forage, three forage types (alfalfa, cool-season hay mix, and teff grass) were compared inside the solar arrays to control plots outside of the arrays. The control plots were planted outside of the solar arrays at 100% of the current recommended seeding rate. Within the solar arrays between the rows of panels each forage type was planted at three seeding rates: 75%, 100%, and 125% of the current recommended seeding rate. The trial was a randomized complete block design replicated four times.
Due to drought conditions and weed pressure during the establishment year, the forage plots were not harvested and baled but yield was estimated using a rising plate meter. Plate meter readings were collected in a zigzag pattern across the sampling area, gathering 30 readings per plot. The average estimated yield was calculated for each treatment using the plate meter readings and a calibration curve developed from clipped samples that were dried and weighed. The results for each forage type are shown in Figure 2. These preliminary yield estimates depict 45 days of growth from August to September and indicate similar establishment success between the control plots and the treatments located in the solar arrays. These plots will be maintained and harvested in upcoming seasons to better understand forage yield and quality.

Collecting forage samples for analysis.


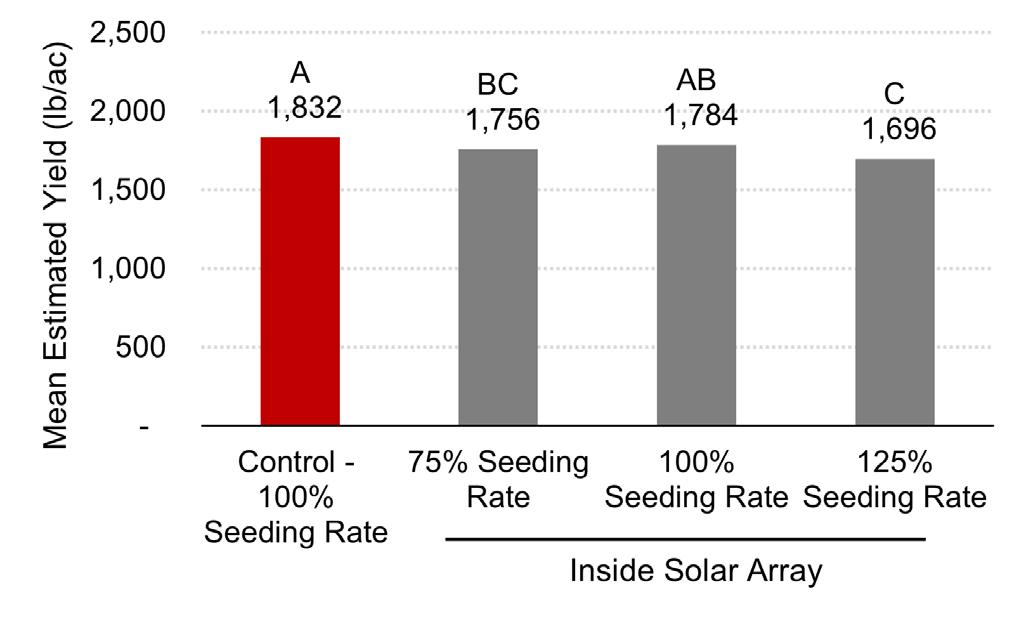
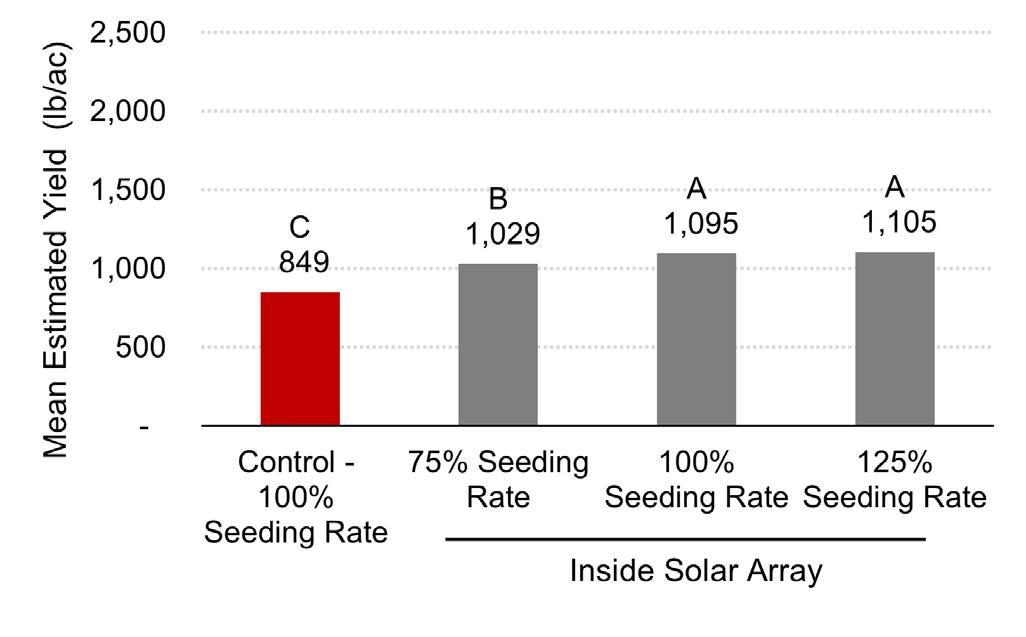
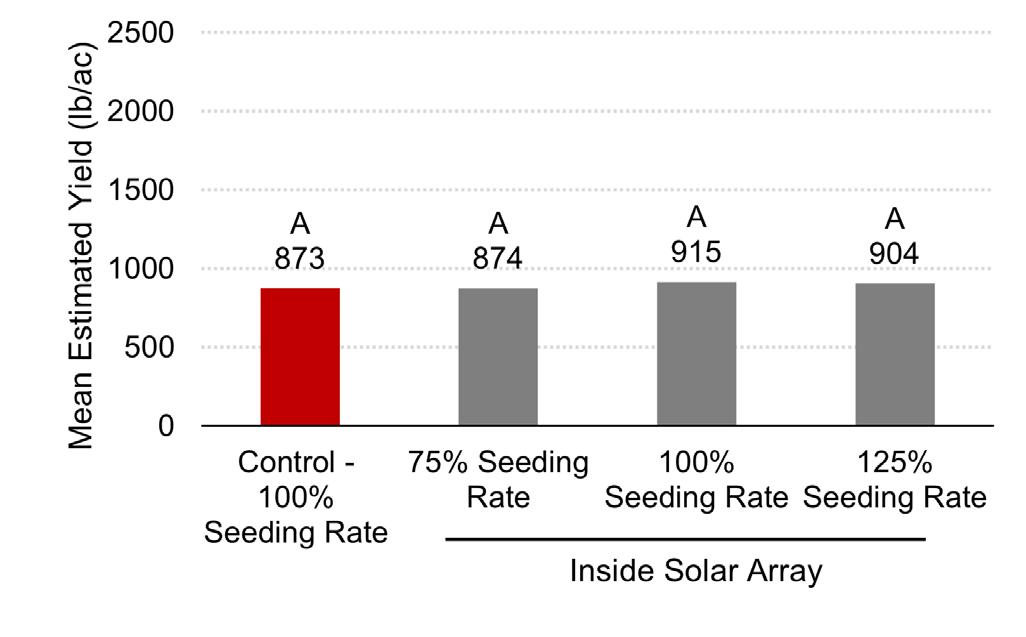
Figure 2. Estimated yields for alfalfa (top), cool -season hay mix (center), and teff grass (bottom) collected using a rising plate meter. Letters indicate statistically significant differences between treatments.
• Weather and weeds were the most significant factors that impacted forage crop establishment in 2024.
• In early spring, the site received heavy precipitation that caused standing water on the site and prohibited planting until late-May/early-June.
• Drought conditions throughout summer hindered forage crop growth.
• Research efforts will continue through 2027 to better understand the feasibility of agrivoltaics.

Determine if fall applied nitrogen (N) increases density and protein in cereal rye.
Planting Date 10/8/2024
Harvest Date 5/11/2025
Variety Cereal Rye VNS
Population 2 bushels per acre
Acres 1
Treatments 16
Reps 4
Treatment Width 10 ft.
Tillage Minimum Till
Management Fertilizer
Previous Crop Soybean
Row Spacing 7.5 in.
This trial was a randomized complete block split-block design with four nitrogen (N) rates in the fall (0, 25, 50, and 75 lbs/ac) and four N rates in the spring (0, 30, 60, and 90 lbs/ ac) over the fall rates in cereal rye. Rye was planted in October and harvested in May. NDVI and Canopeo readings were taken in December before fall dormancy and in late spring after greenup to determine the greenness and density of green matter.


Sandusky County
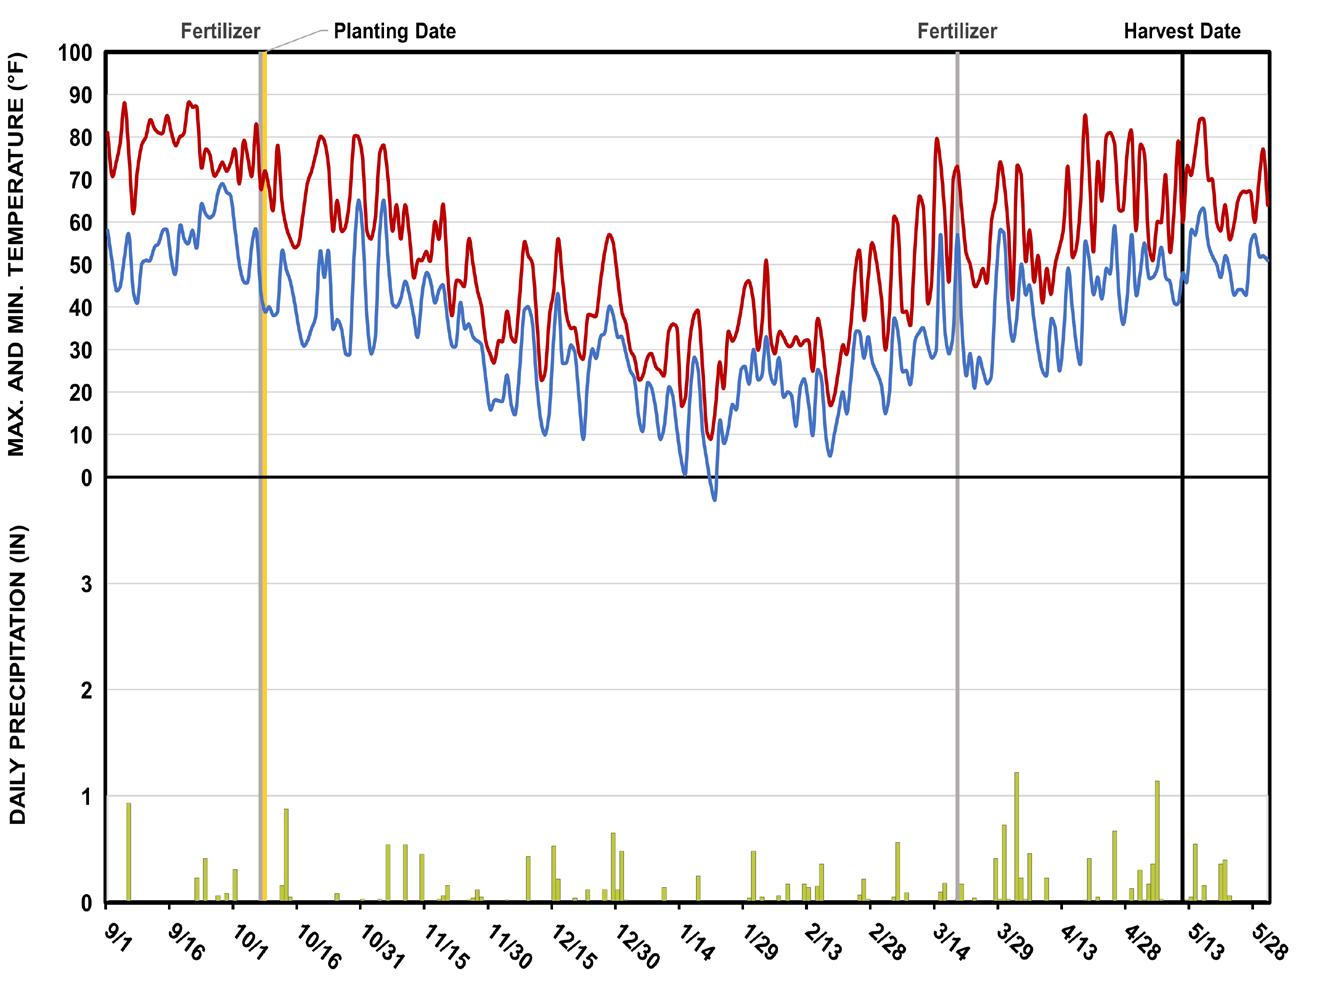
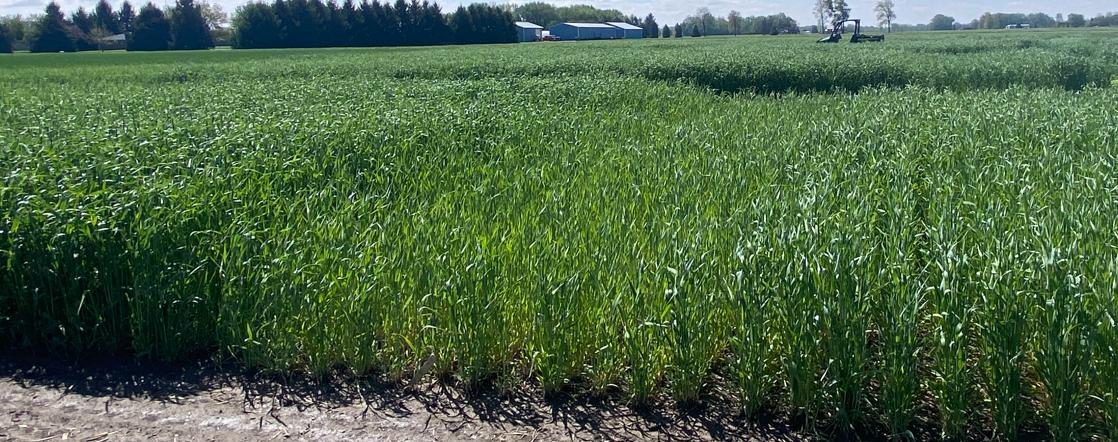
0lbs/N plot in the middle, with other treatments on both sides.


OBSERVATIONS
There was no visual difference between the different treatments in the fall, but there was in the spring while taking NDVI and Canopeo readings. The 0 lbs/N treatments were visibly thinner, shorter, and yellow compared to the other treatments at harvest time.
Treatment Means with the same letter are not significantly different according to Fisher’s Protected Least Significant Differences (LSD) test at alpha = 0.1.
Canopeo
Smartphone application that quantifies the percent canopy cover of live green vegetation for any agricultural crop, turf, or grassland. Take a picture of the vegetation canopy in the app to get the percentage of green canopy cover.


• Forage quality increases with spring N application.
• Neutral Detergent Fiber Digestibility (NDFD) was higher in the fall 0 lbs/N treatments, meaning that these plots are more digestible to livestock.
• At least 30 lbs/N is needed in the spring to maximize total digestible nutrients (TDN).

For inquiries about this project, contact: Jason Hartschuh (hartschuh.11@osu.edu) Kendra Rose (rose.1919@osu.edu)
Evaluate the efficacy of the house fly lure for controlling flies.

Start Date 8/12/2024
End Date 9/18/2024
Species Multiple
Treatments 3
Reps 3
Experimental Unit Fly Trap
Two locations (beef cattle farm and agritourism farm) were included in this study to assess two novel products: a house fly lure. The first trial examined whether the novel lures increased total house fly capture. The weekly observations of flies captured were treated as the replications. The locations were barn settings with multiple species present (donkey, dairy beef feedlot, and agritourism).


Delaware County
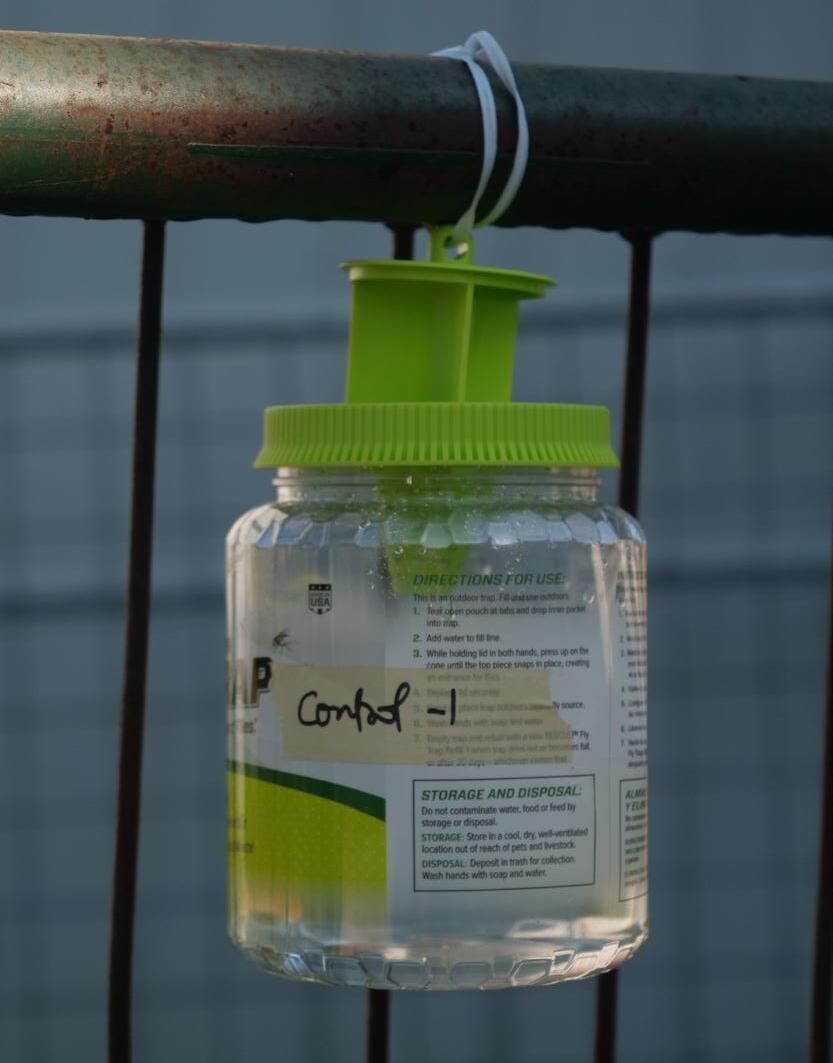
Control treatment trap.


During the third replication there was a sharp decline in flies caught across all 3 treatments. The control (water only) captured no files over the entire span of the trial.
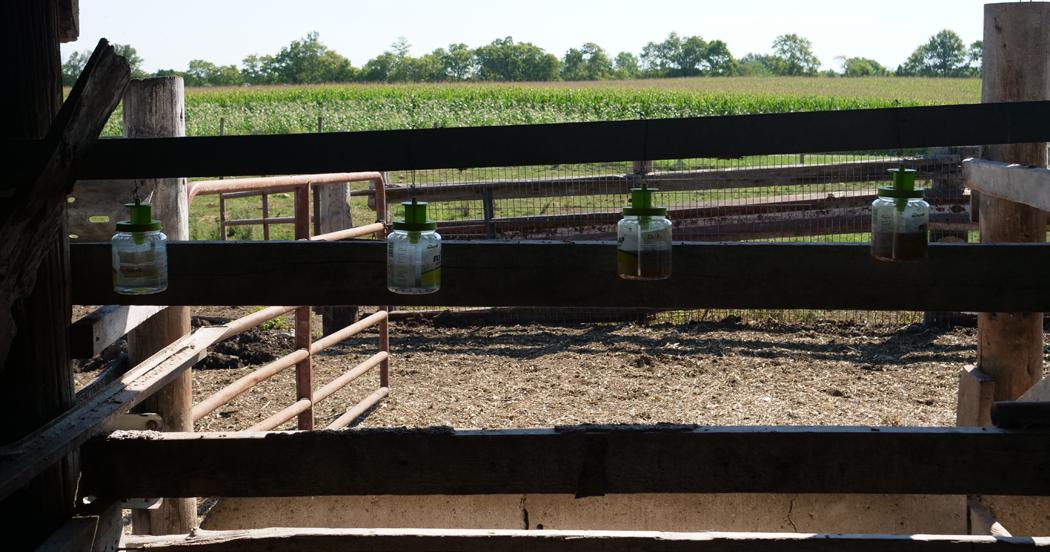


• There is considerable difference in the house flies caught when looking at the Commercial Lure + Novel house fly attractant when compared to the control.
• However, when tested at a 0.1 confidence level these results were not statistically significant. Meaning we cannot confidently say that one treatment is better or worse than the others based on this data. The differences are not consistently large enough to rule out the possibility that they happened by chance.
Performed a Kruska-wallis test- p value is 0.1012 which is above the p=0.1 hence the data is not significant.
Commercial Fly Traps
Commercially available traps used to test treatments.

For inquiries about this project, contact: Jacci Smith (smith.11005@osu.edu) Rob Leeds (leeds.2@osu.edu)
Evaluate the efficacy of the stable bait for controlling flies.

Start Date 8/12/2024
End Date 9/18/2024
Species Multiple Treatments 2 Reps 8
Experimental Unit Fly Trap

OSU Extension
Delaware County
Two locations (beef cattle farm and agritourism farm) were included in this study to assess whether a novel bait improved the effectiveness of an Alsynite fly trap. The weekly observations of flies captured were treated as the replications. The locations were barn settings with multiple species present (donkey, dairy beef feedlot, and agritourism).

View of traps being set up just inside a barn setting.

OBSERVATIONS
There was tremendous variation in the replications overall treatments. The control, an Alsynite trap only, actually caught more flies on average than the Alsynite trap + bait.
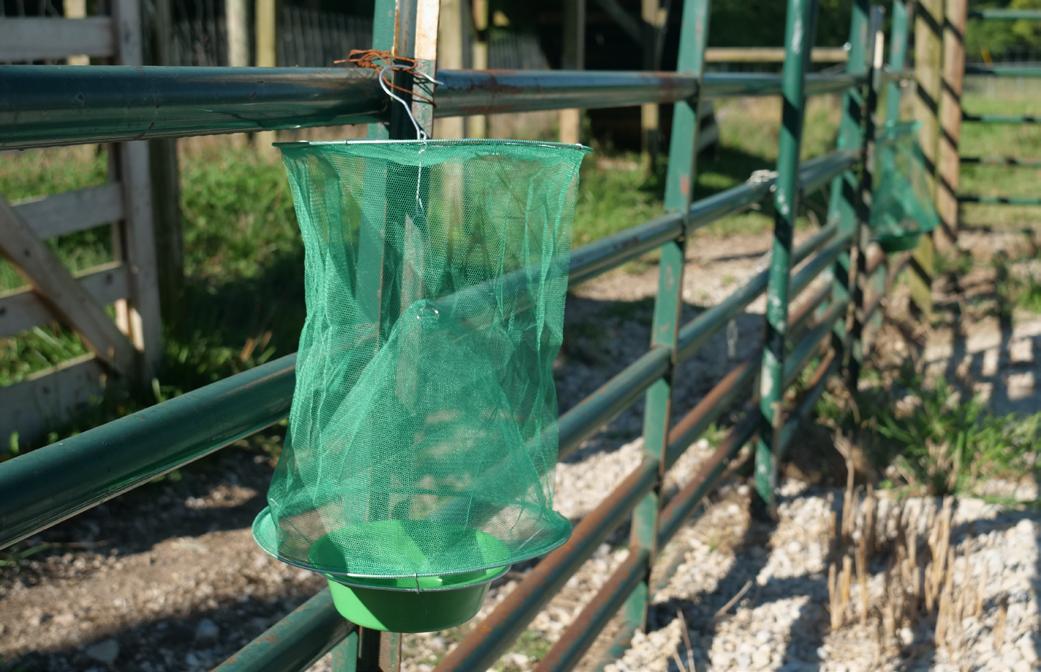


• There is no statistical difference in the stable flies caught when comparing both treatments. When tested at a 0.1 confidence level these results were not statistically significant. Meaning we cannot confidently say that one treatment is better or worse than the others based on this data. The differences are not consistently large enough to rule out the possibility that they happened by chance.
Performed a Kruska-wallis test- p value is 0.7527 which is above the p=0.1 hence the data is not significant .
Alsynite traps used to test treatments.

For inquiries about this project, contact: Jacci Smith (smith.11005@osu.edu) Rob Leeds (leeds.2@osu.edu)
Document long-term soil health impacts of using manure and perennial crops in rotation, by leveraging farm management history against on-farm soil samples.


Douglas Jackson-Smith, Louceline Fleuridor, Steve Lyon, Tiffany Woods, and Cassandra Brown - SENR; Ryan Haden - OSU ATI; Hemendra Kumar - Univ. of Maryland; Marilia Chiavegato - HCS/Animal Sciences; Ryan McMichael (Mercer County), Frank Becker (Wayne County) - OSU Extension; Ajay Shah and Amit Prasad Timilsina - FABE
Specialization of livestock and crop production has led to rapid gains in farm productivity and efficiency. However, the long-term sustainability of specialized farming systems has come under increased scrutiny due to concerns about soil health, nutrient losses, resilience to extreme weather, and growing scrutiny of agriculture’s greenhouse gas footprint. Reintegrating livestock and cash grain production offers the potential to address some of these concerns by recycling nutrients, replacing chemical fertilizers with manure, and diversifying crop rotations.
Rather than applying treatments, this study compared farm management histories with soil health test results from working farm fields. In 2022 and 2023, the team gathered composite soil samples in 86 fields of 31 Ohio farms located in Wayne, Stark, and Holmes counties (eastern Ohio) and Mercer, Shelby, Auglaize and Darke counties (western Ohio). Fields were selected and grouped into four field class (FC) categories based on their 5-year cropping and management history: (1) cash grain fields that used no manure, (2) cash grain fields that used cattle manure, (3) fields that rotated cash grains with perennial hay, and (4) long-term perennial pasture and hay fields.
Composite soil samples were analyzed for each field to look at various soil health qualities. Annual interviews were conducted with farmers to document field management from 2017-2023. Analysis of variance was used to identify differences between the field classes. Multivariate analysis was then used to see how the intensity of various management practices influenced soil health outcomes.
Comparing cash grain fields without (FC1) and with manure (FC2), evidence was found to associate the use of cattle manure with increased soil total organic matter, soil respiration rates, and active carbon (POXC). Fields that used manure (FC2) also had higher arylsulfatase enzyme activity, which helps in cycling sulfur. In fields where perennials were part of the cropping system
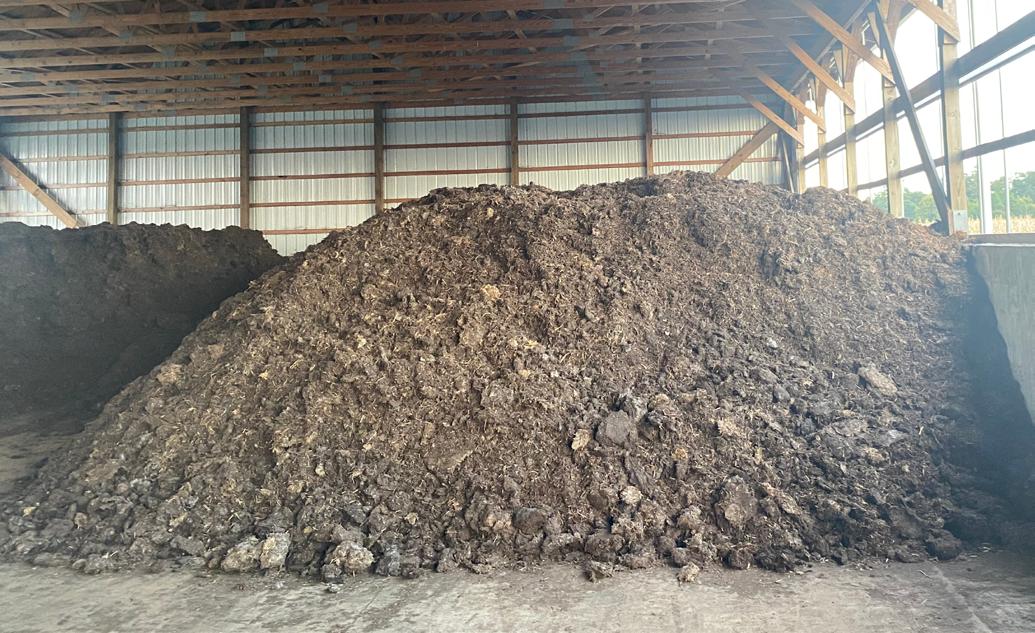
Manure being stored in western Ohio, prior to being used on neighboring fields. (FC3 and FC4), even more pronounced increases were found in most measures of soil health, including soil organic matter, ACE-protein and C, as well as the enzymes Arylsulfatase and Betaglucosidase, which aids in the breakdown of organic matter. The multivariate assessment confirmed that higher usage of perennial crops and manure applications was associated with increases in most soil health metrics. Indicators of cover crop use, fertilizer nutrient applications, and soil disturbance from tillage were not strongly associated with these soil health metrics after manure and perenniality effects were accounted for. Soil texture (especially clay content) did have a significant association with all soil health metrics.


Key to Field Classes (FC):
FC1: Row Crops, No Manure
FC2: Row Crops + Manure
FC3: Annuals + Perennials + Manure
FC4: Pasture/Hay + Manure
Study included beef and dairy operations (spreading own manure) and cash grain farms (importing manure from beef or dairy operations). To target ruminant manure, results excluded fields that received poultry or swine manure.

• Our results suggest that reintegrating crops and livestock would lead to improvements in soil health, but would involve several practical, and logistical challenges.
• Participating farmers shared several strategies to incorporate livestock elements into their farm, such as forming partnerships with neighboring farms to exchange money, temporary field use, manure, bedding material, or labor and equipment. Farmers without livestock might also grow perennials for feed pellet companies or to sell as seed.
• Based on this study, manure and perennials deserve more attention and conversation as key tools for building soil health.
The authors express appreciation to our 31 participating farms, and to the USDA NIFA IDEAS program for funding.
Supported by grant 2021-68014-34142

For inquiries about this project, contact: Doug Jackson-Smith (jackson-smith.1@osu.edu).
Characterize the variability of cattle manure nutrient values using samples and management information from Ohio farms.
Time Surveyed 2022 - 2024
Species Beef and Dairy
Topic Surveyed Manure Management and Nutrients
Type of Respondent Farmers
Counties Surveyed
Auglaize, Dark, Holmes, Mercer, Shelby, Stark, Wayne
Total # of Farms Represented 31
Total # of Fields Represented 86
This report is based on data collected for a USDAfunded study to explore the benefits and tradeoffs associated with integrating crop and livestock production. The 31 Ohio farms and 86 fields in the study were in Auglaize, Darke, Holmes, Mercer, Shelby, Stark, and Wayne counties. Learn more about the project at go.osu.edu/ideas2025

Figure 1 (to the right). Percentage DM of manure samples, and corresponding percentages of total N, P2O5, and K2O as a percentage of DM of 87 manure samples from 28 farms in Ohio. Box plots show the range of data with 75% of the data points represented within the box. Horizontal line in each box represents the midpoint (median).

Manure Nutrient Content by Storage Type
Most slurry manure was stored in uncovered lagoons, while dry manure (greater than 20% dry matter (DM)) was stored as pits or stacks either covered or uncovered. All nutrient data in Figure 1 was based on % DM to allow comparison across manure types. Overall, nutrient content of manure as a percentage of dry matter averaged higher in lagoons. However, there was significant variation in the nutrient and DM content of manure across our study farms, which underscores the importance of testing to ensure accurate application rates.
Manure Application Rates
Manure was commonly applied once or twice a year, in the fall or early summer, though some farmers reported up to 4 applications throughout the growing season. Application rates varied widely, from 5,000 - 35,000 gal/ac annually for slurry manure and from 2 - 30 tons/ac for solid manure. Irrigation or injection of manure occurred on 3 out of the 26 farms who used manure.
Nutrients Applied from Manure and Fertilizer
Figures 2-4 show the total nutrients applied from manure and/ or fertilizer on the 24 study farms who grew annual row crops in the 2022 or 2023 cropping year. The red dashed line is the median amount of nutrient applied across all fields. Manure nutrients applied varied widely due to differences in manure nutrient density and manure application rates across the study farms. Total Nitrogen (N) from manure varied from 15.6 - 448 lbs/ ac. Phosphorus (P2O5) applied with manure varied from 6 - 366 lbs/ac and Potassium (K2O) from 19 - 466.5 lbs/ac. Commercial fertilizer application was the primary source of N, while manure was the dominant source of P2O5 and K2O on these 24 farms.


• Manure sample analyses and management interviews were used to gather data on manure nutrient contents, manure application rates, and applications of chemical fertilizers for the 2022 and 2023 crop years.
• Data was used to summarize the total fertility applied to each field in a cropping year during 2022 or 2023. This included manure or fertilizer applications from the previous fall (e.g., fall 2021 for the 2022 crop) as well as nutrients applied before planting and during the growing season (before harvest).
Implications:
• Storage type is associated with nutrient content, but variability in DM and nutrient levels within each storage system was significantly more variable than expected.
• Similarly, farmers’ manure application behaviors were highly variable. These two factors combined to produce a wide variation in actual nutrients applied by farmers using manure on their farms. Application of chemical fertilizer nutrients was not systematically related to the amount of nutrients coming from manure.
• Average nutrient content for manure samples in this study tend to be lower than those used in available manure guides, and the default numbers in the USDA model used for our study (IFSM). Considering the wide variation shown in this study, farmers and researchers should use default values with caution.
• It is recommended to test all manure sources to guide application rates, along with soil tests and crop requirements.


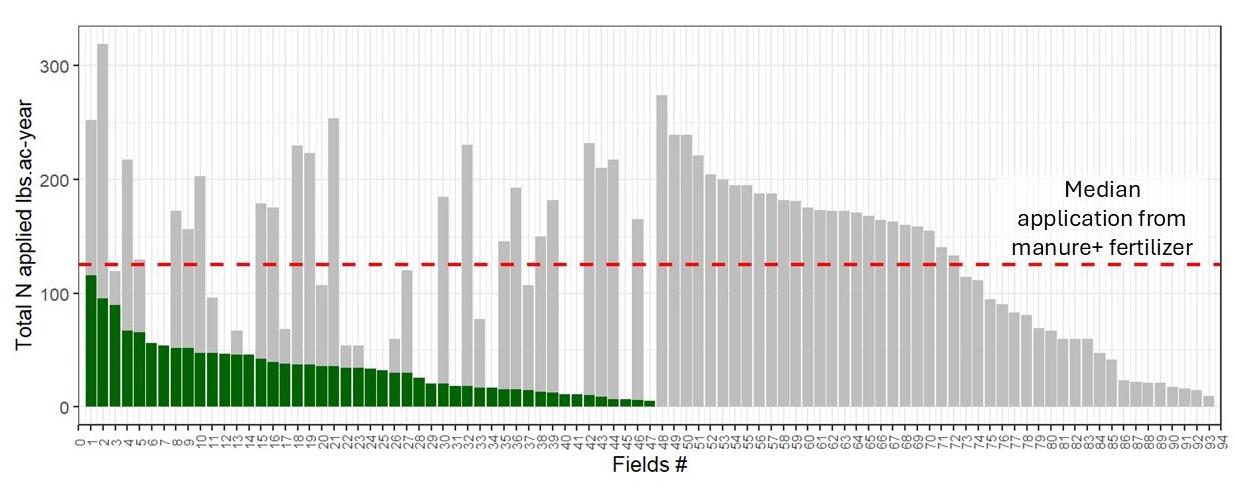
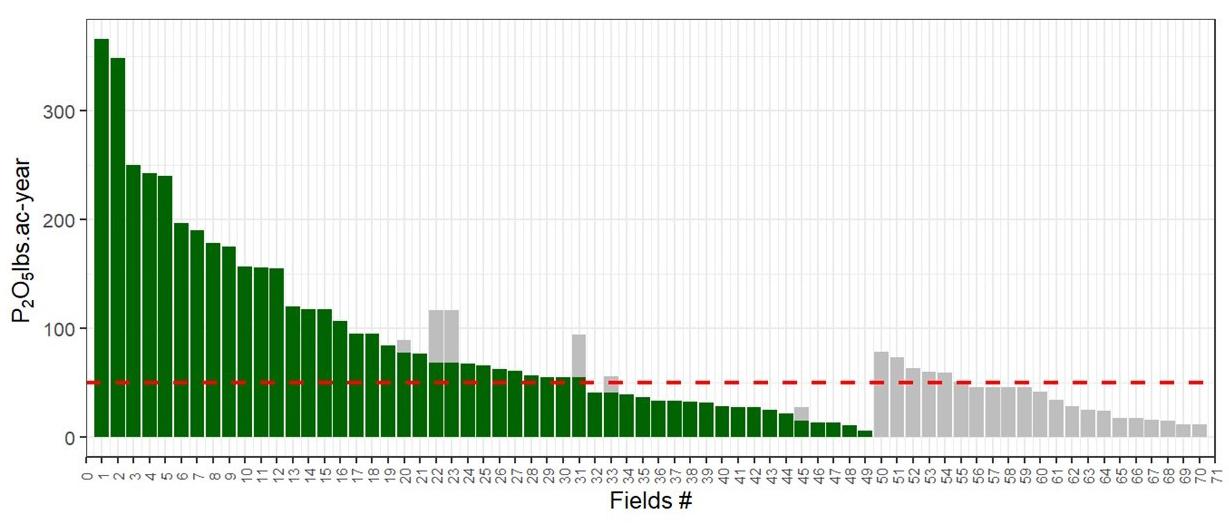

Figures 2-4. Total N, P2O5, and K2O in lbs/ac per cropping year (2022 and 2023) applied by manure (green bars) and commercial fertilizers (gray bars). Each bar = a study field. Red dashed line = median (midpoint) across all fields for total applied nutrient. If no manure and no commercial fertilizers were applied for a specific nutrient, the field was not included, thus there are more fields reported for N and K2O.
For inquiries about this project, contact: Doug Jackson-Smith (jackson-smith.1@osu.edu)
This project is indebted to the 31 partner farms and to funding from the USDA National Institute of Food and Agriculture’s Inter-Disciplinary Engagement in Animal Systems (IDEAS) grant program. Supported by grant 2021-68014-34142
Wait for an
Foot and Mouth Disease (FMD) is a highly contagious viral disease that targets cloven-hooved (splithooved) animals including cattle, pigs, sheep, goats, llamas, alpacas, bison, and deer among many others.
FMD can spread rapidly from one animal to another through direct contact, contaminated feed, vehicles, equipment, clothing, and aerosols (traveling several miles in the wind).
Infected animals frequently experience fever and develop vesicles or blisters in the mouth, along the coronary bands and on the mammary glands. These blisters eventually develop into ulcers resulting in heavy drooling and severe pain that causes lameness, decreased appetite, weight loss, decrease in production, and reluctance to move or stand.¹ ²
Although FMD does not infect humans or pose a direct threat to food safety, an outbreak would have catastrophic economic consequences. In the United States, such an event is projected to result in losses approaching $200 billion due to the complete depopulation of affected farms and the widespread shutdown of domestic and international markets and trade.³
The United States has been free of FMD since 1929, but FMD outbreaks are still on-going in a significant number of countries across 3 continents globally.⁴ International travel, global trade, and regional animal movements allow the threat of FMD entering the U.S. to remain a real possibility.⁵ With approximately 3.63 million cattle, swine, and sheep and goats, Ohio ranks among the nation’s leading states in the production of livestock and animal products.⁶ ⁷ A FMD outbreak in Ohio would not only lead to the culling of thousands of animals, but also trigger an extended halt in the movement of livestock and animal products—causing severe disruptions to the supply chain and livestock markets.

Ulcers formed after FMD blisters ruptured inside of a cow’s mouth.
Resources
1) Iowa State University, cfsph.iastate.edu/Factsheets/pdfs/foot_and_mouth_disease.pdf
2) USDA press release, aphis.usda.gov/publications/animal_health/fs-fmd-general.pdf
3) Iowa State University, card.iaState.edu/products/publications/pdf/11wp525.pdf
Are Ohio producers ready for FMD?
See the results of a statewide survey (conducted in fall of 2024) of producers on Ohio's current preparedness for FMD.
Ohio's Foot and Mouth Disease Landscape Analysis: go.osu.edu/ FMD-Preparedness-Survey-2025
Ohio's livestock producers and veterinarians are the front lines of defense. While regulatory officials play key roles in containing a FMD outbreak, effective prevention and early recognition (plus prompt reporting) begin at the farm gate. Conversations between producers and veterinarians about how to protect their livestock production is critical to protecting their income and Ohio’s livestock industry.
Planning for a FMD outbreak may not seem urgent when there is no immediate threat present in Ohio, but once an outbreak begins, every moment counts. Taking a proactive approach to FMD prevention is essential to safeguarding the Ohio agriculture community.
4) World Animal Health Organization, WAHIS: World Animal Health Information System, wahis.woah.org/#/event-management
5) USDA/APHIS, aphis.usda.gov/sites/default/files/fmd-briefing.pdf
6) Ohio Livestock Coalition, ohiolivestock.org/site/assets/files/1211/olc_jul_2018_comcard.pdf
7) USDA/NASS, nass.usda.gov/Quick_Stats/Ag_Overview/stateOverview.php?state=OHIO


Your veterinarian is a vital partner in safeguarding your herd. Start now by reviewing your on-farm protocols for responding to foreign animal disease outbreaks and asking the right questions.
What symptoms of FMD should my personnel and I watch for in our animals?
If we suspect a blistering (vesicular) disease in our animals, should I report it? If yes, to whom should/must be reported?
Does my farm need a Premises Identification Number (PIN) during an outbreak of FMD? How do I obtain one if I do?
What could happen if I don’t have a Premises Identification Number (PIN) and FMD reaches Ohio?
What types of identification (i.e., ear tags, brands, tattoos) qualify as an official animal identification in the State of Ohio for my animals?
Would I still be allowed to move animals or animal products during a FMD outbreak?
What enhanced biosecurity practices should I put in place to reduce the risk of introduction onto my farm if FMD is introduced into Ohio?
How should I manage visitors on my farm to help prevent the introduction of FMD?
What would be the best depopulation or disposal options for my farm?
Where can I get updates and trustworthy information if there is a FMD outbreak?
Review a summary of Ohio's Foot and Mouth Disease Response at a Glance: go.osu.edu/OH-FMD-Response-2025
Find more Veterinary Extension links and resources from the College of Veterinary Medicine, here: go.osu.edu/VetMedExtensionResources


For inquiries about this project, contact: Armando E Hoet, DVM (hoet.1@osu.edu) Helen Jones, DVM (jones.8204@osu.edu)

Ticks and the diseases that they vector to livestock, companion animals, and humans have become an increasingly larger public health risk and a significant impact on our cattle industry
The American Dog Tick prefers a more open habitat including pasture, meadows, and lawns. This tick is a prominent vector of Rocky Mountain Spotted Fever and Tularemia.
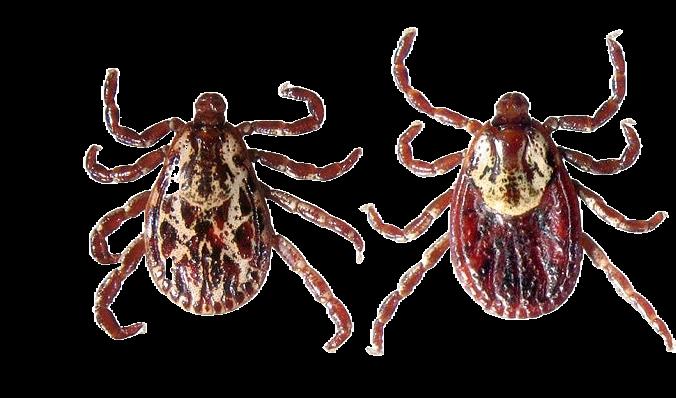
Adult Male (left) and Adult Female (right) American Dog Ticks*.
The Black Legged or Deer Tick prefers to live in wooded habitat. This tick is the primary vector for Lyme disease plus can also vector Babesia and Anaplasmosis.
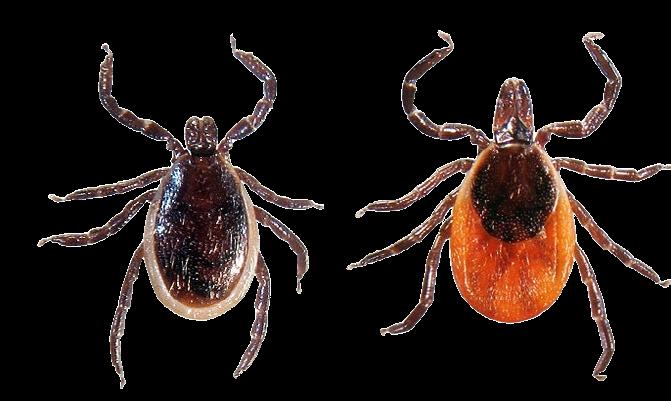
Adult Male (left) and Adult Female (right) Black Legged or Deer Ticks*.
The Lone Star Tick is an aggressive feeder and prefers wooded habitat. This tick is the reported causative agent for the Alpha-gal or Mammalian Muscle Allergy reaction where person who is bitten can become allergic to meat including beef, pork, lamb, and venison.
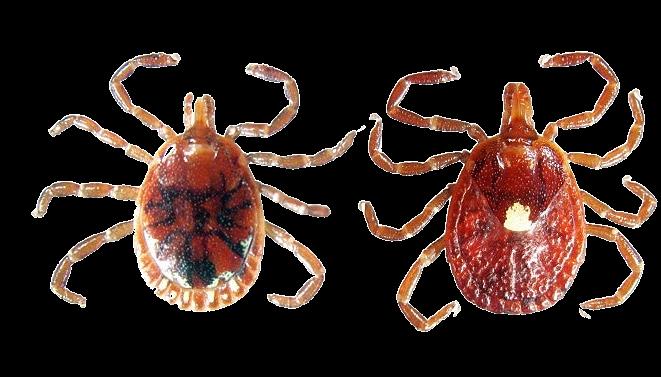
Adult Male (left) and Adult Female (right) Lone Star Ticks*.
*Images sourced from TickEncounter, tickencounter.org
The Ohio State University recently opened a tick testing laboratory where you can submit ticks from humans and animals for identification and pathogen testing.
For more information, visit buckeyeticktest.osu.edu

Note: “This work is supported by the Crop Protection and Pest Management Program grant 20247000643574, from the U.S. Department of Agriculture’s National Institute of Food and Agriculture.”
“Any opinions, findings, conclusions, or recommendations expressed in this publication are those of the author(s) and should not be construed to represent any official USDA or U.S. Government determination or policy.”
For inquiries about this project, contact: Timothy S. McDermott, DVM Extension Educator, Franklin County mcdermott.15@osu.edu (614)-292-7916



The Longhorned Tick (LHT) is an invasive tick that was recently identified in Ohio in 2020. This tick is unique in that it reproduces via parthenogenesis, meaning the female does not need a male to breed, allowing it to produce extreme numbers of ticks on its host or in a pasture.

Adult Female LHT, sourced from the CDC Public Health Image Library, phil.cdc.gov
Tips for managing Longhorned Ticks on pasture and cattle:
• Frequently scout your animals as this tick can reproduce in large numbers.
• While we have had detection as early as March, this tick is known to prefer heat and tall grass. The largest numbers of ticks on cattle in Ohio have been detected in July.
• This tick has been known to vector Theileria orientalis, a protozoal blood parasite, to cattle that can cause fever, inappetence, open cows, jaundice, and mortality.
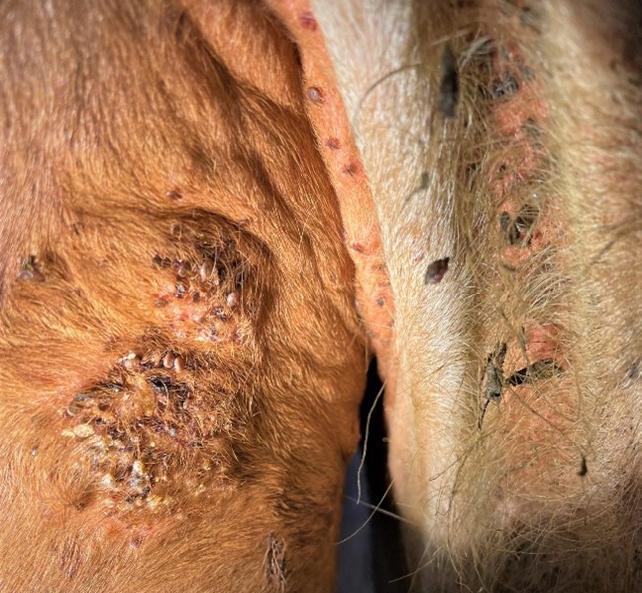
• Work with your veterinarian if you think you have ALHT on your animals. Guidance for extra-label application of tick control, needs to come from your vet.
• Management intensive grazing with rotation through paddocks to let your animals maintain the pasture may be an important integrated pest management strategy.
• Products labelled for pasture application to control ticks that have shown to be effective, but they need to contact the tick to work. Application on top of tall grass or residue may not contact the tick directly and therefore may not be effective for control.
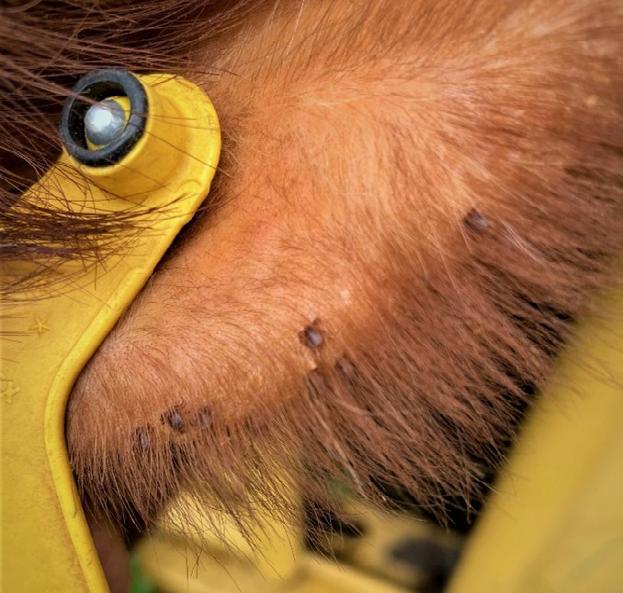
Longhorned tick scouting locations on cattle include the perineum and tailhead (left) and the ears (Right).
Map of Longhorned tick and Theileria detections in Ohio as of July 1, 2025
Ohio counties with: Longhorned Ticks Theileria (theileria orientalis)


• Longhorned ticks have been identified in 21 counties with 12 counties having positive cases of Theileria orientalis. LHT are found in 22 states and DC with the newest being that state up north in June 2025.
• The Farm Services Agency has a Livestock Indemnity Program that may assist producers who have been negatively impacted by cattle mortality from Theileria.


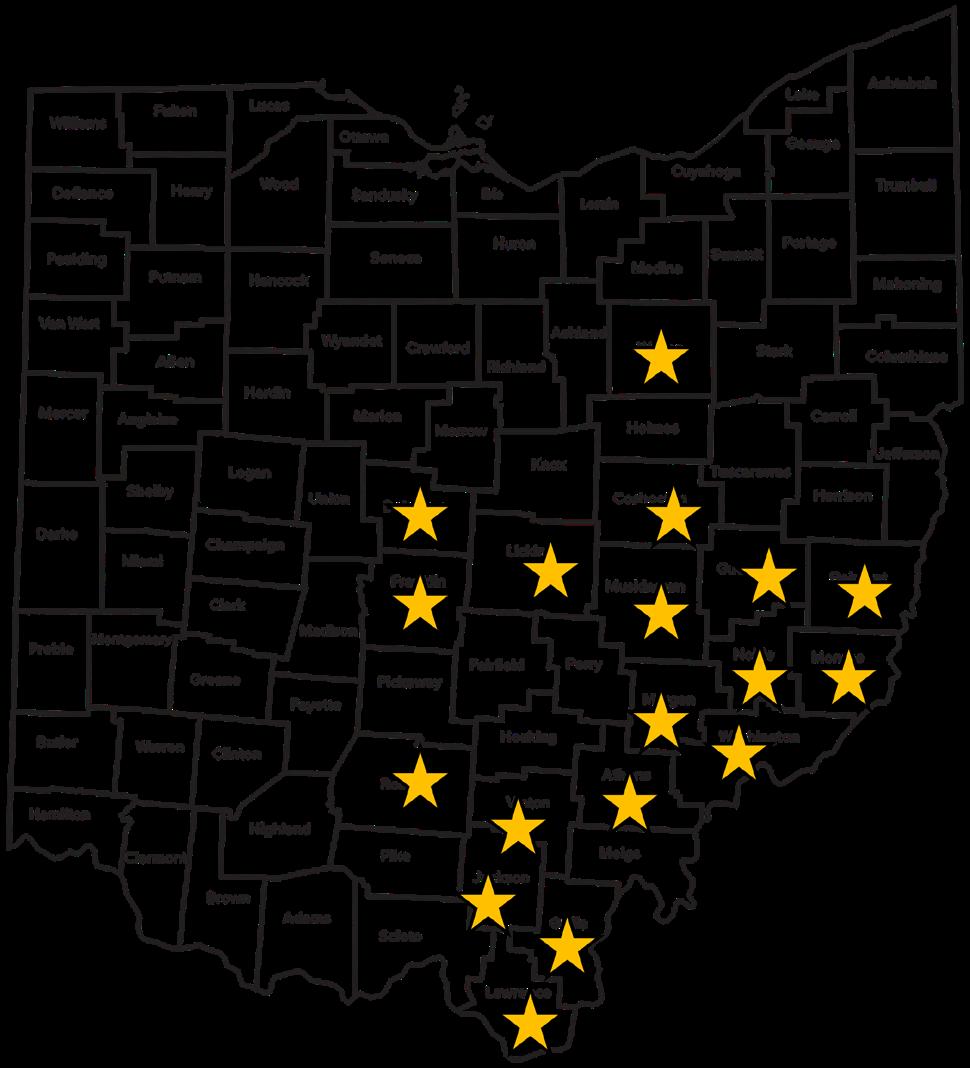


Quantify the economic impact of the 2024 drought on Southeast Ohio beef cattle poducers.
Time Surveyed 9/1/2024 - 1/15/2025
Species Beef
Topic Surveyed Feeding during a drought
Main Counties Surveyed, and Quantity from Each Morgan (77), Muskingum (55), Other counties (39)
Type of Respondent Cattle Producers
# of Ohio Counties Represented 14
Total # of Usable Survey Responses 170
Total Animals and Acres Represented in Survey
Reported in
Paper survey instuments were distributed at in person beef cattle drought related feeding programs across the affected region and through the mail in Morgan and Muskingum counties. Support progrram data was collected from the Farm Service Agency to evaluate offsetting costs.


US Drought Monitor - The weekly drought condition ratings determined if and when financial assistance was going to be available to livestock producers.
Extension programming and survey work identified future programming needs including pasture rehabilitation and repair, annual stored forages, return on investment for livestock water development, optimal mature cow size, and infrastructure to handle non-forage feedstuffs The ongoing effort also includes surveying extension educators who worked in the drought-impacted region to understand the success and challenges of the production environment and the role of OSU Extension during the crisis.

• Survey responses indicated that as early as second cutting, 86% of recipients experienced 50% or greater reduction in hay yield. 68% of respondents indicated that first cutting hay was at 100% of normal yield and 18% of respondents indicated first cutting hay was at least 75% of normal yield. A third cutting of hay was very limited with 68% indicating 25% or less hay yield. Initial data also indicated an average beef herd of 45 head and 160 acres farmed in hay or pasture.
• From June to October 84% of the responding cattle producers fed 5,004 tons of hay and 51% of producers fed a total of 678,085 pounds of supplemental grain that they would have not otherwise fed.


• A higher estimate values hay at $250 per ton and corn at $5.25 per purchased bushel, adding up to $160 and $8.15 respectively, or a total of $168.15 per cow.
• Producers were also surveyed about purchasing water for livestock. 57% of respondents indicated they had hauled water between June and October 2024. Those same farms reported hauling a total of 3,959,923 gallons over that time frame, for an average of 40,823 gallons per farm. Most water purchased cost between a penny and a penny and a half per gallon plus transportation. The majority of respondents indicated they relied on springs, wells, or surface water sources that had dried up prior to hauling water.
• As a conservative price estimate, 5,004 tons of hay valued at $150/ton and 678,085 pounds of grain valued at $4.50/bushel of corn contributed to $750,600 and $54,488 of increased total feed cost, respectively. Calculated on a per cow basis, those totals equate to 0.64 tons of hay valued at $96, and 87 pounds of grain valued at $7 for a total $104 per cow.

• In response to the sustained drought conditions, the USDA Farm Service Agency released funds through Emergency Livestock Assistance Program (ELAP) and through the Livestock Forage Disaster Program (LFP). These programs offered financial assistance for water hauling and hay hauling. The LFP Program paid $148.22 per beef cow and ELAP paid $0.06 per gallon of water hauled. On January 24, 2025, it was estimated that a total of $3,836,098.92 has been paid out of the Muskingum/ Morgan County FSA office alone across 238 farm operations.
Assess the efficacy of machine learning (ML) in grading bovine cumulus-oocyte complexes (COC) based on classification standards.
Start Date January 2024
End Date November 2024
Species Beef and Dairy
Treatments 70% images for training, 30% for validation
Experimental Unit Oocyte
Breed, Genetics Crossbred
Sex Female


This study explored the capability of machine learning (ML) to recognize and evaluate cumulus-oocyte complexes (COC) using various classification schemes. A dataset comprising 1,240 images of cumulus-oocyte complexes, graded from 1 to 4, was collected from cow ovaries obtained from slaughterhouses. The dataset included both individual and grouped images of cumulus-oocyte complexes, each assigned an International Embryo Technology Society (IETS) grade by experienced technicians.
Imaging was conducted using a Leica MC120 HD microscope camera connected to a Leica M80 microscope (pictured in the Tools of the Trade). Additionally, an iPhone camera mounted to the microscope's oculus was used for imaging, enhancing efficiency and image quality. Various ML algorithms were employed for model training and testing, focusing on object detection, segmentation, and feature extraction of the COC images. Both grading individual images into the 4 grades was conducted along with evaluating the ML to grade oocytes into groups (i.e. excellent, good and bad).

Figure 1. Presents cumulus-oocyte complexes (grades 1 to 4) classified according to the International Embryo Technology Society (IETS) evaluation guidelines. It compiles information from various sources, highlighting their criteria and interpretations for cumulus-oocyte complex (COC) grading.
Definitions
Cumulus-Oocyte Complex (COC): an oocyte (immature egg cell) surrounded by specialized granulosa cells (cumulus cells). The cumulus cells surrounding the oocyte ensure healthy oocyte and embryo development.
Machine Learning (ML): teaching computers to learn from data without explicit instructions, often using large sets of data.

Among the various ML models investigated for performance within this research study, the You Only Look Once (YOLOv8) machine learning model has the best performance when it came to classifying COCs following the IETS evaluation scheme.
Machine learning model performance improved by up to 15% when COCs were classified into broader categories: Excellent, Good, and Bad


• The You Only Look Once (YOLOv8) ML model achieved an overall testing accuracy of 63% when classifying COCs into IETS grades 1 through 4.
• Classification accuracy improved to approximately 66–80% when COCs were grouped into broader categories: Excellent, Good, and Bad.
• Grouping COC grades into broader quality categories improved model performance and highlighted the potential of ML for developing reliable, automated COC classification systems with practical applications in reproductive biology and livestock breeding.
Table 1. Compares the overall testing accuracy of a machine learning model using different cumulus-oocyte complex assessment approaches and grading schemes. Grouped assessments generally yield higher accuracy than individual assessments, with the highest accuracy (80%) achieved when grades 1 and 2 are grouped as Good and grades 3 and 4 as Bad.
1 & 2)
Leica M80 Microscope.
Used by lab technicians to view and grade cumulus-oocyte complex images in the the lab. Once oocytes are collected from a cow or heifer, the lab technician views the oocytes evaluating their quality and assesing a grade.
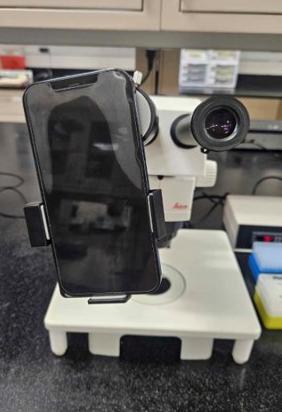
3 and 4)
For inquiries about this project, contact: John Fulton (fulton.20@osu.edu) Grace Koppelman, Master's Student
Identify and characterize risk factors associated with the presence of Salmonella Dublin (S. Dublin) on dairybeef farms.
Time Surveyed 6/1/2023 - 12/31/2024
Species Beef and Dairy
Topic Surveyed Health
Type of Respondent Farmers/Herdsman
Ohio Counties Represented Darke, Logan, Mercer, Miami, Williams
Other States Represented Indiana, Kansas, Minnesota, Missouri, New York, Texas, Wisconsin
Total # of Usable Survey Responses 65
Total Animals Represented in Survey
Calves Annually 178,295
This cross-sectional study was conducted in collaboration with veterinary clinics in the Midwest. Farms that raised dairy-origin surplus calves (Holstein or Holstein-beef crosses) up to 6 months old were enrolled. After enrollment, personnel collected environmental samples throughout the farms, including milk mixing areas, the perimeter of pre-weaned calf hutches, and inside post-weaned group pens. A questionnaire covering farm demographics, herd management, calf movement, and biosecurity practices was also completed for each farm. Samples were sent to an Ohio State University laboratory for processing.


College
Statewide
What is Salmonella Dublin (Salmonella enterica serovar Dublin)?: a type of salmonella bacteria that has adapted specifically to cattle
• Increased prevalence in dairy facilities.
• Can severely affect cattle health. (high morbidity and mortality in young calves, reduced performance in mature animals).
• Infected animals can end up being long-term carriers.
• Difficult to control and eradicate – can be shed from seemingly healthy animals, and long-term carriers sporadically shed the bacteria.
• Is zoonotic = humans can be infected from animal contact or contaminated food/environments.
• Human infection often leads to hospitalization and can be fatal.
• Multi-drug resistance issues.
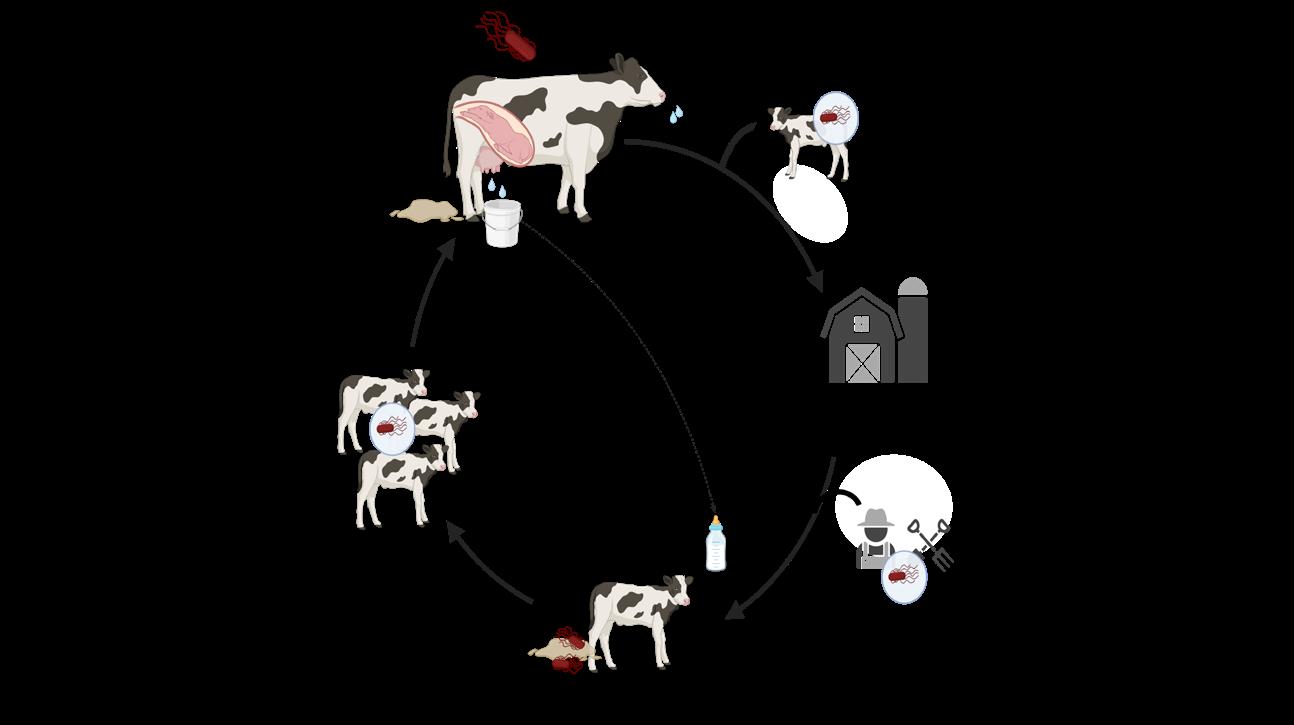
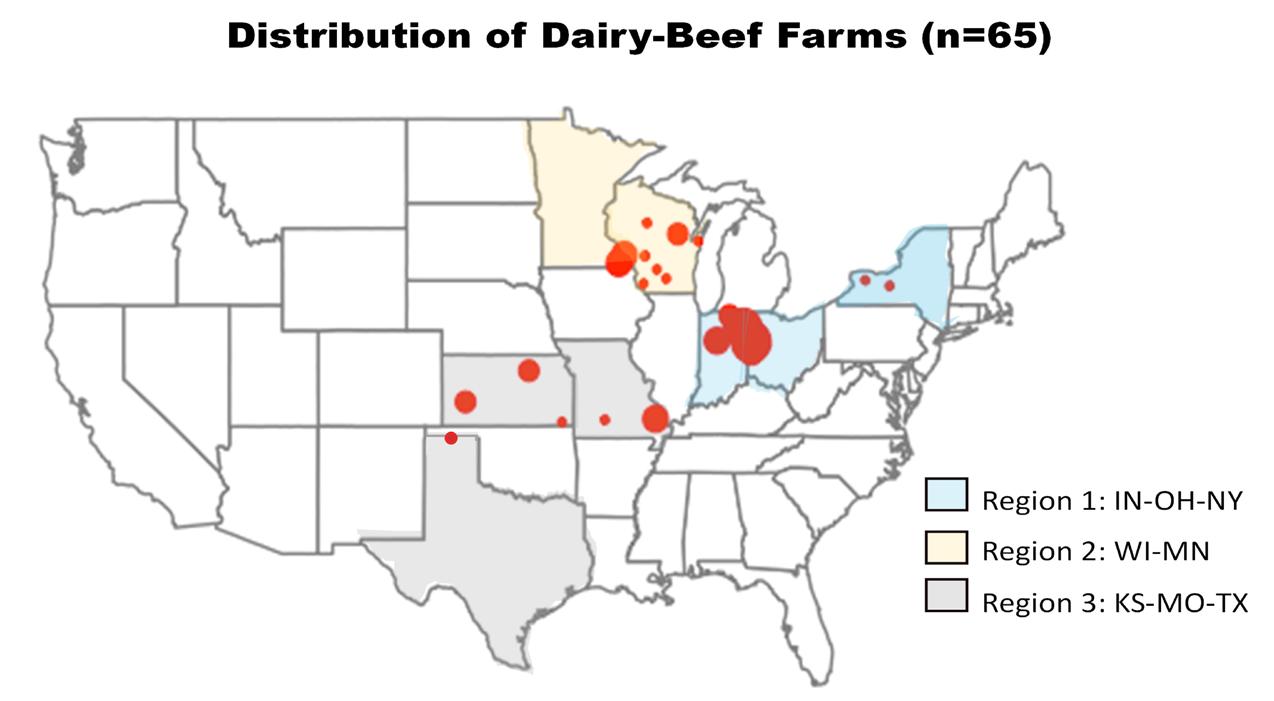
Figure 2. Distribution of Dairy-Beef Farms (n=65).

Salmonella Dublin (S. Dublin) was detected on 32% (21/65) dairy-beef farms, with 18.5% (49/265) of environmental samples testing positive. Most positive farms (57%) had only one positive sample. S. Dublin detection was similar between areas sampled, suggesting widespread environmental contamination.
• Farms introducing new calves frequently (< 9 weeks between groups) had a 6.8 times higher incidence risk of S. Dublin detection.
• Farms where employees had contact with outside livestock had a 5.4 higher incidence risk of S. Dublin detection.
• Findings surrounding biosecurity practices were not statistically significant, however, there was a trend (p = 0.09) suggesting that farms with stronger biosecurity practices may have lower risk of S. Dublin detection.
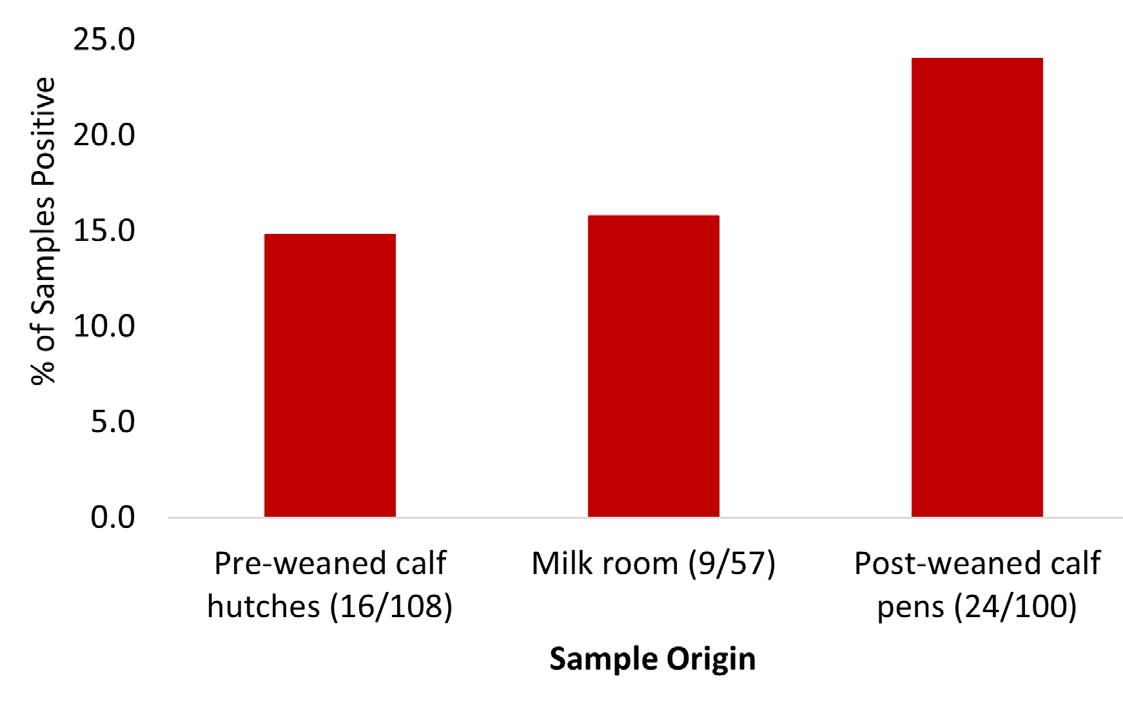


• S. Dublin can be detected on many dairy-beef farms in the Midwest.
• Risk factors such as frequency of new calf introduction and contact with outside livestock were identified. This information can be used to inform farm management practices.
• Consistent cleaning and disinfection (C&D) is critical to control S. Dublin transmission in cattle populations. Work with your veterinarian to design a C&D protocol that is effective and practical for your farm.
Resource on Biosecurity Against Salmonella in Dairy Calf Farms: go.osu.edu/dairy-salmonella-biosecurity
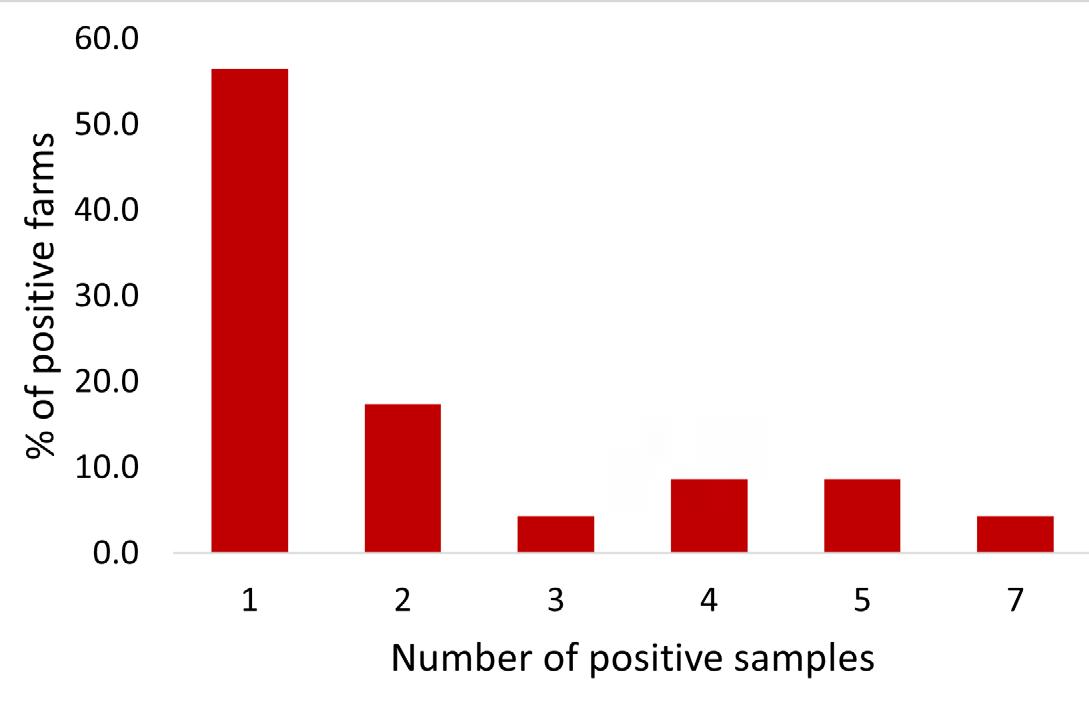
Boot Swabs
A quick and easy way to take environmental samples on-farm. They come premoistened in sterile bags and are made of stretchy material designed to fit over rubber boots like sock. This allows for easy sampling while walking through barns, pens, or other livestock areas, helping to monitor for pathogens.
For inquiries about this project, contact: Dr. Greg Habing, Professor (habing.4@osu.edu)
Alejandra Arevalo, Graduate Research Associate (arevalo.27@osu.edu)
Samantha Locke, Postdoctoral Scholar (locke.91@osu.edu)
Evaluate the daily water consumption, weight gain, and activity level of beef heifers based on travel distance to water source.
Start Date 8/15/2024
End Date 8/26/2024
Species Beef
Start Point Yearling
End Point Yearling
Treatments 3
Reps 34
Experimental Unit Head
Total Units 34
Breed, Genetics Crossbred
Sex Female
IACUC # 2024A00000071

OSU Extension
Wayne County
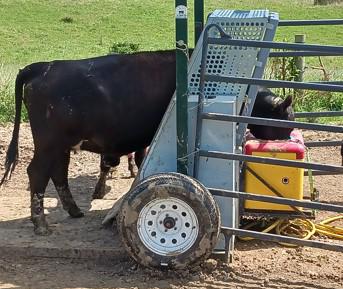
Image 1. Mobile Vytelle SENSE™ weigh system with water as attractant used to record animal weight and water intake.
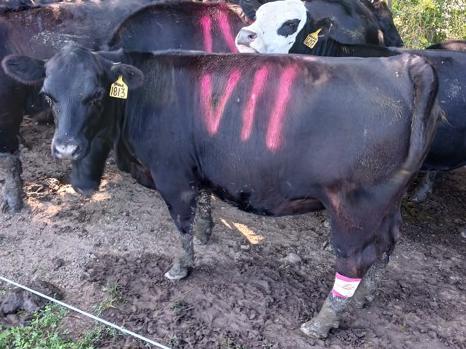
For this study, 34 beef heifers were given access to three pasture paddocks that differed in their distance from the water source. During each evaluation measurements were recorded for total daily water consumption, total number of daily waterer visits, daily weight change, and minutes spent lying down. Matched Pair tests were conducted with JMP 17.0.0 for data analysis. The individual paddocks were grazed during three different time periods:
• August 15-18, with max distance to water at 330 yards
• August 19-22, with max distance to water at 893 yards
• August 23-26, with max distance to water at 400 yards
Image 2. Heifer with attached accelerometer.
Individual water intake and body weight were measured using a mobile Vytelle SENSE™ weigh system with a Richie Brand waterer as the attractant (Image 1). The waterer was fitted with a flow meter to record water recharge volume. The water system allowed only one animal to drink at a time. Water intake and body weight measurements were assigned to an individual animal via an incorporated RFID tag reader panel.
A subset of 8 heifers was randomly selected from the group and a HOBO Pendant G accelerometer (pictured in the Tools of the Trade) was attached to the left hind leg, halfway between the hock and dewclaws with vet wrap (Image 2). The device recorded the average G force and physical position on the X,Y, and Z planes once each minute. Animals were visually observed, and behaviors recorded, to correlate to accelerometer data.

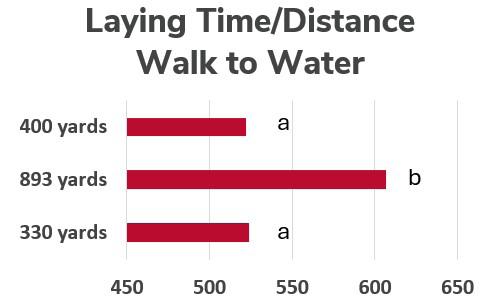
Figure 1. Total time spent lying down minutes/day.

Figure 2. Average number of waterer visits/day.
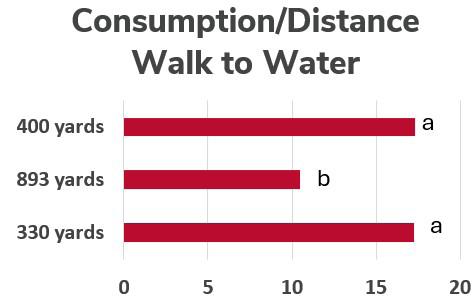
Figure 3. Total water consumption based on distance to waterer (L/day).
HOBO Pendant G Data Logger
Used to monitor physical activity. It records G force and spatial plane to determine movement intensity and animal position.


Distance required to walk to the waterer affected all variables measured. At the most extreme distance, heifers spent more time resting (Figure 1), visited the waterer less (Figure 2), and drank less water each day on that paddock (Figure 3). Heifers gained less weigh per day when required to walk an extreme distance to the water source (Figure 4). Although not significantly different, heifers gained weight at a slower rate when moved to a closer pasture following grazing on the farthest paddock, than in the initial closest paddock.
• Daily individual animal water consumption is dependent on forage maturity, environmental conditions, and physical layout of grazing systems.The accepted recommendation is that beef cattle should not be required to travel farther than 700 feet to reach a water source.
• Results in this study support the accepted recommendation by showing animal performance and behavior being negatively affected when cattle are required to walk an extreme distance from their grazing area to water.
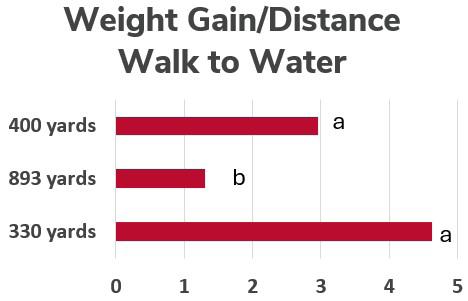
Figure 4. Average daily weight gain for differing distance to waterer (lbs/day).
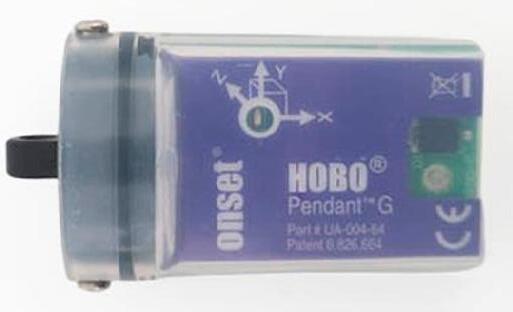
For inquiries about this project, contact: Dr. John Yost Assistant Professor and Extension Educator (yost.77@osu.edu)
Evaluate yearling performance data on replacement females to inform breeding and nutrition decisions.
Start Date 4/1/2024
End Date 4/7/2025
Species Beef
Total Number of Head 96
Breed, Genetics Angus x Red Angus x Simmental
Sex Yearling Heifers


Chart for assessing foot angles and claw sets.
96 replacement females were evaluated as yearlings for the following traits:
• Yearling Weight
• Body Condition
• Hip Height
• Docility Score
• Claw and Hoof Angle Scores
Table 1. Guidelines for Body Condition Scoring and the weight change needed to reach optimal condition before calving.


Table 2. Summarized results of the evaluation.


• Collecting and reporting yearling heifer data can influence sire EPD's and inform mating decisions at the farm level.
• When selecting replacement females target weight at breeding is often between 55-65% of mature body weight at a BCS of 6. The ideal claw set is toes that are symmetrical, even and appropriately spaced, while the ideal is a 45-degree angle at the pastern joint with appropriate toe length and heel depth.
• Docility is a measure of cattle temperment while in the handling chute, the lower the score the better in this case. Yearling height is an indicator of mature cow frame score.
Livestock Scales
The abilty to weigh animals and track performance is key to making nutrition, reproduction, and marketing decsions.

For inquiries about this project, contact: Dean Kreager (kreager.5@osu.edu)
Ted Wiseman (wiseman.15@osu.edu) John Yost (yost.77@osu.edu)
Identify differences between rams and wethers as it relates to live animal efficiency.
Start Date 9/1/2023
End Date 10/31/2024
Species Sheep
Start Point 10 DOA
End Point 5.5 - 6 months of age
Treatments 2
Reps 18
Experimental Unit Pen
Total Units 36 Pens (144 Head)
Breed, Genetics
Hampshire x Suffolk x Dorset x Ile de France x South African Meat
Merino (SAMM)
Sex Males
Feed Access and Delivery Hand Fed, Self Feeder, 1 Diet
IACUC # 2023A00000091


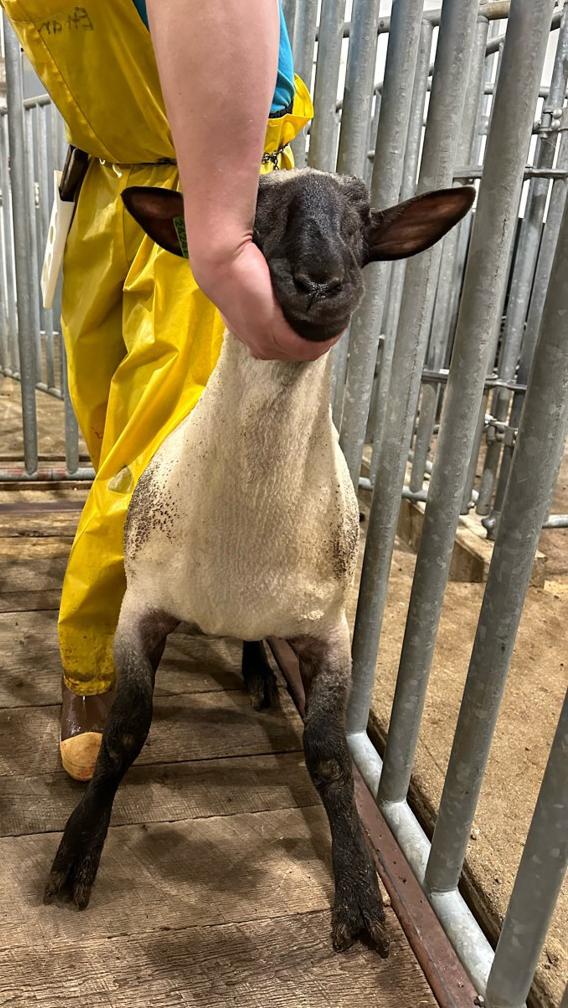
This experiment had two phases of data collection and measurement. This report details the first phase, which aimed to evaluate live lamb performance metrics including body weight (BW) gain, feed efficiency (represented as gain to feed ratio (G : F)), average daily gain (ADG), and dry matter intake (DMI). Treatments of intact males (rams) and castrates (wethers) were randomly assigned to lambs shortly after birth. Lambs were blocked by birth weight and sex and were randomly assigned to 36 pens with 3 lambs per pen in Wooster and 5-6 lambs per pen at the Eastern Agriculture Research Station. All lambs were fed a common finishing diet for 8 weeks.
The second phase evaluated carcass characteristics, which included carcass evaluation and cutability. See the additional report on Effect of Sex on Carcass Evaluation on pages 78-79.
There was a difference in body weight with the sex × time interaction, resulting in rams having heavier body weights throughout the 8-week feeding period.
There was an interaction of sex × time for DMI. Lambs were harvested at approximately six months of age and were finished on a high concentrate diet.
Ram lambs had a greater G : F ratio and ADG, but there was no sex × time interaction for both measures. There was also an interaction of sex × time for DMI.
• Ram lambs were heavier, trimmer throughout, and had greater feed efficiency (G: F and ADG, p < 0.01)
• Ram lambs are more efficient on-farm, but this may not fit all production systems.
• While this experiment demonstrates that ram lambs were heavier, trimmer, and had greater feed efficiency, understanding the length of time required for ram lambs to achieve a marketable weight (in comparison to wethers) is of importance to better understand feed efficiency.


Table 1. Least squares means of live animal and feed efficiency data of ram and wether lambs from birth through the finishing phase of production.
1SEM=standard error of the mean.
2Start wgt. indicates wgt. of lambs at the beginning of 8-week feeding period and is considered Day 0 of feeding trial. Final wgt. indicates wgt. of lambs at end of 8-week feeding period and is considered Day 56 of feeding trial.
3Calculated by dividing DMI by days on feed.
4 Calculated by dividing the amount gained by the DMI.
Digital Livestock Scale.
An important tool that each operation should have or at minimum have access to. A scale is used to weigh animals to better understand weight gain or loss over a period of time as well as feed efficiency to aid in calculating gain to feed which is in turn used to calculate operational costs.
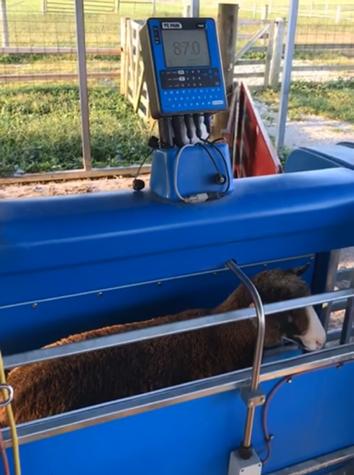
For inquiries about this project, contact: Braden Campbell (campbell.1279@osu.edu)
Benjamin Bohrer (bohrer.13@osu.edu)
Ale Relling (relling.1@osu.edu
Kayla Scott
Identify differences between rams and wethers as it relates to carcass characteristics and cutability.
Start Date 9/1/2023
End Date 10/31/2024
Species Sheep
Start Point 10 DOA
End Point 5.5 - 6 months of age
Treatments 2
Reps 18
Experimental Unit Pen
Total Units 36 Pens (144 Head)
Breed, Genetics
Hampshire x Suffolk x Dorset x Ile de France x South African Meat
Merino (SAMM)
Sex Males
Feed Access and Delivery
Hand Fed, Self Feeder, 1 Diet
IACUC # 2023A00000091


The first phase of this experiment evaluated live lamb performance metrics (body weight gain, feed efficiency, average daily gain, and dry matter intake). See the additional report on Effect of Sex on Animal Growth on pages 76-77.
This experiment had two phases of data collection and measurement. This report details the second phase, which evaluated carcass characteristics, which included carcass evaluation and cutability. Lambs that were utilized for the second phase of measurement were sourced only from the Wooster flock with 70 lambs (35 wethers, 35 rams) being used for carcass evaluation and cutability. Treatments of intact males (rams) and castrates (wethers) were randomly assigned to lambs shortly after birth. Lambs were blocked by birth weight and sex and were randomly assigned to 36 pens with 3 lambs/pen in Wooster and 5-6 lambs/pen at Eastern Agriculture Research Station. All lambs were fed a common finishing diet for 8 weeks.
At the completion of the feeding period, lambs were harvested at The Ohio State University Meat Lab (in Columbus) and carcass measurements were collected.
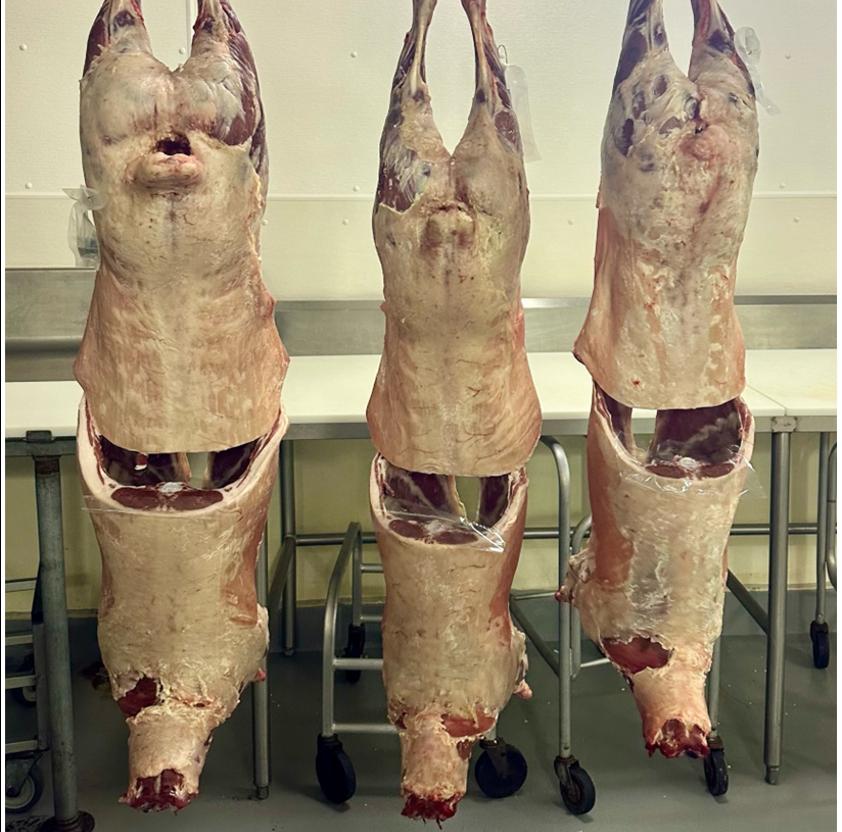
Comparing lamb carcasses.


Ram lambs retained heavier carcasses, with larger ribeyes, and were trimmer throughout (backfat thickness and bodywall thickness). Overall lamb quality was equivalent between treatments, as indicated by similar overall quality grades and degree of fat flank streakings.
Ram lambs were higher yielding for several meat cuts including: neck, shoulder, foreshank, breast, trotters, and leg; with the neck and trotters being heavier when accounting for the differences in carcass weight (wgt.) among treatments.
• Ram lambs exhibited greater weight gain, feed efficiency, carcass yield and cutability.
• Ram lambs are more efficient onfarm and are of greater value when marketed on a live weight, hot carcass weight, or as boxed lamb cuts basis. This practice may not fit all production systems and further work should look at the broader consequences of implementing this strategy.
• There is still uncertainty around consumer acceptability of meat produced by ram lambs, coupled with concerns of increased DMI raising ram lambs; further investigation is needed to support the production of ram lambs for meat production.
Lamb Ribeye Dot Grid
This tool was used to measure and quantify the ribeye area of the loin muscle on a lamb carcass when split between the 12th and 13th rib. This measurement represents the size of the loin chop and is commonly used as an indicator of carcass muscularity.
Table 1. Least squares means of carcass weight and carcass characteristics of ram and wether lambs.
1SEM=standard error of the mean. 2Testes wgt. from ram lambs (n=35).
3Conformation was scored Good to Prime and utilized -, O, + systems: Good- was 1, GoodO was 2, Good+ was 3, Choice- was 4, ChoiceO was 5, Choice+ was 6, Prime- was 7, PrimeO was 8, Prime+ was s 9.
4Leg score was based on a 9 (very thin muscling) to 15 (very thick muscling) system. 5Fat flank streakings scored from Traces to Moderate. Traces = 2, Slight = 3, Small = 4, Modest = 5, Moderate = 6.
6Quality grade ranged Good to Prime. Good = 1, Choice = 2, Prime = 3.
7Yield grade calculated based on formula: Yield Grade=(backfat thickness, in x 10)+0.4.
8BCTRC = boneless, closely trimmed retail cuts, calculated by: BCTRC, % = 49.94 - (0.085 × hot carcass weight, lb) - (4.38 × backfat thickness, in) - (3.53 × body wall thickness, in) + (2.46 × ribeye area, in2).
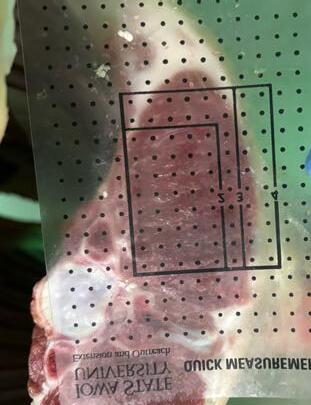
For inquiries about this project, contact: Braden Campbell (campbell.1279@osu.edu)
Benjamin Bohrer (bohrer.13@osu.edu)
Ale Relling (relling.1@osu.edu
Kayla Scott
Evaluate the effect of feeding ground pumpkin seeds (PS) on the growth and parasite resiliency of young, growing lambs.
Start Date 7/8/2024
End Date 8/22/2024
Species Sheep
Start Point 120 DOA
End Point 150 DOA
Treatments 3
Reps 5
Experimental Unit Pen
Total Units 15 Pens (30 Head)
Breed Hampshire x Suffolk x Dorset x Ile de France x South African Meat Merino (SAMM)
Sex 15 M : 15 F
Feed Access and Delivery
Hand Fed, Self Feeder, 3 Diets
IACUC # 2023A00000082
A total of 30 lambs were blocked by fecal egg count (FEC), sex, and body weight (BW) and placed into 15 pens (2 lambs/pen). A total of 3 treatment groups (10 lambs/group) were fed for 14 days. Lamb BW was collected on days 0, 7, and 14. Lamb FEC was collected on days 0, 3, 7, 10, and 14. After the completion of the 14 day treatment period, lambs remained on feed and fed a common diet for an additional 30 days.

CFAES Wooster Wayne County

Student feeding lambs ground pumpkin seeds.
Lamb packed cell volume (PCV) and FEC did not differ (p = 0.28) between treatments.
A treatment x day effect was observed for lamb FAMACHA eye score (FAM) with Diet A having the lowest score (1.1), CON being the intermediate (1.3), and Diet B having the highest score (1.4; p = 0.01).
Lamb dry matter intake (DMI) decreased (1012, 951, and 744 g; p < 0.001) as pumpkin seed inclusion rate increases for CON, A, and B diets, respectively.
Lamb average daily gain (ADG) decreased (269, 162, and 55 g/d; p = 0.02) as pumpkin seed concentration increased in the diet.
On day 30, lamb BW was collected to assess compensatory gain; however, there were no differences in post-treatment ADG (311, 350, and 350 g/d; p = 0.53) for CON, A, and B diets, respectively.

• Despite changing the method of feed delivery (ground pumpkin seeds), parasite burden remained unchanged.
• Lambs offered ground pumpkin seeds resulted in weight loss during the feeding period.
• In comparison to our previous experiment, proglottids (tapeworm segments) were visually observed in all pens that were offered pumpkin seeds. This may indicate that there is some type of effect of pumpkin seeds on other parasite populations. However, this was not quantified through our evaluations.


Proglottid (segment of a tapeworm) found in one of the pens during the study
Table 1. The effect of ground PS on health metrics used to quantify parasite burden in lambs naturally infected with strongyle type parasites.
1SEM=standard error of the mean. 2Eggs per gram.
Table 2. The effect of ground PS on growth and feed efficiency of lambs naturally infected with strongyle type parasites.
to Feed Ratio
Within a row, means with differing letters are significantly different
McMaster Slide
Specailized slide used to quantify parasite burden.

For inquiries about this project, contact: Braden Campbell (campbell.1279@osu.edu)
Ale Relling (relling.1@osu.edu)
Madelyn Schramm
Melva Tacuri Vera
Measure the lambing rate when using frozen semen for Laparoscopic Artificial Insemination (LAI).
Start Date 2017
End Date 7/1/2025
Species Sheep
Start Point Various
End Point Various
Estrous Synchronizatrion Yes
Experimental Unit Head
Bred, Genetics Hampshire, Shropshire, Tunis
Sex Female

OSU Extension Marion County

An up-close view of LAI by a technician.
Laparoscopic Artificial Insemination (LAI) is the intrauterine method of insemination, to bypass the unique anatomically tortuous cervix of the sheep. Currently, producers follow the synchronization schedule, breed ewes with an above average body condition score, and follow the prescribed timelines. The data for this comparison has been collected the past nine years from seedstock producers with experience and knowledge of the LAI procedures.
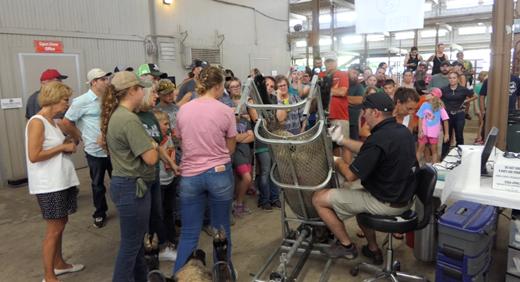
Technician using a cradle device during a LAI.


Breed and age do not influence the lambing percentage. Observation indicates the repeat breeding of LAI ewes that conceived the previous year increases their lambing rate. The breeding intervial from Controlled Internal Drug Release (CIDR) removal and LAI maybe more individual specific than first observed.
• A closer review of frozen semen quality after thawing has been identified as a possible reason for lower lambing rates.
• Currently LAI technicians analysis the quality/ motility of the semen post thaw, a higher level of viable semen maybe needed to increase conception rates.

Laparoscopic Insemination
An industry standard procedure has been used for all years in the participing flocks' laparoscopic insemination program. A laparoscope (image to the right) is used with veterinarian accepted procedures and timings.
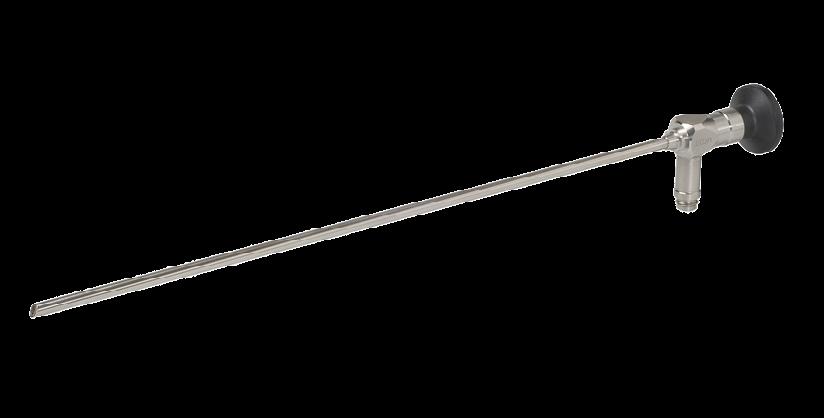
Assess common management practices of newborn care that are being used on small ruminant operations.
Time Surveyed 2/11/2025 - 6/1/2025
Species Small Ruminant
Topic Surveyed Health and Management County Distributing Survey Delaware
Type of Respondent Farmers/Herdsman
Other States and Countries Represented California, Colorado, Illinois, Iowa, Kansas, Kentucky, Maryland, Massachusetts, Michigan, Minnesota, Montana, Nebraska, New Jersey, New York, Oklahoma, Oregon, Pennsylvania, South Dakota, Tennessee, Texas, Virginia, Washington, Wisconsin, UK
Total # of Survey Responses 171
Total Animals Represented 10,993 Females
A survey through Qualtrics was distributed through the Ohio Sheep Team Newsletter along with several different small ruminant social media groups. Participants answered questions about the newborn care (first 7 days of life) management practices.

OSU Extension
Statewide
This study shows that the majority of sheep and goat producers are using lambing or kidding pens and are observing them many times per day for certain factors. This is great news. This also tells us the majority of producers are processing lamb and kids before 7 days old (vast majority withing 3 days) by giving offspring identification, tail docking, and vaccinations. The death rate seen over the first 7 days was much lower than expected and reasons were not as straightforward as anticipated with many reporting no deaths at all. Producers also reported having to deal with a mother not accepting her offspring by restraining with a head gate. They also reported supplementing lambs as their most preferred method of a mother not milking well.
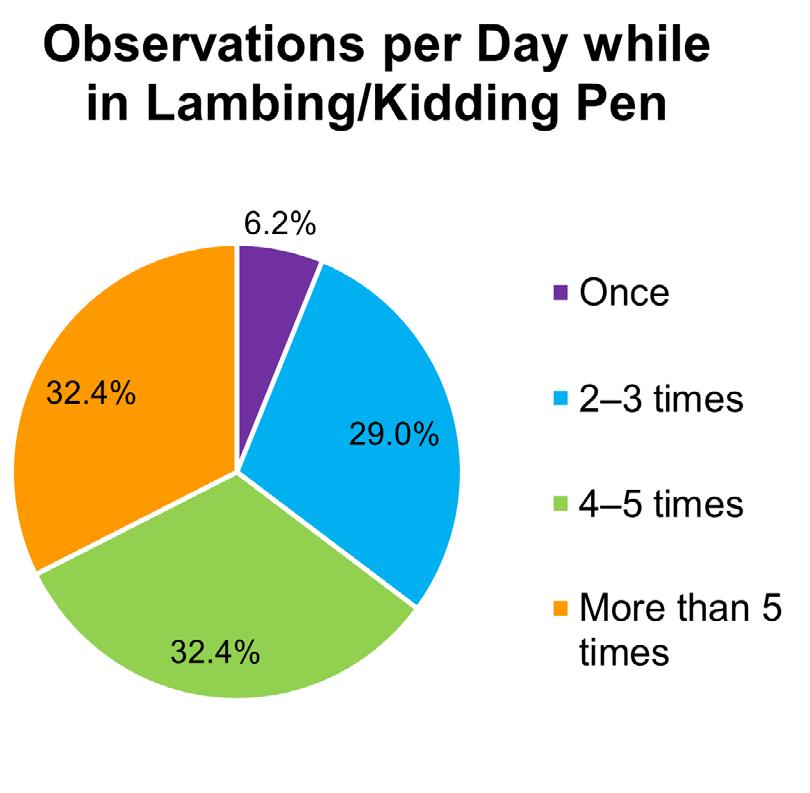
Figure 1. Number of observations per day, n = 145.
Most important observations while in the lambing/ kidding pen:
1. Offspring Nursing
2. Offspring vigor
3. Mothering acceptance
4. Milking ability
5. Mother health condition
6. Offspring body temperature
7. Other (Including themes around health, maternal behavior, and management)

Heat lamps used for temperature control.

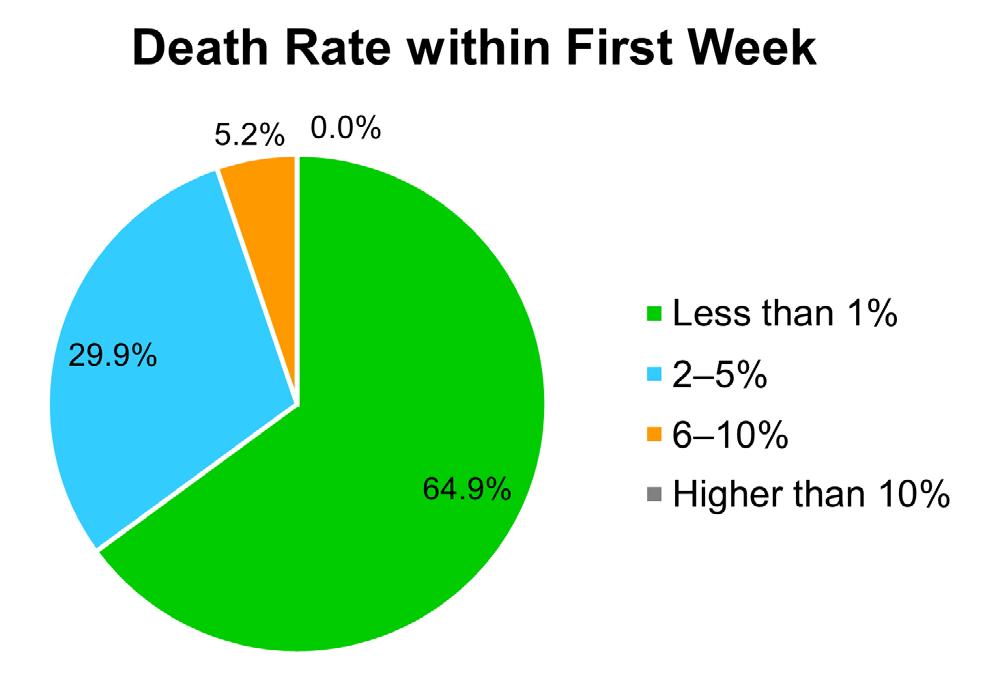


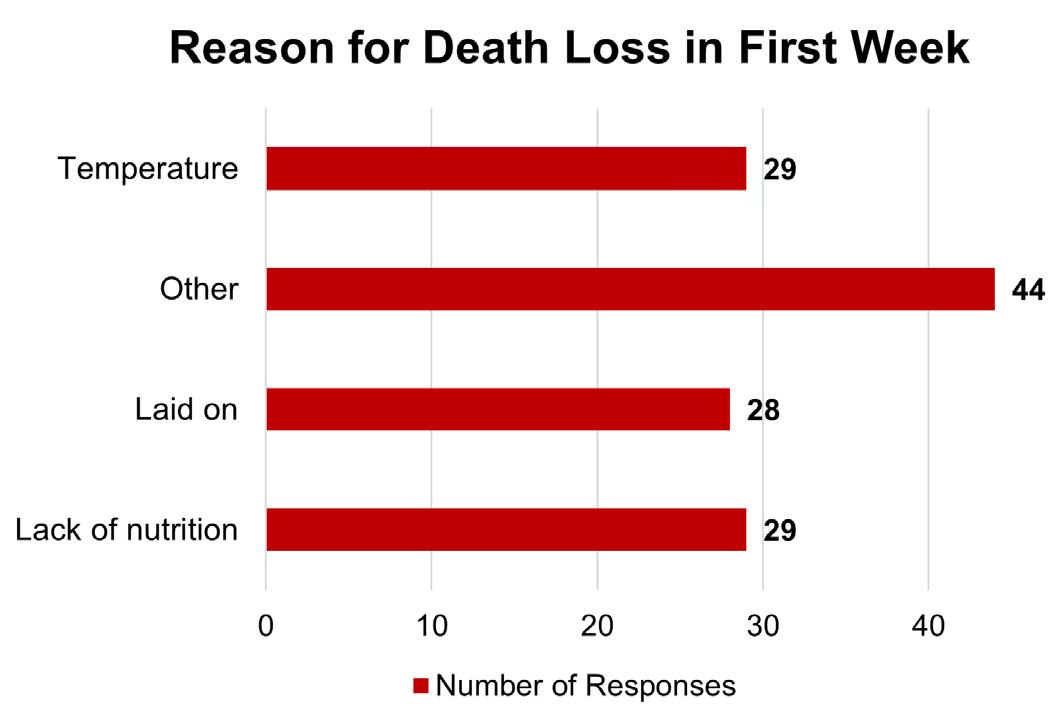
• This data has shown us that timing of processing and length of stay in the lambing and kidding pens are not specifically aligned. It also shows us the death rate in the first week of life is low.
• The common threads seen for future newborn care management curriculum potential include: immediate newborn/ emergency care, nutrition, vaccinations, tube feeding, offspring nursing, and management.


Tagging as a part of newborn processing.
Processing Tasks
• Tag/ID (92)
• Tail Docking (73)
• Vaccinations: (63)
• Vitamin/Mineral Injection (56)
• Castration (27)
• Dehorning (13)
• Other: weight measurement, oral vitamin/minerals

Rob Leeds (leeds.2@osu.edu) Delaware County 2025 eBarns Videos go.osu.edu/25ebarnsvideo
For inquiries about this project, contact: Jacci Smith (smith.11005@osu.edu)
Investigate the effect of meal feeding frequency on individually stalled horses’ behavior.
Start Date Summer 2022
End Date Summer 2022
Species Equine
Start Point Mature
End Point Mature
Treatments 3
Reps 2
Experimental Unit Head
Total Units 6
Breed, Genetics
Riding type school horses
Sex Mares and Geldings
IACUC # 2019A00000081
Horses were separated into two sets based on similar traits (e.g., sex, breed, age) and each set received each treatment in a crossover design. Horses were fed grass hay from slow-feed hay nets at 1.55% and pelleted complementary feed at 0.45% of body weight on a dry matter (DM) basis. Both forage and pelleted feed were split across feedings with the forage portion provided immediately prior to the pellets. Video recordings were evaluated from 7:00am - 7:00pm using an ethogram based on previous work (McDonnell, 2003; McDonnell & Poulin, 2002). Behavior duration and frequency was recorded and calculated using Microsoft Excel, and a JMP Pro 16 mixed model was used to determine differences in the duration and frequency based on treatment, set, and horse.


Table 1. List of behaviors that were evaluated for both frequency and duration for each feeding treatement.
Behaviors Evaluated for Frequency and Duration
Standing/standing alert Drinking
Eating hay Investigative
Standing relaxed and/or dozing Pawing
Locomotion
Defecation
Stall walking Urination
Eating Concentrate Wood chewing
Lying awake Startle
Sleeping/lying Nod/head tossing
Cribbing/wind sucking Tail swishing
Weaving Other
Table 2. Treatment descriptions.
1 feeding/day (8:00am)
2 feedings/day (8:00am and 6:00pm)
3 feedings/day (8:00am, 1:00pm, 6:00pm)
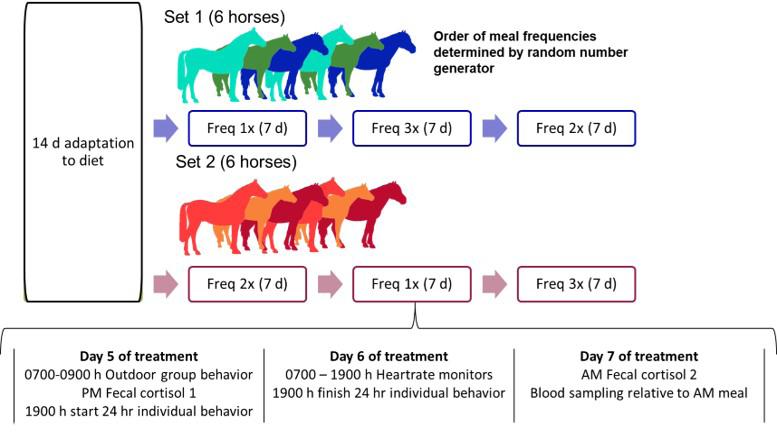
Figure 1. Schematic of study design.

Set did not have a significant impact and was removed from the statistical model. Horses spent 26 ± 2, 13 ± 2, and 8 ± 2 min (mean ± Standard Error) consuming their morning allocation of pellets for 1x, 2x, and 3x treatments, respectively (P < 0.01). All horses still had hay at 7:00pm (end of studied time frame).
There were differences in duration or frequency of behaviors between individual horses.
The top 5 most displayed and most frequent behaviors are listed in the tables below.


• There were differences in duration or frequency of behaviors between individual horses. Horses spent the largest percentages of their time standing alert (38%), eating hay (31%), and standing relaxed/ dozing (9.5%)(see Table 3).
• Understanding horse behavior, in response to feeding and management practices, could help owners and managers make informed decisions.
• Limiting factors were low sample size, exclusion of nighttime behavior, and use of adult horses that have previously established patterns of behavior.
• Future research could include categorizing which behaviors occurred more around feeding times, to capture anticipatory behavior.
Table 3. Duration of behaviors of individually stalled horses (n = 6) as a % of a 12 hour time budget during the daytime.

Table 4. Frequency of behaviors for individually stalled horses (n = 6) within the 12 hours observation period during the daytime.

View the abstract: doi.org/10.1016/j.jevs.2025.105522
Video Cameras
Utilizing video cameras within the stall allows researchers to observe natural animal behaviors without the interference of human presence.

For inquiries about this project, contact: Katherine Jones
Sara Mastellar (mastellar.1@osu.edu)
Elizabeth Share (share.8@osu.edu)
Karen Bennett-Wimbush (wimbush.4@osu.edu)
Investigate the effect of feeding frequency on equine behavior, social hierarchies, and welfare.
Start Date 5/27/2022
End Date 6/30/2022
Species Equine
Start Point Mature
End Point Mature
Treatments 3
Reps 1
Experimental Unit Head
Total Units 12
Breed, Genetics
Light horses used for riding
Sex 6 Mares : 6 Geldings
Feed Access Hand Fed, 1 Diet
IACUC # 2019A00000081-R1


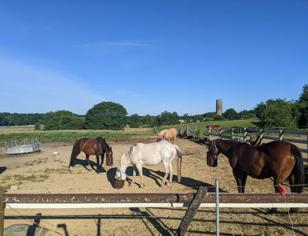
View of the 40 x 40 meter dry lots where horses were group-housed
Twelve horses were assigned to one of two pens, and blocked by body condition score, breed type, age, and sex. They were group-housed in 40 x 40 meter dry lots with shelters. After a 14 day diet adaptation, pens were randomly assigned an order of meal frequencies in a crossover design and a treatment, with total rations divided equally across meals. Each treatment was fed for 7 days. Each pen was fed grass hay at 1.55% of body weight (BW) per day on a dry matter (DM) basis from slow-feed hay nets, approximately 15 min prior to the pelleted meal. Pelleted, complementary concentrate was fed at 0.45% BW DM per day via individual nosebags (1x, 2x, or 3x).
Treatments:
• One time (1x) at 8:00am
• Two times (2x) at 8:00am and 6:00pm
• Three times (3x) at 8:00am, 1:00pm, and 6:00pm
On day 5 of each treatment, horses were video recorded for continuous observation for 2 hours, centered around the 8:00am pelleted meal.
• Behaviors were categorized using an ethogram for frequency (bouts) for all behaviors and duration (%) for select behaviors.
• Time budgets were calculated for pre-feeding (before hay), post-feeding (after hay), and total time.
• Dominance ranks within pen were based on displacements given and received.
• Fecal samples were collected on day 5 for cortisol/ corticosterone metabolite (FCM) measurement as an indicator of stress.
• Data were analyzed using PROC MIXED in SAS with meal, pen, and dominance rank as fixed effects and random effects of period and horse nested within pen.
View the abstract: doi.org/10.1016/j.jevs.2025.105462

When fed 3x, horses stood alert more frequently than horses fed 1x or 2x. Horses assigned a higher dominance rank showed signs of aggression more frequently during pre-feeding, but not post-feeding. During the 3x feedings, there were more signs of aggression seen post-feeding compared to 1x feeding. Horses fed 3x walked more frequently postfeeding than those fed 1x or 2x. Horses were also displaced more frequently when fed 3x than those fed 1x or 2x.
• Changes in feeding frequency may increase stress. Post-feeding, increased incidences of aggression, and locomotion occurred when group-housed horses were fed smaller, more frequent meals.
• While horses had access to adequate forage, it is suspected that increased resource guarding and aggression may be due to smaller amounts of hay during the 3x treatment, which horses may have interpreted as limited resources.
• As expected, more dominant horses had more bouts of aggressive behaviors, while more submissive horses recieved more displacements from higher ranking herd members.
• More research is needed on acclimation periods when observing meal frequency changes. Future research could explore the effect of various methods to prolong access to hay on equine behavior and stress.


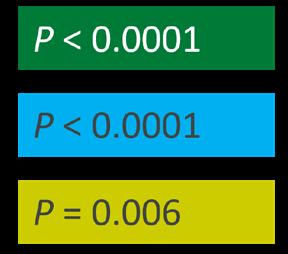
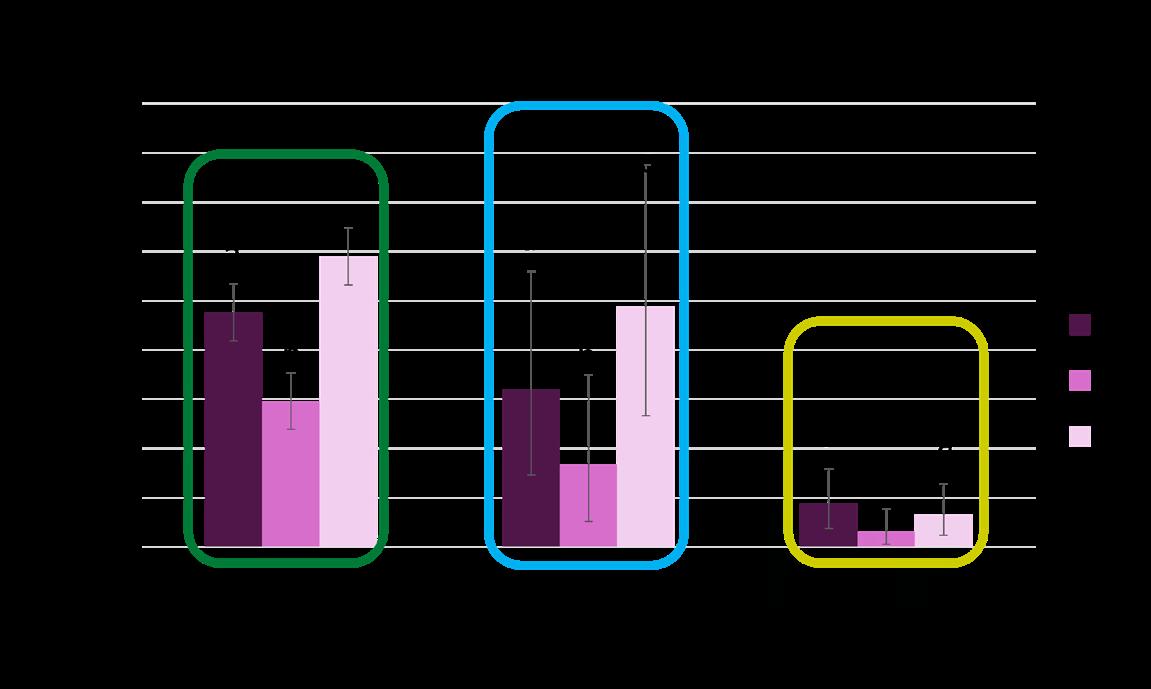
Figure 1*. Comparisons within a time budget notated with a letter (a, b, c) represent differences between least squared means (P ≤ 0.05). Standing alert: standing with eyes open, ears pricked. Nostrils may be flared. Attention may appear to be directed at observer/staff/other horses/other aspects of social or physical environment.

Figure 2*. Comparisons within a time budget notated with a letter (a, b, c) represent differences between least squared means (P ≤ 0.05). Agonistic: Ears back, aggressive movement to move another herd member, biting, kicking
*Figures 1 and 2: Differences in horses’ frequency of behaviors due to feeding frequency based on different time budgets. TT = Total Time Observed, PREFEED = Pre-feeding, POSTFEED = Post-feeding
GoPro
Cameras were used to effectively capture videos for evaluation and analysis. Image to the right shows a GoPro on the corner of the pen.

For inquiries about this project, contact: Elizabeth Share (share.8@osu.edu)
Sara Mastellar (mastellar.1@osu.edu)
Karen Bennett-Wimbush (wimbush.4@osu.edu)
Maurice Eastridge (eastridge.1@osu.edu)
Identify Ohio horse owners’ demographics, knowledge gaps and preferred sources for information, and influences on management choices.
Time Surveyed October 2023December 2023
Species Equine
Topic Surveyed Feeding and housing management
Type of Respondent Horse owners
# of Ohio Counties Represented 82
Total # of Usable Survey Responses 1,011


Using Qualtrics (Provo, UT), a 52-question online, anonymous survey was made available to Ohio horse owners and industry personnel through local horse organizations and social media. Data were summarized using descriptive statistics (mean, percentage, frequency) and relationships between variables were explored using Pearson chi-square tests or Kruskal-Wallis H and Mann-Whitney U tests in SPSS (Armonk, NY). IRB: 2023E0901.
• These results can be used to assist in developing educational opportunities and resources, and to design equine management research to benefit Ohio’s equine stakeholders (i.e. increasing knowledge of Ohio equine industry personnel on body composition scoring, pasture management, ration and supplement evaluation, and the importance of weighing feed). It is recommended that these be optimized for the larger proportion of inexperienced population.
• Given the large proportion of respondents that indicated horses were group-housed, further research into how herd dynamics are affected by management strategies may be of interest. Future research topics could include investigating best practices concerning feeding management, group turn out, and introduction of new horses to herds.
For inquiries about this project, contact: Elizabeth Share (share.8@osu.edu)
Sara Mastellar (mastellar.1@osu.edu)
Joy Rumble (rumble.6@osu.edu)
Maurice Eastridge (eastridge.1@osu.edu)

Demographics and Experience
Most respondents had between 1-10 years of horse experience (64%) and identified as primarily white (63%), females (61%), and between 35-44 years of age (31%).
Quarter Horses (29%) were the most represented breed with 23% of respondents owning and/or managing them.
Overall, the primary sources of equine management information were internet (15%), veterinarians (14%), and personal contacts (12%).
Experience level owning horses affected respondents’ main source of equine information and awareness of resources provided by Ohio State University (OSU) Extension. Awareness of OSU Extension resources affected respondents’ familiarity and use of body condition scoring.
Housing and Feeding Management
Most respondents either stalled horses with unlimited turnout (31%) or group housed horses on pasture (32%).
Most respondents fed concentrates (96%), primarily measuring concentrates either by weight (47%) or volume (51%).
Forages were more commonly fed by flakes/bales (34%) rather than by weight (20%). Feeding frequency of forage depended on access to pasture, and respondents were likely to feed more frequently when horses had no access to pasture.
Feeding forage twice per day was most common, regardless of access to pasture (50%) or not (30%). Concentrates were more commonly provided once per day (43%) with 22% feeding twice per day.


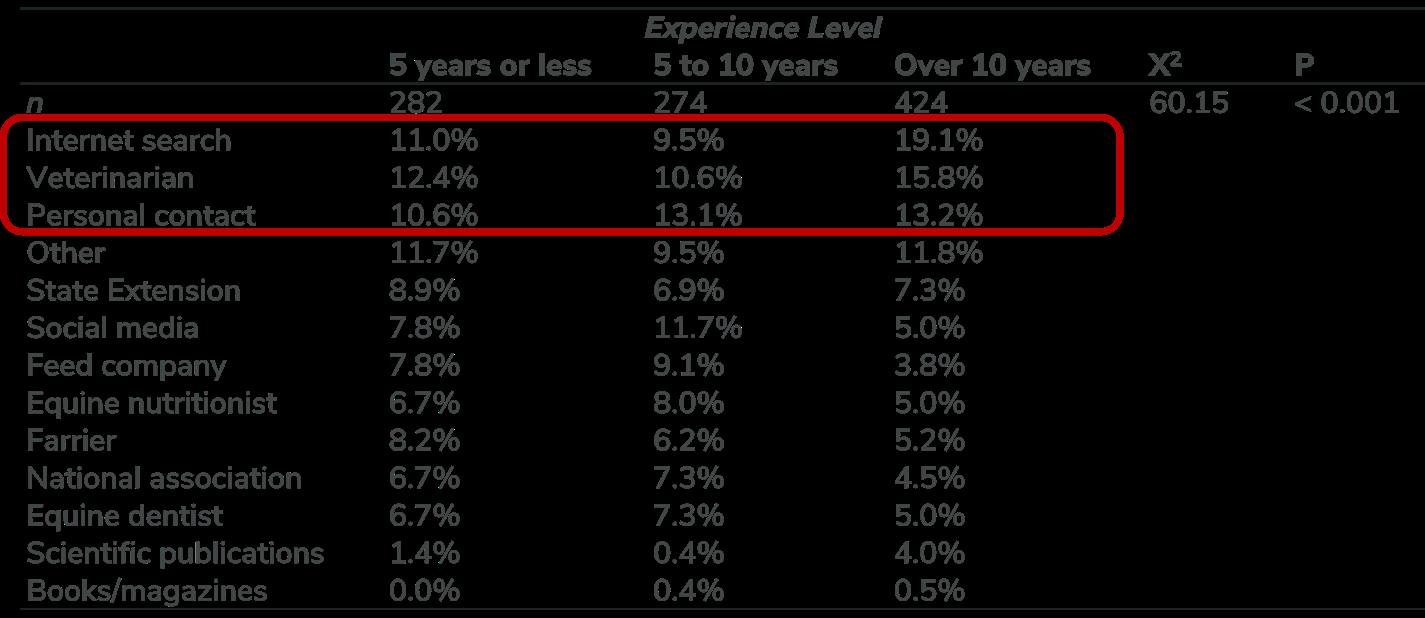
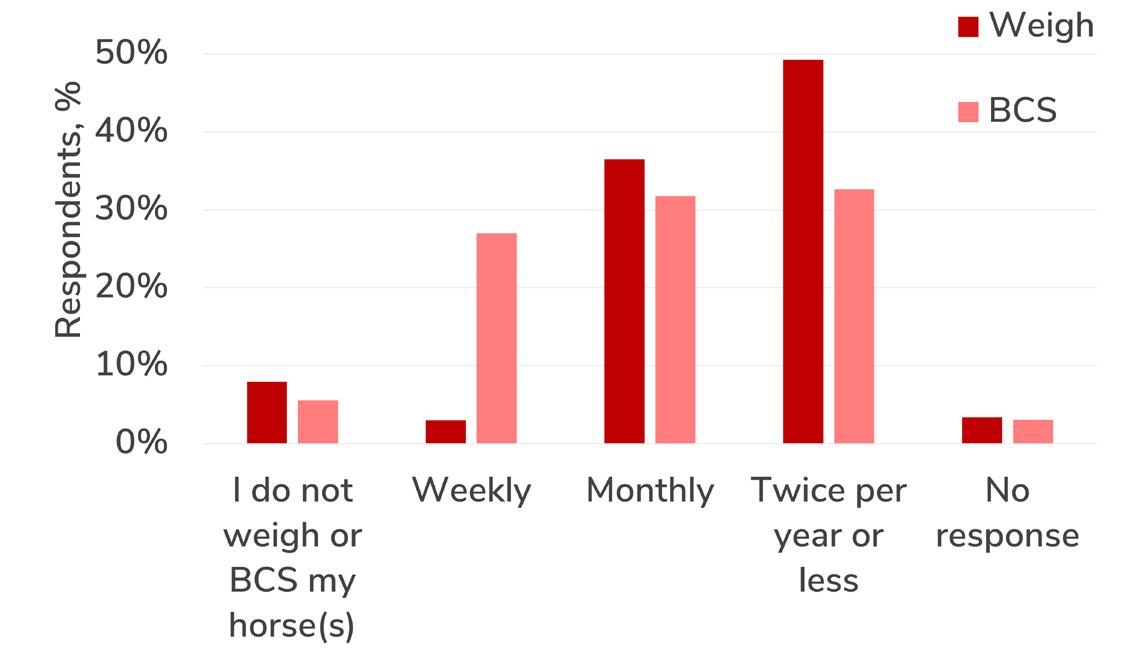


Evaluate the effect of trailer loading on the timing and pH of natural defecations.
Start Date Summer 2024
End Date Summer 2024
Species Equine
Start Point Mature
End Point Mature
Treatments 2
Reps 2
Experimental Unit Head
Breed, Genetics Light horses
Sex Mares & Geldings
IACUC # 2024A00000042
There were 15 mature (meaning 16 years old, plus or minus 5 years) horses, with trailering experience, selected for this study. They were fed at approximately 8:00am and 4:00pm. Horses were then randomly allocated to a treatment on day one and then given the other treatment on day two in a crossover design.
The treatments were two different fecal collection times. The control treatment was collecting samples from natural defecations post morning feeding. The second treatment was collection after trailer loading. This was done after finishing their pelleted morning feed and then being loaded onto a stock trailer. If they did not defecate upon loading, the horse was secured inside for a maximum of 15 minutes (min.) for a defecation. If a horse did not defecate within 15 min., the horse was returned to the pasture and no sample was collected.


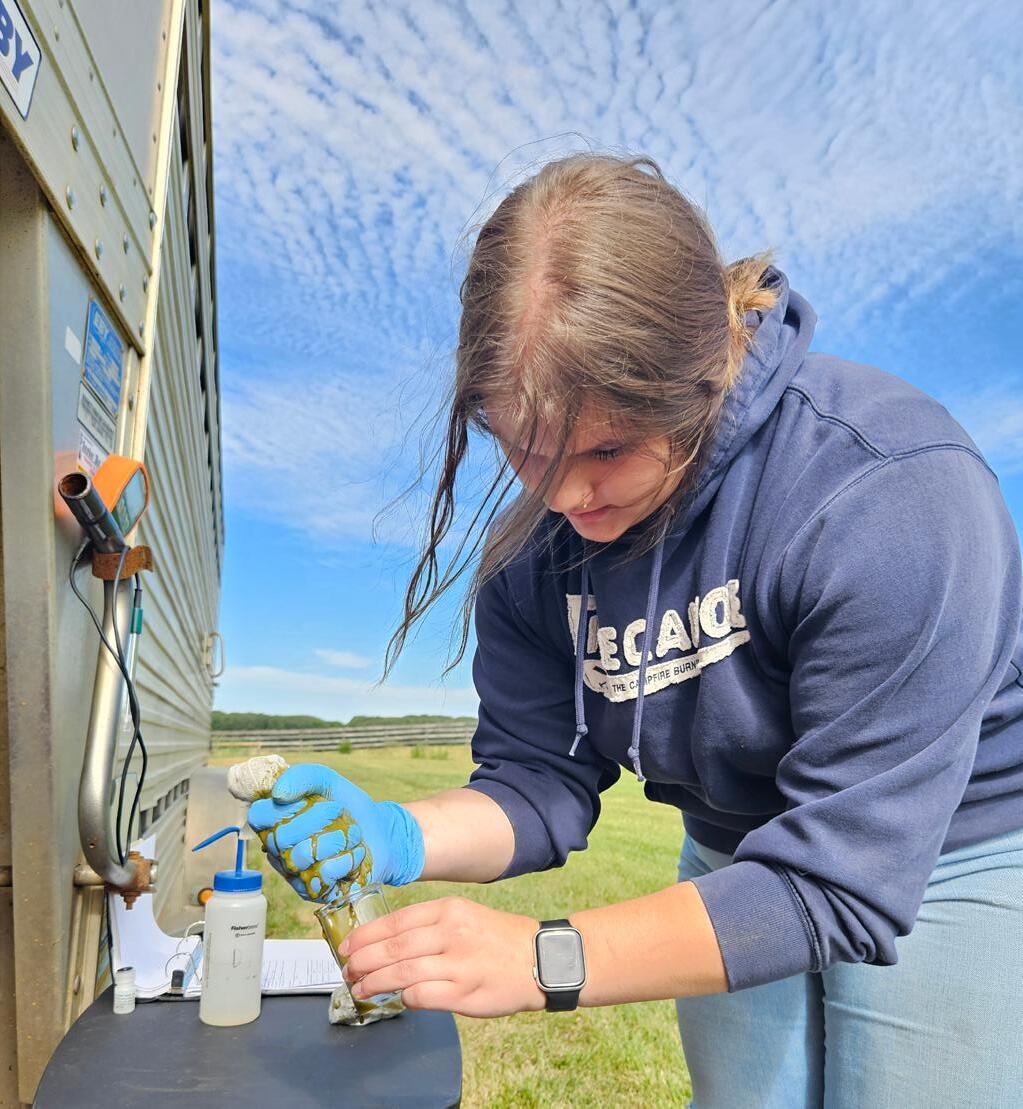
Student collecting fecal fluid for pH measurement.
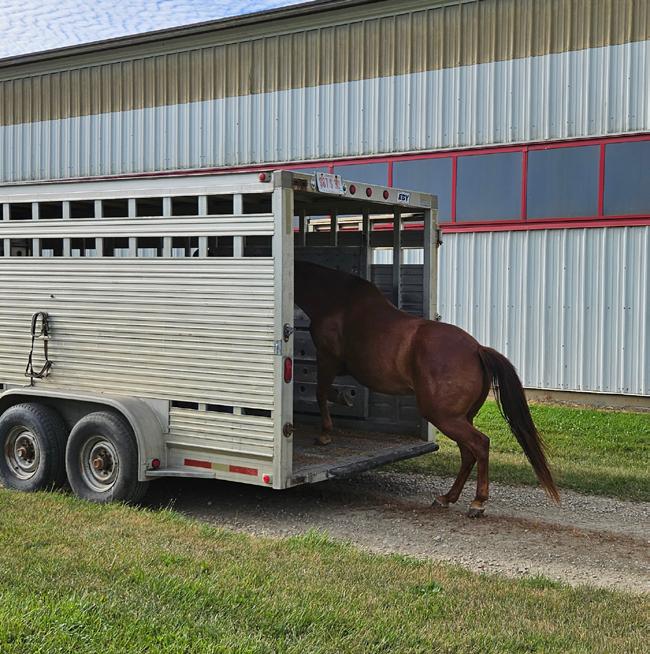


All horses loaded onto the trailer readily. One horse defecated in the pasture and then again on the trailer within 10 min. and the fecal pH from those 2 defecations was the same. Only one horse did not defecate on the trailer within the allotted 15 min.
During the control treatment, it took 35 ± 26 min. (mean ± Standard Error) from feeding to defecation. From trailer loading to defecation, it took 2.0 ± 1.6 min., except for one horse that did not defecate within the allotted 15 min.

Figure 1. Minutes post feeding the morning meal until either natural defecation (control) or defecation induced by trailer loading


• pH values obtained in this study were within the typical range for healthy horses.
• Additional people and trailers could further reduce the time needed to collect fecal samples from a herd of horses using this method.
• The pH of the fecal fluid from defecation in the trailer was not different from the control.
• This study indicates that equine defecation can be induced by trailer loading, and the fecal pH of those defecations is similar to natural defecations.
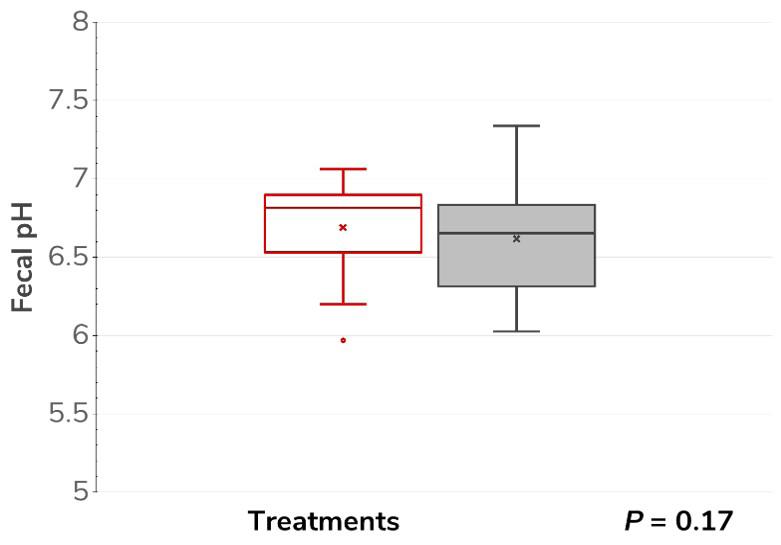
Figure 2. Fecal pH obtained from either natural defecations (control) or defecations induced by trailer loading
View the abstract: doi.org/10.1016/j.jevs.2025.105521
Extech PH220-C Waterproof Palm pH Meter
This portable pH meter allowed researchers to measure fecal pH trailerside.

For inquiries about this project, contact: Caitlyn Geisheimer
Karen Bennett-Wimbush (wimbush.4@osu.edu)
Sara Mastellar (mastellar.1@osu.edu)
Characterize the occurrence of gastrointestinal parasites in pigs with access to outdoor, non-concrete areas.
Start Date March 2024
End Date March 2025
Species Swine
Total # of Farms 15
Ohio Counties Represented Darke, Fairfield, Logan, Medina, Montgomery, Washington States Represented Ohio (7), Indiana (6), Michigan (1), Massachusetts (1)
Health Protection Varying Deworming Protocols
IACUC # IBR # 202400000065 2024R00000054
A total of 15 farms were included in the study, with 137 fecal samples collected from pigs ranging from 2 months to 12 years old. Farms were recruited through the Ohio State University Extension network and online pork directory over the duration of the study. Farms were enrolled if they had pigs reared with access to outdoor, non-concrete areas, and each farm was required to complete a survey about their management practices. Pig fecal samples were collected and submitted to the Veterinary Parasitology Laboratory at the OSU College of Veterinary Medicine for parasitology testing.
Out of the 137 samples, only 16 were negative for gastrointestinal parasites. One farm had all sampled pigs testing negative (six pigs sampled, from 2 months to 12 years old). This farm reported deworming semi-annually. Seven types of intestinal parasites were identified.


CFAES Animal Sciences and Center for Food Animal Health Statewide

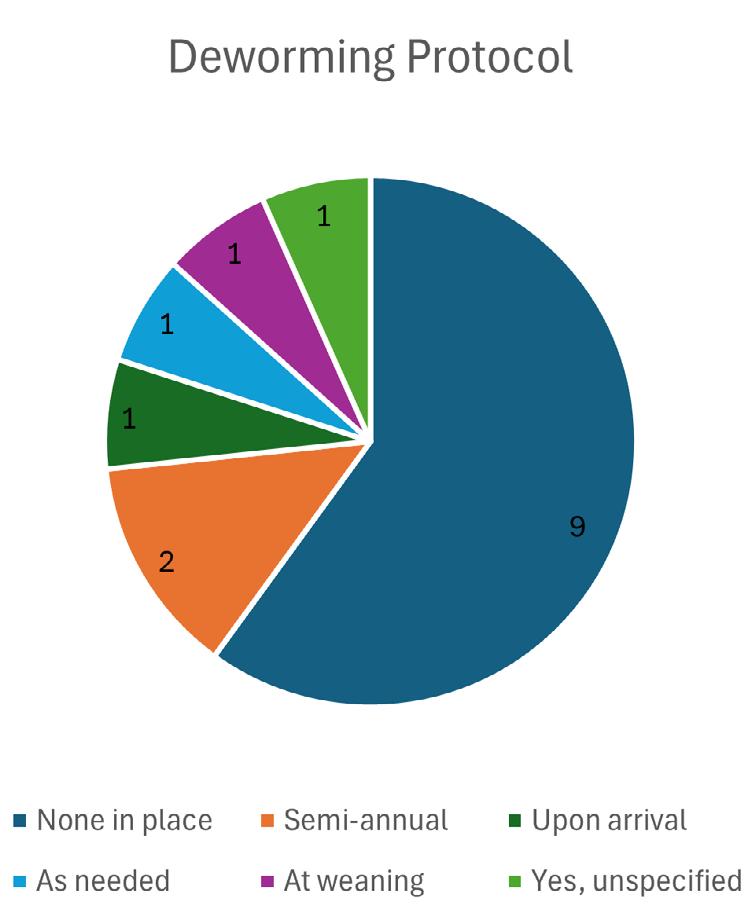

Figures 1-3 (above). These graphs illustrate answers for some of the survey questions about farm management practices obtained from the 15 enrolled farms.

• Results from this study indicated a high diversity of gastrointestinal parasites among pigs raised with access to outdoor, non-concrete areas.
• Some of the parasites observed have zoonotic potential, i.e., can be transmitted from pigs to humans; however, none of them pose a threat to human health through the consumption of properly cooked pork products.


• Management practices varied widely across the farms included in the study, with the most consistent practice being the maintenance of pigs year-round with access to outdoor, non-concrete areas.
• Overall, farms included in this study run their pig rearing system independently of professional services, such as marketing, veterinary, nutrition, and soil/ water/forage management.
• Famers demonstrated interest in receiving veterinary consultation for their pigs but reported difficulty in finding professionals in their geographical area.

Information about the parasites observed in this study can be found in this Swine Gastrointestinal Parasites fact sheet: go.osu.edu/SwineParasites25

For inquiries about this project, contact:
Kara Flaherty (flaherty.177@osu.edu) Education Program Specialist
Valerie Van Meter, MAS student
Dr. Talita Resende, Assistant Professor, Swine Health Extension Specialist
Avian influenza is a viral disease that can affect multiple species of birds and mammals. It can exist in avian species in a low pathogenic form that causes mild symptoms and can also mutate into a highly pathogenic form that can cause high mortality in multiple avian species including domestic poultry such as chickens and turkeys, shore birds, and raptors including hawks, owls, and eagles. Highly Pathogenic Avian Influenza (HPAI) is devastating in that it is highly contagious with no treatment available. It can be spread widely in migratory waterfowl such as where
it can exist in an asymptomatic carrier state. Two of the four major migratory pathways pass through Ohio which increases our risk of outbreaks.
The HPAI outbreak of 2022-2025 has nationally affected over 174,800,000 birds, been detected in 1,708 flocks, all 50 states and one territory. In Ohio during this time period, we have had 25,362,776 birds affected from 78 commercial and 14 backyard flocks.


go.osu.edu/APHIS-HPAI-Data
The key to preventing outbreaks in both backyard poultry and the poultry industry is biosecurity. Biosecurity is the strategy of prioritizing the health by preventing disease from entering the flock or herd. It comes in two main forms, direct biosecurity, and indirect biosecurity.
Direct poultry biosecurity:
Preventing disease transmission from bird to bird. Make sure that your flock cannot encounter wild birds by fencing, bird netting or other exclusion.
Indirect poultry biosecurity:
Make sure to limit or exclude visitors to your flock whenever possible. Make sure to use proper sanitation procedures as well as include the use of personal protective equipment.


Map reflects 136,327,394 outbreaks since 2022 and as of January 23, 2025. Source: newsweek.com/bird-flu-map-update-poultry-cdc-usda-2020528
If you have sick or dead poultry, call and ask for the sick bird coordinator:
• Backyard/hobby flocks, call Ohio Department of Agriculture (ODA) 614-728-6220 or afterhours at 888-456-3405
• Commercial poultry flocks, contact Ohio Poultry Association (OPA) 614-882-6111
For sick or dead wild birds, call 800-WILDLIFE (945-3543):
Includes:
• Any raptor (such as bald eagle)
• Multiple waterfowl such as geese or ducks
• Any other large congregation of sick or dead birds
For more information on HPAI and biosecurity to keep your flocks safe head to go.osu.edu/HPAI
For inquiries about this project:
Timothy S. McDermott, DVM Extension Educator, Franklin County mcdermott.15@osu.edu (614)-292-7916


Aspen Adams-Trisket
Barnes Farms Genetics
Bill Griffith
BR and J farms
Brady Hicks
Buckeye Nutrition
Camille Knapke
CFAES Wooster Small Ruminant Research Center
Chris Clark
Cliff Riehm
Culley Emerson
Dalton Huhn
Dan Erwin, JET Tunis
David Wikander
Dr. Amanda Bowling, The Ohio State University
Dr. Katelyn Kaufman, Morehead State University
Dr. Lyda Garcia, The Ohio State University
Dr. Masa Williams, Purina Land O’Lakes
Dr. Robert Coleman, University of Kentucky
Dr. Steffanie Burk, Otterbein University
Edwin Pickenpaugh
Erin Cavinee
Ethan Scheffler
Farm Service Agency, Morgan/Muskingum Counties
Gregg Fogle
Hemendra Kumar, University of Maryland
Janet McCormick
Jeremy Howard
Kevin Stottsberry
Kevin Vanfossen
Kubota Tractor Corporation
Leeds Farms
Morgan County SWCD
Ohio Sheep and Wool Program
Ohio State ATI Equine Center and Staff
Ohio State ATI’s Research, Creative & Other Scholarly Activities (RCOSA) Funding
Oriana Tillery-Sucre
OSU Eastern Agriculture Research Station
OSU Jackson Agriculture Research Station
OSU North Central Agriculture Research Station
OSU Northwest Agriculture Research Station
OSU Paul Lab
OSU Research Internship Program (ORIP) Program
OSU Western Agriculture Research Station Staff
Parkash Singh
Rachel Bell
Rick Whiting, BWB Farm
Roger Shearer
Ruben Mendoza
Sarah Moser
Savion Energy
Scott Payne
Simplot Animal Sciences
U.S. Department of Energy Funding Award
USDA NIFA Crop Protection and Pest Management Program Grant
USDA NIFA Inter-Disciplinary Engagement in Animal Systems (IDEAS) Grant Program
USDA NIFA Agriculture and Food Research Initiative (Grant 2022-68015-36628)


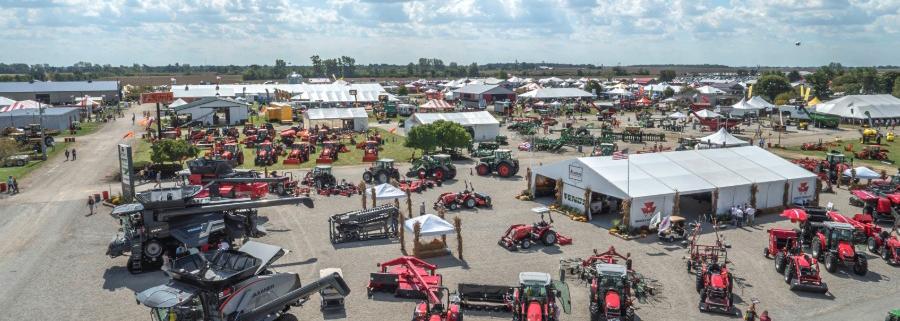
September 22-24, 2026
September 21-23, 2027
September 19-21, 2028
September 18-20, 2029
September 17-19, 2030
95% CI – Confidence Interval, range of values that can be certain to contain the true mean of a population
Ad Libitium – A feeding management in which animals are fed without any restrictions
ADF – Acid Detergent Fiber, least digestible plant compounds, including lignin and cellulose
ADFI – Average Daily Feed Intake, amount of feed (As Fed) consumed per animal, per day
ADG – Average Daily Gain, weight gained per animal, per day
Bob Veal – Veal calves marketed up to three weeks of age
BW – Body Weight
CP – Crude Protein, measures nitrogen content of feedstuffs, including true protein and non-protein nitrogen
DCAD – Dietary Cation Anion Difference, measurement used when formulating diets for dry or lactating cows using positively and negatively charged minerals on animal performance
DDG – Dried Distillers’ Grain with Soluble, co-product of ethanol production and often used as a protein source in a diet
DIM – Days In Milk, number of days a dairy cow has been lactating
DM – Dry Matter, fiber and nutrients remaining once water is removed from a feedstuff or diet
DMI – Dry Matter Intake, amount of dry matter consumed per animal, per day
DON – Deoxynivalenol, Vomitoxin, a common mycotoxin found in grain
Dressing Percent – (Hot Carcass Weight divided by Live Weight) x 100
GDD – Growing Degree Days, heat units used to estimate growth and development of crop and pests during the growing season
FAMACHA © – Selective treatment method for controlling the level of parasitic barber ’s pole worm in small ruminants
FEC – Fecal Egg Count, quantitative assessment of how many parasite eggs an animal is shedding at a particular time
Feekes Growth Stages
10.0 – Grass Forage at Boot Stage, 10.5 – Grass Forage at Heading
FTPI – Failed Transfer of Passive Immunity, when a calf fails to absorb adequate immunoglobulins via colostrum
Gain : Feed – Measure of Feed Efficiency, ratio of total pounds gained to total pounds of feed fed

Hot Carcass Weight – Carcass Weight prior to chilling
Hypoglycemic – Low Blood Sugar
K2O – Potassium fertilizer form, Potash


Laparoscopic Artificial Insemination – Intrauterine method of insemination used in small ruminants
Mycotoxin – Toxin produced by certain molds or fungi in grains
N – Nitrogen
NDF – Neutral Detergent Fiber, structural components of plants, specifically the cell wall and predicts voluntary intake because it provides bulk or fill
NDF48 – Measure of how much of the forage's NDF can be digested in 48-hours
NEL – Net Energy Lactation, amount of energy in a feedstuff that is available for milk production and body maintenance
NIR – Near Infrared Reflectance, measures light energy reflected by the feed sample to determine the chemical composition of forages
OC% – Percent of Organic Carbon
OM% – Percent Organic Matter
P205 – Phosphorus fertilizer form
Passive Immunity – Immunity acquired via colostrum intake shortly after birth
PCV – Packed Cell Volume, a measurement of the proportion of blood that is made up of cells
RFID – Radio Frequency Identification, method used to track livestock
SEM – Standard Error of the Mean, indicates how different the population mean is likely to be from a sample mean
TDN – Total Digestible Nutrients, sum of digestible proteins, fiber, lipids, and carbohydrates in feedstuff
TKN – Total Kjeldahl Nitrogen, total concentration of nitrogen and ammonia
TMR – Total Mixed Ration, method of feeding that combines feeds to a specific nutrient content
Vomitoxin – a mycotoxin that commonly infects corn and other grains
Wet Chemistry – Chemistry based analytical methods used to measure chemical compounds in plant material
“connecting science to farmers”

eBarns is an Ohio State program dedicated to advancing production agriculture through the use of field-scale research. eBarns utilizes modern technologies and information to conduct on-farm studies with an educational and demonstration component used to help farmers and their advisors understand how new practices and techniques can improve farm efficiency and profitability. The program is dedicated to delivering timely and relevant, data-driven, actionable information to farmers throughout Ohio.