Aquaculture
journal homepage: www.elsevier.com/locate/aquaculture
Genome-wide identification and evolution of interleukins and their potential roles in response to GCRV and Aeromonas hydrophila challenge in grass carp (Ctenopharyngodon idella)
Tianbing Xu a, b, c , Zhensheng Wang a , Yang Gao a , Jianguo Su a, b, c, *
a Department of Aquatic Animal Medicine, College of Fisheries, Huazhong Agricultural University, Wuhan 430070, China
b Laboratory for Marine Biology and Biotechnology, Pilot National Laboratory for Marine Science and Technology, Qingdao 266237, China
c Engineering Research Center of Green development for Conventional Aquatic Biological Industry in the Yangtze River Economic Belt, Ministry of Education, Wuhan 430070, China
ARTICLE INFO
Keywords:
Grass carp (Ctenopharyngodon idella)
Interleukins
Evolution
Grass carp reovirus
Aeromonas hydrophila
ABSTRACT
Interleukins (ILs) play important roles in transmitting information, mediating proliferation and differentiation of immune cells, and regulating immune responses. However, due to the large variety, number, and complexity of IL genes, complete and systematic studies on ILs remain largely unknown. In the present study, we identified and characterized 39 IL genes in grass carp (Ctenopharyngodon idella) based on genomic and transcriptomic datasets. These IL genes were classified into six gene families and others. Gene structures, conserved domains, and motif analyses indicated that ILs in the same gene family were more conserved. Collinearity analysis showed that the segmental duplication events played a critical role in the expansion of IL gene families during evolution. RNA-seq data from different healthy tissues showed that many IL genes were widely expressed in various tissues. Based on RNA-seq data, we further analyzed the expression profiles of IL genes in tissues post grass carp reovirus (GCRV) or Aeromonas hydrophila challenge, and the results showed that the expressions of some genes were significantly upregulated or downregulated post-challenge. Finally, qRT-PCR verified mRNA expressions of the representative IL genes post GCRV or A. hydrophila challenge. Taken together, these studies provide a theoretical basis for a comprehensive understanding of ILs and further functional investigation.
1. Introduction
Cytokines are biologically active modulatory proteins or glycoproteins secreted by a variety of cell types that bind their respective receptors in response to various stimuli, leading to the activation of second messengers and signal transduction pathways (Smith and Humphries, 2009). Moreover, the cytokine network is a highly regulated system, and upon removal of the stimulus, cytokine secretion returns to basal levels to prevent excessive cytokine signaling that may dysregulate the normal development and function of the immune system (Ilangumaran et al., 2004). Cytokines play an important role in immune regulation, cell proliferation, and repair of damaged tissues (Ouyang and O’Garra, 2019). More than 200 cytokines have been identified to date, including interleukins (ILs), hematopoietic growth factors (HGFs), interferons (IFNs), tumor necrosis factors (TNFs), and nerve growth factors (NGFs), among others (Kany et al., 2019). ILs, as are important members of
cytokines, are proteins produced by a variety of cell types such as T lymphocytes, B lymphocytes, macrophages, etc., and play an important role in physiological inflammation and immune processes (Wang et al., 2020).
The term IL first appeared in 1979 at the Second International Conference on Lymphokines in Interlaken, Switzerland, where the cytokines that interact between leukocytes during the immune response were unified under the name ILs (Catalan-Dibene et al., 2018). Although ILs are now known to be produced by various cell types, the original name is still used today. The nomenclature is also relatively simple, with the first discovered being IL-1, the second IL-2, etc. (Secombes et al., 2011). Subsequently, the newly identified ILs are named sequentially, with Arabic numerals number after the name to indicate the difference. Since the initial discoveries of IL-1 and IL-2, more than 60 cytokines have been designated as ILs (Akdis et al., 2016). However, although they are extremely important molecules in immunology, their numbers have
* Corresponding author at: Department of Aquatic Animal Medicine, College of Fisheries, Huazhong Agricultural University, Wuhan 430070, China.
E-mail address: sujianguo@mail.hzau.edu.cn (J. Su).
https://doi.org/10.1016/j.aquaculture.2022.738266
Received 22 January 2022; Received in revised form 3 April 2022; Accepted 14 April 2022
Availableonline19April2022
0044-8486/©2022ElsevierB.V.Allrightsreserved.
made it difficult for immunologists to keep pace with the discovery and characterization of these cytokines (Catalan-Dibene et al., 2018).
Interleukins can be classified into the following families based on gene location, amino acid sequence, protein secondary structure, and similarity or functional properties of the corresponding receptors (Akdis et al., 2016). IL-1 family (IL-1α, IL-1β, IL-1Ra, IL-18, IL-36Ra, IL-36α, IL37, IL-36β, IL-36γ, IL-38, and IL-33) (Dao et al., 1996; Rivers-Auty et al., 2018; Schmitz et al., 2005), IL-2 family (IL-2, IL-4, IL-7, IL-9, IL-15, and IL-21) (Leonard et al., 2019), IL-6 family (IL-6, IL-11, IL-31, OSM, LIF, CT-1, CNTF, and CLCF1) (Murakami et al., 2019), IL-10 family (IL-10, IL-19, IL-20, IL-22, IL-24, IL-26, IL-28A, IL-28B, and IL-29) (Commins et al., 2008), IL-12 family (IL-12, IL-23, IL-27, IL-35, and IL-39) (Catalan-Dibene et al., 2018; Tait Wojno et al., 2019; Wang et al., 2016), IL-17 family (IL-17A, IL-17B, IL-17C, IL-17D, IL-17E/IL-25, and IL-17F) (McGeachy et al., 2019), and other IL members (IL-3, IL-5, IL-8, IL-13, IL-14, IL-16, IL-30/IL-27p28, IL-32, IL-34, and IL-40) (Akdis et al., 2016; Catalan-Dibene et al., 2018). Among them, IL-28A, IL-28B, and IL29 are more commonly classified as type III IFNs and are referred to as IFN-λ2, IFN-λ3, and IFN-λ1, respectively (Ouyang and O’Garra, 2019). The IL-12 family members are heterodimers consisting of an α-chain (p19, p28, and p35) and a β-chain (p40 and EBI3). The α subunits have a quadruple helix bundle structure and are structurally homologous to the IL-6 family, whereas the β subunits are structurally similar to the α receptors of IL-6 (Wang and Husain, 2014). Thus, the IL-6 and IL-12 families are structurally related, forming the IL-6/12 superfamily (Garbers et al., 2012).
In the past years, many IL genes have been identified and characterized in grass carp, for example, IL-2, IL-4/13B, IL-21, and IL-34, among others (Lv et al., 2020; Xue et al., 2019; Yang et al., 2016b; Zhang et al., 2020). Several studies have shown that IL genes in grass carp played different roles in different tissues. The expressions of IL genes in grass carp can be induced by various stimuli, such as bacteria and viruses, which further indicated the important role of ILs in immunity. For example, almost all six IL-17 family members (IL-17A/F1, IL-17A/F, IL-17A/F3, IL-17C, IL-17D, and IL-17N) in grass carp were expressed at relatively low levels in head-kidney, tail fin, spleen, trunkkidney, and intestine, while expression levels were generally higher in blood, skin, liver, and muscle. In addition, these genes showed different tissue expression patterns in fish at 24 h after intraperitoneal injection or anal intubation of A. hydrophila, suggesting a role in the inflammatory responses (Sun et al., 2020a). Grass carp IL-34 was constitutively expressed in tissues, with the highest expression in spleen. And the expression was upregulated in spleen after infection with Flavobacterium columnare or GCRV II (Xue et al., 2019). Although some IL genes have been described in grass carp, there are still many ILs that remain unknown.
Grass carp (C. idella) is considered to be one of the most economically important freshwater farmed fish in China, with an annual global production of more than 4.5 million tons, making it the most consumed freshwater fish in the world (Yang et al., 2016a). However, diseases caused by A. hydrophila or GCRV have caused serious losses to the aquaculture industry (Chen et al., 2021; Liu et al., 2015). Therefore, the study of immune genes and immune mechanisms in grass carp is important for the prevention and treatment of various diseases. In recent years, with the publication of genomic data and the continuous development of the application of bioinformatics tools, many possibilities have been offered to explore the gene family of grass carp. In this study, we have systematically investigated the IL genes of grass carp intending to provide theoretical research data and information on the evolution and gene function of the family and provide better theoretical data and references for various problems encountered in the fish farming industry.
2. Materials and methods
2.1.
Genome-wide identification and sequence analysis of ILs
The genome assemblies, coding sequences (CDS), protein sequences, and general feature format files (GFF3) were downloaded from the grass carp database (http://bioinfo.ihb.ac.cn/gcgd) (Chen et al., 2017). The existing IL proteins of human (Homo sapiens), house mouse (Mus musculus), zebrafish (Danio rerio), rainbow trout (Oncorhynchus mykiss), and Atlantic salmon (Salmo salar) downloaded from the NCBI database (https://www.ncbi.nlm.nih.gov) were used as query objects, and the BLASTP alignments were performed in grass carp protein sequences and the transcriptome (Wan and Su, 2015) to search for homologous IL proteins with e-value ≤1e-5, and the GenBank accession numbers of the downloaded proteins were detailed in Table S3. Furthermore, the Hidden Markov Model (HMM) files of ILs were also used to identify all possible IL sequences with HMMER software (HMMER Web version 3.0, http://hmmer.org/) (Finn et al., 2011). The SMART (http://smart. embl-heidelberg.de/) (Letunic et al., 2021) and CDD (http://www. ncbi.nlm.nih.gov/cdd) (Marchler-Bauer et al., 2015) databases were used to identify the integrity of IL domains in candidate genes. Finally, these newly identified sequences were deposited to the GenBank database in Table 1
The biophysical characteristics of the potential ILs in grass carp were further analyzed, such as amino acid number, molecular weight (MW), and isoelectric point (pI) using ExPASy ProtParam tool (http://web.exp asy.org/protparam/) (Gasteiger et al., 2003). Subsequently, the IL protein sequences were analyzed for the presence of signal peptides using SignalP (http://www.cbs.dtu.dk/services/SignalP/) (Almagro Armenteros et al., 2019) and Phobius (https://phobius.sbc.su.se/) (Kall et al., 2007) programs; the IL protein sequences were analyzed for the presence of transmembrane helices using TMHMM-2.0 (http://www.cbs.dtu .dk/services/TMHMM/) (Krogh et al., 2001) and Phobius programs, and the BUSCA (http://busca.biocomp.unibo.it) (Savojardo et al., 2018) and CELLO (http://cello.life.nctu.edu.tw/) (Yu et al., 2006) programs were also used to predict the subcellular localization of IL protein sequences.
2.2. Phylogenetic analysis
The full-length amino acid sequences of IL proteins from the NCBI database were used for phylogenetic analysis, which included mammals (human, house mouse, wild yak, and dog), birds (chicken), amphibians (tropical clawed frog), and teleosts (grass carp, zebrafish, rainbow trout, and Atlantic salmon, etc.). The protein sequences of all determined ILs in the above species were used in multiple sequence alignment using the default setting of Clustal X2 (Larkin et al., 2007). The unrooted phylogenetic trees were constructed using MEGA X (Kumar et al., 2018) with Neighbor-Joining (NJ) (Saitou and Nei, 1987) methods: Dayhoff model; pairwise deletion; and 10,000 bootstrap replications. The iTOL (http://it ol.embl.de/help.cgi) (Letunic and Bork, 2021) online tool was used to visualize the phylogenetic tree. The protein sequences used to construct the phylogenetic trees were shown in Table S3.
2.3. Gene structure, conserved domain, and motif analyses
For gene structure analysis, grass carp IL cDNA sequences were aligned with genomic sequences to determine intron/exon distribution patterns and displayed graphically using the Gene Structure Display Server 2.0 (GSDS 2.0) (http://gsds.cbi.pku.edu.cn/) (Hu et al., 2015). The CDD online tool was used to search for conserved domains. To identify the conserved motifs presented in the IL proteins, all the grass carp IL proteins were submitted to an online motif identification tool MEME (Multiple Expectation Maximization for Motif Elicitation, htt p://memesuite.org/tools/meme) (Bailey et al., 2009). The parameters of the motif search were as follows: any number of repetitions; minimum and maximum motif widths were changed to 6 and 200, respectively,
Table 1
Sequence characteristics of H. sapiens and C. idella interleukin members.
Note: aa, amino acids; MW, molecular weight; Da, Dalton;
“ -” indicated that the gene did not exist at that location. * indicated the sequence was deposited in GenBank by ourselves.
and at least 5 motif sites. The results of MEME were displayed using TBtool software (Chen et al., 2020).
2.4. Chromosomal locations and protein-protein interaction (PPI) networks Considering
the “draft” stage, we selected grass carp scaffolds and linkage groups (LGs) to illustrate the chromosomal localization information of IL genes. The LG and scaffold locations of grass carp IL genes were identified by GFF3 and the alignment of cDNA with the whole grass carp genome. Based on the above information, the IL genes were mapped to corresponding locations on the LGs and scaffolds using MG2C v.2 (http://m g2c.iask.in/mg2c_v2.0/) (Chao et al., 2015). Furthermore, to determine the PPI network of ILs in grass carp, the IL protein sequences of grass carp were imported into the online website STRING (https://strin g-db.org/) (Szklarczyk et al., 2019). The protein interaction network was constructed by using zebrafish as the reference sequences to predict the interaction between the homologous proteins of the grass carp ILs in zebrafish. The minimum required interaction score was set as 0.7.
2.5. Gene collinearity and Ka/Ks analyses
Syntenic blocks of tandem duplications and segmental duplications of IL genes within the genomes of C. idella (Wang et al., 2015), D. rerio (Howe et al., 2013), and Onychostoma macrolepis (Sun et al., 2020b), and between the genomes of C. idella and D. rerio, C. idella and O. macrolepis were obtained by using Multiple Collinearity Scan toolkit (MCScanX, http://chibba.pgml.uga.edu/mcscan2/) (Wang et al., 2012) and visualized using Dual Systeny Plotter software (TBtools, https://github. com/CJ-Chen/TBtools) (Chen et al., 2020). To further estimate duplication events of IL genes, the rates of synonymous (Ks), non-synonymous (Ka) substitutions, and their ratios of each duplicated IL gene were calculated by the KaKs_Calculator 2.0 program (Wang et al., 2010a). Positive and purifying selections were justified as a Ka/Ks ratio > 1 and the Ka/Ks ratio < 1, respectively, while a ratio of 1 indicated neutral selection (Hurst, 2002).
2.6. Transcriptome data analysis of the expression profiles of IL genes
To explore the tissue distribution of grass carp IL genes in eleven healthy tissues (brain, muscle, liver, intestine, blood, head-kidney, kidney, skin, gill, spleen, and heart) (Xu et al., 2019), the RNA-Seq datasets (Accession No. PRJNA510861) were downloaded from the NCBI Sequence Read Archive (SRA) (https://www.ncbi.nlm.nih. gov/sra/). To explore the expression patterns of grass carp IL genes in different tissues (gill, intestine, hepatopancreas, and spleen) (Shi et al., 2014) post GCRV challenge or cells (pre-sorting CIK cells: C1, resistant (to GCRV challenge) pool: R2, and susceptible (to GCRV challenge) pool: S3) (Shang et al., 2017), the RNA-Seq datasets (Accession No. PRJNA229923 and Accession No. PRJNA344676) were downloaded from the SRA. Furthermore, to analyze the expression profiles of grass carp IL genes in spleen post A. hydrophila challenge (Dang et al., 2016), the RNA-Seq datasets (Accession No. PRJNA288831) were downloaded from the SRA.
The above-downloaded transcriptome libraries were quality controlled using fastp (Chen et al., 2018) software, after which all highquality transcriptome libraries were individually mapped to the grass carp genome using the default parameters of HISAT2 (Kim et al., 2019) software. Normalized TPM (transcripts per million) values were obtained using the featureCounts (Liao et al., 2014) program. The results were log2(TPM + 1) transformed and heatmaps were generated using TBtools software. Details of the specific TPM values were shown in Table S5.
2.7. Materials and treatments
In this study, the animal experiments were approved by Institutional Animal Care and Use Committee (IACUC) of Huazhong Agricultural University (HZAU). Laboratory animal license number: HZAUFI-20210002. Healthy grass carp weighing approximately 20 g were acquired from the Xingfu Farm (Huanggang, China) and acclimatized in a recirculating aquaculture system at 25–26 ◦ C for two weeks before
experimental manipulation. The A. hydrophila (ATCC 7966) and GCRV 097 strain were from our laboratory stock.
In this experiment, healthy grass carp were divided into three groups: the control group, the bacterial group (A. hydrophila challenge, 1.0 × 10⁶ CFU), and the viral group (GCRV challenge, 1.0 × 10⁴ TCID50). Each group contained 150 fish and three replicate experiments were performed (50 × 3). After challenge, we collected visceral organs (intestine, head-kidney, hepatopancreas, and spleen) at the corresponding examination points (0, 4, 24, 72, and 120 h) according to the grouping. Three biological replicates were performed for each group.
2.8. RNA isolation and quantitative real-time RT-PCR (qRT-PCR)
The visceral organs were dissected from grass carp, and total RNA was extracted by TRIzol reagent (Aidlab, Beijing, China) immediately. The 260 nm and 280 nm absorbance ratios of total RNA were measured using the NanoDrop 2000 spectrophotometer (Thermo Scientific, Waltham, USA). Meanwhile, the integrities of mRNAs were tested by electrophoresis in the 2% agarose gel (Wang et al., 2022). The cDNA was synthesized using the HiScript® II Q RT SuperMix for qPCR (+gDNA wiper) (R223-01, Vazyme Biotech Co., ltd, Nanjing, China) according to the instruction. All the cDNA samples were adjusted to a concentration of 50 ng/ml and stored at 80 ◦ C before the qRT-PCR assays.
The qRT-PCR was performed using the AceQ® qPCR SYBR Green Master Mix (Q111–02, Vazyme Biotech Co., ltd, Nanjing, China) on a Roche LightCycle® 480 System (Roche, Basel, Switzerland) according to the instruction. The qRT-PCR mixture contained 4 μl of cDNA sample, 3.1 μl of nuclease-free water, 7.5 μl of 2 × AceQ® qPCR SYBR Green Master Mix, and 0.2 μl of each gene-specific primer. Conditions for amplification were 3 min at 95 ◦ C followed by 40 cycles of 15 s at 95 ◦ C (denaturation), 15 s at 60 ◦ C (annealing), and 20 s at 72 ◦ C (extension). Relative mRNA expression levels were calculated by the 2-ΔΔCT method using 18S rRNA as the housekeeping gene (Su et al., 2011). All experimentations were performed in triplicate. The primers were listed in Table 2.
2.9. Statistic analysis
The results were presented as means ± standard deviation (SD). The statistical analyses were performed by the two-tailed unpaired nonparametric Mann-Whitney U test in vivo experiments. * indicated p ≤ 0.05, ** indicated p ≤ 0.01.
3. Results
3.1. Identification and characterization of IL genes in C. idella
In this study, a total of 39 IL genes were identified in grass carp and their designations were showed Table 1 As shown in Table 1, there were some IL genes in grass carp that were not present in human, such as IL1Ral, IL-15l, IL-11b, CNTFL, and p35b, etc. Of course, there were also some IL genes present in human that were not present in grass carp. The amino acid residue length of IL proteins in grass carp ranged from 98 (IL8) to 907 (IL-16); the pI ranged from 5.02 (IL-1Ra) to 10.42 (p28), and the MW ranged from 10,952.09 (IL-8) to 97,942.04 (IL-16) Da. In addition, we performed subcellular localization predictions for these ILs, which showed that most IL proteins were localized extracellularly, with only a small fraction located in the nucleus (IL-1β, CNTF, and CNTFL) and cytoplasm (IL-1Ra, IL-1Ral, IL-14, and IL-16). Signal peptide prediction analysis showed that most of the ILs had signal peptides; transmembrane helix prediction analysis showed that none of the IL members had transmembrane helices except IL-15l, which had a transmembrane helix. The details were shown in Table S1.
Table 2
Primers used for qRT-PCR.
Gene
′
IL-1β IL-1β-F AAGTTCCCGCTTTGGAGAGTA 127 KX094935
IL-6
IL-7
IL-8
IL-15l
IL-1β-R GCCACATACCAGTCGTTCAGT
IL-6-F CTCAACCCTGGTCAACGACA
IL-6-R GCATCCATGCGGATTTGACC
IL-7-F GCCACAATAAAACTCAAATCATCG
IL-7-R CTGACATTTCTTATTGTGCAGTTTG
IL-8-F CCCTACTGCTCCCTGGGTTA
IL-8-R CCAAGCAGAATGGTGCAGGT
IL-15l-F CAAGTGTCAATCAATGTGCAGC
IL-15l-R TGGTGTGTACAGCAAGCAATC
M17 M17-F ATACGAACAAAAAGACGGCAGC
M17-R TCTGGAACATTGTCCATTTGCAT
18S rRNA 18F99 ATTTCCGACACGGAGAGG
KC535507
MZ337860
JN255694
MZ337861
MZ337863
EU047719 18R100 CATGGGTTTAGGATACGCTC
3.2. Phylogenetic analysis and classification of IL genes
To better reveal the family classification of ILs, we first constructed phylogenetic trees of all interleukins in human, mouse, and some teleosts (Fig. S1) and phylogenetic trees of all interleukin members in grass carp (Fig. S2), and secondly, we constructed phylogenetic trees of the IL1 family (Fig. 1A), IL-2 family (Fig. 1B), IL-6 family (Fig. 1C), IL-10 family (Fig. 1D), IL-12 family (Fig. 1E), IL-17 family (Fig. 1F), and other IL members (Fig. S3). However, there were significant differences between grass carp and other fishes or mammalian lineages relative to the phylogenetic trees.
3.2.1. Phylogenetic analysis of IL-1 family
The phylogenetic tree of the IL-1 family showed (Fig. 1A) that the IL1 family proteins were mainly divided into eleven groups, namely IL-1α, IL-1β, IL-1Ra, IL-18, IL-36Ra, IL-36α, IL-37, IL-36β, IL-36γ, IL-38, and IL33 groups. The IL-Ra and IL-1β groups had the most members with nine, and the IL-37 group had the least with only one member, HsIL-37. Most groups had only two genes, for human and mouse IL genes. Interestingly, we found that some fish also had IL-18 genes. Notably, a copy of IL-1Ra, IL-1Ral, was found in grass carp. IL-1Ra was a recently discovered member of the interleukins that was unique to fish. Although the genetic characteristics of IL-1Ra, such as genomic location and sequence homology, differ from those of mammalian IL-1Ra, IL-1Ra did exist in fish as an IL-1β receptor antagonist (Yao et al., 2015). Furthermore, only three members of the IL-1 family were identified in grass carp, namely IL-1β, IL-Ra, and IL-1Ral.
3.2.2. Phylogenetic analysis of IL-2 family
The phylogenetic tree of the IL-2 family showed (Fig. 1B) that the IL2 family proteins were divided into six main groups, namely IL-2, IL-4, IL-7, IL-9, IL-15, and IL-21 groups. The IL-2 group had the largest number of members, 12, and the IL-9 group had the least number of members, only 3, and interestingly, no IL-9 was identified in fish. In addition, grass carp had all members of the IL-2 family except for the absence of IL-9. Notably, grass carp had two copies of both IL-4 and IL15, IL-4/13a and IL-4/13b, and IL-15 and IL-15l, respectively.
3.2.3. Phylogenetic analysis of IL-6 family
The phylogenetic tree of the IL-6 family showed (Fig. 1C) that the IL6 family proteins were divided into nine major groups, namely IL-6, IL11, OSM, M17, LIF, CT-1, CLCF1, CNTF, and IL-31 groups. The IL-11 group had the most members with 14, while the OSM and CT-1 groups had the least members with only 3. The OSM, LIF, and M17 groups were strongly conserved, with M17 being unique to fish. And OSM, LIF, CT-1, and IL-31 genes were not found in fish. In addition, we found two members of both IL-11 and CNTF in grass carp, IL-11a and IL11b, and CNTF and CNTFL, respectively.
3.2.4. Phylogenetic analysis of IL-10 family
The phylogenetic tree of the IL-10 family showed (Fig. 1D) that the IL-10 family proteins were divided into eight major groups, namely IL10, IL-19, IL-20, IL-19l/IL-20l, IL-22, IL-24, IL-26, and IFN-λ groups. The fish IL-19 like or IL-20 like genes whose classification was more confusing were treated as a large subfamily named IL-19l/IL-20l. Notably, the IL-19l/IL-20l in fish was clustered in a large clade containing IL-20, IL-19, and IL-24 of the IL-10 family. While IL-24 and IFNλs genes were not found in fish.
3.2.5. Phylogenetic analysis of IL-12 family
In the present study, the phylogenetic tree of the IL-12 family showed (Fig. 1E) that the IL-12 family members consisting of heterodimeric proteins were divided into five major groups (p19, p28, p35, p40, and EBI3). Among them, mammalian p35 and fish p35 were divided into two branches, and fish p35 was also divided into p35a and p35b. Fish p40 was divided into three branches: p40a, p40b, and p40c. Interestingly, in fish, there was only one copy of p19, p28, p35a, and p40b, except for Atlantic salmon and rainbow trout, which had two copies.
3.2.6. Phylogenetic analysis of IL-17 family
In the present study, the phylogenetic tree of the IL-17 family showed (Fig. 1F) that the members of the IL-17 family were divided into six major groups, namely IL-17A/F, IL-17B, IL-17C, IL-17D, IL-17E, and IL17N. The IL-17A/Fs, IL-17C, IL-17D, and IL-17N of grass carp were grouped corresponding with their teleost counterparts. IL-17A and IL17F clustered into one large branch, of which there were three copies in the IL-17A/F subfamily in fish, namely IL-17A/F1, IL-17A/F2, and IL17A/F3. And the IL-17A/Fs of teleosts were divided into two distinct and separate branches. IL-17A/F2 formed a common branch, while the cluster of IL-17A/F1 was closely grouped with the cluster of IL-17A/F3 in the other branch. IL-17A and IL-17F were neighbors with a high degree of homology, suggesting that they were produced by recent gene duplication events. We found that only some fish (common carp and channel catfish) had the IL-17B gene, and no IL-17E gene was found in fish. Notably, IL-17N was an IL gene-specific to fish, and there were two copies of IL-17C in rainbow trout and torafugu.
3.2.7.
Phylogenetic analysis of other IL members
As shown in Fig. S3A, proteins from grass carp and zebrafish clustered closely on one branch and then aggregated with proteins from many other teleosts to form a fish-specific IL-8 clade, which in turn formed other distinct clades with proteins from birds, mammals, and amphibians. IL-34 had a similar phylogenetic tree to IL-8. As shown in Fig. S3B, proteins from grass carp and zebrafish cluster tightly on one branch and then clustered with proteins from many other teleosts to form a fish-specific IL-14 clade, which in turn formed other distinct clades with mammalian proteins. Interestingly, Atlantic salmon branched out alone. IL-16 had a similar phylogenetic tree to IL-14. The
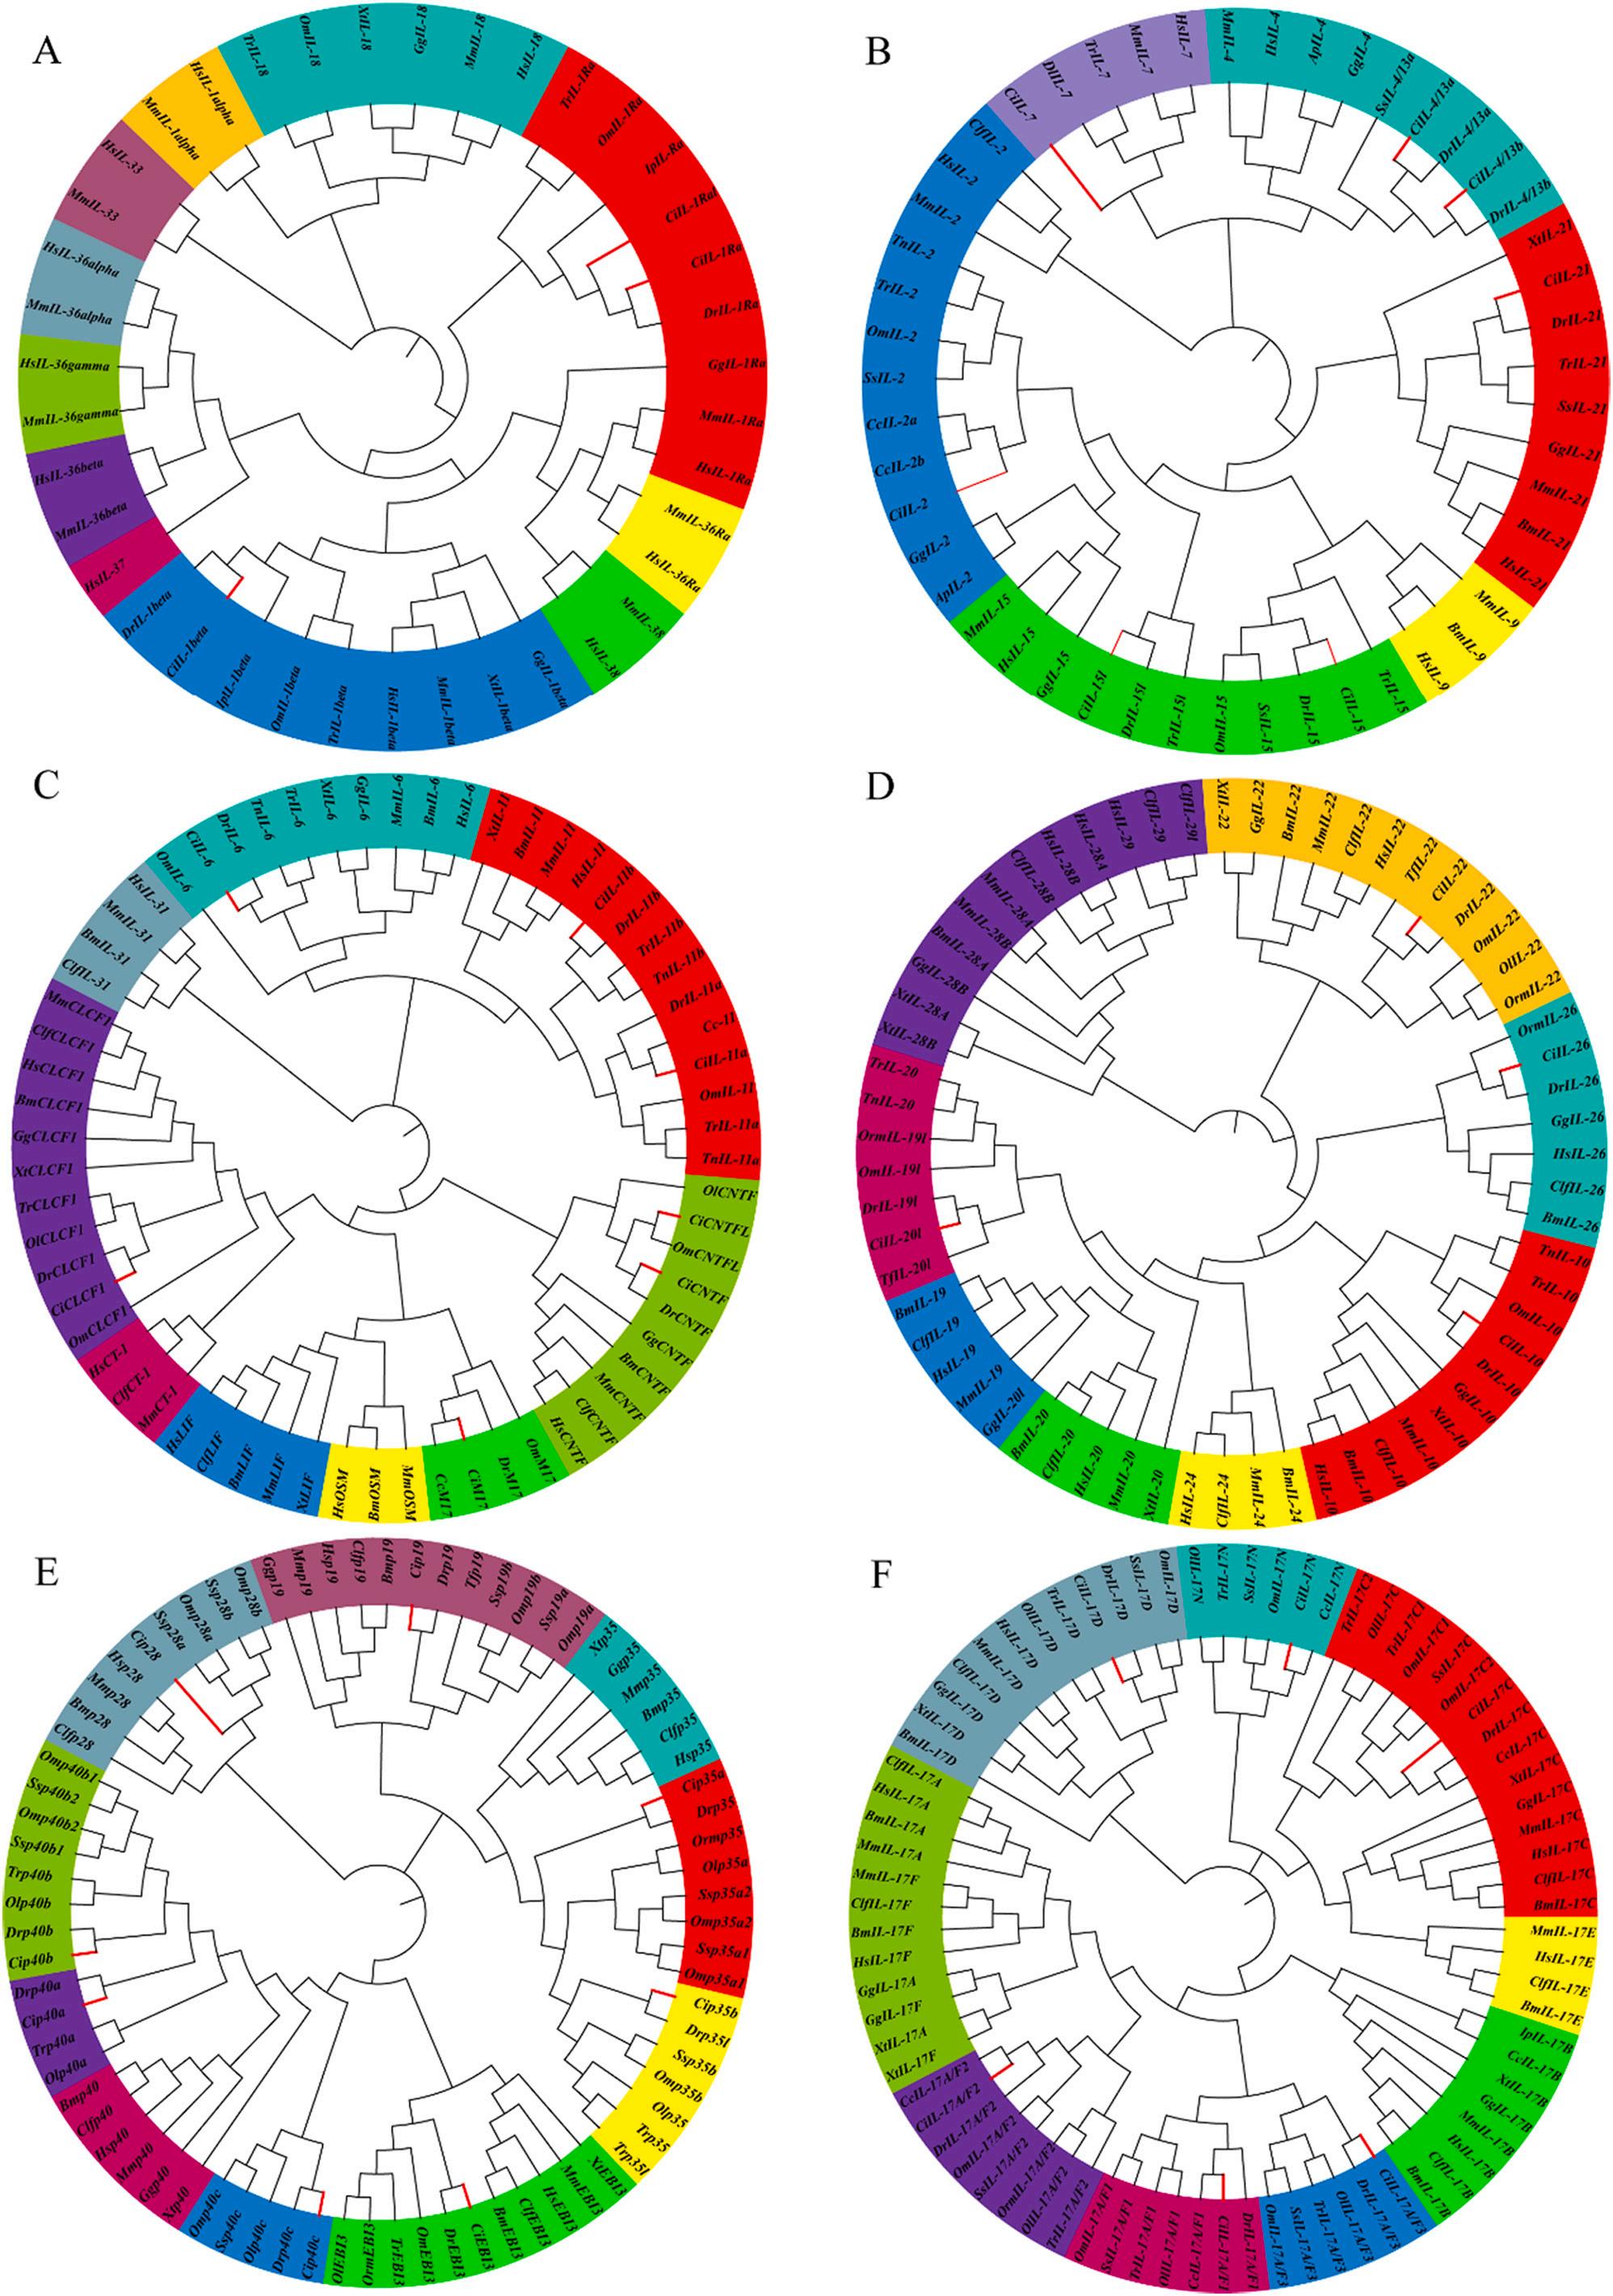
Fig. 1. Phylogenetic relationships of different IL family proteins in C. idella Multiple sequence alignments of IL proteins were performed by MUSCLE, and the phylogenetic trees were constructed by MEGA X by the Neighbor-Joining (NJ) method. The trees were bootstrapped 10,000 times. Different subfamilies were labeled with different colors. Grass carp IL proteins were indicated by red branches. (A)-(F) indicated the phylogenetic trees of IL-1, IL-2, IL-6, IL-10, IL-12, and IL-17 family members, respectively. Supplementary Table S3 provided the accession numbers of the protein sequences used for phylogenetic analysis. Abbreviations: Hs, Homo sapiens; Mm, Mus musculus; Gg, Gallus gallus; Ap, Anas poecilorhyncha; Clf, Canis lupus familiaris; Xt, Xenopus tropicalis; Bm, Bos mutus; Om, Oncorhynchus mykiss; Ol, Oryzias latipes; Orm, Oryzias melastigma; Ss, Salmo salar; Tr, Takifugu rubripes; Tn, Tetraodon nigroviridis; Tf, Tachysurus fulvidraco; Ip, Ictalurus punctatus; Cc, Cyprinus carpio; Dr., Danio rerio; Ci, Ctenopharyngodon idella (For interpretation of the references to colour in this figure legend, the reader is referred to the web version of this article.)
different degrees of differentiation among IL-8, IL-14, IL-16, and IL-34 in mammals, birds, amphibians, and fish might reflect their phylogenetic differences.
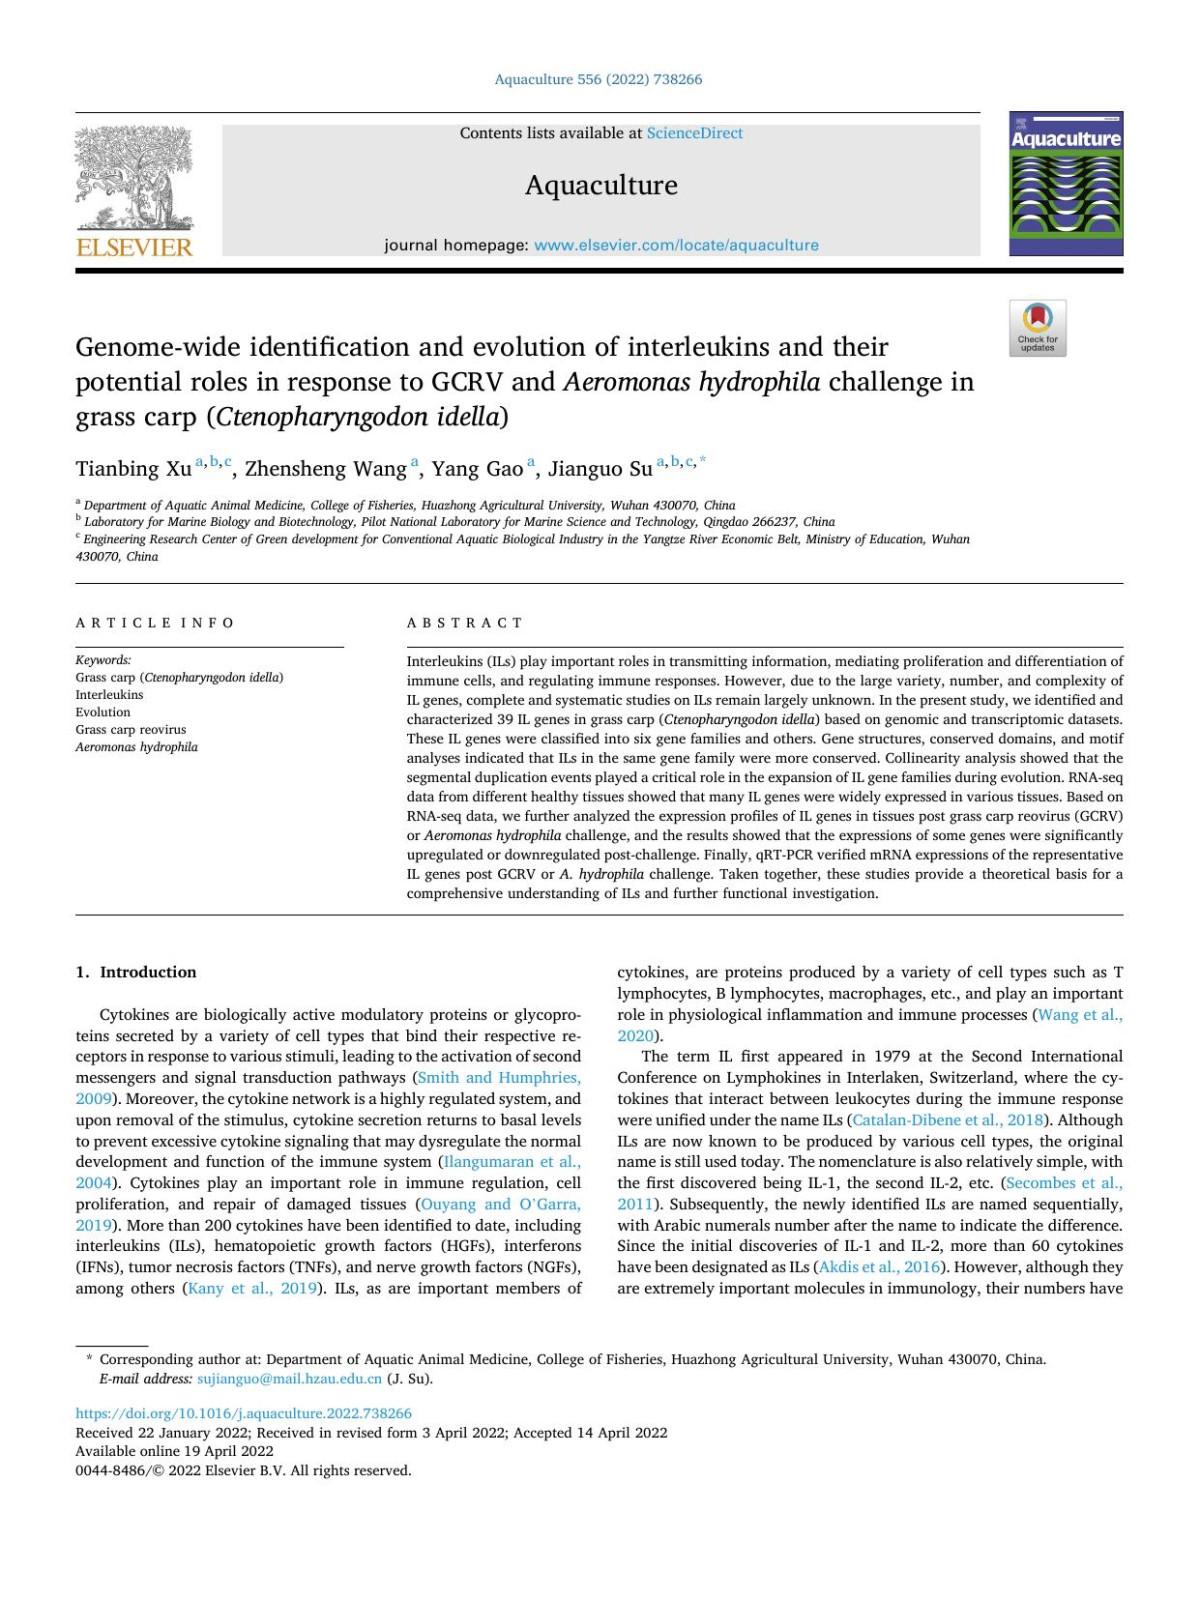
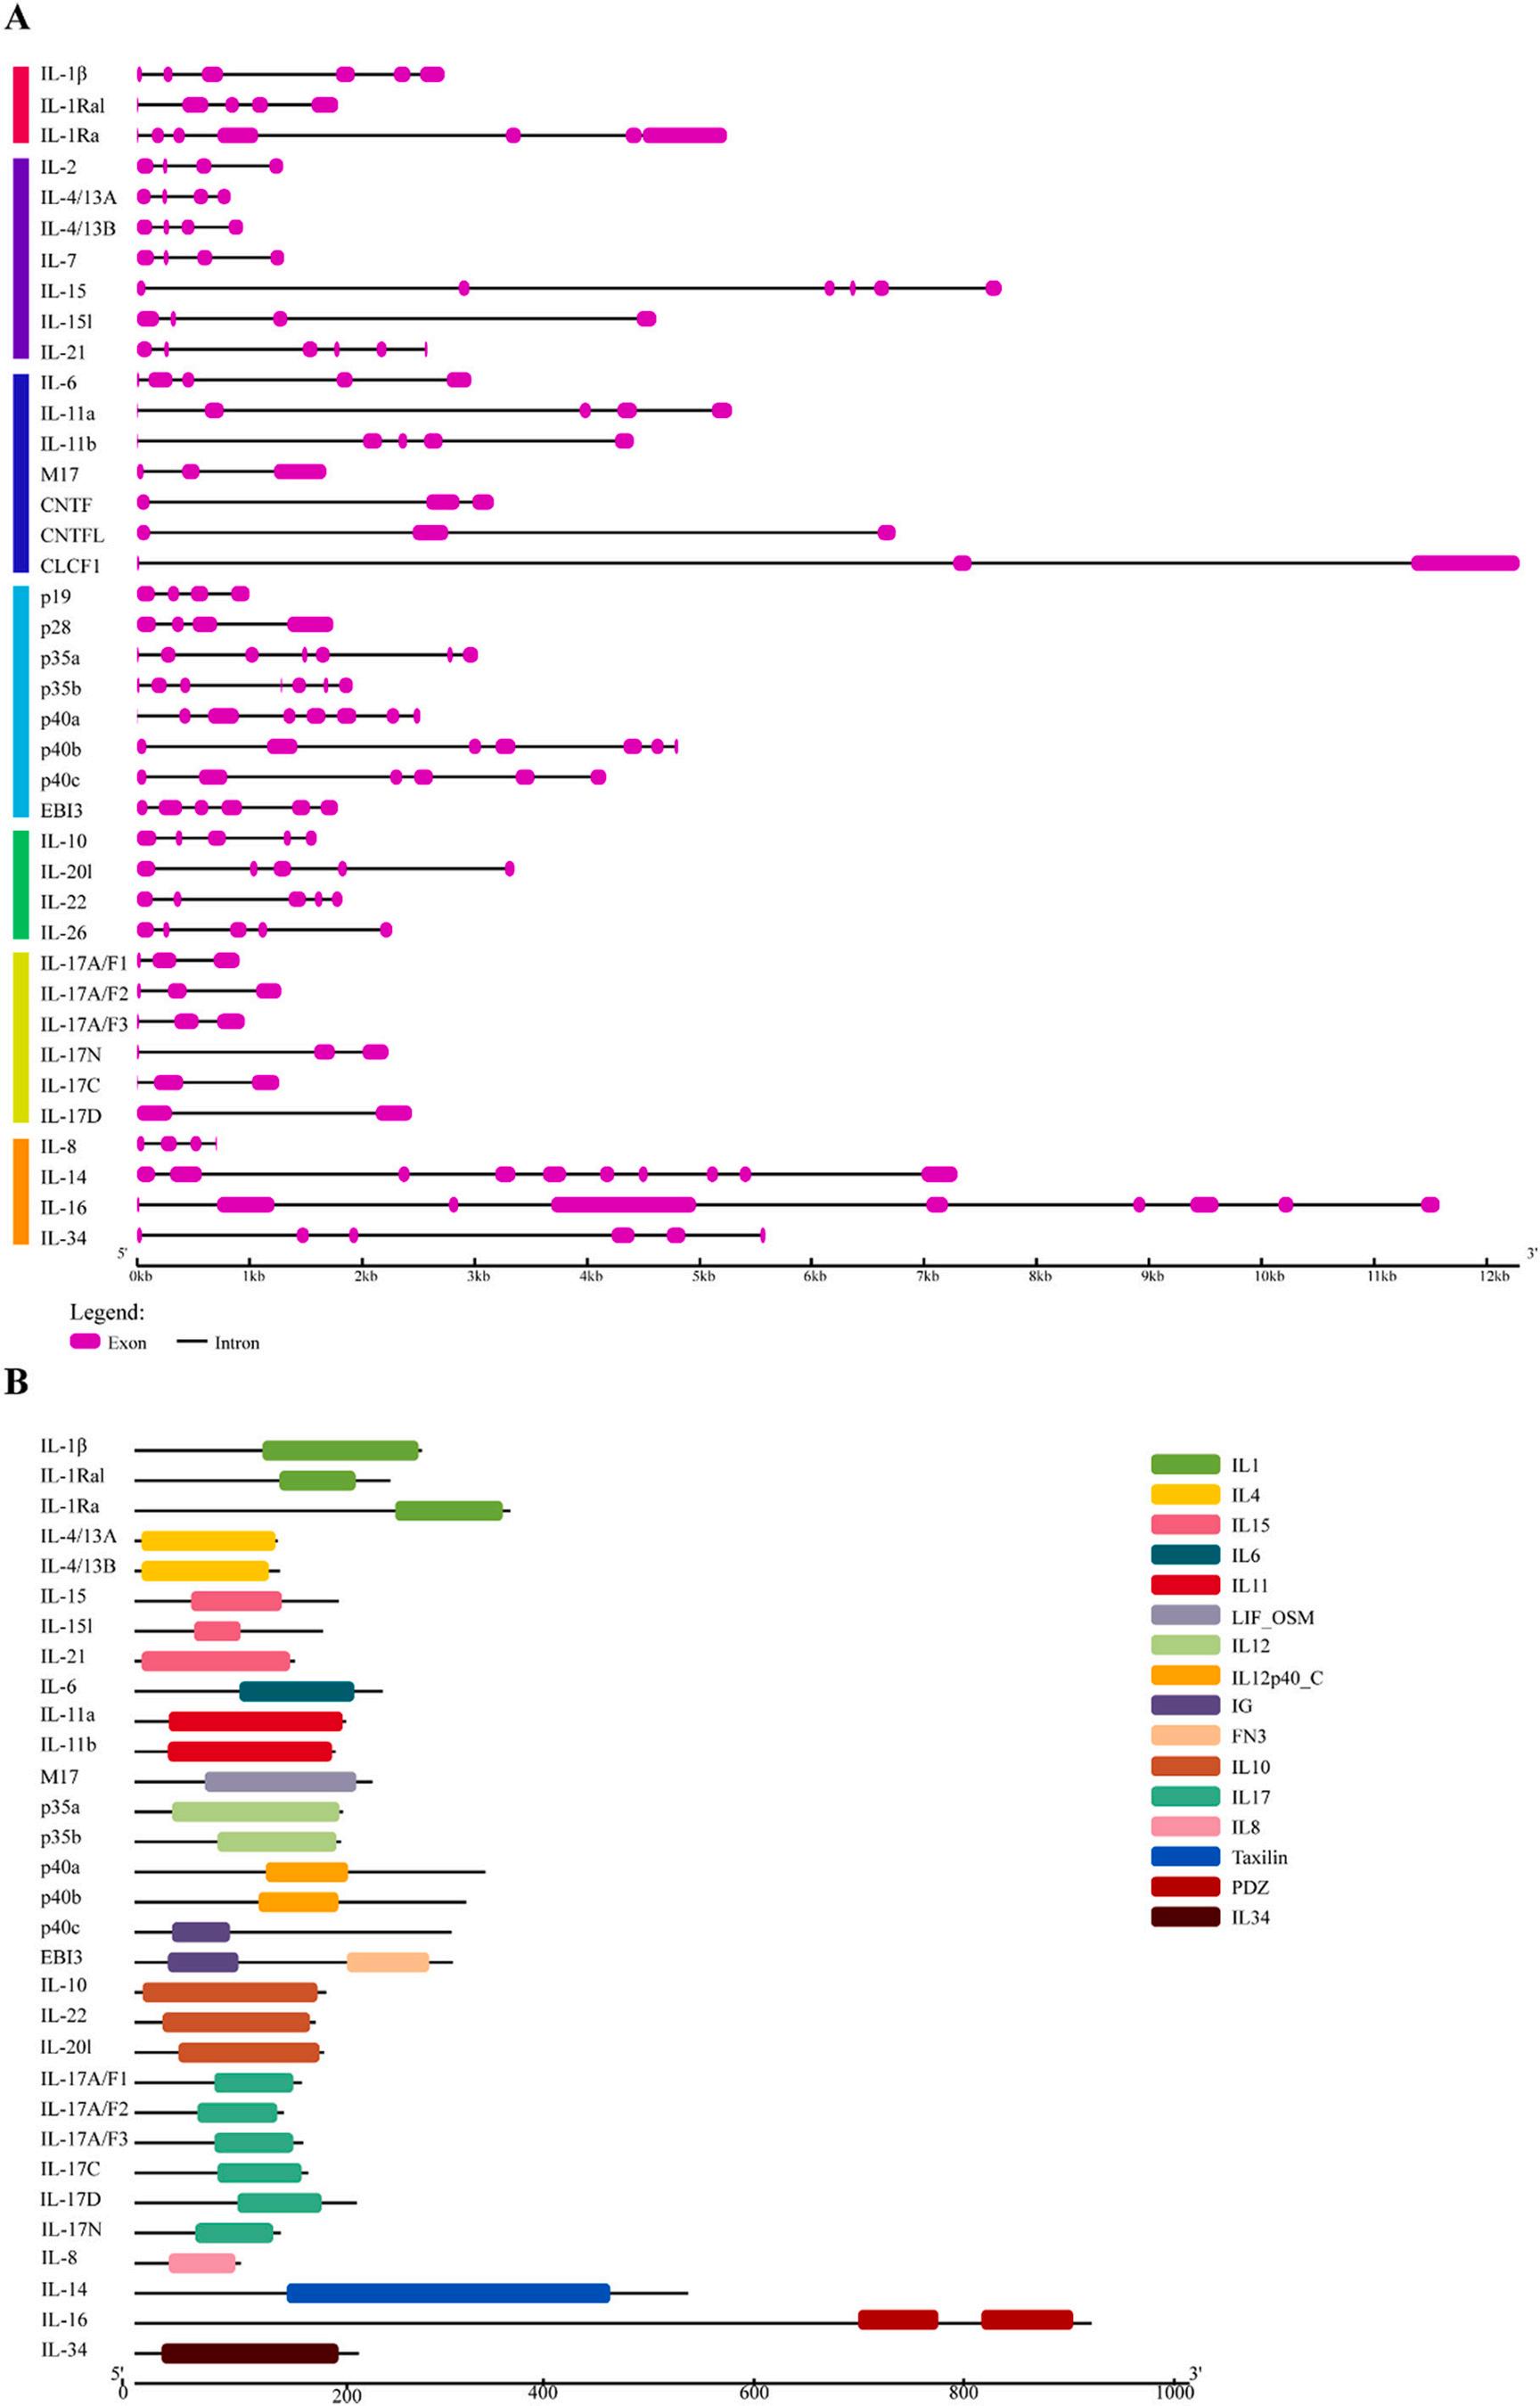
3.3. Gene structure, conserved domain, and motif distribution analyses in C. idella
To better reveal the gene structural components, protein structures, and characteristic regions of ILs, we analyzed them separately according to the classification of gene families. The results showed that the different IL families of grass carp differed significantly in gene structure, conserved domains, and motifs.
3.3.1.
IL-1 family
As shown in Fig. 2A, the number of exons in IL-1 family genes ranged from 5 to 7, indicating a relatively high structural diversity of grass carp IL-1 family genes. The results of conserved domain analysis (Fig. 2B) showed that all IL-1 family proteins had an IL1 domain. The results of motif analysis (Fig. 3) showed that a total of 11 conserved motifs were identified in the IL-1 family and the details of which were shown in Table S4. Motif 1 and motif 2 were highly conserved in the grass carp IL1 family, with all members having one. Motif 8 was present in IL-1Ra and IL-1Ral, but not in IL-1β.
3.3.2.
IL-2 family
As shown in Fig. 2A, members of the IL-2 family shared a similar exon structure. For example, there were six exons in IL-15 and IL-21, while all other members had four exons. The exon/intron structures were highly conserved in the same clade, suggesting that these conserved features played a key role in the specific functions of the group. As shown in Fig. 2B, among the IL-2 family proteins, IL-2 and IL-7 had no domains. IL-4/13A and IL-4/13B had an IL4 domain, while IL-15, IL-15l, and IL-21 had an IL15 domain. As shown in Fig. 3, there were eight conserved motifs in the IL-2 family, the details of which were shown in Table S4. Among them, no motifs were predicted in IL-4/13B and IL-7. Motif 1 was highly conserved in the grass carp IL-2 family, with all members except IL-4/13A having one.
3.3.3.
IL-6 family
In general, members of the IL-6 family had similar exon structures. For example, IL-6, IL-11a, and IL-11b had five exons, and M17, CNTF, CNTFL, and CLCF1 were three exons. The exon/intron structures were highly conserved in the same clade, suggesting that these conserved features played a key role in the specific functions of the group. Among the IL-6 family proteins, CNTF, CNTFL, and CLCF1 did not have domains. Other members had different domains; IL-6 had an IL4 domain, IL-11a and IL-11b had an IL11 domain, and the domain of M17 was LIF_OSM. A total of eighteen conserved motifs were predicted in the IL-6 family, the details of which were shown in Table S4. Among them, except for CNTF, which had one more motif 18, CNTF and CNTFL motifs were identical. Notably, IL-6 had a motif 4 that ran almost the entire length.
3.3.4.
IL-10 family
As shown in Fig. 2A, the gene structures of the members of the IL-10 family were highly conserved, with the number of exons all being 5. The predicted domains of the IL-10 family proteins showed that no domain
was found in IL-26, and all other members had an IL10 domain. The prediction of motifs showed that a total of 8 conserved motifs were detected in the IL-10 family, the details of which were shown in Table S4. The motifs of all members were very conserved. However, some motifs were specific to individual genes; for example, motif 5 was only found in IL-10, motif 7 was only found in IL-26, and motif 8 was only found in IL-20l. These unique motifs might contribute to functional divergence. It could be seen that the members of the IL-10 family were highly conserved in gene structure, domain, and motifs, suggesting that these conserved features played an important role in the specific functions of this family.
3.3.5. IL-12 family
The number of exons of IL-12 family genes ranged from four to eight, indicating a relatively high structural diversity of IL-12 family genes in grass carp. Interestingly, the numbers of exons for both p35a and p35b were 7, while the numbers of exons for p40a, p40b, and p40c were 8, 7, and 6, respectively. These results might suggest an association with the specific functions performed by IL-12 family members. The predicted domains of IL-12 family proteins showed that no domains were found at p19 and p28, but both p35a and p35b had an IL12 domain. An IL12p40_C domain was found in both p40a and p40b, but not in p40c, which was replaced by the same IG domain as EBI3. The prediction of motifs showed that a total of 25 conserved motifs were detected in the IL-12 family, the details of which were shown in Table S4. No motifs were predicted in p28, but the motifs in p35 and p40 were very conserved.
3.3.6. IL-17 family
The results of the gene structure showed that all members of the IL17 family had 3 exons except IL-17N which had 2 exons. The results of domain prediction showed that all members of the IL-17 family were found to have an IL17 domain. The prediction results of motifs showed that a total of 15 conserved motifs were detected in the IL-17 family, the details of which were shown in Table S4. Most members had conserved motifs, among which motif 1, motif 2, motif 3, and motif 4 were highly conserved and they were detected in all members, suggesting that IL-17 family members might have similar biological functions.
3.3.7.
Other IL members
The results of the gene structure showed that the minimum number of exons was 4 for IL-8, the maximum number of exons was 10 for IL-14, 9 for IL-16, and 6 for IL-34. The predicted results of domains showed that IL-8 had an IL8 domain, IL-14 had a Taxilin domain, IL-16 had two PDZ domains, and IL-34 had an IL34 domain that ran for almost the entire length of IL-34. The predicted results of motifs showed that a total of 22 conserved motifs were detected, the details of which were shown in Table S4. All the predicted motifs did not appear for the second time, with a minimum of one motif for IL-8 and a maximum of 10 motifs for IL16.
3.4. Chromosomal locations and PPI network analyses in C. idella
As shown in Fig. S4, 29 of the 39 genes in grass carp ILs were located in 10 LGs, with the remainder located on un-anchored scaffolds. The LG01, LG06, LG12, LG16, and LG19 each contained only one IL gene, while LG10 contained up to four IL genes. In all the scaffolds located,
Fig. 2. The gene structures (A) and conserved domains (B) of ILs from C. idella Exons and introns were represented by purple rectangles and black lines, respectively. The conserved domains were determined using NCBI-Batch-CDD online tool, where different domains were represented by different colour blocks. (For interpretation of the references to colour in this figure legend, the reader is referred to the web version of this article.)
Fig. 3. The conserved motifs of IL proteins were identified using the online MEME program, where different motifs were represented by different colour blocks. The black lines represented the non-conserved sequences. Different families of IL were represented by different colors.
there was only one IL gene on the other scaffolds except that there were two IL genes on the scaffolds CI01000169.
As shown in Fig. S5, we selected IL-1β, IL-10, EBI3, IL-17A/F3, p40a, and p40b for PPI network analysis. The results showed that myeloid differentiation primary response proteins MyD88 (Myd88), tumor necrosis factor b (tnfb), tumor necrosis factor a (tnfa), Janus kinase 1 (jak1), and signal transducer and activator of transcription 3 (stat3) showed a high association with these IL genes. Notably, stat3 hub nodes were found in all predicted PPI networks except in p40b.
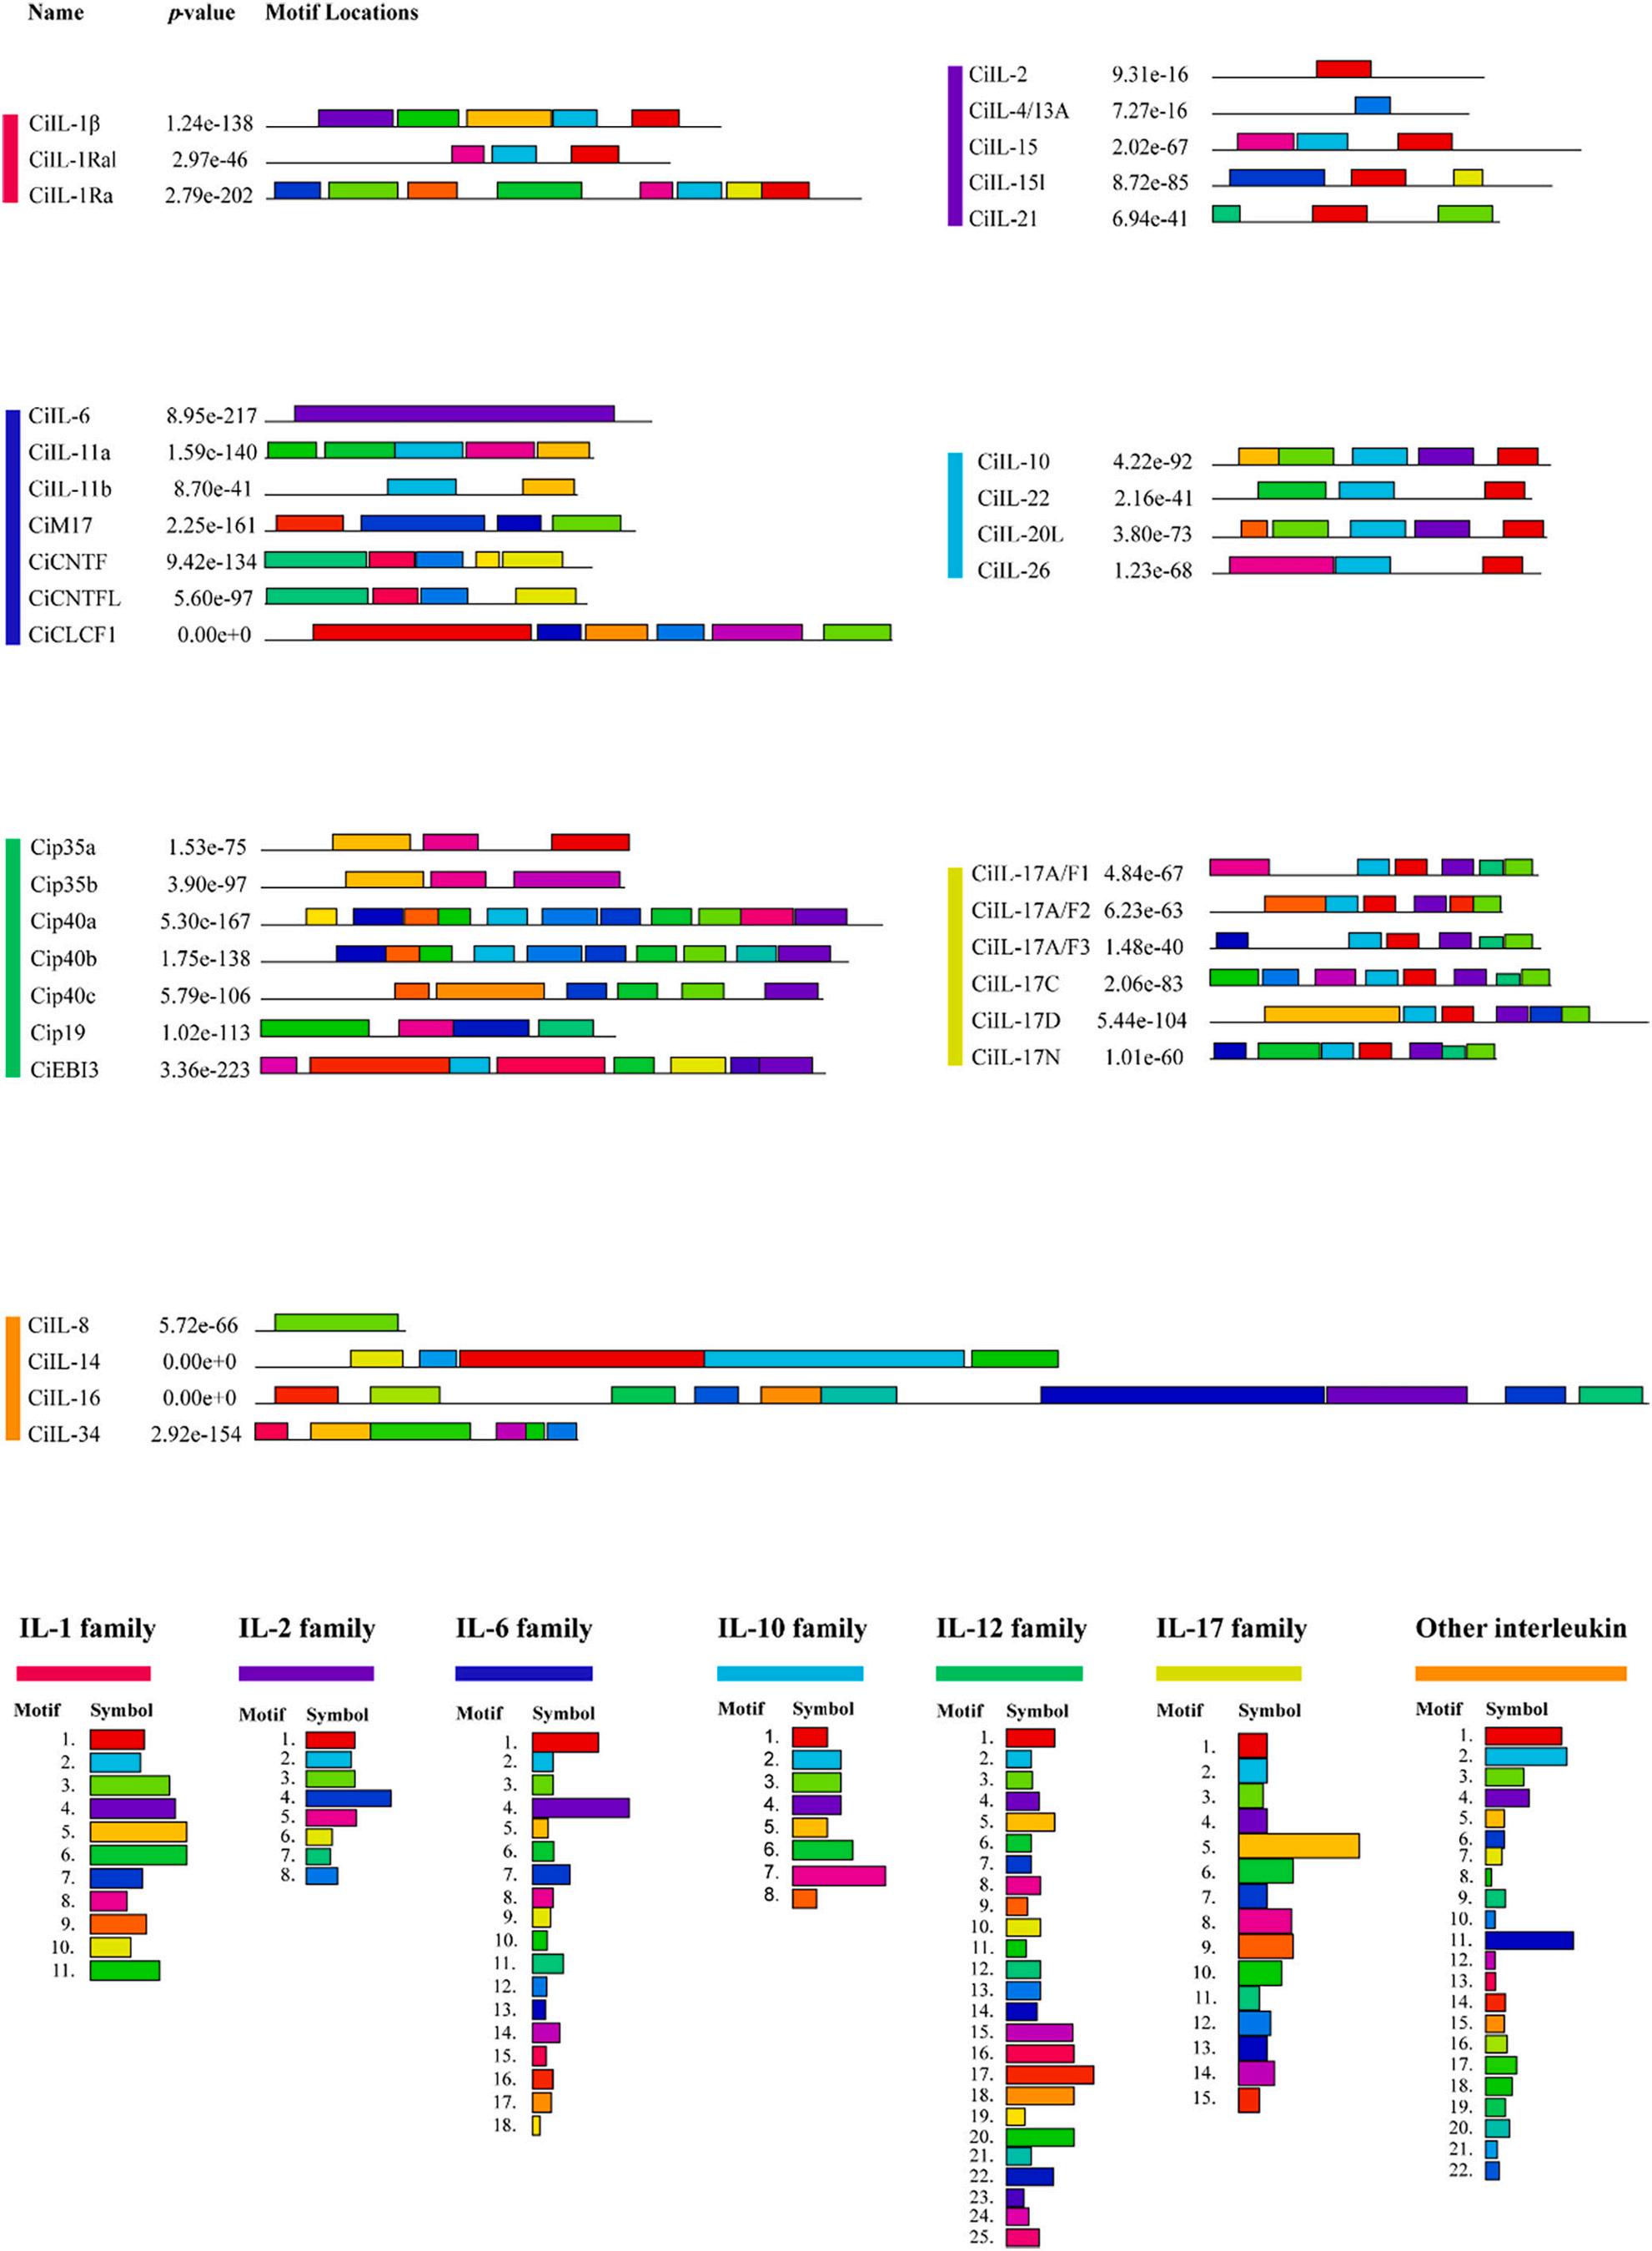
3.5. Gene duplication and Ka/Ks analyses of ILs in C. idella
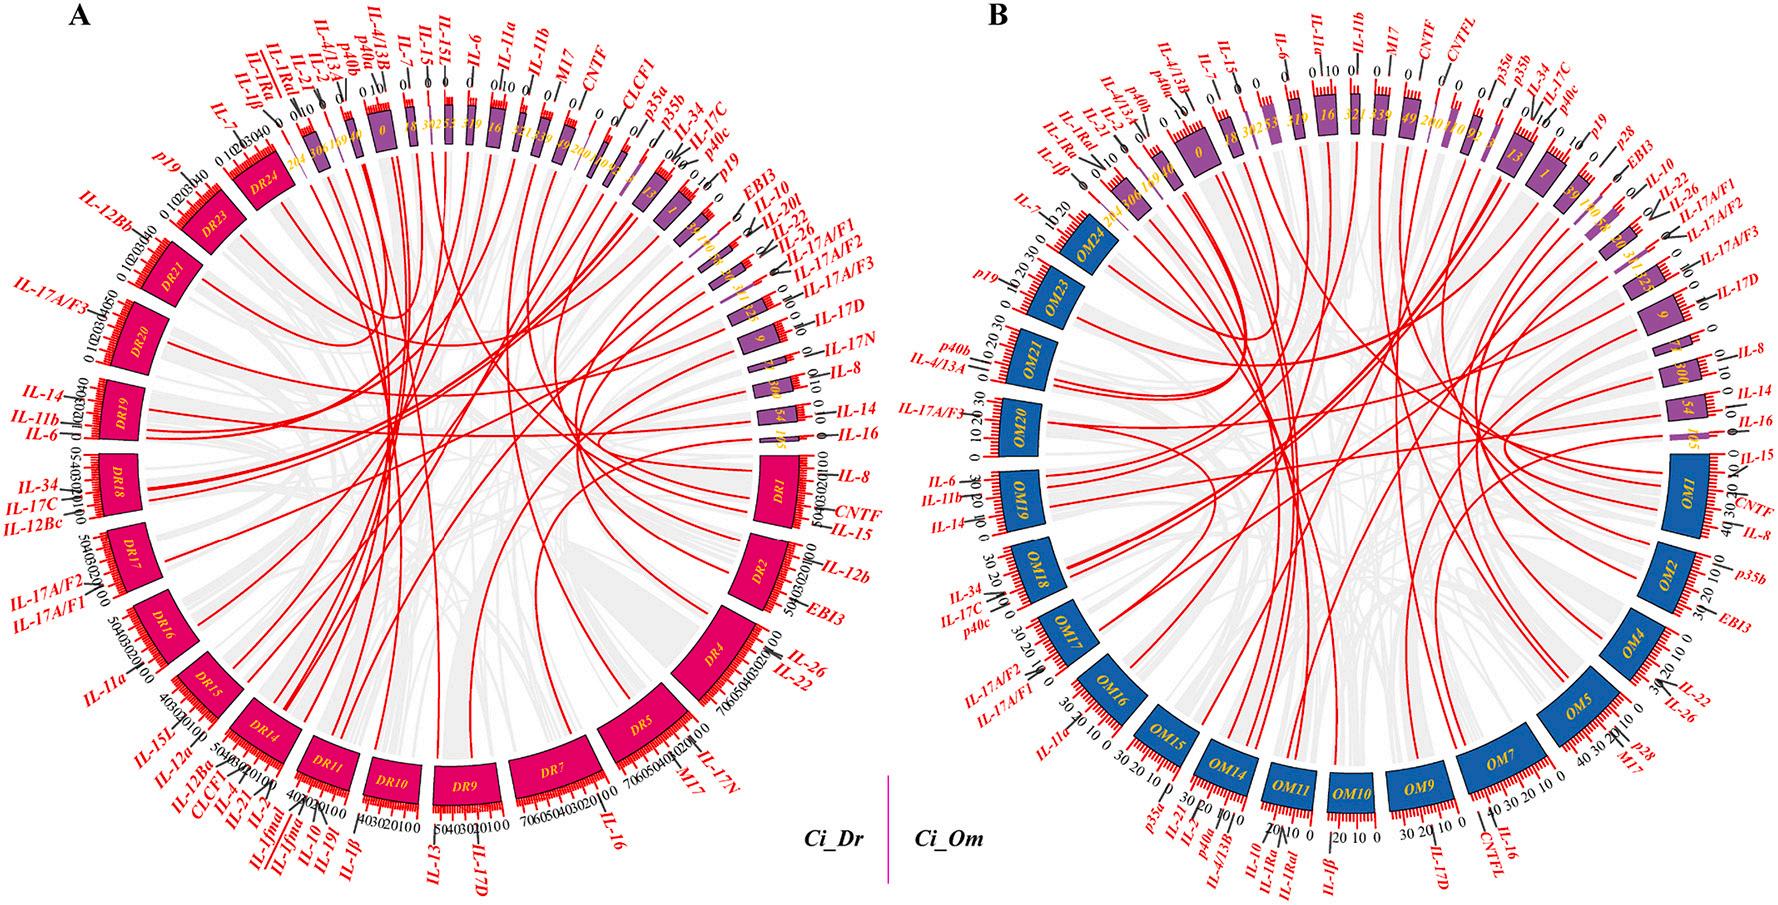
As shown in Fig. 4A, only one pair of tandem duplication events (IL1Ra, IL-1Ral) and one pair of segmental duplication events (IL-8, CXCL13) were found in the genome of C. idella. Fig. 4B showed that no IL gene-related segmental duplication events were found in the genome of D. rerio, but a pair of tandem duplication events (IL-1Ra, IL-1Ral) were found. Fig. 4C showed a pair of tandem duplication events (IL-1Ra/IL1Ral) and two pairs of segmental duplication events (IL-11a, IL-11b, and IL-17A/F1, IL-17A/F3) were found in the genome of O. macrolepis. In addition, Fig. 5A showed that between the C. idella and D. rerio genomes, all 37 IL genes except CNTFL and p28 were gene duplications generated by segmental duplication. Fig. 5B showed that between the genomes of C. idella and O. macrolepis, all 35 IL genes except IL-15l, CLCF1, IL-20l, and IL-17N were gene duplications generated by segmental duplication.
To better understand the evolutionary constraints acting on IL genes, Ka, Ks, and Ka/Ks values were calculated for each IL gene pair (Fig. S6). The results showed Ka/Ks values of <1 for all segmentally and tandemly duplicated IL gene pairs, suggesting that IL genes might have undergone strong purifying selection pressure during evolution. As shown in Fig. S6C, the vast majority of gene pairs in C. idella and D. rerio had Ka/ Ks values less than their mean value of 0.74, and the vast majority of gene pairs in C. idella and O. macrolepis had Ka/Ks values less than their mean value of 0.45. Interestingly, the IL-17N gene pairs in C. idella and D. rerio and the IL-11a and IL-11b gene pairs in O. macrolepis Ks values showed NaN, which indicated too much divergence between sequences and a long evolutionary distance.
3.6.
Tissue distributions of IL genes
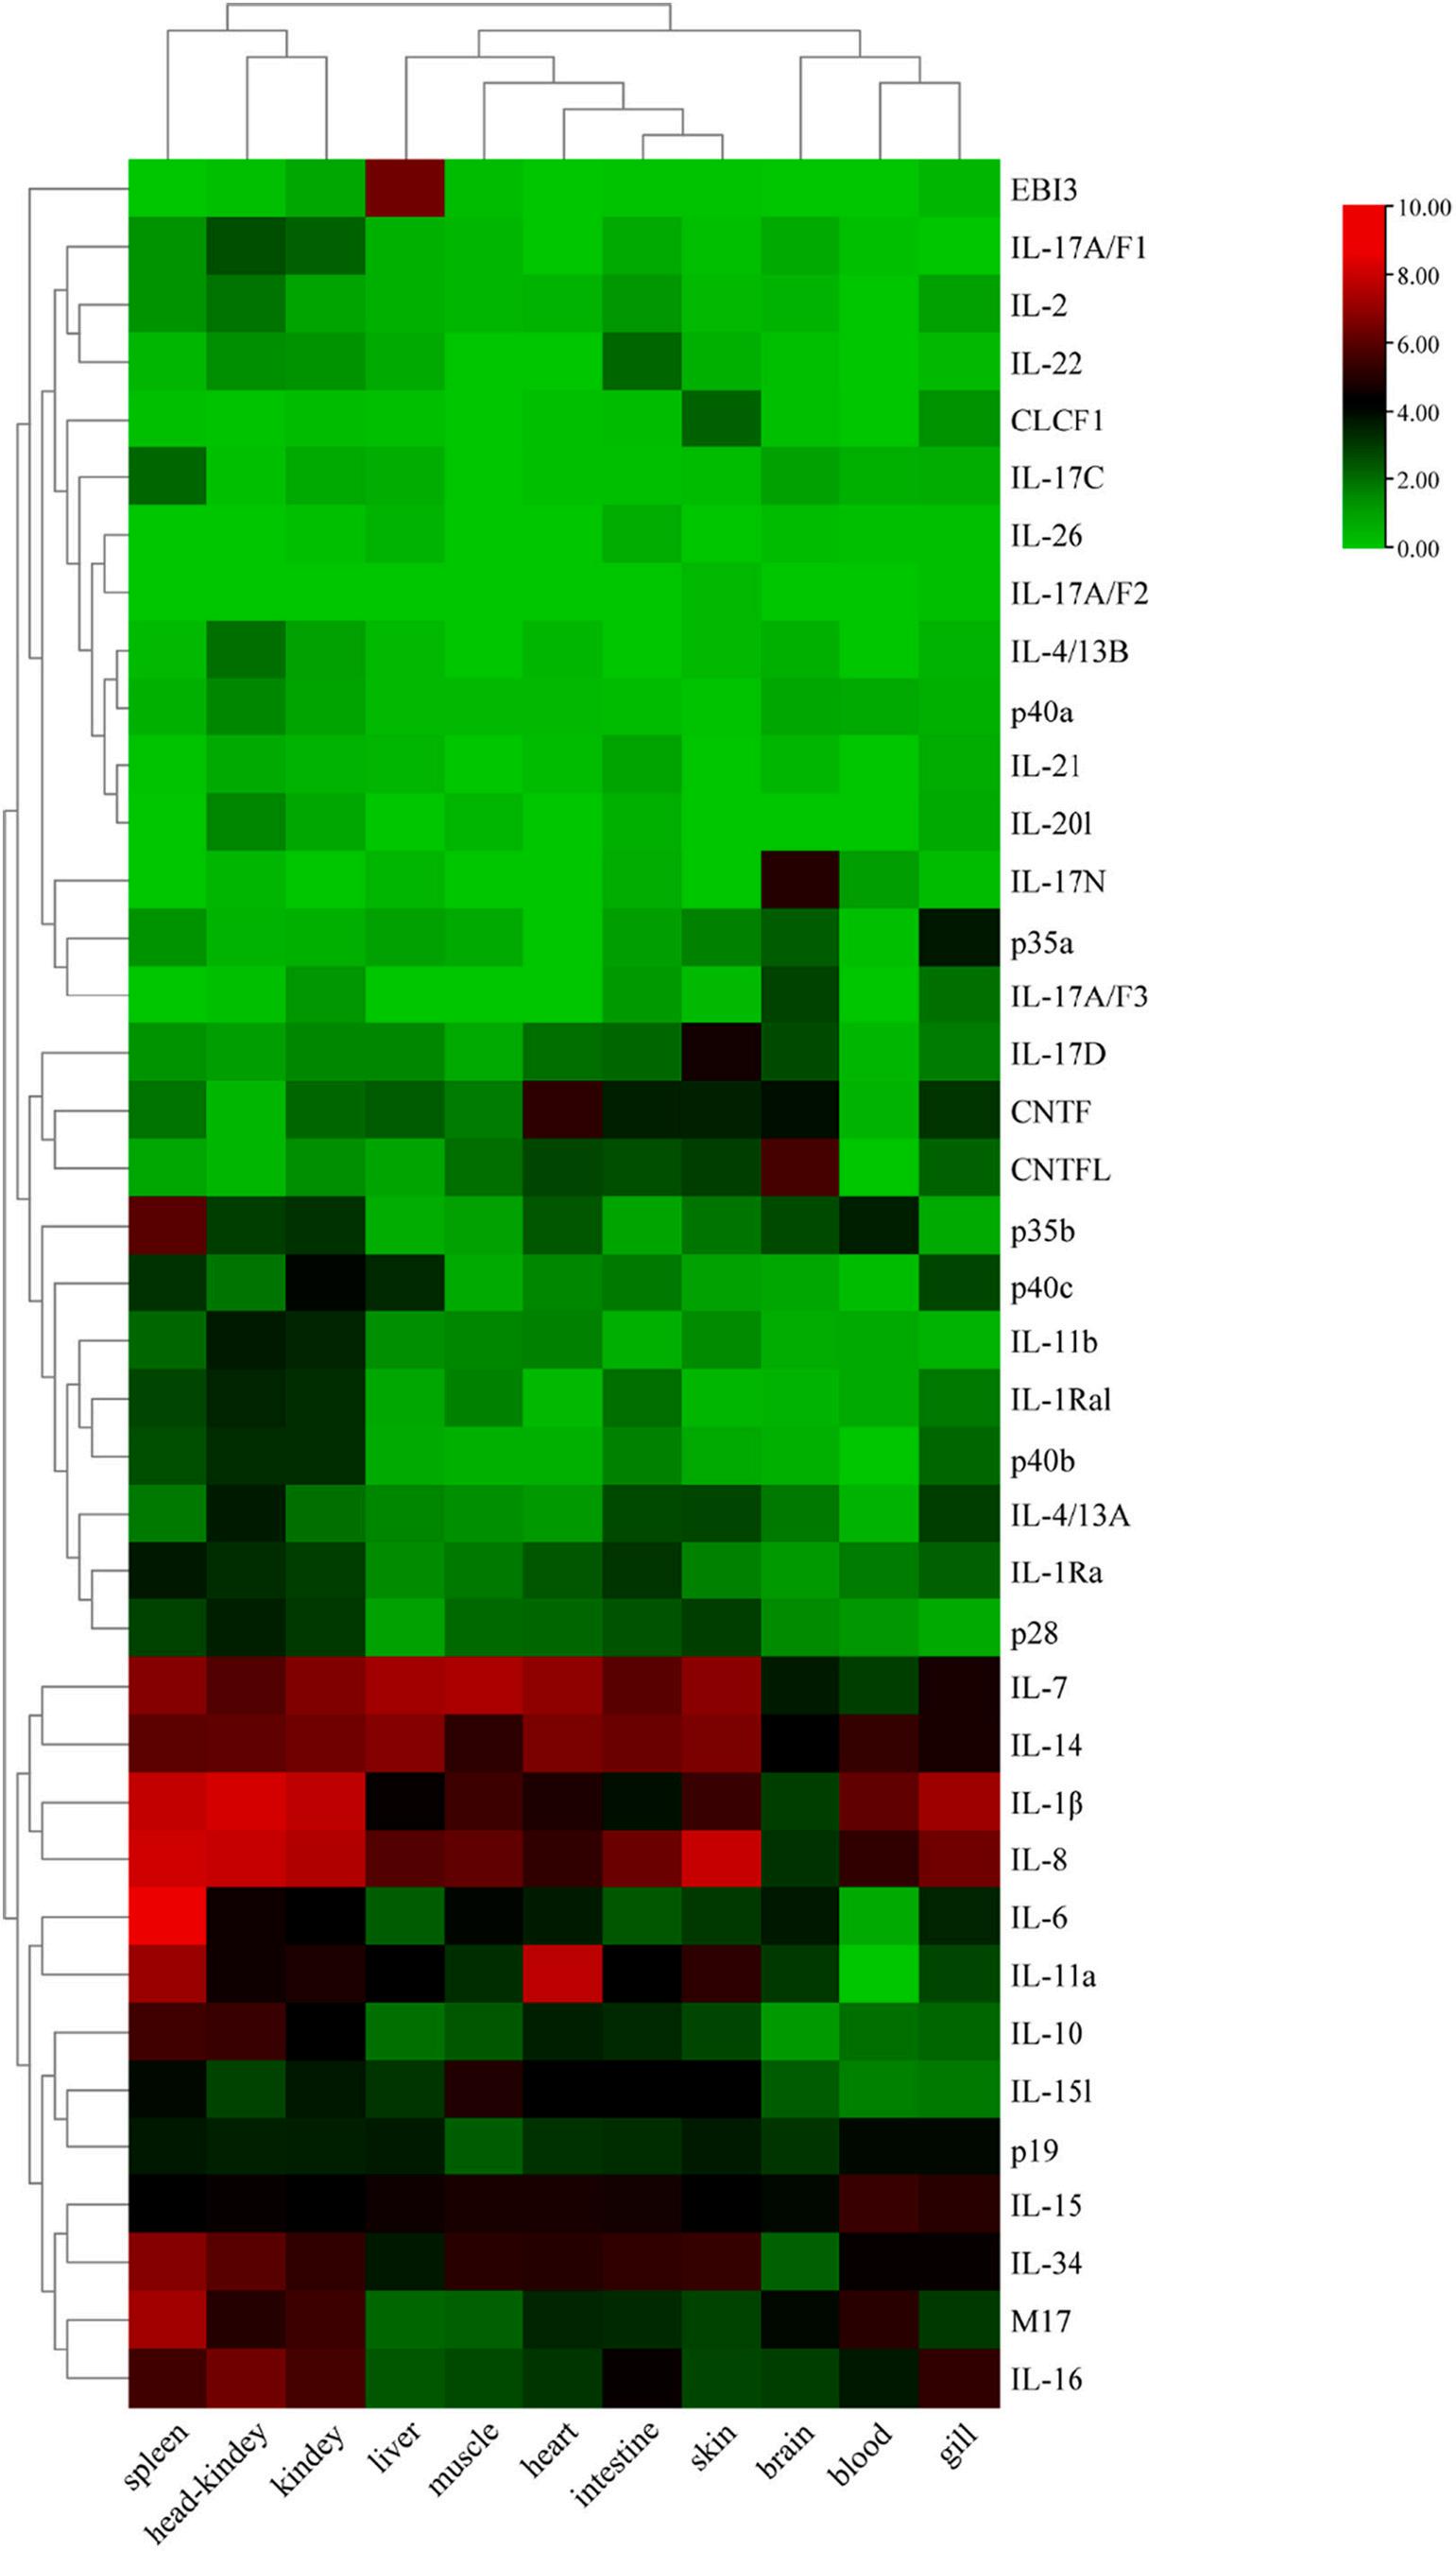
As shown in Fig. 6, IL genes were widely expressed in these tissues and showed different expression patterns. IL-7, IL-14, IL-1β, IL-8, IL-15, and IL-34 were highly expressed in almost all of the other 10 tissues except for brain, with the highest expression levels of IL-1β and IL-8 in spleen, head-kidney, and kidney. IL-6 and IL-10 were highly expressed in spleen and IL-11a had relatively high expression levels in heart and spleen. M17 and IL-16 showed high expression levels in spleen, headkidney, and kidney. CNTF was highly expressed in heart, and CNTFL and IL-17N were highly expressed in brain. EBI3 had relatively high expression levels in liver. Most IL genes were highly expressed in spleen,
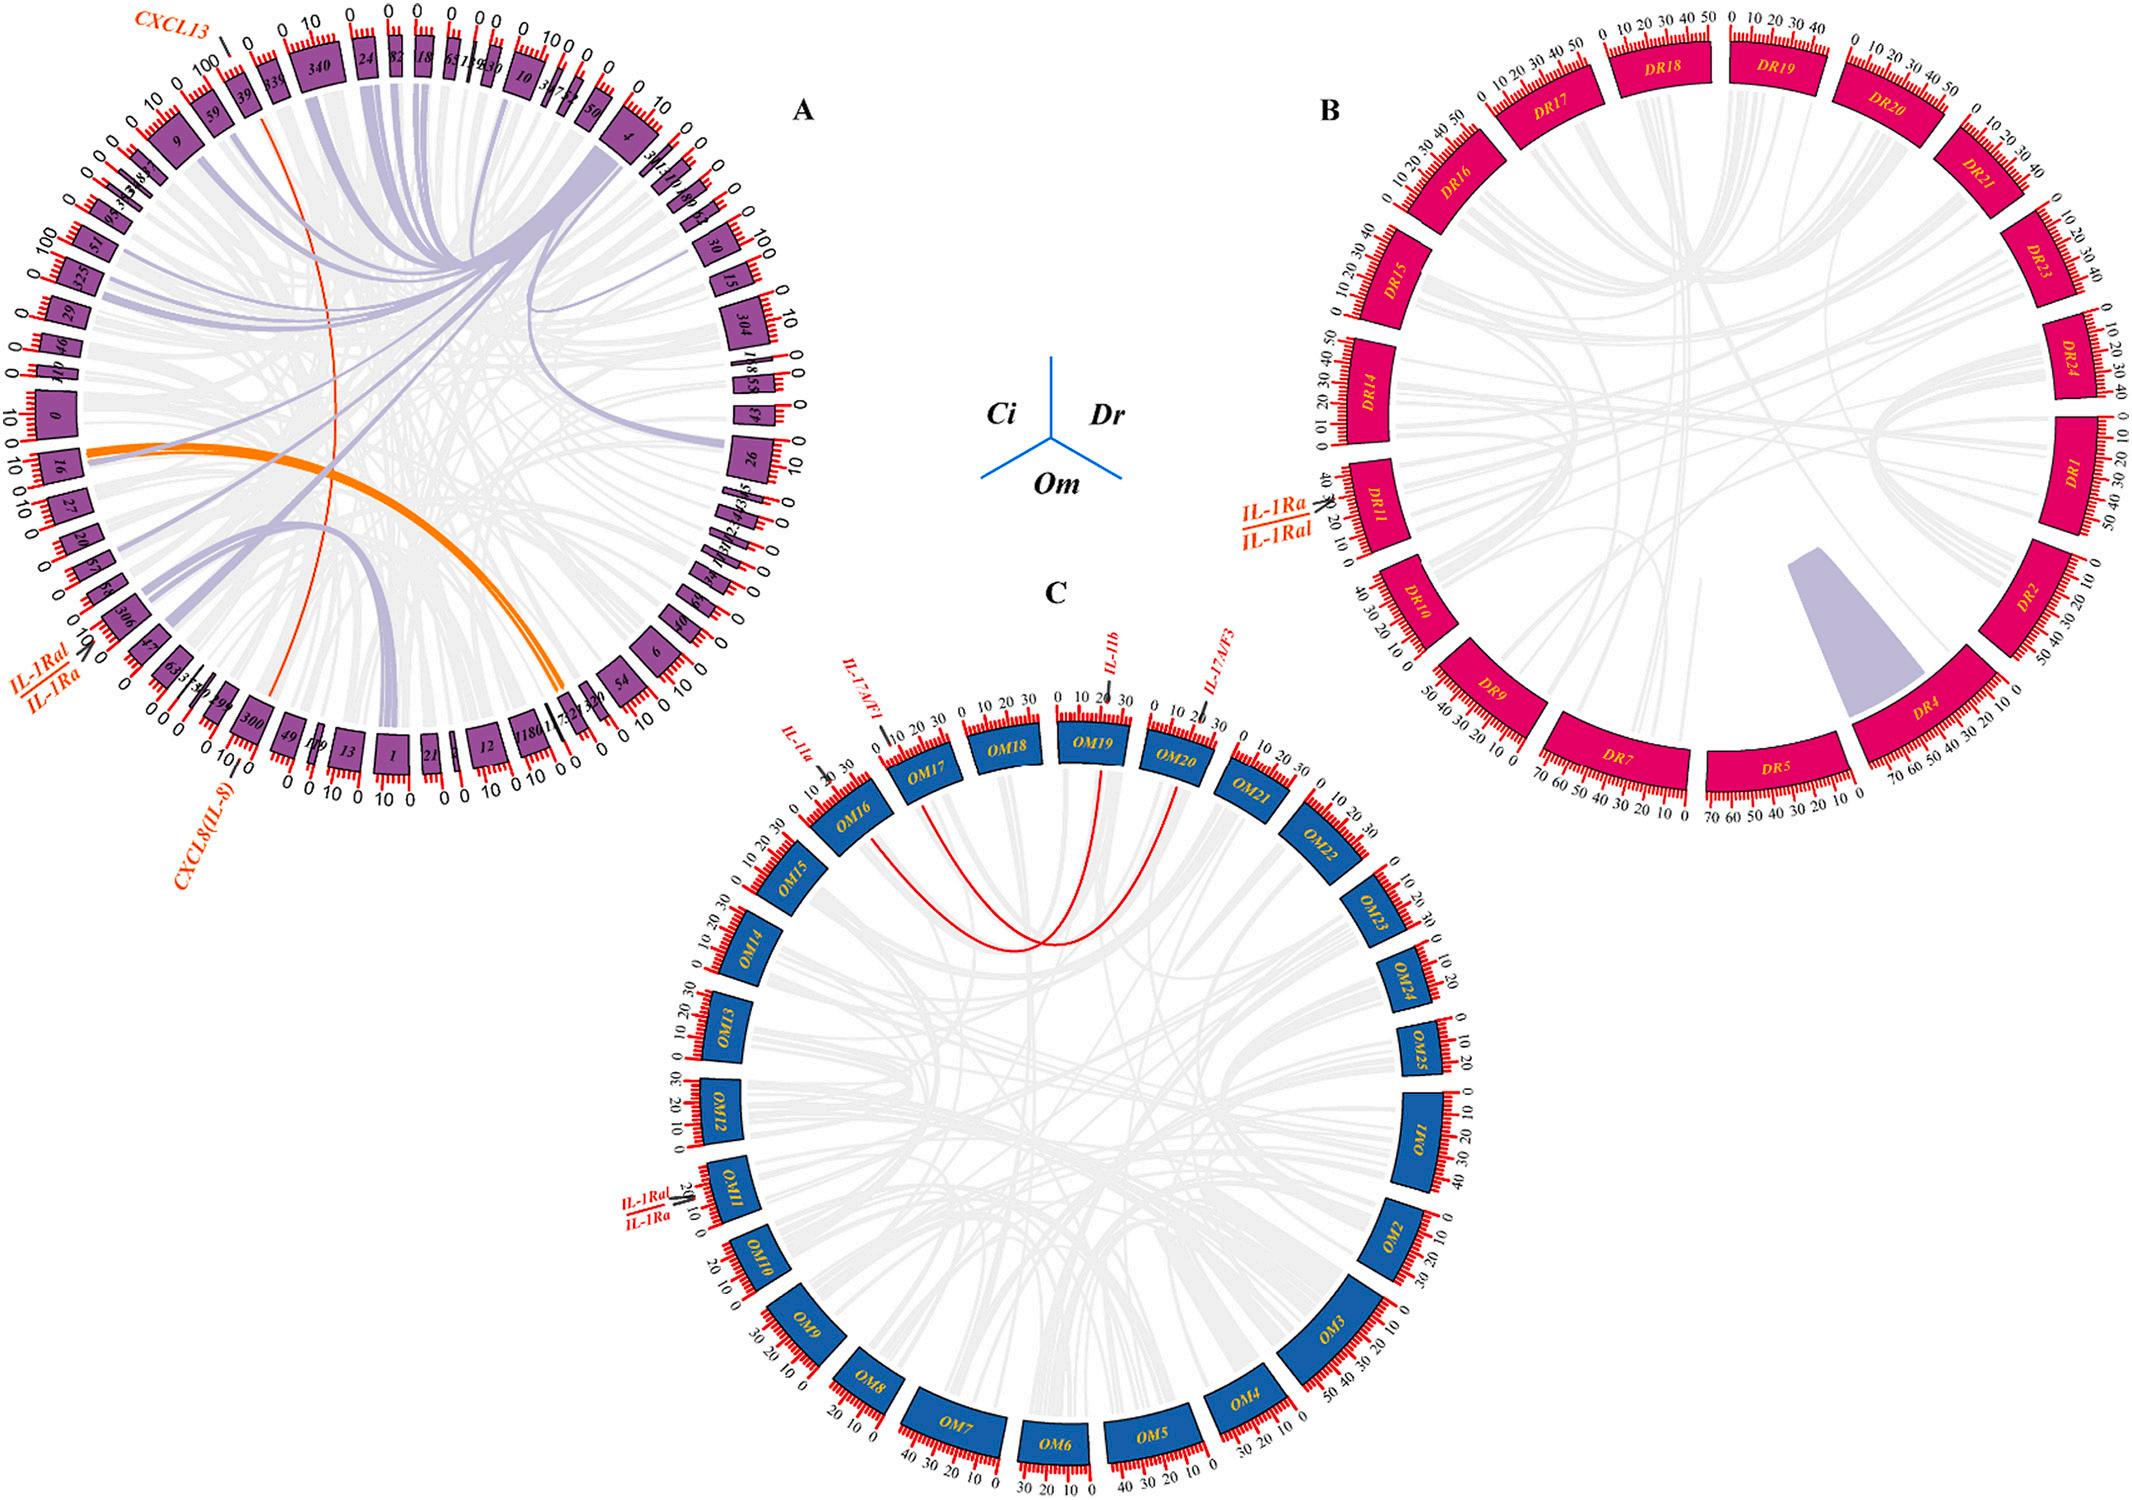
4. Schematic representations of segmental and tandem duplications of IL genes in C. idella (A), Danio rerio (B), and O. macrolepis (C) genome. Gene collinearity relationships were displayed using the Circos program of TBtools software. The gray lines in the background indicated all synteny blocks between each scaffold or chromosome, the red arcs indicated segmentally duplicated gene pairs and the red straight lines indicated tandem duplicated gene pairs. (For interpretation of the references to colour in this figure legend, the reader is referred to the web version of this article.)
Fig.
5. Collinearity of IL genes between the C. idella scaffolds and the Danio rerio chromosomes (A), and C. idella scaffolds and the O. macrolepis chromosomes (B). Duplication events were indicated with gray lines in the background, while the colored arcs connected IL gene pairs.
head-kidney, and kidney relative to other tissues, suggesting that ILs might play a more important role in these tissues. Overall, the expression patterns of IL genes in different tissues could be used to identify functional genes in grass carp.
3.7. Expression profiles of IL genes post GCRV or A. hydrophila challenge
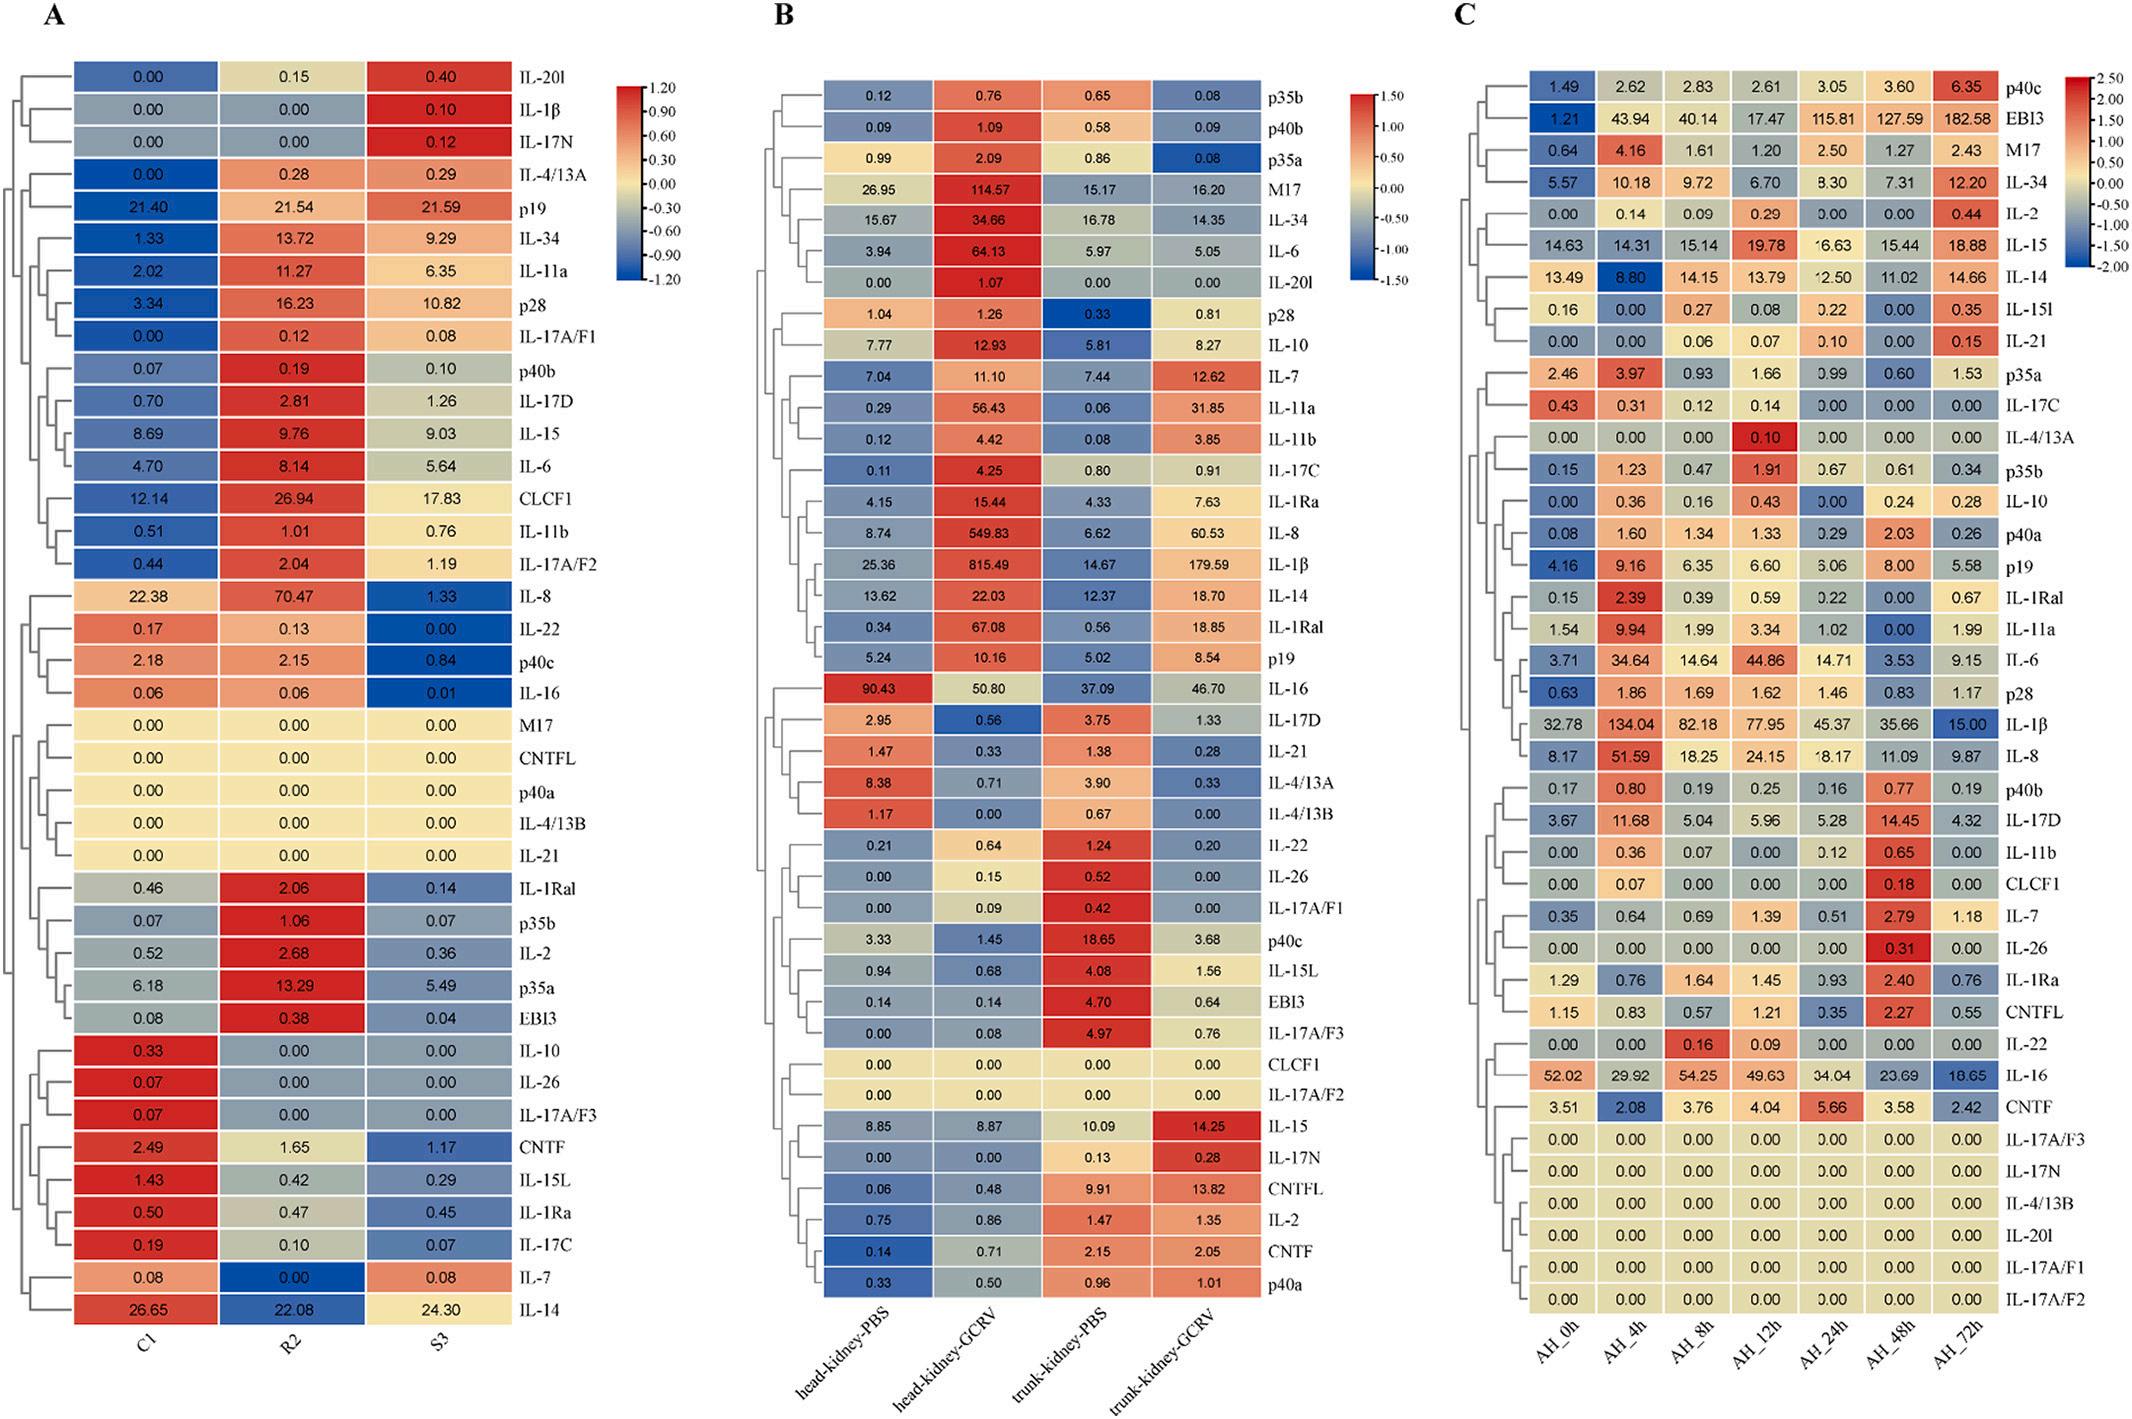
The results showed that the expressions of most IL genes were upregulated in gill post GCRV challenge (Fig. 7A). For example, IL-14 and IL-34 were significantly upregulated at 72 h; IL-7, IL-16, IL-20l, p40b, IL-22, p40a, and IL-26 were significantly upregulated at 24 h; IL-1β and IL-8 were significantly upregulated at 2 h. Notably, some genes showed downregulation, for example, IL-15, IL-15l, and IL-4/13A were significantly downregulated at 2 h. Interestingly, the expressions of most IL genes in intestine remained almost unchanged post GCRV challenge, except for IL-1β, which was significantly downregulated at 2 h of challenge (Fig. 7B). As shown in Fig. 7C, only a small number of IL genes showed significant changes in expression in hepatopancreas post GCRV challenge. For example, EBI3 was significantly upregulated at 24 h; IL-7, IL-8, IL-34, and IL-14 were significantly upregulated at 72 h. Interestingly, IL-17A/F2, IL-17A/F3, IL-17N, IL-20l, and IL-26 were not expressed from the beginning to the end. As shown in Fig. 7D, the expressions of some IL genes were significantly upregulated in spleen post GCRV challenge. IL-22, IL-8, IL-1β, M17, IL-6, IL-11a, and IL-7 were significantly upregulated at 2 h.
Further, we investigated the expressions of IL genes in CIK cells using the resistance and susceptibility database (Fig. 8A). The results showed that IL-34, IL-11a, p28, IL-6, CLCF1, and p35a were highly expressed in R2, and IL-34, IL-11a, and p28 were highly expressed in S3. Notably, IL8 was significantly highly expressed in R2 and significantly low in S3 compared to control C1. As shown in Fig. 8B, the expressions of some IL genes were significantly upregulated in head-kidney and trunk-kidney post GCRV challenge. For example, M17, IL-34, and IL-6 were significantly upregulated in head-kidney; IL-8, IL-1β, and IL-1Ra were significantly upregulated in head-kidney and trunk-kidney. To investigate the expressions of IL genes in response to bacterial infection, we analyzed the transcriptome of infected spleen post A. hydrophila challenge (Fig. 8C). The results showed that only a few IL genes were significantly changed in expression post A. hydrophila challenge. EBI3, IL-11a, IL-6, IL-1β, IL-8, and IL-17D were significantly upregulated at 4 h, with IL-1β, IL-8, and EBI3 expressions changed being particularly significant. In
contrast, IL-16 was significantly downregulated at 4 h. Interestingly, IL17A/F1, IL-17A/F2, IL-17A/F3, IL-17N, IL-20l, and IL-4/13B were not expressed from the beginning to the end.
3.8. qRT-PCR verification of IL gene expressions post A. hydrophila or GCRV challenge
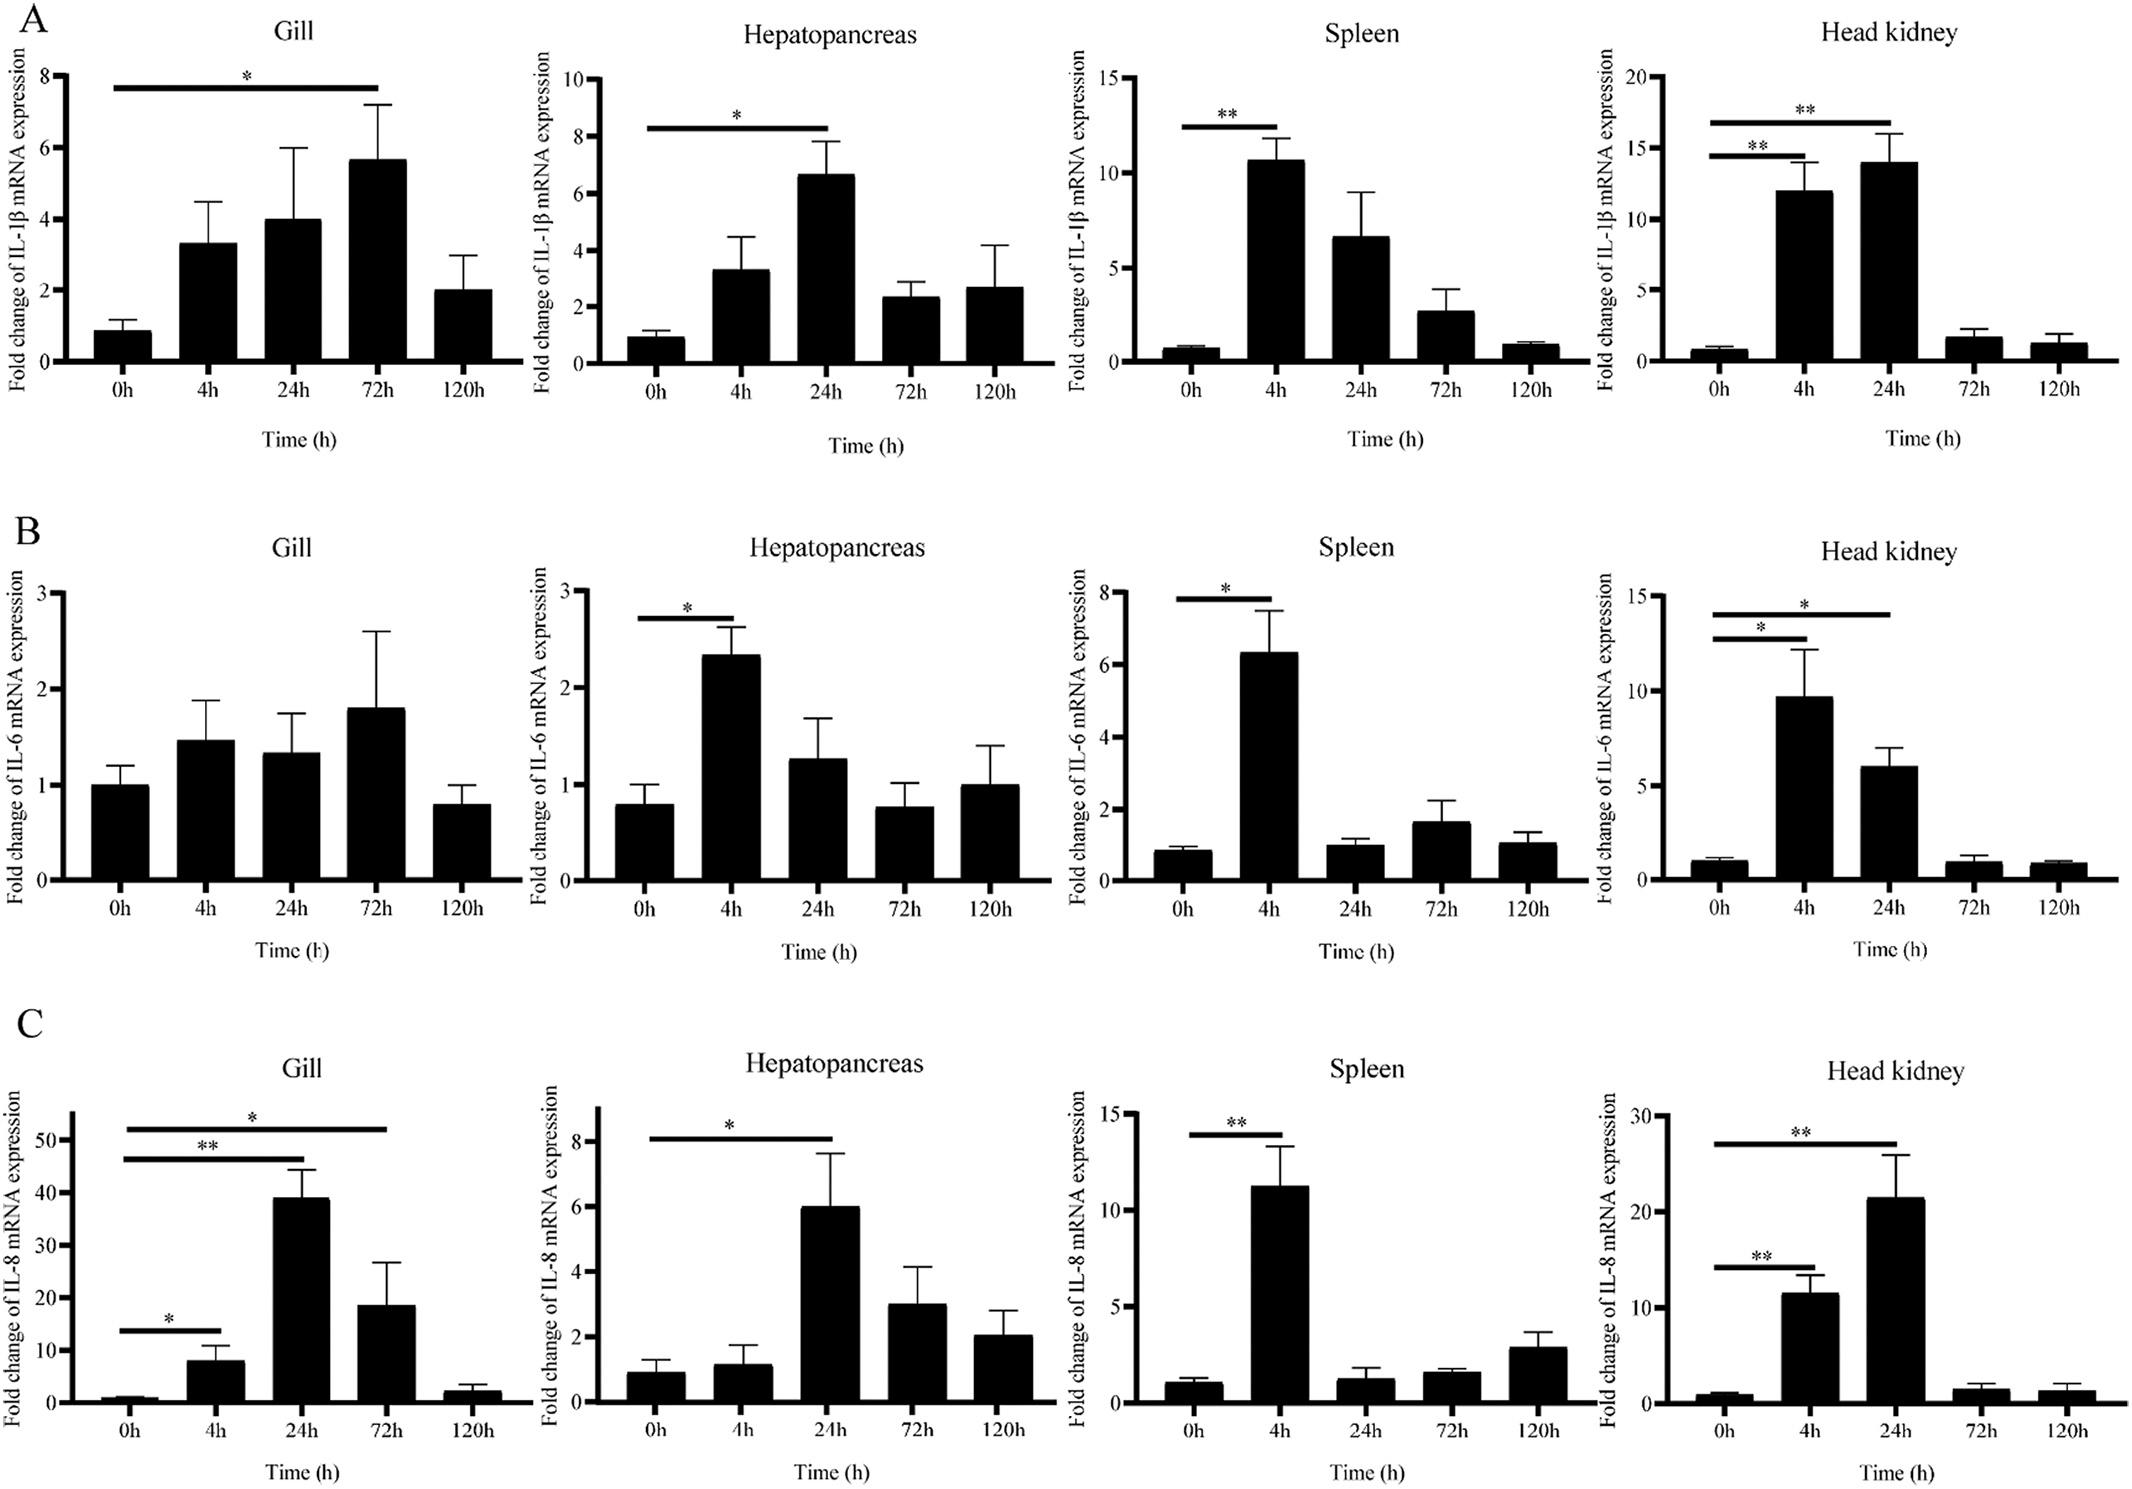
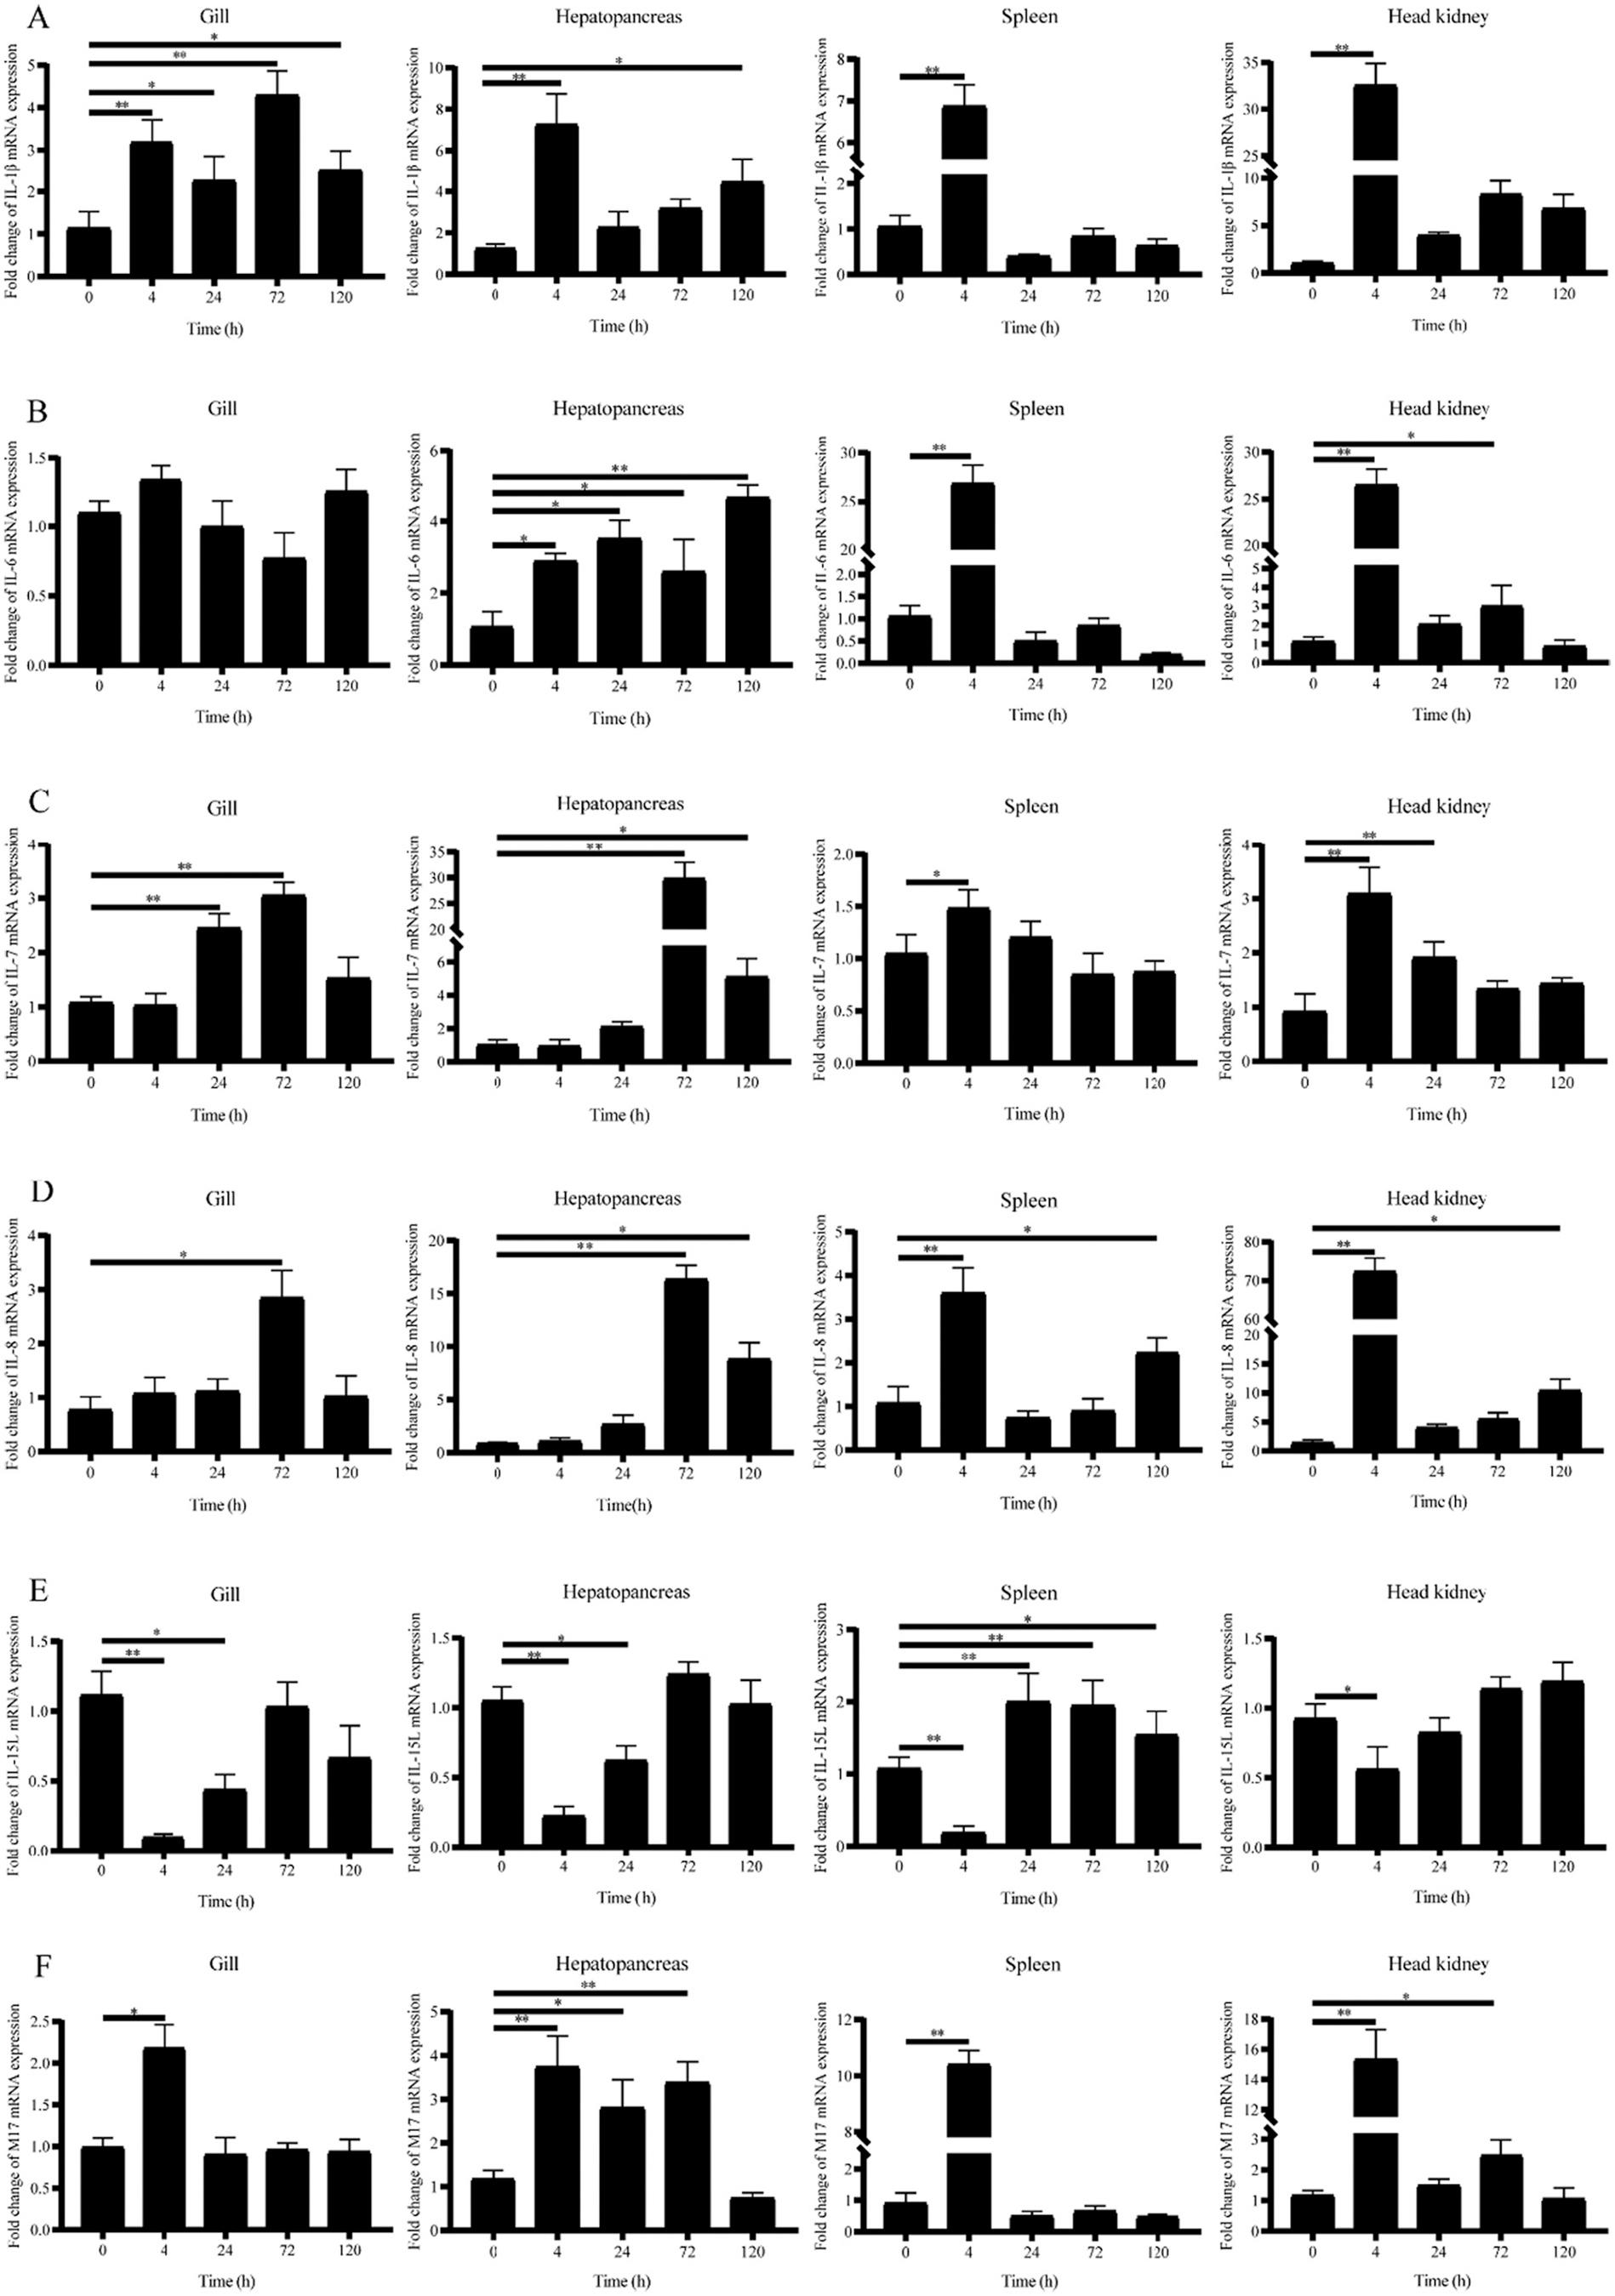
By the expression analysis of RNA-Seq data (Fig. 7 and Fig. 8), we selected six candidate IL genes (IL-1β, IL-6, IL-7, IL-8, IL-15l, and M17) and confirmed their responses to GCRV or A. hydrophila challenge by qRT-PCR. For the bacterial challenge, we investigated the response patterns of IL-1β, IL-6, and IL-8 genes in different tissues (gill, hepatopancreas, spleen, and head-kidney) at different time points (0, 4, 24, 72, and 120 h) in grass carp post-challenge with A. hydrophila The results were shown in Fig. 9, where the expressions of IL-1β and IL-8 were significantly upregulated in gill at 72 h (p < 0.05) and 24 h (p < 0.01) compared to untreated control groups, followed by a gradual return to basal levels. In contrast, IL-6 expression did not change much postchallenge. In hepatopancreas, IL-1β and IL-8 were significantly induced at 24 h (p < 0.05). Compared to untreated control groups, IL-1β and IL-8 expressions were significantly upregulated in both spleen and head-kidney at 4 h (p < 0.01). And IL-6 expression was significantly upregulated at 4 h in hepatopancreas, spleen, and head-kidney (p < 0.05). The above results were largely identical to the expression analysis of RNA-seq data.
For the viral challenge, we investigated the response patterns of IL1β, IL-6, IL-7, IL-8, IL-15l, and M17 in grass carp post GCRV challenge in different tissues (gill, hepatopancreas, spleen, and head-kidney) at different time points (0, 4, 24, 72, and 120 h). The results were shown in Fig. 10, where IL-1β (4 h) and IL-7 (24 h) were significantly induced (P < 0.01), and IL-8 (72 h) and M17 (4 h) were significantly induced (P < 0.05) compared to the untreated control groups. In contrast, no significant changes were observed in the IL-6 in gill. In hepatopancreas, IL-1β (4 h), IL-7 (72 h), IL-8 (72 h), and M17 (4 h) were significantly upregulated (P < 0.01), and IL-6 was significantly upregulated (P < 0.05). Expressions of IL-1β, IL-6, IL-8, and M17 were all significantly upregulated in spleen at 4 h compared to untreated control groups (P < 0.01), while IL-7 was significantly upregulated at 4 h (P < 0.05). In headkidney, IL-1β, IL-6, IL-7, IL-8, and M17 were significantly upregulated at 4 h (P < 0.01). Interestingly, IL-15l was the only one of the six candidate IL genes whose expression was downregulated post GCRV
Fig.
Fig. 6. Expression levels of C. idella IL genes in 11 tissues. Fold changes of IL expressions were log2(TPM + 1) transformed and were used to generate heatmap with TBtools software package. The colour scale on the right side of the heatmap showed the expression level; red indicated high transcript abundance while green indicated low abundance. (For interpretation of the references to colour in this figure legend, the reader is referred to the web version of this article.)
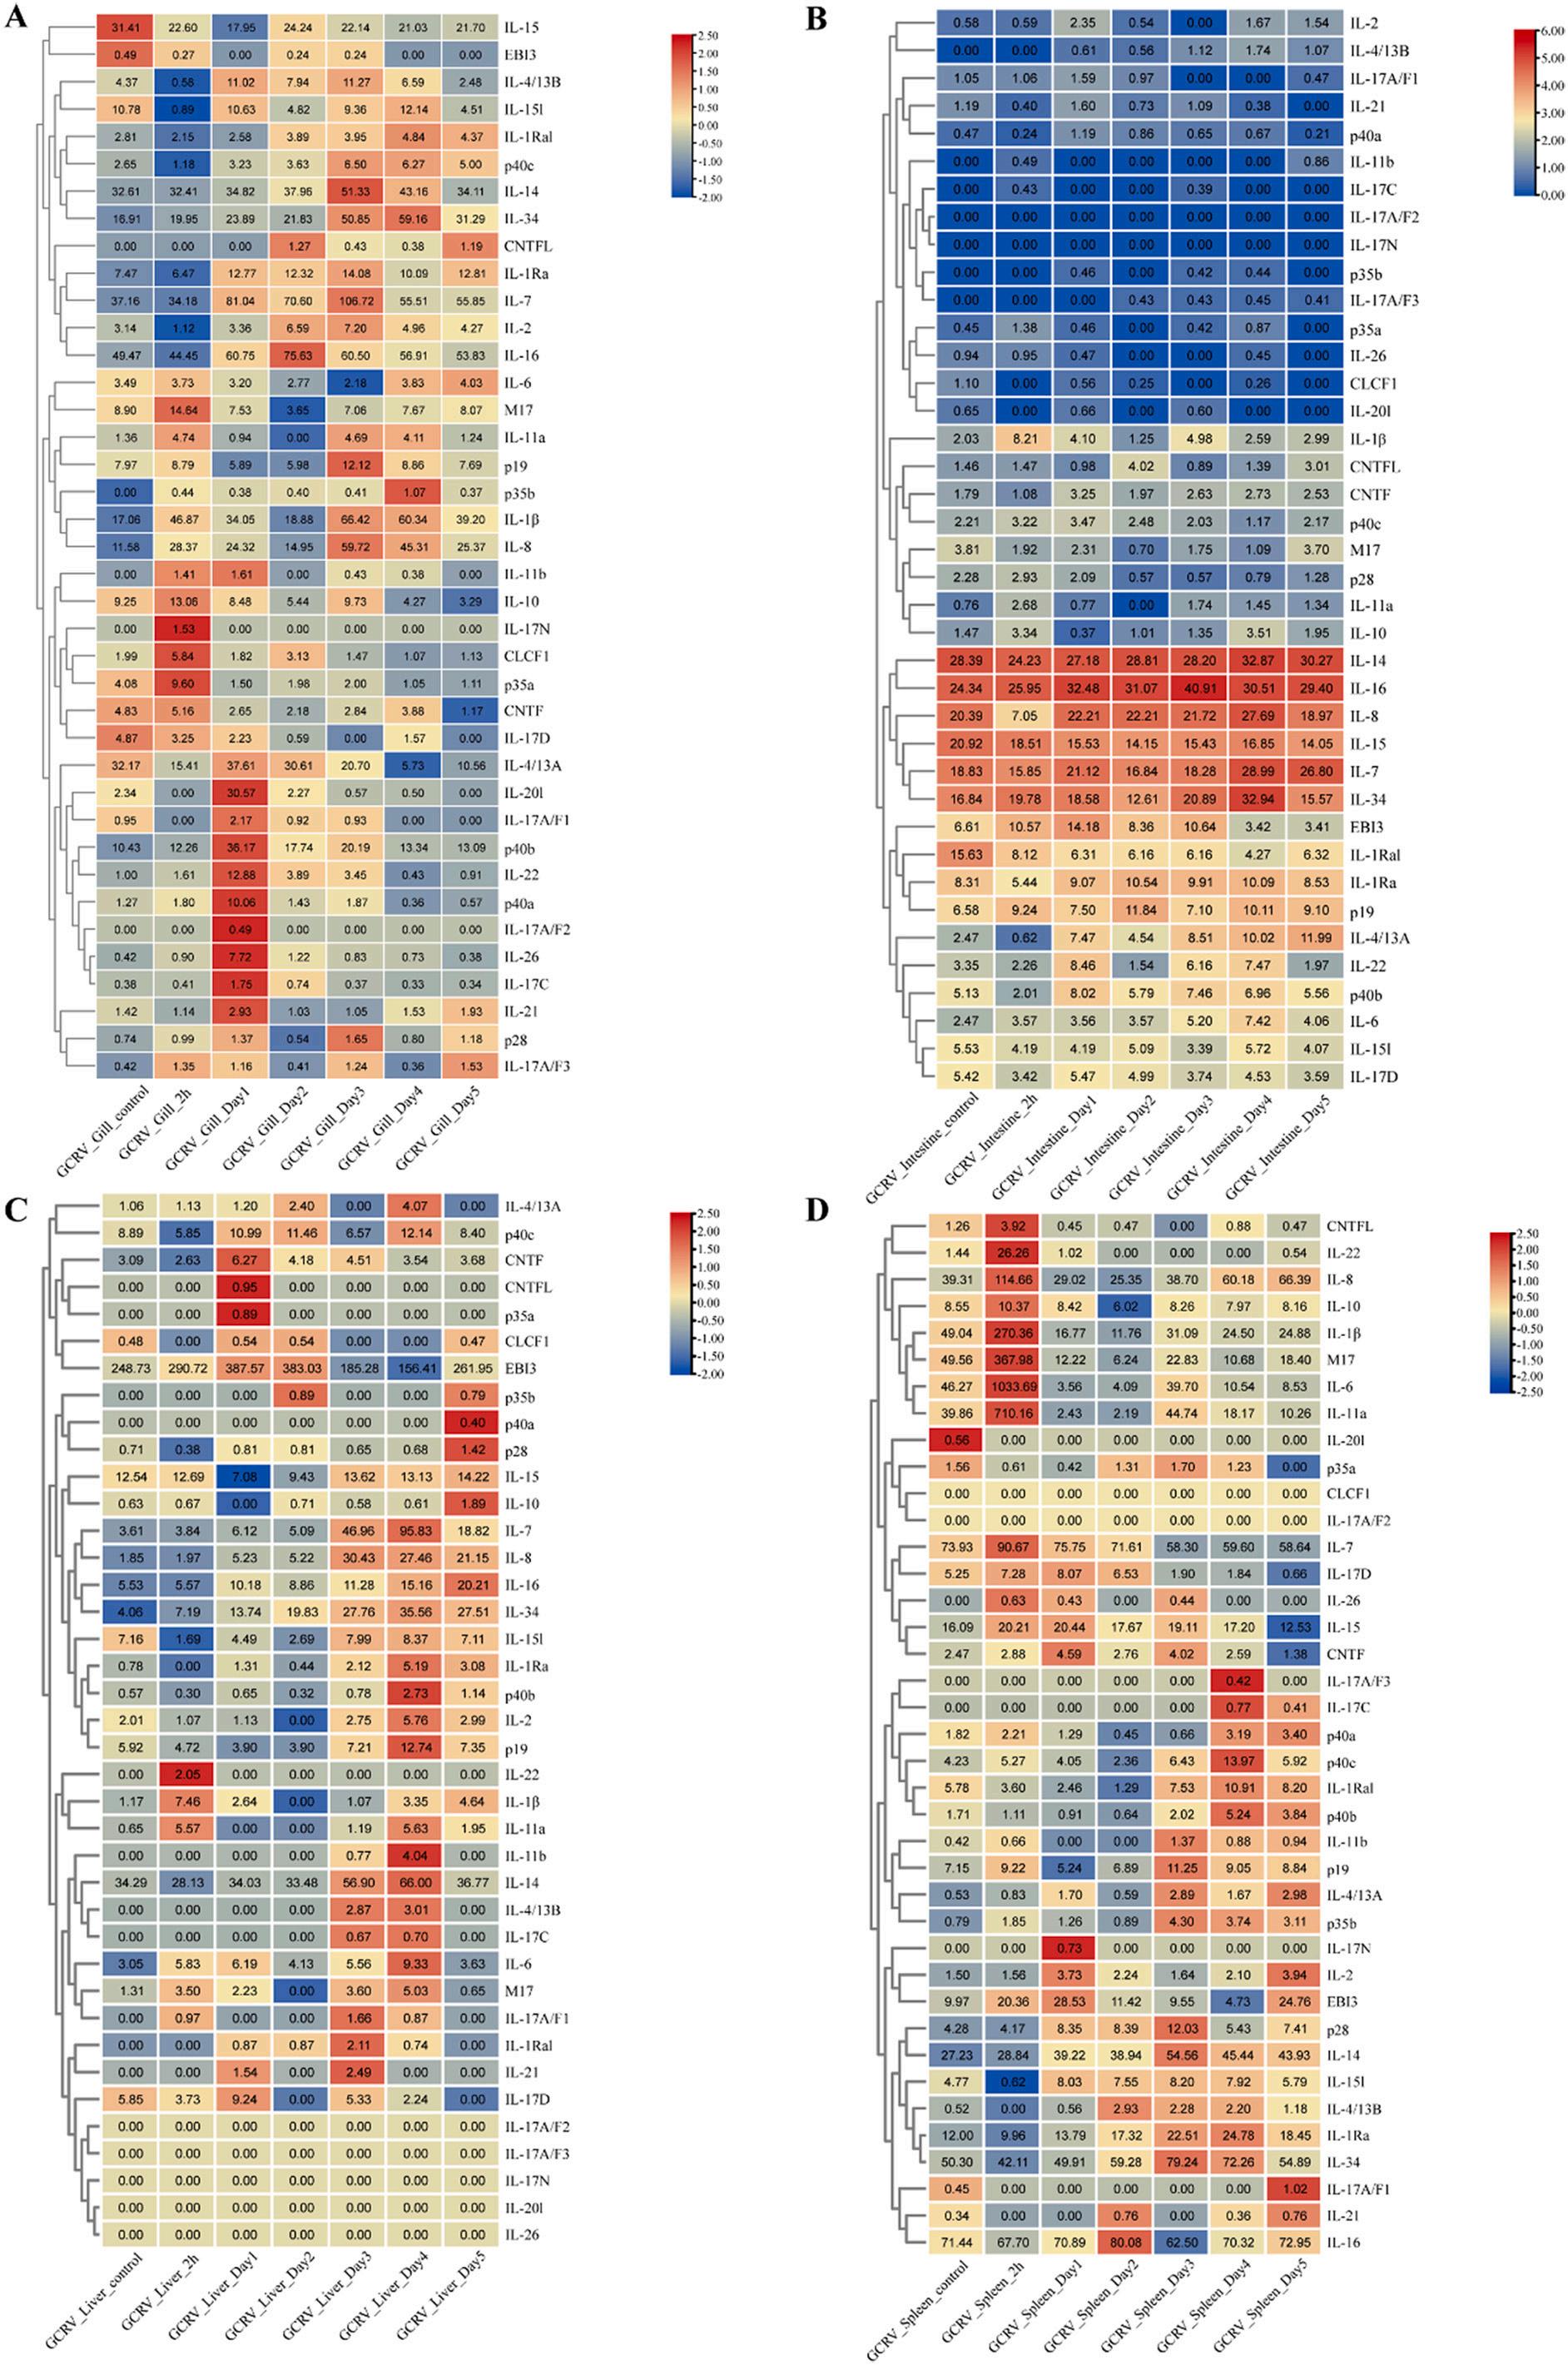
Fig. 7. Expression patterns of IL genes in grass carp in different tissues post GCRV challenge. (A), (B), (C), and (D) represented mRNA expressions of IL genes post GCRV challenge in gill, intestine, hepatopancreas, and spleen tissues, respectively. Fold changes of IL expressions were log2(TPM + 1) transformed and were used to generate heatmap with TBtools software package. The colour scale on the right side of the heatmap showed the expression level; red indicated high transcript abundance while blue indicated low abundance. (For interpretation of the references to colour in this figure legend, the reader is referred to the web version of this article.)
of
indicated the expressions of IL genes in spleen tissues post A.
challenge. As shown in Fig. 10E, IL-15l expressions were all significantly downregulated in gill, hepatopancreas, spleen, and head-kidney at 4 h compared to untreated control groups (p < 0.01).
4. Discussion
Cytokines are a class of pleiotropic molecules that play an important role in immune regulation, cell proliferation, and repair of damaged tissues (Xu and Su, 2021). As a class of cytokines that interact between leukocytes or immune cells, ILs play an important role in transmitting information, activating and regulating immune cells, mediating the activation, proliferation, and differentiation of T and B cells, and inflammatory responses (Akdis et al., 2011). However, due to the wide variety and number of IL genes and their complex classification, few articles have previously conducted a more complete and systematic study of ILs. In the present work, based on the C. idella genomic and transcriptomic datasets, we systematically identified all members of the IL family in grass carp. A total of 39 ILs were identified in grass carp, most of which remained to be functionally characterized. Subsequently, multiple phylogenetic trees were constructed by family classification to assess the evolutionary relationships of ILs among different species to
determine the evolution and possible functions of ILs. To further characterize these ILs, detailed analyses including gene structure, conserved pattern composition, chromosomal location, and gene duplication events were performed. In addition, based on transcriptomic data, the expression profiles of IL genes in different healthy tissues and tissues post GCRV or A. hydrophila challenge were also analyzed. Finally, qRTPCR verification of selected IL genes post A. hydrophila or GCRV challenge was performed.
In general, members within a subgroup may share a common evolutionary origin and conserved function (Li et al., 2020). Phylogenetic analysis may provide some new insights into the evolution of IL genes. In the phylogenetic tree of the IL-1 family made by several of our selected species (Fig. 1A), only a few members of IL-18, IL-1β, and IL1Ra were present in most species, except human and mouse. The other members probably emerged gradually during the evolution of the species, as confirmed by previous studies, and the IL-1 gene family was formed through successive gene duplications (Taylor et al., 2002). The phylogenetic tree of the IL-2 family showed (Fig. 1B) that IL-9 was not found in fish and might have emerged gradually during the evolutionary process. And a second gene copy of IL-15 had been found in the genome of some fish. In some cases, this might be due to duplication of the IL-15
Fig. 8. Expression patterns of IL genes in grass carp in different tissues or cells post GCRV or A. hydrophila challenge. (A) indicated the expressions
IL genes in C1, R2, and S3 post GCRV challenge. (B) indicated the expressions of IL genes in head-kidney and trunk-kidney tissues post GCRV challenge. (C)
hydrophila challenge. T.
Fig. 9. The transcripts of grass carp IL-1β (A), IL-6 (B), and IL-8 (C) genes in gill, hepatopancreas, spleen, and head-kidney post A. hydrophila challenge by qRT-PCR. 18S rRNA gene was employed as an internal reference (n = 5). Asterisks indicated significant differences between the treatment samples and the corresponding control samples. (*p ≤ 0.05, **p ≤ 0.01).
locus, which seemed to have occurred several times during fish evolution (Buonocore et al., 2020). The phylogenetic tree of the IL-6 family showed (Fig. 1C) that M17 was specific to fish and was grouped with the mammalian LIF and OSM clades. The possible reason for this was that the ancestor of M17 evolved as fish M17, which was expanded by gene duplication in mammals to give rise to mammalian LIF and OSM. Another ancestral gene evolved as CNTF-like in fish but might have undergone two rounds of gene duplication after divergence from the main vertebrate lineage in fish, giving rise to mammalian CNTF, CLCF1, and CT-1 (Wang and Secombes, 2009). A second gene copy of CNTF and IL-11 had also been found in some fish genomes, which might be due to fish-wide genome duplication and tandem gene duplication events (Huising et al., 2006; Huising et al., 2005; Wang et al., 2008). The phylogenetic tree of the IL-10 family showed (Fig. 1D) that the IL-19l/IL20l gene in fish, which belonged to the same clade as IL-19, IL-20, and IL-24. It has been suggested that the fish IL-19l/IL-20l gene might have arisen from an ancestral gene that gave rise to IL-19, IL-20, and IL24 in higher vertebrates, rather than the fish IL-19l/IL-20l gene was an ortholog of mammalian IL-19/IL-20 (Wang et al., 2010b). The phylogenetic tree of the IL-12 family showed (Fig. 1E) that at least two copies of the p35 gene and at least three copies of the p40 gene were present in fish compared to mammals, which might be due to genome-wide replication events in fish (Wang and Husain, 2014). The phylogenetic tree of the IL-17 family showed (Fig. 1F) that the orthologous genes of the teleost clustered in a single branch, indicating that the IL-17 family genes were highly conserved, a result that was consistent with previous
findings (Gunimaladevi et al., 2006; Wang et al., 2014b). Since IL-17N, which was unique to teleost, was closely related to IL-17C, it was hypothesized that the so-called teleost IL17N gene might have evolved from an ancestral IL-17C gene that subsequently gave rise to IL-17N and IL-17D (Dong et al., 2019).
The ordinal position and intron-exon distribution pattern of genomic regions can often be used as supportive evidence of gene family expansion patterns and their evolutionary relationship to ancestors (Mach, 2009). In the present study, there were some differences in gene structure among members of the same family while maintaining conservation (Fig. 2A). These differences were particularly evident in members of the IL-1 family. The numbers of exons in the IL-1 family genes were 5, 6, and 7, and there was significant structural variation in the tandem duplication pair of IL-1Ra (7 exons) and IL-1Ral (5 exons), which was also consistent with their larger values of Ka/Ks (0.52, 0.63, and 0.59). This suggested that the loss and gain of IL gene exons during genetic evolution might be responsible for the functional diversity of IL family members (Jiang et al., 2015; Wang and Husain, 2014). In addition, the structures of the IL genes in fish were very close to that of other higher vertebrates, with almost the same number of introns and exons, and even some exon sizes that did not vary across all species (Bei et al., 2006; Huising et al., 2004; Husain et al., 2012; Jiang et al., 2015; Tang et al., 2019; Wang and Secombes, 2009; Wang and Husain, 2014; Wang et al., 2010b; Yao et al., 2015). Conservative domain and motif analyses showed that not all ILs contained typical IL domains and that there was high variability in their motifs across families. Despite this, the domains
an internal reference (n = 5). Asterisks indicated significant differences between the treatment samples and the corresponding control samples. (*p ≤ 0.05, **p ≤ 0.01).
Fig. 10. mRNA expressions of grass carp IL-1β (A), IL-6 (B), IL-7 (C), IL-8 (D), IL-15l (E), and M17 (F) genes in gill, hepatopancreas, spleen, and head-kidney post GCRV challenge by qRT-PCR. 18S rRNA gene was employed as
and motifs were very conserved in members of the IL-10 family and IL17 family. These observations suggested that variations in the gene structure, deletions, and mutations of conserved motifs were also important for the functional diversity of grass carp IL family members and provide a reliable basis for the functional analysis of related genes in the corresponding families (Wang et al., 2014a).
Gene families typically evolve with whole-genome duplication (WGD), tandem duplication, and segmental duplication, resulting in a significant increase in the number of genes in the genome (Maere et al., 2005). In turn, larger genomes may lead to a diversification of gene functions, resulting in larger gene families, which in turn allow for more complex interactions and the evolution of gene networks (Aburomia et al., 2003; Cusack and Wolfe, 2007). We found that there were multiple copies of some IL genes, but these gene copies were not generated by tandem duplication, but potentially by segmental duplication or WGD. It was now generally accepted that vertebrate genomes underwent two rounds (2R) of massive gene duplication after the emergence of urochordates and before the radiation of jawed vertebrates (Flajnik and Kasahara, 2010; Van de Peer et al., 2009). Furthermore, most extant teleosts underwent an additional WGD (3R) during their early evolution compared to other vertebrates (Kassahn et al., 2009; Postlethwait, 2007). Therefore, mammalian genes might have two homologs in some teleost. For example, IL-11 and p35 were present in some teleost as IL11a, IL-11b, and p35a, p35b. Interestingly, the p40 gene in mammals had three copies in some teleost, p40a, p40b, and p40c. Studies have shown that the p40a and p40b genes in teleost were indeed homologs of vertebrate p40, probably due to 3R WGD, while teleost p40c perhaps occurred in a different manner (Wang and Husain, 2014). In addition, salmonids underwent further WGD (4R) based on 3R (Macqueen and Johnston, 2014). Thus, mammalian genes might have two homologs in some teleost and four homologs in salmonids. For example, the p35 gene was identified in salmonids with four loci (Wang and Husain, 2014). The mammalian IL-1β gene, although only one copy was identified in teleosts such as grass carp and zebrafish, two IL-1β genes were identified in tilapia and medaka from Perciformes and Belloniformes, and four IL-1β genes were identified in salmonids (Husain et al., 2012). Theoretically, the p40 gene should have identified six in salmonids, but the fact that only three were identified (p40b1, p40b2, and p40c) might since these 3R IL genes were all copied into salmonids by subsequent 4R WGD, generating additional copies, but some copies of the IL genes might have been lost or inactivated in some salmonids (Wang and Husain, 2014). Notably, the p19 and p28 genes in mammals had only one copy in some teleost, whereas in salmonids there were 2 copies (p19a, p19b, and p28a, p28b) (Husain et al., 2014; Jiang et al., 2015).
Previous studies have shown that IL-1β was expressed to varying degrees in most of the tissues examined, especially showing high expression in gill and head-kidney (Yang et al., 2017). Grass carp IL-1Ra was widely expressed in selected tissues, with relatively high abundance in head-kidney, kidney, and spleen (Yao et al., 2015). It has been reported that IL-1β and IL-6 were significantly upregulated in headkidney, spleen, and liver of Siberian sturgeon (Acipenser baeri) in response to A. hydrophila infection (Wang et al., 2021; Wang et al., 2020). The expression levels of IL-8 were significantly upregulated in trunk-kidney and head-kidney when mandarin fish (Siniperca chuasti) were challenged by the pathogenic bacterium F. columnare G4 (Wang et al., 2017). These results were consistent with the findings of our experiments. The expression level of IL-1β was reported to be significantly elevated in the orange-spotted grouper metamorphosis-stage post nervous necrosis virus (NNV) challenge and was positively correlated with viral content (Wu et al., 2012). The expression of the IL-8 gene was significantly upregulated after a large outbreak of NNV in Pacific cod, suggesting that the expression of IL-8 genes could enhance the immune system of Pacific cod larvae and improve survival post-viral challenge (Mao et al., 2015). In conclusion, all these IL genes play an extremely important role in the immune response.
5. Conclusions
In the present study, we identified all members of the grass carp IL and performed a systematic and comprehensive analysis. Based on the grass carp genomic and transcriptomic datasets, we identified a total of 39 ILs in grass carp, and they were unevenly distributed across 15 LGs and 9 scaffolds in grass carp. Subsequently, multiple phylogenetic trees were constructed by family classification to assess the evolutionary relationships of IL genes among different species. Gene structure, conserved domains, and motif analyses indicated that ILs were relatively conserved in the same gene family. Gene duplication and Ka and Ks substitution rate analyses indicated that segmental duplication events played a key role in the expansion of the IL gene family and underwent strong purifying selection pressure during evolution. Analysis of RNAseq data from different healthy tissues revealed that many IL genes were widely expressed in different tissues of grass carp. In addition, we further analyzed tissue RNA-seq data post GCRV or A. hydrophila challenge and found that the expressions of some IL genes were significantly upregulated or downregulated post-challenge. Finally, we performed the qRT-PCR verification of these genes, and the results showed that the expressions of IL-1β, IL-6, IL-7, IL-8, IL-15l, and M17 genes changed significantly in all four tissues examined post-challenge, suggesting that they played an important role in the immune responses to bacterial or viral infection. In conclusion, we performed a systematic study of all interleukin genes in grass carp, to advance the understanding of interleukin evolution and gene function in grass carp, especially the immune function involving GCRV or A. hydrophila challenge.
CRediT authorship contribution statement
Tianbing Xu: Methodology, Validation, Writing – original draft. Zhensheng Wang: Data curation and Validation. Yang Gao: Data curation and Validation. Jianguo Su: Conceptualization, Methodology, Project administration, Supervision, Writing – review & editing.
Declaration of Competing Interest
The authors declare that they have no known competing financial interests or personal relationships that could have appeared to influence the work reported in this paper.
Acknowledgements
This work was supported by National Key Research and Development Program of China (2018YFD0900504) and Fundamental Research Funds for the Central Universities (2662021SCPY006).
Appendix A. Supplementary data
Supplementary data to this article can be found online at https://doi. org/10.1016/j.aquaculture.2022.738266
References
Aburomia, R., Khaner, O., Sidow, A., 2003. Functional evolution in the ancestral lineage of vertebrates or when genomic complexity was wagging its morphological tail. J. Struct. Funct. Genom. 3, 45–52
Akdis, M., Burgler, S., Crameri, R., Eiwegger, T., Fujita, H., Gomez, E., Akdis, C.A., 2011. Interleukins, from 1 to 37, and interferon-γ: receptors, functions, and roles in diseases. J. Allergy Clin. Immunol. 127, 701–721.
Akdis, M., Aab, A., Altunbulakli, C., Azkur, K., Costa, R.A., Crameri, R., Akdis, C.A., 2016. Interleukins (from IL-1 to IL-38), interferons, transforming growth factor β, and TNF-α: receptors, functions, and roles in diseases. J. Allergy Clin. Immunol. 138, 984–1010
Almagro Armenteros, J.J., Tsirigos, K.D., Sønderby, C.K., Petersen, T.N., Winther, O., Brunak, S., Nielsen, H., 2019. SignalP 5.0 improves signal peptide predictions using deep neural networks. Nat. Biotechnol. 37, 420–423
Bailey, T.L., Boden, M., Buske, F.A., Frith, M., Grant, C.E., Clementi, L., Noble, W.S., 2009. MEME SUITE: tools for motif discovery and searching. Nucleic Acids Res. 37, W202–W208
Bei, J.X., Suetake, H., Araki, K., Kikuchi, K., Yoshiura, Y., Lin, H.R., Suzuki, Y., 2006. Two interleukin (IL)-15 homologues in fish from two distinct origins. Mol. Immunol. 43, 860–869
Buonocore, F., Gerdol, M., Pallavicini, A., Stocchi, V., Randelli, E., Belardinelli, M.C., Wang, T.H., 2020. Identification, molecular characterization and functional analysis of interleukin (IL)-2 and IL-2like (IL-2L) cytokines in sea bass (Dicentrarchus labrax L.). Cytokine. 126, 154898
Catalan-Dibene, J., McIntyre, L.L., Zlotnik, A., 2018. Interleukin 30 to Interleukin 40. J. Interf. Cytokine Res. 38, 423–439
Chao, J.T., Kong, Y.Z., Wang, Q., Sun, Y.H., Gong, D.P., Lv, J., Liu, G.S., 2015. MapGene2Chrom, a tool to draw gene physical map based on Perl and SVG languages. Yi chuan Hereditas. 37, 91–97.
Chen, Y.X., Shi, M.J., Zhang, W.T., Cheng, Y.Y., Wang, Y.P., Xia, X.Q., 2017. The Grass Carp Genome Database (GCGD): an online platform for genome features and annotations. Database 2017, bax051
Chen, S.F., Zhou, Y.Q., Chen, Y.R., Gu, J., 2018. fastp: an ultra-fast all-in-one FASTQ preprocessor. Bioinformatics. 34, i884–i890
Chen, C.J., Chen, H., Zhang, Y., Thomas, H.R., Frank, M.H., He, Y.H., Xia, R., 2020. TBtools: an integrative toolkit developed for interactive analyses of big biological data. Mol. Plant 13, 1194–1202
Chen, L., Huang, R., Li, Y., Li, Y., Li, Y., Liao, L., Wang, Y., 2021. Genome-wide identification, evolution of Krüppel-like factors (klfs) and their expressions during GCRV challenge in grass carp (Ctenopharyngodon idella). Dev. Comp. Immunol. 120, 104062
Commins, S., Steinke, J.W., Borish, L., 2008. The extended IL-10 superfamily: IL-10, IL19, IL-20, IL-22, IL-24, IL-26, IL-28, and IL-29. J. Allergy Clin. Immunol. 121, 1108–1111
Cusack, B.P., Wolfe, K.H., 2007. When gene marriages don’t work out: divorce by subfunctionalization. Trends Genet. 23, 270–272
Dang, Y.F., Xu, X.Y., Shen, Y.B., Hu, M.Y., Zhang, M., Li, L.S., Li, J.L., 2016. Transcriptome analysis of the innate immunity-related complement system in spleen tissue of Ctenopharyngodon idella infected with Aeromonas hydrophila PLoS One 11, e0157413
Dao, T., Ohashi, K., Kayano, T., Kurimoto, M., Okamura, H., 1996. Interferon-γ-inducing factor, a novel cytokine, enhances Fas ligand-mediated cytotoxicity of murine T helper 1 cells. Cell. Immunol. 173, 230–235.
Dong, C.J., Kong, S.N., Zheng, X.H., Zhang, J.F., Nie, G.X., Li, X.J., Xu, P., 2019. Genomewide identification of interleukin-17 (IL17) in common carp (Cyprinus carpio) and its expression following Aeromonas hydrophila infection. Gene. 686, 68–75
Finn, R.D., Clements, J., Eddy, S.R., 2011. HMMER web server: interactive sequence similarity searching. Nucleic Acids Res. 39, W29–W37 Flajnik, M.F., Kasahara, M., 2010. Origin and evolution of the adaptive immune system: genetic events and selective pressures. Nat. Rev. Genet. 11, 47–59 Garbers, C., Hermanns, H.M., Schaper, F., Müller-Newen, G., Grotzinger, J., RoseJohn, S., Scheller, J., 2012. Plasticity and cross-talk of interleukin 6-type cytokines.
Cytokine Growth Factor Rev. 23, 85–97
Gasteiger, E., Gattiker, A., Hoogland, C., Ivanyi, I., Appel, R.D., Bairoch, A., 2003.
ExPASy: the proteomics server for in-depth protein knowledge and analysis. Nucleic Acids Res. 31, 3784–3788
Gunimaladevi, I., Savan, R., Sakai, M., 2006. Identification, cloning and characterization of interleukin-17 and its family from zebrafish. Fish Shellfish Immunol. 21, 393–403 Howe, K., Clark, M.D., Torroja, C.F., Torrance, J., Berthelot, C., Muffato, M., Stemple, D. L., 2013. The zebrafish reference genome sequence and its relationship to the human genome. Nature. 496, 498–503
Hu, B., Jin, J.P., Guo, A.Y., Zhang, H., Luo, J.C., Gao, G., 2015. GSDS 2.0: an upgraded gene feature visualization server. Bioinformatics. 31, 1296–1297
Huising, M.O., Stet, R.J.M., Savelkoul, H.F.J., Verburg-van Kemenade, B.M.L., 2004. The molecular evolution of the interleukin-1 family of cytokines; IL-18 in teleost fish. Dev. Comp. Immunol. 28, 395–413.
Huising, M.O., Kruiswijk, C.P., van Schijndel, J.E., Savelkoul, H.F.J., Flik, G., Verburgvan Kemenade, B.M.L., 2005. Multiple and highly divergent IL-11 genes in teleost fish. Immunogenetics. 57, 432–443
Huising, M.O., Kruiswijk, C.P., Flik, G., 2006. Phylogeny and evolution of class-I helical cytokines. J. Endocrinol. 189, 1–25
Hurst, L.D., 2002. The Ka/Ks ratio: diagnosing the form of sequence evolution. Trends Genet. 18, 486
Husain, M., Bird, S., Zwieten, R.v., Secombes, C.J., Wang, T.H., 2012. Cloning of the IL1β3 gene and IL-1β4 pseudogene in salmonids uncovers a second type of IL-1β gene in teleost fish. Dev. Comp. Immunol. 38, 431–446
Husain, M., Martin, S.A.M., Wang, T.H., 2014. Identification and characterisation of the IL-27 p28 subunits in fish: cloning and comparative expression analysis of two p28 paralogues in Atlantic salmon Salmo salar Fish Shellfish Immunol. 41, 102–112 Ilangumaran, S., Ramanathan, S., Rottapel, R., 2004. Regulation of the immune system by SOCS family adaptor proteins. Semin. Immunol. 16, 351–365 Jiang, Y.S., Husain, M., Qi, Z.T., Bird, S., Wang, T.H., 2015. Identification and expression analysis of two interleukin-23α (p19) isoforms, in rainbow trout Oncorhynchus mykiss and Atlantic salmon Salmo salar Mol. Immunol. 66, 216–228
Kall, L., Krogh, A., Sonnhammer, E.L.L., 2007. Advantages of combined transmembrane topology and signal peptide prediction the Phobius web server. Nucleic Acids Res. 35, W429–W432
Kany, S., Vollrath, J.T., Relja, B., 2019. Cytokines in inflammatory disease. Int. J. Mol. Sci. 20, 6008
Kassahn, K.S., Dang, V.T., Wilkins, S.J., Perkins, A.C., Ragan, M.A., 2009. Evolution of gene function and regulatory control after whole-genome duplication: comparative analyses in vertebrates. Genome Res. 19, 1404–1418
Kim, D., Paggi, J.M., Park, C., Bennett, C., Salzberg, S.L., 2019. Graph-based genome alignment and genotyping with HISAT2 and HISAT-genotype. Nat. Biotechnol. 37, 907–915
Krogh, A., Larsson, B., von Heijne, G., Sonnhammer, E.L.L., 2001. Predicting transmembrane protein topology with a hidden markov model: application to complete genomes. J. Mol. Biol. 305, 567–580
Kumar, S., Stecher, G., Li, M., Knyaz, C., Tamura, K., 2018. MEGA X: molecular evolutionary genetics analysis across computing platforms. Mol. Biol. Evol. 35, 1547–1549.
Larkin, M.A., Blackshields, G., Brown, N.P., Chenna, R., McGettigan, P.A., McWilliam, H., Higgins, D.G., 2007. Clustal W and Clustal X version 2.0. Bioinformatics. 23, 2947–2948.
Leonard, W.J., Lin, J.X., O’Shea, J.J., 2019. The γc family of cytokines: basic biology to therapeutic ramifications. Immunity. 50, 832–850
Letunic, I., Bork, P., 2021. Interactive Tree Of Life (iTOL) v5: an online tool for phylogenetic tree display and annotation. Nucleic Acids Res. 49, W293–W296
Letunic, I., Khedkar, S., Bork, P., 2021. SMART: recent updates, new developments and status in 2020. Nucleic Acids Res. 49, D458–D460
Li, Y.M., Lin-Wang, K., Liu, Z., Allan, A.C., Qin, S.H., Zhang, J.L., Liu, Y.H., 2020. Genome-wide analysis and expression profiles of the StR2R3-MYB transcription factor superfamily in potato (Solanum tuberosum L.). Int. J. Biol. Macromol. 148, 817–832
Liao, Y., Smyth, G.K., Shi, W., 2014. featureCounts: an efficient general purpose program for assigning sequence reads to genomic features. Bioinformatics. 30, 923–930
Liu, L., Gong, Y.X., Zhu, B., Liu, G.L., Wang, G.X., Ling, F., 2015. Effect of a new recombinant Aeromonas hydrophila vaccine on the grass carp intestinal microbiota and correlations with immunological responses. Fish Shellfish Immunol. 45, 175–183
Lv, M.Y., Wang, X.Y., Qiu, X.Y., Zeng, T.T., Feng, S.Y., Yin, L.C., Yang, K., 2020. Functional characterization of grass carp (Ctenopharyngodon idella) interleukin-2 in head kidney leukocytes. Fish Shellfish Immunol. 97, 500–508
Mach, J., 2009. Alternative splicing produces a JAZ protein that is not broken down in response to jasmonic acid. Plant Cell 21, 14
Macqueen, D.J., Johnston, I.A., 2014. A well-constrained estimate for the timing of the salmonid whole genome duplication reveals major decoupling from species diversification. Proc. R. Soc. B 281, 20132881.
Maere, S., De Bodt, S., Raes, J., Casneuf, T., Van Montagu, M., Kuiper, M., Van de Peer, Y., 2005. Modeling gene and genome duplications in eukaryotes. Proc. Natl. Acad. Sci. U. S. A. 102, 5454–5459
Mao, M.G., Wen, S.H., Peralvarez-Marín, A., Li, H., Jiang, J.L., Jiang, Z.Q., Lü, H.Q., 2015. Evidence for and characterization of nervous necrosis virus infection in Pacific cod (Gadus macrocephalus). Arch. Virol. 160, 2237–2248
Marchler-Bauer, A., Derbyshire, M.K., Gonzales, N.R., Lu, S.N., Chitsaz, F., Geer, L.Y., Bryant, S.H., 2015. CDD: NCBI’s conserved domain database. Nucleic Acids Res. 43, D222–D226
McGeachy, M.J., Cua, D.J., Gaffen, S.L., 2019. The IL-17 family of cytokines in health and disease. Immunity. 50, 892–906
Murakami, M., Kamimura, D., Hirano, T., 2019. Pleiotropy and specificity: insights from the interleukin 6 family of cytokines. Immunity. 50, 812–831
Ouyang, W., O’Garra, A., 2019. IL-10 family cytokines IL-10 and IL-22: from basic science to clinical translation. Immunity. 50, 871–891
Postlethwait, J.H., 2007. The zebrafish genome in context: ohnologs gone missing. J. Exp. Zool. (Mol. Dev. Evol.) 308B, 563–577
Rivers-Auty, J., Daniels, M.J.D., Colliver, I., Robertson, D.L., Brough, D., 2018. Redefining the ancestral origins of the interleukin-1 superfamily. Nat. Commun. 9, 1156
Saitou, N., Nei, M., 1987. The neighbor-joining method: a new method for reconstructing phylogenetic trees. Mol. Biol. Evol. 4, 406–425
Savojardo, C., Martelli, P.L., Fariselli, P., Profiti, G., Casadio, R., 2018. BUSCA: an integrative web server to predict subcellular localization of proteins. Nucleic Acids Res. 46, W459–W466
Schmitz, J., Owyang, A., Oldham, E., Song, Y., Murphy, E., McClanahan, T.K., Kastelein, R.A., 2005. IL-33, an Interleukin-1-like cytokine that signals via the IL-1 receptor-related protein ST2 and induces T helper type 2-associated cytokines. Immunity. 23, 479–490
Secombes, C.J., Wang, T., Bird, S., 2011. The interleukins of fish. Dev. Comp. Immunol. 35, 1336–1345
Shang, X.Y., Yang, C.R., Wan, Q.Y., Rao, Y.L., Su, J.G., 2017. The destiny of the resistance/susceptibility against GCRV is controlled by epigenetic mechanisms in CIK cells. Sci. Rep. 7, 4551
Shi, M.J., Huang, R., Du, F.K., Pei, Y.Y., Liao, L.J., Zhu, Z.Y., Wang, Y.P., 2014. RNA-seq profiles from grass carp tissues after reovirus (GCRV) infection based on singular and modular enrichment analyses. Mol. Immunol. 61, 44–53
Smith, A.J.P., Humphries, S.E., 2009. Cytokine and cytokine receptor gene polymorphisms and their functionality. Cytokine Growth Factor Rev. 20, 43–59
Su, J.G., Zhang, R.F., Dong, J., Yang, C.R., 2011. Evaluation of internal control genes for qRT-PCR normalization in tissues and cell culture for antiviral studies of grass carp (Ctenopharyngodon idella). Fish Shellfish Immunol. 30, 830–835
Sun, B.Y., Xiao, L.Y., Kou, H.Y., Yang, C.G., Guo, P.H., He, W., Song, X.H., 2020a. Different routes of Aeromonas hydrophila infection lead to differential grass carp interleukin-17 family gene expression patterns during intestinal inflammation. Aquaculture. 529, 735607
Sun, L.N., Gao, T., Wang, F.L., Qin, Z.L., Yan, L.X., Tao, W.J., Wang, D.S., 2020b. Chromosome-level genome assembly of a cyprinid fish Onychostoma macrolepis by integration of nanopore sequencing, Bionano and Hi-C technology. Mol. Ecol. Resour. 20, 1361–1371
Szklarczyk, D., Gable, A.L., Lyon, D., Junge, A., Wyder, S., Huerta-Cepas, J., Mering, C.v., 2019. STRING v11: protein-protein association networks with increased coverage, supporting functional discovery in genome-wide experimental datasets. Nucleic Acids Res. 47, D607–D613
Tait Wojno, E.D., Hunter, C.A., Stumhofer, J.S., 2019. The immunobiology of the interleukin-12 family: room for discovery. Immunity. 50, 851–870
Tang, D.D., Wu, S.P., Luo, K., Yuan, H.W., Gao, W.H., Zhu, D.S., Xu, Q.Q., 2019. Sequence characterization and expression pattern analysis of six kinds of IL-17 family genes in the Asian swamp eel (Monopterus albus). Fish Shellfish Immunol. 89, 257–270.
Taylor, S.L., Renshaw, B.R., Garka, K.E., Smith, D.E., Sims, J.E., 2002. Genomic organization of the Interleukin-1 locus. Genomics. 79, 726–733
Van de Peer, Y., Maere, S., Meyer, A., 2009. The evolutionary significance of ancient genome duplications. Nat. Rev. Genet. 10, 725–732
Wan, Q.Y., Su, J.G., 2015. Transcriptome analysis provides insights into the regulatory function of alternative splicing in antiviral immunity in grass carp (Ctenopharyngodon idella). Sci. Rep. 5, 12946
Wang, T.H., Husain, M., 2014. The expanding repertoire of the IL-12 cytokine family in teleost fish: identification of three paralogues each of the p35 and p40 genes in salmonids, and comparative analysis of their expression and modulation in Atlantic salmon Salmo salar Dev. Comp. Immunol. 46, 194–207
Wang, T.H., Secombes, C.J., 2009. Identification and expression analysis of two fishspecific IL-6 cytokine family members, the ciliary neurotrophic factor (CNTF)-like and M17 genes, in rainbow trout Oncorhynchus mykiss Mol. Immunol. 46, 2290–2298
Wang, T.H., Hanington, P.C., Belosevic, M., Secombes, C.J., 2008. Two macrophage colony-stimulating factor genes exist in fish that differ in gene organization and are differentially expressed. J. Immunol. 181, 3310
Wang, D.P., Zhang, Y.B., Zhang, Z., Zhu, J., Yu, J., 2010a. KaKs_Calculator 2.0: a toolkit incorporating gamma-series methods and sliding window strategies. Genom. Proteom. Bioinf. 8, 77–80
Wang, T.H., Díaz-Rosales, P., Martin, S.A.M., Secombes, C.J., 2010b. Cloning of a novel interleukin (IL)-20-like gene in rainbow trout Oncorhynchus mykiss gives an insight into the evolution of the IL-10 family. Dev. Comp. Immunol. 34, 158–167.
Wang, Y.P., Tang, H.B., Debarry, J.D., Tan, X., Li, J.P., Wang, X.Y., Paterson, A.H., 2012. MCScanX: a toolkit for detection and evolutionary analysis of gene synteny and collinearity. Nucleic Acids Res. 40, e49
Wang, H.L., Yang, J., Boykin, L.M., Zhao, Q.Y., Wang, Y.J., Liu, S.S., Wang, X.W., 2014a. Developing conversed microsatellite markers and their implications in evolutionary analysis of the Bemisia tabaci complex. Sci. Rep. 4, 6351
Wang, X.Q., Li, C., Thongda, W., Luo, Y.P., Beck, B., Peatman, E., 2014b. Characterization and mucosal responses of interleukin 17 family ligand and receptor genes in channel catfish Ictalurus punctatus Fish Shellfish Immunol. 38, 47–55
Wang, Y., Lu, Y., Zhang, Y., Ning, Z., Li, Y., Zhao, Q., Zhu, Z., 2015. The draft genome of the grass carp (Ctenopharyngodon idellus) provides insights into its evolution and vegetarian adaptation. Nat. Genet. 47, 625–631
Wang, X., Wei, Y., Xiao, H., Liu, X., Zhang, Y., Han, G., Wang, R., 2016. A novel IL23p19/Ebi3 (IL-39) cytokine mediates inflammation in lupus-like mice. Eur. J. Immunol. 46, 1343–1350
Wang, G.L., Wang, M.C., Zhang, X.W., Chang, M.X., Xie, H.X., Nie, P., 2017. Molecular cloning, biological effect, and tissue distribution of interleukin-8 protein in mandarin fish (Siniperca chuasti) upon Flavobacterium columnare infection. Fish Shellfish Immunol. 66, 112–119
Wang, X.W., Chen, J.Y., Zhang, R., Liu, L.L., Ma, G.Q., Zhu, H., 2020. Interleukin-6 in Siberian sturgeon (Acipenser baeri): molecular characterization and immune functional activity. Fish Shellfish Immunol. 102, 296–306
Wang, X.W., Zhang, R., Liu, L.L., Ma, G.Q., Zhu, H., 2021. An IL-1β homologue induced inflammation and antibacterial immune defense in Siberian sturgeon (Acipenser baeri). Fish Shellfish Immunol. 118, 283–293
Wang, Z.S., Huo, X.C., Zhang, Y.Q., Gao, Y., Su, J.G., 2022. Carboxymethyl chitosan nanoparticles loaded with bioactive protein CiCXCL20a effectively prevent bacterial disease in grass carp (Ctenopharyngodon idella). Aquaculture. 549, 737745
Wu, M.S., Chen, C.W., Lin, C.H., Tzeng, C.S., Chang, C.Y., 2012. Differential expression profiling of orange-spotted grouper larvae, Epinephelus coioides (Hamilton), that survived a betanodavirus outbreak. J. Fish Dis. 35, 215–225
Xu, T.B., Su, J.G., 2021. Genome-wide identification, evolution, and transcriptome-based expression profiling analysis of suppressors of cytokine signaling (SOCS) in grass carp (Ctenopharyngodon idella). Aquaculture. 536, 736484
Xu, P., Xu, J., Liu, G.J., Chen, L., Zhou, Z.X., Peng, W.Z., Sun, X.W., 2019. The allotetraploid origin and asymmetrical genome evolution of the common carp Cyprinus carpio Nat. Commun. 10, 4625
Xue, Y.J., Jiang, X.Y., Gao, J.D., Li, X., Xu, J.W., Wang, J.Y., Zou, J., 2019. Functional characterisation of interleukin 34 in grass carp Ctenopharyngodon idella Fish Shellfish Immunol. 92, 91–100
Yang, Y., Yu, H., Li, H., Wang, A.L., 2016a. Transcriptome profiling of grass carp (Ctenopharyngodon idellus) infected with Aeromonas hydrophila Fish Shellfish Immunol. 51, 329–336
Yang, Z.J., Li, C.H., Chen, J., Zhang, H., Li, M.Y., Chen, J., 2016b. Molecular characterization of an interleukin-4/13B homolog in grass carp (Ctenopharyngodon idella) and its role in fish against Aeromonas hydrophila infection. Fish Shellfish Immunol. 57, 136–147
Yang, Q., Chu, Q., Zhao, X.Y., Xu, T.J., 2017. Characterization of IL-1β and two types of IL-1 receptors in miiuy croaker and evolution analysis of IL-1 family. Fish Shellfish Immunol. 63, 165–172.
Yao, F.L., Yang, X., Wang, X.Y., Wei, H., Zhang, A.Y., Zhou, H., 2015. Molecular and functional characterization of an IL-1β receptor antagonist in grass carp (Ctenopharyngodon idella). Dev. Comp. Immunol. 49, 207–216
Yu, C.S., Chen, Y.C., Lu, C.H., Hwang, J.K., 2006. Prediction of protein subcellular localization. Proteins Struct. Funct. Bioinf. 64, 643–651
Zhang, A., Jian, X., Wang, D., Ren, J., Wang, X., Zhou, H., 2020. Characterization and bioactivity of grass carp (Ctenopharyngodon idella) interleukin-21: inducible production and involvement in inflammatory regulation. Fish Shellfish Immunol. 99, 19–26