Aquaculture
journal homepage: www.elsevier.com/locate/aquaculture
Construction of first genetic linkage map based on microsatellite markers and characterization of di- and tri-nucleotide microsatellite markers for
Crassostrea hongkongesis
Haitao Ma a, b, c, d, 1 , Dongmei Yu e, 1 , Jun Li a, b, c, d , Yanping Qin a, b, c, d , Yuehuan Zhang a, b, c, d, * , Ziniu Yu a, b, c, d, *
a Key Laboratory of Tropical Marine Bio-resources and Ecology, Guangdong Provincial Key Laboratory of Applied Marine Biology, South China Sea Institute of Oceanology, Chinese Academy of Sciences, Guangzhou 510301, China
b Southern Marine Science and Engineering Guangdong Laboratory (Guangzhou), Guangzhou 511458, China
c Innovation Academy of South China Sea Ecology and Environmental Engineering, Chinese Academy of Sciences, Guangzhou 510301, China
d Hainan Provincial Key Laboratory of Tropical Marine Biology Technology, Sanya Institute of Oceanology Chinese Academy of Sciences, Sanya 572024, China
e Guangdong Key Laboratory of Animal Conservation and Resource Utilization, Guangdong Public Laboratory of Wild Animal Conservation and Utilization, Institute of Zoology, Guangdong Academy of Sciences, Guangzhou, China
ARTICLE INFO
Keywords:
Crassostrea hongkongensis
Genetic linkage map
Microsatellite
Tri-nucleotide microsatellite
Di-nucleotide microsatellite
ABSTRACT
Hong Kong oyster Crassostrea hongkongensis is an important aquaculture species in the coastal areas of southern China. Because of its high demand and reasonable price, the production of Cohnella hongkongensis has increased drastically. However, the aquaculture of C. hongkongensis has also encountered some problems, such as seasonal mass mortality and reduction of availability and quality of wild seeds. Genetic linkage map is an effective tool for analyzing economically important traits. In this study, a consensus genetic map of C. hongkongensis was constructed by using microsatellite markers of F1 family. The consensus linkage map contained 104 loci, with a span of 653.9 cM and an average resolution of 6.9 cM. The estimated coverage of consensus linkage map was 85%. We identified 10 linkage groups, which were consistent with the haploid chromosome number of the species. The linkage map of male C. hongkongensis comprised 57 markers with a span of 467.6 cM, while the linkage map of female C. hongkongensis comprised 72 markers with a span of 570.9 cM. The average recombination ratio between males and females was 1:1.2. This map is vital for future QTL mapping framework of C. hongkongensis to perform marker assisted selection. Moreover, compared with di-nucleotide microsatellite markers, tri-nucleotide microsatellite markers have significantly stronger correlation with functional genes and cross-amplification success. We also found that the application potential of tri-nucleotide microsatellite markers in molecularmarker assisted selection gene mapping, and comparative linkage mapping was greater than that of dinucleotide markers.
1. Introduction
Hong Kong oyster (Crassostrea hongkongensis) is an endemic and commercially important bivalve, which is mainly distributed in the coastal waters of the South China Sea (Lam and Morton, 2003). C. hongkongensis aquaculture has a history of hundreds of years and is one of the largest coastal industries in the region. By 2020, the annual production of C. hongkongensis has reached nearly 1.79 million tons
(1.13 tons in Guangdong and 0.66 tons in Guangxi) (People's Republic of China Ministry of Agriculture, 2021). In recent years, the increasing demand for oyster products and the decline of wild stocks have led to the increase of C. hongkongensis aquaculture activities. However, with the extensive aquaculture practice, the aquaculture of C. hongkongensis has also encountered some challenges, including the decline in the availability and quality of wild seeds. To achieve the sustainable C. hongkongensis aquaculture, broodstock selection with desired
* Corresponding authors at: Key Laboratory of Tropical Marine Bio-resources and Ecology, Guangdong Provincial Key Laboratory of Applied Marine Biology, South China Sea Institute of Oceanology, Chinese Academy of Sciences, Guangzhou 510301, China. E-mail addresses: yhzhang@scsio.ac.cn (Y. Zhang), carlzyu@scsio.ac.cn (Z. Yu).
1 These authors contributed equally to this work.
https://doi.org/10.1016/j.aquaculture.2022.738272
Received 23 February 2022; Received in revised form 8 April 2022; Accepted 15 April 2022
Availableonline20April2022
0044-8486/©2022ElsevierB.V.Allrightsreserved.
aquaculture traits (e.g. high fecundity, fast growth and etc) is urgently needed. In general, it is believed that with the help of marker-assisted selection (MAS), production traits and selective breeding process can be efficiently improved and accelerated, respectively (Collard et al., 2005), in which genetic mapping is the first key step.
Genetic map has become an important tool for oyster genome research. With the rapid development of sequencing and genotyping technology, the application of dominant markers in linkage map construction is gradually replaced by co-dominant markers (SNP and microsatellites) (Liu, 2007). To date, SNPs and microsatellites have been used as the main markers in oyster genetic mapping, such as Crassostrea gigas (Hubert and Hedgecock, 2004; Hubert et al., 2009; Hedgecock et al., 2015; Li et al., 2018; Shi et al., 2020), Crassostrea virginica (Yu and Guo, 2003), Ostrea edulis (Lallias et al., 2007; Lallias et al., 2009). These genetic maps allow rapid analysis of QTL that responsible for aquaculture important traits, such as growth (Guo et al., 2012; Wang et al., 2016), nutrition (Zhong et al., 2014; Shi et al., 2020), disease resistance (Yu and Guo, 2006; Lallias et al., 2009; Sauvage et al., 2010), and shell color (Zhong et al., 2014; Wang et al., 2018). In general, SNPs are currently the preferred genetic markers because they are abundance, stable, simple, and may be directly related to phenotypes (Liu and Cordes, 2004). On the other hand, microsatellites have some advantages, including their wide distribution in eukaryotic genomes, hyperallelic and PCR-based (Jewell et al., 2006). Microsatellite markers on the genetic maps are easier to be selected for genetic analysis of species.
The increased availability of microsatellite markers and SNPs based linkage maps provided an opportunity to accelerate the comparative study of oyster genome. At present, the assembled whole genome sequences of four oyster species are available, including C. gigas (Zhang et al., 2012; Penaloza et al., 2021), Crassostrea hongkongensis (Peng et al., 2020), Crassostrea ariakensis (Wu et al., 2021), Saccostrea glomerata (Powell et al., 2018). Blasting mapped marker sequences against these whole genome sequences can identify potential candidate genes (Wang et al., 2011a, 2011b).
In the present study, based on segregation analysis of 105 microsatellite markers in 119 F1 progenies of C. hongkongensis full-sib family, the first genetic linkage map for the C. hongkongensis was constructed.
2. Materials and methods
2.1. Mapping family and DNA extraction
F1 full-sib family was produced by artificial fertilization in the Zhanjiang Marine Economic Animal Station hatchery at the South China Sea Institute of Oceanology of the Chinese Academy of Sciences in 2015. The paternal and maternal individuals were sexually mature wild individuals from Zhuhai and Zhanjiang, respectively. In the sea area around Zhanjiang, parental oysters and 240 progenies were randomly sampled after 18 months of long line cultivation. The soft tissues of each oyster were harvested and preserved in 70% ethanol and stored at 80 ◦ C.
2.2. Individual identification of mapping family
Based on the shell morphology and gill tube structure, the C. hongkongensis were identified (Wang et al., 2004). Subsequently, the microsatellite marker Ch409 developed by our laboratory was used for secondary oyster species identification. The primer sequences were 5’CGACTGGTGGGAGTTTCTGAC-3′ (forward) and 5’GCCGCTTCTATCTCCTTTGC-3′ (reverse). PCR was performed in 25 μL volume containing 2.0 mM MgCl2, 0.2 mM dNTP, 0.2 mM of each primer, 50 ng of template DNA, 1 U Taq polymerase and 2.5 μL of 10 × PCR buffer. The thermal cycles protocol consisted of an initial denaturation at 94 ◦ C for 5 min; 30 cycles for 30s at 94 ◦ C, 30s at 60 ◦ C, and 1 min at 72 ◦ C; and a final extension for 10 min at 72 ◦ C. Thirdly, 5 highly polymorphic microsatellite markers of C. hongkongensis were used to
conduct paternity tests on the offspring of mapping family (Ch103, Ch201, Ch305, Ch697, Ch720). The amplified fragments were isolated by 8% non-denaturing polyacrylamide gel electrophoresis and visualized by silver staining. A 50-bp DNA ladder (Takara) was used as reference markers for allele size determination. The allelic determination was made manually with the software package of GEL-PRO analyzer. The progeny and their parents were identified by the specific length of PCR products.
2.3. Microsatellite analysis
A total of 105 microsatellite markers were used to construct the linkage map. Fifty five microsatellite markers were assembled from different sources: 25 (ch102-ch114, ch201-ch248, ch304-ch318, ch409ch424) were from previous publications (Xia et al., 2009; Li and Yu, 2010; Xiao et al., 2011; Li et al., 2011), and 23 previously cloned loci in this laboratory were renamed as ch4403-ch4433 and ch5517-ch5539 (Ma et al., 2021; Ma et al., 2016). The other 7 microsatellite markers were obtained from C. gigas related species (Hubert and Hedgecock, 2004).
In addition, two microsatellite-enriched partial genomic libraries containing di-nucleotide (CA-, GA-) and tri-nucleotide (CAT-, GAT-) microsatellite repeats were constructed using the method described by Carleton et al. (2002) with some modifications. From each library, 200 clones were sequenced in both directions with SP6 and T7 primers and Big-Dye chemicals on an ABI3130 Genetic Analyzer (Applied Biosystems). Microsatellite loci containing five or more di-nucleotide repeat units, four or more tri-nucleotide repeat units and enough flanking regions were identified using the program Primer 3.0 (Rozen and Skaletsky, 2000) for primer design. A total of 30 wild C. hongkongensis were sampled from Zhuhai, Guangdong province, and were analyzed by PCR to evaluate these loci. All polymorphic tri-nucleotide microsatellite markers obtained from C. hongkongensis were then used to analyze the transferability of two closely related species, C. gigas and C. ariakensis, with 22 oysters of each species were randomly obtained from wild populations in Weihai (Shandong province) and Beihai (Guangxi Province), China, respectively.
Next, based on score clarity, amplification efficiency and polymorphism, the mapping suitability of all microsatellite markers was evaluated using the parents and four progenies of the mapping family. PCR amplification was performed using Verit™ thermcycler (Applied Biosystems), with a volume of 20 μL containing 20-100 ng of total DNA, 0.2-1 μM of each primer, 0.2 mM dNTPs, 1.0–2.0 mM MgCL2, 1 × PCR buffer, and 0.25–0.5 U of Taq polymerase (Tiangen, China). PCR conditions were as follows: initial denaturation for 5 min at 94 ◦ C, then 30 cycles for 40s at 94 ◦ C, a primer-specific annealing temperature (Supplementary 1) for 40 s and at 72 ◦ C for 1 min, with a final extension for 10 min at 72 ◦ C. PCR products were then separated and visualized by 8% non-denaturing polyacrylamide gel and silver staining, respectively.
2.4. Linkage analyses and genome coverage
JoinMap 3.0 was used for linkage analysis of sex-specific maps under BC1 algorithm (Van Ooijen and Voorrips, 2001). Mendelian inheritance was used to check for inconsistencies in family genotype data, and then the errors were corrected manually. Chi-square test was used to analyze the goodness of fit of the expected segregation ratio of genotyping data at a confidence level of 0.05. Then, all loci, including those with distorted segregations, were used for linkage analysis. The Kosambi function was used to perform map construction, and the Joinmap parameter was set to minimum LOD score of 3.0. The region showing significant segregation distortion at >2 adjacent loci was defined as segregation distortion region (SDR). Based on the common markers in the female and male maps, a consensus linkage map was constructed, and Mapchart software was used to draw the graphical linkage maps (Voorrips, 2002).
Genome length was estimated by two approaches. Genome
estimation size 1 (Ge 1) was calculated to by adding twice the average marker spacing to the length of each linkage group (Fishman et al., 2001). Genome estimation size 2 (Ge 2) was determined using the proposed method 4, where the total length of the linkage groups is multiplied by the factor (m + 1) / (m-1), where m is the number of loci on each group (Chakravarti et al., 1991). The estimated genome size of C. hongkongensis was the average of the two estimates.
2.5. Prediction of potential candidate genes
Potential candidate genes were identified by microsatellite markers located in genetic linkage maps. The putative functions of the newly developed microsatellite markers in this study were annotated by BLASTX against the NCBI Reference Sequence Database for nonredundant proteins (https://www.ncbi.nlm.nih.gov/refseq/). Only sequence matching with minimum alignment hits of e < 10 5 were used to detect possible candidate genes. Gene names were assigned to each microsatellite marker based on the best Blast hit.
3. Results
3.1. Marker development
A total of 50 novel microsatellite markers were identified and used for linkage mapping (Supplementary 1). Among them, 19 were dinucleotide microsatellite markers, 28 were tri-nucleotide microsatellite markers, 2 were mono-nucleotide microsatellite markers and 1 was minisatellite marker. The average number of alleles of di-nucleotide microsatellite markers and tri-nucleotide microsatellite markers was 10.53 and 7.46, respectively. Furthermore, 14 and 10 of the 28 trinucleotide microsatellite markers were successfully cross-amplified in C. ariakensis and C. gigas, respectively (Table 1). From the 105 microsatellite markers tested, all these markers were segregated and reliably scored in the mapping family.
3.2. Individual identification of mapping family
A total of 240 individuals were sampled from C. hongkongensis mapping family. After morphological characteristics and identification with microsatellite marker Ch409, 114 were found to be not individuals of C. hongkongensis, and the remaining 126 were descendants of C. hongkongensis Subsequently, paternity tests based on 5 microsatellite markers found that 7 individuals were non mapping family individuals. Finally, 119 individuals were identified as the true descendants of the mapping family and used for mapping construction.
3.3. Linkage map and segregation distortion
The linkage map of male C. hongkongensis contained 57 markers found in 9 linkage groups (Fig. 1, Table 2). The total length of the linkage map of male C. hongkongensis was 467.6 cM, and the length of each group was ranged between 23.5 cM and 77.1 cM. The number of microsatellite markers in each linkage group ranged from 3 to 10 markers. The remaining 4 were distributed as two doublets. The linkage map of female C. hongkongensis contained 72 markers found in 9 linkage groups (Fig. 1, Table 2). The total length of linkage map of female C. hongkongensis was 570.9 cM, the length of each group was ranged between 36.7 cM and 132.2 cM, and each contained at least three markers. The remaining 4 markers were distributed as two doublets. The comparison of the linkage maps of male and female C. hongkongensis revealed that the consensus map was consisted of 104 markers, covering 653.9 cM, and the average inter-marker spacing was 6.9 cM (Fig. 1, Table 2). A total of 10 linkage groups (LGs) were identified. The length of linkage groups ranged between 25.6 cM and 128.5 cM, and the number of markers varied from 3 to 20 per linkage group.
The segregation distortion of female map (26 of the assigned loci)
Table 1
Cross-species amplification of 50 novel microsatellite markers between Crassostrea hongkongesis and two closely related Crassostrea species.
Locus Repeat motif Cohnella hongkongensis Crassostrea ariakensis C. gigas
ch504 di-nucleotide 8 215
238
ch507 di-nucleotide 7 320
ch510 di-nucleotide 10 273
ch522 di-nucleotide 4 300
ch551 di-nucleotide 4 328
336
295
329
365
ch553 di-nucleotide 8 166
198
ch555 di-nucleotide 10 234
268
ch556 di-nucleotide 9 250
ch558 di-nucleotide 13 372
ch559 trinucleotide 6 307
ch563 di-nucleotide 6 152
ch564 di-nucleotide 14 204
ch602 di-nucleotide 13 200
340
186
ch611 trinucleotide 9 215
ch614 trinucleotide 4 201–229 2
ch616 di-nucleotide 16 322
ch617 trinucleotide 3 200–
ch623 trinucleotide 7 255–282 n
ch626 trinucleotide 3 244–268 n n n n
ch627 trinucleotide 6 160–204 n n
ch629 mononucleotide 5 223–249 –
ch633 trinucleotide 8 166–203 n n
ch635 trinucleotide 8 265–298 n
ch657 trinucleotide 5 301–
ch658 trinucleotide 2 200–226 n
ch661 trinucleotide 6
ch663 trinucleotide 2 137–186 2
ch667 trinucleotide 8 260–287
ch672 di-nucleotide 16 302
ch681 trinucleotide 8 195–223 n n n
ch686 di-nucleotide 15 226–245 – –
ch696 trinucleotide 3 280–308 n n n n
ch697 trinucleotide 8 155–185 3
ch713 trinucleotide 18 222–250 n n n n
ch720 trinucleotide 16 226–290
ch721 trinucleotide 16 250–308 1
ch733 trinucleotide 9 334–362 n n n
ch746 trinucleotide 14 202–287 n n n n
ch752 minisatellite 4 358–384 – – – –
ch754 trinucleotide 5 203–228 1 204 n n
ch768 di-nucleotide 3 295–324 – – – –
ch770 trinucleotide 15 250–285 6 253–285 n n
ch775 mononucleotide 6 208–239 – –
Table 1 (continued )
Locus Repeat motif Cohnella hongkongensis Crassostrea ariakensis C. gigas
A Size range (bp)
A Size range (bp) A Size range (bp)
ch780 trinucleotide 7 315–352 4 315–352 n n
ch789 trinucleotide 7 203–233 6 203–233 4 203–233
ch790 trinucleotide 9 186–240 2 195–206 1 206
ch792 trinucleotide 3 236–262 n n n n
ch796 di-nucleotide 16 260–286 – – – –
ch797 di-nucleotide 7 210–221 – – – –
ch798 di-nucleotide 15 348–410 – – – –
was much higher than that of male map (20 of the assigned loci). In addition, these distorted loci were unevenly distributed in the maps of female and male C. hongkongensis A total of three and two SDRs were observed on the female map (LG1, LG2 and LG3) and male map (LG1 and LG2), respectively (Fig. 1).
3.4. Genome size and coverage
The total length of the consensus map was 653.9 cM, while the total length of the female and male maps was 570.9 cM and 467.6 cM, respectively. The expected genome length of the consensus, female and male C. maps was 770.1, 742.5 and 651.7 cM, respectively. On the basis of the expected genome length, genome coverage for the consensus, female and male maps was 85%, 77% and 72%, respectively.
3.5. Identification of potential candidate genes
The similarity of microsatellite markers located in genetic linkage map was searched using BLASTX against the NCBI Reference Sequence Database for non-redundant proteins. The potential candidate genes are listed in Table 3. In general, 26 genes were similar to microsatellite sequences, of which 15 and 17 genes were similar to microsatellite marker sequences in the linkage map of male and female C. hongkongensis, respectively.
In addition, BLAST analysis showed that 19 of the 28 tri-nucleotide microsatellite sequences were significantly correlated with functional genes (Table 3). Among the 19 sequences, except Ch559, Ch657 and Ch789, all sequences were significantly correlated with the related genes of C. gigas However, of the 19 dinucleotide microsatellite sequences, only 6 were associated with functional genes (Table 3). Among the 6 sequences, all sequences except Ch797 were significantly associated with related genes of C. gigas. Therefore, in this study, the correlation between tri-nucleotide microsatellite markers and functional genes were significantly higher than that of the correlation between dinucleotide microsatellite markers and functional genes.
4. Discussion
In order to increase the number of microsatellite markers that can be used to construct genetic linkage maps, we constructed two microsatellite-enriched partial genomic libraries containing di- and trinucleotide repeats. A total of 50 novel microsatellite markers were developed randomly from the C. hongkongensis genome, including 19 dinucleotide markers and 28 tri-nucleotide markers. The average number of alleles of di-nucleotide markers was significantly higher than of trinucleotide markers, which was consistent with the previous development of microsatellites (Xia et al., 2009; Zhao et al., 2015; Ma et al., 2016). However, tri-nucleotide marker is more stable than di-nucleotide marker and produces fewer PCR artefacts (Fishback et al., 1999; Clarke
et al., 2001; Li et al., 2007; Ma et al., 2021). Additionally, 50% and 36% of the tri-nucleotide markers were successfully cross-amplified in C. gigas and C. ariakensis, respectively. These observations were consistent with the EST-SSR of C. gigas in C. hongkongensis and C. ariakensis, of which about 50% of the markers were successfully cross amplified (Yu et al., 2010). This high cross-amplification success rate of tri-nucleotide markers was also been recorded in our previous study (Ma et al., 2021). These observations indicated that the flanking regions of these loci are well-conserved among Crassostrea, which can be used for comparative genetic diversity analyses and comparative linkage mapping among these species in the future.
The breeding cycle of C. hongkongensis is long, and there may be individuals from other oyster sources in the process of seeding and development. Especially in the sea area around Zhanjiang, there are many wild planktonic oyster larvae attached to the attachments of the mapping family. It is necessary to conduct paternity test on the offspring of the family before constructing genetic map. The C. hongkongensis were preliminary identified morphologically (Wang et al., 2004). However, since environmental parameters have a great influence on the shell morphology of oysters, the use of morphological characteristics alone is insufficient to identify oyster at the species level (Lam and Morton, 2003). The oyster samples after preliminary identification were identified by microsatellite marker Ch409 This microsatellite marker can effectively identify the individuals of C. hongkongensis, C. ariakensis and C. sikamea. The species-specific electrophoretic bands of C. hongkongensis ranged were 308 bp–347 bp, C. ariakensis and C. sikamea were 362-422 bp and 202-251 bp, respectively. After identification with this marker, 114 individuals were found to be not individuals of C. hongkongensis Using COI sequence alignment, it was found that all 114 individuals were C. sikamea. This result indicated that C. sikamea may be the most abundant wild oyster larvae in the natural sea area near the breeding area of mapping family around Zhanjiang. This result was consistent with the natural distribution and abundance of C. sikamea, which widely distributed in Jiangsu and Guangxi (including Hainan Island) (Wang et al., 2013). In addition, the paternity test also found that 7 individuals were non mapping family individuals. This may be because the larvae of C. hongkongensis were mixed with the artificial breeding operation of the mapping family or wild planktonic larvae attached to the attachments of the mapping family.
Genetic linkage maps of many oyster species were reported, including C. gigas (Li and Guo, 2004; Hubert et al., 2009; Hedgecock et al., 2015; Li et al., 2018; Shi et al., 2020), C. virginica (Yu and Guo, 2003; Yu and Guo, 2006) and O. edulis (Lallias et al., 2007; Lallias et al., 2009). We constructed the first genetic linkage map of C. hongkongensis
A total of 104 microsatellite markers were informative in mapping family, of which 57 and 72 were mapped in the male and female maps, respectively. The total length of the consensus map was 653.9 cM and encompassed 104 microsatellite markers on 10 LGs, corresponding to the haploid chromosome number of C. hongkongensis (n = 10, Wang et al., 2016). For aquaculture organisms, when the distance between markers is less than 10 cM, the marker density does not have a significant impact on power (Massault et al., 2008). In this study, the resolution of the consensus map was 6.9 cM, which represents one of the welldefined microsatellite genetic linkage maps and provides enough marker density for QTL and other genetic analysis.
Differential chromosomal recombination between sexes has been widely documented in different organisms (Hedrick, 2007). In many marine shellfish, including oysters (C. gigas, Hubert and Hedgecock, 2004; C. virginica, Yu and Guo, 2006; O. edulis, Lallias et al., 2007), abalones (Haliotis discus, Liu et al., 2006; Haliotis rubra, Baranski et al., 2006), and pearl oysters (Pinctada maxima, Jones et al., 2013), the recombination rate of females is usually higher than that of males. In this study, the linkage map of male C. hongkongensis (467.6 cM) was shorter than that of the linkage map of female C. hongkongensis (570.9 cM), suggesting that there was a significant female bias in recombination, and the overall female-to-male recombination ratio was 1.2:1. Although this
Fig. 1. Consensus genetic linkage map of Cohnella hongkongensis based on microsatellite markers. The male linkage goup (left) is named as “M1-M11”; the female linkage group (right) is named as “F1-F11”; the consensus linkage group (middle) is named as “1–10” Total lengths of linkage groups are expressed in Kosambi cM. Markers with segregation-distortion were indicated with stars (p ˂ 0.05). SDR: segregation-distortion region.
Table 2
Characteristics of sex-specific and consensus linkage groups of C. hongkongesis.
Table 3
Blastx results of 50 novel microsatellite sequences in Cohnella hongkongensis. SSR
Ch559 (GAA)10
Ch563 (GT)13(GA)25
Ch611 (CAT)7 XP_019922723.2
Ch617 (CAT)4 XP_034300558.1
Ch626 (GAA)9 XP_034336115.1
Ch627 (CAT)6
Ch629 (T)19
Ch635 (CAT)6
Ch657 (CAG)6 (CAG)4
Ch658 (GCT)4
Ch661 (CAG)7 (CAG)7
Ch663 (CTG)6
Ch672 (CT)8 (CT)23
Ch696 (TTG)4
Ch697 (TGT)4 (TGT)4 (TTG)5
Ch713 (GAT)5 (GAT)5
Ch721 (CAT)12
Ch733 (CAT)7
Ch746 (CAT)13
Ch754 (GAA)4
Ch789 (CTT)6
Ch790 (TTC)7
Ch796 (CT)15
Ch797 (GA)5
XP_034317093.1
XP_034332259.1
XP_034319697.1
XP_033741828.1
XP_034323083.1
XP_034323083.1
3e-10
3e-12
of
protein 1 isoform X4 [C. gigas]
Unnamed protein product[Mytilus coruscus]
uncharacterized protein LOC105317282 [C. gigas]
Uncharacterized protein LOC105328081[C. gigas]
Uncharacterized protein LOC105334600[C. gigas]
Uncharacterized protein LOC105334520[C. gigas]
Uncharacterized protein LOC117686351[C. gigas]
uncharacterized protein LOC117691098 [C. gigas]
5e-20 LOW QUALITY PROTEIN: CLIP-associating protein 1-B [C. gigas]
1e-09
Uncharacterized protein LOC117328408[Pecten maximus]
spidroin-1-like [C. gigas]
1e-13 spidroin-1-like [C. gigas]
XP_034323085.1 79.07% 7e-07 spidroin-1-like [C. gigas]
XP_011435556.2
XP_034301380.1
XP_011443943.2
XP_011443818.2
XP_034310142.1
XP_034322352.1
3e-34 solute carrier family 28 member 3 [C. gigas]
uncharacterized protein DDB_G0283357 [C. gigas]
7e-09 hornerin [C. gigas]
5e-07 protein PFC0760c [C. gigas]
3e-07
4e-68
uncharacterized protein LOC105339488 isoform X2[C. gigas]
uncharacterized protein LOC117688405 [C. gigas]
XP_011429100.2 89.29% 9e-07 follicle-stimulating hormone receptor [C. gigas]
XP_034317021.1 50.33% 1e-16
VDI06904.1 41.85% 4e-35
XP_011442081.2 82.54% 7e-24
XP_034327440.1 100.00% 5e-13
VDH97956.1 45.54% 6e-26
gender specific phenomenon is unclear, it could be related to the different environments of germ cell development and different starting times of meiosis (Wang et al., 2016).
Distorted markers are frequently reported in oyster species, such as C. virginica (Yu and Guo, 2003), O. edulis (Lallias et al., 2007), C. gigas (Guo et al., 2012), indicating that the genotype frequency deviates from the typical Mendelian ratio (Ji et al., 2017). In this study, all distorted markers were retained for mapping because we were interested in studying the distribution pattern of segregation distortions in C. hongkongensis genome. The results revealed that there were significant differences in the occurrence of segregation-distorted loci in the sex-specific map of C. hongkongensis, which tended to be not randomly distributed. Most loci were found in specific LGs and/or specific regions of LG, mainly distributed on LG1, LG2, LG3 of female map and LG2 of male map. This observation is unlikely the result of DNA marker mutations and non-biological factors (e.g. sample size, genotyping errors, etc.), but it is likely to be caused by SDRs, as speculated by other studies (Li et al., 2010; Song et al., 2006). SDRs is believed to associated with the location of potential deleterious genes (Li and Guo, 2004; Young et al., 1998), thus, SDR information could be used to identify lethal genes or potential deleterious on C. hongkongensis chromosomes, so as can provide references in selective breeding of C. hongkongensis.
trichohyalin-like [C. gigas]
Hypothetical predicted protein [Mytilus galloprovincialis]
uncharacterized protein LOC105338587 [C. gigas]
macrophage mannose receptor 1 [C. gigas]
Hypothetical predicted protein [M. galloprovincialis]
The blast sequence of genetic linkage map markers not only help to understand the origin and evolution of oyster genome through comparative genome analysis, but also identify potential genes in QTL regions (Wang et al., 2011a). If the target oyster shows an orthology relationship with related species in the assembled whole genome sequences, it will be able to predict candidate genes more accurately. In this study, there were few potential candidate genes related to biochemical and physiological reactions, such as HRNR, TCHHL1, FSHR, MRC1. HRNR is a component of cornified cell envelope (Henry et al., 2011). TCHHL1 is associated with the proliferation of keratinocytes (Makino et al., 2020). FSHR plays a key role in ligand binding, cell surface receptor transport, signaling, and interaction with adaptor proteins (Banerjee and Mahale, 2015). MRC1 play as a phagocytic receptor for bacteria, fungi, parasites, viruses and allergens (MartinezPomares, 2012). In addition, we also obtained some candidate genes with unknown function. Here, the blast result can be the preliminary reference for further identifying candidate genes in important QTL mapping regions. In addition, we also found that the correlation between functional genes and tri-nucleotide microsatellite markers was significantly higher than that between functional genes and dinucleotide microsatellite markers. These observations were consistent with the distribution proportion of repeated type of microsatellites
developed in the EST database of some aquatic animals and our previous studies (Dong et al., 2013; Ma et al., 2021). Therefore, it is easier to find polymorphic loci closely linked to functional genes from the genetic linkage map constructed based on tri-nucleotides.
5. Conclusion
We constructed the first medium density genetic map of Crassostrea hongkongensis exclusively using microsatellite markers. A total of 104 microsatellite markers were assigned to 10 LGs, equivalent to the haploid chromosome number of the species. The consensus map spanned 653.9 cM genome, with a coverage of 85% and a resolution of 6.9 cM. Our map provides an important reference for QTL mapping in C. hongkongensis in the future. Moreover, we also found that the trinucleotide microsatellite markers have significantly higher correlation with functional genes and cross-amplification success than the dinucleotide microsatellite markers. Compared with di-nucleotide marker, the tri-nucleotide microsatellite marker has higher application potential in comparative linkage mapping, molecular-marker assisted selection and gene mapping studies.
Statement of relevance
We constructed the first medium density genetic map of Crassostrea hongkongensis exclusively using microsatellite markers. Moreover, we also found that the tri-nucleotide microsatellite markers have significantly higher correlation with functional genes and cross-amplification success than the di-nucleotide microsatellite markers developed randomly from the genome of C. hongkongensis.
Declaration of Competing Interest
The authors declare that they have no known competing financial interests or personal relationships that could have appeared to influence the work reported in this paper.
Acknowledgments
This work was supported by Haina Provincial Key R&D Programme (ZDYF2021XDNY183, ZDYF2021XDNY135), National Science Foundation of China (31702340), Guangdong Academy of Sciences (GDAS) Special Project of Science and Technology Development (2018GDASCX0107), Guangdong Natural Science Foundation (2017A030310442), Science and Technology Planning Project of Guangdong Province, China (2017B030314052), National Marine Genetic Resource Center; China Agriculture Research System of MOF and MARA (CARS-49), and Innovation Academy of South China Sea Ecology and Environmental Engineering, Chinese Academy of Sciences (No.ISEE2018PY01; No. ISEE2018ZD02; ISEE2018PY03).
Appendix A. Supplementary data
Supplementary data to this article can be found online at https://doi. org/10.1016/j.aquaculture.2022.738272
References
Banerjee, A.A., Mahale, S.D., 2015. Role of the extracellular and intracellular loops of follicle-stimulating hormone receptor in its function. Front. Endocrinol. 6, 110. Baranski, M., Loughnan, S., Austin, C.M., Robinson, N., 2006. A microsatellite linkagemap of the blacklip abalone, Haliotis rubra Anim. Genet. 37, 563–570 Carleton, K.L., Streelman, J.T., Lee, B.Y., Garnhart, N., Kidd, M., Kocher, T.D., 2002. Rapid isolation of CA microsatellites from the tilapia genome. Anim. Genet. 33, 140–144
Chakravarti, A., Lasher, L.K., Reefer, J.E., 1991. A maximum likelihood method for estimating genome length using genetic linkage data. Genetics 128, 175–182
Clarke, L.A., Rebelo, C.S., Goncalves, J., Boavida, M.G., Jordan, P., 2001. PCR amplification introduces errors into mononucleotide anddinucleotide repeat sequences. Mol. Pathol. 54, 351–353
Collard, B.C.Y., Jahufer, M.Z.Z., Brouwer, J.B., Pang, E.C.K., 2005. An introduction to markers, quantitative trait loci (QTL) mapping and marker-assisted selection for crop improvement: the basic concepts. Euphytica 142, 169–196
Dong, Y.H., Yao, H.H., Lin, Z.H., Sun, C.S., You, Z.J., 2013. Development of 53 novel polymorphic EST-SSR markers for the hard clam Meretrix meretrix and cross-species amplification. Conserv. Genet. Resour. 5, 811–816
Fishback, A.G., Danzmann, R.G., Sakamoto, T., Ferguson, M.M., 1999. Optimization of semi-automated microsatellite multiplex polymerasechain reaction systems for rainbow trout (Oncorhynchus mykiss). Aquaculture 172, 247–254.
Fishman, L., Kelly, A.J., Morgan, E., Willis, J.H., 2001. A genetic map in the Mimulus guttatus species complex reveals transmission ratio distortion due to heterospecific interactions. Genetics 159, 1701–1716.
Guo, X., Li, Q., Wang, Q.Z., Kong, L.F., 2012. Genetic mapping and QTL analysis of growth-related traits in the Pacific oyster. Mar. Biotechnol. 14, 218–226
Hedgecock, D., Shin, G., Gracey, A.Y., Berg, D.V.D., Samanta, M.P., 2015. Secondgeneration linkage maps for the Pacific oyster Crassostrea gigas reveal errors in assembly of genome scaffolds. G3-Genes Genom. Genet. 5, 2007–2019
Hedrick, P.W., 2007. Sex: differences in mutation, recombination, selection, gene flow, and genetic drift. Evolution 61, 2750–2771
Henry, J., Hsu, C.Y., Haftek, M., Nachat, R., de Koning, H.D., Gardinal-Galera, I., Simon, M., 2011. Hornerin is a component of the epidermal cornified cell envelopes. FASEB. J.25, 1567–1576
Hubert, S., Hedgecock, D., 2004. Linkage maps of microsatellite DNA markers for the Pacific oyster Crassostrea gigas Genetics 168, 351–362
Hubert, S., Cognard, E., Hedgecock, D., 2009. Centromere mapping in triploid families of the Pacific oyster Crassostrea gigas (Thunberg). Aquaculture 288, 172–183
Jewell, E., Robinson, A., Savage, D., Erwin, T., Love, C.G., Lim, G.A., Edwards, D., 2006. SSRPrimer and SSR taxonomy tree: biome SSR discovery. Nucleic Acids Res. 34, 656–659
Ji, G.S., Zhang, Q.J., Du, R.H., Lv, P., Ma, X., Fan, S., Liu, G.Q., 2017. Construction of a high-density genetic map using specific-locus amplified fragments in sorghum. BMC Genomics 18, 51
Jones, D.B., Jerry, D.R., Khatkar, M.S., Raadsma, H.W., Zenger, K.R., 2013. A highdensity SNP genetic linkage map for the silver-lipped pearl oyster, Pinctada maxima: a valuable resource for gene localization and marker-assisted selection. BMC Genomics 14, 810.
Lallias, D., Beaumont, A.R., Haley, C.S., Boudry, P., Heurtebise, S., Lap` egue, S., 2007. A first-generation genetic linkage map of the European flat oyster Ostrea edulis (L.) based on AFLP and microsatellite markers. Anim. Genet. 38, 560–568
Lallias, D., Gomez-Raya, L., Haley, C.S., Arzul, I., Heurtebise, S., Beaumont, A.R., Lapegue, S., 2009. Combining two-stage testing and interval mapping strategies to detect QTL for resistance to bonamiosis in the European flat oyster Ostrea edulis Mar. Biotechnol. 11, 570
Lam, K., Morton, B., 2003. Mitochondrial DNA and morphological identification of a new species of Crassostrea (Bivalvia: ostreidae) cultured for centuries in the Pearl River Delta, Hong Kong, China. Aquaculture 228, 1–13
Li, L., Guo, X.M., 2004. AFLP-based genetic linkage maps of the pacific oyster Crassostrea gigas Thunberg. Mar. Biotechnol. 6, 26–36
Li, L., Yu, Z.N., 2010. Isolation and characterization of 24 microsatellite loci in oyster Crassostrea hongkongensis Conserv. Genet. Resour. 2, 93–96
Li, Y.T., Wongprasert, K., Shekhar, M., Ryan, J., Dierens, L., Meadows, J., Lyons, R.E., 2007. Development of twomicrosatellite multiplex systems for black tiger shrimp Penaeus monodon and its application in genetic diversity study for two populations. Aquaculture 266, 279–288
Li, H.B., Kilian, A., Zhou, M.X., Wenzl, P., Huttner, E., Mendham, N., Vaillancourt, R.E., 2010. Construction of a high-density composite map and comparative mapping of segregation distortion regions in barley. Mol. Gen. Genomics. 284, 319–331
Li, L., Xiao, S., Yu, Z.N., 2011. Development of twenty-six microsatellite loci from Crassostrea hongkongensis and cross-species amplification in two closely related species. J. Genet. 90, e58–e61.
Li, C.Y., Wang, J.P., Song, K., Meng, J., Xu, F., Li, L., Zhang, G.F., 2018. Construction of a high-density genetic mapand fine QTL mapping for growth andnutritional traits of Crassostrea gigas BMC Genomics 19, 626
Liu, Z.J., 2007. Aquaculture Genome Technologies. Blackwell Publishing, Ames
Liu, Z.J., Cordes, J.F., 2004. DNA marker technologies and their applications in aquaculture genetics. Aquaculture 238, 1–37
Liu, X.D., Liu, X., Guo, X.M., Gao, Q.K., Zhao, H.G., Zhang, G.F., 2006. A preliminary genetic linkagemap of the Pacific abalone Haliotis discus hannaiIno. Mar. Biotechnol. 8, 386–397
Ma, H.T., Xiao, S., Zhang, Y., Li, X.M., Li, J., Yu, Z.N., 2016. Polymorphic microsatellite loci developed from the Hong Kong oyster (Crassostrea hongkongensis). Genet. Mol. Res. 15 gmr. 15048676
Ma, H.T., Zhang, Y.H., Xiang, Z.M., Zhang, Y., Qin, Y.P., Yu, Z.N., 2021. Development of tri-nucleotide microsatellite markers from Crassostrea hongkongensis using enriched genomic libraries and cross-species amplification in two closely related species. Aquacult. Rep. 19, 100592
Makino, T., Mizawa, M., Yoshihisa, Y., Yamamoto, S., Tabuchi, Y., Miyai, M., Shimizu, T., 2020. Trichohyalin-like 1 protein plays a crucial role in proliferation and anti-apoptosis of normal human keratinocytes and squamous cell carcinoma cells. Cell Death Dis. 6, 1–13
Martinez-Pomares, L., 2012. The mannose receptor. J. Leukoc. Biol. 92, 1177–1186
Massault, C., Bovenhuis, H., Haley, C., Koning, D.J.D., 2008. QTL mapping designs for aquaculture. Aquaculture 285, 23–29.
Penaloza, C., Gutierrez, A.P., Eory, L., Wang, S., Guo, X.M., Archibald, A.L., Houston, R. D., 2021. A chromosome-level genome assembly for the Pacific oyster Crassostrea gigas GigaScience 10, giab020
Peng, J.X., Li, Q.Z., Xu, L., Wei, P.Y., He, P.P., Zhang, X.Z., Chen, X.H., 2020. Chromosome-level analysis of the Crassostrea hongkongensis genome reveals extensive duplication of immune-related genes in bivalves. Mol. Ecol. Resour. 20, 980–994
People'’s Republic of China Ministry of Agriculture, 2021. China Fishery Yearbook Powell, D., Subramanian, S., Suwansa-ard, S., Zhao, M., O’Connor, W., Raftos, D., Elizur, A., 2018. The genome of the oyster Saccostrea offers insight into the environmental resilience of bivalves. DNA Res. 25, 655–665 Rozen, S., Skaletsky, H., 2000. Primer3 on the WWW for general users and for biologist programmers. In: Krawetz, S., Misener, S. (Eds.), Bioinformatics Methods and Protocols: Methods in Molecular Biology. Humana Press, Totowa, New Jersey, pp. 365–386.
Sauvage, C., Boudry, P., de Koning, D.J., Haley, C.S., Heurtebise, S., Lap` egue, S., 2010. QTL for resistance to summer mortality and OsHV-1 load in the Pacific oyster (Crassostrea gigas). Anim. Genet. 41, 390–399
Shi, R.H., Li, C.Y., Qi, H.G., Liu, S., Wang, W., Li, L., Zhang, G.F., 2020. Construction of a high-resolution genetic map of Crassostrea gigas: QTL mapping and GWAS applications revealed candidate genes controlling nutritional traits. Aquaculture 527, 735427
Song, X.L., Sun, X.Z., Zhang, T.Z., 2006. Segregation distortion and its effect on genetic mapping in plants. Chin. J. Agric. Biotechnol. 3, 163–169
Van Ooijen, J.W., Voorrips, R.E., 2001. JoinMap® 3.0, Software for the Calculation of Genetic Linkage Maps. Plant Research International, Wageningen, the Netherlands Voorrips, R.E., 2002. MapChart: software for the graphical presentation of linkage maps and QTLs. J. Hered. 93, 77–78
Wang, H.Y., Guo, X.M., Zhang, G.F., Zhang, F.S., 2004. Classification of Jinjiang oysters Crassostrea rivularis (Gould, 1861) from China, based on morphology and phylogenetic analysis. Aquaculture 242, 137–155
Wang, C.M., Bai, Z.Y., He, X.P., Lin, G., Xia, J.H., Sun, F., Yue, G.H., 2011a. A highresolution linkage map for comparative genome analysis and QTL fine mapping in Asian seabass, Lates calcarifer BMC Genomics 12, 174 Wang, C.M., Lo, L.C., Zhu, Z.Y., Pang, H.Y., Liu, H.M., Tan, J., Yue, G.H., 2011b. Mapping QTL for an adaptive trait: the length of caudal fin in Lates calcarifer. Mar. Biotechnol. 13, 74–82
Wang, H.Y., Qian, L.M., Wang, A.M., Guo, X.M., 2013. Occurrence and distribution of Crassostrea sikamea (Amemiya 1928) in China. J. Shellfish Res. 32, 439–446
Wang, J.P., Li, L., Zhang, G.F., 2016. A high-density SNP genetic linkage map and QTL analysis of growth-related traits in a hybrid family of oysters (Crassostrea gigas×Crassostrea angulata) using genotyping-by-sequencing. G3-Genes Genom. Genet. 6, 1417–1426
Wang, J.L., Li, Q., Zhong, X.X., Song, J.L., Kong, L.F., Yu, H., 2018. An integrated genetic map based on EST-SNPs and QTL analysis of shell color traits in Pacific oyster Crassostrea gigas Aquaculture 492, 226–236
Wu, B., Chen, X., Yu, M.J., Ren, J.F., Hu, J., Shao, C.W., Liu, Z.H., 2021. Chromosomelevel genome and population genomic analysis provide insights into the evolution and environmental adaptation of Jinjiang oyster Crassostrea ariakensis Mol. Ecol. Resour. 00, 1–16
Xia, J.J., He, X.C., Yu, Z.N., 2009. Isolation and characterization of fourteen novel microsatellite loci in the Hong Kong oyster, Crassostrea hongkongensis. Conserv. Genet. 10, 1829–1832
Xiao, S., Ma, H.T., Yu, Z.N., 2011. Development of 20 novel microsatellite markers in the Hong Kong oyster, Crassostrea hongkongensis Conserv. Genet. Resour. 3, 413–415
Young, W.P., Wheeler, P.A., Coryell, V.H., Keim, P., Thorgaard, G.H., 1998. A detailed linkage map of rainbow trout produced using doubled haploids. Genetics 148, 839–850
Yu, Z.N., Guo, X.M., 2003. Genetic linkage map of the eastern oyster Crassostrea virginica Gmelin. Biol. Bull. 204, 327–338
Yu, Z.N., Guo, X.M., 2006. Identification and mapping of disease-resistance QTLs in the eastern oyster, Crassostrea virginica Gmelin. Aquaculture 254, 160–170
Yu, Z.N., Wang, Y.H., Fu, D.K., 2010. Development of fifty-one novel EST-SSR loci in the Pacific oyster, Crassostrea gigas by data mining from the public EST database. Conserv. Genet. Resour. 2, 13–18
Zhang, G.F., Fang, X.D., Guo, X.M., et al., 2012. The oyster genome reveals stress adaptation and complexity of shell formation. Nature 490, 49–54
Zhao, X.L., Shi, H.T., Yu, H., Li, Q., 2015. Characterization of polymorphic microsatellite markers and genetic diversity in the Hong Kong oyster Crassostrea hongkongensis using paired-end Illumina shotgun sequencing. Genes. Genom. 37, 615–620
Zhong, X.X., Li, Q., Guo, X., Yu, H., Kong, L.F., 2014. QTL mapping for glycogen content and shell pigmentation in the Pacific oyster Crassostrea gigas using microsatellites and SNPs. Aquac. Int. 22, 1877–1889
H.
Other documents randomly have different content
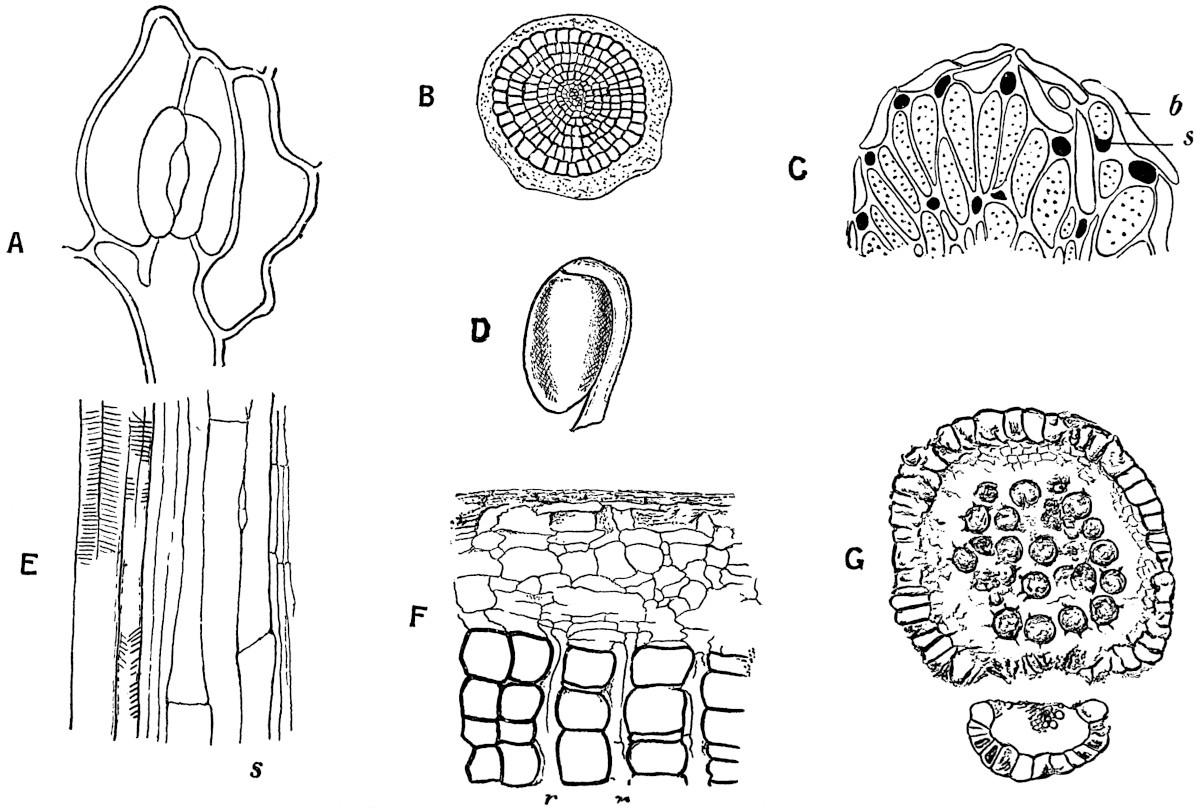
With the exception of very young twigs the petrified Sphenophyllum stems usually show a greater or less development of secondary wood. In the xylem-strand of fig. 105, B, the broad concave bays of the primary wood have been filled in by the development of two rows of large secondary tracheids, x, but opposite the protoxylem groups, px, there are no signs of cambial activity. In the unusually large stem represented by a rough sketch in fig. 105, C, the triangular primary xylem lies in the centre of a thick mass of secondary vascular tissue. The secondary and primary wood together have a diameter of about 5 mm.
After the bays between each protoxylem corner have been filled in, the formation of secondary wood proceeds uniformly along the stem radii, but the rows of tracheids and medullary rays which are developed opposite the corners of the primary strand, c, differ in certain characters from the broader masses of wood opposite the bays. For convenience, the secondary wood, c, opposite the protoxylem groups has been spoken of as fascicular wood, and the rest, d, as interfascicular wood.
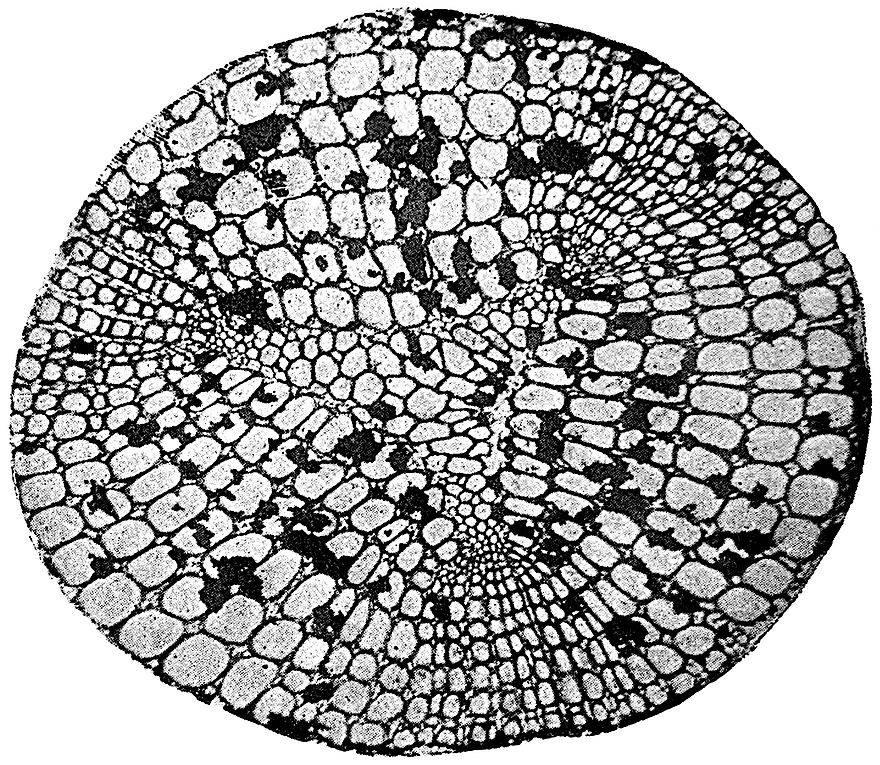
The secondary xylem consists either of tracheae with numerous bordered pits on their radial walls (fig. 105, D), or of tracheae with broad and bordered scalariform pits (fig. 105, E). The suggestion of concentric rings of growth in the wood in fig. 105, C, is rather deceptive; there are no well-marked regular rings in Sphenophyllum stems, but irregular bands of smaller elements occasionally interrupt the uniformity of the secondary xylem. In some stems the medullary rays have the form of rows of parenchymatous cells, which in tangential longitudinal section are found to consist frequently of a single row of radially disposed elements; this type of medullary rays occurs in the species Sphenophyllum insigne, in which the tracheae are scalariform. Three medullary rays, r, are seen on the radial face of the scalariform tracheids in fig. 105, E, which represents a radial section of this species. In other species, e.g. S. plurifoliatum, the medullary rays have a peculiar and characteristic structure; in a transverse section of the stem they appear as groups of a few parenchymatous cells in the spaces between the truncated angles of the large tracheae (fig. 106). In longitudinal section these medullary-
ray elements resemble thick bars stretching radially across the face of the tracheae (fig. 105, D, r); the apparent septa or bars are however thin-walled cells connecting the different groups of medullary-ray cells, as seen in a transverse section. These radial connecting cells are occasionally seen as short rays in transverse sections of stems.
The cambium and phloem elements are occasionally preserved in good specimens of older stems; the former consist of tabular flatted thin-walled cells, and the latter in some cases include large sievetubes and narrower parenchymatous elements.
The sections shown in fig. 107, E and F, illustrate the preservation of cambial and phloem tissue. In the transverse section of fig. 107, F, the secondary xylem with the medullary rays, r, is succeeded by a few tabular cambium cells, and external to these there are thinwalled elements of unequal size representing the phloem. In fig. 107, E, the scalariform tracheids are succeeded by narrow thin-walled cells, and the larger elements with transverse and oblique septa are no doubt sieve-tubes.
In the large stem of fig. 105, C, the xylem is succeeded by a band of tissue, a, which is no doubt phloem, and external to this there is a considerable development of periderm (b). The periderm in Sphenophyllum stems had a deep-seated origin, the phellogen or cork-cambium occasionally being formed in the secondary phloemparenchyma, and in other cases in the pericycle, as in the stems of some living dicotyledons. Williamson and Scott[872] describe stems in which a succession of phellogens were formed at different levels, thus producing a scaly type of bark, such as we find in the Pine or the Plane tree.
Before describing the structure of the strobili of Sphenophyllum, we may briefly point out the distinguishing features of two specific types of the genus recently described by Williamson and Scott. One of these species, S. insigne, was originally described by Williamson as an Asterophyllites; the numerous narrow linear leaves in each verticil led to the inclusion of the specimens in the latter genus. The
SPHENOPHYLLUM PLURIFOLIATUM.
material on which this species is founded is from the volcanic beds of Pettycur, Burntisland, on the coast of the Firth of Forth.
1. Sphenophyllum insigne (Will.). Figs. 105, C and E, and 107, E and F.
1891. Asterophyllites insignis. Williamson[873] .
An intercellular space occurs at each angle of the three-rayed primary xylem strand, and spiral tracheae are abundant. The tracheae of the secondary wood have scalariform markings on the radial walls. Regular medullary rays extend through the secondary wood. The phloem contains large sieve-tubes.
This species occurs in the Calciferous sandstone rocks of Burntisland, and has lately been recorded from Germany. It characterises a lower horizon than S. plurifoliatum (Will. and Scott).
2. Sphenophyllum plurifoliatum (Williamson and Scott)[874] Figs. 105, A, B, and D, and 106.
1891. Asterophyllites sphenophylloides. Will.[875]
The specific name plurifoliatum was proposed by Williamson and Scott for a type of stem originally described by Williamson[876] as an Asterophyllites, from the Coal-Measures of Oldham, Lancashire. This form of stem has not so far been connected with any of the older species founded on external characters, but it evidently bore foliage in which the leaves were deeply divided, as in Sphenophyllum trichomatosum (fig. 110, B).
F��. 106. Sphenophyllum plurifoliatum, Will. and Scott.
From a photograph by Mr Highly from a section in the Williamson Collection (no. 899). × 27.
In this species there are no canals at the angles of the primary xylem, and there are fewer spiral tracheae than in S. insigne. The tracheae of the secondary wood have numerous small pits on the radial walls, and the medullary rays are chiefly composed of parenchymatous cells, which appear in transverse section as groups of cells between the truncated angles of the tracheae. The characters are fairly well seen in the xylem portion of a stele shown in fig. 106. The fascicular wood includes some rows of parenchymatous medullary-ray cells in addition to the characteristic groups, as seen in the figure. A slightly oblique transverse section of a stem is often convenient in the interpretation of histological features; one of the sections of S. plurifoliatum in the Williamson collection (no. 893), which has been cut somewhat obliquely, shows very clearly the differences in pitting exhibited by the different xylem elements.
b. Roots.
Our knowledge of the anatomy of Sphenophyllum roots is very limited. Renault has described a somewhat imperfect example of a silicified root from St. Étienne and Autun. The drawing in fig. 107, B, which is copied from one of Renault’s figures, shows a cylindrical mass of xylem with a small band of narrower elements occupying the centre, and surrounded by rows of larger secondary tracheae. The central bipolar band is described as the diarch primary xylem, around which the secondary pitted elements have been developed.
It is probable that the specimen described by Renault is a root of Sphenophyllum, but my impression gained from an examination of the section was that the diarch primary strand is not quite so clear as in the published figures. Until we possess better material we cannot attempt any very satisfactory description of the anatomical features of the roots of this genus.
A section of a Sphenophyllum stem has been figured by Felix[877] , in which a lateral member is being given off; this may possibly represent the origin of an adventitious root, but the preservation is not sufficiently distinct to render this certain.
c. Leaves.
Renault[878] has described some silicified leaves of Sphenophyllum from Autun in which the laminae consist of thin-walled loose parenchyma, traversed by small groups of tracheids constituting the simple or forked veins. The epidermis is made up of a single layer of cells, with here and there indistinct indications of stomata. A more perfect stoma has, however, been described by Solms-Laubach from the epidermis of a bract in a strobilus (fig. 107, A).
F��. 107. A. Stoma in a bract of Sphenophyllostachys. B. Root of Sphenophyllum. C. Sphenophyllostachys Römeri, Solms. s, sporangiophore, b, bract. D. Sporangium. E and F. Sections through the cambium, phloem and secondary xylem of Sphenophyllum insigne (Will.). s, sieve-tube. G. Sporangium and pedicel. A, C, D. After SolmsLaubach. B. After Renault. E–G. After Williamson and Scott. E. F. × 100. G. × 115.
d. Cones.
The history of the recognition of the cones of Sphenophyllum has already been briefly alluded to in chapter V., p. 100. The main points in the structure of the cones of this genus were known for several years, before the fact was established that they belonged to Sphenophyllum stems. In 1871 Williamson[879] published an account of an imperfect fossil strobilus from the Lower Coal-Measures of Oldham, Lancashire, under the name of Volkmannia Dawsoni. The generic term Volkmannia has been used by different writers for cones varying considerably in structural features; in the case of Williamson’s fossil, Weiss[880] substituted the name Bowmanites, a
genus instituted by Binney[881] for a strobilus apparently of the same type as Volkmannia Dawsoni. In 1891 Williamson[882] described some additional specimens of Bowmanites Dawsoni, and, as in his earlier paper, he compared the strobilus with Asterophyllites and Sphenophyllum, but it was still a matter of speculation as to what was the form of the vegetative branches. Soon after the more complete account of the English cones was published, Zeiller[883] recognised a close agreement between some French and Belgian specimens of Sphenophyllum strobili and the strobilus described by Williamson. A closer comparison thoroughly established the connection between Bowmanites Dawsoni and Sphenophyllum; and there is little doubt that this strobilus belongs to the stem known as Sphenophyllum cuneifolium (Sternb.)—a well-known species of the genus.
STROBILUS.
The most important morphological features of the strobilus of Sphenophyllum may best be illustrated by a detailed account of one specific type, and by a brief reference to other forms which are characterised by certain differences in the number and attachment of the sporangia. When we know that a given strobilus must have grown on a Sphenophyllum stem, the obvious name to assign to it would seem to be that of the plant which bore it; but there are advantages in making use of special generic terms for detached cones, which cannot be referred with certainty to a particular species of stem. The genus Calamostachys affords an example of a name which is intended to denote that a cone so called belongs to a Calamarian plant; similarly such a name as Sphenophyllostachys may be used for Sphenophylloid cones which cannot be connected with certainty to particular species of Sphenophyllum It has been suggested that the genus Bowmanites, first used for a cone which was afterwards recognised as belonging to a Sphenophyllum, should be employed instead of the sesquipedalian term Sphenophyllostachys. The latter is used here as being in accordance with a generally accepted and convenient system of nomenclature, and as a name which at once denotes the fact that the fossil is not only a cone but that it belongs to a Sphenophyllum.
Sphenophyllostachys Dawsoni (Will.). Figs. 107, A and G, 108.
Probably the strobilus of Sphenophyllum cuneifolium (Sternb.).
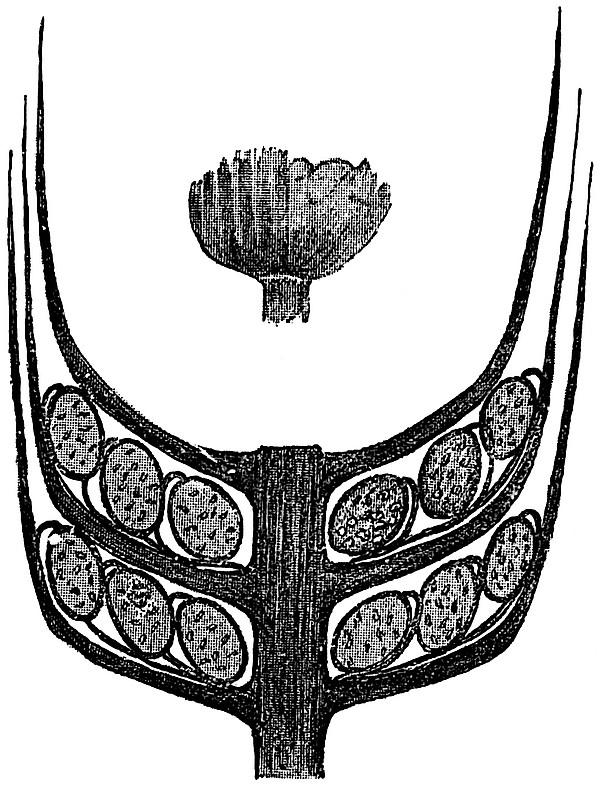
F��. 108. Diagrammatic longitudinal section of a Sphenophyllum strobilus.
The upper figure represents a portion of a whorl of bracts. (The smaller figure, after Zeiller.)
The cone consists of a central axis bearing a number of verticils of bracts coherent in their lower portions in the form of a widely open funnel-shaped disc, which splits up peripherally into 14–20 linearlanceolate segments. The free segments of each verticil have an obliquely ascending or almost vertical position, and extend upwards for a distance of about six internodes. The smaller drawing in fig. 108 shows the appearance in side view of the narrow bracts of a single whorl. A transverse section of a strobilus would include, therefore, sections of several concentric series of ascending bracts. The verticils of Sphenophyllostachys Dawsoni are probably superposed, but this point has not been definitely settled. From the upper surface of the coherent basal portion of each verticil, there are given off twice
as many sporangiophores as there are free segments, and these are attached close to the line of junction of the axis of the cone and the funnel-shaped disc. Each sporangiophore has the form of a slender stalk which bends inwards at its distal end and bears a single sporangium (cf. fig. 107, D). The sporangiophores given off from the same verticil of bracts vary in length. All the sporangiophores are attached to the coherent bracts at the same distance from the axis of the cone; but as the sporangia between each verticil of bracts are arranged in two or three concentric series, it follows that the length of the sporangiophores varies considerably The diagrammatic longitudinal section of a strobilus in fig. 108 shows three concentric series of sporangia between successive bract-verticils. A similar diagram was published by Williamson in 1892[884] , and afterwards copied by Potonié[885] , but in Williamson’s restoration the sporangiophores of the three series of sporangia are erroneously represented as arising from different points on the surface of the bracts. There is little doubt, as regards the strobilus of S. cuneifolium, that the sporangiophores were given off in a single series close to the axils of the bracts, as is partially shown in fig. 108.
The central part of the axis of the cone is occupied by a single triangular stele like that of the stem, except that each ray of the xylem strand has a comparatively broad blunt termination, and is not tapered to a narrow arm as in fig. 105, A and B. The wood consists of pitted tracheae, with two groups of protoxylem elements at each of the truncated angles of the solid strand of xylem. From the angles of the stele branches of vascular tissue pass out through the cortex to supply the sterile and fertile segments of each verticil. One of the transverse sections of the Sphenophyllum cone in the British Museum Collection (no. 1898 E) affords a good example of the misleading appearance occasionally presented by an intruded ‘rootlet’ of Stigmaria; the vascular tissue of the cone has disappeared, and a Stigmarian appendage with its vascular bundle occupies the position of the stelar tissues.
The bracts consist of parenchymatous tissue limited externally by an epidermis containing stomata. A single stoma with subsidiary cells is represented in fig. 107, A. The sporangiophores are
composed internally of thin-walled cells with stronger cells towards the surface. The longer sporangiophores in a series may be more or less coherent for part of their length to the upper surface of the verticil of bracts. In fig. 108 the slender sporangiophores do not appear to come off always from the same portion of the bracts, but this is due to some of them lying on the surface of the latter during part of their course to support the external circle of sporangia. The hook-like distal end of a sporangiophore, towards the point of attachment of the sporangium, is characterised by the larger size and greater prominence of the surface cells; these larger cells, which pass over the upper surface of a sporangium base, probably constitute a kind of annulus which determines the dehiscence of the sporangial wall[886] .
Fig. 107, G, represents a sporangiophore and its sporangium cut through transversely just below the point of attachment of the latter to the end of the hook-like termination of the former. The spores are characterised by an irregularly reticulate thickening of the outer coat or exospore, as seen in the figure.
One of the chief points of interest suggested by a Sphenophyllum cone is the exact morphological nature of the sporangiophores. Are they branches borne in the axils of bracts, or may we regard each sporangiophore as a modified leaf, which has become coherent with the whorls of sterile leaves? Or is a sporangiophore merely a stalk of a sporangium; or a ventral lobe of a leaf, of which the sterile bracts represent the dorsal lobes? Although it is impossible without the evidence of development to decide with certainty between these alternatives, it would seem most probable that a sporangiophore may be looked upon as a ventral lobe of a leaf, the sterile lobes forming the bracts or members of the sterile whorls of the cone. This question is discussed by Zeiller[887] and Williamson and Scott[888] , also more recently by Scott[889] in his memoir on Cheirostrobus.
Sphenophyllostachys Römeri (Solms-Laubach)[890]. Fig. 107, C and D.
In another type of Sphenophyllum strobilus, recently described by Solms-Laubach, the incurved end of each sporangiophore bore two
sporangia. In most respects this species, which has not been found in connection with a vegetative shoot, agrees with Sphenophyllostachys Dawsoni.
In fig. 107, C, which is copied from one of Solms-Laubach’s drawings[891] , we have an oblique transverse section of part of a strobilus, including portions of two series of sporangia borne on one verticil of bracts, and at the right-hand edge the section has passed through the sporangia belonging to another whorl of bracts. There were probably three concentric series of sporangia attached to each verticil of bracts, as in the case of fig. 108. The unshaded area, b (fig. 107, C), represents the bracts of two successive sterile whorls in transverse section. The shaded areas are the sporangia, with their sporangiophores, s. The relative position of the sporangia and sporangiophores suggests that each pedicel bore two sporangia at its tip, instead of one, as in the strobilus of Sphenophyllum cuneifolium (Sternb.).
A further variation in the structure of the strobili is illustrated by some specimens of S. trichomatosum Stur, described by Kidston[892] , from the Coal-Measures of Barnsley Each whorl of bracts bears a single series of oval sporangia which appear to be sessile on the basal portion of the whorl. It is possible that delicate sporangiophores may have been present, but in the imperfect examples in Kidston’s collection[893] the sporangia present the appearance of being seated directly on the surface of the bracts. As the specimens do not show any internal structure, it would be unwise to lay too much stress on the apparent absence of the characteristic sporangiophores. In any case, Kidston’s cones afford an illustration of the occurrence of a single series of sporangia in each whorl, instead of the pluriseriate manner of occurrence in some other species.
The statement is occasionally met with that some Sphenophyllum cones possessed two kinds of spores, but we are still in want of satisfactory evidence that this was really the case. Renault has described an imperfect specimen, which he considers points to the heterosporous nature of a Sphenophyllum cone, but Zeiller and Williamson and Scott have expressed doubts as to the correctness
of Renault’s conclusions. While admitting the possibility of undoubted heterosporous strobili being discovered, we are not in a position to refer to Sphenophyllum as having borne strobili containing two kinds of spores[894] .
SPHENOPHYLLUM EMARGINATUM.
[The following are some of the specimens in the Williamson Cabinet which illustrate the structure of Sphenophyllum:—
S. plurifoliatum. 874, 882, 884, 893, 894, 897, 899, 901, 903, 908, 1893.
S insigne 910, 914, 919, 921, 922, 924, 926, 1420, 1898
Sphenophyllostachys 1049�–1049�, 1898 ]
B. Types of vegetative branches of Sphenophyllum.
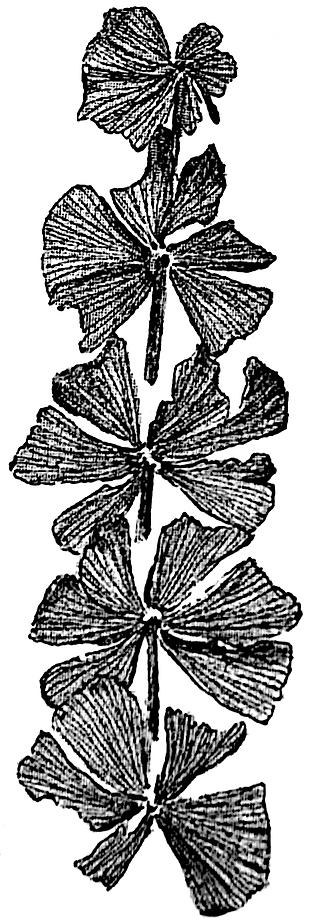
1 Sphenophyllum emarginatum (Brongniart) Fig 109
1822. Sphenophyllites emarginatus, Brongniart[895] . 1828 Sphenophyllum emarginatum, Brongniart[896]
1828. Sphenophyllum truncatum, Brongniart[896] . 1828. Rotularia marsileaefolia, Bischoff[897] . 1862. Sphenophyllum osnabrugense, Römer[898]
F��. 109. Sphenophyllum emarginatum (Brongniart).
From a specimen in the Collection of Mr R. Kidston, Upper CoalMeasures, Radstock. ⅚ nat. size.
This species of Sphenophyllum bears verticils of six or eight wedge-shaped leaves varying in breadth and in the extent of dissection of the laminae; they are truncated distally, and terminate in a margin characterised by blunt or obtusely-rounded teeth, each of which receives a single vein. The larger leaves are usually more or less deeply divided by a median slit. The narrow base of each leaf receives a single vein which branches repeatedly in a dichotomous manner in the substance of the lamina. Several drawings have been given by Sterzel[899] in a memoir on Permian plants, showing the variation in leaf-form in Sphenophyllum emarginatum, but as Kidston[900] and Zeiller[901] have pointed out Sterzel’s specimens probably belong to S. cuneifolium (Sternb.).
Branches are given off singly from the nodes, and the cones are borne at the tips of branches or branchlets. The cone of S. emarginatum agrees very closely with that of S. cuneifolium, and is of the same type as that shown in fig. 108. The small branch of S. emarginatum represented in fig. 109 does not show clearly the detailed characters of the species, as the leaf-margins are not well preserved.
In one of the largest specimens of this species which I have seen, in the Leipzig Museum, the main stem has internodes of about 3·9 cm. in length, from which a lateral branch with much shorter internodes is given off from a node.
It is important to notice the close resemblance, as pointed out by Zeiller, between some of the narrower-leaved forms of S. emarginatum and S. cuneifolium (Sternb.)[902]; but in the latter species the margins of the leaves have sharp, and not blunt teeth.
The cone described and figured by Weiss[903] as Bowmanites germanicus, since investigated by Solms-Laubach[904] , must be referred to this species. Geinitz[905] figured a cone in 1855 as that of S. emarginatum, but his determination of the species is a little doubtful. Good figures of the true cone of S. emarginatum have been given by Zeiller[906] in his Flore de Valenciennes, as well as in his important memoir on the fructification of Sphenophyllum.
LEAVES.
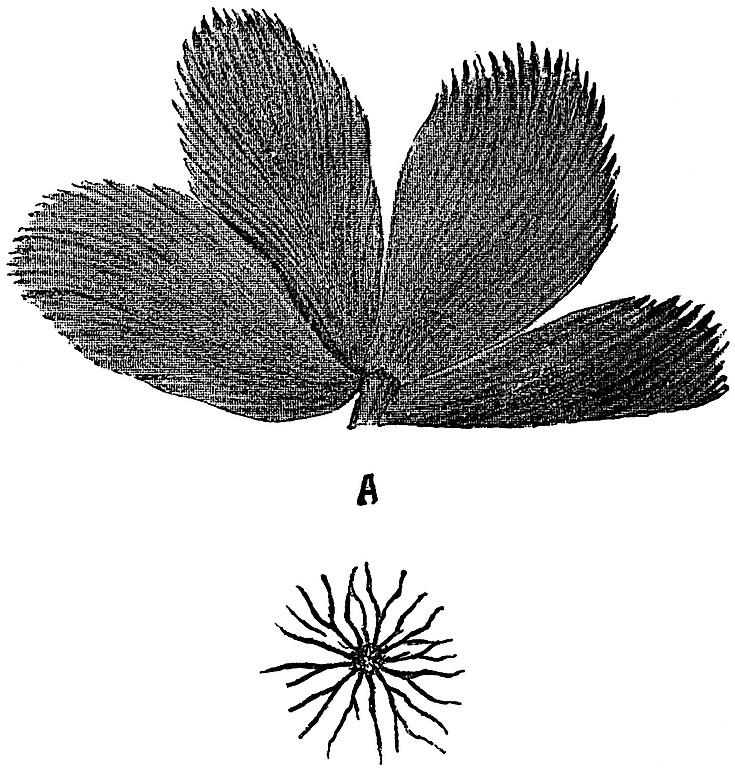
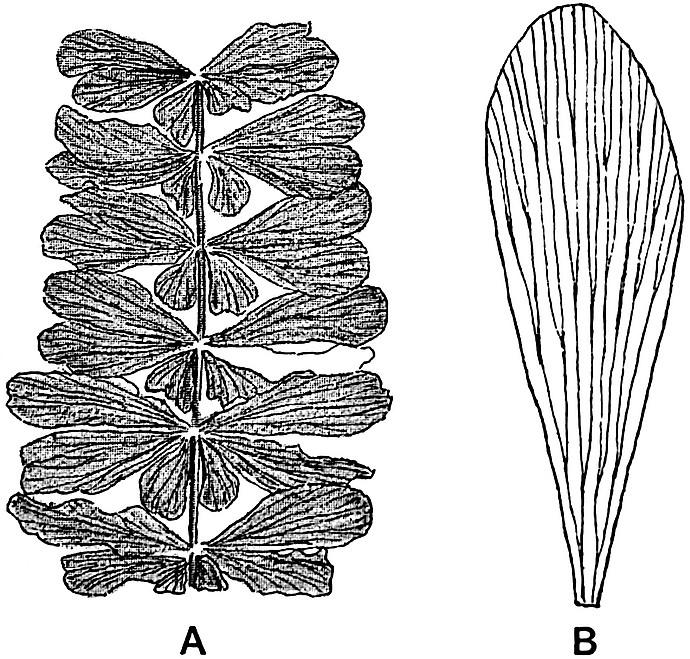
2. Sphenophyllum trichomatosum Stur. Fig. 110, B.
The finely-divided leaves of the single whorl shown in fig. 110, B (from the Middle Coal-Measures of Barnsley, Yorkshire), afford an example of a form of Sphenophyllum which is represented by such species as S. tenerrimum Ett.[907] , S. trichomatosum Stur[908] , and S. myriophyllum[909] Crép. Probably the specimen should be referred to S. trichomatosum, but it is almost impossible to speak with certainty as to the specific value of an isolated leaf-whorl of this form. It has long been known that the leaves of Sphenophyllum may vary considerably, as regards the size of the segments, on the same plant; and the occurrence of such finely-divided leaves has lent support to an opinion which was formerly held by some writers, that
Asterophyllites and Sphenophyllum could not be regarded as welldefined separate genera. This heterophylly of Sphenophyllum has thus been responsible for certain mistaken opinions both as to the relation of the genus to Calamocladus[910] (Asterophyllites), and as regards the view that the finely-divided laminae belonged to submerged leaf-whorls, while the broader segments were those of floating or subaerial whorls.
There is a very close resemblance between some of the deeplycut and linear segments of a Sphenophyllum and the leaves of Calamocladus, but in the former genus the linear segments are found to be connected basally into a narrow common sheath. The assertion[911] that the deeply-cut leaves occur on the lower portions of stems is not supported by the facts. Kidston[912] has pointed out that the cones are often borne on branches with such leaves, and the same author refers to a figure by Germar, in which entire and muchdivided leaves occur mixed together in the same individual specimen. M. Zeiller recently pointed out to me a similar irregular association of broader and narrower leaf-segments on the same shoots in some large specimens in the École des Mines, Paris. Cones of Sphenophyllum tenerrimum have been figured by Stur[913] and others; they are characterised by their small size and by the dissection of the slender free portions of the narrow bracts[914] .
3.
Sphenophyllum Thoni Mahr. Fig. 110, A.
Another type of Sphenophyllum is illustrated by S. Thoni Mahr as shown in fig. 110, A. This species was first described by Mahr[915] from the Coal-Measures of Ilmenau, and has since been figured by Zeiller and other authors. Each whorl consists of six large obcuneiform leaves with the broad margin somewhat irregularly fringed. The unusually good specimen of which fig. 110, A, represents a single verticil was originally described and figured by Zeiller in 1880[916]; it is now in the École des Mines Museum, Paris.
F��. 110.
A. Sphenophyllum Thoni, Mahr. (After Zeiller.)
B. Sphenophyllum trichomatosum, Stur. From a specimen in the Woodwardian Museum; from the Coal-Measures of Barnsley, Yorks. A and B ¾ nat. size.
The leaf-forms illustrated by figs. 109 and 110 are some of the more extreme types of Sphenophyllum leaves; but these are more or less connected by a series of intermediate forms. For a more complete systematic account of the different species the student should consult such works as those by Coemans and Kickx[917] , Zeiller, Schimper, and others.
4. Sphenophyllum speciosum (Royle). Fig. 111. 1834. Trizygia speciosa, Royle[918] .
The species shown in fig. 111 has been usually described as a separate genus Trizygia, a name instituted by Royle in 1834 for some Indian fossils from the Lower Gondwana rocks of India[919] . Zeiller[920] has lately pointed out the advisability of including this Asiatic type in the genus Sphenophyllum. The slender stem bears verticils of cuneate leaves in three pairs at each node, the anterior
pair being smaller than the two lateral pairs. The characteristic Sphenophyllum venation is clearly seen in the enlarged leaf, fig. 111, B. F��. 111. Sphenophyllum speciosum (Royle).
A. Nat. size. B. enlarged leaf.
From the Raniganj Coal-field, India. (After Feistmantel.)
The inequality of the members of a single whorl, which characterises this Indian plant, is sometimes met with in European species. A specimen of Sphenophyllum oblongifolium, which Prof. Zeiller showed me in illustration of this point, was practically indistinguishable from Trizygia[921] .
In some of the earlier descriptions of the Indian species the generic name Sphenophyllum[922] was used by McClelland and others, but the supposed difference in the leaf-whorls was made the ground of reverting to the distinct generic term Trizygia. Now that a similar type of leaf-whorl is known to occur in Sphenophyllum, it is better to adopt that genus rather than to allow the question of locality to unduly influence the choice of a separate generic name for an Indian plant.
GEOLOGICAL RANGE.