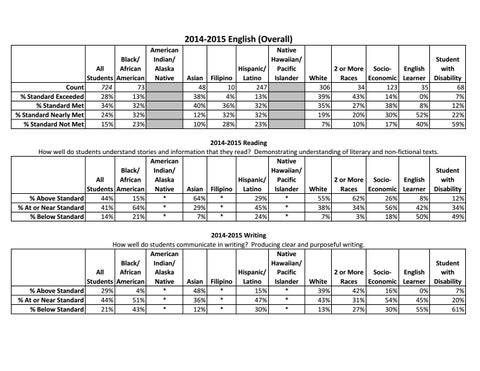
2014-2015 English (Overall)
Count % Standard Exceeded % Standard Met % Standard Nearly Met % Standard Not Met
All Students 724 28% 34% 24% 15%
American Black/ Indian/ African Alaska American Native 73 13% 32% 32% 23%
Asian 48 38% 40% 12% 10%
Native Hawaiian/ Student Hispanic/ Pacific 2 or More SocioEnglish with Filipino Latino Islander White Races Economic Learner Disability 10 247 306 34 123 35 68 4% 13% 39% 43% 14% 0% 7% 36% 32% 35% 27% 38% 8% 12% 32% 32% 19% 20% 30% 52% 22% 28% 23% 7% 10% 17% 40% 59%
2014-2015 Reading How well do students understand stories and information that they read? Demonstrating understanding of literary and non-fictional texts. American Native Black/ Indian/ Hawaiian/ Student All African Alaska Hispanic/ Pacific 2 or More SocioEnglish with Students American Native Asian Filipino Latino Islander White Races Economic Learner Disability % Above Standard 44% 15% * 64% * 29% * 55% 62% 26% 8% 12% % At or Near Standard 41% 64% * 29% * 45% * 38% 34% 56% 42% 34% % Below Standard 14% 21% * 7% * 24% * 7% 3% 18% 50% 49% 2014-2015 Writing How well do students communicate in writing? Producing clear and purposeful writing. American Native Black/ Indian/ Hawaiian/ Student All African Alaska Hispanic/ Pacific 2 or More SocioEnglish with Students American Native Asian Filipino Latino Islander White Races Economic Learner Disability % Above Standard 29% 4% * 48% * 15% * 39% 42% 16% 0% 7% % At or Near Standard 44% 51% * 36% * 47% * 43% 31% 54% 45% 20% % Below Standard 21% 43% * 12% * 30% * 13% 27% 30% 55% 61%