OPTION 9: THE ATMOSPHERE AND OCEAN ENVIRONMENTS

01 THE ATMOSPHERE AND OCEAN ENVIRONMENTS
02 SOLAR ENERGY AND GLOBAL TEMPERATURES
03 MOISTURE IN THE ATMOSPHERE
04 OCEANS, ATMOSPHERE, WEATHER AND CLIMATE
05 CLIMATIC ENVIRONMENTS
06 CLIMATE CHARACTERISTICS AND ECONOMIC DEVELOPMENT
i
First published 2024
The Educational Company of Ireland
Ballymount Road
Walkinstown
Dublin 12
www.edco.ie
A member of the Smurfit Kappa Group plc
© Lee O’Donnell, 2024
All rights reserved. No part of this publication may be reproduced, stored in a retrieval system, or transmitted in any form or by any means, electronic, mechanical, photocopying, recording or otherwise, without either the prior permission of the publishers or a licence permitting restricted copying in Ireland issued by the Irish Copyright Licensing Agency, 63 Patrick Street, Dún Laoghaire, Co Dublin.
Editor: Dog’s-ear
Design: Ailbhe Hooper
Proofreaders: Dog’s-ear, Jane Rogers
Layout and illustrations: Compuscript
While every care has been taken to trace and acknowledge copyright, the publishers tender their apologies for any accidental infringement where copyright has proved untraceable. They would be pleased to come to a suitable arrangement with the rightful owner in each case.
Web references in this book are intended as a guide for teachers. At the time of going to press, all web addresses were active and contained information relevant to the topics in this book. However, The Educational Company of Ireland and the authors do not accept responsibility for the views or information contained on these websites. Content and addresses may change beyond our control and pupils should be supervised when investigating websites.
ii
iii CONTENTS OPTION 9: THE ATMOSPHERE AND OCEAN ENVIRONMENTS 1. THE ATMOSPHERE AND OCEAN ENVIRONMENTS 2 2. SOLAR ENERGY AND GLOBAL TEMPERATURES 21 3. MOISTURE IN THE ATMOSPHERE 32 4. OCEANS, ATMOSPHERE, WEATHER AND CLIMATE 49 5. CLIMATIC ENVIRONMENTS 74 6. CLIMATE CHARACTERISTICS AND ECONOMIC DEVELOPMENT 92
ACKNOWLEDGEMENTS
In presenting The Natural World, Option 9: The Atmosphere and Ocean Environments I extend my deepest gratitude to a circle of individuals whose support and belief have been crucial. My partner Aoibheann deserves special mention for her unwavering love and belief in my capabilities. Your encouragement has been fundamental to this journey I am equally indebted to my mother Sinead and my brother Evan, whose support has been a cornerstone in all my endeavours.
I am profoundly grateful to the team at Edco for offering me the platform to express my enthusiasm for teaching and learning. A heartfelt thank you to Declan, whose expertise and guidance were invaluable throughout this project, and to Neil, whose dedication and insight were crucial in bringing the digital dimension of this book to life.
I extend my appreciation to our editors, Emma and Rónán, whose keen eye, constructive criticism, and meticulous approach were instrumental in refining every detail of this book
Lastly, my colleagues and students at Woodbrook College deserve my deepest thanks. Your daily inspiration and motivation have been a source of continuous encouragement, greatly contributing to the creation of this work.
Lee O’Donnell
PHOTO ACKNOWLEDGEMENTS
For permission to reproduce photographs and other images, the author and publisher gratefully acknowledge the following:
Alamy: p.12 © Jim West; p.19 © zhencong chen; p.40 © Kathy Wright; p.41 © John Sirlin. Getty Images: p.90 © KEREM YUCEL. Science Photo Library: p.10 © Paul Rapson; p.70 © Karsten Schneider. Shutterstock: p.1 © Valentyn Volkov; p.2 © Darryl Fonseka; p.4 © studio23; p.8 © Pixel-Shot; p.10 © Ningaloo.gg; p.21 © bombermoon; p.32 © Bekti Dwi; p.36 © Taiga; p.41 © Amappi, Somyot Mali-ngam; p.49 © cobalt88; p.74 © Piyaset; p.92 © Encierro; p.103 © Omer koclar; p.106 © 4H4 PH.
iv
OPTION 9: THE ATMOSPHERE AND OCEAN ENVIRONMENTS
01 THE ATMOSPHERE AND OCEAN ENVIRONMENTS
02 SOLAR ENERGY AND GLOBAL TEMPERATURES
03 MOISTURE IN THE ATMOSPHERE
04 OCEANS, ATMOSPHERE, WEATHER AND CLIMATE
05 CLIMATIC ENVIRONMENTS
06 CLIMATE CHARACTERISTICS AND ECONOMIC DEVELOPMENT
1
THE ATMOSPHERE AND OCEAN ENVIRONMENTS
CHAPTER 01
SYLLABUS LINK
9.1 THE ATMOSPHERE GASES AND OCEAN WATERS ARE LINKED SYSTEMS WITH PHYSICAL AND CHEMICAL CHARACTERISTICS, WHICH CAN BE OBSERVED, RECORDED, AND ANALYSED
KNOWLEDGE RETRIEVAL
Retrieval Quiz
1. What type of climate does Ireland have?
2. What is the main influence on Ireland’s climate?
3. How does the North Atlantic Drift affect Ireland’s climate?
4. How do the prevailing winds affect Ireland’s climate?
5. What role does the polar front play in Ireland’s climate?
LEARNING INTENTIONS
1. Outline the composition and structure of the atmosphere.
2. Describe how atmospheric conditions are measured.
3. Discuss how climate is measured to understand atmospheric conditions.
4. Outline the characteristics and vertical structure of oceans.
KEYWORDS
Nitrogen OxygenTroposphereStratosphere
ExosphereAtmospheric conditions
Atmospheric pressureRelative humidity
Ice core analysis
Ocean monitoring
Ocean trenches Vertical structure of the oceans
Weather forecasting Temperature
Wind patterns
Climate change
SalinityDensity/pressure
Sunlight zone
Midnight zone
TOPIC 1.1: Geographical Writing for Atmosphere and Oceans
The ‘Atmosphere and Oceans’ section of the Leaving Certificate Geography Syllabus has a different marking scheme from the rest of the written paper. It is the only part of the written paper that takes into consideration overall coherence as part of the marking scheme. This means that your answer must be written with a logical structure and must contain a consistent flow.
In order to ensure your answer has a logical structure and consistent flow, it is best to construct your answer into different aspects you are going to discuss. An aspect can be defined as an area of discussion that is relevant to the question being asked.
In each ‘Atmosphere and Oceans’ answer, you will structure your answer into either three or four aspects:
• If you are writing about three aspects, you must write a minimum of 8 SRPs per aspect.
• If you are writing about four aspects, you must write a minimum of 6 SRPs per aspect.
MARKING SCHEME
MARKING
SCHEME: 3 ASPECTSMARKING SCHEME: 4 ASPECTS
Name aspect = 4 marksName aspect = 3 marks
Discuss for 8 SRPs = 16 marksDiscuss for 6 SRPs = 12 marks
Overall coherence = 20 marksOverall coherence = 20 marks
A1(20m) + A2(20m) + A3(20) + OC(20m) = 80 marks
A1(15m) + A2(15m) + A3(15m) + A4(15m) + OC(20m) = 80 marks
3 CHAPTER 1 | THE ATMOSPHERE AND OCEAN ENVIRONMENTS
TOPIC 1.2: The Atmosphere
COMPOSITION OF THE
ATMOSPHERE
The Earth’s atmosphere is a blend of gases that envelops our planet, providing the air we breathe and playing a crucial role in maintaining life. An understanding of the Earth’s atmosphere and its composition is vital for understanding the relationship between atmospheric components (such as greenhouse gases) and climate change. This understanding has never been more important, as climate models predict that Earth’s global average temperature will rise an additional 4°C during the twenty-first century, if greenhouse gas levels continue to rise at the current rate. The study of the composition of the atmosphere highlights how carbon dioxide levels influence global temperatures, precipitation patterns, and rising sea levels.
KEY COMPONENTS
1. Nitrogen (N2): Nitrogen dominates our atmosphere, accounting for approximately 78 per cent of its composition. It is essential for all living organisms and plays a role in various natural processes. For example, nitrogen plays a pivotal role in natural processes such as nitrogen fixation by bacteria, which converts atmospheric nitrogen into a form usable by plants
2. Oxygen (O2): Oxygen makes up about 21 per cent of the atmosphere. It is vital for respiration in plants and animals, including humans.
3. Argon (Ar): Argon is a noble gas that constitutes around 0.93 per cent of the atmosphere. It is chemically inert (does not react) and remains relatively constant in its abundance.
4. Carbon dioxide (CO2): Carbon dioxide is a greenhouse gas that plays a crucial role in the Earth’s climate. It makes up approximately 0.04 per cent of the atmosphere, but its concentration has been increasing due to human activities, contributing to global warming.
5. Trace gases: These include various gases present in minute quantities, such as neon, helium, methane and ozone. Individually, their percentages are small, but they can have significant effects on climate and atmospheric chemistry.
VARIABILITY AND IMPORTANCE

The composition of the atmosphere can vary with altitude and location. For example, at higher altitudes, the proportion of oxygen decreases, making it harder to breathe.
The atmosphere is essential for various geophysical and environmental processes, including weather patterns, the greenhouse effect, and protecting the Earth from harmful solar radiation Understanding the composition of the atmosphere is vital for addressing climate change, air quality, and atmospheric dynamics.
THE NATURAL WORLD – OPTION 9 4
Figure 1.1
Gas Percentage by Volume Nitrogen (N2)78.084 Oxygen (O2) 20.946 Argon (Ar) 0.934 Carbon dioxide (CO2) 0.037 Neon (Ne) 0.00182 Helium (He) 0.00052 Methane (CH4) 0.00015 Krypton (Kr) 0.00011 All other gases 1% Oxygen 21% Nitrogen 78%
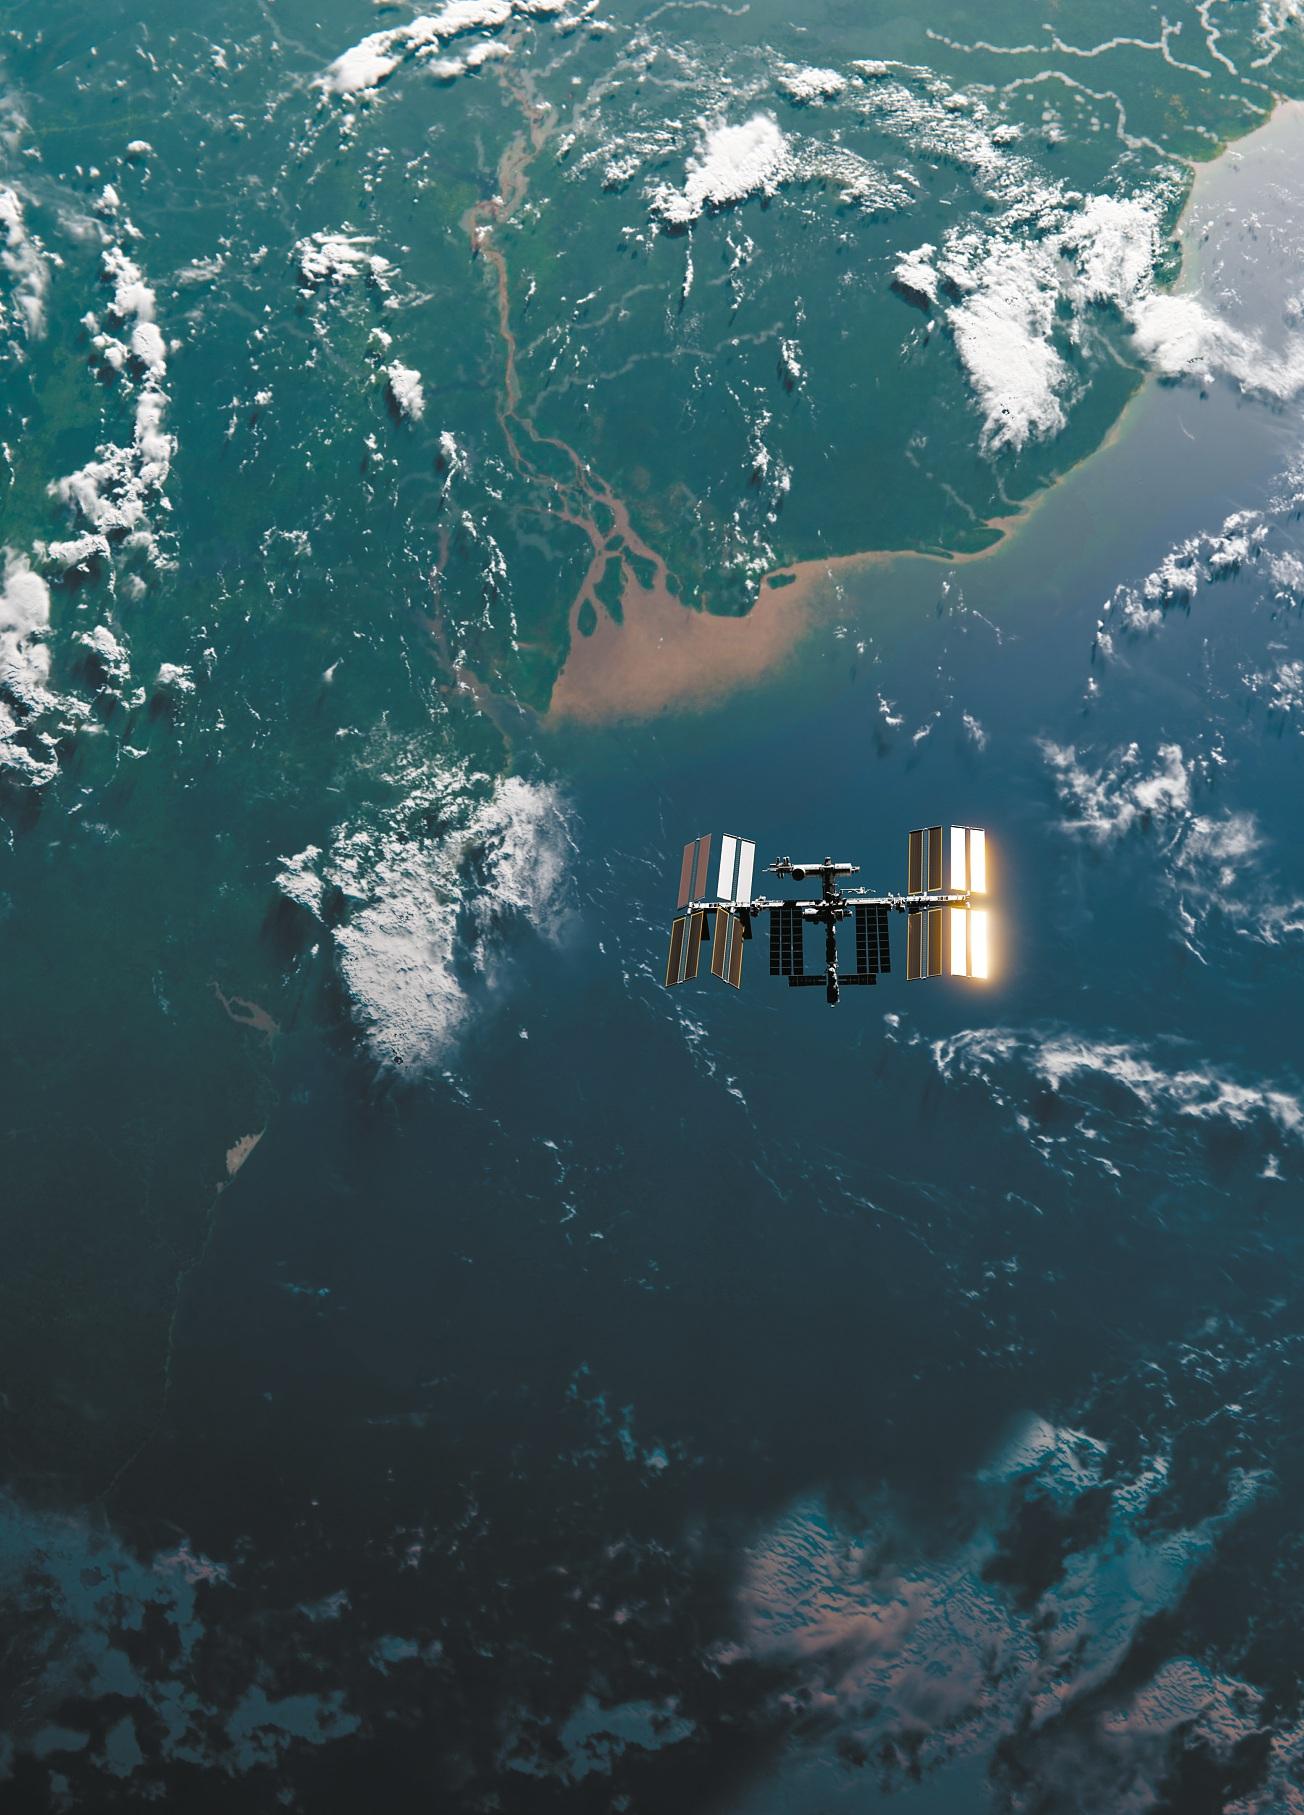
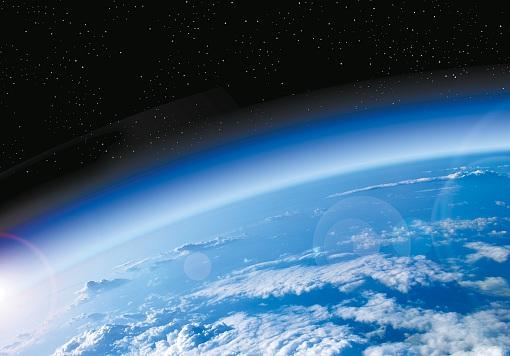
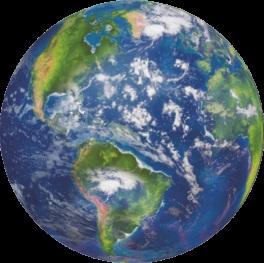
The Earth and its atmosphere as seen from space
Figure 1.2
the
The components of
atmosphere
STRUCTURE OF THE ATMOSPHERE
The Earth’s atmosphere is divided into distinct layers, each with its own unique characteristics and functions. The five layers of the atmosphere, starting from the closest to the Earth’s surface, are:
1. Troposphere
2. Stratosphere
3. Mesosphere
4. Thermosphere
5. Exosphere
TROPOSPHERE
The troposphere is the layer closest to the Earth’s surface, extending approximately 8–15 kilometres above sea level. It’s where weather occurs, and its temperature generally decreases with altitude. The troposphere contains most of the Earth’s clouds, and it’s the layer where we live and where airplanes fly.
STRATOSPHERE
Above the troposphere lies the stratosphere, reaching up to about 50 kilometres above the Earth’s surface. Here, temperatures rise with increasing altitude, primarily due to the presence of the ozone layer. The stratosphere plays a crucial role in protecting life on Earth by absorbing and blocking harmful ultraviolet (UV) radiation from the sun.
MESOSPHERE
The mesosphere extends from the stratosphere to about 85 kilometres above the Earth’s surface. In this layer, temperatures decrease again with altitude, making it one of the coldest places in the atmosphere. It’s also where meteors burn up upon entry, creating visible streaks of light known as shooting stars.
THERMOSPHERE
The thermosphere extends from about 85 kilometres to over 600 kilometres above the Earth’s surface. Unlike the other layers, the temperature in the thermosphere rises significantly with increasing altitude due to the absorption of intense solar radiation. However, it would feel extremely cold to us because of the low density of molecules in this region. The International Space Station (ISS) orbits within the thermosphere
EXOSPHERE
The outermost layer of the Earth’s atmosphere is the exosphere, which extends beyond the thermosphere and gradually transitions into space. In the exosphere, molecules are incredibly sparse, and it is where satellites and space debris orbit the Earth. It is essentially the edge of our atmosphere, where the atmosphere merges with the vacuum of outer space.
5 CHAPTER 1 | THE ATMOSPHERE AND OCEAN ENVIRONMENTS
.
10 TROPOSPHERE He ight (km ) OZONE Tropopause THERMOSPHERE EXOSPHERE Aircraft 20 30 40 50 60 70 80 90 100 Mt Everest
STRATOSPHERE MESOSPHERE
Figure 1.3 Structure of the atmosphere
CHECK YOUR UNDERSTANDING
Basic Knowledge
1. What is the most abundant gas in Earth’s atmosphere, and what percentage of the atmosphere does it account for?
2. Name the layer of the atmosphere closest to the Earth’s surface and describe one important feature or function of this layer.
3. Which gas in the atmosphere is considered a greenhouse gas, and what role does it play in the Earth’s climate?
Developed Knowledge
1. Describe the composition of the Earth’s atmosphere.
2. Explain how the composition of the atmosphere can vary with altitude.
3. Discuss the significance of the ozone layer in the stratosphere.
Advanced Knowledge
1. Analyse the impact of increasing carbon dioxide (CO2) levels in the atmosphere due to human activities on global warming and climate change.
2. Investigate the role of each atmospheric layer mentioned in the text (troposphere, stratosphere, mesosphere, thermosphere, and exosphere).
3. How does the exosphere’s sparse molecular density affect space exploration and satellite activities?
TOPIC 1.3: Measuring Atmospheric Conditions
INTRODUCTION
Although measuring the atmosphere is a complex task, it is integral to our understanding of weather and climate. Understanding atmospheric conditions enables humans to predict weather and to study long-term climate patterns. Meteorologists and climate scientists use various methods to measure these conditions accurately.
MEASURING WEATHER TO UNDERSTAND ATMOSPHERIC CONDITIONS
There are four basic elements of weather:
1. Temperature
2. Atmospheric pressure
3. Relative humidity
4. Wind
TEMPERATURE
Temperature is a critical factor in understanding atmospheric conditions and predicting weather Temperature is the degree of hotness or coldness of the atmosphere. It is commonly measured in Celsius or Fahrenheit. Accurate temperature measurements provide valuable insights into the state of the atmosphere and help meteorologists make weather forecasts.
Measuring temperature
A thermometer is the most common instrument used to measure temperature. Thermometers contain a liquid, often mercury or alcohol, that expands or contracts with changes in temperature.
THE NATURAL WORLD – OPTION 9 6
3
The temperature is read from a scale on the thermometer. Modern thermometers use digital displays for easy and precise readings.
Weather stations consist of various instruments, including thermometers, that collect data on temperature, pressure, humidity, and wind speed These stations are strategically located to provide comprehensive weather information for specific regions.
Remote-sensing satellites equipped with infrared sensors can measure temperature from space. They capture thermal infrared radiation emitted by Earth’s surface, which is influenced by surface temperature.
Floating buoys in oceans and large bodies of water are equipped with temperature sensors. They transmit data in realtime, helping meteorologists to monitor the temperature of the sea surface, which is crucial for predicting tropical storms.
Application
Accurate temperature measurements aid in weather forecasting. Meteorologists analyse temperature patterns to predict changes in weather, including cold fronts, heatwaves and precipitation. Understanding temperature variations at different altitudes in the atmosphere helps determine weather conditions. Temperature inversions, where warm air lies above cooler air, can trap pollutants and impact air quality.
The importance of temperature measurements
The vertical temperature profile of the atmosphere can give clues about upcoming weather conditions. For example, a rapid decrease in temperature with height can indicate unstable air, which might lead to thunderstorms or turbulence. Conversely, a slower temperature decrease or temperature inversion (where temperature increases with altitude) can suggest stable conditions, often associated with clear skies.
This measurement of temperature conditions is used in hurricane prediction. By measuring temperature at different altitudes, meteorologists can assess the structure and intensity of tropical cyclones. For instance, the National Hurricane Centre (NHC) in the United States uses temperature profiles from dropsondes (weather-measuring devices dropped from aircraft) to gauge the thermal structure inside hurricanes. This information, combined with data on wind speed and direction at different altitudes, helps in predicting the path and intensity of hurricanes, providing vital information for issuing warnings and enabling people to prepare for evacuations
In August 2020, Hurricane Laura was closely monitored using such techniques Measurements indicated a rapidly intensifying system as it approached the Gulf Coast, leading to accurate forecasts of its landfall as a Category 4 hurricane. This allowed for timely evacuations, potentially saving many lives.
ATMOSPHERIC PRESSURE
Atmospheric pressure, also known as barometric pressure, plays a crucial role in understanding weather patterns. Atmospheric pressure can be defined as the force exerted on a surface by the air above it as gravity pulls it to Earth. Measuring atmospheric pressure helps meteorologists predict weather changes and track the movement of weather systems.
7 CHAPTER 1 | THE ATMOSPHERE AND OCEAN ENVIRONMENTS
Left bulb Minimum temperature of 24°C Maximum temperature of 30°C Right bulb Vacuum °C °C –25 Mercury Metal indices Alcohol –20 –25 –20 –15 –10 –5 0 5 10 15 20 25 30 35 40 –15 –10 –5 0 5 10 15 20 25 30 35 40
Figure 1.4 Maximum and minimum thermometer
Measuring atmospheric pressure
Barometers are instruments specifically designed to measure atmospheric pressure. The most common type is the mercury barometer, which uses the height of a column of mercury in a sealed tube to indicate pressure changes When pressure rises, the mercury column falls, and when pressure falls, the column rises. Aneroid barometers, which are built into a flexible box and do not contain liquids, are portable.

Automated weather stations are equipped with barometers, among other instruments. These stations continuously monitor atmospheric pressure and transmit data to central meteorological agencies. The data from multiple stations is used to create weather maps, detect pressure systems such as highs and lows, and predict weather changes.
Modern technology has led to the development of electronic pressure sensors, such as piezoelectric sensors These sensors convert pressure changes into electrical signals, which can be easily measured and recorded by computers. They are commonly used in portable weather instruments and automated data collection systems.
Application
Changes in atmospheric pressure are closely linked to weather changes. Falling pressure often indicates an approaching storm, while rising pressure suggests fair weather Meteorologists use pressure patterns to predict the movement of weather systems, including the development of hurricanes and the movement of high- and low-pressure areas.
The importance of atmospheric pressure measurements
Hurricane Harvey stands as a stark example of how measuring changes in atmospheric pressure is crucial for predicting severe weather patterns. Harvey, which struck the Texas coast in August 2017, quickly intensified into a Category 4 hurricane, primarily due to the rapid drop in atmospheric pressure as it approached land.
In the days leading up to Harvey’s landfall, meteorologists closely monitored a significant decrease in atmospheric pressure, a clear indicator that the storm was strengthening. The central pressure of Harvey dropped suddenly, a phenomenon known as ‘rapid intensification’, signalling the storm’s potential for severe impact. This rapid intensification, captured through atmospheric pressure readings, allowed forecasters to issue timely warnings about the hurricane’s severity.
Harvey made landfall near Rockport, Texas, on 25 August 2017, with sustained winds of 210 kmph. The storm caused catastrophic flooding, particularly in the Houston metropolitan area, leading to significant property damage and loss of life. The early warnings, based on atmospheric pressure measurements, were crucial in mobilising emergency responses and evacuations, though the storm’s unprecedented rainfall highlighted challenges in predicting the full scope of such events.
RELATIVE HUMIDITY
Relative humidity is a crucial parameter for understanding atmospheric conditions and predicting weather It measures the amount of moisture in the air relative to the maximum amount the air can hold at a specific temperature. This information is vital for meteorologists in forecasting various weather phenomena.
Measuring relative humidity
Hygrometers are instruments designed to measure relative humidity accurately The most common type is the psychrometer, which consists of two thermometers – one with a wet
THE NATURAL WORLD – OPTION 9 8
Figure 1.5
Aneroid barometer
bulb and another with a dry bulb. By comparing the temperature readings from the two thermometers, meteorologists can determine relative humidity When air is dry, the wet bulb cools more quickly due to evaporation, resulting in a larger temperature difference between the two bulbs. Conversely, in humid conditions, the wet bulb cools less, leading to a smaller temperature difference.
Modern technology has impacted the study of meteorology through the introduction of electronic sensors, such as capacitive humidity sensors These sensors measure changes in electrical capacitance caused by the absorption of water vapour Sensors provide quick and accurate relative humidity readings, making them valuable in weather stations, climate monitoring, and weather forecasts.
Applications
Relative humidity plays a crucial role in weather patterns. High relative humidity indicates moist air, which can lead to cloud formation and precipitation. Low relative humidity suggests dry air, which may result in sunny and clear conditions Meteorologists use relative humidity data to predict weather changes and assess the potential for rain, storms or fog.
Importance of relative humidity measurements
Relative humidity influences evapotranspiration rates, the process through which water is transferred from the land to the atmosphere by evaporation from the soil and other surfaces and by transpiration from plants. High humidity levels can slow down evapotranspiration, leading to excessive moisture around plants. This can affect plant health, making crops more susceptible to diseases and pests. Conversely, low humidity levels can accelerate evapotranspiration, increasing the need for irrigation to prevent plant stress or drought conditions.
• Farmers use measurements of relative humidity to make informed decisions about watering schedules, planting times and harvesting periods. By understanding the moisture content in the air, they can adjust their irrigation systems to apply water more efficiently, reducing waste and improving crop yield. Additionally, humidity data can help in predicting the spread of plant diseases and pests, which often thrive in specific humidity conditions.
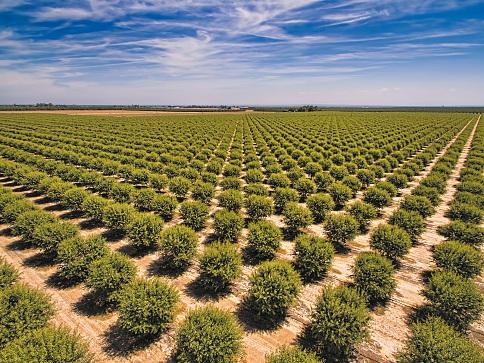
An example of this principle at work can be seen in California’s almond farms. The state, a leading producer of almonds, uses sophisticated weather stations that measure relative humidity, among other variables, to guide irrigation practices In recent years, due to drought conditions, these measurements have become crucial in implementing precision irrigation techniques By closely monitoring relative humidity, farmers can optimise water use, ensuring that almond trees receive adequate moisture without over-irrigation, which is vital for the health of the crop and for conservation of water resources.
9 CHAPTER 1 | THE ATMOSPHERE AND OCEAN ENVIRONMENTS
20 30 20 10 0 10 20 30 40 50 10 0 10 20 30 40 50 60 70 80 90 100 110 120 30 20 10 0 10 20 30 40 50 20 10 0 10 20 30 40 50 60 70 80 90 100 110 120 DRY °F °C °F °C WET Wet bulb thermometer Dry bulb thermometer Temperature scale
Muslin cloth Water container
Figure 1.6 Hygrometer
In one notable instance, almond farmers in California’s Central Valley used relative humidity data alongside soil moisture sensors to reduce their water use by up to 20 per cent while maintaining, or even increasing, their yields. This approach not only conserves water but also minimises the risk of fungal diseases, which can proliferate in overly moist conditions.
WIND
Understanding wind patterns is crucial in meteorology for predicting weather conditions. Wind is the movement of air masses in the Earth’s atmosphere, and measuring wind accurately is essential for various applications, including weather forecasting and climate research.
Measuring wind
Anemometers are instruments designed to measure wind speed The most common type is the cup anemometer, consisting of three or more cups attached to horizontal arms. When wind blows, the cups rotate. The speed of rotation is directly proportional to wind speed, allowing meteorologists to calculate the wind’s velocity.
Wind direction is just as important as wind speed in meteorology. Wind vanes, also known as weathervanes or windsocks, are used to determine wind direction. A wind vane typically consists of a flat, arrow-shaped plate that rotates on a vertical axis. The plate aligns itself with the direction from which the wind is blowing.
Applications

Accurate wind data is essential for predicting weather conditions. Wind patterns can influence temperature, cloud formation, and the movement of weather systems Meteorologists use wind measurements to anticipate changes in weather, including the approach of storms, shifts in wind direction, and variations in wind speed. Additionally, pilots and air traffic controllers rely on wind data for safe and efficient air travel. Wind speed and direction affect aircraft performance during take-off, landing and flight. Wind shear, a rapid change in wind direction or speed, can be hazardous to aviation. Monitoring wind conditions is critical for flight planning and safety
MEASURING CLIMATE TO UNDERSTAND
ATMOSPHERIC CONDITIONS
There are three main methods of measuring climate to help understand long-term atmospheric changes and patterns:
1. Long-term temperature records
2. Ice core analysis
3. Ocean monitoring
THE NATURAL WORLD – OPTION 9 10
Figure 1.7
Almond farms in California cover over 1 million acres of land in the state.
Figure 1.8
Wind vane and anemometer
LONG-TERM TEMPERATURE RECORDS
To measure long-term temperature records, scientists employ various methods and technologies.
Historical temperature records
Traditional weather stations have recorded daily temperature data for many years. These records, which include maximum and minimum temperatures, are often collected manually Historical data from these stations provides valuable insights into long-term temperature trends
Modern meteorological instruments, such as digital thermometers and automated weather stations, have improved the accuracy and efficiency of temperature measurements. These instruments ensure consistent and standardised data collection. Automated weather stations have significantly reduced human error and increased the efficiency of data collection. In 2021 a report by the European Centre for Medium-Range Weather Forecasts (ECMWF) revealed that automated stations can collect temperature data at intervals as short as every minute, ensuring timely and comprehensive observations.
Satellite-based measurements
Satellites equipped with remote sensing instruments can capture temperature data from the Earth’s surface, oceans and atmosphere. These satellite-based measurements allow global temperature datasets to be created, which is essential for monitoring climate changes on a large scale.
Satellites have provided a consistent and comprehensive record of temperature data since the late twentieth century. Organisations such as NASA and the European Space Agency (ESA) manage satellite programmes dedicated to Earth observation, ensuring long-term data continuity.
Climate models and data analysis
Climate scientists use computerbased climate models to analyse long-term temperature records and project future climate scenarios. These models incorporate historical temperature data to simulate climate processes and predict potential climate impacts.
Researchers employ statistical techniques and data analysis tools to identify trends, anomalies and patterns in long-term temperature records. These analyses help in detecting climate change signals and understanding the factors that contribute to temperature variations. For example, statistical analysis of global temperature data reveals a consistent upward trend over the past century. The year 2023 was the hottest year on record, with daily global temperature averages surpassing
11 CHAPTER 1 | THE ATMOSPHERE AND OCEAN ENVIRONMENTS
levels by more than 2°C
Year: 200 400 600 800 1000 1200 1400 1600 1800 2000 +1.0 °C +0.5 °C 0.0 °C –0.5 °C
pre-industrial
.
warm period’ ‘Little ice age’
Global Average Temperature Change ‘Medieval
Figure 1.9
1980 1990 2000 Hindcast Forecast evaluation for models run in 2004 Ensemble mean Observations (+ 2019 estimate) Forecast Year Temp erature changes (°F) (1980–1999) 2010 2020 1970 –0.5 0.0 0.5 1.0 1.5
Global temperature records
models are accurately predicting global warming
Figure 1.10 Climate
Detecting anomalies
Through statistical methods such as anomaly detection algorithms, researchers identify deviations from expected temperature norms. This helps to identify unusual climatic events. Anomaly detection algorithms analyse temperature data over time, flagging anomalies that surpass typical variations. For instance, spikes in temperature beyond seasonal norms may indicate heatwaves or extreme weather events. In August and September of 2023, for example, Europe experienced an intense heatwave that shattered temperature records across several countries An anomaly detection algorithm used by meteorologists identified spikes in temperature beyond seasonal norms, indicating the onset of extreme heatwaves.
In France, for instance, temperatures soared well above 40 degrees Celsius in some regions such as the Rhône Valley, far exceeding typical summer averages. Similarly, parts of Spain, Germany, Belgium and the Netherlands also experienced unprecedented heat.
Applications
Long-term temperature records are vital for assessing climate change, identifying temperature trends, and understanding the impact of global warming on ecosystems, weather patterns, and sea levels.
Government agencies, policymakers and environmental organisations use long-term temperature data to formulate climate-related policies, adapt to changing conditions, and develop strategies for mitigating the effects of climate change.
Long-term temperature records support scientific research in various fields, including ecology, agriculture and public health. Researchers rely on historical data to investigate climate-related phenomena and develop solutions for climate-related challenges.
ICE CORE ANALYSIS
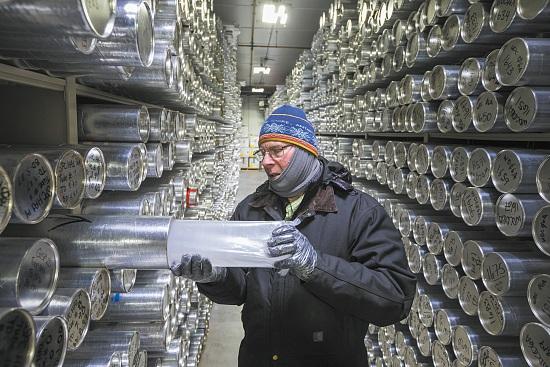
Ice cores are valuable tools for studying Earth’s climate history. These cylindrical samples of ice drilled from polar ice sheets and mountain glaciers contain layers of ancient ice that can provide insights into atmospheric conditions and long-term climate patterns.
Collection of ice cores
Scientists use special drills to extract ice cores from regions such as Antarctica and Greenland, where ice has accumulated over thousands of years. These cores can extend several kilometres deep. Ice cores are transported to laboratories, and maintained in their frozen state to preserve the layers and the information they contain.
Analysing ice cores
Each layer in an ice core represents one year’s worth of snowfall, with air bubbles trapped inside. By counting layers and analysing the air bubbles, scientists can determine past temperatures and atmospheric compositions.
The ratio of oxygen isotopes in ice varies with temperature. By measuring these ratios, researchers can estimate past temperatures and identify climate fluctuations.
Ice cores also contain various impurities, such as dust and chemical substances. The concentration of these impurities provides information about past atmospheric conditions, including volcanic eruptions, wildfires, and human activities.
THE NATURAL WORLD – OPTION 9 12
Figure 1.11 Ice core analysis
Hydrogen and deuterium isotopes in ice cores help identify variations in past precipitation patterns, which can reveal changes in regional climate.
Climate insights
Ice cores provide a record of climate variations spanning thousands of years. They offer evidence of ice ages, warmer periods, and abrupt climate changes. By examining ice cores, scientists can distinguish natural climate variability from human-induced climate change, which is crucial for predicting future climate trends. Ice core data helps assess the impact of past climate changes on ecosystems, sea levels, and the availability of freshwater resources.
OCEAN MONITORING
Oceans play a crucial role in regulating the Earth’s climate. Monitoring ocean conditions is essential for understanding atmospheric patterns and long-term climate trends.


1. Ocean temperature: Scientists use a network of buoys, ships and satellites to monitor sea surface temperatures (SST) SST data help identify temperature anomalies like El Niño and La Niña, which can influence weather patterns globally.
2. Sea level rise: Satellite altimeters measure changes in sea level with remarkable precision. Rising sea levels indicate global warming, which will affect coastal regions and contribute to extreme weather events.
3. Ocean circulation: Oceanographic instruments such as floats and research vessels are used to study ocean currents. Understanding ocean circulation helps predict climate changes, such as the North Atlantic Oscillation
4. Ocean chemistry: Sensors measure parameters such as ocean acidity and oxygen levels. Changes in ocean chemistry affect marine ecosystems and influence carbon dioxide absorption.
5. Ice melt: Satellites and aerial surveys monitor ice sheets and glaciers. Melting ice contributes to rising sea levels and impacts regional climates.
13
| THE ATMOSPHERE AND OCEAN ENVIRONMENTS
CHAPTER 1
Decision support tools Air gap sensor PORTS visibility sensor Continuously operating reference station Water level gauge Water quality monitoring Buoys: Ocean chemistry Wave sensors Water temperature gauge Meteorological sensors Harmful algal bloom monitoring Aton mounted acoustic Doppler current profiler Bottom mounted acoustic Doppler current profiler
vehicle Single
Meteorological station High frequency radar Airborne LIDAR aerial imagery airborne gravimeter Satellite communication
Glider or autonomous underwater
beam sonar Multibeam sonar
Figure 1.12
Monitoring the atmosphere from land, sea and sky
6. Ocean currents: Instruments such as acoustic Doppler current profilers (ADCPs) track currents. Ocean currents transport heat, influencing weather and climate patterns.
7. Marine life and ecosystems: Research vessels, underwater drones, and satellites monitor marine ecosystems. Changes in marine life reflect shifts in ocean conditions and climate impacts.
CHECK YOUR UNDERSTANDING
Basic Knowledge
1. What are the four basic elements of weather?
2. Name two instruments used for measuring temperature.
3. What role does atmospheric pressure play in understanding weather patterns?
Developed Knowledge
1. Explain how temperature measurements are taken using thermometers and weather stations.
2. Discuss the importance of relative humidity in weather forecasting and its impact on various weather phenomena.
3. Describe the instruments used to measure wind speed and wind direction. Why are both parameters important in meteorology?
Advanced Knowledge
1. Analyse the significance of long-term temperature records in climate change assessment and policymaking.
2. Investigate the process of ice core analysis and its role in studying Earth’s climate history.
3. Consider the importance of ocean monitoring in understanding atmospheric patterns and long-term climate trends.
WRITE LIKE A GEOGRAPHER
1. Give an account of how atmosphere and ocean phenomena are measured and examine the importance of such measurements.
Success criteria
Your answer must:
• Accurately describe the three main methods of measuring climate.
• Include specific details about how long-term temperature records are measured.
• Explain the significance of ice core analysis.
Your answer should:
• Discuss the applications of long-term temperature records.
• Elaborate on the insights gained from ice core analysis, such as evidence of ice ages, warmer periods, and the distinction between natural climate variability and humaninduced changes.
• Describe the various aspects of ocean monitoring, covering ocean temperature, sea level rise, ocean circulation, and their implications for understanding climate patterns
Your answer could:
• Explore the technological advancements in climate measurement.
• Analyse the role of climate models and data analysis in understanding long-term temperature records.
THE NATURAL WORLD – OPTION 9 14
3
TOPIC 1.4: Ocean Environments
CHARACTERISTICS OF OCEANS
Oceans cover approximately 71 per cent of the Earth’s surface They are vast and dynamic bodies of water that play a crucial role in shaping our planet’s climate and ecosystems Additionally, they contain 97 per cent of the planet’s water To comprehend their significance, we must explore three key characteristics: salinity, temperature, and density and pressure.
SALINITY
Salinity, a fundamental characteristic of oceans, refers to the concentration of dissolved salts in seawater. It plays a crucial role in shaping the physical and biological properties of Earth’s oceans. Understanding salinity is essential for comprehending ocean dynamics and its impact on climate, marine life, and human activities.
Salinity is defined as the measurement of the total amount of dissolved salts, primarily sodium chloride (table salt), in a given volume of seawater. It is typically expressed in parts per thousand (ppt) For example, seawater with a salinity of 35 ppt means there are 35 grams of dissolved salts in every kilogram of seawater.
Several factors influence the salinity of ocean water
Regions with high evaporation rates, such as the subtropics, tend to have higher salinity, as water evaporates, leaving salts behind. Conversely, areas with high precipitation rates, such as the equator or polar regions, may have lower salinity.
Rivers introduce freshwater into the ocean, which lowers salinity in coastal regions. Estuaries, where rivers meet the sea, often have lower salinity due to this freshwater input
When seawater freezes to form sea ice in polar regions, it excludes salt, making the remaining seawater saltier Conversely, when sea ice melts, it releases freshwater, reducing salinity.
Salinity levels can vary significantly across oceans and at different depths
• Atlantic versus Pacific: The Atlantic Ocean is generally saltier than the Pacific Ocean. This difference results from variations in freshwater inputs, ocean circulation patterns, and evaporation rates.
• Surface water versus deep water: Surface waters are typically less salty due to freshwater inputs, while deep ocean water can have higher salinity because it is isolated from surface processes.
Understanding salinity is vital for several reasons
Salinity influences ocean currents and circulation patterns, which, in turn, impact climate and weather systems For instance, the circulation of the Atlantic Meridional Overturning Circulation (AMOC) is driven in part by variations in salinity.
Salinity gradients create distinct ecological zones, influencing the distribution of marine species. Coral reefs, for example, thrive in regions with stable salinity levels. Salinity data is essential for climate models, helping scientists to predict and understand climate change and its effects on ocean circulation.
TEMPERATURE
Temperature is a fundamental characteristic of oceans, playing a significant role in shaping their physical properties and influencing marine life and climate systems. Understanding ocean temperatures is essential for comprehending the complex dynamics of our planet’s largest and most influential ecosystem.
15 CHAPTER 1 | THE ATMOSPHERE AND OCEAN ENVIRONMENTS
Ocean temperatures vary both horizontally and vertically, leading to distinct temperature gradients:
1. Surface temperature: The ocean’s surface temperature varies with latitude and season. Near the equator, surface waters are warm, while polar regions experience cold surface temperatures
2. Thermocline: Below the surface layer, there is often a distinct thermocline, a rapid decrease in temperature with depth. The thermocline separates the relatively warm surface layer from the cooler, deeper waters.
3. Deep ocean: Deeper in the ocean, temperatures become relatively stable and chilly, hovering just above freezing in most regions.
Several factors influence ocean temperatures:
1. Solar radiation: The sun is the primary source of heat for the ocean. Equatorial regions receive more direct sunlight and have higher surface temperatures.
2. Latitude: Temperature varies with latitude due to differences in the angle and intensity of solar radiation. Near the poles, sunlight is less direct and provides less warmth.
3. Ocean currents: Ocean currents transport warm or cold water from one region to another, affecting temperatures. For instance, the Gulf Stream brings warm water from the tropics to the North Atlantic, influencing the climate of Ireland and western Europe.
4. Seasons: Seasonal changes in solar radiation cause surface temperature variations. For example, the ocean’s surface warms in summer and cools in winter.
Ocean temperature has far-reaching effects:
1. Climate regulation: Oceans act as Earth’s heat reservoir, absorbing and releasing heat over time. This process helps regulate global climate and influences weather patterns.
2. Marine ecosystems: Temperature affects the distribution of marine species. Warmer waters support coral reefs, while colder regions are home to unique polar ecosystems.
3. Weather systems: Ocean temperatures influence the formation and intensity of tropical storms, such as hurricanes and typhoons.
Ocean temperature is measured using various tools, including buoys equipped with temperature sensors, ship-based measurements, and satellites These methods provide valuable data for understanding ocean temperature variations.
DENSITY AND PRESSURE
Density and pressure are two interconnected characteristics that define the behaviour of oceans. These factors play a crucial role in the movement of ocean waters and the distribution of marine life
Density refers to the mass of a substance per unit volume. In the context of oceans, it primarily relates to the density of seawater Several key factors influence seawater density:
1. Temperature: Colder water is denser than warmer water As water cools, its molecules slow down and come closer together, increasing its density
2. Salinity: Higher salinity increases seawater density. Saltwater is denser than freshwater because salt ions occupy space between water molecules, making the water more compact.
3. Pressure: Deeper in the ocean, pressure increases with depth. As pressure rises, it compresses water molecules, making the water denser.
Pressure is the force exerted by the weight of water and it is a function of both depth and density
Pressure increases with depth and plays a crucial role in ocean dynamics:
1. Hydrostatic pressure: The pressure at any given depth in the ocean is known as hydrostatic pressure. It is directly proportional to depth, increasing by about 1 atmosphere (atm) for every 10 metres of descent
THE NATURAL WORLD – OPTION 9 16
2. Effect on marine life: Deep-sea organisms have adapted to withstand high pressures. For example, the body structures of deep-sea fish are designed to cope with extreme pressure conditions.
Density and pressure variations lead to vertical stratification in the ocean, resulting in distinct layers:
1. Surface layer: The uppermost layer, known as the mixed layer, has relatively uniform temperature and lower density. It is influenced by wind and surface heating.
2. Thermocline: Below the mixed layer, there is a rapid temperature decrease known as the thermocline, separating the warmer surface waters from the cooler, denser layers below.
3. Deep layer: The deep ocean is characterised by low temperatures and high pressure, with relatively constant conditions.
Density differences drive ocean circulation. Cold, dense water sinks; while warmer, less dense water rises. This process, known as thermohaline circulation, plays a vital role in redistributing heat and nutrients in the ocean and influencing global climate patterns.
VERTICAL STRUCTURE OF THE OCEANS
As a result of density, pressure, salinity and temperature, oceans have developed a distinctive layer structure. There are five main layers or zones that extend from the surface of oceans to deep trenches on ocean floors:
1. The sunlight zone
2. The twilight zone
3. The midnight zone
4. The abyss
5. The trenches
17 CHAPTER 1 | THE ATMOSPHERE AND OCEAN ENVIRONMENTS
650 ft 200 m 1,000 m 4,000 m 6,000 m 11,000 m
zone (Sunlight zone)
zone (Twilight zone) Bathypelagic zone (Midnight zone) Abyssopelagic zone (Abyss) Hadalpelagic zone (Trenches) 3,300 ft 13,100 ft 19,700 ft 36,100 ft
Epipelagic
Mesopelagic
Figure 1.13
Vertical zones of the ocean
SUNLIGHT ZONE
The sunlight zone, also known as the euphotic zone, is a vertical layer in the ocean where sunlight penetrates, supporting photosynthesis and a wealth of marine life The sunlight zone extends to a depth of about 200 metres. This layer is defined by specific characteristics of salinity, temperature, density, and pressure.
Salinity and temperature
In the sunlight zone, salinity varies depending on location but tends to be relatively stable Salinity is the measure of salt concentration in seawater and it plays a critical role in the properties of ocean water.
This layer experiences the most significant temperature fluctuations with depth in the ocean. Near the surface, temperatures are warm and conducive to photosynthesis. As you descend, temperatures gradually decrease, creating a temperature gradient within this zone.
Density and pressure
The density of water in the sunlight zone is influenced by temperature and salinity. Warmer, less dense surface waters overlay cooler, denser waters below. This density difference creates a distinct boundary between the sunlight zone and the deeper layers.
The pressure in the sunlight zone is relatively low compared to deeper ocean layers. Pressure increases with depth, but in this upper layer, it remains manageable for marine life and human activities. The sunlight zone is characterised by the transition between the low-pressure surface and the high-pressure depths.
TWILIGHT ZONE
The twilight zone, also known as the mesopelagic zone, is a vertical layer in the ocean that lies below the sunlight zone and above the midnight zone. The twilight zone extends from a depth of 200 metres to approximately 1,000 metres This zone is characterised by unique conditions of salinity, temperature, density, and pressure that shape the environment and life within it.
Salinity and temperature
In the twilight zone, salinity remains relatively stable, with values similar to the surface However, it can vary slightly due to factors such as water currents and the mixing of water masses.
The temperature in this layer decreases with depth Near the upper boundary, temperatures may be relatively mild, but as you descend further, they gradually drop. The twilight zone represents a transition zone where surface warmth gives way to the cooler depths of the ocean.
Density and pressure
The density of water in the twilight zone is influenced by both temperature and salinity Cooler and saltier water tends to be denser, creating vertical stratification in the ocean. This layer exhibits a noticeable change in density as you move from the upper mesopelagic to the lower mesopelagic, where temperatures and salinity levels continue to decrease.
The pressure in the twilight zone increases significantly with depth. At the lower boundary of this zone, pressures can reach several hundred times that of sea level. These high pressures present challenges to both humans and marine life that venture into these depths.
MIDNIGHT ZONE
The midnight zone, also known as the bathypelagic zone, is a mysterious vertical layer in the ocean, characterised by its extreme depth and unique environmental conditions. This layer is home to a variety of adaptations that allow marine life to thrive in near-total darkness.
The midnight zone begins at a depth of approximately 1,000 metres and extends down to around 4,000 metres. This makes it one of the deepest layers in the ocean, and it is far removed from the sunlit surface waters.
THE NATURAL WORLD – OPTION 9 18
Salinity and temperature
Salinity in the midnight zone is relatively stable and similar to that in the upper layers of the ocean. Salinity does not fluctuate dramatically in this zone, as it does in the surface waters.
The temperature in the midnight zone is relatively cold and hovers around 2 to 4 degrees Celsius (36 to 39 degrees Fahrenheit). It remains relatively constant due to the absence of sunlight.
Density and pressure
The density of water in the midnight zone is influenced primarily by temperature, as salinity variations are minimal. Colder temperatures result in higher density, creating a layer where water becomes progressively denser with depth. The pressure in the midnight zone is immense, reaching up to 400 times atmospheric pressure at the surface. Organisms living here have evolved unique adaptations to withstand this extreme pressure.
ABYSS

1.14
Many deep-sea organisms can emit ‘living light’ through a chemical reaction, bringing light to the otherwise total darkness of the deep ocean. This is known as bioluminescence For example, angler fish use bioluminescence to attract their prey.
The abyss, also known as the abyssopelagic zone, is a vertical layer in the ocean, characterised by its extreme depth and unique environmental conditions. This layer is home to some of the most mysterious and otherworldly creatures on our planet. Let’s delve into the key characteristics of the abyss, including depth, salinity, temperature, density, and pressure.
Depth
The abyss begins at a depth of around 4,000 metres and descends to the depths of up to 6,000 metres or more. It is one of the Earth’s deepest and darkest realms, far removed from the sunlight that penetrates shallower waters.
Salinity and temperature
The salinity in the abyss is relatively stable and similar to that in the upper layers of the ocean. Unlike the surface waters, where salinity can vary significantly due to evaporation and precipitation, the abyss maintains a constant salinity.
The temperature in the abyss is quite chilly, hovering around 2 to 4 degrees Celsius. Unlike surface waters that experience temperature fluctuations, the abyss maintains a frigid but stable environment.
Density and pressure
The density of water in the abyss is primarily influenced by its temperature. The cold temperatures result in higher density, making the water denser as you descend further into the abyss. The pressure in the abyss reaches over 600 times atmospheric pressure at the surface. This crushing pressure poses a formidable challenge to any explorers or organisms that venture into these depths.
TRENCHES
The oceanic trenches represent some of the most mysterious features of our planet’s oceans. These features stretch across the ocean floor, and are characterised by their extreme depth, salinity, temperature, density, and pressure.
19 CHAPTER 1 | THE ATMOSPHERE AND OCEAN ENVIRONMENTS
Figure
Depth
Ocean trenches are the deepest parts of the Earth’s oceans, plunging to astonishing depths. The Mariana Trench, for example, is the deepest of them all, with a maximum known depth of approximately 10,928 metres. To put this into perspective, if Mount Everest were placed into the Mariana Trench, its peak would still be over 2 kilometres below the surface
Salinity and temperature
The trenches exhibit a consistent and stable salinity, similar to the rest of the deep ocean. Salinity variations are relatively minimal in these deep, isolated areas.
The temperature within the trenches remains relatively constant and cold, hovering around 1 to 4 degrees Celsius. This temperature is significantly cooler than surface waters, primarily due to the absence of sunlight.
Density and pressure
Trenches have denser water due to the lower temperatures at these extreme depths. The cold water increases the density, making it heavier compared to surface waters.
The pressure in ocean trenches reaches over 1,000 times atmospheric pressure at the surface. At the deepest point in the Mariana Trench, the pressure is equivalent to the weight of approximately 1,000 elephants resting on a car
CHECK YOUR UNDERSTANDING
Basic Knowledge
1. What percentage of Earth’s surface is covered by oceans?
2. Define salinity and explain why it is important in understanding oceans.
3. What factors influence the salinity of ocean water, and how does it vary across different regions?
Developed Knowledge
1. Describe the concept of the thermocline and its role in ocean temperature variation.
2. Discuss how density and pressure change with depth in the ocean.
3. Explain the importance of salinity in ocean circulation and its impact on climate and marine life.
Advanced Knowledge
1. Differentiate between the various ocean layers. Your answer should discuss how these zones differ in terms of depth, temperature, density and pressure.
2. Examine the significance of ocean trenches, such as the Mariana Trench, in the context of oceanography, 3
PAST EXAM PAPER QUESTION
HIGHER LEVEL
2017
Give an account of how atmosphere–ocean phenomena (e.g. pressure, temperature, wind and humidity) are measured and examine the importance of such measurements.
(80 marks)
THE NATURAL WORLD – OPTION 9 20
SOLAR ENERGY AND GLOBAL TEMPERATURES
CHAPTER 02

SYLLABUS LINK
9.2 SOLAR ENERGY IS DISTRIBUTED UNEVENLY OVER THE SURFACE OF THE EARTH AND IS BOTH TRANSFORMED AND REDISTRIBUTED THROUGH CIRCULATION PATTERNS IN THE ATMOSPHERE AND OCEANS
KNOWLEDGE RETRIEVAL
Retrieval Quiz
1. What is the most abundant gas in Earth’s atmosphere, and what percentage of the atmosphere does it account for?
2. Name the layer of the atmosphere closest to the Earth’s surface and describe one important feature or function of this layer.
3. What role does atmospheric pressure play in understanding weather patterns?
4. What percentage of the Earth’s surface is covered by oceans?
5. Define salinity and explain why it is important in understanding oceans.
21
LEARNING INTENTIONS
1. Explain the concept of the heat budget of the Earth.
2. Describe the global distribution of temperature.
3. Outline global temperature patterns in the northern and southern hemispheres.
KEYWORDS
Earth’s heat budget Geographical distribution of temperature Ocean currents Prevailing winds
Altitude Northern hemisphereSouthern hemisphereLandmass distribution
Seasonal dynamics
TOPIC 2.1: The Heat Budget of the Earth and Global Distribution of Temperature
THE HEAT BUDGET
Understanding how temperature varies across the Earth’s surface is crucial for comprehending the complex systems that govern our climate. This process, known as the Earth’s heat budget, helps us explain why some regions are hot, while others are cold, and why some experience dramatic temperature fluctuations.
EARTH’S HEAT BUDGET: BALANCING THE ENERGY BOOKS
Earth’s primary source of energy is the sun. Each day, Earth receives an enormous amount of energy from the sun in the form of solar radiation It is estimated that Earth receives approximately 50 per cent of its total energy from the sun. This incoming solar radiation primarily consists of visible light, but it also includes ultraviolet and infrared radiation.
When solar radiation reaches Earth’s surface, it is either absorbed or reflected Dark surfaces, such as forests and oceans, tend to absorb more energy; while lighter surfaces, such as ice and deserts, reflect more
The absorbed solar energy is converted into heat This heat is then redistributed through various processes, including conduction (the transfer of heat through solids), convection (the transfer of heat through fluids, like air and water), and radiation (the emission of heat in the form of infrared radiation).
As the Earth absorbs heat, it also emits heat in the form of infrared radiation This outgoing radiation is crucial for maintaining a balanced heat budget.
THE NATURAL WORLD – OPTION 9 22
Reflected (30%) 5% 5% 20% By clouds By surface 50% is absorbed at the surface by land and water 20% is absorbed by the atmosphere and clouds Top of atmosphere By atmosphere Incoming solar energy 100% By clouds
is a constant balance between incoming energy from the sun and outgoing energy from Earth.
Figure 2.1
Earth’s heat budget
GEOGRAPHICAL DISTRIBUTION OF TEMPERATURE
Because of varying degrees of solar rays incoming at different times of the year and at different geographical locations, the Earth does not heat evenly. There are five main factures that cause temperature to be distributed unequally across Earth:
1. Tilt, curvature and latitude
2. Land and sea masses
3. Ocean currents
4. Prevailing winds
5. Altitude
TILT, CURVATURE AND LATITUDE
The geographical distribution of temperature across Earth’s surface is greatly influenced by three key factors: Earth’s tilt, its curvature, and latitude. Understanding how these factors interact is essential for comprehending the diverse climates experienced in different regions.
Earth’s tilt: The reason for the seasons
Earth is tilted on its axis by approximately 23.5 degrees. This tilt has a profound impact on temperature distribution. As Earth orbits the Sun, different parts of the planet receive varying amounts of solar radiation throughout the year When a hemisphere is tilted towards the sun, it experiences summer, characterised by warmer temperatures. Conversely, when it is tilted away, it undergoes winter, with cooler temperatures.
Earth’s curvature: Uneven heating
Earth’s surface is curved, which results in uneven heating. Solar radiation is most direct and intense at the equator due to its position at the centre of the Earth’s curvature. Consequently, equatorial regions experience higher temperatures throughout the year. At the poles, the curvature causes solar radiation to be more diffuse, resulting in colder conditions.
23 CHAPTER 2 | SOLAR ENERGY AND GLOBAL TEMPERATURES
day Sun Polar night SUMMER Equator WINTER
Polar
Figure 2.2
A Solar energy Northern hemisphere summer N Equal amounts of energy Equator S More concentrated per unit area at B than it is at A B Solar energy
Earth’s orbit and seasons
Figure 2.3
The curvature of Earth results in the spreading out of solar energy towards the poles and a concentration near the equator.
Latitude: The influence of location
Latitude, the distance north or south of the equator, plays a vital role in temperature variation.
Areas near the equator, between the Tropic of Cancer and the Tropic of Capricorn, are referred to as the tropical zones. They receive the most direct sunlight, leading to consistently warm to hot temperatures.
Located between the tropical and polar zones, the temperate zones experience seasonal variations in temperature due to the changing angle of solar radiation. These regions include Ireland and much of Europe.
Near the poles, such as the Arctic and Antarctic regions, temperatures remain cold all year round because they receive oblique sunlight, resulting in limited heating.
Insolation
At the equator, the sun is directly overhead. Sunlight strikes the Earth directly. Energy from the sun is concentrated on the smallest possible area. Ireland’s position at mid-latitudes.
Insolation
Insolation
Nearer the poles, the sun’s rays strike at a very low angle. The energy is spread over a large area due to the curved surface of the Earth. Thus, each spot gets less heat.
LAND AND SEA MASSES
The geographical distribution of temperature across Earth’s surface is not only influenced by factors such as latitude and Earth’s tilt, but it is also significantly affected by the presence of land and sea masses. These land–sea contrasts play a vital role in shaping local and regional climates.
Landmasses: Rapid temperature changes
Landmasses heat up and cool down more quickly than water. During the day, landmasses absorb and retain heat, resulting in higher daytime temperatures. Conversely, at night, they lose heat rapidly, leading to cooler night-time temperatures.
Regions far from the moderating influence of the ocean, known as continental climates, often experience extreme temperature variations between summer and winter For example, places in the interior of continents, such as parts of Russia, can have scorching summers and bitterly cold winters.
Sea masses: Moderate and stable temperatures
Oceans and seas have a stabilising effect on temperatures. Water has a high heat capacity, meaning it can absorb and release heat slowly. As a result, areas near large water bodies experience milder and more stable temperatures throughout the year
Regions in close proximity to the sea, known as maritime climates, enjoy moderate and comfortable temperatures. For instance, coastal areas of Ireland experience less temperature variation between seasons compared to inland areas.
THE NATURAL WORLD – OPTION 9 24
North Pole Atmosphere
South Pole
Equator
Figure 2.4
The influence of latitude and curvature of Earth on geographical distribution of temperature
Coastal effects: Local variations
Coastal areas can experience sea breezes, where cool air from the sea moves inland during the day, providing relief from extreme heat. At night, land breezes may bring cooler air from the land to the coast.
2.5
Differential
OCEAN CURRENTS
Ocean currents are like rivers within the ocean, flowing continuously and playing a significant role in shaping the geographical distribution of temperature across Earth’s surface. These currents can have both warming and cooling effects on coastal regions, which impacts local climates.
Figure 2.6
25 CHAPTER 2 | SOLAR ENERGY AND GLOBAL TEMPERATURES
Slower heat loss Insolation Insolation Rapid heat loss Land surfaceisheated quickly Heatdoesnot penetrate Water mixing Heat penetrates more deeply
Figure
heating of land and sea masses impacts global temperature distribution.
Alaska North Atlantic Drift Gulf Stream East Australia Agulhas Brazil Kuroshio North Pacific North Pacific North Equatorial North Equatorial Irminger North Atlantic Drift Equatorial Counter Equatorial Counter South Equatorial South Equatorial North Equatorial Equatorial Counter South Equatorial North Equatorial Equatorial Counter South Equatorial South PacificSouth Atlantic South Indian South Pacific Antarctic Circumpolar Antarctic Circumpolar Antarctic Circumpolar Antarctic Subpolar Antarctic Subpolar Antarctic Subpolar Labrador Greenland Oyashio Peru Benguela West Australia California Canary
heating of land and sea masses impacts global temperature distribution.
Differential
Warm ocean currents
Warm ocean currents are currents of warm water that flow from the equator towards the poles. They transfer heat from tropical regions to higher latitudes. For example, the Gulf Stream in the North Atlantic Ocean is a prominent warm ocean current. It originates in the Gulf of Mexico, carrying warm water north-eastward towards western Europe When warm ocean currents flow near coastal areas, they can raise local temperatures For instance, the Gulf Stream helps keep parts of western Europe, including Ireland, milder and less susceptible to extreme cold.
Cold ocean currents
Cold ocean currents are currents of cold water that flow from polar regions towards lower latitudes. They can have a cooling effect on nearby coastal areas. The California Current is a cold ocean current that flows southward along the western coast of North America Cold ocean currents can lower coastal temperatures, making nearby regions cooler than they would be otherwise. They can also affect local weather patterns.
Upwelling and downwelling
Upwelling occurs when cold, nutrient-rich water from deeper ocean layers rises to the surface This process can cool coastal regions but also supports productive fisheries due to the nutrient supply. Downwelling involves the sinking of surface water, often associated with the convergence of ocean currents. Downwelling can result in the warming of coastal waters.
Climate variability
Ocean currents can vary in strength and position due to natural climate variability, such as El Niño and La Niña events. These variations can have profound impacts on regional climates, including temperature patterns. In Chapter 5 we will explore the impact of El Niño events on ocean variability in more detail.
PREVAILING WINDS
Prevailing winds are dominant wind patterns that consistently blow in a particular direction over a specific region. These winds play a crucial role in influencing the geographical distribution of temperature across Earth’s surface.
Westerlies
Westerlies are prevailing winds that blow from the west to the east in the mid-latitudes (between 30° and 60° latitude) in both hemispheres. In Ireland, the south-westerly winds are particularly important. They bring moist and relatively mild maritime air from the Atlantic Ocean. Ireland’s western location on the edge of the Atlantic Ocean exposes it to these south-westerly winds, resulting in a maritime climate with mild temperatures all year round The westerlies help moderate temperature extremes.
Trade winds
2.7
Atmospheric circulation and prevailing winds
Trade winds are consistent easterly winds that blow from east to west near the equator, roughly between 0° and 30° latitude in both hemispheres. The northeast trade winds in the northern hemisphere blow from the northeast toward the southwest, affecting regions like the Caribbean. These winds can bring warm, tropical air towards equatorial regions, leading to higher temperatures In contrast, descending air in the subtropical high-pressure zones associated with trade winds can result in arid or desert conditions.
THE NATURAL WORLD – OPTION 9 26
North Pole 60° 30° 0° Equator Westerlies Intertropical Convergence Zone Westerlies South Pole NE trade winds SE trade winds
Figure
impact on climatic
directly
conditions.
Polar easterlies
Polar easterlies are cold prevailing winds that blow from the polar high-pressure zones (around the poles) towards the mid-latitudes, generally between 60° and 90° latitude. These winds impact regions such as Siberia in the northern hemisphere and Antarctica in the southern hemisphere. The polar easterlies can transport cold air masses from polar regions to mid-latitudes, contributing to lower temperatures in these areas during certain seasons.
Seasonal variability
Prevailing winds can exhibit seasonal variations due to Earth’s axial tilt. For example, during summer in the northern hemisphere, the westerlies can shift poleward, affecting temperature distribution.
ALTITUDE
Altitude, or elevation above sea level, is a crucial factor that significantly influences the geographical distribution of temperature. As one ascends in altitude, several key temperaturerelated changes occur
3,000 metres
2,000 metres
1,000 metres
2.8
The impact of altitude on climate
Temperature decreases with altitude
The most noticeable impact of increasing altitude is the drop in temperature. For every 100 metres gained in altitude, the average temperature tends to decrease by about 0.6°C. In Ireland, this principle is evident when comparing the warmer temperatures at sea level along the coast to the cooler temperatures experienced in upland areas such as the Wicklow Mountains. As altitude increases, the air becomes less dense, and it can hold less heat. This leads to a decrease in temperature, often resulting in cooler and sometimes even alpine or polar climates at high elevations
Temperature inversion
Occasionally, temperature inversion occurs when a layer of warm air traps cooler air near Earth’s surface. This phenomenon is more common in valleys and basins, where cold air becomes trapped beneath a layer of warm, stable air Glendalough in Co. Wicklow is known for its temperature inversion events Cold air settles in the valley during the night, resulting in cooler temperatures compared to the surrounding areas. Temperature inversions can lead to local variations in temperature distribution, often causing cooler conditions in valleys and basins.
27
| SOLAR ENERGY AND GLOBAL TEMPERATURES
CHAPTER 2
0 metres (sea level) 17°C –4°C 3°C6°C 10°C16°C
Figure
Microclimates
Altitude can give rise to microclimates – small, localised climate variations within a larger region. These microclimates can exhibit unique temperature patterns influenced by local topography and altitude. The Burren in Co. Clare contains microclimates where sheltered limestone pavements can create warmer pockets within the surrounding cooler landscape.
CHECK YOUR UNDERSTANDING
Basic Knowledge
1. What is Earth’s primary source of energy for its heat budget?
2. Explain the process of how solar radiation is absorbed and reflected by Earth’s surface.
3. What are the three main processes by which heat is redistributed on Earth, and how do they work?
Developed Knowledge
1. Describe the significance of Earth’s heat budget in understanding global climate patterns.
2. Discuss the impact of Earth’s tilt on temperature distribution and the changing seasons.
3. Explain how the curvature of Earth’s surface affects the intensity of solar radiation and temperature variations.
Advanced Knowledge
1. Analyse the role of latitude in influencing temperature variations across Earth.
2. Differentiate between the temperature characteristics of landmasses and sea masses.
3. Examine the effects of coastal areas on temperature variations, including the phenomena of sea breezes and land breezes.
WRITE LIKE A GEOGRAPHER
1. Examine the unequal distribution of heat across the Earth’s surface.
Success criteria:
Your answer must:
• Clearly explain the concept of Earth’s heat budget.
• Describe the geographical distribution of temperature, outlining the five main factors.
• Provide specific examples to illustrate how these factors affect temperature distribution, such as the effect of Earth’s tilt on seasons.
Your answer should:
• Elaborate on how different types of surfaces (forests, oceans, ice and deserts) absorb or reflect solar radiation, and how this contributes to Earth’s heat budget.
• Discuss the role of ocean currents in temperature distribution, differentiating between warm and cold currents and their effects on coastal temperatures
• Explain the influence of prevailing winds, such as the westerlies, trade winds, and polar easterlies, on temperature patterns in various regions, including Ireland.
Your answer could:
• Explore the complexities of Earth’s heat budget, such as the redistribution of heat through conduction, convection and radiation.
• Analyse the nuanced interactions between the factors influencing temperature distribution.
THE NATURAL WORLD – OPTION 9 28
3
TOPIC 2.2: Global Temperature Patterns
TEMPERATURE PATTERNS IN THE NORTHERN AND SOUTHERN HEMISPHERES
Global temperature patterns vary significantly between the northern hemisphere and the southern hemisphere due to differences in landmass distribution, ocean currents, and seasonal dynamics. To comprehend these variations, it is crucial to explore the unique factors that influence temperature patterns in each hemisphere.
NORTHERN HEMISPHERE
The northern hemisphere contains a more extensive landmass compared to the southern hemisphere, leading to more significant temperature variations. Land heats up and cools down faster than water, resulting in pronounced seasonal changes.
For example, Moscow in Russia experiences frigid winters with temperatures well below freezing. and warm summers with temperatures above 20°C. This extreme seasonal contrast is due to its inland location.
Ocean currents play a crucial role in moderating temperature extremes in the northern hemisphere. Warm ocean currents, such as the North Atlantic Drift, raise temperatures in coastal areas, while cold currents, such as the California Current, have a cooling effect. For example, Ireland experiences milder winters than locations at similar latitudes due to the warming influence of the North Atlantic Drift.
SOUTHERN HEMISPHERE
The southern hemisphere is primarily oceanic, with a higher proportion of water compared to land. Oceans have a stabilising effect on temperatures, resulting in milder and less variable climate patterns. This is evident in Sydney, Australia, which enjoys a temperate climate with relatively mild winters and warm summers due to its coastal position.
Seasonal changes in the southern hemisphere occur at different times than in the Northern Hemisphere due to Earth’s axial tilt. When it is summer in the northern hemisphere, it is winter in the southern hemisphere (and vice versa). December in the southern hemisphere marks the beginning of summer, and means that many Christmas and New Year celebrations take place on beaches and include outdoor activities.
29 CHAPTER 2 | SOLAR ENERGY AND GLOBAL TEMPERATURES
Figure 2.9
Mean January and July temperatures show the differing temperature patterns between the northern and southern hemispheres. Also notice the differing temperature patterns between coastal regions and land masses.
CHECK YOUR UNDERSTANDING
Basic Knowledge
1. What causes more significant temperature variations in the northern hemisphere compared to the southern hemisphere?
2. Explain how landmass distribution influences temperature patterns in the northern hemisphere.
3. How do ocean currents affect temperature in coastal areas of the northern hemisphere?
Developed Knowledge
1. Describe the seasonal temperature contrast experienced in Moscow, Russia, and explain why it occurs.
2. Discuss the role of ocean currents in moderating temperatures in the northern hemisphere and provide an example of their impact.
3. Explain why the southern hemisphere experiences milder and less variable climate patterns compared to the northern hemisphere.
THE NATURAL WORLD – OPTION 9 30 July 10°C 0°C0°C 20°C 20°C 10°C 10°C 10°C 30°C 20°C 20°C 60°S 30°S 0° 30°N 60°N 0°C 30°C 40°C 40°C 40°C 40°C
10°C 10°C 0°C –10°C 20°C 20°C –20°C –30°C –40°C 10°C 10°C 0°C –10°C 20°C 20°C 30°C –20°C –30°C 60°S 30°S 0° 30°N 60°N 30°C 30°C 30°C
3 January
Advanced Knowledge
1. Analyse the relationship between landmass distribution and temperature variations, considering the specific regions mentioned in the text.
2. Differentiate between the temperature influences of warm and cold ocean currents in the northern hemisphere and discuss their implications for regional climates.
3. Consider the implications of Earth’s axial tilt on seasonal changes in the southern hemisphere and how this affects cultural and recreational activities.
PAST EXAM PAPER QUESTIONS
HIGHER LEVEL
2023
Examine how solar energy is transformed and redistributed through circulation patterns in the atmosphere and oceans.
(80 marks)
2021
Examine the uneven distribution of temperature over Earth’s surface.
(80 marks)
31 CHAPTER 2 | SOLAR ENERGY AND GLOBAL TEMPERATURES
MOISTURE IN THE ATMOSPHERE
SYLLABUS LINK

CHAPTER 03
9.3 EXCHANGES OF WATER BETWEEN OCEANS AND ATMOSPHERE VARY GREATLY OVER THE SURFACE OF THE EARTH AND GIVE RISE TO DISTINCTIVE WEATHER AND CLIMATE REGIMES
KNOWLEDGE RETRIEVAL
Retrieval Quiz
1. What is the Earth’s primary source of energy for its heat budget?
2. Explain the process of how solar radiation is absorbed and reflected by the Earth’s surface.
3. What are the three main processes by which heat is redistributed on Earth, and how do they work?
4. What is the cause of the more significant temperature variations in the northern hemisphere compared to the southern hemisphere?
5. Explain how landmass distribution influences temperature patterns in the northern hemisphere.
32
LEARNING INTENTIONS
1. Explain the hydrological cycle as a concept in the atmosphere and oceans.
2. Outline the formation of different cloud types.
3. Describe the three different types of rainfall.
4. Discuss the global distribution of rainfall across different climatic regions.
5. Analyse the distribution of rainfall in Ireland.
KEYWORDS
Evaporation Condensation
Precipitation Runoff
Infiltration Groundwater recharge Water resource management Ecosystem health
Climate regulation Weather patterns
Cirrus clouds Nimbostratus clouds
Condensation nuclei Dew point
Cumulonimbus clouds Relief rainfall
Frontal rainfallConvectional rainfallRain-shadow effect Polar regions
Temperate regions
TOPIC 3.1: The Hydrological Cycle
THE HYDROLOGICAL CYCLE
The hydrological cycle, often referred to as the water cycle, is a fundamental concept in geography that explains how water moves and changes forms within our environment. This natural process is crucial for sustaining life on Earth and it plays a pivotal role in shaping our planet’s landscapes.
The hydrological cycle is essential for maintaining Earth’s climate, regulating temperatures, and ensuring a continuous supply of freshwater for drinking, agriculture and industry. It is a perfect example of nature’s sustainable water recycling system, demonstrating just how interconnected our planet’s systems are. There are four main stages to the hydrological cycle:
• Evaporation
• Condensation
• Precipitation
• Runoff
• Infiltration.
33 CHAPTER 3 | MOISTURE IN THE ATMOSPHERE
GROUNDWATER Percolation Surface flow Transpiration Snow melt Runoff Evaporation Deposition Sublimation Condensation Precipitation Transportation Precipitation Transportation Condensation Evaporation Plant uptake Infiltration Figure 3.1 The hydrological cycle
EVAPORATION
In the hydrological cycle, evaporation is the initial and vital step where water undergoes a transformation from liquid to vapour This process is integral to the movement of water and the replenishment of our planet’s freshwater resources.
It all begins with the warmth of the sun When sunlight reaches the Earth’s surface, it is converted to energy in water bodies such as oceans, seas, lakes and rivers. This energy causes water molecules to become more energetic and break free from the liquid’s surface, turning into water vapour.
The sun’s energy is vital for evaporation, providing the necessary heat to drive this process. Water absorbs this energy, causing its molecules to move faster and rise into the atmosphere. It is similar to how warmth from the sun makes a wet pavement dry quickly.
Several factors can affect the rate of evaporation:
1. Temperature: Higher temperatures lead to increased evaporation rates. Warmer water molecules possess more energy and are more likely to escape into the air.
2. Surface area: Larger water bodies provide more surface area for evaporation to occur. This is why oceans contribute significantly to the Earth’s water vapour content.
3. Humidity: The amount of water vapour already present in the air can either promote or inhibit evaporation. Dry air can absorb more moisture, which encourages faster evaporation.
4. Wind: Wind helps carry away the water vapour rising from the surface, creating a continuous supply of drier air that encourages more evaporation.
Evaporation plays a crucial role in the hydrological cycle and has far-reaching implications:
1. Weather patterns: The water vapour released during evaporation forms clouds, which eventually lead to precipitation. This, in turn, affects weather patterns, influencing rainfall, snowfall and other forms of precipitation.
2. Freshwater supply: Evaporation is vital for the replenishment of our freshwater resources. As water vapour rises, it can travel long distances before condensing and falling back to the Earth’s surface as precipitation, providing us with the water we need for drinking, agriculture and industry
3. Climate regulation: The movement of water vapour through evaporation helps regulate the Earth’s climate. It can transport heat from warm regions to cooler areas, contributing to temperature balance across the planet.
CONDENSATION
In the hydrological cycle, condensation is the crucial second step following evaporation. It is a fundamental process where water vapour in the atmosphere transforms back into liquid form, leading to the formation of clouds and, eventually, precipitation
Condensation is initiated when warm, moisture-laden air rises and encounters cooler temperatures at higher altitudes. As air cools, it loses its capacity to hold as much moisture.
The point at which the air becomes saturated with moisture is known as the dew point When this occurs, the air cannot hold any more water vapour This causes excess water vapour to condense into tiny water droplets or ice crystals, depending on the temperature.
Condensation creates clouds We can think of clouds as visible collections of water droplets or ice crystals suspended in the atmosphere. Clouds can take various forms, from fluffy white cumulus clouds to thin, wispy cirrus clouds.
Several factors affect the rate and intensity of condensation:
1. Temperature: As mentioned earlier, the cooling of air is a primary driver of condensation. Colder air is more efficient at causing water vapour to revert to its liquid form.
THE NATURAL WORLD – OPTION 9 34
2. Humidity: Higher humidity levels mean there is more water vapour in the air. When the air is close to its saturation point, even slight cooling can trigger condensation and cloud formation.
3. Nucleation: In some cases, water droplets need tiny particles, known as condensation nuclei, to attach to before they can form clouds. These particles can be dust, salt or other airborne particles. Condensation is a critical process in the hydrological cycle and it has several important implications:
1. Cloud formation: The formation of clouds through condensation influences weather patterns and plays a key role in the distribution of precipitation, which, in turn, affects ecosystems, agriculture and water resources.
2. Climate and climate change: The presence of clouds in the atmosphere has a cooling effect on the Earth’s surface, reflecting sunlight back into space. Understanding the processes of condensation and cloud formation is crucial for studying and predicting climate changes.
3. Freshwater supply: Condensation is an essential part of freshwater production. It contributes to the formation of precipitation, which recharges groundwater, fills lakes and rivers, and sustains life on Earth.
PRECIPITATION
Particulate matter in air
Small particles such as dust, pollen or bacteria provide surface for condensation
Saturation to form clouds
Precipitation
Water vapour
Water body
Small particles, such as dust, pollen or bacteria, are vital in the process of condensation.
In the hydrological cycle, precipitation is the culmination of several preceding processes, including evaporation, condensation and cloud formation. It is a critical step that brings water back to the Earth’s surface, ensuring the continuous movement of water through our environment.
As mentioned previously, condensation in the atmosphere forms clouds. Within these clouds, tiny water droplets or ice crystals continue to grow as they collide and merge.
As these water droplets or ice crystals become larger and heavier, they eventually overcome the force of air resistance and begin to fall towards the Earth’s surface due to gravity.
Depending on the temperature at different altitudes and the size of the water droplets or ice crystals, precipitation can take various forms, including rain (liquid water), snow (ice crystals), sleet (frozen raindrops), and hail (large, layered ice balls).
Several factors impact the type, amount and distribution of precipitation:
1. Temperature: Temperature determines whether precipitation falls as rain, snow or other forms. Colder temperatures favour the freezing of water droplets, resulting in snow or other frozen precipitation.
2. Air masses: The characteristics of air masses, including their moisture content and temperature, influence the amount of moisture available for precipitation.
3. Topography: Mountainous areas can force moist air to rise, cool, and release moisture, leading to increased precipitation on windward sides (windward precipitation) and a rain-shadow effect on the leeward sides (leeward deserts).
Precipitation is of vital importance for several reasons:
1. Water supply: Precipitation provides the primary source of freshwater for various human activities, including drinking, agriculture and industrial processes.
2. Ecosystems: Precipitation sustains natural ecosystems by nourishing plants and maintaining habitats for various species. Adequate precipitation levels are essential for biodiversity and ecological balance.
35 CHAPTER 3 | MOISTURE IN THE ATMOSPHERE
Figure 3.2
3. Climate regulation: Precipitation patterns influence climate and weather conditions, impacting regional climates, temperature patterns, and seasonal variations.
4. Natural hazards: Excessive or insufficient precipitation can lead to natural hazards such as floods and droughts, which can have severe economic and societal consequences.
Precipitation patterns can show significant variability and trends over time, and are often influenced by factors such as climate change. Monitoring and analysing precipitation data is critical for understanding long-term trends and adapting to potential changes in water availability.
RUNOFF

Runoff, also known as surface runoff, is a critical component of the hydrological cycle that occurs when excess water, primarily from precipitation, flows over the Earth’s surface. This process plays a pivotal role in shaping landscapes, replenishing water bodies, and influencing weather patterns. It all begins with precipitation, which includes rain, snow, sleet and hail. When the intensity of precipitation exceeds the rate at which the ground can absorb it (infiltration), runoff is initiated.
Excess water starts to flow downhill due to gravity It may follow various pathways, including roads, streets, rivers and streams. This flow is essential for gathering water and transporting it to larger water bodies.
As runoff progresses, it collects in natural or human-made channels, such as creeks or stormwater drains. Multiple smaller flows often converge into larger watercourses.
Eventually, runoff reaches rivers, lakes, reservoirs or the ocean
In some cases, it may infiltrate into the ground and contribute to groundwater recharge.
Several factors affect the amount and speed of runoff:
1. Topography: The slope and shape of the land determine how quickly runoff moves. Steep slopes typically lead to faster runoff, while flat areas may result in slower movement.
2. Soil type: Soil characteristics, such as permeability and porosity, influence the rate of infiltration. Sandy soils generally allow for more infiltration compared to clayey soils.
3. Land use: Urban areas with impermeable surfaces such as concrete and asphalt can increase runoff due to reduced infiltration. Conversely, natural landscapes with vegetation promote slower runoff
THE NATURAL WORLD – OPTION 9 36
Figure 3.3
Snow Surface runoff Surface runoff Interflow Interflow
Water from precipitation is gathered in reservoirs or water bodies on the surface of the Earth.
Figure 3.4
Basic processes of surface runoff
4. Precipitation intensity: The intensity of rainfall or snowmelt events can greatly impact runoff. Heavy downpours are more likely to generate rapid runoff compared to lighter, sustained rain. Understanding runoff is crucial for various reasons:
1. Water resource management: Runoff contributes to the filling of rivers, lakes, and reservoirs, ensuring a constant supply of freshwater for various purposes, including drinking, agriculture and industry
2. Erosion and sediment transport: Runoff can erode soil and transport sediments downstream, shaping landscapes and influencing the formation of landforms.
3. Flood management: Effective management of runoff is essential to mitigate flood risks in areas prone to heavy rainfall or snowmelt events.
4. Ecosystem health: Proper runoff patterns sustain aquatic ecosystems by maintaining water levels and providing habitats for various species.
INFILTRATION
Infiltration is a crucial process within the hydrological cycle, where water from precipitation or other sources soaks into the ground and moves through the soil and rock layers. Infiltration plays a vital role in replenishing groundwater and maintaining the balance of water in the environment.
37
| MOISTURE IN THE ATMOSPHERE
CHAPTER 3
LESS infiltration in non-porous soils and rock Lake Throughflow Water table Surface runoff MORE infiltration in porous soils and rock Precipitation
The
Figure 3.5
process of infiltration
When precipitation, such as rain or snow, reaches the Earth’s surface, it interacts with the top layer of soil, which is known as the zone of aeration. This zone contains both air and water-filled spaces. Water moves downward through the soil and rock layers under the influence of gravity This process is called percolation, and it continues until water reaches the zone of saturation, where all available spaces are filled with water.
Infiltrated water eventually contributes to groundwater, which is the water stored beneath the Earth’s surface. Groundwater serves as a vital source of freshwater for wells, springs and rivers.
Several factors affect the rate and extent of infiltration:
1. Soil type: Different soil types have varying levels of porosity and permeability Sandy soils generally allow water to infiltrate quickly, while clay soils may slow down the process because they are more compact.
2. Vegetation: Vegetation can enhance infiltration by reducing surface runoff and encouraging water to seep into the ground. Plants also help maintain soil structure, which benefits infiltration.
3. Precipitation intensity: The intensity and duration of precipitation events can impact infiltration. Light, steady rain may infiltrate more effectively than heavy, intense rainfall that can lead to surface runoff.
Infiltration plays a crucial role in maintaining the health of ecosystems and supporting human activities:
1. Groundwater recharge: Infiltrated water replenishes underground aquifers, which are essential sources of freshwater for drinking, agriculture and industry.
2. Surface-water quality: By filtering water as it percolates through the soil, infiltration helps improve the quality of surface waters in rivers, lakes and streams.
3. Flood mitigation: Adequate infiltration can reduce surface runoff, lowering the risk of floods during heavy rainfall events.
4. Ecosystem health: Infiltration supports the growth of vegetation and sustains natural habitats by providing water to plants and aquatic ecosystems.
In some regions, human activities such as urbanisation and deforestation can reduce infiltration rates by altering soil structures and increasing surface runoff. Sustainable land use practices, such as preserving green spaces, promoting afforestation, and minimising soil disturbance, can help maintain healthy infiltration rates and protect groundwater resources.
CHECK YOUR UNDERSTANDING
Basic Knowledge
1. List the four main stages of the hydrological cycle.
2. What is the initial process in the hydrological cycle where water changes from liquid to vapour?
3. Name the process where water vapour in the atmosphere transforms back into liquid form, leading to cloud formation.
Developed Knowledge
1. Describe how the process of evaporation contributes to the replenishment of the Earth’s freshwater resources.
2. Explain the significance of condensation in the hydrological cycle.
3. Discuss the role of infiltration in replenishing groundwater.
Advanced Knowledge
1. Analyse the factors that affect the rate of evaporation and how they influence weather patterns and climate regulation.
2. Differentiate between the impacts of precipitation in various forms (e.g. rain, snow, sleet and hail) on different ecosystems and human activities.
3. Investigate the implications of reduced infiltration rates in urbanised and deforested areas.
THE NATURAL WORLD – OPTION 9 38
3
WRITE LIKE A GEOGRAPHER
1. Analyse the processes of the hydrological cycle and its impact on precipitation and climate.
Success criteria:
Your answer must:
• Outline the four main stages of the hydrological cycle.
• Describe the process of infiltration and its role in the hydrological cycle.
• Explain the factors that affect each stage of the hydrological cycle.
Your answer should:
• Elaborate on how evaporation is influenced by various environmental factors and its significance in replenishing the Earth’s freshwater resources.
• Discuss the importance of condensation in cloud formation and its role in climate regulation and the production of freshwater.
• Describe how different types of precipitation (rain, snow, sleet, hail) occur and their impact on ecosystems, water supply, and climate regulation.
Your answer could:
• Explore the implications of the hydrological cycle on weather patterns, such as the formation of clouds and precipitation influencing rainfall and snowfall.
• Analyse the broader impact of the hydrological cycle on climate regulation, including the transport of heat from warm regions to cooler areas.
TOPIC 3.2: Formation and Types of Clouds FORMATION OF CLOUDS
Clouds are remarkable products of nature’s processes. To understand how clouds form, we must consider the concept of condensation, a fundamental step in the hydrological cycle.
It all begins when warm, moist air rises into the atmosphere due to various factors such as sunlight heating the Earth’s surface or air being forced upwards by topography
As the warm air ascends to higher altitudes, it encounters cooler temperatures. The temperature drop causes the air to cool down, and cooler air can hold less moisture.
When the rising air cools to a certain point, known as the dew point, it becomes saturated with moisture. At this stage, the air can no longer hold all its water vapour.
To form visible clouds, water vapour needs tiny particles called condensation nuclei. These particles can be dust, salt, or even pollution. Water vapour begins to condense onto these nuclei.
Once condensation begins, countless water droplets or ice crystals form around the nuclei, creating a cloud. These tiny water droplets or ice crystals cluster together, making the cloud visible.
39 CHAPTER 3 | MOISTURE IN THE ATMOSPHERE
Cool air descends Hot air ascends Water vapours start rising up Water vapour Convection Solar energy heats up the Earth’s surface Evaporation 1 2
Figure 3.6
Simplified diagram of the formation of clouds
TYPES OF CLOUDS
Clouds come in various shapes and sizes, and each type of cloud has its own characteristics. There are four main cloud types:
• Cirrus
• Altocumulus
• Nimbostratus
• Cumulonimbus.

CIRRUS
Cirrus clouds reside in the uppermost reaches of the Earth’s atmosphere, typically at altitudes of 6,000 to 12,000 metres. This high location is why they are often called ‘high-level clouds.’
Cirrus clouds have a wispy, feathery appearance. They appear as thin, white streaks or tufts, sometimes resembling strands of hair or horse’s tails.
Cirrus clouds are primarily composed of ice crystals. They form through the following process:
1. At their high altitudes, the air is extremely cold, well below freezing. However, cirrus clouds can exist because the water droplets or ice crystals within them are in a supercooled state, meaning they remain liquid even at temperatures below freezing.
2. These clouds form around condensation nuclei, such as tiny ice crystals or dust particles, where water droplets freeze onto these nuclei.
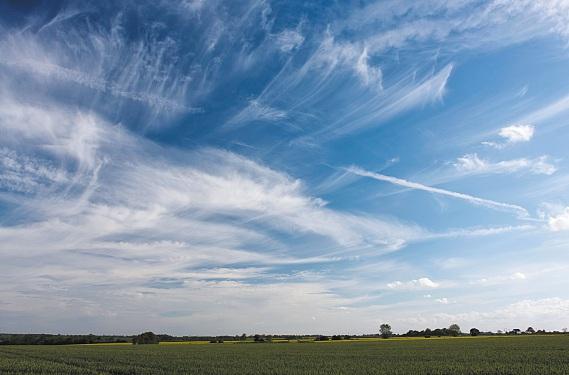
THE NATURAL WORLD – OPTION 9 40
CirrusCirrocumulus
Middle High Low
Altocumulus Stratus
Nimbostratus
Altostratus
Cirrostratus
Cumulus
Stratocumulus
Cumulonimbus
Figure 3.7
Clouds are classified by their height and appearance
Figure 3.8
Cirrus clouds
ALTOCUMULUS
Altocumulus clouds are mid-level clouds, found at altitudes ranging from 2,000 to 6,000 metres above sea level. Their location between low-level and high-level clouds earned them the name ‘alto’, which means middle in Latin.
Altocumulus clouds appear as puffy, rounded masses or layers in the sky They often resemble small cotton balls or flakes arranged in a patchwork pattern.
Altocumulus clouds are primarily composed of water droplets, although they can also contain ice crystals. They form through the following process:
1. Altocumulus clouds often form when moist, warm air rises and cools as it ascends to the middle levels of the atmosphere. The cooling causes water vapour to condense into visible cloud droplets.
2. These clouds can appear in various patterns, from scattered individual clouds to continuous layers The specific appearance of altocumulus clouds can give clues about atmospheric instability or stability.
NIMBOSTRATUS
Nimbostratus clouds reside in the lower atmosphere, typically at altitudes below 2,000 metres. They hang low in the sky, often covering it entirely
Nimbostratus clouds are known for their dull, grey, featureless appearance They create a thick, overcast sky that blocks out the sun and casts a gloomy atmosphere

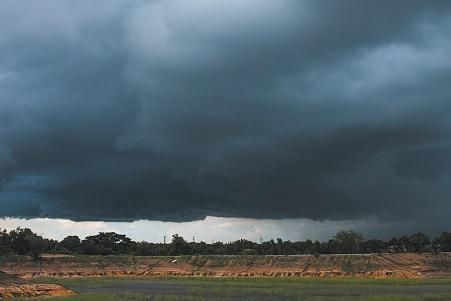
Nimbostratus clouds form due to the ascent of moist, warm air over a large area, typically along warm and cold fronts. As the warm, moist air rises, it cools and condenses into a continuous layer of cloud. The Latin term ‘nimbo’ signifies the potential to bring precipitation.
CUMULONIMBUS
Cumulonimbus clouds reach impressive heights, extending from low altitudes to towering up to 15,000 metres or more into the sky.
They have a distinctive anvil or mushroom shape with a dark, dense base and a spreading, icy top. This unique structure sets them apart from other cloud types.
Cumulonimbus clouds typically form due to intense vertical air currents, often associated with thunderstorms. As warm, moist air rises and cools, it condenses into a towering column of cloud. The vigorous updrafts can carry water droplets to great heights, where they freeze, creating an anvil-shaped top.
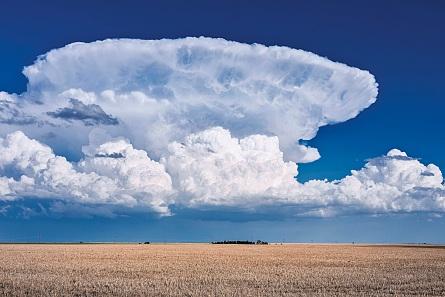
41
3 | MOISTURE IN THE ATMOSPHERE
CHAPTER
Figure 3.9
Altocumulus clouds
Figure 3.10
Nimbostratus clouds
Figure 3.11
Cumulonimbus clouds
CHECK YOUR UNDERSTANDING
Basic Knowledge
1. What is the name of the process that leads to the formation of clouds?
2. List the four main types of clouds mentioned in the text.
3. At what point does the rising air become saturated with moisture, leading to cloud formation?
Developed Knowledge
1. Describe the appearance and composition of cirrus clouds and their location in the atmosphere.
2. Explain how altocumulus clouds form and the atmospheric conditions that give rise to their distinctive appearance.
3. Discuss the characteristics of nimbostratus clouds and their association with certain weather conditions.
Advanced Knowledge
1. Analyse the conditions that lead to the formation of cumulonimbus clouds and their role in weather phenomena such as thunderstorms.
TOPIC 3.3: Precipitation
PRECIPITATION
Precipitation refers to any form of water – liquid or solid – that falls from the atmosphere to the Earth’s surface. It includes rain, snow, sleet and hail.
Precipitation occurs when moist air cools and condenses, forming clouds. When these tiny water droplets or ice crystals combine and become heavy enough, they fall to the ground.
The four forms of precipitation are:
1. Rainfall: Raindrops are liquid water droplets that fall when the air temperature is above freezing. It is the most common form of precipitation.
2. Snow: Snowflakes are ice crystals that fall when the air temperature is below freezing. Snowfall can accumulate and create stunning winter landscapes.
3. Sleet: Sleet consists of tiny ice pellets. It forms when raindrops freeze before reaching the ground, often causing hazardous conditions.
4. Hail: Hail is composed of larger, frozen pellets of ice. It forms within intense thunderstorms and can be destructive.
RAINFALL
Rainfall is the most common form of precipitation. It occurs as a result of warm, moist air rising into the atmosphere, condensing and turning to rainfall. There are three main types of rainfall:
• Relief rainfall
• Frontal rainfall
• Convectional rainfall
RELIEF RAINFALL
Relief rainfall, also known as orographic rainfall, is a phenomenon that occurs in mountainous regions. It plays a crucial role in shaping local climates and influencing precipitation patterns. It occurs through the following process.
THE NATURAL WORLD – OPTION 9 42
3
1. When moist air meets mountains
Relief rainfall occurs when moist air from the sea or ocean is forced to ascend over a mountain range. As this moist air rises, it cools due to the decrease in atmospheric pressure with altitude.
2. Condensation and cloud formation
As the air cools, it reaches its dew point, the temperature at which it can no longer hold all the moisture it contains. At this point, water vapour in the air condenses into tiny water droplets, forming clouds.
3. Rainfall on the windward side
The moisture-laden air continues to rise over the mountain, and the clouds grow thicker. Eventually, the condensed water droplets combine and become heavy enough to fall as rainfall on the windward side of the mountain.
4. Rain-shadow effect
After crossing the mountain range, the now dry air descends on the leeward side, creating an area known as the rain shadow. Here, the air warms and dries, inhibiting rainfall. As a result, the leeward side often experiences arid or semi-arid conditions.
Examples of relief rainfall
The Western Ghats, a mountain range along the western coast of India, receives heavy relief rainfall during the monsoon season. The windward side, facing the Arabian Sea, has lush forests and experiences high precipitation, while the leeward side, the Deccan Plateau, is much drier.
The Andes Mountains influence the climate of South America significantly. The Amazon Rainforest, on the eastern windward side, benefits from relief rainfall, while the western leeward side, including parts of Chile, is arid.
FRONTAL RAINFALL
Frontal rainfall, also known as cyclonic rainfall, is a significant weather phenomenon that occurs when two air masses with different characteristics meet. This type of rainfall is responsible for a substantial portion of Ireland’s precipitation. It occurs through the following process.
1. Collision of air masses
Frontal rainfall happens when a warm air mass and a cold air mass meet. The warm air is lighter and rises above the denser, cold air. This collision of air masses typically occurs in regions with varying atmospheric pressures.
2. Formation of a front
As the warm air rises, it cools, and its moisture condenses, forming clouds. This process creates a weather front, which is the boundary between the warm and cold air masses.
3. Rainfall along the front
Along this front, the rising warm air cools further, leading to the formation of raindrops These raindrops fall as rainfall, often over an extended area, depending on the size and movement of the front.
43
| MOISTURE IN THE ATMOSPHERE
CHAPTER 3
Warm, moist air rises over high ground
Prevailing wind
Evaporation
Air cools and condenses, forming clouds
Rain shadow
Dry air descends and warms
Precipitation
Warm ocean
Figure 3.12
Relief rainfall
TYPES OF FRONTS
1. Warm front
When a warm air mass advances and rises over a retreating cold air mass, a warm front is formed. Warm fronts usually bring steady, light to moderate rainfall. They have a gentle slope and can lead to cloudy, overcast conditions.
2. Cold front
A cold front occurs when a cold air mass advances and pushes under a warm air mass, forcing the warm air to rise rapidly Cold fronts are associated with more intense, but shorter-lived rainfall. They often bring thunderstorms and heavy downpours.
3. Occluded front
An occluded front forms when a cold front catches up with a warm front, lifting the warm air mass off the ground. This complex interaction results in a mix of precipitation types, including rain, sleet, or snow, depending on the temperature.
Ireland frequently experiences frontal rainfall due to its location in the path of weather systems from the Atlantic Ocean. When warm, moist air masses collide with cold air masses, it leads to the rainfall that is a common feature of the Irish climate.
CONVECTIONAL RAINFALL
Convectional rainfall is a vital component of Ireland’s weather system, often contributing to short but intense bursts of rainfall, especially during the summer months. Understanding how it occurs is crucial to comprehending our climate.
The process occurs through the following process.
1. Heating of the Earth’s surface
Convectional rainfall begins with the heating of the Earth’s surface by the sun, primarily during daylight hours. This process is most pronounced in the summer when the sun’s rays are more direct
THE NATURAL WORLD – OPTION 9 44
Condensation forms clouds Front
Warm air forced to rise over cold air
It rains heavily along the front
Figure 3.13
Frontal rainfall
Energy from the sun heats the ground
Rising air cools, condenses and forms clouds
The warm ground heats the a shallow layer of the air above. Moisture on the ground evaporates
Precipitation occurs
Warm, moist pockets of air (convection currents) rise rapidly
Figure 3.14
Convectional rainfall
2. Warming of the air
As the ground heats up, it warms the air directly above it Warm air is lighter and less dense than cold air, causing it to rise. This rising warm air is called an updraught
3. Cooling and condensation
As the warm air rises, it encounters cooler temperatures at higher altitudes. As the air ascends, it cools, and when it reaches a certain point, it cools enough for its moisture to condense and form cumulonimbus clouds.
4. Rainfall
These towering cumulonimbus clouds are associated with heavy rainfall, often in the form of thunderstorms. The condensed moisture within the clouds combines to form raindrops, which fall to the ground as precipitation.
Convectional rainfall is common in the east and midlands of Ireland, especially during the summer when the sun’s heating effect is at its peak. After a hot, sunny day, the rising warm air can lead to the development of cumulonimbus clouds, resulting in heavy and sometimes thundery rainfall.
3
CHECK YOUR UNDERSTANDING
Basic Knowledge
1. What are the four forms of precipitation?
2. Name the three main types of rainfall.
3. Define relief rainfall and explain where it commonly occurs.
Developed Knowledge
1. Describe the process of frontal rainfall and the different types of weather fronts involved.
2. Explain how convectional rainfall occurs, particularly its relationship with the heating of the Earth’s surface.
3. Discuss the formation of cumulonimbus clouds during convectional rainfall and their association with certain weather conditions.
Advanced Knowledge
1. Analyse the impact of mountain ranges on local climates and precipitation patterns, using the example of relief rainfall in the Western Ghats or the Andes Mountains.
TOPIC 3.4: Global Distribution of Rainfall
Figure 3.15
Global distribution of
45 CHAPTER 3 | MOISTURE IN THE ATMOSPHERE
Arctic Ocean Atlantic Ocean Pacific Ocean Pacific Ocean Indian Ocean Precipitation (mm) 2,000 + 1,000–2,000 500–1,000 250–500 0–250
precipitation
EQUATORIAL REGIONS
In equatorial regions, which lie near the Earth’s equator, the distribution of rainfall exhibits unique patterns, resulting in some of the highest annual averages in the world. These regions experiences approximately 2,000 to 3,600 mm per year. This high precipitation is primarily due to the region’s position relative to the sun as well as specific atmospheric conditions.
Equatorial regions receive intense solar heating throughout the year because they are positioned near the equator, where the sun’s rays strike directly. This constant energy input causes the warm, moist air at the surface to rise rapidly, creating a low-pressure area.
As the warm, moist air ascends, it cools and condenses at higher altitudes, forming dense clouds. These clouds release heavy rainfall in the form of convectional rainfall. Convectional rainfall is characterised by short, intense bursts of rain, often occurring in the late afternoon or early evening.
Equatorial regions typically experience year-round rainfall due to the consistent solar heating and convectional processes. This leads to lush rainforests and high levels of biodiversity. For example, the Congo Basin in Africa and the Amazon Rainforest in South America receive abundant rainfall throughout the year
TROPICAL REGIONS
Tropical regions, located between the Tropics of Cancer and Capricorn, experience distinct patterns of rainfall with reference to annual averages. These areas are characterised by high temperatures and unique climatic features
In many tropical regions, rainfall exhibits a monsoonal pattern For example, in India, annual rainfall averages around 1,100 mm This is primarily due to the Indian monsoon, a seasonal wind system that brings heavy rains during the summer months. These monsoons are essential for agriculture and provide a significant portion of the annual precipitation.
Other tropical areas, such as the Caribbean, receive annual rainfall averages ranging from 1,000 to 2,000 mm. Trade winds play a crucial role in bringing moisture to these regions. However, some areas, such as the leeward sides of mountains, experience rain shadows, where moist air is blocked by the mountains, leading to lower annual rainfall averages.
TEMPERATE REGIONS
Temperate regions, found in the mid-latitudes, have distinctive patterns of rainfall with reference to annual averages. These areas experience a moderate climate characterised by four distinct seasons, which influence their precipitation patterns
Temperate regions typically receive annual rainfall averages ranging from 500 to 1,500 mm This consistent and well-distributed rainfall supports diverse ecosystems and agriculture. For example, the Greater Dublin Area receives an annual average of approximately 750 mm of rainfall
The temperate climate’s four-season cycle (spring, summer, autumn and winter) results in varied rainfall patterns throughout the year Summer tends to be drier, while autumn and winter are wetter due to the passage of cyclonic fronts.
CONTINENTAL INTERIOR REGIONS
Continental interior regions are known for their unique rainfall patterns, which are influenced by their distance from oceans and geographic features. Annual rainfall averages in these areas exhibit distinct characteristics.
Continental interior regions typically receive lower annual rainfall averages compared to coastal areas. Annual averages often range from 100 to 500 mm. For instance, regions such as the Gobi Desert in Mongolia receive less than 200 mm of rainfall annually.
The primary factor affecting rainfall in continental interiors is their distance from large bodies of water, such as oceans. These regions experience a rain-shadow effect, where moist air from the oceans is blocked by mountain ranges, resulting in dry conditions on the leeward side.
THE NATURAL WORLD – OPTION 9 46
Limited rainfall in continental interior regions can lead to desertification, a process where fertile land becomes desert due to prolonged drought. This has significant implications for agriculture and ecosystem sustainability
POLAR REGIONS
Polar regions, including the Arctic and Antarctic, are known for their extreme cold and unique climatic conditions. When it comes to rainfall, these areas exhibit some of the lowest annual averages in the world.
Polar regions experience minimal rainfall throughout the year Annual averages often hover around 200 to 400 mm, which is significantly lower than other parts of the world. This limited rainfall is mainly due to the frigid temperatures, as the cold air holds very little moisture.
While rainfall is scarce, polar regions are characterised by heavy snowfall. Snow accumulates over time and forms ice sheets, glaciers, and pack ice. The snow and ice play a crucial role in shaping the landscape and influencing global climate patterns.
DISTRIBUTION OF RAINFALL IN IRELAND
Ireland, known for its cool temperate oceanic climate, exhibits a distinctive distribution of rainfall across its regions.
THE WEST
The western half of Ireland, including its high ground, receives a large amount of rainfall. Here, annual averages typically range between 1,000 and 1,400 mm. In mountainous areas, the figures soar, exceeding 2,000 mm The highest summits are drenched by over 3,000 mm of rainfall annually Much of this precipitation results from relief rainfall, as moist air is uplifted over the elevated terrain.
Atlantic influence
This region is also the first to encounter frontal rainfall associated with depressions crossing the Atlantic Ocean. These weather systems bring significant amounts of rain, contributing to the high annual averages.
THE EAST
In contrast, the eastern half of Ireland experiences lower annual rainfall, averaging between 800 and 1,200 mm Many areas such as the GDA benefit from the rain-shadow effect, which occurs when mountains block prevailing westerly winds, resulting in relatively lighter rainfall. 3,600 2,800 2,400 2,000 1,600 1,400 1,200 1,000 800 600 0
Figure 3.16
Average rainfall across different regions in Ireland, measured in millimetres (mm)
47 CHAPTER 3 | MOISTURE IN THE ATMOSPHERE
THE MIDLANDS
The Midlands region experiences some convectional rainfall during the summer months. This type of rainfall occurs when the sun heats the ground, causing warm air to rise and condense into rain clouds. While not as significant as other forms of rainfall, it adds to the overall precipitation totals.
HAIL AND SNOW
Hail and snow contribute relatively little to Ireland’s precipitation totals. These forms of frozen precipitation are infrequent and occur mainly during the winter months, with rainfall being the dominant form of precipitation throughout the year
SEASONAL VARIATION
Rainfall in Ireland is not evenly distributed throughout the year The wettest months in nearly all areas are December and January, while April is generally the driest month. However, in many southern parts of the country, June stands out as the driest month. This is evidence of the subtle regional variations within Ireland’s climate.
CHECK YOUR UNDERSTANDING
Basic Knowledge
1. What is the average annual rainfall range in equatorial regions?
2. Name the two main types of rainfall experienced in tropical regions.
3. How much annual rainfall does the Greater Dublin Area in Ireland typically receive?
Developed Knowledge
1. Describe the process of relief rainfall and its effects in the western half of Ireland.
2. Explain how the monsoonal pattern of rainfall affects regions such as India.
3. Discuss the reasons for lower annual rainfall averages in continental interior regions compared to coastal areas.
Advanced Knowledge
1. Analyse the impact of Ireland’s geographical location on the distribution of rainfall across the country
PAST EXAM PAPER QUESTIONS
HIGHER LEVEL
2021
‘Exchanges of water between oceans and atmosphere, over the Earth’s surface, impact on precipitation and its distribution patterns.’
Discuss.
(80 marks)
Examine how exchanges of water between oceans and atmosphere give rise to distinctive weather and climate regimes.
(80 marks)
THE NATURAL WORLD – OPTION 9 48
3
OCEANS, ATMOSPHERE, WEATHER AND CLIMATE
CHAPTER 04

SYLLABUS LINK
9.4 CIRCULATION IN BOTH THE ATMOSPHERE AND THE OCEANS AFFECTS WEATHER AND CLIMATE PATTERNS ON A VARIETY OF SCALES
KNOWLEDGE RETRIEVAL
Retrieval Quiz
1. List the four main stages of the hydrological cycle.
2. What is the initial process in the hydrological cycle where water changes from liquid to vapour?
3. Name the process where water vapour in the atmosphere transforms back into liquid form, leading to cloud formation.
4. What is the name of the process that leads to the formation of clouds?
5. List the four main types of clouds.
49
LEARNING INTENTIONS
1. Explain the idea of atmospheric circulation and global wind patterns.
2. Describe the formation of mid-latitude large-scale weather systems.
3. Outline the occurrence of local weather systems or microclimates.
4. Discuss surface and deep-water currents as part of the wider system of ocean movements.
5. Describe the impact of ocean currents in the North Atlantic Ocean on weather patterns, oceanic circulation and climates.
6. Analyse the impacts of ocean currents on regional temperature and precipitation.
KEYWORDS
Atmospheric circulation Uneven heating Trade winds
Hadley cell Ferrel cell Polar cell
Westerlies Easterlies
Mid-latitude depressions
Polar front Omega-blocking pattern Sea and land breezes
Coriolis effect
Prevailing surface winds
Mid-latitude anticyclones
Valley and mountain winds
Differential heating and cooling Thunderstorm life cycle Cumulonimbus clouds Ocean currents
Surface currents Deep-water currents
Coriolis effect Gulf Stream
Atlantic Meridional Overturning Circulation (AMOC)
Thermohaline circulation
Global ocean conveyor belt
North Atlantic DriftUpwelling
TOPIC 4.1: Atmospheric Circulation and Global Wind Patterns
ATMOSPHERIC CIRCULATION
Atmospheric circulation is a vital concept in understanding how the Earth’s climate system functions. It explains the movement of air and distribution of heat around the planet, significantly influencing weather patterns and climate zones.
At its core, atmospheric circulation involves the transfer of heat from the equator, where sunlight is strongest, to the poles, which receive less solar energy. This process starts with the sun’s energy heating the Earth unevenly due to the planet’s spherical shape. The equator gets more direct sunlight and is warmer compared to the poles.
Warm air at the equator rises, creating an area of low pressure. This rising air cools as it reaches higher altitudes and spreads out towards the poles. As it moves, it cools and descends, forming high-pressure areas. These movements create wind patterns known as trade winds, westerlies and easterlies.
Atmospheric circulation is crucial for understanding global weather patterns and climate. For instance, the Intergovernmental Panel on Climate Change (IPCC) 2021 report highlights how changes in atmospheric circulation due to global warming are influencing extreme weather events such as hurricanes and droughts
50 THE NATURAL WORLD – OPTION 9
Figure 4.1
Incoming sunlight on the Earth and its impact on the global distribution of heat
GLOBAL WIND PATTERNS
The Earth is encircled by six major surface wind belts, three in each hemisphere. These global wind belts are the result of two main influences:
1. Uneven heating of the Earth’s surface, which creates high- and low-pressure belts.
2. The rotation of the Earth on its axis, which results in the Coriolis effect.
Pressure belts are large areas of the Earth where air pressure is consistently high or low. These belts are formed due to the uneven heating of the Earth’s surface, which is a direct result of the sun’s rays striking the Earth at different angles.
HIGH-PRESSURE BELTS
High-pressure belts are areas where the air is cooler and denser, which causes air to descend towards the Earth’s surface. As a result, these areas experience clear skies and dry weather conditions. The most significant high-pressure belts are found at about 30 degrees North and South of the equator, and near the poles at about 90 degrees North and South. The one near the equator is known as the subtropical high-pressure belt, while those near the poles are called polar high-pressure belts.
LOW-PRESSURE BELTS
Low-pressure belts, in contrast, are areas where warm air rises. This process occurs predominantly at the equator, known as the equatorial low-pressure belt, and around 60 degrees North and South, termed as the subpolar low-pressure belts Rising air leads to cloud formation and precipitation, making these areas generally wetter
The existence of these pressure belts is a key factor in the creation of global wind patterns. Winds blow from high- to low-pressure areas as the air tries to balance out the differences in pressure.
TRADE WINDS, WESTERLIES AND EASTERLIES
The most notable wind patterns influenced by these pressure belts are the trade winds, the westerlies, and the polar easterlies. The trade winds blow from the subtropical high-pressure belts towards the equatorial low-pressure belt. They are reliable and steady, historically aiding sailing ships in oceanic voyages.
The westerlies, found between 30 and 60 degrees latitude, blow from the subtropical high- to the subpolar low-pressure belts. They are crucial in the weather patterns of many mid-latitude countries, including Ireland.
51 CHAPTER 4 | OCEANS, ATMOSPHERE, WEATHER AND CLIMATE
Arctic Circle 60°N 30°N Tropic of Cancer Equator South Pole Low angle Most directly Low angle North Pole Tropic of Capricorn 30°S 60°S Antarctic Circle Atmosphere
The polar easterlies blow from the polar highs to the subpolar lows. These winds are less consistent due to the extreme conditions near the poles.
THE CORIOLIS EFFECT
The Coriolis effect is a fundamental concept in geography that explains how the rotation of the Earth influences the movement of air and water across the planet.
At its core, the Coriolis effect arises due to the Earth’s rotation. It is important to note that the Earth rotates faster at the equator than at the poles. This difference in rotational velocity affects the path of moving objects, including air and water currents, causing them to appear to veer off their straight path.
Earth’s rotation
Equator
Intended path
Actual path
Direction of Earth’s rotation
Starting point
Figure 4.2 Coriolis effect
MOVEMENT IN THE NORTHERN AND SOUTHERN HEMISPHERES
In the northern hemisphere, the Coriolis effect causes moving air and water to deflect to the right of their direction of travel. Conversely, in the southern hemisphere, they deflect to the left. It is important to understand that the Coriolis effect does not cause the movement; it only alters the path of moving objects.
IMPACT ON WEATHER PATTERNS
The Coriolis effect is instrumental in shaping weather patterns. For example, it influences the rotation of cyclones – causing them to spin anticlockwise in the northern hemisphere and clockwise in the southern hemisphere. This effect is also responsible for the direction of prevailing wind patterns, such as the trade winds and westerlies.
THE THREE CIRCULATION CELLS
The atmospheric circulation of each hemisphere is divided into three main cells:
• Hadley cell
• Polar cell
• Ferrel cell
52 THE NATURAL WORLD – OPTION 9
North Pole
HADLEY CELL
The Hadley cell operates between the equator and 30 degrees latitude in both hemispheres. This cell begins with warm air rising near the equator, creating a low-pressure area. As this air rises, it cools and spreads towards the poles. Around 30 degrees latitude, it cools and descends, forming a high-pressure area This descent leads to dry conditions and it is why many of the world’s deserts are located in these regions.
The return flow of air at the surface from these high-pressure areas back to the equator is known as the trade winds These winds are crucial for global weather patterns and were historically significant for maritime navigation.
POLAR CELL
The Polar cell operates in the regions from 60 degrees latitude to the poles. In this cell, cold, dense air descends at the poles, creating a high-pressure area. This air then flows towards lower latitudes. At around 60 degrees latitude, it rises again, creating a low-pressure area.
53 CHAPTER 4 | OCEANS, ATMOSPHERE, WEATHER AND CLIMATE
Polar cell
Ferrel cell
Hadley cell
Hadley cell
Ferrel cell
Polar cell
Ferrel cell
Hadley cell
Hadley cell
60° 30° 0° 30° 60°
Ferrel cell
Figure 4.3
Global atmospheric circulation cells
High Low High Pressure 30°N Equator30°S Latitude
Hadley cell ITCZ Hadley cell
Figure 4.4 Hadley cells
Hadley cell ITCZ Hadley cell Polar cell Low Polar cell High Low Low High Pressure 90°N 60°N 30°N Equator 30°S 60°S 90°S Latitude High High
Figure 4.5 Polar cells
The winds in the Polar cell are known as the polar easterlies, blowing from the east to the west. These winds are significant in the polar regions and play a role in the Arctic and Antarctic climates.
FERREL CELL
The Ferrel cell exists between 30 and 60 degrees latitude. It is a more complex and less predictable cell compared to the Hadley and Polar cells. The air in this cell moves polewards and upwards at around 60 degrees latitude, creating a low-pressure area As it moves towards the equator, it descends at about 30 degrees latitude, creating a high-pressure zone
This cell is responsible for the prevailing westerlies – winds that blow from the west to the east in the mid-latitudes These winds are crucial for the weather systems in these latitudes, including those affecting Ireland.
PREVAILING SURFACE WINDS
Prevailing surface winds are major wind patterns that consistently occur at specific latitudes around the Earth. They are crucial for understanding global climate, weather systems and navigation.
cell Descending cool, dry air
front
easterlies
Descending cool, dry air
Hadley cell
Equatorial doldrums (ITCZ)
Hadley cell
Figure 4.7 Trade winds, westerlies and polar easterlies
Descending cool, dry air
54 THE NATURAL WORLD – OPTION 9
Polar cell Ferrel cell Hadley cell ITCZ Hadley cell Ferrel cell Polar cell HighLow HighLow High Low High Pressure 90°N 60°N 30°N Equator 30°S 60°S 90°SLatitude
Figure 4.6
Ferrel cells
Polar
Polar
High
Polar
Rising
Low
High
Rising
Low pressure
pressure
warm, moist air
pressure
pressure
warm, moist air
High pressure Rising warm, moist air Low pressure Polar easterlies Polar high Polar cell Polar
Ferrel
front
cell Horse latitudes
Horse latitudes Ferrel cell 60° Westerlies 30° Northeast Trade winds 0° Southeast Trade winds 30° Westerlies 60°
TRADE WINDS
Trade winds are steady, easterly winds found in the Earth’s equatorial region, approximately between 30° North and 30° South latitude. They originate from the subtropical high-pressure areas and move towards the equatorial low-pressure zone. The Coriolis effect causes these winds to curve, blowing from the northeast in the northern hemisphere and the southeast in the southern hemisphere.
Trade winds are known for their consistency and were historically crucial for maritime navigation, enabling ships to travel quickly across the oceans. Climatically, they have a significant impact on tropical rainforests and deserts. For example, they contribute to the Amazon Rainforest’s high rainfall, while their absence in certain regions leads to the formation of deserts, such as the Sahara.
WESTERLIES
Westerlies are winds that blow from the west towards the east in the mid-latitudes, between 30° and 60° North and South latitude. These winds arise due to the temperature gradient between the equator and the poles and are affected by the Earth’s rotation.
The westerlies are particularly notable for their role in weather patterns in temperate regions. They are responsible for carrying moist air from the oceans onto land, contributing to varied weather conditions in places such as Europe and North America. In Ireland, for example, the westerlies are a major factor in the country’s generally mild and moist climate.
EASTERLIES
Easterlies, also known as the polar easterlies, are cold, dry winds that blow from the east to the west. They are found in the polar regions, from 60° latitude to the poles. These winds originate from high-pressure areas in the polar regions and move towards the lower pressure areas of the Ferrel cell at around 60° latitude.
The easterlies are known for their role in the polar climates. They are significant in the formation and movement of sea ice and play a part in the Earth’s heat balance by transporting cold air from the poles towards lower latitudes.
CHECK YOUR UNDERSTANDING
Basic Knowledge
1. State the primary reason atmospheric circulation is considered vital in understanding Earth’s climate system.
2. Name the three major wind patterns created by atmospheric circulation.
3. List the three main cells involved in atmospheric circulation and their corresponding latitude ranges.
Developed Knowledge
1. Explain how the Coriolis effect influences global wind patterns
2. Discuss the impact of the Hadley cell on the world’s desert locations.
3. Outline the significance of the westerlies for the weather patterns in mid-latitude countries, including Ireland.
Advanced Knowledge
1. Analyse the relationship between the uneven heating of the Earth’s surface and the formation of high- and low-pressure belts.
2. Differentiate between the roles of the Ferrel cell and the Polar cell in global atmospheric circulation.
3. Investigate how changes in atmospheric circulation, as highlighted in the IPCC 2021 report, might influence extreme weather events such as hurricanes and droughts.
55 CHAPTER 4 | OCEANS, ATMOSPHERE, WEATHER AND CLIMATE
3
TOPIC 4.2: Mid-Latitude Weather Systems
THE MID-LATITUDES: LARGE-SCALE WEATHER SYSTEMS
The mid-latitudes are unique in terms of atmospheric circulation. They are characterised as a zone where tropical and polar air masses meet. The weather here is extremely volatile and changeable both from season to season and day to day.
There are many types of atmospheric disturbances here but the two mains disturbances that occur are:
• Mid-latitude depressions
• Mid-latitude anticyclones.
MID-LATITUDE DEPRESSIONS
Mid-latitude depressions, also known as extratropical cyclones, are large-scale weather systems that are pivotal in shaping the climate and weather patterns in mid-latitude regions, including Ireland. These systems are characterised by low atmospheric pressure and are a primary weather feature in the temperate zones of the Earth.
Formation and structure
Mid-latitude depressions form at the boundaries between warm tropical air masses and cold polar air masses This boundary is known as the polar front When these contrasting air masses meet, the warmer air is forced to rise over the colder air, leading to the development of a depression.
The structure of a mid-latitude depression typically includes a warm front and a cold front. The warm front is where warm air moves over cold air, often bringing steady rain followed by warmer, clearer conditions. The cold front, where cold air undercuts warm air, usually brings more intense, shorter periods of precipitation and a drop in temperature.
Life cycle and movement
The life cycle of a mid-latitude depression involves several stages: initial development, maturation, and dissipation Initially, a wave-like disturbance occurs along the polar front, leading to the formation of a low-pressure system As the system matures, the warm and cold fronts become more distinct, and the depression deepens, reaching its most intense stage. Eventually, the system dissipates as it moves away from its source of energy – the temperature contrast between the air masses.
These systems typically move from west to east, driven by the prevailing westerly winds in the midlatitudes Their movement and intensity are influenced by various factors, including the jet stream and geographical features such as mountain ranges.
56 THE NATURAL WORLD – OPTION 9
Cold polar air Warm tropical air Cold polar air Warm tropical air Cold air LOW Warm sector Occluded front Cool air Warmfront Cold air Coldfront Warm air Cold front Warmfront A B C D
Figure 4.8
Formation of mid-latitude depressions
4.9
Characteristics of a
Impact on weather
Mid-latitude depressions are responsible for much of the variable weather experienced in countries such as Ireland They bring bouts of rain, wind and sometimes stormy conditions Many of the heavy rain events in Ireland are associated with these depressions. For example, Storm Babet in 2023 brought upwards of 90 mm of rain in just 36 hours to some areas in the country.
MID-LATITUDE ANTICYCLONES
Mid-latitude anticyclones particularly influence weather patterns in temperate regions such as Ireland. These systems are characterised by high atmospheric pressure.
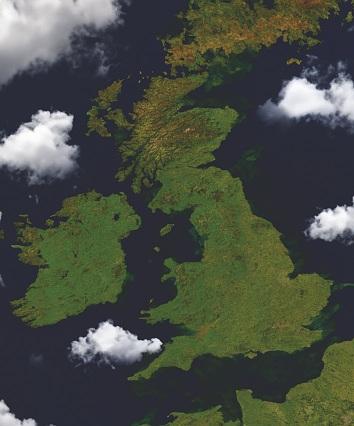
Formation and structure
Mid-latitude anticyclones are high-pressure weather systems formed due to descending air in the Earth’s atmosphere. This descending air occurs when warm air rises at the equator, moves towards the poles, cools, and then sinks back towards the Earth’s surface. As the air descends, it warms adiabatically (without heat loss or gain), leading to increased pressure at the surface.
These systems are characterised by a high-pressure centre, where the air pressure is highest. The air within an anticyclone moves in a clockwise direction in the northern hemisphere due to the Coriolis effect, a phenomenon caused by the Earth’s rotation. This movement results in clear, calm weather as the descending air inhibits cloud formation and decreases wind speed.
57 CHAPTER 4 | OCEANS, ATMOSPHERE, WEATHER AND CLIMATE
3 2 1 Isobar showing pressure in millibars Direction of air in the warm sector Direction of air in the cold sector Warm sector Cold front Warm front 980 When the cold front passes:In the warm sector: The warm front approaches: • Pressure starts to rise • It gets warmer • Pressure drops • Pressure steadies • Clouds thicken and become lower • Wind speed increases • Dry ahead of the front • Heavy rain close to the front • Clouds may thin and break • Wind stays steady • Rain turns to drizzle or stops • Thick cumulus clouds form • Wind speed starts to increase • Heavy rain or showers 980 1012 1008 1004 1000 996 992 988 984 LOW
Figure
1004 1000 996 992 988 984 980 976
Anticyclone over Ireland
mid-latitude depression
Figure 4.10
Life cycle and movement
The life cycle of a mid-latitude anticyclone includes its development, maturation, and eventual dissipation. Initially, a ridge of high pressure forms, gradually intensifying into a well-defined anticyclone. Over time, as the system moves over the Earth’s surface, it begins to weaken and dissipate
These anticyclones generally move from west to east, steered by the upper atmospheric winds. The speed and direction of movement can be influenced by various factors such as the jet stream, a fast-flowing river of air high in the atmosphere, and geographical features such as mountain ranges.
Impact on weather
In Ireland, mid-latitude anticyclones significantly impact the weather These systems bring stable, dry, and clear weather conditions, which can be a relief from the typically wet Irish climate. During the summer months, anticyclones can lead to warm, sunny days with high temperatures, sometimes resulting in heatwaves This is particularly evident during periods when the Azores High, a semi-permanent anticyclone in the North Atlantic, extends towards Ireland.
In winter, these high-pressure systems can cause cold, frosty weather with clear skies The clear nights can lead to significant temperature drops, resulting in frost. Fog is also a common feature in these conditions, particularly during the morning.
While generally associated with calm weather, anticyclones can sometimes contribute to extreme weather conditions. For instance, during a prolonged anticyclone in summer, there can be risks of drought and water shortages. Conversely, in winter, persistent high pressure can lead to prolonged cold spells.
An example of this mid-latitude anticyclone weather system impacted Ireland in September 2023, when the country experienced a heatwave, which was unusual for that period of the year. This heatwave was caused by an omega system. An omega system is one in which high pressure becomes sandwiched between two low-pressure systems.
This omega high-pressure system was driven by tropical storms pushing a high-pressure system over Ireland and the UK, with the jet stream moving to the north and bending into what is known as an omega-blocking pattern
In Ireland, temperatures reached highs of up to 28 degrees during the spell of warm weather Additionally, a status yellow high temperature weather warning was put in place for a three-day period in
Figure 4.11 September heatwave driven by an omega high-pressure system over Ireland in 2023
58 THE NATURAL WORLD – OPTION 9
September 17 17 35 32 34 33 3331 3132 35 3634 36 37 37 35 33 32 31 28 27 32 32 20 20 18 19 19 18 21 25 26 26 29 29 29 20 303132 22 20 2020 28 30 30 3433 32 323334 26 2322 24 24 25 26 27 24 232423 19 15 27 24 222836242525 24 24 22 19 17 1717 25 26262724 2624 26 2625 25 23 15 17 17 18 25 28 27 27 29 2825 262425 26 22 29 26 2928 2829 27 25 25 26 23 24 2628 2427 2726 29 25 25 24 24 24 24 24 23 26262327 27 2423 24 23 24 25 1717 23 23 22 24 26 22 23 232125 25 27 26 23 17 25 26242526 24 25 25 24 24 26 25 2829 26 27 27 25 25 30 3029 27 28 27 302729 29 29 28 3033 2728 30 29 29 29 3028 3030 3030 29 27 3130 28 28 17 17 18 17 15 15 14 16 18 22 28 21 0 16 17 18 19 18 18 17 17 18 25 323333 35 3232 32 30 32 2831 31 31 28 29 2323 21 32 30 3132 3130 3232 26 46 42 36 38 34 30 44 40 36 32 28 24 20 16 12 8 4 0 –4 –8 –12 –14 –10 –6 –2 2 6 10 14 18 22 26
3 CHECK YOUR UNDERSTANDING
Basic Knowledge
1. What are the two main types of atmospheric disturbances found in the mid-latitudes?
2. State the typical life cycle stages of a mid-latitude depression.
3. Name the weather system responsible for Ireland’s heavy rain events, such as Storm Babet in 2023.
Developed Knowledge
1. Describe how mid-latitude depressions form at the boundary between warm tropical and cold polar air masses.
2. Explain the impact of mid-latitude anticyclones on Ireland’s weather during the summer and winter months.
3. Discuss the role of the Coriolis effect in the movement of air within mid-latitude anticyclones.
Advanced Knowledge
1. Analyse the reasons for the volatile and changeable weather in the mid-latitudes, particularly focusing on the interaction of tropical and polar air masses.
2. Examine how the omega high-pressure system contributed to the unusual heatwave in Ireland in September 2023.
WRITE LIKE A GEOGRAPHER
1. Describe the formation of anticylones and depressions and discuss their impact on weather patterns.
Success criteria:
Your answer must:
• Define mid-latitude depressions and anticyclones, describing their basic characteristics and significance in mid-latitude weather patterns.
• Explain the formation and structure of mid-latitude depressions.
• Describe the formation and structure of mid-latitude anticyclones.
Your answer should:
• Elaborate on the life cycle and movement of mid-latitude depressions.
• Discuss the life cycle and movement of mid-latitude anticyclones.
• Provide examples of the impact of these weather systems on Ireland’s weather, such as the effects of Storm Babet and the September 2023 heatwave.
Your answer could:
• Explore the broader implications of mid-latitude weather systems on climate variability, including their role in seasonal weather patterns and extreme weather events.
• Analyse how geographical features (e.g. mountain ranges) and atmospheric phenomena (e.g. the jet stream) influence the behaviour of these weather systems.
59 CHAPTER 4 | OCEANS, ATMOSPHERE, WEATHER AND CLIMATE
TOPIC 4.3: Local Weather Systems
LOCAL WEATHER SYSTEMS
Although we have studied the large-scale movement of air across the Earth, the circulation of wind also occurs on smaller, local scales and can produce variations in climatic conditions. These local climates are often referred to as microclimates. The circulation of wind across microclimates results in a variety of different weather conditions:
• Sea and land breezes
• Valley and mountain winds
• Thunderstorms.
SEA AND LAND BREEZES
Sea and land breezes are significant local weather phenomena that occur in coastal areas. These breezes result from differences in air temperature and pressure over land and water bodies. Understanding these breezes is essential for comprehending local weather patterns, particularly in coastal regions.
Formation of sea and land breezes
A sea breeze develops during the day when the sun heats the land more rapidly than the sea This rapid heating causes the air above the land to warm up and rise, creating a low-pressure area. Cooler air from the sea, a high-pressure area, then moves in to replace the rising warm air. This movement of cooler air from the sea towards the land is known as a sea breeze. It often brings a refreshing coolness to coastal areas during hot days.
In contrast, a land breeze occurs at night. The land loses heat more quickly than the sea after sunset. As the air over the land cools, it becomes denser and creates a highpressure area Meanwhile, the warmer air over the sea rises, forming a low-pressure area. This scenario causes air to move from the land towards the sea, creating a land breeze. This breeze is generally cooler and can lead to a drop in temperature along the coast at night.
Differential heating and cooling


The key to understanding sea and land breezes lies in the differential heating and cooling properties of land and water. Water heats and cools more slowly than land due to its higher specific heat capacity. This difference in temperature change rates between land and sea surfaces drives the formation of these breezes.
Coastal areas around the world experience these breezes regularly. For example, in Ireland, sea breezes can be felt along the coast, bringing cooler air from the Atlantic Ocean during warm summer days This can lead to temperature variations between coastal and inland areas.
60 THE NATURAL WORLD – OPTION 9
DAY 3 Cooler air sinks. Higher pressure area 4 Cooler air from over the ocean replaces rising warm air. 1 Land heats up faster than water. As a result, the air over land heats up faster than air over water. Lower pressure area 2 Warm air rises. 5 This creates a wind blowing from the ocean towards land. NIGHT 2 Warm air rises. Warm air over the sea (lower pressure) 3 Cool air sinks at night 5 This creates a breeze from land to sea. Cold air (higher pressure) 1 Land cools faster than water, As a result air over land cools faster than air over water. 4 Cooler air from over the land replaces the rising warm air.
Figure 4.12
Sea and land breezes
Impact on weather and local climate
Sea and land breezes can significantly impact local weather and climate. They can moderate temperatures in coastal regions, making them more temperate compared to inland areas. Furthermore, sea breezes can bring moisture and sometimes cause afternoon showers or thunderstorms in coastal regions. On the other hand, land breezes are generally dry and contribute to clearer night skies along the coast
VALLEY AND MOUNTAIN WINDS
Valley and mountain winds are local weather phenomena that occur in mountainous regions. These winds result from temperature differences between mountain slopes and valleys, and they play a significant role in local weather patterns. Understanding these winds is crucial for comprehending the localised weather dynamics of mountainous areas. DAY
(AFTERNOON)

61
OCEANS, ATMOSPHERE, WEATHER AND CLIMATE
CHAPTER 4 |
HP LP LP Valleywind Valleywind Cold air sinking NIGHT Cold air sinking Cool air LP HP HP Cold air sinking Mountainwind Mountainwind Warmer air rising Warm air rising Warm air rising
Figure 4.13 Valley and mountain winds
Formation of valley and mountain winds
A valley wind is typically experienced during the day. As the sun rises and heats the sides of mountains more rapidly than the air in the valleys, the warmer air on the slopes becomes less dense and rises. This creates a low-pressure area, causing cooler air from the valley to move upwards to replace the rising warm air The movement of this cooler air up the valley slopes is known as a valley wind This wind is often moderate and can contribute to pleasant daytime conditions in the valleys Conversely, a mountain wind occurs during the night. After sunset, the mountain slopes cool more rapidly than the air in the valleys The cool air on the slopes becomes denser and begins to descend into the valley, creating a high-pressure area This downward movement of air is called a mountain wind. It often brings cooler temperatures to the valley, which can be particularly noticeable in the late night and early morning hours.
The phenomenon of valley and mountain winds is driven by the differential heating and cooling rates of mountain slopes and valleys. Mountainsides, due to their angle, receive more direct sunlight and hence heat up and cool down more quickly than the air in the valleys.
In mountainous regions around the world, including parts of Ireland, valley and mountain winds are a common occurrence. For instance, in the Wicklow Mountains, hikers often experience these winds, which can lead to rapid changes in temperature and weather conditions.
Impact on local weather and climate
These winds can significantly influence local weather and microclimates. During the day, valley winds can aid in dispersing air pollutants and bringing fresher air into the valley. At night, mountain winds can lead to colder valley temperatures, which may affect local agriculture, such as frostsensitive crops.
THUNDERSTORMS
Thunderstorms are a common yet complex weather phenomenon, characterised by lightning, thunder, heavy rain, and sometimes hail. Understanding the life cycle of thunderstorms is essential for comprehending local weather systems. This section will cover the three stages of a thunderstorm: the developing stage, the mature stage, and the dissolving stage
62 THE NATURAL WORLD – OPTION 9
Mature stageDissolving stage Developing stage Updraught Tropopause −40°C –40°C 0°C 0°C 0°C Light rain Heavy rain Direction of storm movement Downdraught
4.14 Formation of thunderstorms
Figure
Developing stage
The developing stage of a thunderstorm begins with the formation of cumulus clouds. These clouds form when warm, moist air rises into the atmosphere due to solar heating of the Earth’s surface. As this air rises, it cools and condenses to form clouds. During this stage, updraughts (upward-moving currents of air) dominate, allowing the cloud to grow in height. At this point, the cloud is known as a cumulus cloud. There is generally little to no rain during this stage, and the thunderstorm is essentially building up energy
Mature stage
The mature stage is when the thunderstorm is most intense. During this phase, the cloud has developed into a cumulonimbus cloud, often recognised by its anvil-shaped top. This stage is characterised by the presence of both updraughts and downdraughts – the latter being downwardmoving currents of air As the rain begins to fall, it cools the surrounding air, leading to downdraughts. The presence of both updraughts and downdraughts creates turbulence within the cloud.
It is during the mature stage that we typically observe the characteristics of a thunderstorm: heavy rain, thunder, lightning, and sometimes hail. The lightning is a result of the separation of positive and negative charges within the cloud, leading to electrical discharges. Thunder is the sound of the rapid expansion and contraction of air heated by the lightning. This stage can last for a varying duration, typically around 30 minutes, but can extend depending on the storm’s intensity and the available moisture and heat.
Dissolving stage
Finally, the dissolving stage marks the end of the thunderstorm’s life cycle. During this phase, the downdraughts begin to dominate, cutting off the updraughts and hence the supply of warm, moist air to the cloud. Without this fuel, the storm starts to weaken. The rainfall becomes lighter, and the frequency of lightning and thunder diminishes. Eventually, the storm dissipates, leaving behind cooler and more stabilised atmospheric conditions.
CHECK YOUR UNDERSTANDING
Basic Knowledge
1. Name the three types of local weather phenomena discussed in the topic.
2. What are the primary causes of sea and land breezes?
3. List the three stages of a thunderstorm’s life cycle.
Developed Knowledge
1. Describe how valley and mountain winds are formed and their impact on local weather and climate.
2. Explain the difference in the formation of sea breezes during the day and land breezes at night.
3. Discuss the characteristics of the mature stage of a thunderstorm and the weather conditions associated with it.
Advanced Knowledge
1. Analyse how the differential heating and cooling properties of land and water drive the formation of sea and land breezes.
2. Differentiate between the impact of valley winds during the day and mountain winds at night on local weather patterns.
3. Examine the role of updraughts and downdraughts in the development and dissipation of thunderstorms.
63 CHAPTER 4 | OCEANS, ATMOSPHERE, WEATHER AND CLIMATE
3
TOPIC 4.4: Ocean Currents
Ocean currents are continuous, directed movements of seawater generated by various forces acting upon the water, including wind, the Coriolis effect, breaking waves, and temperature and salinity differences These currents play a crucial role in the Earth’s climate system and are essential components of the world’s oceans.
There are two primary types of ocean currents:
• Surface currents
• Deep-water currents
Surface currents, comprising about 10 per cent of all the water in the ocean, are primarily driven by the wind. These currents typically extend to depths of about 400 metres and are greatly influenced by the Earth’s rotation, which deflects their path – a phenomenon known as the Coriolis effect.
Deep-water currents, making up the other 90 per cent, are driven by differences in water density, which are controlled by temperature (thermo) and salinity (haline), hence the term thermohaline circulation. This circulation is a critical component of the global climate system, transporting heat and nutrients around the world.
THE GLOBAL OCEAN CONVEYOR BELT
The global ocean conveyor belt, also known as thermohaline circulation, is a vast, continuous system of deep-ocean currents driven by temperature and salinity. This global system plays a crucial role in regulating Earth’s climate and supporting marine life.
Thermohaline circulation is powered by differences in water density, which are affected by temperature (thermal) and salinity (haline) factors. Cold, salty water is dense and sinks to the ocean floor; while warmer, less salty water is less dense and remains near the surface. This creates a global circuit of deep and surface currents.
In areas such as the North Atlantic and near Antarctica, the water becomes cold and salty enough to sink, forming deep-water currents.
These deep currents slowly circulate across the ocean basins, travelling vast distances. Over centuries, this water eventually rises to the surface through a process called upwelling, mainly in the Pacific and Indian Oceans.
64 THE NATURAL WORLD – OPTION 9
Cold water Warm water Arctic Ocean Atlantic Ocean Indian Ocean Southern Ocean Pacific Ocean
Figure 4.15
Global ocean conveyor belt
CHAPTER 4 | OCEANS, ATMOSPHERE, WEATHER AND CLIMATE
This circulation is essential for distributing heat and nutrients around the globe. It influences climate patterns by moving warm water towards the poles and cold water towards the equator. Additionally, it brings nutrients from the deep sea to the surface, supporting marine ecosystems
DEEP-WATER CURRENTS
Deep ocean currents, unlike surface currents driven by wind, are primarily driven by differences in water density, which are influenced by temperature and salinity. This process, known as thermohaline circulation, involves the movement of cold, saline (salty) water sinking to the ocean depths and warmer, less saline water rising towards the surface.
The movement of these currents is a slow and steady flow of water across the ocean basins. The dense water formed in the polar regions, due to its high salinity and low temperature, begins to sink. This sinking water creates a flow that moves along the ocean floor towards the equator.
These deep currents have a global reach, connecting the world’s oceans in a vast system that acts like a conveyor belt. They play a critical role in global heat distribution, transferring warm water from the equator to the poles and vice versa. This heat exchange is essential in regulating the global climate, impacting weather patterns and marine biodiversity.
A prime example of deep ocean currents is the Atlantic Meridional Overturning Circulation (AMOC). This system carries warm, salty water in the upper layers of the Atlantic Ocean to the north; and cold, deep water to the south. The AMOC is a critical component of the Earth’s climate
Mechanisms behind thermohaline circulation
Sun Evaporation Increased salt level due to evaporation Dense, cold and salty water flowing south Heated and mixed water rising to the surface salt from freezing water Water is cooled Heat 65
Figure 4.16
system, influencing weather patterns in Europe and North America.
Deep ocean currents also play a crucial role in nutrient cycling. As these currents travel, they transport oxygen and nutrients, supporting life in deep-sea ecosystems. This nutrient transport is essential for maintaining the biodiversity of the oceans.
SURFACE OCEAN CURRENTS
Surface ocean currents are a major component of the Earth’s ocean system and they significantly influence global climate patterns. Surface ocean currents are movements of water that occur at the ocean surface, driven mainly by the global wind system. They are created by three primary factors: global wind patterns, the rotation of the Earth, and the shape of ocean basins.
Winds such as the trade winds and westerlies are crucial in initiating the movement of surface waters. These winds blow consistently over large areas of the ocean, pushing the water to create currents.
4.17
The Atlantic Meridional Overturning Circulation (AMOC) is a deep-water current system in the Atlantic Ocean that brings warm water from the tropics to Europe.
The Earth’s rotation causes a phenomenon known as the Coriolis effect, which deflects the path of the winds and, subsequently, the currents. In the northern hemisphere, this deflection is to the right; in the southern hemisphere, it is to the left.
The configuration of ocean basins and continental landmasses also influences the direction and flow of currents. Coastlines and the seafloor topography can redirect, split, or concentrate the flow of water.
Surface ocean currents can be warm or cold, depending on their origin. Warm currents originate near the equator and flow towards the poles, while cold currents flow from polar or high-latitude regions towards the equator.
An example is the Gulf Stream in the North Atlantic Ocean, which carries warm water from the Gulf of Mexico along the east coast of the United States and towards Europe, significantly influencing the climate of the surrounding regions.
The California Current is a cold current that flows southwards along the west coast of North America, bringing cooler temperatures and influencing the climate of the West Coast.
GYRES
Gyres are large systems of circular surface ocean currents formed by the Earth’s wind patterns and the forces created by the rotation of the planet. These immense, rotating ocean currents play a crucial role in determining the climate of the Earth’s continents and are fundamental in marine navigation and biology
Gyres are primarily formed by the major wind patterns of the planet, such as the trade winds, westerlies, and polar easterlies The Earth’s rotation also contributes through the Coriolis
66 THE NATURAL WORLD – OPTION 9
North Atlantic Current
North Atlantic Deep Water Gulf Stream
Figure
effect, which causes the currents to shift direction – clockwise in the northern hemisphere and anticlockwise in the southern hemisphere.
There are five major ocean gyres: the North Atlantic, South Atlantic, North Pacific, South Pacific, and Indian Ocean gyres. Each of these occupies a vast area in their respective ocean basins. For example, the North Atlantic Gyre, encompassing the Gulf Stream, significantly influences the climate of western Europe, including Ireland, by transporting warm water from the equator towards the north.
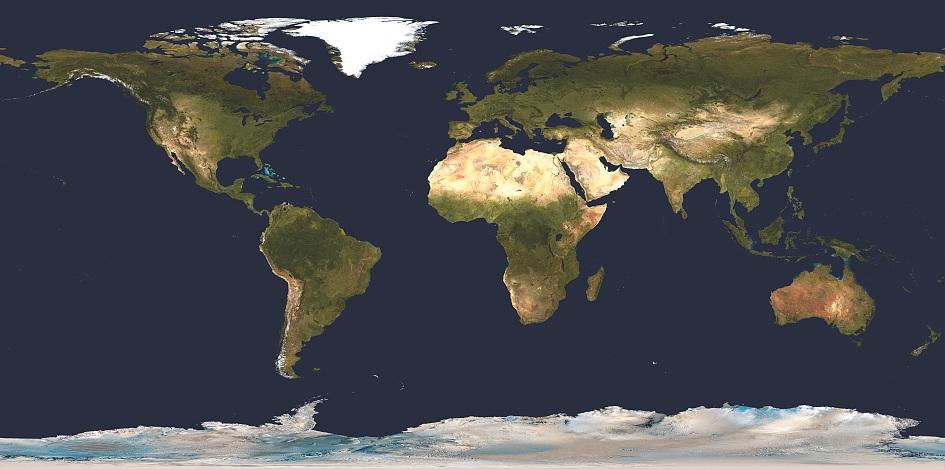
4.18
There are five major gyres, which are large systems of rotating ocean currents.
CASE STUDY: Ocean Currents in the North Atlantic Ocean
The Atlantic Ocean is the second largest of the Earth’s five oceans, following the Pacific Ocean.
The northern part of the Atlantic Ocean extends northwards from the equator to the Arctic Ocean and is bounded by North America and the Caribbean Sea to the west, and Europe and Africa to the east.
This ocean plays a vital role in global weather patterns, oceanic circulation, and consequently, in the climates of adjacent continents. The North Atlantic is known for its critical ocean currents, notably the Gulf Stream, which has a significant impact on the climate of western Europe, including Ireland. This warm ocean current ensures milder winters in these regions compared to other areas at similar latitudes
There are seven major ocean currents that influence the North Atlantic Ocean:
• North Equatorial Current
• Gulf Stream
• Canaries Current
• North Atlantic Gyre
• North Atlantic Drift
• Greenland Current
• Labrador Current.
67 CHAPTER 4 | OCEANS, ATMOSPHERE, WEATHER AND CLIMATE
North Pacific Gyre North Equatorial Current South Pacific Gyre East Wind Drift East Wind Drift West Wind Drift South Atlantic Gyre North Atlantic Gyre North Equatorial Current Indian Ocean Gryre Indian Ocean Gryre Oyashiocurrent KuroshioCurrent
Figure
The system of ocean currents in the North Atlantic Ocean
NORTH EQUATORIAL CURRENT
The North Equatorial Current is a significant component of the oceanic circulation in the North Atlantic Ocean. This current is a warm, westward-flowing stream of water, located near the equator, stretching from the west coast of Northern Africa to the Caribbean Sea.
The North Equatorial Current plays a crucial role in the broader system of Atlantic Ocean circulation. It helps in the transfer of warm water from the eastern Atlantic to the western Atlantic. This movement of warm water is essential for maintaining the temperature balance within the ocean and it contributes to the global climate system.
Upon reaching the Caribbean Sea, the North Equatorial Current feeds into the Gulf Stream.
THE GULF STREAM
The Gulf Stream is a powerful, warm Atlantic Ocean current that originates in the Gulf of Mexico, flows along the eastern coastline of the United States, and extends across the Atlantic Ocean. It is one of the strongest ocean currents, profoundly impacting the ocean circulation in the North Atlantic.
The Gulf Stream plays a critical role in the North Atlantic Ocean’s circulation by transferring warm water from the tropical regions towards the higher latitudes. This northward flow is a key component of the Atlantic Meridional Overturning Circulation (AMOC), which is a larger system of currents that includes both surface and deep-water movements.
68 THE NATURAL WORLD – OPTION 9
Warm surface ocean current Cold surface ocean current Cold deep-water ocean current Greenland Current North Atlantic Drift Shannon 6°C Equator Gulf Stream North Atlantic Gyre North Equatorial Current Canaries Current Labrador Current New York −1°C
Figure 4.19
One of the most significant impacts of the Gulf Stream is its influence on climate. The warm waters of the Gulf Stream help to moderate temperatures in western Europe, including Ireland. This warming effect is crucial, as it results in milder winters and more temperate climates in these regions compared to similar latitudes elsewhere.
As the Gulf Stream moves north, it cools and eventually sinks near Greenland, contributing to the formation of deep ocean currents. This process is known as thermohaline circulation.
THE CANARIES CURRENT AND NORTH ATLANTIC GYRE
The Canaries Current is a crucial component of the North Atlantic Ocean’s circulation system. It is a cold, broad and slow-moving ocean current that flows southwards along the western coast of Northern Africa, from around the Iberian Peninsula to the coast of Senegal. This current plays a significant role in the Atlantic’s subtropical gyre.
The Canaries Current is part of the North Atlantic Gyre’s eastern boundary, which comprises a series of currents circulating clockwise in the northern hemisphere due to the Coriolis effect.
As a cold current, the Canaries Current contributes to the temperature balance in the North Atlantic Ocean. It brings cooler waters from the higher latitudes towards the equator, helping to moderate the ocean’s temperature and influencing the climate of nearby coastal regions.
The Canaries Current is driven primarily by the northeast trade winds. These winds push surface waters away from the coast, allowing cooler water from below to rise to the surface in a process known as upwelling This upwelling is essential for bringing nutrient-rich water to the ocean’s surface, supporting marine ecosystems.
The current’s cooling effect on the adjacent land areas is notable, particularly in the summer months. It can lead to the formation of marine layers and fog along the coast, impacting local weather conditions. Furthermore, the nutrient-rich waters support high levels of primary productivity, sustaining rich fisheries in the region.
THE NORTH ATLANTIC DRIFT
The North Atlantic Drift is a powerful and warm ocean current, an extension of the Gulf Stream, extending from the Grand Banks off Newfoundland to the coast of western Europe. It is a significant component of the North Atlantic’s circulation system, impacting the ocean’s dynamics and the climate of adjacent landmasses.
The North Atlantic Drift plays a vital role in the thermohaline circulation, which is a global system of surface and deep-water currents. As an extension of the Gulf Stream, the Drift transports warm, saline waters from the tropical Atlantic northwards. This transfer of warm water contributes to the moderate climate experienced in western Europe, including Ireland, by influencing the atmospheric temperature and weather patterns.
The warm waters of the North Atlantic Drift have a significant impact on the atmospheric conditions above They contribute to milder winters in western Europe compared to other regions at similar latitudes. The NAD’s heat also aids in the development of weather systems, particularly those involving precipitation and storms in the region.
THE GREENLAND CURRENT
The Greenland Current is a significant current within the North Atlantic Ocean circulation system. It flows southwards along the east coast of Greenland and carries cold, low-salinity polar waters from the Arctic Ocean into the North Atlantic.
69 CHAPTER 4 | OCEANS, ATMOSPHERE, WEATHER AND CLIMATE
This current plays a critical role in the thermohaline circulation, which is essential for global ocean circulation. As the Greenland Current moves southwards, it cools the warmer waters of the North Atlantic, contributing to the formation of dense water masses. This dense water sinks and helps drive the deep-water currents that are a vital part of global ocean circulation.
The cold waters of the Greenland Current interact with the warmer waters of the North Atlantic Drift, an extension of the Gulf Stream. This interaction is a crucial factor in moderating the climates of North Atlantic regions, including those in Northern Europe.
THE LABRADOR CURRENT
The Labrador Current is a crucial ocean current within the North Atlantic Ocean. Originating in the Arctic Ocean, it flows southwards along the coast of Labrador and Newfoundland. This cold, lowsalinity current is a continuation of the West Greenland Current and is influenced by waters from Baffin Bay and the Arctic Ocean.
The Labrador Current plays a significant role in the North Atlantic’s oceanic circulation. As a cold current, it interacts with the warmer waters of the Gulf Stream. This interaction is critical for the thermohaline circulation, which is the global ocean conveyor belt driven by temperature and salinity differences.
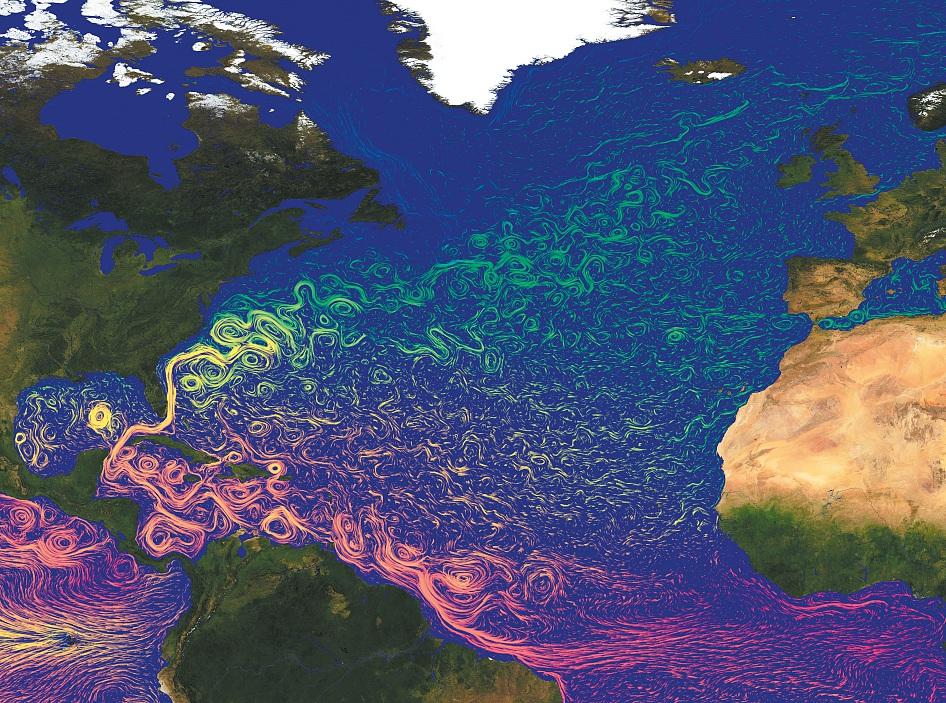
70 THE NATURAL WORLD – OPTION 9
Figure 4.20
Satellite image showing ocean currents in the North Atlantic Ocean. Temperatures are displayed from red (representing warm currents) to green (representing cold currents).
CHECK YOUR UNDERSTANDING
Basic Knowledge
1. What are the two primary types of ocean currents?
2. Name the phenomenon that causes the deflection of ocean currents due to Earth’s rotation.
3. List the stages of the thermohaline circulation, including the process of upwelling.
Developed Knowledge
1. Describe how surface ocean currents are primarily formed and their extent in depth
2. Explain the role of the Gulf Stream in influencing the climate of western Europe, including Ireland.
3. Discuss the impact of the Coriolis effect on the direction of surface ocean currents in different hemispheres.
Advanced Knowledge
1. Analyse how differences in water density, controlled by temperature and salinity, drive the formation of deep-water currents.
2. Differentiate between the roles of surface and deep-water currents in global heat distribution and nutrient transport.
3. Investigate the impact of the North Atlantic Drift and the Labrador Current on the North Atlantic Ocean’s climatic and oceanic circulation.
TOPIC 4.5: Impacts Of Ocean Currents
Ocean currents play an important role in weather patterns, oceanic currents, and climates on a global scale. However, they also play a significant role in impacting regional temperature and precipitation in an area.
SURFACE OCEAN CURRENTS AND REGIONAL TEMPERATURE
Surface ocean currents play a significant role in influencing regional temperatures. These currents are primarily driven by global wind patterns and the Earth’s rotation.
One of the key roles of surface ocean currents is the redistribution of heat across the planet. Warm-water currents, originating near the equator, carry warm water towards the poles. Conversely, cold-water currents bring colder water from the poles towards the equator This process helps regulate the Earth’s climate by balancing temperature differences between different regions.
Examples
1. The Gulf Stream: This warm current, originating in the Gulf of Mexico, flows north along the eastern coast of the United States and across the Atlantic Ocean towards Europe It significantly impacts the climate of western Europe, including Ireland, making it warmer than other regions at similar latitudes.
71 CHAPTER 4 | OCEANS, ATMOSPHERE, WEATHER AND CLIMATE
3
Figure 4.21
The diagram shows how the warm Gulf Stream gradually cools on its journey northwards through the North Atlantic and into the Norwegian Sea, until it meets the ice in the Arctic (grey area). Cold water flows back, both on the surface and in deep water.
2. The California Current: As a cold current, it flows southwards along the western coast of North America, cooling the adjacent coastal areas. This current influences the climate of the region, leading to cooler summers and milder winters compared to the inland areas.
Surface ocean currents also interact with atmospheric weather systems. For instance, the warmth or coldness of a current can affect air temperature above it, altering atmospheric pressure and wind patterns This interaction can lead to various weather phenomena, such as fog, storms, or even droughts in adjacent land areas.
SURFACE OCEAN CURRENTS AND REGIONAL PRECIPITATION
Surface ocean currents have a significant influence on regional precipitation patterns. These currents, created by global wind patterns and the Earth’s rotation, not only move water but also transport heat and moisture, affecting weather and climate over adjacent land areas.
Surface ocean currents impact regional precipitation mainly through their role in distributing heat and moisture. Warm currents increase the temperature of the air above the sea surface, leading to evaporation. This evaporated water vapour eventually contributes to cloud formation and precipitation when it moves over land.
The interaction between ocean currents and atmospheric conditions is a key factor in determining regional precipitation. For example, warm currents can lead to increased evaporation and, consequently, more precipitation in adjacent coastal areas. In contrast, cold currents may lead to drier conditions, as they cool the air, reducing its capacity to hold moisture.
72 THE NATURAL WORLD – OPTION 9 Canada Norway Greenland 10 8 6 4 2 0 −2
Examples:
1. Impact of warm currents: The Gulf Stream, a warm current in the North Atlantic, is a prime example. It increases air temperature and moisture content over the North Atlantic, leading to higher precipitation levels in western Europe, including Ireland. This contributes to the region’s relatively wet climate
2. Influence of cold currents: The California Current, a cold current off the west coast of the United States, cools the air and decreases evaporation This often leads to lower precipitation levels in Southern California, contributing to its semi-arid and arid climate.
The impact of surface ocean currents on precipitation is also linked to larger global climate patterns. For instance, the El Niño Southern Oscillation (ENSO) can alter the direction and strength of currents in the Pacific Ocean, significantly affecting precipitation patterns across the Pacific and beyond.
3
CHECK YOUR UNDERSTANDING
Basic Knowledge
1. What is the primary role of surface ocean currents in terms of global climate?
2. State the origin of the Gulf Stream and its general direction of flow.
Developed Knowledge
1. Describe how the California Current influences the climate of the west coast of North America.
2. Explain the process by which warm ocean currents can increase precipitation in adjacent coastal areas.
3. Discuss the relationship between the temperature of a surface ocean current and the air temperature above it.
Advanced Knowledge
1. Analyse the impact of surface ocean currents on the climate of western Europe, particularly focusing on the role of the Gulf Stream.
2. Differentiate between the effects of warm and cold currents on regional precipitation patterns, using the Gulf Stream and the California Current as examples.
PAST EXAM PAPER QUESTIONS
HIGHER LEVEL
2020
‘Circulation in both the atmosphere and the oceans gives rise to different weather patterns.’
Discuss.
2018
(80 marks)
Describe the formation of each of the following and discuss its impact on weather patterns.
• Mid-latitude depressions
• Anticyclones
• Land and sea breezes
(80 marks)
73 CHAPTER 4 | OCEANS, ATMOSPHERE, WEATHER AND CLIMATE
CLIMATIC ENVIRONMENTS
SYLLABUS LINK
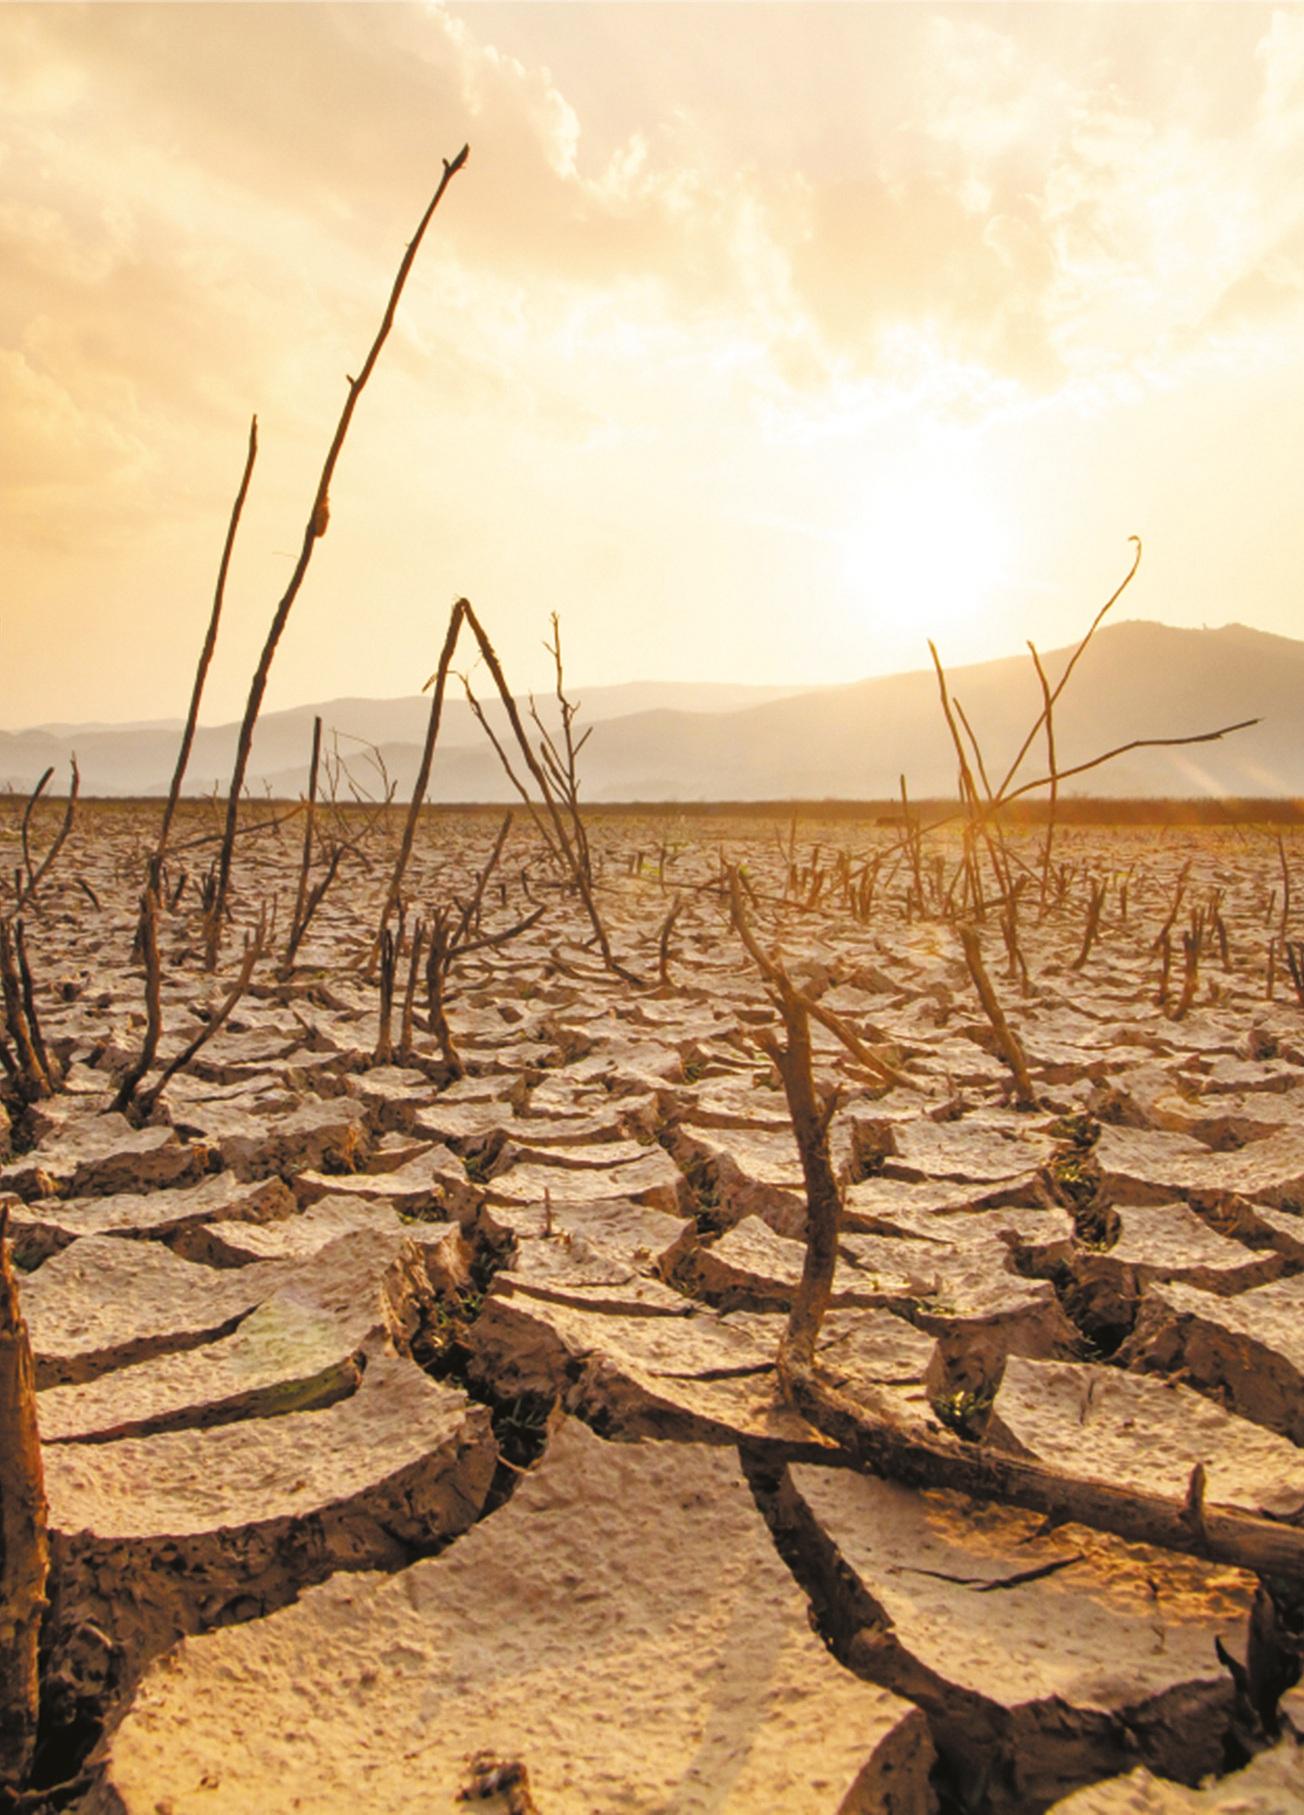
CHAPTER 05
9.5 THE SURFACE OF THE EARTH CAN BE DIVIDED INTO DISTINCTIVE CLIMATIC ENVIRONMENTS. THE CHARACTERISTICS OF CLIMATE CAN CHANGE OVER TIME AND SPACE
KNOWLEDGE RETRIEVAL
Retrieval Quiz
1. State the primary reason atmospheric circulation is considered vital in understanding Earth’s climate system.
2. Name the three major wind patterns created by atmospheric circulation.
3. List the three main cells involved in atmospheric circulation and their corresponding latitude ranges.
4. What are the two main types of atmospheric disturbances found in the mid-latitudes?
5. State the typical life cycle stages of a mid-latitude depression.
74
LEARNING INTENTIONS
1. Classify global climates using the Köppen climate classification system.
2. Discuss the global distribution and rainfall/temperature/humidity patterns in a tropical rainforest climate.
3. Explain the occurrence of ice ages with reference to Milankovitch cycles.
4. Analyse the impact of El Niño weather events in the Pacific Ocean.
5. Outline the consequences of the enhanced greenhouse effect on a global scale.
KEYWORDS
Tropical climatesDry climatesTemperate climatesContinental climates
Polar climatesHigh humidityAbundant rainfall
Intertropical Convergence Zone (ITCZ)
Evapotranspiration Dense canopyMilankovitch cycles Pleistocene Ice Age
Glacial periods Interglacial periods Changes in Earth’s orbit and tilt El Niño
Weakening of trade winds Increased sea surface temperatures Altered global weather patterns Volcanic eruptions
Human-induced Burning of fossil fuels Deforestation Greenhouse effect
TOPIC 5.1: Classifying Global Climates
WORLD CLIMATES
The Köppen climate classification system is a widely used method for categorising the world’s diverse climates based on specific criteria. Developed by Wladimir Köppen, a Russian-German climatologist, this system classifies climates into five main types, which are then subdivided into more specific categories.
MAIN CLIMATE TYPES IN THE KÖPPEN SYSTEM
1. Tropical (A): These climates have high temperatures (average above 18°C) all year round and significant rainfall. They include the Tropical Rainforest (Af), Tropical Monsoon (Am), and Tropical Wet and Dry or Savannah (Aw, As) climates. Example: The Amazon Basin in South America.
2. Dry (B): This group includes arid and semi-arid climates. The key factor is limited precipitation compared to evaporation. It is subdivided into Desert (BW) and Steppe (BS) climates. Example: The Sahara Desert
3. Temperate (C): Characterised by moderate temperatures with warm summers and cool winters This group includes Mediterranean (Csa, Csb), Humid Subtropical (Cfa, Cwa), and Marine West Coast (Cfb, Cfc) climates. Example: The Mediterranean region.
4. Continental (D): These climates have a more significant temperature range between summer and winter compared to Temperate climates. Subtypes include Hot Summer Continental (Dfa, Dwa), Warm Summer Continental (Dfb, Dwb), and Subarctic (Dfc, Dfd, Dwc, Dwd) climates. Example: Siberia.
75 CHAPTER 5 | CLIMATIC ENVIRONMENTS
5. Polar (E): Extremely cold climates with long, very cold winters. Includes Tundra (ET) and Ice Cap (EF) climates. Example: Antarctica.
The Köppen system uses temperature and precipitation as the primary criteria for classification. It looks at the monthly averages and annual totals of these factors to determine the climate category This system helps in understanding the general climate patterns of a region.
The Köppen climate classification system is essential in various fields, including geography, meteorology, and environmental science It helps in understanding the climatic patterns and potential impacts of climate change on different regions. For instance, the system’s categorisation can assist in studying biodiversity, agricultural practices, and urban planning according to specific climate types.
CHECK YOUR UNDERSTANDING
Basic Knowledge
1. What are the five main climate types in the Köppen climate classification system?
2. Name the climate type classified under A in the Köppen system and its characteristic feature.
3. Identify the type of climate the Sahara Desert falls under according to the Köppen system. Developed Knowledge
1. Describe the typical characteristics of a Temperate (C) climate as classified in the Köppen system.
3. Discuss the conditions that characterise Continental (D) climates and provide an example of a region with this climate type. 3
2. Explain the difference between Desert (BW) and Steppe (BS) climates in the Dry (B) group of the Köppen system.
76 THE NATURAL WORLD – OPTION 9
Köppen climate classification system BSk DsdDwd Dfd Aw BSh Cwc CfcDsc Dwc Dfc Af BWhCsa Cwa CfaDsa Dwa Dfa ET Am BWkCsb Cwb Cfb Dsb DwbDfb EF
Figure 5.1
TOPIC 5.2: Tropical Rainforest Climate
GLOBAL DISTRIBUTION
Tropical rainforest climates can be characterised by their lush vegetation, high humidity, and abundant rainfall They are predominantly found near the equator, within the tropical zone, and are distributed across several continents, including South America, Central America, Africa, Southeast Asia, and Oceania.
The global distribution of tropical rainforests can be attributed to specific geographic and climatic factors. First, the positioning of rainforests near the equator allows for a more direct and intense exposure to sunlight throughout the year. This results in high temperatures, promoting rapid plant growth and photosynthesis.
Second, the abundant rainfall in these regions, often exceeding 2,000 millimetres annually, is critical for the thriving ecosystem. The warm, moist air rises near the equator, forming dense clouds that release copious amounts of rainfall over the rainforest areas. This continuous supply of water sustains the diverse array of plant and animal life found within the rainforest.
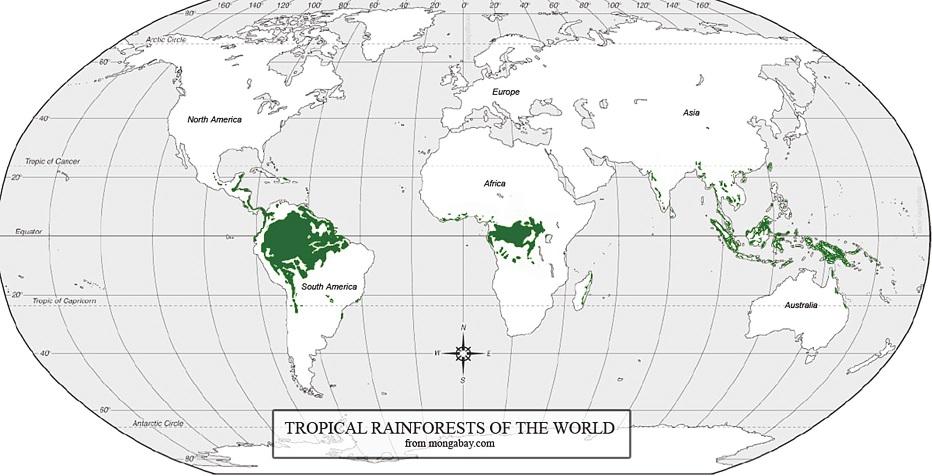
TEMPERATURE
The temperature in a tropical rainforest climate is characterised by high average temperatures, a narrow annual temperature range, a relatively small diurnal temperature range, and distinct differences between daytime and night-time temperatures.
On average, tropical rainforests experience high temperatures throughout the year The annual average temperature is between 25 and 28 degrees Celsius. This relatively constant warmth is due to the proximity of these regions to the equator, where they receive direct and intense sunlight year-round.
The annual temperature range in tropical rainforests is quite small compared to other climates. It typically ranges from only 3 to 5 degrees Celsius. This means that the temperature variation between the hottest and coldest months is relatively minimal.
The diurnal temperature range, which refers to the difference in temperature between day and night, is also smaller in tropical rainforests compared to other regions. Typically, the difference between daytime and night-time temperatures is around 6 to 8 degrees Celsius.
77 CHAPTER 5 | CLIMATIC ENVIRONMENTS
160° 80° 60° 60° 40° 40° 20° 20° 160° 140° 140° 120° 120° 100° 100° 80° North America South America Tropic of Capricorn Antarctic Circle Equator Tropic of Cancer Arctic Circle Europe Africa Australia Asia 80° 60° 60° 40° 40° 20° 20° 0° 80°
Figure 5.2
Tropical rainforest climates around the world
During the day, temperatures in tropical rainforests can soar to around 30 to 35 degrees Celsius. The dense canopy of trees provides ample shade, preventing excessive heating from direct sunlight. However, the high humidity in the rainforest can make the daytime temperatures feel even hotter
At night, temperatures in tropical rainforests drop to around 20 to 25 degrees Celsius The thick vegetation and moisture in the air help retain some of the heat from the daytime, preventing significant cooling during night-time
In the tropical rainforest climate, high temperatures are a result of direct sunlight, due to its geographic position close to the equator Because the tropical rainforest is located near the equator, it receives more direct sunlight compared to regions farther away.
When sunlight reaches the Earth’s surface, it carries heat energy. In the tropical rainforest, the sun’s rays hit the area at a near-vertical angle, which means the sunlight is concentrated over a smaller surface area This concentration of sunlight leads to greater heating of the land and the atmosphere. Consequently, the dense vegetation captures sunlight, and the moisture in the air traps heat, creating a warm and humid environment.
PRECIPITATION
Sunlight is more concentrated over a smaller area at the equator, which contributes to the high temperatures experienced in tropic rainforests.
In the tropical rainforest biome, precipitation plays a vital role in shaping the unique environment. This biome experiences high levels of rainfall throughout the year, with an average of over 200 rainy days annually The total amount of precipitation can reach 2,000 to 10,000 millimetres per year, making it one of the wettest biomes on Earth.
Precipitation in the tropical rainforest is influenced by several factors. First, the convergence of the north-east and south-east trade winds at the equator creates a zone of low pressure, known as the Intertropical Convergence Zone (ITCZ). This convergence results in the uplift of warm, moist air, leading to the formation of clouds and rainfall.
A wet season is a distinctive feature of the tropical rainforest climate. During the wet season, which can vary in duration across different regions, precipitation is abundant and occurs almost daily This is due to the intensified vertical air currents and the increased moisture content in the atmosphere. However, these regions receive high rainfall year-round with little to no dry season.
This can be attributed to the lush vegetation of the tropical rainforest. The vegetation also contributes to the high levels of precipitation through a process called transpiration Plants release water vapour into
Evapotranspiration = transpiration + evaporation
Figure 5.4
Evapotranspiration plays a significant role in the development of clouds and contributes to the significant rainfall experienced in the tropical rainforest biome.
78 THE NATURAL WORLD – OPTION 9
Sun’s rays Equator Atmosphere Earth Largearea A B Sun’s rays Sm all ar ea Long Distance Short Distance
Figure 5.3
Evaporation Groundwater recharge Transpiration Trees Grass Runoff
the air, adding moisture to the atmosphere. This process further enhances cloud formation and consequently increase the amount of rainfall received.
Furthermore, evapotranspiration plays a significant role in the water cycle of the tropical rainforest. This is the combined process of evaporation and transpiration, which occurs in the Earth’s water cycle. Evaporation is the conversion of liquid water into water vapour, primarily from surfaces such as oceans, lakes, and rivers. Transpiration, on the other hand, is the release of water vapour by plants through tiny openings called stomata on their leaves.
The abundant rainfall and high temperatures in tropical rainforest biomes create ideal conditions for water uptake by plants and subsequent release as vapour through transpiration. This process helps maintain the humid environment of the rainforest and contributes to cloud formation and precipitation.
HUMIDITY
Humidity is the amount of water vapour present in the air. In tropical rainforest climates, humidity levels are exceptionally high, often above 75 per cent, and can approach 100 per cent during certain periods. This high humidity is a result of the intense solar heating at the equator, which leads to significant evaporation and transpiration (water release by plants), saturating the air with moisture.
The consistent warmth, with temperatures averaging 18°C to 28°C, and the high solar radiation throughout the year contribute to the high humidity Furthermore, these regions experience substantial and regular rainfall, often exceeding 2,000 mm annually, which maintains the saturated air conditions. The frequent and heavy downpours, typically occurring in the afternoon, replenish the moisture in the atmosphere, sustaining the high humidity levels.
The humidity in tropical rainforests creates a natural greenhouse effect. The dense canopy of the rainforest traps the moisture and warm air, leading to a steamy and humid environment within the forest. This condition is crucial for the diverse ecosystems in tropical rainforests, supporting a wide variety of plant and animal life.
CHECK YOUR UNDERSTANDING
Basic Knowledge
1. What is the average annual rainfall range in tropical rainforest climates?
2. Name the zone of low pressure created by the convergence of northeast and southeast trade winds near the equator.
3. How does the sunlight’s angle of incidence at the equator contribute to the high temperatures in tropical rainforests?
Developed Knowledge
1. Describe the role of transpiration in the tropical rainforest biome and its impact on precipitation.
2. Explain how the Intertropical Convergence Zone (ITCZ) influences rainfall in tropical rainforests.
3. Discuss the characteristics of the wet season in tropical rainforest climates and its impact on the environment.
Advanced Knowledge
1. Analyse how the process of evapotranspiration contributes to cloud formation and rainfall in the tropical rainforest biome.
2. Differentiate between the roles of evaporation and transpiration in the water cycle of tropical rainforests.
3. Investigate the relationship between high humidity levels and the greenhouse effect within the tropical rainforest ecosystem. 3
79 CHAPTER 5 | CLIMATIC ENVIRONMENTS
WRITE LIKE A GEOGRAPHER
1. Describe and account for the characteristics of one global climate type that you have studied.
Success criteria:
Your answer must:
• Describe the global distribution of tropical rainforests and the geographic and climatic factors contributing to their location near the equator.
• Explain the temperature characteristics of tropical rainforests.
• Detail the role of precipitation in tropical rainforests, including factors influencing rainfall such as the Intertropical Convergence Zone (ITCZ) and transpiration.
Your answer should:
• Discuss the impact of concentrated sunlight at the equator on the high temperatures experienced in tropical rainforests.
• Elaborate on the precipitation patterns, including the wet season and the year-round high rainfall, and the processes of evapotranspiration in maintaining the biome’s humidity.
• Describe the high humidity level in tropical rainforests, its causes, and its significance in creating a greenhouse effect that supports diverse ecosystems.
Your answer could:
• Explore the interrelationship between temperature, precipitation, and humidity in tropical rainforests.
• Analyse the ecological importance of tropical rainforests in terms of biodiversity and their role in the global climate system
TOPIC 5.3: Ice Ages
ICE AGES
An ice age is a prolonged period of time in Earth’s history when large parts of the surface are covered by ice sheets and glaciers. During an ice age, temperatures globally are cooler, leading to the expansion of ice cover beyond polar regions. These periods are characterised by the presence of extensive ice sheets in the northern and southern hemispheres.
The onset of an ice age is influenced by several factors, including changes in Earth’s orbit and tilt (Milankovitch cycles), variations in solar radiation, atmospheric composition (especially levels of greenhouse gases such as carbon dioxide), and tectonic plate movements. These factors combine to reduce the Earth’s average temperature, leading to the growth of ice sheets.
A well-known example of an ice age is the Pleistocene Ice Age, which began around 2.6 million years ago and lasted until about 11,700 years ago. During this time, large parts of North America, Europe and Asia were covered by massive ice sheets
Between ice ages, Earth experiences interglacial periods, where temperatures are warmer, ice sheets retreat, and sea levels rise. The current period, known as the Holocene, is an interglacial period that started at the end of the Pleistocene.
80 THE NATURAL WORLD – OPTION 9
MILANKOVITCH CYCLES
Milankovitch cycles are long-term changes in Earth’s orbit and orientation that affect the planet’s climate over thousands of years. Named after Serbian astrophysicist Milutin Milanković, who developed the theory in the early twentieth century, these cycles are key factors in understanding the timing and occurrence of ice ages.
Figure 5.5
The three components of Milankovitch cycles
Components of Milankovitch cycles
1. Eccentricity: This refers to changes in the shape of Earth’s orbit around the sun, ranging from more circular to more elliptical over a cycle of about 100,000 years An elliptical orbit leads to variations in the distance between the Earth and the sun, affecting the amount of solar energy the Earth receives.
2. Axial tilt (obliquity): The angle of Earth’s axis relative to its orbit around the sun changes over a cycle of about 41,000 years. A greater tilt means more significant seasonal contrasts, with warmer summers and colder winters.
3. Precession: This is the wobble in Earth’s rotation on its axis, with a cycle of about 26,000 years Precession alters the timing of the seasons in relation to Earth’s position in its orbit around the sun
Milankovitch cycles play a crucial role in initiating and ending ice ages by influencing the distribution and intensity of solar energy received at different latitudes. When these cycles align to reduce summer solar radiation in the polar and higher latitudes, snow and ice can accumulate as temperatures are too low to completely melt the winter snow. This accumulation leads to the growth of ice sheets, contributing to the onset of an ice age.
Conversely, when the cycles align to increase summer solar radiation in these regions, it can lead to significant melting of ice sheets, signalling the end of an ice age.
EXAMPLES AND EVIDENCE
The Pleistocene Ice Age, which encompassed multiple glacial and interglacial periods over the past 2.6 million years, is a prominent example. Studies of geological records, such as ice cores and ocean sediments, have shown a correlation between changes in Earth’s orbit and tilt and the timing of these glacial cycles.
81 CHAPTER 5 | CLIMATIC ENVIRONMENTS
The
The
The 100,000-year stretch Earth Earth Today S S Current tilt 23.5° N Earth’s more circular orbit (glacial) Minimum tilt (glacial) 22° 20,000 years ago Earth’s elliptical orbit (interglacial) Maximum tilt (interglacial) 24.5° N Sun Sun Sun
40,000-year tilt
20,000-year wobble
CHECK YOUR UNDERSTANDING
Basic Knowledge
1. What is an ice age?
2. Name the three components of Milankovitch cycles.
3. Define eccentricity as it relates to Milankovitch cycles.
Developed Knowledge
1. Describe how axial tilt (obliquity) affects Earth’s climate over a cycle of about 41,000 years.
2. Explain the role of Milankovitch cycles in initiating and ending ice ages.
3. Discuss the evidence found in geological records, such as ice cores and ocean sediments, that supports the theory of Milankovitch cycles.
Advanced Knowledge
1. Analyse the combined impact of eccentricity, axial tilt, and precession on Earth’s long-term climate changes.
2. Investigate how variations in solar radiation due to Milankovitch cycles correlate with the glacial and interglacial periods of the Pleistocene Ice Age.
TOPIC 5.4: El Niño
EL NIÑO
El Niño is a significant short-term climatic event that occurs periodically, typically every two to seven years. It is characterised by the warming of ocean surface waters in the central and eastern tropical Pacific Ocean. El Niño is a key component of the El Niño Southern Oscillation (ENSO), which also includes its counterpart, La Niña.
This phenomenon has widespread impacts on global weather and climate patterns. During El Niño events, the usual upwelling of cold, nutrient-rich water in the eastern Pacific is reduced, leading to warmer ocean temperatures. This change in ocean temperature influences atmospheric circulation patterns, often resulting in significant alterations in precipitation and temperature regimes across many parts of the world.
CONDITIONS DURING THE ABSENCE OF EL NIÑO
In the absence of an El Niño event, the Pacific Ocean exhibits characteristic climatic conditions that are crucial to understanding the region’s weather patterns. These ‘normal’ conditions are part of a complex climatic system influencing global weather and climate.
82 THE NATURAL WORLD – OPTION 9
Normal conditions Thunderstorms Atmosphere Mean sea level Downwelling Trade winds blowing west Cold lower ocean Upwelling South America Drought Warm, moist rising air Dry, cold sinking air Strong surface current flowing west Warm upper ocean South-East Asia and North-East Australia
Conditions during the absence of El Niño
Figure 5.6
3
TRADE WINDS AND OCEAN CURRENTS
Under normal circumstances, the Pacific Ocean’s climate is significantly influenced by the trade winds These winds blow from east to west along the equator The strong trade winds drive the surface ocean currents, pushing warm water westwards towards Asia and Australia, and allowing cooler water to upwell along the coast of South America.
WESTERN PACIFIC WARM POOL
As a result of the westward movement of warm surface water, the western Pacific experiences higher sea surface temperatures, creating a region known as the Western Pacific Warm Pool. This area, near Indonesia and Australia, typically has some of the warmest ocean waters on Earth, contributing to high rainfall and humidity in these regions.
EASTERN PACIFIC COOLING
Conversely, along the coast of South America, particularly near Peru and Ecuador, the upwelling of cooler, nutrient-rich water from deeper in the ocean creates a cooler and drier climate This upwelling supports abundant marine life, making these waters some of the most productive fishing grounds in the world.
ATMOSPHERIC PRESSURE SYSTEMS
The normal pattern in the Pacific also involves a high-pressure system in the eastern Pacific and a low-pressure system in the western Pacific. This pressure gradient further reinforces the trade winds and maintains the stability of this climatic system.
IMPACT ON GLOBAL CLIMATE
These normal conditions in the Pacific Ocean play a crucial role in global climate. The heat and moisture from the Western Pacific Warm Pool influence atmospheric circulation patterns, affecting weather conditions far beyond the Pacific region, including North America and Africa.
CONDITIONS DURING EL NIÑO
Climate conditions under a El Niño event can be characterised by the warming of sea surface temperatures in the central and eastern equatorial Pacific. El Niño events typically occur at irregular intervals of two to seven years and can last for several months.
83 CHAPTER 5 | CLIMATIC ENVIRONMENTS
El Niño event Thunderstorms Atmosphere Mean sea level Downwelling Trade winds reverse direction Cold lower ocean Warm upper ocean Warm surface current reverses direction Upwelling South America Drought Warm, moist rising air Dry, cold sinking air South-East Asia and Australia
5.7 Conditions during a El Niño event
Figure
ALTERATION OF TRADE WINDS
One of the hallmark features of an El Niño event is the weakening or reversal of the trade winds in the Pacific. Normally, these winds blow from east to west, but during El Niño, they weaken or even start blowing from the opposite direction. This change disrupts the usual oceanic and atmospheric circulation patterns.
SEA-SURFACE TEMPERATURE CHANGES
During El Niño, the warm water that is typically found in the western Pacific spreads eastwards towards South America. This leads to an increase in sea-surface temperatures across the central and eastern Pacific. The shift in warm water affects the distribution of heat and moisture in the atmosphere, leading to significant changes in global weather patterns
IMPACT ON WEATHER AND CLIMATE
El Niño events have widespread impacts on global weather and climate:
• Increased precipitation: Regions along the coast of Peru and Ecuador, which typically experience dry conditions, can receive unusually high rainfall, which can lead to flooding.
• Droughts: Conversely, Southeast Asia and Australia, which are normally wet, can experience drought conditions
• Global influence: The effects of El Niño extend far beyond the Pacific, influencing weather patterns across the Americas, Africa, and even Europe.
EFFECTS ON MARINE ECOSYSTEMS
The warmer water temperatures and altered ocean currents during El Niño can have detrimental effects on marine ecosystems The usual upwelling of nutrient-rich waters along the South American coast is reduced, impacting fish populations and, consequently, the fishing industry
EFFECTS OF EL NIÑO ON THE EQUATORIAL PACIFIC
El Niño significantly affects the weather and ocean conditions in the equatorial Pacific. It is characterised by an unusual warming of surface ocean waters in the central and eastern tropical Pacific Ocean.
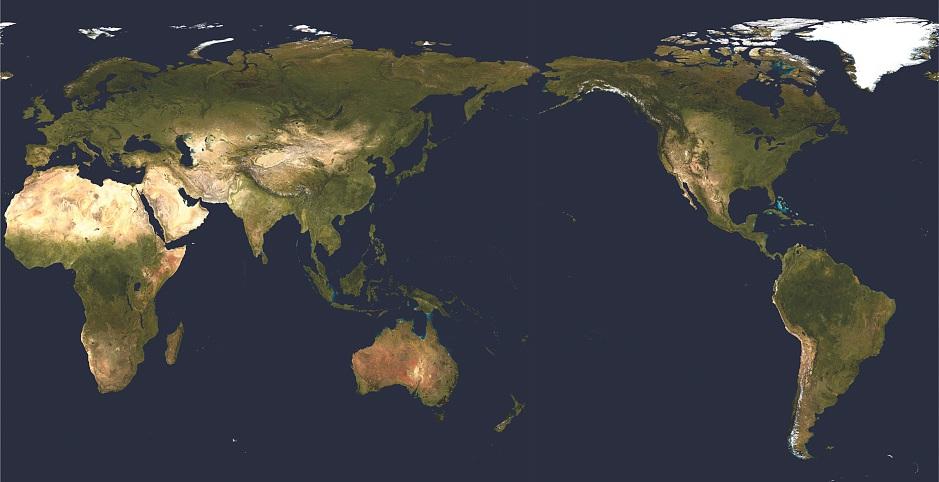
5.8
Generalised prediction of effects of El Niño on global weather patterns
84 THE NATURAL WORLD – OPTION 9
Wet Wet Wet Wet Warm Warm Warm Warm Warm Dry and Warm Dry Dry Dry and Warm Wet and Warm Wet and Cool -
Figure
During an El Niño event, the normal upwelling of cold, nutrient-rich water in the eastern Pacific weakens or reverses. This leads to an increase in sea surface temperatures, which can rise by as much as 2 to 3°C above normal The warm water expands eastward from the western Pacific, affecting a vast area.
El Niño’s primary effect in the equatorial Pacific is the disruption of typical weather patterns. This includes:
1. Increased rainfall: Regions that are typically dry, such as the western coast of South America, experience increased rainfall and even flooding. This can lead to significant ecological and societal impacts, including damage to infrastructure and impacts on agriculture
2. Drought conditions: Conversely, areas that are normally wet, particularly in the western Pacific such as Australia and Indonesia, often experience drier conditions. This can result in droughts, water shortages, and increased fire risk.
EFFECTS OF EL NIÑO ON GLOBAL WEATHER PATTERNS
El Niño also disrupts the normal climatic balance, leading to various weather extremes across the globe.
El Niño weakens the trade winds, altering the normal pattern of oceanic and atmospheric circulation. This change affects the distribution of heat and moisture in the atmosphere, triggering a cascade of global weather changes.
El Niño can affect the formation and intensity of tropical cyclones In the Atlantic Ocean, El Niño tends to suppress hurricane activity, while in the Pacific, it can lead to more frequent and intense cyclones.
During El Niño events, global temperatures tend to be higher. The redistribution of warm ocean water contributes to increased atmospheric temperatures, influencing heatwaves and overall global warming trends.
3
CHECK YOUR UNDERSTANDING
Basic Knowledge
1. What is El Niño and how often does it typically occur?
2. During a non-El Niño event, where is the Western Pacific Warm Pool typically located?
3. What is the primary effect of El Niño on the weather and ocean conditions in the equatorial Pacific?
Developed Knowledge
1. Describe how El Niño alters the normal pattern of trade winds in the Pacific Ocean.
2. Explain the impact of El Niño on marine ecosystems, particularly in the eastern Pacific.
3. Discuss the changes in sea surface temperature during an El Niño event and their global climatic implications.
Advanced Knowledge
1. Analyse the range of global weather changes triggered by El Niño, including its effect on tropical cyclone formation and intensity.
2. Differentiate between the impacts of El Niño on various global regions, such as increased rainfall in South America and drought conditions in Australia and Indonesia.
85 CHAPTER 5 | CLIMATIC ENVIRONMENTS
TOPIC 5.5: Climate Change
NATURAL CYCLES OF CLIMATE CHANGE
The Earth’s climate has undergone changes throughout its history, influenced by natural cycles. These changes have occurred over various timescales, from decades to millions of years, and are driven by different natural processes.
One of the key drivers of long-term climate changes are the Milankovitch cycles These are variations in the Earth’s orbit and tilt, affecting the amount and distribution of solar energy received by the Earth. There are three main components:
1. Eccentricity: The shape of Earth’s orbit around the sun, which changes from more circular to more elliptical on a cycle of about 100,000 years.
2. Axial tilt (obliquity): The angle of Earth’s axis in relation to its orbit around the sun, altering over a 41,000-year cycle.
3. Precession: The wobble in Earth’s rotation, with a cycle of about 26,000 years. These cycles influence the timing and severity of ice ages and interglacial periods, as seen in the Pleistocene Epoch – the last ice age.
Solar activity, including sunspots and solar radiation levels, will also impact climate change. The sun goes through cycles of higher and lower activity, typically over an 11-year cycle These changes can influence global temperatures, although their impact is generally less significant than other factors.
Volcanic eruptions can lead to short-term climate changes Large eruptions release significant amounts of volcanic ash and sulphur dioxide into the atmosphere, creating an aerosol layer that can reflect sunlight and cool the Earth’s surface. The 1815 eruption of Mount Tambora and the subsequent ‘Year Without a Summer’ in 1816 is a classic example.
HUMAN-INDUCED CLIMATE CHANGE
Human-induced climate change refers to the alteration of the Earth’s climate system primarily due to human activities, notably the burning of fossil fuels, deforestation, and industrial processes. This change is characterised by global warming, which is the long-term rise in the average temperature of the Earth’s climate system
GREENHOUSE EFFECT
The greenhouse effect is a natural process that warms the Earth’s surface. It occurs when the sun’s energy reaches the Earth’s atmosphere – some of this energy is reflected back to space and the rest is absorbed and re-radiated by greenhouse gases.
Greenhouse gases include water vapour, carbon dioxide (CO2), methane (CH4), nitrous oxide (N2O), and other gases. These gases act like a blanket, trapping heat in the atmosphere and keeping the Earth warm enough to sustain life. Without the greenhouse effect, the Earth’s average temperature would be about –18°C, compared to the current average of 15°C
THE NATURAL GREENHOUSE EFFECT
The natural greenhouse effect is a natural process that is critical to sustaining life on Earth. It involves the trapping of the sun’s warmth in the planet’s lower atmosphere, which helps to maintain the Earth’s average temperature.
Solar radiation reaches the Earth’s surface, where it is absorbed and then re-radiated upwards as infrared heat Greenhouse gases in the atmosphere, such as water vapour, carbon dioxide (CO2), methane (CH4), and nitrous oxide (N2O), trap some of this heat, preventing it from escaping back into space. This trapped heat warms the Earth’s surface and lower atmosphere.
86 THE NATURAL WORLD – OPTION 9
CONSEQUENCES OF THE ENHANCED GREENHOUSE EFFECT
1. Global warming: A rise in average global temperatures, leading to climate change.
2. Extreme weather events: Increased frequency and severity of extreme weather events such as hurricanes, floods and droughts.
3. Melting of ice caps and glaciers: Contributing to rising sea levels and loss of habitats.
4. Ocean acidification: Increased CO2 absorption by oceans, affecting marine life.
GLOBAL WARMING
Global warming refers to the long-term rise in Earth’s average surface temperature, primarily due to human activities that increase concentrations of greenhouse gases in the atmosphere. It is a direct consequence of the enhanced greenhouse effect, a human-driven intensification of the natural greenhouse effect.
According to the Intergovernmental Panel on Climate Change (IPCC), the global average surface temperature has increased by about 1.1°C since before the Industrial Era (1850–1900). The last decade (2011–2020) was the warmest on record, with 2020 being one of the three warmest years recorded. Levels of CO2 in the atmosphere are also unprecedented, surpassing 410 parts per million (ppm) in 2021, a significant increase from the pre-industrial levels of about 280 ppm.
5.10
Correlation between CO2 in the atmosphere and rising land/sea temperatures. Red bars show global average (land and sea) temperatures above the long-term average, and blue bars indicate temperatures below the long-term average. The black line shows the concentration of CO2 in the atmosphere.
IMPACTS OF GLOBAL WARMING
1. Melting of ice and snow: The increase in global temperature has led to the melting of glaciers and ice caps, contributing to rising sea levels. The Arctic Sea ice extent has been declining by about 13 per cent per decade since satellite records began in 1979.
2. Extreme weather events: There is an increased frequency and severity of extreme weather events such as heatwaves, hurricanes, and heavy rainfall. The number of record-breaking rainfall events globally has increased significantly in the last two decades.
88 THE NATURAL WORLD – OPTION 9
58.0 57.5 57.0 56.5 56.0 400 380 360 340 320 300 280 260 1880 1900 1920 1940 Year 1960 1980 2000 Global Temperature and Carbon Dioxide Gl obal te mper at ur e (°F) CO 2 , co nc en tr ati on (p pm ) CO
2 Concentration
Figure
3. Ecosystem disruptions: Rising temperatures are affecting ecosystems and biodiversity. Coral-bleaching events, driven by warmer ocean temperatures, have become more frequent and severe
4. Impact on human health and livelihoods: Global warming affects human health through extreme heat, exacerbated air pollution, and the increased spread of vector-borne diseases It also threatens livelihoods, particularly in vulnerable communities, through impacts on agriculture and water resources.
Separating Human and Natural Influences on Climate
Observations
Natural and Human Factors
Natural Factors Only
Figure 5.11
Climate models that account only for the effects of natural processes cannot explain the warming observed over the past century. Models that also account for the greenhouse gases emitted by humans can explain this warming.
EXTREME WEATHER EVENTS
Extreme weather events, such as heatwaves, heavy rainfall, hurricanes, and droughts, have become more frequent and intense as a result of the enhanced greenhouse effect.
The European heatwave of 2023 is a stark example. It was one of the hottest summers on record, resulting in over 61,672 deaths across Europe Studies indicate such heatwaves have become more likely due to climate change. Temperatures in Valencia in Spain soared to a record 46.8°C
Heat-attributable deaths per million, summer 2022
Figure 5.12
The human impact of increasing global temperatures and increased severity of extreme weather events can have detrimental effects, even for the developed economies of Europe.
89 CHAPTER 5 | CLIMATIC ENVIRONMENTS
1900 2.0 1.5 1.0 0.5 0 –0.5 –1.0 1920 1940 Year 1960 1980 2000 Gl obal Te mper at ur e Cha ng e (°F)
Italy 050100 150 200 250 Greece Spain Portugal Bulgaria Croatia Malta Lithuania Estonia Romania Europe
The 2020 monsoon floods in South Asia affected over 17 million people and highlighted the intensity of increased rainfall. Similarly, Germany and Belgium faced devastating floods in July 2021, which was attributed to unusually heavy rainfalls, a phenomenon expected to become more common with climate change.
The 2017 Atlantic hurricane season was unusually severe, with hurricanes such as Irma and Maria causing widespread destruction Research indicates that the intensity and frequency of the strongest hurricanes have increased due to higher sea-surface temperatures
The enhanced greenhouse effect alters atmospheric conditions, influencing weather patterns. Warmer temperatures increase evaporation rates and the atmosphere’s capacity to hold moisture, leading to more intense rainfall and increased flooding risk. Conversely, in some regions, these changes disrupt normal weather patterns, leading to prolonged droughts. Warmer sea-surface temperatures fuel the intensity of tropical storms and hurricanes.
These extreme weather events have a global impact, affecting economies, ecosystems and communities. They pose challenges to agriculture, infrastructure and human health. The economic costs of extreme weather events are substantial, with billions spent annually on recovery and adaptation efforts.
MELTING OF ICE CAPS AND GLACIERS
The melting of ice caps and glaciers globally is a direct and alarming consequence of the enhanced greenhouse effect. This phenomenon, primarily driven by human activities that increase greenhouse gases in the atmosphere, leads to global warming, which in turn causes the ice in polar and mountainous regions to melt at unprecedented rates.
According to the National Snow and Ice Data Centre (NSIDC), the extent of Arctic sea ice has been declining at a rate of about 13 per cent per decade since 1979. The summer ice coverage in the Arctic has reached its lowest in recent years, with 2020 being one of the years with the smallest recorded ice extent.
The Antarctic ice sheet has lost over 3,000 gigatons of ice since 1992, with the rate of loss increasing over time. This loss contributes significantly to global sea-level rise. Additionally, glaciers worldwide, from the Himalayas to the Andes, are retreating at an accelerated pace. It is estimated that the average thickness loss of glaciers worldwide has been about 1 metre per year over the last few decades.
The melting of ice caps and glaciers contributes to rising sea levels, posing a threat to coastal communities.
The Intergovernmental Panel on Climate Change (IPCC) estimates that global sea levels could rise by 0.6 to 1 metre by 2100 if current trends continue. This rise can lead to increased coastal flooding, erosion, and can impact freshwater systems and ecosystems.
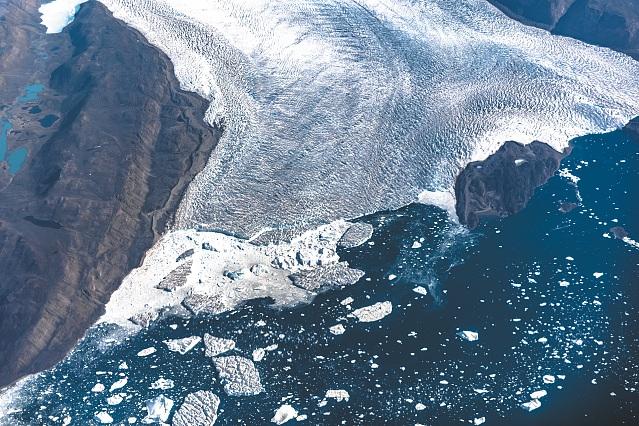
90 THE NATURAL WORLD – OPTION 9
Figure 5.13
Aerial view of icebergs and ice sheet in Baffin Bay near Pituffik, Greenland
CHECK YOUR UNDERSTANDING
Basic Knowledge
1. What are the three main components of the Milankovitch cycles?
2. Define the greenhouse effect and its importance for life on Earth.
3. What is the primary cause of the enhanced greenhouse effect?
Developed Knowledge
1. Describe how changes in Earth’s orbit and tilt, as part of the Milankovitch cycles, influence long-term climate changes.
2. Explain the differences between the natural greenhouse effect and the human-enhanced greenhouse effect.
3. Discuss the impacts of large volcanic eruptions on short-term climate changes.
Advanced Knowledge
1. Differentiate between the consequences of natural and human-induced climate changes on global weather patterns and ecosystems.
2. Investigate the potential impacts of continued global warming and the enhanced greenhouse effect on future climate scenarios, including sea level rise and extreme weather events.
PAST EXAM PAPER QUESTIONS
HIGHER LEVEL
2022
‘Climate characteristics change over space and time.’
Discuss.
2021
(80 marks)
Describe and account for the characteristics of one global climate type that you have studied.
(80 marks)
91 CHAPTER 5 | CLIMATIC ENVIRONMENTS
3
CLIMATE CHARACTERISTICS AND ECONOMIC DEVELOPMENT

KNOWLEDGE RETRIEVAL
Retrieval Quiz
1. What is the average annual rainfall range in tropical rainforest climates?
2. Name the zone of low pressure created by the convergence of northeast and southeast trade winds near the equator.
3. How does the sunlight’s angle of incidence at the equator contribute to the high temperatures in tropical rainforests?
4. During a non-El Niño event, where is the Western Pacific Warm Pool typically located?
5. What is the primary effect of El Niño on the weather and ocean conditions in the equatorial Pacific?
92
CHAPTER 06
9.6
CHARACTERISTICS
AN
SYLLABUS LINK
CLIMATE
HAVE
INFLUENCE ON ECONOMIC DEVELOPMENT
LEARNING INTENTIONS
1. Discuss the influence of climate on agriculture with reference to the development of Ireland’s agricultural economy.
2. Explain the impact of drought and desertification on economic development with reference to the Sahel.
3. Outline the influence of climatic conditions on rainfall and domestic water supply in Ireland.
4. Describe the impact of climate on tourism with reference to the tourism economy of Spain.
KEYWORDS
TemperatureRainfallClimate changeSoil fertility
Cool temperate oceanic climate Drought
Wind patterns
Desertification Sahel
AgricultureSocio-economic consequences
Spain Mediterranean climate influence
Adaptation strategies
Seasonal tourism
Irish Water
Economic impact
TOPIC 6.1: Influence of Climate on Agriculture
CLIMATE AND AGRICULTURE
Agriculture is intrinsically linked to climate. The characteristics of a region’s climate, including temperature, rainfall and seasonal patterns, are crucial determinants of agricultural productivity, crop selection and farming practices.
Temperature significantly influences agriculture. Each crop has a specific temperature range for optimal growth. For example, wheat thrives in temperate climates, while crops such as rice prefer warmer, tropical conditions. Extreme temperatures, either too hot or too cold, can impair crop growth, reduce yields, or even result in total crop failure
Rainfall patterns dictate water availability for crops. Adequate and well-distributed rainfall during the growing season can ensure healthy crop growth without the need for additional irrigation. Conversely, regions with low or erratic rainfall, such as semi-arid or arid zones, often rely heavily on irrigation systems. Excessive rainfall can lead to flooding, which can damage crops and erode soils.
The length and timing of growing seasons are largely dependent on climate. In regions with distinct seasons, such as temperate zones, the growing season is limited to the warmer months. In contrast, tropical climates can support multiple growing seasons or year-round agriculture due to their consistent temperatures and prolonged daylight hours.
Climate change is altering temperature and precipitation patterns, affecting agricultural zones. Farmers are adapting by shifting planting dates, selecting climate-resilient crop varieties, and employing new farming techniques. For instance, in regions experiencing increased droughts, drought-tolerant crops and water-saving irrigation technologies are being adopted.
Soil fertility, closely related to climate, is another critical factor. For example, tropical climates often have highly weathered soils with low nutrient content, requiring careful soil management and fertilisation strategies. In contrast, temperate climates often have richer soils, benefiting from the decomposition of organic matter in cooler conditions.
CHAPTER 6 | CLIMATE CHARACTERISTICS AND ECONOMIC DEVELOPMENT 93
CASE STUDY: The Impact of
Climate on Ireland’s
Agriculture
Ireland experiences a cool temperature oceanic climate as it is located in the mid-latitudes between 40° and 60° on the western outskirts of Europe The main influence on Ireland’s climate is the Atlantic Ocean As a result, the country does not experience the extremes of temperature that other countries located at these latitudes experience. The maritime influence on Ireland’s climate is felt mostly near the west coast and it decreases with distance towards the midlands. Additionally, the country’s mountainous terrain provides shelter from the strong Atlantic winds.
Figure 6.1
Ireland’s latitude has a significant impact on the climatic conditions experienced in the country.
TEMPERATURE
Ireland’s temperature characteristics are characterised by moderate temperatures experienced all year round. Winters in Ireland are generally mild. The average temperature in the coldest months, January and February, ranges from about 4°C to 7°C. Snow is uncommon, and frost occurs less frequently compared to other countries at similar latitudes.
Summers in Ireland are relatively cool, with average temperatures in July and August, the warmest months, ranging from 14°C to 18°C The country rarely experiences extremely high temperatures, making the climate comfortable during summer
There are slight regional variations in temperature across Ireland. The east and southeast tend to be slightly warmer in summer, influenced by the relatively warmer waters of the Irish Sea. The west and northwest, facing the Atlantic Ocean, experience milder winters and cooler summers due to the prevailing westerly winds.
THE NATURAL WORLD – OPTION 9 94
Antarctic Circle 60°S 30°S 0° 30°N 60°N 60°S 30°S 0° 30°N 60°N 150°W120°W90°W60°W30°W30°E60°E90°E120°E150°E180°E 0° 150°W120°W90°W60°W30°W30°E60°E90°E120°E150°E180°E 0°
IRELAND INDIAN
PACIFIC OCEAN PACIFIC OCEAN ATLANTIC OCEAN Tropic
Equator Tropic
Arctic
SOUTHERN OCEAN
OCEAN
of Capricorn
of Cancer ARCTIC OCEAN
Circle


Average air temperatures in Ireland in January (left) and July (right)
PRECIPITATION
Precipitation is distributed throughout the year in Ireland, with variations in the average between the summer and winter months. However, the west of Ireland receives significantly more rainfall than the rest of the country. This is due to the influence of mountainous relief that characterises the area. The mountainous terrain of the west of Ireland leads to the formation of relief rainfall, as the upland areas force air to cool when it rises over the high altitudes.
6.3
Average annual rainfall in Ireland
CHAPTER 6 | CLIMATE CHARACTERISTICS AND ECONOMIC DEVELOPMENT 95 5·5˚C 5˚C 5·5˚C 6˚C 6·5˚C 7˚C 7˚C 6·5˚C 6˚C 5·5˚C 4·5˚C 4˚C 4˚C 16˚C 14·5˚C 15˚C 15·5˚C 16˚C 15·5˚C 15˚C 14·5˚C
Figure 6.2
3,600 mm 2,800 2,400 2,000 1,600 1,400 1,200 1,000 800 600 0
Figure
SUNSHINE
Sunshine is measured to determine climate by calculating the number of hours of sunshine experienced per day. Ireland receives 1,000–1,600 hours of sunshine per year. However, these hours are spread out, with quite a difference between summer and winter. Average hours of sunshine are experienced differently across the country, as the southeast receives the most sunshine on average over the course of the year. Average summer sunshine in Ireland is approximately 5–7 hours a day. Average winter sunshine is 1–3.5 hours a day.
Figure 6.4
Average annual hours of sunshine in Ireland
ATMOSPHERIC PRESSURE
Ireland’s climate is significantly influenced by its atmospheric pressure patterns, which are primarily shaped by its location at the edge of the European continent and the nearby Atlantic Ocean. These pressure patterns are key in determining Ireland’s weather conditions. Ireland frequently experiences low-pressure systems, especially during the autumn and winter months. These systems, originating from the Atlantic Ocean, bring with them moist and unstable air. This results in Ireland’s well-known wet and windy conditions during these seasons. The passage of these systems can often lead to varied and unpredictable weather patterns.
Conversely, during spring and summer, high-pressure systems are more prevalent. These systems, known as anticyclones, bring more settled weather conditions, with less precipitation and more sunshine. However, since Ireland is a maritime climate, even during high-pressure systems, Ireland can experience cloud cover and mist, especially along coastal areas. Ireland’s position makes it prone to cyclonic activity, particularly in winter. These cyclones can lead to significant weather events, including strong winds and heavy rainfall.
THE NATURAL WORLD – OPTION 9 96
1,650 Hours 1,600 1,550 1,500 1,450 1,400 1,350 1,300 1,250 1,200 1,150 1,100 1,050 1,000
Figure 6.5
Seasonal variations in atmospheric pressure in Ireland. The isobars on the maps represent equal areas of atmospheric pressure. Isobars that are close together represent cloudy, windy weather, while isobars spaced further apart represent calm conditions with light winds.
IMPACT OF CLIMATE ON AGRICULTURE DEVELOPMENT
Ireland’s moderate temperatures, characterised by mild winters and relatively cool summers, create an ideal environment for certain types of agriculture. The absence of extreme cold or hot temperatures allows for year-round cultivation of various crops and supports pasture growth essential for livestock
1. Winter temperatures: The mild winters, with average temperatures ranging from 4°C to 7°C, reduce the need for extensive winter housing and feeding of livestock. This lowers operational costs for farmers.
2. Summer temperatures: The cool summer temperatures, averaging between 14°C and 18°C, are conducive to the growth of certain crops such as potatoes and barley, which prefer cooler growing conditions.
CHAPTER 6 | CLIMATE CHARACTERISTICS AND ECONOMIC DEVELOPMENT 97 1011.5 1012 1012.5 1013 1014.5 1013 1013.5 1014 1013.5 Spring Autumn 1010.5 1011 1011 1011.5 1012 1012.5 1013 1013.5 Winter 1015 1015.5 1016 1016.5 Summer
.
INFLUENCE OF PRECIPITATION ON FARMING PRACTICES
The distribution of precipitation throughout the year impacts agricultural activities. This is especially the case with the higher rainfall in the west because of relief rainfall.
1. Rainfall distribution: Consistent rainfall is beneficial for grass and fodder crops, which are vital for Ireland’s strong dairy and beef industries. However, excessive rainfall can pose challenges such as waterlogging and soil erosion.
2. Regional variations: The drier east and southeast regions of Ireland, with less rainfall, are more suited to arable farming, including the cultivation of wheat and other cereals.
SUNSHINE HOURS AND CROP YIELD
Sunshine duration, varying across regions, plays a significant role in photosynthesis and crop maturity
1. Summer sunshine: Approximately 5–7 hours of sunshine during summer enhances the growth period of crops and pasture, leading to higher yields
2. Winter sunshine: Lower sunshine hours in winter can affect the growth rate of winter crops and pasture.
ATMOSPHERIC PRESSURE AND WEATHER PATTERNS
The atmospheric pressure patterns, including frequent low-pressure systems and occasional highpressure systems, influence Ireland’s agricultural calendar.
1. Low-pressure systems: These bring wet and windy conditions, especially in autumn and winter, affecting soil preparation, planting and harvesting schedules.
2. High-pressure systems: More settled weather conditions during spring and summer aid in timely sowing and harvesting of crops and improve conditions for outdoor livestock rearing.
ECONOMIC IMPACT
Ireland’s agricultural sector plays a vital role in the nation’s economy. This is evident by its significant contribution to employment, GDP and exports. The country’s natural resources, climatic conditions, and agricultural practices have shaped a robust industry, primarily focused on livestock and dairy farming, alongside crop production.
CONTRIBUTION TO EMPLOYMENT AND GDP
Agriculture is a key employer in Ireland, particularly in rural areas. According to the Central Statistics Office (CSO), the agriculture sector, along with fishing and forestry, provided employment for about 112,000 people in 2023. This represents approximately 4.6 per cent of Ireland’s total workforce In terms of GDP, agriculture contributed around 1.08 per cent in 2022.
SIGNIFICANCE IN EXPORTS
Irish agriculture is heavily export-oriented. Bord Bia, the Irish Food Board, reported that agrifood exports exceeded €18.8 billion in 2022, accounting for a significant portion of Ireland’s total exports. Dairy products and beef are the leading export categories, benefiting from Ireland’s reputation for high-quality, sustainably produced food products.
DAIRY AND BEEF SECTORS
The dairy sector is particularly prominent in Ireland’s agricultural economy. In 2020 it contributed over €6.8 billion in exports, buoyed by strong international demand for Irish butter and cheese. Similarly, the beef sector plays a crucial role, contributing significantly to agricultural outputs and employing thousands in both farming and related industries.
THE NATURAL WORLD – OPTION 9 98
CROP PRODUCTION AND ECONOMIC DIVERSIFICATION
While livestock and dairy dominate, crop production, including cereals and potatoes, is also significant. The sector has seen growth in diversification, with an increase in horticulture and organic farming, driven by domestic and international demand for diverse and sustainable food products.
IMPACT ON RURAL COMMUNITIES
Agriculture is crucial for the socio-economic fabric of rural Ireland, providing not just employment but also supporting ancillary industries such as food processing, machinery and agri-services. Agriculture plays a key role in maintaining rural populations and preventing urban migration.
CHALLENGES AND FUTURE OUTLOOK
Despite its strengths, the agriculture sector faces challenges, including market volatility, Brexitrelated trade uncertainties, and environmental concerns. Climate change poses a significant risk, with potential impacts on yields and the need for adaptive agricultural practices. However, opportunities exist in expanding into new markets, developing sustainable farming practices, and leveraging technology for efficiency and environmental protection.
Financial and Insurance Activities Information and Communication Agriculture, Forestry and Fishing
Figure 6.6
Comparing the agricultural economy of Ireland’s contribution to GDP with other sectors
CHECK YOUR UNDERSTANDING
Basic Knowledge
1. What is the main influence on Ireland’s climate?
2. State the average temperature range during winter in Ireland.
3. Name two primary sectors in Ireland’s agricultural economy. Developed Knowledge
1. Describe how Ireland’s climate impacts the growth of pasture and fodder crops.
2. Explain the challenges faced by Irish farmers due to the regional variations in rainfall.
3. Discuss the significance of the dairy sector in Ireland’s agricultural economy. Advanced Knowledge
1. Analyse the economic impact of Ireland’s agricultural sector on its GDP and employment.
2. Differentiate between the agricultural practices and crop selections in the west and east of Ireland, based on climatic conditions.
3. Investigate how climate change might affect agricultural practices in Ireland in the future, considering the current climatic conditions and farming techniques.
CHAPTER 6 | CLIMATE CHARACTERISTICS AND ECONOMIC DEVELOPMENT 99
€ billion 05 10 15 20 25 30 35 40 45 50 55 60 65 70 75 80
3
WRITE LIKE A GEOGRAPHER
1. ‘Climate characteristics have an influence on economic development.’ Discuss this statement with reference to agriculture in Ireland.
Success criteria:
Your answer must:
• Describe the intrinsic link between climate and agriculture.
• Explain the influence of Ireland’s cool temperature oceanic climate on agricultural activities.
• Discuss the economic impact of agriculture in Ireland.
Your answer should:
• Elaborate on the regional temperature variations across Ireland and their influence on different types of farming practices.
• Analyse the impact of precipitation patterns, especially relief rainfall in the west and its effects on grass and fodder crops, and the challenges posed by excessive rainfall.
• Describe the role of atmospheric pressure patterns in shaping Ireland’s agricultural calendar.
Your answer could:
• Explore the challenges and opportunities faced by the Irish agricultural sector, including market volatility, Brexit-related trade uncertainties, and the impact of climate change on farming practices.
TOPIC 6.2: The Impact of Drought and Desertification
Drought and desertification can have significant impacts on the climatic characteristics of a region and can therefore impact economic development
Drought is a prolonged period of abnormally low rainfall, leading to a shortage of water. It is not merely a physical phenomenon but also relates to the demand and supply of water resources. Droughts can vary in duration and spatial extent and are often classified into three types:
1. Meteorological drought: Occurs when a region experiences a period of below-normal precipitation
2. Agricultural drought: Happens when there is insufficient moisture for average crop or range production
3. Hydrological drought: Arises when the water reserves available in sources such as aquifers, lakes and reservoirs fall below a statistical average.
Desertification refers to the process by which fertile land becomes desert, typically as a result of drought, deforestation or inappropriate agriculture. Unlike natural deserts, desertification is largely caused by human activities and climatic changes, such as overgrazing, over-cultivation, deforestation, and poor irrigation practices It leads to a persistent degradation of dryland ecosystems by variations in climate and human activities.
THE NATURAL WORLD – OPTION 9 100
CASE STUDY: Drought and Desertification in the Sahel
The Sahel is a distinct geographic region in Africa, characterised by its location as a transitional zone between the Sahara Desert to the north and the more fertile savannas and rainforests to the south. Stretching approximately 5,400 kilometres across the African continent, the Sahel covers parts of Senegal, Mauritania, Mali, Burkina Faso, Algeria, Niger, Nigeria, Chad, Sudan, South Sudan, Eritrea, Cameroon, and the Central African Republic
Ecologically, the Sahel is characterised by grasslands, scrublands and sparse trees, adapted to the region’s dry conditions. The vegetation is predominantly of the savanna type, suited to withstand drought and erratic rainfall. However, the region’s environment is fragile and susceptible to desertification due to climatic variations and human activities.
CHAPTER 6 | CLIMATE CHARACTERISTICS AND ECONOMIC DEVELOPMENT 101
MALI NIGER
ERITREA
ATLANTIC
INDIAN
ATLANTIC
BLACK SEA
SEA CASPIAN SEA RED SEA Sahel ALGERIA CAMEROON
MAURITANIA
CHAD SUDAN
SOUTH SUDAN NIGERIA BURKINA FASO SENEGAL
OCEAN
OCEAN
OCEAN
MEDITERRANEAN
Figure 6.7
Map of the Sahel
The Sahel holds significant socio-economic importance for the countries it spans. Agriculture, including both crop cultivation and livestock rearing, forms the backbone of the economy for many communities in the Sahel. However, the region faces numerous challenges such as poverty, political instability, and the impacts of climate change, which exacerbate food insecurity and the displacement of populations.
CLIMATE CHARACTERISTICS OF THE SAHEL
The Sahel, a semi-arid region that forms a transitional zone between the Sahara Desert to the north and more humid savannas to the south, exhibits unique climatic characteristics which are influenced by its geographical location and topography.
TEMPERATURE
The Sahel is characterised by high temperatures throughout the year. Average temperatures typically range from 25°C to 30°C but can reach higher during the hottest months. The region experiences a considerable range in diurnal temperature variation, with hot days and significantly cooler nights, especially in the dry season.
Figure 6.8
Climograph displaying average precipitation and temperature in the Sahel
RAINFALL
Rainfall in the Sahel is highly variable and is one of the defining characteristics of its climate. The region experiences a single rainy season each year, usually from June to September, with the amount of rainfall decreasing from south to north. Annual rainfall averages between 200 and 600 millimetres but can be highly unpredictable, with significant year-to-year variations. The region is prone to droughts, often resulting in severe water shortages.
DRY AND WET SEASONS
The Sahel undergoes distinct wet and dry seasons. The wet season is brief but crucial for agriculture, supporting the growth of grasslands and crops. Conversely, the dry season is longer, marked by hot, dry winds, and very little precipitation, contributing to the region’s arid conditions.
WIND PATTERNS
The Sahel’s climate is significantly influenced by wind patterns. The Harmattan, a dry and dusty north-easterly trade wind, blows from the Sahara Desert into the region, particularly during the dry season. This wind can carry large amounts of dust and sand, reducing air quality and visibility
THE NATURAL WORLD – OPTION 9 102
42 40 38 36 34 32 30 28 26 24 22 20 18 16 14 Te mp °C 150 100 50 0 Ra in fa ll (m m) JanFeb MarApr MayJun JulAug SepOct NovDec
Rainfall Min. Temp. Max. Temp.
Monthly climate averages for Sahel (Burkina Faso)
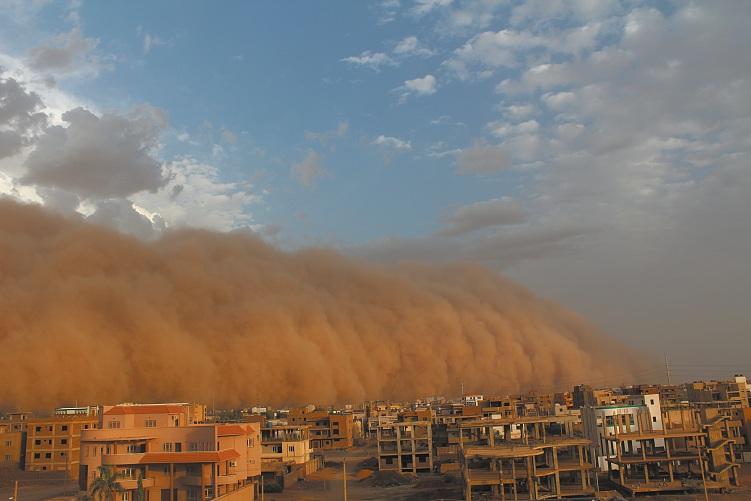
The Harmattan wind can increase fire risk and cause severe crop damage in the Sahel.
IMPACTS OF CLIMATE CHANGE ON THE SAHEL
Climate change has led to rising temperatures in the Sahel, which are increasing at a rate higher than the global average. According to the Intergovernmental Panel on Climate Change (IPCC), the region has experienced an increase in temperature of 0.5–1.5 °C over the last century This rise in temperature exacerbates evaporation, intensifies droughts, and disrupts traditional weather patterns.
VARIABLE RAINFALL AND DROUGHTS
One of the most critical impacts of climate change on the Sahel is the alteration in rainfall patterns. The region has seen an increase in the variability of rainfall, with longer dry spells interspersed with short periods of intense rain. The United Nations Environment Programme (UNEP) reports that the frequency and severity of droughts have increased over the past decades, leading to significant water scarcity, crop failures, and food insecurity Additionally, water resources have declined by nearly 40 per cent over the same period. In some parts of the Sahel, the water table is dropping by up to 2 metres per year, making it difficult for farmers to irrigate their crops. Moreover, it is estimated that the Sahel will experience a 10–20 per cent reduction in annual rainfall by 2070, which will further strain water resources and increase food insecurity in the region.
DESERTIFICATION
The Sahel is particularly vulnerable to desertification, a process exacerbated by climate change. Reduced and erratic rainfall, combined with higher temperatures, accelerates land degradation and the spread of the Sahara Desert. According to UNEP, about 80 per cent of the Sahel’s farmlands are degraded, affecting food production and the livelihoods of millions. Moreover, deforestation is also contributing to desertification, which is one of the major environmental challenges in the Sahel. The loss of vegetation cover and the exposure of bare soil to the wind and sun is causing the land to become dry and infertile, making it more difficult for farmers to grow crops and graze livestock. According to the United Nations, desertification affects over 45 per cent of the land in the Sahel, which is leading to food insecurity and poverty.
CHAPTER 6 | CLIMATE CHARACTERISTICS AND ECONOMIC DEVELOPMENT 103
Figure 6.9
VULNERABILITY
Figure 6.10
Areas at risk of desertification in Africa, Europe and the Middle East
AGRICULTURAL CHALLENGES
Agriculture, the backbone of the Sahel’s economy, is heavily impacted by climate change. Changes in temperature and precipitation patterns affect the growing seasons, crop yields, and the types of crops that can be cultivated. This has economic implications, as agriculture employs 60–80 per cent of the Sahel’s workforce
Additionally, overgrazing is significantly contributing to agricultural challenges in the region. Overgrazing occurs when too many animals are grazing on the same area of land, which leads to the depletion of vegetation and soil erosion. As the population in the Sahel has grown, the demand for livestock has also increased, which has put a strain on the region’s grazing lands. According to the Food and Agriculture Organisation of the United Nations (FAO), overgrazing is one of the main drivers of land degradation in the Sahel, along with deforestation and poor land management practices. It is estimated that up to 10 per cent of the soils in the Sahel are severely degraded due to overgrazing.
THE NATURAL WORLD – OPTION 9 104 Low Moderate High Very high Dry Cold Humid, not vulnerable
OTHER REGIONS
As more people in the Sahel rely on livestock for their livelihoods, the demand for grazing land has increased. However, the amount of grazing land available has not kept up with this demand, which has led to overgrazing. Additionally, as the population continues to grow, the pressure on resources such as water and food is also increasing, making it more difficult for farmers to provide enough food for their animals. This can lead to further overgrazing as animals are forced to graze in smaller areas. It is believed that 70 per cent of the Sahel’s rangelands are overgrazed, leading to a decline in the productivity of these lands.
SOCIO-ECONOMIC CONSEQUENCES
The impacts of climate change in the Sahel extend beyond environmental concerns. They contribute to socio-economic challenges, including poverty, migration, and conflicts over dwindling natural resources. The environmental changes that have occurred in the region have reduced the amount of arable land available for agriculture, which has been the primary livelihood for many people in the region. As a result, people have been forced to migrate to urban areas or neighbouring countries in search of better living conditions. According to the United Nations, the population of the Sahel region is projected to increase from the current estimated 135 million to over 340 million by 2050, with climate change being one of the factors contributing to this increase.
CASE STUDY: Rainfall and Domestic Water Supply in Ireland
Ireland benefits from its geographical location near the Atlantic Ocean in that it enjoys one of the highest water availability rates in Europe The country’s climate, characterised by heavy and welldistributed rainfall, ensures a plentiful supply of water for both domestic and industrial needs. Irish Water, the national water utility, distributes approximately 1.7 million litres of water per day to homes and businesses across the country. However, a significant challenge arises as almost half of this water is lost through leakages in the distribution system.
INFLUENCE OF ATLANTIC WEATHER SYSTEMS
The predominant influence on Ireland’s weather and, consequently, its rainfall patterns, comes from the Atlantic Ocean. Atlantic weather systems, along with prevailing westerly winds, significantly impact rainfall distribution, especially along the west coast When warm, moist air from the Atlantic encounters the mountainous regions of the west coast, the air rises and cools, leading to cloud formation and the resultant relief rain Met Éireann reports that the west coast experiences more than 200 wet days annually.
DEPRESSIONS AND FRONTAL RAINFALL
Depressions, or low-pressure weather systems, are a common occurrence over Ireland. Depressions are formed over the Atlantic when warm tropical air meets cold polar air. These depressions move across Ireland from west to east, bringing frontal rainfall along their warm and cold fronts This type of rainfall is prevalent over most of the country.
WATER SOURCES AND TREATMENT
More than 80 per cent of Ireland’s water supply is sourced from surface water, including rivers, lakes and reservoirs. This water is susceptible to contamination from various sources, necessitating treatment to make it fit for human consumption. The remainder of the drinking water is sourced from groundwater, which generally requires less treatment due to its higher quality.
CHAPTER 6 | CLIMATE CHARACTERISTICS AND ECONOMIC DEVELOPMENT 105
Figure 6.11
Blessington Lakes in Co Wicklow is an artificial lake/reservoir that supplies water to Wicklow and Dublin. On the reservoir, the Poulaphouca Dam generates hydroelectric power.
GROUNDWATER SOURCES AND RURAL RELIANCE
Rainwater percolates into the ground, replenishing groundwater sources which eventually feed into rivers, emerge as springs, or are extracted through wells. Rural communities and group water schemes often rely more on these groundwater sources.
IMBALANCE IN RAINFALL DISTRIBUTION AND DEMAND
While Ireland receives sufficient rainfall to meet its population’s needs, there is an imbalance between the distribution of rainfall and the demand for water The west of Ireland is considerably wetter than the east; however, the eastern part, including the Greater Dublin Area, is more densely populated This mismatch leads to occasional water shortages in eastern regions, a situation that is expected to worsen in the future
RAINFALL TRENDS AND CLIMATE CHANGE
Recent decades have seen a shift in rainfall patterns in Ireland. The west and northwest have experienced an approximate 5 per cent increase in rainfall, while the east and southeast have seen a decrease by a similar amount. Predictions for the next 20 to 30 years suggest wetter winters in the west and north, with drier summers in the south and east.
FUTURE CHALLENGES AND WATER MANAGEMENT
The expected rise in Ireland’s population and economic growth will increase water demand, particularly in a context where water may become scarcer due to changing rainfall patterns. These challenges necessitate strategic water management. Irish Water is tasked with finding new water sources for the Eastern and Midlands region, highlighting the importance of sustainable water resource management in the face of climate change and population growth.
THE NATURAL WORLD – OPTION 9 106
3
The highest decile* accounted for: (*10% of metered households) of total domestic metered public water consumption in 2021
Figure 6.12
823,739 public water supply meters in 2021
The CSO publishes data on economic, social and general activities in Irish society. It generally gathers information every five years. This infographic displays information on Irish public water consumption.
CHECK YOUR UNDERSTANDING
Basic Knowledge
1. Define drought and name the three types of drought.
2. What is desertification, and how does it differ from natural deserts?
3. How does Ireland’s geographical location influence its rainfall patterns?
Developed Knowledge
1. Discuss the socio-economic consequences of climate change in the Sahel region.
2. Explain how the Atlantic weather systems and depressions contribute to Ireland’s rainfall.
3. Describe the impact of climate change on rainfall and water supply in Ireland, focusing on regional differences.
Advanced Knowledge
1. Analyse the challenges faced by the Sahel region due to variable rainfall and droughts, and how these affect agricultural practices.
2. Investigate the imbalance between rainfall distribution and water demand in Ireland, and its implications for future water management.
3. Consider the potential long-term effects of climate change on both the Sahel and Ireland, particularly in terms of water resources and agriculture
CHAPTER 6 | CLIMATE CHARACTERISTICS AND ECONOMIC DEVELOPMENT 107 An Phríomh-Oifig Staidrimh 34% Central Statistics Office Daily Water Domestic Metered Public Water Consumption 2021 AVERAGE Consumption in 2021 Daily Water MEDIAN Consumption in 2021 0 0 0 0 0 37 5L down 1%
2020 00000 280
down
from
L
1% from 2020
TOPIC 6.3: The Impact of Climate on Tourism CLIMATE
AND
TOURISM
The relationship between climate and tourism is a subject of increasing importance in the global context. Climate plays a crucial role in shaping the attractiveness of tourist destinations, influencing the choices of tourists, and impacting the sustainability of the tourism industry
Tourists often select destinations based on climatic conditions, seeking either warm, sunny climates for beach holidays or cold, snowy climates for winter sports For example, the Mediterranean region attracts millions of tourists annually due to its warm, dry summers. In contrast, mountainous regions such as the Alps draw winter sports enthusiasts due to their reliable snowfall.
The seasonal nature of tourism is closely tied to climate. Destinations often see peak tourist seasons aligned with favourable weather conditions. For instance, European summer resorts experience peak visitation in July and August, while ski resorts in North America and Europe see heightened activity in the winter months.
According to the UN’s World Tourism Organization (UNWTO), coastal and island destinations, which are highly climate-dependent, attract about 50 per cent of global tourists. Similarly, in 2019 the Alps hosted around 120 million overnight stays during the winter season, emphasising the importance of snowfall for winter tourism
Climate change poses a significant challenge to tourism Rising temperatures, changing precipitation patterns, and increased frequency of extreme weather events affect tourism destinations. For example, in the Mediterranean, increasing heatwaves and water shortages could reduce the region’s appeal. Ski resorts face challenges from reduced snowfall and shorter winter seasons, which is impacting destinations reliant on winter sports.
The economic implications of climate on tourism are substantial. Destinations that experience unfavourable climatic changes may see a decline in tourist arrivals, affecting local economies dependent on tourism revenue. Conversely, some regions might see an increase in tourism due to more favourable weather conditions, presenting opportunities for economic growth.
To mitigate climate impacts, tourism destinations are adopting adaptation strategies. These include diversifying tourism offerings, investing in sustainable tourism practices, and developing infrastructure resilient to climate change. For instance, ski resorts are investing in snowmaking technology and promoting summer tourism activities to counter reduced snow reliability.
CASE STUDY: The Impact of Climate on Tourism in Spain
Spain, characterised by its Mediterranean climate, stands as an example of how climate can drive tourism economies. The Mediterranean climate, characterised by hot, dry summers and mild, wet winters, has played a pivotal role in shaping Spain’s tourism sector, making it one of the most popular tourist destinations in the world.
THE NATURAL WORLD – OPTION 9 108
A
Coruña
Bilbao
San Sebastian
Pamplona
Zaragoza
Salamanca
Cordoba
Seville Granada
Málaga Cádiz
Figure 6.13
Spain’s tourism industry is mostly focused around coastal areas such as the Costa del Sol and Balearic Islands.
The warm and sunny climate is a major draw for tourists, especially those from cooler, northern European countries. Spain’s coastal regions, such as Costa Brava, Costa del Sol, and the Balearic Islands, are particularly famed for their summer climate, attracting millions seeking beach vacations. The predictability of the weather, with an average of 300 sunny days a year in some regions, ensures a steady flow of tourists.
Tourism is a vital component of Spain’s economy. According to the Spanish Statistical Office (INE), the sector contributed about 11.6 per cent to the country’s GDP in 2022, with over 100 million tourists visiting Spain that year The World Tourism Organisation (UNWTO) ranked Spain as the second most visited country in the world in 2022, highlighting the significant economic impact of tourism.
International tourist arrivals, thousands
International tourism inbound receipts (inbound US$, millions)
Travel and Tourism industry GDP, US$ million
Travel and Tourism industry share of GDP, % of total GDP
Travel and Tourism industry employment, 1,000 jobs
Travel and Tourism industry share of employment, % of total employment
Domestic Travel and Tourism spending, % of internal Travel and Tourism spending
Figure 6.14
Key indicators of Spain’s tourism economy
CHAPTER 6 | CLIMATE CHARACTERISTICS AND ECONOMIC DEVELOPMENT 109
Barcelona Madrid
Valencia Palma de Mallorca Alicante
18,958 €108.63M €28.54M 2.2% 830 4.3% 63.2%
REVENUE GENERATION FROM COASTAL TOURISM
Coastal tourism, underpinned by the Mediterranean climate, generates substantial revenue. Resorts, hotels, restaurants and other tourism-related businesses thrive in these regions. The Balearic Islands, for example, see a significant portion of their income generated from tourism, with a noticeable spike in economic activity during the summer months.
EMPLOYMENT OPPORTUNITIES IN THE TOURISM SECTOR
The tourism sector is a major employer in Spain. Data from INE indicates that the industry provides employment to millions, both directly and indirectly. Seasonal employment, particularly in coastal areas, peaks during the summer months, offering numerous job opportunities in hospitality and service sectors. This was evident in 2022 as the branches of tourism in the economy generated more than 1.9 million jobs, which was 9.3 per cent of total employment
IMPACT ON LOCAL ECONOMIES AND BUSINESSES
Local economies in tourist-heavy regions are heavily reliant on the influx of tourists. Businesses ranging from local handicrafts to transportation services benefit from the spending of tourists. The Mediterranean climate also supports outdoor dining and nightlife, adding to the tourist appeal and economic activity.
Figure 6.15
Overview of the Spanish tourism economy’s performance on the Travel and Tourism Development Index. This index ranks the performance of countries in different areas of the tourism economy. In 2019, Spain ranked as the number 1 tourism economy in the world. Following the COVID-19 pandemic, it has since dropped to number 3.
THE NATURAL WORLD – OPTION 9 110
Spain Performance Overview International openness 43rd 8th 27th 41st 32nd 16th 64th 3.9 5.9 5.8 4.9 6.2 6.1 4.5 Prioritisation of travel and tourism ICT readiness 9 Human resources and labour market Health and hygiene Safety and security Business environment Price competitiveness Environmental sustainability Air transport infrastructure Ground and port infrastructure Tourist service infrastructure Natural resources Cultural resources and business travel 5.0 4.7 5.0 5.2 6.6 4.8 6.7 101st 25th 10th 12th 3rd 9th 3rd 765 4321 5.4 Overall Score Rank 1st/140 12 34 56 7
CHALLENGES POSED BY OVER-TOURISM
The popularity of these destinations, partly due to their favourable climate, has led to challenges of over-tourism. This has resulted in environmental degradation, pressure on infrastructure, and a rise in living costs for locals. Balancing the economic benefits with sustainable tourism practices has become a key concern.
CLIMATE CHANGE AND FUTURE IMPLICATIONS
Spain’s tourism economy faces potential shifts due to climate change. The changes in temperature, precipitation patterns, and the frequency of extreme weather events could significantly affect the country’s attractiveness to tourists, thereby impacting its economy.
Climate change projections suggest an increase in average temperatures in Spain, which could result in excessively hot summers. This extreme heat may deter tourists from visiting during peak summer months, traditionally the high season for Spanish tourism. Coastal regions, famous for their beaches, might face reduced tourist influx due to uncomfortably high temperatures. This could lead to a decline in revenue from tourism.
Altered precipitation patterns could pose challenges to both summer and winter tourism. Reduced rainfall may lead to water shortages, affecting the appeal of coastal destinations, while unpredictable weather might impact outdoor tourist activities. Conversely, winter destinations such as ski resorts in the Pyrenees could face reduced snowfall, adversely affecting winter sports tourism and related economic activities.
The increased frequency of extreme weather events, such as heatwaves, storms and floods, poses a significant risk to tourism infrastructure. Damage to resorts, beaches and historical sites could incur substantial repair costs and lead to temporary declines in tourist arrivals, thus impacting the local economies reliant on tourism. According to Spain’s state meteorological agency (AEMET), the frequency of heatwaves in Spain has increased by 14 per cent over the past decade, with 2022 recording one of the highest numbers of heatwave days on record Additionally, a study by the European Drought Observatory found that Spain experienced severe drought conditions affecting over 20 per cent of its territory in 2021, marking an escalation in the intensity and duration of drought events. Conversely, the Spanish government has reported a 15 per cent increase in heavy rainfall events between 1980 and 2022, leading to more frequent and intense flooding incidents across the country.
The potential decline in tourism due to climate change could have wider socio-economic consequences. Regions heavily dependent on tourism might experience unemployment and reduced incomes, leading to economic instability. This could particularly impact areas where alternative employment opportunities are limited.
CHAPTER 6 | CLIMATE CHARACTERISTICS AND ECONOMIC DEVELOPMENT 111
CHECK YOUR UNDERSTANDING
Basic Knowledge
1. What are the main climatic factors that influence the destination choices of tourists?
2. Define over-tourism and its impact on local environments and communities.
3. How does the Mediterranean climate contribute to Spain’s popularity as a tourist destination?
Developed Knowledge
1. Discuss the economic implications of climate on Spain’s tourism industry.
2. Explain the seasonal nature of tourism and how it is affected by climatic conditions.
3. Describe the challenges and potential impacts of climate change on tourism in Spain.
Advanced Knowledge
1. Analyse the potential effects of altered precipitation patterns and increased temperatures on Spain’s coastal and winter tourism sectors.
2. Investigate the role of sustainable tourism practices in mitigating the impact of climate change on the tourism industry.
3. Consider the socio-economic consequences for regions in Spain that are heavily reliant on tourism, in the context of climate change and its impact on tourism patterns
PAST EXAM PAPER QUESTIONS
HIGHER LEVEL
2022
‘Climate characteristics have an influence on economic development.’
Discuss this statement with reference to each of the following:
• Agriculture
• Drought and desertification
• Tourism
2020
(80 marks)
Examine how climate characteristics influence economic development. (80 marks)
2012
Examine the impact of rainfall on agriculture and on domestic water supplies. (80 marks)
THE NATURAL WORLD – OPTION 9 112
3
