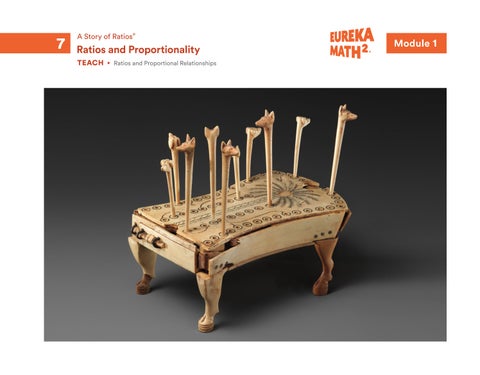
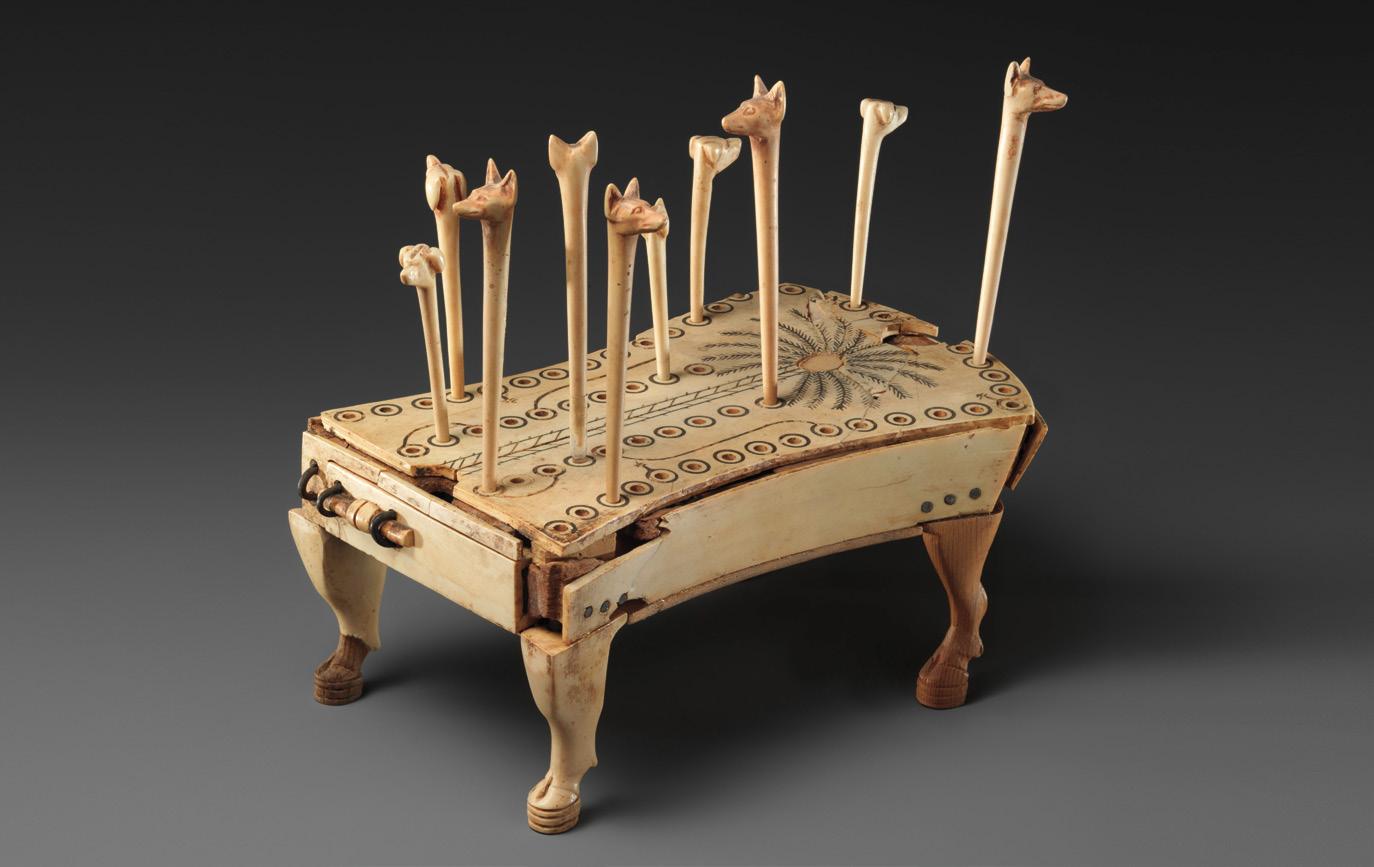
The ancient Egyptian game Hounds and Jackals, similar to the modern CHUTES AND LADDERS, is a game of chance in which the players race across the board by rolling “knucklebones” (like dice). When chance is described in mathematics, it is called probability, and it is measured with ratios to show how likely or unlikely an outcome might be. What is the probability of the hounds conquering the jackals?
On the cover
Game of Hounds and Jackals, ca. 1814–1805 BCE Egyptian Ebony, ivory
The Metropolitan Museum of Art, New York, NY, USA Game of Hounds and Jackals. Egyptian; Thebes, Lower Asasif, Birabi. Middle Kingdom, reign of Amenemhat IV, ca. 1814–1805
Students apply knowledge of multiplicative comparisons to understand ratio relationships. They represent the two values in a ratio as a quotient—known as the value of the ratio—and then use that value to determine rates and unit rates of ratio relationships. Throughout the coursework of grade 6, students apply ratio reasoning to work with percents, equations, graphs, geometry, and statistics. Grade 7 module 1 elevates the work of grade 6 by introducing the terms proportional relationships and scale factor.
Overview
Ratios and Proportional Relationships
Topic A
Understanding Proportional Relationships
Students apply ratio reasoning to recognize that sets of equivalent ratios represent proportional relationships. Students identify proportional relationships in tables, graphs, equations, and written descriptions.
Topic B
Working with Proportional Relationships
Students make connections among the different representations of proportional relationships from topic A to compare them in this topic. By exploring patterns, they come to understand when constant rates indicate proportional relationships. Students write equations to model constant rate situations and part-to-whole ratio relationships.
Topic C
Scale Drawings and Proportional Relationships
Students learn that the constant of proportionality goes by another name, scale factor, when applied to scale drawings. They interpret the scale factor as the constant that produces an enlargement of a figure when it is greater than 1 and a reduction when it is between 0 and 1. Students produce scale drawings by using the scale factor and then compare the area of a figure to the area of its scale drawing.
After This Module
Grade 7 Modules 3–5
Students apply their knowledge of proportional reasoning throughout grade 7. They apply proportional reasoning when working with equations in module 3, when constructing geometric shapes in module 4, and when working with percents in module 5.
Grade 8
Students’ proportional reasoning and experience with scale drawings supports their work in grade 8 as they discover slope, rate of change, similarity, and dilations.
A Sunday on La Grande Jatte, by Georges Seurat, 1884
Ratios and Proportional Relationships
6
Identifying Proportional Relationships in Written Descriptions
• Determine whether a written description represents a proportional relationship.
Understanding Proportional Relationships
Lesson 1
An Experiment with Ratios and Rates
• Compare different relationships in situations by using ratio and rate reasoning.
Lesson 2
Exploring Tables of Proportional Relationships
• Identify proportional relationships represented in tables by calculating constant unit rates.
Lesson 3
Identifying Proportional Relationships in Tables
• Analyze tables to identify proportional relationships.
• Determine the unit rate associated with a ratio of fractions by evaluating a complex fraction.
Lesson 4
Exploring Graphs of Proportional Relationships
• Identify proportional relationships represented as graphs.
• Interpret and make sense of the point (0, 0) in context.
Lesson 5
Analyzing Graphs of Proportional Relationships
• Analyze graphs or sets of ratios to determine whether they represent proportional relationships.
• Identify the point on a graph that best shows the constant of proportionality k and explain the meaning of the point in context.
88
Topic B
Working with Proportional Relationships
Lesson 7
Handstand Sprint
• Model a situation by using a proportional relationship to solve a problem.
Lesson 8
Relating Representations of Proportional Relationships
• Relate information among tables, graphs, equations, and situations to display a proportional relationship.
• Identify the constant of proportionality in different representations of a proportional relationship.
Lesson 9
Comparing Proportional Relationships
• Explain how to use the point (1, r) to find the unit rate of a proportional relationship.
• Relate the unit rate to the steepness of the line representing the proportional relationship by using the unit rate triangle with vertices (0, 0), (1, 0), and (1, r).
Lesson 10
Applying Proportional Reasoning
• Represent proportional relationships as equations.
• Solve problems by applying proportional reasoning.
Lesson 11
Constant Rates
• Represent rate problems as proportional relationships with equations.
• Solve rate problems.
Lesson
Lesson 12
Multi-Step Ratio Problems, Part 1
• Solve multi-step ratio problems by using proportional reasoning.
Lesson 13
Multi-Step Ratio Problems, Part 2
• Solve multi-step ratio problems by using proportional reasoning.
Topic C
Scale
Drawings and Proportional Relationships
Lesson 14
Extreme Bicycles
• Compare objects of different sizes by using proportional reasoning.
Lesson 15
Scale Drawings
• Determine one-to-one correspondence of points in related figures.
• Recognize that corresponding lengths in scale drawings are in a proportional relationship with a constant of proportionality called a scale factor.
Lesson 16
Using a Scale Factor
• Determine whether a scale factor produces an enlargement or a reduction.
• Create a scale drawing by using the proportional relationship that exists between corresponding distances.
Lesson 17
Finding Actual Distances from a Scale Drawing
• Find measurements of a figure when given a scale factor and either the scale drawing or the original figure.
Lesson 18 .
Relating Areas of Scale Drawings
298
Lesson 19 .
Scale and Scale Factor
• Describe the difference between a scale and a scale factor.
• Find unknown measurements in scale drawings through the appropriate use of scales and scale factors.
Lesson 20 .
Creating Multiple Scale Drawings
• Draw a scale drawing of another scale drawing by using a new scale factor.
• Write an equation for the proportional relationship relating scale drawings that have different scale factors, and use the equation to find unknown distances.
Resources
Standards
Achievement Descriptors: Proficiency Indicators
Acknowledgments
320
• Describe the area of a scale drawing with scale factor r as r2 times the area of the original figure.
Why Ratios and Proportional Relationships
I was expecting to see percent work in this module. Where is it addressed?
The curriculum reserves the application of proportional reasoning to percent problems until module 5, after work with equations is completed. The major emphasis of grade 7’s math standards is ratio and proportional reasoning. Because students apply proportional reasoning throughout their careers, strong foundational knowledge is essential. Module 1 focuses on conceptual understanding of proportional relationships. Students are introduced to the equation y = kx, where k is the constant of proportionality, as a representation of a proportional relationship in this module; work with equations is extended in module 3.
I notice students do not set up a proportion in this module. Is this intentional?
The traditional method of setting up a proportion obscures understanding of why the procedure works, and it often leads to misuse of the procedure, resulting in common errors in calculation. The connection between the values in the proportional relationship and the order in which quantities are placed in the traditional proportion is not usually made clear to students.
1. In this module, students extend work with unit rates and equations from grade 6 to represent proportional relationships with the equation y = kx. This representation allows students to determine the constant of proportionality and compare proportional relationships efficiently.
2. After ample practice representing proportional relationships with the equation y = kx in modules 1 and 3, students are introduced to the traditional proportion in module 3. In module 5, students consider the efficiency of the traditional proportion when working with percent problems. Students understand the connection between a visual model and the equation of the relationship, and they relate the placement of the values in that relationship to the placement of values in the traditional proportion.
Why does scale factor appear in this module when it is a geometry standard?
1. Scale drawings are introduced in this module because of their connection to proportional relationships. This way, students can see that the scale factor r in scale drawings is the same as the constant of proportionality k in proportional relationships.
2. An understanding of scale drawings is foundational to understanding dilations, similarity, and ultimately slope in grade 8. This module prepares students for work in grade 8 by reinforcing that all distances in a scale drawing must be in a proportional relationship to the corresponding distances in the original figure.
Achievement Descriptors (ADs) are standards-aligned descriptions that detail what students should know and be able to do based on the instruction. ADs are written by using portions of various standards to form a clear, concise description of the work covered in each module.
Each module has its own set of ADs, and the number of ADs varies by module. Taken together, the sets of module-level ADs describe what students should accomplish by the end of the year.
ADs and their proficiency indicators support teachers with interpreting student work on
• informal classroom observations,
• data from other lesson-embedded formative assessment,
• Exit Tickets,
• Topic Quizzes, and
• Module Assessments.
This module contains the eight ADs listed.
7.Mod1.AD1 Compute unit rates associated with ratios of fractions given within contexts.
7.Mod1.AD3 Identify the constant of proportionality in proportional relationships.
7.RP.A.2.b
7.Mod1.AD4 Represent proportional relationships given in contexts with equations.
7.RP.A.2.c
7.Mod1.AD5 Interpret the meaning of any point (x, y) on the graph of a proportional relationship in terms of the situation, including the points (0, 0) and (1, r), where r is the unit rate.
7.RP.A.2.d
7.Mod1.AD6 Solve multi-step ratio problems by using proportional relationships (not expressed as percentages).
7.Mod1.AD7 Reproduce a scale drawing at a different scale.
7.RP.A.3
7.G.A.1
7.Mod1.AD8 Solve problems involving scale drawings of geometric figures.
7.G.A.1
The first page of each lesson identifies the ADs aligned with that lesson. Each AD may have up to three indicators, each aligned to a proficiency category (i.e., Partially Proficient, Proficient, Highly Proficient). While every AD has an indicator to describe Proficient performance, only select ADs have an indicator for Partially Proficient and/or Highly Proficient performance.
An example of one of these ADs, along with its proficiency indicators, is shown here for reference. The complete set of this module’s ADs with proficiency indicators can be found in the Achievement Descriptors: Proficiency Indicators resource.
ADs have the following parts:
• AD Code: The code indicates the grade level and the module number and then lists the ADs in no particular order. For example, the first AD for grade 7 module 1 is coded as 7.Mod1.AD1.
• AD Language: The language is crafted from standards and concisely describes what will be assessed.
• AD Indicators: The indicators describe the precise expectations of the AD for the given proficiency category.
• Related Standard: This identifies the standard or parts of standards from the Common Core State Standards that the AD addresses.
AD Code Grade.Mod#.AD#
Language
7.Mod1.AD4 Represent proportional relationships given in contexts with equations.
RELATED CCSSM
7.RP.A.2.c Represent proportional relationships by equations. For example, if total cost t is proportional to the number n of items purchased at a constant price p, the relationship between the total cost and the number of items can be expressed as t = pn Partially Proficient
Identify which equation represents a proportional relationship given in context.
Marcus finds an old, empty piggy bank. He puts $0.75 into the piggy bank each week. Which equation represents the amount of money m in dollars in Marcus’s piggy bank after w weeks?
A. w = 0.75 ⋅ m
B. m = 0.75 w
C. w = m + 0.75
D. m = 0.75 + w
Proficient
Represent proportional relationships given in contexts with equations.
A streaming service rents digital movies for $3.99 each. Write an equation to represent the total cost c to rent d movies from the streaming service.
EUREKA MATH2 7 ▸ M1
AD
Topic A Understanding Proportional Relationships
In topic A, students are introduced to proportional relationships. They analyze proportionality across four types of representations: tables, graphs, equations, and written descriptions. Students build on their ratio and rate reasoning from grade 6, in a coherent progression within the topic.
Students further their understanding of rate by using familiar additive or multiplicative reasoning to determine unknown values in tables. Students learn how to identify a proportional relationship by computing unit rates for all pairs of ratios within a table, and then by noticing the unit rate is constant. The complexity increases from grade 6 to grade 7 when students compute the unit rate given a ratio of fractions. Students apply their understanding of unit rate within tables of proportional relationships to write equations that model those relationships.
Using their knowledge of graphing sets of ratios and coordinate pairs from grade 6, students graph proportional relationships. Students compare graphs of proportional relationships to those that are not proportional. In doing so, they identify a characteristic that is unique to proportional relationships represented in graphs: points appear to lie on a line that goes through the origin, (0, 0). As students become fluent in their ability to recognize proportionality in graphs, they focus on two key points, (0, 0) and (1, k), where k is the constant of proportionality. Students explain the meaning of these points as they relate to a context and begin identifying the constant of proportionality as the constant unit rate r.
Students synthesize their understanding of proportionality by creating written descriptions of proportional relationships presented to them in tables, graphs, and equations. The topic ends with students determining proportionality and identifying the constant of proportionality from written descriptions.
Students apply what they learn about proportional relationships in topic A to a variety of situations throughout the remainder of the module. In topic B, students identify the constant of proportionality in one representation to create another representation of the same proportional relationship. They also identify the unit rate triangle on graphs
of proportional relationships to compare their steepness. In topic C, students examine corresponding distances to determine whether figures are proportional, and they identify the scale factor as the constant of proportionality.
Progression of Lessons
Lesson 1 An Experiment with Ratios and Rates
Lesson 2 Exploring Tables of Proportional Relationships
Lesson 3 Identifying Proportional Relationships in Tables
Lesson 4 Exploring Graphs of Proportional Relationships
Lesson 5 Analyzing Graphs of Proportional Relationships
Lesson 6 Identifying Proportional Relationships in Written Descriptions
An Experiment with Ratios and Rates
Compare different relationships in situations by using ratio and rate reasoning.
1. Dylan folds 5 paper airplanes in 2.5 minutes. Do you think he folds 10 paper airplanes in 5 minutes? Explain your thinking.
I think Dylan folds approximately 10 paper airplanes in 5 minutes, but the total might vary. Dylan’s rate may not be constant over the 5 minutes.
Lesson at a Glance
In this lesson, students sort cubes based on color to model sorting coins by type. Students use additive and multiplicative reasoning to make predictions about rates and to complete tables of values related to the performance of coin-sorting machines. Students explore methods to compare rates at which the machines sort coins. Students look for corresponding values of quantities, extend tables to show the number of coins sorted in one second, and find the unit rate. They discuss how they know whether a coin-sorting machine is sorting at a constant rate when they are given values in a table.
2. For a STEM competition, students build machines that fold paper airplanes. Machine A folds 60 paper airplanes in 0.5 minutes. Machine B folds 400 paper airplanes in 4 minutes. Each machine folds paper airplanes at a constant rate.
a. How many paper airplanes does machine A fold in 5 minutes? Justify your solution.
60 05 120 =
Machine A folds 120 paper airplanes per minute.
1205600 ⋅=
Machine A folds 600 paper airplanes in 5 minutes.
b. Which machine folds paper airplanes at a faster rate, machine A or machine B? Explain how you know.
400 4 100 =
Machine B folds at a rate of 100 paper airplanes per minute.
In part (a), I found that machine A folds at a rate of 120 paper airplanes per minute. Therefore, machine A folds paper airplanes at a faster rate.
Key Questions
• How can we determine whether a relationship between two quantities has a constant rate?
• What strategies can we use to compare situations that have constant rates?
• What connections can we make between constant rate relationships and our knowledge of ratios?
Achievement Descriptors
7.Mod1.AD1 Compute unit rates associated with ratios of fractions given within contexts. (7.RP.A.1)
Student Edition: Grade 7, Module 1, Topic A, Lesson 1
Agenda
Fluency
Launch 10 min
Learn 25 min
• Machines Sorting Coins
• Finding the Unit Rate
Land 10 min
Materials
Teacher
• Computer or device*
• Projection device*
• Teach book*
Students
• Dry-erase marker*
• Learn book*
• Pencil*
• Personal whiteboard*
• Personal whiteboard eraser*
• Stopwatch or clock
• Interlocking cubes, 1 cm (1 set of approximately 50 cubes per student pair)
Lesson Preparation
• Prepare sets of about 50 interlocking cubes per student pair.
*These materials are only listed in lesson 1. Ready these materials for every lesson in this module.
Fluency
Divide Decimals
Students divide decimals to prepare for finding the unit rate.
Directions: Divide.
Teacher Note
Fluency activities are short sets of sequenced practice problems that students work on in the first 3–5 minutes of class. Administer a fluency activity as a bell ringer or adapt the activity as a teacher-led Whiteboard Exchange or choral response. Directions for these routines can be found in the Resources.
Launch
Students engage with a sorting activity to build an understanding of rate.
Play the Coin-Sorting Machines video. Then ask the following questions.
What do you notice about the video?
I notice the coins are sorted into stacks based on the type of coin.
I notice the timer showing how long the machine is sorting coins.
What do you wonder about the video?
I wonder how the machine can tell what type of coin it is sorting.
I wonder how long it would take to sort 150 coins.
Show students a pile of about 20 cubes.
Imagine that each color represents a different type of coin. How long do you predict it will take you to sort this pile of cubes by color? Why?
I predict it will take 20 seconds because I think I will be able to sort a cube every second and it looks like there are about 20 cubes in the pile.
What information could help you make an accurate prediction?
If I know how long it takes to sort 10 cubes and I know the number of cubes in the pile, I can make an accurate prediction about how long it will take to sort all the cubes.
Provide student pairs with approximately 50 cubes and a stopwatch. Have students choose one person to sort the cubes and one person to track time. Allow a few minutes for students to complete problem 1.
Teacher Note
The dialogue shown provides suggested questions and sample responses. To maximize every student’s participation, facilitate discussion by using tools and strategies that encourage student-to-student discourse. For example, make flexible use of the Talking Tool, turn and talk, think–pair–share, and the Always Sometimes Never routine.
UDL: Representation
Presenting the coin-sorting machine in a video format supports students in understanding the problem context by removing barriers associated with written and spoken language.
Teacher Note
If stopwatches are unavailable, students can use the second hand on a classroom clock, use a digital timer on an internet browser, or complete the sorting as a class with one stopwatch being used for all groups.
1. Use the provided cubes to complete parts (a)–(d).
a. Predict how many cubes you can sort by color in 10 seconds.
Sample: I predict I can sort 15 cubes in 10 seconds.
b. Time how many cubes you can sort by color in 10 seconds. Record the number of cubes.
Sample: 13 cubes
c. Predict how many cubes you can sort by color in 30 seconds.
Sample: I predict I can sort 39 cubes in 30 seconds.
d. Time how many cubes you can sort by color in 30 seconds. Record the number of cubes.
Sample: 23 cubes
After most students have finished, facilitate a class discussion about sorting predictions and actual rates by asking the following questions.
How did you predict the number of cubes you could sort in 30 seconds?
I multiplied the number of cubes I could sort in 10 seconds by 3 because 10 · 3 = 30.
Were your predictions accurate? Why do you think that is?
Sample:
My prediction for sorting in 10 seconds was accurate, but the prediction for 30 seconds was not. I think that’s because I got tired by the end of sorting, and I placed a cube in the wrong pile a few times.
My predictions were not accurate. I sorted fewer cubes than predicted in both situations. I think my predictions were higher than the actual cubes sorted because I took more time than I thought I would.
Imagine you were asked to sort cubes for 10 minutes. Do you think you would sort slower, faster, or at the same rate as you did for 30 seconds?
I think I would sort at a slower rate than I did for 30 seconds because 10 minutes is much longer than 30 seconds. I would probably slow down as the sorting continued.
Teacher Note
Gauge student understanding of ratios and rates from grade 6 and consider using the Launch discussion to also review these terms, if needed. Use the following questions to guide discourse.
• What is a rate? How is a rate related to a ratio?
• What are examples of rates in your everyday life?
• What was the rate in the coin-sorting situation?
• Were you sorting cubes at a constant rate? How do you know?
Do you think it is possible for humans to sort coins or cubes at a constant rate?
I think it would be difficult for humans to sort at a constant rate, especially for longer periods of time. For example, a person may get tired over time and sort cubes at a slower rate.
Today, we will explore how we can use constant rates to compare ratio relationships and we will calculate rates related to sorting machines.
25
Learn Machines Sorting Coins
Students develop an understanding of constant rates.
Provide students with the following assumption about how coin-sorting machines operate.
Unless otherwise noted, we can assume that coin-sorting machines sort coins at a constant rate. Is this a reasonable assumption? Why?
Yes. It is a machine, so it probably will not get tired or slow down.
Have students work in pairs to complete problems 2–5. Circulate as students work and listen for student thinking that demonstrates using additive and multiplicative reasoning to complete the tables.
Language Support
Consider using strategic, flexible grouping throughout the module based on students’ mathematical and English language proficiency. The following are grouping suggestions:
• Pair students who have different levels of mathematical proficiency.
• Pair students who have different levels of English language proficiency.
• Join pairs to form small groups of four.
As applicable, complement any of these groupings by pairing students who speak the same native language.
2. Use these rates to complete the tables for machine A and machine B.
• Machine A sorts 20 coins every 4 seconds.
• Machine B sorts 33 coins every 6 seconds.
3. Does machine A or machine B sort more coins in 10 seconds? Explain how you found your answer.
Machine B does because machine A sorts 50 coins in 10 seconds and machine B sorts 55 coins in 10 seconds. To find the number of coins sorted in 10 seconds for each machine, I multiplied the number of coins sorted in 2 seconds by 5. Machine A sorts 10 coins every 2 seconds, so it can sort 50 coins in 10 seconds. Machine B sorts 11 coins every 2 seconds, so it can sort 55 coins in 10 seconds.
Teacher Note
The tables are intentionally organized out of numeric order so that students can find ways other than only looking for patterns in the additive structure to determine unknown values. Consider highlighting the multiplicative relationship between the values in the ratio tables to help students recognize and use patterns to fill in blank rows.
4. Use these rates to complete the tables for machine C and machine D.
• Machine C sorts 36 coins every 8 seconds.
• Machine D sorts 9 coins every 1.5 seconds.
D
Teacher Note
When completing the table, students do not need to use unit rate as a strategy because it is addressed later in the lesson. Consider guiding students to notice that this is a ratio table and all the ratios are equivalent.
If students need support to complete the table, consider asking the following questions to scaffold student thinking for machine C:
• What is the multiplicative relationship between 8 and 2?
5. Does machine C or machine D sort more coins in 20 seconds? Explain how you found your answer.
Machine D sorts more coins in 20 seconds. I know machine C sorts 9 coins every 2 seconds, and at that constant rate the machine can sort 90 coins in 20 seconds because 10 · 9 = 90. Machine D can sort 60 coins every 10 seconds, so it can sort 120 coins in 20 seconds because 2 · 60 = 120.
• If it takes 8 seconds to sort 36 coins, how many coins could be sorted in 2 seconds? How do you know?
• How can you use the number of coins sorted in 2 seconds and the multiplicative relationship between 2 and 6 to determine how many coins could be sorted in 6 seconds?
Machine
After most students are finished, confirm student responses and engage in a discussion about determining and comparing constant rates.
Machine C sorts 36 coins every 8 seconds. How did you use the constant rate to complete the table for machine C?
First, I divided the number of coins and seconds by 4 to find how many coins can be sorted every 2 seconds. Then, I used the rate of 9 coins every 2 seconds to determine the number of coins for 6 seconds and 14 seconds. I multiplied 2 by 3 to get 6 seconds, so I multiplied 9 by 3 to get 27 coins sorted in 6 seconds. I multiplied 2 by 7 to get 14 seconds, so I multiplied 9 by 7 to get 63 coins sorted in 14 seconds. Lastly, I knew that 72 coins is double the amount of 36 coins, so if it takes 8 seconds to sort 36 coins, I could double 8 seconds to find that it takes 16 seconds to sort 72 coins.
How can you determine which machine sorts the most coins in 10 seconds?
I can multiply or divide the values in a row of the table to find the number of coins sorted by each machine in 10 seconds. For example, I know from the table that machine A sorts 10 coins in 2 seconds, so I can multiply by 5 to find that the machine will sort 50 coins in 10 seconds.
Which machine sorts the fastest? How do you know?
Machine D sorts the fastest. When I found the number of coins sorted every 10 seconds, machine D sorted the most coins.
Finding the Unit Rate
Students are reminded of the meaning of unit rate and use unit rate to determine unknown information.
Display the completed tables for machine C and machine D. Have students turn and talk about the following question.
How can you find the number of coins machine C and machine D each sort in 1 second?
For machine C, I divided 8 and 36 by 4 to find that for every 2 seconds there are 9 coins sorted. I can repeat the process and divide 2 and 9 by 2 to find that for every 1 second machine C sorts 4.5 coins.
For machine D, I can divide 60 by 10 to find that the machine sorts at a rate of 6 coins per second.
Promoting the Standards for Mathematical Practice
When students look for patterns while repeatedly calculating the unknown values for the number of coins sorted, time, and unit rate, they are looking for and expressing regularity in repeated reasoning (MP8).
Ask the following questions to promote MP8:
• What patterns did you notice when you were finding and using unit rate?
• Will these patterns always work?
• How can these patterns help you fill in the table more efficiently?
Have students recall that the unit rate is the numerical part of the rate when it is written so that the second of the two quantities is 1 unit. Connect this definition to the context of sorting machines by using the following questions.
What is the unit rate for machine C? 4.5
Fill in the unit rate in the table for machine C as the class comes to a consensus.
What does the unit rate mean in this situation?
This machine sorts 4.5 coins every second.
Why can it be helpful to know the unit rate when determining sorting rates for the machines?
If you know the unit rate, you can determine how many coins can be sorted in any amount of time if the sorting continues at a constant rate.
Direct students to complete problem 6 individually or in pairs.
6. Use the information in the table to determine the unit rate for each machine.
Display the table and invite a few students to share how they determined each unit rate. Show the unit rates in the table one machine at a time as students share their thinking. Have students confirm their answers and share their approach to finding unit rate with the following questions.
How did you find the unit rate for each machine?
I divided the number of coins sorted by the number of seconds. The quotient is the unit rate.
Can you always find the unit rate by dividing the number of coins by the number of seconds? Why?
Yes, that strategy will always work. When I divide the number of coins by the number of seconds, I am finding the number of coins that can be sorted in 1 second, which is the unit rate.
Invite students to examine the table in problem 7. Then ask them to share what they notice is different about this table compared to the previous table. Highlight responses that identify the difference that some of the unit rates are given and others are not.
Allow time for students to complete problem 7 in pairs. Circulate as students work. Advance their thinking by asking the following questions.
• How are you using multiplication or division to determine the unit rate?
• How can you use the unit rate to determine an unknown value in the table?
7. Complete the table.
When most students are finished, invite several students to share their thinking about how to find unknown values in the table when given the unit rate.
For some of the machines in problem 7, you were given the unit rate and had to determine either the number of coins sorted or the time in seconds. How did you use what you know about unit rates to solve for those unknown values? Give an example to support your thinking.
I know the unit rate in this situation represents the number of coins sorted per 1 second. That means to find the number of coins sorted, I can multiply the unit rate by the number of seconds spent sorting. To find the number of seconds, I can divide the number of coins sorted by the unit rate. For example, for machine X, the unit rate means the machine sorts 10 coins per 1 second. To calculate how many coins were sorted in 3.5 seconds, I multiplied 3.5 by 10 to get 35 coins.
Differentiation: Support
If students need support to begin problem 7, consider using the following questions to support reasoning about rates and determining the unit rate for machine U:
• What does the unit rate mean in this situation?
• What is the multiplicative relationship between 6 and 1?
• If it takes 6 seconds to sort 42 coins, how many coins could be sorted in 1 second? How do you know?
Once students have filled in the machine U row accurately, ask them to name other relationships they notice among values and how those relationships could be applied to other rows.
Machine V and machine W show different times and numbers of coins sorted in the table, but they have the same unit rate of 6. How is that possible?
Machine V and machine W have the same unit rate because the ratios of the number of seconds to the number of coins sorted are equivalent. In this situation, it means the machines sort at the same constant rate of 6 coins per second.
Display Noor and Eve’s reasoning on the unit rate for a new coin-sorting machine. Allow students a minute to individually read the situation and consider their response. Encourage debate and have students defend their position by sharing their thinking.
Noor and Eve are looking for a new coin-sorting machine. They see a machine that sorts 10 coins in 4 seconds.
• Noor says the unit rate is 2.5.
• Eve says the unit rate is 0.4.
Who is correct? Why?
I think Noor is correct because the number of coins sorted divided by the number of seconds is 2.5.
I think Eve is correct because the number of seconds divided by the number of coins sorted is 0.4.
I think both Noor and Eve are correct because they both found a unit rate. The only difference is that Noor found the unit rate for coins per second and Eve found the unit rate for seconds per coin.
Which rate do you think better describes the situation? Why?
Noor’s rate better describes the situation because she found the unit rate for coins sorted per second, which matches the phrasing of the rate in the situation.
Teacher Note
Consider adapting the discussion format for Noor and Eve’s reasoning by using the Take a Stand routine. Display signs with the words Noor, Eve, Both, and Neither around the classroom. Then have students stand next to the sign they believe represents who is correct. Have groups discuss their reasoning related to the unit rate and then share out to the class.
Display the tables for machines G, H, I, and J.
Have students think–pair–share about the following questions.
Which tables represent machines that sort at a constant rate? Use what you know about unit rates to explain your thinking.
Machine J is the only machine that sorts at a constant rate. I know that because when I find the unit rate for the number of coins sorted in each row, I get the same number.
I can determine the number of coins sorted per second and then I can use that unit rate to check the other values in the table. Because the values all matched what I expected, I know that machine J sorts coins at a constant rate.
Differentiation: Support
If students are having difficulty determining which tables represent machines that sort at a constant rate, refer them back to the tables for machines A, B, C, and D and consider guiding student thinking with the following questions.
• How do the values in the tables for machines A, B, C, and D represent equivalent ratios?
• How did you use the rate to find unknown values in the tables for machines A, B, C, and D?
• Is it possible to determine the unit rate for the values in the tables for machines A, B, C, and D? What does that tell you about the rate?
• How can you use the same reasoning about their rates to see whether machines G, H, I, and J are sorting at a constant rate?
How did you determine which machines did not sort at a constant rate?
I calculated the unit rate for each row of values in the table. If all of the rows of values have the same unit rate, then the machine sorts coins at a constant rate. The values in the table for machines G, H, and I show that those machines did not sort coins at a constant rate. I know this because when I calculated the unit rate for each row in the table, the unit rates were not all the same.
Debrief 5 min
Objective: Compare different relationships in situations by using ratio and rate reasoning.
Have students think–pair–share about the following questions.
How can we determine whether a machine sorts coins at a constant rate?
A machine sorts coins at a constant rate if the same unit rate can be calculated from each pair of values in the table.
What strategies did we use to compare situations that have constant rates?
We made a table of equivalent ratios for each situation. Then we compared the values in the ratios A : B when both tables contained the same A value or the same B value. Another strategy was to compare the unit rates. The unit rate was found by extending the table to include a row with 1 in the A column. We also found the unit rate by dividing B values by their corresponding A values
What connections can we make between constant rate relationships and our knowledge of ratios?
We found equivalent ratios in tables that have constant rates. We were also able to calculate the unit rate from the ratios and use it to compare relationships and find unknown values.
Exit Ticket 5 min
Provide up to 5 minutes for students to complete the Exit Ticket. It is possible to gather formative data even if some students do not complete every problem.
Teacher Note
Assign the Practice problems for completion outside of class or use them in class if time remains after the lesson. Refer students to the Recap for support.
Student Edition: Grade 7, Module 1, Topic A, Lesson 1
Name Date
An Experiment with Ratios and Rates
In this lesson, we
• sorted coins to determine the relationship of time elapsed to number of coins sorted.
• compared rates that are constant to rates that are not constant.
• compared rates of different machines by looking for corresponding values of quantities.
• calculated unit rates and used them to find other values.
Example
Bananas are priced at a constant rate.
a. Complete the following table.
Another way to find the unit rate is to extend the table to have a row for 1 pound of bananas. The price of 1 pound of bananas is the unit rate.
Since this relationship has a constant rate, additive or multiplicative reasoning or the unit rate can be used to complete the table.
b. Using the table from part (a), how can you determine the price of 1 pound of bananas?
You can use any row to determine the unit rate that relates 1 pound of bananas to a price.
The unit rate is 0.6. The price of 1 pound of bananas is $0.60
c. What is the cost of 5 pounds of bananas? Explain how you know.
Since the bananas are priced at a constant rate, the unit rate is multiplied by the number of pounds of bananas.
The cost of 5 pounds of bananas is $3.00
d. Dylan bought 3 pounds of pears for $2.10. The pears are also priced at a constant rate per pound. Which cost less per pound: bananas or pears?
The price per pound of pears is $0.70
The price of bananas is less per pound because $0.60 is less than $0.70 Any row of values can be used to find the unit rate, since this relationship has a constant rate.
Sample Solutions
Student Edition: Grade 7, Module 1, Topic A, Lesson 1
1. Machine A and machine B sort paper at a constant rate. Machine A sorts 150 pieces of paper every 6 seconds. Machine B sorts 90 pieces of paper every 4.5 seconds. Which machine sorts paper more quickly?
Machine A sorts 25 pieces of paper per second. Machine B sorts 20 pieces of paper per second. Therefore, machine A sorts paper more quickly.
2. Machine C sorts paper at a constant rate. If it sorts 143 pieces of paper every 6.5 seconds, how many pieces of paper does machine C sort in 10 seconds? Machine C sorts 220 pieces of paper in 10 seconds.
c. What is the cost of 10 pounds of peaches? Explain how you know. Since the peaches are priced at a constant rate, the unit rate can be multiplied by the number of pounds of peaches.
The cost of 10 pounds of peaches is $22.00 because 10 2.2 = 22
d. Dylan buys 3.25 pounds of apples for $9.75. The apples are also priced at a constant rate. Which price is less per pound: apples or peaches?
The price per pound of apples is $3.00. The price of peaches is less per pound because $2.20 is less than $3.00 Remember For problems 4–7, multiply.
3. At a farm market, peaches are priced at a constant rate.
a. Complete the following table.
b. Using the table in part (a), how can you determine the price of one pound of peaches? What is the price per pound of peaches?
The table could be extended to include the price of one pound of peaches. The price per pound is $2.20
8. If 4 people share 9 cups of popcorn equally, how many cups of popcorn does each person get? Each person gets 21 4 cups of popcorn. 9. For every 5 apples that a fruit stand sells, it sells 3 oranges. Complete the table. Number of Apples Sold Number of Oranges Sold
EUREKA MATH
Exploring Tables of Proportional Relationships
Identify proportional relationships represented in tables by calculating constant unit rates.
Lesson at a Glance
1. The table shows the cost in dollars for different numbers of daisies purchased. Number of Daisies
3 6 9 12 15
Is the cost proportional to the number of daisies purchased? Explain how you know.
The cost is not proportional to the number of daisies purchased. Dividing each cost by the corresponding number of daisies purchased does not result in a constant price per daisy. Paying $6 for 3 daisies is a price of $2 per daisy. Paying $15 for 12 daisies is a price of $1.25 per daisy.
2. The table shows the cost in dollars for different numbers of roses purchased.
Is the cost proportional to the number of roses purchased? Explain how you know.
The cost is proportional to the number of roses purchased. Dividing each cost by the corresponding number of roses purchased results in a constant price of $2.50 per rose.
Students begin this lesson by observing patterns between pairs of quantities presented in tables. They categorize tables that are collections of equivalent ratios and learn that the pairs of values in those tables are in proportional relationships. Through partner work and discussion, students see that proportional relationships also have a constant unit rate. They apply this new understanding to determine pairs of values in relationships and to write equations to represent the relationships. This lesson introduces the term proportional relationship and the phrase is proportional to.
Key Question
• How can we identify whether the quantities in a table form a proportional relationship?
Achievement Descriptors
7.Mod1.AD1 Compute unit rates associated with ratios of fractions given within contexts. (7.RP.A.1)
7.Mod1.AD4 Represent proportional relationships given in contexts with equations. (7.RP.A.2.c)
Student Edition: Grade 7, Module 1, Topic A, Lesson 2
Agenda
Fluency
Launch 5 min
Learn 25 min
• Pedro’s Tables
• Try These Tables
• Extending Tables
• Writing Equations from Tables
Land 15 min
Materials
Teacher
• None Students
• Context Table Card Sort (1 set per student pair)
Lesson Preparation
• Prepare one set of Context Table Card Sort for each student pair.
Fluency
Divide Fractions
Students divide fractions to prepare for finding the unit rate.
Directions: Divide.
Launch
Students sort tables into groups based on common characteristics.
Have students work in pairs to complete the card sort activity. Distribute one set of cards to each pair. Direct students to review the tables on the cards, identify similarities and differences among them, and then sort them into two groups. Tell students that they should be prepared to describe what each group has in common.
Circulate as students work to observe how they sort the cards and to listen to partner conversations. At this point, honor any method that students choose to sort the tables. This could include sorting by nonmathematical attributes. However, identify pairs of students who grouped the tables by using unit rate or equivalent ratios.
Invite selected pairs to share their groups of tables and their reasoning with the whole class. Then transition to the next activity by using the following prompt.
In today’s lesson, we will examine the specific characteristics in tables of values that give us information about the relationship represented by the data in the table.
Learn
Pedro’s Tables
Students identify the characteristics of proportional relationships in tables.
Present the Pedro’s Tables problem.
Consider having students work in pairs or small groups to analyze the four tables. Encourage students to use other representations, such as tape diagrams and double number lines, as needed to identify additive and multiplicative patterns in the tables.
Circulate as students work, and look for students who identify that each of these tables has a set of equivalent ratios or a constant unit rate.
1. Pedro groups these four tables together.
What do these four tables have in common?
In each table, the ratios of the pairs of values are all equivalent.
After a few minutes, select several students to share their responses to problem 1(a) in Pedro’s Tables. Sample answers include the following statements:
• In each table, the pairs of values are all in equivalent ratios.
• It looks like a ratio table. The value of the ratio is the same for all pairs.
• The unit rate for each pair of numbers is constant.
• In the tables, you can multiply every quantity in the first column by the same factor to get the corresponding quantity in the second column.
Ask one or two students to share with the class their strategies for identifying and creating equivalent ratios. Then introduce the term proportional relationship.
Each pair of quantities in Pedro’s Tables is in a proportional relationship. Measures of two quantities are in a proportional relationship if there is a constant unit rate between pairs of corresponding values.
We can use the phrase is proportional to when describing the relationship between the quantities. In the first table, the number of cups of sugar is proportional to the number of cups of flour.
Encourage students to practice using the new terminology proportional relationship and the phrase is proportional to throughout the remainder of this lesson and topic.
How can you use the phrase is proportional to when describing the other three relationships?
The volume of a sample in cubic centimeters is proportional to the mass of that sample in grams. The height of a prism in inches is proportional to the volume of the prism in cubic inches. The time in minutes is proportional to the volume of water in gallons.
Have students think–pair–share with a partner about part (b) of the Pedro’s Tables problem and then record their definitions.
b. Describe a proportional relationship in your own words.
When ratios of pairs of quantities are equivalent, the quantities are in a proportional relationship.
UDL: Representation
To activate prior knowledge about equivalent ratios, consider modeling strategies to identify and create equivalent ratios from grade 6, such as the tape diagram and the double number line.
Tape diagrams are used to model situations in which two quantities have the same unit, such as the number of cups of sugar and the number of cups of flour. Demonstrate to students that the ratio of the number of cups of sugar to the number of cups of flour for every pair of values is 1 : 4 for any size unit.
Number of Cups of Sugar
Number of Cups of Flour 1 4
Double number lines are used to model situations where two quantities have different units, such as the volume and mass of a sample.
Volume (cubic centimeters)
Mass (grams)
2.713.527 1510
Creating pictorial models helps students understand and visualize relationships between two quantities that are represented in a table. Encourage students to use these strategies throughout this lesson as needed.
Select a few students to share their definitions aloud. If students do not mention that proportional relationships have pairs of quantities that are in equivalent ratios, use the following prompt to call their attention to this idea.
Looking at these tables, how would you describe a proportional relationship in your own words?
When pairs of quantities are in equivalent ratios, they are also in a proportional relationship.
Students use their descriptions of a proportional relationship as they complete the next problem, Try These Tables.
Try These Tables
Students determine whether relationships represented in a table are proportional.
Have students work in pairs to complete the Try These Tables problem. Circulate as students work, and listen for pairs who identify equivalent ratios or a constant unit rate between all pairs of values in a table.
2. Given the following tables, determine whether each relationship is proportional.
Language Support
In Land, students use a graphic organizer to begin formalizing terminology and phrases. They will refer to this graphic organizer throughout the topic as they discover new characteristics of proportional relationships.
Table 1
Table 2
Table 3
4
Tables 1 and 4 represent proportional relationships. Tables 2 and 3 do not represent proportional relationships.
When most students are finished, call the class back together to discuss the following questions. Highlight student reasoning that identifies a constant unit rate for every pair of values in a table.
Which tables did you identify as representing proportional relationships? Why?
Which table was the most difficult to classify as either a proportional relationship or not a proportional relationship? Why was that? Why were other tables less difficult to classify?
Extending Tables
Students generate pairs of values that belong in a proportional relationship.
Introduce the Extending Tables problem, and invite students to think–pair–share with a partner about their methods for generating pairs of values.
Circulate and listen for students who use unit rate as their method to find additional values.
Teacher Note
Consider a short formative assessment after students complete the Try These Tables problem. Display the first two tables, one at a time, and ask students to show a thumbs-up when the table represents a proportional relationship, a thumbs-down when it does not, or a thumbs-to-the-side when they are unsure. Select a few students to share their reasoning.
If most of the class is unsure or incorrect, revisit the characteristics of a proportional relationship from Pedro’s Tables and model how to determine whether pairs of values in a table are in equivalent ratios. Consider an additional review of ratios, ratio tables, and equivalent ratio strategies from grade 6 as needed.
3. Generate two additional pairs of values that belong in each proportional relationship.
Sample:
Differentiation: Support
Support students as they decontextualize the multiplicative relationship between the two quantities by doing the following:
• creating tape diagrams,
• creating double number line diagrams, and
• annotating tables (as shown).
Ask a few students to share the pairs of values that they added to the tables and to explain their reasoning. Consider displaying each table and adding pairs of values as students share.
Describe the method you used to find these additional values in the proportional relationship.
I multiplied both values in the ratio 1 : 24 by the same number to get an equivalent ratio.
I created a tape diagram with 4 units and made each unit 24 hours.
I multiplied the number of days by the unit rate, 24.
Encourage students to contextualize the relationship between two variables when writing equations. For example:
• The number of cups of lemon juice j is 1 4 the number of cups of lemonade l.
• The number of hours h is 24 times the number of days d.
Consider asking the following questions to extend students’ thinking:
• Can you think of any other values that can be added to the table? How can you be sure?
• What assumptions are you making when you extend the table?
• What is an example of a pair of values that does not belong in one of these tables? How do you know?
If unit rate has not already been mentioned, focus students’ attention on this characteristic of proportional relationships by using the following questions.
What do you notice about the unit rates in each of these relationships?
The unit rate, 1 4 , is the same for every pair of values in the lemonade table. There is 1 4 cup of lemon juice for every 1 cup of lemonade, so the unit rate of that relationship is 1 4 .
Each day contains 24 hours, so the unit rate of that relationship is 24.
How can you use the unit rate to find additional values in the relationship?
When you know the unit rate, you can multiply the first quantity by the unit rate to find the second quantity.
When y is proportional to x, we can predict any y-value by using the unit rate, which we identified in the table. For example, in problem 3, we multiplied the number of days by 24 to find the number of hours.
Writing Equations from Tables
Students write an equation to model a proportional relationship.
Present the Writing Equations from Tables problem. Use the following statement and question to guide student thinking about how to use the unit rate to write an equation to model each situation.
How can we write equations to represent the proportional relationships in the two tables from the previous problem?
We can use the unit rate to relate the y-value to the x-value.
Circulate as students write equations. Ask students who finish early to analyze the relationship between the unit rate and the variables used in each table.
4. Use table 1 to write an equation to show how the number of hours h relates to the number of days d. hd = 24
5. Use table 4 to write an equation to show how the number of cups of lemon juice j relates to the number of cups of lemonade l. jl = 1 4
Invite a few students to share their responses and reasoning for each problem.
Some students may write a related equation, such as l = 4j, for the second table. Promote flexible thinking by accepting both l = 4j and jl = 1 4 as acceptable equations.
Promoting the Standards for Mathematical Practice
When students identify and use the constant unit rate to write an equation to represent a proportional relationship in problems 4 and 5, they are demonstrating abstract and quantitative reasoning (MP2).
Ask the following questions to promote MP2:
• What does this equation mean in this situation?
• What does the variable mean in this situation?
Land
Debrief 10 min
Objective: Identify proportional relationships represented in tables by calculating constant unit rates.
Have students think–pair–share with a partner about the following question.
How does our new learning relate to the activity in lesson 1?
Invite a few students to share their responses. Highlight student responses that recognize examples of relationships that are proportional and relationships that are not proportional in the coin sorting activity.
Use the following prompt to guide a discussion about identifying proportional relationships in tables.
In the last problem, we determined that the number of cups of lemon juice was proportional to the number of cups of lemonade. How can we identify whether the quantities in a table form a proportional relationship?
We look to see whether all the pairs of values are in equivalent ratios.
We calculate the unit rate of each pair of quantities and see whether it is constant.
Introduce the Proportional Relationships Graphic Organizer, and have students record their ideas about the term proportional relationship in it. Pair students to write a definition in their own words and begin the sections for Proportional and Not Proportional by using tables from today’s lesson. Remind students to leave space on the graphic organizer, as they will continue adding to their definition in later lessons.
To prepare for the next lesson, pose the following question and allow student discussion.
How is finding the unit rate from the ratio of two fractional values different from finding the unit rate from the ratio of two nonfractional values?
Consider sharing an example: If 1 6 cup of lemon juice makes 1 2 cup of lemonade, what is the unit rate associated with the number of cups of lemon juice per cup of lemonade? How did you find the unit rate?
Exit Ticket 5 min
Provide up to 5 minutes for students to complete the Exit Ticket. It is possible to gather formative data even if some students do not complete every problem.
Teacher Note
Assign the Practice problems for completion outside of class or use them in class if time remains after the lesson. Refer students to the Recap for support.
Exploring Tables of Proportional Relationships
In this lesson, we
• identified that pairs of values with equivalent ratios represent proportional relationships.
• recognized that proportional relationships have constant unit rates.
• determined pairs of values in proportional relationships.
• wrote equations to represent proportional relationships.
Example
The table shows the number of pounds of fertilizer used to cover different-size lawns.
a. Is there a proportional relationship between the area of the covered lawn and the number of pounds of fertilizer used to cover it?
Yes.
Find the unit rate of each row to determine whether a proportional relationship exists.
The area of the lawn is proportional to the amount of fertilizer.
b. When the rate is expressed in square feet of lawn area per pound of fertilizer, what is the unit rate? Explain what the unit rate represents.
The unit rate is 1,000. This means that for every 1,000 square feet of lawn area, 1 pound of fertilizer is used.
c. You have 8 pounds of fertilizer. Is this enough to cover a 7,500-square-foot lawn? Why? 7500100075 ,,÷=
We have enough fertilizer. We need only 7.5 pounds of fertilizer to cover the lawn, and we have 8 pounds of fertilizer.
Another way to solve this problem is to extend the table to determine how much area is covered by 8 pounds of fertilizer.
Sample Solutions
Expect to see varied solution paths. Accept accurate responses, reasonable explanations, and equivalent answers for all student work.
• Tables can be evenly spaced or unevenly spaced, but each table must have a multiplicative relationship among the quantities.
• Graphs c an be continuous or not continuous.
• Points must appear to be on a line that goes through the origin.
• Equations must be in the form y = kx • Situations mig ht state the constant of proportionality , and a multiplicative relationship must be present. A bo
• A proportional re lations hip is a re lations hip that has a constant unit rate.
• The number of hours Stefanie w orks is proportional to the amount of money she earns.
• The constant of proportionality k is the constant unit rate.
• The constant of proportionality c an be determined from the point ( 1 , k ) on a graph.
5. The tables show the total costs of various amounts of frozen yogurt at two different shops. For each shop, state whether the total cost is proportional to the number of ounces of frozen yogurt. Explain your thinking.
a. Frosty’s Fro-Yo
Fro-Yo Hut
6. The table shows the number of gallons of paint used to paint walls with different areas.
a. Is there a proportional relationship between the wall area and the amount of paint in gallons? Yes.
b. What is the unit rate associated with the rate of square feet of wall area per gallon of paint? Explain what this unit rate represents. The unit rate is 350. For every 350 square
You
Do
7. Shawn and her friends love to go ice skating. Last week, Shawn went to the ice rink and paid $15 to skate for 2 hours. Today, her friend Sara skated for 3 hours at the same ice rink and paid a total of $22.50
a. Suppose the relationship between the total cost and the number of hours of skating is proportional. Complete the table with two additional pairs of values. Explain what these values mean in terms of a constant rate. Number of Hours of Skating
For problems 8–11, multiply.
If the total cost is proportional to the number of hours of skating, then the skating rink charges a constant rate of $7.50 per hour.
b. Suppose the relationship between the total cost and the number of hours of skating is not proportional. Complete the table with two additional pairs of values. Explain what these values might mean in terms of a constant rate.
Sample:
Number of Hours of Skating Total Cost (dollars) 2 15.00 3 22.50 4 28.00
5 32.50
If the total cost is not proportional to the number of hours of skating, then there is not a constant price per hour. Maybe the price per hour is lower for more hours of skating.
12. Lily walks 60 feet in 10 seconds. Nora walks 25 feet in 5 seconds. Who walks at a faster rate? Explain how you know.
Lily walks at a rate of 6 feet per second. Nora walks at a rate of 5 feet per second. Therefore, Lily walks at a faster rate.
13. When traveling to Belize, Dylan exchanges 40 US dollars for 80 Belize dollars. What is the exchange rate between US dollars and Belize dollars? Choose all that apply.
2 US dollars per Belize dollar
Teacher Edition: Grade 7, Module 1, Topic A, Lesson 2
c.
b.
Identifying Proportional Relationships in Tables
Analyze tables to identify proportional relationships.
Determine the unit rate associated with a ratio of fractions by evaluating a complex fraction.
Lesson at a Glance
Students examine pairs of values that now include fractions when working with relationships that are proportional and those that are not. Students recognize that complex fractions can be written as division expressions. Working in pairs, students compute unit rates that involve fractions and decimals. With their partners, students use the unit rates they have computed to write equations, which they apply to determine values that are not included in the tables.
Key Questions
• Is determining the unit rate from fractional quantities similar to determining the unit rate from whole-number quantities? Why or why not?
• How can we predict values in a proportional relationship?
Achievement Descriptors
7.Mod1.AD1 Compute unit rates associated with ratios of fractions given within contexts. (7.RP.A.1)
7.Mod1.AD4 Represent proportional relationships given in contexts with equations. (7.RP.A.2.c)
Agenda
Fluency
Launch 10 min
Learn 25 min
• Proportional or Not?
• Nora’s Summer Job
• Almonds for Eve
Land 10 min
Materials
Teacher
• None Students
• None
Lesson Preparation
• None
Fluency
Divide Fractions
Students divide fractions to prepare for evaluating complex fractions.
Directions: Divide.
Teacher Note
Instead of this lesson’s Fluency, consider administering the Dividing Fractions Sprint. Directions for administration can be found in the Fluency resource.
Launch
Students explore ratios composed of fractional values.
Have students read the introduction to problem 1 and examine the numbers in the table. Then ask the following questions.
In what ways is this situation similar to the situations we’ve worked with previously?
In what ways is it different?
Students should notice that both values within each ratio are fractional. This is an increase in complexity, since students have worked only with ratios of whole numbers or ratios that contain one whole number and one fraction.
Before having students complete the problem, briefly have them recall and share different methods they have used (tape diagrams, double number lines, and extending a pattern) to answer problems like these.
Have students complete the problem in pairs.
1. Noor takes daily walks. The distance Noor walks in miles is proportional to the amount of time she walks in hours. The table shows how long it takes Noor to walk varying distances.
Use a method of your choice to determine the number of miles Noor walks per hour.
Noor walks 3 miles per hour.
When most students have finished their work on this problem, lead a class discussion about the use of the unit rate for solving it.
Did anyone find the unit rate of these equivalent ratios to determine how many miles Noor walks per hour?
If students answer yes, follow up by asking them to share with the class how they found the unit rate. If few or no students calculated the unit rate, ask them how to calculate the unit rate in a situation where all values are whole numbers. Then have them apply that thinking to calculate the unit rate in this situation.
Let’s look more at how finding a unit rate can be helpful when solving ratio problems.
Learn
Proportional or Not?
Students identify proportional relationships by analyzing the values given in tables.
Direct students to the Proportional or Not? problem. Consider having them work in pairs to identify which tables represent proportional relationships. Circulate as students work. If they need support writing a description by using ratio language, consider providing them with an example such as “1 teacher per class of 30 students.”
2. For each table that represents a proportional relationship, write a description by using ratio language. For each of the other tables, explain why it does not represent a proportional relationship.
a.
This table represents a proportional relationship because the pairs of values reflect a constant unit rate of 10.5. For every 1 hour worked, the amount earned is $10.50.
c.
This table does not represent a proportional relationship because the pairs of values do not reflect a constant unit rate.
This table represents a proportional relationship because the pairs of values reflect a constant unit rate of 23 4 . For every 1 loaf of bread, there are 23 4 cups of flour.
This table represents a proportional relationship because the pairs of values reflect a constant unit rate of 3. For every 1 hour, the distance walked is 3 miles. e.
This table does not represent a proportional relationship because the pairs of values do not reflect a constant unit rate.
This table represents a proportional relationship because the pairs of values reflect a constant unit rate of 20. For every 1 hour worked, the amount earned is $20.
When most of the groups have finished, lead a discussion about their responses by using the following prompts.
Which tables represent proportional relationships? How do you know?
The tables in parts (a), (c), (d), and (f) represent proportional relationships because each table has pairs of values that reflect a constant unit rate.
Invite a few pairs of students to share descriptions they wrote for the proportional relationships they identified. As a class, confirm that the description shared matches the proportional relationship it is intended to describe.
Turn and talk to your partner about the assumptions we made when we classified the relationship in the table in part (d) as proportional.
We assumed the person didn’t stop walking, speed up, or slow down. The person didn’t stop at a crosswalk or jog to catch up with a friend.
Teacher Note
Sprinkled throughout this topic and the next are references to assumptions made to model a situation as a proportional relationship. If it is reasonable to model a situation with a proportional relationship, then we assume the relationship is proportional.
We often think about situations as proportional so we can make predictions about them, such as knowing how much longer it will take to get to our destination while traveling. You might have done this in real life without even thinking about it. Have you ever tried to predict how much longer it will take you to read a book based on how long it has taken you so far? If so, then you have taken a relationship that is not proportional and thought about it as proportional to make a reasonable prediction.
Consider discussing these examples with students to help them understand the difference between a proportional relationship and an assumed proportional relationship.
In situations like these, we assume that the rate is constant, so we can model it with a proportional relationship.
Nora’s Summer Job
Students write an equation to model a proportional relationship and then use the equation to determine other values within the same relationship.
Have students work in pairs to complete the Nora’s Summer Job problem. Encourage students to discuss an approach to this problem with their partner before solving. As needed, guide them through the problem by asking the following questions or similar ones:
• To write an equation, we must first determine the unit rate of the ratios in the table. How can we rewrite a ratio from the table as division to determine how much Nora earns per hour?
• Since we know this situation is a proportional relationship, what does that mean about the unit rate for all pairs of values?
• How can we use the unit rate to write an equation that represents the amount of money Nora earns per hour?
Encourage students to notice the repeated reasoning of multiplying the number of hours by 11.5 to find the amount of money earned. When doing so, it may be easier for students to see the equation written as 11.5h = d before it is written as d = 11.5h.
• How can we use the equation you wrote to determine how many hours Nora works if she earns $51.75?
3. Nora has a part-time summer job. The amount of money she earns is proportional to the number of hours she works. The table shows the amount of money Nora earns for different numbers of hours worked.
Promoting the Standards for Mathematical Practice
When students notice repeated calculations of multiplying the number of hours by the constant unit rate, they are discovering general methods and shortcuts (MP8).
Ask the following questions to promote MP8:
• When multiplying the number of hours Nora works by the constant unit rate, does anything repeat? How can this help you write the equation that models this situation?
• Will the constant unit rate always repeat?
Teacher Note
If students do not readily notice the repeated calculations within the table, encourage them to implement strategies that help make those calculations visible. Consider having students make a note between the columns for each entry that shows the multiplication by the constant unit rate of 11.5
a. Write an equation that shows how much Nora earns at her job. Let h represent the number of hours worked. Let d represent the amount earned in dollars.
The unit rate is 11.5.
dh = 115 .
b. Use the equation from part (a) to determine how much Nora earns for working 31 2 hours.
.
Nora earns $40.25 for working 31 2 hours.
Almonds for Eve
Students use proportional reasoning to generate equations and find unknown values in a relationship.
Play part 1 of the video that shows a person purchasing almonds, in bulk, from a store.
Have students turn and talk about the following question.
Do you think Eve has enough money to buy the almonds? Why?
Play part 2 of the video that shows the person determining whether they have enough money to purchase the almonds.
Did the video confirm your thinking? Has anything changed about your thinking?
My thinking was confirmed. She has $18.00 in her pocket and picked up 1.75 pounds of almonds. Since the almonds cost $9.99 per pound, 1.75 pounds of almonds cost approximately $17.48 because 1.75 ⋅ 9.99 = 17.4825.
Have students work independently on problem 4, but encourage them to check in with a partner throughout to compare their thinking. Circulate as students work to identify a variety of solution paths to highlight in the discussion that follows.
Teacher Note
Depending on your local tax structure, anticipate that students might wonder whether there is enough money to purchase the almonds after taxes are applied.
Conduct a class discussion to gauge students’ understanding of sales tax and make estimates based on your local sales tax to determine whether there is enough money to purchase the almonds.
Percents are the focus in module 5, so precise calculations are not expected at this time.
4. The cost of almonds is proportional to their weight. Eve pays $2.50 for 1 2 pound of almonds.
a. Determine the costs of the different weights of almonds listed in the table.
b. Write an equation that represents the cost of different weights of almonds. Let a represent the weight of almonds in pounds. Let c represent the cost of the almonds in dollars.
ca = 5
c. Use the equation from part (b) to determine the cost of 21 4 pounds of almonds.
Invite identified students to share their solution paths with the class. Then facilitate a class discussion by using the following prompts.
How can we determine the unknown values in the table?
The unit rate is found by dividing the cost of almonds in dollars by the weight of almonds in pounds. Once the unit rate is known, it can be multiplied by any weight of almonds to determine the cost.
How do we use the unit rate to write an equation to represent the cost of almonds per pound?
The weight of the almonds is multiplied by the unit rate to find the cost of the almonds. Therefore, the equation is c = 5a.
How can we use the equation we wrote to find the cost for 2 1 4 pounds of almonds?
Now that we have the equation, we can substitute 21 4 for a and solve c =⋅51 4 2 .
How much does Eve pay for 2 1 4 pounds of almonds?
Eve pays $11.25 for 21 4 pounds of almonds.
UDL: Action & Expression
After the discussion, encourage students to assess the way they applied strategies as they worked on the problem. Ask students to reflect on parts (a), (b), and (c). Display an exemplar (student generated or teacher created) of Almonds for Eve for students to compare with their solution paths. Prompt students to ask themselves the following questions to identify where they experienced success and challenge:
• Did I determine the unknown value?
• Did I find the unit rate?
• Did I write the equation and solve it?
This supports executive function, encouraging students to monitor their own progress.
Land
Debrief
5 min
Objectives: Analyze tables to identify proportional relationships.
Determine the unit rate associated with a ratio of fractions by evaluating a complex fraction.
Use the following questions to facilitate a discussion about proportional relationships.
Is determining the unit rate from fractional quantities similar to determining the unit rate from whole-number quantities? Why or why not?
Determining the unit rate from fractional quantities is exactly the same as determining the unit rate from whole-number quantities. The only difference is that the values are fractions.
How can we predict values in a proportional relationship?
If I know the unit rate, I can multiply it by the independent variable in any proportional relationship to determine the value of the dependent variable.
Why is it difficult to predict values when the relationship is not proportional?
If there is not a constant unit rate, I don’t know what to multiply the independent variable by to find the value of the dependent variable.
Allow time for students to make additions or revisions to their Proportional Relationships Graphic Organizers.
What new information did you add to your graphic organizer about the term proportional relationship?
Exit Ticket 5 min
Provide up to 5 minutes for students to complete the Exit Ticket. It is possible to gather formative data even if some students do not complete every problem.
Teacher Note
Assign the Practice problems for completion outside of class or use them in class if time remains after the lesson. Refer students to the Recap for support.
Identifying Proportional Relationships in Tables
In this lesson, we
• identified relationships as proportional or not proportional.
• computed unit rates involving fractions and decimals.
• recognized that complex fractions can be written and evaluated as division expressions.
• used unit rates to write equations that we used to determine values that were not included in the tables.
Example
Ava paints small rocks. Suppose she works at a constant rate and paints 4 rocks every 3 4 hours she works.
To write an equation, first determine the unit rate. In this case, divide
a. Write an equation that represents the number of rocks Ava paints in a given amount of time. Let r represent the number of rocks, and let h represent the number of hours worked.
Sample Solutions
Expect to see varied solution paths. Accept accurate responses, reasonable explanations, and equivalent answers for all student work.
Student Edition: Grade 7, Module 1, Topic A, Lesson 3
Name Date
1. Lily keeps track of the snowfall by measuring it every 15 minutes for 45 minutes. The table shows her records.
2. The table shows the amount of flour Dylan needs to bake various numbers of cupcakes.
a. According to Lily’s records, is the depth of snow proportional to the time? Explain how you know.
The depth of snow is not proportional to the time because there is no constant unit rate.
b. Which value in the table can be changed so that all the ratios have a constant unit rate? What should it be changed to?
I can change the second value in the last row from 5 6 to 1 2 . The ratio of the values in the last row would then have a unit rate of 2 3 , which is equal to the unit rate of the ratios of the other values.
Alternatively, I can change the first value in the last row from 3 4 to 11 4 . The ratio of the values in the last row would then have a unit rate of 2 3 , which is equal to the unit rate of the ratios of the other values.
a. Is the amount of flour proportional to the number of cupcakes? Explain how you know.
Based on the table, the amount of flour is proportional to the number of cupcakes, because there is a constant rate of 11 2 cups of flour for every dozen cupcakes.
b. How much flour does Dylan need to bake 50 cupcakes, which is 41 6 dozen cupcakes? Dylan needs 61 4 cups of flour to bake 50 cupcakes.
3. The table shows the amount of money Eve earns for different numbers of hours she works.
Remember For problems 5–8, multiply.
a. Find the unit rate. Explain its meaning in this problem.
The unit rate is 10.5, which means that Eve earns $10.50 per hour.
b. Use the unit rate to write an equation that represents the amount of money Eve earns per hour. Let h represent the number of hours Eve works, and let d represent the amount of money she earns in dollars.
dh = 105
4. Maya makes braided bracelets. Suppose she works at a constant rate and braids 5 bracelets for every 2 3 hours she works.
a. Write an equation that represents the number of bracelets Maya braids per hour. Let b represent the number of bracelets, and let h represent the number of hours worked.
bh = 71 2
b. How many bracelets does Maya braid in 11 2 hours?
Maya braids 111 4 bracelets in 11 2 hours.
Shawn reads 570 words in 3 minutes. Sara reads 630 words in 3.5 minutes. Who reads at a faster rate? Explain how you know.
Shawn reads at a rate of 190 words per minute. Sara reads at a rate of 180 words per minute. Shawn reads at a faster rate because he reads 10 more words per minute than Sara.
How
Exploring Graphs of Proportional Relationships
Identify proportional relationships represented as graphs.
Interpret and make sense of the point (0, 0) in context.
Lesson at a Glance
Pedro earns extra money doing yard work in his neighborhood. He creates a graph showing the number of hours he works and the amount of money he earns.
a. Based on the graph, does the amount of money Pedro earns appear to be proportional to the number of hours he works? Explain how you know.
Yes. The amount of money Pedro earns appears to be proportional to the number of hours he works. The graph looks linear, and it appears that a line connecting the points would go through the origin.
b. Pedro adds the point (0, 0) to his graph. What does the point (0, 0) mean in this context?
The point (0, 0) means that Pedro works 0 hours and earns $0
c. How much money does Pedro earn if he only works 1 hour? Explain how you know. Pedro earns $40 for 5 hours of work. 40 5 8 =
This is a rate of $8 per hour. Pedro earns $8 for 1 hour of work.
In this lesson, students connect proportional relationships represented in tables to their graphical representations. Students sort tables into two categories, proportional and not proportional, and match each table with its graph. Students generalize the key characteristics of graphical representations of proportional relationships: that the points lie on a line through the origin. This lesson introduces the term constant of proportionality.
Key Question
• How can we determine whether a graph represents a proportional relationship?
7.Mod1.AD3 Identify the constant of proportionality in proportional relationships. (7.RP.A.2.b)
7.Mod1.AD5 Interpret the meaning of any point (x, y) on the graph of a proportional relationship in terms of the situation, including the points (0, 0) and (1, r), where r is the unit rate. (7.RP.A.2.d)
Agenda
Fluency
Launch 5 min
Learn 30 min
• Graph Match
• Analyzing (0, 0)
• Revisiting the Water Flow Problem
• Take a Stand
Land 10 min
Materials
Teacher
• Always True sign
• Sometimes True sign
• Never True sign
• Tape Students
• Table Sort cards (1 set per student group)
• Graph Match cards (1 set per student group)
Lesson Preparation
• Copy and cut out 1 set of Table Sort cards for each student group.
• Copy and cut out 1 set of Graph Match cards for each student group.
• Create signs labeled Always True, Sometimes True, Never True, and position them in different locations around the room.
Fluency
Graph Points
Students graph points to prepare for identifying proportional relationships represented as graphs.
Directions: Graph and label each point in the coordinate plane.
Teacher Note
Students may use the Quadrant I removable.
UDL: Action & Expression
Provide access to digital graphing tools or adapted grid paper to offer alternatives to physical response methods that require precise fine motor skills.
Launch
Students sort tables by examining their characteristics.
Divide students into groups of three or four. Distribute one set of Table Sort cards to each group. Have students work together to sort the tables into two categories: proportional and not proportional. As groups finish sorting, encourage them to record anything they notice about the tables in each category.
1. Sort the tables into two categories: proportional and not proportional.
What I notice:
• The proportional relationships all have a constant unit rate.
• The proportional relationships all have a multiplicative structure.
• Relationships that are not proportional may still include the ordered pair (0, 0).
When most groups have finished, call the class back together and invite students to share what they noticed about the tables in each category.
Facilitate a class discussion by using the following prompts.
How did your group determine which tables represented proportional relationships and which did not?
When I divide all pairs of values in the table and get the same number, I know the relationship is proportional. When I divide and get different numbers, the relationship is not proportional.
In the last two lessons, you identified key features of a proportional relationship represented in a table. What do you think the graphs of proportional relationships look like?
Allow time for student responses.
Now let’s examine the graphs of proportional relationships.
The groupings shown in the table give the solution for the Launch activity as well as the first segment of Learn.
Teacher Note
Graphs are used to represent values in context in grade 6. Depending on students’ understanding, a discussion about when graphs are continuous and when individual points are graphed may be helpful to some students before moving on.
Consider reminding students that when individual points are graphed, this signifies that only these values have meaning in the context. If the graph is a continuous line, then all points on that line have meaning in the context.
Differentiation: Support
To succeed in this lesson, students need to know how to find the constant unit rate of a proportional relationship.
Use student work on the lessons 2 and 3 Exit Tickets to gauge student understanding. If a student needs additional support, consider analyzing one table. Have the student add a row or column to the table. Calculate the unit rate for each ordered pair in the table and write the unit rate in the added row or column. Compare the values to see whether they are constant.
Learn
Graph Match
Students examine graphs of proportional relationships and generalize about their characteristics.
Distribute a set of Graph Match cards to each group. Tell students to match each graph card to one of the tables they sorted into proportional and not proportional categories. Each graph has exactly one matching table.
Circulate as groups work and encourage students to record anything they notice about the graphs of proportional relationships. Identify students who recognize that the graphs of proportional relationships begin at the origin, (0, 0), and lie on a line.
2. Match each graph to its table. Examine the graphs of the proportional relationships. What characteristics do they have?
What I notice:
• The graphs of the proportional relationships are lines or are points that lie on the same line.
• The graphs of the proportional relationships go through the origin.
When most groups have finished, call the class back together and facilitate a class discussion by asking the following questions.
What strategies did your group use to match the graphs to the tables?
We graphed the values from the table and then found the graph card that matched. We identified a few points on each graph and then looked to see which table had the same pairs of numbers.
Promoting the Standards for Mathematical Practice
Students look for and express regularity in repeated reasoning (MP8) when they look at examples of graphs and observe key features of graphs representing proportional relationships.
Ask the following questions to promote MP8:
• What patterns did you notice when you looked at the graphs of proportional relationships?
• What is the same about the graphs of the proportional relationships?
What characteristics do graphs of proportional relationships have in common?
Have several groups share the characteristics they identified. Encourage the students who noticed that the graphs of proportional relationships begin at the origin, (0, 0), and lie on a line to share with the whole class. Allow time for students to record what classmates noticed to problem 2 as needed.
If no students identified the properties of the graphs of proportional relationships, ask questions like the following to guide students to this understanding.
How would you describe the graphs that represent proportional relationships?
The graph is either a line or points that appear to lie on a line.
Do the graphs of proportional relationships always have to appear as lines or can they be points that appear to lie on a line too? Can both types of graphs represent proportional relationships?
Both types of graphs can represent proportional relationships. To represent a proportional relationship, the x- and y-values plotted on the graph must reflect a constant unit rate.
Do all graphs that are lines represent proportional relationships?
No. The graph of the relationship between the number of hours and the bike rental cost formed a line. However, the table showed that it was not proportional because the pairs of values did not reflect a constant unit rate.
What makes the bike rental graph different from the ones that we identified as proportional?
The graphs of the proportional relationships all include the point (0, 0), while this graph does not.
Do you think a graph could contain the point (0, 0) but not represent a proportional relationship?
Yes. The graph that represents the relationship between the side length of a square and its area includes the point (0, 0), but it is not proportional because the graph is not a line.
Teacher Note
If students do not notice the similarities in the graphs, encourage them to note the specific x- and y-values of each point. Have them consider the following questions:
• Are there any points that are common among all the graphs of proportional relationships?
• How do the x- and y-values in each graph change in relation to each other?
If students solidify an understanding that the graphs of proportional relationships are lines that include the origin, extend that thinking by asking them to consider unknown values in the situation. Use the following questions to guide their thinking:
• Is there an ordered pair that you think might fit into this relationship?
• Is there an ordered pair that you know would not fit into this relationship?
UDL: Representation
Consider pausing after identifying the characteristics of graphs of proportional relationships. Ask students to think about and visualize lines that do and do not contain the point (0, 0). This supports comprehension about the key characteristics of graphs of proportional relationships.
What are the characteristics of the graph of a proportional relationship?
The graph of a proportional relationship is a line, or points that lie on the same line, that includes the point (0, 0).
Analyzing (0, 0)
Students explain the meaning of the point (0, 0) in context.
Allow time for groups to complete the Analyzing (0, 0) problem.
3. Review each relationship that your group identified as proportional. What does the point (0, 0) mean in each context?
The cost to make 0 copies is 0 dollars.
Making 0 cups of rice requires 0 cups of water.
Buying 0 pounds of green beans costs 0 dollars.
When students are finished, invite them to share their responses with the class.
The line containing the graph of the proportional relationship always includes the point (0, 0). If it did not, the relationship would not have a constant unit rate.
Revisiting the Water Flow Problem
Students verify that the graph of a context they know to be proportional fits their description of the graph of a proportional relationship.
Have students work together in their groups for a few minutes to solve problems 4 and 5. Circulate to identify a student who correctly graphs the data from the table so the graph can be displayed during the discussion that follows.
In lesson 2, you identified a proportional relationship between the number of minutes a faucet is turned on and the number of gallons of water that flow from it.
Differentiation: Challenge
If groups finish early, have them return to other examples of relationships that are proportional or not proportional from lessons 2 and 3. Have students graph the relationships represented in the tables and reflect on the completeness of their description of a proportional graph.
4. Graph the proportional relationship by using the data in the table.
5. Does the graph fit our description of a proportional relationship? Explain why or why not. Yes, this graph fits our description of a proportional relationship because the points lie on a line and the line passes through the origin (0, 0).
Call the class back together, and ask a student to display a graph for the class. Then ask the following questions.
Does this graph fit our description of the graph of a proportional relationship?
Yes. The points lie on a line, and the line passes through the origin (0, 0).
What does the point (0, 0) mean in this context?
The point (0, 0) means that when no time has passed, no water has flowed out of the faucet.
In lessons 2 and 3, we verified that the relationship was proportional by looking for a constant unit rate in the table. What is the constant unit rate in this situation? Where can we see this constant unit rate in the graphical representation?
Since the constant rate is 1.5 gallons per minute, the constant unit rate is 1.5. In the graph, you can see this as the point (1, 1.5).
The constant unit rate, which we saw in the table and the graph, is called the constant of proportionality. In this situation, the constant of proportionality is 1.5.
Considering the context of flowing water, can we draw a line through these points?
Yes. It makes sense to connect the points because the water keeps flowing at this rate over time.
Draw a line through the points on the graph that is displayed, and ask students to do the same on their graph.
Will this line extend beyond the first quadrant?
No. Negative values for time or volume don’t make sense in this situation.
Teacher Note
Students build an understanding of the term constant of proportionality over the next few lessons. This is an informal description that can guide their learning.
Take a Stand
Students summarize the learning of the day by considering what they know to be true about the graphs of proportional relationships.
Introduce the Take a Stand routine to the class. Draw students’ attention to the signs hanging in the classroom: Always True, Sometimes True, and Never True.
Present the statement “Graphed lines represent proportional relationships.”
Then invite students to stand beside the sign that best describes their thinking.
When all students are standing near a sign, allow 1 minute for groups to discuss the reasons why they chose that sign.
After a minute, ask each group to share reasons for their selection. Invite students who change their minds during the discussion to join a different group.
Ensure that all students understand that the statement is sometimes true. If the line passes through the origin, it represents a proportional relationship; otherwise, the line does not represent a proportional relationship.
Have students return to their seats and respond to problem 6.
6. Is the statement “Graphed lines represent proportional relationships” always, sometimes, or never true?
It is sometimes true because lines that do not go through the origin do not represent proportional relationships.
Teacher Note
Although the discussion should land on recognizing that graphed lines sometimes represent proportional relationships, make sure to acknowledge the correct thinking of other rationales.
For example, some students may justify standing by Always True because proportional relationships are always represented by lines. This rationale signifies that the student is misinterpreting the statement but is demonstrating a correct understanding of the characteristics of the graph of a proportional relationship.
Similarly, some students may justify standing by Never True because proportional relationships include only nonnegative values. This means that the graphed representation is a line, beginning at the origin. This rationale also signifies a complete understanding of the content.
Land
Debrief 5 min
Objectives: Identify proportional relationships represented as graphs.
Interpret and make sense of the point (0, 0) in context.
Guide a discussion about the graphs of proportional relationships.
How do we know when a graph represents a proportional relationship?
A graph that represents a proportional relationship is a line or points that lie on a line.
A graph that represents a proportional relationship begins at the origin.
Have students make additions or revisions to their Proportional Relationships Graphic Organizers.
What new information did you add to your graphic organizer about the term proportional relationship? What edits did you make to what was already there?
Expect students to add information about the term constant of proportionality and the characteristics of graphs that represent proportional relationships.
Exit Ticket 5 min
Provide up to 5 minutes for students to complete the Exit Ticket. It is possible to gather formative data even if some students do not complete every problem.
Language Support
As the module progresses, students continue to build on their understanding of the term constant of proportionality. As students add to their Proportional Relationships Graphic Organizers, direct them to label the constant unit rate in a proportional relationship as the constant of proportionality. Tell students that they will add to this understanding throughout the module.
Teacher Note
Assign the Practice problems for completion outside of class or use them in class if time remains after the lesson. Refer students to the Recap for support.
Student Edition: Grade 7, Module 1, Topic A, Lesson 4
• identified graphs of proportional relationships as lines that pass through the origin, the point (0, 0).
Examples
Terminology
The constant of proportionality is the constant unit rate in a proportional relationship between two quantities
1. Which graphs represent a proportional relationship? Explain how you know.
2. Consider the following graph for a lemonade recipe.
This point is (10, 5), and it represents that for every 10 cups of water, there are 5 cups of lemon juice
a. Does the graph appear to represent a proportional relationship between the number of cups of water and the number of cups of lemon juice used in a lemonade recipe? Explain how you know
0245678139
The graph represents a proportional relationship.
The graph forms a line that passes through the origin, (0, 0) 0245678139
The graph does not represent a proportional relationship.
The graph forms a line, but the line does not pass through the origin, (0, 0)
139
The graph does not represent a proportional relationship.
The graph passes through the origin, (0, 0), but it does not form a line.
The graph appears to represent a proportional relationship. The points appear to lie on a line that passes through the origin, (0, 0)
Confirm that the points appear to lie on a line that passes through the origin by sketching a line
b. Create a table of values based on the graph
c. Use the values from the table to justify that the relationship between the number of cups of water and the number of cups of lemon juice is proportional.
The point (10, 5) is represented in the table because the graph shows that for every 10 cups of water, there are 5 cups of lemon juice.
The table shows that there is a constant unit rate, or a constant of proportionality, associated with the relationship between the number of cups of water and the number of cups of lemon juice. The constant of proportionality is 0.5
To confirm that the relationship is proportional, compare the unit rates for each ordered pair to see whether they are the same number.
1 2 2 4 3 6 5 10 05 == ==
Since the unit rate is 0.5, the constant of proportionality is also 0.5
Sample Solutions
Expect to see varied solution paths. Accept accurate responses, reasonable explanations, and equivalent answers for all student work.
For problems 1–3, determine whether each graph represents a proportional relationship. Explain how you know.
The graph does not represent a proportional relationship. The line does not pass through the origin.
graph does not represent a proportional relationship. The graph is a curve, not a line.
b. Is the relationship between y and x proportional? Justify your thinking by using the table and graph.
The relationship between y and x is proportional. The pairs of values from the table reflect a constant unit rate of 1 3 The points on the graph appear to lie on a line through the origin.
c. Describe a proportional situation that could be modeled by this table and graph.
Let x represent the number of chores you complete, and let y represent the number of hours you can spend playing video games. For every 3 chores you complete, you can play video games for 1 hour.
5. The graph shows the number of candy bars sold and the money received.
Number of Candy Bars Sold
a. Does the graph appear to represent a proportional relationship between the amount of money received and the number of candy bars sold? Explain how you know.
The graph appears to represent a proportional relationship because the points appear to lie on a straight line that passes through the origin.
b. Create a table of values based on the graph. Number of Candy Bars Sold, x Money Received, y (dollars) 2 3 4 6 6 9 8 12
c. Use the values from the table to justify that the relationship between the amount of money received and the number of candy bars sold is proportional.
The table shows that there is a constant unit rate, or a constant of proportionality, associated with the relationship between the amount of money received and the number of candy bars sold. The constant of proportionality is 1.5
d. What does the point (0, 0) mean in this context?
The point (0, 0) means that if 0 candy bars are sold, the amount of money received is 0 dollars.
6. Logan and Shawn recorded how much money they earned working at a local restaurant over a 5-hour shift. Use the tables shown for parts (a) and (b).
a. Graph both sets of data in the same coordinate plane. Choose an appropriate scale and label your axes.
b. Describe the similarities and differences between Shawn’s and Logan’s earnings. Use the graphs to support your thinking.
Both graphs show an increase in money earned with more hours worked. The graphs show that Shawn’s earnings grew at a constant rate, while Logan’s earnings did not.
11. The table shows costs in dollars for different quantities of baseballs. Do the corresponding values in the table represent a proportional relationship between the cost and the number of baseballs? Explain how you know.
The corresponding values in the table do not represent a proportional relationship between the cost and the number of baseballs. Dividing each cost by the corresponding number of baseballs does not result in a constant unit rate.
Liam uses 3 cups of milk to make 4 batches of muffins. How many cups of milk does he need to make just 1 batch of muffins? Liam needs 3 4 cups of milk to make 1 batch of muffins.
Teacher Edition: Grade 7, Module 1, Topic A, Lesson 4
Analyzing Graphs of Proportional Relationships
Analyze graphs or sets of ratios to determine whether they represent proportional relationships. Identify the point on a graph that best shows the constant of proportionality k and explain the meaning of the point in context.
Lesson at a Glance
In this collaborative lesson, students work in groups to represent relationships as tables, graphs, and sets of ratios. Each group determines whether a relationship is proportional by looking for key characteristics in the different representations. They create posters and then complete a gallery walk, providing opportunities to recognize common characteristics of proportional relationships represented in different ways. Through a class discussion, students realize that the point (1, k) for the graph of a proportional relationship clearly conveys the constant of proportionality k. This lesson formalizes the definition of the term proportional relationship.
Key Questions
• How can we distinguish a proportional relationship from a relationship that is not proportional by looking at their graphs?
• How can you determine the constant of proportionality from the graph of a proportional relationship?
7.Mod1.AD3 Identify the constant of proportionality in proportional relationships. (7.RP.A.2.b)
7.Mod1.AD5 Interpret the meaning of any point (x, y) on the graph of a proportional relationship in terms of the situation, including the points (0, 0) and (1, r), where r is the unit rate. (7.RP.A.2.d)
Agenda
Fluency
Launch 5 min
Learn 30 min
• Foursquare Task
• Gallery Walk
• Discussion
Land 10 min
Materials
Teacher
• None Students
• Foursquare Task Card (1 per student group)
• Poster paper (1 per student group)
• Grid paper (1 per student group)
• Markers (at least 1 per student group)
• Tape
Lesson Preparation
• Copy, cut out, and distribute 1 Foursquare Task Card for each student group.
Fluency
Divide Decimals
Students divide decimals to prepare for finding the constant of proportionality.
Directions: Divide.
Launch
Students review features of graphs that represent proportional relationships.
Display the graph of number of toppings versus total cost.
Number of Toppings
Have students turn and talk about whether the graph shown represents a proportional relationship or a relationship that is not proportional, and why. Consider asking students to show a thumbs-up to indicate a proportional relationship or a thumbs-down to indicate a relationship that is not proportional. After reviewing student responses, reveal that the graph shows a relationship that is not proportional.
Repeat the turn and talk and the hand signal for the graph of time traveled versus distance from home and the graph of tablespoons versus cups.
UDL: Representation
Provide a verbal description of each graph, or prompt students to describe the key information about the graphs to one another when they turn and talk. This method presents the information in more than one mode, providing options for perception.
After reviewing student responses, reveal that both of those graphs represent proportional relationships.
Facilitate a brief discussion by using the following questions.
The graph of the relationship between the volume in tablespoons and the volume in cups doesn’t include the point (0, 0). How do we know it is a proportional relationship?
The points appear to lie on a line that, if extended, would go through the origin, (0, 0). It makes sense that for 0 tablespoons, there are 0 cups.
What ideas are important to remember when you are identifying whether a graph represents a proportional relationship?
The graph of a proportional relationship will always be a line, or points along a line, that extends through the origin.
You can create a table of values from the graph and see whether every pair of values reflects the same unit rate or is in equivalent ratios.
Explain that students will apply their understanding of proportional relationships as they work to complete the Foursquare Task.
In the task in today’s lesson, you will make connections between the graph of a proportional relationship, like the ones we just discussed, and other representations of that relationship.
Learn
Foursquare Task
Students create multiple representations of a relationship and determine whether it is proportional.
Present the Foursquare Task to students. Read aloud the student directions, and provide time for students to ask any questions they have about the activity.
Divide students into groups of three or four. Distribute one of the Foursquare Task Cards to each group. Allow groups about 10 minutes to discuss the relationship shown on the card. Direct students to complete the Foursquare Task Page during this group discussion.
Circulate as students work, and listen for examples of proportional reasoning and understanding of the relationships between quantities. Encourage groups to use precise ratio language in their descriptions and to define the variables they use in their equations.
Differentiation: Support
If students need additional practice determining whether a graph or table represents a proportional relationship, consider limiting this activity to only the task cards for groups 1–5 and duplicating any groups as needed.
Consider using one of the cards as an example first, modeling for students how to create a table of values and determine proportionality. Students can then work on the other exercises in groups.
Differentiation: Challenge
Increase the challenge of this task by asking students to consider why the graphs are represented as individual points (discrete) or a connected line or curve (continuous).
For groups 1–5, ask students to explain why the graph is represented as individual points or why the graph is a line.
For groups 6–10, ask students to construct their graphs by using either individual points or a connected line or curve, based on the description they were given.
After about 10 minutes, or when most students have finished the Foursquare Task Page, distribute poster paper, markers, tape, and a piece of graph paper to each group. Give students about 5 minutes to create a group poster that represents the four quadrants of their Foursquare Task Page. When most groups have completed their posters, direct them to display their posters around the room.
If your group has a task card with a graph, complete the following steps:
• Graph the relationship in the Graph square.
• Write a description of the real-world situation that is graphed.
• Create a table of values based on the graph.
• Determine whether the graph represents a proportional relationship, and explain how you know.
• If the relationship is proportional, define the two variables in the relationship, and write an equation to describe the relationship.
If your group has a task card with a set of ratios, complete the following steps:
• List the ratios and a brief description in the Description square.
• Graph the points that represent the set of ratios in the Graph square.
• Create a table of values based on the graph.
• Determine whether the graph represents a proportional relationship, and explain how you know.
• If the relationship is proportional, define the two variables, and write an equation to describe the relationship.
UDL: Representation
The Foursquare Task provides students with multiple representations of proportional relationships (graphs, tables, descriptions, and equations), and the student posters illustrate examples and nonexamples of proportionality to reinforce the key features of proportional relationships.
Teacher Note
Support students in constructing graphs with appropriate scales for the vertical and horizontal axes. Emphasize to students that their graphs must show all the points given on their task cards and that the scales for each axis do not need to be the same. Consider using the following prompts to guide student thinking:
• What is the largest x-value you will plot? What is the smallest?
• What is the largest y-value you will plot? What is the smallest?
• What unit can you count by on each axis to show both the largest and smallest values?
Gallery Walk
Students observe features of graphs, tables, descriptions, and equations that represent proportional relationships.
Present the Gallery Walk problem.
Direct each group to rotate to the nearest group’s poster. Give students no more than 1 minute to review the poster and record their observations to the prompts in the Gallery Walk problem. Continue the rotation until all groups have reviewed every poster.
List the proportional relationships from the gallery walk. Identify and explain what the constant of proportionality means in each context.
• Total cost of visiting a museum:
The constant of proportionality is 7.5, which means the cost of each student’s ticket is $7.50.
• Value of the US dollar versus the euro:
The constant of proportionality is 0.9, which represents the number of euros you can get for 1 US dollar.
List and describe the relationships from the gallery walk that are not proportional.
• Increase in the number of cells of E. coli bacteria
• Relationship between the area and the perimeter of a square
• Additional cost for the megabytes of data used after 500 megabytes
Discussion
Students discuss features of graphs of proportional relationships and discover that the constant of proportionality can always be determined from the point (1, k) on the graph of a proportional relationship.
Ask one or two students to share their lists of proportional relationships and relationships that are not proportional from the posters.
Language Support
While students circulate for the gallery walk, consider directing English learners to use the Say It Again section of the Talking Tool to rephrase how other students describe what the constant of proportionality means in context at each poster.
Promoting the Standards for Mathematical Practice
Students reason abstractly and quantitatively (MP2) when they make sense of graphs, equations, ratios, and rates that represent real-world contexts, such as exchanging currency or constant price per unit.
Ask the following questions to promote MP2:
• What does this point on the graph mean in this situation?
• What does this ratio (or unit rate) mean in this situation?
• What does this context tell you about the relationship between these two quantities?
Once students have shared their responses, draw students’ attention to the two posters that represent the proportional relationships. Have students think–pair–share with a partner about the following questions. After each question, select a few students to share their ideas with the class. As students respond, point to where the constant of proportionality is conveyed on each displayed graph by circling or highlighting the point (1, k).
What do you notice about where the constant of proportionality is determined on both graphs?
The constant of proportionality is the y-value at the point where x is 1. On the graph of the museum visit, the constant of proportionality is determined from the point (1, 7.5).
On the graph of dollars and euros, the constant of proportionality is determined from the point (1, 0.9).
We use the variable k to represent the constant of proportionality. Can the constant of proportionality always be determined from the point (1, k) on the graph of a proportional relationship? How do you know?
Yes. The constant of proportionality is the unit rate of the relationship, or the amount of y for every one x. So it will always be the y-value at the point where x is 1.
What representation was most helpful for you in writing the equation, and why?
The graph was most helpful. I found the point (1, k) and used that to write the equation y = kx.
The table was most helpful. I found the unit rate k by dividing each y-value by its corresponding x-value. Then I wrote an equation in the form y = kx.
What do the proportional relationships have in common? What do the relationships that are not proportional have in common?
In all the proportional relationships, the sets of ratios in the relationship are equivalent, and they are also equivalent to the ratios of pairs of values in the table. The constant of proportionality is determined from the point (1, k) on every graph of a proportional relationship. In every equation of a proportional relationship, the constant of proportionality is multiplied by the x-value.
In the relationships that are not proportional, there may be a pattern, like doubling or points that lie on a line. However, in the graphs of the relationships, the values in the pattern do not create a line through the origin.
Throughout this topic, students’ knowledge of proportional relationships has grown greatly. Now that they have a better understanding of proportional relationships, we will formalize the definition.
In lesson 2, our description of proportional relationships was “Measures of two quantities are in a proportional relationship if there is a constant unit rate between pairs of corresponding values.” What do we call the constant unit rate now?
The constant unit rate is the constant of proportionality.
How can we use the constant of proportionality to write an equation?
To write the equation of a proportional relationship, we need to know the constant of proportionality. The form of a proportional relationship equation is y = kx, where k represents the constant of proportionality.
Now we can formally define proportional relationships as “Measures of two quantities are in a proportional relationship if there is a constant unit rate, known as the constant of proportionality k, between pairs of corresponding values, meaning the relationship is described by an equation of the form y = kx.”
Debrief 5 min
Objectives: Analyze graphs or sets of ratios to determine whether they represent proportional relationships.
Identify the point on a graph that best shows the constant of proportionality k and explain the meaning of the point in context.
Use the following prompts to guide a discussion about the Foursquare Task. Emphasize responses that show the connections students made between different representations of a proportional relationship.
In the Foursquare Task, how did your work with graphs, tables, ratios, and equations help you identify whether a relationship is proportional?
The graph helped me identify a proportional relationship because I could easily see whether the points lie on a line that goes through the origin. The table helped me confirm whether the relationship is proportional because I was able to test every pair of values for a constant unit rate. When the unit rate of the relationship is constant, I can use that constant to write the equation of the relationship in the form y = kx.
How can we distinguish a proportional relationship from a relationship that is not proportional by looking at their graphs?
The graph of a proportional relationship will always show either a line that extends through the origin or points that lie on a line that extends through the origin. The graph of a relationship that is not proportional may show a curve, or it may show points that lie on a line that does not extend through the origin.
How can you determine the constant of proportionality from the graph of a proportional relationship?
The constant of proportionality is the y-value of the point (1, k).
Have students make additions or revisions to their graphic organizers if necessary.
Exit Ticket 5 min
Provide up to 5 minutes for students to complete the Exit Ticket. It is possible to gather formative data even if some students do not complete every problem.
Teacher Note
Assign the Practice problems for completion outside of class or use them in class if time remains after the lesson. Refer students to the Recap for support.
Student Edition: Grade 7, Module 1, Topic A, Lesson 5
Analyzing Graphs of Proportional Relationships
In this lesson, we
• represented relationships as tables, graphs, and sets of ratios.
• determined whether a relationship was proportional by examining the different representations.
• calculated the constant of proportionality and used it to write an equation to represent a proportional relationship.
• identified that the constant of proportionality k can be determined from the point (1, k) in the graph of a proportional relationship.
Example
The table shows the width and height of various posters.
Terminology
Measures of two quantities are in a proportional relationship if there is a constant unit rate, known as the constant of proportionality k, between pairs of corresponding values, meaning the relationship is described by an equation of the form y = kx
a. Graph the pairs of values from the table.
Sizes of the Posters
A different point represents the values in each row in the table.
(10, 15)
(15, 22.5)
(20, 30)
(30, 45) 510152025 30 0
w
b. Explain how you can determine that the height of each poster is proportional to its width.
I can determine that the relationship of the height to the width is proportional because the points appear to be on a line that passes through the origin. In the table, I can see that there is a constant of proportionality, 1.5
To determine that the values in the table have a constant of proportionality of 1.5, each value of the height needs to be divided by the value of the corresponding width. Each quotient is 1.5
EUREKA MATH
c. Explain where you can find the constant of proportionality in both the table and the graph. What does the constant of proportionality represent in this situation?
In the table, I can find the constant of proportionality by calculating the unit rate, 1.5
I can find the constant of proportionality on the graph by identifying the y-value of the point (1, 1.5).
The constant of proportionality shows that when the width is 1 inch, the height is 1.5 inches.
d. Write an equation to describe the relationship between the height of each poster and its width.
hw = 15 .
Use the equation y = kx to represent a proportional relationship with a constant of proportionality k. In this situation, k is 1.5, and the variables w and h are used instead of x and y
Sample Solutions
Expect to see varied solution paths. Accept accurate responses, reasonable explanations, and equivalent answers for all student work.
Teacher Edition: Grade 7, Module 1, Topic A, Lesson 5
Description
The graph shows the total cost of visiting a museum based on how many students are visiting. It costs $7.50 for each student to go to the museum.
The number of students is proportional to the total cost of visiting the museum. The graph of the relationship shows that the points lie on a line that goes through the origin. In the table, we can see that all the ratios have the same unit rate, 7.5
Equation y = 7.5x, where x is the number of students visiting the museum and y is the total cost in dollars.
Description
At the beginning, there is 1 cell of E. coli bacteria. Every 20 minutes, the number of cells doubles. After 20 minutes, there are 2 cells; after 40 minutes, there are 4 cells; after 60 minutes, there are 8 cells, etc.
Proportional or Not Proportional?
The time is not proportional to the number of cells in the sample of E. coli. The graph of the relationship shows that the points lie on a curve. In the table, there is not a constant unit rate. Equation
We are unable to write an equation for this relationship.
3
Description
The graph shows the relationship between the value of US dollars and the value of euros. Every 1 US dollar is worth 0.9 euros, so 50 US dollars are worth 45 euros, 100 US dollars are worth 90 euros, etc.
Description
The graph shows the relationship between the area of a square and its perimeter. A square with an area of 1 in2 has a perimeter of 4 in, a square with an area of 4 in2 has a perimeter of 8 in, etc.
of
The number of US dollars is proportional to the number of euros. The graph of the relationship shows that the points lie on a line that goes through the origin. In the table, we can see that all the ratios of the number of euros to the number of US dollars have the same unit rate, 0.9. For every 0.9 euros, there is 1 US dollar. Equation y = 0.9x, where x is the number of US dollars and y is the number of euros.
Proportional or Not Proportional?
The area of a square is not proportional to the perimeter of a square. The graph of the relationship shows that the points lie on a curve, not a line. In the table, there is not a constant unit rate.
Equation
We are unable to write an equation for this relationship.
Description
The graph shows the relationship between the number of megabytes of data used and the additional cost, like for a smartphone plan.
It starts with 500 megabytes and $0 additional cost, and then the cost increases by $5 for each additional 250 megabytes of data used.
Proportional or Not Proportional?
The additional cost is not proportional to the amount of data used. The graph of the relationship shows that the points lie on a line that does not go through the origin. In the table, there is not a constant price per megabyte.
Equation
We are unable to write an equation for this relationship.
Description
A class is taking a field trip to visit a local museum. The following ratios relate the number of students visiting the museum to the total cost of tickets.
Proportional or Not Proportional?
The number of students is proportional to the total cost of visiting the museum. The graph of the relationship shows that the points lie on a line that goes through the origin. In the table, we can see that all the ratios have the same unit rate, 7.5
Equation: y = 7.5x, where x is the number of students visiting the museum and y is the total cost in dollars.
Description
A scientist is studying the growth of a sample of E. coli bacteria cells. He records the following ratios of the time that has passed in minutes to the number of cells in the sample.
Proportional or Not
The time is not proportional to the number of cells in the sample of E. coli The graph of the relationship shows that the points lie on a curve. In the table, there is not a constant unit rate.
Equation
We are unable to write an equation for this relationship.
Description
When visitors arrive in a country in Europe, they go to a bank to exchange US dollars for euros, the currency of European countries. The following ratios show the number of US dollars given to the number of euros received for different exchanges.
Proportional or Not Proportional?
The number of US dollars is proportional to the number of euros. The graph of the relationship shows that the points lie on a line that goes through the origin. In the table, we can see that all the ratios have the same unit rate, 0.9 For every 0.9 euros, there is 1 US dollar. Equation
the number of euros.
Description
The following ratios show the area as related to the perimeter of different squares.
Group 10
Description
The following ratios show how the number of megabytes of data used on a smartphone each month is related to the additional cost for the smartphone data plan for that month.
The area of a square is not proportional to the perimeter of a square. The graph of the relationship shows that the points lie on a curve, not a line. In the table, there is not a constant unit rate.
Equation
We are unable to write an equation for this relationship.
Proportional or Not Proportional?
The additional cost is not proportional to the amount of data used. The graph of the relationship shows that the points lie on a line that does not go through the origin. In the table, there is not a constant price per megabyte.
Equation We are unable to write an equation for this relationship.
Student Edition: Grade 7, Module 1, Topic A, Lesson 5
Name Date
For problems 1–6, state whether each graph represents a proportional relationship. Explain your reasoning. If the graph represents a proportional relationship, state the constant of proportionality and what it represents in the situation.
The graph represents a proportional relationship. The points appear to be on a line that passes through the origin. The constant of proportionality is 1.25, which represents the height in inches of each textbook.
The graph does not represent a proportional relationship. The line does not pass through the origin.
The graph represents a proportional relationship. The points appear to be on a line that passes through the origin. The constant of proportionality is 1.6 which represents the number of kilometers for every mile.
The graph does not represent a proportional relationship. The points appear to be on a line, but it does not pass through the origin.
7. The table shows the widths and heights of different logos for a local school.
The graph does not represent a proportional relationship. The points appear to be on a curve.
The graph represents a proportional relationship. The line passes through the origin. The constant of proportionality is 2.25, which represents the cost in dollars per pound of strawberries.
a. Graph the pairs of values from the table.
b. Explain how you can determine that the width of the logo in inches is proportional to the height of the logo in inches.
I can determine that the relationship of the width to the height is proportional because the points appear to be on a line that goes through the origin. In the table, I can see that there is a constant of proportionality of 4 3 , or 11 3
12. Water drips from a faucet into an empty bucket. The table shows the proportional relationship between the amount of time that passes and the depth of the water.
a. Complete the table.
c. Explain where you can find the constant of proportionality in both the table and the graph. What does the constant of proportionality represent in this situation?
In the table, I can find the constant of proportionality by calculating the unit rate, 11 3 , that is multiplied by each width to get the corresponding height. On the graph, the constant of proportionality can be found by determining the y-value of the point on the line where the x-value is 1 111 ,3 (). The y-value represents a height of 11 3 inches when the width is 1 inch.
b. Explain why the relationship shown in the table is proportional. The relationship in the table is proportional because each pair of corresponding values represents a constant rate of 1 6 centimeter per hour.
d. Write an equation to describe the relationship between the width w of the logo in inches and the height h of the logo in inches. hw = 4 3 Remember
For problems 8–11, convert the fractions to mixed numbers and convert the mixed numbers to fractions.
c. Let d represent the depth of the water in centimeters. Let t represent the amount of time that passes in hours. Write an equation to show how the depth of the water d relates to the time t dt = 1 6
EUREKA
13. At a local grocery store, there are 15 apples in each large bag of apples.
a. Write an expression to represent the number of apples in b bags.
15b
b. How many apples are in 9 bags?
There are 135 apples in 9 bags.
EUREKA MATH
Group 6
A class takes a field trip to visit a local museum. The following ratios relate the number of students visiting the museum to the total cost in dollars of tickets.
Group 8
Group 7
When visitors arrive in a country in Europe, they often go to a bank to exchange US dollars for euros , the currency of European countries. The following ratios show the number of US dollars given to the number of euros received for
A scientist studies the growth of a sample of E. coli bacteria cells. He records the following ratios of the time that passes in minutes to the number of cells in the sample.
exchanges.
: 1
:
to 2
:
to
to
Group 10
The following ratios show how the number of megabytes of data used on a smartphone each month relates to the additional cost for the smartphone data plan for that month.
500 to 0 1,000 : 10 1,500 to 20 750 : 5 1,250 to 15
Group 9
The following ratios show the area as related to the perimeter of different squares. 1 : 4 4 : 8 9 to 12 16 : 16 25 to 20 0 : 0
Identifying Proportional Relationships in Written Descriptions
Determine whether a written description represents a proportional relationship.
Lesson at a Glance
Consider the two situations.
Situation 1:
A carnival charges an entrance fee of $8.00, and tickets for rides cost $0.60 each.
Situation 2:
At a frozen yogurt shop, a dish containing yogurt and toppings is weighed, and the price is $0.85 per ounce.
Which situation represents a proportional relationship? Explain how you know.
The cost at the carnival is $8.00 for 0 rides because of the entrance fee, so situation 1 does not represent a proportional relationship.
Situation 2 represents a proportional relationship. The cost of frozen yogurt is proportional to its weight because there is a constant price of $0.85 per ounce.
After a written description of a relationship is read aloud, a poll is taken to see whether students think the relationship is proportional. This process is repeated for additional descriptions. Groups of students then analyze the language in the written descriptions to predict whether the relationships are proportional. Students verify their predictions by interpreting tables or graphs of the written descriptions. Through class discussion, students recognize language that is useful to identify when a relationship is proportional.
Key Question
• Given a written description, how can we determine whether it represents a proportional relationship?
7.Mod1.AD3 Identify the constant of proportionality in proportional relationships. (7.RP.A.2.b)
Student Edition: Grade 7, Module 1, Topic A, Lesson 6
Agenda
Fluency
Launch 5 min
Learn 30 min
• Jonas and Lily
• Proportional or Not
• Create Your Own
Land 10 min
Materials
Teacher
• None Students
• Graphs and Tables removable (1 per student pair)
• Note card
Lesson Preparation
• Consider having grid paper available for students to use when creating a table or graph.
• Copy and distribute 1 Graphs and Tables removable for each student pair.
Fluency
Divide Complex Fractions
Students divide complex fractions to prepare to find constants of proportionality.
Directions: Divide.
Teacher Note
If time permits, ask students to discuss how problems 1 and 2 are related.
Launch
Students create representations of relationships.
Introduce problem 1 and designate which type of relationship students will create: proportional or not proportional. Let each student decide whether to create a table, a graph, or an equation for their type of relationship. Have students create their representations independently.
1. Create a table, a graph, or an equation to represent your assigned type of relationship.
Proportional relationship:
Sample (table):
Differentiation: Support
If students need support with identifying the different characteristics of proportional relationships, move them forward by having them compare the tables or graphs on their Proportional Relationships Graphic Organizer.
Sample (equation):
Let x represent the number of hours worked.
Let y represent the amount of money earned in dollars.
yx = 1025 . 5
Not a proportional relationship:
(graph):
Number of Water Bottles
Have students return to the whole group. Ask one or two students to share their representations and rationale for selecting that particular representation with the class. Then ask the class the following question.
What are some things you can say about proportional relationships?
Proportional relationships have a constant of proportionality that relates one quantity to another.
The graph of a proportional relationship is a line, or has points that appear to lie on a line, that passes through the point (0, 0).
In previous lessons, we used tables, graphs, and equations to identify proportional relationships. Today, we will identify proportional relationships from written descriptions.
Teacher Note
Consider developing at least one of each type of representation in advance. These can be used as examples for students who need support to begin. They can also be used if, for example, no student chooses to represent their situation with a graph.
Learn
Jonas and Lily
Students determine whether a written description of a relationship is proportional.
Introduce problem 2 and have students work with a partner to complete parts (a) and (b).
2. Jonas is 10 years old and Lily is 8 years old.
a. How old will Lily be when Jonas is 20 years old?
1082 −=
Since Jonas is 2 years older than Lily, Lily will be 18 years old when Jonas is 20 years old.
b. Is this a proportional relationship? Explain why.
No. For it to be a proportional relationship, Jonas would have needed to be 0 years old when Lily was 0 years old.
Once students finish, invite them to share their reasoning for part (b) by using the prompts that follow. Do not confirm responses yet. The intent is for students to share their thoughts and hear other classmates’ ideas.
Who thinks this is a proportional relationship? Why?
Who thinks this is not a proportional relationship? Why?
Have students complete part (c).
c. Create a table or graph to justify your solution.
Sample:
Call the class back together to discuss the following questions.
Was creating a table or graph helpful in identifying the type of relationship?
Yes. When I created a table for the relationship, I could not extend the table to have a zero for Jonas’s and Lily’s ages in the same row.
When I graphed the points, they appeared to lie on a line, but that line did not go through (0, 0).
What patterns do you notice in this relationship?
Jonas’s age and Lily’s age are related by addition, since Jonas is 2 years older than Lily.
Have students think–pair–share with a partner about the following question.
Instead of making a table or a graph for every written description, we can examine the language to help us determine whether it describes a proportional relationship. What clues help us determine proportionality in a written description?
There needs to be a constant of proportionality that relates the values in the written description. Also, the pair of values (0, 0) needs to make sense in the situation.
Proportional or Not
Students determine whether situations are proportional, based on written descriptions.
Present problems 3–10. Read through each situation as a class, and take a quick poll of the students to see whether they feel the situation is a proportional relationship.
Divide students into groups of three or four. Assign each group three situations, and instruct them to determine whether each situation is a proportional relationship. Advise students to find the constant of proportionality for any relationships that are proportional.
As each group finishes, give them the Graphs and Tables removable. Tell them to use the removable to verify or correct their answers to problems 3–10. If students have more time, have them begin working on the other problems.
Promoting the Standards for Mathematical Practice
Students reason quantitatively and abstractly (MP2) when they identify and create situations that are proportional or not proportional.
Ask the following questions to promote MP2:
• What does the constant of proportionality mean in this situation?
• What real-world situations are modeled by a proportional relationship?
For problems 3–10, determine whether the situation is proportional. Explain how you know. For any relationships that are proportional, find the constant of proportionality.
3. The grocery store sells apples for $1.25 per pound.
This is a proportional relationship.
Each pound of apples costs $1.25.
The constant of proportionality is 1.25.
4. A do-it-yourself car wash charges $2.00 plus $0.25 per minute to wash your car.
This is not a proportional relationship.
There is a $2.00 fee in addition to the fee per minute.
5. Abdul walks 1 4 mile in every 1 12 hour.
This is a proportional relationship.
The same distance is walked in every 1 12 hour.
The constant of proportionality is 3.
6. Ava uses 3 4 of a bag of fertilizer for every 1 5 of her lawn.
This is a proportional relationship.
The same amount of fertilizer is used for every 1 5 of her lawn.
Teacher Note
Since specific ratios are not defined in these situations, students may find the reciprocals of the constants of proportionality. These answers should also be marked correct.
Differentiation: Support
If students need support with determining the type of relationship when reading the situation, suggest creating a table or graph. This will allow students to see the familiar structure of relationships that are proportional or not proportional.
The constant of proportionality is 33 4 .
7. A package of 96 diapers costs $24.27. A package of 72 diapers costs $19.44. This is not a proportional relationship.
The unit rates associated with the cost per diaper are not the same.
8. A gas station sells gas for $2.79 per gallon.
This is a proportional relationship.
Each gallon costs $2.79.
The constant of proportionality is 2.79.
9. Noor wants to make a batch of trail mix. One batch, which is 41 2 cups of trail mix, contains 1 4 cup of raisins.
This is a proportional relationship.
Each batch of trail mix contains 1 4 cup of raisins.
10. So-hee owns a greenhouse and wants to buy carrot seeds. For $59.95, she can buy 1 pound of seeds. For $26.95, she can buy 1 4 pound of seeds.
This is not a proportional relationship. 5995 1 .5995 . =
The unit rates associated with the price per pound of seeds are not the same.
Call the class back together and facilitate a class discussion by using the following questions.
Which situations did you accurately predict? What led you to predict those types of relationships?
Which situation took the most thought?
Address any situations not mentioned by students before using the next prompt.
What did you notice in a situation that led you to believe there was a proportional relationship?
Problem 3 specifies a price for every pound of apples.
Problem 5 specifies that Abdul walks the same distance in every 1 12 hour.
Problem 6 specifies that the same amount of fertilizer is used for every 1 5 of Ava’s lawn.
Problem 8 specifies that the gas station sells each gallon of gas for $2.79.
Problem 9 specifies that for every batch of trail mix, 1 4 cup of raisins is needed.
Create Your Own
Students write descriptions of situations that can and cannot be modeled by proportional relationships.
For this activity, each student needs one note card. Direct students to write on one side of the note card a short situation, similar to those in problems 3–10, that describes a proportional relationship. On the other side, ask them to write a short situation for a relationship that is not proportional.
Once students are finished, have them trade with a partner. Each partner must determine which of the two situations on the note card is the proportional relationship. Encourage students to create tables or graphs as needed.
When students have made their decisions, tell them to check with their partners to find out whether they are correct.
Land
Debrief 5 min
Objective: Determine whether a written description represents a proportional relationship.
Initiate a class discussion by using the following prompts. Encourage students to revoice or build upon their classmates’ responses by using the terminology introduced in this topic. However, it is still acceptable for students to reference constant unit rate in place of constant of proportionality.
Given a written description, how can we determine whether it represents a proportional relationship?
Look for rate and ratio language and a constant of proportionality among values. If it is proportional, the pair of values (0, 0) makes sense in the situation. If you are still unsure, tables and graphs can help determine whether it is proportional.
Language Support
Consider having English learners partner with one another to write on the note cards. Depending on their need, consider providing two situations, without values, as an entry point for students.
UDL: Action & Expression
After the trade, encourage students to assess their application of strategies as they worked on the situations. Ask students to reflect on the characteristics of proportional relationships. Prompt students to ask themselves the following questions about their proportional relationship situation and identify where they experienced success and challenge:
• Did I include quantities that have a multiplicative relationship in my proportional relationship situation?
• Did I choose a situation that allows for the pair of values (0, 0) in my proportional relationship situation?
This supports executive function, encouraging students to monitor their own progress.
Consider offering alternatives to responding in writing. For example, students may use an audio recording device or word processing software to describe their situation.
Have students make additions or revisions to their Proportional Relationships Graphic Organizers if necessary.
What are the big ideas about proportional relationships from your graphic organizer?
A proportional relationship is a multiplicative relationship between two quantities.
A table of values shows a proportional relationship if there is a constant of proportionality that relates the pairs of quantities.
A graph represents a proportional relationship if the points appear to lie on a line that goes through the origin.
An equation represents a proportional relationship if it can be written in the form y = kx, where k is the constant of proportionality.
A written description represents a proportional relationship if a multiplicative relationship is evident between the two quantities.
Exit Ticket 5 min
Provide up to 5 minutes for students to complete the Exit Ticket. It is possible to gather formative data even if some students do not complete every problem.
Teacher Note
Consider having a few students share their graphic organizers. Have them discuss what they have learned about proportional relationships so far.
Topic B continues the learning on proportional relationships, so students will continue to add to and revise their graphic organizers.
Teacher Note
Assign the Practice problems for completion outside of class or use them in class if time remains after the lesson. Refer students to the Recap for support.
Identifying Proportional Relationships in Written Descriptions
In this lesson, we
• determined whether a relationship was proportional from its written description.
• used tables and graphs to justify that relationships were proportional.
Examples
1. Determine whether the following relationship is proportional. If so, define your variables and write an equation. If not, explain why not.
For every hour Liam babysits, he earns $12
Let t represent the total amount in dollars he earns.
Let h represent the number of hours he babysits.
th = 12
This is a proportional relationship since Liam earns the same amount for every hour he babysits.
2. Determine whether the following relationship is proportional. If so, explain how you know. If not, change one value to make it a proportional relationship.
Last week, Henry purchased 3 pounds of apples for $3.75 at the grocery store. This week, he went back to the grocery store and purchased 5 pounds of apples for $6.50
375 3 125 = 65 5 13 =
This is not a proportional relationship because the price per pound is not constant. If we change $3.75 to $3.90, then it becomes a proportional relationship. We can also change $6.50 to $6.25 to make it a proportional relationship.
Find the unit rate of each pair of values to determine whether the cost is proportional to the number of pounds of apples. There are two options to use for the unit rate: either 1.25 or 1.3
Sample Solutions
Expect to see varied solution paths. Accept accurate responses, reasonable explanations, and equivalent answers for all student work.
Student Edition: Grade 7, Module 1, Topic A, Lesson 6
Name Date
1. A cell phone company charges a flat fee of $40.00 per month and an additional $20.00 per month for each phone on the plan.
a. Is the relationship between the total monthly cost and the number of phones on the plan a proportional relationship? Explain your thinking.
No. If the $40.00 flat fee was not a part of the monthly cost, then it would be a proportional relationship. Because of the $40.00 fee, there is not a constant of proportionality between the total monthly cost and the number of phones on the plan.
b. Justify your thinking by creating a table or a graph. Number of Phones Total Monthly Cost (dollars) 0 40 1 60 2 80
There is not a constant of proportionality between the total monthly cost and the number of phones on the plan, so this is not a proportional relationship.
For problems 2 and 3, identify whether the relationship is proportional. If so, define your variables and write an equation. If not, change a value to make it a proportional relationship.
2. Each day of doggie daycare costs $25
The relationship is proportional.
Let c represent the total cost in dollars.
Let d represent the number of days.
cd = 25
3. On Tuesday, Ethan purchased 7 flowers for $6.75. On Friday, Ethan went back to the flower shop and purchased 14 flowers for $12.00
The relationship is not proportional. If $12.00 is changed to $13.50, then it is a proportional relationship. Alternatively, if $6.75 is changed to $6.00, then it is a proportional relationship.
4. Logan wants to make a specific shade of purple paint. He is told to mix 1 2 gallon of red paint with 3 4 gallons of blue paint to get the desired shade of purple. If he uses a gallon of red paint, how much blue paint does he need to mix with it? Use the table to justify your answer.
Logan needs 11 2 gallons of blue paint.
5. Pedro wants to make 31 2 batches of granola bars. His dad tells him that he needs 51 4 cups of oatmeal. How much oatmeal does Pedro need for a single batch?
For a single batch of granola bars, Pedro needs 11 2 cups of oatmeal.
For problems 6–8, multiply.
EUREKA MATH2
9. Yu Yan earns extra money working on weekends. She creates a graph showing the number of hours she works and the amount of money she earns each weekend.
a. Based on the graph, does the amount of money Yu Yan earns appear to be proportional to the number of hours she works? Explain how you know.
Yes, the amount of money Yu Yan earns appears to be proportional to the number of hours she works. The points appear to lie on a line that passes through the origin.
b. The next weekend, Yu Yan adds the point (0, 0) to the graph. What does the point (0, 0) mean in this context?
The point (0, 0) means that Yu Yan worked 0 hours and earned $0 that weekend.
c. How much money does Yu Yan earn if she works only 1 hour? Explain. Yu Yan earns $55 for 5 hours of work, which means that she earns $11 for 1 hour of work.
10. For every 5 apples that a fruit stand sells, it sells 3 oranges. Use the table to graph the relationship between the number of apples sold x and the number of oranges sold y Plot the points, title the graph, and label the axes.
9. Trail Mix (cups)
10. Carrot Seeds (pounds)
Topic B Working with Proportional Relationships
The focus of topic A is identifying proportional relationships in tables, graphs, equations, and written descriptions. In topic B, students apply their learning from topic A by analyzing, comparing, and solving problems involving proportional relationships. Students transition from identifying the constant of proportionality to using it to solve for unknown values in the relationship. They encounter familiar rate and part-to-whole ratio problems from grade 6 and discover proportional relationships between the quantities in those problems.
Students begin this topic by exploring proportional relationships through an open-ended activity that motivates the learning of the topic. They begin converting among the different representations of a proportional relationship and highlighting the constant of proportionality in each representation. This prepares them to compare proportional relationships in later lessons. Students compare the steepness of lines that represent proportional relationships. This allows students to make the connection between graphs of proportional relationships and the additive relationship between quantities in tables. Students encounter a new tool, the unit rate triangle, which enables them to see these additive patterns on the graph of the relationship and to understand why the point (1, r) represents the unit rate.
In this topic, students recognize everyday constant rates as proportional relationships. They calculate rates from real-world contexts, write equations in the form y = kx, and use their equations to solve for unknown values. Students use the Read–Represent–Solve–Summarize modeling strategies to solve a historical math problem featured in the Math Past resource. They discover the method of false position, connecting proportional reasoning to problem-solving strategies as they prepare to solve multi-step ratio problems. As the topic closes, students revisit part-to-whole ratio situations from grade 6, such as recipes and mixtures. They use equations, tape diagrams, and other models to represent the proportional relationships between the partial quantities and the whole. In a culminating, open-ended task, they create their own part-to-whole ratios.
In topic C, students write equations to find unknown side lengths in scale drawings. Grade 7 module 5 revisits multi-step ratio problems but includes percents. Students expand their knowledge of steepness and the unit rate triangle as they learn about slope in grade 8.
Progression of Lessons
Lesson 7 Handstand Sprint
Lesson 8 Relating Representations of Proportional Relationships
Lesson 9 Comparing Proportional Relationships
Lesson 10 Applying Proportional Reasoning
Lesson 11 Constant Rates
Lesson 12 Multi-Step Ratio Problems, Part 1
Lesson 13 Multi-Step Ratio Problems, Part 2
Handstand Sprint
Model a situation by using a proportional relationship to solve a problem.
Lesson at a Glance
This lesson is an open-ended modeling exploration. Students watch a video of a person hand-walking and create a class list of questions about the video. Students work in groups and apply proportional reasoning to determine how long it takes the person to cross the finish line. Groups of students present their solution strategy to the class. This lesson is designed as a formative assessment for several mathematical practices. Part 2 of the video is an optional extension to challenge students.
Key Question
• How can we use proportional reasoning to model situations and solve problems?
Achievement Descriptor
7.Mod1.AD6 Solve multi-step ratio problems by using proportional relationships (not expressed as percentages). (7.RP.A.3)
Agenda
Fluency
Launch 5 min
Learn 30 min
• Explore
• Handstand Race (Optional)
Land 10 min
Materials
Teacher
• None Students
• None
Lesson Preparation
• None
Fluency
Expressing Division
Students evaluate different representations of division.
Directions: Evaluate.
Launch
5
Students generate questions about a video.
Play part 1 of the video.
What questions do you have?
Resist the urge to answer the questions. Instead, use this time to encourage student curiosity.
Record each question, one at a time, and display it for the class. Then ask the class who else has that same question. Record the number of students who have the same question by placing check marks, plus signs, or other counting marks next to each question.
If no students question how long it takes to reach the finish line, offer that as your wondering and find out how many students also find that question interesting.
We won’t be able to explore all of these questions today. Let’s first tackle how long it takes to reach the finish line.
Direct students to record the focus question.
Focus question: How long will it take to reach the finish line?
Promoting the Standards for Mathematical Practice
When students collect and analyze data to determine how long it took the person to reach the finish line, they are modeling with mathematics (MP4).
Ask the following questions to promote MP4:
• What math can you write or draw to represent the hand-walking situation?
• What assumptions can you make to help estimate the time it takes to reach the finish line?
• What do you wish you knew that would help you find the answer?
UDL: Engagement
The hand-walking video provides an interesting context for students to apply proportional reasoning. After watching the video, students naturally generate questions about the context.
Learn
Explore
Students estimate the length of time it takes the person to cross the finish line.
Ask the following questions and have several students share their thinking.
How long do you think it takes the person to cross the finish line? What is an unreasonable guess? What is too high or too low?
If students disagree about whether a guess is unreasonable, have them explain their thinking.
Divide the class into groups of four. Allow time for groups to brainstorm about the information they need to answer the question. Circulate as groups discuss to monitor progress. Expect students to generate a list similar to the following:
• We need to know how far it is to the finish line.
• We need to know how quickly the person is moving.
• We need to know whether the person is moving at a constant rate.
Invite groups to share their lists with the class. Now that students have identified the information necessary to answer the focus question, direct them to develop a plan by using the following prompt.
Work with your group to make a plan to gather the needed information.
As students work in their groups to explore the focus question, monitor their progress. As needed, move groups forward by asking any or all of the following questions:
• Can we find specific markers on the video to help determine how much time it takes to travel a specific distance?
• Can we estimate the length of the race?
• What assumptions are we making?
Promoting the Standards for Mathematical Practice
Students use appropriate tools strategically (MP5) when they create a plan to determine how long it takes the person to reach the finish line.
Ask the following questions to promote MP5:
• What kind of strategy would be helpful to gather the needed information?
• Why did you choose to gather the data the way you did? Did that work well?
• How can you estimate the solution? Does your estimate sound reasonable?
Play part 1 of the video again as many times as needed for students to gather the data by using their plans. If possible, provide access to tools such as the internet to facilitate student plans.
Direct students to return to their groups to answer the focus question. Tell groups to be prepared to share their solution strategies with the class.
When groups finish, invite those groups to display their solution strategies or discuss them with the class. After all groups have shared, engage students in a discussion by asking the following questions:
• Are the answers we found reasonable?
• What assumptions did we make? How did those assumptions affect your solution?
• What information did you research? How did you use that information?
• How are our solution strategies similar? How are they different?
If time permits, continue on to the optional Handstand Race segment. However, if only a few minutes remain in class, play parts 2 and 3 to show students how long it took the person to cross the finish line. Have students discuss in their groups the following questions:
• Was our prediction close?
• Did we assume anything that was not true?
• If we had a similar problem, would we solve the problem differently?
Handstand Race (Optional)
Students determine who wins the handstand race.
If time permits, show part 2 of the video and follow a process similar to the one used with part 1.
Record the questions that students generated after watching the video. Record the number of students who have the same question by placing check marks, plus signs, or other counting marks next to each question.
If no students question who wins the race, offer that as your wondering and find out how many students also find that question interesting.
Differentiation: Challenge
Consider showing part 2 of the video to students who finish early. Direct them to move forward to the Handstand Race while other groups finish.
Let’s focus on finding who wins the race.
Direct students to record the focus question.
Focus question: Who wins the race?
Allow time for groups to brainstorm about the information they need to answer the question. Circulate as groups discuss to monitor progress. Expect students to generate the following list:
• We need to know how quickly each racer is moving.
• We need to know whether the racers are moving at a constant rate.
• We need to decide how to model the racer who keeps falling down.
Invite groups to share their lists with the class.
Now that students have identified the information necessary to answer the focus question, direct them to develop a plan by using the following prompt.
Work with your group to make a plan to gather the needed information.
As needed, move groups forward by asking any or all of the following questions. Encourage students to make reasonable assumptions. Without them, the students cannot move forward in finding who wins the race. Expect groups to make different assumptions.
• How can you account for the time it takes for the fallen racer to start again?
• What assumptions is your group going to make?
Play part 2 of the video again, as many times as needed.
Tell groups to be prepared to share their solution strategies with the class.
When groups finish, invite those groups to display their solution strategies or discuss them with the class. After all groups have shared, engage students in a discussion by asking the following questions:
• Are the answers we found reasonable?
• What assumptions did we make? How did those assumptions affect your solution?
• What information did you research? How did you use that information?
• How are our solution strategies similar? How are they different?
Play part 3 of the video to show who won the race. Ask the following question. Were you surprised by the result?
Land
Debrief 5
min
Objective: Model a situation by using a proportional relationship to solve a problem.
Use the following question to help students recognize where they used proportional reasoning to answer the focus question from the Explore segment. Encourage students to add on to their classmates’ responses.
How did your group use what you know about proportional relationships to find how long it took the person to cross the finish line?
Select from the following questions to debrief the lesson:
• What assumptions did your group make and how did that impact your results?
• Did your group face any obstacles? How did you overcome them?
• What would your group do differently?
• What was most helpful?
Exit Ticket 5 min
Provide up to 5 minutes for students to complete the Exit Ticket. It is possible to gather formative data even if some students do not complete every problem.
Teacher Note
The Exit Ticket asks students to reflect on this lesson. Consider guiding students’ reflection with a question that was not asked during the debrief.
Teacher Note
Assign the Practice problems for completion outside of class or use them in class if time remains after the lesson.
Sample Solutions
Expect to see varied solution paths. Accept accurate responses, reasonable explanations, and equivalent answers for all student work.
1. When you model situations using a proportional relationship, what assumptions do you make? You assume there is a constant rate.
2. How is the situation modeled in class different from a proportional relationship?
A true proportional relationship, like the relationship between the amount of flour and sugar needed for making multiple batches of the same recipe, doesn’t require assumptions.
3. Which other questions did you want explored in class? What information would we need to solve them? What assumptions, if any, would we need to make? Predict the answers to your questions.
7. Kabir earned money for every mile he walked in a Walk-a-Thon. The graph shows the relationship between the number of miles Kabir walked and the amount of money he earned in dollars.
a. Based on the graph, does the amount of money Kabir earned in dollars appear to be proportional to the number of miles he walked? Explain how you know.
Yes. The amount of money Kabir earned in dollars appears to be proportional to the number of miles he walked. The points on the graph appear to lie on a line that would go through the origin.
b. Kabir adds the point (0, 0) to the graph. What does the point (0, 0) mean in this context?
The point (0, 0) means that Kabir walked 0 miles and earned $0
c. How much money does Kabir earn if he walks only one mile? Explain how you know.
Kabir earned $50 for walking 10 miles.
50 10 = 5
This is a rate of $5 per mile, which means Kabir earns $5 for walking 1 mile.
8. Logan is training for the track team. He runs 500 meters 4 times every day.
a. At this rate, how many meters will Logan have run in a week?
14,000 meters
b. Logan continues to train at the same rate every day until he has run a total of 70 kilometers. How many days does he train?
35 days
Relating Representations of Proportional Relationships
Relate information among tables, graphs, equations, and situations to display a proportional relationship. Identify the constant of proportionality in different representations of a proportional relationship.
Lesson at a Glance
a. Complete the table to represent this relationship.
In this lesson, the connections among tables, graphs, equations, and situations of proportional relationships are enhanced. Collaborating with a partner, students discover that they can relate information from one representation of a proportional relationship to another. Students observe and discuss the importance of identifying the constant of proportionality and using it to represent the relationship in a different form.
Key Questions
• Which representation seems least challenging to determine the constant of proportionality? Is this always the case?
• Why is it beneficial to be able to identify the constant of proportionality?
Achievement Descriptors
7.Mod1.AD3 Identify the constant of proportionality in proportional relationships. (7.RP.A.2.b)
7.Mod1.AD4 Represent proportional relationships given in contexts with equations. (7.RP.A.2.c)
Agenda
Fluency
Launch 10 min
Learn 25 min
• Where Is the Constant of Proportionality?
• Two Boxes
• Other Representations
Land 10 min
Materials
Teacher
• Highlighter
• Empty boxes (2)
Students
• Highlighter
• Box A cards (1 card per student pair)
• Box B cards (1 card per student pair)
Lesson Preparation
• Label one box as Box A and the other as Box B.
• Prepare 1 box A card per student pair.
• Prepare 1 box B card per student pair.
Teacher Note
To help each pair of students pick a card from box B that does not match the representation of the card from box A, consider preparing more box B cards than the number of pairs of students.
Fluency
Write Equations
Students write equations from tables to prepare for identifying the constant of proportionality.
Directions: Write an equation that represents the relationship shown in the table.
Launch
Students use data from a table to create a situation and then identify the constant of proportionality, write an equation, and graph the relationship.
Present problem 1 to the class.
Pair students and use the Co-construction routine to have them create a situation that applies to the values in the table. Invite students to add a heading to the table and write a situation for part (a).
Give pairs around 2 minutes to compare the situations they constructed with those constructed by other groups.
For part (b), have pairs identify the constant of proportionality and describe what it means in their situation.
Invite students to share their ideas with the class and explain the proportional relationships they created.
For parts (c) and (d), give pairs around 4 minutes to define their variables, write an equation, label their axes, and graph the relationship.
Circulate to identify student work samples of equations and graphs to share with the class.
1. Consider the table shown.
a. Write a situation that shows this relationship.
A grocery store sells pears for $3.50 per pound.
b. What is the constant of proportionality? What does it mean in the situation described in part (a)?
The constant of proportionality is 3.5.
For every pound of pears purchased, the price is $3.50.
c. Write an equation that represents the situation in part (a). Define your variables.
Let x represent the number of pounds of pears purchased.
Let y represent the total cost in dollars.
yx = 35 .
d. Graph this relationship. Label the axes.
Pounds of Pears
Ask identified students to share their equations and graphs with the class. Consider facilitating a discussion about the similarities and differences among the samples shared.
Now that students are comfortable with all four representations of a proportional relationship, transition them to the next segment, where they highlight the location of the constant of proportionality in each representation.
Today, we will identify the constant of proportionality in each representation.
Learn
Where Is the Constant of Proportionality?
Students identify the constant of proportionality in different representations.
Introduce problem 2 and have students work with a partner to identify and highlight the constant of proportionality in the table, situation, equation, and graph.
2. Look back at the work from problem 1. In part (b), you calculated the constant of proportionality. Highlight the constant of proportionality in the table, in the situation, in the equation, and in the graph.
Teacher Note
As discussed in topic A, constant of proportionality and unit rate reference the same value. These two terms can be used interchangeably.
Some students might highlight the y-value of 3.5 in the table. This is accurate. Students also need to know how to calculate the constant of proportionality if the ordered pair (1, k) is not shown.
Facilitate a class discussion with the following prompt.
How do you find the constant of proportionality in a table? In a situation? In an equation? In a graph?
Invite several students to respond, and then focus the discussion on strategies for finding the constant of proportionality in a table. Students may identify the following strategies:
• Dividing the y-value by the x-value
• Using the y-value that corresponds to the x-value of 1
• When the x-value of 1 is not evident, extending the table to incorporate that value, and then determining the corresponding y-value
It is important that students understand that finding the constant of proportionality within one type of representation can vary in difficulty, which is why we want to know how to identify it from all representations. Elicit this thinking by showing a pair’s situation where the constant of proportionality is evident without calculation.
Ask students to work with their partner to create a situation where calculation is needed to determine the constant of proportionality. Have pairs share their new situations.
Promoting the Standards for Mathematical Practice
When students identify the constant of proportionality in tables, graphs, equations, and situations, they are making use of structure (MP7).
Ask the following questions to promote MP7:
• How can you use what you know about ratio tables to help you determine the constant of proportionality?
• How are tables and equations related?
Two Boxes
Students represent a given proportional relationship in another form.
Offer boxes labeled Box A and Box B to each pair of students. Each card in box A contains a representation of a proportional relationship as a table, an equation, a graph, or a situation. Each card in box B contains the word Equation, an empty table, the word Situation, or a blank graph. Have each pair pick one card out of box A and one out of box B.
Box A Cards
Box B Cards
Have students use the proportional relationship gathered from their card from box A to create the type of representation they chose from box B. The representation they create must be different from the one from box A. For example, if a pair of students chooses a card from box A that represents a proportional relationship as an equation and then chooses an equation card from box B, have the pair choose again from box B to get a new representation.
When pairs have completed the task, have them share their work with another pair.
Invite students to share with the class their processes for making new representations. Use the following prompts to debrief the activity.
Differentiation: Support
If students experience difficulty when creating the representation they chose from box B, ask them to create a different representation of their choosing. Another representation could be the bridge to creating the one that they chose.
For instance, some students might like to create a table before they create a graph.
Did your group go directly from one representation to the other, or did you take multiple steps?
My group went directly from an equation to a table. However, a different group went from a situation to a table to a graph.
Is it easier to create a new representation from some original representations than from others?
Creating a representation from an equation is easier than creating an equation from a table or a graph. When an equation is given, the constant of proportionality is shown, and no calculation is needed.
Other Representations
Students create representations of proportional relationships and highlight the constant of proportionality in each one.
Have students work independently on problem 3 and then discuss it with a partner once both students have finished.
3. Henry purchases 0.6 pounds of almonds for $5.25. The cost of almonds is proportional to the weight of the almonds.
a. Complete the table for this relationship. Enter values for the pounds of almonds p, and then determine the corresponding values for the total cost c in dollars. Calculate and highlight the constant of proportionality.
Differentiation: Challenge
Challenge students by asking them to create a different version of their representation or an additional representation.
For example, if students create a table after choosing that card from box B, they can create a table by using different values but maintaining the same constant of proportionality, or they can represent the situation with a graph.
b. What is the constant of proportionality for this relationship? What does it mean in this situation?
The constant of proportionality is 8.75. Each pound of almonds costs $8.75.
c. Write an equation for this relationship. Highlight the constant of proportionality.
d. Graph this relationship, and label the axes. Highlight the constant of proportionality.
Call the class back together to discuss any misconceptions that surfaced during the partner conversations.
Land
Debrief 5
min
Objectives: Relate information among tables, graphs, equations, and situations to display proportional relationships.
Identify the constant of proportionality in different representations of a proportional relationship.
Use the following prompts to guide a discussion about the constant of proportionality in different representations of a proportional relationship.
Which representation seems least challenging to determine the constant of proportionality? Is this always the case?
I notice the constant of proportionality more easily when the relationship is written as an equation. Sometimes I can identify the constant of proportionality easily in a table when the value for x is 1 or in a graph when the point (1, k) is visible. In situations, the constant of proportionality is sometimes given, but often I have to calculate it.
Why is it beneficial to be able to identify the constant of proportionality?
It gives us more information about the multiplicative structure between the x- and y-values of the relationship. It also allows us to relate one representation to another.
Have students highlight the constant of proportionality in the proportional relationships in their Proportional Relationships Graphic Organizers.
Exit Ticket 5
min
Provide up to 5 minutes for students to complete the Exit Ticket. It is possible to gather formative data even if some students do not complete every problem.
Teacher Note
Assign the Practice problems for completion outside of class or use them in class if time remains after the lesson. Refer students to the Recap for support.
c. Determine the constant of proportionality.
Relating Representations of Proportional Relationships
In this lesson, we
• related one representation of a proportional relationship to other representations.
• determined the constant of proportionality and used it to represent a proportional relationship in a different form.
Example
Use information from the graph to complete the following tasks.
a. Complete the table. x
b. Write a situation that shows this relationship. Noor
Since the graph is a line going through the origin, this is a proportional relationship. This helps determine the y-value when the x-value is 1. The line goes through (2, 90) so the line will also go through (1, 45)
Many situations could show this relationship. Each correct situation will use the following form: 45 of one unit for every 1 of another unit.
d. Write an equation relating x and y y = 45x
For proportional relationships, the equation is written in the form y = kx, where k is the constant of proportionality.
Expect to see varied solution paths. Accept accurate responses, reasonable explanations, and equivalent answers for all student work.
1. Shawn charges $15 for each lawn he mows. Is this a proportional relationship? If so, determine the constant of proportionality.
Yes. This is a proportional relationship because Shawn charges the same amount for each lawn. The constant of proportionality is 15
2. Given the table, determine whether the amount of money earned is proportional to the number of hours worked. If so, calculate the constant of proportionality and explain what it means in this situation.
Complete the table.
Student Edition: Grade 7, Module 1,
Lesson 8
b. Write an equation relating x and y yx = 60
c. Complete the table by using values from your situation.
c. Determine the constant of proportionality.
d. Graph the data from part (c). Draw the line that contains the data points.
d. Write a situation that describes this relationship.
On Sara’s road trip, she drove 60 miles per hour.
4. A proportional relationship has a constant of proportionality of 3.25
a. Write a situation with a constant of proportionality of 3.25.
A grocery store sells nectarines for $3.25 per pound.
b. Write an equation that represents the situation in part (a). Define your variables.
Let c represent the total cost in dollars.
Let p represent the number of pounds of nectarines.
cp = 325
EUREKA MATH
10. Which of the graphs appear to represent proportional relationships? Choose all that apply.
11. A 3-pound bag of apples costs $3.75. A 5-pound bag of apples costs $6.50. When the rate is expressed in dollars per pound, what is the unit rate associated with each bag of apples?
The unit rate associated with the 3-pound bag of apples is 1.25. The unit rate associated with the 5-pound bag of apples is 1.3
Explain how to use the point (1, r) to find the unit rate of a proportional relationship.
Relate the unit rate to the steepness of the line representing the proportional relationship by using the unit rate triangle with vertices (0, 0), (1, 0), and (1, r).
Lesson at a Glance
shows the distance in miles that an object moved based on the number of hours it was in motion.
a. From the graph, identify each relationship that has a unit rate greater than 1. Use characteristics of the lines to justify your answer.
The relationships represented by lines ℓ and m have unit rates greater than 1. The relationship represented by line n has a unit rate of 1, and lines ℓ and m are both steeper than line n
b. Which point on line ℓ has a y-coordinate equal to the unit rate? What does the unit rate mean in this situation?
The point (1, 5) has a y-coordinate equal to the unit rate of the relationship represented by line ℓ. The unit rate means that the object associated with line ℓ moved 5 miles for each hour it was in motion.
In this lesson, students explore the connection between unit rate and the steepness of the line representing a proportional relationship. After creating graphs for real-world situations, students observe that a proportional relationship with a larger unit rate is represented by a steeper line. Students create and analyze unit rate triangles and use the point (1, r) to compare proportional relationships. Students also use tables and equations to compare proportional relationships. This lesson introduces the term unit rate triangle.
Key Questions
• How does the steepness of a line relate to the unit rate triangle on a graph of a proportional relationship?
• How can we compare two proportional relationships?
Achievement Descriptors
7.Mod1.AD3 Identify the constant of proportionality in proportional relationships. (7.RP.A.2.b)
7.Mod1.AD5 Interpret the meaning of any point (x, y) on the graph of a proportional relationship in terms of the situation, including the points (0, 0) and (1, r), where r is the unit rate. (7.RP.A.2.d)
The graphs of several proportional relationships are shown. Each line
Students plot points to form lines to prepare for relating the unit rate to the steepness of the line.
Directions: Plot and label each pair of points. Then draw a line that connects the points and passes through (0, 0).
Teacher Note
Students may use the Quadrant I removable.
1. A(3, 3) and B(5, 5)
2. C(1, 3) and D(3, 9)
3. E(4, 1) and F (6, 11 _ 2 )
4. G(3, 5) and H(6, 10)
5. I(3, 2) and J(9, 6)
Launch
Students compare relationships displayed as graphs.
Display the graphs of groups A and B.
Group A
Group B
Invite students to think–pair–share about the following questions.
What do all the graphs in group A have in common?
All the graphs are lines that go up from left to right.
All the lines go through the origin.
All the graphs represent proportional relationships.
What do all the graphs in group B have in common?
All the graphs are lines.
None of the lines go through the origin.
None of the graphs represent proportional relationships.
Continue to display the graphs of groups A and B as you invite students to complete problems 1 and 2 with a partner.
1. Do you think this graph belongs in group A or group B? Why?
I think the graph belongs in group B because the graph does not represent a proportional relationship.
2. Do you think this graph belongs in group A or group B? Why?
I think the graph belongs in group A because the graph represents a proportional relationship.
When students are finished, invite them to share their responses.
Invite students to sketch a graph on their personal whiteboards that belongs in group A. Then, invite students to share their sketches with the class.
What is similar about the graphs created?
Each graph represents a proportional relationship. Each graph is a line through the origin.
What is different about the graphs created?
The lines each have a different steepness.
Language Support
If a student response uses the word steepness, review the meaning by asking students the following questions.
• Where have you heard steepness used before?
• How does steepness relate to running, biking, skateboarding, or skiing?
Display the graphs of groups C and D.
Group C
Group D
What do all the graphs in group C have in common?
Each graph has two lines that both represent proportional relationships. All the graphs have two lines through the origin. The dashed line is steeper than the solid line.
How could we modify the graphs in group C so that they would belong in group D instead of group C?
We could make the solid line steeper than the dashed line.
Consider modeling how to modify a graph to belong in group D, or inviting a student to do so.
Today, we will learn about proportional relationships and the steepness of the lines that represent them.
Learn
Eating Habits of Pandas
Students explore steepness of lines that represent proportional relationships.
Invite students to complete problem 3 with a partner.
3. This graph shows the eating habits of a giant panda at a zoo.
Differentiation: Support
If students need additional support with determining the number of pounds of bamboo a panda eats in 1 day, consider using the following prompts:
• Is this a proportional relationship? Why or why not?
• How can we use the point (4, 120) to find the number of pounds of bamboo a panda eats in 1 day?
a. What does the point (4, 120) represent in this situation?
In 4 days, the panda eats 120 pounds of bamboo.
b. How many pounds of bamboo does the panda eat in 1 day?
The panda eats 30 pounds of bamboo in 1 day.
c. Graph a line representing a proportional relationship that shows an amount a panda eats that is more than the amount that the original panda eats. Label the line ��. Determine the constant of proportionality of the relationship you graph.
Sample:
Number of Days
The constant of proportionality is 40.
d. Graph a line representing a proportional relationship that shows an amount a panda eats that is less than the amount that the original panda eats. Label the line ��.
Determine the constant of proportionality of the relationship you graph.
Number of Days
The constant of proportionality is 20.
e. Graph a line representing a proportional relationship that shows an amount a panda eats that is the same as the amount that the original panda eats. Label the line ℯ. Determine the constant of proportionality of the relationship you graph.
Number of Days
The constant of proportionality is 30.
Once most students are finished, invite students to share how they know that the panda eats 30 pounds of bamboo in 1 day.
Ask the following questions, gesturing to a graph to support student responses.
What does the constant of proportionality represent in this situation?
It represents the number of pounds of bamboo a panda eats per day.
How does the constant of proportionality change if a panda eats more food per day? It increases.
How does an increased constant of proportionality change the line that represents the proportional relationship?
A greater constant of proportionality makes the line steeper.
How does the constant of proportionality change if a panda eats less food per day? It decreases.
How does a decreased constant of proportionality change the line that represents the proportional relationship?
A smaller constant of proportionality makes the line less steep.
Let’s say each panda eats the same amount of bamboo as the other per day. What would you expect to be true about the constants of proportionality that represent the amount of bamboo they each eat per day?
They are the same.
Can you use this graph to determine exactly how much food a panda eats in any amount of time? Why?
No. Pandas do not continuously eat. This graph represents the typical amount a panda eats each day.
No. The graph only represents data up to 7 days and up to 140 pounds of bamboo.
Models are not perfect, but they help us visualize the relationship between the amount of bamboo eaten and the number of days.
Creating and Using the Unit Rate Triangle
Students explore ways to further proportional reasoning by using the unit rate triangle.
Display the graph and table. Then show how the graph and table change over a period of 3 days.
Promoting the Standards for Mathematical Practice
When students apply their understanding of the unit rate triangle to compare proportional relationships, they are making use of structure (MP7).
Ask the following questions to promote MP7:
• How are the unit rate triangle and the graph related?
• How can what you know about unit rate triangles help you compare proportional relationships?
What patterns do you see in the table?
With each additional day, the x-values are increasing by 1 and the y-values are increasing by 30.
What numbers belong in the next row of the table?
The x-value is 4 and the y-value is 120.
What unit rate describes the number of pounds of bamboo the panda eats per day?
30
Point to the unit rate triangles as you ask the following questions.
The graph shows three triangles. What do you notice about these triangles?
The triangles are the same.
The triangles have the same base length and the same height. Each triangle has a base of 1 unit and a height of 30 units.
The triangles show the addition patterns from the table. When the change in the x-value, the base length of each triangle, is 1, the change in the y-value, the vertical side length of each triangle, is 30.
The height of the triangles is the unit rate of the relationship the line represents. The side of each triangle that is not the base or the height lies on a line that travels through the origin.
Point to the unit rate triangle on the graph.
We call this first triangle the unit rate triangle. Why do you think we call it a unit rate triangle?
The triangle represents the unit rate of the number of pounds of bamboo the panda eats in 1 day.
Because unit rates are expressed as a quantity per 1 unit, I think it makes sense that this would be considered the unit rate triangle.
Invite students to complete problems 4 and 5 with a partner.
Differentiation: Support
If students suggest that the unit rate triangles have a base of 2 units and a height of 3 units, draw their attention to the scales on the axes.
Language Support
To assist students in understanding the meaning of a unit rate triangle, consider providing additional graphs of proportional relationships and asking them to draw unit rate triangles on each graph.
4. Consider the examples shown of triangles that are unit rate triangles and triangles that are not unit rate triangles. What do the unit rate triangles have in common?
UDL: Representation
Consider creating a color-coded chart to show the connections between the multiple representations of proportions and unit rate triangles.
They all have a base length of 1 unit.
5. Is this triangle a unit rate triangle? How do you know?
No. The base length is not 1 unit.
When students are finished, bring the class together and ask the following questions.
What is a unit rate?
The unit rate is the numerical part of a rate when the second quantity in the rate has a value of 1 unit.
What do all unit rate triangles in problem 4 have in common?
They all have base lengths of 1 unit.
One of the triangles that is not a unit rate triangle also has a base length of 1 unit.
Why is it not a unit rate triangle?
The side that is not its base or height does not lie on a line through the origin.
Based on what we have observed, a unit rate triangle is the triangle with vertices at (0, 0), (1, 0), and (1, r), where r is the unit rate.
Why do you think unit rate triangles must have a base length of 1 unit?
Unit rates are rates expressed as a quantity per 1 unit, so it makes sense that the base length would need to be 1 unit.
Invite students to complete problem 6.
6. Draw a unit rate triangle on the graph that represents a panda that eats 40 pounds of bamboo per day.
When students are finished, display the unit rate triangle.
Gesture to the point (1, 40).
What does this point represent?
This point represents the unit rate.
This point represents that the panda eats 40 pounds of bamboo in 1 day.
We just learned that a unit rate triangle must have a base that is 1 unit long, but this unit rate triangle has a base that stretches past two gridlines. Why is this triangle considered a unit rate triangle?
Two gridlines represent 1 day, so the base is 1 unit.
To be a unit rate triangle, the length of its base must be 1 unit. The number of gridlines between 0 and 1 can be any number.
The graph of every proportional relationship goes through the point (1, r). What do the coordinates of the point (1, r) tell us about the proportional relationship?
r is the constant of proportionality.
r is the unit rate.
How does the steepness of a line representing a proportional relationship relate to the point (1, r)?
The greater the value of r, the steeper the line.
Display the graphs representing panda A and panda B.
Number of Days
What conclusions can you make about panda A and panda B from this graph? Explain your thinking.
For each panda, the relationship between the number of pounds of bamboo eaten and the number of days is a proportional relationship. That is because each graph is a line through the origin.
The unit rate of the number of pounds of bamboo eaten per day is greater for panda B because the line representing panda B is steeper than the line representing panda A.
Panda B eats more food per day than panda A because the line representing panda B is steeper.
Panda B eats more food per day than panda A because the line representing panda B goes through the point (1, 40) and the line representing panda A goes through the point (1, 30) and 40 is greater than 30.
Promoting the Standards for Mathematical Practice
When students apply their understanding of the unit rate triangle to compare proportional relationships, they are making use of structure (MP7).
Ask the following questions to promote MP7:
• How are the unit rate triangle and the graph related?
• How can what you know about unit rate triangles help you compare proportional relationships?
Panda B
Panda A
Invite students to complete problem 7 with a partner. Circulate as students work, asking the following questions:
• How can you determine the number of pounds of bamboo the new panda eats in 1 day?
• What is the unit rate in this situation? How do you know?
• What is the base on the unit rate triangle? What is the height? How do you know?
• How can you use the unit rate to write an equation to represent the number of pounds of bamboo the panda eats per day?
7. A new panda at the zoo eats 137 pounds of bamboo in 5 days.
a. If the new panda eats a constant amount of bamboo each day, how many pounds of bamboo does it eat in 1 day?
137 ÷ 5 = 27.4
The panda eats 27.4 pounds of bamboo in 1 day.
b. The graph represents how many pounds of bamboo the new panda eats. Draw the unit rate triangle.
c. Complete the table.
(Note: The student responses to parts (c) and (d) are shown above on the table.)
d. On the table, show where the additive properties of the unit rate triangle appear.
e. Write an equation relating the number of days x to the number of pounds of bamboo eaten y for the new panda.
y = 27.4x
f. Write an equation relating the number of days x to the number of pounds of bamboo eaten y for the new panda if the panda grows and eats more than 27.4 pounds of bamboo per day.
Sample: y = 30x
When students are finished, bring the class together. Invite students to share their answers to part (f).
What do all the answers to part (f) have in common? Why?
The coefficient of x is greater than 27.4 because the unit rate is greater than 27.4. Invite students to complete problem 8 with a partner.
8. The tables show the number of pounds of apples and the number of pounds of yams a giraffe at the zoo eats for different numbers of days.
Number of Days Apples Eaten (pounds)
a. Write an equation relating the number of pounds of apples eaten y to the number of days x. y = 1 5 x
b. Write an equation relating the number of pounds of yams eaten y to the number of days x. y = 1 4 x
c. Does the giraffe eat more pounds of apples per day or more pounds of yams per day? How do you know?
The giraffe eats 1 _ 5 pound of apples and 1 _ 4 pound of yams every day. The giraffe eats more pounds of yams because 1 _ 4 is greater than 1 _ 5 .
When students are finished, invite them to share their strategies for writing the equations and for determining which food the giraffe eats more of. Then ask the following questions. Anticipate that some students may compare the relationships by comparing corresponding values of the same quantity.
If we were to create graphs of both equations, which line would be steeper? How do you know?
The line representing the number of pounds of yams eaten each day would be steeper because the constant of proportionality is greater. Number of Days Yams Eaten
Land
Debrief 5 min
Objectives: Explain how to use the point (1, r) to find the unit rate of a proportional relationship.
Relate the unit rate to the steepness of the line representing the proportional relationship by using the unit rate triangle with vertices (0, 0), (1, 0), and (1, r).
Facilitate a class discussion by using the following prompts. Encourage students to restate or build upon one another’s responses.
How does the steepness of a line relate to the unit rate triangle on a graph of a proportional relationship?
The steepness of the line depends on the point (1, r) of the unit rate triangle. As r increases, the line gets steeper.
How can we compare two proportional relationships?
There are many different strategies to compare proportional relationships. If the proportional relationships are represented on the same coordinate plane, we can compare the steepness of the lines. If the proportional relationships are represented in tables, we can find the unit rate or compare corresponding values of the same quantity.
Exit Ticket 5 min
Provide up to 5 minutes for students to complete the Exit Ticket. It is possible to gather formative data even if some students do not complete every problem.
Teacher Note
Assign the Practice problems for completion outside of class or use them in class if time remains after the lesson. Refer students to the Recap for support.
Name Date
Comparing Proportional Relationships
In this lesson, we
• compared the steepness of lines.
• determined the unit rate r from the point (1, r)
• connected the unit rate to the steepness of the line.
• created and analyzed the unit rate triangle.
Examples
Terminology
The unit rate triangle is the triangle with vertices at (0, 0), (1, 0) and (1, r), where r is the unit rate.
1. Write an equation that, if graphed, would be steeper than the graph of yx = 4 3 . Explain your reasoning.
yx = 3 2
For the graph of this line to be steeper, the constant of proportionality would need to be greater than 4 3 .
The larger the unit rate, the steeper the line.
3 2 4 3 >
The graph of the line yx = 3 2 would be steeper than the graph of the line yx = 4 3 RECAP
2. The graph and table represent the same proportional relationship.
a. On the graph, draw the unit rate triangle.
b. On the table, show where the additive properties of the unit rate triangle appear.
When the change in the x-values is 1 in a proportional relationship, the change in the y-values is the vertical side length of the unit rate triangle.
1. Relationship A has a constant of proportionality of 43 4 . Relationship B has a constant of proportionality of 3. When graphed, which relationship is represented by a steeper line? Explain your reasoning.
Relationship A is represented by a steeper line because, for every horizontal distance of 1 you go up 43 4 , which is more than 3
2. Write an equation that, if graphed, would be less steep than the graph of y = 7x. Explain your reasoning.
yx = 3
For this line to be less steep, the constant of proportionality needs to be less than 7 Student Edition: Grade 7, Module 1, Topic B, Lesson
a. How do you know that these lines represent proportional relationships? Each line goes through the origin.
b. Write an equation relating the number of seconds t to the number of coins sorted c for machine A.
ct = 25
c. Write an equation relating the number of seconds t to the number of coins sorted c for machine
d. Which machine sorts coins faster? How do you know?
Machine A sorts 2.5 coins per second because the constant of proportionality is 2.5.
Machine B sorts 2 coins per second because the constant of proportionality is 2
Machine A sorts coins faster than machine B because 2.5 is greater than 2
a. Write an equation relating Abdul’s pay p in dollars to the number of hours he works t pt = 875 b. Write an equation relating Eve’s pay p in dollars to the number of hours she works t. pt = 95 c. Who makes more money per hour? How do you know?
5. The graph and table represent the same proportional relationship.
a. On the graph, draw the unit rate triangle.
10. Determine whether each situation represents a relationship that is proportional or not proportional. Explain how you know.
Situation 1: Carrots cost $1.29 per pound.
Situation 2: At the bowling alley, it costs $3.00 to rent bowling shoes and $4.00 for each game played.
Situation 3: Kabir works at an ice cream shop and earns $9.50 an hour.
Situation 2 does not represent a proportional relationship because there is an initial cost to rent bowling shoes.
Situations 1 and 3 both represent proportional relationships because each has a constant unit rate and no additional cost.
11. Use the diagram to match each ratio description to its ratio.
b. On the table, show where the additive properties of the unit rate triangle appear.
For problems 6–9, add or subtract.
Applying Proportional Reasoning
Represent proportional relationships as equations.
Solve problems by applying proportional reasoning.
Jonas knows that 1 inch is equivalent to 2.54 centimeters. Let x represent the number of inches in a measured distance. Let y represent the number of centimeters in the same measured distance.
a. Write an equation that Jonas might use to convert between inches and centimeters.
yx = 2.54
b. Use the equation you created in part (a) to convert 11 inches to centimeters.
A distance of 11 inches is equivalent to 27.94 centimeters.
c. Use the equation you created in part (a) to convert 33 centimeters to inches. Round to the nearest inch.
Lesson at a Glance
In this lesson, students are presented with several real-world proportional relationship problems and work collaboratively to solve them. Through discussion and partner work, students identify the constant of proportionality and explain what it means in context.
Students write equations by using the constant of proportionality and then use the equations to solve for unknown values.
Key Questions
• Do you prefer to write an equation from a table, a graph, or a situation? Why?
• When we substitute a number for a variable in a two-variable equation, how do we determine which variable to substitute for?
Achievement Descriptors
7.Mod1.AD4 Represent proportional relationships given in contexts with equations. (7.RP.A.2.c)
7.Mod1.AD6 Solve multi-step ratio problems by using proportional relationships (not expressed as percentages). (7.RP.A.3)
Agenda
Fluency
Launch 5 min
Learn 30 min
• Taco Truck
• Dollars to British Pounds
• Recycling
Land 10 min
Materials
Teacher
• None Students
• Proportional Contexts Card Sort cards (1 set per student)
Lesson Preparation
• Prepare 1 set of Proportional Contexts Card Sort cards per student.
Fluency
Solve One-Step Equations
Students solve one-step equations to prepare for finding unknown values in situations modeled by proportional relationships.
Directions: Solve each equation.
Launch
Students identify proportional relationships given in various representations.
Have students work independently on the Proportional Contexts Card Sort activity. Instruct them to group together cards that have representations of the same proportional relationship. Two cards are included as distractors. They represent proportional relationships, but they do not match representations on any other cards. Once students are finished, have them compare solutions with one another.
Teacher Note
Instead of this lesson’s Fluency, consider administering the One-Step Equations–Multiplication Sprint. Directions for administration can be found in the Fluency resource.
UDL: Engagement
This Proportional Contexts Card Sort activity has representations that present varying amounts of difficulty in determining the constant of proportionality. Providing this range ensures that learners are appropriately challenged at their varied levels, helping to sustain students’ effort and persistence.
Circulate and listen for different solution pathways and misconceptions to address during the class discussion.
Facilitate a class discussion by inviting a few students to share their strategies for identifying equivalent relationships. Then discuss any misconceptions that led to errors in grouping the relationships.
Now that students have seen proportional relationships represented by situations, graphs, tables, and equations, transition them to the next segment, in which they will see what else they can learn from an equation of a proportional relationship.
All of these representations of proportional relationships help us understand the context. Today, we will use equations to help us answer questions about proportional relationships.
Learn
Taco Truck
Students write an equation from a table to help them find unknown values.
Direct students to the Taco Truck problem. Have students work with a partner on problem 1.
Teacher Note
It might be helpful to refer to the provided answer key for this activity before implementation.
1. The table shows how much time Lily worked and how much she earned during her last three shifts at the Taco Truck.
Differentiation: Support
Identifying and defining the two quantities that are proportional is an entry point into writing equations. Have students verbalize the relationship if they are having a difficult time writing the equation.
For example, “Take the number of hours worked and multiply that by 8.2. Then you have your earnings.” On their papers, students can translate their written descriptions into equations.
a. Are Lily’s earnings proportional to the number of hours she works? Explain your thinking.
Yes. Lily’s earnings are proportional to the number of hours she works. She earns $8.20 for every hour she works.
b. Write an equation relating Lily’s earnings e in dollars to the number of hours that she works h. eh = 8.2
c. Lily earns $45.10. How many hours does she work to earn that amount?
Promoting the Standards for Mathematical Practice
Lily works 5.5 hours to earn $45.10.
d. What are the coordinates of the vertices for the unit rate triangle for this relationship? Explain your reasoning.
(0, 0), (1, 0), (1, 8.2)
The first coordinate is always the origin, (0, 0). From there, you go one unit to the right, so the next coordinate is (1, 0). From this point, you go up by the unit rate, which is 8.2, so the coordinate is (1, 8.2).
e. Write an equation that produces a steeper graph than the graph of the equation you found in part (b). Use the same variables as in part (b). How does your new equation relate to the situation?
eh = 9
Lily would earn $9.00 per hour.
Call the class back together to discuss problem 1 by using the following prompts.
What strategies did you use to determine whether this is a proportional relationship?
We divided the earnings by the corresponding number of hours worked. When you always get the same value, then you know it is a proportional relationship.
We divided one amount of earnings by the corresponding number of hours worked. Then we multiplied the quotient by each of the other values for hours worked. When you get the corresponding earnings amount for each of the other values, you know it is a proportional relationship.
Students reason abstractly and quantitatively (MP2) as they decontextualize a proportional relationship to write and use an equation to solve for unknown values. Students then contextualize the solution to bring meaning to the value.
Ask the following questions to promote MP2:
• What does this table tell you about the equation?
• Does your answer make sense in this context?
UDL: Representation
As students describe their strategies, illustrate their thinking on the board. For each strategy, highlight and emphasize the structure of the table.
Teacher Note
Welcome discussion about how a bonus, raise, or other variation in pay may affect whether this is always a proportional relationship.
How did you determine the coordinates of the vertices for the unit rate triangle?
I know the first point of the unit rate triangle is always at (0, 0). From there, I know to go one unit to the right, so that coordinate is (1, 0). The next coordinate is determined by the unit rate r. It is located at (1, r). In this relationship, the unit rate is 8.2, so the coordinate is (1, 8.2).
Is it okay that students have different answers for part (e)?
Yes. The only requirement is that the constant of proportionality needs to be greater than 8.2. The larger the constant of proportionality of a relationship, the steeper the line of its graph.
Dollars to British Pounds
Students write an equation from a graph to help them find unknown values. Introduce the problem and read the directions to the students. Give them a minute to individually review the problem and the graph.
Bring the class back together to discuss the context of this problem. Refer to the Teacher Note for additional information about British pounds. Consider showing the photograph of British pounds. Facilitate a class discussion about students’ experiences with other currency.
Has anyone heard of someone needing to exchange currency?
What other types of currency have you heard of?
Mexican peso
Euro
Japanese yen
Swiss franc
Have students work in groups of three to complete problem 2. Circulate to provide support as needed.
Teacher Note
Support students in determining the coordinates of the vertices of the unit rate triangle. Move them forward by referencing the learning in lesson 9.
Teacher Note
In the United States, we use US dollars to pay for items because that is our currency. Other countries have their own forms of currency. If you travel outside of the US, you might need to exchange some US dollars for a different currency.
The United Kingdom, which includes England, Scotland, Wales, and Northern Ireland, uses the British pound as its currency. According to the Global Exchange, out of all existing forms of currency, the British pound is the oldest.
2. Four friends are planning to travel to the United Kingdom. They want to exchange some of their US dollars for British pounds. The graph shows their exchanges.
a. What does the point (375, 285) mean in this situation?
It means that 375 US dollars is equivalent to 285 British pounds.
b. Is the value of British pounds proportional to the value of US dollars? Explain your thinking.
Yes. British pounds are proportional to US dollars because the points appear to lie on a line that goes through the origin.
c. Write an equation to describe the number of British pounds p that someone receives when they exchange any number of US dollars d.
= 0.76
The constant of proportionality is 0.76. pd = 0.76
d. You are planning to travel to the United Kingdom and want to have 380 British pounds to pay for food and transportation during your trip. How many US dollars do you need to exchange? Show work to justify your answer.
I need 500 US dollars to exchange for 380 British pounds.
e. Your friend exchanges 300 US dollars. How many British pounds does she receive in return?
She receives 228 British pounds in exchange for 300 US dollars.
Have students return to the whole group. Facilitate a class discussion by using the following prompt.
Which part of problem 2 was the most challenging for your group? Why?
I thought part (c) was the most challenging because at first, I didn’t know which way to divide to find out how to go from dollars to pounds.
Then I noticed that in all four exchanges, the number of dollars was larger than the number of pounds. This told me that I would need to multiply the number of dollars by a number less than 1.
Differentiation: Challenge
Challenge students to write an equation to describe the number of US dollars that you receive when exchanging British pounds.
dp = 25 19
Accept all equivalent variations of this equation.
Recycling
Students write an equation from a situation to help them find unknown values.
Transition students to the Recycling problem. Consider having students work in pairs on problem 3. Circulate to find a variety of solution pathways for part (d).
3. A recycling company pays $0.35 per pound of empty aluminum cans. This is a proportional relationship.
a. What two quantities are proportional? Define variables for each quantity and write an equation to represent the relationship.
Payment for cans p in dollars and pounds of empty aluminum cans c are proportional.
pc = 0.35
b. You have 9.4 pounds of empty aluminum cans to recycle. How much money will you receive?
I will receive $3.29.
c. You have a receipt for $5.81 from the recycling company. How many pounds of empty aluminum cans did you recycle?
I recycled 16.6 pounds of empty aluminum cans.
d. The average empty aluminum can weighs about 15 grams. There are approximately 453.6 grams in a pound. How many empty aluminum cans do you need to recycle to earn $7.00?
Differentiation: Support
If students need guidance for part (d), have them think about the expected answer. Ask questions such as these:
• What unit are we looking for: the number of cans or a dollar amount?
I need 20 pounds of empty aluminum cans to earn $7.00.
Approximately 30.24 empty aluminum cans weigh a total of 1 pound.
• What is a reasonable number of cans? What is an unreasonable number of cans?
• What information is most useful? How can you find that information?
• What information can you find by using the $7.00? How does that relate to your final answer?
I need approximately 605 empty aluminum cans.
Confirm responses to parts (a)–(c). Then invite pairs to share their solution pathway to part (d).
Sample student responses for part (d) include the following:
Our group determined how many empty aluminum cans are in a pound before we determined how many pounds we would need to earn $7.00.
We found how many pounds of empty aluminum cans are needed to earn $7.00. Then we found how many empty aluminum cans were in 1 pound and multiplied.
Ask the class for reactions to the number of cans needed.
Did the number of empty aluminum cans surprise you?
I was expecting a smaller number of empty aluminum cans. It would take a while to gather 605 empty aluminum cans.
Differentiation: Challenge
Have students estimate how many beverages in aluminum cans are consumed by students and staff at your school each day. Ask questions such as these:
• If you set up recycling bins, about how much money could you earn from recycling those cans each week? Each year?
• Is it reasonable to estimate that everyone would recycle their cans? How can you factor that into your model?
Land
Debrief 5 min
Objective: Represent proportional relationships as equations. Solve problems by applying proportional reasoning.
Have students think–pair–share with a partner about the following questions.
When you wrote the equation for problem 3, how did that differ from writing the equations for problems 1 and 2?
In problem 3, the constant of proportionality was given in the situation. In problem 1, I divided the earnings by the corresponding number of hours to find the constant of proportionality k. In problem 2, I divided a value of British pounds by the corresponding value of US dollars to find the constant of proportionality. I used the constant of proportionality to write the equation for the relationship in the form of y = kx.
Do you prefer to write an equation from a table, a graph, or a situation? Why?
It depends on how the values are presented in the representation. When the constant of proportionality k is visible in the representation, it is simple to write the equation.
If you have a table or a graph, then you need to identify the ordered pair (1, k) to determine the constant of proportionality. A situation often includes the constant of proportionality; however, a calculation is sometimes needed.
When we substitute a number for a variable in a two-variable equation, how do we determine which variable to substitute for?
We need to see how the variables are defined. Substitute the given value for the variable that has the same units as that value. The other variable has the same units as the unknown that you are trying to find.
Exit Ticket 5 min
Provide up to 5 minutes for students to complete the Exit Ticket. It is possible to gather formative data even if some students do not complete every problem.
Teacher Note
Assign the Practice problems for completion outside of class or use them in class if time remains after the lesson. Refer students to the Recap for support.
1. Use the following table to answer parts (a)–(d).
a. Are Shawn’s earnings proportional to the number of hours he works? Explain your reasoning.
$12.50
b. Write an equation relating Shawn’s earnings e in dollars to the number of hours t he works. et = 125
c. Shawn earns $62.50. How many hours does he work? Shawn works for 5 hours.
d. Suppose Shawn works 17 hours next week. How much will he earn?
Shawn will earn $212.50
2. Yu Yan can drive an average of 23 miles for each gallon of gas that her car uses.
a. Write an equation relating the number of miles driven m to the number of gallons of gas used g mg = 23
b. Yu Yan plans to drive 391 miles. How many gallons of gas does she need?
Yu Yan needs 17 gallons of gas to drive 391 miles.
c. Yu Yan has 12 gallons of gas in her car. How far can she drive?
Yu Yan can drive 276 miles when she has 12 gallons of gas.
3. The graph shows conversions between the number of pints and the number of fluid ounces.
a. Are the number of pints and the number of fluid ounces proportional?
Yes. The points appear to lie on a line that goes through the origin.
b. Write an equation relating the number of fluid ounces z to the number of pints p. zp = 16
c. A recipe requires 11 pints of water. How many fluid ounces of water are in 11 pints of water?
There are 176 fluid ounces of water in 11 pints of water.
d. An average ice cube contains 1 fluid ounce of water. Shawn puts 64 ice cubes into an empty pitcher. When the ice cubes melt, approximately how many pints of water are in the pitcher?
When the ice cubes melt, there will be approximately 4 pints of water in the pitcher.
EUREKA MATH
EUREKA MATH
Teacher Edition: Grade 7,
So-hee has a part-time job that pays her $7.50 per hour. Let x represent the number of hours worked. Let y represent the earnings in dollars. yx = 11
Constant Rates
Represent rate problems as proportional relationships with equations.
Solve rate problems.
a. Nora earns a constant amount of money for each mile she rides. She rides 14 miles and earns a total of $235.90. How much money does Nora earn for each mile she rides?
23590141685 ÷= Nora earns $16.85 for each mile she rides.
b. Shawn earns $13.25 for each mile he rides. Shawn earns a total of $251.75. How many miles does Shawn ride?
25175132519 ÷=
rides 19 miles.
Lesson at a Glance
Students begin this lesson by using the problem-solving routine Read–Represent–Solve–Summarize to model and solve a historical problem involving proportional reasoning. Students then collaborate with a partner to illustrate and represent rate problems with double number lines and equations. Students identify familiar rates as proportional relationships.
Key Questions
• What is a rate, and how do we use rates to solve problems?
• What patterns do we notice in equations that represent rates?
Achievement Descriptors
7.Mod1.AD3 Identify the constant of proportionality in proportional relationships. (7.RP.A.2.b)
7.Mod1.AD4 Represent proportional relationships given in contexts with equations. (7.RP.A.2.c)
7.Mod1.AD6 Solve multi-step ratio problems by using proportional relationships (not expressed as percentages). (7.RP.A.3)
Nora and Shawn earn money for charity in a bike-a-thon.
• Review the Math Past resource to support the delivery of Launch.
Fluency
Divide Rational Numbers
Students divide rational numbers to prepare for solving rate problems.
Directions: Evaluate. 1. How many fourths are in one and a half?
5. How many halves are in one-fourth?
Launch
10
Students use modeling and false position as strategies to solve a historical math problem.
Introduce the problem posed in the Math Past resource and remind students of the problem-solving routine Read–Represent–Solve–Summarize they first encountered in grade 6.
Today we will work on internalizing productive habits for problem solving. Read the problem silently as I read aloud.
A quantity and its quarter added becomes 15. What is the quantity?
Math Past
A quantity and its quarter added becomes 15. What is the quantity?
This problem was first posed more than 3,600 years ago by an Egyptian scribe named Ahmes. Notice the use of quantity in this problem. When we talk about quantity, we’re referring to the measurement of something, like 4 apples or 6 hours. In this problem, quantity refers only to a number, like 4 or 6, without a unit like apple or hour.
Engage students in the Read portion of the problem-solving routine by having them turn and talk with a partner about these two questions:
• What does this problem ask me to find?
• What do I know?
Encourage students to read the problem as many times as needed to understand what is being asked. Consider having students share their understanding with the class before using the following prompt.
Now that we read and understand the problem, another productive habit is to find some way to represent the relationship we read about. We can represent it by using a tape diagram, an equation, a graph, a table, or any other model. Representing the relationship helps us move from simply reading the problem to solving it and summarizing our findings.
Teacher Note
Launch includes references to two important resources: the module 1 Math Past resource and the problem-solving routine Read–Represent–Solve–Summarize.
Modeling in A Story of Ratios® includes the routine Read–Represent–Solve–Summarize. This is an intermediate problem-solving routine that links the Read–Draw–Write (RDW) method from A Story of Units® to the formal mathematical modeling cycle used in A Story of Functions® .
Math Past
The Math Past resource includes more information about Ahmes’s problem and the method of false position.
Ahmes’s method of false position is one of several tools students may choose to solve problems in this lesson or in subsequent lessons. As time allows, consider asking students to use the method of false position to model and solve the second problem that appears in the Math Past resource:
• A quantity and its third and its quarter added becomes 76. What is the quantity?
Allow students to work in pairs to represent and solve the problem by selecting a model and testing solutions. As students work, circulate and listen to how students react and proceed when they realize that a solution is incorrect. Also look for students who use a tape diagram as a model for the unknown quantity and its quarter.
When most students finish, select a few pairs to share their models and solutions with the class. Encourage students to share their process for solving the problem, particularly the approach they took when they did not get the correct answer. Ask students to share how they revised their model to get closer to the correct answer until finally finding it.
Display the picture of the papyrus.
Give students a brief summary of the history of this problem. A sample explanation follows. Refer to the Math Past resource for additional information.
The problem we just solved was discovered on this papyrus, written by an Egyptian scribe named Ahmes. Scribes were educated citizens who, unlike most Egyptians of that time, could read, write, and do math.
Ahmes’s first guess was 4. Why do you think Ahmes started with the number 4?
Ahmes probably started with 4 because 4 is an easy whole number to work with. It is divisible by 4, so its quarter is easy to find, and it is also a whole number.
Facilitate a brief discussion about the method of false position.
Ahmes’s way of solving this problem is called the method of false position. The false part is the first guess with a simple whole number, which is almost always wrong. The position part is the unknown quantity in the problem.
How do you think Ahmes used his false answer, 4, to get the correct answer?
Ahmes knew that his false answer, 4, led to a sum of only 5, so he probably made another guess using a number larger than 4.
Ahmes might have realized that using 4 as his guess led to a sum of 5, which is 1 3 of the sum he was looking for. If he realized that, he probably just multiplied his guess by 3 to get a sum that would also be three times as large.
Ahmes needed to keep the quantity and its quarter in proportion. He multiplied his guess by 3, giving him the quantity 12 and its quarter 3, which is proportional to his guess of 4 and its quarter 1. These days, this method is often referred to as proportional reasoning.
How is false position similar to the method you used to solve the problem?
We also started with a wrong answer, and then we used our diagram to get closer to the correct answer.
In the next few lessons, we will solve a series of multi-step problems involving rates and ratios. Keep in mind Ahmes’s method of false position, as well as the productive habits for problem solving, as you work to find reasonable and accurate solutions.
Learn
Shawn’s Speed Problem
Students use a double number line to model a speed problem and to determine a proportional relationship.
Introduce Shawn’s Speed Problem. Read the problem aloud and then model the use of a double number line to reacquaint students with that tool. Demonstrate how to label the tick marks as Number of Hours and Number of Miles, and then ask students to do the same on their double number lines. Consider rotating the double number line so it is oriented vertically with the labels at the top. Then ask students whether they notice how much it resembles a ratio table.
Once students label the double number line, have them work with a partner to complete problem 2.
UDL: Representation
Consider activating prior knowledge about double number lines by providing an example before students complete Shawn’s Speed Problem.
Show a sample double number line, and model how to determine pairs of values by multiplying a given pair of values by a constant. Model how to partition an interval on the double number line and find values in between, such as finding halfway between 8 hours (560 miles) and 9 hours (630 miles) of driving in Shawn’s Speed Problem.
If students only need a brief review of how to model problems with a double number line, consider showing them a completed double number line and asking them what they notice and what kinds of problems they could solve with the diagram.
0120180240360480600 02346810
1. Shawn and his family are on a road trip. They drive at an average speed of 70 miles per hour on the highway. Use a double number line to show how many miles Shawn’s family drives during times ranging from 0 to 10 hours.
Number of Miles
Number of Hours 070 35 140210280350420490560630700 595
2. For parts (a)–(c), use the double number line to determine the distance that Shawn’s family drives during the given amounts of time.
a. Shawn’s family drives for 8.5 hours.
595 miles
b. Shawn’s family drives for 30 minutes.
35 miles
c. Shawn’s family drives for t hours.
70t miles
When students finish problem 2, facilitate a class discussion by using the prompts that follow.
How did you find the number of miles that Shawn’s family drives in 8.5 hours?
I placed a tick mark halfway between 8 hours and 9 hours. Then I found the number of miles halfway between 560 miles and 630 miles, which is 595 miles.
I multiplied 8.5 by 70.
How did you find how far Shawn’s family drives in 30 minutes?
I placed a tick mark halfway between 0 hours and 1 hour because 30 minutes is 1 2 of an hour. Then I found that the tick mark was halfway between 0 miles and 70 miles, which is 35 miles.
Teacher Note
A common error that students make when finding the distance Shawn’s family drives in 30 minutes is multiplying 30 by the speed, 70, to get 2,100. Address this misconception by probing for an understanding of the context.
• If Shawn’s family drives 70 miles in 1 hour, does it make sense that they drive 2,100 miles in 30 minutes?
• If Shawn’s family drives 70 miles in 1 hour, what is a reasonable estimate for how far they drive in 30 minutes?
Use the misconception noted above to deepen student understanding about the importance of recognizing units when calculating values by using rates.
Display the coordinate grid shown in figure 11.1.
Use the following prompts to develop the graph of Shawn’s Speed Problem with the class.
What should the graph of the relationship look like?
It should be a straight line that goes through the origin.
Which points do we use to draw the unit rate triangle on the graph? What does the triangle represent?
We use the points (0, 0), (1, 0), and (1, 70) to draw the unit rate triangle. The triangle represents the increase in time from 0 hours to 1 hour and the increase in distance traveled from 0 miles to 70 miles.
Either model how to graph the relationship between distance and time on the grid in figure 11.1 or display figure 11.2, which shows the completed graph. In figure 11.2, point out the unit rate triangle on the graph that includes the points (0, 0) and (1, 70). Display figure 11.3 and show how the triangle can be repeated to find new points on the graph of the relationship.
Ask students to complete problems 3 and 4 with their partners.
3. Write an equation relating the amount of time t in hours that Shawn’s family drives to the total distance d that they drive in miles.
dt = 70
4. Identify the constant of proportionality and explain what it represents in the situation. The constant of proportionality is 70. It represents the speed at which Shawn’s family drives in miles per hour.
Confirm responses for problems 3 and 4. Then use the following prompts to explain that proportionality can be imposed in many contexts that are not proportional, such as driving, to allow for reasonable predictions.
Is it reasonable to assume that Shawn’s family drives 70 miles per hour for 10 straight hours? What might affect Shawn’s predictions about how far his family will travel?
No, that assumption is not reasonable. Their speed might not be constant the whole time, or they might go slower when they are in traffic or traveling through cities. Also, Shawn and his family will likely have to stop for gas or food during the 10 hours, which makes Shawn’s prediction of how many miles they will travel too large.
Do you think all problems involving speed involve proportional relationships? Why?
I don’t think all problems involving speed are proportional relationships. It doesn’t seem realistic to do something at the same rate all the time. For example, when I’m running, sometimes I have to slow down, or I sprint at the very end of a race. When I’m in a car, we have to stop for lights, signs, and traffic. At other times, we can go pretty fast.
We often think about situations as proportional so we can make predictions about them, like knowing how much longer it will take to get to our destination while traveling. You might have done this in real life without even thinking about it. Have you ever tried to predict how much longer it will take you to read a book based on how long it has taken you so far? If so, then you have taken a situation that is not proportional and thought about it as proportional to make a reasonable prediction.
Patterns in Equations That Represent Rates
Students explore rate language and contexts, notice the structure of rate equations, and use equations to find unknown values.
To highlight the patterns part of Patterns in Equations That Represent Rates, consider assigning only part (a) of each problem first and then engaging students in a discussion focused on rate. Next, assign part (b) and facilitate a discussion focused on using unit rate to write an equation. Finally, assign part (c) and discuss how to use the equation to answer a specific question about each situation.
Differentiation: Support
Students may need additional practice calculating rates, writing equations, and using equations to solve problems. Consider providing problems similar to the rate problems that students worked with in Patterns in Equations That Represent Rates. Two sample problems are given below. Scaffold these problems if needed by asking students to first calculate the unit rate, then write the equation, and then solve for the unknown.
• You can fill a 5-gallon bucket with your garden hose in 50 seconds. At that rate, how long does it take that hose to fill a pool that holds 6,138 gallons?
• You count 25 heartbeats in 20 seconds. Predict how many heartbeats you would count in an hour.
Use the following prompts after students complete part (a) in problems 5–7.
What other situations can you think of that have rates?
Cost per pound of fruit at the grocery store
The average speed that I can run a mile in gym class
What do you notice about the numerical value of the rate?
It is the unit rate and the constant of proportionality of the relationship.
What information do rates provide?
They tell us how many units of one quantity there are for every one of another quantity.
Use the following prompts after students complete part (b) in problems 5–7 to make sure that students formalize how to use the unit rate to write an equation.
What do you notice about how the unit rate is used to write the equation?
The equations are all written in the form y = kx, where k represents the unit rate.
How do you write the equation when the unit rate is not provided or is not obvious?
If the unit rate is not provided, I divide the y-value by the x-value to calculate the unit rate, and then write the equation.
Use the following prompts after students complete part (c) in problems 5–7.
Do these situations represent proportional relationships? How do you know?
Yes. They represent proportional relationships because they all have constant unit rates. Each equation is written in the form y = kx, where k represents the unit rate of the situation and is also the constant of proportionality.
What do you think about or pay attention to when you solve for an unknown value in an equation that represents a rate?
I pay attention to what the variables mean so I can substitute the number I’m given for the correct variable in the equation.
I think about whether my answer makes sense. If I get something that seems wrong or unreasonable, I double check my work.
Teacher Note
In module 1 topic A lesson 2, students learned how to structure the equation of a proportional relationship.
In part (a) of Patterns in Equations That Represent Rates, students who define the unit rate as 18 should write the equation as d = 18v. Students who define the unit rate as 1 18 should write the equation as vd = 1 18 . However, in this context, a rate of miles per gallon is more common and useful.
Guide students to think through which unit rate makes more sense in a given context and then to use that unit rate to write their equations. Students should begin to notice and describe patterns between the rate units and the structure of the variables in the equation. However, avoid telling students that the units cancel out between the rate and the independent variable, as that is reserved for high school.
5. A hose completely fills a 15-gallon container with water in 1.5 minutes.
a. What is the unit rate, and what does it mean in this situation? 15 15 . = 10
The unit rate is 10. This means that in every minute, the hose releases 10 gallons of water.
b. Write an equation to represent this situation. Define the variables in your equation.
Let v represent the volume of water released in gallons, and let t represent the time in minutes.
vt = 10
c. How long does it take for the same hose to fill a 2,000-gallon pool?
vt t t t = = ÷= ÷ = 10 2,00010 2,000101010
It takes 200 minutes to fill a 2,000-gallon pool.
6. You count 20 heartbeats in 15 seconds.
a. What is the unit rate, and what does it mean in this situation?
The unit rate is 11 3 . This means that in every second, your heart beats 11 3 times.
b. Write an equation to represent this situation. Define the variables in your equation.
Let b represent the number of heartbeats, and let t represent the time in seconds.
bt = 11 3
Promoting the Standards for Mathematical Practice
As students solve multi-step rate problems by finding entry points, monitoring their own progress, and questioning whether the values they calculate make sense, they are demonstrating perseverance and sense-making (MP1).
Ask the following questions to promote MP1:
• What are some things you can try to start solving the problem?
• How can you simplify the problem?
• Does your answer make sense?
c. At this rate, how many times does your heart beat in a minute?
It beats 80 times in a minute.
7. You pay $1.80 for 12 pencils.
a. What is the unit rate, and what does it mean in this situation?
18 12 = 0.15
The unit rate is 0.15. This means that for every pencil purchased, I pay $0.15.
b. Write an equation to represent this situation. Define the variables in your equation.
Let c represent the total cost in dollars, and let p represent the number of pencils purchased.
cp = 0.15
c. How many pencils can you buy with $12?
I can buy 80 pencils with $12.
Land
Debrief 5 min
Objectives: Represent rate problems as proportional relationships with equations.
Solve rate problems.
Facilitate a class discussion by using the following prompts. Encourage students to articulate the strategies they used to write rates and equations to describe given situations.
What is a rate, and how do we use rates to solve problems?
A rate is how we describe a ratio relationship, such as how many miles were driven and how many hours it takes. If we know the rate, then we can use it to write an equation like y = kx. To answer a question about the situation, we need the rate and one other value, either an x-value or a y-value. Then we can solve the equation.
What patterns do you notice between rates and the equations that represent them? Give an example.
The variable in the equation is always one of the two units in the rate. For example, if the rate is 10 gallons per minute, then the unknown value I solve for will be either gallons or minutes.
The coefficient in the equation is the unit rate. For example, the unit rate in Shawn’s Speed Problem is 70, which represents the speed in miles per hour. The equation that represents that relationship is d = 70t.
Exit Ticket 5 min
Provide up to 5 minutes for students to complete the Exit Ticket. It is possible to gather formative data even if some students do not complete every problem.
Teacher Note
Assign the Practice problems for completion outside of class or use them in class if time remains after the lesson. Refer students to the Recap for support.
Recap
Name Date
Constant Rates
In this lesson, we
• represented rate problems with double number lines, graphs, and equations.
• observed that situations with constant rates represent proportional relationships.
• calculated familiar unit rates such as speed, gas mileage, and heart rate and used them to solve for unknown values.
• observed patterns in how rates are used to write equations.
Example
A local mini-triathlon is a race involving three parts: a 0.25-mile swim, a 6.2-mile bike ride, and a 1.5-mile run.
a. Eve completes the swim portion of the mini-triathlon in 10 minutes. What is her average swimming speed in miles per minute?
025 10 = 0.025
Eve swims at an average speed of 0.025 miles per minute.
b. What is Eve’s average swimming speed in miles per hour? 1hour60minutes = 10 60 1 6 =
Since there are 60 minutes in 1 hour, 10 minutes is equivalent to 1 6 of an hour.
025 1 6 = 1.5
Eve swims at an average speed of 1.5 miles per hour.
Average speed is a rate. Find the rate by dividing the distance Eve swims, 0.25 miles, by the time it takes her to swim, 10 minutes.
c. Write an equation relating the total distance Eve swims d in miles to the number of minutes she swims m
dm = 0.025
Write equations in the form d = rt, where d represents distance, r represents rate, and t represents time. In this case, we use m to represent the amount of time in minutes.
d. Write an equation relating the total distance Eve swims d in miles to the number of hours she swims h dh = 1.5
Pay attention to the units of the rate. To find miles per hour, convert the time in minutes to a fraction of an hour. 10 minutes is 1 6 of an hour because there are 60 minutes in an hour.
e. Part of the swim portion of the race involves swimming the full length of a pier, which is 0.1 miles long. How many minutes does it take Eve to reach the end of the pier?
dm m m m = = ÷= ÷ = 0.025 0.10.025 0.10.0250.0250.025 4 It takes Eve 4 minutes to reach the end of the pier.
Substitute 0.1 for d because it is the distance in miles that Eve swims.
1. Yu Yan competes in a sprint triathlon. The race consists of three parts: a 0.5-mile swim, a 12.4-mile bike ride, and a 3.1-mile run.
a. Yu Yan completes the swim portion of the sprint triathlon in 25 minutes. What is her average swimming speed in miles per minute?
Yu Yan swims at an average speed of 0.02 miles per minute.
b. What is her average swimming speed in miles per hour?
Yu Yan swims at an average speed of 1.2 miles per hour.
c. Write an equation relating the total distance Yu Yan swims d in miles to the number of minutes she swims m
dm = 0.02
d. Write an equation relating the total distance Yu Yan swims d in miles to the number of hours she swims h
dh = 1.2
e. Part of the swim portion of the race involves swimming the full length of a pier, which is 0.2 miles long. Yu Yan swims at her average speed. How many minutes does it take Yu Yan to reach the end of the pier?
It takes Yu Yan 10 minutes to reach the end of the pier.
f. Yu Yan completes the bike ride in 48 minutes. What is her average biking speed in miles per hour?
Yu Yan bikes at an average speed of 15.5 miles per hour.
g. Write an equation relating the total distance Yu Yan bikes d to the time in hours she bikes h
dh = 15.5
h. Yu Yan’s friends are waiting to cheer for her at a place that is 6.2 miles from the start of the bike race course. Using the equation from part (g), for how many minutes does Yu Yan bike before reaching her friends?
Since there are 60 minutes in an hour, it takes Yu Yan 24 minutes to reach her friends.
i. Yu Yan finishes the whole sprint triathlon in 1 hour and 38 minutes. Using the information above, find Yu Yan’s average pace in minutes per mile for the run portion of the triathlon. Round your answer to the nearest tenth.
Yu Yan’s pace is about 8.1 minutes per mile.
2. A lawn mower uses 0.75 gallons of gasoline in 50 minutes of mowing.
a. How many gallons of gasoline does the lawn mower use in an hour of mowing? The lawn mower uses 0.9 gallons of gasoline per hour of mowing.
b. Write an equation to relate the number of gallons of gasoline g that the lawn mower uses to the time spent mowing h in hours.
gh = 0.9
c. Liam estimates that his lawn mower has about 1.25 gallons in the gas tank. How long can he mow before the gas tank is empty? Round your answer to the nearest tenth of an hour. Liam can mow for about 1.4 hours before the gas tank is empty.
Remember
For problems 3–6, add or subtract.
EUREKA MATH2
7. The graphs of several proportional relationships are shown. Each line shows the distance in miles that an object moves based on the number of hours it is in motion.
8. Consider the given rectangle. 1inc3hes 4 312inches
a. Find the area of the rectangle. The area of the rectangle is 61 8 square inches.
b. Find the perimeter of the rectangle. The perimeter of the rectangle is 101 2 inches.
a. Using the graph, identify each relationship that has a unit rate less than 1. Discuss steepness of the lines in your response.
The relationship represented by line 𝓀 appears to have a unit rate of 1. The relationships represented by lines 𝓁 and 𝓂 have unit rates less than 1 because they are less steep than line 𝓀
b. Identify the point on the graph that best demonstrates the unit rate of the relationship represented by line 𝒿. What does the unit rate mean in this context?
The point (1, 4) best demonstrates the unit rate of the relationship represented by line 𝒿 The unit rate is the distance the object has moved in one unit of time, which in this case is one hour.
Multi-Step Ratio Problems, Part 1
Solve multi-step ratio problems by using proportional reasoning.
Lesson at a Glance
In this lesson, students write ratios to relate different quantities in a situation where two parts make a whole. They discover different proportional relationships within the situation, connecting to their knowledge of part-to-whole ratios such as A : A + B, B : B + A, and A : B from grade 6. Students use this understanding to write equations to describe proportional relationships and solve multi-step ratio problems. This learning builds a foundation for the task in lesson 13, where students encounter ratio relationships with more than two parts that make up a whole.
Key Question
• What proportional relationships exist in a situation where there is a consistent ratio between two parts that form a whole?
Achievement Descriptors
7.Mod1.AD3 Identify the constant of proportionality in proportional relationships. (7.RP.A.2.b)
7.Mod1.AD4 Represent proportional relationships given in contexts with equations. (7.RP.A.2.c)
7.Mod1.AD6 Solve multi-step ratio problems by using proportional relationships (not expressed as percentages). (7.RP.A.3)
Agenda
Fluency
Launch 5 min
Learn 30 min
• Comical Proportions
• Lily’s Special Lemonade
Land 10 min
Materials
Teacher
• None
Students
• None
Lesson Preparation
• None
Solve One-Step Equations
Students solve one-step equations to prepare for solving multi-step ratio problems.
Directions: Solve each equation.
Teacher Note
If time permits, ask students to discuss the similarities and differences between problems 1 and 2 or problems 5 and 6.
Launch
Students generate possible problems for a part-to-whole context.
Display the picture of the cups and pitcher to the class.
Pair students and use the Co-construction routine to have partners write possible mathematical problems to match the situation.
Give pairs 3 minutes to compare the problems they construct with other groups.
Invite pairs to share the problems they construct with the class and explain the relationship to the situation.
Sample student responses:
If you use 1 cup of water to make 16 ounces of strawberry lemonade, how many cups of water will you need to make 32 ounces of strawberry lemonade?
The ratio of the amount of water to the amount of lemon juice in a recipe is 2 : 1. If 2 pints of juice are used, how much water do you need?
Remind students of the concept of part-to-part and part-to-whole ratios by using the prompt that follows.
We can write ratios that compare a part to a part, such as the amount of water to the amount of lemon juice in a recipe, or ratios that compare a part to a whole, such as the amount of lemon juice to the total amount of strawberry lemonade made. Today, we will look at both types of ratios and explore the proportional relationships between the parts and the whole.
UDL: Representation
Describe the diagram to students to present information in more than one mode, providing options for perception.
Differentiation: Support
If students need more structure, model by using the following question: An 8-ounce glass of strawberry lemonade is made with 4 ounces of water, 2 ounces of strawberry syrup, and 2 ounces of lemon juice. How many ounces of each ingredient will you need to make a 24-ounce pitcher of strawberry lemonade?
Learn
Comical Proportions
Students use ratio reasoning to solve a multi-step problem.
Present the Comical Proportions problem. Read the problem aloud while students follow along. Before allowing students to solve, facilitate a discussion to ensure they comprehend the problem by using the prompts that follow.
What does it mean that “Maya wants the ratio of the length of the head … to the length of the body … to be constant in every frame”? Why do you think this is important to a comic strip artist?
This means that the sizes of the superhero’s head and body will look proportional in each frame. For example, if the superhero is drawn far away in a scene, both the head and body will be small.
Look at the values in the table. About how many times the length of the superhero’s head is the length of the body? How can you estimate that?
The length of the superhero’s body is about 9 times the length of the head. In the bottom row, I notice that the head is 21 4 centimeters, and the body is 18 centimeters. If I round 21 4 to 2, that means that the length of the body is about 9 times the length of the head, because 2 ⋅ 9 = 18.
Have students complete the table and parts (a)–(d) of Comical Proportions in pairs or groups.
1. Maya creates a comic strip about a superhero. The superhero is drawn in different sizes and poses in different frames of the comic strip. However, Maya wants the ratio of the length of the head (from the chin to the top of the hair) to the length of the body (from the toes to the bottom of the head) to be constant in every frame.
Language Support
Support students’ comprehension of this problem by having them read or listen to the text multiple times. For example, you could first read the problem aloud to the class, and then have students switch off reading every other sentence with a partner, after which they could summarize the problem in their own words with a partner.
UDL: Representation
Activate prior knowledge about three-column tables and part-to-whole ratios by asking students some comprehension questions before solving:
• How is this table different from the tables we have been working with in this module?
• What does each column represent?
• How do we find the value in the third column?
a. Complete the table. Find the unknown lengths by determining the value of the ratio from the bottom row and applying it to the other two rows.
b. What is the value of the ratio of the length of the superhero’s head to the length of the body, and what does it mean?
The value of the ratio is 1 8 . The length of the superhero’s head is 1 8 of the length of the body.
c. What is the value of the ratio of the length of the superhero’s body to the total length?
d. What is the value of the ratio of the length of the superhero’s head to the total length?
Review the solutions and facilitate a discussion about the values of the ratio, leading students to understand the different proportional relationships in the situation.
How did you use the different values of the ratio to find the unknown values in the table?
Once I knew the length of the superhero’s head was 1 8 of the length of the body, I could multiply any given body length by 1 8 to find the head length in that frame. Or I could multiply any head length by 8 1 , or 8, to find the body length.
Is the value of the ratio of head length to body length equivalent in every frame?
What other sets of equivalent ratios do you notice in this situation?
Yes. The value of the ratio of head length to body length is always 1 8 . The value of the ratio of body length to total length is always 8 9 . The value of the ratio of head length to total length is always 1 9 .
What different proportional relationships exist in this situation?
The length of the superhero’s body and the length of the head are proportional to each other. Each length is also proportional to the total length.
After this discussion, have students use their ratio values to complete part (e) of the problem.
e. Using the values of the ratios that you identified, write equations for at least three different proportional relationships in this situation. Use the variables shown in the table.
Sample:
Select a few students to share their equations.
UDL: Action & Expression
Consider reviewing division of mixed numbers and fractions before beginning the Comical Proportions problem. Give each step brief labels, such as “Rename as a fraction greater than 1” and “Rewrite as multiplication by the reciprocal.”
Keep the example problem posted for students to refer to as they work.
Lily’s Special Lemonade
Students write and use equations to describe proportional relationships within part-to-part and part-to-whole ratios.
Present the Lily’s Special Lemonade problem. Allow students to work with partners or in groups to complete the problem.
As students work, circulate and look for students who identify and use the different proportional relationships:
• The number of cups of iced tea is 8 3 times the number of cups of lemonade.
• The number of cups of lemonade is 3 8 times the number of cups of iced tea.
• The amount of total drink is 11 8 times the number of cups of iced tea.
• The amount of total drink is 11 3 times the number of cups of lemonade.
2. Lily makes a drink by mixing lemonade and iced tea. She uses 11 2 cups of lemonade for every 4 cups of iced tea.
a. Complete the table.
Promoting the Standards for Mathematical Practice
When students identify and use the different proportional relationships within a situation involving parts and wholes, they are making use of structure (MP7).
Ask the following questions to promote MP7:
• How are the parts and wholes related? How could that help you find the unknown value?
• How is this problem similar to proportional relationship problems you have solved before?
b. Write an equation to describe the proportional relationship of the total number of cups of the drink to the number of cups of lemonade.
dl = 11 3
c. Write an equation to describe the proportional relationship of the total number of cups of the drink to the number of cups of iced tea.
= 11 8
When most groups have completed the problem, ask a few students to identify and explain the relationships they used to solve for the unknown values in the table. Facilitate a discussion about proportional relationships in the lemonade recipe.
How did you find the constant of proportionality for the relationship of the total number of cups of the drink to the number of cups of lemonade? What is that constant of proportionality, and what does it represent?
I divided the total amount of the drink, 51 2 cups, by the amount of lemonade, 11 2 cups. The constant of proportionality of the relationship is 11 3 . There are 11 3 , or 32 3 , total cups of the drink made from every 1 cup of lemonade used.
Debrief 5 min
Objective: Solve multi-step ratio problems by using proportional reasoning.
Use the following prompts to guide a discussion about multi-step ratio problems. Encourage students to make connections between solving different types of problems, such as part-to-whole ratio problems and rate problems. Help students notice that they solve those problems by identifying a proportional relationship within the problem and by using the constant of proportionality to write an equation.
What different proportional relationships exist in a situation where there is a consistent ratio between two parts that form a whole? Explain the proportional relationships you found in the Lily’s Special Lemonade problem.
Each part is in a proportional relationship with the whole. Each part is also proportional to the other part. For example, in Lily’s Special Lemonade, the amount of lemonade is proportional to the total amount of the drink, and it is also proportional to the amount of iced tea.
How are the ratio problems in this lesson similar to the rate problems that we solved in lesson 11?
In lesson 11, we found rates like speed in miles per hour or flow rates in gallons per minute. In the Comical Proportions problem, we found the length of the superhero’s head per 1 centimeter of the length of the body, and in Lily’s Special Lemonade, we found the amount of lemonade per 1 cup of total drink. In both lessons, we had to find a unit rate to write the equation and solve for the unknown values.
Both types of problems can be solved with tables and equations.
Exit Ticket 5 min
Provide up to 5 minutes for students to complete the Exit Ticket. It is possible to gather formative data even if some students do not complete every problem.
Teacher Note
Assign the Practice problems for completion outside of class, or use them in class if time remains after the lesson. Refer students to the Recap for support.
Recap
b. What is the constant of proportionality between the number of cups of flour and the number of cups of sugar? What does the constant of proportionality represent?
Multi-Step Ratio Problems, Part 1
In this lesson, we
• wrote ratios and created tables to represent situations where two parts combined to make a whole.
• observed that part-to-whole situations can be described by proportional relationships.
• identified the value of the ratio of each part to the whole and of each part to the other part.
• used the value of the ratio to solve for unknown parts and wholes.
Example
The table shows the amounts of sugar and flour that are needed to make batches of various sizes for a cookie recipe.
a. Complete the table.
Use the multiplicative relationship between rows to find unknown values. The amount of sugar in the second batch, 11 2 cups, is twice the amount of sugar in the first batch, 3 4 cups.
The constant of proportionality is the value of the ratio between the two items in the recipe. Find the value of the complex fraction by rewriting it as fractions greater than 1 and dividing.
The constant of proportionality is 5 3 There are 5 3 , or 12 3 , cups of flour for every 1 cup of sugar that is used.
c. Write an equation that relates the number of cups of flour and the number of cups of sugar.
= 5 3
Because the amount of flour is proportional to the amount of sugar, the equation is in the form y = kx The constant of proportionality, k, represents the number of cups of flour per 1 cup of sugar.
Find the total amount by adding the cups of sugar and the cups of flour.
Edition: Grade 7, Module 1, Topic B, Lesson 12
Sample Solutions
Expect to see varied solution paths. Accept accurate responses, reasonable explanations, and equivalent answers for all student work.
2. The table shows the amounts of milk and flour that are needed to make a mix for biscuits. Those are the only two ingredients in the mix.
a. Complete the table.
1. The table shows the amounts of peanuts and raisins that are used to make a specific type of snack mix.
a. Complete the table.
b. Write an equation to describe the proportional relationship between the number of cups of peanuts and the number of cups of raisins.
c. Write an equation to describe the proportional relationship between the total amount of snack mix and the number of cups of peanuts.
b. Describe two quantities in this situation that are in a proportional relationship.
Sample:
The amount of milk is proportional to the amount of flour.
c. What is the constant of proportionality in the relationship described in part (b), and what does it represent?
There are 5 2 , or 21 2 , cups of flour for every 1 cup of milk that is used, so the constant of proportionality is 5 2
d. Write an equation that relates the two quantities.
fm = 5 2
Remember For problems 3–6, add or subtract.
7. Sara knows that 1 mile is approximately equivalent to 1.61 kilometers. Let x represent the number of miles between two towns. Let y represent the number of kilometers in the same distance.
a. Write an equation that Sara might use to convert between measurements in miles and in kilometers.
yx = 161
b. Use your equation to convert 15 miles to an equivalent measurement in kilometers. A distance of 15 miles is approximately equivalent to 24.15 kilometers.
a.
Multi-Step Ratio Problems, Part 2
Solve multi-step ratio problems by using proportional reasoning.
Lesson at a Glance
In this collaborative lesson, students explore a part-to-whole ratio relationship that involves more than two parts. Students continue to observe that the relationship of each part to the whole is proportional, as is the relationship between parts. Working in groups, students choose a representation to model a relationship and solve multi-step ratio problems. Through discussion and reflection, students make connections between ratio and rate problems as different applications of proportional relationships.
Key Questions
• How are ratios, rates, and proportional relationships connected?
• How can we use proportional relationships to solve problems?
Achievement Descriptors
7.Mod1.AD3 Identify the constant of proportionality in proportional relationships. (7.RP.A.2.b)
7.Mod1.AD4 Represent proportional relationships given in contexts with equations. (7.RP.A.2.c)
7.Mod1.AD6 Solve multi-step ratio problems by using proportional relationships (not expressed as percentages). (7.RP.A.3)
An alloy is a mixture. The table shows weights of copper, tin, and zinc that are combined to create a bronze alloy used in making coins.
Agenda
Fluency
Launch 5 min
Learn 25 min
• The Irrational Pie
Land 15 min
Materials
Teacher
• Writing Equations for Proportional Relationships page Students
• None
Lesson Preparation
• Prepare the Writing Equations for Proportional Relationships page for Launch.
Fluency
Areas of Squares and Rectangles
Students find the areas of squares and rectangles to anticipate scaling problems in topic C.
Directions: Find the area of the rectangle or square with the given side lengths.
1. A rectangle with a length of 5 inches and a width of 2 inches
2. A rectangle with a length of 8 inches and a width of 9 inches
3. A rectangle with a length of 21 2 inches and a width of 11 4 inches
4. A square with a side length of 2.5 inches
5. A square with a side length of 31 3 inches
square inches
square inches
9 square inches
Teacher Note
Some students may benefit from a visual of the rectangles and squares.
Launch
Students write equations to describe proportional relationships given in tables.
Facilitate a Whiteboard Exchange. Display the tables from the Writing Equations for Proportional Relationships page one at a time. Each time a table is shown, ask students to write an equation on their whiteboards to describe the relationship. When almost every student has written an equation, give a signal for all students to display their boards. Quickly give feedback on their responses.
If time permits, facilitate a discussion about student strategies and about which pair of values in each table was most useful for finding the constant of proportionality, especially for tables that do not have a point (1, r).
In today’s task, we will use proportional reasoning to solve ratio problems involving pizza toppings. You might find it useful to create tables, like the ones we just studied, to identify the constant of proportionality.
Promoting the Standards for Mathematical Practice
The Irrational Pie
Students identify and use proportional relationships in multi-part ratio situations.
Divide students into groups of four. Present the problem The Irrational Pie. Give students 4 minutes to create their pizza recipes according to the instructions. Then allow groups to work through the four problems in the task.
Circulate and monitor group conversations. Listen for groups that discuss unit rates or the constant of proportionality and groups that use equations or other diagrams to find the amounts of ingredients needed when the number of total cups of toppings changes. Listen for how students describe the multiplicative relationships within the pizza toppings, such as “ 1 4 cup of cheese for every 5 cups of total toppings.”
Students use appropriate tools strategically (MP5) when they choose among tables, equations, ratios, and other models such as tape diagrams to visualize how the amounts of pizza toppings are scaled in each part of this problem.
Ask the following questions to promote MP5:
• What kind of diagram or strategy would be helpful in determining the amounts of pizza toppings?
• How can you estimate the amount of pizza toppings in each part of the problem? Do your estimates sound reasonable?
A restaurant called The Irrational Pie provides the pizza toppings shown in the list.
a. Create a recipe for a small pizza from the list of toppings. Your recipe must
• total exactly 5 cups of toppings,
• include at least 3 different toppings,
• include fractional amounts of at least 2 toppings, and
• include some amount of cheese.
Sample:
1 cup of cheese
21 2 cups of chicken
1 2 cup of olives
1 cup of mushrooms
b. A large pizza calls for a total of 8 cups of toppings. Calculate the amount of each topping you need to create a large pizza if the ratios of ingredients remain the same as in the recipe you created for your small pizza.
Sample:
13 5 cups of cheese
4 cups of chicken
4 5 cups of olives
13 5 cups of mushrooms
Pizza Toppings
Artichokes
Green bell peppers
Red bell peppers
Mushrooms
Onions
Olives
Pineapples
Spinach
Basil
Chicken
Anchovies
Cheese
c. A medium pizza calls for a total of 61 2 cups of toppings. Calculate how much of each topping you will need to create a medium pizza if the ratios of ingredients remain the same as in the recipe you created for your small pizza.
Sample:
13 10 cups of cheese
31 4 cups of chicken
13 20 cups of olives
13 10 cups of mushrooms
d. A customer wants to order a pizza made from the recipe you created for your small pizza, but the customer asks for 41 2 cups of cheese. Determine the amounts of all the other ingredients the customer’s pizza will have if the ratios of ingredients remain the same as in your recipe. What will the total amount of toppings be?
Sample:
41 2 cups of cheese
111 4 cups of chicken
21 4 cups of olives
41 2 cups of mushrooms
221 2 total cups of toppings
e. You are running out of cheese and only have 1 2 cup left for a pizza. Determine the amounts of all the other ingredients the pizza will have if you keep the ratios of ingredients the same. What will the total amount of toppings be?
Sample:
1 2 cup of cheese
11 4 cups of chicken
1 4 cup of olives
1 2 cup of mushrooms
21 2 total cups of toppings
When most groups have completed all four problems, facilitate a discussion about the different proportional relationships that students identified and used to solve the problem by asking the following questions.
How did you figure out the amounts of toppings needed to make 8 total cups of toppings in part (b) and 6 1 2 total cups of toppings in part (c)?
We found the unit rate of the number of cups of each topping per number of total cups of toppings. Then we multiplied by the new number of total cups.
For example, in part (b), we multiplied the amount of each topping by 8 5 , because 8 is 8 5 of 5.
How did you know that the ratios of the amounts of toppings in your recipe remained the same in each of these scenarios?
The ratio of each amount of toppings to the total in the original recipe was equivalent to the ratio in the new large or medium recipe.
What different proportional relationships did you identify in this situation? How can you tell?
The amount of any topping is proportional to the total amount of toppings. The amount of any topping is proportional to the amount of any other topping.
Our original recipe had 21 2 cups of cheese out of 5 total cups of toppings. We know that the amount of cheese is proportional to the total amount of toppings because in every size pizza, the ratio of the amount of cheese to the total amount of toppings was 1 : 2.
Ask students to write equations to describe the proportional relationship between the amount of each topping in their recipe and the total amount of toppings. A sample recipe and related equations are provided for reference.
Original student recipe:
1 cup of cheese
21 2 cups of chicken
1 2 cup of olives
1 cup of mushrooms
UDL: Action & Expression
Provide students with a sample of a completed recipe as a model. Prompt students to check off each bullet in part (a) as they meet the requirements of the recipe.
Differentiation: Challenge
Prompt students to think about other possible ratios within this context by posing the following additional questions:
• A small pizza is cut into 6 slices, a medium pizza is cut into 8 slices, and a large pizza is cut into 10 slices. For which size pizza do you get the greatest amount of toppings per slice? How do you know?
• The pizzeria charges $8.00 for a small pizza, $12.00 for a medium pizza, and $16.00 for a large pizza. For which size pizza do you get the greatest amount of toppings per dollar? How do you know?
Equations:
t = 5c, where t is the total number of cups of toppings and c is the number of cups of cheese
t = 2k, where t is the total number of cups of toppings and k is the number of cups of chicken
t = 10v, where t is the total number of cups of toppings and v is the number of cups of olives
t = 5m, where t is the total number of cups of toppings and m is the number of cups of mushrooms
Select a few groups to share their original pizza recipe and the equations for the proportional relationships in their recipe. If possible, highlight student work where the constant of proportionality of the relationship is not a whole number.
Land
Debrief 10 min
Objective: Solve multi-step ratio problems using proportional reasoning.
Use the following prompts to facilitate a class discussion. Encourage students to make connections among part-to-whole ratio problems, rates, and proportional relationships.
How was today’s task similar to what we did in lesson 12? How was it different?
The problems from lesson 12 and today’s lesson both involved different parts that were combined to make a whole. Lesson 12’s problems only had two parts, like lemonade and iced tea. Today’s pizza recipe had more than two parts since we had to use at least three toppings.
In every part-to-whole situation, there were proportional relationships between each of the parts and the whole and between each of the parts and the other parts.
Teacher Note
Based on the fractions that students chose for their original recipe, some students may get unrealistic measurements of toppings in their answers to different parts of the problem. If needed, allow students to go back and change their original recipe to include friendlier numbers in their measurements.
Prompt student thinking about real-world connections by using the following discussion questions:
• Is it reasonable to see a measurement like 13 20 cups of olives in a recipe? What kinds of measurements are reasonable?
• How might a person making pizza in real life estimate a quantity like 13 20 cups of olives?
Teacher Note
Because this lesson concludes the learning in topic B, time for the Debrief discussion is extended. To prompt additional student reflection on all that they have learned about proportional relationships, consider asking students to do one of the following:
• Write a short reflection about the characteristics of proportional relationships, including those involving ratios and rates.
• Make a visual or graphic organizer about ratio and rate relationships, comparing examples that are proportional and not proportional.
How are ratios, rates, and proportional relationships connected? Give some examples.
In a proportional relationship, such as the relationship between distances measured in inches and distances measured in feet, there is always a constant rate between the two quantities.
There are some ratio relationships that aren’t proportional relationships. For example, if the ratio of the number of walls to the number of windows in a classroom is 4 : 5, it does not mean that there is a relationship between the number of walls and the number of windows everywhere, in all classrooms.
Some rates are not proportional relationships. For example, the rate that I walk to school is not constant if I stop at a crosswalk or if I run one block. Sometimes I can model those relationships with a proportional relationship.
How can we use what we know about proportional relationships to solve problems?
You can look for the unit rate, or the value of the ratio of one quantity to another quantity. Then you can use the unit rate to write an equation to find any pair of values in the relationship.
You can use the constant of proportionality or unit rate to write an equation to describe the relationship and then use the equation to find unknown x- or y-values by solving for that variable.
Exit Ticket 5 min
Provide up to 5 minutes for students to complete the Exit Ticket. It is possible to gather formative data even if some students do not complete every problem.
Teacher Note
Assign the Practice problems for completion outside of class or use them in class if time remains after the lesson. Refer students to the Recap for support.
• explored part-to-whole ratio relationships that involve more than two parts.
• observed that the relationship of each part to the whole is proportional, as is the relationship between parts.
• chose a model to represent a proportional relationship and solved multi-step ratio problems.
Example
A recipe for one batch of cranberry orange punch calls for the following ingredients: 12 ounces of cranberry juice, 6 ounces of orange juice, and 8 ounces of sparkling water.
a. Complete the table below to represent a regular batch, a double batch, and a half batch of the punch.
To complete the second row, double all the quantities in the recipe. To complete the third row, halve all the quantities.
6 3 4 13
b. Write equations that relate each of the following: Ounces of cranberry juice c to ounces of orange juice j:
cj = 2
The amount of cranberry juice is double the amount of orange juice.
Use the information from the directions to complete the first row. The total amount of punch is the sum of all the ingredients.
Ounces of sparkling water s to ounces of cranberry juice c: sc = 2 3 Total ounces of punch t to ounces of sparkling water s:
To find the constant of proportionality, take an amount of sparkling water and divide it by the corresponding amount of cranberry juice.
16 24 2 3 =
To find the constant of proportionality, take an amount of punch and divide it by the corresponding amount of sparkling water.
26 8 13 4 =
c. You have a 16-ounce can of cranberry juice. If you use all the other ingredients in the same ratios as a regular batch, how many total ounces of punch can you make?
The value of the ratio of total ounces of punch to ounces of
16 represents the number of ounces of cranberry juice, so 16 is substituted into the equation for c
You can make 342 3 total ounces of punch.
Sample Solutions
Expect to see varied solution paths. Accept accurate responses, reasonable explanations, and equivalent answers for all student work.
1. A recipe for one batch of fruit punch calls for the following ingredients: 12 ounces each of frozen lemonade and frozen orange juice, 48 ounces of pineapple juice, and 34 ounces of sparkling water.
a. Complete the table to represent a regular batch, a double batch, and a half batch of the fruit punch.
Lemonade, l (ounces)
Orange Juice, j (ounces) Pineapple Juice, p (ounces)
Water, s (ounces)
2. A lasagna recipe calls for wheat noodles, cheese, and tomato sauce in ratios as shown in the table.
a. Complete the table.
Noodles, n (cups)
c (cups)
Amount of Fruit Punch, t (ounces)
b. Write an equation that relates the number of ounces of pineapple juice p to the number of ounces of frozen lemonade l pl = 4
c. Write an equation that relates the number of ounces of sparkling water s to the number of ounces of pineapple juice p sp = 17
d. Write an equation that relates the number of ounces of fruit punch t to the number of ounces of sparkling water s
e. You have a 16-ounce can of pineapple juice. If you use all the other ingredients in the same ratios as in a regular batch, how many total ounces of fruit punch can you make? You can make 35 total ounces of fruit punch.
b. Write an equation relating the total cups of lasagna to the cups of wheat noodles.
= 13 8
c. Suppose you use 31 2 cups of cheese to make this recipe and use proportional amounts of the other ingredients. Will the lasagna fit into a pan that holds 12 cups?
Yes. With 31 2 cups of cheese, the recipe will make a total of 113 8 cups of lasagna, so it will fit into a pan that holds 12 cups.
3–6, add or subtract.
7. Liam sells tickets for the fall musical. The price of a Saturday night ticket is different from the price of a Sunday night ticket.
a. Liam sells 20 Saturday night tickets for a total of $305. What is the price of each Saturday night ticket?
The price of each Saturday night ticket is $15.25
b. The price of each Sunday night ticket is $14.75 How many Sunday night tickets does Liam sell for a total of $309.75?
Liam sells 21 Sunday night tickets.
8. Choose all the true statements about the rectangle’s sides. ms x h
Topic C Scale Drawings and Proportional Relationships
In topics A and B, students develop an understanding of what defines a proportional relationship and how to represent proportional relationships with tables, graphs, equations, and written descriptions. In topic C, students use this understanding to explore a new application of proportional relationships: scale drawings.
Students begin this topic by exploring scale drawings through an open-ended activity that motivates the learning of the topic. In the following lesson, students informally explore scale drawings. They notice that when corresponding distances are placed in a table, a constant unit rate exists between the distances in the original figure and those in the scale drawing. They learn that in the context of scale drawings, we call the constant of proportionality the scale factor. Correspondence is introduced informally, as students analyze a common misconception to establish the importance of comparing the correct corresponding distances.
Once they make the connection that corresponding distances in the original figure and in the scale drawing form a proportional relationship, students apply their learning from topics A and B, writing equations and finding unknown distances to create scale drawings.
In the following lessons, students look for other relationships between an original figure and its scale drawing. Through examining multiple examples, students discover that if an original figure and a scale drawing are related by a given scale factor, their areas are related by the square of that scale factor. Students use this information to determine unknown areas, scale factors, and factors relating areas.
Students explore contexts where a scale drawing might be either much larger or much smaller than the original. Students determine that in these cases a scale might be more appropriate than a scale factor to represent the relationship between the distances in the figures. In the last lesson, students create scale drawings from figures that are already scale drawings and look for patterns among the original figure and the two scale drawings.
A Sunday on La Grande Jatte, by Georges Seurat, 1884
An understanding of scale drawings is the foundation for understanding similarity transformations in grade 8. It is important in this topic to reinforce that all corresponding distances in the scale drawings, even distances that are not drawn, are in a proportional relationship. Bedroom1
Progression of Lessons
Lesson 14 Extreme Bicycles
Lesson 15 Scale Drawings
Lesson 16 Using a Scale Factor
Lesson 17 Finding Actual Distances from a Scale Drawing
Lesson 18 Relating Areas of Scale Drawings
Lesson 19 Scale and Scale Factor
Lesson 20 Creating Multiple Scale Drawings
Extreme Bicycles
Compare objects of different sizes by using proportional reasoning.
Lesson at a Glance
This lesson is an open-ended modeling exploration. Students watch a video depicting someone riding a very small bicycle and a very large bicycle and create a class list of questions about the video. Students work in groups and apply proportional reasoning to compare the sizes of the bikes. Groups of students present their solution strategies to the class. This lesson is designed as a formative assessment for several mathematical practices.
Key Question
• How can we use proportional reasoning to model situations and solve problems?
• In this lesson, students generate and investigate a question. During this process, they may determine that they need specific tools. Consider having common problem-solving resources available in the classroom.
Teacher Note
Encouraging students to identify and select their own tools helps students demonstrate MP5. Invite students to request materials or tools that might help them answer a question instead of providing a bank of tools to choose from.
Fluency
Measurement Division
Students interpret the measurement form of division.
Directions: Divide.
Launch
Students generate questions about the video.
Play part 1 of the video.
What do you wonder about this part of the video?
Resist the urge to answer the questions. Instead, use this time to encourage student curiosity.
Play part 2 of the video.
What do you wonder about this part of the video?
Resist the urge to answer the questions. Instead, use this time to encourage student curiosity.
We have now seen a video of a very small bike and a very large bike. What questions do you have about these two bikes?
Record the questions, one at a time, and display them for the class. Then ask the class who else finds that question interesting. Record the number of students who show interest in the question by placing check marks, plus signs, or other counting marks next to each question.
If no students question how the sizes of the bikes are related, offer that as your wondering and find out how many students also find that question interesting.
The goal of this activity is to have students explore a question of their choosing. Have students review the questions the class has documented.
Which of these questions do you think you want to explore further? What have we learned so far that could help us?
Guide students toward a question that relates the sizes of the bikes. The following questions are examples:
• How much larger is the larger bike than the smaller bike?
• How much smaller is the smaller bike than the larger bike?
• How do the sizes of these bikes relate to the size of a normal bike?
Teacher Note
Expect that students may generate questions worthy of study that either cannot be explored during the timeframe of this class or cannot be properly explored by using the prior knowledge and information that they have. Consider writing down some of these questions and saving them to be explored at a different time.
As a class, refine the focus question to make sure it is clear. Ask questions to help guide students through the process of editing the question:
• Is everyone clear about what this question is asking?
• Do we need to be more specific?
• Would a student who walked in late to class be able to clearly understand our question?
Once you have edited and refined the focus question, have students document it.
Today, we will explore the question we have generated. As you work through it with your group, consider what information or tools might help you answer this question.
Learn
Unrealistic Estimates
Students make estimations related to the focus question they generated in Launch.
Conduct a discussion about unrealistic estimations regarding the chosen focus question.
Let’s begin by making some estimates about our focus question, starting with estimates we know are not reasonable. What estimate would be too small?
Twice the size would be too small. The larger bike is clearly more than double the size of the smaller bike.
What estimate would be way too large?
A million. The larger bike is not a million times larger than the smaller bike.
If students disagree that a guess is unreasonable, have them explain their thinking.
UDL: Engagement
The bicycle video provides an interesting context for students to apply proportional reasoning. After watching the video, students naturally generate questions about the context.
Teacher Note
The question provided in the sample student response is one option for a focus question. However, allow students to explore other focus questions if they desire. When sample responses are provided throughout the rest of this lesson, they are in reference to this focus question. If students choose a different focus question, expect different student responses.
Teacher Note
Students will likely want to estimate lengths on the bikes to help them answer their question. Pause the video at strategic places to help them make estimations. Support students in making estimations by encouraging them to compare the size of the bicycle to the size of other objects that might be easier to estimate.
• What object could we compare the bicycle to in order to estimate its size?
Comparing Different-Size Bicycles
Students use proportional reasoning to investigate the focus question they generated.
Divide the class into groups of four. Allow time for groups to brainstorm about the information they need to answer the question. Circulate as groups discuss to monitor progress. Expect students to generate a list similar to the following:
• We need to know some measurements of the smaller bike.
• We need to know some measurements of the larger bike.
Invite groups to share their lists with the class. Now that students have identified the information necessary to answer the focus question, direct them to develop a plan by using the following prompt.
Work with your group to make a plan to gather the needed information and explore our focus question.
As students work in their groups to explore the focus question, monitor their progress. As needed, move groups forward by asking any or all of the following questions:
• How can you estimate a length on the bike?
• How are we going to estimate the length of the wheel?
• Can you compare it to a known length or a length you can estimate?
Play the video again, stopping at key places if necessary, so students can gather the information by using their plan. If possible, provide access to tools such as the internet or measurement tools to facilitate student plans.
Direct students to return to their groups to answer the focus question. Tell groups to be prepared to share their solution strategies with the class.
When groups finish, invite those groups to display their solution strategies or discuss them with the class. After all groups have shared, engage students in a discussion by asking the following questions:
• What estimations did you make while attempting to answer this question? How did you make those estimations?
Promoting the Standards for Mathematical Practice
Students use appropriate tools strategically (MP5) when they create a plan to determine how much larger the big bike is than the small bike.
Ask the following questions to promote MP5:
• What kind of strategy would be helpful to gather the needed information?
• Why did you choose to gather the data the way you did? Did that work well?
• How can you estimate the solution? Does your estimate sound reasonable?
Promoting the Standards for Mathematical Practice
As students work to find entry points, monitor their own progress, and question whether values make sense when using proportional reasoning to compare the sizes of the two bicycles, they are making sense of problems and persevering in solving them (MP1).
Ask the following questions to promote MP1:
• What information or facts do you need to know to help answer your question?
• What is your plan to estimate different lengths on the bicycles?
• Does your answer make sense?
• Are the answers we found reasonable?
• What assumptions did we make? How did those assumptions affect your solution?
• What information did you research? How did you use that information? How are our solution strategies similar? How are they different?
Land
Debrief 5 min
Objective: Compare objects of different sizes by using proportional reasoning.
Use the following question to help students recognize where they used proportional reasoning to answer the class-determined focus question. Encourage students to add on to their classmates’ responses.
How did your group use what you know about proportional relationships to find the answer?
Select from the following questions to debrief the lesson:
• What assumptions did your group make, and how did that impact your results?
• Did your group face any obstacles? How did you overcome them?
• What would your group do differently?
• What was most helpful?
Exit
Ticket 5 min
Provide up to 5 minutes for students to complete the Exit Ticket. It is possible to gather formative data even if some students do not complete every problem.
Teacher Note
The Exit Ticket asks students to reflect on this lesson. Consider guiding their reflection with a question that was not asked during the debrief.
Teacher Note
Assign the Practice problems for completion outside of class or use them in class if time remains after the lesson.
Sample Solutions
Expect to see varied solution paths. Accept accurate responses, reasonable explanations, and equivalent answers for all student work.
The table shows a proportional relationship.
1. When you modeled the bicycle situation by using a proportional relationship, what assumptions did you make?
We assumed that each part of the bike was made larger or smaller by multiplying corresponding distances by the same number.
2. How was the bicycle situation modeled in class different from a proportional relationship? The bikes weren’t exactly the same design, so not all corresponding distances were in a proportional relationship.
3. If you had more time to examine another question related to the bicycle video, what question would you consider? What would your plan be to determine the answer? Student responses will vary.
Complete the sentence. Choose all that apply.
The table represents a proportional relationship because
A. each ratio B : A is equivalent.
B. there is a constant unit rate.
C. the difference between A values is constant.
D. the difference between B values is constant.
9. Ethan reads about 180 words per minute. If a book contains about 72,000 words, approximately how many minutes would it take Ethan to read the whole book? It would take about 400 minutes for Ethan to read the whole book.
For problems 4–7, add or subtract.
Scale Drawings
Determine one-to-one correspondence of points in related figures.
Recognize that corresponding lengths in scale drawings are in a proportional relationship with a constant of proportionality called a scale factor.
Lesson at a Glance
In this lesson, students explore examples of scaled figures and make observations about their key features. Through exploring corresponding line segment lengths in scale drawings, students observe scale drawings that are enlargements or reductions. By measuring side lengths, students determine that corresponding lengths in scale drawings are in a proportional relationship, and they learn that the constant of proportionality is called the scale factor. This lesson introduces the terms scale drawing and scale factor.
Key Questions
• How do we determine the corresponding points of an original figure and a scale drawing?
• How can we determine whether a figure is a scale drawing of another figure?
• How can we find the scale factor between a scale drawing and an original figure?
Achievement Descriptor
No. Figure 2 does not appear to be a scale drawing of figure 1. Figure 2 appears to be stretched more horizontally than it is vertically, so the distances are not proportional to those in figure 1.
• Applying Understanding of Scale Factor and Scale Drawings
Land 10 min
Materials
Teacher
• None Students
• Ruler
• Colored pencils (3)
Lesson Preparation
• None
Fluency
Find the Constant of Proportionality
Students find the constant of proportionality to prepare for identifying scale factors between corresponding side lengths.
Directions: Find the constant of proportionality.
Launch
Students reason about the properties of a scale drawing.
Display the original figure and the scaled figure of the artwork A Sunday on La Grande Jatte, by Georges Seurat (1884).
Invite students to think–pair–share about the following questions.
What do you notice about the original figure and the scaled figure?
I notice the original figure looks smaller than the scaled figure.
Do you think the scaled figure is an enlargement or a reduction of the original figure? Why?
I think the scaled figure is an enlargement because it appears bigger than the original figure.
If the scaled figure is an enlargement of the original figure, what do you think a reduction of the original figure would look like?
I think the reduction would be smaller than the original figure.
So far, we’ve observed that an enlargement appears to make the figure larger, and we think a reduction will make the figure smaller. Today, we will explore characteristics of scaled figures.
Teacher Note
The terms enlargement and reduction are used informally in this lesson to indicate when a scale drawing is proportionally larger or smaller than the original figure. This topic will formalize that a scale drawing is an enlargement if the scale factor is greater than 1 and a reduction if the scale factor is greater than 0 but less than 1.
Learn
Exploring Scale Drawings—An Enlargement
Students measure segments in an original figure and relate the lengths of those segments to the lengths of corresponding segments in an enlarged scale drawing.
Divide students into pairs. Allow students to work on problem 1 for 5 minutes. Circulate as students work, encouraging them to reason about the relationships between the length of each segment in the original figure and the length of the segment that is in the same location in the scaled figure.
1. Use the two figures of the school building to complete parts (a)–(e).
Differentiation: Support
In this exploration, students identify corresponding segments and recognize the segments as proportional. Some students may need support in measuring segments accurately. To review how to use a ruler to measure precisely, consider cutting a few straws at different lengths and asking students to measure the straws.
Original Figure
Scaled Figure
a. Choose a segment in the original figure. Use a colored pencil to trace the segment in the original figure.
b. Measure the segment in the original figure. Record the length to the nearest tenth of a centimeter in the table.
c. Use the same colored pencil to trace the segment that is in the same location in the scaled figure.
d. Measure the segment in the scaled figure. Record the length to the nearest tenth of a centimeter in the table.
e. Complete the table by repeating parts (a)–(d) for other lengths in the original figure and the scaled figure. Use a different colored pencil for each new pair of segments.
Sample:
2. What is the relationship between the lengths of the segments that are in the same location in the original figure and the scaled figure?
The length of the segment in the scaled figure is 3 times the length of the segment in the original figure.
When most students are finished, use the following prompts to guide a discussion about identifying corresponding segments and proportional relationships in scale drawings.
In the activity, you measured corresponding segments in an original figure and a scaled figure. What do you think corresponding means?
Corresponding means that they are related or in the same location in each figure.
Describe a pair of corresponding side lengths in problem 1.
I used the same color to mark corresponding sides. A pair of corresponding segments in the two figures connect the same objects in the figures, such as the heights of the school doors.
Teacher Note
To keep the focus on recognizing proportionality, encourage students to round lengths to the nearest tenth of a centimeter. This focuses the activity on determining corresponding side lengths and their multiplicative relationship. If student measurements are not showing a scale factor of 3, have students revisit their measurements for accuracy.
UDL: Representation
In this activity, students color code the corresponding segments they are measuring in the original figure and the scaled figure. They can then use the same color to write the measurements in the table. This can help them identify which segments correspond to the scaled figure and visually recognize proportionality.
The scaled figure in problem 1 is a scale drawing of the original figure. What do you think a scale drawing is?
I think a scale drawing is a drawing that is smaller or larger than the original but is proportional to the original.
How can you tell whether one figure is a scale drawing of another figure?
I can tell that one figure is a scale drawing of another if all corresponding lengths are in a proportional relationship.
A scale drawing is a copy of a figure in the plane with all distances proportional to the corresponding distances in the original figure.
In a scale drawing, the constant of proportionality is called the scale factor. How can you determine the scale factor from the measurements in your table?
I can find the constant of proportionality between the corresponding measurements in the table. The scale factor is multiplied by the length of the segment in the original figure to determine the length of the corresponding segment in the scaled figure. Therefore, I can divide the length of the corresponding segment in the scaled figure by the length of the segment in the original figure to determine the scale factor in a scale drawing.
The length of the segment in the original figure is multiplied by the scale factor to determine the length of the corresponding segment in the scaled figure. We can divide the length of the corresponding segment in the scaled figure by the length of the segment in the original figure to determine the scale factor in a scale drawing.
If we measured a segment in the original figure as 2.5 centimeters, how could we determine the length of the corresponding segment in the scaled figure without measuring?
We could multiply 2.5 centimeters by the scale factor to determine its length in the scaled figure.
Language Support
Consider using a visual to provide context for the term scale factor. A visual like the example below illustrates how a scale factor is the multiplicative constant of proportionality used to determine lengths on a scaled figure.
Original Figure Scaled Figure k
Exploring Scale Drawings—A Reduction
Students measure segments in an original figure and relate the lengths of those segments to the lengths of corresponding segments in a reduced scale drawing.
Direct students to work on problem 3 with a partner. Circulate as students work, and advance their thinking by asking the following questions.
• Is the scaled figure an enlargement or a reduction of the original figure? How do you know?
• What do you notice about the relationship between the lengths of the corresponding segments?
• How are these figures different from the figures in problem 1? How are they the same?
3. Use the two figures of the bank building to complete parts (a)–(e).
Original Figure
Scaled Figure
a. Choose a segment in the original figure. Use a colored pencil to trace the segment in the original figure.
b. Measure the segment in the original figure. Record the length to the nearest tenth of a centimeter in the table.
c. Use the same colored pencil to trace the corresponding segment in the scaled figure.
d. Measure the segment in the scaled figure. Record the length to the nearest tenth of a centimeter in the table.
Teacher Note
If you observe students recording lengths that do not produce an exact scale factor of 1 2 , consider using the following questions to support their understanding of estimation and measurement error.
• About how much greater do the lengths in the scaled figure look compared to the corresponding lengths in the original figure?
• Do you see a similar multiplicative relationship between corresponding lengths in your table?
• Why do you think the lengths in the scaled figure are not exactly 1 __ 2 of the corresponding lengths in the original figure?
e. Complete the table by repeating parts (a)–(d) for other lengths in the original figure and the scaled figure. Use a different colored pencil for each new pair of segments.
Sample:
4. What is the relationship between the lengths of the corresponding segments in the original figure and the scaled figure?
The length of the segment in the scaled figure is 1 _ 2 of the length of the corresponding segment in the original figure.
When most students are finished, use the following prompts to guide discussion about using corresponding segments to determine scale factor and differentiating between enlargements and reductions.
How did you identify corresponding segments in the original figure and the scaled figure?
I found the corresponding segments by finding the segments that were in the same location in the original figure and the scale drawing.
Differentiation: Support
If students have difficulty recognizing the scale factor, consider using string models to represent the relationship between the original figure line segment length and the corresponding scaled figure line segment length.
Have students cut string and use it to measure the length of corresponding sides in the original and the scaled figure. Then lay the strings next to one another. Prompt students to manipulate the strings to determine the relationship between the string lengths and to relate it to their understanding of scale factor.
When I place the measured string like this, I notice the scaled figure string is about half the original figure string. The scale factor is .1 2
How can you find the scale factor by using the measurements in the table? Give an example.
To find the scale factor, I can divide a length from the scale drawing by the corresponding length from the original figure. For example, 3 divided by 6 is 0.5, or 1 2 . The scale factor for these figures is 0.5.
If the length of a segment in the original figure is 2.2 centimeters, what is the length of the corresponding segment in the scaled figure? How do you know?
The length of the scaled figure segment is 1.1 centimeters. We can multiply 2.2 centimeters by the scale factor to determine the length of the corresponding segment in the scaled figure.
How can you tell whether a scaled figure is an enlargement or a reduction of an original figure?
If the scaled figure has corresponding segments that are longer than the original figure and a scale factor greater than 1, it is an enlargement. If the scaled figure has corresponding segments that are shorter than the original figure and a scale factor between 0 and 1, it is a reduction.
Applying Understanding of Scale Factor and Scale Drawings
Students apply their learning about scale factor and scale drawings to a new set of figures.
Display the sets of animal figures one at a time. Invite students to compare each original figure with the four other figures. Ask students to share their thinking as they determine which are scale drawings by assessing proportionality visually. Highlight student responses that distinguish scale drawings from those that have been stretched or compressed in a single direction. Use the following prompts to have students defend their choices.
• How can you tell which of the figures are scale drawings of the original figure?
• Is the scale drawing an enlargement or a reduction? How do you know?
Language Support
During the class discussion, multilingual learners may benefit from additional support in the form of sentence starters. Consider the following examples:
• I think the figures are not scale drawings because …
• I think the figures are scale drawings because …
• I can tell the scaled figure is not proportional to the original figure because …
• I can see the figures are proportional because …
Display the scale drawings of the triangles and Pedro’s work.
Have students think–pair–share about the following prompt.
Pedro compared side lengths and concluded that these triangles are not scale drawings. Is Pedro correct? Why?
Pedro is not correct. He did not find the scale factor by using corresponding side lengths. The triangles are scale drawings if the scale factor is determined by using corresponding sides in the scale drawings.
What should Pedro do to determine whether the triangles are scale drawings?
For Pedro to determine whether the triangles are scale drawings, he must use corresponding side lengths of the scale drawings to determine the scale factor. Select several students to share their thinking. Highlight student responses that recognize that the triangles are proportional, but that Pedro made an error in his work by not correctly matching corresponding sides of the triangles to determine the scale factor. As students share their reasoning, encourage them to apply the concept of correspondence and identify the triangles as scale drawings.
Promoting the Standards for Mathematical Practice
When students recognize that corresponding measurements in the original figure and the scale drawing form a proportional relationship, and when they use the relationship to understand scale drawings, they are looking for and making use of structure (MP7).
Ask the following questions to promote MP7:
• How are proportional relationships and scale drawings related? How could that help you create scale drawings?
• How can what you know about proportional relationships help you find unknown lengths in a scale drawing?
Why might someone think Pedro is correct?
Someone might think he is correct because the scale factors Pedro found are not equivalent. The scale factors were calculated incorrectly by using side lengths that are not corresponding.
Are the triangles scale drawings? How do you know?
Yes. I know the triangles are scale drawings because the ratios of corresponding side lengths are equivalent. I can divide the scaled figure side length by the original figure side length to find that the corresponding lengths have a constant of proportionality of 4.
Why is it important to look at corresponding segments and not just any pair of segments when determining whether figures are scale drawings?
Figures are scale drawings only if all distances are proportional to corresponding distances in the original figure. Using any pair of segments or points to determine a scale factor does not tell us whether there is a proportional relationship because the distances may not be corresponding.
Land
Debrief 5 min
Objectives: Determine one-to-one correspondence of points in related figures.
Recognize that corresponding lengths in scale drawings are in a proportional relationship with a constant of proportionality called a scale factor.
Use the following prompts to guide a conversation about correspondence and scale drawings. Encourage students to restate or build upon one another’s responses.
How do you determine the corresponding points of an original figure and a scale drawing?
Corresponding points are in the same position in the original figure and the scale drawing.
Teacher Note
Consider having students appropriately match up corresponding sides and recalculate the scale factor. Once they do, they should see that the scale factor is constant; therefore, the triangles are proportional and represent scale drawings.
How can you determine whether a figure is a scale drawing of another figure?
A figure is a scale drawing of another figure when corresponding lengths are in a proportional relationship.
How can you find the scale factor between a scale drawing and an original figure?
A scale factor is found the same way as determining a constant of proportionality. Divide a length from the scale drawing by the corresponding length from the original figure.
Exit Ticket 5 min
Provide up to 5 minutes for students to complete the Exit Ticket. It is possible to gather formative data even if some students do not complete every problem.
Teacher Note
Assign the Practice problems for completion outside of class or use them in class if time remains after the lesson. Refer students to the Recap for support.
b. Which measurement in figure C corresponds with 10 inches in figure D?
Scale Drawings
In this lesson, we
• determined one-to-one correspondence of points in related figures.
• identified whether a scale drawing was an enlargement or a reduction.
• learned that the constant of proportionality that relates corresponding lengths in scale drawings is called a scale factor
Example
Terminology
A scale drawing is a copy of a figure with all distances proportional to the corresponding distances in the original figure.
In a scale drawing, the constant of proportionality is called the scale factor
c. Determine the scale factor that relates figure D to figure C.
If it would be helpful, consider organizing corresponding sides into a table. Then divide a measurement of the scale drawing by the corresponding measurement of the original figure to find the scale factor. In this example, that quotient is 1 2
a. Is figure D an enlargement or a reduction of figure C?
Figure D is a reduction of figure C.
Are the corresponding sides of the scale drawing shorter or longer than the sides of the original figure? If the sides of the scale drawing are longer, the scale drawing is considered an enlargement. If the sides of the scale drawing are shorter, the scale drawing is considered a reduction.
EUREKA MATH
Sample Solutions
1. For each pair of figures, state whether the second figure represents a scale drawing of the first figure. Explain your answer.
a.
c.
b.
The second figure is not a scale drawing of the first figure because it does not represent a proportional stretching of the first figure.
The second figure is a scale drawing of the first figure because it represents a proportional compressing of the first figure.
MATH
3. In the following family portraits, figure N is a scale drawing of figure
a. Is figure N an enlargement or a reduction of figure M? Figure N is an enlargement of figure M.
b. Which measurement in figure M corresponds with 11 inches in figure N? 5.5 inches
c. Determine the scale factor that relates the scale drawing, figure N, to figure M.
2. Is figure B an enlargement or a reduction of figure A?
Figure AFigure B
Figure B is a reduction of figure A.
4. In the figures shown, △DEF is a scale drawing of △ABC
c.
a. Is △DEF an enlargement or a reduction of △ABC? The scale drawing, △DEF, is a reduction of △ABC
b. What is the length of the side of △DEF that corresponds to side AB in △ABC
5. Rectangle EFGH is a scale drawing of rectangle ABCD. Determine the scale factor, and state whether it is an enlargement or a reduction.
The scale factor is 2 3 Rectangle EFGH is a reduction of rectangle ABCD
a. Complete the table to show the proportional relationship among the numbers of cubic feet of
b. Write an equation that represents the proportional relationship between the volume of sand s and the volume of Maya’s mixture
Which of the following expressions have products that are greater than the second factor? Choose all that apply.
Using a Scale Factor
Determine whether a scale factor produces an enlargement or a reduction.
Create a scale drawing by using the proportional relationship that exists between corresponding distances.
Lesson at a Glance
Lily looks at the scale drawing shown. She notices that the original figure is about half the width and half the height of the scale drawing. For this reason, she says that the scale factor is about 1 2 Do you agree or disagree with Lily? Explain your answer.
As a whole class, students predict whether given scale factors produce enlargements or reductions. Through guided instruction, they use scale factors to create scale drawings and verify their predictions. Students engage in discussion to determine that a scale factor greater than 1 produces an enlargement and a scale factor greater than 0 and less than 1 produces a reduction.
Key Questions
• Can we determine whether a scale drawing is an enlargement or a reduction by using only the scale factor? Why or why not?
• How is a scale factor used to create a scale drawing?
Achievement Descriptors
7.Mod1.AD3 Identify the constant of proportionality in proportional relationships. (7.RP.A.2.b)
7.Mod1.AD7 Reproduce a scale drawing at a different scale. (7.G.A.1)
I disagree with Lily. The scale factor used to produce the scale drawing must be greater than 1 because the scale drawing is an enlargement of the original figure. The scale factor Lily chose is less than 1 which would produce a reduction of the original figure. Since the scale drawing is about twice the width and twice the height of the original figure, the scale factor used to produce the scaled figure is approximately 2
7.Mod1.AD8 Solve problems involving scale drawings of geometric figures. (7.G.A.1)
Agenda
Fluency
Launch 5 min
Learn 30 min
• Let’s Draw!
• Representing Lengths in Tables
• Henry’s Thinking
Land 10 min
Materials
Teacher
• None Students
• Straightedge
Lesson Preparation
• None
Fluency
Find Unknown Values
Students find unknown values to prepare for finding unknown measurements of scale drawings.
Directions: Given the equation, fill in the unknown values in each table.
1.
Launch
Students notice which scale factors produce enlargements and which scale factors produce reductions.
Introduce problem 1. Allow students 2 minutes to identify the scale factor. Encourage students to think about the scale drawings they observed in lesson 15.
In the figure shown, △DEF is a scale drawing of △ ABC.
Teacher Note
When a scale drawing is related to an original figure by a scale factor of 1 2
the sides of the scale drawing are 1 2 as long as those in the original figure. In this case, we can say the scale drawing is a reduction of the original figure. Some students may say that the scale drawing is 1 2 as large as the original figure. This common misconception can be corrected by reminding students that thus far, we have only studied relationships between side lengths and distances. In lesson 18, students explore how the area of a scale drawing relates to the area of its original figure.
The measurements of corresponding side lengths between △ ABC and △DEF are displayed in the table.
1. Determine the scale factor that relates △DEF to △ ABC.
Facilitate a class discussion by using the following question.
What would be different if we applied a scale factor of 2 to the original drawing?
Allow students time to consider how the scale factors of 1 2 and 2 differ and how they impact the scale drawings produced. It is not essential that students draw precise conclusions at this point in the lesson. A formal discussion of observations occurs in Land.
After a few minutes of discussion, transition students to the next segment by describing how they will apply this new understanding.
Today, we will create scale drawings. As we do, let’s pay attention to how the scale factor affects the size of the scale drawing.
UDL: Representation
Have students color-code the sides with the colors of the measurements written in the table. This will help them determine which measurements correspond when they are creating the scale drawing.
Let’s Draw!
Students produce a scale drawing given an original figure and a scale factor.
Introduce problem 2. Guide students in creating a scale drawing by using the following prompts.
If you produce a scale drawing of the geometric figure shown by using a scale factor of 2 3 , will the scale drawing be an enlargement or a reduction of the original figure?
Allow students to consider this and share informal predictions with the class, but do not confirm any predictions at this time. This question is revisited once the table and scale drawing are complete.
Let’s use the table to record the side lengths of the figure. Look at the figure. Which lengths can we record?
We can record the base and height of each triangle by counting, but we can’t find the lengths of the slanted sides without using a ruler.
How can we apply a scale factor of 2 3 to the original figure to produce a scale drawing?
We can multiply each of the measurements of the original figure by a scale factor of 2 3 to determine the corresponding measurements of the scale drawing.
Have students complete the table and then create the scale drawing next to the original figure.
2. Create a scale drawing of the geometric figure by using a scale factor of 2 3 .
When students are finished with problem 2, have them revisit their predictions from the beginning of the problem. Ask students to think–pair–share with a partner about the following questions.
Now that you have produced the scale drawing by using a scale factor of 2 3 , think about your prediction. Was it correct? Why do you think this is so?
Allow students 1 minute of think time.
Turn to a partner and share your ideas.
Allow students 2 minutes to share ideas with their partners. Then invite 2 or 3 students to share their ideas with the class.
Representing Lengths in Tables
Students determine the side lengths of a scale drawing when given an original figure, its side lengths, and a scale factor.
Read problem 3 aloud to students, and then ask them to predict whether the scale drawing will be an enlargement or a reduction of the original figure.
Have students work with a partner to complete the table to see whether their prediction is correct. If time permits, consider having students sketch the scale drawing.
Teacher Note
In grade 5, students interpret multiplication as scaling (resizing). They do this by explaining why multiplying by a fraction greater than 1 results in a product greater than the given number and why multiplying by a fraction less than 1 results in a product less than the given number (5.NF.B.5b). While facilitating conversations about scale factor, consider using the following questions to make connections to this prior knowledge from grade 5.
• Will a number become larger or smaller when you multiply it by a number larger than 1?
• Will a number become larger or smaller when you multiply it by a fraction between 0 and 1?
3. A scale drawing of the triangle shown must be produced by using a scale factor of 1.5. Determine the corresponding measurements of the scale drawing and record them in the table. All measurements shown are in centimeters.
When most students have finished, have them revisit their predictions from the beginning of the problem. Ask students to think–pair–share with a partner about the following question.
Now that you have calculated the measurements for the scale drawing, think about your prediction. Was it correct? Why do you think this is so?
Allow students 1 minute of think time.
Turn to a partner and share your ideas.
Allow students to share their ideas with their partners. Then invite 2 or 3 students to share their ideas with the class. Confirm student thinking that explains that the scale drawing is an enlargement because every side length is 1.5 times the corresponding side length of the original figure.
Facilitate a class discussion about scale factor and its effect on the scale drawing by using the following prompts.
What is the smallest scale factor you can think of that produces an enlargement? Turn and talk to your partner.
As students talk with their partners, circulate and listen to their thoughts and reasoning. Identify students who share that any scale factor larger than 1 produces an enlargement.
Invite identified students to share their thoughts and reasoning with the class. Then continue the discussion with the following prompt.
Any scale factor greater than 1 produces an enlargement. Even a scale factor like 1.00001 produces an enlargement because it is greater than 1. What do you think happens when a scale factor of exactly 1 is applied to a figure? Turn and talk to your partner again.
Language Support
As the class discussion unfolds, consider providing students with sentence frames and key terminology as a scaffold for peer conversations. For example, post the key terms scale drawing, scale factor, enlargement, and reduction on the board along with a sentence frame such as “The scale drawing is a _____ because _____.”
As before, circulate while students share ideas with a partner. Identify students who reason that a scale factor of 1 does not change the original figure because all lengths remain the same.
Ask identified students to share their reasoning with the class. Then continue the discussion by using the following prompt.
A scale factor of 1 means that the lengths in the scale drawing are the same as the corresponding lengths in the original figure. The lengths stay exactly the same because the lengths in the original figure are multiplied by 1, the scale factor, and multiplying by 1 doesn’t change anything. Now think about what scale factors might produce a reduction. Turn and talk to your partner again.
Allow students to discuss with their partners. Students may need support to identify the parameters for scale factors that produce reductions. As you circulate, listen for students who reason that a scale factor that is less than 1 but greater than 0 produces a reduction.
Invite students to share their reasoning with the class.
If necessary, use the following prompts to help students understand that scale factors greater than 0 and less than 1 produce scale drawings that are reductions.
A scale factor that is less than 1 produces a scale drawing that is a reduction of the original figure. We know a scale factor of exactly 1 doesn’t change the original figure. What would happen if the scale factor were 0?
If a length in the original figure is multiplied by 0, the corresponding length of the scale drawing would be 0, which doesn’t make sense.
A scale factor of 0 would be multiplied by a length in the original figure. Because multiplying by 0 always results in a product of 0, all lengths in the scale drawing would be 0. Can you imagine a figure with 0 length? Neither can I, so we know that any scale factor whose value is less than 1 but greater than 0 produces a reduction.
Henry’s Thinking
Students analyze a different way of producing a scale drawing that does not require the use of the scale factor.
Introduce the Henry’s Thinking problem. Allow students a moment to consider Henry’s answer and to decide whether he is correct. Then have students turn and talk about Henry’s thinking. Circulate to listen for students who notice the relationship of the horizontal side length to the vertical side length of each figure.
4. Henry’s teacher tells him that figure B is a scale drawing of figure A. She asks him what scale factor relates figure B to figure A. He responds that the scale factor is 2. Is Henry correct? Explain.
B
A
Henry is not correct. The scale factor is not 2; it is 1.5. Henry might have found the value of the ratio of length to width within each figure. He might have seen that the length is 2 times the width.
Promoting the Standards for Mathematical Practice
When students decide whether they think Henry’s thinking is correct and discuss their thinking with classmates, they are constructing viable arguments and critiquing the reasoning of others (MP3).
Ask the following questions to promote MP3:
• When do you think Henry’s strategy works?
• When would this strategy not work?
Facilitate a class discussion by using the following prompts.
Henry says the scale factor is 2. What do you think?
The scale factor can’t be 2 because the length of 4 in the original figure multiplied by 2 would give you 8 as the length in the scale drawing.
Why might Henry think the scale factor is 2?
Henry might have found the value of the ratio of the length to the width within each figure. He might have seen that the length is 2 times the width.
Can we use Henry’s strategy to create other scale drawings of the original figure? If so, what can be some measurements of the lengths and widths of other scale drawings?
Yes. Some other measurements can be a width of 1 2 inch and a length of 1 inch, a width of 4 inches and a length of 8 inches, or a width of 5 inches and a length of 10 inches.
Explain to students that Henry has pointed out a ratio of side lengths within a figure. This ratio can be useful when creating scale drawings, but it is not the scale factor.
Have students observe pairs of ratios between an original figure and its scale drawing from a previously completed problem to confirm that the ratios are equivalent and can be used to create other scale drawings.
Land
Debrief 5 min
Objectives: Determine whether a scale factor produces an enlargement or a reduction.
Create a scale drawing by using the proportional relationship that exists between corresponding distances.
Use the following prompts to engage students in a discussion about using scale factor.
Can we determine whether a scale drawing is an enlargement or a reduction by using only the scale factor? Why?
Yes. A scale factor greater than 1 creates an enlargement, and a scale factor less than 1 but greater than 0 creates a reduction. A scale factor of exactly 1 creates an identical figure.
How is a scale factor used to create a scale drawing?
Each length in an original figure is multiplied by the scale factor to determine the corresponding lengths in the scale drawing. Then those lengths are used to create a scale drawing.
Exit Ticket 5 min
Provide up to 5 minutes for students to complete the Exit Ticket. It is possible to gather formative data even if some students do not complete every problem.
Teacher Note
Assign the Practice problems for completion outside of class or use them in class if time remains after the lesson. Refer students to the Recap for support.
Using a Scale Factor
In this lesson, we
• determined which scale factors produce enlargements.
• determined which scale factors produce reductions.
• determined which scale factor produces identical figures.
• used a scale factor to create scale drawings.
Example
Create a scale drawing of the figure shown on the grid. Use a scale factor of 3
To find the side lengths of the scale drawing, multiply each side length of the original figure by the scale factor of 3 If it would be helpful, consider organizing side lengths in a table.
Expect to see varied solution paths. Accept accurate responses, reasonable explanations, and equivalent answers for all student work.
1. Figure B is a scale drawing of figure A. Estimate the scale factor that relates figure B to figure A. Explain your estimate.
The scale factor is about 11 4 . Figure B is larger than figure A, but it does not appear to be twice as large. It only appears to be slightly larger, so a number slightly greater than 1 is an appropriate estimate.
2. Figure B is a scale drawing of figure A. Estimate the scale factor that relates figure B to figure A. Explain your estimate.
A Figure B
The scale factor is about 1 2 . Figure B is smaller than figure A, and it appears to be approximately half the height and width of figure A. Student Edition: Grade 7, Module 1, Topic C, Lesson 16
3. Give an example of a scale factor that produces an enlargement. Explain why you chose this scale factor.
A scale factor of 3 produces an enlargement because it is greater than 1
4. Give an example of a scale factor that produces a reduction. Explain why you chose this scale factor.
A scale factor of 1 2 produces a reduction because it is less than 1 but greater than 0
5. Give an example of a scale factor that produces an identical scale drawing. Explain why you chose this scale factor.
A scale factor of 1 is the only scale factor that produces a scale drawing that is identical to its original figure.
6. Create a scale drawing of the figure shown on the grid. Use a scale factor of 13 4
EUREKA MATH2
Minds
EUREKA MATH2
Figure AFigure B
Figure
13. The table shows a proportional relationship between the number of cups of water and the number of eggs in a yellow cake recipe.
Write an equation that represents the relationship between the number of eggs e and the number of cups of water w used in the cake recipe.
e = 4w
14. Which of the following would best be represented by a negative number? Choose all that apply.
A. A temperature below 0°C
B. A deposit in a bank account
C. Gold coins buried 50 feet below sea level
D. The height of a mountain
E. A temperature of 0°F
Finding Actual Distances from a Scale Drawing
Find measurements of a figure when given a scale factor and either the scale drawing or the original figure
Lesson at a Glance
With a partner, students compute a scale factor when given a table of values. Partners use the scale factor to express the relationship between the side lengths of an original figure and the side lengths of a scale drawing as an equation. Students independently find measures of unknown side lengths of both the original figure and the scale drawing. With guidance, they notice that the scale factor relating the scale drawing to its original figure is the reciprocal of the scale factor relating the original figure to its scale drawing.
Key Question
• If we know that one figure is a scale drawing of another, how can we determine an unknown side length of one of the figures?
Achievement Descriptor
7.Mod1.AD8 Solve problems involving scale drawings of geometric figures. (7.G.A.1)
Agenda
Fluency
Launch 5 min
Learn 30 min
• Shawn’s Unknown Measurements
• More Unknown Side Lengths
• Original Figure: Measurements Unknown
Land 10 min
Materials
Teacher
• None
Students
• None
Lesson Preparation
• None
Fluency
Solve Equations
Students solve equations to prepare for finding unknown lengths in scale drawings.
Directions: Solve each equation for the unknown variable. 1. y = 3x when x =
Launch
Students identify a scale drawing as either an enlargement or a reduction and predict what the scale factor is before calculating.
Direct students to problem 1. Have students work independently. Consider using their responses to informally assess understanding of scale drawings and scale factors.
1. In the figures shown, △DEF is a scale drawing of △ ABC.
a. Is △DEF an enlargement or a reduction of △ ABC? Explain how you know. In the figures shown, △DEF is an enlargement of △ ABC because the lengths of the sides of △DEF are longer, so it is larger.
b. Determine the scale factor, and use it to calculate the length of side DE
When most students have finished, confirm their responses. Invite students to respond to the following prompt, and then transition into the next segment.
How did you use the scale factor you calculated in part (b) to determine the length of side DE ?
I multiplied the length of the corresponding side AB by the scale factor to get the length of side DE .
Now that we have some experience with scale drawings and the scale factors that relate them, let’s apply that understanding to write equations that allow us to find unknown side lengths of original figures or their scale drawings.
Learn
Shawn’s Unknown Measurements
Students use given measurements to determine the scale factor and then write and solve an equation to find unknown measurements of the scale drawing.
Direct students to problem 2. Allow time for productive struggle as students work with a partner to complete part (a). Circulate and listen for evidence of students calculating the scale factor and then using it to write an equation.
2. Shawn created a pentagon and a scale drawing of the pentagon.
a. Write an equation that relates the side lengths of the scale drawing to the side lengths of the original figure. Let y represent a side length of the scale drawing, and let x represent the corresponding side length of the original figure.
When most students are finished or the struggle is no longer productive, engage the class in a discussion by using the following prompts.
What information do you need to write the equation? How did you get that information?
Before you can write the equation, you need to figure out the scale factor. I found the scale factor by dividing a side length of the scale drawing by its corresponding side length in the original figure.
Consider engaging students in a conversation about the efficiency they gain by carefully selecting which pair of corresponding sides to use to calculate the scale factor. In this case, the corresponding horizontal bases present the simplest calculation required compared to the other corresponding side lengths.
How did you use the scale factor to write the equation for part (a)?
Since y represents a side length of the scale drawing, it is the dependent variable, and x is the independent variable. The equation is written as yx = 1 4 .
How is writing an equation to relate lengths in a scale drawing to lengths in an original figure similar to writing an equation for a proportional relationship?
It’s almost the exact same process except that when I write an equation for a proportional relationship, I need to know the constant of proportionality. For scale drawings, I need to know the scale factor.
Since a scale drawing of an original figure is a geometric representation of a proportional relationship, writing the equation is exactly the same except for what we call the constant of proportionality. With scale drawings, we refer to the constant as the scale factor.
Have students continue to work with their partners to complete part (b). Circulate to confirm answers or correct miscalculations.
UDL: Representation
While discussing this problem with students, consider annotating the table to show that each side length of the original figure is being multiplied by the scale factor to determine the corresponding side length of the scale drawing. Encourage students to demonstrate this in their work. This may help them when they use the scale factor to write equations.
b. Complete the table by using the equation from part (a).
Teacher Note
As students become familiar with identifying corresponding side lengths, they may feel it is unnecessary to use a table to organize the information. As appropriate, you may choose to have them omit this step.
More Unknown Side Lengths
Students determine the scale factor, write an equation, and use the equation to find unknown measurements of an original figure and its scale drawing.
Direct students to the More Unknown Side Lengths problem. Give them a moment to look over the entire problem, and then ask students as many of the following questions as needed before allowing them to work independently or with a partner:
• What do you notice about the pentagons?
• Which side lengths have unknown measurements?
• Which side of the scale drawing corresponds to side HI ?
• Which side of pentagon FGHIJ corresponds to side DE of the original figure?
• What do we need to know before we can write an equation to relate the original figure to the scale drawing?
• What did we do in the last problem before writing an equation?
• How did we use the equation to determine the measurement of an unknown side length?
Pentagon FGHIJ is a scale drawing of pentagon ABCDE.
a. Use the table to record corresponding side lengths.
b. Write an equation that relates the side lengths of the scale drawing to the side lengths of the original figure. Define your variables.
UDL: Representation
Can students determine correspondences between figures as well as determine ratios of side lengths within figures? If not, consider demonstrating how to use different-color highlighters or markers to color-code the notable sides. Use guiding questions to support student understanding, such as the following:
• How many times longer is side PQ than side UP ?
• What mathematical relationship exists between side UT and side UP ?
Focusing on the relationships that exist between figures, as well as within figures, allows students to make connections to how they can use these relationships to determine side lengths.
Let y represent a side length of the scale drawing.
Let x represent the corresponding side length of the original figure. yx = 3 2
c. Determine the length of side HI .
The length of side HI is 101 2 units.
d. Determine the length of side DE .
The length of side DE is 6 units.
When most students have finished, call the class back together to confirm responses. Facilitate a class discussion that focuses on part (d) by using the following prompts.
What was different about how you used the equation in part (d) compared to how you used the equation in part (c)?
In part (c), I solved the equation to find the y-value. In part (d), I solved the equation to find the x-value.
For part (d), we knew the measure for the side length of the scale drawing and needed to solve the equation to find the x-value, which represents the unknown side length of the original figure. Review the work you did to solve the equation for x. What extra step was required to determine the unknown side length?
I had to multiply both sides of the equation by 2 3 to figure out the unknown side length.
How does 2 3 relate to the scale factor you used in the equation?
2 3 is the reciprocal of the scale factor 3 2 .
Most of the work we’ve done so far with scale drawings has us taking a side length of an original figure and multiplying it by the scale factor to find an unknown side length of a scale drawing, as we did for part (c).
We now have a strategy for finding an unknown length in an original figure: Take the length in a scale drawing and multiply it by the reciprocal of the scale factor to find the corresponding length in the original figure.
Original Figure: Measurements Unknown
Students determine unknown measurements of an original figure when given all measurements of a scale drawing and one known corresponding side length of the original figure.
Direct students to problem 4. This problem presents students with a scale drawing of an original figure; however, the original figure has no measurements given. Use the following prompts to engage students in discussion about this problem.
Look at the polygons in problem 4. What do you notice?
Allow students to share anything they notice. They will likely notice that the scale drawing is a reduction of the original figure and that the original figure has no measurements given.
Language Support
Students work with reciprocals in grade 6 when dividing fractions. Students may need support in activating this prior knowledge. If so, consider providing them with examples such as the following:
• The reciprocal of 5 is 1 5 .
• The reciprocal of 3 2 is 2 3
Consider providing students with the sentence frame, “The reciprocal of is .” Offer more examples, and allow students to work with a partner to appropriately complete the sentence frames.
Promoting the Standards for Mathematical Practice
When students determine which sides correspond between figures and when they compare the ratios of side lengths within one figure, they are attending to precision (MP6).
Ask the following questions to promote MP6:
• What details are important to think about when determining corresponding sides?
• Is it correct to say the right side of the original figure corresponds to the right side of the scale drawing? What could we add or change to be more precise?
Since the scale drawing is a reduction of the original figure, what do we know about the scale factor even though we don’t have any measurements on the original?
Since it is a reduction, we know the scale factor is greater than zero, but less than one.
In the Henry’s Thinking problem from the last lesson, Henry used a within figure ratio to find an unknown side length. Henry noticed that the length was twice the width for a given rectangular figure. Could we apply Henry’s strategy to this problem? Turn and talk to your partner.
Circulate to listen for students who realize that Henry’s strategy can only be applied if we know at least one side length of the original figure. After students have had a chance to consider Henry’s strategy, move forward with the next prompt.
I heard some partners say that Henry’s strategy could work, but we still need at least one measurement for the original figure.
The measurement of side FA is 6 3 8 units. Label side FA as 6 3 8 . Use Henry’s strategy, or another strategy of your choice, to determine the length of side AB.
Have students work on problem 4 by using this new information. Circulate as students work, and identify any unique solution strategies.
4. Polygon PQRSTU is a scale drawing of polygon ABCDEF. Determine the length of side AB .
Teacher Note
Students are intentionally not provided with enough information to complete this problem. Expect students to realize there is missing information and request it.
UDL: Action & Expression
As students work, consider encouraging them to compare and discuss approaches, especially when you notice students using different methods. Also consider selecting student work to project and conducting brief discussions to support students as they practice.
Since the length of side PQ is 2 times the length of side UP , the length for side AB is 2 times the length of side FA .
The length of side AB is 123 4 units.
Some students may determine and use the reciprocal of the scale factor of 2 3 to find the unknown corresponding side length. Other students may use Henry’s strategy to find the ratio between side UP and side PQ . Since the length of side PQ is 2 times the length of side UP , students can multiply the length of side FA by 2 to determine the unknown length for side AB .
When most students have found the length of side AB , invite students to share their selected strategy and their work with the class.
Land
Debrief 5 min
Objective: Find measurements of a figure when given a scale factor and either the scale drawing or the original figure.
Lead students in a discussion about how to find unknown side lengths within scale drawings by using the following prompts.
If you know that one figure is a scale drawing of another, how can you determine an unknown side length of one of the figures?
To find an unknown side length, you must first determine the scale factor. Then, you can use the scale factor to write an equation that relates the scale drawing to the original figure. Finally, you use the equation to find unknown side lengths of the original figure or the scale drawing.
What’s the difference between finding an unknown length in a scale drawing and finding an unknown length in an original figure when using an equation?
When finding an unknown length in a scale drawing, the corresponding length in the original is multiplied by the scale factor. When finding an unknown length in an original figure, the corresponding length in the scale drawing is multiplied by the reciprocal of the scale factor.
Exit Ticket 5 min
Provide up to 5 minutes for students to complete the Exit Ticket. It is possible to gather formative data even if some students do not complete every problem.
Teacher Note
Assign the Practice problems for completion outside of class or use them in class if time remains after the lesson. Refer students to the Recap for support.
Finding Actual Distances from a Scale Drawing
In this lesson, we
• used scale factors to develop equations that relate scale drawings to their original figures.
• determined unknown side lengths of scale drawings.
• determined unknown side lengths of original figures.
• noticed that the scale factor relating a scale drawing to its original figure is the reciprocal of the scale factor that relates its original figure to the scale drawing.
Example
Figure 2 is a scale drawing of figure 1.
a. Determine the scale factor.
b. Write an equation that relates the scale drawing to the original figure. Let s represent a side length of the scale drawing, and let r represent the corresponding side length of the original figure.
s = 1.5r
Any pair of corresponding side lengths can be used to determine the scale factor. In this example, 4.5 and 3 are used, but 6 and 4 could also be used because 6 4 15 =
When developing the equation, recall that the scale factor is multiplied by the side length r in the original figure. The product is the length s of the corresponding side of the scale drawing.
c. Use the equation to find the unknown side length of the scale drawing that corresponds to the original figure’s side length of 1 unit.
sr = = = 15 151 15 .()
The unknown side length of the scale drawing is 1.5 units.
d. Use the equation to find the unknown side length of the original figure that corresponds to the scale drawing’s side length of 3 units.
sr r r r = = ÷= ÷ = 15 315 3151515 2
The unknown side length of the original figure is 2 units.
EUREKA MATH
Sample Solutions
Expect to see varied solution paths. Accept accurate responses, reasonable explanations, and equivalent answers for all student work.
In the following pair of images, △JKL is a scale drawing of △ ABC
1. Use the diagram to answer parts (a)–(c). ScaleDra OrwingB iginalFigureScale DrawingA
a. Is scale drawing A an enlargement or a reduction of the original figure?
Scale drawing A is a reduction of the original figure.
b. What is the scale factor that relates scale drawing A to the original figure?
c. Is scale drawing B an enlargement or a reduction of the original figure? Scale drawing B is an enlargement of the original figure.
d. What is the scale factor that relates scale drawing B to the original figure?
e. Write an equation that relates the lengths of scale drawing B to the lengths of scale drawing A. Let b represent a length of scale drawing B, and let a represent the corresponding length of scale drawing A.
b = 4a
a. Determine the scale factor.
b. Write an equation that relates the scale drawing to the original figure. Let f represent a length of the original figure, and let d represent the corresponding length of the scale drawing. d = 3f
c. Use the equation to find the length of JL . The length of JL is 9 units.
3. In the following pair of figures, figure 2 is a scale drawing of figure 1.
4. Liam creates this scale drawing of a sign that hangs at his school. He uses a scale factor of 1 3 w h t
a. Determine the scale factor.
0.25
b. Write an equation that relates the scale drawing to the original figure. Let a represent a length of the original figure, and let b represent the corresponding length of the scale drawing.
b = 0.25a
c. Use the equation to find the unknown side length in the scale drawing that corresponds with the side length of 5 units in the original figure.
1.25 units
d. Use the equation to find the unknown side length in the original figure that corresponds with the side length of 0.25 in the scale drawing.
unit
a. Write an equation that relates Liam’s scale drawing to the original sign. Let a represent a length of the original sign, and let b represent the corresponding length of Liam’s scale drawing.
ba = 1 3
b. On the grid, each unit represents 1 centimeter. Use the scale drawing on the grid and the equation from part (a) to find the corresponding lengths h, t, and w of the original sign.
The corresponding length of h in the original sign is 18 cm
The corresponding length of t in the original sign is 24 cm
The corresponding length of w in the original sign is 712cm
Describe the area of a scale drawing with scale factor r as r2 times the area of the original figure.
What is the area of the kitchen in scale drawing B?
The area of the kitchen in scale drawing A is 3 4 square inches.
Lesson at a Glance
Students discover the relationship between the areas of a scale drawing and an original figure through a structured but student-centered experience. In an exploratory task, students observe that when a square is scaled by scale factor r, the area of that square is scaled by a factor of r2. Then students test and confirm that this relationship holds true for other figures, such as rectangles and triangles.
Key Questions
• Is there a relationship between the area of the figure and the area of the scale drawing? Explain.
• If we know the area of the original figure and the scale factor, how can we find the area of the scale drawing?
Achievement Descriptors
7.Mod1.AD3 Identify the constant of proportionality in proportional relationships. (7.RP.A.2.b)
7.Mod1.AD8 Solve problems involving scale drawings of geometric figures. (7.G.A.1)
Agenda
Fluency
Launch 5 min
Learn 30 min
• Scaling Squares
• Scaling a Rectangle
• Returning to the Triangle Problem
Land 10 min
Materials
Teacher
• None
Students
• Straightedge
Lesson Preparation
• None
Fluency
Area of Polygons
Students find areas of polygons to prepare for comparing areas of scale drawings.
Directions: Find the areas of the polygons with the given side lengths.
1. A rectangle with a length of 8 cm and a width of 10 cm
2. A right triangle with a base of 8 cm and a height of 10 cm
3. A square with a side length of 7 cm
4. A right triangle with a base of 7 cm and a height of 7 cm
5. A right triangle with a base of 10 cm and a height of 9 cm
6. A right triangle with a base of 1.2 cm and a height of 5 cm
Teacher Note
Some students may benefit from visuals of the rectangle, triangles, and square.
Launch
Students construct a scale drawing and wonder about how areas of scale drawings relate to the areas of their original figures.
Allow students 2 minutes to individually complete problem 1.
1. Create a scale drawing of the triangle by using the scale factor of 3.
Differentiation: Support
Students need to be able to fluently create scale drawings with a given scale factor on grid paper. If students need more practice, consider reviewing the skill before moving on with the lesson. Use the scale drawings in the Scaling Squares exploration to walk students through how to draw a scale drawing with a given scale factor.
Have students think–pair–share with a partner about the following question.
How many of the original triangles do you think would fit into the larger scale drawing?
After two or three students have shared their answers, introduce the day’s learning by asking students to consider the next question.
Do you think the areas of scale drawings are related to the areas of the original figures in predictable ways? If so, how?
Allow students to make predictions; however, an accurate response to this question is not yet expected.
Today, we will explore how the areas of scale drawings relate to the areas of their original figures.
Teacher Note
Some students may interpret the scale factor, r, as indicating that the scale drawing’s area is r times the area of the original figure. This is a common misconception that can be addressed by reminding students that the scale factor relates only corresponding distances. Consider offering a real-life example, such as the following:
• When this pencil’s length is multiplied by a scale factor of 4, it is the same length as the desk. Does that mean the desk is 4 times as large as the pencil?
Learn
Scaling Squares
Students make observations about how areas of scale drawings are related.
Introduce the Scaling Squares segment. Have students work in pairs to complete problems 2–7. Circulate as students work.
Ask students the following questions as they work to highlight their thinking:
• Do you notice any patterns in the values in the table?
• For each pair of figures, how many of the original figure squares fit into the scale drawing?
For problems 2–7, use the provided scale factors to create a scale drawing of each original figure. Then calculate the areas of the original figure and the scale drawing.
Once most pairs have completed problems 2–7, introduce problem 8 while providing support for the term conjecture.
For problem 8, we are asked to make a conjecture. Mathematicians make educated guesses, called conjectures, based on observations. Then they try to prove that their conjectures are true or false. We will use our observations from problems 2–7 to write a conjecture about the relationship between the area of an original figure and the area of its scale drawing.
8. Write a conjecture, or an educated guess, that describes the relationship between the area of an original figure and the area of a scale drawing.
Consider asking pairs to share with the class their responses to problem 8, but do not validate any conjecture yet.
Direct students to problems 9–12. Tell students that this is their opportunity to prove that their conjecture is true or to refine it if it is not. Consider printing the answers to problems 9–12 and leaving a copy where students can easily access it. Instruct pairs to complete the problems and then to check their answers by using the answer key. If their answers are correct, then instruct them to continue to problem 13.
Ask pairs the following questions, if necessary, to support them in refining their conjecture:
• Does your conjecture work for some, but not all, of the problems? If so, which ones does it work for?
• What is similar among the cases for which your conjecture worked? What is different about the cases for which your conjecture did not work?
Teacher Note
After the original exploration, students may develop a misconception that the area of the scale drawing is the square of the scale factor. However, this worked only when the area of the original square was 1. If you notice that students have answered problems 9 and 10 correctly and problems 11 and 12 incorrectly, this misconception may be the cause of their error. To help students identify their error, ask questions such as the following:
• What is different about the original figures in the last two problems?
• Do you think the area of the original figure affects the area of the scale drawing?
Language Support
Consider directing students to use their Talking Tools to develop their conjectures. Students can use the I Can Share My Thinking section of the tool when communicating their ideas.
For problems 9–12, use the conjecture you wrote in problem 8 to find the areas of the following scale drawings without creating them.
Teacher Note
If students need support to clearly articulate the relationship between the areas of the scale drawings and the areas of the original figures, consider asking them to do a peer review. Have them write their conjecture, trade with a partner, and have the partner consider whether the conjecture is clear without needing further explanation. If the conjecture is not clear, have the partner ask questions and provide feedback with suggestions about how to make it clearer.
13. Do you think your conjecture will be true for scaled figures that are not squares? Explain your thinking.
Scaling a Rectangle
Students explore whether their conjecture is also true for
rectangles.
Present Scaling a Rectangle. Have students work with a partner on problem 14.
14. Consider the rectangle.
a. What is the area of the rectangle?
The area of the rectangle is 6 square units.
b. Suppose the conjecture you generated for squares also works for rectangles. What should the area of a scale drawing be if it is produced with a scale factor of 1 2 ?
Teacher Note
Students learn to evaluate
grade 8 module 1. In grade 7, students use what they know about exponential notation from grade 6 to interpret
The area of the scale drawing should be 1.5 square units.
c. Create the scale drawing by using a scale factor of 1 2 . Find the area of the scale drawing. Does the area you found confirm that your conjecture works for rectangles?
Promoting the Standards for Mathematical Practice
When students notice that the area of a region in a scale drawing is always related to the area of the corresponding region in the original figure by a factor of the scale factor squared, they are looking for and expressing regularity in repeated reasoning (MP8).
Ask the following questions to promote MP8:
• What patterns did you notice when comparing areas of corresponding regions in the scale drawing and original figure?
• Will this pattern always work?
The area of the scale drawing is 1.5 square units. This confirms that if the scale factor is r, the area of the scale drawing is r2 times the area of the original figure.
Returning to the Triangle Problem
Students verify that their conjecture is also true for triangles.
Present the Returning to the Triangle Problem segment. Have students work with a partner on problem 15.
15. Consider the triangles from problem 1.
a. Are the areas of the scaled triangles related in the same way as the areas of the scaled squares and rectangles? Explain.
Since the scale factor is 3, the area of the scale drawing should be 32 , or 9, times the area of the original figure.
The area of the scale drawing is 32 , or 9, times the area of the original figure, since 4 ⋅ 9 = 36. The area of the scaled triangle is related to the area of the original triangle in the same way as for squares and rectangles.
b. Suppose these two triangles had areas of 5 square units and 80 square units. Determine the scale factor that would enlarge the smaller triangle to the larger triangle.
5 16 =
The areas of the figures are related by a factor of 16. Their side lengths are related by a scale factor of 4 because 42 = 16.
When most students finish problem 15, ask them to summarize what they discovered about the relationship between the area of an original figure and the area of its scale drawing. If necessary, summarize the learning for students by using the following statement.
In this exploration, you found a relationship between the area of an original figure and the area of a scale drawing. You found that multiplying the original figure’s area by the scale factor squared gives you the scale drawing’s area. You verified that this property works for squares, rectangles, and triangles.
Land
Debrief 5 min
Objective: Describe the area of a scale drawing with scale factor r as r2 times the area of the original figure.
Initiate a class discussion by using the following prompts. Encourage students to revoice or build upon their classmates’ responses. Have students refer to problem 2.
In problem 2, why do you think the areas are related by a factor of 4 instead of by the scale factor 2?
The scale factor of 2 changes the measure of each length to be 2 times longer. Area is found by multiplying two lengths, so the areas should be related by a factor of 2 ⋅ 2, or 22 .
Is there a relationship between the area of the figure and the area of the scale drawing? Explain.
Yes. The areas are proportional, but they are related by a constant of proportionality other than the scale factor that relates their side lengths. The area of a scale drawing produced with a scale factor of r is r2 times the area of the original figure.
If you know the area of the original figure and the scale factor, how can you find the area of the scale drawing?
I can square the scale factor to determine the constant of proportionality that will relate the areas. I can then multiply the area of the original figure by that constant of proportionality to find the area of the scale drawing.
Exit Ticket 5 min
Provide up to 5 minutes for students to complete the Exit Ticket. It is possible to gather formative data even if some students do not complete every problem.
Teacher Note
Assign the Practice problems for completion outside of class or use them in class if time remains after the lesson. Refer students to the Recap for support.
Figure 2 is a scale drawing of figure 1. Figure 1 has an area of 16 square units. Figure 2 has an area of 256 square units. What scale factor relates figure 2 to figure 1? Explain how you know.
Relating Areas of Scale Drawings
In this lesson, we
• observed patterns in areas of scale drawings of figures including squares, rectangles, and triangles.
• determined that the area of a scale drawing created with a scale factor r is r2 times the area of the original figure.
• used areas of scale drawings to determine the scale factor.
Examples
1. Figure 2 is a scale drawing of figure 1. The area of figure 1 is 9 square units, and the scale factor is 8 What is the area of figure 2? Explain how you know.
Figure 2 Figure 1
When the side lengths are related by a scale factor of r, the areas are related by a factor of r2
Because the scale factor is 8, the areas of the figures are related by a factor of 82 or 64. The area of figure 2 is 576 square units because 9 ⋅ 64 = 576
Determine the factor that relates the areas by squaring the scale factor. Then multiply the area of the original figure by this factor to find the area of the scale drawing.
Determine the factor that relates their areas.
Since figure 2 is a scale drawing of figure 1, find the factor that relates the areas by finding the value of the ratio: areaoffigure2 areaoffigure1
The areas of the figures are related by a factor of 16. Their side lengths are related by a scale factor of 4 because 42 = 16
To find the scale factor, determine what value times itself is equal to 16
EUREKA
Sample Solutions
Expect to see varied solution paths. Accept accurate responses, reasonable explanations, and equivalent answers for all student work.
a.
b. Calculate the areas of △ ABC and △
The area of △ ABC is 84 square centimeters. The area of △DEF is 21 square centimeters.
c. What factor should you apply to the area of △ ABC to find the area of △DEF? How does the area of △DEF compare to the area of △ ABC? How does this relationship compare to the scale factor?
The areas of the triangles are related by a factor of 1 4 which means that the area of △DEF is 1 4 the area of △ ABC
The value of 1 4 is equivalent to the scale factor squared, 1 2 2()
3. Figure 2 is a scale drawing of figure 1. The area of figure 1 is 15 square units, and the scale factor is 5. What is the area of figure 2? Explain how you know.
Figure 2
Figure 1
Because the scale factor is 5 the areas of the figures are related by a factor of 52, or 25. The area of figure 2 is 375 square units because 15 25 = 375
4. Figure 2 is a scale drawing of figure 1. Figure 1 has an area of 8 square units, and figure 2 has an area of 200 square units. What scale factor relates figure 2 to figure 1? Explain how you know.
Figure 2
Figure 1
The areas of the figures are related by a factor of 25. Their side lengths are related by a scale factor of 5 because 52 = 25
5. Figure 2 is a scale drawing of figure 1. The area of figure 1 is 20 square units, and the scale factor that relates figure 2 to figure 1 is 3. What is the area of figure 2? Explain how you know.
Figure 1
Figure 2
Because the scale factor is 3, the areas of the figures are related by a factor of 32, or 9. The area of figure 2 is 180 square units because 20 ⋅ 9 = 180
EUREKA MATH
EUREKA MATH
Figure
2
10. Ava looks at the scale drawing shown. She notices that the scale drawing is about half the width and half the height of the original figure. For this reason, she says the scale factor is about 1 2
Do you agree or disagree with Ava’s reasoning? Explain your answer.
I agree with Ava. The scale factor must be less than 1 because the scale drawing is a reduction of the original figure. Since the scale drawing is about half the width and half the height of the original figure, the scale factor is about 1 2 11. Evaluate 2x2 + 2x − 16 when x = 3. 8
Describe the difference between a scale and a scale factor. Find unknown measurements in scale drawings through the appropriate use of scales and scale factors.
Lesson at a Glance
In this lesson, students apply their understanding of scale factor to generate an appropriate scale to represent a situation. Students interpret what a given scale means in context. In a modeling task, students design a billboard advertisement that includes an enlarged floor plan, and they reflect on the appropriateness of their chosen scale. This lesson introduces the term scale.
Key Questions
• What is a scale, and why is it useful?
• When might it be better to use a scale instead of a scale factor?
Achievement Descriptors
7.Mod1.AD7 Reproduce a scale drawing at a different scale. (7.G.A.1)
7.Mod1.AD8 Solve problems involving scale drawings of geometric figures. (7.G.A.1)
Agenda
Fluency
Launch 5 min
Learn 30 min
• Which Scale?
• Creating an Appropriate Scale
• Identifying Scale
• Creating a Billboard
Land 10 min
Materials
Teacher
• None Students
• Straightedge
Lesson Preparation
• Consider having graph paper available for students to use on the Creating a Billboard problem.
Fluency
Convert Between Units of Measure
Students convert between units of measure (length) to prepare for using scales and scale factors appropriately.
Directions: Convert between the units of measure.
Launch
Students observe a scaled map and explore its relationship to the actual distances it depicts.
Have students complete problem 1 with a partner.
1. Consider the map.
a. In your own words, describe what the map shows.
The map shows a city with different locations marked.
b. Is the restaurant or the coffee shop closer to the house? How do you know?
The coffee shop is closer to the house because it appears closer on the map.
c. Can you determine the distance from the house to the coffee shop from the information provided in the map?
No. I would need to know a distance on the map to determine the actual distances between any of these locations.
Teacher Note
Depending on how familiar students are with maps, consider conducting a class discussion about the features of the map.
• What do you think the symbols on this map mean?
Conduct a class discussion by using the following questions. This is just the first of several discussions about scale in this lesson.
How can you tell which locations are closer to or further from the actual house than other locations?
If the locations appear closer on the map, I think they are closer in actual distance as well.
What information would help us determine the actual distances between the locations shown on the map?
It would be helpful to know the size of the actual city compared to the size of the map.
Transition to the next activity by using the following prompt.
A map is an example of a scale drawing. To determine the actual distances between these locations, we need to know what scale factor relates the distances on the map to the actual distances. Today, we will consider what type of scale factor is appropriate for situations like this.
Learn
Which Scale?
Students consider multiple meanings of the word scale.
Have students think–pair–share with a partner about problem 2.
2. Consider the following figures, which all depict the word scale. Which one best relates to the work of the module? Why? What does the figure show?
Representation of Scale
Representation of Scale
Representation of Scale
Representation of Scale
Representation of Scale
FRANCE
1cm
1centimeterrepresents100miles
Invite students to share their responses to problem 1. Then focus the discussion on the mathematical use of the word scale by using the following prompts.
Which figure shows how we use the word scale in math?
I think the figure in answer choice E shows how we use the word scale because it shows how distances on a scale drawing relate to actual distances.
What do you think the term scale means in this context?
The scale is probably like a scale factor. It shows the relationship between distances on the map and actual distances.
Creating an Appropriate Scale
Students analyze a context in which a given scale is not appropriate to represent a situation and then generate a more appropriate scale.
Complete problem 3 as a class. Have students record their work.
Pause after part (b) and ask questions that elicit the idea that inches are not a typical form of measurement for such a large distance. Encourage students to suggest another form of measurement that may make it easier to conceptualize the actual distance.
About how long is 158,400 inches? Why is this difficult to think about?
When I think of inches, I think of a ruler, which has only 12 inches. It is difficult to think about a number that large.
Why does using this unit of measure seem unreasonable? What unit of measure would be more reasonable to use to represent distances like this?
Language Support
The term scale has multiple meanings. Pay close attention to how students interpret and use the term. Problem 2 provides several examples. Consider having students highlight where scale appears in the figure here as well as in problems throughout the lesson.
Complete parts (c) and (d) together. Then facilitate a class discussion about scale by using the following prompts.
What is a scale?
A scale tells how distances in a scale drawing are related to distances in the original setting.
When does it makes more sense to use a scale rather than a scale factor?
A scale lets you pick more appropriate units to compare two distances. When a scale factor is used, the units must be the same. So if the corresponding distances produce a scale factor that is either very large or very small, then using a scale makes sense.
3. For this map, the scale factor is 63,360.
a. What is the actual distance in inches that corresponds with a distance of 1 inch on the map?
63,360 inches
b. What is the actual distance in inches that corresponds with a distance of 2.5 inches on the map?
158,400 inches
c. What unit of measure might be more appropriate than inches to represent the actual distances? Determine a scale using this unit of measure.
Feet or miles would be a more appropriate unit of measure.
12 inches = 1 foot
63360 12 ,5280 , =
The scale could be 1 inch represents 5,280 feet.
5,280 feet = 1 mile
5280 5280 ,1 , =
The scale could be 1 inch represents 1 mile.
d. The distance between the hospital and the parking garage on the city map is 3 inches. Use your scale to find the actual distance.
Based on the scale of 1 inch represents 5,280 feet, the actual distance from the hospital to the parking garage is 15,840 feet because 3(5,280) = 15,840.
Based on the scale of 1 inch represents 1 mile, the actual distance from the hospital to the parking garage is 3 miles because 3(1) = 3.
Identifying Scale
Students explain what a scale means in context.
Have students work with a partner on problem 4. Circulate as students work and listen for how they use the double number line to find the actual distance that corresponds to 1 inch on the map.
4. Consider the scale for the map of Hawaii. Explain what the scale means in context. Your answer should include what 1 inch on the map represents in terms of actual distance.
Teacher Note
It is important to leave enough time for students to complete problem 5. If time is short, consider having students first complete problem 5 and then complete problem 4. Another option is to assign problem 4 as homework.
The scale means that 1 inch on the map corresponds to 160 miles of actual distance.
Creating a Billboard
Students use scale and scale factor to solve a problem.
Have students work with a partner on problem 5. Circulate as students work and listen for the rationale they give for their choice of scale. Encourage students to engage with the problem by modeling it with Read–Represent–Solve–Summarize.
5. A developer advertises a new housing development. She wants to enlarge this floor plan to fit on a billboard. The billboard is 18 feet tall and 48 feet long. Using your knowledge of scale and scale factor, provide directions about how to enlarge the floor plan. Your final response should address design features such as the total area of the enlarged floor plan and the space needed for other information on the billboard.
Promoting the Standards for Mathematical Practice
When students create scales to use for their billboards and when they reflect on the appropriateness of their chosen scales, they are modeling with mathematics (MP4).
Ask the following questions to promote MP4:
• What key ideas in the Creating a Billboard problem do you need to make sure to use in your model?
• What do you wish you knew to create this billboard?
• How could you improve your billboard design to better represent the enlarged floor plan?
Differentiation: Support
Invite students to share their responses to problem 5. Consider using any of the following prompts to engage the class in discussion:
• Did you use a scale or a scale factor to create the scale drawing for the billboard?
• What scale did you pick for your billboard drawing? Was that an appropriate scale?
• What other information might the developer want to put on this billboard? Is there enough room to include that information?
If students need support getting started with this problem, consider asking questions as they work:
• What units are involved in this problem?
• Does it make more sense to use a scale or a scale factor?
Have graph paper available, and suggest that students sketch out the billboard, including the enlarged blueprint, to determine whether their chosen scale is appropriate.
Land
Debrief 5 min
Objectives: Describe the difference between a scale and a scale factor.
Find unknown measurements in scale drawings through the appropriate use of scales and scale factors.
Use the following prompts to guide a discussion about scale and scale factor.
What is a scale, and why is it useful?
A scale is a ratio that compares a distance on a scale drawing to the actual distance. A scale is useful when the scale factor would be very large or very small. In this case, a scale gives you the flexibility to use units of measure that are more appropriate for both contexts.
How is using a scale to find unknown side lengths different from using a scale factor?
When using a scale, you need to pay close attention to the quantities. Sometimes you need to use a conversion factor to relate quantities given with a different unit of measure.
When might it be better to use a scale instead of a scale factor?
Using a scale might be better when relating two distances of very different sizes, such as the distance on a map and the actual distance.
Exit Ticket 5
min
Provide up to 5 minutes for students to complete the Exit Ticket. It is possible to gather formative data even if some students do not complete every problem.
Teacher Note
Assign the Practice problems for completion outside of class or use them in class if time remains after the lesson. Refer students to the Recap for support.
Edition: Grade 7, Module 1, Topic C, Lesson 19
Scale and Scale Factor
In this lesson, we
• created a more appropriate scale to represent a scale drawing.
• interpreted the meaning of a scale in context.
• used a scale to find unknown measurements.
• developed a scale to complete a modeling activity.
Examples
Terminology
For problems 2 and 3, determine the scale factor that corresponds to the scale.
2. 1 foot represents 20 miles.
20(5,280) = 105,600
The scale factor is 105,600.
To find the scale factor, compare values with the same unit of measure.
1. Consider the given scale.
a. What is the actual distance that corresponds to a distance of 1 inch on the map?
32 1 4 ÷= = The actual distance is 32 miles.
b. What is the actual distance that corresponds to a distance of 5 4 inches on the map? 5 4 3240 = The actual distance is 40 miles.
The scale shows the relationship between the distances in a scale drawing and the distances in the original setting. A scale also gives the flexibility to use different units of measure. This scale is like a double number line. This means that 1 4 inch on the map represents 8 miles of actual distance. 016 0 8 Map Distance (inches) Actual Distance (miles) 1 4 1 2 It is also accurate to use 1 2 inch and 16 miles from the scale. 16162 32 1 2 ÷= = Since 1 inch represents 32 miles, other unknown distances can be found by using this scale.
This scale factor means that 1 foot in the scale drawing represents 105,600 actual feet.
3. 1 centimeter represents 8 meters.
8(100) = 800
The scale factor is 800
To determine the number of feet in 20 miles, multiply the number of miles, 20, by the number of feet in 1 mile, 5,280
Student
Sample Solutions
Expect to see varied solution paths. Accept accurate responses, reasonable explanations, and equivalent answers for all student work.
1. For this map, the scale factor is 126,720
c. On the map, the distance between the hospital and the gas station is 4 inches. Use the scale you determined in part (b) to find the actual distance.
Based on the scale of 1 inch represents 10,560 feet, the actual distance from the hospital to the gas station is 42,240 feet because 4(10,560) = 42,240
Based on the scale of 1 inch represents 2 miles, the actual distance from the hospital to the gas station is 8 miles because 4(2) = 8.
2. A developer wants to reduce this floor plan drawing so that it will fit on a brochure with other designs. The developer creates a scale in which 1 inch in the original floor plan drawing represents 0.5 inches in the reduced floor plan drawing.
a. What is the actual distance in inches that corresponds to a distance of 1 inch on the map? 126,720 inches
b. What unit of measure might be more appropriate than inches to represent the actual distances? Determine a scale by using this unit of measure. Feet or miles would be a more appropriate unit of measure.
The scale could be 1 inch represents 10,560 feet. The scale could be 1 inch represents 2 miles.
a. What are the lengths in the reduced floor plan drawing? The lengths are 1.5 inches and 3 inches.
b. What scale factor reduces the original floor plan drawing to the reduced floor plan drawing? The scale factor is 0.5
ADRIATIC SEA
For problems 4–6, determine the scale factor that corresponds to each scale.
4. 1 inch represents 10 feet. The scale factor is 120 5. 1 millimeter represents 4 meters.
The scale factor is 4,000 6. 1 foot represents 10 miles.
The scale factor is 52,800.
Remember
For problems 7–9, add.
Does figure B appear to be a scale drawing of figure A? Explain your thinking.
No. Figure B does not appear to be a scale drawing of figure A. It appears that a scale factor has been applied to the width of figure A, but the height appears to be the same so the distances of figure B are not proportional to those of figure A.
11. Evaluate 2(3x + 5) + 4x + 5 when x = 3.
EUREKA MATH
10.
Creating Multiple Scale Drawings
Draw a scale drawing of another scale drawing by using a new scale factor.
Write an equation for the proportional relationship relating scale drawings that have different scale factors and use the equation to find unknown distances.
Lesson at a Glance
Figure 2 is an enlargement of figure 1 and is produced with a scale factor of 1.2. Figure 3 is a reduction of figure 2 and is produced with a scale factor of 0.4
2
1
3
a. Is figure 3 a scale drawing of figure 1? Yes. Figure 3 is a scale drawing of figure 1 since they are both proportional to figure 2.
b. What scale factor reduces figure 1 to figure 3? 1.2 · 0.4 = 0.48 The scale factor that reduces figure 1 to figure 3 is 0.48.
c. Write an equation that represents the relationship between the side lengths of figure 3 and figure 1. Let y represent a side length of figure 3, and let x represent the corresponding side length of figure 1.
y = 0.48x
In this lesson, students explore the features of a scale drawing of a figure that is already a scale drawing. Students conclude that if a scale drawing is made from a scale drawing, the scale factor that takes the original figure to the second scale drawing is the product of the scale factors. Students apply their understanding of scale factor to write and solve equations that relate the side lengths of an original figure to the side lengths of a second scale drawing.
Key Question
• How can we find the scale factor that relates an original figure to a second scale drawing?
Achievement Descriptors
7.Mod1.AD7 Reproduce a scale drawing at a different scale. (7.G.A.1)
7.Mod1.AD8 Solve problems involving scale drawings of geometric figures. (7.G.A.1)
Agenda
Fluency
Launch 5 min
Learn 30 min
• Scaling Scale Drawings
• Relating Scale Drawings
Land 10 min
Materials
Teacher
• None
Students
• Straightedge
Lesson Preparation
• Consider having grid paper available for students who make errors or need additional space.
Fluency
Find the Scale Factor
Students find the scale factor by using side lengths to prepare for using scale factors to find unknown distances.
Directions: Determine the scale factor by using the figures shown.
Figure AFigure BFigure C
1. Figure A to figure B
Figure
to figure C
Launch
Students study four pairs of figures and consider which pair does not belong with the others based on key features.
Original Figure
Figure
Display the illustration of four pairs of figures. Introduce the Which One Doesn’t Belong? routine. Present the four pairs of figures and invite students to study them.
Give students 1 minute to find a category in which three of the pairs belong, but the fourth pair does not.
Highlight responses that emphasize reasoning about the scale factors used.
Set A is the only set that shows an enlargement.
Set B is the only set that shows that the figures are the same size.
Set C is the only set that does not show a scale drawing.
Set D is the only set that shows a reduction.
Ask questions that invite students to use precise language, make connections, and ask questions of their own.
Sample questions:
• Do these illustrations appear to show figures that are scale drawings?
• Can we find the scale factors that relate these figures? If not, how can we estimate the scale factors in each of these?
• Why is the second figure in set B considered a scale drawing, even though it did not change size?
Sets A, B, and D show a relationship between the corresponding lengths of an original figure and a scale drawing. Today, we will explore what happens when a second scale drawing is created from a scale drawing of an original figure.
Learn
Scaling Scale Drawings
Students draw a scale drawing of a scale drawing and compare it to the original figure.
Use the Numbered Heads routine to engage the class with problem 1. Organize students into groups of four and assign each student a number, 1 through 4. Assign one part, (a)–(e), to each group and have them follow the directions to create two scale drawings from that original figure. Assign the same part to multiple groups, if necessary.
Teacher Note
The word relates is generally used throughout the topic to identify the scale factor used in creating the scale drawing from the original figure. In this lesson, more than one scale drawing is referenced. To limit ambiguity, the word takes is used to clarify which figure is the original figure and which is the scale drawing. This phrasing also appears in grade 8 when students work with transformations.
Promoting the Standards for Mathematical Practice
When students predict that the scale factor that will take figure 1 to figure 3 can be found by multiplying the two scale factors, they are making conjectures. Later when students justify why their conjecture is true by using knowledge of scale drawings, they are constructing viable arguments (MP3).
Ask the following questions to promote MP3:
• Can you find a situation where your conjecture does not work?
• Why does your strategy for finding the combined scale factor work? Convince your partner.
Monitor groups as they work, and probe their thinking with questions like the following:
• What do you find is the most efficient way to create a scale drawing?
• How do you think the second scale drawing is related to the original figure?
• Do you think it is possible to accurately predict the scale factor that relates the original figure to the second scale drawing?
1. Construct a scale drawing of figure 1 by using the first scale factor and label it Figure 2. Then construct a scale drawing of figure 2 by using the second scale factor and label it Figure 3.
a. First scale factor: 1 3 ; second scale factor: 4
UDL: Action & Expression
Consider preparing annotated copies with completed scale drawings for all parts of problem 1. After groups finish the problem, they can compare their scale drawings with the annotated examples and identify areas of success and areas for improvement.
b. First scale factor: 1 2 ; second scale factor: 2
c. First scale factor: 3; second scale factor:
e. First scale factor: 4; second scale factor: 1
As groups finish their assigned scale drawings, have them complete problems 2 and 3. Part of problem 3 asks students to return to problem 1 and complete all parts (a)–(e) to confirm whether their prediction was correct.
It is not important that all groups finish all problems. Tell students that any one of them could be the spokesperson for the group, so each person in the group should be prepared to present their method for predicting the scale factor that takes figure 1 to figure 3.
2. For your assigned problem, compare the original figure (figure 1) to the second scale drawing (figure 3). Does the second scale drawing appear to be a scale drawing of the original figure? Justify your thinking. If so, what scale factor relates the two figures?
Differentiation: Support
If students need support with recognizing that the scale factor that takes figure 1 to figure 3 is found by multiplying the scale factors, challenge them to carefully analyze a single side length. Have them track that length through the first and second scale drawings and record their calculations. For example, in problem 1(a):
The side length in figure 1 is 3 units.
The side length in figure 2 is 1 unit because 3 ⋅ 1 3 = 1.
The side length in figure 3 is 4 units because 1 ⋅ 4 = 4.
So from figure 1 to figure 3, the calculation is as follows:
Yes. Figure 3 is a scale drawing of figure 1. All corresponding distances in figure 1 are proportional to those in figure 3. The scale factor of 4 3 enlarges figure 1 to figure 3.
3. With your group, predict the scale factor that takes figure 1 to figure 3 for each of the remaining parts of problem 1. Then complete each scale drawing by using the assigned scale factors to check the accuracy of your prediction. Be prepared to share how your group made predictions about the scale factor that takes figure 1 to figure 3.
Differentiation: Challenge
Challenge groups of students to predict whether a second drawing will be the same if they complete their scale drawings in reverse order. Have students verify their predictions by going back to the original figure their group was assigned and completing the scale drawings again, this time using the scale factors in reverse order.
Students should determine that when the scale drawings are completed in reverse order, the final scale drawing still looks the same.
Once all groups have had a chance to make a prediction and confirm with at least one additional part of problem 1, call the class back together. Then say a number, 1 through 4, to identify the group’s spokesperson, and use the prompt that follows.
As spokesperson for your group, describe the method you used to predict the scale factor that takes figure 1 to figure 3.
We predicted that the scale factor that takes figure 1 to figure 3 is the product of the two scale factors given. We verified that our prediction was correct by testing it out with other parts of problem 1. We created a scale drawing by using the scale factor we thought it would be and then checked it by creating the scale drawing for figure 2 and then figure 3. Our final scale drawings were the same, so we knew our prediction was correct.
Facilitate a class discussion by using the following questions. Consider calling out a number to identify a spokesperson for the remainder of the discussion.
We discovered in problem 1 that a scale drawing of a scale drawing can be created by applying the product of both scale factors to the original figure. Which figures do we know this method works with?
Problem 1 has triangles, squares, and rectangles so we know it works with those figures.
Take 10 seconds to silently think about whether this method works for all figures.
After 10 seconds, invite students to share their thoughts and validate responses backed up by reasoning. For now, students can only be certain this method works for the figures observed in problem 1 and any other figure that is composed of triangles, rectangles, or squares.
Why does the method of multiplying the scale factors together to determine the new scale factor work?
Have students discuss with their group for 1 minute.
The lengths in the first scale drawing are found by taking the lengths of the original figure and multiplying them by the scale factor. Then the lengths in the second scale drawing are found by taking the lengths in the first scale drawing and multiplying them by the new scale factor. So we can go straight from the lengths of the original figure to the lengths of the second scale drawing by multiplying the original lengths by both scale factors.
When we think about this with a simple figure, like a square with a side length of 1 unit, we can make sense of why the method of taking the product of scale factors works. If we scale a side length of 1 unit by a scale factor of 2, we get a side length of
2 units. Then we can take the length of 2 units and scale it by a scale factor of 3 to get 6 units. To get from 1 unit of length to 6 units of length, we multiply the original length by 6, which happens to equal the product of scale factors 2 and 3.
Relating Scale Drawings
Students determine the combined scale factor without using side lengths.
Have students work with their group on problem 4.
4. Figure 2 is a reduction of figure 1 and was produced by using a scale factor of 3 4 . Figure 3 is a reduction of figure 2 and was produced by using a scale factor of 1 2 .
Differentiation: Challenge
Challenge groups of students to use the equation developed in problem 4(c) to find the length of a side of figure 1, given the length of a side of figure 3. Ask:
• If a side length of figure 3 is 6 units, what is the length of the corresponding side in figure 1?
a. Is figure 3 a scale drawing of figure 1?
Yes. Figure 3 is a scale drawing of figure 1 since they are both proportional to figure 2.
b. What scale factor reduces figure 1 to figure 3? 3 4 1 2 3 8 ⋅=
The scale factor that reduces figure 1 to figure 3 is 3 8 .
The length of that side in figure 1 is 16 units.
Figure 1
Figure 2
Figure 3
c. Write an equation that represents the relationship between the side lengths of figure 3 and figure 1. Let y represent a side length of figure 3, and let x represent the corresponding side length of figure 1.
d. The figures shown are regular pentagons, meaning that each pentagon has five sides that are the same length. If a side length of figure 1 is 40 units, what is the length of the corresponding side of figure 3?
The length of the corresponding side of figure 3 is 15 units.
Debrief 5 min
Objectives: Draw a scale drawing of another scale drawing by using a new scale factor.
Write an equation for the proportional relationship relating scale drawings that have different scale factors and use the equation to find unknown distances.
Facilitate a class discussion by using the following prompts. Encourage students to restate their classmates’ responses.
How can we find the scale factor that relates an original figure to a second scale drawing?
We can multiply the scale factors. This gives us the scale factor that produces the second scale drawing from the original figure.
How can you predict whether the second scale drawing will be an enlargement or a reduction of the original?
Once I find the scale factor, if the scale factor is greater than 1, it is an enlargement. If the scale factor is greater than 0 but less than 1, it is a reduction.
Do you think your method would also work with 3 scale drawings? Or 4? Why?
Yes. I think it would work for any number of scale drawings. To find the new lengths, you multiply the original lengths by the scale factor, and you could perform this multiplication many times for many scale drawings.
Exit Ticket 5 min
Provide up to 5 minutes for students to complete the Exit Ticket. It is possible to gather formative data even if some students do not complete every problem.
Teacher Note
Assign the Practice problems for completion outside of class or use them in class if time remains after the lesson. Refer students to the Recap for support.
Creating Multiple Scale Drawings
In this lesson, we
• created a scale drawing of a figure that was already a scale drawing.
• determined that the scale factor that relates the original figure to the second scale drawing is found by multiplying the scale factors.
• wrote equations to represent the relationship between the side lengths of an original figure and the side lengths of a second scale drawing.
• used equations to find unknown side lengths.
Example
Figure 2 is a reduction of figure 1 and is produced with a scale factor of 1 2 Figure 3 is a reduction of figure 2 and is produced with a scale factor of 1 3
3 Figure 2 a. Is figure 3 a scale drawing of figure 1?
1
Figure 3 is a scale drawing of figure 1 since they are both proportional to figure 2.
b. What scale factor reduces figure 1 to figure 3? 1 2 1 3 1 6 ⋅=
The scale factor that reduces figure 1 to figure 3 is 1 6
c. What scale factor enlarges figure 3 to figure 1? 1 6 1 6 =
The scale factor that enlarges figure 3 to figure 1 is 6.
d. Write an equation that could be used to find any length in figure 3, given a corresponding length in figure 1. Let y represent a side length of figure 3, and let x represent the corresponding side length of figure 1.
yx = 1 6
e. Suppose a side length in figure 1 is 9 units. What is the length of the corresponding side in figure 3? yx = = = = 1 6 1 6 9 6 3 2 9 ()
The corresponding side length in figure 3 is 3 2 units.
The combined scale factor that takes the original figure to the second scale drawing is found by multiplying the two scale factors. The scale factor that enlarges figure 3 to figure 1 is the reciprocal of the scale factor that reduces figure 1 to figure 3. Since scale drawings are examples of proportional relationships, write equations in the same form, y = kx, where the scale factor is the constant of proportionality k To find the length of the side in figure 3, evaluate the equation when x = 9
Expect to see varied solution paths. Accept accurate responses, reasonable explanations, and equivalent answers for all student work.
1. Quadrilateral EFGH is a scale drawing of an original figure. The scale factor between the original figure and the scale drawing is 2 3
c. What is the scale factor between the original figure, quadrilateral ABCD, and the quadrilateral WXYZ? Since the scale factor from quadrilateral ABCD to quadrilateral EFGH is 2 3 , and the scale factor from quadrilateral EFGH to quadrilateral WXYZ is 1 2 the scale factor from quadrilateral ABCD to quadrilateral WXYZ must be 1 3 because 2 3 1 2 1 3 ⋅=
2. Figure 2 is a reduction of figure 1 and is produced with a scale factor of 1 4 . Figure 3 is a reduction of figure 2 and is produced with a scale factor of 1 5
Figure 2 Figure 3
Figure 1
a. Is figure 3 a scale drawing of figure 1? Yes. Figure 3 is a scale drawing of figure 1 since they are both proportional to figure 2.
b. What scale factor reduces figure 1 to figure 3? 1 20
c. What scale factor enlarges figure 3 to figure 1? 20
(Note: The student responses and work for parts (a)–(c) are shown in purple in the graph.)
a. Create a scale drawing of quadrilateral EFGH by using a scale factor of 1 2 Label this drawing quadrilateral WXYZ
b. Draw the original figure. Label the resulting quadrilateral ABCD
d. Write an equation that could be used to find any side length of figure 3, given a corresponding side length of figure 1. Let y represent a side length of figure 3, and let x represent the corresponding side length of figure 1.
yx = 1 20
e. If the length of a side of figure 1 is 8 units, what is the length of the corresponding side of figure 3?
The corresponding side length in figure 3 is 2 5 units.
3. Figure 2 is a scale drawing of figure 1 and is produced with a scale factor of 1.7 Figure 3 is a scale drawing of figure 2 and is produced with a scale factor of 0.6
1
Consider figure 1. 4 1
2
2
3
a. What scale factor is used to relate the side lengths of figure 1 to the side lengths of figure 3? 1.02
b. Is figure 3 an enlargement or a reduction of figure 1?
Enlargement
(Note: The student responses to parts (a) and (b) are shown in purple in the graph.)
a. Create a scale drawing of figure 1 by using a scale factor of 1.5 Label it Figure 2.
b. Create a scale drawing of figure 1 by using a scale factor of 0.5 Label it Figure 3.
c. What scale factor reduces figure 2 to figure 3? 1 3
d. Find the area of figure 2. 4.5 square units
e. Use the scale factor you generated in part (c) to find the area of figure 3. 0.5 square units
9. Dylan makes a model skyscraper by using a scale in which 1 inch represents 65 feet. What is the height of the actual skyscraper if the height of the model is 171 2 inches?
The height of the actual skyscraper is 11371 ,2 feet.
10. Estimate the sum. Then use the standard algorithm to find the sum. 8.39 + 6.4 + 5.74
An estimate is 20. The sum is 20.53 8. 3 9
Teacher Edition: Grade 7, Module 1, Standards
Standards
Module Content Standards
Analyze proportional relationships and use them to solve real-world and mathematical problems.
7.RP.A.1 Compute unit rates associated with ratios of fractions, including ratios of lengths, areas and other quantities measured in like or different units. For example, if a person walks 1 2 mile in each 1 4 hour, compute the unit rate as the complex fraction 1 2 1 4 miles per hour, equivalently 2 miles per hour.
7.RP.A.2 Recognize and represent proportional relationships between quantities.
a. Decide whether two quantities are in a proportional relationship, e.g., by testing for equivalent ratios in a table or graphing on a coordinate plane and observing whether the graph is a straight line through the origin.
b. Identify the constant of proportionality (unit rate) in tables, graphs, equations, diagrams, and verbal descriptions of proportional relationships.
c. Represent proportional relationships by equations. For example, if total cost t is proportional to the number n of items purchased at a constant price p, the relationship between the total cost and the number of items can be expressed as t = pn.
d. Explain what a point (x, y) on the graph of a proportional relationship means in terms of the situation, with special attention to the points (0, 0) and (1, r) where r is the unit rate.
7.RP.A.3 Use proportional relationships to solve multistep ratio and percent problems. Examples: simple interest, tax, markups and markdowns, gratuities and commissions, fees, percent increase and decrease, percent error.
Draw, construct, and describe geometrical figures and describe the relationships between them.
7.G.A.1 Solve problems involving scale drawings of geometric figures, including computing actual lengths and areas from a scale drawing and reproducing a scale drawing at a different scale.
Standards for Mathematical Practice
MP1 Make sense of problems and persevere in solving them.
MP2 Reason abstractly and quantitatively.
MP3 Construct viable arguments and critique the reasoning of others.
MP4 Model with mathematics.
MP5 Use appropriate tools strategically.
MP6 Attend to precision.
MP7 Look for and make use of structure.
MP8 Look for and express regularity in repeated reasoning.
7.Mod1.AD1 Compute unit rates associated with ratios of fractions given within contexts.
RELATED CCSSM
7.RP.A.1 Compute unit rates associated with ratios of fractions, including ratios of lengths, areas and other quantities measured in like or different units.
For example, if a person walks
2 mile in each
4 hour, compute the unit rate as the complex fraction
miles per hour, equivalently 2 miles per hour.
Partially Proficient Proficient Highly Proficient
Compute unit rates associated with ratios of fractions given within contexts. Peyton walks 1 2 mile in each 1 4 hour. What is the unit rate associated with his rate in miles per hour?
7.Mod1.AD2 Recognize proportional relationships.
RELATED CCSSM
7.RP.A.2.a Decide whether two quantities are in a proportional relationship, e.g., by testing for equivalent ratios in a table or graphing on a coordinate plane and observing whether the graph is a straight line through the origin.
Partially Proficient
Proficient Highly Proficient
Recognize proportional relationships.
Which of the following represent proportional relationships? Select all that apply.
Justify why two quantities are proportional or are not proportional.
The table shows the amounts of sodium and sugar in different sizes of a popular soft drink.
Jaylen thinks the quantities in the tables are proportional. Henry thinks they are not.
Who is correct? Justify your answer.
7.Mod1.AD3 Identify the constant of proportionality in proportional relationships.
RELATED CCSSM
7.RP.A.2.b Identify the constant of proportionality (unit rate) in tables, graphs, equations, diagrams, and verbal descriptions of proportional relationships.
Partially Proficient
Proficient
Identify the constant of proportionality in proportional relationships.
Identify the constant of proportionality in each proportional relationship shown.
Constant of Proportionality
Highly Proficient
Identify the constant of proportionality in proportional relationships where computation is required.
In the proportional relationship shown, what is the unit rate?
7.Mod1.AD4 Represent proportional relationships given in contexts with equations.
RELATED CCSSM
7.RP.A.2.c Represent proportional relationships by equations. For example, if total cost t is proportional to the number n of items purchased at a constant price p, the relationship between the total cost and the number of items can be expressed as t = pn.
Partially Proficient
Identify which equation represents a proportional relationship given in context.
Marcus finds an old, empty piggy bank. He puts $0.75 into the piggy bank each week. Which equation represents the amount of money m in dollars in Marcus’s piggy bank after w weeks?
A. w = 0.75 ⋅ m
B. m = 0.75 ⋅ w
C. w = m + 0.75
D. m = 0.75 + w
Proficient
Represent proportional relationships given in contexts with equations.
A streaming service rents digital movies for $3.99 each. Write an equation to represent the total cost c to rent d movies from the streaming service.
Highly Proficient
7.Mod1.AD5 Interpret the meaning of any point (x, y) on the graph of a proportional relationship in terms of the situation, including the points (0, 0) and (1, r), where r is the unit rate.
RELATED CCSSM
7.RP.A.2.d Explain what a point (x, y) on the graph of a proportional relationship means in terms of the situation, with special attention to the points (0, 0) and (1, r) where r is the unit rate.
Partially Proficient
Proficient
Interpret the meaning of any point (x, y) on the graph of a proportional relationship in terms of the situation, including the points (0, 0) and (1, r), where r is the unit rate.
Consider the graph shown relating time in hours to snowfall in inches.
Highly Proficient
012345678910
What do the points (0, 0), (1, 1.5), and (8, 20) mean in this situation? What is significant about the coordinate points when the x-value is 1?
7.Mod1.AD6 Solve multi-step ratio problems by using proportional relationships (not expressed as percentages).
RELATED CCSSM
7.RP.A.3 Use proportional relationships to solve multistep ratio and percent problems. Examples: simple interest, tax, markups and markdowns, gratuities and commissions, fees, percent increase and decrease, percent error.
Partially Proficient
Solve scaffolded multi-step ratio problems by using proportional relationships (not expressed as percentages).
Cristina feeds her dog 11 3 cups of dog food 3 times each day from a 50-pound bag of dog food.
Part A
How many total cups of dog food does Cristina feed her dog per day?
Part B
Each pound contains about 4 cups of dog food. How many cups of dog food are in the 50-pound bag?
Part C
How many days will the 50-pound bag of dog food last at this feeding rate?
Proficient
Solve multi-step ratio problems by using proportional relationships (not expressed as percentages).
Cristina feeds her dog 11 3 cups of dog food 3 times each day. The 50-pound bag of dog food that she buys contains about 200 cups of dog food. How many days can Cristina feed her dog from that bag, and how many times can she feed it?
Highly Proficient
7.Mod1.AD7 Reproduce a scale drawing at a different scale.
RELATED CCSSM
7.G.A.1 Solve problems involving scale drawings of geometric figures, including computing actual lengths and areas from a scale drawing and reproducing a scale drawing at a different scale.
Partially Proficient
Identify a scale drawing by visual inspection.
Which image appears to be a scale drawing of the image shown?
Proficient
Reproduce a scale drawing at a different scale. The drawing shown is a scale drawing produced by using a scale factor of 3 4 . Create a new scale drawing such that the scale factor from the original figure to the new scale drawing is 11 2 .
Highly Proficient
A.
B. C. D.
7.Mod1.AD8 Solve problems involving scale drawings of geometric figures.
RELATED CCSSM
7.G.A.1 Solve problems involving scale drawings of geometric figures, including computing actual lengths and areas from a scale drawing and reproducing a scale drawing at a different scale. Partially
Compute the scale factor relating a scale drawing to an original drawing or figure.
Figure B is a scale drawing of figure A. What is the scale factor from figure A to figure B?
n 1 3
n 2 3
Solve problems involving unknown length and area measurements in scale drawings of geometric figures by using like or different units.
A scale drawing is produced with a scale factor of 1 3 . A distance in the scale drawing is shown as 4.5 centimeters. What is the corresponding distance in the original drawing?
A rectangle has an area of 72 square inches. A scale drawing of the rectangle is made with a scale factor of 2 3 . What is the area of the scale drawing in square feet?
Figure A
Figure B
Teacher Edition: Grade 7, Module 1, Terminology
Terminology
The following terms and symbols are critical to the work of grade 7 module 1. This resource groups terms into categories called New, Familiar, and Academic Verbs. The lessons in this module incorporate terminology with the expectation that students work toward applying it during discussions and in writing.
Items in the New category are discipline-specific words that are introduced to students in this module. These items include the definition, description, or illustration as it is presented to students. At times, this resource also includes italicized language for teachers that expands on the wording used with students.
Items in the Familiar category are discipline-specific words introduced in prior modules or in previous grade levels.
Items in the Academic Verbs category are high-utility terms that are used across disciplines. These terms come from a list of academic verbs that the curriculum strategically introduces at this grade level.
New constant of proportionality
The constant unit rate in a proportional relationship between two quantities (Lesson 4)
proportional relationship
Measures of two quantities are in a proportional relationship if there is a constant unit rate, known as the constant of proportionality k, between pairs of corresponding values, meaning the relationship is described by an equation of the form y = kx (Lesson 5)
scale
A ratio that compares the distances in a scale drawing to the distances in the original setting (Lesson 19)
scale drawing
A copy of a figure in the plane with all distances proportional to the corresponding distances in the original figure (Lesson 15)
scale factor
The constant of proportionality in a scale drawing (Lesson 15)
unit rate triangle
The triangle with vertices at (0, 0), (1, 0), and (1, r), where r is the unit rate (Lesson 9)
Familiar
Academic Verbs
Module 1 does not introduce any academic verbs from the grade 7 list.
Math Past
False Position: Wrong Guess, but Right Answer
How can making a wrong guess lead to the right answer? Don’t we always want to make correct statements in math? Why would we do something false?
Try giving your students the following problem. It comes from an English translation of an ancient Egyptian papyrus (roll of reed paper) written around the year 1650 BCE, which was more than 3,600 years ago.
A quantity and its quarter added together become 15. What is the quantity?1
Some clarification will help students understand what the question asks. A quantity means the number we are seeking, and its quarter means one-fourth of that number. For clarity, you can rephrase the problem for your students as A number plus one-fourth of that number equals 15. What is the number?
Encourage students to take guesses. For example, suppose that a student guesses the quantity is 6. Then its quarter is 11 2 , and the quantity and its quarter added together are 71 2 . Since the goal is to reach 15, 71 2 is not large enough and the original quantity must be greater than 6.
Another student might guess that the quantity is 9. Then its quarter is 21 4 , and the quantity and its quarter added together are 11 1 4 , which is still not large enough.
Students will likely arrive at the correct answer (the quantity is 12) soon enough. Problem solved. But is there a more efficient way to solve it?
Let us see how Ahmes, the Egyptian scribe who wrote the problem, solved it. Scribes were educated citizens who, unlike most Egyptians of that time, could read, write, and do math. Ahmes took a guess, as we did. But he had a different goal in mind when he made the guess. And he had a clever trick to turn the guess into the right answer immediately. Here is what Ahmes did.
Ahmes guessed 4. 2 He surely knew that 4 was not nearly large enough to be the right answer, but he was not going for size. He made a guess that produced only whole numbers. If the quantity is 4, then its quarter is 1. There are no messy fractions like the ones we got when we guessed 6 or 9.
Ahmes’s guess means that the quantity plus its quarter is 5. That is far short of 15. But Ahmes observed that 5 needs to be tripled to reach 15. So he multiplied the guess by 3 and got 12, which is the right answer.
Students may appreciate seeing how this problem looks with tape diagrams. Here is the original problem.
itsquarte ar quantity
1 Mathematical Association of America, Rhind Mathematical Papyrus,
2 Mathematical Association of America, 68.
68.
Ahmes’s guess of 4 would produce this tape diagram.
Ahmes saw that he needed 3 times as much to make 15.
So Ahmes made the guess 3 times as much, which is 12.
Ahmes’s way of solving this problem is called the method of false position. The false part is the guess, which is almost always wrong. The position is the quantity in the problem—in modern terms, the variable that the guess is substituted in for. Egyptians did not use the term false position—that name (in Latin, regula falsi) was given to the Egyptian method centuries later.
Ahmes was just one of many Egyptian scribes who used false position. Other cultures also used it, notably the Babylonians, who lived about the same time as the ancient Egyptians. A more general version of the Egyptian method, called double false position, was invented in China around 200 BCE. From China, the methods of false position and double false position spread to India and Persia and eventually to Europe.
You may want to point out to students that Ahmes applied a scale factor to the guess. We teach ratios, proportions, and scale factors in Eureka Math2. To the Egyptians, though, using scale factors was second nature, and they saw no need to explain it.
You may want to give your students another false position problem. Remember that the guess should produce whole numbers.
A quantity and its third and its quarter added together become 76. What is the quantity? 76
athird quantity
The smallest guess that produces whole numbers is 12, the least common multiple of 3 and 4.
19
123 4
As the tape diagram shows, 12 plus 4 (its third) plus 3 (its quarter) makes 19. It takes 4 of these groups to make 76. 76
1234312431243 124
Scaling the guess by 4 produces 48, the correct quantity. 76
Guessing any multiple of 12 will produce whole numbers and lead to the right answer. But the scale factor will not always be a whole number. Have your students try a guess of 36 to see what happens. They should discover that the quantity, its third, and its quarter add to 57, and the required scale factor is 1 1 3 .
Your students may wonder whether the method of false position works for any problem. Can we always take a guess and then scale it to the correct answer? Ask them to try out false position on this made-up problem (it does not appear in Ahmes’s papyrus).
A quantity multiplied by itself, added to 4 times the original quantity, becomes 60. What is the quantity?
Suppose students guess the quantity is 2. They get (2 · 2) + 4(2) = 12, which means they should scale by 5. Scaling the guess produces 10. Is that the right quantity? Oops! It doesn’t work, because (10 · 10) + 4(10) = 140, which is too large.
Your students may wonder why false position didn’t work. They may suspect that the culprit is “a quantity multiplied by itself.”
If you wish, you can lead the discussion toward the idea of a linear equation ax = b, which is the type of equation that false position solves.
We initially posed the question, “Why would we do something false?” Scholars in the 1500s were afraid that teaching a method called false position sounded like imparting bad habits to the young. One writer clarified the situation this way (the spelling has been modernized):
The Rule of Falsehood is so named not for that it teaches any deceit or falsehood, but that by feigned numbers taken at all adventures, it teaches to find out the true number that is demanded.3
3
David Eugene Smith, History of Mathematics Volume II, 441.
Teacher Edition: Grade 7, Module 1, Fluency
Fluency
Fluency activities allow students to develop and practice automaticity with fundamental skills so they can devote cognitive power to solving more challenging problems. Skills are incorporated into fluency activities only after they are introduced conceptually within the module.
Each lesson in A Story of Ratios begins with a Fluency segment designed to activate students’ readiness for the day’s lesson. This daily segment provides sequenced practice problems on which students can work independently, usually in the first few minutes of a class. Students can use their personal whiteboards to complete the activity, or you may distribute a printed version, available digitally. Each fluency routine is designed to take 3–5 minutes and is not part of the 45-minute lesson structure. Administer the activity as a bell ringer or adapt the activity as a teacher-led Whiteboard Exchange or choral response.
Bell Ringer
This routine provides students with independent work time to determine the answers to a set of problems.
1. Display all the problems at once.
2. Encourage students to work independently and at their own pace.
3. Read or reveal the answers.
Whiteboard Exchange
This routine builds fluency through repeated practice and immediate feedback. A Whiteboard Exchange maximizes participation by having every student record solutions or strategies for a sequence of problems. These written recordings allow for differentiation: Based on the answers you observe, you can make responsive, in-the-moment adjustments to the sequence of problems. Each student requires a personal whiteboard and a whiteboard marker with an eraser for this routine.
1. Display one problem in the sequence.
2. Give students time to work. Wait until nearly all students are ready.
3. Signal for students to show their whiteboards. Provide immediate and specific feedback to students one at a time. If revisions are needed, briefly return to validate the work after students make corrections.
4. Advance to the next problem in the sequence and repeat the process.
Choral Response
This routine actively engages students in building familiarity with previously learned skills, strengthening the foundational knowledge essential for extending and applying math concepts. The choral response invites all students to participate while lowering the risk for students who may respond incorrectly.
1. Establish a signal for students to respond to in unison.
2. Display a problem. Ask students to raise their hands when they know the answer.
3. When nearly all hands are raised, signal for the students’ response.
4. Reveal the answer and advance to the next problem.
Count By
This routine actively engages students in committing counting sequences to memory, strengthening the foundational knowledge essential for extending and applying math concepts.
1. Establish one signal for counting up and counting down and another signal for stopping the count.
2. Tell students the unit to count by. Establish the starting and ending numbers between which they should count.
3. Begin the count by providing the signals. Be careful not to mouth the words as students count.
Sprints
Sprints are activities that develop mathematical fluency with a variety of facts and skills. A major goal of each Sprint is for students to witness their own improvement within a very short time frame. The Sprint routine is a fun, fast-paced, adrenaline-rich experience that intentionally builds energy and excitement. This rousing routine fuels students’ motivation to achieve their personal best and provides time to celebrate their successes.
Each Sprint includes two parts, A and B, that feature closely related problems. Students complete Sprint A, followed by two count by routines—one fast-paced and one slow-paced—that include a stretch or other physical movement. Then students complete Sprint B, aiming to improve their score from Sprint A. Each part is scored but not graded.
Sprints can be given at any time after the content of the Sprint has been conceptually developed and practiced. The same Sprint may be administered more than once throughout a year or across grade levels. With practice, the Sprint routine takes about 10 minutes.
Directions
1. Have students read the instructions and sample problems. Frame the task by encouraging students to complete as many problems as they can—to do their personal best.
2. Time students for 1 minute on Sprint A. Do not expect them to finish. When time is up, have students underline the last problem they completed.
3. Read the answers to Sprint A quickly and energetically. Have students call out “Yes!” if they answered correctly; have them circle the answer if they answered incorrectly.
4. Have students count their correct answers and record that number at the top of the page. This is their personal goal for Sprint B.
5. Celebrate students’ effort and success on Sprint A.
6. To increase success with Sprint B, offer students additional time to complete more problems on Sprint A or ask discussion questions to analyze and discuss the patterns in Sprint A.
7. Lead students in the fast-paced and slow-paced count by routines. Include a stretch or other physical movement during the count.
8. Remind students of their personal goal from Sprint A.
9. Direct students to Sprint B.
10. Time students for 1 minute on Sprint B. When time is up, have students underline the last problem they completed.
11. Read the answers to Sprint B quickly and energetically. Have students call out “Yes!” if they answered correctly; have them circle the answer if they answered incorrectly.
12. Have students count their correct answers and record that number at the top of the page.
13. Have students calculate their improvement score by finding the difference between the number of correct answers in Sprint A and in Sprint B. Tell them to record the number at the top of the page.
14. Celebrate students’ improvement from Sprint A to Sprint B.
Sample Dialogue
Have students read the instructions and complete the sample problems. Frame the task:
• You may not finish, and that’s okay. Complete as many problems as you can—do your personal best.
• On your mark, get set, think!
Time students for 1 minute on Sprint A.
• Stop! Underline the last problem you did.
• I’m going to read the answers quickly. As I read the answers, call out “Yes!” if you got it right. If you made a mistake, circle the answer.
Read the answers to Sprint A quickly and energetically.
• Count the number of answers you got correct and record that number at the top of the page. This is your personal goal for Sprint B.
Celebrate students’ effort and success.
Provide 2 minutes to allow students to complete more problems or to analyze and discuss patterns in Sprint A using discussion questions.
Lead students in the fast-paced and slow-paced count by routines. Include a stretch or other physical movement during the count.
• Point to the number of answers you got correct on Sprint A. Remember, this is your personal goal for Sprint B.
Direct students to Sprint B.
• On your mark, get set, improve!
Time students for 1 minute on Sprint B.
• Stop! Underline the last problem you did.
• I’m going to read the answers quickly. As I read the answers, call out “Yes!” if you got it right. If you made a mistake, circle the answer.
Read the answers to Sprint B quickly and energetically.
• Count the number of answers you got correct and record that number at the top of the page.
• Calculate your improvement score and record it at the top of the page.
Celebrate students’ improvement.
The table below provides implementation guidance for the Sprints recommended in this module.
Sprint Name Administration Guidelines
Equivalent Fractions
Students identify equivalent fractions to prepare for recognizing equivalent ratios in module 1.
Administer before module 1 lesson 5.
Dividing Fractions
Students divide fractions to prepare for solving multi-step ratio problems.
Administer before module 1 lesson 11 or in place of the module 1 lesson 3 Fluency.
Equivalent Ratios
Students write equivalent ratios to prepare for creating double number lines in module 1.
Administer before module 1 lesson 10.
Discussion Questions
How is the strategy you used for problems 1–4 the same as or different from the strategy you used for problems 5–7?
How are problems 11 and 17 related?
How are problems 1 and 9 related?
What do you notice about the answers for problems 14 and 15?
How do problems 1–10 compare to problems 11–18?
How is the strategy you used for problems 1–4 the same as or different from the strategy you used for problems 5–8?
How are problems 14 and 15 related?
Which problem, 31 or 32, did you think was easier? Why?
Count By Routines
Fast-paced: Count by tens from 0 to 120.
Slow-paced: Count by sixes from 0 to 72.
Fast-paced: Count by fifths from 0 fifths to 20 fifths.
Slow-paced: Count by fifths from 16 fifths to 0 fifths.
Fast-paced: Count by thirds from 0 thirds to 12 thirds.
Slow-paced: Count by thirds from 0 thirds to 12 thirds using mixed numbers.
Greatest Common Factor
One-Step Equations— Multiplication
Students identify the greatest common factor to prepare for writing equivalent ratios in module 1.
Administer before module 1 lesson 5.
Students solve one-step multiplication equations to prepare for solving real-world ratio problems.
Administer before module 1 lesson 9 or in place of the module 1 lesson 9 Fluency.
Which problem, 3 or 11, did you think was easier? Why?
How are problems 14–16 related?
How do problems 1–5 compare to problems 6–9?
How can you use problem 19 to answer problem 20?
Which problem, 22 or 23, did you think was easier? Why?
Fast-paced: Count by fourths from 0 fourths to 12 fourths.
Slow-paced: Count by fourths from 12 fourths to 0 fourths.
Expect to see varied solution paths. Accept accurate responses, reasonable explanations, and equivalent answers for all student work.
4. Liam makes green paint by mixing 3 gallons of yellow paint with 2 gallons of blue paint. He likes the shade of green paint he makes and wants to make more in the same ratio. Complete the table to show the relationship between the number of gallons of yellow paint and the number of gallons of blue paint.
For problems 1–3, determine the unit rate for the situation.
1.
5. Ethan drives 150 miles in 3 hours. If he continues to drive at a constant rate, how many hours will it take Ethan to drive 600 miles? It will take Ethan 12 hours to drive 600 miles.
6. Mrs. Kondo makes bags of school supplies for her students. Mrs. Kondo has 36 pencils and 48 erasers, and she wants to place all of them in the bags.
a. What is the greatest number of bags Mrs. Kondo can make with each bag containing the same number of pencils and the same number of erasers?
Mrs. Kondo can make 12 bags.
b. How many pencils and erasers will be in each bag? There will be 3 pencils and 4 erasers in each bag.
7. Consider the given equation.
a. Fill in the boxes to make a true number sentence.
b. Find the sum of 4 5 and 3 10 Choose all that apply.
For problems 10–12, write the given division expression as an equivalent expression with a whole-number divisor.
13. Order the values from least to greatest.
9. Use the standard algorithm to find the
The measurements of a rectangular floor are shown in the figure.
a. Find the area of the floor. The area of the floor is 126 m2 b. Find the perimeter of the floor. The perimeter of the floor is
6. Two vertices of a rectangle are located at (−2, −9) and (3, −9). The area of the rectangle is 100 square units. Name one set of possible coordinates for the other two vertices. Use the coordinate plane as needed.
One set of possible coordinates for the other two vertices is (−2, 11) and (3, 11) Another set of possible coordinates is (−2, −29) and (3, −29)
7. Use the figure shown to complete parts (a)–(f).
a. Name a line.
Sample: ⟷ CE
c. Name a line segment.
Sample: YN
e. Name an obtuse angle.
Sample: ∠ ENY
b. Name a ray.
Sample: ⟶ YC
d. Name an acute angle.
Sample: ∠ CEN
f. Name a pair of parallel line segments.
Sample: CY and EN
For problems 8–10, determine whether the data distribution is approximately symmetric or skewed. Describe the shape of the data distribution. 8. Skewed to the right
CAST. Universal Design for Learning Guidelines version 2.2. Retrieved from http://udlguidelines.cast.org, 2018.
Mathematical Association of America, et al. 1927. The Rhind Mathematical Papyrus, British Museum 10057 and 10058: photographic facsimile, hieroglyphic transcription, transliteration, literal translation, free translation, mathematical commentary, and bibliography. Oberlin, OH: Mathematical Association of America.
National Governors Association Center for Best Practices, Council of Chief State School Officers (NGA Center, CCSSO). 2010. Common Core State Standards for Mathematics. Washington, DC: NGA Center, CCSSO.
Smith, David Eugene. 1958. History of Mathematics Volume II. New York: Dover Publications.
Zwiers, Jeff, Jack Dieckmann, Sara Rutherford-Quach, Vinci Daro, Renae Skarin, Steven Weiss, and James Malamut. Principles for the Design of Mathematics Curricula: Promoting Language and Content Development. Retrieved from Stanford University, UL/SCALE website: https://ul.stanford.edu/resource/principles-design -mathematics-curricula-and-mlrs, 2017.
Teacher Edition: Grade 7, Module 1, Credits
Credits
Great Minds® has made every effort to obtain permission for the reprinting of all copyrighted material. If any owner of copyrighted material is not acknowledged herein, please contact Great Minds for proper acknowledgment in all future editions and reprints of this module.
For a complete list of credits, visit http://eurmath.link /media-credits.
Cover, Game of Hounds and Jackals. Egyptian; Thebes, Lower Asasif, Birabi. Middle Kingdom, reign of Amenemhat IV, ca. 1814–1805 BCE. Ebony, ivory. Board: h. 6.3 cm (2 1/2 in); w. 15.2 cm (6 in). Purchase, Edward S. Harkness Gift, 1926 (26.7.1287a-k). The Metropolitan Museum of Art, New York,
Tiah Alphonso, Christopher Barbee, Erik Brandon, Joseph Phillip Brennan, Beth Brown, Leah Childers, Mary Christensen-Cooper, Cheri DeBusk, Jill Diniz, Dane Ehlert, Scott Farrar, Kelli Ferko, Levi Fletcher, Anita Geevarghese, David Gertler, Krysta Gibbs, Winnie Gilbert, Julie Grove, Marvin E. Harrell, Robert Hollister, Rachel Hylton, Travis Jones, David Kantor Choukalas, Emily Koesters, Liz Krisher, Connie Laughlin, Alonso Llerena, Sarah Maile, Gabrielle Mathiesen, Maureen McNamara Jones, Melissa Mink, Richard Monke, Dave Morris, Bruce Myers, Marya Myers, Kati O’Neill, Ben Orlin, Darion Pack, Brian Petras, April Picard, Lora Podgorny, Ben Polovick, Amy Rome, Bonnie Sanders, Aly Schooley, Andrew Senkowski, Erika Silva, Jessica Sims, Ashley Spencer, Danielle Stantoznik, Tara Stewart, Heidi Strate, James Tanton, Cody Waters, Valerie Weage
Trevor Barnes, Brianna Bemel, Adam Cardais, Christina Cooper, Natasha Curtis, Jessica Dahl, Brandon Dawley, Delsena Draper, Sandy Engelman, Tamara Estrada, Soudea Forbes, Jen Forbus, Reba Frederics, Liz Gabbard, Diana Ghazzawi, Lisa Giddens-White, Laurie Gonsoulin, Nathan Hall, Cassie Hart, Marcela Hernandez, Rachel Hirsh, Abbi Hoerst, Libby Howard, Amy Kanjuka, Ashley Kelley, Lisa King, Sarah Kopec, Drew Krepp, Crystal Love, Maya Márquez, Siena Mazero, Cindy Medici, Patricia Mickelberry, Ivonne Mercado, Sandra Mercado, Brian Methe, Mary-Lise Nazaire, Corinne Newbegin, Max Oosterbaan, Tamara Otto, Christine Palmtag, Andy Peterson, Lizette Porras, Karen Rollhauser, Neela Roy, Gina Schenck, Amy Schoon, Aaron Shields, Leigh Sterten, Mary Sudul, Lisa Sweeney, Samuel Weyand, Dave White, Charmaine Whitman, Nicole Williams, Glenda Wisenburn-Burke, Howard Yaffe
Exponentially Better
Knowledge2 In our tradition of supporting teachers with everything they need to build student knowledge of mathematics deeply and coherently, Eureka Math2 provides tailored collections of videos and recommendations to serve new and experienced teachers alike.
Digital2 With a seamlessly integrated digital experience, Eureka Math2 includes hundreds of clever illustrations, compelling videos, and digital interactives to spark discourse and wonder in your classroom.
Accessible2 Created with all readers in mind, Eureka Math2 has been carefully designed to ensure struggling readers can access lessons, word problems, and more.
Joy2 Together with your students, you will fall in love with math all over again—or for the first time—with Eureka Math2.
What does this object have to do with math?
The ancient Egyptian game Hounds and Jackals, similar to the modern CHUTES AND LADDERS, is a game of chance in which the players race across the board by rolling “knucklebones” (like dice). When chance is described in mathematics, it is called probability, and it is measured with ratios to show how likely or unlikely an outcome might be. What is the probability of the hounds conquering the jackals?
On the cover
Game of Hounds and Jackals, ca. 1814–1805 BCE Egyptian Ebony, ivory