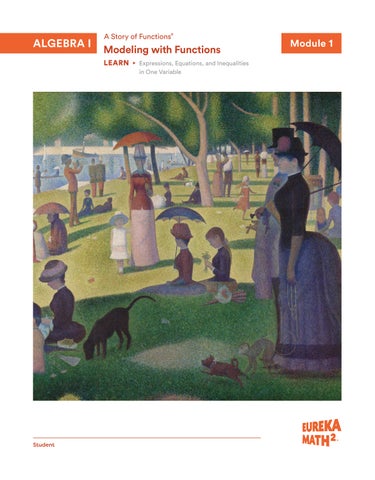
LEARN ▸ Expressions, Equations, and Inequalities in One Variable
What does this painting have to do with math?
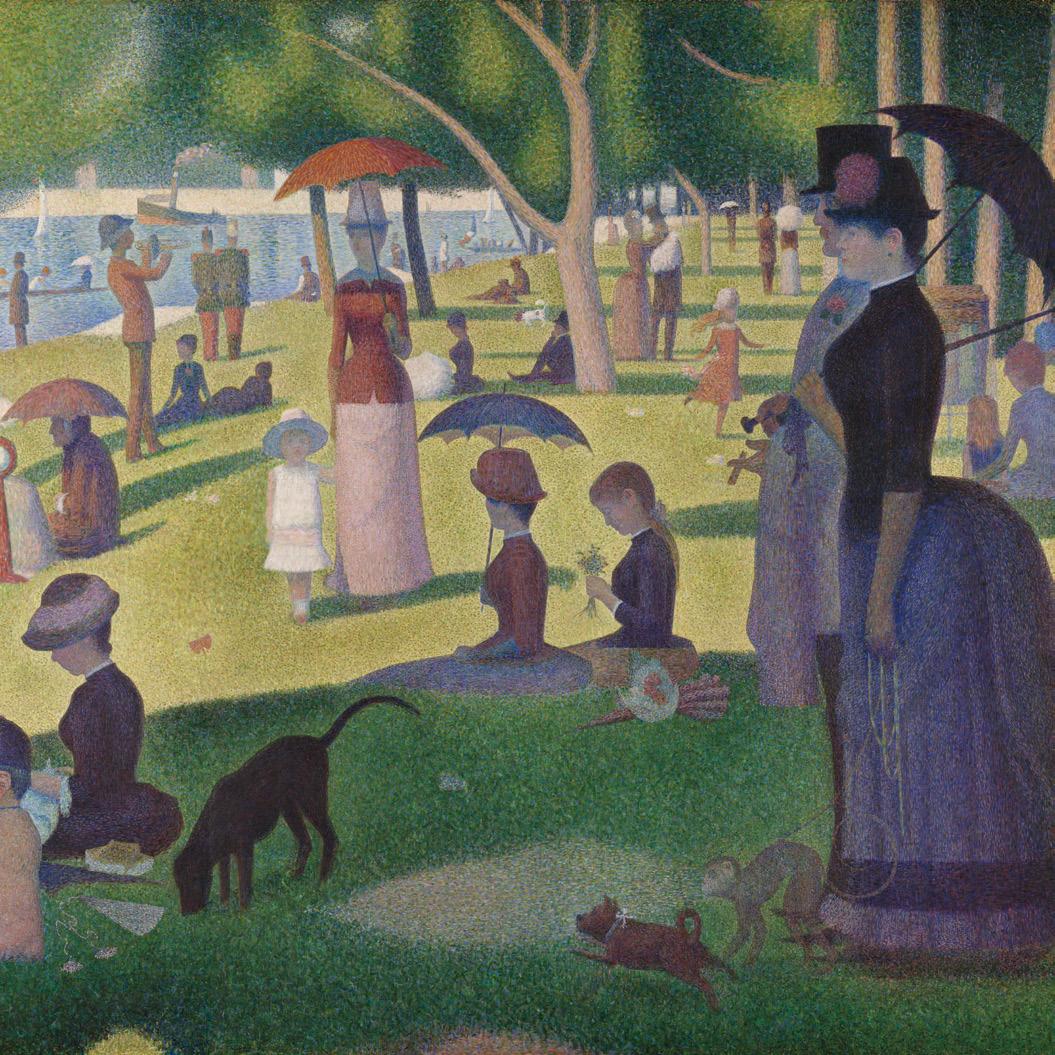
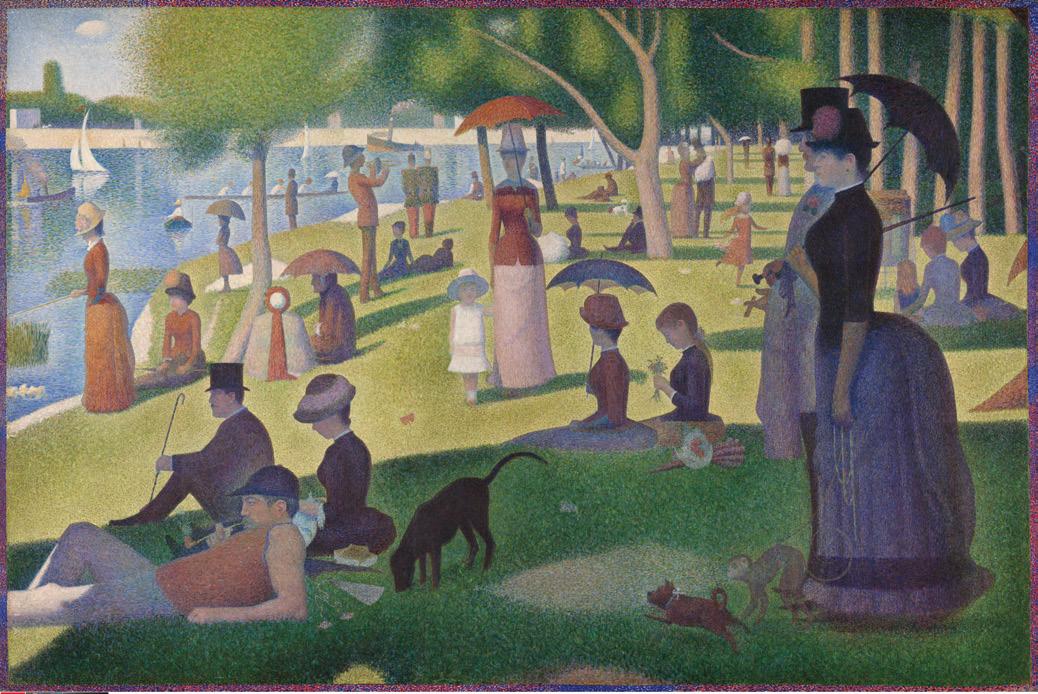
A Sunday on La Grande Jatte is considered Georges Seurat’s greatest work. Even though this painting is made entirely out of small dabs of paint, our eyes mix the colors together through optical blending. To achieve this effect, Georges Seurat had to be very precise with his colors and dot placement. This methodical technique is similar to a practice you will need as you graph equations and inequalities in two variables.
On the cover
A Sunday on La Grande Jatte—1884, 1884–1886
Georges Seurat, French, 1859–1891 Oil on canvas
Art Institute of Chicago, Chicago, IL, USA
Georges Seurat (1859–1891), A Sunday on La Grande Jatte—1884, 1884/86. Oil on canvas, 81 3/4 x 121 1/4 in (207.5 x 308.1 cm). Helen Birch Bartlett Memorial Collection, 1926.224. The Art Institute of Chicago, Chicago, USA. Photo Credit: The Art Institute of Chicago/Art Resource, NY
Great Minds® is the creator of Eureka Math® , Wit & Wisdom® , Alexandria Plan™, and PhD Science®
Module 1 Expressions, Equations, and Inequalities in One Variable
2 Equations and Inequalities in Two Variables
3 Functions and Their Representations
4 Quadratic Functions
5 Linear and Exponential Functions
6 Modeling with Functions
Student Edition: Grade A1, Module 1, Contents
Expressions, Equations, and Inequalities in One Variable
Topic A 5
Adding, Subtracting, and Multiplying Polynomial Expressions
Lesson 1 .
The Growing Pattern of Ducks
Lesson 2
The Commutative, Associative, and Distributive Properties
Lesson 3
Polynomial Expressions
Lesson 4
Adding and Subtracting Polynomial Expressions
Lesson 5
Multiplying Polynomial Expressions
Lesson 6
Polynomial Identities
7
21
Lesson 12
Rearranging Formulas
Lesson 13
Solving Linear Inequalities in One Variable
Topic C
43
55
71
85
Topic B 101
Solving Equations and Inequalities in One Variable
Lesson 7
Printing Presses
Lesson 8
Solution Sets for Equations and Inequalities in One Variable
Lesson 9
Solving Linear Equations in One Variable
Lesson 10
Some Potential Dangers When Solving Equations (Optional)
Lesson 11
Writing and Solving Equations in One Variable
103
113
133
149
173
189
161
Compound Statements Involving Equations and Inequalities in One Variable
Lesson 14
Solution Sets of Compound Statements
Lesson 15
Solving and Graphing Compound Inequalities
Lesson 16
Solving Absolute Value Equations
Lesson 17
Solving Absolute Value Inequalities
Topic D
Univariate
Lesson 18
Distributions and Their Shapes
Lesson 19
Describing the Center of a Distribution
Lesson 20
Using Center to Compare Data Distributions
Lesson 21
Describing Variability in a Univariate Distribution with Standard Deviation
Lesson 22
Estimating Variability in Data Distributions
Lesson 23
Comparing Distributions of Univariate Data
Resources
Mixed Practice 1
Mixed Practice 2
Fluency Removables
Lesson 15 Number Lines
Lesson 17 Number Lines
Sprint: Add and Subtract Fractions
Sprint: Apply the Distributive Property
Sprint: Multiply and Divide Fractions
Sprint: Operations with Integers
Sprint: Solve One- and Two-Step Equations
Sprint: Solve One- and Two-Step Inequalities
Sprint: Solve Two-Step Equations
Sprint: Write Equivalent Expressions
Adding, Subtracting, and Multiplying Polynomial Expressions
Student Edition: Grade A1, Module 1, Topic A
Numbers in Base x
Here’s a question for you: What does this image …
… have in common with this one?
Poorly drawn shapes?
Yes, yes, and yes. Never mind that one image represents a number and the other represents a polynomial, one is used for arithmetic and one is used with algebra, and one is teeming with 10s and the other is swimming in xs. The truth is, these two images have practically everything in common.
A number is a sum of standard parts: tens, hundreds, thousands, and so on. The number’s name is a kind of brief inventory list: “In here, we’ve got 1 thousand, 3 hundreds, 4 tens, and 7 ones.”
All the same things are true of a polynomial, except the standard parts include x, x2 , x3, and so on. The inventory reads: “In here, we’ve got 1 cube, 3 squares, 4 rods, and 7 ones.”
What is a polynomial? It’s a number in base x.
Student Edition: Grade A1, Module 1, Topic A, Lesson 1
Name
The Growing Pattern of Ducks
1. Examine the pattern of ducks.
Date
a. Describe the arrangement of ducks in figure 1.
b. Describe the arrangement of ducks in figure 2.
c. How is the arrangement of ducks in figure 2 similar to the arrangement of ducks in figure 1? How is it different?
Figure 1
Figure 2
Figure 3
d. Describe the arrangement of ducks in figure 3.
e. How is the arrangement of ducks in figure 3 similar to the arrangement of ducks in figure 2? How is it different?
How Do They Grow?
2. If the pattern continues, how many ducks will be in figure 4? Describe the arrangement of ducks.
3. Work with your group to find out how many ducks will be in figure 5, figure 10, and figure 100.
4. Describe how to find the number of ducks given any figure number. You may use words, symbols, pictures, expressions, and/or equations.
5. On your paper, record two different expressions from other groups. What is similar about the expressions? What is different?
Figure 1
Figure 2
Figure 3
Student Edition: Grade A1, Module 1, Topic A, Lesson 1
Name Date
Examine the pattern of socks.
1. If the pattern continues, how many socks will be in figure 4? In figure 10? In figure 100?
2. Describe how to find the number of socks given any figure number.
Figure 1
Figure 2
Figure 3
Student Edition: Grade A1, Module 1, Topic A, Lesson 1
Name Date RECAP
The Growing Pattern of Ducks
In this lesson, we
• examined visual patterns.
• wrote numerical expressions to represent visual patterns.
• described visual patterns by using words and algebraic expressions.
Example
Examine the pattern of zebras.
a. How many zebras are in figure 4?
There are 14 zebras in figure 4.
Each figure has 3 more zebras than the previous figure. Figure 3 has 11 zebras.
Figure 3
Figure 1
Figure 2
b. Describe how to find the number of zebras in any given figure number. In each figure, there are 3 equal groups of zebras, with 2 left over. The number of zebras in each of the groups is the figure number. If n represents the figure number, this can be represented as 3n + 2.
c. How many zebras are in figure 10? In figure 100?
Figure 10: 32 zebras because 3(10) + 2 = 32
Figure 100: 302 zebras because 3(100) + 2 = 302
Figure 3
Figure 1
Figure 2
Student Edition: Grade A1, Module 1, Topic A, Lesson 1
Name Date
1. Examine the pattern of bees.
a. How many bees will be in figure 4? Figure 10? Figure 100?
b. Describe how to find the number of bees given any figure number.
Figure 1
Figure 2
Figure 3
2. Examine the pattern of mice.
a. How many mice will be in figure 4? Figure 10? Figure 100?
b. Describe how to find the number of mice given any figure number.
Figure 1
Figure 2
Figure 3
3. Bahar and Nina examine the pattern of tacos.
Bahar and Nina divide the figures into parts. They each write expressions to represent the number of tacos in each figure. Their work is shown.
Work:
Bahar’s
Figure 1
Figure 2
Figure 3
Figure 4
Figure
Figure
Figure 4
Nina’s Work:
For each figure, do their expressions represent the same value? Explain how you know.
Figure 1
2(12)+2
Figure 2
2(22)+2
Figure 3
2(32)+2
Figure 4
2(42)+2
4. Examine the pattern of snails. Show two ways to represent the number of snails given any figure number.
Figure 1
Figure 2
Figure 3
Figure 1
Figure 2
Figure 3
Remember
For problems 5 and 6, evaluate.
5. −12.14 − 2.32 6. 9.9 + 11.25 + (−4)
7. Which equations are true? Choose all that apply.
A. 72 + 45 = 9(8 + 5)
C. 24 + 6 = 6(4 + 1)
E. 48 + 28 = 4(12 + 7)
8. Ana made a mistake solving w − 16 = −25.
B. 80 + 60 = 8(10 + 60)
D. 39 + 27 = 3(19 + 9)
a. Identify Ana’s mistake, and explain what she should have done to solve the problem correctly.
b. Solve for w
Student Edition: Grade A1, Module 1, Topic A, Lesson 2
Name Date
The Commutative, Associative, and Distributive Properties
Matching Expressions Task
Match each expression in table 1 to an expression in table 2. Explain why you matched each pair of expressions.
Table 1
1. 9 + p + 2
2. 9( p + 2)
3. 9 ⋅ 2 ⋅ p
4. (9 ⋅ p) ⋅ 6
5. 9 + (p + 6)
6. 9p + 54
Table 2
A. (9 + p) + 6
B. 9p + 18
C. 9 ⋅ ( p ⋅ 6)
D. 9( p + 6)
E. 2 ⋅ 9 ⋅ p
F. p + 9 + 2
Properties of Arithmetic Tree Map
Complete the statements in the tree map, and provide examples of each property.
If a and b are real numbers, then Multiplication
If a and b are real numbers, then Addition
Properties of Arithmetic
If a , b , and c are real numbers, then Multiplication
If a , b , and c are real numbers, then Addition
If a , b , and c are real numbers, then Distributive Example
Defining Equivalent Expressions
An algebraic expression is a number, a variable, or the result of placing previously generated algebraic expressions into the blanks of one of the four operators, ( ) + ( ), ( ) ( ), ( ) ⋅ ( ), ( ) ÷ ( ), or into the base blank of an exponentiation with an exponent that is a rational number, ( )( ) .
7. List some examples of algebraic expressions.
Two expressions are equivalent expressions if both expressions evaluate to the same number for every possible value of the variables.
If we can convert one expression into the other by some number of applications of the commutative, associative, and distributive properties and the properties of exponents, then the two expressions are equivalent.
8. List two equivalent expressions. Explain why they are equivalent.
9. List a nonexample of two equivalent expressions. Explain why they are not equivalent.
Demonstrating Equivalence
10. Show −8(−5b + 7) + 5b is equivalent to 45b − 56 by using a flowchart and a two-column table.
11. Show that 3( y + 2) + 9x is equivalent to 3(3x + y) + 6 by completing the flowchart. Write the property or operation used in each step on the line next to the arrow.
3(y +2)+9x
3y +6+9x 9x +3y +6
(9x +3y)+6
3(3x + y)+6
12. Show that (5y)(4 + y) − 12 is equivalent to 5y2 + 20y − 12 by completing the two-column table. Write the property or operation used in each step.
Expression
(5y)(4 + y) − 12
y ⋅ 4
− 12
Property or Operation Used
13. Show that 2(5a − 7 − 8 + 10a) is equivalent to 30(a − 1) by writing the property or operation used in each step on the line next to each arrow.
2(5a –7–8+10a)
2(5a +10a –7–8)
2(15a –7–8) 10a –14–16+20a 10a +20a –14–16
2(15a –15)30a –14–16
2·15(a –1)30a –30
30(a –1)
14. Show that 6d − d(d + 10) + 8(d + 10) is equivalent to d2 + 4d + 80. Organize your work in a flowchart or a two-column table.
Student Edition: Grade A1, Module
1, Topic A, Lesson 2
Name Date
Show that 6 + 5w + 3w(w + 2) and 3w2 + 11w + 6 are equivalent expressions by stating the operation or property used in each step.
Expression
6 + 5w + 3w(w + 2)
6 + 5w + 3w2 + 6w
6 + 5w + 6w + 3w2 6 + 11w + 3w2 3w2 + 11w + 6
Property or Operation Used
Student Edition: Grade A1, Module 1, Topic A, Lesson 1
Name Date
The Commutative, Associative, and Distributive Properties
In this lesson, we
• used the commutative, associative, and distributive properties to rewrite algebraic expressions.
• applied properties and operations to show that two algebraic expressions are equivalent.
The Properties of Arithmetic
The Distributive Property
If a, b, and c are real numbers, then
a(b + c) = ab + ac.
33234 (24)+= ⋅+ ⋅
6630 (5) tt += +
The Associative Property of Addition
If a, b, and c are real numbers, then (a + b) + c = a + (b + c).
(32)(24) ++ =+ + 43
(6)(5) ++ =+ + t 56 t
The Commutative Property of Addition
If a and b are real numbers, then a + b = b + a.
3223 += + 66 += + tt
Terminology
An algebraic expression is a number, a variable, or the result of placing previously generated algebraic expressions into the blanks of one of the four operators, ( ) + ( ), ( ) − ( ), ( ) ( ), ( ) ÷ ( ), or into the base blank of an exponentiation with an exponent that is a rational number, ( )( ) .
Two expressions are equivalent expressions if both expressions evaluate to the same number for every possible value of the variables. If we can convert one expression into the other by some number of applications of the commutative, associative, and distributive properties and the properties of exponents, then the two expressions are equivalent.
The Associative Property of Multiplication
If a, b, and c are real numbers, then (a b) c = a (b c). (32)(24) =⋅43
(6)(5) ⋅ ⋅=⋅⋅tt 56
The Commutative Property of Multiplication
If a and b are real numbers, then a ⋅ b = b ⋅ a.
3223 ⋅=
66 ⋅= ⋅ tt
Examples
1. Show that 6x + 10x(2x − 3) is equivalent to 20x2 − 24x by writing the property or operation that best describes each step next to each arrow.
Arrows are double-ended to show that the expressions on each end are equivalent to one another.
6x +10x(2x –3) 6x –30x +20x2
distributiveproperty
6x +20x2–30x
commutativepropertyofaddition
additionofliketerms
–24x +20x2
commutativepropertyofaddition
20x2–24x
2. Show that 2a(5a + 4) − 3(4a − 1) is equivalent to 10a2 − 4a + 3 by writing the property or operation used in each step.
Expression
2a(5a + 4) − 3(4a − 1)
2
2 ⋅ 5 ⋅ a2 + 2 ⋅ 4 ⋅ a − 3 ⋅ 4 ⋅ a − 3 ⋅ (−1)
Leave this box blank because the expression in this row is the original expression.
Property or Operation Used
Distributive property
Commutative property of multiplication
Property of exponents (ba ⋅ bc = ba + c) 10a2 + 8a − 12a + 3
Multiplication 10a2 − 4a + 3
Addition of like terms
Student Edition: Grade A1, Module 1, Topic A, Lesson 2
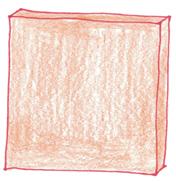
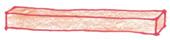
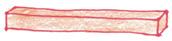
For problems 1–4, write two equivalent expressions for each situation.
1. Total length of both segments
2. Area of the rectangle
3. Volume of the rectangular prism
4. Number of squares in the figure
For problems 5–10, identify the property that justifies why each pair of expressions is equivalent.
5. 3 + 5 + 2 and 3 + 2 + 5
5 ⋅ (4 ⋅ 6) and (5 ⋅ 4) ⋅ 6
7. 9(2 + 5) and 18 + 45
2x + 3x2 − 5 and 3x2 + 2x − 5
9. (y + 5)(y − 3) and (y + 5)y + (y + 5)(−3)
+ 2m − 6m − 12 and m2 + (2m − 6m) − 12
11. Show that 2x(3x + 2) − 4(3x + 2) is equivalent to 6x2 − 8x − 8 by writing the property or operation used in each step.
Expression
Property or Operation Used 2x(3x + 2) − 4(3x + 2)
6x2 + 4x − 12x − 8 6x2 − 8x − 8
12. Show that −8 + x(x + 3) + 4(y + 3) is equivalent to x2 + 3x + 4(y + 1) by writing the property or operation used in each step.
13. Show that −4a + 3a(a + 2) is equivalent to 3a2 + 2a by writing the property or operation used in each step on the line next to each arrow.
14. Show that 2g + 8(g − 4) − 7g is equivalent to 3g − 32 by completing the flowchart. Write the property or operation used in each step on the line next to each arrow. 2g +8(g –4)–7g 2g +8g –32–7g
g –7g +8(g –4)
g +8g –7g –32
g –7g +8g –32
g –32
15. Show that 5p2 − 3 + 2(p2 − p3) is equivalent to −2p3 + 7p2 − 3 by using a flowchart or two-column table. State the property or operation used in each step.
16. Show that 2(2 + n3) + n(5n2 + 2) is equivalent to 7n3 + 2n + 4. State the property or operation used in each step.
Remember
For problems 17 and 18, evaluate.
17. 16.5 ⋅ 4.4 18. 45 ÷ (−2.5)
19. Evaluate 4x3 + 6x − 16 for x = 2.
20. Find the solution to g 7 = 8 by each method listed.
a. Use tape diagrams.
b. Solve algebraically.
Student Edition: Grade A1, Module 1, Topic A, Lesson 3
For problems 4–6, evaluate the expression for x = 10 4. 6x2 + 7x + 2 5. 8x3 + 9x2 + 4x + 3
x4 + 5x2 + 4x + 8
Polynomial Expressions
Complete the map by writing examples and nonexamples, when appropriate, of each definition. Use the examples and nonexamples from the card sort activity.
Monomial Expression
Degree of a Polynomial Expression
The degree of the term with the greatest degree
Term
A polynomial expression that is generated by using only multiplication. It does not contain + or – symbols. A single nonzero monomial expression in a polynomial expression
The degree of a monomial expression in one variable is the exponent of its variable.
Polynomial Expression
A numerical expression or variable OR the result of adding or multiplying two previously generated polynomial expressions
Standard Form
A polynomial expression is in standard form if it is a sum of a finite number of terms of the form axn, where each n is a distinct nonnegative integer, each a is nonzero, and the terms are in descending order by degree.
Trinomial Expression
A polynomial expression with three terms where each term has a distinct degree
Binomial Expression
A polynomial expression with two terms where each term has a distinct degree
Student Edition: Grade A1, Module 1, Topic A, Lesson 3
a. Write the expression in standard form, and state the degree of the polynomial expression.
b. Evaluate the expression for x = 10
Student Edition: Grade A1, Module 1, Topic A, Lesson 3
Name Date
Polynomial Expressions
In this lesson, we
• compared numbers in base 10 with numbers in base x.
• identified polynomial expressions.
• stated the degree of polynomial expressions.
• evaluated polynomial expressions.
• wrote polynomial expressions in standard form.
Examples
For problems 1 and 2, state whether the expression is a polynomial expression. If it is a polynomial expression, state its degree. If it is not, explain how you know.
1. +− + 4622 48 www
Yes; degree 8
2. 15215 x x
The term with the greatest degree is w8
This is not a polynomial expression. We cannot add or multiply any numbers or variables to get the term 15 x .
Terminology
A polynomial expression is a numerical expression or a variable, or the result of adding or multiplying two previously generated polynomial expressions.
A monomial expression is a polynomial expression that is generated by using only multiplication. It does not contain + or symbols.
The degree of a monomial expression in one variable is the exponent of its variable.
A term is a single nonzero monomial expression in a polynomial expression.
The degree of a polynomial expression is the degree of the monomial term with the greatest degree.
A binomial expression is a polynomial expression with two terms where each term has a distinct degree.
A trinomial expression is a polynomial expression with three terms where each term has a distinct degree.
A polynomial expression is in standard form if it is a sum of a finite number of terms of the form axn, where each n is a distinct nonnegative integer, each a is nonzero, and the terms are in descending order by degree.
3. Consider the polynomial expression.
m2 − 10 + 7m5 + 6m2 + 5 − 2m5 + 9 + 8m3 + 2m
a. Write the polynomial expression in standard form.
b. State the degree of the polynomial expression.
Writing a polynomial expression in base m in standard form is similar to writing a number in base 10 in expanded form.
For problems 3 and 4, evaluate the polynomial expression for x = 10.
3. 2x3 + 4x2 + 3x + 5
4. 2x3 + 9x2 + 6x
For problems 5–9, write the polynomial expression in standard form.
5. 6x3 + 4x − 2x3 − 5
6. 2x2 − 8x + 6x + x2 + 1
7. 5 + 2x + 3x3 − 7 + 8x2 − x + 10 − 4x2
8. 3(x3 + 2x + 2) + 8x4 − 6
9. 0.2c(c3 − 3c) + 4 − 1.3 + 2c4 + 0.4c4 − 1.2c2
For problems 10–15, state whether the expression is a polynomial expression. If it is a polynomial expression, state its degree. If it is not, explain how you know. 10. y5 − 3y
12. 64 1 5 gg
14. 21 22 1 3 1 2 1 6 cccc +− −+
13. uuuu 7427 +− ++
15. x x 351 −+
For problems 16–19, use the description to write a polynomial expression in standard form.
a. Write the polynomial expression in standard form.
b. State the degree of the polynomial expression.
c. Evaluate the polynomial expression for x = 10
d. Describe how polynomial expressions in standard form can behave like integers in expanded form. Use your response from part (c) to support your answer.
21. Consider the expression 2x5 + + 7.
a. What term can be placed in the box to make this a polynomial expression in standard form?
b. What term cannot be placed in the box to make this a polynomial expression?
c. What term can be placed in the box to make this a polynomial expression that is not in standard form?
Lucas says that the expression 5a − 2a2 + 6a is a binomial expression in disguise because it can be rewritten as 11a − 2a2 when all the terms have been distributed and like terms have been combined. For problems 22–25, determine whether the expression is a binomial expression in disguise.
Remember
For problems 26 and 27, evaluate.
−1.2 ⋅ 2.4 − 3.02
22. 2 ⋅ 5x5 − 12x4 + 3x5 + 2x4
23. t(t + 2) + 2(t + 2) − 4t
24. 5(b − 1) − 10(b − 1) + 100(b2 − 1)
25. (2πr − πr2) ⋅ r − (2πr − πr2) ⋅ 2r
26. 62.34 − (−5.66) + (−11.91)
For problems 28–31, find the product.
28. m(m − 4)
29. 6t(t + 3)
For problems 32 and 33, solve the equation.
32. −3x − 12 = −18
33. 24 = 9 − 6x
30. n(10n2 − 7)
31. −2a2(1 − 5a)
Student Edition: Grade A1, Module 1, Topic A, Lesson 4
Name Date
Adding and Subtracting Polynomial Expressions
1. Evaluate the following expressions for x = −3, x = −2, x = −1, x = 0, x = 1, x = 2, and x = 3.
b. x + 2
Find the Sum or Difference
2. Write 125 in expanded form.
3. Write 432 in expanded form.
4. Add the expanded forms of problems 2 and 3 to find the total sum.
5. Find the sum (x2 + 2x + 5) + (4x2 + 3x + 2). Combine like terms.
6. Write 563 in expanded form.
7. Write 251 in expanded form.
8. Subtract the expanded form of problem 7 from the expanded form of problem 6. Write the difference in standard form.
9. Find the difference (5x2 + 6x + 3) − (2x2 + 5x + 1). Combine like terms.
Adding and Subtracting Polynomial Expressions
For problems 10–20, find the sum or difference. Write your answer as a polynomial expression in standard form.
Student Edition: Grade A1, Module 1, Topic A, Lesson 4
Name Date
Find the sum or difference. Combine like terms.
(w3 − 3w2 + 12w + 8) + (2w3 − 18w + 4)
2. (w3 − 3w2 + 12w + 8) − (2w3 − 18w + 4)
1.
Student Edition: Grade A1, Module 1, Topic A, Lesson 4
Name
Adding and Subtracting Polynomial Expressions
In this lesson, we
• compared the addition and subtraction of polynomial expressions to the addition and subtraction of multi-digit numbers in expanded form.
• added and subtracted polynomial expressions.
Examples
For problems 1 and 2, find the sum. Combine like terms.
1.
2. (5x2 + 2x + 3) + (x2 + 4x + 5)
Adding the digits of terms with the same place value in a multi-digit number is similar to adding the coefficients of terms with the same degree in a polynomial expression.
For problems 3–5, rewrite the polynomial expression in standard form.
3. (4p2 − 9p + 2) − (2p2 + 8p − 6)
Use the distributive property to rewrite −(2p2 + 8p − 6) as −2p2 − 8p + 6
4. (w4 + 6 − w2) + (12 − w2 + 6w + 4w3)
5.
Polynomial expressions are closed under addition and subtraction. The sum or difference of two polynomial expressions is always a polynomial expression.
Student Edition: Grade A1, Module 1, Topic A, Lesson 4
Name
For problems 1 and 2, write the number in expanded form.
For problems 3–7, find the sum or difference. Combine like terms.
1. 306
2. 1042
3. 80,463 + 2510
4.
5.
6. (8x4 + 4x2 + 6x + 3) + (2x3 + 5x2 + 1x)
7. (4x
8. Describe how adding and subtracting polynomial expressions is similar to adding and subtracting whole numbers. Use your responses from problems 2 and 3 to support your answer.
a. What values for the unknown exponent would make this a trinomial expression when written in standard form?
b. What values for the unknown exponent, when substituted into the box, would make this a polynomial expression with four terms when written in standard form?
c. What values for the unknown exponent would make this a binomial expression when written in standard form?
18. Emma wrote a 5th-degree polynomial expression. Tiah wrote a 3rd-degree polynomial expression.
a. Is the sum of their expressions a polynomial expression? Explain.
b. Is the difference of their expressions a polynomial expression? Explain.
c. What is the degree of the sum of their expressions?
d. What is the degree of the difference of their expressions?
Remember
For problems 19 and 20, evaluate.
19. −+ 2 5 3 4 20. 4 9 2 3 1 27 +−()
21. Show that 7 + 2m + 6m(m + 3) and 6m2 + 20m + 7 are equivalent expressions. State the property or operation used in each step.
For problems 22 and 23, solve the equation.
22. −2(3x − 2) = 28
23. 5(2x + 4) − 12x = −6
Student Edition: Grade A1, Module 1, Topic A, Lesson 5
Name Date
Multiplying Polynomial Expressions
From Area Model to Tabular Model
1. Consider the area model shown.
a. Determine the partial products and record them on the area model.
b. What is the product of 27 and 13?
2. Consider the tabular model shown.
a. What multiplication expression is represented by the tabular model?
b. Determine the partial products and record them on the tabular model.
7 2 x 1x 3
c. Write the equation that is represented by the tabular model.
3. Use a tabular model to determine the product (4x + 1) (2x − 5) in standard form.
4. Use a tabular model to determine the product (x − 1) (3x − 7) in standard form.
5. Consider the expression (x − 1)(3x − 7).
a. Multiply by distributing x − 1.
b. Multiply by distributing 3x − 7
6. Consider the expression (x + 2)(x2 − x − 5).
a. Multiply by distributing x + 2.
b. Multiply by distributing x2 − x − 5
Student Edition: Grade A1, Module 1, Topic A, Lesson 5
Name
Find the product. Write your answer in standard form.
(a − 6)(3a + 4)
Date
Student Edition: Grade A1, Module 1, Topic A, Lesson 5
Name Date
Multiplying Polynomial Expressions
In this lesson, we
• explored connections between multiplying integers by using the area model and multiplying polynomial expressions by using the tabular model.
• described connections between the tabular model and the algebraic method for multiplying polynomial expressions.
• multiplied polynomial expressions.
Examples
For problems 1–3, find the product. Write the answer in standard form.
1. (x + 1)(x + 4)
Tabular Model:
(x + 1)(x + 4) = x2 + 5x + 4
Algebraic Method:
Unless a problem specifies otherwise, you can pick whichever method you prefer to multiply polynomial expressions.
Both approaches require the distributive property. The terms x and 4 each are multiplied by x and by 1.
Polynomial expressions are closed under multiplication. The product of two polynomial expressions is always a polynomial expression.
2. (4m − 3)(5m + 2)
Tabular Model:
3. (w − 8)(w2 − 4)
Tabular Model:
Algebraic Method:
Algebraic Method:
The polynomial expression w2 − 4 is missing a w term. If using the tabular model to multiply, it is helpful to include a 0w term to align like terms correctly along the diagonals.
Student Edition: Grade A1, Module 1, Topic A, Lesson 5
Name Date
For problems 1–6, find the product.
p( p
5)
(10s6 − 4s + 1) s
7. Find the area of the rectangle. Write the area as a polynomial expression in standard form, where b > 1
b –5
1. 9(7t4) 2. 1 2 126 3 () hh
3. 8(3k5 + 2k2 + 11)
4. (7g3)(8g2)
5.
−
For problems 8–10, find each product.
8. 58 ⋅ 15
9. (50 + 8)(10 + 5)
(5x + 8)(x + 5)
11. Describe how multiplying polynomial expressions is similar to multiplying integers. Use your responses from problems 8–10 to support your answer.
12. Find the area of the triangle. Write a polynomial expression in standard form for the area of the triangle, where x > 0. 2x +6 3x
10.
For problems 13–17, find the product. Write your answer in standard form.
18. Write a polynomial expression in standard form for the area of a rectangle with length d + 6 and width d + 9, where d > −6.
13. (m + 2)(m + 5)
14. (a − 1)(a + 6)
15. (9 − v)(v − 3)
16. (7z − 2)(3z + 2) 17.
19. Write a polynomial expression in standard form for the area of triangle ABC, where p > −2.
For problems 20–25, rewrite each expression as a polynomial expression in standard form.
26. Li Na wrote an 8th-degree polynomial expression, and Lyla wrote a 2nd-degree polynomial expression. Will the product of their polynomial expressions be a polynomial expression? Explain.
20. (c + 6)(c2 + 1)
21. (w + 2)(w2 + 3w + 5)
22. (−2r + 7 + 3r2)(5r + 1)
23. 2( j − 5)( j + 3)
24. (0.2u2 + 1)(0.75u − 5) + 0.3
25. 7q2 + (2q − 7)(8q2 − 3) − 4
Remember
For problems 27–29, evaluate.
30. Consider the polynomial expression 7
a. Write the expression in standard form, and state the degree of the polynomial expression.
b. Evaluate the expression for x = 10
31. Solve for x in the equation −4(x − 6) = −2(3x + 2) − 8
Student Edition: Grade A1, Module 1, Topic A, Lesson 6
Name Date
Polynomial Identities
For problems 1–5, find the product. Write your answer as a polynomial expression in standard form.
1. (a + 3)(a + 3)
2. (w + 2)(w + 2)
3. (q − 7)(q − 7)
4. (n + 5)(n − 5)
5. (2y + 6)(2y − 6)
Perfect Squares
Evan and Tiah notice that problems 1, 2, and 3 are all squared binomial expressions. They wonder if squaring a binomial expression has a special result. They each decide to investigate the binomial expression a + b, where a and b are any numbers. Evan’s work is shown.
6. Is Evan’s work correct? Why?
7. Tiah says that squaring a binomial expression gives the same result as multiplying a binomial expression by itself. She begins by using the tabular model to multiply (a + b) and (a + b). Complete her work to find the product (a + b)(a + b).
Tiah’s Work
For problems 8 and 9, use multiplication to rewrite the expression as a polynomial expression in standard form.
8. (x + 3)2
9. ( y − 12)2
For problems 10–13, use the identity (a + b)2 = a2 + 2ab + b2 to rewrite the expression as a polynomial expression in standard form.
10. (a + 12)2
11. ( f − 6)2
12. (7r + 1)2
13. (3k − 4)2
Difference of Squares
14. Use the tabular model to find the product (a + b)(a − b).
For problems 15 and 16, use multiplication to rewrite the expression as a polynomial expression in standard form.
15. (g + 4)(g − 4)
16. (10u + 5)(10u − 5)
For problems 17–20, use the identity (a + b)(a − b) = a2 − b2 to rewrite the expression as a polynomial expression in standard form.
17. (m + 10)(m − 10)
18. (−h + 4)(−h − 4)
19. (2s + 12)(2s − 12)
20. (−5b + 1)(−5b − 1)
Return of the Ducks
21. Choose two expressions from the Growing Pattern of Ducks problem from lesson 1, and verify that they are equivalent. Justify your reasoning for each step by using properties, identities, and/or operations.
Student Edition: Grade A1, Module 1, Topic A, Lesson 6
Name Date
1. Find the product. Write your answer in standard form. (2t + 1)(2t − 1)
2. Write the polynomial expression (x − 4)2 in standard form.
Student Edition: Grade A1, Module 1, Topic A, Lesson 6
Name Date
Polynomial Identities
In this lesson, we
• multiplied polynomial expressions.
• established the polynomial identities (a + b)2 = a2 + 2ab +
• explored the usefulness of polynomial identities.
Examples
In problems 1–5, rewrite the polynomial expression in standard form.
1. (x + 2)2
Use
2. (m + 3)(m − 3)
Use
3. (3a − 4)(3a − 4)
Use
4.
You can apply the commutative property of multiplication to rewrite the product so that it is in the same form as the identity.
5. 7 + (y − 8)2 − 6y
The product (3a − 4)(3a − 4) is equivalent to (3a − 4)2
Expand (y − 8)2 first. Use
Student Edition: Grade A1, Module 1, Topic A, Lesson 6
Name Date
For problems 1–10, rewrite the expression as a polynomial expression in standard form. 1. (x + 3)(x + 3)
(h + 6)2
11. Explain why (a + b)(a − b) = a2 − b2 is called an identity.
12. Figure ABCD is a square. Write a polynomial expression in standard form for the area, where x >− 4 3 3x +4
13. Levi and Zara want to find the product (12 − d)2. Levi says the expression (12 − d)2 is equivalent to 144 − d2. Zara says the expression is equivalent to 144 + d2 .
a. Which student is correct? Explain any mistakes Levi and Zara may have made.
b. Write the product (12 − d)2 in standard form.
For problems 14–17, rewrite the expression as a polynomial expression in standard form.
18. Figure IJKL is a rectangle. Write a polynomial expression in standard form for the area, where x > 10 7 . 7x –10
x +10
19. KL is the radius of the circle. Write a polynomial expression in standard form for the exact area of the circle, where k > 1 9 .
20. Write a polynomial expression in standard form for the area of the triangle, where x > 3. x +3 x –3
For problems 21–25, rewrite the expression as a polynomial expression in standard form.
21. (6x + 3)2 + 20
22. 8x + (x − 1)2 − 8
23. −18k − 5k + (k + 5)2
24. 8b2 − (4b + 6)(4b − 6) + 14
25. 27c2 + (8c2 − 3)2 − 8
26. Write a polynomial expression in standard form for the volume of the square prism, where x > 3.
27. What is the degree of the polynomial expression for the product (ax3 + b)2, where a and b are constants and a ≠ 0?
Remember For problems 28 and 29, evaluate.
For problems 30 and 31, find the sum or difference.
30. (−3p4 + 2p2 − 6p − 7) + (8p4 − 15p + 4)
31. (a3 − 6a2 − 4a + 10) − (−3a3 + 2a2 − 2)
32. Which statements can be represented by the inequality x > 10? Choose all that apply.
A. There are more than 10 students in the class.
B. The meeting will last for at least 10 minutes.
C. The value of x is greater than 10
D. The minimum donation for the fundraiser is $10.
E. The greatest value of x is 10.
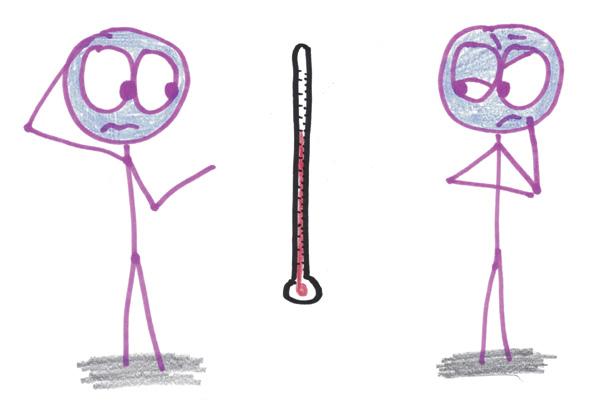
Solving Equations and Inequalities in
One Variable
Student Edition: Grade A1, Module 1, Topic B
Numbers Seeking Work
TOPIC B
In algebra, every statement is like a job posting. Think of it as a mathematical HELP WANTED sign, describing the role to be performed and the necessary qualifications. And who are the job applicants?
Numbers, of course.
Sometimes, every number fits the description. These jobs are “identities,” and everyone gets hired.
WANTED:
2(x+3) = 2x+6
So many qualified applicants!
Sometimes, no numbers fit the description. These jobs are impossibilities, like requiring that employees be age 25 or younger, with at least 30 years of job experience.
WANTED:
x+2 = x+3
Hmmm... I may need to raise the salary we’re offering.
And sometimes—the most interesting times, in fact—certain numbers fit the description, while other numbers do not. These postings are like those for real jobs: selective, competitive, intriguing to study.
WANTED:
x2 = 25
Congratulations. You’re both hired.
All across the sciences, we seek out numbers: a population’s size, a chemical’s concentration, a roller coaster’s speed. Though we don’t know what number we need, we know a fact or two about it. That’s where algebra comes in: to describe the number’s traits and then to recruit qualified applicants.
Remember, the next time you solve an algebraic equation, you’re the one doing the hiring.
At the start of the 15th century, Johannes Gutenberg developed the printing press. Although Chinese monks had developed a printing technique around 600 CE, the technology was not used widely until the Gutenberg printing press was introduced. It could print much faster than other presses, which meant that publishers could produce more books and pamphlets for a lower cost. Thanks to Gutenberg’s printing press, more people could now afford books. New ideas in science and mathematics spread quickly.
Printing Presses
A print shop needed to print the same number of copies of a novel and a cookbook. The novel had twice as many pages as the cookbook. On day one, all of the printing presses made copies of the novels. On day two, the printing presses were split into two equal-size groups. The first group continued to print copies of the novel. They finished at the end of the day. The second group printed copies of the cookbook. They did not finish by the end of the day. Instead, one printing press worked for an additional two days to finish printing the copies of the cookbooks. All of the printing presses printed pages for both books at the same constant rate. How many printing presses are at the shop?
Sharing Work Samples
Record your notes and comments about work samples from other students.
• solved a problem by reasoning quantitatively by using a variety of methods, such as guessand-check or tape diagrams.
• solved a problem algebraically by creating an equation in one variable.
Example
At a basketball game, the number of adult tickets sold is 5 more than 2 times the number of student tickets sold. A total of 98 tickets are sold. How many adult tickets are sold?
Solve with a Tape Diagram
This is one unit. It represents the number of student tickets sold.
This is the total number of tickets sold.
Two units represent 2 times the number of student tickets sold. This section represents 5 tickets.
There are 31 student tickets sold.
There are 67 adult tickets sold.
Solve Algebraically
Let x represent the number of student tickets sold. Then 2x + 5 represents the number of adult tickets sold.
The sum of the number of student tickets sold and the number of adult tickets sold is the total number of tickets sold.
There are 31 student tickets sold. 2315625 67 () += + =
Substitute 31 for x in 2x + 5 to find the number of adult tickets sold.
1. The larger of two numbers is 16 more than 3 times the smaller number. The sum of the two numbers is 62.
Lyla used a tape diagram to find the two numbers. Find the error in Lyla’s work and correct it. Then find the numbers.
2. Mason read 1 3 of his book on Monday. On Tuesday, he read half of the remaining pages. On Wednesday, he read 54 pages to finish the book. How many pages are in Mason’s book? Use a tape diagram to solve.
3. A printing company will print an equal number of textbooks and novels to complete an order.
a. A textbook has 3 times as many pages as a novel. Write expressions to represent the number of pages in each type of book.
b. If the order is for 2560 copies of each book, write an expression for the total number of pages.
c. A total number of 1,925,120 pages needs to be printed to complete the order. Use your expression in part (b) to write and solve an equation to determine the number of pages in each book.
For problems 4–7, use any method to solve.
4. Levi is 4 years older than twice his younger brother’s age. The sum of their ages is 25. How old is each boy?
5. Three times the difference of a number and 5 is equal to the sum of the number and 12. What is the number?
6. Danna, Evan, and Mason combine their money to buy their friend a present. Evan spends $5.50 more than Danna. Danna spends $3.00 less than Mason. They spend a total of $25. How much money does each person spend?
7. Ji-won and Emma wrote the following problem for math class. Solve the problem to help them create the answer key.
Ji-won has $68, and Emma has $18. How much money will Ji-won have to give Emma so that Emma will have four times as much money as Ji-won?
Remember
For problems 8 and 9, solve the equation. 8. 2 5 4 += x 9. x 3 21=− .
10. Find the product. Write the answer in standard form. (w + 4)(3w 7)
11. Write an inequality for each sentence in the table. Graph the solution set of the inequality on the number line.
Solution Sets for Equations and Inequalities in One Variable
In this lesson, we
• determined whether equations and inequalities are true for different values of the variable.
• represented solution sets in words, in set notation, and on graphs.
• solved equations by using mental math.
Examples
1. Write the solution set represented by the graph.
Terminology
An element of a set is an item in the set.
An empty set is a set that has no elements.
–1010 –20123456789–4–1–6–3–8–5–9–7 a {a | a ≤ 0}
The solution set of this problem is infinite, so we use set-builder notation. This solution set means “the set of all values of a such that a ≤ 0.”
2. Find the value of x that satisfies the equation 9 + 3x = 6x. Write your answer in set notation. Solve the problem by using mental math.
I know that 3x + 3x = 6x. So the 9 on the left side of the equation must be equal to 3x. Therefore, x = 3.
The solution set of this problem is finite, so we use set notation. This solution set means “the set consisting of the number 3.”
For problems 3 and 4, solve the equation by using mental math. Write the solution set, and then graph the solution set on a number line.
3. 6x − 12 = 6(x − 12)
I can rewrite the equation as 6x − 12 = 6x − 72. I know that 6x = 6x for all values of x. But because −12 is not equal to −72, there are no values of x that make the equation true.
The solution set of this problem is the empty set. This notation means “a set with no elements.”
–1010 –20123456789–4–1–6–3–8–5–9–7
4. 6x − 12 = 6(x − 2)
A graph of the empty set does not show any points or shading.
I can rewrite the equation as 6x − 12 = 6x − 12. All values of x make this equation true.
The solution set of this problem contains any value of x. This notation means “the set of all real numbers.”
–1010 –20123456789–4–1–6–3–8–5–9–7
A graph of the set of all real numbers shows shading on the entire number line, including both arrows.
For problems 1–4, determine whether the number sentence is true or false. 1. 18750 2 +=
(24 + 16) 5 = 24 + (16 5)
3. (5 + 4)2 = 52 + 42
For problems 5–8, graph the solution set.
5. {8}
6. {} 3 4
7. ℝ
For problems 9–12, write the solution set represented by the graph.
For problems 13–17, determine whether the equation or inequality is true or false when x = 2.
13. 11 + 2x = 1 − 3x
15. 3(x + 4) = 8(x + 1) − 3x
14. 11 + 2x ≥ 1 − 3x
17. 8 − 3x + 4x + 2 = 9 + 3x − 2(x + 1)
16. 7x + 9 + 2x = 9(x + 1)
18. What is the solution set of an equation? Explain in your own words.
For problems 19–22, write a sentence that interprets the solution set of the equation or inequality.
19 + x = 10; {−9}
20. c2 = 16; {−4, 4}
x − 3 = x − 5; {}
22. −6b + 4 < 10; {b | b > −1}
19.
21.
23. What makes an equation an identity?
For problems 24–29, find the solutions to the equation. Write the solution set by using set notation. Try to solve the problem by using mental math.
x − 10.5 = 12
For problems 30–32, solve the equation by using mental math. Write the solution set by using set notation. Then graph the solution set on the number line.
24.
30. x2 = 36
31. 5(x − 2) = 5x − 2
32. 5(x − 2) = 5x − 10
33. The equation A = l ⋅ w gives the area of a rectangle in square units with length l units and width w units.
a. Find A when l = 10 and w = 15.5.
b. Find l when A = 26 and w = 2.
c. Find w when A = 9 and l = 1 2 .
For problems 34–39, find the solution(s) to the equation. Write your answer by using set notation.
34. 3 − b + 8 = 16
6b − (5 + 2b) = −5 + 4b
8(b − 2) = 6b − 2 + 2b
3b(b + 1) + 6 = 3(b2 + b + 2)
24 10 2 5 bb + + =
b2 + 6b + 3 = b(b + 6)
40. Find the value of b if the equation b(y + 1) = 2(y + 1) is an identity.
36.
38.
35.
37.
39.
41. Create an equation in one variable with one solution. Write the solution set by using set notation.
42. Revise one expression from the equation you created in problem 41 so the solution set of the new equation is all real numbers.
43. Revise one expression from the equation you created in problem 41 so that the new equation has no solution.
Remember
For problems 44 and 45, solve the equation. 44.
46. Find the product. Write your answer in standard form. (n + 3)(2n2 − 3n + 4)
For problems 1–3, identify the solution set for each equation. Use the if–then moves to justify each step of your solution path. Problem 1 has been started for you. Complete each statement.
1. 7345 x += 7345 7 6 x x x += = = If a = b, then a + c = b + c. If a = b, then
Solution set:
2. 54100 () v −=
Solution set:
3. 3 zz +=162
Solution set:
Property Development
For problems 4–9, without solving, state the property or properties that justify why the two equations must have the same solution set.
4. 5(v 4) = 100 and (v 4)5 = 100
5. 5(v 4) = 100 and 5v 20 = 100
6. 2[5(v 4)] = 2(100) and (2 5)(v 4) = 2(100)
7. v 4 = 20 and 5(v 4) = 100
8. v 4 = 20 and v 2 = 22
9. 5v 20 = 100 and 4 + v = 20
10. Apply the addition property of equality to the equation 1 − 9q = −19 to create an equation with the same solution set.
11. Apply the multiplication property of equality to the equation 1 − 9q = −19 to create an equation with the same solution set.
12. Consider the equation 3x = 3x + 2. Complete the table.
Original Equation Step Resulting Equation
3x = 3x + 2
Solution Set of Resulting Equation
Solution Set of Original Equation
Add −3x to both sides of the equation.
Multiply both sides of the equation by a nonzero number.
Multiply both sides of the equation by 0
Justifying Steps
For problems 13–15, solve each equation. Write the property or operation used in each step. Write the solution set by using set notation.
1. Solve the equation 2 x − 3(x − 2) = 4x + 34. State the operation or property used for each step, and write the solution set by using set notation.
2. Without solving, explain why the equations 2 + 3x = 4x − 2 and 6x + 4 = 8x − 4 have the same solution set. Include references to properties in your answer.
• verified that, with the exception of multiplying both sides of an equation by 0, applying the properties of arithmetic and equality preserves the solution set of an equation.
• justified each step in solving an equation by applying properties and operations.
Examples
1. Explain why the equations −3(m − 5) = 8(m + 3) and −6(m − 5) = 48 + 16m have the same solution set.
By the multiplication property of equality, I can multiply both sides of the first equation by 2. This preserves the solution set because I multiplied by a nonzero number.
2 ⋅ (−3(m − 5)) = 2 ⋅ (8(m + 3))
By the associative property of multiplication, I can regroup the factors. This preserves the solution set.
The associative property of multiplication says you can regroup the factors to multiply 2 and −3 first.
By the distributive property, I can rewrite 16(m + 3) as 16m + 48. This preserves the solution set.
−6(m − 5) = 16m + 48
By the commutative property of addition, I can rewrite 16m + 48 as 48 + 16m. The result is an equation with the same solution set as the original equation.
−6(m − 5) = 48 + 16m
The original equation is −3(m − 5) = 8(m + 3).
The equations −3(m − 5) = 8(m + 3) and −6(m − 5) = 48 + 16m have the same solution set because each property applied preserved the solution set.
For problems 2–4, find the solution set. State the property or operation used in each step.
2. 9x − 5 = 10x − 5
Addition property of equality
Addition property of equality
The solution set {0} means that the equation is true only when x equals 0. The solution set {0} is not the same as { }.
3.
Distributive property
Commutative property of addition
Addition of like terms
The resulting expressions are identical. Therefore, the values of the expressions must be equal for all values of x
Some Potential Dangers When Solving Equations (Optional)
Squaring Both Sides
1. Consider the equations x + 1 = 4 and (x + 1)2 = 16.
a. What is the solution set of x + 1 = 4? Explain.
b. What is the solution set of (x + 1)2 = 16? Explain.
c. Based on your results, does squaring both sides of an equation preserve the solution set of the original equation?
2. Consider the equations x − 2 = 0 and (x − 2)2 = 0.
a. What are the solution sets of the two equations?
b. Based on your results, does squaring both sides of an equation preserve the solution set of the original equation?
Multiplication Property of Equality
3. Consider the equation x − 3 = 5.
a. Multiply both sides of the equation by a nonzero constant, and verify that the solution set of the new equation is the same as the original equation.
b. Multiply both sides of the equation by x, and verify that 8 is a solution to the new equation.
c. Show that 0 is also a solution to the equation from part (b).
d. Based on your results, does multiplying both sides of an equation by a nonzero constant preserve the solution set of the original equation?
e. Based on your results, does multiplying both sides of an equation by a variable expression preserve the solution set of the original equation?
4. Solve for x, and then check the solution. a. x xx 4 2 5 2 =
5. Consider the equation x2 = 5x.
a. Ana multiplies both sides by 1 x to solve. What solution does she get? Verify that it is a solution to the original equation.
b. Bahar says that the equation actually has two solutions. What is the second solution to the equation?
Consider the equation x + 3 = 10, which has the solution set {7}
For each of the following problems, create a new equation by performing the action described on the equation x + 3 = 10. Then state the solution set of the new equation.
• discovered that not all moves preserve the solution set when solving an equation.
• explored popular moves that are not guaranteed to preserve the solution set, such as squaring both sides of an equation and multiplying both sides of an equation by a variable expression.
• discovered that certain moves when solving an equation may result in an equation with a solution set that is different from that of the original equation.
Examples
1. Consider the equation 4x − 3 = x + 9
a. Find the solution set.
b. Show that adding x + 5 to both sides of the equation preserves the solution set.
By the addition property of equality, adding a variable expression to both sides of an equation preserves the solution set.
c. Show that multiplying both sides of the equation by x + 5 results in a new equation with a solution set that also includes −5
(4x − 3)(x + 5) = (x + 9)(x + 5)
Substitute −5 for x to verify that −5 is also a solution.
Left side: (4(−5) − 3)((−5) + 5) = (−23)(0) = 0
Right side: ((−5) + 9)((−5) + 5) = (4)(0) = 0
2. Consider the equation 3x = x − 4.
a. Find the solution set.
The solution set of the resulting equation is {−5, 4}. So multiplying both sides of an equation by a variable expression may result in a new equation with a different solution set.
b. Square both sides of the equation. Show that −2 is a solution of the resulting equation.
(3x)2 = (x − 4)2
Substitute −2 for x to verify that −2 is a solution.
Left side: (3(−2))2 = (−6)2 = 36
Right side: ((−2) − 4)2 = (−6)2 = 36
c. Show that 1 is also a solution of the resulting equation. (3x)2 = (x − 4)2
Substitute 1 for x to verify that 1 is also a solution.
Left side: (3(1))2 = (3)2 = 9
Right side: ((1) − 4)2 = (−3)2 = 9
The solution set of the resulting equation is {−2, 1}. So squaring both sides of an equation may result in a new equation with a different solution set.
1. Consider the equation a = 3. Create a new equation by performing the action described on the equation. Then state the solution set of the new equation.
a. Square both sides of the equation.
b. Cube both sides of the equation.
c. Multiply both sides of the equation by a.
2. Consider the equation x + 4 = 3x + 2.
a. Find the solution set.
b. Show that adding x − 4 to both sides of the equation creates a new equation with the same solution set.
c. Show that multiplying both sides of the equation by x − 4 creates a new equation with a different solution set that includes 4
3. Consider the equation x + 2 = 2x.
a. Find the solution set.
b. Square both sides of the equation, and verify that your solution satisfies this new equation.
c. Show that 2 3 is also a solution to the new equation.
4. Consider the equation x(x − 3) = 5(x − 3).
a. Explain why it is incorrect to divide both sides by x − 3 to solve for x.
b. What is the solution set of the equation?
For problems 5–7, solve the equation for x.
Remember
For problems 8 and 9, solve the equation.
10. Find the difference. Write your answer in standard form.
Writing and Solving Equations in One Variable School Choir
1. At the beginning of the school year, the school choir had an equal number of freshmen and sophomores. At the end of the first semester, 3 sophomores left the choir. After that, the ratio of the number of sophomores to the number of freshmen became 3 : 4. How many sophomores remained in the choir?
Writing and Solving Equations
Solve each problem by writing and solving an equation.
2. Angel has $5.45 in quarters and dimes. He has 5 fewer dimes than quarters. How many of each coin does Angel have?
3. Sixteen years from now, Tiah’s age will be twice her age 12 years ago. What is Tiah’s current age?
4. Bahar and Huan filled bags of popcorn to sell at the baseball game.
• Huan filled 25% more bags of popcorn than Bahar.
• After the game, 15% of the combined total of their bags was not sold.
• The bags sold for $0.75 each.
• Bahar and Huan made $114.75 selling bags of popcorn. How many bags of popcorn did each person fill?
Nina sells tickets to the school play. Adult tickets are $8 each, and student tickets are $5 each. She sells 15 fewer student tickets than adult tickets. If Nina’s ticket sales are $315 total, how many student tickets does she sell?
Student Edition: Grade 8, Module 1, Topic A, Lesson 1
Name Date
Writing and Solving Equations in One Variable
In this lesson, we
• wrote equations in one variable.
• used equations in one variable to solve problems.
Examples
1. A bowling alley has two different options to pay for bowling:
• a cost of $5.75 per game plus a shoe rental fee of $3.50 or
• a flat hourly rate of $32.25 that includes shoe rental.
How many games must a player bowl in one hour for the two options to cost the same?
Let g represent the number of games.
5753503225 5752875 5 g g g += = =
A player must bowl 5 games in one hour for the cost to be the same.
2. The sum of Angel’s age now and his sister’s age now is 25. Three years ago, Angel’s age was 1 less than 3 times his sister’s age then. How old are Angel and his sister now?
Let a represent Angel’s age now. Then 25 − a represents his sister’s age now.
Also, a − 3 represents Angel’s age 3 years ago, and 22 − a represents his sister’s age 3 years ago.
Angel’s age 3 years ago
Three years ago, Angel’s sister was (25 − a) − 3, or 22 − a.
One less than 3 times his sister’s age then
Angel is 17 years old now.
Substitute 17 for a in 25 − a to find his sister’s age now.
1. The pentomino can be placed on the grid to cover a set of numbers.
a. Where should the center of the pentomino be placed so the sum of the five covered numbers is 55? Write a number sentence that verifies your placement.
b. Write an expression to represent the sum of any five numbers covered by the pentomino on the grid. Let x represent the number covered by the center of the pentomino.
c. Use your expression from part (b) to find x, the number covered by the center of the pentomino when the sum of the five covered numbers is 75. Write an equation that verifies your placement.
d. Use your expression from part (b) to find x, the number covered by the center of the pentomino when the sum of the five covered numbers is 118. Write an equation that verifies your placement.
2. Consider two integers. The first integer is 3 more than twice the second integer. Adding 21 to five times the second integer will give us the first integer. Find the two integers.
3. The sum of a father’s age and his son’s age is 53 years. In 9 years, the father’s age will be 8 years more than twice his son’s age at that time. Find the current age of each.
4. A budget cell phone company offers two texting plans.
• Option A: Base cost of $10 plus a fee of $0.10 per text message sent or received
• Option B: Base cost of $25 and no additional fees for text messages sent or received
How many text messages would a customer need to send or receive for the two service plans to cost the same?
5. Ana sells T-shirts and sweatshirts for the soccer team. The price of one sweatshirt is $10 more than the price of one T-shirt. She sells 50 T-shirts and 40 sweatshirts for a total of $1480. What is the price of one T-shirt? What is the price of one sweatshirt?
6. A pet rescue center is creating a monthly food budget. The center currently has two-thirds as many dogs as cats. Each animal is fed 2 cans of food a day. Dog food costs $0.68 per can, while cat food costs $0.65 per can. The rescue center has budgeted a total of $2581.80 for food for this 30-day month. How many dogs are at the rescue center?
Remember
For problems 7 and 8, solve the equation.
7.
9. Mr. Wu’s age is 7 years more than twice Angel’s age. The sum of their ages is 79. How old is Angel?
10. Which equation correctly models the statement that −30 is 30 units from 0 on a number line?
1. A rectangular portion of a park will be fenced off to create a playground. A construction company donated a total of 117.5 feet of fencing. Based on the space provided to create the playground, the length of the playground must be 35.5 feet. Use the formula for the perimeter of a rectangle to determine what the width of the playground must be.
Width of Any Rectangle
2. Solve the perimeter formula P = 2(l + w) for w.
Use a Formula to Make a Formula
3. The formula for the area of a rectangle is A = lw, where l represents the length and w represents the width.
a. Solve for l
b. Solve for w
4. To find the volume of a cylinder with radius r and height h, we use the formula V = πr 2h. Solve the formula for height h.
5. Angel decided to memorize three formulas that relate velocity v, displacement d, and the time t traveled by an object. v d t = t d v = d = vt
Does he need to memorize all three formulas, or can he just memorize one? Explain your reasoning.
6. Given an equation of a line ax + by = c, solve for y, where b ≠ 0.
7. The formula for the surface area of a rectangular prism with a square base is S = 2w2 + 4hw, where w represents the side length of the square base, and h represents the height of the prism. Solve for h, where w ≠ 0
8. If F represents temperature in degrees Fahrenheit and C represents the same temperature in degrees Celsius, then this equation is always true:
5F − 9C = 160
Rewrite the formula so it is more convenient for the following situations.
a. A traveler to the United States from a country that measures temperature in degrees Celsius
b. A traveler from the United States to a country that measures temperature in degrees Celsius
c. Why would the two travelers prefer different formulas?
Numbers Versus Letters
For each pair of equations in problems 9 and 10, first solve the equation that contains more than one variable. Then solve the one-variable equation. As you work, pay attention to the similarities and differences in each step of solving the equations.
The kinetic energy K of an object depends on its mass m and its velocity v. The formula for kinetic energy is Kmv = 1 2 2. Rearrange the formula to write the mass m in terms of K and v, where v ≠ 0
• compared solving equations with more than one variable to solving equations with one variable.
• rearranged formulas to solve for a specific quantity.
Examples
1. One formula for the surface area of a rectangular prism with length l, width w, and height h is SA = 2lw + 2(l + w)h. The measurements are in inches.
a. Find the height of a rectangular prism when SA = 108, l = 6, and w = 4. SA = 2lw + 2(l + w)h
Substitute the known values into the formula. Then solve the equation.
The height of the rectangular prism is 3 inches.
b. This time, start with the formula and rearrange the variables to solve for h. Then substitute the values to find the height of a rectangular prism. Recall that SA = 108, l = 6, and w = 4 The measurements are in inches.
The rearranged formula is equivalent to the given formula.
Generally assume that shapes like rectangular prisms have positive side lengths. So the possibility of dividing by 0 is not a concern in the rearranged formula.
The height of the rectangular prism is 3 inches.
2. Solve each equation for n.
Equation with One Variable n
3. Rewrite the equation
We get the same answer regardless of which arrangement of the formula we choose.
Related Equation with More than One Variable
Apply the same properties of equality to solve for n
1. The formula for the perimeter of a rectangle with length l and width w is P = 2(l + w)
a. Find the width of a rectangle when P = 92 and l = 13. The measurements are in centimeters.
b. Using the formula P = 2(l + w), solve for w first. Then substitute values when P = 92 and l = 13.
2. The formula for the volume of a cylinder with radius r and height h is V = πr 2h.
a. Find the height of a cylinder when r = 4 and V = 112π. The radius is measured in inches and the volume is measured in cubic inches.
b. Using the formula V = πr 2h, solve for h first. Then substitute values when r = 4 and V = 112π to find the height.
For problems 3–6, solve the equation for the listed variable.
Equation with One Variable
Related Equation with More than One Variable
7. Use problems 3–6 to compare each equation with one variable to its related equation with more than one variable. Explain how they are similar and how they are different.
For problems 8–13, rewrite the formula by solving for the listed variable.
8. The formula for the perimeter of a square is P = 4s, where s is the side length. Solve for s.
9. The formula for the circumference of a circle with radius r is C = 2πr Solve for r.
3. Solve 32 5 = + m for m.
4. Solve tmn s = + for m where s ≠ 0
5. Solve 13 − 5x = 3x − 3 for x.
6. Solve b − ax = cx − d for x.
10. The formula for the force on an object with mass m and acceleration a is F = ma. Solve for m.
11. The formula for the perimeter of a triangle with side lengths a, b, and c is P = a + b + c. Solve for b.
12. The formula for the surface area of a prism is S = 2B + ph, where B represents the area of the base, p represents the perimeter of the base, and h represents the height of the prism.
Solve for h.
13. The formula for the area of a trapezoid is . Solve for b
For problems 14–17, rewrite the equation in slope-intercept form, y = mx + b
14. 2x + 4y = 8 16.
x + 7y = 14
18. The formula used to convert temperature in degrees Celsius to degrees Fahrenheit is FC=+ 9 5 32
a. Rewrite this formula to convert temperature in degrees Fahrenheit to degrees Celsius.
b. Use the formula from part (a) to convert 72 degrees Fahrenheit to degrees Celsius.
19. A snow cone consists of flavored ice that fills a right circular paper cone and sits on top of the cone in the shape of a hemisphere. The volume of a snow cone is estimated by the formula Vrhr =+ 1 3 2 3 23 ππ .
a. Solve for h.
b. Use the equation from part (a) to estimate the height of the right circular cone of a snow cone that has an estimated volume of 17.08 cubic inches and a diameter of 3 inches.
20. When is it useful to rearrange a formula?
Remember
For problems 21 and 22, solve the equation.
21. 9 − 1.6t = −11
22. 4 3 2 9 2 tt−=
For problems 23–25, solve the equation for x. Write the solution set by using set notation.
23. x2 = 36
24. 2x + 5 = 5 + 2x
25. x + 6 = x + 1
26. Use the number line to answer each question.
a. Which points, if any, correspond to a number with an absolute value of 3? Explain.
b. Which points, if any, correspond to a number with an absolute value that is greater than 3? Explain.
c. Which points, if any, correspond to a number with an absolute value of −7? Explain.
For problems 1–4, determine whether the statement is always, sometimes, or never true for any value of n.
Naming the Properties of Inequality
Complete the statements in the graphic organizer, and provide examples of each property.
Properties of Inequality
Addition
Multiplication
For real numbers a , b , and c : If a > b and c > 0 , then For real numbers a , b , and c : If a > b and c < 0 , then
Example Example Example For real numbers a , b , and c : If a > b , then
Solving Inequalities
For problems 5–9, find the solution set of the inequality. Write the solution set by using set notation, and then graph the solution set on a number line.
Solution set:
Solution set:
5. 3(x − 4) > 18
6. 6 − 2x ≥ −4
Solution set:
Solution set:
Solution set:
8. −6(x − 1) < 6 − 6x
9. 2(x − 3) + x < 3(x + 4)
10. Fin and Bahar each solved the inequality 8 − 5x > −10 in class today. They found different solution sets.
a. Which solution set is correct?
b. Use the properties of inequality to explain the mistake.
Making the Grade
11. Every student in Zara’s science class will have 5 test scores by the end of the grading period. Zara sets a goal to have at least a 90 average for the grading period. Her first four test scores are 97, 85, 96, and 89. Write an inequality to find the score Zara needs to earn on her fifth test to meet her goal. Then solve the inequality.
• formalized the addition and multiplication properties of inequality.
• solved inequalities and graphed the solution sets on number lines.
Examples
1. Find the solution set of the inequality 10 − 9w ≥ 28. Write the solution set by using set notation, and then graph the solution set on a number line.
Method 1:
Reverse the inequality sign when applying the multiplication property of inequality with a negative value. 10928 918 2 −≥ −≥ ≤− w w w
Method 2: {w | w ≤ 2}
Apply the addition property of inequality so that the coefficient of the variable term is positive.
2. One number is 5 less than half another number. The numbers have a sum of at most 68. What are the largest numbers that satisfy these conditions?
Let n and 1 25 n represent the two numbers.
The phrase at most 68 indicates that the sum of the numbers must be less than or equal to 68.
Substitute 42 for n in 1
The greatest number less than or equal to 42 is 42
The largest numbers that satisfy the given conditions are 42 and 26.
For problems 1 and 2, graph the solution set on the number line.
For problems 3–5, write the solution set that represents the graph shown on the number line.
1. {g | g > 4}
2. {m | 3 ≤ m}
6. Why is graphing solution sets of one-variable inequalities more helpful than graphing solution sets of one-variable equations?
For problems 7–10, place the correct inequality sign in the box. Write the property used in each case.
If y + 3 > 9, then y +−3393 . 8. If −2x ≤ 8, then 2 2 x 8 2
For problems 11–14, find the solution set of the inequality. Write the solution set by using set notation, and then graph the solution set on a number line.
Solution set:
set:
7.
9.
11. 2c > −9
12. h – 7 < 3 Solution
13. 54 ≥ −6v
Solution set:
14. −≤93 4 f Solution set:
15. Write and solve an inequality that represents the statement that a number increased by 4 is greater than 16
For problems 16–18, find the solution set of the inequality. Write the solution set by using set notation, and then graph the solution set on a number line.
16. –6b + 4 < 10
Solution set:
17. 2 5 1 4 2 u −>
Solution set:
18. 2(g – 8) > 2g – 16
Solution set:
19. Evan buys 3 yards of fabric that is the same price per yard. He needs to have at least $5 left after making his purchase. He has a $50 bill. What’s the maximum price per yard he can pay for the fabric?
For problems 20–22, find the solution set for the inequality. Write the solution set by using set notation, and then graph the solution set on a number line.
20. 2g + (g + 5) ≥ 6g – 10
Solution set:
21. 3 5 1061 ()6 bb −≥
Solution set:
22. 2 5 2 3 49qq +<
Solution set:
23. One number is 8 more than twice the other number. If the numbers have a sum of at least −22, what is the smallest pair of numbers that fits these constraints?
24. Twelve more than four times a number is at most 42 more than twice the number. Find the solution set.
Remember
For problems 25 and 26, solve the equation.
25. −9n + 5n − 10 + 14n = 30
27. Write the property or operation used for each step in solving the equation 5(x + 4) + 6x = 11 − 3x.
28. A soccer team’s coach made a dot plot showing the number of goals scored in each game this season.
Goals Scored in Games This Season
Number of Goals
a. How many games did the soccer team play this season?
b. In how many games this season did the soccer team score at least 2 goals?
c. How many goals in total did the team score this season?
Compound Statements Involving Equations and Inequalities in One Variable
Student Edition: Grade A1, Module 1, Topic C
Stargazing for Solutions
What do algebraic solutions look like?
TOPIC C
Well, first, do they even look like anything? In a sense, no. They’re not animals or planets or pieces of fruit. They’re numbers: colorless, furless, and faceless. They are not inherently visual.
Yet, mathematicians love visualizing them. They do this with a number line, which is a kind of mathematical viewing screen. On the number line, numbers appear as points. You might say that arithmetic enters our eyes as geometry.
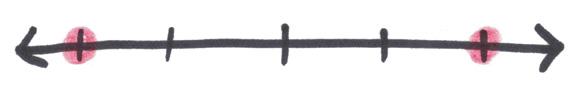
Some solution sets (say, for | x | = 2) form isolated points, like stars in the night sky.
-2 -1 0 1 2
Others (say, for | x | ≤ 2) fill whole regions, somewhat like the stars of the Milky Way, which are so numerous that they form a bright smear across the sky.
-1 0 1 2
What if there are more variables: y, z, and beyond? Then things get tricky, and mathematicians get excited. This is the idea behind algebraic geometry, a branch of advanced mathematics. It has birthed some stunning images: distant cousins of what we see on our number lines, showing what complicated solution sets look like. These are the quasars and nebulae and black holes of mathematics—strange cosmic wonders only state-of-the-art telescopes can view.
Now, here’s the real question: What do algebraic solutions taste like?
For problems 1–4, use one or more inequalities to represent the height requirements of an unaccompanied rider for the rides at Epic Park.
1. Caterpillar Coaster
2. Mobius Loop
3. Roaring River
4. Lil’ Dipper
Determining Truth
For problems 5–13, determine whether the statement is true or false.
5. Right now, I am in math class, and I am in English class.
6. Right now, I am in math class, or I am in English class.
7. Ice is cold, and fire is hot.
8. Ice is cold, or fire is hot.
A statement is a sentence that is either true or false, but not both.
A compound statement consists of two or more statements connected by logical modifiers, like and or or.
9. 3 + 5 = 8 and 5 < 7 − 1
10. 10 + 2 ≠ 12 and 8 − 3 > 0
11. 3 < 5 + 4 or 6 + 3 = 9
12. 16 20 > 1 or 5.5 + 4.5 = 11
13. 16 + 20 > 1 or 5.5 + 4.5 = 11
Graphing Solution Sets
For problems 14–16, solve each compound statement. Write the solution set by using set notation. Then graph the solution set on the given number line.
y + 8 = 3 or y 6 = 2
d 6 = 1 and d + 2 = 9
2w 8 = 10 and w > 9
14.
15.
16.
17. x < 3 and x > −1
a. Using a colored pencil, graph the inequality x < 3.
b. Using a different colored pencil, graph the inequality x > −1.
c. Using a third colored pencil, darken the section of the number line where x < 3 and x > −1.
d. Write the solution set by using set notation.
e. How many solutions are there to this compound inequality? Explain.
f. Is there a more efficient way to write this statement?
For problems 18–21, write the solution set of the compound statement by using set notation. Then graph the solutions on the number line.
18. f > 4 or f ≤ 0
g > −2 or g = −2
m > 2 or m > 6
x ≥ −5 or x ≤ 2
19.
20.
21.
For problems 22 and 23, rewrite as a compound statement connected by and or or. Graph the solution set on the number line.
22. x ≤ 4
23. 1 < d < 3
Let’s Apply It
24. Each student has to present a speech in English class. The guidelines state that the speech must be at least 7 minutes, but it must not exceed 12 minutes. Write a compound inequality for the possible lengths of the speech.
25. The element mercury has a freezing point of −37.9°F and a boiling point of 673.9°F. It is a liquid between these temperatures. Write a compound inequality for the temperatures at which mercury is a liquid.
26. The internal temperature of a cooked steak must be at least 145°F when warm or below 40°F when refrigerated. At any other temperature, bacteria can grow and make the steak unsafe to eat. Write a compound inequality for the internal temperature of a cooked steak that is safe to eat.
1. Match each compound statement to the graph of its solution set on the number line.
a. x = 5 or x = −10
b. x < 5 and x > −10
c. x > 5 or x < −10
d. x ≥ 5 or x ≤ −10
e. x ≤ 5 and x ≥ −10
2. The acceptable range of chlorine levels in swimming pools is at least 1 part per million and no more than 3 parts per million. Write a compound inequality for the acceptable range of chlorine levels in a swimming pool.
• described solution sets of two equations or two inequalities joined by and or or.
• graphed solution sets of two equations or two inequalities joined by and or or on a number line.
• wrote compound statements to describe contexts.
Examples
For problems 1 3, graph the solution set of the compound statement.
1. x + 1 = 3 or x − 2 = 5
Terminology
A statement is a sentence that is either true or false, but not both.
A compound statement consists of two or more statements connected by logical modifiers, like and or or.
The connecting word is or. Solutions must make at least one part of the compound statement true.
–10–2–9–8–7–6–5–4–3–110 x 8 012345679
2. w > 5 or w < −4
–10–2–9–8–7–6–5–4–3–110 w 8 012345679
The graph of the solution set consists of both regions.
3. c ≥ −7 and c ≤ 2
The connecting word is and. Solutions must make both parts of the compound statement true.
–10–2–9–8–7–6–5–4–3–110
8 012345679
The graph of the solution set is where the graphs of c ≥ −7 and c ≤ 2 overlap.
4. Write a compound inequality for the graph.
–10–2–9–8–7–6–5–4–3–110 m 8 012345679
−4 ≤ m ≤ 6
Another way to write this compound inequality is m ≥ −4 and m ≤ 6.
5. Consider the compound inequality −5 < x ≤ 5.
a. Rewrite as a compound statement separated by and or or. x > −5 and x ≤ 5
b. Graph the compound inequality.
–10–2–9–8–7–6–5–4–3–110 x 8 012345679
c. How many solutions are there to the compound inequality?
There are infinitely many solutions to the compound inequality.
6. Write a compound inequality to represent the situation.
The car repair is expected to cost at least $100 but no more than $150
Let r represent the cost for the car repair in dollars.
100 ≤ r ≤ 150
The phrases at least and no more than indicate that the inequality should include the values 100 and 150
Student Edition: Grade A1, Module 1, Topic C, Lesson 14 Name Date
For problems 1–6, write whether the compound statement is true or false.
1. 6 + 1 = 7 and 8 − 6 = 2
2. 5 > 3 or 7 < 1
3. 3 ⋅ 4 = 12 and 1 2 74⋅=
− 10 > 6 or 1 4 163⋅≤
For problems 7–16, graph the solution set of the statement on the given number line.
7. x = −2 or x = 8
8. w > 5
9. g ≤ 2
10. k > 5 or k < 2
11. m ≤ −8 or m ≥ −1
12. d < 9 and d > 7
13. v > −3 and v < 5
14. c ≤ 3 4 or c > 1 2
15. q ≤−21 4 or q ≥ 21 4
16. x = −2 and x = 8
For problems 17 and 18, write a compound inequality for each graph.
–10–6–5–9–8–7–4–3–2–1021436589710
18. p
–10–6–5–9–8–7–4–3–2–1021436589710
19. Consider the compound inequality 0 < x < 3.
a. Rewrite the compound inequality as a compound statement connected by and or or
b. Graph the compound inequality on a number line.
c. How many solutions are there to the compound inequality?
20. Consider the compound inequality −1.75 ≤ u < 4
a. Rewrite the compound inequality as a compound statement connected by and or or.
b. Graph the compound inequality on a number line.
21. Consider the inequality n ≤ 6.
a. Rewrite the inequality as a compound statement connected by and or or.
b. Graph the inequality on a number line.
For problems 22–26, write a single or compound inequality for the situation.
22. The scores on the last test ranged from 65% to 100%.
23. To ride the roller coaster, a person must be at least 48 inches tall.
24. Unsafe body temperatures are those lower than 96°F or above 104°F.
25. For a shark to survive in an aquarium, the water in its tank must be at least 18°C and no more than 22°C.
26. Children and senior citizens receive a discount on tickets at the movie theater. The discount applies to 2- to 12-year-olds as well as adults 60 years of age or older.
27. Consider the following compound statements.
x < 1 and x > −1
x < 1 or x > −1
Does changing the word and to or change the solution set? Explain and graph the solutions to both statements.
Remember
For problems 28 and 29, solve the equation.
28. 3(x + 5) = −18
29. 7 = −4(2x − 1)
For problems 30 and 31, write the polynomial expression in standard form.
30. (a − 6)2
31. (m − 9)(m + 9)
32. The data list the heights in inches of the vertical jumps of 18 players on a youth basketball team.
4. Use the series of clues to determine the mystery integer. For each clue, find the solution set of the compound inequality. Write the solution set in set notation and graph the solution set on the number line. Then guess what the mystery integer is.
A. When I take a third of my number and then add 2, the result is less than or equal to 4 3 or greater than or equal to 10 3 . 1 3 x + 2 ≤ 4 3 or 1 3 x + 2 ≥ 10 3 –10 –8 –6 –4 –2 2 4 6 8 010
Clue Graph Guess
B. When I subtract 2 from my number and then triple that difference, the result is strictly between −21 and 12.
−21 < 3(x − 2) < 12
C. Half the sum of the opposite of my number and 5 is less than 3 or greater than 4 x + 5 2 < 3 or x + 5 2 > 4
Clue
Graph Guess
D. The difference between my number and one-third of my number is at least −4 and at most 2. 4 ≤ x − 1 3 x ≤ 2
For problems 1 and 2, find the solution set of the compound inequality. Write the solution set in set notation. Then graph the solution set on the number line.
1. 5x − 2 > 8 + 3x or 5 − 2x > 3
Solve each part of the compound inequality individually.
For problems 1–4, choose the word and or or for the compound inequality so that the solution set is neither the empty set nor the set of all real numbers.
1. x > −2 x < 12
2. x > 4 x < −1
3.
For problems 5–7, write each compound inequality as one statement without the word and. Then write a sentence describing all possible values of x.
5. x > −6 and x < −1
6. x ≤ 5 and x > 0
7. x ≥ 1 2 and x < 1
For problems 8–10, find the solution set of each compound inequality. Write the solution set by using set notation. Then graph the solution set on the number line.
8. x − 2 < 6 or x 3 4 >
9. 5y + 2 ≥ 27 and 3y − 1 < 29
2w > 8 or −2w < 4
10.
11. Consider the compound inequality 4p + 8 > 2p − 10 or 1 3 32 p −< .
a. Find the solution set. Write the solution set by using set notation. Then graph the solution set on the number line.
b. If the inequalities are joined by and instead of or, what is the solution set? Graph the solution set on the number line.
4p + 8 > 2p – 10 and 1 3 32 p −<
12. Consider the compound inequality 7 − 3x < 16 and x + 12 < −8.
a. Find the solution set. Write the solution set by using set notation. Then graph the solution set on the number line.
b. If the inequalities are joined by or instead of and, what is the solution set? Graph the solution set on the number line.
7 − 3x < 16 or x + 12 < −8
13. Consider the compound inequality −1 < g − 6 < 1.
a. Rewrite the compound inequality as a compound statement.
b. Solve each inequality from part (a) for g.
c. Write the solution set by using set notation.
d. Graph the solution set on the number line.
14. Consider the compound inequality −< ≤ 13 2 h .
a. Rewrite the compound inequality as a compound statement.
b. Solve each inequality from part (a) for h.
c. Write the solution set by using set notation.
d. Graph the solution set on the number line.
For problems 15–17, solve the compound inequality. Then graph the solution set on the number line.
15. 0 ≤ 4x − 3 ≤ 11
16. −8 ≤ −2(x − 9) ≤ 8
17. −< < + 63 1 4 x
Remember
For problems 18 and 19, solve the equation.
18. 2 3 6912−+ () =− r 19. −+() = 5215 10 r
20. Without solving, use properties to explain why the equations 5x + 6 = 3 − 4x and 18 + 15x = 9 − 12x have the same solution set.
21. Emma surveyed her friends and recorded the number of states each friend has visited. The numbers of states visited are 3, 8, 7, 6, 5, 4, 4, 5, 6, 4, and 5.
a. Find the mean number of states visited by Emma’s friends. Round to the nearest tenth.
b. Find the median number of states visited by Emma’s friends.
For problems 1–5, write the equation as a compound statement, if applicable. Use the compound statement to find the solution set. Check your solutions in the original equation. Then graph the solution set on the given number line.
1. |x| = 5
2. |x| = −5
3. |k − 2| = 7
4. |4y + 2| = 3
|2x − 3| = 0
An absolute value equation is an equation of the form, or equivalent to the form, |bx − c| = d, where b, c, and d are real numbers. The equation |bx − c| = d means bx − c is a distance of d units from 0 for some value or values of x and can be interpreted through the compound statement bx − c = d or −(bx − c) = d.
More Than Just Absolute Value
For problems 6–10, solve the equation. Write the solution set by using set notation.
• wrote absolute value equations as compound statements.
• solved absolute value equations.
• graphed solution sets of absolute value equations on a number line.
Examples
Terminology
An absolute value equation is an equation of the form, or equivalent to the form, |bx − c| = d, where b, c, and d are real numbers. The equation |bx − c| = d means bx − c is a distance of d units from 0 for some value or values of x and can be interpreted through the compound statement bx − c = d or −(bx − c) = d
For problems 1 and 2, write the equation as a compound statement, if applicable. Then write the solution set in set notation.
1. |x| = 7 x = 7 or x = 7 {−7, 7}
2. |m| = −9 {}
The compound statement means that x is 7 or the opposite of x is 7. If the opposite of x is 7, then x is −7.
3. Consider the absolute value equation |z − 6| = 2.
Absolute value represents distance from 0, and distance is never negative. This equation is not true for any value of m
a. Rewrite the absolute value equation as a compound statement. z − 6 = 2 or −(z − 6) = 2
b. Solve each linear equation for z.
c. Write the solution set in set notation.
8}
d. Graph the solution set on the number line. –10–2–9–8–7–6–5–4–3–110 z 8 012345679
4. Solve the absolute value equation 4|6 − 4x| + 9 = 81. Write the solution set in set notation.
6} Apply properties of equality to isolate the absolute value first.
For problems 1–4, write the equation as a compound statement, if applicable. Then graph the solution set of each equation on the number line.
1. |p| = 10
2. |x| = 0
3. |t| = 1.5
4. |y| = −3
5. Consider the absolute value equation |x + 7| = 3.
a. Rewrite the absolute value equation as a compound statement.
b. Solve the compound statement for x. Write the solution set by using set notation.
c. Graph the solution set on the given number line.
6. Consider the absolute value equation d 2 41−=
a. Rewrite the absolute value equation as a compound statement.
b. Solve the compound statement for d. Write the solution set by using set notation.
c. Graph the solution set on the given number line.
For problems 7–11, solve the absolute value equation. Write the solution set by using set notation.
6
7. |x + 2| − 4 =
8. 2|2p − 11| = 66
9. 8 + |5x − 2| − 2 = 6
10. −2|2x + 25| = 14
11. 8|3 − 3x| − 5 = 91
12. Why does an absolute value equation need to be rewritten as a compound statement?
13. Why is there no solution to an absolute value equation when the absolute value is equal to a negative number?
Remember
For problems 14 and 15, solve the equation.
14. 0 = −4(−6t + 3)
2.5(8 − 2t) = 2
16. The formula for the volume V of a right cone is Vrh = 1 3 2 π , where r represents the radius of the base of the cone, and h represents the height of the cone. Rearrange the formula to write the height h in terms of V and r
17. A lifeguard counted and recorded the number of children in the splash pool at each half hour. The data are listed in ascending order.
Write the letter of the equation or inequality next to the graph of its solution set.
Statement Graph A. |x| = 7 –10–2–8–6–410 x 02468 B. x > 7 –10–2–8–6–410
02468
–8–4–2024681
Explain how you matched each equation or inequality to the graph of its solution set.
Between or Not Between
For problems 1–6, write the inequality as a compound statement, if applicable. Find the solution set and write it by using set notation. Then graph the solution set on the number line.
1. |x| < 4
2. |x| > 4
3. |k + 2| ≤ 7
4. |a − 5| > 3
An absolute value inequality is an inequality of the form, or equivalent to the form, |bx − c| > d where b, c, and d are real numbers and any inequality symbol is used.
Complete each statement with either more or less based on the absolute value inequality.
The inequality |bx − c| > d means that the value of the expression bx − c is than d units from 0.
The inequality |bx − c| < d means that the value of the expression bx − c is than d units from 0.
5. |6y − 2| ≥ 5
6. |10x + 1| < 11
For problems 7–10, find the solution set. Write a brief justification for your answer.
7. |m| > −2
8. |m| < −2
9. |g − 4| ≥ 0
10. |g − 4| ≤ 0
More Than Just Absolute Value
For problems 11 and 12, solve the inequality. Write the solution set by using set notation.
11. |c + 4| − 8 < 20
12. −3|w + 12| + 10 ≤ −5
Applying Absolute Value
13. A machine weighs bags of flour. The weight of a filled bag of flour should be no more than 0.04 pounds from the desired weight of 5 pounds. Write and solve an absolute value inequality to find the range of acceptable weights.
14. A factory is designing a sensor for an aircraft engine. Regulations allow for the height to be no more than 0.001 inches from the desired height of 6 inches. Write and solve an absolute value inequality to determine the range of acceptable heights for the sensor. Write the solution set by using set notation.
• wrote absolute value inequalities as compound inequalities.
• solved absolute value inequalities.
• graphed solution sets of absolute value inequalities on a number line.
Examples
1. Consider the absolute value inequality |4r + 3| < 7
a. Rewrite the absolute value inequality as a compound inequality.
Terminology
An absolute value inequality is an inequality of the form, or equivalent to the form, |bx − c| > d where b, c, and d are real numbers and any inequality symbol is used. The inequality |bx − c| > d means bx − c is more than d units from 0. The inequality |bx − c| < d means bx − c is less than d units from 0. If 4r + 3 and its opposite are less than 7 units from 0, then the value of 4r + 3 must be between −7 and 7. Use and
b. Solve each inequality for
c. Write the solution set by using set notation.
d. Graph the solution set on the number line.
2. Consider the absolute value inequality 2|6a − 10| ≥ 4.
a. Isolate the absolute value.
b. Rewrite the absolute value inequality as a compound inequality.
If 6a − 10 and its opposite are at least 2 units from 0, then the value of 6a − 10 must be less than or equal to 2 or greater than or equal to 2. Use or
a. Rewrite the inequality as a compound statement.
b. Solve the compound statement for x. Write the solution set by using set notation.
c. Graph the solution set on the number line provided.
2. Consider the inequality |2b − 1| ≥ 6.
a. Rewrite the inequality as a compound statement.
b. Solve the compound statement for b. Write the solution set by using set notation.
c. Graph the solution set on the number line provided.
For problems 3–9, find the solution set of the inequality. Write the solution set by using set notation. Then graph the solution set on the given number line.
3. |w + 2| < 10
4. |2m − 7| > 19
5.
6.
−5|4c + 25| + 7 ≥ −8
|5 − x| − 3 > 7
8.
9.
10. Compare and contrast the solution set of |k − 2| = 3 with the solution set of |k − 2| ≥ 3.
For problems 11–14, create an equation or inequality for the situation.
11. An absolute value equation that has two solutions
12. An absolute value equation that has one solution
13. An absolute value inequality that has a solution of all real numbers
14. An absolute value inequality that has no solution
15. A candy manufacturer typically fills each bag with 362 pieces of candy. The candy count can be up to 12 pieces above or below this number.
a. Write an absolute value inequality that represents the acceptable range of candy pieces in a bag.
b. Solve the absolute value inequality from part (a) to find the acceptable number of candy pieces in any bag of candy.
Remember
For problems 16 and 17, solve the equation.
16. −2(d − 6) + 5d = 12
17. −= −+4289 4 dd
18. Match each compound equation or inequality to the graph of its solution set on the number line.
19. One random sample was taken from all shoppers at store A, and another random sample was taken from all shoppers at store B. The box plots show the distributions of the time shoppers spent at each store. Which statements must be true based on the data distributions shown in the box plots? Choose all that apply.
Length of Time Spent in Grocery Store
A
Store B
Time (minutes)
A. The ranges of the two data sets are the same.
B. The median for store A is less than the median for store B.
C. The interquartile range for store B is greater than the interquartile range for store A.
D. The difference in the medians of the two data sets is 1 2 times the interquartile range for store A.
E. The difference in the medians of the two data sets is 2 times the interquartile range for store B.
Store
Student Edition: Grade A1, Module 1, Topic D
Big Data
Count out one second. It’s about the length of a typical sneeze.
Now, in that second, here is a rough summary of what happened on the internet:
1000
5000 5 tweets sent on Twitter things “liked” on Facebook posts made on Instagram hours of video uploaded to YouTube
70,000
Look at that data! So big!
To be clear, there was nothing special about the second you counted. All of these events, give or take, are happening every single second, all day long. For each post, companies log the time, the device, the account posting it, the hashtags, the reactions to it—and much more.
Multiply that by thousands of posts per second, 60 seconds per minute, 1440 minutes per day, and you can imagine the staggering size and detail of the data sets.
This is too much data for one person to examine. It needs to be summarized, with the important features picked out.
That’s where statistics come in. A statistic is a brief summary, a quick fact about a data set.
What do statistics reveal? What do they not reveal? Who should have access to this data, and for what purposes? These questions are not only mathematical, but moral and social too. And, to answer them wisely, we’ll need to know how the statistics work.
• described shapes of data distributions displayed in dot plots by using the terms symmetric, right-skewed, left-skewed, and mound-shaped.
• compared data distributions displayed in dot plots.
• estimated typical values for data distributions.
Example
Terminology
Univariate quantitative data means there is one variable, and the data values are numerical.
A data distribution is approximately uniform when most of the values have about the same frequencies.
The numbers of grams of protein per serving in 20 different varieties of breakfast cereals are listed. 1, 1, 1, 1, 1, 2, 2, 2, 2, 3, 3, 3, 4, 4, 5, 5, 6, 6, 7, 8
a. Create a dot plot showing the distribution of grams of protein per serving in the 20 breakfast cereals.
Each dot represents one value in the data set.
Protein per Serving of Cereal
0123456789
Protein (grams)
b. Describe the shape of the distribution. The distribution is right-skewed.
c. Use the dot plot to estimate a typical number of grams of protein for one serving of cereal. A typical number of grams of protein in one serving is about 3 grams.
A skewed distribution has a tail on one side. This distribution has a tail on the right side.
The data value 3 grams falls in the middle of the data set, so it is a good estimate of a typical data value.
1. Match each dot plot to the description of its shape.
Number of Pets Owned by Students
Approximately symmetric
024612 810
Number of Pets
Measurements of Length of East Hallway
Skewed to the right
Ages of Cars Driven by Teachers
Skewed to the left
012345678
Age (years)
2. Ana recorded the daily high temperature in degrees Fahrenheit at her house for 10 days. 77, 85, 77, 79, 82, 84, 79, 78, 79, 80
a. Create a dot plot showing the distribution of high temperatures in degrees Fahrenheit for the 10-day period.
75767880828486 777981838587
b. What is the shape of the distribution?
3. There were 25 people who attended an event. The ages of the people in attendance are listed.
a. Create a dot plot showing the distribution of the ages in years of the people in attendance. 0123456798111213141015
b. What is the shape of the distribution?
c. What is a typical age of a person who attended the event?
d. What might the event have been?
4. A random sample of 80 viewers of a television show was selected. The dot plot shows the distribution of the ages of the viewers in years.
Ages of Television Show Viewers
a. What shape is the distribution?
Viewer Age (years)
b. Based on the dot plot, what is the typical age of a viewer?
c. Would you say that this television show appeals to a wide age range of viewers? Explain.
5. When is it not efficient to represent a data set by using a dot plot?
6. A doctor measured the resting heart rates of a large group of middle-aged adults. From the group, the doctor randomly selected 20 adults who are right-handed and 20 adults who are left-handed. The distributions are shown in the dot plots.
Resting Heart Rates for Right-Handed Adults
444850465254565860626466687274707682788084
Heart Rate (beats per minute)
Resting Heart Rates for Left-Handed Adults
444850465254565860626466687274707682788084
Heart Rate (beats per minute)
a. In 2 or 3 sentences, compare the distribution for the resting heart rates of right-handed adults with the distribution for the resting heart rates of left-handed adults.
b. Based on the data, can the fact that an adult is left-handed or right-handed influence that adult’s resting heart rate? Explain your reasoning.
Remember
For problems 7 and 8, solve the equation.
7. 16 = 7 − 2x − 5x 8.
9. Circle each polynomial expression.
10. Danna earns $114 for 8 hours of work. She earns the same amount of money each hour. Write an equation that represents the relationship between Danna’s earnings in dollars y and the number of hours she works x.
Draw a sample dot plot for each case, and summarize the information about the mean and median.
Typical Measures for Data Distributions
Symmetric or Approximately Symmetric
Distribution Shapes
Skewed to the Left
Skewed to the Right
Choosing a Measure of Center
The table shows estimates of the population size in thousands of 16 penguin species.
1. Complete the dot plot.
2. What is the median population size?
3. Without computing, which is greater, the mean or the median? Why?
4. To estimate the typical penguin population size, is it appropriate to use the mean, the median, or both? Why?
5. The population size of the macaroni penguin species is approximately 18,000,000. If we included the population size for the macaroni penguins in the data set, how would that affect the mean and the median? Which measure would be more affected?
Measures of Center from a Histogram
The histogram summarizes the average number of clear days in a year for the 48 largest cities in the United States. A clear day is defined as one in which clouds cover at most 30 percent of the sky during daylight hours.
6. Estimate the median and the mean from the histogram.
7. What is a typical number of clear days in a year for one of these cities? Explain your answer.
8. Construct a relative frequency histogram from the histogram for the average number of clear days.
Clear Days in a Year for US Cities Relative Frequency
Average Number of Clear Days in a Year
9. Estimate the median and the mean of the distribution.
Student Edition: Grade A1, Module 1, Topic D, Lesson 19 Name Date
1. A random sample of 10 ninth grade students was asked how many text messages they sent last Tuesday.
Text
Consider the dot plot showing the number of text messages the students sent.
Text Messages Sent by Ninth Graders Last Tuesday 050100150200250300
Number of Text Messages Sent
a. Calculate the mean and median of the data set.
b. To describe a typical number of text messages students sent last Tuesday, would you use the mean, median, or both? Explain your answer.
• determined the mean and median of a distribution from a dot plot.
• estimated the mean and median of a distribution from a histogram.
• determined which measures of center are most appropriate to describe a distribution.
Examples
1. The dot plot shows the number of grams of protein per serving in 20 different varieties of breakfast cereal. Protein (grams)
a. Find the mean and median.
The mean is 3.35 grams.
The median is 3 grams.
Protein per Serving of Cereal
Because there are an even number of data values, the median is the mean of the two middle values. 33 2 3 + =
b. Determine whether the mean, median, or both would be appropriate to use to describe a typical number of grams of protein for one serving of cereal. Explain.
The median would be more appropriate to use to describe a typical number of grams of protein for one serving of cereal because the distribution is right-skewed.
In a right-skewed distribution, the mean is usually greater than the median.
2. The histogram shows the distribution of audience ratings (out of 100%) for a sample of 100 movies.
Audience Ratings for Movies
The left half of the distribution almost mirrors the right half of the distribution.
a. Describe the shape of the distribution.
The distribution is approximately symmetric.
b. Use the histogram to estimate the mean and median of the distribution.
The mean movie rating is about 65.
The median movie rating is between 60 and 70.
The balance point is near the center because the distribution is approximately symmetric.
A histogram does not provide exact data values. The best estimate of the median is within an interval.
c. Determine whether the mean, median, or both would be appropriate to use to describe a typical audience rating for a movie in this sample. Explain.
Both the mean and the median are appropriate to use to describe the typical audience rating because the distribution is approximately symmetric.
In an approximately symmetric distribution, the mean and the median are about the same value.
1. Draw a dot plot of a data distribution representing the ages of 20 people for which the median and the mean are approximately the same value. Explain your reasoning.
2. Draw a dot plot of a data distribution representing the ages of 20 people for which the median is noticeably less than the mean. Explain your reasoning.
For problems 3 and 4, determine whether it is appropriate to use the mean, median, or both to describe a typical value. Explain.
3. A random sample of 70 employees of several different companies was asked how much money they spent on lunch last week.
Employee Spending on Lunch Last Week (Several Workplaces)
4. Another random sample of 70, this time from the same workplace, was asked how much they spent on lunch last week.
5. The dot plot shows the movie lengths in minutes of the 8 Best Picture nominees for the 2019 Oscars.
Movie Lengths of Best Picture Nominees for Oscars 2019
(minutes)
The median movie length for the movies is 133.5 minutes. Determine by inspection whether the mean movie length is greater than, less than, or the same as the median movie length. Explain your reasoning.
6. An event was attended by 40 people. The ages of the people are as follows:
Create a histogram of the ages by using the provided axes. Use intervals of 10 years.
Ages of People Attending an Event
a. Would you describe the histogram as symmetric or skewed? Explain your choice.
b. Using the histogram, estimate the mean and median.
c. Would the mean, median, or both appropriately describe the typical age of a person attending this event?
7. The relative frequency histogram shows the distribution of heights for a sample of 25 players in the Women’s National Basketball Association (WNBA).
Heights of 25 WNBA Players
Frequency
a. Estimate the mean and median.
b. To describe the typical height of these basketball players, is it appropriate to use the mean, median, or both? Explain.
Remember
For problems 8 and 9, solve the inequality for p. 8. 5p + 8 > 28 9. 3(p − 5) ≤ −18
10. The drama club sells bouquets of flowers at the spring musical performances. Each small bouquet sells for $12, and each large bouquet sells for $20. The drama club sells 14 more small bouquets than large bouquets. If the drama club makes $552 in total sales, how many small bouquets do they sell?
11. The soccer coach purchased headbands for the team. The graph shows the relationship between the number of headbands purchased and the total cost. What is the cost per headband?
1. A restaurant owner invited 100 people to try a new sandwich and to provide feedback by completing a survey. One of the survey questions asked what would be a reasonable price to the nearest dollar for the sandwich. The results are shown in the relative frequency histogram.
Suggested Price for Sandwich
Write 2 or 3 sentences that describe a typical value for the data set and what that means in terms of the suggested reasonable price for the sandwich.
Describe the distribution in terms of quartiles and what the quartiles mean in terms of the suggested reasonable price for the sandwich.
Constructing a Box Plot
2. Find each value and create a box plot that shows the distribution from problem 1.
Minimum: Q1: Median: Q3:
Maximum:
Comparing Data Distributions
5678910111213141516
Price (dollars)
3. The box plots summarize the life expectancy at birth in countries in Asia and Europe in 2017.
Life Expectancy at Birth
Asia
Europe
6870716972737475767778798180838485868788898290
Age (years)
a. What is the lowest life expectancy in any country in Europe?
b. What is the highest life expectancy in any country in Asia?
c. Is it true that there are more countries in Europe where people have a life expectancy between 76 and 80.5 years than between 80.5 and 89 years? Explain.
d. Mason says that the number of countries in Asia where people have a life expectancy between 75 and 78 years is the same as the number of countries in Europe where people have a life expectancy between 80.5 and 82 years. Do you agree with Mason? Explain.
e. How does a typical life expectancy for people in a country in Asia compare with a typical life expectancy for people in a country in Europe?
f. Write a few sentences comparing the life expectancy for people in an Asian country and the life expectancy for people in a European country.
4. The box plots summarize the average points per game for two sets of NBA players.
• The first box plot shows the distribution of the average points per game of the 21 leading scorers in NBA history.
• The second box plot shows the distribution of the average points per game of the 21 leading scorers among NBA players who were active through June 2019.
NBA Leading Scorers
Throughout NBA History
Active Players
161820222426283032
Average Points per Game
a. Complete each sentence.
% of the leading scorers in NBA history had a higher average than the bottom 75% of the leading scorers who were active through June 2019.
Approximately % of the leading scorers in NBA history had a higher average than 100% of the leading scorers who were active through June 2019.
b. Describe the shape of each data distribution.
c. Compare a typical value for average points per game for the leading scorers in NBA history and the leading scorers who were active through June 2019.
A forest is divided into equal sections, and 100 of these sections are randomly selected. A scientist asks volunteers to record the number of squirrels and birds seen in each section. The box plots show the distributions of the number of squirrels and birds observed in each section.
Animal Sightings in 100 Sections of the Forest
Squirrels
Birds
056789 234 1101112
Number of Squirrels and Birds Seen
Is the typical number of squirrels seen in each section of the forest greater than the typical number of birds seen? Justify your answer.
• interpreted information about a distribution from a box plot.
• compared distributions displayed in box plots.
Example
Twelve swimmers each swam 1500 meters two times: once wearing a wetsuit and once without wearing a wetsuit. The box plots show the distributions of the swimmers’ maximum speeds in meters per second.
Swimming Speeds
No Wetsuit
Wetsuit
Maximum Speed (meters per second)
a. Determine whether each statement is true or false.
Most of the swimmers’ maximum speeds when not wearing a wetsuit are less than 1.4 meters per second.
False
Only about 25% of the speeds fall into this category.
About 50% of the swimmers’ maximum speeds when wearing a wetsuit are between 1.2 meters per second and 1.5 meters per second.
True
The range of maximum speeds for the swimmers when not wearing a wetsuit is less than the range of maximum speeds for the swimmers when wearing a wetsuit.
True
The typical maximum speed for a swimmer when wearing a wetsuit is less than the typical maximum speed for a swimmer when not wearing a wetsuit.
False
The median speed for swimmers when wearing a wetsuit is 1.5 m/s. The median speed for swimmers when not wearing a wetsuit is 1.45 m/s
b. Did a greater percentage of swimmers reach a maximum speed of at least 1.45 meters per second when wearing a wetsuit or when not wearing a wetsuit? Explain.
A greater percentage, about 75%, of swimmers reached maximum speeds of at least 1.45 meters per second when wearing a wetsuit. This is a greater percentage than the approximately 50% of swimmers who achieved this maximum speed when not wearing a wetsuit.
1. Ana recorded the daily high temperature in degrees Fahrenheit at her house for 10 days. 77, 85, 77, 79, 82, 84, 79, 78, 79, 80
Find each value and create a box plot that shows the distribution of the daily high temperatures.
Minimum:
Q1:
Median:
Q3:
Maximum:
2. The box plot displays the distribution of heights for a sample of 25 players in the Women’s National Basketball Association (WNBA). Determine whether each statement is true or false and justify your choice.
Heights of 25 WNBA Players
61626364656668707274767880 6769717375777981
Height (inches)
a. The minimum height of the basketball players is 66 inches.
b. Most of the basketball players have a height of 73 inches or less.
c. More basketball players are between 69 inches and 73 inches tall than between 73 inches and 76 inches.
d. Approximately 25% of the basketball players are between 76 inches and 78 inches tall.
3. A timed quiz was given to 20 students. The next day students were given the same quiz, but it was untimed. The distributions of the scores for the quizzes are shown in the box plots.
Quiz Scores
Timed
Untimed
Score
a. Which distribution had a higher percentage of scores that are 7 points or greater? Explain.
b. Describe a typical score on the timed quiz and a typical score on the untimed quiz.
c. Based on the box plots, the teacher concludes that students did significantly better on the untimed quiz than on the timed quiz. Give three pieces of evidence that support this conclusion.
d. Can the teacher conclude that students had better scores on the second quiz because it was untimed? Explain.
4. Why are box plots useful to compare two univariate data sets?
5. The box plot displays the distribution of ages for 200 randomly selected residents from Kenya. The relative frequency histogram displays the distribution of ages for 200 randomly selected residents from the United States. 020406
a. Which country’s distribution has a greater percentage of people who are at least 20 years old? Explain.
b. Estimate the percentage of the people in each distribution who are at least 50 years old.
Remember
For problems 6 and 7, solve the inequality for c.
6. −34c + 18c ≤ 8 7. −4(2 c − 8) < −24
8. Consider the equation |3x − 5| = 4
a. Rewrite the equation as a compound statement.
b. Use the compound statement from part (a) to find the solution set of the original equation.
9. Suppose Nina and Danna each walk at a constant rate. The equation dt = 16 5 represents Nina’s distance d in miles for t hours of walking. The graph represents Danna’s distance during the time she walks. Who walks at a greater rate? Explain.
Describing Variability in a Univariate Distribution with Standard Deviation
1. A principal wants to know how much sleep students get each night. She randomly selects 8 students from ninth grade and 8 students from sixth grade and asks them to report the number of hours they slept the night before to the nearest hour. The dot plots display the results.
Hours of Sleep for Ninth Grade Students
456789111012
Amount of Sleep (hours)
Hours of Sleep for Sixth Grade Students
456789111012
Amount of Sleep (hours)
Based on the distributions, compare the typical amount of sleep for the ninth grade students with the typical amount of sleep for the sixth grade students.
Measuring Spread with Standard Deviation
Ninth Grade Students
Sum of deviations: Sum of squared deviations:
Mean:
Estimate the typical deviation from the mean of the ninth grade student data set.
Variance: the sum of the squared deviations from the mean divided by one less than the sample size
Standard deviation: the square root of the variance; can be used to measure the typical distance from the mean
Variance:
Standard deviation:
What does the standard deviation represent in this context?
Amount of Sleep (hours)
Sixth Grade Students
Deviation from the Mean
Squared Deviation from the Mean
Sum of deviations: Sum of squared deviations:
Mean:
Variance:
Standard deviation:
Interpret the standard deviation in this context.
Using Technology to Calculate Standard Deviation
4. The following dot plots show a larger random sample of ninth grade students and sixth grade students. Use technology to find the standard deviation of each data set.
Hours of Sleep for Ninth Grade Students
Hours of Sleep for Sixth Grade Students
456789111012
Amount of Sleep (hours)
456789111012
Amount of Sleep (hours)
Calculate the standard deviation of the ninth grade student data set.
Calculate the standard deviation of the sixth grade student data set.
Compare the standard deviations of the samples.
Changing Values and Standard Deviation
Determine whether each statement is always, sometimes, or never true.
5. Decreasing the value of a point will decrease the standard deviation of a data set.
6. Increasing the value of a point will increase the standard deviation of a data set.
7. Including an outlier in the calculation will increase the standard deviation of a data set.
1. The dot plot for data set A shows scores on a math quiz that had 4 questions worth 2 points each. The dot plot for data set B shows scores on a math quiz that had 8 questions worth 1 point each.
Which statement correctly compares the mean and the standard deviation of data set A and data set B?
Data Set A
Quiz Scores
Data Set B
Quiz Scores
A. Data set A and data set B have the same mean and standard deviation.
B. Data set A has a larger mean and a larger standard deviation than data set B.
C. Data set A has a larger mean than data set B, but data set A and data set B have the same standard deviation.
D. Data set A and data set B have the same mean, but data set A has a larger standard deviation than data set B.
2. The following data set lists the fuel economy of 5 cars in miles per gallon.
, 24.7, 24.7, 24.9, 27.9
The mean of the data set is approximately 25.1 miles per gallon, and the standard deviation is approximately 1.7 miles per gallon.
A different data set lists the fuel economy of 6 other cars in miles per gallon.
Without calculating the standard deviations, explain why the standard deviation of the second data set is larger than the standard deviation of the first data set.
Describing Variability in a Univariate Distribution with Standard Deviation
In this lesson, we
• calculated the variance and standard deviation of a distribution, by hand and with technology.
• used standard deviation to compare two distributions.
• explored the effects of changing data values on the standard deviation of a distribution.
Example
The list shows the ages in years of 5 children on the swings at a playground.
6, 8, 8, 11, 12
a. What is the range of the data set?
12 − 6 = 6
6 years
b. What is the mean of the distribution?
6881112 5 9 +++ + =
9 years
Terminology
The variance is the sum of the squared deviations from the mean of a data set divided by one less than the sample size. Variance is a measure of the overall variation from the mean in a sample.
The standard deviation is a measure of variability appropriate for data distributions that are approximately symmetric. Standard deviation is often used to describe the typical distance from the mean. It is calculated by taking the square root of the variance of a data set.
c. Record deviations from the mean and the squared deviations from the mean in the table.
Subtract the mean from each data value.
The deviation from the mean is negative when the data value is less than the mean. The squared deviation is always positive.
d. What is the variance of the distribution?
To calculate variance, divide by 1 less than the sample size. The sample size is 5. So divide by 4.
e. What is the standard deviation of the distribution? Round to the nearest tenth.
The standard deviation is the square root of the variance.
f. Interpret the standard deviation in context.
The typical distance the ages of the children are from the mean age is about 2.4 years.
1. At a high school, ninth grade students are required to run a timed mile as part of a yearly physical fitness test. Each data set shows the times it took 5 randomly selected ninth grade students to run a mile, rounded to the nearest minute.
Data Set 1: 9, 9, 9, 9, 9
Data Set 2: 7, 8, 9, 10, 11
a. Write a sentence that compares the centers and spreads of the data sets.
b. Interpret what the centers and spreads mean in this situation.
2. A manager of a trampoline park recorded attendance at the park each day over several months. The mean of the data set is 85 people, and the standard deviation is 6 people.
a. Explain what the mean of this data set tells you about the number of people who attended the trampoline park.
b. Explain what the standard deviation of this data set tells you about the number of people who attended the trampoline park.
3. The following list shows the quiz scores for five students selected at random. 6, 7, 9, 9, 9
a. What is the range of the data set?
b. What is the mean of the data set?
c. Record the deviations from the mean and the squared deviations from the mean in the table.
d. What is the variance for the data distribution?
e. What is the standard deviation for the data distribution? Round to the nearest tenth.
f. Interpret the standard deviation in context.
4. At a track meet, there are three men’s 100-meter races. The times in which the runners completed each race are recorded to the nearest 0.1 second and are shown in the dot plots.
Race 1
Race 2
Race 3
Time (seconds)
a. Without calculating, rank the races in order from least standard deviation to greatest standard deviation.
b. Explain how you were able to rank the standard deviations of the distributions without calculating.
c. Which estimate is closest to the standard deviation for the data from race 1?
A. 0.1 second
B. 0.75 seconds
C. 1.15 seconds
D. 1.30 seconds
d. Use your calculator to find the mean and standard deviation for race 1. Round each value to the nearest hundredth. How close was your estimate of standard deviation to the actual value?
Race 1 mean:
Race 1 standard deviation:
5. A grocery store manager wondered whether there was a consistent number of apples in the bags of apples sold at the store. The manager randomly selected 20 bags of apples and recorded the number of apples in each bag. The mean number of apples in each bag was 8, and the standard deviation was approximately 2 apples.
Randomly Selected Bags of Apples
Number of apples
a. How could the manager redistribute the apples into bags so that the mean of the distribution is unchanged but the standard deviation is 0?
b. How could the manager redistribute the apples into bags so that the mean and range of the distribution are unchanged but the standard deviation is maximized?
c. Suppose another bag of apples is added to the original sample. Describe what would happen to the standard deviation if the bag contains the following amounts of apples:
i. 9 apples
ii. 11 apples
iii. 3 apples
Remember
For problems 6 and 7, solve the inequality.
6. 5341 5 −≤ m 7. −0.5(−4m − 6) > 4
8. Which equations or inequalities have no solution? Choose all that apply.
1. As part of a project, Mrs. Allen’s Algebra I class collected data to determine whether the amount of homework increased as grade level increased. One group surveyed a random sample of 50 ninth grade students and 50 eleventh grade students and asked them how many hours each week they spent on homework. The dot plots show the results of the survey.
Weekly Hours of Homework for Ninth Grade Students
Weekly Hours of Homework for Eleventh Grade Students
01234567891011121314
Time (hours)
01234567891011121314
Compare the spreads of the distributions. Explain your reasoning.
Time (hours)
Estimating Spread from Histograms
A product review team is conducting a study of various brands of batteries. The team measures the battery life of a random sample of 100 batteries from brand D and a random sample of 100 batteries from brand E.
Brand D Battery Life
2. Estimate the mean of the battery life distribution for brand D.
3. Which value is closest to the value of the standard deviation of the battery life distribution? Circle the best estimate. 3 hours 10 hours 30 hours
4. Estimate the mean of the battery life distribution for brand E.
5. Is the standard deviation for this distribution greater than, about the same as, or less than the standard deviation for the brand D battery life distribution? Explain your reasoning.
6. Compare the distribution of brand D battery life with the distribution of brand E battery life. Interpret the comparison in context.
Measuring Variation from Box Plots
A company that owns amusement parks was studying wooden and steel roller coasters of their competitors. A researcher selected a random sample of 75 wooden roller coasters and 75 steel roller coasters and recorded their maximum speeds. The distribution of the data is shown in the box plots. 0102030405060708090100110120130
7. How many outliers does each distribution have? Estimate their values.
8. What is the approximate difference in the median speeds of the distributions?
9. What is the approximate difference in the ranges of the distributions?
10. What is the approximate difference in the interquartile ranges of the distributions?
11. Which measure more accurately compares the variation in the distributions? Justify your reasoning.
12. Compare the distributions of roller coaster maximum speeds. Interpret your findings in context.
1. The histogram shows the distribution of the weights in pounds of 50 dogs at a dog show.
Weights of Dogs
Which value is the best estimate of the standard deviation of the distribution?
A. 15 pounds
B. 30 pounds
C. 37.5 pounds
D. 75 pounds
2. Two different locations have a speed limit of 70 kilometers per hour. Ana uses a speed detector to collect random samples of the speeds, in kilometers per hour, of cars traveling past the two locations in one day. The box plots display the distributions of those random samples.
Location 1
Location 2
Speed (kilometers per hour)
Suppose Ana claims that the amount of variation in the driving speeds at location 1 is greater than the amount of variation in the driving speeds at location 2.
a. Provide one form of evidence from the data that supports Ana’s claim.
b. Provide one form of evidence from the data that refutes Ana’s claim.
• estimated the mean and standard deviation of a distribution from a histogram.
• compared spreads of distributions in box plots and dot plots.
Examples
1. The histogram shows the ages of a random sample of 100 subscribers of one streaming video service.
The distribution is mound-shaped. About two-thirds of the data values lie within one standard deviation of the mean of the distribution.
The mean is located at approximately the center of the distribution.
a. Estimate the mean age of a subscriber to the streaming video service. Mark it on the histogram with a vertical line.
About 40 years
b. Which value is closest to the value of the standard deviation of the age distribution? Circle the best estimate.
8 years
16 years
24 years
c. On the histogram, mark the locations that are approximately one standard deviation greater than the mean and one standard deviation less than the mean.
2. The box plot summarizes the numbers of videos that the random sample of video streaming service subscribers streamed over the last month.
A data point separated from the rest of the plot in a box plot is an outlier.
Videos Streamed Last Month
02468101214161820222426283032
Number of Videos
a. Identify any outliers in the distribution.
0 videos
b. What is the range of the distribution?
30 videos
c. What is the interquartile range (IQR) of the distribution?
8 videos
Include outliers when calculating measures of center and spread. The minimum value in this distribution is 0 videos, not 13 videos.
30 − 0 = 30
IQR is the difference between Q3 and Q1.
24 − 16 = 8
d. Is the range or IQR a better measure of the spread for this distribution? Explain.
The IQR is a better measure of spread for this distribution. The outlier increases the range of the distribution significantly, but it has little to no effect on the IQR. So the IQR better represents the overall spread of the data.
1. All the members of a high school swim team were asked how many hours they studied last week, estimated to the nearest half hour. The histogram summarizes the results.
Weekly Time Spent Studying
Study Time (hours)
a. Which value best estimates the mean study time?
A. 5 hours
B. 10 hours
C. 20 hours
b. Which value best estimates the standard deviation of the study time?
A. 2.5 hours
B. 5 hours
C. 10 hours
D. 20 hours
2. Suppose all the members of a different high school swim team were asked how many hours they studied last week, estimated to the nearest half hour. The box plot shows the data distribution.
Weekly Time Spent Studying Swim Team B
0246810121416182022242628303234363840
Study Time (hours)
a. What is the range of the distribution?
b. Interpret the range in this context.
c. Identify any outliers in the distribution.
d. What is the interquartile range (IQR) of the distribution?
e. Interpret the IQR in this context.
3. Now, suppose all the members of a high school track team were asked how many hours they studied last week. The box plot shows the data distribution.
Weekly Time Spent Studying Track Team
0246810121416182022242628303234363840
Study Time (hours)
a. Identify any outliers in the distribution.
b. What is the range of the distribution?
c. What is the IQR of the distribution?
d. Is the range or IQR a better measure of the spread in the distribution? Explain your reasoning.
4. City A hosts a marathon. The ages of the runners in the marathon are summarized in the histogram.
a. Estimate the mean age of runners in the city A marathon. Mark this value on the histogram with a vertical line.
Ages of Participants City A Marathon
Circle the best estimate of the standard deviation of the ages of runners in the city A marathon. 5 years
b. On the histogram, mark with vertical lines the locations that are approximately one standard deviation greater than the mean and less than the mean.
Ages of Participants City A Marathon
Age (years)
c. Approximately what percentage of the runners’ ages lies between one standard deviation less than the mean and one standard deviation greater than the mean?
City B also hosted a marathon. The ages of the runners in the marathon are summarized in the histogram.
Ages of Participants
d. Estimate the mean of the age of the runners in the city B marathon.
e. Circle the best estimate for the standard deviation of the runners in the city B marathon.
5 years
10 years
15 years
f. For which distribution is the standard deviation of the ages of the runners greater? Why is it greater?
5. Consider the box plots of the distributions of delay times in minutes of 60 randomly selected Big Air flights in November 2019 and December 2019.
Delay Times for Big Air Flights
November
December
0102030405060708090100110120
Delay Time (minutes)
Compare the distributions of delay times in context by using measures of shape, center, and spread.
6. Nina selected 10 students at random from her English class and 10 students at random from her math class. She asked each student how many movies they had watched in the previous month. The students’ responses are included in the lists shown.
Number of Movies Watched by Students Last Month
a. Calculate the mean and median for the data from each class. Class
English
Math
b. Calculate the standard deviation and IQR for the data from each class. Round to the nearest tenth.
English
Math
c. Identify the outliers in either data set.
d. Which measures of spread are most affected by the outlier? Explain your reasoning.
e. Is the typical number of movies watched last month by students in Nina’s English class different from the typical number of movies watched last month by students in Nina’s math class? Explain your reasoning.
7. Three data sets are shown in the dot plots.
Data Set A
Data Set B
Data Set C
2021222324252627282930
a. Compare the distributions by using measures of shape, center, and variation.
b. Which measures of center and variation did you choose to compare? Why?
c. How do these data sets illustrate the importance of measuring variation to describe a data distribution?
Remember
For problems 8 and 9, solve the inequality.
10. The dot plot shows the distribution of the workout lengths on Tuesday for a random sample of 40 gym members. Times are rounded to the nearest 5 minutes.
Time Spent at Gym
05101520253035404550556065
Time (minutes)
a. What is the shape of the distribution of workout lengths?
b. Is 30 minutes a typical workout length for this sample of gym members? Justify your answer.
11. Write the equation of the line in slope-intercept form.
• compared distributions by using shape, center, and variability.
• interpreted differences in distributions in context.
Example
The graphs show the distributions of flight times for a random sample of flights from Boston to San Francisco and a random sample of flights from San Francisco to Boston.
Compare the distributions of flight times in context by using shape and measures of center and spread.
Shape:
The distribution of flight times from Boston to San Francisco appears approximately symmetric, while the distribution of the flight times from San Francisco to Boston appears right-skewed.
Center:
The median flight time for Boston to San Francisco is about 356 minutes. The median flight time for San Francisco to Boston is between 295 minutes and 300 minutes. The typical flight time for a flight from Boston to San Francisco is about 55 to 60 minutes longer than the typical flight time from San Francisco to Boston.
Spread:
The IQR for the distribution of flight times from Boston to San Francisco is about 28 minutes. The IQR for the distribution of flight times from San Francisco to Boston is between 10 and 20 minutes. The typical variation in flight times from Boston to San Francisco is about 10 to 20 minutes more than the typical variation in flight times from San Francisco to Boston.
1. The following dot plot represents the ages of 60 randomly selected people from Japan in 2018.
Ages of Individuals from Japan
a. What is the shape of the distribution?
Age (years)
b. How does the shape of a distribution help us decide which measures of center and spread to use?
c. What is the typical age of a person in the sample?
d. What measure of center did you use to calculate a typical age in part (c)? Justify your choice.
e. What is an estimate of spread for the distribution?
f. What measure of spread did you use to calculate spread in part (e)? Justify your choice.
2. The relative frequency histogram summarizes the ages of a random sample of people in Bangladesh in 2018.
Ages of People in Bangladesh
a. Compare the shapes of the distributions of the ages in the sample from Japan and the sample from Bangladesh.
b. Which measures of center and spread would you use to compare the distributions? Justify your reasoning.
c. Compare the distributions by using appropriate measures of center and spread.
3. A principal selected 100 eighth grade students at random to participate in a reading fluency test. Teachers recorded the number of words students read accurately in one minute. Students were tested in the fall and then again in the spring. The results of each test are summarized in the box plots.
Reading Fluency Test Scores
Write two or three sentences about the eighth grade reading test results.
Runs Scored by Blue Socks Baseball Team
4. The following graphs show the distributions of the number of runs scored per game for a random sample of 30 games for the Blue Socks baseball team and a random sample of 30 games for the Black Socks baseball team. 01234567810 9
Number of Runs Scored
Runs Scored by Black Socks Baseball Team
Number of Runs Scored
Compare the distributions in context by using shape and measures of center and spread.
5. The box plots summarize the distributions of weekly sales of chocolate chip cookies from three bakeries.
Weekly Chocolate Chip Cookie Sales
30507090110130150170190210230250
Number of Cookies Sold
Compare the distributions in this context by using measures of shape, center, and spread.
Bakery A
Bakery B
Bakery C
Remember
For problems 6 and 7, solve the equation.
Volunteer Hours
8. A random sample of ninth grade students and tenth grade students at one school was asked how many hours they volunteered last month. The box plots show the distributions of time spent volunteering. 012345678
Tenth Grade
Ninth Grade
Time (hours)
Is the typical number of volunteer hours for ninth grade students in the survey greater than, less than, or equal to the typical number of volunteer hours for tenth grade students in the survey? Justify your answer.
Student Edition: Grade A1, Module 1, Mixed Practice 1
Mixed Practice 1
1. Evaluate 41 1 2 x () for x =− 1 2 .
2. Solve 648 7 8 3 8 += ++xx for x.
3. Write a number that completes the equation so it has infinitely many solutions. 4(2x + _____) = 8x + 12 Name
4. Choose the solution to the system of linear equations shown in the graph.
A. Point F
B. Point G
C. Point J
D. Points F, G, and J
5. Solve the system of linear equations algebraically.
6. Match each graph to its description.
The graph shows an outlier.
The graph shows a negative, nonlinear association.
The graph shows clustering.
The graph shows a positive, linear association.
7. Each student at Sparks Middle School takes one elective class. A random sample of students was asked which elective class they currently take. The two-way table shows the number of students in the sample by grade level who take each elective class. Use the data in the table to calculate each proportion in parts (a) and (b).
Elective Classes
a. What proportion of students from the sample take art class? If necessary, round the answer to two decimal places.
A. 0.27
B. 0.31
C. 0.36
D. 0.42
b. What proportion of seventh grade students from the sample take yearbook class? If necessary, round the answer to two decimal places.
A. 0.21
B. 0.27
C. 0.30
D. 0.38
8. Over a period of several years, Tiah recorded how many fish she caught each time she went fishing. She plans to go fishing again today. The table shows the number of fish Tiah caught on previous trips and the probability that she catches that number of fish today.
Number of Fish
Probability
a. What is the probability that Tiah will catch exactly 4 fish?
b. What is the probability that Tiah will catch at least 3 fish?
Student Edition: Grade A1, Module 1, Mixed Practice 2
Mixed Practice 2
1. Which expressions are equivalent to 43 ⋅ 4−8? Choose all that apply.
A. 4−24
B. 4−5
C. 411
D. 4 4 3 8
E. 4 4 3 8
F. 1 4 5
2. Which expressions are equivalent to 1.2 × 10⁵? Choose all that apply.
A. 120,000
B. (1.0 × 10⁶) + (2.0 × 10⁵)
C. (2.0 × 10³)(6.0 × 10²)
D. 4810 4010 7 2 . × ×
E. (2.0 × 10⁵) − (8.0 × 10⁴)
3. Match each statement to the inequality that models it. An inequality may be matched to more than one statement.
Five less than 7 times a number is at least 21 7x − 5 < 21
Five less than 7 times a number is less than 21. 7x − 5 ≤ 21
Five less than 7 times a number is at most 21 7x − 5 > 21
Five less than 7 times a number is no more than 21. 7x − 5 ≥ 21
Five less than 7 times a number is greater than 21
4. Water flows from a hose at a constant rate of 14 gallons per minute.
a. Write an equation to represent the number of gallons g that flows from the hose in t minutes.
b. Complete the table.
Time, t (minutes)
Number of Gallons, g 0 5 7 10
c. Graph the relationship between time and gallons of water.
(minutes)
5. Calculate the slope of the line twice by using two different pairs of points.
6. The table represents a function. Which ordered pairs can be added to the table so that it still represents a function? Choose all that apply.
A. (4, −13)
B. (1, −1)
C. (−4, −1)
D. (0, −1)
E. (6, −10)
F. (3, −12)
7. A right triangle has one leg with a length of 12 cm and a hypotenuse with a length of 20 cm What is the length of the other leg?
8. Ji-won says that a translation is the only transformation of AB that will result in an image with the same length as AB . Do you agree with Ji-won? Explain.
Rewrite each expression as an equivalent expression in standard form.
1. 1 + (1 + 1)
2. x + (x + x)
ARewrite each expression as an equivalent expression in standard form.
1. 1 + 1
2. 1 + 1 + 1
3. (1 + 1) + 1
4. (1 + 1) + (1 + 1)
5. (1 + 1) + (1 + 1 + 1)
6. x + x
7. x + x + x
8. (x + x) + x
9. (x + x) + (x + x)
10. (x + x) + (x + x + x)
11. (x + x) + (x + x + x + x)
12. 2x + x
13. 3x + x
14. x + 4x
15. x + 7x
16. 2x + 7x
17. 7x + 3x
18. 10x − x
19. 10x − 5x
20. 10x − 10x
21. 10x − 11x
22. 10x − 12x
Number Correct:
23. 4x + 6x − 12x
4x + 6x − 4x
4x + 6x + 4
(4x + 3) + x
(4x + 3) + 2x
3x + (4x + 3)
29. 6x + (4x + 3)
30. 6x + (4 + 3x)
31. 6x + (4 − 3x)
32. 4x + (4 − 3x)
33. 2x + (4 − 3x)
34. (3x + 9) + (3x + 9)
35. (3x − 9) + (3x − 9)
36. (3x − 9) + (3x + 9)
37. (3x − 9) − (3x + 9)
38. (11 − 5x) + (4x + 2)
39. (5x + 11) + (2 − 4x)
40. (11 − 5x) − (2 − 4x)
41. (2x + 3y) + (4x + y)
42. (2x − 3y) + (4x − y)
43. (2x − 3y) + (3y − 4x)
44. (2x + 3y) − (2x − 3y)
BRewrite each expression as an equivalent expression in standard form.
1. 1 + 1 + 1
2. 1 + 1 + 1 + 1
3. (1 + 1) + (1 + 1)
4. (1 + 1 + 1) + (1 + 1)
5. (1 + 1 + 1) + (1 + 1 + 1)
6. x + x + x
7. x + x + x + x
8. (x + x) + (x + x)
9. (x + x + x) + (x + x)
10. (x + x + x) + (x + x + x)
11. (x + x) + (x + x) + (x + x)
12. 4x + x
13. 5x + x
14. x + 8x
15. x + 11x
16. 3x + 11x
17. 11x + 5x
18. 9x – x
19. 9x − 5x
20. 9x − 9x 21. 9x − 10x
22. 9x − 11x
Number Correct:
Improvement:
3x + 5x − 10x
3x + 5x − 3x 25. 3x + 5x + 3
26. (3x + 4) + x
27. (3x + 4) + 2x
28. 3x + (3x + 4)
29. 7x + (3x + 4)
30. 7x + (3 + 4x)
31. 7x + (3 − 4x)
32. 5x + (3 − 4x)
33. 3x + (3 − 4x)
34. (5x + 7) + (5x + 7)
35. (5x − 7) + (5x − 7)
36. (5x + 7) + (5x − 7)
37. (5x − 7) − (5x + 7)
38. (6 − 13x) + (8x + 3)
39. (13x + 6) + (3 − 8x)
40. (6 − 13x) − (3 − 8x)
41. (4x + 9y) + (8x + 3y)
42. (4x − 9y) + (8x − 3y)
43. (4x − 9y) + (9y − 8x)
44. (4x + 9y) − (4x − 9y)
Student Edition: Grade A1, Module 1, Bibliography
Bibliography
National Governors Association Center for Best Practices, Council of Chief State School Officers (NGA Center, CCSSO). Common Core State Standards for Mathematics. Washington, DC: NGA Center, CCSSO, 2010.
O’Connor, John J. and Edmund F. Robertson. “Abu Ja’far Muhammad ibn Musa Al-Khwarizmi.” St. Andrews, Scotland: School of Mathematics and Statistics, University of St. Andrews. 2019. http://mathshistory.st-andrews.ac.uk/Biographies/Al-Khwarizmi.html.
O’Connor, John J. and Edmund F. Robertson. “Arabic Mathematics: Forgotten Brilliance?” St. Andrews, Scotland: School of Mathematics and Statistics, University of St. Andrews. 2019. http://mathshistory.st-andrews.ac.uk/HistTopics/Arabic_mathematics.html#13.
Rashed, Rashdi. Al-Khwarizmi: The Beginnings of Algebra. London: Saqi Books, 2010.
Student Edition: Grade A1, Module 1, Credits
Credits
Great Minds® has made every effort to obtain permission for the reprinting of all copyrighted material. If any owner of copyrighted material is not acknowledged herein, please contact Great Minds for proper acknowledgment in all future editions and reprints of this module.
Cover, Georges Seurat, A Sunday on La Grande Jatte—1884, 1884–1886, Helen Birch Bartlett Memorial Collection, Art Institute of Chicago. Photo Credit: The Art Institute of Chicago/Art Resource, NY; page 279, (top left) TWITTER, TWEET, RETWEET and the Twitter logo are trademarks of Twitter, Inc. or its affiliates, (top right) and (bottom right), Facebook and Instagram are trademarks of Facebook and are used according to their brand guidelines, (bottom left) YouTube is a trademark of Google LLC and is used according to their brand guidelines; All other images are the property of Great Minds.
For a complete list of credits, visit http://eurmath.link/media-credits.
When I solve a problem or work on a task, I ask myself
Before
Have I done something like this before? What strategy will I use?
Do I need any tools?
During Is my strategy working?
Should I try something else? Does this make sense?
After
What worked well?
What will I do differently next time?
At the end of each class, I ask myself
What did I learn?
What do I have a question about?
MATH IS EVERYWHERE
Do you want to compare how fast you and your friends can run?
Or estimate how many bees are in a hive?
Or calculate your batting average?
Math lies behind so many of life’s wonders, puzzles, and plans.
From ancient times to today, we have used math to construct pyramids, sail the seas, build skyscrapers—and even send spacecraft to Mars.
Fueled by your curiosity to understand the world, math will propel you down any path you choose.
Ready to get started?
Module 1
Expressions, Equations, and Inequalities in One Variable
Module 2
Equations and Inequalities in Two Variables
Module 3
Functions and Their Representations
Module 4
Quadratic Functions
Module 5
Linear and Exponential Functions
Module 6
Modeling with Functions
What does this painting have to do with math?
A Sunday on La Grande Jatte is considered Georges Seurat’s greatest work. Even though this painting is made entirely out of small dabs of paint, our eyes mix the colors together through optical blending. To achieve this effect, Georges Seurat had to be very precise with his colors and dot placement. This methodical technique is similar to a practice you will need as you graph equations and inequalities in two variables.
On the cover
A Sunday on La Grande Jatte—1884, 1884–1886
Georges Seurat, French, 1859–1891 Oil on canvas
Art Institute of Chicago, Chicago, IL, USA
Georges Seurat (1859–1891), A Sunday on La Grande Jatte—1884, 1884/86. Oil on canvas, 81 3/4 x 121 1/4 in (207.5 x 308.1 cm). Helen Birch Bartlett Memorial Collection, 1926.224. The Art Institute of Chicago, Chicago, USA. Photo
Credit: The Art Institute of Chicago/Art Resource, NY