LEARN ▸ Ratios and Proportional Relationships Module 1
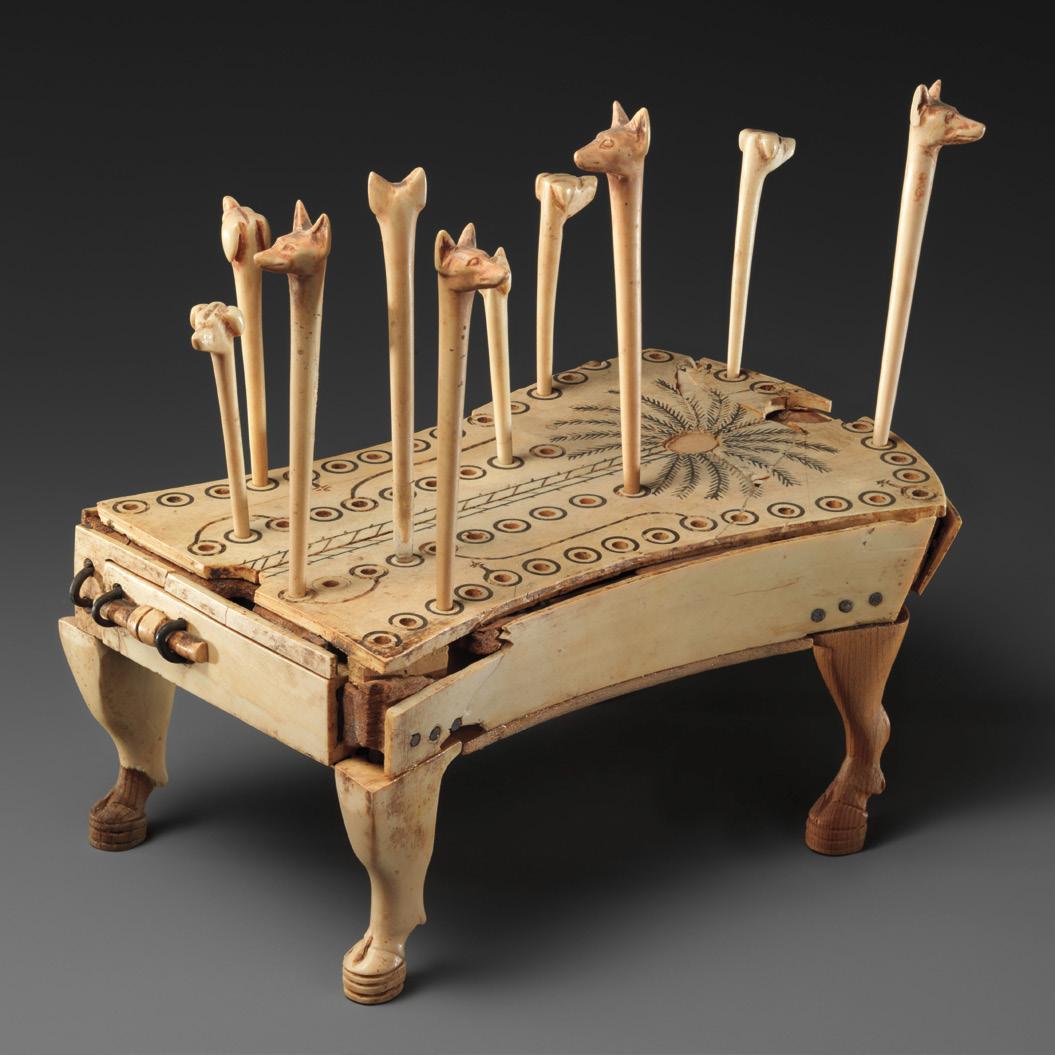
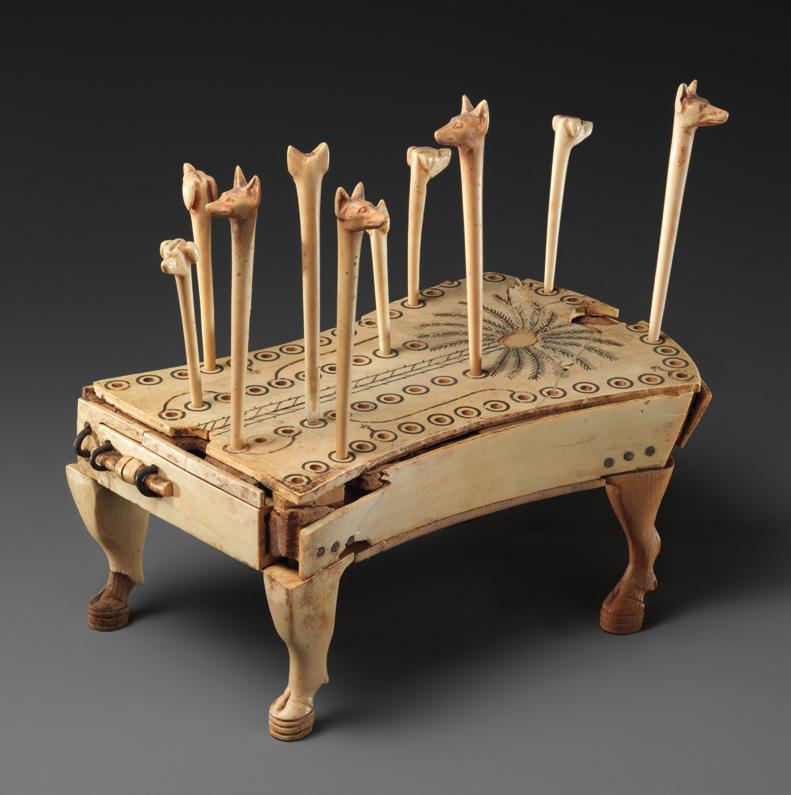
What does this object have to do with math?
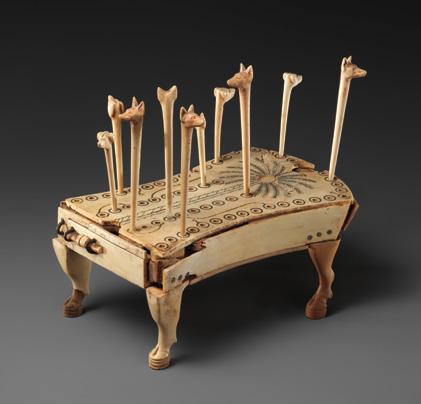
The ancient Egyptian game Hounds and Jackals, similar to the modern CHUTES AND LADDERS, is a game of chance in which the players race across the board by rolling “knucklebones” (like dice). When chance is described in mathematics, it is called probability, and it is measured with ratios to show how likely or unlikely an outcome might be. What is the probability of the hounds conquering the jackals?
On the cover
Game of Hounds and Jackals, ca. 1814–1805 BCE Egyptian Ebony, ivory
Identifying Proportional Relationships in Written Descriptions
Topic B
Working with Proportional Relationships
Lesson 7
Handstand Sprint
Lesson 8
Relating Representations of Proportional Relationships
Lesson 9
Comparing Proportional Relationships
Lesson 10
Applying Proportional Reasoning
7
17
Lesson 11
Constant Rates
Lesson 12
Multi-Step Ratio Problems, Part 1
Lesson 13
Multi-Step Ratio Problems, Part 2
Topic C
Scale Drawings and Proportional Relationships
Lesson 14
Extreme Bicycles
Lesson 15
Scale Drawings
Lesson 16
Using a Scale Factor
Lesson 17
Finding Actual Distances from a Scale Drawing
Lesson 18
Relating Areas of Scale Drawings
Lesson 19
Scale and Scale Factor
Lesson 20
Creating Multiple Scale Drawings
TOPIC A Understanding Proportional Relationships
Student Edition: Grade 7, Module 1, Topic A
In a World Without Ratios
Every school has rules about how many teachers are required for a field trip. If you were the principal of a school, what rule might you pick? (Pro Tip: Don’t pick an unchanging number of teachers!)
Student Edition: Grade 7, Module 1, Topic A, Lesson 1
Name Date
An Experiment with Ratios and Rates
1. Use the provided cubes to complete parts (a)–(d).
a. Predict how many cubes you can sort by color in 10 seconds.
b. Time how many cubes you can sort by color in 10 seconds. Record the number of cubes.
c. Predict how many cubes you can sort by color in 30 seconds.
d. Time how many cubes you can sort by color in 30 seconds. Record the number of cubes.
Machines Sorting Coins
2. Use these rates to complete the tables for machine A and machine B.
• Machine A sorts 20 coins every 4 seconds.
• Machine B sorts 33 coins every 6 seconds. Machine A
B
3. Does machine A or machine B sort more coins in 10 seconds? Explain how you found your answer.
4. Use these rates to complete the tables for machine C and machine D.
• Machine C sorts 36 coins every 8 seconds.
• Machine D sorts 9 coins every 1.5 seconds. Machine C
5. Does machine C or machine D sort more coins in 20 seconds? Explain how you found your answer.
Finding the Unit Rate
6. Use the information in the table to determine the unit rate for each machine.
7. Complete the table.
Student Edition: Grade 7, Module 1, Topic A, Lesson 1
Name Date
1. Dylan folds 5 paper airplanes in 2.5 minutes. Do you think he folds 10 paper airplanes in 5 minutes? Explain your thinking.
2. For a STEM competition, students build machines that fold paper airplanes. Machine A folds 60 paper airplanes in 0.5 minutes. Machine B folds 400 paper airplanes in 4 minutes. Each machine folds paper airplanes at a constant rate.
a. How many paper airplanes does machine A fold in 5 minutes? Justify your solution.
b. Which machine folds paper airplanes at a faster rate, machine A or machine B? Explain how you know.
Student Edition: Grade 7, Module 1, Topic A, Lesson 1
Name Date
An Experiment with Ratios and Rates
In this lesson, we
• sorted coins to determine the relationship of time elapsed to number of coins sorted.
• compared rates that are constant to rates that are not constant.
• compared rates of different machines by looking for corresponding values of quantities.
• calculated unit rates and used them to find other values.
Example
Bananas are priced at a constant rate.
a. Complete the following table.
Another way to find the unit rate is to extend the table to have a row for 1 pound of bananas. The price of 1 pound of bananas is the unit rate.
Since this relationship has a constant rate, additive or multiplicative reasoning or the unit rate can be used to complete the table.
b. Using the table from part (a), how can you determine the price of 1 pound of bananas?
You can use any row to determine the unit rate that relates 1 pound of bananas to a price. The unit rate is 0.6. The price of 1 pound of bananas is $0.60.
c. What is the cost of 5 pounds of bananas? Explain how you know.
Since the bananas are priced at a constant rate, the unit rate is multiplied by the number of pounds of bananas.
The cost of 5 pounds of bananas is $3.00
Any row of values can be used to find the unit rate, since this relationship has a constant rate.
d. Dylan bought 3 pounds of pears for $2.10. The pears are also priced at a constant rate per pound. Which cost less per pound: bananas or pears?
The price per pound of pears is $0.70.
The price of bananas is less per pound because $0.60 is less than $0.70.
Student Edition: Grade 7, Module 1, Topic A, Lesson 1
Name Date
1. Machine A and machine B sort paper at a constant rate. Machine A sorts 150 pieces of paper every 6 seconds. Machine B sorts 90 pieces of paper every 4.5 seconds. Which machine sorts paper more quickly?
2. Machine C sorts paper at a constant rate. If it sorts 143 pieces of paper every 6.5 seconds, how many pieces of paper does machine C sort in 10 seconds?
3. At a farm market, peaches are priced at a constant rate.
a. Complete the following table.
b. Using the table in part (a), how can you determine the price of one pound of peaches? What is the price per pound of peaches?
c. What is the cost of 10 pounds of peaches? Explain how you know.
d. Dylan buys 3.25 pounds of apples for $9.75. The apples are also priced at a constant rate. Which price is less per pound: apples or peaches?
Remember
For problems 4–7, multiply.
8. If 4 people share 9 cups of popcorn equally, how many cups of popcorn does each person get?
9. For every 5 apples that a fruit stand sells, it sells 3 oranges. Complete the table.
Student Edition: Grade 7, Module 1, Topic A, Lesson 2
Name Date
Exploring Tables of Proportional Relationships
Pedro’s Tables
1. Pedro groups these four tables together. Sugar, s (cups)
a. What do these four tables have in common?
b. Describe a proportional relationship in your own words.
Try These Tables
2. Given the following tables, determine whether each relationship is proportional.
Table 1
Table 3
Table 2
Extending Tables
3. Generate two additional pairs of values that belong in each proportional relationship.
Writing Equations from Tables
4. Use table 1 to write an equation to show how the number of hours h relates to the number of days d.
5. Use table 4 to write an equation to show how the number of cups of lemon juice j relates to the number of cups of lemonade l.
Student Edition: Grade 7, Module 1, Topic A, Lesson 2
Name Date
1. The table shows the cost in dollars for different numbers of daisies purchased.
Is the cost proportional to the number of daisies purchased? Explain how you know.
2. The table shows the cost in
Is the cost proportional to the number of roses purchased? Explain how you know.
Student Edition: Grade 7, Module 1, Topic A, Lesson 2
Name Date
Exploring Tables of Proportional Relationships
In this lesson, we
• identified that pairs of values with equivalent ratios represent proportional relationships.
• recognized that proportional relationships have constant unit rates.
• determined pairs of values in proportional relationships.
• wrote equations to represent proportional relationships.
Example
The table shows the number of pounds of fertilizer used to cover different-size lawns.
This row tells me that 3.5 pounds of fertilizer covers 3,500 square feet of lawn.
a. Is there a proportional relationship between the area of the covered lawn and the number of pounds of fertilizer used to cover it?
Yes.
Find the unit rate of each row to determine whether a proportional relationship exists. 5000 5 ,1000,; =
2 ,1000,; =
65 ,1000,; =
,1000 , =
The area of the lawn is proportional to the amount of fertilizer.
b. When the rate is expressed in square feet of lawn area per pound of fertilizer, what is the unit rate? Explain what the unit rate represents.
The unit rate is 1,000. This means that for every 1,000 square feet of lawn area, 1 pound of fertilizer is used.
c. You have 8 pounds of fertilizer. Is this enough to cover a 7,500-square-foot lawn? Why?
7500100075 ,,. ÷=
We have enough fertilizer. We need only 7.5 pounds of fertilizer to cover the lawn, and we have 8 pounds of fertilizer.
Another way to solve this problem is to extend the table to determine how much area is covered by 8 pounds of fertilizer.
Student Edition: Grade 7, Module 1, Topic A, Lesson 2
For problems 1–4, state whether y is proportional to x for each table. Explain your thinking.
5. The tables show the total costs of various amounts of frozen yogurt at two different shops. For each shop, state whether the total cost is proportional to the number of ounces of frozen yogurt. Explain your thinking.
a. Frosty’s Fro-Yo b. The Fro-Yo Hut
6. The table shows the number of gallons of paint used to paint walls with different areas.
a. Is there a proportional relationship between the wall area and the amount of paint in gallons?
b. What is the unit rate associated with the rate of square feet of wall area per gallon of paint? Explain what this unit rate represents.
c. You have 5 gallons of paint to paint the cafeteria wall, which has an area of 1,820 square feet Do you have enough paint? Why?
7. Shawn and her friends love to go ice skating. Last week, Shawn went to the ice rink and paid $15 to skate for 2 hours. Today, her friend Sara skated for 3 hours at the same ice rink and paid a total of $22.50
a. Suppose the relationship between the total cost and the number of hours of skating is proportional. Complete the table with two additional pairs of values. Explain what these values mean in terms of a constant rate.
b. Suppose the relationship between the total cost and the number of hours of skating is not proportional. Complete the table with two additional pairs of values. Explain what these values might mean in terms of a constant rate. Number
Remember For problems 8–11, multiply.
12. Lily walks 60 feet in 10 seconds. Nora walks 25 feet in 5 seconds. Who walks at a faster rate? Explain how you know.
13. When traveling to Belize, Dylan exchanges 40 US dollars for 80 Belize dollars. What is the exchange rate between US dollars and Belize dollars? Choose all that apply.
A. 2 US dollars per Belize dollar
B. 2 Belize dollars per US dollar
C. 1 2 Belize dollar per US dollar
D. 1 2 US dollar per Belize dollar
Student Edition: Grade 7, Module 1, Topic A, Lesson 3
Name Date
Identifying Proportional Relationships in Tables
1. Noor takes daily walks. The distance Noor walks in miles is proportional to the amount of time she walks in hours. The table shows how long it takes Noor to walk varying distances.
Use a method of your choice to determine the number of miles Noor walks per hour.
Proportional or Not?
2. For each table that represents a proportional relationship, write a description by using ratio language. For each of the other tables, explain why it does not represent a proportional relationship.
a.
c. Number of Loaves of Bread Flour (cups)
d. Time Walked (hours) Distance Walked (miles)
e. Number of Teachers
Nora’s Summer Job
3. Nora has a part-time summer job. The amount of money she earns is proportional to the number of hours she works. The table shows the amount of money Nora earns for different numbers of hours worked.
a. Write an equation that shows how much Nora earns at her job. Let h represent the number of hours worked. Let d represent the amount earned in dollars.
b. Use the equation from part (a) to determine how much Nora earns for working 31 2 hours.
Almonds for Eve
4. The cost of almonds is proportional to their weight. Eve pays $2.50 for 1 2 pound of almonds.
a. Determine the costs of the different weights of almonds listed in the table.
b. Write an equation that represents the cost of different weights of almonds. Let a represent the weight of almonds in pounds. Let c represent the cost of the almonds in dollars.
c. Use the equation from part (b) to determine the cost of 21 4 pounds of almonds.
1. Water flows into a pool from a hose at a constant rate. The depth of the water at various times is shown in the table.
a. What is the depth of the water at 3 5 hours?
b. Explain why the relationship shown in the table is proportional.
c. Write an equation to show how the depth of water d in feet relates to the time t in hours.
Student Edition: Grade 7, Module 1, Topic A, Lesson 3
Name Date
Identifying Proportional Relationships in Tables
In this lesson, we
• identified relationships as proportional or not proportional.
• computed unit rates involving fractions and decimals.
• recognized that complex fractions can be written and evaluated as division expressions.
• used unit rates to write equations that we used to determine values that were not included in the tables.
Example
Ava paints small rocks. Suppose she works at a constant rate and paints 4 rocks every 3 4 hours she works.
To write an equation, first determine the unit rate. In this case, divide 4 by 3 4 .
a. Write an equation that represents the number of rocks Ava paints in a given amount of time. Let r represent the number of rocks, and let h represent the number of hours worked.
b. How many rocks does Ava paint in 11 4 hours?
Organize the ratios in a table to help confirm the number of rocks Ava paints in 11 4 hours.
Ava paints 62 3 rocks in 11 4 hours.
Ava paints 6 rocks completely and 2 3 of a seventh rock in 1 hour and 15 minutes.
Student Edition: Grade 7, Module 1, Topic A, Lesson 3
Name Date
1. Lily keeps track of the snowfall by measuring it every 15 minutes for 45 minutes. The table shows her records.
a. According to Lily’s records, is the depth of snow proportional to the time? Explain how you know.
b. Which value in the table can be changed so that all the ratios have a constant unit rate? What should it be changed to?
2. The table shows the amount of flour Dylan needs to bake various numbers of cupcakes.
a. Is the amount of flour proportional to the number of cupcakes? Explain how you know.
b. How much flour does Dylan need to bake 50 cupcakes, which is 41 6 dozen cupcakes?
3. The table shows the amount of money Eve earns for different numbers of hours she works.
a. Find the unit rate. Explain its meaning in this problem.
b. Use the unit rate to write an equation that represents the amount of money Eve earns per hour. Let h represent the number of hours Eve works, and let d represent the amount of money she earns in dollars.
4. Maya makes braided bracelets. Suppose she works at a constant rate and braids 5 bracelets for every 2 3 hours she works.
a. Write an equation that represents the number of bracelets Maya braids per hour. Let b represent the number of bracelets, and let h represent the number of hours worked.
b. How many bracelets does Maya braid in 11 2 hours?
Remember For problems 5–8, multiply.
9. Shawn reads 570 words in 3 minutes. Sara reads 630 words in 3.5 minutes. Who reads at a faster rate? Explain how you know.
10. Jonas swims 50 meters in 30 seconds. He continues to swim at a constant rate. How many seconds does it take him to swim 200 meters? Use a double number line diagram to show your work.
Student Edition: Grade 7, Module 1, Topic A, Lesson 4
Name Date
Exploring Graphs of Proportional Relationships
1. Sort the tables into two categories: proportional and not proportional.
What I notice:
Graph Match
2. Match each graph to its table. Examine the graphs of the proportional relationships. What characteristics do they have?
What I notice:
Analyzing (0, 0)
3. Review each relationship that your group identified as proportional. What does the point (0, 0) mean in each context?
Revisiting the Water Flow Problem
In lesson 2, you identified a proportional relationship between the number of minutes a faucet is turned on and the number of gallons of water that flow from it.
4. Graph the proportional relationship by using the data in the table.
5. Does the graph fit our description of a proportional relationship? Explain why or why not.
Take a Stand
6. Is the statement “Graphed lines represent proportional relationships” always, sometimes, or never true?
• identified graphs of proportional relationships as lines that pass through the origin, the point (0, 0).
Examples
Terminology
The constant of proportionality is the constant unit rate in a proportional relationship between two quantities.
1. Which graphs represent a proportional relationship? Explain how you know.
The graph represents a proportional relationship.
The graph forms a line that passes through the origin, (0, 0).
The graph does not represent a proportional relationship. The graph forms a line, but the line does not pass through the origin, (0, 0).
The graph does not represent a proportional relationship. The graph passes through the origin, (0, 0), but it does not form a line.
2. Consider the following graph for a lemonade recipe.
y a. Does the graph appear to represent a proportional relationship between the number of cups of water and the number of cups of lemon juice used in a lemonade recipe? Explain how you know.
The graph appears to represent a proportional relationship. The points appear to lie on a line that passes through the origin, (0, 0).
This point is (10, 5), and it represents that for every 10 cups of water, there are 5 cups of lemon juice.
Confirm that the points appear to lie on a line that passes through the origin by sketching a line
b. Create a table of values based on the graph.
c. Use the values from the table to justify that the relationship between the number of cups of water and the number of cups of lemon juice is proportional.
The point (10, 5) is represented in the table because the graph shows that for every 10 cups of water, there are 5 cups of lemon juice.
The table shows that there is a constant unit rate, or a constant of proportionality, associated with the relationship between the number of cups of water and the number of cups of lemon juice. The constant of proportionality is 0.5.
To confirm that the relationship is proportional, compare the unit rates for each ordered pair to see whether they are the same number.
Since the unit rate is 0.5, the constant of proportionality is also 0.5.
Student Edition: Grade 7, Module 1, Topic A, Lesson 4
Name Date
For problems 1–3, determine whether each graph represents a proportional relationship. Explain how you know.
4. Consider the given table.
a. Graph the relationship.
b. Is the relationship between y and x proportional? Justify your thinking by using the table and graph.
c. Describe a proportional situation that could be modeled by this table and graph.
5. The graph shows the number of candy bars sold and the money received.
y
Number of Candy Bars Sold
a. Does the graph appear to represent a proportional relationship between the amount of money received and the number of candy bars sold? Explain how you know.
b. Create a table of values based on the graph. Number of Candy Bars Sold, x Money Received, y (dollars)
c. Use the values from the table to justify that the relationship between the amount of money received and the number of candy bars sold is proportional.
d. What does the point (0, 0) mean in this context?
6. Logan and Shawn recorded how much money they earned working at a local restaurant over a 5-hour shift. Use the tables shown for parts (a) and (b).
a. Graph both sets of data in the same coordinate plane. Choose an appropriate scale and label your axes.
b. Describe the similarities and differences between Shawn’s and Logan’s earnings. Use the graphs to support your thinking.
Remember
For problems 7–10, multiply.
11. The table shows costs in dollars for different quantities of baseballs. Do the corresponding values in the table represent a proportional relationship between the cost and the number of baseballs? Explain how you know.
Number of Baseballs
12. Liam uses 3 cups of milk to make 4 batches of muffins. How many cups of milk does he need to make just 1 batch of muffins?
Student Edition: Grade 7, Module 1, Topic A, Lesson 5
Name Date
Analyzing Graphs of Proportional Relationships
Foursquare Task
If your group has a task card with a graph, complete the following steps:
• Graph the relationship in the Graph square.
• Write a description of the real-world situation that is graphed.
• Create a table of values based on the graph.
• Determine whether the graph represents a proportional relationship, and explain how you know.
• If the relationship is proportional, define the two variables in the relationship, and write an equation to describe the relationship.
If your group has a task card with a set of ratios, complete the following steps:
• List the ratios and a brief description in the Description square.
• Graph the points that represent the set of ratios in the Graph square.
• Create a table of values based on the graph.
• Determine whether the graph represents a proportional relationship, and explain how you know.
• If the relationship is proportional, define the two variables, and write an equation to describe the relationship.
Gallery Walk
List the proportional relationships from the gallery walk. Identify and explain what the constant of proportionality means in each context.
List and describe the relationships from the gallery walk that are not proportional.
Student Edition: Grade 7, Module 1, Topic A, Lesson 5
Description Graph
Table of Values Proportional or Not Proportional?
Equation
Student Edition: Grade 7, Module 1, Topic A, Lesson 5
Name Date
Which of the graphs shown appear to represent proportional relationships? Choose all that apply.
Explain why the graphs you chose represent proportional relationships.
Student Edition: Grade 7, Module 1, Topic A, Lesson 5
Name Date
Analyzing Graphs of Proportional Relationships
In this lesson, we
• represented relationships as tables, graphs, and sets of ratios.
• determined whether a relationship was proportional by examining the different representations.
• calculated the constant of proportionality and used it to write an equation to represent a proportional relationship.
• identified that the constant of proportionality k can be determined from the point (1, k) in the graph of a proportional relationship.
Example
The table shows the width and height of various posters.
Terminology
Measures of two quantities are in a proportional relationship if there is a constant unit rate, known as the constant of proportionality k, between pairs of corresponding values, meaning the relationship is described by an equation of the form y = kx.
a. Graph the pairs of values from the table.
Sizes of the Posters
A different point represents the values in each row in the table.
(10, 15) (15, 22.5)
(20, 30)
(30, 45)
b. Explain how you can determine that the height of each poster is proportional to its width. I can determine that the relationship of the height to the width is proportional because the points appear to be on a line that passes through the origin. In the table, I can see that there is a constant of proportionality, 1.5.
To determine that the values in the table have a constant of proportionality of 1.5, each value of the height needs to be divided by the value of the corresponding width. Each quotient is 1.5.
c. Explain where you can find the constant of proportionality in both the table and the graph. What does the constant of proportionality represent in this situation?
In the table, I can find the constant of proportionality by calculating the unit rate, 1.5. I can find the constant of proportionality on the graph by identifying the y-value of the point (1, 1.5).
The constant of proportionality shows that when the width is 1 inch, the height is 1.5 inches.
d. Write an equation to describe the relationship between the height of each poster and its width.
hw = 15 .
Use the equation y = kx to represent a proportional relationship with a constant of proportionality k. In this situation, k is 1.5, and the variables w and h are used instead of x and y
Student Edition: Grade 7, Module 1, Topic A, Lesson 5
Name Date
For problems 1–6, state whether each graph represents a proportional relationship. Explain your reasoning. If the graph represents a proportional relationship, state the constant of proportionality and what it represents in the situation.
7. The table shows the widths and heights of different logos for a local school.
a. Graph the pairs of values from the table.
b. Explain how you can determine that the width of the logo in inches is proportional to the height of the logo in inches.
c. Explain where you can find the constant of proportionality in both the table and the graph. What does the constant of proportionality represent in this situation?
d. Write an equation to describe the relationship between the width w of the logo in inches and the height h of the logo in inches.
Remember
For problems 8–11, convert the fractions to mixed numbers and convert the mixed numbers to fractions.
12. Water drips from a faucet into an empty bucket. The table shows the proportional relationship between the amount of time that passes and the depth of the water.
a. Complete the table.
b. Explain why the relationship shown in the table is proportional.
c. Let d represent the depth of the water in centimeters. Let t represent the amount of time that passes in hours. Write an equation to show how the depth of the water d relates to the time t
13. At a local grocery store, there are 15 apples in each large bag of apples.
a. Write an expression to represent the number of apples in b bags.
b. How many apples are in 9 bags?
Student Edition: Grade 7, Module 1, Topic A, Lesson 6
Name
LESSON
Date
Identifying Proportional Relationships in Written Descriptions
1. Create a table, a graph, or an equation to represent your assigned type of relationship.
Jonas and Lily
2. Jonas is 10 years old and Lily is 8 years old.
a. How old will Lily be when Jonas is 20 years old?
b. Is this a proportional relationship? Explain why.
c. Create a table or graph to justify your solution.
Proportional or Not
For problems 3–10, determine whether the situation is proportional. Explain how you know. For any relationships that are proportional, find the constant of proportionality.
3. The grocery store sells apples for $1.25 per pound.
4. A do-it-yourself car wash charges $2.00 plus $0.25 per minute to wash your car.
5. Abdul walks 1 4 mile in every 1 12 hour.
6. Ava uses 3 4 of a bag of fertilizer for every 1 5 of her lawn.
7. A package of 96 diapers costs $24.27. A package of 72 diapers costs $19.44
8. A gas station sells gas for $2.79 per gallon.
9. Noor wants to make a batch of trail mix. One batch, which is 41 2 cups of trail mix, contains 1 4 cup of raisins.
10. So-hee owns a greenhouse and wants to buy carrot seeds. For $59.95, she can buy 1 pound of seeds. For $26.95, she can buy 1 4 pound of seeds.
Student Edition: Grade 7, Module 1, Topic A, Lesson 6
Name Date
Consider the two situations.
Situation 1:
A carnival charges an entrance fee of $8.00, and tickets for rides cost $0.60 each.
Situation 2:
At a frozen yogurt shop, a dish containing yogurt and toppings is weighed, and the price is $0.85 per ounce.
Which situation represents a proportional relationship? Explain how you know.
Student Edition: Grade 7, Module 1, Topic A, Lesson 6
Name Date
Identifying Proportional Relationships in Written Descriptions
In this lesson, we
• determined whether a relationship was proportional from its written description.
• used tables and graphs to justify that relationships were proportional.
Examples
1. Determine whether the following relationship is proportional. If so, define your variables and write an equation. If not, explain why not.
For every hour Liam babysits, he earns $12.
Let t represent the total amount in dollars he earns.
Let h represent the number of hours he babysits.
th = 12
This is a proportional relationship since Liam earns the same amount for every hour he babysits.
2. Determine whether the following relationship is proportional. If so, explain how you know. If not, change one value to make it a proportional relationship.
Last week, Henry purchased 3 pounds of apples for $3.75 at the grocery store. This week, he went back to the grocery store and purchased 5 pounds of apples for $6.50.
Find the unit rate of each pair of values to determine whether the cost is proportional to the number of pounds of apples.
This is not a proportional relationship because the price per pound is not constant. If we change $3.75 to $3.90, then it becomes a proportional relationship. We can also change $6.50 to $6.25 to make it a proportional relationship.
There are two options to use for the unit rate: either 1.25 or 1.3
3. In Watertown, Wisconsin, snow fell at a constant rate. In 63 4 hours, 41 2 inches of snow fell. How many inches of snow fell in 1 hour?
snowed 2 3 inches in 1 hour.
Student Edition: Grade 7, Module 1, Topic A, Lesson 6
Name Date
1. A cell phone company charges a flat fee of $40.00 per month and an additional $20.00 per month for each phone on the plan.
a. Is the relationship between the total monthly cost and the number of phones on the plan a proportional relationship? Explain your thinking.
b. Justify your thinking by creating a table or a graph.
For problems 2 and 3, identify whether the relationship is proportional. If so, define your variables and write an equation. If not, change a value to make it a proportional relationship.
2. Each day of doggie daycare costs $25.
3. On Tuesday, Ethan purchased 7 flowers for $6.75. On Friday, Ethan went back to the flower shop and purchased 14 flowers for $12.00
4. Logan wants to make a specific shade of purple paint. He is told to mix 1 2 gallon of red paint with 3 4 gallons of blue paint to get the desired shade of purple. If he uses a gallon of red paint, how much blue paint does he need to mix with it? Use the table to justify your answer.
5. Pedro wants to make 31 2 batches of granola bars. His dad tells him that he needs 51 4 cups of oatmeal. How much oatmeal does Pedro need for a single batch?
Remember
For problems 6–8, multiply.
Red Paint (gallons)
Blue Paint (gallons)
9. Yu Yan earns extra money working on weekends. She creates a graph showing the number of hours she works and the amount of money she earns each weekend.
a. Based on the graph, does the amount of money Yu Yan earns appear to be proportional to the number of hours she works? Explain how you know.
b. The next weekend, Yu Yan adds the point (0, 0) to the graph. What does the point (0, 0) mean in this context?
c. How much money does Yu Yan earn if she works only 1 hour? Explain.
10. For every 5 apples that a fruit stand sells, it sells 3 oranges. Use the table to graph the relationship between the number of apples sold x and the number of oranges sold y. Plot the points, title the graph, and label the axes.
Number of Apples Sold, x Number of Oranges Sold, y
Student Edition: Grade 7, Module 1, Topic B
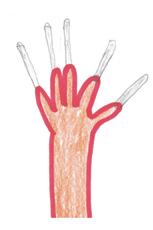
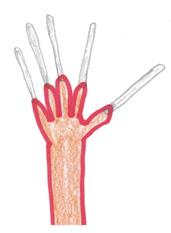
The Glory of Fingernails
My word! Those must have taken you *forever* to grow! Don’t be silly. Two decades, tops.
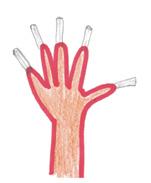
I’m sorry to say, but you are a rather boring mammal. You have no claws. You have no horns. In fact, you have only one truly exciting feature: a body part that peels stickers, scratches itches, looks pretty when painted, and grows at a rate of 3 millimeters per month.
Your fingernails.
This rate—3 millimeters per month—establishes an unlikely connection, a proportional relationship, between two very different things. First, the passage of time; second, the length of those horn-like claw substitutes on your fingertips.
Time and fingernails. Fingernails and time.
1 year
2 years
3 years
The longest fingernails ever recorded were roughly 2 feet long. How much time did they take to grow? According to our rate, it was around 200 months, or almost 17 years.
But let’s go further. What if we spent the whole human life span (80 years, give or take) growing a single set of fingernails? According to our rate, they’d be about 2.9 meters long, or over 9 feet. That’s almost the height of a basketball hoop.
And what if an immortal being wanted to grow fingernails that stretched from, say, Las Vegas to Chicago (about 1,500 miles)? Well, according to our rate, that would take around 67 million years. So, if you’d started when the dinosaurs died out, you’d be just finishing up.
1. When you model situations using a proportional relationship, what assumptions do you make?
2. How is the situation modeled in class different from a proportional relationship?
3. Which other questions did you want explored in class? What information would we need to solve them? What assumptions, if any, would we need to make? Predict the answers to your questions.
Remember
For problems 4–6, multiply.
7. Kabir earned money for every mile he walked in a Walk-a-Thon. The graph shows the relationship between the number of miles Kabir walked and the amount of money he earned in dollars.
a. Based on the graph, does the amount of money Kabir earned in dollars appear to be proportional to the number of miles he walked? Explain how you know.
b. Kabir adds the point (0, 0) to the graph. What does the point (0, 0) mean in this context?
c. How much money does Kabir earn if he walks only one mile? Explain how you know.
8. Logan is training for the track team. He runs 500 meters 4 times every day.
a. At this rate, how many meters will Logan have run in a week?
b. Logan continues to train at the same rate every day until he has run a total of 70 kilometers. How many days does he train?
Relating Representations of Proportional Relationships
1. Consider the table shown.
a. Write a situation that shows this relationship.
b. What is the constant of proportionality? What does it mean in the situation described in part (a)?
c. Write an equation that represents the situation in part (a). Define your variables.
d. Graph this relationship. Label the axes.
Where Is the Constant of Proportionality?
2. Look back at the work from problem 1. In part (b), you calculated the constant of proportionality. Highlight the constant of proportionality in the table, in the situation, in the equation, and in the graph.
Other Representations
3. Henry purchases 0.6 pounds of almonds for $5.25. The cost of almonds is proportional to the weight of the almonds.
a. Complete the table for this relationship. Enter values for the pounds of almonds p, and then determine the corresponding values for the total cost c in dollars. Calculate and highlight the constant of proportionality.
b. What is the constant of proportionality for this relationship? What does it mean in this situation?
c. Write an equation for this relationship. Highlight the constant of proportionality.
d. Graph this relationship, and label the axes. Highlight the constant of proportionality.
Relating Representations of Proportional Relationships
In this lesson, we
• related one representation of a proportional relationship to other representations.
• determined the constant of proportionality and used it to represent a proportional relationship in a different form.
Example
Use information from the graph to complete the following tasks.
a. Complete the table.
Since the graph is a line going through the origin, this is a proportional relationship. This helps determine the y-value when the x-value is 1. The line goes through (2, 90), so the line will also go through (1, 45).
b. Write a situation that shows this relationship. Noor saves $45 every month.
Many situations could show this relationship. Each correct situation will use the following form: 45 of one unit for every 1 of another unit.
c. Determine the constant of proportionality.
d. Write an equation relating x and y. y = 45x
For proportional relationships, the equation is written in the form y = kx, where k is the constant of proportionality.
1. Shawn charges $15 for each lawn he mows. Is this a proportional relationship? If so, determine the constant of proportionality.
2. Given the table, determine whether the amount of money earned is proportional to the number of hours worked. If so, calculate the constant of proportionality and explain what it means in this situation.
3. Use the graph to answer parts (a)–(d).
a. Complete the table.
b. Write an equation relating x and y.
c. Determine the constant of proportionality.
d. Write a situation that describes this relationship.
4. A proportional relationship has a constant of proportionality of 3.25.
a. Write a situation with a constant of proportionality of 3.25.
b. Write an equation that represents the situation in part (a). Define your variables.
c. Complete the table by using values from your situation.
d. Graph the data from part (c). Draw the line that contains the data points.
5. Which representations have a constant of proportionality of 5? Choose all that apply.
= 5x + 2
D. In 1 minute, Rohan can fold 5 shirts.
G. y = 5x
H. A single batch of enchiladas requires 5 pounds of chicken.
Remember
For problems 6–9, add or subtract. Write your answer in the same form as the problem.
6. One third plus one third 7. 1 fifth plus 2 fifths
8. Four ninths minus two ninths 9. 7 tenths minus 4 tenths
10. Which of the graphs appear to represent proportional relationships? Choose all that apply.
11. A 3-pound bag of apples costs $3.75. A 5-pound bag of apples costs $6.50. When the rate is expressed in dollars per pound, what is the unit rate associated with each bag of apples?
1. Do you think this graph belongs in group A or group B? Why?
2. Do you think this graph belongs in group A or group B? Why?
Eating Habits of Pandas
3. This graph shows the eating habits of a giant panda at a zoo.
a. What does the point (4,120) represent in this situation?
b. How many pounds of bamboo does the panda eat in 1 day?
c. Graph a line representing a proportional relationship that shows an amount a panda eats that is more than the amount that the original panda eats. Label the line ��. Determine the constant of proportionality of the relationship you graph.
Number of Days
d. Graph a line representing a proportional relationship that shows an amount a panda eats that is less than the amount that the original panda eats. Label the line ��. Determine the constant of proportionality of the relationship you graph.
Number of Days
e. Graph a line representing a proportional relationship that shows an amount a panda eats that is the same as the amount that the original panda eats. Label the line ℯ. Determine the constant of proportionality of the relationship you graph.
Number of Days
Creating and Using the Unit Rate Triangle
4. Consider the examples shown of triangles that are unit rate triangles and triangles that are not unit rate triangles. What do the unit rate triangles have in common?
5. Is this triangle a unit rate triangle? How do you know?
6. Draw a unit rate triangle on the graph that represents a panda that eats 40 pounds of bamboo per day.
7. A new panda at the zoo eats 137 pounds of bamboo in 5 days.
a. If the new panda eats a constant amount of bamboo each day, how many pounds of bamboo does it eat in 1 day?
b. The graph represents how many pounds of bamboo the new panda eats. Draw the unit rate triangle.
c. Complete the table.
d. On the table, show where the additive properties of the unit rate triangle appear.
e. Write an equation relating the number of days x to the number of pounds of bamboo eaten y for the new panda.
f. Write an equation relating the number of days x to the number of pounds of bamboo eaten y for the new panda if the panda grows and eats more than 27.4 pounds of bamboo per day.
8. The tables show the number of pounds of apples and the number of pounds of yams a giraffe at the zoo eats for different numbers of days.
a. Write an equation relating the number of pounds of apples eaten y to the number of days x.
b. Write an equation relating the number of pounds of yams eaten y to the number of days x.
c. Does the giraffe eat more pounds of apples per day or more pounds of yams per day? How do you know?
The graphs of several proportional relationships are shown. Each line shows the distance in miles that an object moved based on the number of hours it was in motion.
Time in Motion (hours)
a. From the graph, identify each relationship that has a unit rate greater than 1. Use characteristics of the lines to justify your answer.
b. Which point on line ℓ has a y-coordinate equal to the unit rate? What does the unit rate mean in this situation?
1. Relationship A has a constant of proportionality of 43 4 . Relationship B has a constant of proportionality of 3. When graphed, which relationship is represented by a steeper line? Explain your reasoning.
2. Write an equation that, if graphed, would be less steep than the graph of y = 7x. Explain your reasoning.
3. Line a shows how many coins machine A sorts per second. Line b shows how many coins machine B sorts per second.
(seconds)
a. How do you know that these lines represent proportional relationships?
b. Write an equation relating the number of seconds t to the number of coins sorted c for machine A.
c. Write an equation relating the number of seconds t to the number of coins sorted c for machine B.
d. Which machine sorts coins faster? How do you know?
4. Abdul’s pay is proportional to the number of hours he works. Eve’s pay is proportional to the number of hours she works.
a. Write an equation relating Abdul’s pay p in dollars to the number of hours he works t.
b. Write an equation relating Eve’s pay p in dollars to the number of hours she works t
c. Who makes more money per hour? How do you know?
5. The graph and table represent the same proportional relationship.
a. On the graph, draw the unit rate triangle.
b. On the table, show where the additive properties of the unit rate triangle appear.
For problems 6–9, add or subtract.
10. Determine whether each situation represents a relationship that is proportional or not proportional. Explain how you know.
Situation 1:
Carrots cost $1.29 per pound.
Situation 2:
At the bowling alley, it costs $3.00 to rent bowling shoes and $4.00 for each game played.
Situation 3:
Kabir works at an ice cream shop and earns $9.50 an hour.
11. Use the diagram to match each ratio description to its ratio.
ratio of the number of circles to the number of stars
ratio of the number of squares to the total number of shapes
The ratio of the number of triangles to the number of circles
The ratio of the total number of shapes to the number of circles
1. The table shows how much time Lily worked and how much she earned during her last three shifts at the Taco Truck.
Time Worked (hours)
Earnings (dollars)
649.20 432.80
7.561.50
a. Are Lily’s earnings proportional to the number of hours she works? Explain your thinking.
b. Write an equation relating Lily’s earnings e in dollars to the number of hours that she works h.
c. Lily earns $45.10. How many hours does she work to earn that amount?
d. What are the coordinates of the vertices for the unit rate triangle for this relationship? Explain your reasoning.
e. Write an equation that produces a steeper graph than the graph of the equation you found in part (b). Use the same variables as in part (b). How does your new equation relate to the situation?
Dollars to British Pounds
2. Four friends are planning to travel to the United Kingdom. They want to exchange some of their US dollars for British pounds. The graph shows their exchanges.
a. What does the point (375,285) mean in this situation?
b. Is the value of British pounds proportional to the value of US dollars? Explain your thinking.
c. Write an equation to describe the number of British pounds p that someone receives when they exchange any number of US dollars d.
d. You are planning to travel to the United Kingdom and want to have 380 British pounds to pay for food and transportation during your trip. How many US dollars do you need to exchange? Show work to justify your answer.
e. Your friend exchanges 300 US dollars. How many British pounds does she receive in return?
Recycling
3. A recycling company pays $0.35 per pound of empty aluminum cans. This is a proportional relationship.
a. What two quantities are proportional? Define variables for each quantity and write an equation to represent the relationship.
b. You have 9.4 pounds of empty aluminum cans to recycle. How much money will you receive?
c. You have a receipt for $5.81 from the recycling company. How many pounds of empty aluminum cans did you recycle?
d. The average empty aluminum can weighs about 15 grams. There are approximately 453.6 grams in a pound. How many empty aluminum cans do you need to recycle to earn $7.00?
Jonas knows that 1 inch is equivalent to 2.54 centimeters. Let x represent the number of inches in a measured distance. Let y represent the number of centimeters in the same measured distance.
a. Write an equation that Jonas might use to convert between inches and centimeters.
b. Use the equation you created in part (a) to convert 11 inches to centimeters.
c. Use the equation you created in part (a) to convert 33 centimeters to inches. Round to the nearest inch. EXIT TICKET
1. Use the following table to answer parts (a)–(d).
a. Are Shawn’s earnings proportional to the number of hours he works? Explain your reasoning.
b. Write an equation relating Shawn’s earnings e in dollars to the number of hours t he works.
c. Shawn earns $62.50. How many hours does he work?
d. Suppose Shawn works 17 hours next week. How much will he earn?
2. Yu Yan can drive an average of 23 miles for each gallon of gas that her car uses.
a. Write an equation relating the number of miles driven m to the number of gallons of gas used g.
b. Yu Yan plans to drive 391 miles. How many gallons of gas does she need?
c. Yu Yan has 12 gallons of gas in her car. How far can she drive?
3. The graph shows conversions between the number of pints and the number of fluid ounces.
a. Are the number of pints and the number of fluid ounces proportional?
b. Write an equation relating the number of fluid ounces z to the number of pints p
c. A recipe requires 11 pints of water. How many fluid ounces of water are in 11 pints of water?
d. An average ice cube contains 1 fluid ounce of water. Shawn puts 64 ice cubes into an empty pitcher. When the ice cubes melt, approximately how many pints of water are in the pitcher?
Remember
For problems 4–7, add.
8. Which of the following situations represent proportional relationships? Choose all that apply.
G. The cost of each banana is $0.25
Jonas has $15 in a savings account. He adds $3 to the account every week.
C.
9. A grade 7 student does jumping jacks at a constant rate. If the student does 40 jumping jacks in one minute, how many jumping jacks does the student do in 15 seconds?
A quantity and its quarter added becomes 15. What is the quantity?
Shawn’s Speed Problem
1. Shawn and his family are on a road trip. They drive at an average speed of 70 miles per hour on the highway. Use a double number line to show how many miles Shawn’s family drives during times ranging from 0 to 10 hours.
Number of Miles
Number of Hours
2. For parts (a)–(c), use the double number line to determine the distance that Shawn’s family drives during the given amounts of time.
a. Shawn’s family drives for 8.5 hours.
b. Shawn’s family drives for 30 minutes.
c. Shawn’s family drives for t hours.
3. Write an equation relating the amount of time t in hours that Shawn’s family drives to the total distance d that they drive in miles.
4. Identify the constant of proportionality and explain what it represents in the situation.
Patterns in Equations That Represent Rates
5. A hose completely fills a 15-gallon container with water in 1.5 minutes.
a. What is the unit rate, and what does it mean in this situation?
b. Write an equation to represent this situation. Define the variables in your equation.
c. How long does it take for the same hose to fill a 2,000-gallon pool?
6. You count 20 heartbeats in 15 seconds.
a. What is the unit rate, and what does it mean in this situation?
b. Write an equation to represent this situation. Define the variables in your equation.
c. At this rate, how many times does your heart beat in a minute?
7. You pay $1.80 for 12 pencils.
a. What is the unit rate, and what does it mean in this situation?
b. Write an equation to represent this situation. Define the variables in your equation.
Nora and Shawn earn money for charity in a bike-a-thon.
a. Nora earns a constant amount of money for each mile she rides. She rides 14 miles and earns a total of $235.90. How much money does Nora earn for each mile she rides?
b. Shawn earns $13.25 for each mile he rides. Shawn earns a total of $251.75. How many miles does Shawn ride?
• represented rate problems with double number lines, graphs, and equations.
• observed that situations with constant rates represent proportional relationships.
• calculated familiar unit rates such as speed, gas mileage, and heart rate and used them to solve for unknown values.
• observed patterns in how rates are used to write equations.
Example
A local mini-triathlon is a race involving three parts: a 0.25-mile swim, a 6.2-mile bike ride, and a 1.5-mile run.
a. Eve completes the swim portion of the mini-triathlon in 10 minutes. What is her average swimming speed in miles per minute?
025 10 = 0.025
Eve swims at an average speed of 0.025 miles per minute.
Average speed is a rate. Find the rate by dividing the distance Eve swims, 0.25 miles, by the time it takes her to swim, 10 minutes.
b. What is Eve’s average swimming speed in miles per hour? 1hour60minutes =
Since there are 60 minutes in 1 hour, 10 minutes is equivalent to 1 6 of an hour.
Pay attention to the units of the rate. To find miles per hour, convert the time in minutes to a fraction of an hour. 10 minutes is 1 6 of an hour because there are 60 minutes in an hour.
c. Write an equation relating the total distance Eve swims d in miles to the number of minutes she swims m
dm = 0.025
Write equations in the form d = rt, where d represents distance, r represents rate, and t represents time. In this case, we use m to represent the amount of time in minutes.
d. Write an equation relating the total distance Eve swims d in miles to the number of hours she swims h.
dh = 1.5
e. Part of the swim portion of the race involves swimming the full length of a pier, which is 0.1 miles long. How many minutes does it take Eve to reach the end of the pier?
It takes Eve 4 minutes to reach the end of the pier.
Substitute 0.1 for d because it is the distance in miles that Eve swims.
1. Yu Yan competes in a sprint triathlon. The race consists of three parts: a 0.5-mile swim, a 12.4-mile bike ride, and a 3.1-mile run.
a. Yu Yan completes the swim portion of the sprint triathlon in 25 minutes. What is her average swimming speed in miles per minute?
b. What is her average swimming speed in miles per hour?
c. Write an equation relating the total distance Yu Yan swims d in miles to the number of minutes she swims m
d. Write an equation relating the total distance Yu Yan swims d in miles to the number of hours she swims h.
e. Part of the swim portion of the race involves swimming the full length of a pier, which is 0.2 miles long. Yu Yan swims at her average speed. How many minutes does it take Yu Yan to reach the end of the pier?
f. Yu Yan completes the bike ride in 48 minutes. What is her average biking speed in miles per hour?
g. Write an equation relating the total distance Yu Yan bikes d to the time in hours she bikes h.
h. Yu Yan’s friends are waiting to cheer for her at a place that is 6.2 miles from the start of the bike race course. Using the equation from part (g), for how many minutes does Yu Yan bike before reaching her friends?
i. Yu Yan finishes the whole sprint triathlon in 1 hour and 38 minutes. Using the information above, find Yu Yan’s average pace in minutes per mile for the run portion of the triathlon. Round your answer to the nearest tenth.
2. A lawn mower uses 0.75 gallons of gasoline in 50 minutes of mowing.
a. How many gallons of gasoline does the lawn mower use in an hour of mowing?
b. Write an equation to relate the number of gallons of gasoline g that the lawn mower uses to the time spent mowing h in hours.
c. Liam estimates that his lawn mower has about 1.25 gallons in the gas tank. How long can he mow before the gas tank is empty? Round your answer to the nearest tenth of an hour.
Remember
For problems 3–6, add or subtract.
7. The graphs of several proportional relationships are shown. Each line shows the distance in miles that an object moves based on the number of hours it is in motion.
Number of Hours
a. Using the graph, identify each relationship that has a unit rate less than 1. Discuss steepness of the lines in your response.
b. Identify the point on the graph that best demonstrates the unit rate of the relationship represented by line ��. What does the unit rate mean in this context?
8. Consider the given rectangle. 1inc3hes 4 312inches
1. Maya creates a comic strip about a superhero. The superhero is drawn in different sizes and poses in different frames of the comic strip. However, Maya wants the ratio of the length of the head (from the chin to the top of the hair) to the length of the body (from the toes to the bottom of the head) to be constant in every frame.
a. Complete the table. Find the unknown lengths by determining the value of the ratio from the bottom row and applying it to the other two rows.
Head Length, h (centimeters) Body Length, b (centimeters) Total Length, t (centimeters)
b. What is the value of the ratio of the length of the superhero’s head to the length of the body, and what does it mean?
c. What is the value of the ratio of the length of the superhero’s body to the total length?
d. What is the value of the ratio of the length of the superhero’s head to the total length?
e. Using the values of the ratios that you identified, write equations for at least three different proportional relationships in this situation. Use the variables shown in the table.
Lily’s Special Lemonade
2. Lily makes a drink by mixing lemonade and iced tea. She uses 11 2 cups of lemonade for every 4 cups of iced tea.
a. Complete the table. Lemonade, l (cups)
b. Write an equation to describe the proportional relationship of the total number of cups of the drink to the number of cups of lemonade.
c. Write an equation to describe the proportional relationship of the total number of cups of the drink to the number of cups of iced tea.
So-hee mixes yellow paint and blue paint by volume to make green paint.
a. Complete the table so that each row represents the same ratio of volume of yellow paint to volume of blue paint.
b. Write an equation to describe the proportional relationship between the volume of green paint in fluid ounces and the volume of yellow paint in fluid ounces.
c. Write an equation to describe the proportional relationship between the volume of green paint in fluid ounces and the volume of blue paint in fluid ounces.
• wrote ratios and created tables to represent situations where two parts combined to make a whole.
• observed that part-to-whole situations can be described by proportional relationships.
• identified the value of the ratio of each part to the whole and of each part to the other part.
• used the value of the ratio to solve for unknown parts and wholes.
Example
The table shows the amounts of sugar and flour that are needed to make batches of various sizes for a cookie recipe.
a. Complete the table.
Use the multiplicative relationship between rows to find unknown values. The amount of sugar in the second batch, 11 2 cups, is twice the amount of sugar in the first batch, 3 4 cups.
Amount of Sugar and Flour, t (cups)
Find the total amount by adding the cups of sugar and the cups of flour.
b. What is the constant of proportionality between the number of cups of flour and the number of cups of sugar? What does the constant of proportionality represent?
The constant of proportionality is the value of the ratio between the two items in the recipe. Find the value of the complex fraction by rewriting it as fractions greater than 1 and dividing.
The constant of proportionality is 5 3 . There are 5 3 , or 12 3 , cups of flour for every 1 cup of sugar that is used.
c. Write an equation that relates the number of cups of flour and the number of cups of sugar.
Because the amount of flour is proportional to the amount of sugar, the equation is in the form y = kx. The constant of proportionality, k, represents the number of cups of flour per 1 cup of sugar.
1. The table shows the amounts of peanuts and raisins that are used to make a specific type of snack mix.
a. Complete the table. Raisins, r (cups) Peanuts, p (cups)
b. Write an equation to describe the proportional relationship between the number of cups of peanuts and the number of cups of raisins.
c. Write an equation to describe the proportional relationship between the total amount of snack mix and the number of cups of peanuts.
2. The table shows the amounts of milk and flour that are needed to make a mix for biscuits. Those are the only two ingredients in the mix.
a. Complete the table.
b. Describe two quantities in this situation that are in a proportional relationship.
c. What is the constant of proportionality in the relationship described in part (b), and what does it represent?
d. Write an equation that relates the two quantities.
Remember
For problems 3–6, add or subtract.
7. Sara knows that 1 mile is approximately equivalent to 1.61 kilometers. Let x represent the number of miles between two towns. Let y represent the number of kilometers in the same distance.
a. Write an equation that Sara might use to convert between measurements in miles and in kilometers.
b. Use your equation to convert 15 miles to an equivalent measurement in kilometers.
8. Which of the following figures have an area of 20 square centimeters? Choose all that apply. 5cm 8cm
A restaurant called The Irrational Pie provides the pizza toppings shown in the list.
a. Create a recipe for a small pizza from the list of toppings. Your recipe must
• total exactly 5 cups of toppings,
• include at least 3 different toppings,
• include fractional amounts of at least 2 toppings, and
• include some amount of cheese.
b. A large pizza calls for a total of 8 cups of toppings. Calculate the amount of each topping you need to create a large pizza if the ratios of ingredients remain the same as in the recipe you created for your small pizza.
Pizza Toppings
Artichokes
Green bell peppers
Red bell peppers
Mushrooms
Onions
Olives
Pineapples
Spinach
Basil
Chicken
Anchovies
Cheese
c. A medium pizza calls for a total of 61 2 cups of toppings. Calculate how much of each topping you will need to create a medium pizza if the ratios of ingredients remain the same as in the recipe you created for your small pizza.
d. A customer wants to order a pizza made from the recipe you created for your small pizza, but the customer asks for 41 2 cups of cheese. Determine the amounts of all the other ingredients the customer’s pizza will have if the ratios of ingredients remain the same as in your recipe. What will the total amount of toppings be?
e. You are running out of cheese and only have 1 2 cup left for a pizza. Determine the amounts of all the other ingredients the pizza will have if you keep the ratios of ingredients the same. What will the total amount of toppings be?
• explored part-to-whole ratio relationships that involve more than two parts.
• observed that the relationship of each part to the whole is proportional, as is the relationship between parts.
• chose a model to represent a proportional relationship and solved multi-step ratio problems.
Example
A recipe for one batch of cranberry orange punch calls for the following ingredients: 12 ounces of cranberry juice, 6 ounces of orange juice, and 8 ounces of sparkling water.
a. Complete the table below to represent a regular batch, a double batch, and a half batch of the punch.
To complete the second row, double all the quantities in the recipe. To complete the third row, halve all the quantities.
Cranberry Juice, c (ounces)
Orange Juice, j (ounces)
Sparkling Water, s (ounces)
b. Write equations that relate each of the following:
Ounces of cranberry juice c to ounces of orange juice j:
cj = 2
The amount of cranberry juice is double the amount of orange juice.
Total Amount of Punch, t (ounces)
Use the information from the directions to complete the first row. The total amount of punch is the sum of all the ingredients.
Ounces of sparkling water s to ounces of cranberry juice c: sc = 2 3
Total ounces of punch t to ounces of sparkling water s: ts = 13 4
To find the constant of proportionality, take an amount of sparkling water and divide it by the corresponding amount of cranberry juice.
To find the constant of proportionality, take an amount of punch and divide it by the corresponding amount of sparkling water.
c. You have a 16-ounce can of cranberry juice. If you use all the other ingredients in the same ratios as a regular batch, how many total ounces of punch can you make?
The value of the ratio of total ounces of punch to ounces of cranberry juice is 13 6 , so tc = 13 6
16 represents the number of ounces of cranberry juice, so 16 is substituted into the equation for c.
1. A recipe for one batch of fruit punch calls for the following ingredients: 12 ounces each of frozen lemonade and frozen orange juice, 48 ounces of pineapple juice, and 34 ounces of sparkling water.
a. Complete the table to represent a regular batch, a double batch, and a half batch of the fruit punch.
Frozen Lemonade, l (ounces)
Frozen Orange Juice, j (ounces)
Pineapple Juice, p (ounces)
Sparkling Water, s (ounces)
Total Amount of Fruit Punch, t (ounces)
b. Write an equation that relates the number of ounces of pineapple juice p to the number of ounces of frozen lemonade l
c. Write an equation that relates the number of ounces of sparkling water s to the number of ounces of pineapple juice p.
d. Write an equation that relates the number of ounces of fruit punch t to the number of ounces of sparkling water s.
e. You have a 16-ounce can of pineapple juice. If you use all the other ingredients in the same ratios as in a regular batch, how many total ounces of fruit punch can you make?
2. A lasagna recipe calls for wheat noodles, cheese, and tomato sauce in ratios as shown in the table.
a. Complete the table.
b. Write an equation relating the total cups of lasagna to the cups of wheat noodles.
c. Suppose you use 31 2 cups of cheese to make this recipe and use proportional amounts of the other ingredients. Will the lasagna fit into a pan that holds 12 cups?
Remember
For problems 3–6, add or subtract.
7. Liam sells tickets for the fall musical. The price of a Saturday night ticket is different from the price of a Sunday night ticket.
a. Liam sells 20 Saturday night tickets for a total of $305. What is the price of each Saturday night ticket?
b. The price of each Sunday night ticket is $14.75. How many Sunday night tickets does Liam sell for a total of $309.75?
8. Choose all the true statements about the rectangle’s sides.
A. Side m is parallel to side s.
B. Side x is parallel to side h
C. Side s is parallel to side x.
D. Side s is perpendicular to side h
E. Side h is perpendicular to side x.
Scale Drawings and Proportional Relationships
Student Edition: Grade 7, Module 1, Topic C
Eartha, the World’s Largest Rotating Globe
Whoa. Doesn’t it make you feel small and insignificant? Are you kidding? It makes me feel like a giant the size of California.
Located in the town of Yarmouth, Maine, the world’s largest rotating globe is called Eartha, and it’s 41 feet across. That means 1 inch on the globe corresponds to roughly 16 miles on earth. Visiting Eartha might make you feel very small.
Or, if you prefer, very big.
Got a pebble in your shoe? That’s the size of the asteroid that killed the dinosaurs.
Plant your pinky somewhere on the globe. You just left a fingerprint larger than Manhattan. If you thought Godzilla and King Kong were big, then think again—each of them is no bigger than one of your skin cells.
Oops—did you let a hair follicle tumble from your head down onto Eartha? To the locals, that hair is 200 feet wide and snakes along like a river for dozens or hundreds of miles.
Want to cry a tear of joy? Go for it; just be careful where you let it fall. Here, every teardrop is a Great Salt Lake, like the one in Utah, equivalent to three days’ worth of average rainfall for the nation of India.
Keep going. How big are your footprints and handprints? Is there a lake the right size to be a refreshing drink? Is there an ocean big enough to be your bathtub? How hard (or easy) would it be to climb Mount Everest?
1. When you modeled the bicycle situation by using a proportional relationship, what assumptions did you make?
2. How was the bicycle situation modeled in class different from a proportional relationship?
3. If you had more time to examine another question related to the bicycle video, what question would you consider? What would your plan be to determine the answer?
Remember
add or subtract.
8. The table shows a proportional relationship.
Complete the sentence. Choose all that apply.
The table represents a proportional relationship because
A. each ratio B : A is equivalent.
B. there is a constant unit rate.
C. the difference between A values is constant.
D. the difference between B values is constant.
9. Ethan reads about 180 words per minute. If a book contains about 72,000 words, approximately how many minutes would it take Ethan to read the whole book?
1. Use the two figures of the school building to complete parts (a)–(e).
Original Figure
Scaled
Figure
a. Choose a segment in the original figure. Use a colored pencil to trace the segment in the original figure.
b. Measure the segment in the original figure. Record the length to the nearest tenth of a centimeter in the table.
c. Use the same colored pencil to trace the segment that is in the same location in the scaled figure.
d. Measure the segment in the scaled figure. Record the length to the nearest tenth of a centimeter in the table.
e. Complete the table by repeating parts (a)–(d) for other lengths in the original figure and the scaled figure. Use a different colored pencil for each new pair of segments.
Length in Original Figure (centimeters)
Length in Scaled Figure (centimeters)
2. What is the relationship between the lengths of the segments that are in the same location in the original figure and the scaled figure?
Exploring Scale Drawings—A Reduction
Use the two figures of the bank building to complete parts (a)–(e).
a. Choose a segment in the original figure. Use a colored pencil to trace the segment in the original figure.
b. Measure the segment in the original figure. Record the length to the nearest tenth of a centimeter in the table.
c. Use the same colored pencil to trace the corresponding segment in the scaled figure.
d. Measure the segment in the scaled figure. Record the length to the nearest tenth of a centimeter in the table.
e. Complete the table by repeating parts (a)–(d) for other lengths in the original figure and the scaled figure. Use a different colored pencil for each new pair of segments.
Length in Original Figure (centimeters)
Corresponding Length in Scaled Figure (centimeters)
4. What is the relationship between the lengths of the corresponding segments in the original figure and the scaled figure?
• determined one-to-one correspondence of points in related figures.
• identified whether a scale drawing was an enlargement or a reduction.
• learned that the constant of proportionality that relates corresponding lengths in scale drawings is called a scale factor.
Example
Figure D is a scale drawing of figure C.
C
Terminology
A scale drawing is a copy of a figure with all distances proportional to the corresponding distances in the original figure.
In a scale drawing, the constant of proportionality is called the scale factor
a. Is figure D an enlargement or a reduction of figure C?
Figure D is a reduction of figure C.
Are the corresponding sides of the scale drawing shorter or longer than the sides of the original figure? If the sides of the scale drawing are longer, the scale drawing is considered an enlargement. If the sides of the scale drawing are shorter, the scale drawing is considered a reduction.
Figure
Figure D
b. Which measurement in figure C corresponds with 10 inches in figure D?
20 inches
c. Determine the scale factor that relates figure D to figure C. 1 2
If it would be helpful, consider organizing corresponding sides into a table. Then divide a measurement of the scale drawing by the corresponding measurement of the original figure to find the scale factor. In this example, that quotient is 1 2 .
In the figure shown, △DEF is a scale drawing of △ABC.
The measurements of corresponding side lengths between △ABC and △DEF are displayed in the table.
1. Determine the scale factor that relates △DEF to △ABC.
Let’s Draw!
2. Create a scale drawing of the geometric figure by using a scale factor of 2 3 .
Original Figure (units)
Scale Drawing (units)
Representing Lengths in Tables
3. A scale drawing of the triangle shown must be produced by using a scale factor of 1.5. Determine the corresponding measurements of the scale drawing and record them in the table. All measurements shown are in centimeters.
Figure
Drawing (centimeters)
Henry’s Thinking
4. Henry’s teacher tells him that figure B is a scale drawing of figure A. She asks him what scale factor relates figure B to figure A. He responds that the scale factor is 2. Is Henry correct? Explain.
Lily looks at the scale drawing shown. She notices that the original figure is about half the width and half the height of the scale drawing. For this reason, she says that the scale factor is about 1 2
Do you agree or disagree with Lily? Explain your answer.
1. In the figures shown, △DEF is a scale drawing of △ ABC.
a. Is △DEF an enlargement or a reduction of △ ABC? Explain how you know.
b. Determine the scale factor, and use it to calculate the length of side DE .
Shawn’s Unknown Measurements
2. Shawn created a pentagon and a scale drawing of the pentagon.
a. Write an equation that relates the side lengths of the scale drawing to the side lengths of the original figure. Let y represent a side length of the scale drawing, and let x represent the corresponding side length of the original figure.
b. Complete the table by using the equation from part (a).
More Unknown Side Lengths
Pentagon FGHIJ is a scale drawing of pentagon ABCDE.
a. Use the table to record corresponding side lengths.
Original Figure (units)
Scale Drawing (units)
b. Write an equation that relates the side lengths of the scale drawing to the side lengths of the original figure. Define your variables.
c. Determine the length of side HI .
d. Determine the length of side DE
Original Figure: Measurements Unknown 4. Polygon PQRSTU is a scale drawing of polygon ABCDEF. Determine the length of side AB.
Ethan paints pictures of two surfboards on the wall of a building. He paints a small surfboard as a scale drawing of a large surfboard, using a scale factor of 1 16 . The small surfboard has a length of 61 8 inches.
• used scale factors to develop equations that relate scale drawings to their original figures.
• determined unknown side lengths of scale drawings.
• determined unknown side lengths of original figures.
• noticed that the scale factor relating a scale drawing to its original figure is the reciprocal of the scale factor that relates its original figure to the scale drawing.
Example
Figure 2 is a scale drawing of figure 1.
2
a. Determine the scale factor.
The scale factor is 1.5.
b. Write an equation that relates the scale drawing to the original figure. Let s represent a side length of the scale drawing, and let r represent the corresponding side length of the original figure.
s = 1.5r
Any pair of corresponding side lengths can be used to determine the scale factor. In this example, 4.5 and 3 are used, but 6 and 4 could also be used because 6 4 15 = . .
When developing the equation, recall that the scale factor is multiplied by the side length r in the original figure. The product is the length s of the corresponding side of the scale drawing.
c. Use the equation to find the unknown side length of the scale drawing that corresponds to the original figure’s side length of 1 unit. sr = = = 15 151 15 .()
The unknown side length of the scale drawing is 1.5 units.
d. Use the equation to find the unknown side length of the original figure that corresponds to the scale drawing’s side length of 3 units.
The unknown side length of the original figure is 2 units.
a. Is scale drawing A an enlargement or a reduction of the original figure?
b. What is the scale factor that relates scale drawing A to the original figure?
c. Is scale drawing B an enlargement or a reduction of the original figure?
d. What is the scale factor that relates scale drawing B to the original figure?
e. Write an equation that relates the lengths of scale drawing B to the lengths of scale drawing A. Let b represent a length of scale drawing B, and let a represent the corresponding length of scale drawing A.
2. In the following pair of images, △JKL is a scale drawing of △ ABC.
a. Determine the scale factor.
b. Write an equation that relates the scale drawing to the original figure. Let f represent a length of the original figure, and let d represent the corresponding length of the scale drawing.
c. Use the equation to find the length of JL .
3. In the following pair of figures, figure 2 is a scale drawing of figure 1.
Figure 1
Figure 2
a. Determine the scale factor.
b. Write an equation that relates the scale drawing to the original figure. Let a represent a length of the original figure, and let b represent the corresponding length of the scale drawing.
c. Use the equation to find the unknown side length in the scale drawing that corresponds with the side length of 5 units in the original figure.
d. Use the equation to find the unknown side length in the original figure that corresponds with the side length of 0.25 in the scale drawing.
4. Liam creates this scale drawing of a sign that hangs at his school. He uses a scale factor of 1 3 .
a. Write an equation that relates Liam’s scale drawing to the original sign. Let a represent a length of the original sign, and let b represent the corresponding length of Liam’s scale drawing.
b. On the grid, each unit represents 1 centimeter. Use the scale drawing on the grid and the equation from part (a) to find the corresponding lengths h, t, and w of the original sign.
Remember
For problems 5–8, add.
9. Match each graph to a corresponding equation. Write one equation in each box from the given answer choices.
Answer Choices
10. Plot each number and its opposite on the number line provided.
1. Create a scale drawing of the triangle by using the scale factor of 3
Scaling Squares
For problems 2–7, use the provided scale factors to create a scale drawing of each original figure. Then calculate the areas of the original figure and the scale drawing.
8. Write a conjecture, or an educated guess, that describes the relationship between the area of an original figure and the area of a scale drawing.
For problems 9–12, use the conjecture you wrote in problem 8 to find the areas of the following scale drawings without creating them.
13. Do you think your conjecture will be true for scaled figures that are not squares? Explain your thinking.
Scaling a Rectangle
14. Consider the rectangle.
a. What is the area of the rectangle?
b. Suppose the conjecture you generated for squares also works for rectangles. What should the area of a scale drawing be if it is produced with a scale factor of 1 2 ?
c. Create the scale drawing by using a scale factor of 1 2 . Find the area of the scale drawing. Does the area you found confirm that your conjecture works for rectangles?
Returning to the Triangle Problem
15. Consider the triangles from problem 1.
a. Are the areas of the scaled triangles related in the same way as the areas of the scaled squares and rectangles? Explain.
b. Suppose these two triangles had areas of 5 square units and 80 square units. Determine the scale factor that would enlarge the smaller triangle to the larger triangle.
Scale drawings A and B are made from the same original drawing. Scale drawing A is given here. For every 1 inch in scale drawing A, scale drawing B (not shown) shows a length of 12 inches.
Scale Drawing A
Diningroom
a. What scale factor relates scale drawing B to scale drawing A?
b. Describe how the scale factor is used to determine the area of the kitchen in scale drawing B.
c. What is the area of the kitchen in scale drawing B?
• observed patterns in areas of scale drawings of figures including squares, rectangles, and triangles.
• determined that the area of a scale drawing created with a scale factor r is r2 times the area of the original figure.
• used areas of scale drawings to determine the scale factor.
Examples
1. Figure 2 is a scale drawing of figure 1. The area of figure 1 is 9 square units, and the scale factor is 8. What is the area of figure 2? Explain how you know.
Figure 2 Figure 1
When the side lengths are related by a scale factor of r, the areas are related by a factor of r2
Because the scale factor is 8, the areas of the figures are related by a factor of 82, or 64. The area of figure 2 is 576 square units because 9 ⋅ 64 = 576
Determine the factor that relates the areas by squaring the scale factor. Then multiply the area of the original figure by this factor to find the area of the scale drawing.
2. Figure 2 is a scale drawing of figure 1. Figure 1 has an area of 16 square units. Figure 2 has an area of 256 square units. What scale factor relates figure 2 to figure 1? Explain how you know.
Determine the factor that relates their areas.
Since figure 2 is a scale drawing of figure 1, find the factor that relates the areas by finding the value of the ratio:
areaoffigure2
areaoffigure1
The areas of the figures are related by a factor of 16. Their side lengths are related by a scale factor of 4 because 42 = 16.
To find the scale factor, determine what value times itself is equal to 16.
1. In the figures shown, △DEF is a scale drawing of △ ABC. All lengths shown are in centimeters.
a. Determine the scale factor to confirm that △DEF is a scale drawing of △ ABC.
b. Calculate the areas of △ ABC and △DEF.
c. What factor should you apply to the area of △ ABC to find the area of △DEF? How does the area of △DEF compare to the area of △ ABC? How does this relationship compare to the scale factor?
2. Figure 2 is a scale drawing of figure 1. Figure 1 has an area of 6 square units, and figure 2 has an area of 294 square units. What scale factor relates figure 2 to figure 1? Explain how you know.
Figure 1
Figure 2
3. Figure 2 is a scale drawing of figure 1. The area of figure 1 is 15 square units, and the scale factor is 5. What is the area of figure 2? Explain how you know.
Figure 1
Figure 2
4. Figure 2 is a scale drawing of figure 1. Figure 1 has an area of 8 square units, and figure 2 has an area of 200 square units. What scale factor relates figure 2 to figure 1? Explain how you know.
2
1
5. Figure 2 is a scale drawing of figure 1. The area of figure 1 is 20 square units, and the scale factor that relates figure 2 to figure 1 is 3. What is the area of figure 2? Explain how you know.
1
2
Figure
Figure
Figure
Figure
6. Figure 2 is a scale drawing of figure 1. The area of figure 1 is 80 square units, and the scale factor that relates figure 2 to figure 1 is 1 2 . What is the area of figure 2? Explain how you know.
Remember For problems 7–9, add.
Figure 1
Figure 2
10. Ava looks at the scale drawing shown. She notices that the scale drawing is about half the width and half the height of the original figure. For this reason, she says the scale factor is about 1 2
Do you agree or disagree with Ava’s reasoning? Explain your answer.
a. In your own words, describe what the map shows.
b. Is the restaurant or the coffee shop closer to the house? How do you know?
c. Can you determine the distance from the house to the coffee shop from the information provided in the map?
Which Scale?
2. Consider the following figures, which all depict the word scale. Which one best relates to the work of the module? Why? What does the figure show?
Representation of Scale
A.
B.
Representation of Scale
C.
D.
Representation of Scale
1cm
1centimeterrepresents100miles
Creating an Appropriate Scale
3. For this map, the scale factor is 63,360.
a. What is the actual distance in inches that corresponds with a distance of 1 inch on the map?
b. What is the actual distance in inches that corresponds with a distance of 2.5 inches on the map?
c. What unit of measure might be more appropriate than inches to represent the actual distances? Determine a scale using this unit of measure.
d. The distance between the hospital and the parking garage on the city map is 3 inches. Use your scale to find the actual distance.
Identifying Scale
4. Consider the scale for the map of Hawaii. Explain what the scale means in context. Your answer should include what 1 inch on the map represents in terms of actual distance. 0
Creating a Billboard
5. A developer advertises a new housing development. She wants to enlarge this floor plan to fit on a billboard. The billboard is 18 feet tall and 48 feet long. Using your knowledge of scale and scale factor, provide directions about how to enlarge the floor plan. Your final response should address design features such as the total area of the enlarged floor plan and the space needed for other information on the billboard.
On a map of a state park, 1 inch represents 2,000 feet. Thomas Peak and Simmons Peak are 81 4 inches apart on the map. What is the actual distance in miles between Thomas Peak and Simmons Peak? (1 mile = 5,280 feet)
• created a more appropriate scale to represent a scale drawing.
• interpreted the meaning of a scale in context.
• used a scale to find unknown measurements.
• developed a scale to complete a modeling activity.
Examples
1. Consider the given scale.
a. What is the actual distance that corresponds to a distance of 1 inch on the map?
Terminology
The scale shows the relationship between the distances in a scale drawing and the distances in the original setting. A scale also gives the flexibility to use different units of measure. This scale is like a double number line. This means that 1 4 inch on the map represents 8 miles of actual distance.
is also accurate to use 1
inch and 16 miles from the scale.
actual distance is 32 miles.
b. What is the actual distance that corresponds to a distance of 5 4 inches on the map?
The actual distance is 40 miles.
Since 1 inch represents 32 miles, other unknown distances can be found by using this scale.
For problems 2 and 3, determine the scale factor that corresponds to the scale.
2. 1 foot represents 20 miles.
20(5,280) = 105,600
The scale factor is 105,600.
This scale factor means that 1 foot in the scale drawing represents 105,600 actual feet.
3. 1 centimeter represents 8 meters.
8(100) = 800
The scale factor is 800.
To find the scale factor, compare values with the same unit of measure.
To determine the number of feet in 20 miles, multiply the number of miles, 20, by the number of feet in 1 mile, 5,280.
centimeters = 1 meter 1. For this map, the scale factor is 126,720.
a. What is the actual distance in inches that corresponds to a distance of 1 inch on the map?
b. What unit of measure might be more appropriate than inches to represent the actual distances? Determine a scale by using this unit of measure.
c. On the map, the distance between the hospital and the gas station is 4 inches. Use the scale you determined in part (b) to find the actual distance.
2. A developer wants to reduce this floor plan drawing so that it will fit on a brochure with other designs. The developer creates a scale in which 1 inch in the original floor plan drawing represents 0.5 inches in the reduced floor plan drawing.
a. What are the lengths in the reduced floor plan drawing?
b. What scale factor reduces the original floor plan drawing to the reduced floor plan drawing?
Bedroom1 Bedroom2
3. Consider the scale on the map of Italy.
ROME ADRIATIC SEA
ITALY
a. What is the actual distance that corresponds to a distance of 1 centimeter on the map?
b. What is the actual distance that corresponds to a distance of 1.5 centimeters on the map?
For problems 4–6, determine the scale factor that corresponds to each scale.
4. 1 inch represents 10 feet.
5. 1 millimeter represents 4 meters.
6. 1 foot represents 10 miles.
Remember
For problems 7–9, add.
7.
10. Does figure B appear to be a scale drawing of figure A? Explain your thinking.
1. Construct a scale drawing of figure 1 by using the first scale factor and label it Figure 2. Then construct a scale drawing of figure 2 by using the second scale factor and label it Figure 3.
a. First scale factor: 1 3 ; second scale factor: 4
b. First scale factor: 1 2 ; second scale factor: 2
c. First scale factor: 3; second scale factor: 2
Figure 1
d. First scale factor: 1 3 ; second scale factor:
Figure 1
e. First scale factor: 4; second scale factor: 1 3
2. For your assigned problem, compare the original figure (figure 1) to the second scale drawing (figure 3). Does the second scale drawing appear to be a scale drawing of the original figure? Justify your thinking. If so, what scale factor relates the two figures?
3. With your group, predict the scale factor that takes figure 1 to figure 3 for each of the remaining parts of problem 1. Then complete each scale drawing by using the assigned scale factors to check the accuracy of your prediction. Be prepared to share how your group made predictions about the scale factor that takes figure 1 to figure 3.
Relating Scale Drawings
4. Figure 2 is a reduction of figure 1 and was produced by using a scale factor of 3 4 .
Figure 3 is a reduction of figure 2 and was produced by using a scale factor of 1 2
1
a. Is figure 3 a scale drawing of figure 1?
b. What scale factor reduces figure 1 to figure 3?
c. Write an equation that represents the relationship between the side lengths of figure 3 and figure 1. Let y represent a side length of figure 3, and let x represent the corresponding side length of figure 1.
Figure
Figure 2
Figure 3
d. The figures shown are regular pentagons, meaning that each pentagon has five sides that are the same length. If a side length of figure 1 is 40 units, what is the length of the corresponding side of figure 3?
Figure 2 is an enlargement of figure 1 and is produced with a scale factor of 1.2. Figure 3 is a reduction of figure 2 and is produced with a scale factor of 0.4.
2
1
a. Is figure 3 a scale drawing of figure 1?
b. What scale factor reduces figure 1 to figure 3?
3
c. Write an equation that represents the relationship between the side lengths of figure 3 and figure 1. Let y represent a side length of figure 3, and let x represent the corresponding side length of figure 1.
• created a scale drawing of a figure that was already a scale drawing.
RECAP
• determined that the scale factor that relates the original figure to the second scale drawing is found by multiplying the scale factors.
• wrote equations to represent the relationship between the side lengths of an original figure and the side lengths of a second scale drawing.
• used equations to find unknown side lengths.
Example
Figure 2 is a reduction of figure 1 and is produced with a scale factor of 1 2 . Figure 3 is a reduction of figure 2 and is produced with a scale factor of 1 3 .
a. Is figure 3 a scale drawing of figure 1?
Yes. Figure 3 is a scale drawing of figure 1 since they are both proportional to figure 2.
Figure 1
Figure 3
Figure 2
b. What scale factor reduces figure 1 to figure 3? 1 2 1 3 1 6
The scale factor that reduces figure 1 to figure 3 is 1 6 .
c. What scale factor enlarges figure 3 to figure 1?
The combined scale factor that takes the original figure to the second scale drawing is found by multiplying the two scale factors.
The scale factor that enlarges figure 3 to figure 1 is 6.
d. Write an equation that could be used to find any length in figure 3, given a corresponding length in figure 1. Let y represent a side length of figure 3, and let x represent the corresponding side length of figure 1.
yx = 1 6
e. Suppose a side length in figure 1 is 9 units. What is the length of the corresponding side in figure 3?
The scale factor that enlarges figure 3 to figure 1 is the reciprocal of the scale factor that reduces figure 1 to figure 3. Since scale drawings are examples of proportional relationships, write equations in the same form, y = kx, where the scale factor is the constant of proportionality k
The corresponding side length in figure 3 is 3 2 units.
To find the length of the side in figure 3, evaluate the equation when x = 9
1. Quadrilateral EFGH is a scale drawing of an original figure. The scale factor between the original figure and the scale drawing is 2 3 .
a. Create a scale drawing of quadrilateral EFGH by using a scale factor of 1 2 . Label this drawing quadrilateral WXYZ.
b. Draw the original figure. Label the resulting quadrilateral ABCD.
c. What is the scale factor between the original figure, quadrilateral ABCD, and the quadrilateral WXYZ?
2. Figure 2 is a reduction of figure 1 and is produced with a scale factor of 1 4 . Figure 3 is a reduction of figure 2 and is produced with a scale factor of 1 5 .
3
2
1
a. Is figure 3 a scale drawing of figure 1?
b. What scale factor reduces figure 1 to figure 3?
c. What scale factor enlarges figure 3 to figure 1?
Figure
Figure
Figure
d. Write an equation that could be used to find any side length of figure 3, given a corresponding side length of figure 1. Let y represent a side length of figure 3, and let x represent the corresponding side length of figure 1.
e. If the length of a side of figure 1 is 8 units, what is the length of the corresponding side of figure 3?
3. Figure 2 is a scale drawing of figure 1 and is produced with a scale factor of 1.7. Figure 3 is a scale drawing of figure 2 and is produced with a scale factor of 0.6
a. What scale factor is used to relate the side lengths of figure 1 to the side lengths of figure 3?
b. Is figure 3 an enlargement or a reduction of figure 1?
Figure 1
Figure 2
Figure 3
4. Consider figure 1.
1
a. Create a scale drawing of figure 1 by using a scale factor of 1.5. Label it Figure 2.
b. Create a scale drawing of figure 1 by using a scale factor of 0.5. Label it Figure 3.
c. What scale factor reduces figure 2 to figure 3?
d. Find the area of figure 2.
e. Use the scale factor you generated in part (c) to find the area of figure 3.
Remember
For problems 5–8, subtract.
9. Dylan makes a model skyscraper by using a scale in which 1 inch represents 65 feet. What is the height of the actual skyscraper if the height of the model is 171 2 inches?
10. Estimate the sum. Then use the standard algorithm to find the sum. 8.39 + 6.4 + 5.74
Student Edition: Grade 7, Module 1, Mixed Practice 1
Mixed Practice 1
Name Date
For problems 1–3, determine the unit rate for the situation.
1. A car travels 105 miles in 3 hours. What is the unit rate associated with the rate of miles per hour?
2. Maya buys 6 limes for $1.50. What is the unit rate associated with the rate of dollars per lime?
3. Pedro receives 10 text messages in 21 2 hours. What is the unit rate associated with the rate of text messages per hour?
4. Liam makes green paint by mixing 3 gallons of yellow paint with 2 gallons of blue paint. He likes the shade of green paint he makes and wants to make more in the same ratio. Complete the table to show the relationship between the number of gallons of yellow paint and the number of gallons of blue paint.
5. Ethan drives 150 miles in 3 hours. If he continues to drive at a constant rate, how many hours will it take Ethan to drive 600 miles?
6. Mrs. Kondo makes bags of school supplies for her students. Mrs. Kondo has 36 pencils and 48 erasers, and she wants to place all of them in the bags.
a. What is the greatest number of bags Mrs. Kondo can make with each bag containing the same number of pencils and the same number of erasers?
b. How many pencils and erasers will be in each bag?
7. Consider the given equation.
a. Fill in the boxes to make a true number sentence.
b. Find the sum of 4 5 and 3 10 . Choose all that apply.
7 10
11 5
8. Find the product.
9. Use the standard algorithm to find the sum.
For problems 10–12, write the given division expression as an equivalent expression with a whole-number divisor.
10. 575.186 ÷ 5.8
12. 532.1 ÷ 0.56
13. Order the values from least to greatest.
11. 857.22 ÷ 47.1
Student Edition: Grade 7, Module 1, Mixed Practice 2
Mixed Practice 2
1. Evaluate (2.1)3
A. 4.41
B. 6.3
C. 8.001
D. 9.261
Name Date
2. Which expressions represent twice the product of 3 and g? Choose all that apply.
A. 2 + 3 + g
B. (3g) ⋅ 2
C. 2(3 + g)
D. 2 + 3g
E. 2(3g)
3. Evaluate 4x3 + 6 − 16 when x = 2.
4. The measurements of a rectangular floor are shown in the figure.
a. Find the area of the floor.
b. Find the perimeter of the floor.
5. Find the area of the triangle.
6. Two vertices of a rectangle are located at (−2, −9) and (3, −9). The area of the rectangle is 100 square units. Name one set of possible coordinates for the other two vertices. Use the coordinate plane as needed.
7. Use the figure shown to complete parts (a)–(f).
a. Name a line.
c. Name a line segment.
e. Name an obtuse angle.
b. Name a ray.
d. Name an acute angle.
f. Name a pair of parallel line segments.
For problems 8–10, determine whether the data distribution is approximately symmetric or skewed. Describe the shape of the data distribution.
Points Scored in Each Game
Number of Points
Student Edition: Grade 7, Module 1, Topic A, Lesson 4
Great Minds® has made every effort to obtain permission for the reprinting of all copyrighted material. If any owner of copyrighted material is not acknowledged herein, please contact Great Minds for proper acknowledgment in all future editions and reprints of this module.
Tiah Alphonso, Christopher Barbee, Erik Brandon, Joseph Phillip Brennan, Beth Brown, Leah Childers, Mary Christensen-Cooper, Cheri DeBusk, Jill Diniz, Dane Ehlert, Scott Farrar, Kelli Ferko, Levi Fletcher, Anita Geevarghese, David Gertler, Krysta Gibbs, Winnie Gilbert, Julie Grove, Marvin E. Harrell, Robert Hollister, Rachel Hylton, Travis Jones, David Kantor Choukalas, Emily Koesters, Liz Krisher, Connie Laughlin, Alonso Llerena, Sarah Maile, Gabrielle Mathiesen, Maureen McNamara Jones, Melissa Mink, Richard Monke, Dave Morris, Bruce Myers, Marya Myers, Kati O’Neill, Ben Orlin, Darion Pack, Brian Petras, April Picard, Lora Podgorny, Ben Polovick, Amy Rome, Bonnie Sanders, Aly Schooley, Andrew Senkowski, Erika Silva, Jessica Sims, Ashley Spencer, Danielle Stantoznik, Tara Stewart, Heidi Strate, James Tanton, Cody Waters, Valerie Weage
Trevor Barnes, Brianna Bemel, Adam Cardais, Christina Cooper, Natasha Curtis, Jessica Dahl, Brandon Dawley, Delsena Draper, Sandy Engelman, Tamara Estrada, Soudea Forbes, Jen Forbus, Reba Frederics, Liz Gabbard, Diana Ghazzawi, Lisa Giddens-White, Laurie Gonsoulin, Nathan Hall, Cassie Hart, Marcela Hernandez, Rachel Hirsh, Abbi Hoerst, Libby Howard, Amy Kanjuka, Ashley Kelley, Lisa King, Sarah Kopec, Drew Krepp, Crystal Love, Maya Márquez, Siena Mazero, Cindy Medici, Patricia Mickelberry, Ivonne Mercado, Sandra Mercado, Brian Methe, Mary-Lise Nazaire, Corinne Newbegin, Max Oosterbaan, Tamara Otto, Christine Palmtag, Andy Peterson, Lizette Porras, Karen Rollhauser, Neela Roy, Gina Schenck, Amy Schoon, Aaron Shields, Leigh Sterten, Mary Sudul, Lisa Sweeney, Samuel Weyand, Dave White, Charmaine Whitman, Nicole Williams, Glenda Wisenburn-Burke, Howard Yaffe
Student Edition: Grade 7, Module 1, Talking Tool
Talking Tool
Share Your Thinking
I know . . . .
I did it this way because . . . .
The answer is because . . . .
My drawing shows . . . .
Agree or Disagree
I agree because . . . . That is true because . . . . I disagree because . . . . That is not true because . . . .
Do you agree or disagree with ? Why?
Ask for Reasoning
Why did you . . . ?
Can you explain . . . ?
What can we do first?
How is related to ?
Say It Again
I heard you say . . . . said . . . .
Another way to say that is . . . . What does that mean?
Student Edition: Grade 7, Module 1, Thinking Tool
Thinking Tool
When I solve a problem or work on a task, I ask myself
Before
Have I done something like this before?
What strategy will I use?
Do I need any tools?
During Is my strategy working?
Should I try something else?
Does this make sense?
After
What worked well?
What will I do differently next time?
At the end of each class, I ask myself
What did I learn?
What do I have a question about?
MATH IS EVERYWHERE
Do you want to compare how fast you and your friends can run?
Or estimate how many bees are in a hive?
Or calculate your batting average?
Math lies behind so many of life’s wonders, puzzles, and plans.
From ancient times to today, we have used math to construct pyramids, sail the seas, build skyscrapers—and even send spacecraft to Mars.
Fueled by your curiosity to understand the world, math will propel you down any path you choose.
Ready to get started?
Module 1
Ratios and Proportional Relationships
Module 2
Operations with Rational Numbers
Module 3
Expressions, Equations, and Inequalities
Module 4
Geometry
Module 5
Percent and Applications of Percent
Module 6
Probability and Populations
What does this object have to do with math?
The ancient Egyptian game Hounds and Jackals, similar to the modern CHUTES AND LADDERS, is a game of chance in which the players race across the board by rolling “knucklebones” (like dice). When chance is described in mathematics, it is called probability, and it is measured with ratios to show how likely or unlikely an outcome might be. What is the probability of the hounds conquering the jackals?
On the cover
Game of Hounds and Jackals, ca. 1814–1805 BCE Egyptian Ebony, ivory
The Metropolitan Museum of Art, New York, NY, USA
Game of Hounds and Jackals. Egyptian; Thebes, Lower Asasif, Birabi. Middle Kingdom, reign of Amenemhat IV, ca. 1814–1805 BCE. Ebony, ivory. Board: H. 6.3 cm (2½ in); W. 15.2 cm (6 in). Purchase, Edward S. Harkness Gift, 1926 (26.7.1287a-k). The Metropolitan Museum of Art, New York, NY, USA.