


Suggested citation
Homsey, A. 2022. Watersheds & Landscapes. Technical Report for the Delaware Estuary and Basin, L. Haaf, L. Morgan, and D. Kreeger (eds). Partnership for the Delaware Estuary. Report #22-05.
Contributors LeeAnn Haaf, Jessica Klinkam, Kelly Faller, and Nick Procopio
Cover photograph by Gavin Brown
Technical Report for the Delaware Estuary and Basin Partnership for the Delaware
Abstract
The Delaware Estuary and Basin saw a 4% gain in total population, nearly +865,000, from 2000 to 2020. White populations have decreased, while minority and Hispanic populations have increased. In 2016, land cover in the entire Estuary and Basin was ~60% natural lands, 21% agricultural and 17% developed. From 1996-2016, ~210 mi2 was developed— a rate of ~17.5 acres per day. Over that same period, the Estuary and Basin lost ~106 mi2 of agricultural and ~99 mi2 of natural land, which approximates to 8.9 and 8 acres lost per day, respectively. Imperviousness was greatest in watersheds surrounding Philadelphia; watersheds in the Upper Region had the least imperviousness. In line with increased development, imperviousness has also increased. Despite increased development, the Estuary and Basin has >2,900 square miles of protected land (>22% total land area), which increased from 2010-2020 by 162.9 mi2, or 1.3% of the total land area.
Human population can have a direct impact on water quality and habitat within a watershed. In general, the more densely populated an area is, the more stress on the environment. These stresses can impact our natural resources, such as forests, wetlands, and water resources.
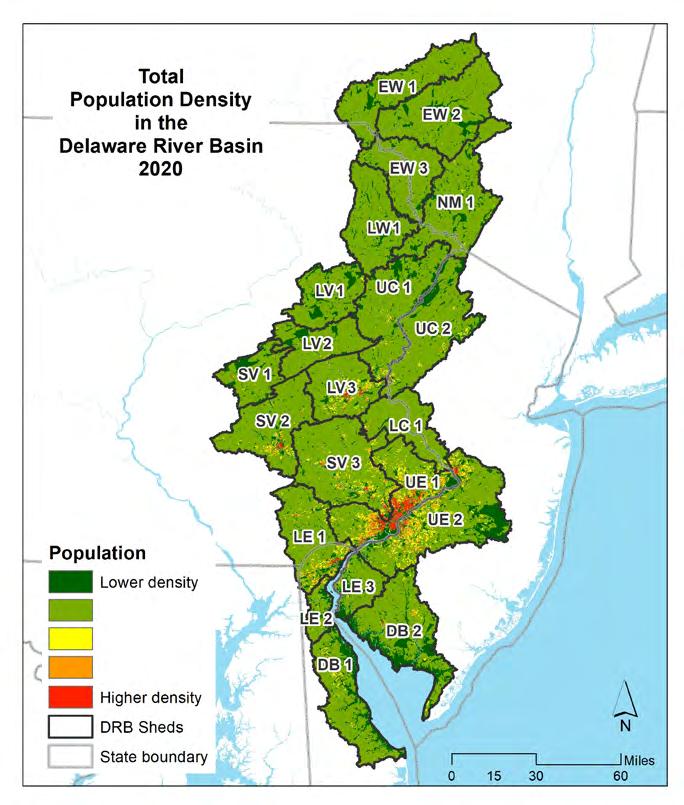
The Delaware Estuary and Basin, with a land area of nearly 12,900 square miles, is highly variable in the number of people living within its watersheds. The relatively sparse but increasing population of the tidal portions to the south give way to the densest areas along the I-95 corridor and the Philadelphia environs, up to approximately the limit of tide near Trenton, NJ. Above this point, the population is much less dense, except for some relatively urbanized areas in the Schuylkill and Lehigh Valleys. The upper reaches of the Basin, in upstate New Jersey, Pennsylvania, and New York, are highly forested with quite low population densities.
In order to derive the population for each decennial census year in the analysis (2000, 2010, and 2020) on a watershed basis, it is necessary to estimate, since population data are not provided by the U.S. Census Bureau on a watershed basis. For each year of the decennial census, tabular data were obtained on a census block and/or block group level (census blocks are the smallest tabulation area produced by the Census Bureau). Census data for 2020 were obtained through an early data release for the purposes of the reapportionment program. It is possible that future data releases will be slightly different as the data are adjusted after a period of quality control.
To enable the arbitrary calculation of population on any spatial unit (e.g., by watershed or by county with each watershed), the population information for each census block was linked to the geographic information system (GIS) data layer for the appropriate year. Since the delineation of census blocks is not static but may change from year to year, a separate GIS data layer for each year’s census blocks was obtained and linked to the tabular data.
Information for the population used in this analysis included total population (by census block) for
2000, 2010, and 2020, as well as racial makeup by census block for 2010 and 2020. Two different type breakdowns were made—first the minority population, which consists of any self-reported race that is not “white alone.” Individuals who reported themselves as a single race other than white were included, as well as anyone who indicated that they were of more than one race. Secondly, the Hispanic population was determined for 2010 and 2020, based on respondents who self-identified as “Hispanic.” Note that minority/non-minority and Hispanic are not exclusive categories. It is possible to self-report as racially white, or any other race (or mixed race), and also Hispanic. For this reason, minority/non-minority and Hispanic populations’ status are considered separately.
Population was summarized across two units, states and counties, within the Delaware Estuary and Basin, and population was based on the 21 watersheds within the Basin. GIS data layers for each of these geographic areas were used to summarize population data for each of the three decennial census years. For both layers, the area of water was removed so that all data are based on land area, where habitation is possible.
To help visualize the current population and trends over the past two decades (2000-2020) the tabular data were linked to the GIS layer of 21 watersheds and presented cartographically.
Over the past two decades, there has been a fairly large rise in population within the Basin. The highest increases were observed in Delaware (+24%), then Pennsylvania (+11%), and New Jersey (+7%). New York was the only state to see a slight loss of population (-0.4%). Pennsylvania comprises the largest portion of the Basin in area, with over half (50%) of the land area, followed by New Jersey (23%), New York (19%), Delaware (8%), and Maryland (0.1%) (Fig. 1.1.1A, Table 1.1.1).
Table 1.1.1 Current population in the Delaware Estuary and Basin by state.
Similarly, based on total population, Pennsylvania contains 67% of the Basin’s inhabitants, New Jersey 23%, Delaware 9%, New York 1.4%, and Maryland 0.1% (Fig 1.1.1B). Refer to Table 1.1.3 for a full summary of population from 2000, 2010, and 2020, by state and county, based on U.S. Census Bureau Decennial Census figures.
Between 2000 and 2010, population in the Delaware Estuary and Basin increased by nearly 500,000, representing a 6.3% increase, exceeding 8 million inhabitants for the first time. Between 2010 and 2020 the population expanded by more than an additional 360,000, a 4.5% increase.
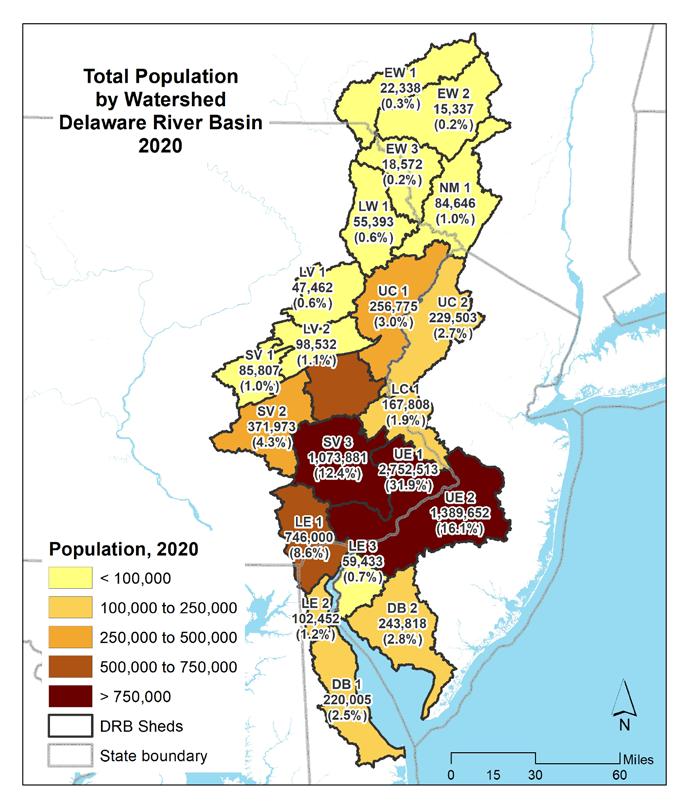
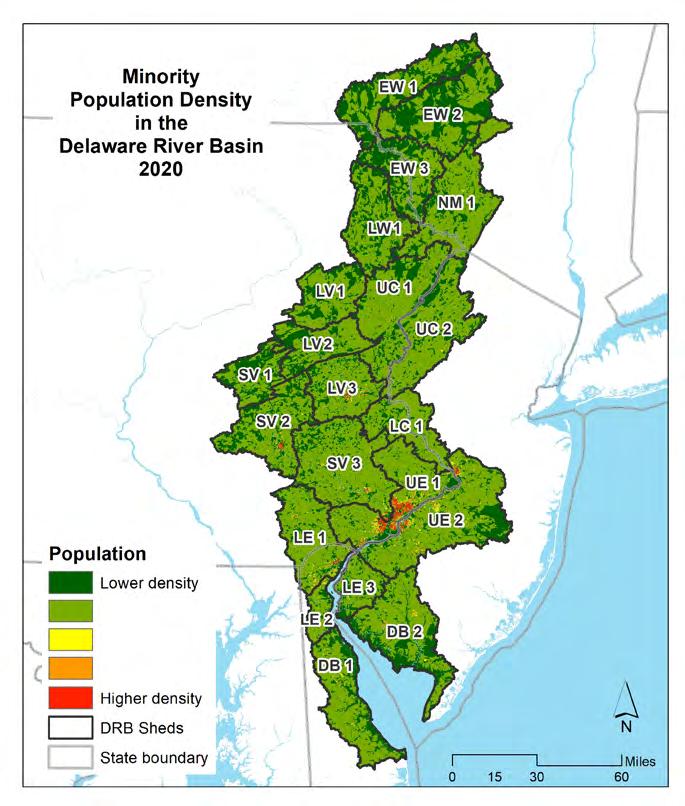
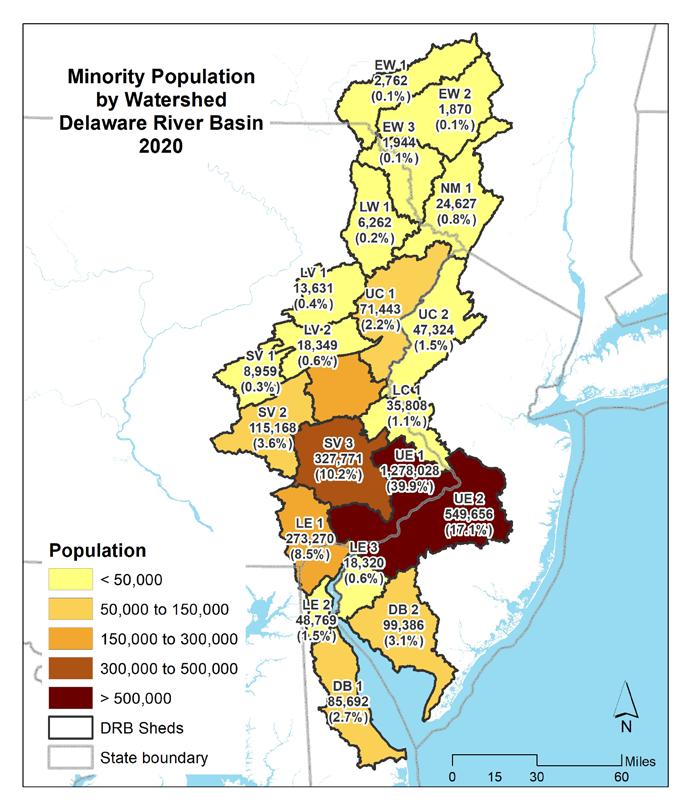
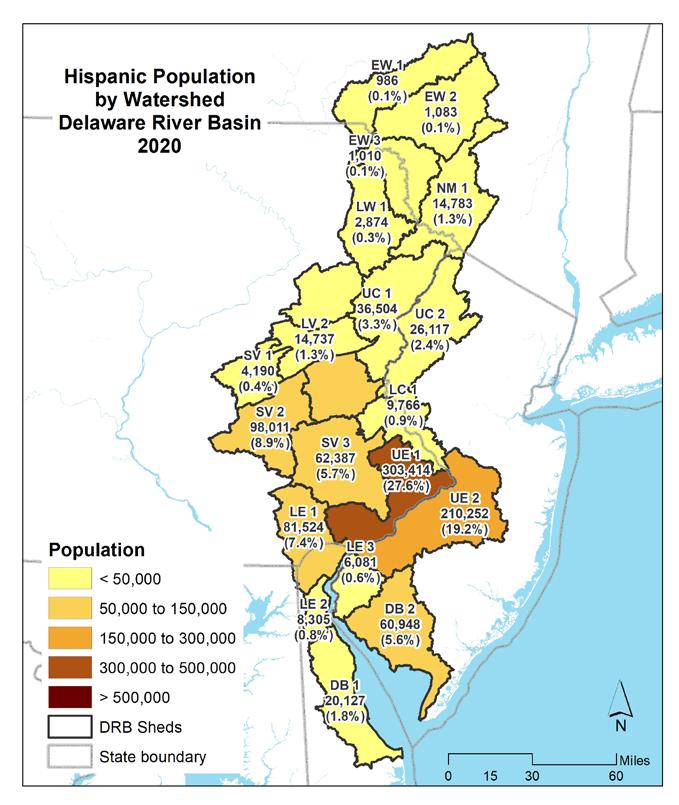
As of the 2020 decennial census, there were approximately 8,628,000 people living in the Delaware Estuary and Basin. Nearly a third (2,750,000 or 32%) of the population resided in the Upper Estuary watershed containing the Philadelphia metro area (UE1), with the second most populous watershed being UE2, or the greater Camden, NJ region (1,400,000 or 16%) (Table 1.1.2). Minority and Hispanic populations were summarized by watershed for the census years 2010 and 2020 (Figs 1.1.2-1.1.5). The highest minority
Figure 1.1.1 Percent area within the Basin for each state (A) and the 2020 population sizes by state (B).
populations were also in UE1 and UE 2, with, respectively, 1,278,028 (39.9%) and 549,656 (17.1%) of the Basin’s minority population. Similarly, the highest Hispanic population was in those two watersheds, with 303,414 (27.6%) and 210,252 (19.2%), respectively.
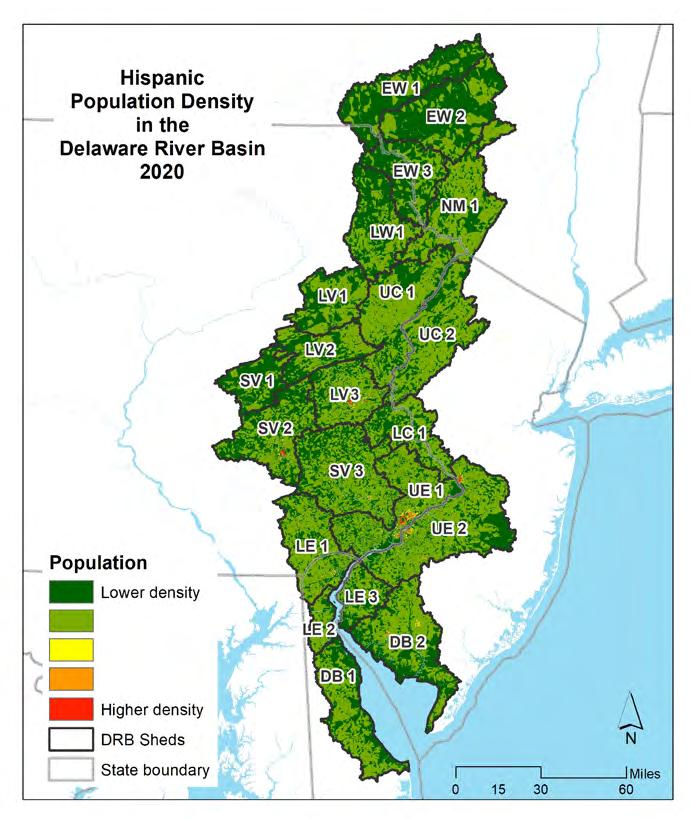
Figures 1.1.6 through 1.1.11 shows the distribution and percentages of population within the Delaware Estuary and Basin. The maps on the left show the population density for each demographic category, while the maps on the right show the total populations (and percentages of the Delaware Estuary and Basin total) for each demographic by each 21 watersheds in the Delaware Estuary and Basin. The watersheds in the upper Basin have quite low populations and population densities, with the highest populations in the Lower Central and Upper Estuary watersheds. The Lower Estuary and Delaware Bay watersheds are relatively lower in population but are experiencing growth.
Between 2000 and 2020, the population of the Delaware Estuary and Basin increased by nearly 865,000. Most of the change occurred in the watersheds in the greater Philadelphia region. Based on the decennial census, total population went from 7,763,062 in 2000, to 8,256,005 in 2010 (a 6.3% increase), and 8,627,962 in 2020 (a 4.5% increase).
Figure 1.1.12 shows the trend in population in the Delaware Estuary and Basin, by state, for each decennial census year (2000, 2010, 2020). Tables 1.1.3 and 1.1.4 summarize the change in total basin population between 2000 and 2020 by each county and state. Figure 1.1.13 presents the total change by state between 2000 and 2020. Figure 1.1.14 shows the change as a percentage difference by state.
The map in Figure 1.1.15 shows the change in total population by watershed with total population and percent change indicated. Table 1.1.5 summarizes the changes in total population by watershed in the Delaware Estuary and Basin. Figure 1.1.16 shows the change in minority populations by watershed. Table 1.1.6 summarizes the changes in minority population by watershed. Figure 1.1.17 shows the change in the Hispanic population by watershed. Table 1.1.7 summarizes the changes in minority populations by watershed.
Table 1.1.2 Population of demographic categories by watershed, and the percentage of that category relative to the entire Basin.
Population (in thousands)
Population, Minority and Non-minority, 2020
Non-minority Minority
Population, Hispanic and Non-hispanic, 2020
Non-hispanic Hispanic
Population (in thousands)
Non-minority Minority
Figure 1.1.4 Minority and non-minority population (%) in the Delaware Estuary and Basin (2020). Watersheds are shown in descending order of total population size, from left to right.
Non-hispanic Hispanic
Figure 1.1.5 Hispanic and non-hispanic population (%) in the Delaware River Basin (2020). Watersheds are shown in descending order of total population size, from left to right.
State, 2000, 2010, 2020
1,000,000 2,000,000 3,000,000 4,000,000 5,000,000 6,000,000 7,000,000
2000 2010 2020
Delaware Maryland New Jersey New York Pennsylvania
Figure 1.1.12 Population in the Delaware River Basin by year and state.
Table 1.1.3 Populations over time and population change by county for Pennsylvania.
Table 1.1.4 Population over time and population change within the Delaware Basin by county for Delaware, Maryland, New Jersey, and New York.
Figure 1.1.18 shows the population change between 2010 and 2020 for each of the five demographic categories—total population, minority population, Hispanic population, non-minority population, and non-Hispanic population—within the Delaware Estuary and Basin. Figure 1.1.19 shows the percentage change in each demographic category 2010-2020.
Figure 1.1.20 shows the change in the minority population between 2010 and 2020, by watershed. Figure 1.1.21 shows the change in minority population between 2010 and 2020 by watershed as a percentage. Figure 1.1.22 shows the change in Hispanic population between 2010 and 2020 by watershed. Figure 1.1.23 shows the change in Hispanic population between 2010 and 2020 by watershed as a percentage.
The Delaware Estuary and Basin saw a 4% gain in total population, despite an area-wide decrease of over 481,000 (8.1%) of the total population of white residents in the basin over the ten-year period. This discrepancy was due to an increase in the minority population, which showed a nearly 850,000 (36%) increase, and the Hispanic population, which increased by over 307,000 (39%) over the ten-year period.
Based on the trajectory of current demographic trends reported here, the proportion of non-white (i.e., people of a single race other than white, or of multiple races) will likely increase over the next decade. Similarly, the number and proportion of people who identify as Hispanic is also likely to increase. However, the overall population increase is likely to decline, which is concurrent with current national population trends (Vespa et al. 2020, Davis et al. 2022). It is also likely that areas in some of the watersheds, such as in the Schuylkill and Lehigh Valleys and the coastal Delaware Bayshore will continue to experience a majority of the increase in population pressure. In contrast, other areas may face challenges of a static or possibly declining population.
With an increasingly diverse and urbanized population within the Delaware Estuary and Basin, water quality and watershed health will become increasingly important for these regions and their inhabitants. Environmental impacts may increase in areas such as the Lehigh and Schuylkill Valleys and the Delaware Bayshore. Impacts on all water resources, including degradation in quality, increased flooding, groundwater pressures, and wetlands degradation will likely become an increasing concern in those areas. Given that the watersheds where population pressures are greatest are also often environmentally sensitive, it will be important to plan for protections for these resources and to secure sufficient funding, resources, and political will to anticipate and counter potential negative impacts.
Given the trajectory of demographic trends reported here, the pressures on the resources of the Delaware Estuary and Basin will likely continue to increase. While the overall population rate of increase may be starting to flatten, the relative increasingly urbanized population will present challenges in the coming decades. These challenges may be seen in terms of impervious cover, potential pollution sources, and competing interests for water resources. As populations become more diverse, we also must ensure there is equity in access to resources, especially in environmental justice communities. Planners and policymakers need to anticipate differential changes and plan accordingly in each of the Delaware Estuary and Basin’s watersheds.
Population Change in the Delaware Basin, by State and Total, 2000-2020
Figure 1.1.13 Population change in the Delaware River Basin by state (2000-2020).
% Change in Population in the Delaware Basin, by State and Overall 2000-2020
Figure 1.1.14 Percent population change in the Delaware River Basin by state (2000-2020). Maryland is not depicted here as the total population is low compared to other states.
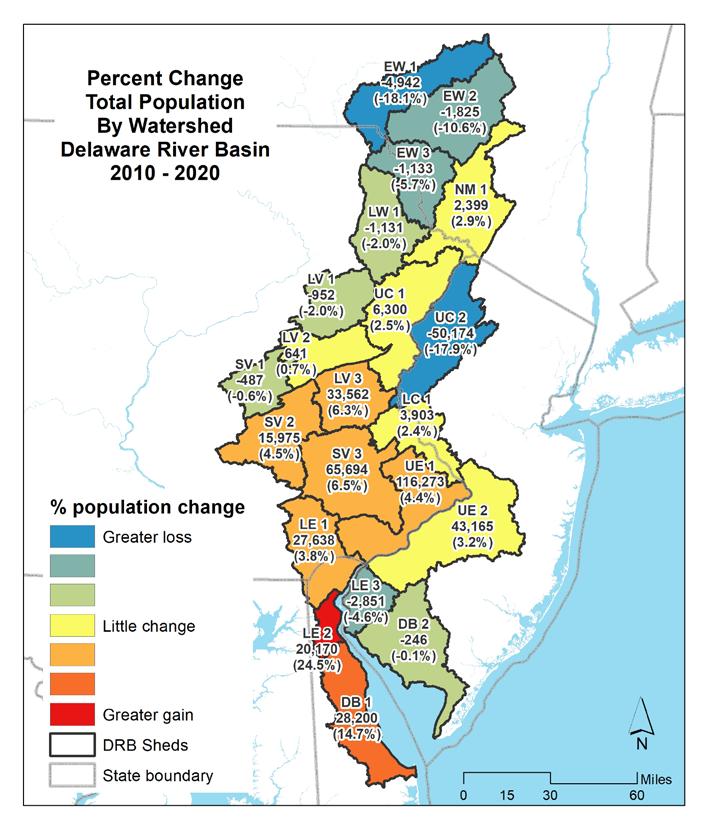
Figure 1.1.15 Percent change in total population by watershed in the Delaware River Basin (2010-2020).
Table 1.1.5 Percent change in total population by watershed in the Delaware River Basin (2010-2020).
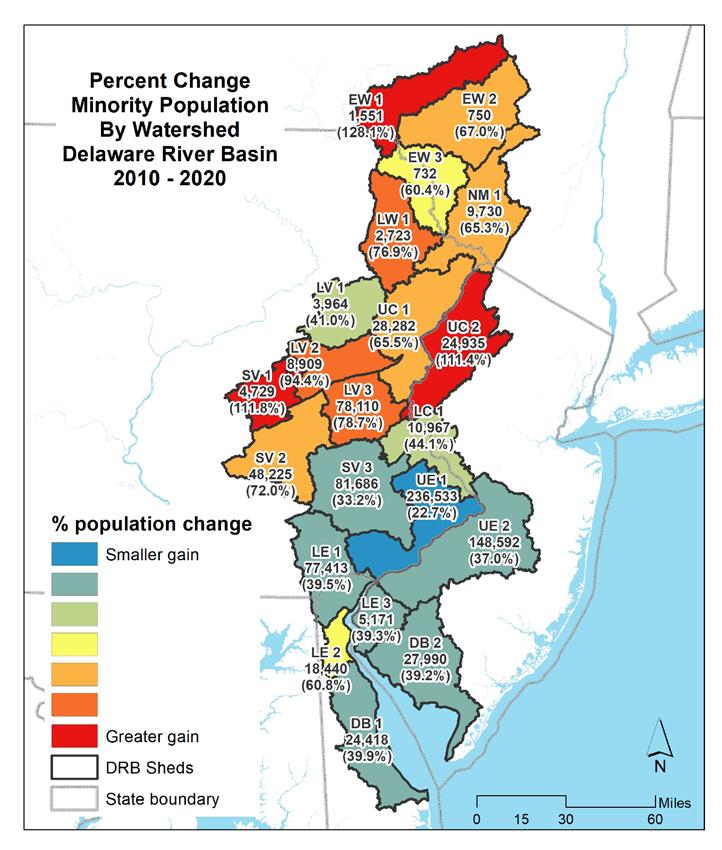
Figure 1.1.16 Percent change in minority population by watershed in the Delaware River Basin (2010-2020).
Table 1.1.6 Percent change in minority population by watershed in the Delaware River Basin (2010-2020).
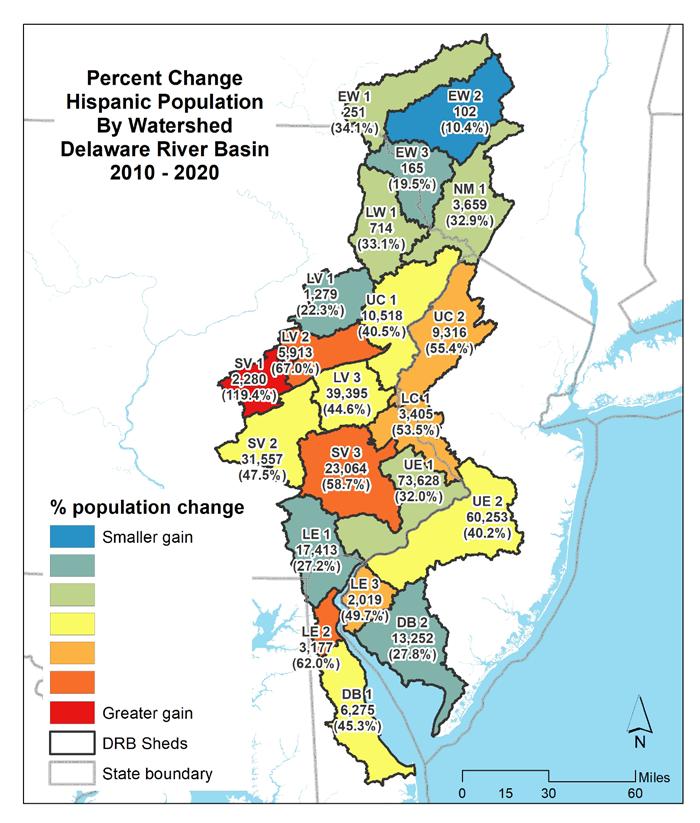
Figure 1.1.17 Percent change in Hispanic population by watershed in the Delaware River Basin (2010-2020).
Table 1.1.7 Percent change in Hispanic population by watershed in the Delaware River Basin (2010-2020).
1.1.18 Population change by type (2010-2020).
Population Change Percent Population Change, Delaware Basin, 20102020
1.1.19 Percent population change by type (2010-2020).
Chage
Population Change, Delaware Basin, 2010 - 2020
Population Change, Minority and Non-minority, 20102020
Figure 1.1.20 Minority and non-minority population change (2010-2020).
Population Percent Change, Minority and Non-minority 2010 - 2020 Non-minority Minority
Population Change, Delaware Basin, 2010 - 2020 Total Minority Non-minority Hispanic Non-Hispanic
Figure 1.1.21 Minority and non-minority percent population change (2010-2020).
Population Change, Delaware Basin, 2010 - 2020
Population Change, Hispanic and Non-Hispanic, 20102020
Figure 1.1.22 Hispanic and non-Hispanic population change (2010-2020).
Chage
Population Change, Delaware Basin, 2010 - 2020
Total Minority Non-minority Hispanic Non-Hispanic
Percent Population Change, Hispanic and NonHispanic, 2010 - 2020 Non-Hispanic Hispanic
Figure 1.1.23 Hispanic and non-Hispanic percent population change (2010-2020).
Land cover describes what is physically present on a particular area of ground. Land cover is pertinent for determining the effects of a land cover type on the overall health of a watershed, including aspect of water quality (Kauffman et al. 2011). For instance, a cover type of high-intensity developed land would have characteristic impacts related to its intensity, largely independent of what particular land use practice is there. When assessing overall watershed health at a broad scale, land cover is useful because it is comparable across a variety of landscapes and is relatively consistent across time. What is physically present on the landscape has a profound and lasting impact on the overall environmental health of those landscapes.
Land cover is constantly changing. In some cases the changes are natural, resulting from vegetative succession, uplift, volcanism, erosion, wildlife migration, or natural climatic shifts. Other changes occur due to human interaction and agency on the land. Processes such as the development of towns and cities, transportation and communication networks, population dispersal or migration, and agricultural activity have occurred throughout human history and led to significant and sometimes dramatic changes in the landscape. Other processes, such as human-induced climate change, air and water pollution, famine and disease, and widespread dispersal of invasive species, among other factors, are the indirect result of human activity, and can also lead to major impacts on the landscape.
Some changes are quite gradual, taking decades or longer, while others can occur quite quickly, over the span of a few years or even more rapidly. These changes often have a profound impact on the health of watersheds and water resources, and the societies and organisms which depend on them. Understanding how the land cover of an area is changing over time is an important metric to determine if conditions are degrading, improving, or holding steady. Using a high-quality, high-resolution dataset over a decadal time frame is a useful way of tracking those changes and understanding potential future trends. By comparing changes in the landscape with other metrics such as water quality, it is possible to quantify the effects of those changes over time. Land cover is not spatially consistent across the Delaware Estuary and Basin, and so the change in land cover over time can be highly variable as well. Land cover is often a reflection of economic, demographic, societal, political, and regulatory factors. By studying the nature of land cover and particularly how fast it is changing, watershed professionals can understand patterns in the landscape and can anticipate future changes, and seek to lessen their negative impacts.
In this chapter, four broad land cover types are assessed: developed land, agricultural land, natural lands, and open water. Developed land is generally associated with lower-quality habitat and lower water quality values than more natural types of land cover. More highly developed areas have higher degrees of imperviousness, as well as a greater number of human activities that can potentially affect water quality, exacerbate flooding, and reduce base flows in streams. Agricultural land cover can have significant impacts on stream and watershed health, depending on the type of practices employed, and the character of the crop or animal operation. Increased nutrients, sediment, and bacteria are often a result of upstream farming practices. The types of practices on the ground can also have a great impact on overall water quality and watershed health; proper management of waste and runoff are crucial to protecting the water resources of the Basin, particularly since agriculture makes up a large proportion of the Delaware Estuary and Basin.
Natural lands consist of forests and wetlands. Forest cover is associated with pre-development conditions of water quality and hydrology. Forests cycle nutrients and carbon dioxide, capture rainfall and inhibit
erosion, and play an important role in water quality, quantity, and habitat provision for aquatic and terrestrial wildlife. The presence of forests is a hallmark for defining high-quality watersheds. Wetlands, both freshwater and tidal, are a natural land cover type and therefore associated with clean and healthy watersheds. Wetlands provide a wide variety of ecosystem services, including water purification, habitat provision, flood protection, pollution reduction, recreation, sea level rise, and storm-surge amelioration.
Open water includes lakes, ponds, and streams in the Delaware Estuary and Basin. The largest body of water in the watershed are its namesakes, the Delaware River and Bay, but that area is not included in land cover analysis by watershed. The “other” category consists mostly of barren land, transitional land, and beaches/dunes. This category makes up a very small portion of land cover in the Estuary and Basin.
Land cover status is important to a holistic assessment of the current condition and past or future trends within a watershed. In order to determine the land cover status for the nearly 13,000 square miles, Delaware Estuary and Basin, it was important to use a consistent source of data to assure that comparisons across the watersheds, as well as across years, are valid. The National Oceanic and Atmospheric Administration (NOAA) administers the Coastal Change Analysis Program (C-CAP), which characterizes near coastal land cover (within an ~200-mi boundary of the US coastline). Unlike the National Land Cover Dataset, C-CAP classifictions include more refined coastal habitat classifications, such as estuarine wetlands. Land cover data are available for the past several decades at approximately five-year intervals. This source is useful since it is consistent over time and across the study area. This source has been used in previous editions of the Technical Report for the Estuary and Basin (TREB) and provides another useful “snapshot” of watershed conditions in the Delaware Estuary and Basin. The latest vintage of C-CAP land cover data was used for the land cover analysis. Previous years were also analyzed for land cover trends. Table 1.2.1 presents the classification of land cover types in C-CAP data and the corresponding simplified category that is used for all subsequent analyses in this TREB. Note that while the C-CAP category “shrub/scrub” is not specifically agricultural, it was included in this category as its spectral signature is similar to agriculture.
NOAA C-CAP data are based on satellite imagery at a 30-meter ground resolution, which is classified into over 20 land cover categories. A simplified scheme of six categories was used (see the following section). The six categories of land cover used to characterize the Delaware Estuary and Basin are: developed (or developing), agriculture, forest, wetland, open water, and other. This simplified classification scheme is helpful in quantifying the character (and changes) within the landscapes of the Delaware Estuary and Basin at a watershed scale and affords a generalized picture of their condition.
Data were obtained through NOAA’s C-CAP program through their online portal for 1996, 2001, 2006, 2011, and 2016 (the latest available data for this program). Each dataset covered the entire Delaware Estuary and Basin and is based on Landsat satellite imagery at 30-meter ground resolution. Note that previous TREB reports have used the same data source (C-CAP) but the entire five-year series was re-
acquired, due to some minor classification changes noted in some of the previous datasets since the last TREB report in 2017. The data from 2016 were used for this section (land cover), and all years were used in consideration of the changes over time (see Section 1.3). All land cover data were obtained in the Universal Transverse Mercator (UTM) projection, Zone 18 North, cast on the North American Datum of 1983 (NAD83), with coordinates in meters.
To assess the condition of the land cover across the Delaware Estuary and Basin, the 21 watersheds within the Estuary and Basin were used as a cataloging unit on which to summarize the data. The total land cover area was calculated for each watershed. To determine the land cover characteristics of each sub-category within the overall Delaware Estuary and Basin, and all levels of watershed hierarchy including regions, sub-regions, each of the 10 watershed divisions, and the data for the 21 watersheds were aggregated to produce summary information in this hierarchy. See Figure 1.2.1 for a schematic representation of the assessment units and reporting hierarchy within the Delaware Estuary and Basin. For each of the 21 watersheds (the smallest level of hierarchy, represented by the numbered divisions in the lowest row), land use profiles were calculated. The proportion by land area of the Delaware Estuary and Basin represented by each region is presented in Figure 1.2.2.
Also using C-CAP data, we performed a broad four category classification of land cover changes in the Delaware Estuary and Basin between 1996 and 2016. Changes are more difficult to verify at a lower resolution, and so we chose to represent land cover changes using these broader land cover categories.
B.
The four categories were Developed, Agricultural, Natural Lands, and Other (see Table 1.2.1). Importantly, “Forest1” includes forest C-CAP classes for forest (see Table 1.2.1) as well as salt and freshwater forested/ scrub-shrub wetlands; and “Other” includes emergent wetland, barren, open water, etc. Additionally, “Any (non-Developed)” were categories classified as Forest or Agriculture in 1996, but classed one of the “Other” classes in 2016.
The Delaware Estuary and Basin comprises approximately 12,862 mi2 (33,312 km2) within Delaware, New Jersey, New York, Pennsylvania, and Maryland (Tables 1.2.2, 1.2.3). Over half (53%) falls within the nontidal watersheds of the Upper Basin. The remainder forms the Delaware Estuary (i.e., the watersheds of the tidal portion of the Basin). The Delaware Bay itself is in the lower portion of the Estuary, and covers 752 mi2 (1,948 km2), resulting in a total area of 13,614 mi2 (35,268 km2) for the Basin (including the Delaware Bay). With the Bay included, more than half (50.2%) of the Basin is the Delaware Estuary (and under the scope of the National Estuary Program). All land cover analysis has excluded the Bay. Figure 1.2.3 shows the land cover of the Delaware Estuary and Basin.
Maps in the following figures (Figs 1.2.4, 1.2.5) show the proportion of human-manipulated land cover categories as a percentage of total land cover by watershed in the Delaware Estuary and Basin. The most
1. Forested wetlands could also be considered with wetland categories, but for this broad scale, we consider these land covers to be more similar to other forested systems rather than grouped with emergent wetlands.
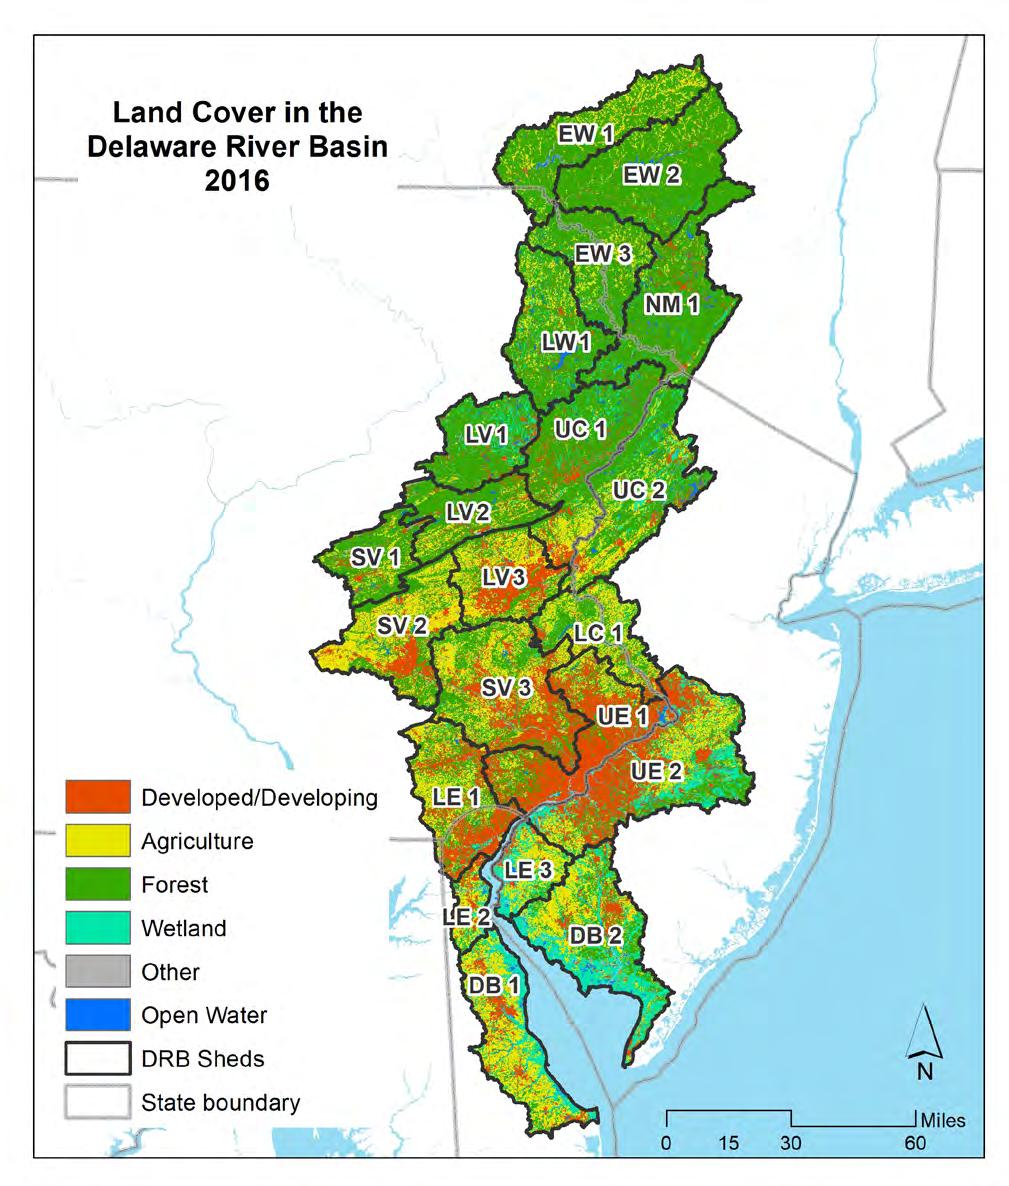
developed areas are the watersheds surround the Philadelphia metropolitan area. Watershed UE2 is 61% developed, with less development moving out from there. Northern watersheds are the least developed, with 5% developed area or less. This reflects the historic character of the watershed. The distribution of natural cover is nearly the reverse of areas of higher development; the highest percentage of the natural cover occurring in the northern watersheds, including East-West Branch (EW 1, 2), Lackawaxan (LW 1), and Neversink-Mongaup (NM 1).
Other Open Water Developed Agriculture Natural Land
Figure 1.2.4 Land cover in the Delaware River Basin (2016).
Agriculture is a relatively small portion of the most urbanized watersheds. Areas of southeast Pennsylvania and central New Jersey have the highest proportions of agriculture, while the most northern and most highly forested watersheds have the lowest percentages of agricultural land cover.
Overall, the basin is nearly 60% natural lands, with 21% in agriculture and 17% developed. Figure 1.2.6 shows the amount of each land cover type by watershed in the Delaware Estuary and Basin.
The Estuary portion of the Delaware Estuary and Basin comprises the lower four watersheds (with 10 of the 21 watersheds), including all watersheds whose rivers flow into the main stem of the Delaware River below the tidal limit. The Delaware Estuary includes the most populous and developed portions of the Delaware Estuary and Basin, as well as the highest amount of agricultural land. The Delaware Bay watershed is also characterized by a high percentage of tidal wetland along the Bayshore.
Figure 1.2.7 shows the percent land cover types for the upper Basin (non-tidal watersheds) (A), and the Estuary (B). Figure 1.2.8 shows the land cover for both the Estuary, the upper Basin (non-tidal watersheds), and the Delaware Estuary and Basin as a whole. Table 1.2.4 presents a summary of all ten watersheds in the four regions of the Delaware Estuary and Basin, including total area in square miles and as a percentage, as well as for the upper Basin, Estuary, and whole watershed.
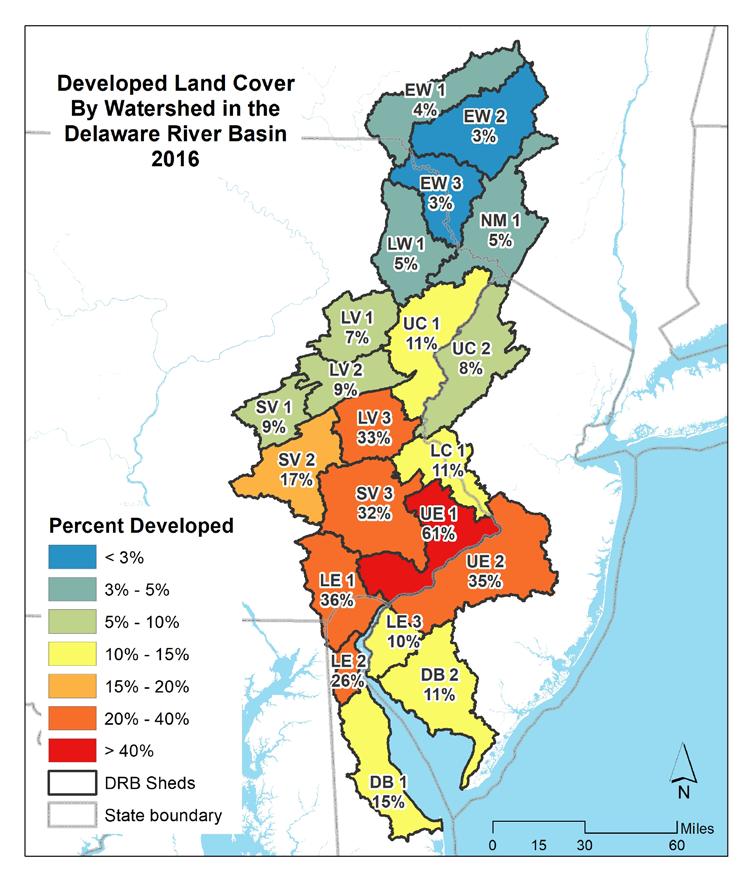
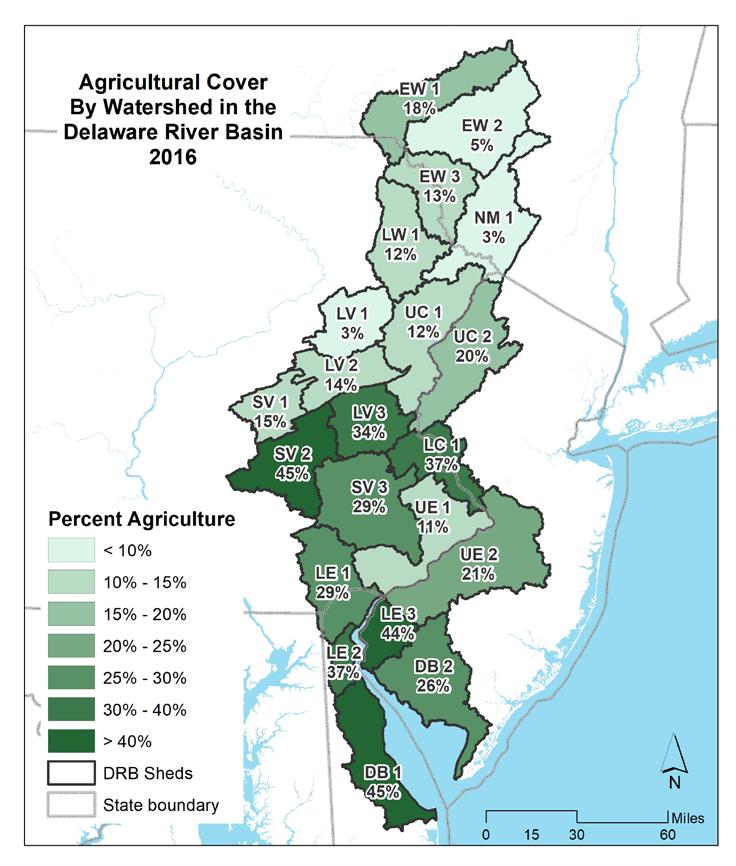
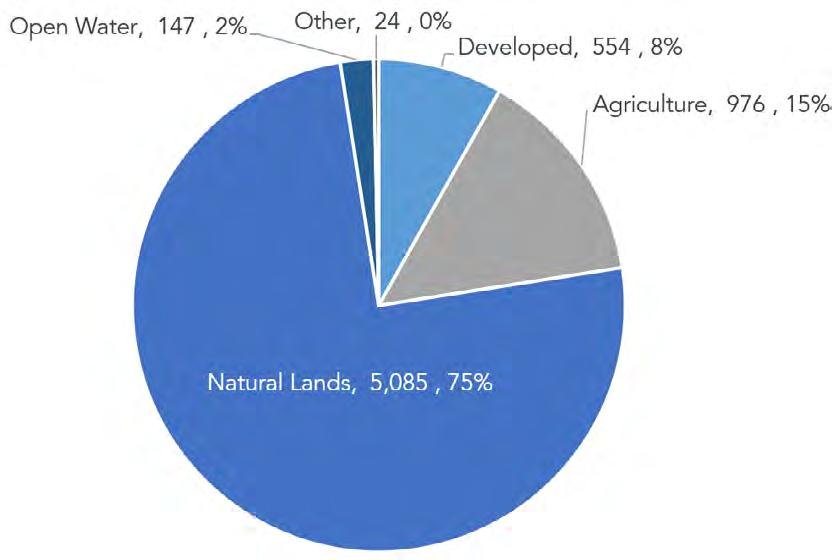
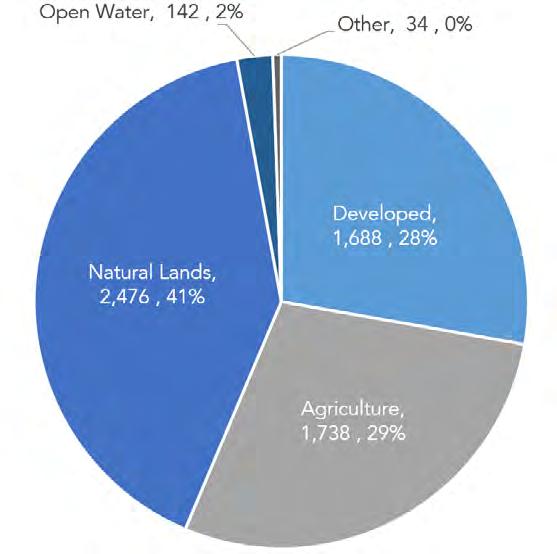
Figure 1.2.7 Land cover proportions of the Upper Basin (A) and Estuary (B) in 2016. Values next to cover class represent land cover in square miles, followed by the percent of each cover class relative to the total land area for each region.
Changes in the landscape have generally been a progression of natural to more “human-influenced” land uses. Certainly, much of the trajectory of land cover in the Estuary and Basin, particularly in the southern portion, has been from natural cover to urban/suburban and agricultural uses. Land cover, including natural lands and agriculture, thus tends toward development and lower intensity development toward higher intensity development. Another trend seen throughout many portions of the Estuary and Basin is the displacement of agriculture farther from urban and population centers, as existing agricultural lands are progressively developed. Previously forested land is then claimed for agriculture, as the focus of food production shifts away from the higher land rents of the urban cores.
Prior to urbanization and following the period of early European colonization in the early 17th century (Kauffman 2010), much of the land of the Estuary and Basin had been heavily forested. While the Lenni Lenape, the indigenous people of the Estuary and Basin, cleared some land using fire or other means, the preponderance of watersheds was largely natural. By the early 20th century, natural cover was at its lowest ebb due to urban and agricultural expansion and colonial resource exploitation. Some of this trend has reversed due to economics, regulation, and land-use policies, but the pace of development has increased, especially in the previously less-populated areas of the upper watersheds in the Lehigh and Schuylkill Valleys and the Delaware Bayshore.
The Upper Basin has been and continues to be predominated by forest cover, despite more recent trends in recreational uses and extraction such as hydraulic fracturing (“fracking”) for natural gas (although high volume hydraulic fracturing was recently banned within the Delaware River Basin, see the Final Rule, February 2021). The driving forces of land use change in our watersheds are based on competition for resources and space. With a limited amount of ground and an increasing population, this trend will likely continue for some time.
Analysis of the C-CAP land cover data for the past twenty years Basin-wide shows that since 1996:
• Approximately 210 square miles were converted to developed land, a 10.3% increase.
• One hundred and six square miles of agricultural land was converted to another use (mostly developed land, but some to forest), a net loss of 3.8%.
• Nearly 94 square miles of forested land was lost over the period, of 1.5% of the total.
• The Basin lost 5.7 square miles of freshwater and tidal wetlands (a net loss of 0.5%).
Figure 1.2.9 shows the overall changes, in square miles, in the Basin as well as in the Non-tidal (upper Basin) and Estuary portions. Figure 1.2.10 summarizes the changes within each region of the Delaware Estuary and Basin between 1996 and 2016. Developed land increased considerably over the period, focused largely on the Estuary portion of the Delaware Estuary and Basin over the period 1996 to 2016. Much of this expansion came as agriculture was converted to developed land, which occurred almost exclusively in the Estuary. Natural land cover loss over the period was more evenly distributed throughout the extent of the Delaware Estuary and Basin. Figure 1.2.11 presents the percentage changes in land cover types by region in the Delaware River Basin. Figures 1.2.12 and 1.2.13 show maps of the percent change in developed and agricultural land by region, respectively.
See Table 1.2.5A for a summary of net changes (mi2) and Table 1.2.5B for percentage changes within the regions of the Basin and the Basin overall.
Figure 1.2.9 Land cover change in the Delaware River Basin (1996-2016).
1.2.10 Land cover change (mi 2) by Region in the Delaware River Basin (1996-2016).
Figure 1.2.11 Land cover change (%) by Region in the Delaware River Basin (1996-2016).
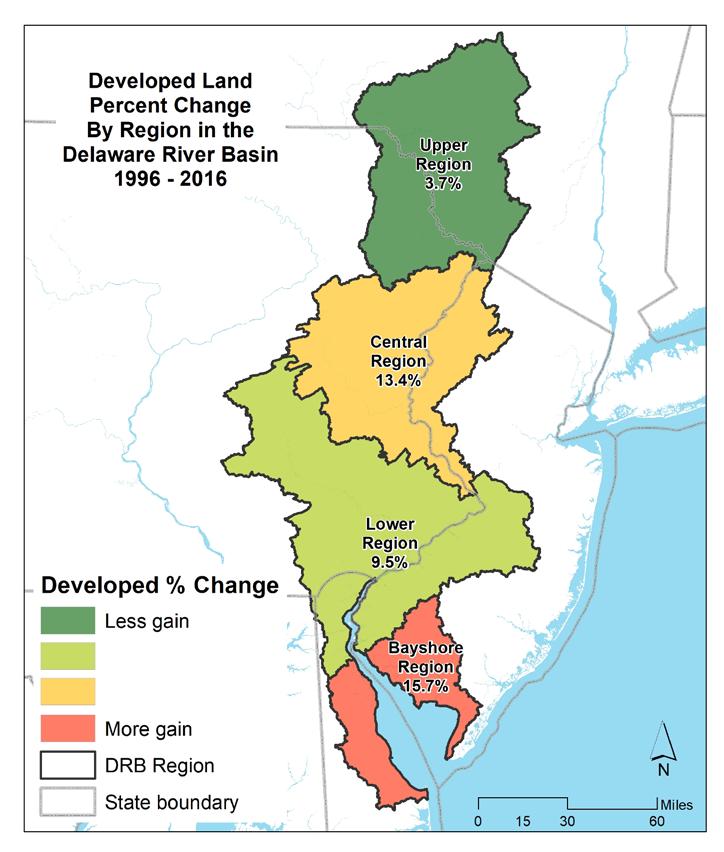
1.2.12 Developed land cover change (%) in Regions of the Delaware River Basin.
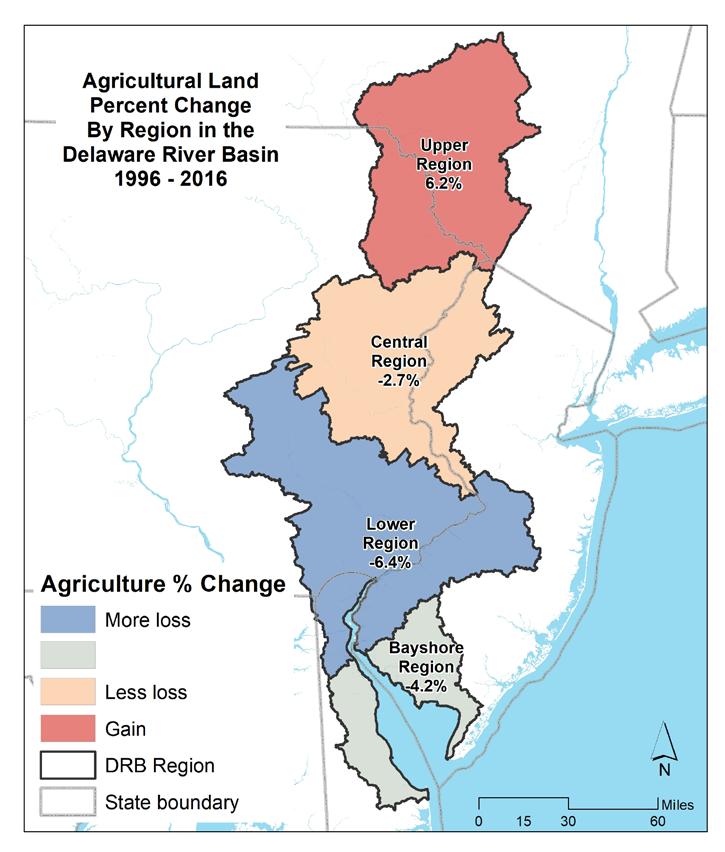
1.2.13 Agricultural land cover change (%) in Regions of the Delaware River Basin.
Table 1.2.5 Summary of net changes (mi 2, A, and %, B) within the Regions of the Delaware River Basin and the Basin overall from 1996-2016.
The overall increase in developed area in the period between 1996 and 2016 is evident, particularly in the watersheds of the upper portions of the Estuary, in the greater Philadelphia region (Schuylkill Valley, Upper and Lower Estuaries). Significant development is also occurring in more outlying suburbanizing watersheds including the Lehigh Valley, Upper Central, and Lower Estuary. The Delaware Bayshore is also seeing development pressure. Agricultural loss in the period 1996 to 2016 is most significant in the watersheds of the Estuary, which are also seeing the highest amount of newly developed land.
Figure 1.2.14 illustrates the net change in land cover type across the basin by the ten watershed groups arranged north to south (reading left to right), between 1996 and 2016. Figure 1.2.15 shows the same information as a percentage. The maps in Figure 1.2.16 and 1.2.17 show the changes, as a percentage, across the period 1996 to 2016, by the 21 watershed of the Delaware Estuary and Basin for developed and agricultural lands, respectively. Table 1.2.6A summarizes the land cover changes (in square miles) in the Delaware Estuary and Basin between 1996 and 2016 (the shaded portion of the table indicates watersheds that are part of the Delaware Estuary).Table 1.2.6B shows the percentage change in the watersheds of the Basin, as well as the Upper (non-tidal) and Estuary portions of the Basin.
Rates of change in land cover types, including developed land, agriculture, and natural lands, also varied across the time period from 1996 to 2016. Rate of change for developed land peaked in the period between 2001 and 2006, as did the rate of agricultural loss (4.0% and -2.1%, respectively). Each subsequent period saw a smaller change, as a percentage, of those two land cover types. Figure 1.2.18 shows the rates of changes as a percentage of each of the three land cover types for each 5-year period between 1996 and 2016.
The largest change (total across the watershed) is Agriculture to Forest (34%) (Fig 1.2.19 and 1.2.20). This was likely caused by succession, as scrub or fallow farmland reverts to trees, and the same to some extent for pasture/grasslands (these may or may not have actually been cultivated in 1996, but still lumped into the “Agricultural” class). The next largest change was Agriculture to Developed (31%).
Land Cover Change (sq. mi.) in the Delaware River Basin, 1996-2016
Developed Agriculture Natural Lands
Figure 1.2.14 Land cover change (mi 2) by subregion in the Delaware River Basin (1996-2016).
Land Cover Change (%) in the Delaware River Basin, 1996-2016
Developed Agriculture Natural Lands
Figure 1.2.15 Land cover change (%) by subregion in the Delaware River Basin (1996-2016).
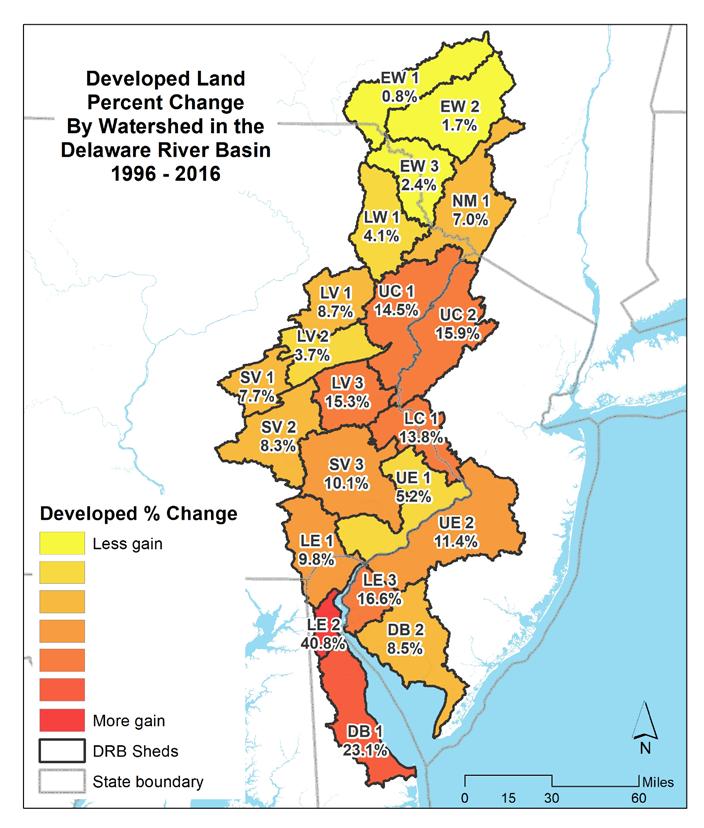
1.2.16 Developed land cover change (%) by watershed in the Delaware River Basin (1996-2016).
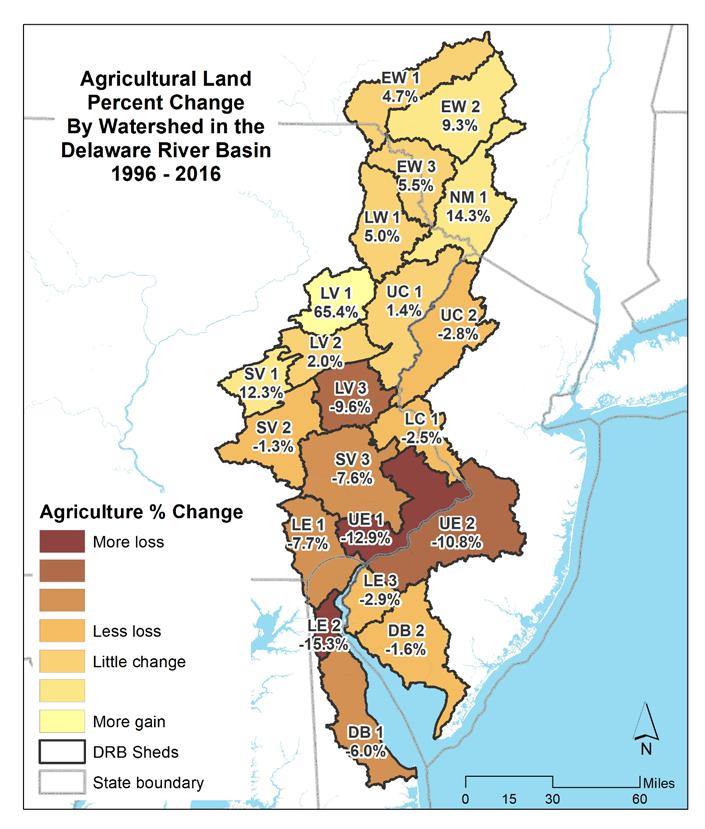
1.2.17 Agricultural land cover change (%) by watershed in the Delaware River Basin (1996-2016).
Table 1.2.6 Land cover change (mi 2, A, and %, B) by region and watershed in the Delaware River Basin (1996-2016).
Currently, the watershed is characterized by relatively undeveloped, forested land to the north in the headwaters of the Delaware River, with increasing development moving down the main stem and relatively less development along the less-populous Bayshore. Agriculture is prevalent in the more coastal watersheds and in the regions surrounding the urban Philadelphia core. In the Bayshore (DB 1, 2), Lower Estuary (LE 1, 2, 3), Schuylkill Valley (SV 1, 2, 3), and Lower Central (LC 1) watersheds agriculture is approximately one-third of the total land cover. As land development often correlates or sometimes outpaces population growth (Gao and O’Neill 2021), it is likely that areas of existing development will densify, with agricultural and forested land converting to more developed land cover as populations in the Delaware Estuary and Basin increase (see Section 1.1).
Figure 1.2.18 Rate of land cover change (% per 5-year increment) in the Delaware Estuary and Basin (1996-2016).
Net land cover change in the landscape occurs in conjunction with other trends, including demographic, economic, environmental, and regulatory changes. For example, periods of economic expansion can lead to a surge in development pressure and population expansion, which adds to residential and commercial development. Increased residential and commercial development often includes the conversion of agricultural land to houses, businesses, roads, and other uses. Climate-related effects can also affect the character of land cover. As wetlands are lost, urban areas respond to increased flooding risks and successional changes occur with changing temperature regimes. The regulatory framework at the local to the national level, including zoning ordinances, and environmental constraints (for instance as enforced through the Clean Water Act) can have a significant effect over time on the overall character of land cover. Strong planning and management strategies implemented at the local and regional scale can also help ameliorate some of the negative impacts of uncontrolled changes in the Basin’s watersheds.
It is likely that many of the trends being felt in the Delaware Estuary and Basin will continue, with one of the most significant drivers being the overall economic environment. The previous decade saw a significant slow-down in economic activity with the 2008-2009 recession, but also saw a fairly robust recovery in the past several years. The change in the economic outlook and the strong pent-up demand has led to a building boom in many areas. The latest data from 2016 has perhaps not fully captured this trend, but in the next several years it is possible development pressures will increase.
Demographically, the rate of population increase has leveled off, and in some areas, begun to decline. In line with trends nationally, it is likely that population pressures will become less intense so that the impacts that come with population increase will moderate. In conjunction with effective and environmentally sound policies and regulations at the local, state, and federal levels, overall watershed health in the Estuary and Basin is possibly going to stabilize and possibly improve in coming years.


Figure 1.2.19 Cover class changes by broad category in the Delaware Estuary and Basin watersheds from 1996 to 2016.
Figure 1.2.20 Total cover class changes by broad category in the Delaware Estuary and Basin from 1996 to 2016.
Technical Report for the Delaware Estuary and Basin Partnership for the Delaware Estuary—Host of the Delaware Estuary Program
Land cover is one of the most significant factors in the overall health and water quality of the Delaware Estuary and Basin’s watersheds. It is therefore important to protect the natural portions of the watersheds, particularly those areas experiencing the highest expected growth in population and developed land uses. Regional planning is a key component of protecting the highly variable landscapes of the watershed from degradation. Given the many diverse governmental and regulatory structures within the Estuary and Basin, centralized coordination is key. Organizations such as the Partnership for the Delaware Estuary and the Delaware River Basin Commission (DRBC), along with private and non-profit partners (especially watershed organizations), are crucial for protecting the resources that impact water quality, watershed health, and human and environmental well-being. Coordinating among these, through efforts such as the Delaware River Watershed Initiative, a multi-year, multi-state collaborative addressing water quality in the Delaware Estuary and Basin, can be an important conduit for the sharing of ideas and coordination of activity.
Implementation in urbanized areas, where watersheds are highly impacted by development, of practices designed to remove pollutants and ameliorate flooding and runoff are components of an overall watershed protection strategy. Agricultural practices designed to remove potential pollutants before they enter the waterways are also crucial to fostering water quality and watershed health. Finally, protecting the natural areas of the watershed, especially forest buffers and wetlands, helps those areas perform functions that serve to protect streams and rivers, and the overall health of the watershed.
• Coordinate with federal and state agencies to maintain and improve geospatial and other data collection, maintenance, and dissemination.
• Focus on highly critical land cover types, such as wetlands and forest, in coordinating the collection methods, sensors, attributes, and timing of data. In particular, focus on C-CAP and the National Wetlands Inventory to ensure spatial and temporal compatibility.
• Identification and inventory of forested areas critical to water resources and habitat.
• Identification and prioritization of the threats and opportunities for watershed protection across the Estuary and Basin, recognizing that these will vary widely across the region.
• Inventory and understanding of land use regulatory frameworks across the Delaware Estuary and Basin.
• Support regional approaches to watershed management and strategic planning efforts to protect natural land cover, in particular in riparian corridors.
• Bolster coordination among local, state, regional, and federal regulatory agencies, local watershed groups and other non-profits, and the academic community. Increased coordination could include outreach to local partners by regional watershed organizations (such as the PDE), in particular to help act as liaison to local, state, and federal regulators, such as the USEPA and state departments of environmental protection, as well as to provide direct technical support.
• Inventory funding opportunities for land protection in the service of clean water and watershed protection.
• Support for robust and comprehensive monitoring of progress and trends to inform decision makers and enable program assessments.
Land cover in the Delaware Estuary and Basin is highly variable among Regions. Since what occurs on the land upstream will have a direct impact on all downstream lands, it is fortunate that many of the headwaters in the watersheds of the Basin, including the main stem of the Delaware River, are highly
natural and protected. Towards the south, development and human density increase, peaking in the watersheds of the Philadelphia conurbation. Upstream in the tributaries of the main stem of the Delaware River many watersheds are characterized by agriculture and smaller urban centers, particularly in the Schuylkill Valley, Lehigh Valley, and the Lower Estuary in southeast Pennsylvania. The Bayshore is also agricultural, with large areas of tidal wetlands, but there are also development and population pressures, which are likely to increase in coming years.
Nearly 210 square miles within the Delaware Estuary and Basin was developed over the period of 19962016, at a rate of 17.5 acres per day. While the Basin lost over 106 square miles (8.9 acres per day) of agricultural land, over 99 square miles (~8 acres per day) of natural land. Table 1.2.7 presents the changes in each major land cover class across the 20-year period between 1996 and 2016, in square miles (total and annually) and acres on a daily basis.
Table 1.2.7 Daily change in each land cover class across the 20-year period between 1996 and 2016.
Developed land increased in every watershed between 1996 and 2016; while natural lands declined. Agricultural land also declined in total area, with increases only in the northern watersheds of the Basin. The Estuary portion of the watershed experienced the highest increase in development (nearly 74% of all increase), about half of the natural land loss, and nearly all the agricultural losses experienced across the Basin. The Upper (non-tidal) portion of the Delaware Estuary and Basin experienced more net natural land loss than the Estuary over the period, but a smaller amount in percentage terms.
The watersheds of the Lower Region experienced the greatest increases in developed land as well as the most loss of agricultural and natural lands. As a percentage increase, however, both the Central and Bayshore Regions saw more intensive development pressure. The conversion of natural land to either agriculture or developed land is the most significant trend in terms of water quality and watershed health. Natural land changes are variable throughout the Delaware Estuary and Basin, but losses in the upper (non-tidal) portions of the Basin have increased in the latest period of available data (2010 -2016) and represent a larger value in square miles (albeit not percent) than the loss in the Estuary.
Land cover, as considered here, can be a helpful indicator of overall health of the Delaware Estuary and Basin at the landscape scale. When considering land cover impacts at higher levels of detail it can be helpful to consider other factors and data sources such as higher-resolution land us, topography, transportation networks, and crop or forestry information, as well as ground-verified data.
Impervious cover is defined as features on the ground that prevent water from infiltrating, causing it to run off. Imperviousness as a watershed metric is the measure of the degree to which an area of the ground is covered by such features. Examples of impervious cover include roads, parking lots, rooftops, and any other hard or impermeable surfaces. Impervious cover disrupts the normal hydrologic cycle, in which a portion of atmospheric precipitation is able to percolate into the ground and help recharge the groundwater table. Water that runs off rather than infiltrating the ground can cause problems with pollution entering streams and other waterbodies and more potential for flooding. High percentage of impervious cover leads to more polluted waters, streams that are more flood-prone, and lower streamflow in dry periods. Measuring imperviousness gives an indication of the overall health of a watershed.
As the percentage of impervious cover increases in a watershed, the overall stream quality tends to decline (Fig 1.3.1). Studies have shown that impervious cover in the landscape can negatively affect stream quality and watershed health at levels between 5% and 10% of the total area. Above the 10% threshold streams are considered “impacted”, and when imperviousness exceeds 25% of the watershed area, streams are “non-supporting” in terms of adequate water quality, habitat, hydrology and channel stability (Schueler et al. 2009). A survey of 225 research projects assessing the correlation of degree of impervious cover stream and aquatic life condition compiled by the Center for Watershed Protection links the presence of impervious cover to a list of impacts, including: reduced macroinvertebrate and fish diversity; decline in biological function; increase in stream temperature; decline in channel stability and fish habitat; and compromised wetlands water quality and water level fluctuation (Schueler et al. 2009).
Figure 1.3.1 Center for Watershed Protection’s model of impervious cover impacts on streams. Adapted from Schueler et al. (2009).
Measures of impervious cover can be derived in several ways. Using satellite imagery and image processing techniques it is possible to determine the characteristic imperviousness on a given area of the ground. The USGS National Land Classification Database (NLCD) consists of a series of image products including land cover, forest cover, and imperviousness, based on a 30 by 30 meter ground resolution (pixel size). These data are available for the U.S. starting in 2001, every few years, through 2019. For this study the NLCD data for impervious cover for the years 2001, 2006, 2011, 2016, and 2019 were used to assess both the current level of imperviousness on a watershed basis, as well as the change in imperviousness by watershed over that time period.
Other methods include direct measurement of impervious cover through photo interpretation of aerial photography, or use of representative imperviousness values based on land cover classifications. This latter technique has been used in previous States of the Estuary and Basin reports. Specifically, the NOAA Coastal Change Analysis Program (C-CAP) data was used to apply a representative value of imperviousness based on land cover type. While this method provides a flexible, consistent, and easily replicable method for determining imperviousness on a watershed basis, the data is not available for dates later than 2016. Additionally, the NLCD data has the advantage of being specifically produced to quantify imperviousness in the continental U.S. A drawback is that the data are reported on a percentage basis, with each 30 by 30-meter pixel assigned a percentage score, rather than a fixed amount of impervious cover. However, this limitation was addressed by calculating for each pixel the predicted amount (area) of impervious cover within a given pixel.
Another potential limitation is that the data are developed only for urbanized areas; areas that do not comprise a non-natural land cover type are not considered in calculation of the impervious percentage. Therefore, though the data are well-suited for analysis at a watershed scale, they should not be used at scales requiring a high level of detail (e.g., the neighborhood scale). The consistency and temporal resolution (i.e., every few years), as well as the availability of recent data, made this the preferred data source for impervious analysis for this report.
Determination of the current status of imperviousness on a watershed basis was performed for the Delaware Estuary and Basin and Estuary based on the 2019 NLCD impervious cover dataset. To analyze change over time, data for 2001, 2011, and 2019 were also considered. The impervious layers for each of these years were used to calculate the total amount of imperviousness for each pixel of the datasets. The total amount of imperviousness by watershed was calculated by summing the amount of impervious within each watershed. Statistics were compiled at three scales: the USGS Hydrologic Unit Code 12 digit watershed (HUC12; the smallest watershed division available on a national basis), as well as the Delaware River Basin Commission designations consisting of ten watersheds in the Delaware Estuary and Basin, plus a further division into 21 smaller watersheds, see Table 1.3.1.
Impervious cover in the Delaware Estuary and Basin varies dramatically across its 21 watersheds. Higher levels of development correlates to a higher degree of imperviousness. Based on 2019 data, watersheds in the greater Philadelphia area have the highest degree of imperviousness, with the watershed containing Philadelphia at more than 25% impervious, while those on the Delaware Bayshore and in the Central Region have somewhat lower values. The Upper Region is the least affected by impervious cover, with most values well under 2% (Figures 1.3.2, 1.3.3).
Impervious at the HUC 12 level shows the distribution of imperviousness at a higher resolution, with the area around Philadelphia showing the highest degree of imperviousness, with additionally high values in the I-95 corridor in Delaware, and in the upper reaches of the Schuylkill and the Lehigh River Valleys (Figures 1.3.2, 1.3.3).
Figure 1.3.4 presents the current (2019) imperviousness, by watershed in the Delaware Estuary and Basin, as a percent of land cover. Figure 1.3.5 shows the distribution of HUC 12s based on their percentage imperviousness in 2019. The red and orange lines in the graph indicate the level of imperviousness above which streams are considered “Nonsupporting” and “Impacted”, respectively, according to the Center for Watershed Protection’s Impervious Cover Model (ICM). Out of a total of 428 HUC 12s, 65 watersheds (15.2%) are above the 10% Impacted threshold, while 29 (6.8%) are Nonsupporting. In 2019, of the 21 watersheds, one (UE1) is above the threshold for being Nonsupporting, and an additional four (UE2, LE1, LV3, and SV3) are above the 10% Impacted impervious threshold.
Table 1.3.1 Watersheds, watersheds, and regions of the Delaware River Basin.
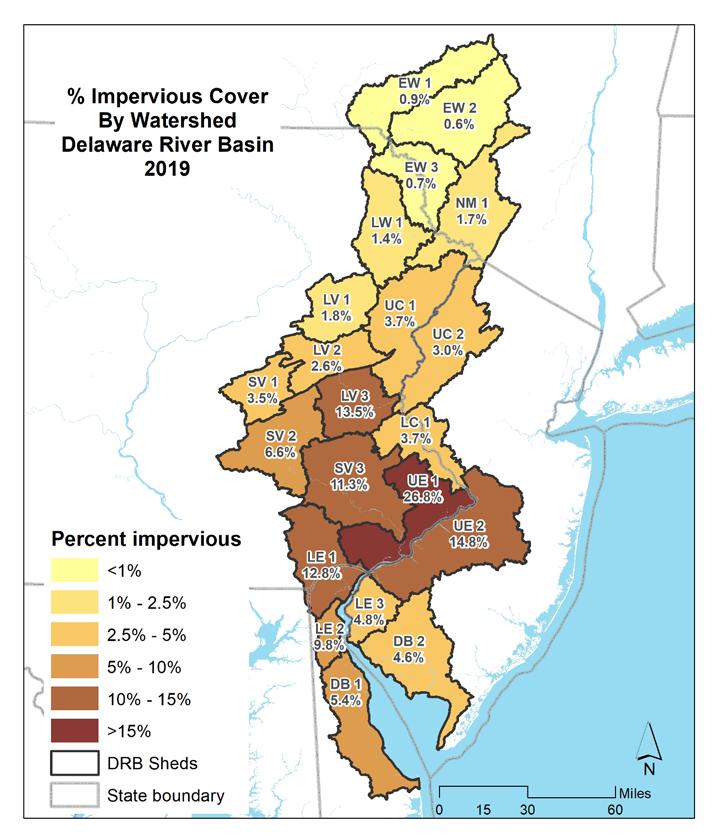
1.3.2 Percent impervious cover by the 21 watersheds in the Delaware River Basin (2019).
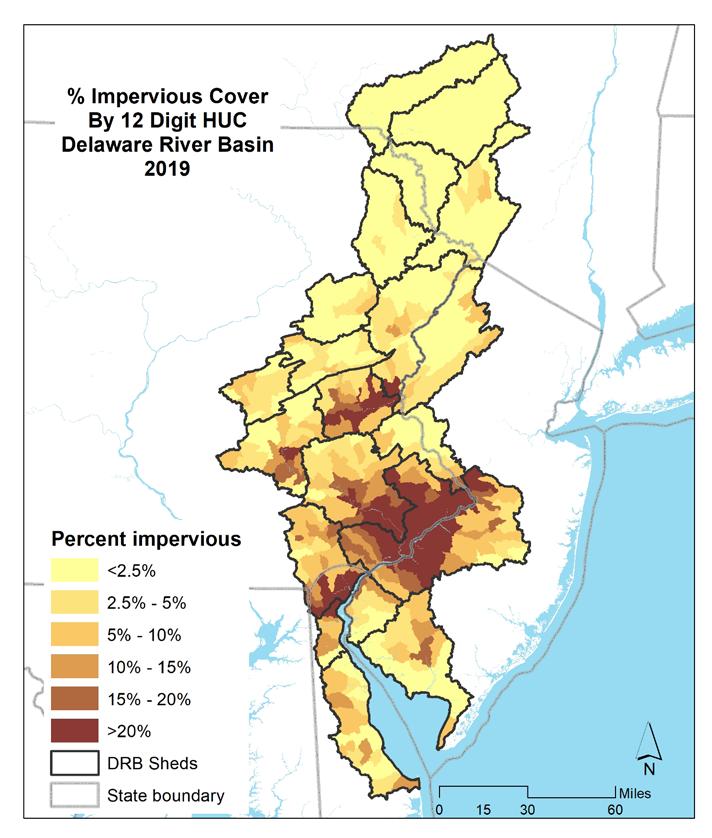
1.3.3 Percent impervious cover by 12-digit HUC watershed in the Delaware River Basin (2019).
12-digit HUC watershed in the Delaware River
1.3.5
of percent impervious cover by watersheds in the Delaware River Basin (2019).
Over time, as watersheds become increasingly developed, the amount of imperviousness also increases. Watersheds with low levels of imperviousness that see a significant increase in development will experience a large percent increase in impervious cover. The most significant increases were seen in the UE2 in New Jersey, LV3 in Pennsylvania, and LE2 in Delaware (Table 1.3.2). These are not the most highly developed watersheds (i.e. those comprising the Philadelphia area and the I-95 corridor), but in the areas adjacent to those watersheds, indicating an increase in development, and thus stress on the watershed health. Maps in Figures 1.3.6 and 1.3.7 presents the percentage change in imperviousness for each HUC12 and 21 watersheds, respectively, in the Delaware Estuary and Basin based on the NLCD between 2001 and 2019. The highest changes were seen in the greater Philadelphia area (i.e., LV3, SV3, UE2, and LE2). The watersheds of the Upper Region of the Delaware Estuary and Basin remained low in imperviousness and showed little change over the period.
Figure 1.3.8 presents trends in imperviousness by watershed, for the years 2001, 2011, and 2019. Also shown are the thresholds for Impacted (orange line) and Nonsupporting (red line) watersheds. The sharp rise in imperviousness in the watersheds surrounding the most highly urbanized areas is notable, as is the nominal increase in the less highly impervious watersheds of the upper Delaware Estuary and Basin.
Figure 1.3.9 presents the increases in imperviousness for Delaware Estuary and Basin HUC 12s 2001–2019.
Table 1.3.2 Percentage change for each watershed, by region within the Delaware Estuary and Basin.
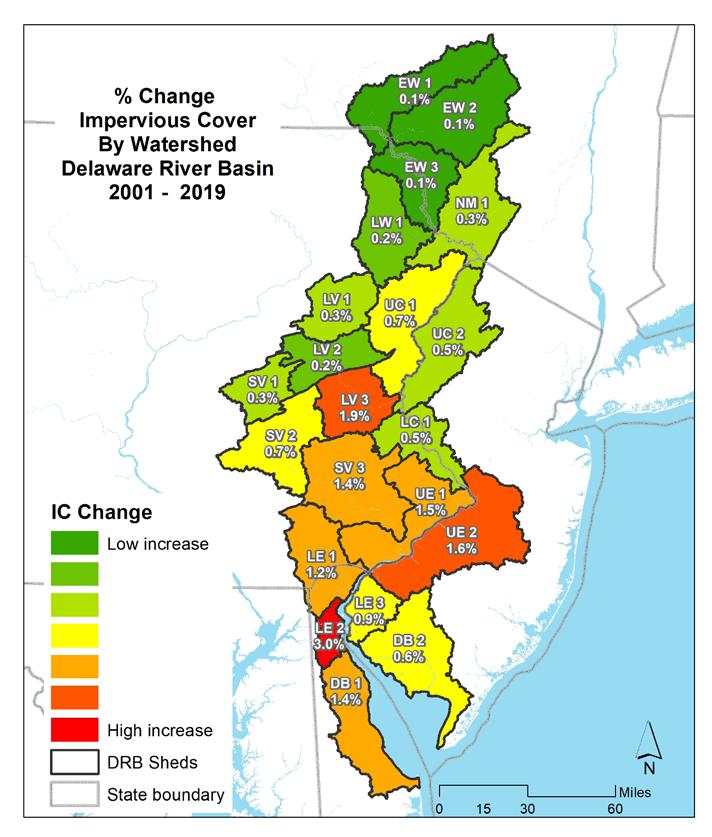
1.3.6 Percent change in impervious cover by the 21 watersheds in the Delaware River Basin (2019).
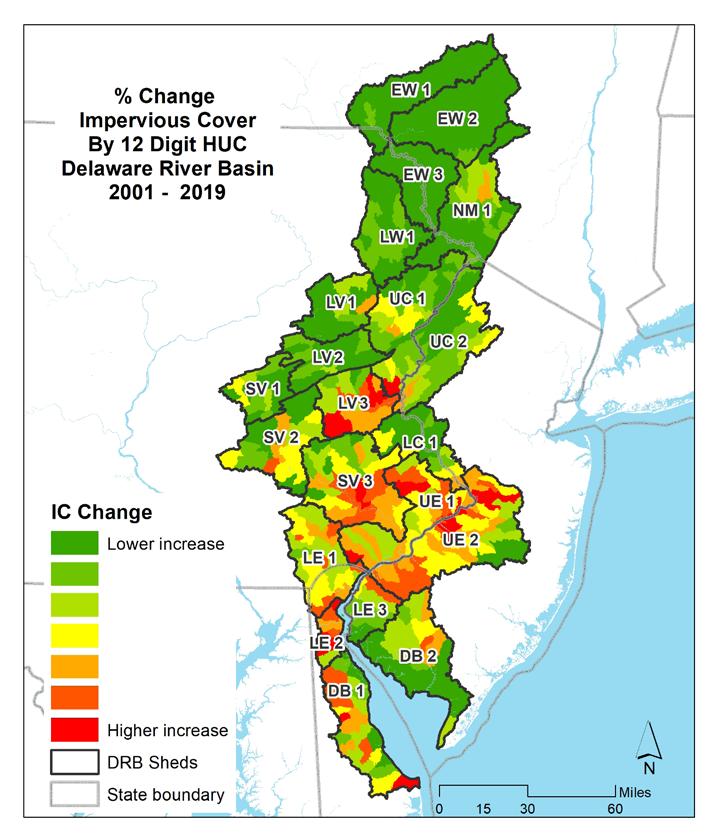
1.3.7 Percent change in impervious cover by 12-digit HUC watershed in the Delaware River Basin (2019).
1.3.8 Percent changes in impervious cover by watershed from 2001-2019.
2001 - 2019
Number of HUC 12s = 428
1.3.9 Histograms of increases in the percent impervious cover from 2001-2019 by HUC12.
Table 1.3.3 shows the total number of HUC 12s in the Basin that are either Impacted (above 10% impervious) or Nonsupporting (over 25% impervious). Of the 428 HUC 12s, 55 (12.9%) were Impacted in 2001, and by 2019 that number had increased to 65 (15.2%). In 2001, 26 (6.1%) of HUC 12s were Nonsupporting, and by 2019 that had increased by three to 29 (6.8%). In all, the number of Impacted or Nonsupporting HUC 12 watersheds increased from 81 (18.9%) in 2001 to 94 (22%)in 2019.
Table 1.3.3 Number of HUC12s that are impacted or nonsupporting.
Total HUC 12s 428 428 428
Impacted (I) 55 (12.9%) 61 (14.3%) 65 (15.2%)
Nonsupporting (N) 26 (6.1%) 29 (6.8%) 29 (6.8%)
All (I & N) 81 (18.9%) 90 (21%) 94 (22%)
While there is a clear trend upward in imperviousness in the watersheds of the Delaware Estuary and Basin, future directions will depend on land cover, demographic, and economic trends. It is possible to mitigate the negative impacts of imperviousness through proper watershed management. Local and regional planning efforts can improve issues of stormwater, flooding, water quality, and other problems that stem from an excess amount of runoff due to impervious cover. As population and development pressures increase, along with the effects of climate change, impervious cover will remain a primary concern for water resources managers and governmental entities.
Two efforts are important to limit the negative effect of imperviousness on the watersheds of the Delaware Estuary and Basin. Large scale planning through bodies such as the federal and state governments, the Delaware River Basin Commission, National Estuary Programs, and many local partners will be required to address water quality and quantity issues caused by excessive runoff from impervious cover.
Funding for transformational efforts at addressing climate change and the impacts of human development should be provided at higher levels. While the Delaware Estuary and Basin has been less-well funded than other large regional basins, recent trends in infrastructure investment, along with public/private partnerships such as the Delaware River Watershed Initiative (DRWI) will help address these problems, and will serve as a catalyst for further investments across the basin.
Impervious cover is a key metric for tracking and predicting watershed health in terms of water volume, water quality, stream and riparian habitat, and drinking water supply. The trend in increased imperviousness will threaten watersheds at all scales. Smaller urbanizing catchments can be particularly vulnerable, given the increasing transformation of land to developed land cover types, along with relatively weaker local regulations and public will to control imperviousness and the resultant runoff.
Protected lands are those defined as permanently non-developable (i.e., to urban or suburban uses) because it is either owned outright (fee simple ownership) by a government or other entity which explicitly protects it, or it has an easement that limits or precludes development by the owner due to a legal agreement with a third party. Fee simple protected land is owned by federal, state, or local governments, or by private or non-profit entities, and the owner restricts development of the land. Such land might include state or national parks, preserves, wildlife management areas, wildlife refuges, historic parks, recreational areas, or homeowner association (HOA) owned open space within developments, among others. Eased land can be any open land to which the development rights have been permanently sold or transferred by the owner to a third party. The third party can be a land trust, local or state government, or other private entity. The easement can be designated for a specific purpose, such as agriculture, wildlife conservation, forestry, historic or cultural resources, or other use.
The degree of protection in a watershed afforded by such permanently protected land is important to the current and future health of that watershed. Areas with a high percentage of protected land will undergo less potential development pressures in the future, and are therefore more likely to sustain a higher level of ecological, recreational, historic, and water-quality related integrity. Areas without such protections remain vulnerable to degradation due to more intensive development.
Land which is protected and accessible to the public also provides benefit to the human population in terms of outdoor recreation and ability to enjoy associated benefits to health and well-being. The amount of publicly accessible protected land is also an important indicator of how the presence of protected land can benefit the population of the Delaware Estuary and Basin.
The USGS Gap Analysis Program (GAP)1 has tracked the location and extent of public open space through their Protected Areas Database of the United States (PAD-US). The data are derived from a wide variety of sources, including local, state, national datasets and data provided by private and non-profit entities. The program periodically compiles and inventories protected land nationally, including those owned by federal, state, regional, local government entities, as well as land owned by private and non-profit organizations for the specific purpose of protecting their resources. Additionally, land that is eased by various public, private, and non-profit entities is included in the database. The program also tracks which lands are open to the public and to what degree (e.g., open access versus restricted due to fees or other constraints).
PAD-US data have undergone several iterations over time, starting with Version 1.0 in 2009. The program has released periodic updates to the dataset (available in various GIS formats) since then, with the latest
1. The mission of the USGS Gap Analysis Program (GAP) is providing state, regional and national assessments of the conservation status of native vertebrate species and natural land cover types and facilitating the application of this information to land management activities. The PAD-US geodatabase is required to organize and assess the management status (i.e., apply GAP Status Codes) of elements of biodiversity protection. GAP seeks to increase the efficiency and accuracy of PAD-US updates by leveraging resources in protected areas data aggregation and maintenance as described in “A Map of the Future,” published following the PAD-US Design Project (July, 2009) available at: http://gapanalysis.usgs.gov/padus/vision/ with updates coming soon. While PAD-US was originally developed to support the GAP Mission stated above, the dataset is robust and has been expanded to support the conservation, recreation and public health communities as well. Additional applications become apparent over time. See the GAP Website http://gapanalysis.usgs.gov/padus/resources/ or the companion site http:// protectedlands.net/uses for more information.
version, and the version used in the current analysis (Version 2.1), having been released in September, 2020. While each iteration of the data theoretically can be used as a “snapshot” in time to determine the overall level of protection (and public access) for each particular year, the data are not easily comparable across time-scales. This is due to the difficulty in compiling data from disparate sources, and in manually cross-walking datasets to make sure they are accurate and not duplicative. If data from one era are missing a source, or if data from two sources overlap partially or entirely, for instance, comparison between releases is problematic. The PAD-US program, in fact, on their website explicitly discourages such comparisons.
While the data in Version 2.1 has been greatly enhanced to be more complete and accurate than that in previous versions, there were still issues with the data which required some additional manual editing and additions. Since the date of establishment is not available for many properties (both fee owned and eased), the decision was made to only derive two periods for trend analysis: pre- and post-2010. To determine the dates of particular tracts of land that were not included in the data already, other data sources, such as previous versions of the PAD-US data as well as Internet searches of the relevant organization/owner were used. Where dates could not be determined, the parcel or property was assumed to have been protected prior to 2010 for analysis purposes. In some cases lands may have been protected in phases, with many years (or decades) separating the protection of different parcels. In this event, the date used was for the primary, largest, or first major parcel protected. Also, in some cases ownership may have changed from one entity (from state to federal, for instance), which complicated the analysis.
While the data in Version 2.1 of PAD-US was structured and cleaned more thoroughly than in previous versions, some editing, such as in the case of overlapping polygons was still necessary in a few instances. There were also incidences of missing or incomplete information (including dates of protection), and this was addressed using ancillary data, such as The Nature Conservancy’s 2018 Secured Lands database. New Jersey’s Department of Agriculture was also used to fortify the dataset of eased lands in the New Jersey portion of the Delaware Estuary and Basin.
Once the data were enhanced using the steps outlined above, analysis was undertaken in GIS to determine the extent of the characteristics of interest, by each of the 21 watersheds of the Delaware Estuary and Basin. Firstly, for each fee owned preserved property, the area was calculated based on ownership type for each period, pre- and post- 2010. The database included military installations and school district lands, so these were excluded before the areas were summarized. Table 1.4.1 shows the ownership types used for the analysis. Note that “Local” owner types include county and municipal government, while “Unknown/Other” includes unknown owners and lands with joint ownership. Similarly, the area of permanently eased lands was calculated (for both pre- and post-2010 time periods), based on the type of easement. Table 1.4.1 presents the easement types used in the analysis.
To determine the amount of protected land that is also accessible to the public, information from the PAD-US database was used. Land was considered open if there was open access or access restricted by fee or membership. In the database these have the code “OA” and “RA,” respectively. Areas that were closed to access, or of unknown status were not included as providing public access (“XA” and “UA”, respectively, in the database).
For each component of the PAD-US data considered, the total summary of land by category was tabulated and mapped. For the area of fee owned and eased lands the pre- and post-2010 trend was also considered. For public access, only the latest (2020) conditions were analyzed and presented.
Table 1.4.1 Ownership and easement types in the PAD-US.
Type Description Database code
Federal FED
State STAT
Local LOC
Owner
Easement
Non-profit/NGO NGO
Private PVT
Unknown/other UNK / JNT
Agricultural AGRE
Conservation CONE
Forestry FORE
Historical HCAE
Recreational RECE
Unknown/other OTHE / UNK
The following maps (Figures 1.4.1 to 1.4.4) show the distribution and types of protected land in the Delaware Estuary and Basin in 2020, including fee simple ownership (i.e., land that is owned completely) and easements (i.e., lands with legal development restrictions). Fee lands are symbolized according to the owner type, while easements are presented by type of easement. Within the 12,857 square mile Delaware Estuary and Basin in 2020, there were nearly 2,050 square miles of land protected through fee simple ownership, or 15.9% of the total land area in the basin. Of the protected lands, the most was protected by states—nearly 1,350 square miles, or 10.5%—with the next highest share protected at the local level (counties and municipalities), with 327 square miles, or over 2.5% of the land area. Federal lands and NGO lands were the next most significant holdings, with 178.5 and 141.4 square miles (1.4% and 1.1%), respectively. In 2020 land protected through easements made up over 862 square miles of the Delaware Estuary and Basin, which translates to 6.7% of the total land area. Of these, 567 were agricultural easements (4.4%) with other/unknown easements making up the next largest proportion, at nearly 148 square miles (1.15%). Conservation easements were also a significant proportion of protected land, representing over 126 square miles, or nearly 1% of the total land area in the Delaware Estuary and Basin. Figure 1.4.5 shows the proportions of fee simple owned land by ownership and eased land by type. Table 1.4.2 summarizes the total areas and percentages for land protected through easement in the Delaware RIver Basin.
The highest proportion of fee simple owned protected land are found in the upper reaches of the basin, in the headwaters of the Lehigh Valley (LV 1) with nearly 42% of the land protected, and along the main stem of the Delaware River above the head of tide (Upper Central and Neversink-Mongaup watersheds). The lands along the Delaware Bayshore also have a relatively high proportion of protected land; Delaware Bay watersheds have nearly 30% protection in New Jersey, and nearly 20% on the Delaware side. The more urbanized watersheds in the central portions of the Delaware Estuary and Basin have somewhat lower degrees of protected land.
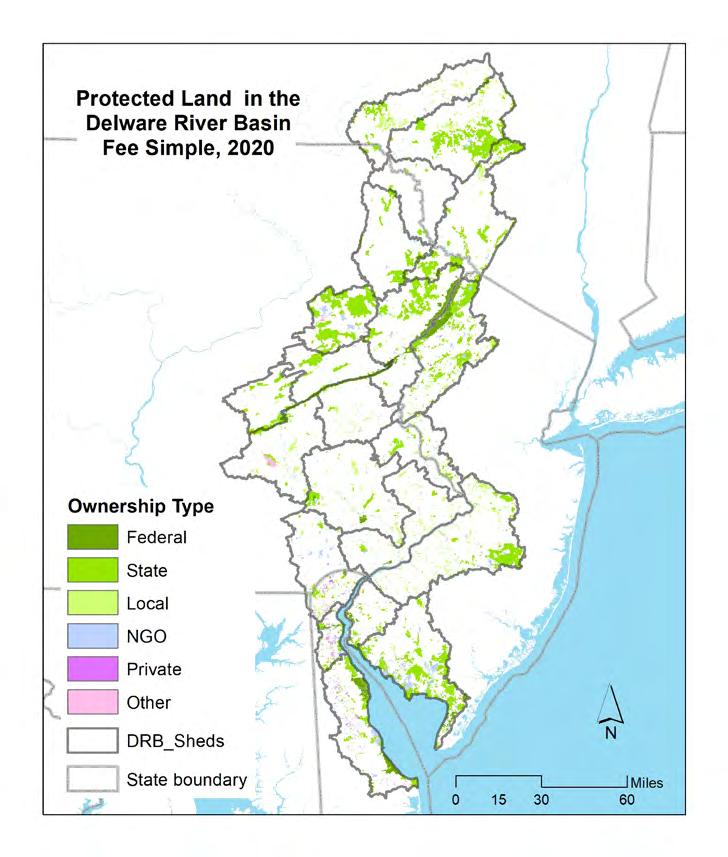
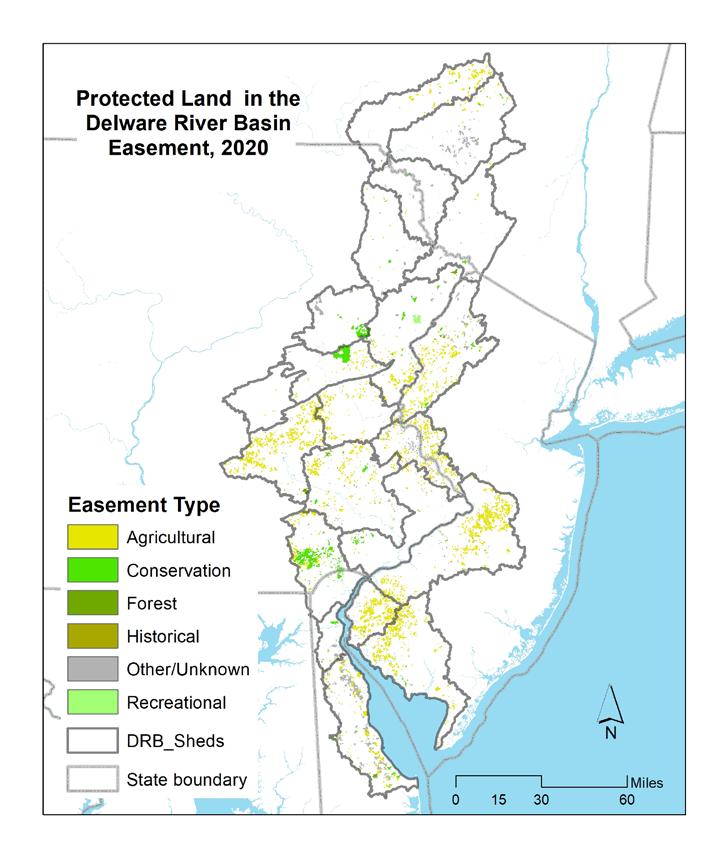
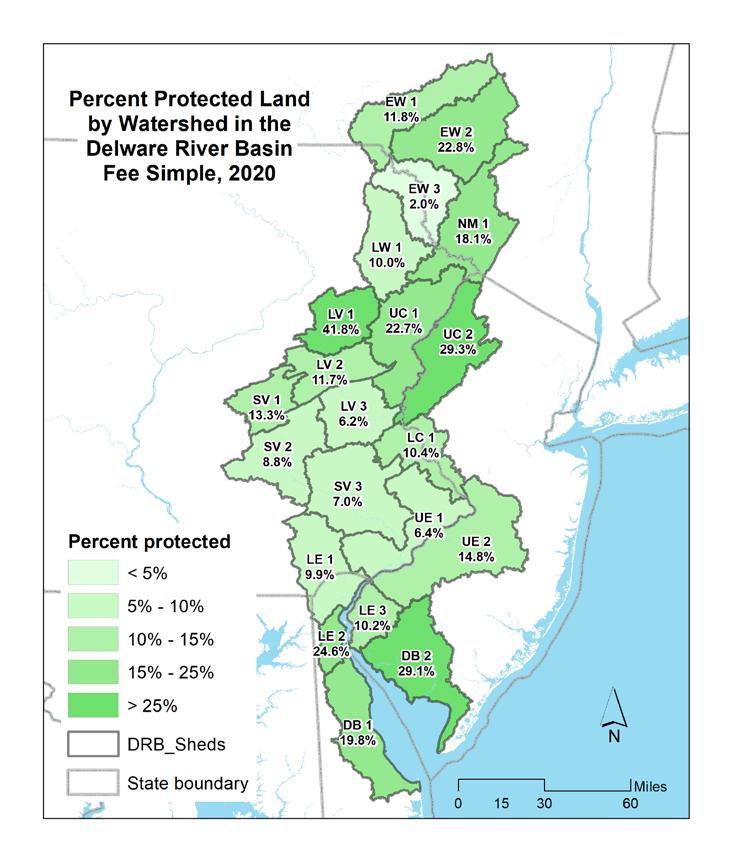
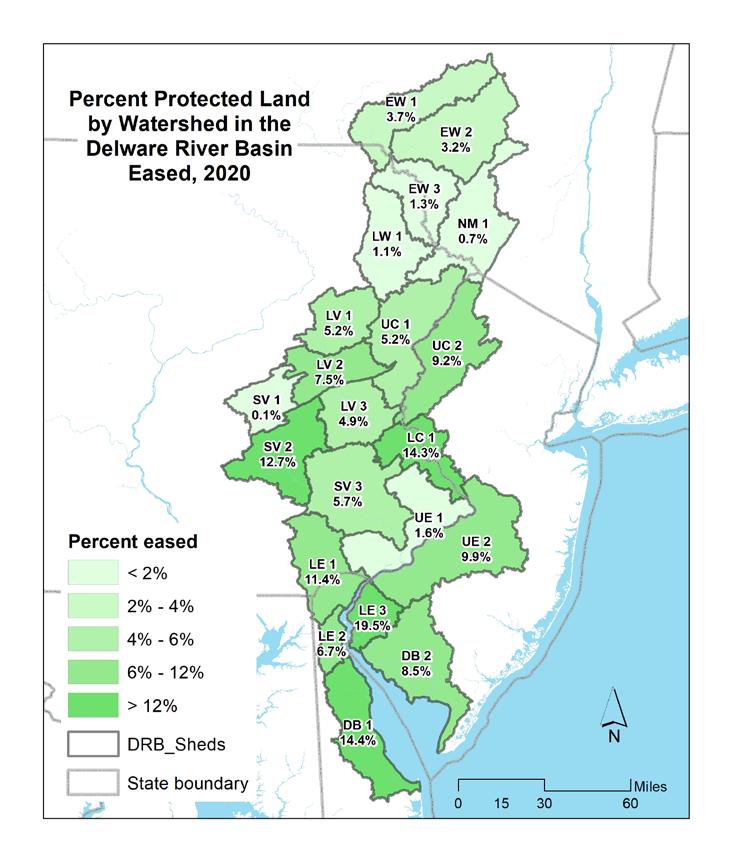
Figure 1.4.5 Proportion of protected land by fee simple ownership (A) and easement type (B).
Conversely, easements tend to be more prevalent in the central portion of the basin, with Schuylkill Valley (SV 2) at 12.7% protected, and Lower Central (LC 1) at 14.3% protected. The upper reaches of the basin have lower proportions of eased land, but are highly forested and protected through ownership. Table 1.4.2 presents the total fee owned and eased protected lands in the Delaware Estuary and Basin in 2020 by major watershed. Overall in the basin, there are over 2,900 square miles of protected land, or 22.6% of the total land area.
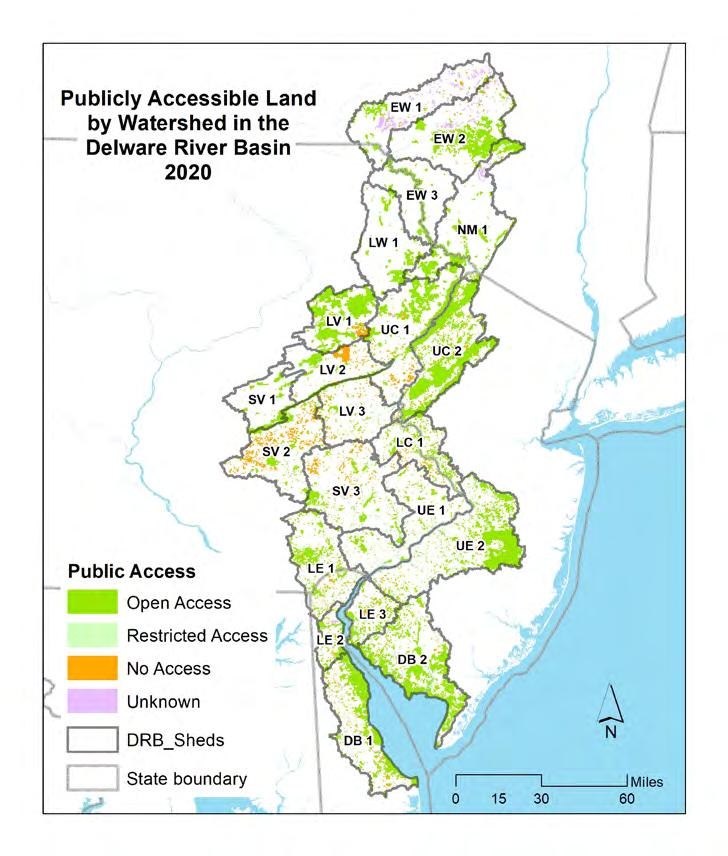
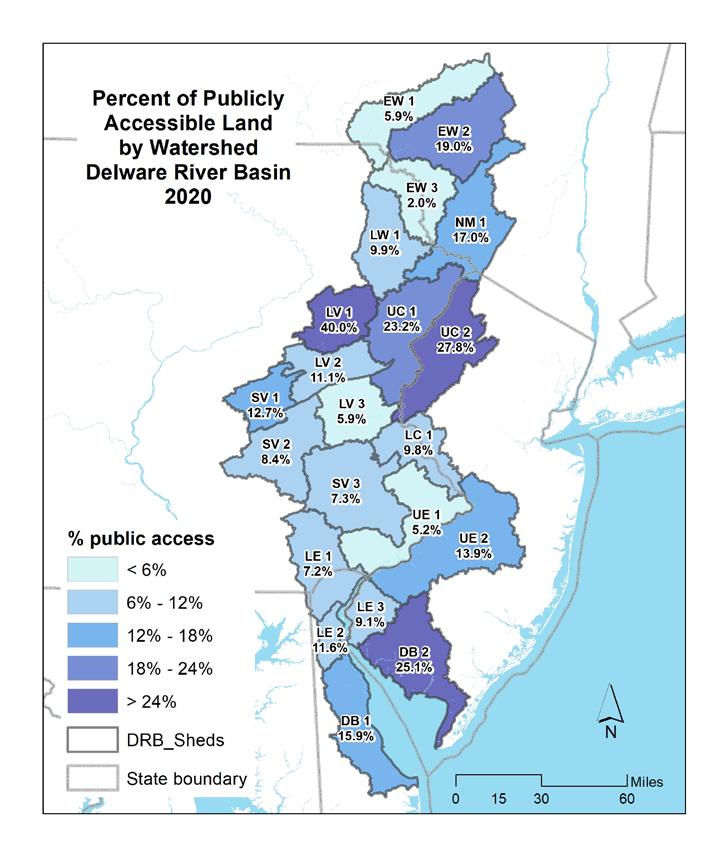
Access to protected lands by the public is an important factor in promoting watersheds as a direct public benefit. Allowing access to open spaces is an important factor in peoples’ quality of life, and can have the effect of promoting and encouraging further protection measures. Table 1.4.3 summarizes the square mileage and percentage of publicly accessible protected land in the Delaware Estuary and Basin, by watershed. The map in Figure 1.4.7 shows the properties in the Delaware Estuary and Basin that are open to the public, either with no restrictions, or through fee- or membership-based access. Central portions of the basin have the most land available, as a percentage of total land area, for public access, with an average of approximately 25% in the Upper Central watershed, and 40% in the headwaters of the Lehigh Valley watershed (LV 1)(Figures 1.4.6, 1.4.7). Other areas, including the upper portion of the basin, watershed (EW 2) and the Delaware Bayshore (DB 2) also have a high proportion (19% and 25%, respectively) of protected land accessible to the public. The Estuary portion of the Delaware Estuary and Basin has 728 square miles of protected land accessible to the public, or 12% of the total land area. The Upper Basin (non-tidal portion) has 1,095 square miles publicly accessible, over 16% of the total land area.
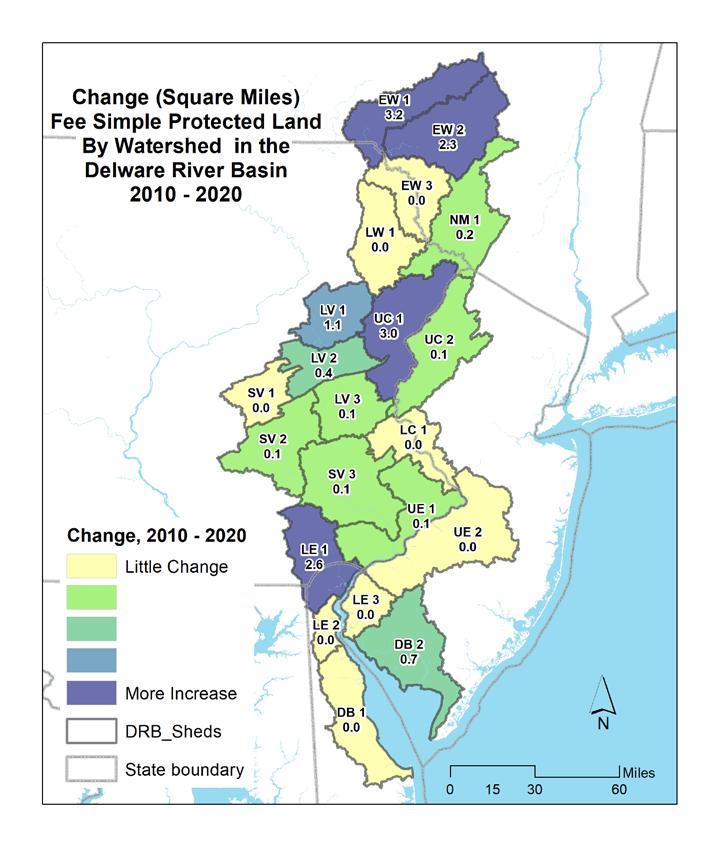
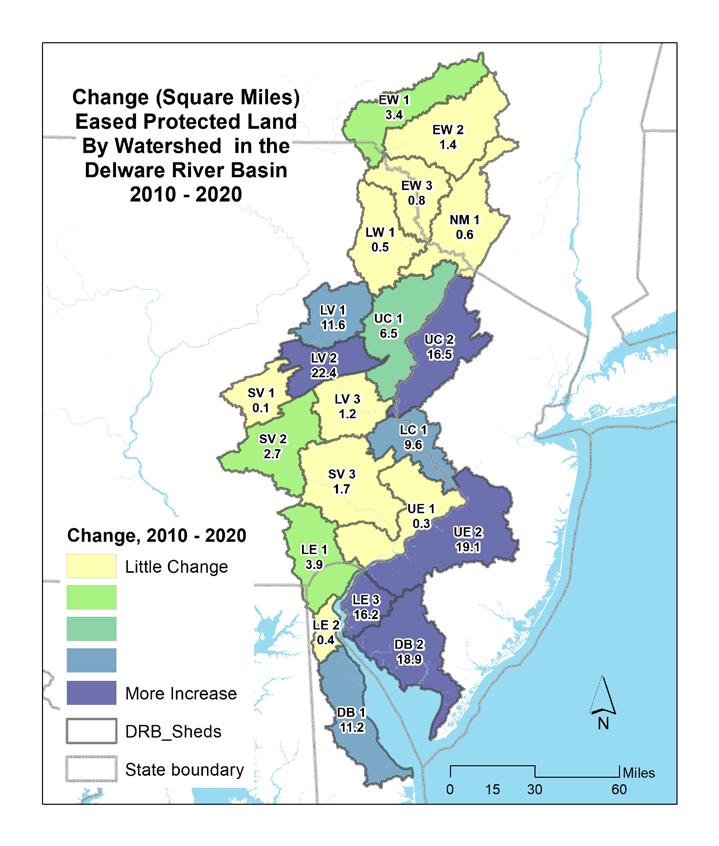
The total area of protected land tends to change rather slowly over time, as the process of purchasing land or going through the easement process can be lengthy. This analysis used a 10-year time frame (between 2010 and 2020) due to the difficulty of compiling establishment date information compiled prior to widespread availability of GIS data (for instance through programs such as the PAD-US). The maps in Figures 1.4.8 and 1.4.9 show the change, by each of the 21 watersheds of the Delaware Estuary and Basin, in fee owned protected land and easement, between 2010 and 2020.
Table 1.4.3 Protected lands with public access in the Delaware River Basin.
1.4.6 Public access to protected lands in the Delaware River Basin (2020).
lands
The watersheds with the highest increase in fee owned protected land are in the Lower Estuary (LE 1), with 2.6 square miles added between 2010 and 2020, UC 1, with 3 square miles added, and EW 1 and EW 2, with 3.2 and 2.3 square miles added, respectively. The increase in the East-West watersheds (EW 1 and EW 2) are due primarily to purchases made the New York City to retain open lands for reservoir protection. In the Lower Estuary (LE 1), the increase was due primarily to acquisitions and transactions relating to the First State National Historical Park, while in Upper Central (UC 1) most changes were due to purchases by a variety of localities and non-governmental organizations.” Overall, the Delaware Estuary and Basin added 13.9 square miles, or 0.1% of the total land area, of fee owned protected land, and 149 square miles (1.2% of the total land area). See Tables 1.4.4 and 1.4.5 for the basin-wide totals and change for fee owned and eased protected land by owner type and easement type, respectively. Figure 1.4.8 presents the change in fee simple protected land, by ownership type and as a total for the Delaware Estuary and Basin. Figure 1.4.9 presents the change in land protected through easement, by easement type and as a total for the Delaware Estuary and Basin.
Table 1.4.4 Ownership and easement types in the PAD-US dataset.
Table 1.4.5 Ownership and easement types in the
1.4.8 Change in fee simple protected land by ownership (2010-2020).
1.4.9 Change in eased land by type (2010-2020).
The pace of land protection is fairly slow, so it is unlikely that very large changes to the overall percentage of protection is going to occur. There is a broad recognition, however of the many benefits of land preservation. Many public entities at the federal, state, county, and local levels have active programs to foster and encourage preservation efforts. New developments often have open space requirements, and the many land conservation organizations are active in various locations throughout the Delaware Estuary and Basin.
Easement programs provide funding and support for preservation of current conditions, such as through agricultural preservation and conservation easements. The amount of land in easement is therefore steadily increasing, though it is generally focused only in certain locations. Recognition of the multiple benefits of preserving open space is widely recognized by the public and by public, private, and nonprofit entities.
Coordination among federal, regional, state, local, and private/non-profit organizations remains important, as competing interests among watershed stakeholders becomes more intense. Through regional-scale efforts such as the Delaware River Watershed Initiative (DRWI), and organizational frameworks such as the Partnership for the Delaware Estuary (PDE) and the Delaware River Basin Commission (DRBC), this coordination has been improving. Data collection and coordination efforts, such as the PAD-US are necessary to help compile and disseminate information. Accurate and complete layers of data are critical as organizations prioritize their focus to maximize benefit to the overall health of the watershed. Support of such regional and national coordination should continue. Future iterations of the data will become more refined and comprehensive; therefore, this effort should be supported to periodically provide updates.
Programs that target preservation of land need to be properly funded, and should be given priority by governments and regulators. Public awareness of the importance both of open space and protection of existing land-based resources should also be a priority and coordinated at the watershed scale. Creation of additional areas of protected land that are also open to the public is important for the well-being of watershed residents, and for the promotion of understanding of the importance of protections for watershed health.
As the pool of available open land which could be protected is always shrinking, planning for and prioritizing and coordinating future protection efforts is crucial. While many areas of the Delaware Estuary and Basin are fairly well-protected by fee ownership and easements on land, overall the basin has over 2,900 square miles of protected land (more than 22% of the total land area). Some watersheds, however have lower levels of protection. Some areas are already developed, but many have ample opportunities to increase the amount of protection afforded either through ownership or easement.
Public accessibility to protected open space is an important factor to the well-being of the basin’s inhabitants. Currently, the Estuary portion of the Basin has about 12% of land protected and publicly accessible. The Upper Basin watersheds has over 16% of the total land area accessible to the public, with the Delaware Estuary and Basin overall having 14.2% of its land area accessible. The combination of robust levels of protection and increasing access to protected open spaces for the public will go far in fostering watershed health and multiple benefits to the inhabitants of the Delaware River Basin.
Davis, James C., Anil Rupasingha, John Cromartie, and Austin Sanders, “Rural America at a Glance, 2022 Edition,” Economic Information Bulletin No. 246, U.S. Department of Agriculture, Economic Research Service, Washington, DC, 2022.
Gao, J. and O’Neill, B., 2021. Different Spatiotemporal Patterns in Global Human Population and Built‐Up Land. Earth’s Future, 9(8), p.e2020EF001920. https://agupubs.onlinelibrary.wiley.com/doi/ pdfdirect/10.1029/2020EF001920
Kauffman Jr, G.J., 2010. The Delaware River revival: Four centuries of historic water quality change from Henry Hudson to Benjamin Franklin to JFK. Pennsylvania History: A Journal of Mid-Atlantic Studies, 77(4), pp.432-465. https://journals.psu.edu/phj/article/download/59953/59771
Kauffman, G.J., Homsey, A.R., Belden, A.C. and Sanchez, J.R., 2011. Water quality trends in the Delaware River Basin (USA) from 1980 to 2005. Environmental monitoring and assessment, 177(1), pp.193-225. https://link.springer.com/content/pdf/10.1007/s10661-010-1628-8.pdf
Schueler, T. R., L. Fraley-McNeal, and K. Cappiella. 2009. “Is Impervious Cover Still Important? Review of Recent Research.”Journal of Hydrologic Engineering, 14(4).
Vespa, Jonathan, Lauren Medina, and David M. Armstrong, “Demographic Turning Points for the United States: Population Projections for 2020 to 2060,” Current Population Reports, P25-1144, U.S. Census Bureau, Washington, DC, 2020.
Technical Report for the Delaware Estuary and Basin Partnership for the Delaware Estuary—Host of the Delaware Estuary Program