Supporting Local Governments in British Columbia to Implement Energy Benchmarkin
Prepared by:
Lisa Westerhoff, Stewart Somerville and Jiaxin Li
With special thanks to all who contributed:
Derek de Candole – City of Victoria
Glen Cheetham – City of Kamloops
Gurmeet Singh – City of Vancouver
Maggie Baynham – District of Saanich
Maria Thorlakson - Resort Municipality of Whistler
Matt Greeno – Capital Regional District
Sharane Simon – Efficiency Canada
Ting Pan – City of Nanaimo
1 Introduction
1.1 Benchmarking, Reporting and Disclosure Programs in Canada
Benchmarking, reporting, and disclosure requirements are on the rise in Canada as provincial and local governments seek to better understand and support their communities’ building stocks in reducing their energy consumption and related carbon emissions. Energy benchmarking refers to the process of measuring and tracking a building’s energy performance over time and comparing the data with peers, while reporting refers to the act of sharing that benchmarked data with an authority having jurisdiction, such as a city or province Benchmarking and reporting programs are often coupled with some form of disclosure, which makes benchmarking data available and/or visible to the public.
While benchmarking, reporting and disclosure programs don’t require any action on the part of building owners to improve their building’s performance, studies have shown that benchmarking and disclosure drive action and yield cumulative average energy savings of up to 7% over 3 years 1. They also often form the foundation for subsequent policy development to support and/or compel existing buildings to reduce energy use and emissions as part of the broader effort to meet local climate targets.
There is increasing momentum in the emergence of both mandatory and voluntary benchmarking programs and policies across North America. To date, Ontario is the only province in Canada that currently requires building energy benchmarking and reporting, and until recently, the only examples at the municipal scale that could be pointed to were voluntary programs initiated by a handful of larger cities (e.g., Calgary, Edmonton, Winnipeg). In British Columbia (BC), many local governments have elected to participate and/or encourage local participation in OPEN’s Building Benchmark BC (BBBC) program, which has collected energy and emission performance from across participating jurisdictions for the last three years.
Building Benchmark BC
Building Benchmark BC (BBBC), launched on January 21, 2020, is a voluntary benchmarking and disclosure program led by local and regional governments. At its inception, there were no mandatory energy benchmarking programs in BC. Partner jurisdictions of BBBC inform and invite building owners and managers to participate in and share energy data with the program. The program manager and administrator, OPEN Green Building Society acting on behalf of government partners, analyzes and discloses data through both public and targeted disclosure channels (refer to 3.6.1).
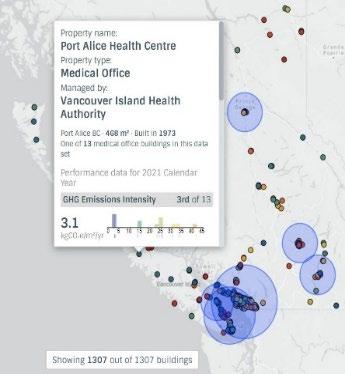
In February 2024, BBBC released its Year 4 Annual Report, which shows that the BC benchmarking community expanded to include over 80 participating municipalities, public sector organizations and private sector portfolios, with a total of 13.8 million square feet gross floor area participating in the program.
The program enhances jurisdictions' understanding of the role of energy benchmarking and disclosure in a broader framework of climate regulations, policies, and incentives, and cultivates the capacity of industry and governments, fostering the adoption of energy benchmarking and disclosure practices across BC.
In 2022-2023, a shift towards mandatory programs in Canada began to emerge with the initial approval and/or launch of three new benchmarking, reporting, and disclosure requirements in the cities of Montreal, Toronto and Vancouver. Most relevant to the BC context, the City of Vancouver’s Annual Greenhouse Gas and Energy Limits By-law No. 13472 was approved in July 2022, which compels large Part 3 buildings to report their energy and emissions performance annually as a first step towards meeting greenhouse gas emissions limits. Metro Vancouver has also indicated their intention to create a regional benchmarking requirement, though timelines are uncertain. These new programs provide an important foundation for exploring how similar approaches could be taken by other municipalities – especially given the absence of any signal from the provincial government that a province-wide benchmarking requirement will be forthcoming.
1.2 Purpose of the Guide
Municipalities across British Columbia are starting to explore their ability to implement their own benchmarking, reporting and disclosure requirements. However, there is little information available that speaks to the specific needs, authorities, and environments to help guide these efforts. This guide has been designed to fill this gap and provide a step-by-step guide for regional and municipal government staff in BC Its purpose is to compile existing knowledge and practice in benchmarking, reporting and disclosure programs and tailor it to the local context to provide a succinct series of steps to aid local governments in BC in enacting their own program. This guide also provides links to existing resources to further readers’ understanding and provide more in-depth insights on specific steps in the process of setting up a requirement and program
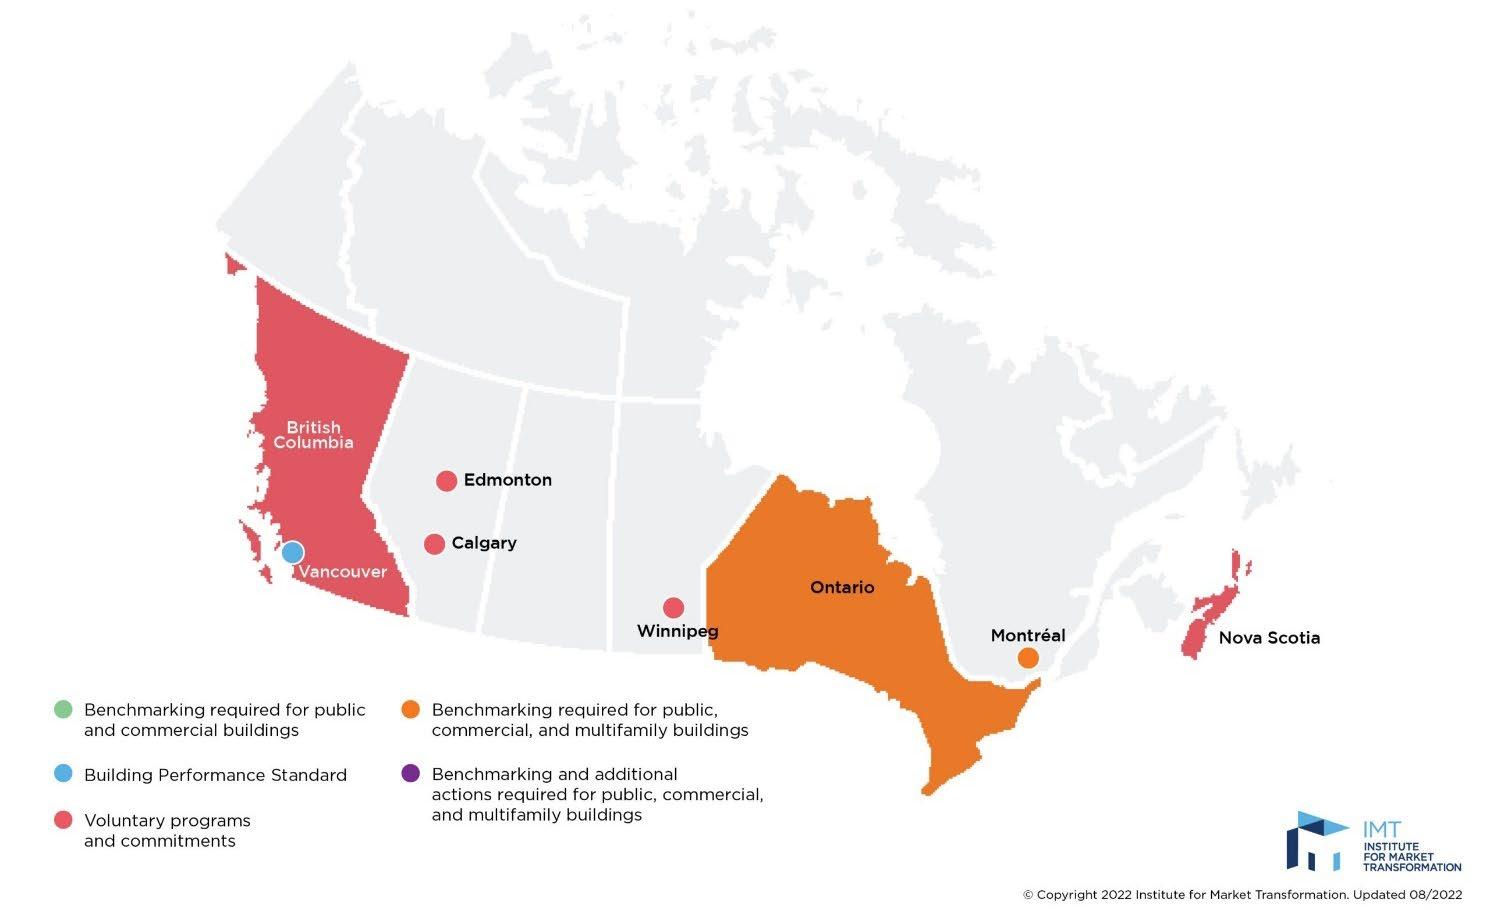
Figure 1: Canadian policies for existing buildings (Source: Institute for Market Transformation)
2 Program Design
2.1 Establish a Legal
Framework
The starting point for local governments interested in implementing a benchmarking and reporting requirement is to establish a clear sense of the authority of local governments as defined by the Community Charter (which defines the authority of municipalities) and the Local Government Act (which defines the core authorities of regional governments and covers municipalities in areas not defined by the Community Charter).
The Community Charter states that a municipal Council may, by bylaw, regulate, prohibit, and impose requirements in relation to buildings and other structures (section 8 (3) (l)) While this authority is limited in other sections of the Charter, Section 53 (2) indicates that a municipal Council may only exercise its authority under section 8 (3) (l) for the following:
a) the provision of access to a building or other structure, or to part of a building or other structure, for a person with disabilities;
b) the conservation of energy or water;
c) the reduction of greenhouse gas emissions;
d) the health, safety or protection of persons or property.
Interpreted broadly, this indicates that a benchmarking and reporting requirement can be enacted by a municipal government in BC, so long as they use a bylaw as the foundation. It also indicates that such an energy benchmarking bylaw must not govern the actual construction of buildings, as this authority sits with the Province.
However, it is important that the stipulations of such a bylaw be reasonable, in that it should involve consultation with affected parties, including regulated building owners, occupants/tenants, and building or property managers, as well as relevant members of municipal staff and other interest holders, such as utilities and service providers. The bylaw must also be enacted in relation to buildings only, and not concern broader matters of the environment.
Other means of establishing a benchmarking and reporting requirement at the municipal level may exist but are less clearly articulated in terms of a municipal government’s authority. These rest in:
1) A municipal Council’s authority to regulate, prohibit and impose requirements in relation to municipal services, or
2) A Council’s authority to regulate in relation to business (vis-à-vis commercial buildings).
With respect to regional governments, similar clauses in the Local Government Act are absent, making the authority to enact a requirement for benchmarking unlikely. However, regional districts can take on local government services via a service establishing bylaw. As such, where participating municipalities are willing to exercise their benchmarking authority through a bylaw, regional districts could support the implementation of a benchmarking requirement and in so doing, assist in supporting consistency across the region (for more on the role of the regional government, see section 3.9).
In sum, the broad interpretation of municipal powers in the Community Charter are likely to see a court uphold municipal efforts to impose a benchmarking and reporting requirement. With the exception of electoral areas under their jurisdiction, regional governments do not enjoy the same authority, but can support municipal reporting requirements via several avenues, including support in coordination across multiple municipalities; offering support programs for regulated building owners; providing outreach and educational efforts; and others.
Exemptions in British Columbia
It is worth noting that the two jurisdictions in British Columbia that have already implemented or are in the process of implementing a benchmarking and reporting requirement fall under different authorities:
• The authority of the City of Vancouver is determined by the Vancouver Charter, which confers it direct authority over the regulation of both new and existing buildings. As noted above, the City enacted a reporting requirement in 2022 via its Annual Greenhouse Gas and Energy Limits By-Law No. 13472, which outlines energy and emissions reporting requirements for large commercial and retail buildings (in addition to specific carbon pollution limits). It is also worth noting that as there was unclear authority under the Vancouver Charter to enact this requirement, the Province agreed to amend the Charter to mirror the Community Charter to provide greater clarity and legal authority.
• The Metro Vancouver Regional District (MVRD) also enjoys a different authority under its responsibility for managing and regulating air quality, as delegated from the provincial government in the Environmental Management Act. This authority allows the region to create a bylaw to prohibit, regulate and otherwise control and prevent the discharge of air contaminants, including greenhouse gases. Specifically, Section 31 of the BC Environmental Management Act provides the authority to manage air quality and prevent the discharge of air contaminants that are capable of harming public health and the environment. The MVRD’s Climate 2050 Plan signals that they will be implementing a building performance standard with a reporting requirement, but timelines are currently uncertain. Note that the only other government with jurisdiction over air quality is the City of Montréal, which enacted a benchmarking requirement in 2021.
2.2 Establish Policy Goals
As a part of establishing the legal framework for a reporting requirement, it is also important for local governments to establish the policy goals they wish to achieve. Most BC local governments are in the process of either creating, implementing or updating their climate action plans, which outline the broad sources of emissions across key sectors in their communities, as well as the actions that will be taken to reduce them. These plans have shown that building sector emissions can account for as much as 50% of community-wide emissions, making the decarbonization of both new and existing buildings a key priority in meeting emissions reduction targets.
Building energy benchmarking, reporting, and disclosure policies are often seen as a key first step in identifying how and where emissions reductions can be achieved in the existing building sector. They can provide important information on the building stock, including the types and sizes of buildings that have higher or lower overall emissions performance. They can also improve overall transparency for tenants and occupants, helping to inform decisions over lease or rent agreements.
No matter the rationale, it is important for the purposes of communication – to Council members, other staff, building industry members, and the public – to clarify the goals that are intended to be achieved through the establishment of a new reporting requirement. It is also important for these goals to be communicated in line with the powers outlined in the Community Charter.
In addition to the goals that are being set, local governments may also wish to establish some guiding principles to help guide decisions on program design. Setting guiding principles also helps local governments remain accountable to their regulated community.
Examples of Policy Goals
• Increase building owner and manager understanding of their building’s current performance, how it compares against their peers, and opportunities to improve it.
• Increase the public’s understanding and valuation of building energy and emissions performance (where data is publicly disclosed).
• Increase understanding of the overall building stock and get access to data that will support the development of further programs, policies and funding that support climate action.
Examples of Guiding Principles
• Consistency: Ensure harmonization of reporting requirements across jurisdictions to facilitate an apples-to-apples comparison of building performance with its peers and over time.
• Effectiveness: Design and implement a benchmarking program to achieve its intended goals. Effectiveness could be attained by developing a streamlined compliance process and empowering both industry interest holders and the public to act on performance results.
• Equity and fairness: Address concerns and challenges from interest holders and avoid any disproportionate impact on specific interest holder groups
• Transparency: Provide clear, accessible, and comprehensible information to interest holders regarding the goals, program design processes, and outcomes, and publicly disclose benchmarking data to support informed decision-making
• Capacity building: Conduct outreach and provide resources, education, and training sessions with ongoing assistance throughout the program implementation to support participation/compliance, improve data quality, raise awareness and literacy regarding energy use, and ultimately drive actual energy savings in buildings.
• Adaptability: Be flexible and adaptive in response to changes in the business environment. Regularly reassess benchmarks to ensure they remain relevant and aligned with organizational goals.
2.3 Engage with and Educate Interest Holders
2.3.1
Who, Why and When to Engage
Interest holder engagement is the effort to actively consult, involve, and collaborate with key interest holders throughout the decision-making process. This section of the guide is focused on interest holder engagement during the pre-regulation phase, where the primary goal is to collect input from interest holders so as to craft and launch benchmarking programs with consideration of local circumstances and concerns. Effective interest holder engagement can also bolster support for the policy and enhance readiness for compliance, making for more successful program implementation later
The key groups that can be engaged at this stage are described in Table 1
Table 1: Key interest holder groups and the rationale for engagement
Group Organization(s)
Industry associations Commercial:
• Building Owners and Managers Association of BC (BOMA-BC)
• Real Property Association of Canada (REALPAC)
• Urban Development Institute (UDI) Residential:
• Landlord BC
• Condominium Homeowners Association (CHOA)
• Vancouver Island Strata Owners Association (VISOA)
• BC Non-Profit Housing Association (BCNPHA)
• Canadian Condominium Institute’s BC Chapter
• Professional Association of Managing Agents (PAMA)
Rationale for Engagement
• Receive support in outreach efforts to member companies
• Catalyze a collaborative approach and foster a sense of ownership over outcomes
• Access insights on industry-wide considerations
• Leverage existing communication channels to share updates and collect feedback
Building owners and managers
Utilities
• Consider building owners with a prominent presence in local jurisdictions e.g., Commercial: QuadReal, Cadillac Fairview, Ivanhoé Cambridge, Residential: BC Housing, CHARD, Rancho
• Consider property managers with a prominent presence in local jurisdictions, e.g. Warrington PCI, Colliers, Oxford Properties
• BC Hydro (Electric)
• Fortis BC (Gas)
• District energy providers
• FortisBC Alternative Energy Inc. (FAES)
Regulators Representatives from:
• Province of BC
• Regional Government
• Nearby Local Governments
Local partners
• Green building associations
• Large public portfolio owners
• Relevant service providers
• Build awareness and understanding of the proposed requirements
• Hear about challenges, concerns and feedback
• Tailor support programs to meet the needs and gaps
• Gain industry support, and identify industry benchmarking pioneers and potential advocates to encourage engagement and foster peer learning
• Understand any legal and technical challenges to providing whole-building energy data access
• Work together to develop streamlined processes for data aggregation and automated uploading
• Explore potential synergies with utility programs
• Signal intent for mandatory benchmarking requirements
• Ensure consistency and avoid conflicting requirements
• Coordinate efforts to create aligned engagement plans among local jurisdictions if possible
• Leverage any existing contacts, available resources and lessons learned
• Advocate to the Province to signal support for mandatory benchmarking and support implementation
• Outline existing support services and programs and develop additional resources to address gaps identified
• Build case studies for benchmarking and reporting
With respect to timing, interest holder engagement in the formulation of benchmarking and reporting policy is generally staged at three key points in time:
1) Initiation and planning: Conduct targeted conversations with key interest holders to gain their initial perspectives of the proposed policy and collaborate on the engagement plan.
2) Drafting regulations: Seek input on negotiable elements, understand the support needed, and gather concerns expressed by key interest holders.
3) Program launch and continued outreach: Refine the draft based on feedback, present the final bylaw/program, establish a continuous communication mechanism, and conduct outreach to provide ongoing support.
Clearly outlining what aspects of the proposed benchmarking requirements can be influenced by interest holders facilitates a comprehensive yet streamlined process to develop the policy For elements that are somewhat negotiable, the engagement should aim to consult with interest holders and gather feedback on the proposed design; for negotiable elements, the purpose is to collaborate with interest holders in a joint design effort.
• One-on-one meetings
• Implementation advisory group
• Focus group meetings
• Open houses & webinars
Utilities Initiation and planning/ drafting of regulations
Regulators Initiation and planning/ drafting of regulations
Local partners
Drafting regulations/ continued outreach
• Regulatory requirements: Mandatory benchmarking and reporting
• Mechanism: Use of a bylaw as the means of requiring reporting
• Alignment: Consistency with reporting requirements of similar programs (e.g. other nearby municipalities)
• Building type and thresholds: Building types and sizes that are covered for compliance
• Compliance timeline: Initial benchmarking and reporting year and a phased-in schedule followed
• One-on-one meetings
• Implementation advisory group
• Implementation advisory group
• Open houses & webinars
• Implementation advisory group
• Open houses & webinars
• Support programs: Where support is needed and what support programs might look like
• Exemptions: Potential reporting exemptions to be considered
• Data quality: Approaches to ensure data quality
• Data disclosure: Options for disclosing data and timeframes
• Enforcement: Methods for enforcement to promote compliance.
Table 2: Timing and format of engagement
Interest Holder Category Timing
Engagement Tools
Table 3: Examples of negotiable and non-negotiable elements for interest holder influence
It is also common to hear interest holders express concerns about some of the negotiable elements of a proposed benchmarking requirement.
Table 4 outlines these potential areas of concern and frequently asked questions, as well as examples of possible responses.
Table 4: Potential areas of pushback and responses Theme Frequently Asked Questions Potential Responses
Covered building types and thresholds Why does the regulation impact me/ impact me first?
Compliance cost How much will compliance cost?
Benchmarking and reporting requirements are designed to initially focus on larger buildings characterized by higher energy use and emissions, as well as greater resources to respond. This also represents a smaller number of buildings that allows us to roll out requirements to smaller buildings over time, gradually increasing the capacity of the industry.
Potential costs could include one-time registration and ongoing reporting fees as well as outsourced services for benchmarking and data verification if required. However, as buildings become more aware of energy efficiency opportunities, operational savings will outweigh the costs. Support will also be provided for benchmarking and data verification where required.
Compliance effort How much time and effort will it take me to benchmark my building?
Support How will you support me?
There are several factors that can affect the time and effort needed to comply, including the type of building, the availability of automated utility data upload services, the accessibility of specific details about the building's use, and familiarity with the reporting tool While an initial time investment will be needed to set the building up in the reporting platform, ongoing updates should be minimal, particularly if utility data is automatically transferred through web services.
Support may include:
• Workshops and training sessions: educating building owners and operators on the benchmarking program and how to comply
• Guidance Materials: Clear, simple, step-by-step materials guiding covered buildings through the compliance process
• Centralized Resources: A centralized benchmarking homepage that includes the regulation, interest holder engagement process, and available resources
• Help Centers: A dedicated help center to provide one-on-one assistance and answer any questions
• Targeted Support: More hands-on support for building owners with lower capacity or that serve equity-deserving groups.
Data utilization and disclosure
What are you going to do with my data?
Enforcement What happens if I don’t submit a report?
Data collected will be analyzed and shape the development of incentives and programs that help reduce your building energy and emissions. We will provide the results of the analysis to offer insights into how your building performs, with high-level recommendations for improvements, and lead you to the existing incentives and resources. We will also explore potential public disclosure options with interest holders, aiming to cultivate a fair business environment and recognize the endeavours of leading owners or organizations in the pursuit of high-performance buildings.
The initial roll-out of the policy places a strong emphasis on education and training, presenting the business case for owners on why benchmarking can benefit them. However, a mechanism for enforcement, potentially including fines for non-compliance, will be essential to address cases where buildings persistently fail to report.
2.3.2 Communication Materials
To solicit valuable feedback from interest holders, local jurisdictions will need to provide interest holders with key information on the proposed requirement, laying a foundational understanding for them to share their perspectives, concerns, and suggestions. Communication materials play a crucial role in this process by offering a structured means of disseminating information to interest holders and facilitating their informed participation in shaping the program design.
Communication materials should be tailored to the audience with content design aligning closely with the specific information needs of each interest holder group and the underlying rationale for engaging them (see Table 1). In addition, jurisdictions should recognize different levels of knowledge on benchmarking and energy efficiency among individuals within the same group or across groups and present content in various formats to ensure a shared understanding. Incorporating visuals such as graphics and explanatory diagrams into presentation slides can be a sound strategy. Creating a master slide with content that can be applied across all interest holder groups can also be useful, allowing for slight adjustments for meetings to cater to specific audiences.
A PowerPoint presentation that provides a quick guide to energy benchmarking has been developed as a supplementary resource to this guide and can be used as to support engagement and education with interest holders.
2.4 Establish Reporting Requirements and Processes
2.4.1 Establish Thresholds and Phasing
A key part of establishing a reporting requirement is identifying which kinds of buildings are required to report These are typically defined by specifying the building size, building type and/or occupancy date, with the general aim of capturing the greatest percentage of energy use or emissions in the smallest number of covered buildings. Given that energy use and emissions are unknown (hence the need for a reporting requirement), floor area is used as a proxy.
Buildings that must comply with a reporting requirement are often phased in over time to help jurisdictions test and refine program processes and manage the initial influx of reporting buildings. A well-established and recommended approach is to start with public sector buildings that are municipally owned and operated Reporting municipal buildings not only demonstrates leadership but also builds internal capacity and allows staff to gain a better understanding of the challenges building owners may face.
This is often followed by commercial and institutional buildings over a certain size threshold. Owners and managers of larger buildings typically have greater resources available to participate and comply with requirements, providing further opportunities to refine the program process before other buildings are introduced. Over time the size threshold is reduced, and other building types are introduced, to expand the covered buildings.
In general, minimum size thresholds are set and usually fall in the range of 10,000 ft2 to 50,000 ft2. Many jurisdictions have run into capacity issues when targeting buildings under 20,000 ft2 as these buildings are often owned by single individuals rather than companies, who have limited capacity and resources to participate and comply. For multi-unit residential buildings, it may be easier to establish thresholds based on unit count, as this information tends to be more readily available and is more definitive.
Examples of thresholds and phasing from jurisdictions with existing reporting requirements are provided in Table 5. More details on the recommended reporting timelines can be found in Section 3.1
• Report by July 1 for the previous calendar year.
• 2018 (for the 2017 calendar year), buildings greater than 250,000 ft2, unless any part is classified as multi-unit residential
• 2019 (for the 2018 calendar year), buildings greater than 100,00 ft2.
• 2023 (for the 2022 calendar year), buildings greater than 50,000 ft2.
Legend: Timeline, Building Size, Building Type, Occupancy Date
• Report by June 1 for the previous calendar year.
• 2024 (for the 2023 calendar year), buildings with a GFA equal to or exceeding 9,290 m2 for major occupancies A1, A2, A3, A4, D and E, F1, F2, F3 and MUBs
• 2025 (for the 2024 calendar year), buildings with a GFA equal to or exceeding 4,645 m2 for major occupancies A1, A2, A3, A4, D and E, F1, F2, F3 and MUBs.
• 2024 (for the 2023 calendar year), buildings with a GFA equal to or exceeding 9,290 m2 for major occupancies B3, C and MUBs.
• By October 1, 2012, and by April 1 annually thereafter for buildings larger than 50,000 ft2 having an initial occupancy date before January 1, 2011.
• By April 1, 2013, and by April 1 annually thereafter for buildings larger than 20,000 ft2 having an initial occupancy date before January 1, 2012
• By one year after the date of initial occupancy for all other buildings having an initial occupancy date of January 1, 2011 or later.
Thresholds and phasing of covered buildings may vary by municipality depending on their building stock. To
Table 5: Example of thresholds and phasing from jurisdictions with existing reporting requirements
Province of Ontario
City of Vancouver
City of Seattle
establish thresholds and phasing, a high-level analysis of the building stock can be conducted to understand the number of buildings that would fall under different thresholds. The data used for this analysis may be the same data that is used to establish a covered buildings list (see Section 2.4.2 below) for potential data sources and details on creating a covered buildings list.
It is important to provide clear definitions for the variables used to define requirements in the by-law and supporting guidance to avoid contentions. E.g. “Gross floor area (GFA)” means the sum of the area of every floor in a building, measured between the outside surface of the exterior walls, including all areas inside a building, excluding exterior spaces such as balconies, patios, interior parking spaces, and covered walkways, and crawl spaces.
2.4.2 Create a Covered Buildings List
Once broad thresholds are identified, a covered buildings list of which specific buildings must comply must be developed. The following set of key steps/data sources can used in creating a covered buildings list, which were derived from insights provided by the City of Vancouver and Metro Vancouver. Note that other jurisdictions may have additional databases (e.g., permit records, drawings, etc.) available that could expedite the process. Consider other available internal databases that could be adapted for this purpose. In smaller jurisdictions, physical verification of building sizes (e.g., by walk-by assessments) may be more expedient than using online mapping platforms.
1) Parcel-level data from BC Assessment can be used as a starting point to derive a long list of buildings by class. When creating this initial list, starting with thresholds that are slightly lower than what will be regulated (e.g., identify all buildings 45,000ft2 and up for a reporting threshold of 50,000 ft2) allows a larger starting point that may capture more buildings than would be otherwise, given the inaccuracy in gross floor area in the BCA dataset.
2) Pictometry is a technique that can be used to produce oblique georeferenced imagery showing the fronts and sides of buildings and locations on the ground. Online mapping platforms such as Google Maps can be used to create custom parcel maps for any buildings over 50,000 ft2. This provides a foundation to determine the number of structures on each parcel, but not the distribution of floor area across each structure.
3) Manual calculations may be needed to derive actual building gross floor areas; for example, by determining the footprint of the building and calculating floor area by multiplying the area by the number of observable storeys.
4) CoStar data can then be used to cross-check and add detail to the list of covered buildings. It should be noted that CoStar data only provides leasable floor area, but it can be used to start to compile and refine information on owner, address, and other details.
5) Finally, tax databases can be used to further cross-check and refine building owner and address information. This information can be requested a few times a year to ensure information is up to date, as information often changes.
Tips for Creating a Covered Buildings List
• Start the process early as it will take longer than expected! Take the time to understand the nuances of each dataset before refining the covered buildings list.
• Help build the accuracy of the list by engaging and educating building owners on what’s coming and using these touchpoints as opportunities to proactively ask for information.
• Note that tenants may have different addresses within the same building. Determining the primary address of a building can take some time.
• While many data points can be collected, focus on the key metrics of interest: 1) building name/address; 2) building owner name and contact information; 3) building type; 4) building GFA
• Creating a covered building list can be supported by a position such as a summer intern; however, note that significant effort will be required by the project team lead to set the process up for success. Individual(s) with strong Excel and organizational skills are an asset.
• Ensure sufficient staff resources to create and maintain the list. For reference, the City of Vancouver’s initial covered buildings list of approximately 1,850 buildings required the effort of two employees over the span of 2-3 months, plus the ongoing effort of approximately 0.25 FTE in the year following its initial creation to continue developing and refining the list.
• It is important to assign a unique building identifier to each covered building. The Pacific Northwest National Laboratory offers a methodology for creating these. However, this may be a task that can be assigned to a service provider once a program is up and running. Note that using an existing and replicable methodology is preferred; avoid creating a building identification methodology that is specific to your municipality/jurisdiction.
While less intensive, the time and effort to maintain these lists as buildings are constructed, renovated, change hands, or demolished over time is also significant.
• Consider using any existing internal tools (such as permit tracking software) to track new construction and demolition.
• Use existing databases (e.g., tax databases) to track building ownership and address information. Consider requesting information from these databases throughout the year.
• Given the gaps and uncertainties inherent in the datasets described above, it is not uncommon for building owners to contest the data that the AHJ has on file, particularly building floor area. Building owners should be allowed an opportunity to contest that they do not fall under a certain reporting threshold or requirement. Potential sources of verification of actual building floor include:
o Past energy audits
o Engineering drawings, and/or
o Other documents signed off by a professional engineer.
2.4.3 Establish a Benchmarking and Reporting Tool
With reporting requirements in place, the next step is to establish the tool(s) that building owners will use for benchmarking and reporting their building’s performance It is important that such a tool reduces the administrative burden for staff and building owners and supports streamlined data collection and quality control Other factors to consider include ease of use, embedded support functions, embedded analysis functions, compatibility with utility data exchange, and data verification processes.
The tools used in the benchmarking and reporting process range from simple spreadsheets to web-based platforms and customized software. However, across jurisdictions with existing reporting requirements, ENERGY STAR Portfolio Manager (ESPM) is the preferred tool through which building owners provide and submit building performance data
Energy Star Portfolio Manager:
• Is a free online tool that tracks the monthly energy consumption of buildings
• Was developed by the U.S. Environmental Protection Agency, it has been adapted for use in Canada by Natural Resources Canada to enable performance comparisons based on actual Canadian data
• Offers cost-free training resources and technical assistance. NRCan further provides additional support resources with a dedicated website (See 3.4.2).
• Both BC Hydro and Fortis BC can connect web services with ESPM for data exchange, automatically uploading energy usage data each month into user Portfolio Manager accounts upon request (see Section 3.4) Data collected can also be entered manually or through spreadsheets into Portfolio Manager.
• Provides standardized analysis methods to assess a building’s energy and emission impacts and includes metrics designed to incorporate weather and climate effects on energy performance.
• Allows for custom reporting for data submission and has verification features to improve the quality of data (See Section 3.5).
Building owners are required to set up an ESPM account and create profiles for their properties (first year only), upload and verify performance data, and finally, submit data to the jurisdiction. More information on utility data access, verifying data and guidance to support building owners is discussed in Section 3. With respect to submitting data, ESPM provides two options for jurisdictions to choose between:
• Data requesting. Jurisdictions set up a custom reporting template in ESPM and publish it as a data request via a dedicated web link. The template will be automatically added to a Portfolio Manager account when building owners and managers click that link, which allows them to complete the template with information from their accounts and send the data to the requesting jurisdictions.
• Property sharing. Covered buildings are required to provide read-only access to an account managed by jurisdictions or designated third-party program administrators. This access enables jurisdictions to extract the information and metrics specified for reporting. There is also an opportunity for jurisdictions to establish an Automated Web Services (AWS) Application Programming Interface (API) to automatically pull data.
A comparison of these two options is provided in Table 6. Some jurisdictions have adopted these two reporting mechanisms in tandem to facilitate the resolution of data quality issues with respondents.
Table 6: Summary of benchmarking reporting mechanisms
Data Requesting
• Jurisdiction defines the fields they want as in a custom template
• Link to reporting template online
Steps
Pros
• Owner clicks the link and follows defined steps to select which properties to report, review the data, and hit submit
• Jurisdiction receives a spreadsheet
• Must be done every year
• Clear limits to owners on what data will be accessed
• Forces people to run a data quality check and review performance data each year
• Must happen each year
• Has a “regulatory” feel
• High drop-out rate as people forget to report
Cons
• Cumbersome and slow for all parties
• Does not grant access to all data
Property Sharing
• Building owner initiates a “connection” in Portfolio Manager to a jurisdiction’s account
• Owner shares “read-only access” to properties with the jurisdiction
• The jurisdiction exports shared data or has ESPM and pulls data
• Only done once (though owner must keep Portfolio Manager data up to date)
• Easy for the building owner
• Gives access to all data
• Only needs to happen once
• Least associated with “regulatory” systems
• Despite its name, it is difficult to use Portfolio Manager as a data management tool; data still would need to be exported to a spreadsheet.
• The initial setup of a software that pulls data automatically can be complex and needs a third party to run or a high level of technical capacity in-house
• Does not force owners to keep data up to date
To support the reporting, tracking, and processing of data, jurisdictions typically assign Building IDs to covered buildings, which building owners use when submitting data. For more details on handling and processing submitted data, see Section 3.2.
The use of ESPM provides consistency across jurisdictions and allows for streamlined processing and quality control. There is also an abundance of resources already available to support building owners, utility providers and administrators with using the platform However, each municipality’s legal team will have to review whether they are comfortable with specifying ESPM. An alternative to specifying ESPM would be to include requirements that strongly encourage its use, such as metrics or quality control processes that are most easily achieved through ESPM.
If ESPM is not used as the primary tool, or if metrics that are not outputs of EPSM are of interest to the program (see section 2.4.4 below), jurisdictions will need to establish a different reporting channel such as an online form This should make use of a reporting template that provides clear direction on the collection and submission of data to ensure consistency in reporting and help program administrators in reviewing and assessing compliance One example of this form of data collection is the City of Vancouver’s Building Performance Reporting System, which collects required and optional information that cannot be reported through ESPM.
2.4.4 Identify Metrics of Interest
A list of the key inputs and outputs of ESPM and the data that a jurisdiction might request is provided in Table 7. Note that these lists are not exhaustive and that the exact name of each metric differs slightly between ESPM and what a jurisdiction might request For details on how BC Major Occupancy Classifications map to ESPM property types, see Appendix B.
Table 7: Inputs and outputs of ESPM and requested data
Inputs into ESPM
Minimum data required to benchmark: All properties
• Property name
• Property address
• Property primary use type
• Total gross floor area of property
• Irrigated area
• Year built/planned for construction completion
• Occupancy
• Number of buildings
• 12 consecutive months of energy data By property type:
Additional data required to benchmark is collected based on property type, these inputs can be identified using Energy Star’s Data Collection Worksheet examples include:
• Gross floor area of other property types
• Percentage that can be heated
• Percentage that can be cooled
• Weekly operating hours
• Number of computers Other information: Beyond the minimum data required to benchmark, ESPM can be used to collect a range of other information, examples include:
• Administrator name
• Number of storeys
• Meter information
Outputs of ESPM Metrics required to be reported.
• ENERGY STAR score (for building types eligible for a score)
• Annual site and source energy use (total and by energy/fuel type)
• Annual site and source energy use intensity (total and by energy/fuel type)
• Annual weather normalized site and source energy use (total and by energy/fuel type)
• Annual weather normalized site and source energy use intensity (total and by energy/fuel type)
• Annual greenhouse gas emissions (total and by energy/fuel type)
• Annual greenhouse gas emissions intensity (total and by energy/fuel type).
• Building ID (provided by jurisdiction)
• Building address
• Building’s primary occupancy;
• Other occupancies
• Gross floor area for each building occupancy
• Percentage of building occupied
• Name of person submitting the report
• Owner(s) of the building
• Year of construction
• Number of storeys
• Number of active energy meters by fuel type
• Annual site energy use (total and by energy/fuel type)
• Annual site energy use intensity (total and by energy/fuel type)
• Annual weather normalized site energy use (total and by energy/fuel type)
• Annual weather normalized energy use intensity (total and by energy/fuel type)
• Annual greenhouse gas emissions (total and by energy/fuel type)
• Annual greenhouse gas emissions intensity (total and by energy/fuel type)
• Individual monthly utility data in their respective units (where available)
• Proof of the amount of energy use by fuel type
Unlike energy, where there are two primary utility providers, FortisBC for gas and BC Hydro for electricity, the utility provider for water varies between municipalities. Access to water data, the technical capabilities to share water data and internal staff capacity are therefore also likely to vary between municipalities. A municipality might consider including water use reporting as a requirement if this data is readily accessible, as it too can be reported through ESPM. Municipalities that rely on groundwater might be particularly interested in including water use reporting. Those that provide water directly may be able to compile water use information using internal records, which can then be integrated with larger benchmarking datasets.
2.4.5 Identify Exemptions and Extensions
Assuming building owners have access to utility data and the reporting platform, there are few barriers of any significance to the act of reporting, making exemptions for reporting requirements unnecessary. Exemptions are instead typically introduced alongside performance requirements to provide flexibility and support building owners to achieve the required level of performance. Reviewing requests for exemptions could result in extra administrative burden and also open up loopholes for building owners who want to avoid reporting. However, depending on the municipality’s approach to enforcement and the mechanisms used, other instances can be considered (see below).
Examples of Possible Exemptions
• The building did not have a certificate of occupancy or temporary certificate of occupancy for a consecutive twelve-month period prior to the compliance date;
• Over 50% of the building's gross floor area was not occupied by the owner or tenant throughout the consecutive twelve-month period prior to the building compliance date due to renovation;
• The sum of the building's gross floor area minus unconditioned and semi-conditioned spaces is less than 50% of the building's gross floor area;
• The property is primarily used for farming, manufacturing or industrial purposes with intensive use of process energy;
• The building was demolished during the calendar year for which benchmarking is required.
• Financial distress:
o The building has arrears of property taxes that resulted in the building's inclusion on the City's annual tax lien sale list;
o The building has a court-appointed receiver in control of the asset due to financial distress;
o The building is owned by a financial institution through default by the borrower;
o The building has been acquired by a deed in lieu of foreclosure;
o The owner has an immediate and significant financial need that cannot be satisfied with other available resources and is caused by events that are beyond the owner’s control. In addition, strict compliance would not be in the public’s best interest.
As with exemptions, extensions are typically introduced alongside performance requirements However, extensions might be useful for the first benchmarking cycle when building owners are getting acquainted with the requirements, but will likely extend the benchmarking cycle and increase administrative burden. In general, extensions are not recommended, even in the case of ownership change.
2.4.6 Draft a Bylaw
To formally establish a benchmarking, reporting and disclosure requirement, municipal councils and regional district boards must exercise their statutory authority (see Section 2.1) and pass a bylaw
A bylaw template for local governments in British Columbia has been developed as a supplementary resource to this guide, which builds off the model by-law developed by Efficiency Canada and has been aligned with the sections of the City of Vancouver’s Annual Greenhouse Gas and Energy Limits By-law that pertain to energy benchmarking. This alignment will allow local governments in BC to cite Vancouver as a precedent, supporting consistency across the province. Given that large buildings are often owned as a part of a larger portfolio that span different regions, this also helps to reduce the burden of compliance.
While many of the contents of such a bylaw will be consistent across municipalities, a few components will be contingent on the characteristics of the local building stock, as well as local preferences for stringency. For example, extensions and enforcement will be dependent on the local appetite for supportive vs. more penaltybased approaches.
The contents of the bylaw template provided as part of this guide are as follows:
• Section 1: Interpretation: covers intent, authority and definitions
• Section 2: Applicability: covers phasing, exemptions, reporting, and release of information.
• Section 3: Authorities of the Administrator: covers administration, document filing and proof of compliance.
• Section 4: Violations and Enforcement: covers offences.
• Section 5: Enactment: covers severability, force and effect
3 Program Implementation
3.1 Notifying Building Owners
Prior to and alongside the launch of a reporting requirement, jurisdictions should make efforts to inform affected building owners and managers about their obligation to comply. Raising awareness among those covered by the policy and providing clear guidance on how and when to comply is essential to garner robust compliance.
Program reporting requirements typically begin 6-18 months after the date the policy is enacted. Setting annual reporting deadlines depends on the timing and availability of utility data, which is often not accessible in realtime because utilities require time to aggregate and then release data for auto-upload or manual input into Portfolio Manager. A common practice in jurisdictions with benchmarking and reporting requirements is to set data reporting deadlines five to six months after the end of the calendar year To promote consistency across the province, alignment with the City of Vancouver’s deadline of June 1st should be considered.
As for the initial notification, the process should start no later than the end of the calendar year preceding the reporting due date to get the attention of building owners and managers to upcoming benchmarking and reporting obligations and allow sufficient time for them to make necessary preparations. Key information to communicate during this phase includes:
• Objectives of the program
• Building types covered by the program
• Actions required to achieve compliance
• Consequences of non-compliance and information on exemptions
• Compliance deadlines
• Supportive resources available
There are two approaches to notifying building owners and managers about the program launch:
• Targeted notification, where building owners and managers receive program launch and compliance notifications through direct outreach channels such as email and mailings.
• Public notification, where building owners and managers are informed of their reporting obligations through communication channels that promote awareness of the benchmarking and reporting program and disseminate detailed program information Both public and member-exclusive channels that are considered trustworthy by the industry should be leveraged to connect with a broad audience.
Email serves as the primary method for jurisdictions to send the initial formal notification. While compiling a comprehensive email list of all building owners is not an easy task, strategies that can be used to obtain accurate email contact information include:
• Using contact lists from other municipal departments or industry associations that have existing relationships with targeted building owners (where privacy laws permit)
• Gathering email addresses from businesses' license information
• Collecting email and contact information during engagement with building owners for program design
• Including a link on the city’s benchmarking website where owners can submit their contact information
• Mailing postcards with simple instructions and use them to collect email addresses
Table 8 provides a list of additional outreach channels that jurisdictions could consider using for distributing compliance information and making building owners and managers aware of the program.
Table 8: Potential outreach channels for initial notification
Outreach Channels
Direct mail
Program website
Local jurisdictions
Industry associations
Social media
Description
Delivering physical letters, postcards, or informational materials directly to the mailing addresses of building owners. Jurisdictions may also consider inserting notices in property tax bills or utility mailings.
Publishing a comprehensive set of resources on the program website, including a list of covered buildings, background information on the program, support documents for compliance, details on training and assistance centers, and an interactive section for building owners to submit their contact information.
Promoting the program at existing touchpoints within local governments, including licensing, business license renewals, permitting and planning activities.
Collaborating with industry associations to distribute compliance information to their members through established networks, including conferences, newsletters, media outlets, and events.
Creating official accounts or pages on platforms like Twitter and LinkedIn and sharing compliance notifications through these channels.
3.2 Managing Reported Data
Central to a successful benchmarking and reporting requirement is the need to efficiently manage large volumes of reported data from thousands of buildings at a time. Data management encompasses the overall lifecycle of data, including collecting, cleaning, storing, and using data. Specifically, program administrators are responsible for the following primary data management tasks:
• Integrating data from ESPM and other sources, such as supplementary reporting forms in Excel
• Tracking reporting and compliance status (e.g. awaiting data, partial data, data under review, errors detected, completed, etc.).
• Conducting analyses and providing actionable and visually compelling data insights to building owners, managers, and the public.
• Reaching out to contacts for each building (e.g. notifying emails, conversations on compliance issues, building-level scorecards) and logging these communications.
Automating repetitive tasks as possible is also important to reduce errors, save time, ensure consistency, and enhance the overall efficiency of the program. Considering the set of technical and automation requirements that a benchmarking program demands, establishing a data management system is highly recommended. Jurisdictions can either opt to use an open-source platform and manage reported data in-house, or partner with a third-party provider to establish a customized system.
With respect to open-source platforms, Standard Energy Efficiency Data (SEED) is the primary option. Developed by the U.S. Department of Energy, the SEED platform can import data from multiple sources, including ESPM, tax records, spreadsheets, and salesforce. The platform can also automate the process of formatting, matching, cleaning, and validating data to identify errors, and allows the sharing of selected data directly with other software tools or public-facing dashboards.
Alternatively, there are multiple third-party providers that jurisdictions might consider partnering with to develop a customized data management system for collecting, processing, analyzing, and disclosing data. Providers include but are not limited to OPEN Technologies, Touchstone IQ and PUMA.
As one example, OPEN Technologies developed their platform GRID with support from Natural Resources Canada, which is intended to help jurisdictions run benchmarking programs The tool features a data
visualization and analytics portal with an interactive map and histograms to empower users to understand data in multiple ways.
Developing data management software (or customizing an existing one) is a time-intensive process and should begin as early as possible
3.3 Coordinating Outreach and Communication
The objective of outreach and communication during the implementation phase is to work with building owners and managers to increase compliance rates, improve data quality, and encourage them to use benchmarking data and take action to improve building performance.
Table 9: Communication Goals across Program Phases
Program design Consult
Program launch Inform
Program implementation Involve
Work with building owners and managers to shape the development of a benchmarking program (See 2.3)
Provide information to assist building owners and managers in understanding their obligations and how to comply with the reporting requirements (See 3.1)
Work with building owners and managers along the compliance process and create a two-way communication
During this phase, outreach and communications fall into two broad categories:
• Requiring action: Communications explicitly compel building owners and managers to undertake specific actions, including completing reports, rectifying missing data, correcting data errors, and taking necessary steps to address non-compliance conditions.
• Motivating action: Communications aim to encourage building owners and managers to undertake voluntary actions, including participating actively in training sessions and interest holder engagement workshops for any new policy or program development, implementing energy efficiency measures, and investing in building retrofits.
Given the importance of receiving and reacting to feedback from the industry in ongoing communications, jurisdictions should supplement the communication channels noted in Section 3.1 by leveraging additional twoway methods, such as in-person or online meetings and phone calls. Using direct phone calls, program administrators can proactively reach out to building owners and managers who may face challenges, listen to their concerns, and provide timely assistance. Table 10 provides a summary of key focus areas for outreach and communications during the implementation phase, along with recommended timing and outreach methods.
Table 10: Outreach and Communications in the Implementation Phase
Topic Description
Compliance
• Remind building owners and managers about their obligation to comply with reporting requirements, ensuring they are aware of deadlines and required actions
Data errors
Noncompliance
• Reach out to building owners and managers who have errors identified in their submission and provide instructions to help them correct the errors
• Conduct further follow-up with noncompliant buildings and offer support to rectify the status
• In the absence of any action, notify building owners and managers of violations and penalizations
Monthly between the initial notification and reporting deadline. Frequency may taper off in subsequent years.
Annually after receiving reporting
Primary Methods
• Email compliance notifications
• Mail compliance notifications
• Training sessions
• Interactions from the Help Center
• Email notice-to-correct
• Phone calls from the Help Center
Annually after the completion of the data-cleaning phase
Support resources
Program progress and outcomes
• Inform building owners and managers about upcoming dates for training sessions, the availability and locations of support documents, and contact methods for the Help Center
• Disseminate updates to the public regarding the progress and outcomes of the program, and provide the available channels through which building owners and managers can provide their feedback
Ongoing
Annually on the planned date of disclosure
• Phone calls from the Help Center
• Phone calls from council members encouraging them to comply
• Email violation notifications
• Mail violation notifications
• Program newsletters
• Program website
• Social media channels
• Industry association's communication networks
• Program newsletters
• Program website
• Social media channels
• Industry association's communication networks
Improving building performance
Successes from peers
• Guide building owners and managers to implement measures and direct them to utility programs, incentives, and other resources
• Share case studies from industry leaders, demonstrating lessons learned on how best to comply with requirements and highlighting best practices on what is possible to achieve
Ongoing
• Email performance scorecards
• Program website
• Interactions from the Help Center
Ongoing
• Program newsletters
• Program website
• Social media channels
• Industry association's communication networks
3.4 Utility Data Access
In order to fulfill reporting requirements, building owners must provide 12 months of energy consumption data for the entire building Uploading data presents two notable challenges:
1) Data quality: It is important to ensure data entry is completed correctly. There is a risk errors and poor data quality when data is manually uploaded
2) Data aggregation: Owners of multi-tenant commercial and multifamily buildings could face difficulties accessing energy consumption data for the entire building when tenant spaces are metered separately
Utility providers play a key role in addressing these challenges and can help support reporting in two ways:
1) Facilitating automated utility data upload: Using ESPM data exchange web services, utilities can directly upload energy usage data to an ESPM account with the customer's permission. This service ensures ongoing updates of energy performance metrics, enhances data quality, and streamlines the overall data collection process.
2) Providing aggregate whole-building utility data: Utilities can aggregate monthly energy consumption data from all similar meter types in a building upon request. When the number of tenants/accounts exceeds a specified threshold (determined by the utility and their privacy or confidentiality guidelines), the risk of disaggregating the total value and attributing the usage to any particular tenant is deemed low. This solution provides building owners with access to the data needed for reporting while protecting customer data privacy. Table 11 outlines BC Hydro’s and Fortis BC’s automated data access policies.
Data aggregation
Renewable energy tracking and reporting
Only available for aggregated building data. If the threshold is not met, owners are required to manually upload electricity data
Meter aggregation limit: Commercial – 3 accounts or more MURBs – 5 accounts or more
Net metering program offers smart meters that track onsite renewable electricity generation vs electricity supply from the grid which can be linked to ESPM
Only available for aggregated building data. If the threshold is not met, owners are required to manually upload natural gas data.
Meter aggregation limit: All building types – 10 accounts or more
Does not provide a breakdown of renewable natural gas vs. conventional natural gas consumption
BC Hydro provides the automation of data transfer and aggregate electricity consumption data with a minimum threshold of three accounts for commercial buildings and five accounts for multi-family buildings to uphold customer confidentiality and privacy while ensuring data access. They also share data below these thresholds if the account holders sign a waiver to release the data. As for renewable onsite electricity generation, BC Hydro currently offers a net metering program, in which a smart meter tracks how much electricity the onsite renewable energy system generates and sends to the grid and how much of the electricity supplied by BC Hydro that has
Table 11: BC Hydro’s and Fortis BC’s Data Access Policies (as of March2024)
Data Access Solutions
BC Hydro Fortis BC
Automated utility data upload
been used and determines the net amount of monthly electricity consumption. Applying for net metering and linking the meter to ESPM accounts facilitate the incorporation of renewable electricity generation into the benchmarking and reporting process.
More information on BC Hydro’s benchmarking support is available on their Energy efficiency benchmarking webpage and in their How to benchmark your building guide.
Fortis BC also streamlines the automation of data transfer and shares aggregate natural gas consumption data for buildings with 10 or more accounts. For consumers opting for an RNG blend, Fortis BC currently does not provide a breakdown of RNG and NG consumption in its automated data upload to ESPM accounts, but this information can be requested or found on utility bills
More information on FortisBC’s benchmarking support is available on their Energy-efficiency tools for natural gas business customers webpage and in their ENERGY STAR® Portfolio Manager quick start guide.
For other utilities and fuel types, including district energy service providers, building owners need to use bills or request utility data from the provider directly and upload the data manually.
3.5 Verifying Data
Data verification is the process of identifying and correcting data quality problems to ensure the data generated from benchmarking and reporting policies is complete and accurate, such that a high percentage of the required data fields are entered, and the data reflects the characteristics and performance of the buildings being reported. A high-quality and reliable dataset is important for subsequent data applications, including compliance enforcement, disclosure, and the development of other policies and programs. As such, jurisdictions should consider embedding data verification requirements into their benchmarking, reporting and disclosure by-laws. Different options for data verification are outlined below
• Automated utility data upload: In many cases, building owners will report performance data through ESPM and will use automated utility data upload. Automated utility data upload ensures consistency and quality, and data upload in this way can be deemed verified.
• Using data quality checkers built into the reporting tool: Most reporting tools will have built-in data quality checkers that building owners and property managers can use before submitting data. ESPM’s data quality checker can be used to identify omissions, data entry errors, and unusual values that prevent the calculation of performance metrics such as ENERGY STAR score or EUI. Links within the alerts will take a user back to the corresponding data input field where the data issues need to be fixed. With verification requirements, building owners must address all alerts before submitting benchmarking reports. Submittals with unresolved alerts will trigger follow-up from program administrators.
• Using a certified professional: To further ensure complete and accurate data, it is also common to include a requirement that the building’s owner get their data verified by a certified professional at specified time intervals (e.g. every three years) starting from the initial compliance year. As an example, the Province of Ontario requires verification in the initial year and every fifth year thereafter for buildings over 100,000 square feet.
• Data cleaning: Local government staff or third-party program administrators may also wish to establish a data cleaning process for received data. The process begins with identifying suspected data quality errors followed by taking corresponding actions to address specific types of errors. Table 13 provides a summary of common errors and the handling actions.
Data Verification Options When is it conducted?
Automated utility data upload
Using data quality checkers built into the reporting tool
Using a certified professional
Prior to data submission
Prior to data submission
Prior to data submission
Undertaking data cleaning After data submission
Common Errors Handling Actions
Duplicate benchmarking records
Data fields are left blank or contain obvious mistakes
Outliers for data fields related to energy or water performance
Who leads the verification?
Building owners and property managers
Building owners and property managers
Using a certified professional
Local government staff or third-party program administrators
• Remove from the dataset
• Reject the submission as non-compliant
• Notify the submitter of the noncompliant status
What is the enabling mechanism?
Encouraging automated utility data upload
Including requirements in policy design
Including requirements in policy design
Developing a standardized data cleaning process
• Instruct to correct the error(s) and resubmit to achieve compliance
• Contact the submitter to either confirm the suspicious data or correct it. For submissions found to contain accurate data:
o Refer submitters with extremely high energy consumption to local utility programs
o Encourage submitters with extremely low energy consumption to apply for recognition opportunities
o Note the submission’s unusual data to avoid flagging again in future years
A key consideration for data verification is to achieve the highest possible data quality without overly burdening building owners and local government staff. For instance, requiring data verification by a credentialed professional improves data quality but will raise the cost of compliance. Drawing from the experience of the City of Chicago, potential solutions include expanding the eligibility criteria for data verifiers and offering pro-bono data verification support.
Similarly, the in-house data verification process for local governments is time-consuming and requires ongoing communications with building owners to address suspected data concerns. To solve this challenge, local governments could consider outsourcing the data verification responsibility to a third-party, (see Section 3.9 for more details on establishing roles and responsibilities)
Table 12: Overview of Data Verification Options
Table 13: Common Errors and Correction Actions in Data Cleaning
3.6 Encouraging Compliance and Enforcement
Compliance and enforcement policies can help to achieve a high compliance rate and ensure the effectiveness of benchmarking and reporting requirements The specific mechanism used by each jurisdiction will depend on their appetite to enforce and the mechanisms available to them.
In the initial years of a requirement, it is generally recommended to focus capacity and resources on outreach, support and training This includes supporting building owners and managers through the process, including setting up ESPM accounts and raising awareness of the benefits of benchmarking (See Section 3.7). Consider showcasing leading property owners that are already participating, so that other building owners can learn the value from their peers. This will help to foster positive relationships with the industry and improve compliance rates. Once the requirement is well established and goals shift to increasing compliance jurisdiction may transition to punitive enforcement
Potential Enforcement Methods
• Sending non-compliance notifications: notify of non-compliance status through official written notices.
• Publicly listing a building as non-compliant: disclose information about a building's non-compliance to the public, possibly through an online public disclosure map.
• Charging fines: impose a financial penalty for failing to comply and consider setting fines on par with or higher than the average fee charged by local service providers for data reporting and verification.
• Revoking a building’s registration: suspend a building's registration or business license as a consequence of failure to comply.
This should be done carefully and consider:
• Giving owners every reasonable opportunity to comply;
• Delaying fines until after several non-compliance notifications have been issued;
• Providing non-compliant owners with fast feedback following incomplete data submissions; and
• Reaching out directly to owners who are believed to be struggling with the requirements and offering further support.
3.7 Providing Owner Support
While the capacity of building owners and sectors varies considerably, there is a learning curve for each covered building to comply with benchmarking and reporting requirements. The industry needs opportunities to learn the new regulatory requirements, concepts, tools, and processes of benchmarking.
Providing support is not only beneficial for people who are responsible for compliance but also offers benefits to local governments, including increased buy-in for a benchmarking program, improved compliance rates, higher data quality, and opportunity to build and strengthen the relationship with the industry and drive performance improvement through other energy efficiency programs and initiatives. Jurisdictions should communicate the value of participation in the program through multiple touchpoints from program design engagement to ongoing outreach and communication during program implementation to promote awareness of the benefits associated with benchmarking and reporting, as outlined in Table 14
Table 14: Benefits of benchmarking and reporting
Benefits
of benchmarking
• Maintaining competitiveness: provide insight into building-scale energy use/emissions and how this compares to similar buildings
• Saving money: Identify timely opportunities for operational efficiency improvements and retrofit projects
• Efficient portfolio management: provide data to inform future decisions about performance investments across a building portfolio
• Improving tenant retention: demonstrate improvements to support efficiency, comfort, and alignment with sustainability goals
Incentives for reporting
• Customized performance report: receive a detailed performance report that offers tailored insights on how to improve a building's energy performance and information on available incentives and support resources
• Recognized leadership: gain public acknowledgment for exemplary efforts and achievements in compliance with reporting requirements
• Knowledge-exchange networks: access opportunities to actively participate in a community of practice, sharing experiences, best practices, lessons learned, and valuable insights
In terms of developing support resources, it is important to tailor these resources to provide practical assistance in addressing specific challenges that building owners may encounter during the compliance process. Common challenges include:
• Being aware of the benefits of benchmarking and reporting
• Understanding compliance requirements
• Obtaining whole-building utility data
• Using ENERGY STAR Portfolio Manager to track energy consumption
• Fulfilling the data verification if required
• Submitting benchmarking data
• Fixing compliance errors if exist
• Finding a service provider to accomplish the requirements
• Accessing support resources easily
Building upon the focus areas identified and guided by the principles of accommodating diverse preferences and ensuring timely assistance, support can be provided through three complementary sources:
• Compliance support documents: Written materials that guide building owners on key topics identified above. The support materials should include:
o Fact sheet: A one-page overview of the benchmarking and reporting policy
o Compliance checklist: A concise one to two-page document that outlines the actions building owners need to take to comply with the requirements
o Benchmarking how-to guide: A comprehensive instructional document designed to provide step-by-step guidance on meeting compliance requirements. For example, to demonstrate where and how building information is entered in Portfolio Manager, screenshots of every step from ESPM would be the expected detail level
o Frequently Asked Questions (FAQs): A compilation of frequently encountered problems during the compliance process and the corresponding answers
o Additional instructions: A guidance offers extra information such as the specific fields required for benchmarking residential properties, instructions for buildings with missing benchmarking information and data errors
o List of service providers: A catalogue that includes the names and contact information of service providers that offer benchmarking and data verification services.
o Complete list of support: A list outlines all the available support resources, including those developed by program administrators as well as from other interest holders, along with their respective access links. Existing support resources from other interest holders include:
BC Hydro: Energy efficiency benchmarking
Fortis BC: Energy-efficiency tools for natural gas business customers
Natural Resources Canada:
- Energy benchmarking training resources
- ENERGY STAR for Buildings
City of Vancouver: Energy and carbon reporting
ENERGY STAR Portfolio Manager: Benchmark your building using ESPM
• Training sessions: In-person workshops or online webinars designed to provide interactive training opportunities for building owners and managers. Training sessions are suggested to be offered once a month starting three to six months after a benchmarking policy has been enacted. These sessions could cover foundational topics, including policy overview, compliance process, and available support resources. In the months leading up to compliance deadlines, the training frequency should increase and emphasis should be placed on more specific topics such as setting up an ESPM account, entering utility data and connecting to utility web services, verifying and reporting data, or highlighting nuances that are unique to a building type such as class B and C commercial buildings or multifamily buildings. Archives of training sessions should be maintained and made accessible for ongoing viewing in subsequent years.
• Help Desk/Help Center: A help center is a one-stop shop support infrastructure consisting of trained staff that are accessible via phone and email with the primary purpose of providing building owners with direct assistance by answering questions as they navigate the compliance process. Help centers can also be tasked to make proactive outreach to non-compliant buildings prior to the compliance deadline, offering help or directing building owners and managers to utility programs, incentives, and other resources that can help them improve their performance. Some utilities may have their own help desks but these will only provide support on issues related to utility data rather than the broader reporting process. Establishing a help center requires a minimum of three months, and it should be operational three to six months prior to the reporting deadline. A surge in requests for assistance will occur six to eight weeks before and after the due date, particularly during the initial compliance year and the years a benchmarking program that expands to cover additional building types or smaller sizes when responsible parties are less familiar with the compliance process.
Access to all three support sources should be months before the compliance deadline, and creating them may take weeks or months. Differentiated by communication formats and channels, as detailed in Table 15, three support sources function collectively to enhance the overall effectiveness of the support provided.
Table 15: Summary of Three Support Sources
Support
Compliance support documents
6-9 months before the compliance deadline
Training sessions 6-9 months before the compliance deadline
Help center 3-6 months before the compliance deadline
Website
Online webinars and/or in-person workshops
Phone and email
• Ensures a consistent source of information that can be referred to
• Allows for self-paced learning and review
• Can be accessed at any time
• Can be tailored to address specific challenges
• Provides an opportunity for interactive learning and for participants to receive immediate clarification
• Offers direct assistance and timely responses
• Serves as a single point of contact for various support needs
• Lacks direct interaction, which might be less effective for hands-on learning
• Can not address inquiries promptly
• Interactive opportunities are only available on scheduled dates and times, potentially excluding certain interest holders
• Requires at least one extra FTE employee and resources to provide training on the technical aspects of the compliance process and customer service skills. FTE requirements will depend on the size of the jurisdiction. A help center could be a joint venture with multiple jurisdictions or other parties.
3.8 Analyzing Data and Driving Change
Once reported data has been aggregated and verified, jurisdictions can analyze it to understand the effectiveness of the program implementation, the basic characteristics of the covered building stock and their energy performance, and potential energy and cost-saving opportunities across market sectors and the jurisdiction as a whole. With the data collected and insights gained from analysis, jurisdictions can:
1. Conduct targeted outreach. Local governments or third-party program administrators can use peerbuilding comparisons and changes in ENERGY STAR score and EUI over time to identify under and highperforming buildings.
o Reach out to building owners with the greatest potential for improvement, inform them of energy-saving opportunities, available incentives, and financing support, and reference an approved vendor list of service providers for audit and retrofit services.
o Engage owners of high-performing buildings, encouraging them to share best practices and participate in recognition programs if available.
o Combine with sector or location information to target specific building classes or geographic areas for outreach
2. Establish a foundation for future research, programs, or policies. As benchmarking data grows, the data can provide key metrics and keep calibrating those metrics to support the development of community energy plans, incentive programs, and regulations. For example, benchmarking data enables the establishment of sector-specific performance targets and strengthens the understanding of current building performance. Tailored regulatory requirements and incentives can then be developed for different sectors or levels of performance. In the following years, annual updates from the reporting facilitate the evaluation of energy savings and emissions reduction that existing policy and incentive approaches garnered and offer insights into the design process.
3. Communicate benchmarking data to motivate actions. Jurisdictions can publicly share the information to increase the awareness of and demand for higher-performing buildings. Jurisdictions can also guide the industry to improve energy performance through targeted disclosure. See 3.6.1 for more detail.
Appendix A provides further details on the specific types of analysis that can be completed with reported data, including methods, rationales, and suggested frequencies for each.
3.8.1 Disclosing Reported Data
There are three key information barriers currently in the real estate market related to building performance:
1. Availability of data: Building performance data is not readily available for market decision-makers.
2. Awareness of data: Market decision-makers may not know the data is publicly accessible.
3. Understanding of data: Market decision-makers do not understand how benchmarking data can be used in their operations to improve building performance.
To help overcome these barriers, local jurisdictions may opt to make the benchmarking data visible, work with local partners to disseminate information about its presence, and strategically disclose it through suitable approaches. The overarching goal of benchmarking programs is to drive building performance improvement, data disclosure serves as a catalyst for this by making performance metrics more visible, uncovering the value of energy efficiency and incentivizing year-over-year improvement. Specific benefits of data disclosure for local governments, building owners and operators, transactional counterparties, and utilities are outlined in Table 16.
Table 16: Benefits of Data Disclosure
Interest holders Benefits of Data Disclosure
Local governments
Building owners and operators
Investors, prospective buyers and tenants
Utilities
• Improve public awareness of and demand for improved building performance
• Motivate building owners to take action to improve building performance
• Justify investments in outreach and support programs for lower-performing buildings
• Understand how their building compares to other, similar buildings
• Demonstrate leadership and gain recognition for investing in energy efficiency and/or emissions reductions
• Attract and retain investors, prospective buyers, and tenants who value transparency and energy efficiency
• Reduce costs and identify opportunities for capital and operational improvements
• Bridge the information gap on energy efficiency and make informed decisions
• Investors and buyers: invest in and own high-performing buildings with price premiums, low operation costs, and protection against transition risks
• Tenants: lease a high-performing space with lower utility bills and aligned with corporate goals
• Identify customers that would benefit most from energy efficiency programs and incentives
• Understand customer energy use to inform new program development.
The collection of data through a benchmarking program and the subsequent analyses conducted on that benchmarking dataset constitute the information available for disclosure, which spans a spectrum from granular data that can be attributed to a particular building, to broader and analytical insights that examine trends and high-level statistics (Table 17).
In general, disclosing more granular data in multiple formats allows for the greatest potential impact. For example, the City of Boulder employs a building performance map to annually report basic building characteristics and energy performance metrics for its covered buildings. Beyond the simple presentation of metrics, the City leverages case studies to share lessons learned from the benchmarking and reporting process. Boulder also adopts a biannual performance report to communicate broad findings and trends, including learnings from benchmarking data gathered within the city and a comparison of the performance metrics of its building stock with other cities implementing similar policies, enriching the understanding of local building performance and offering insights into areas where improvement is needed.
Granular
• Property owner name
• Building address
• Property type
• Gross floor area
• Energy use intensity (EUI)
• Total site energy usage and usage by fuel type
• Total greenhouse gas (GHG) emissions
• ENERGY STAR score
• Compliance status
Broad
• Overview of the benchmarking program
• Compliance summary
• Basic characteristics of the covered building stock
• Energy savings and cost savings opportunity
• Training and educational events available
• Incentives and rebate programs
• Distribution of ENERGY STAR scores
• Distribution of EUI for different building types
• Fuel mix for different building types
• Change in building performance, including total site energy use, EUI, ENERGY STAR score
Table 17: Data available for disclosure
To fully unlock the potential of benchmarking data and improve performance in buildings, data must be delivered to the right audiences. There are two broad approaches in terms of intended audience:
• Public disclosure, where everyone is given access to the data. Public disclosure contributes to transforming what the market values and creating long-term demand for energy-efficient buildings.
• Targeted disclosure, where people who directly control or influence investment decisions in a building are given access to the data. Target audiences include building owners and operators, investors, lenders, existing and prospective tenants or buyers depending on what disclosure option is applied. Targeted disclosure is intended to spur and result in actual operational and capital improvement decisions.
These can be used in tandem. For example, the City of Seattle discloses building benchmarking data and insights using both public and targeted approaches. Seattle shares data annually on its online visualization map and open data portal with the public. The City also sends building owners a performance scorecard that summarizes annual energy usage and provides additional information on energy efficiency opportunities and requires building owners to disclose the most recent energy benchmarking report to current and prospective tenants, buyers, and lenders within seven days upon request.
Selecting effective disclosure channels helps to ensure that the right audiences receive the most pertinent and impactful data when needed to make informed decisions. Potential options to explore derived from across regulating jurisdictions include:
• Infographic: A visual representation using graphic elements to show summary statistics of benchmarking data in a concise and easily understandable format.
• Benchmarking Report: A comprehensive report sharing high-level statistics about the local building stock based on the benchmarking data.
• Anonymized Database: A data set providing broad and deep benchmarking data, which are often aggregated at the postal code level, with the identifiable building information removed.
• Online Interactive Map: A data visualization platform with buildings displayed geographically, offering the ability to filter and view performance metrics of an individual building and how it is compared to its peers.
• Energy Rating Placard: A poster or sign for public display with a rating assigned based on building benchmarking data.
• Case Studies: An in-depth analysis of an example showcasing successful benchmarking and reporting endeavours for others to learn from and replicate.
• Benchmarking Scorecard: A customized report helping building owners understand how the energy performance of their buildings compared to peers and recommending next steps for improvements.
• Transactional Transparency: A practice of disclosing building performance metrics to potential buyers or tenants during real estate transactions.
• Disclosure Upon Request: Benchmarking data is made available to interested parties upon specific requests.
These data disclosure options are not mutually exclusive, and local governments may consider the possibility of employing multiple options simultaneously. As an example, the City of Chicago reports annually on key findings and trends in its energy benchmarking report and infographic. The City shares building-specific data with the public on the Chicago Data Portal and sends building owners an annual scorecard. Buildings over 50,000 square feet receive a Chicago Energy Rating Placard on an annual basis and are required to post their placard in a prominent location on the property. Building owners will also need to share the rating at the time of sale or lease listing.
Table 18: Data disclosure options
Disclosure options What can be disclosed? Who to disclose to? When to disclose? Pros Cons
Infographic Broad data
Public
Benchmarking report Broad data
Online interactive map Board performance data and granular data
Anonymized database Granular performance data
Open data portal Granular data
Energy rating placard Granular data
Case studies Granular data
Public
Periodically at intervals of one to five years
Periodically at intervals of one to five years
Public Annually
• Visually engaging and easy to understand
• Promotes awareness across a wide audience
• Provides a comprehensive overview of local building stock, benchmarking trends and progress
• Allows peer comparison in a highly visual format
• User-friendly data presentation
Public Annually
Public
Annually
Public
Annually
Public Upon demand
• Provides access to detailed data for indepth analysis
• Protects data privacy
• Offers a central repository for data
• Allows different interest holders to analyze data as needed
• Provides energy performance at a glance
• Motivates actions to improve score/rating
• Rewards leadership
• Engages interest holders with success stories
• Provides limited information to drive actions
• Time consuming to prepare
• May go unread
• Encourages judgment of buildings solely based on energy performance
• May incur pushback from industry
• Not digestible for a broad audience
• May overwhelm the public with excessive information and impede them from extracting meaningful insights
• Potential for misinterpretation
• May incur pushback from industry
• May not be universally applicable
Benchmarking scorecard Granular data
Transactional transparency Granular data
Disclosure upon request Granular data
Building owners Annually
• Addresses worries about data privacy
• Encourages the uptake of suggested actions
Prospective buyers/tenants
Current/ prospective tenants/buyers/ lenders
Different time points during transactions
Upon request
• Allows informed decision-making
• Present additional costs and/or resource needs for local governments
• Substantial difference between disclosing at the time of listing and before the time of sale and lease signing
• Avoids creating data overload and provides only the data requested
• Unclear request processes may deter interested parties from seeking data
• Hinders peer comparison and obscures the true potential of benchmarking
How has data disclosure been approached in Canada?
The Province of Ontario, the City of Montréal, and the City of Vancouver currently require building energy benchmarking and reporting, and approach data disclosure in the following ways:
• The Province of Ontario annually publishes anonymized data in raw form, presenting metrics in their original, unanalyzed, and unprocessed state as initially collected, on the intensity of energy and water usage, GHG emissions as well as property use types on Ontario's Data Catalogue
• The City of Montreal is planning to assign a GHG emissions performance rating to each building subject to the regulation annually. Building owners will be required to display the rating in accordance with forthcoming standards that detail the permissible locations for disseminating this information. The City also intends to publish the building’s address and the rating on its website. The standards for displaying the rating and the methodology for assigning it both have yet to be finalized.
• The City of Vancouver requires energy and carbon reporting and is in the process of deciding how data will be disclosed. According to its Annual GHG and Energy Limits By-law, the City may make the anonymized information and analysis for all covered buildings available to the public. Individual building performance data will be disclosed publicly via an online map, but only if building owners volunteer their data
Aside from regulatory requirements, methods for sharing information can also be explored across the voluntary benchmarking programs in Canada (see Table 19). All five programs make benchmarking data publicly available through an online interactive map, which visualizes data on property information, performance metrics, and peer comparisons. Scorecards are also used to communicate building performance and improvement insights but are shared exclusively with program participants. Three out of the five programs further provide a summary report highlighting progress and benchmarking results. The City of Winnipeg also discloses data via its open data portal.
Table 19: Methods for sharing information in the voluntary benchmarking programs in Canada
Building Benchmark BC is particularly relevant as it represents an exploratory endeavour on benchmarking and disclosure in B.C. It is currently operating in its fourth year with 22 participating jurisdictions. Table 20 takes a closer look at the data disclosure mechanisms design adopted by this pilot program. It is worth highlighting that the program exploits both public and targeted disclosure approaches and provides participants with an option to opt out of the public disclosure of building performance data.
Table 20: Key Disclosure Components in Building Benchmark BC
Who is data disclosed to?
How is it disclosed?
Public Online interactive map
Public Benchmarking report
Building owners and managers Benchmarking scorecard
is disclosed? When is it disclosed? Where is it disclosed?
• Property information, including floor area, year built, property type, and management body
• Performance data, including GHG emissions intensity, total GHG emissions, site EUI, source EUI, and ENERGY STAR Score against peers
• Program update
• Key takeaways
• Benchmarking results, including the distribution and median of EUI and GHGI, Year-over-Year (YoY) performance of EUI and GHGI, and monthly energy consumption
• Participants overview
• Insights on reducing GHG emissions
Personalized performance insights for each building, including:
• YoY performance
• Rankings against peers
• A comparison of monthly bills to peers
• A comparison of energy end-uses to peers
• A breakdown of energy use and GHG emissions
• Targeted recommendations and potential savings
Annually Program website
Annually Program website
Annually A scorecard sent directly to targeted audiences
3.9 Establishing roles and responsibilities
To manage a benchmarking and reporting program effectively and efficiently, local jurisdictions should consider taking a hybrid approach, partnering with interest holders, including utilities, industry associations, and regional governments, and outsourcing tasks to third-party contractors, which not only frees up government staff time for core tasks but also taps into external resources, knowledge, expertise, and technical infrastructure needed for specific tasks. The first step to deciding on distributing responsibilities is to gain a comprehensive understanding of the tasks involved in this phase.
Create a covered buildings list
Develop an inventory of buildings that are subject to reporting requirements
Notify building owners Inform building owners and managers about their obligation to comply with reporting requirements ✔
Develop or host a data management system
Coordinate ongoing outreach and communication
Establish a system to collect, clean, store, analyze, and utilize the data, and track interactions with building owners and managers
Establish two-way communication channels to work with building owners and managers. ✔
Engage utilities Collaborate with utilities to streamline the compliance process and to provide support for building owners and managers ✔
Provide support
Verify data
Educate and assist building owners and managers throughout the compliance process and encourage actions to improve building performance.
Develop standardized processes to validate the completeness and accuracy of reported data
Enforce compliance Implement mechanisms to ensure compliance with benchmarking and reporting requirements
Analyze and disclose data
Utilize data
Evaluate the program
Analyze data to derive insights and communicate trends and key metrics to building owners managers and the public ✔
Leverage insights gained from data to support targeted outreach and inform policy and program development ✔
Assess program implementation performance, monitor progress toward goals, and evaluate long-term impacts ✔
However, outsourcing has trade-offs, especially with tasks of conducting outreach and providing support as local jurisdictions may lose the opportunity to establish direct communication with building owners and managers and gain their trust for future policy and program development and implementation. Local jurisdictions should carefully assess these limitations and weigh them against the benefits. The extent of outsourcing also depends on the funding, staff resources, and the pool of third-party contractors available.
Table 21: Key tasks for managing a benchmarking and reporting program
3.9.1 Identifying costs, staffing, and time needs
Based on a survey of 13 U.S. jurisdictions with established benchmarking ordinances, estimated costs for program design and first-year management range from USD $300,000 to $1,200,000, and estimated annual costs in subsequent years range from USD $150,000 to $800,000 2 These cost estimates include the expenses related to tasks managed in-house and the costs for consultants and outsourced services but exclude any costs that might be incurred by other internal departments of local jurisdictions or partner organizations. These substantial differences in cost are influenced by factors, such as the wide range of building sizes, the number of buildings covered, additional regulatory actions required, and the complexity of enforcement rules and practices. These factors are relevant not only to overall costs but also to costs associated with individual tasks. In the case of a specific task, the most influential factor affecting the pricing is the scope of services contracted.
For instance, a 12-month subscription to GRID can range from $15,000 to $110,000, with a one-time configuration fee for the first year, and increased prices for larger numbers of covered buildings. Additional costs are also incurred for additional services, with pricing contingent on the number of buildings and level of support. Estimates of these costs are as follows:
• Development and management of a building owner portal ($20,000 - $55,000/year)
• Data cleaning ($5,000 to $35,000/year, according to level of service)
• Help desk and ESPM support ($110,000- $135,000/year)
• Advanced analytics, e.g. score cards ($2,500 - $4,000/building.
Initial implementation requires more staff and effort because the processes are new for all parties involved. Staffing needs and time spent by staff could be reduced after the initial roll-out as the process becomes more routine, and building owners and managers get more familiar with the actions required. On average, local jurisdictions need at least one full-time employee (FTE) to manage a benchmarking and reporting program in the first year. After the first year, an estimated 0.5 to 1.0 FTE in staffing is required for the workload, with the need for more staff during 'high traffic' periods when compliance deadlines approach.
In the first year, the most time-consuming tasks are compiling a covered building list and providing help center services. Table 22 compares the staffing needs for internalizing these two tasks and the costs of outsourcing, with those on the higher end of the range expected for jurisdictions with 3,000 buildings required to comply or more. 3 Note that both tasks can benefit from using interns if jurisdictions consider handling them in-house because of the concentrated period for resources they demand. Creating a covered buildings list typically takes two to three months in the first year of program launch, and the help desk often experiences a spike in workload during the three months before and after a reporting deadline.
Table 22: Comparing in-house staffing requirements and outsourcing expenses
Create a covered buildings list
Run a Help Center
• In the first years: 1.5 FTEs
• In subsequent years: N/A
• In the first years: 1.0-2.0 FTEs
• In subsequent years: 0.5-2.0 FTEs
USD $1,500– $7,000
USD $50,000– $150,000
2 Evaluation of U.S. Building Energy Benchmarking and Transparency Programs: Attributes, Impacts, and Best Practices (2017). Available: https://www.energy.gov/scep/slsc/articles/evaluation-us-building-energy-benchmarking-and-transparency-programs-attributes
3 Implementing Building Performance Policies: How Cities Can Apply Legislation for Maximum Impact (2018). Available: https://www.energy.gov/scep/slsc/articles/implementing-building-performance-policies-how-cities-can-apply-legislation
It is worth noting that the costs associated with each task are not necessarily additive since investing in one item could potentially reduce the need for resources in another task. For instance, investing in a robust data management system could significantly reduce the staff time required for tasks such as sending notifications, data verification, and help center operations.
3.9.2 Streamlining the compliance process and the role of utilities
Central to the success of a benchmarking and reporting program is the accessibility of high-quality energy data, and utilities play dual roles as both suppliers and enablers in this regard (see Section 3.4). Therefore, local jurisdictions must work closely with utilities to ensure that building owners and managers have access to the necessary data for submission and receive automated data uploads for their buildings. In addition, utilities are valuable partners that jurisdictions should consider engaging in program management, particularly in areas of:
• Notifying building owners Utilities can send notifications on behalf of local governments to customers, utilizing channels such as bill inserts or newsletters.
• Providing support Utilities often have designated web pages that explain the process of using ESPM to benchmark and set up automated data uploads to ESPM, supplemented by relevant documents (See 3.4.2). Utilities can also host or be invited to present in training sessions on how to request data, benchmark buildings, take actions by leveraging utility programs, and access incentives. Existing online and phonebased customer services can be adapted and expanded to address benchmarking inquiries, working in concert with support provided by local jurisdictions.
3.9.3 Consistency and the role of the regional government
Meaningful comparisons of energy performance between buildings over time is another key aspect contributing to the success of a benchmarking and reporting program. An important component of data comparability lies in the consistency of reporting requirements. Such consistency not only provides valuable insights from comparable data reported but also facilitates compliance for building owners and managers with portfolios in different jurisdictions. Noting that regional governments in B.C. do not have the authority to implement their own benchmarking and reporting requirements (apart from their electoral areas), they can support member municipalities via a service establishing bylaw to provide consistency across the region. Regional governments can also consider taking on program management responsibilities to alleviate the administrative burdens of member jurisdictions and consolidate resources efficiently. Potential tasks include:
• Creating a covered buildings list Regional governments take the lead in compiling and regularly updating an inventory of buildings subject to reporting requirements within the region and share the list with local jurisdictions for collaborative program management.
• Notifying building owners and supporting ongoing communications By utilizing established public communication channels, regional governments can work together with local jurisdictions to inform building owners and managers about reporting requirements, deadlines, and available support, increase awareness and provide reminders of required actions, and encourage voluntary efforts to improve building energy performance.
• Engaging utilities Regional governments facilitate the collaboration with utilities on behalf of member jurisdictions, aligning goals, streamlining data requests and exchange processes, and forming strategic partnerships to administer the program
• Providing support. Centralizing support functions at the regional level includes the development of support documents, delivery of training sessions, and the operation of a regional help desk. Adopting a regionalled approach ensures the standardization of support resources and services and capitalizes on economies of scale.
• Enforcing compliance. After receiving reported data and compliance status shared by local governments, regional authorities can reach out to non-compliant buildings, offer assistance for compliance or requesting exemption, and enforce compliance measures in cases of inaction.
• Evaluating the program Regional governments gather reported data and key performance indicators to conduct program evaluations. The insights gained are then shared with member jurisdictions for further discussions on refining strategies for program implementation.
4 Program Evaluation
Evaluating a benchmarking and reporting program enables program administrators to measure current performance, track the progress toward established goals, and understand what worked well and what didn't to identify areas for improvement and adjust strategies as needed.
The first step of conducting an evaluation is to determine key aspects for assessment, starting with understanding the role a benchmarking and reporting program plays in improving energy performance within the building sector. As illustrated in Figure 2 below, local jurisdictions realize the barriers to the access and use of energy consumption data by building owners and managers, policymakers and other energy efficiency program interest holders, and the public. In response, designing and implementing the benchmarking policy to overcome these identified barriers, with the overarching goals (See 2.2) of driving market transformation and, consequently, leading to energy savings and GHG emissions reductions. Following this logical sequence, three areas that can be evaluated are:
• Implementation performance: measures how well planned actions are carried out
• Market transformation progress: assess the extent to which desired goals are being met
• Long-term impacts: Calculates the energy savings and GHG emissions reductions
Figure 2: Identifying components of a benchmarking program for evaluation
Barriers to improving energy performance:
• Policymakers and other program administrators lack data for informed policy/program design
• Building owners and managers are often unaware of their energy use
• The building sector lacks transparency about energy performance for the public
Actions to overcome barriers:
• Develop and implement benchmarking and reporting programs
• Conduct outreach and provide support for building owners and managers
• Collect and disclose benchmarking data to the public
Goals to achieve through actions:
• Increase jurisdictions’ understanding of current building sector performance
• Increase owners’ and managers’ understanding of their building’s performance, how it compares against their peers, and opportunities to improve it
• Increase the public’s understanding and valuation of building energy and emissions performance
Impacts that result from the removal of barriers:
• Energy savings
• GHG emissions reductions
The evaluation process involves identifying key performance indicators, collecting data, and comparing the metrics to benchmarks established. Table 23 presents a summary of performance indicators and suggested steps for measuring results under the three evaluation domains.
Table 23: Summary of evaluation metrics
Evaluation of Implementation Performance
Indicator Key Performance Indicators
Compliance results
• Compliance rates
Outreach and Support efforts
Data quality:
• Compliance rates compared to the percentage of buildings with usable data
Compliance support documents:
• Number of downloading and viewing
Training sessions:
• Number of sessions held
• Number of attendees
Help center:
• Number of interactions (phone calls, emails, and webforms handled)
• Average response time
• Perceived usefulness of available support
Evaluation of Market Transformation Progress
Where to collect evaluation data? When to evaluate?
Benchmarks
Reported data Annually after reporting • Peer jurisdictions
• The compliance rates of the preceding year
Reported data Annually after reporting • Baseline conditions
Program records
Program records The initial year and the years when new categories of buildings phased in
Program records Ongoing
• Established goals for support programs
Follow-up survey Ongoing
Indicator Key Performance Indicators Where to collect evaluation data?
Availability of data for jurisdictions
Building owner and manager awareness
• Jurisdictions have a better understanding of the status of the building sector and its energy performance
• Policymakers and other energyefficiency program administrators include reported benchmarking data as inputs to their current and future policy/program implementation and designs
• Building owners and managers are aware of and track the annual energy performance of their buildings for all fuels
• Building owners and managers can identify specific energy savings opportunities in their buildings
Interviews with relevant staff, policymakers, and program administrators
Interviews and surveys of building owners and managers
Every three years • Baseline conditions
Every three years • Baseline conditions
• Building owners and managers can describe participation in any level of jurisdictions’ energy efficiency programs (e.g. incentives, support)
• Building owners and managers can describe the implementation of specific measures, or investments in operational or energy-efficiency upgrades within their buildings
• Building owners and managers incorporate improved energy performance as a management and performance review metric
Public awareness Tenants:
• are aware of building energy and emissions performance and their understanding of this information increases over time
• incorporate building energy and emissions performance into lease negotiations
• expect improving energy performance as a standard practice by building owners
Buyers, investors, and underwriters:
• are aware of building energy and emissions performance
• include building energy and emissions performance as valuation criteria
Survey of tenants and brokers, and interviews with real estate professionals on lease contract
Every three years • Baseline conditions
Energy savings
• Total energy usage
• Weather-normalized site EUI
• ENERGY STAR scores
Emissions reduction
• Total GHG emissions
Interviews with real estate professionals
Every three years • Baseline conditions
Baseline conditions
Evaluation of Long-term Impacts
5 Appendix A – Analyzing Reported Data
Table 24: Analysis that can be completed with reported data
What to analyze
Compliance rates by number of buildings and by floor area
Number of buildings and floor area by building type
• Divide the number of compliant buildings and compliant floor area by the total number of covered buildings and the total floor area respectively
• Categorize the covered buildings by property use type and add up the number of buildings and total square footage for each category
• Divide each number by the corresponding total for the entire sample to find the percentage of the total for the number of buildings and square footage
Number of buildings and floor area by decade constructed
Distribution of ENERGY STAR scores for eligible buildings
Energy use intensity (EUI) and greenhouse gas use intensity (GHGI) by building type
• Categorize each covered building into a decade of construction using the Year Built field in ESPM
• Offer insights into the effectiveness of the program implementation
• Annually
Fuel mix by building type
• Group ENERGY STAR scores into four performance categories: Poor, Fair, Good, and Excellent, and calculate the percentage of buildings in each performance category based on building type or year built
• Calculate the mean, median, and quartile distribution for weather normalized EUI and GHGI within each building type
• Understand the composition of property use types among covered buildings
• Account for the effect that the size of buildings has on the distribution
• Design and direct outreach, engagement strategies, and support programs for maximum effect
• Understand when covered buildings were constructed and how old and new buildings are distributed
• Provide energy efficiency measures may be more opportune in the local building stock
• Evaluate the effectiveness of improvements to energy codes are achieving their expected impact
• Indicate how a jurisdiction’s building stock compares to the national average
• Annually
• Calculate the quantity and type of fuel used by buildings
• Identify the most energy-intensive building types and building types with the highest emissions intensity within a jurisdiction
• Initiate outreach and offer tailored support to encourage actions to improve energy efficiency and reduce energy usage
• Accurately account for emissions in local building stock
• facilitate the development of decarbonization strategies
• Annually in the early years
• Every three to five years in later years
• Annually
• Annually
• Annually in the early years
• Every three to five years in later years
Estimated energy costs
Change in key performance metrics
• Take the site energy a building used for each fuel type and multiply it by the average cost of that fuel in the region
• Develop median energy cost estimates for each building type
• Track the change in median ENERGY STAR score, total weather normalized site energy use, median EUI, and GHGI for consistently complying buildings
Energy savings and cost savings opportunity
• Calculate the energy that would be saved if lower-performing buildings reduce their site EUI to a performance target based on the site EUIs of better-performing buildings of the same use type
• Multiply the potential annual site energy use reduction percentage by the electricity use and the natural gas (or other fuel) in buildings
• Multiply by energy rates to get the potential annual energy cost savings for each building and add up to arrive at a jurisdiction-wide potential annual cost savings
• Enable building owners and managers to compare their operating expenses against the median expenses for their building type in a more familiar unit of measure
• Assess whether building performance is improving, declining, or remaining constant
• Evaluate the impacts of various energy efficiency programs and policies affecting the local building stock
• Showcase the benefits that could be realized from greater progress toward energy efficiency
• Annually in the early years
• Every three to five years in later years
• Annually
• Annually in the early years
• Every three to five years in later years
6 Appendix B – BC Major Occupancy
Classifications and ESPM Property Types
A 1
A 2
Assembly occupancies intended for production and viewing of performance arts
Assembly occupancies not elsewhere classified in Group A
A 3
A 4
Assembly occupancies of the arena type
Assembly occupancies in which occupants are gathered in the open air
Entertainment/public assembly
• Movie Theater
• Performing Arts
Entertainment/public assembly
• Aquarium
• Bar/Nightclub
• Bowling Alley
• Casino
• Convention Center
• Fitness Center/Health Club/Gym
• Ice/Curling Rink
• Museum
• Roller Rink
• Social/Meeting Hall
• Swimming Pool
• Other - Entertainment/Public Assembly
• Other - Recreation Education
• Adult Education
• College/University
• Pre-school/Daycare
• Vocational School
• Other - Education Public services
• Library
• Social/Meeting Hall
• Transportation Terminal/Station
Entertainment/public assembly
• Indoor Arena
• Stadium (Closed)
Entertainment/public assembly
• Aquarium (Open)
• Race Track
• Stadium (Open)
B 3 Care occupancies
Healthcare
• Ambulatory Surgical Center
• Outpatient Rehabilitation/Physical Therapy
• Residential Care Facility
C - Residential occupancies Lodging/Residential
• Barracks
• Hotel
• Multifamily Housing
• Residence Hall/Dormitory
• Senior Living Community
D - Business and personal services occupancies Office
• Medical Office
• Office
• Veterinary Office Banking/Financial services
• Bank Branch
• Financial Office
E - Mercantile occupancies Retail
• Automobile Dealership
• Convenience Store without Gas Station
• Enclosed Mall
• Lifestyle Center
• Retail Store
• Strip Mall
• Wholesale Club/Supercenter Personal Services
• Barber and hairdressing shops
• Beauty parlours
F 1 High-hazard industrial occupancies
F 2 Medium-hazard industrial occupancies
Manufacturing/Industrial
• Manufacturing/Industrial Plant
Manufacturing/Industrial
• Manufacturing/Industrial Plant
F 3 Low-hazard industrial occupancies Manufacturing/Industrial