

INVESTMENT OUTLOOK


TREASURYYIELD CURVE STEEPENS
Three principal issues impacted the bond market during the second quarter. First, U.S. President Donald Trump’s aggressive push to implement tariffs and rework trading relationships, begun in early April, impacted the outlook for inflation and led to some questions regarding the continuation of the United States’ “safe haven” status in the global financial markets. Compounding this were growing concerns over the U.S. national debt and the trajectory of the government budget deficit, which have prompted many bond investors to question the wisdom of holding large positions of long-term fixed income securities. Finally, an already modestly slowing economy faced further headwinds as consumers began to pull back on spending and corporations slowed hiring and delayed new capital outlays in the face of heightened barriers to trade.
As these issues concentrated investor attention during the quarter, the U.S. Treasury yield curve steepened. The short end of the curve was down as the market forecast a weaker economy in the near term, while the very long end of the curve rose. The two-year Treasury yield fell 16 basis points during the quarter to 3.72%, while the 30-year Treasury yield rose 20
basis points to 4.78%. The 10year Treasury yield was up slightly to 4.23%.
Increased protectionism in the U.S. will be inflationary, while slowing economic growth puts downward pressure on near-term inflation. These factors roughly cancelled each other out in the second quarter, with the 10-year U.S. inflation breakeven rate (what investors are expecting inflation to be in the coming 10 years) down slightly to 2.28%. This figure is above the U.S. Federal Reserve’s (Fed) longterm 2.0% target, however, prompting Fed policymakers to maintain relatively tight monetary policy. The fed funds rate, the Fed’s main monetary policy
instrument, was 4.5% at quarterend, with the bond market forecasting two 25 basis point cuts to this rate by year-end. As this forecast demonstrates, the bond market believes that a weaker economy will soon overcome Fed policymakers’ fears of tariff-induced inflation.
In the corporate bond market, option-adjusted spreads widened in the early days of the second quarter after President Trump announced new tariffs on virtually all trading partners of the United States. Corporate spreads have fallen since, however, and actually ended June down for the quarter. Given the potential for economic slowdown coupled with a more complicated policy
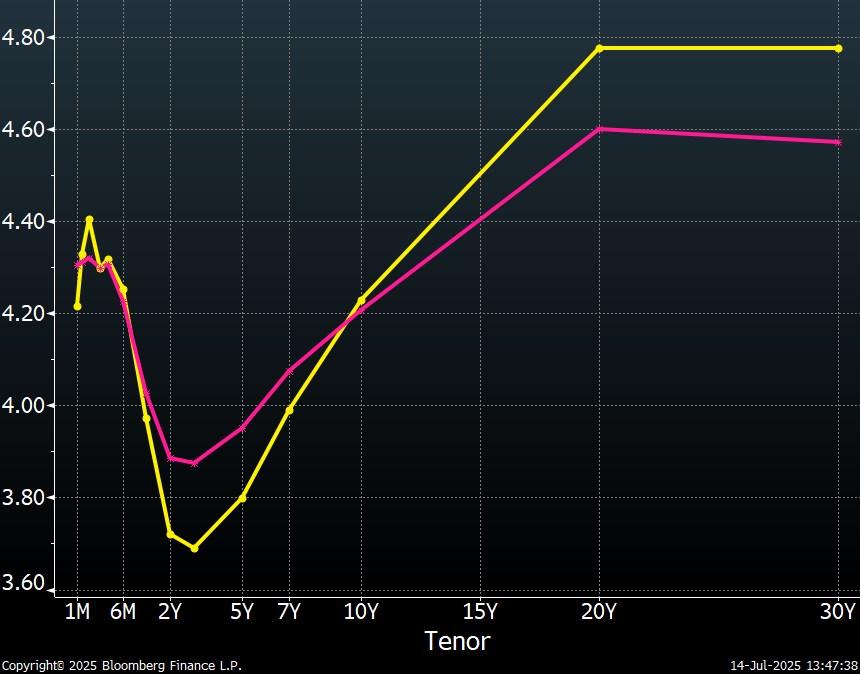
6/30/25
3/31/25
Source: Bloomberg U.S. Treasury Yield Curve
framework for companies exposed to international trade, we view corporate bond outperformance during the last several weeks as overdone and see better relative value with agency mortgage-backed securities (MBS) and U.S. Treasuries. Corporates have benefited from a three-year bull market for stocks and we believe that, sooner or later, the corporate bond market will suffer a period of potentially sharp underperformance visà-vis government-backed fixed income securities.
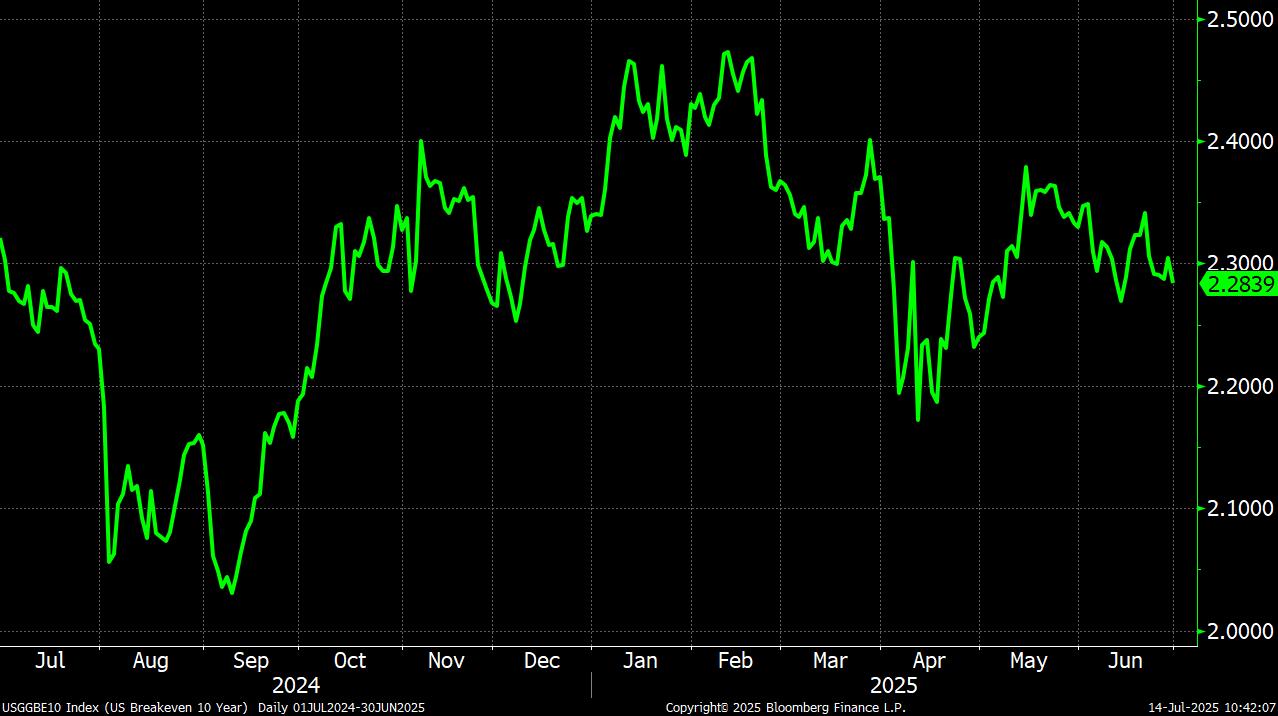
10-Year U.S. Inflation Breakeven Rate
Source: Bloomberg
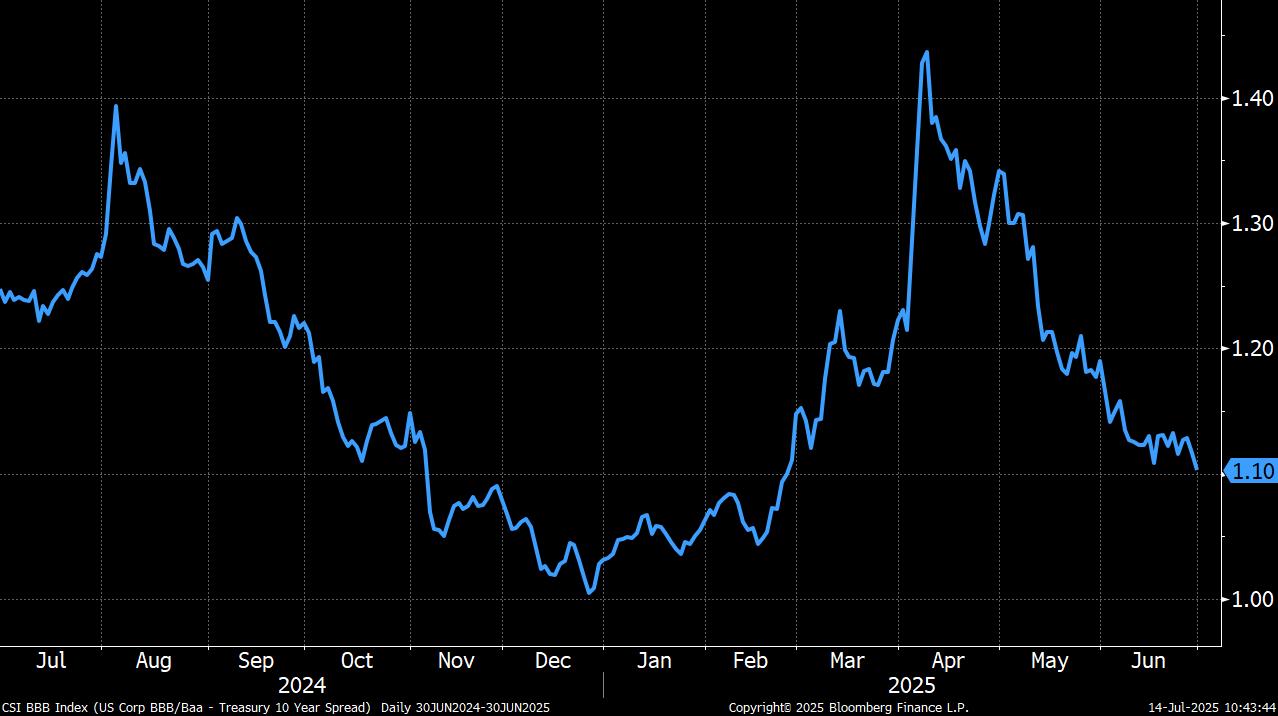
U.S. Corporate BBB/ Treasury 10-Year Spread
Given the current environment, we view it as prudent to minimize exposure to the very long end of the yield curve, though we do see good value with shorter term securities. With strategies invested in both U.S. Treasuries and agency MBS, we favor a barbell strategy with an emphasis on short-term U.S. Treasuries coupled with longer-term agency MBS. Low coupon (longer duration) agency MBS have attractive option-adjusted spread given their very limited prepayment risk in today’s interest rate environment. At the same time, the very short end
Source: Bloomberg
of the Treasury yield curve is inverted, offering investors solid yield on short-dated securities. With portfolios invested purely in agency MBS we are now looking to add to positions of higher coupon securities, while keeping a close eye on negative convexity and duration extension risk.
STOCK INVESTORS OPTIMISTIC DESPITE RISKS
Despite various sources of uncertainty and doubts regarding the resiliency of a three-year bull market, broad equity market indices rose in the second quarter and are up year-to-date. Divergence among equity sector performance has been high, however, with international stocks strongly outperforming their U.S. counter-
parts. The MSCI EAFE Index of international developed stocks returned 20.0% year-to-date through June (in U.S. dollar terms) while the U.S.-based S&P
500 is up just 6.2%. This represents an important change as international stocks underperformed for an extended period before 2025. Looking more granularly at equity sectors, performance has varied. Financials, industrials, and utilities have outperformed the broader market this year, while technology and healthcare have underperformed.
Equity Returns Year-to-Date (normalized)

Source: Bloomberg
The equity market was briefly stunned in early April when U.S. President Donald Trump announced new protectionist trade policies far beyond what investors had expected. Since then, the equity market has adopted a much more optimistic outlook regarding the evolution of trade negotiations, taking as evidence the fact that President Trump has made concessions from his original maximalist positions. The president appears to truly believe in the benefits of protectionist trade policy (and tariffs specifically) but also wants robust economic growth and a rising stock market. Orthodox economic thought holds these goals – high trade barriers coupled with strong equity performance – to be in conflict. The stock market’s strong recovery since April indicates its forecast that, in the end, President Trump will be forced to further dial back trade demands and will ultimately agree to relatively modest changes to the status quo.
In conclusion, it’s also important to mention the rapid pace of technological change occurring today and the impact this has had on the equity market. There is great hope among many that continued technological advancements will lead to faster economic growth, increased productivity, and strong corporate profitability. The equity market has embraced this idea as stocks have continued to perform well even as valuations are by most measures elevated compared to historical averages. There is risk to the market’s forecast, as many yet unrealized positive developments are already priced into equity valuations. There is the potential for further upside as well, as society may be on the verge of technological progress even beyond what is anticipated today. In any event, the realized impact of technological advances on productivity and growth will be a dominant issue for the financial markets in the coming years.
- Brandon Fitzpatrick, CFA

THIS PUBLICATION IS FOR INFORMATIONAL PURPOSES ONLY. THIS PUBLICATION IS IN NO WAY A SOLICITATION OR OFFER TO SELL SECURITIES OR INVESTMENT ADVISORY SERVICES, EXCEPT WHERE APPLICABLE, IN STATES WHERE DB FITZPATRICK IS REGISTERED OR WHERE AN EXEMPTION OR EXCLUSION FROM SUCH REGISTRATION EXISTS.
INFORMATION THROUGHOUT THIS PUBLICATION, WHETHER STOCK QUOTES, CHARTS, ARTICLES, OR ANY OTHER STATEMENT OR STATEMENTS REGARDING MARKET OR OTHER FINANCIAL INFORMATION, IS OBTAINED FROM SOURCES WHICH WE AND OUR SUPPLIERS BELIEVE RELIABLE, BUT WE DO NOT WARRANT OR GUARANTEE THE TIMELINESS OR ACCURACY OF THIS INFORMATION. BLOOMBERG FINANCE L.P. IS THE SOURCE UTILIZED FOR GRAPHS THROUGHOUT THIS PUBLICATION. THE GRAPHS ARE USED WITH PERMISSION OF BLOOMBERG FINANCE L.P. NEITHER WE NOR OUR INFORMATION PROVIDERS SHALL BE LIABLE FOR ANY ERRORS OR INACCURACIES, REGARDLESS OF CAUSE, OR THE LACK OF TIMELINESS OF, OR FOR ANY DELAY OR INTERRUPTION IN THE TRANSMISSION THEREOF TO THE USER. THERE ARE NO WARRANTIES, EXPRESSED OR IMPLIED, AS TO ACCURACY, COMPLETENESS, OR RESULTS OBTAINED FROM ANY INFORMATION CONTAINED IN THIS PUBLICATION.
NOTHING IN THIS PUBLICATION SHOULD BE INTERPRETED TO STATE OR IMPLY THAT PAST RESULTS ARE AN INDICATION OF FUTURE PERFORMANCE.