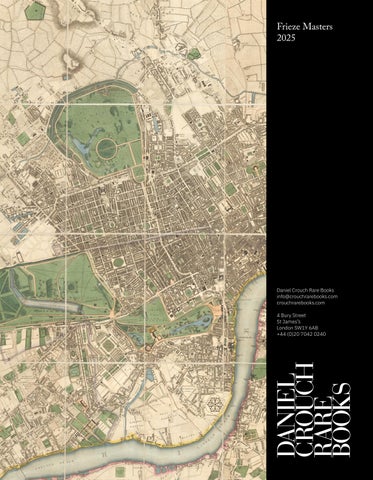
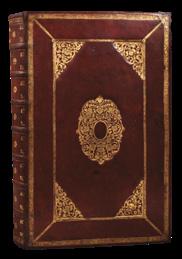
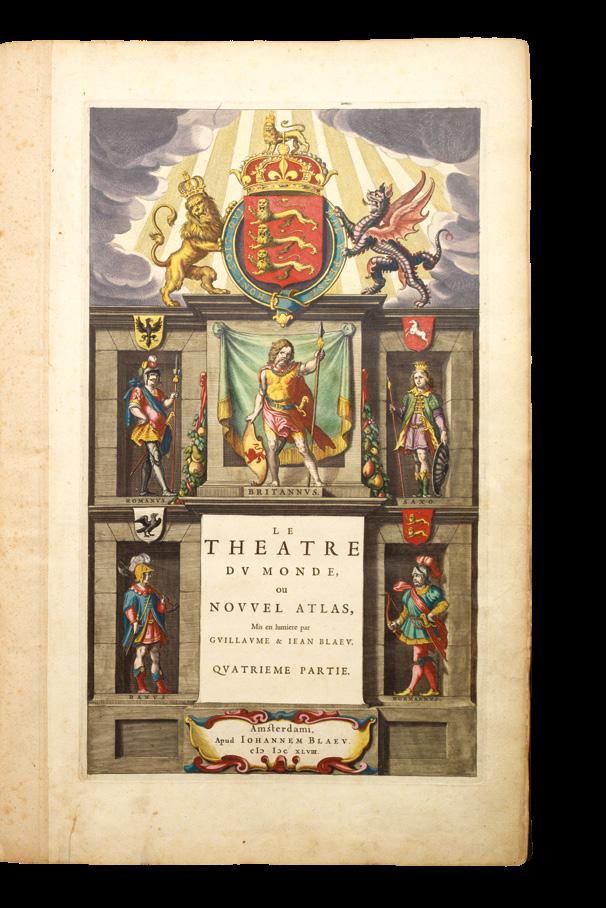
Folio (510 by 335mm), French text, engraved title, 58 engraved maps (mainly double-page), original hand-colour in outline, a.e.g., bookplate of William Goodwin of Arlscoat, to upper paste down, contemporary full red morocco, gilt, covers panelled with stylised foliate roll, and large centre and corner arabesques, spine divided into eight compartments separated by raised bands, decorated with foliate corner pieces around a central rose tool.
References van de Krogt, 2:311K; Skelton Country Atlases 43
£35,000
Blaeu’s atlas of England and Wales in full red morocco
A fine example of Blaeu’s volume of England & Wales with French text, bound in full red morocco.
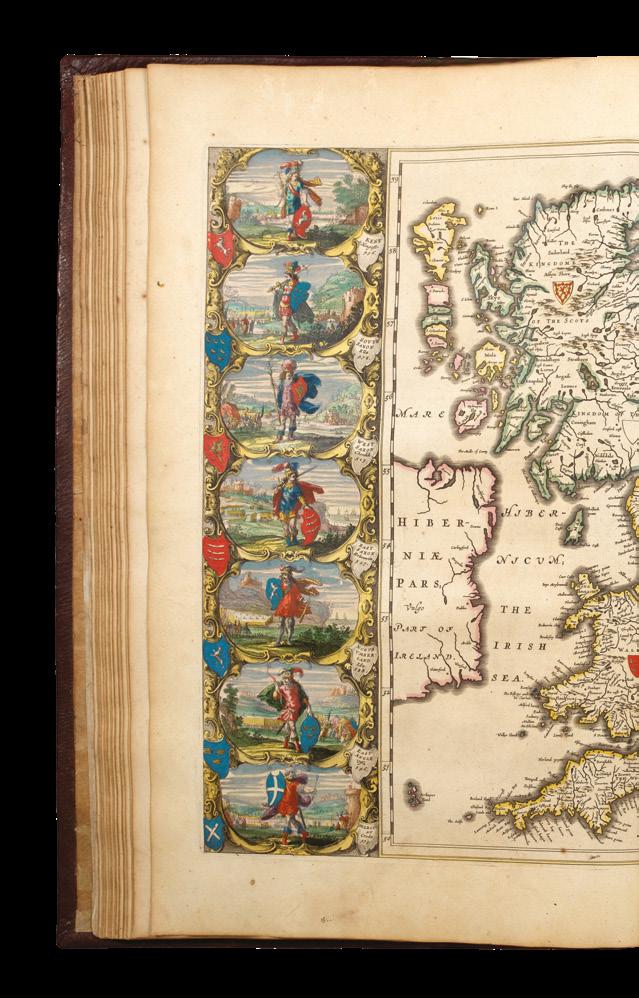
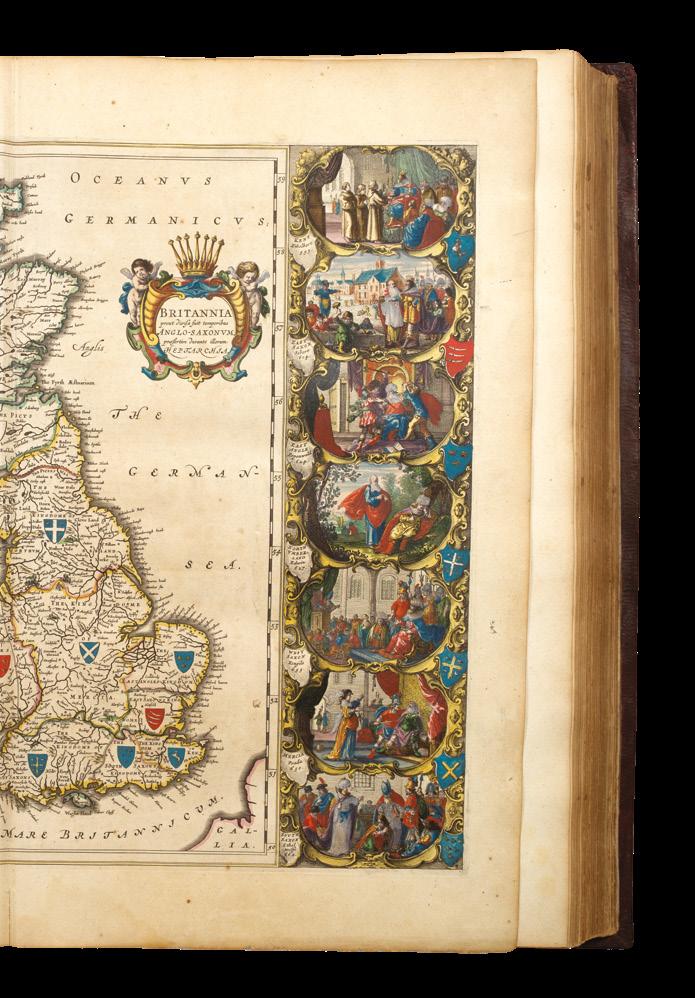
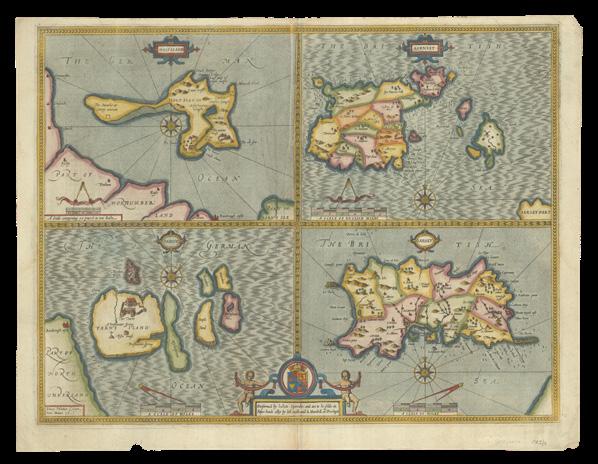
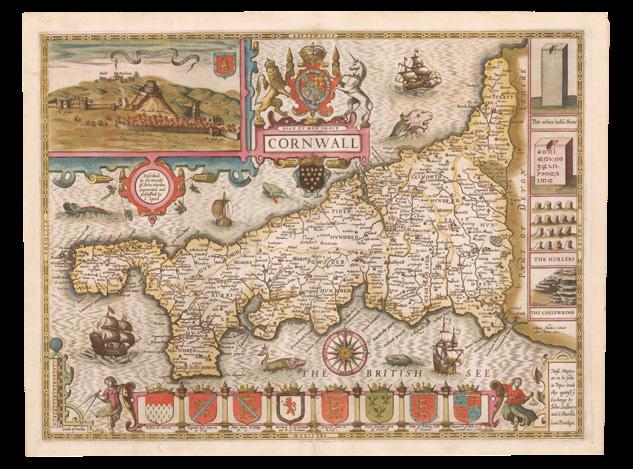
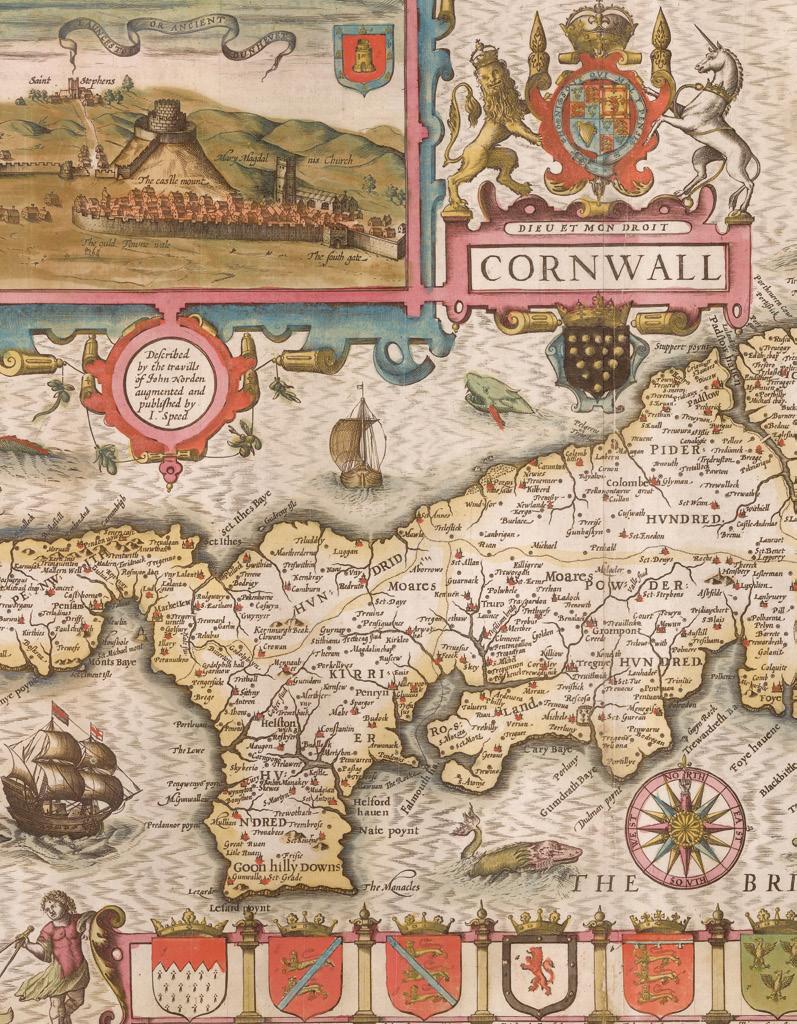
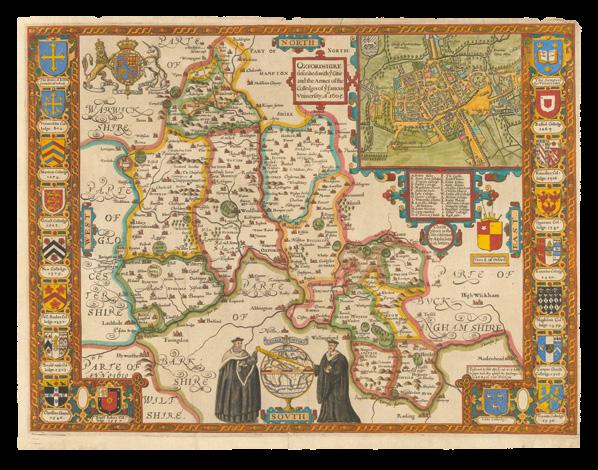
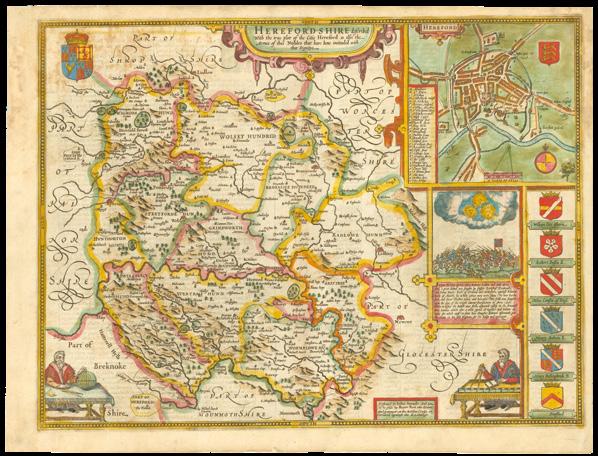
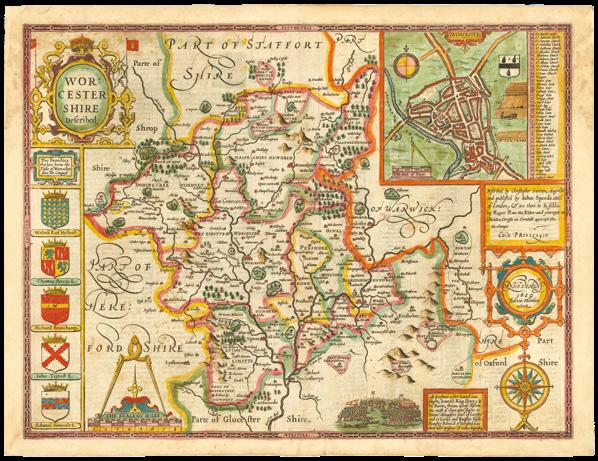
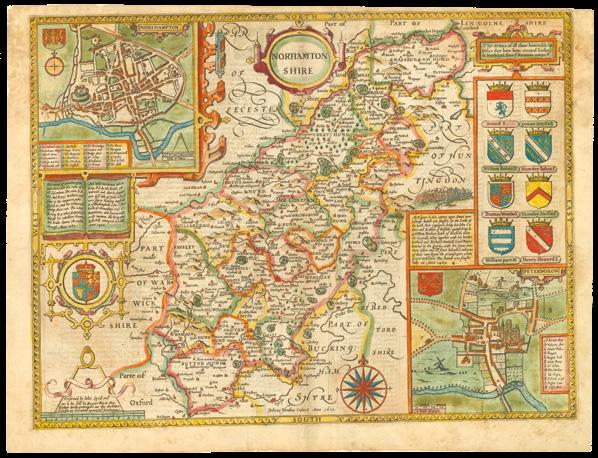
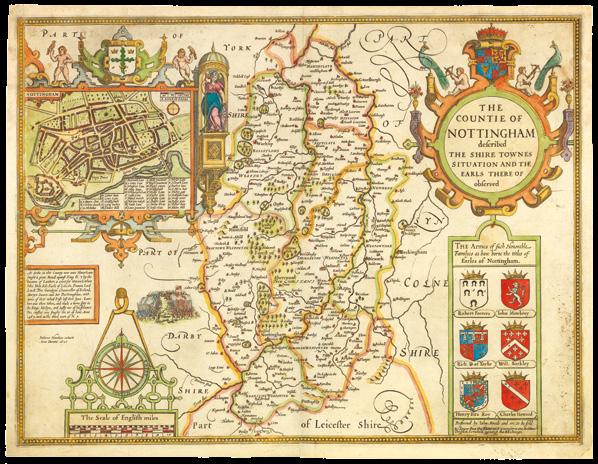
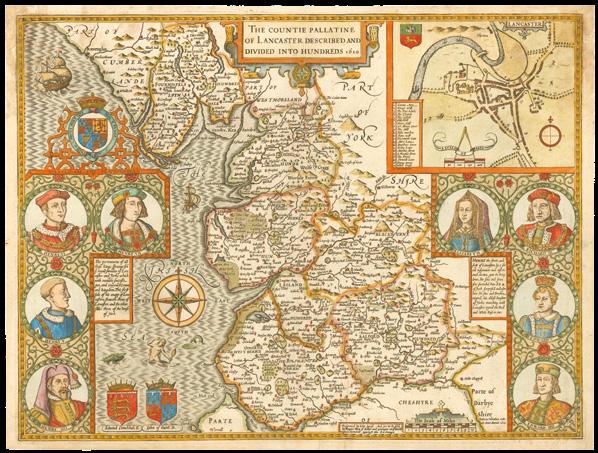
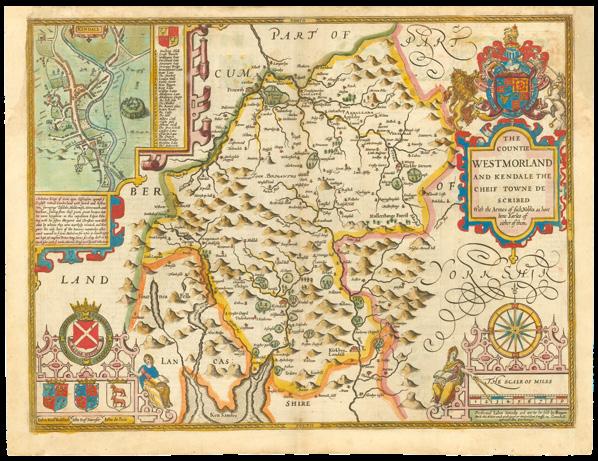
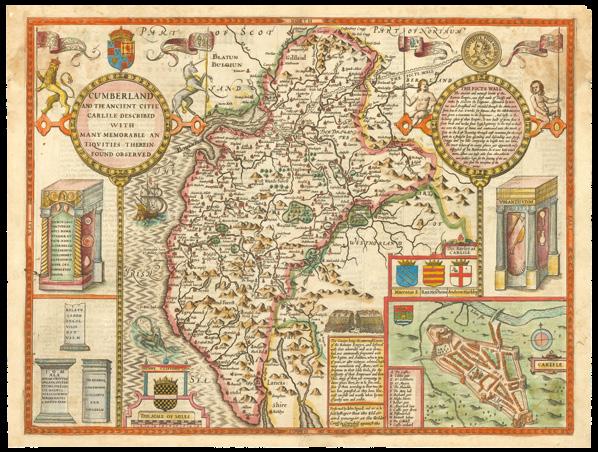
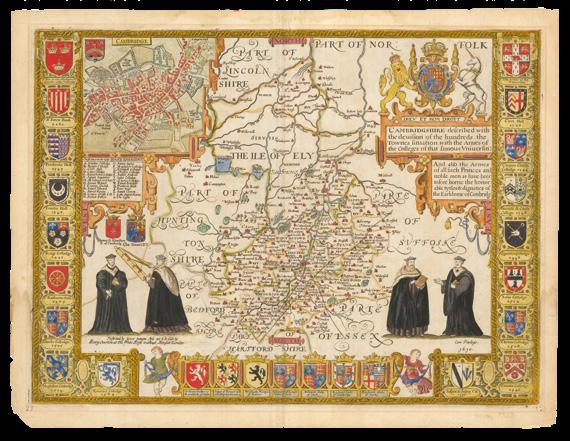
In this atlas, all the counties of England and Wales are shown, surrounded by splendid illustrations and accompanied by pages of text. Blaeu derived the cartographic contents from various editions of John Speed’s ‘Theatre of the Empire of Great Britain’ originally published in 1611, while the texts is largely copied from William Camden’s ‘Britannia’. Each map exhibits the craftsmanship and artistry of the Blaeu workshop, with their ornate cartouches, heraldic crests and intricate calligraphy. Blaeu originally published the volume as the fourth part of his 1645 ‘Atlas novus’. Later in 1662 the maps reappeared in volume five of his Atlas Maior, perhaps the finest cartographic work ever produced.
Willem Blaeu (1638) was the founder of the Blaeu cartographic dynasty, the finest mapmakers of the Golden Age of Dutch cartography. After moving to Amsterdam and establishing a shop in 1605, he was granted a privilege to print a navigational guide. Two years later, he produced a set of large carte-à-figure wall maps of the four continents and published a pilot with coastal profiles to accompany the sailing instructions. His greatest feat, however, was to publish a pair of globes 68 centimetres in diameter in 1616. He also made giant metal globes for Prince Crain Patenglo of Makasar and Christina of Sweden. Willem’s sons joined him in the firm, with the eldest Joan (1598) quickly assuming the lead. They produced their first atlas together in 1630, the ‘Atlas Appendix’. The title was deliberately chosen to position is as a supplement to the well-respected atlases of Abraham Ortelius and Gerard Mercator, and it mostly contained maps from their stock of plates. Five years later, they produced their ‘Atlas Novus’ with more than twice the number of maps in the ‘Appendix’, which was published in four languages. After Willem died, Joan expanded the ‘Atlas Novus’ into the ‘Atlas Maior’, the largest and grandest atlas of its time.
Provenance
Bookplate of William Goodwin, a gentleman who resided in Arlscoat during the first half of the eighteenth century.
BLAEU, Johannes
Atlas Major Sive Cosmographia
Blaviana, qua solum, salum, coelum accuratissime describuntur.
Publication
Amsterdam, 1665 [but later].
Description
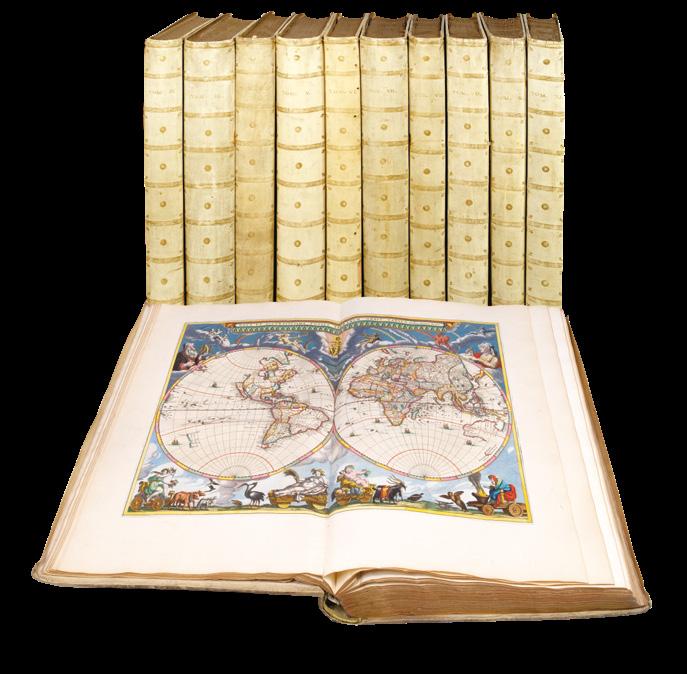
11 volumes, folio (555 by 360mm), three engraved allegorical frontispieces, architectural frontispieces, letterpress titles with engraved vignettes and divisional half-titles, 594 engraved maps and plates, mostly double-page (some folding), extra-illustrated with 18 engraved maps, engraved illustrations, coloured throughout in a contemporary hand, frontispieces and engraved titles heightened in gold, a.e.g., publisher’s vellum gilt with yapp fore-edges, covers panelled with stylised foliate roll, and large centre and corner arabesques, with central armillary sphere tool, spine divided into eight compartments by horizontal rolls, decorated with foliate corner pieces around a central rose tool, with remnants of original ties.
References
Brotton, 265-290; van der Krogt 2:601; Koeman I, BL 56 (pp.203-227); Phillips 3430.S.; Kramer, ‘Ex bibliotheca Reisachiorum’, Scriptorium 34 (1980), pp.91-95; Shirley, British Library.
£700,000
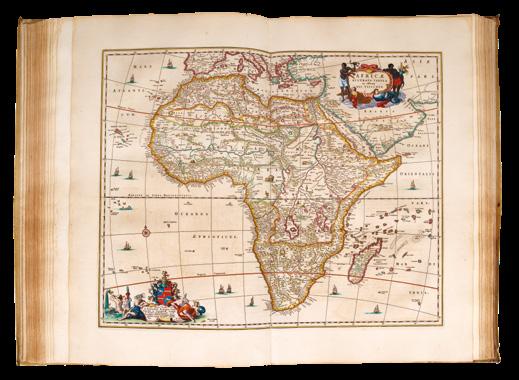
An fine extra-illustrated edition of Blaeu’s greatest work. Containing 18 extra maps by Visscher and de Wit, together with the allegorical frontispieces for Europe, America, and Africa, present in very few copies, all finely coloured and heightened in gold.
The ‘Atlas Major’ in its various editions was the largest atlas ever published. It was justly famed for its production values, its high typographic standard, and the quality of its engraving, ornamentation, binding, and colouring. The atlas frequently served as the official gift of the Dutch Republic to princes and other authorities. It is one of the most lavish and highly prized of all seventeenth-century illustrated books.
“In its sheer size and scale it surpassed all other atlases then in circulation, including the efforts of his great predecessors Ortelius and Mercator” (Brotton). The work was published simultaneously in five different languages, Latin, French, Dutch, Spanish, and German. What Blaeu managed to achieve was to contain the world in a book, an endeavour that in many respects would never be equalled.
Publication history
Blaeu’s great work was born in 1630 when he published his first atlas, the ‘Atlas Appendix’. The book consisted of 60 maps, and was billed by Blaeu as a supplement to Mercator’s atlas. His great rivals, Henricus Hondius and Johannes Janssonius, had expanded and reissued Mercator’s work. They were so frightened of Blaeu’s move into the publication of atlases that they rushed out a rival ‘Appendix’ by the end of the same year.
Over the next 30 years this great publishing rivalry would spur the production of ever larger and more lavish atlases. In 1634, Willem Blaeu produced his ‘Atlas Novus’, containing 161 maps; this was expanded in 1635 to two volumes, containing 207 maps. The house of Blaeu was so successful that in 1637 they moved into larger premises. The new building was the largest printing house in Europe, with its own print foundry and nine letterpresses. Unfortunately, Willem did not live long after the move and he passed away the following year. He was succeeded in business by his son Joan, who also inherited the lucrative and influential post of Hydrographer to the Dutch East India Company (V.O.C.).
Over the next 20 years Joan expanded the ‘Atlas Novus’: adding a third volume in 1640 covering Italy and Greece; in 1645, a fourth volume on the British Isles; and in 1654 a volume relating to China, the Atlas Sinensis. This was the first western atlas of China, based on the work of the Jesuit Marteo Martini. Janssonius managed to keep pace with his more illustrious rival. In 1646 he published a four volume atlas, adding a fifth – the first folio sea atlas – in 1650, and in 1658 a sixth consisting of 450 maps, some 47 more than Blaeu’s similar work.
In 1662, Blaeu announced that he would auction his bookselling business in order to finance the imminent publication of his great atlas.
From a brief look at the numbers it is clear that Blaeu needed the capital. The creation of the five editions took six years, from 1659 to 1665. It is estimated that 1,550 copies over all five editions were printed. If one totals up the entire print run, it comes to just over 5.4 million pages of text, and 950,000 copper plate impressions! Such a vast undertaking in capital and labour was reflected in the price of the work, with the French edition the most expensive at 450 guilders. The atlas was not only the costliest ever sold, but also the most expensive book of its day. To give us some idea of comparative value, the average price of a house in Amsterdam at the time of publication was 500 guilders.
The maps
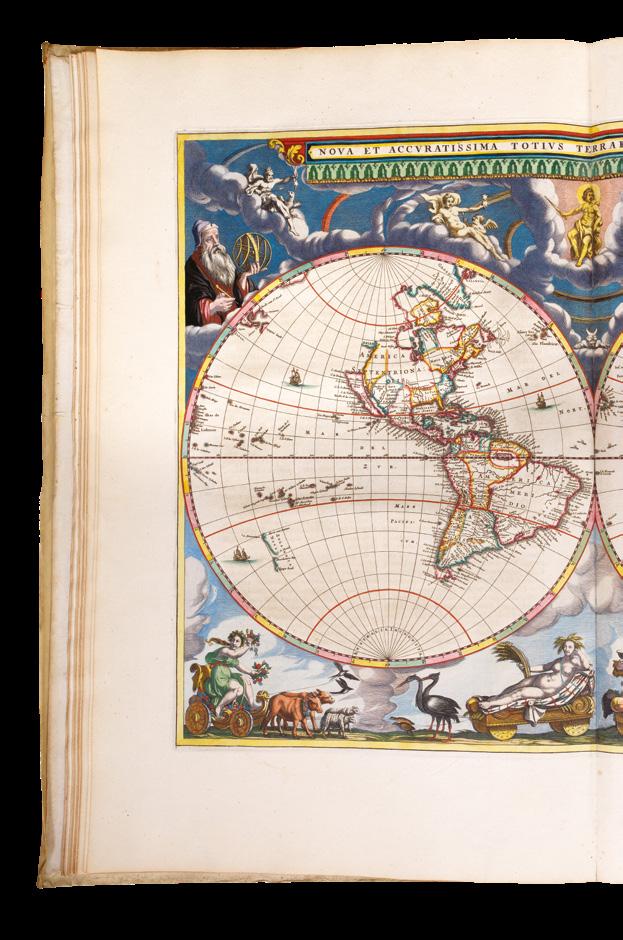
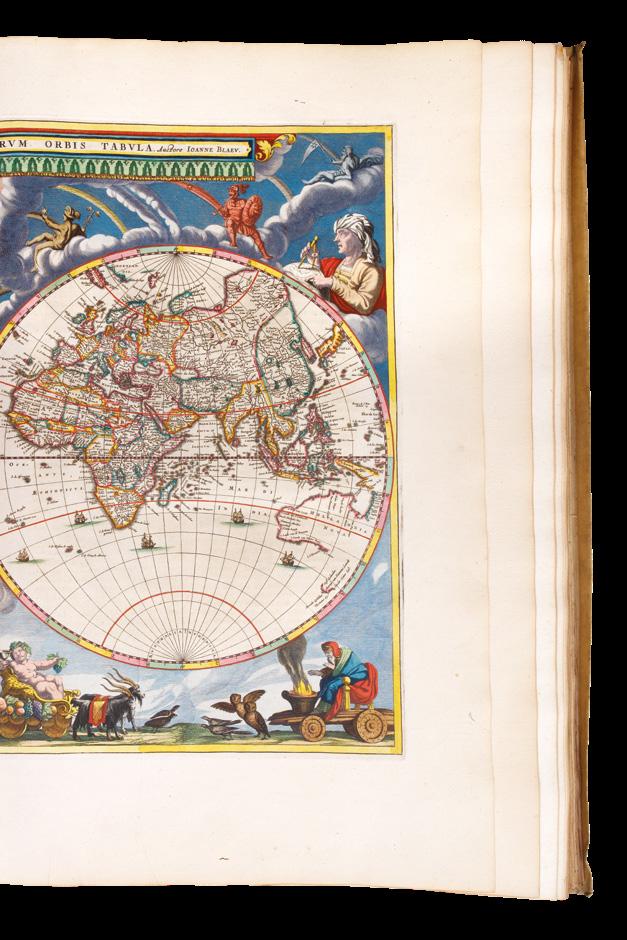
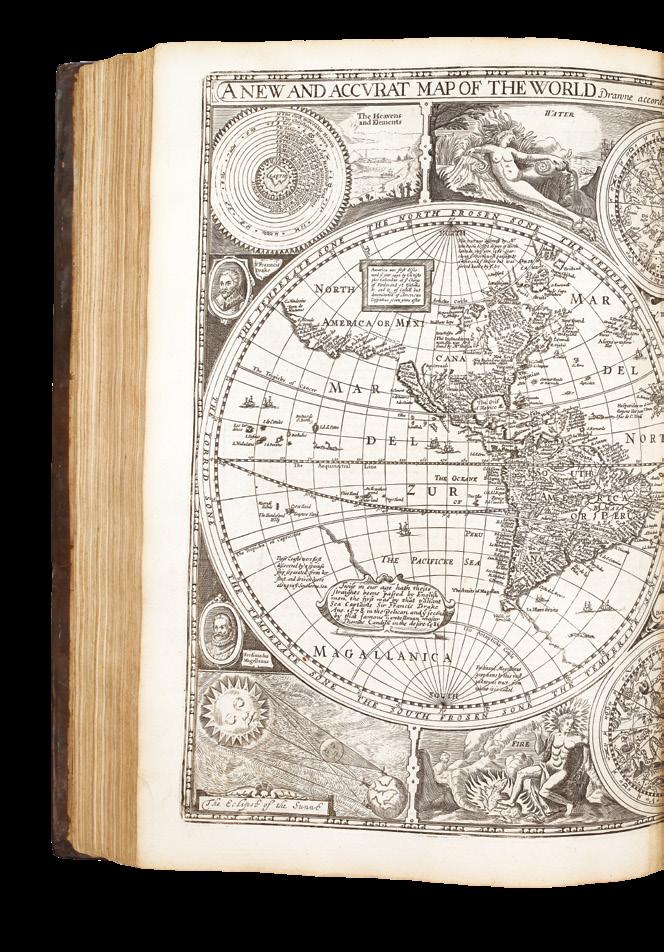
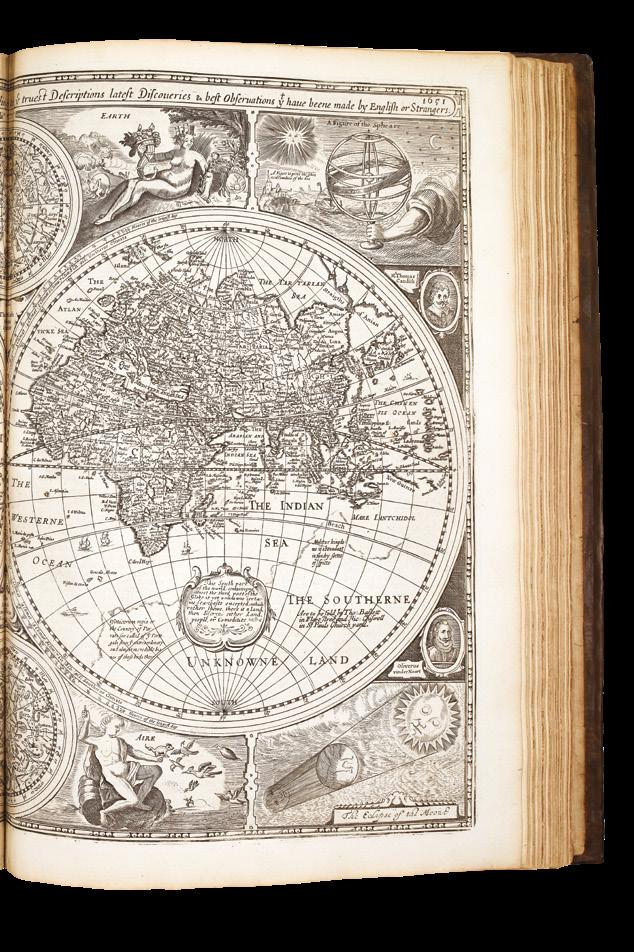
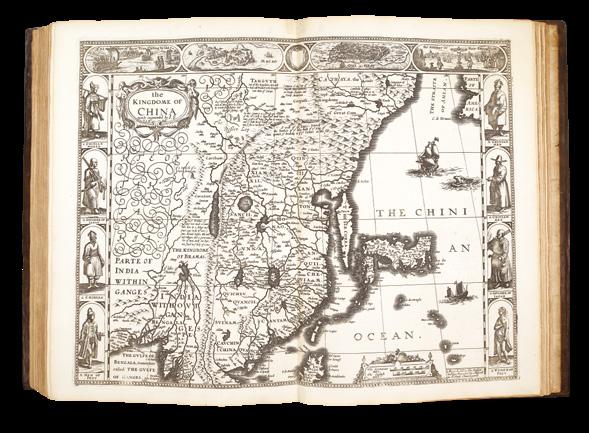
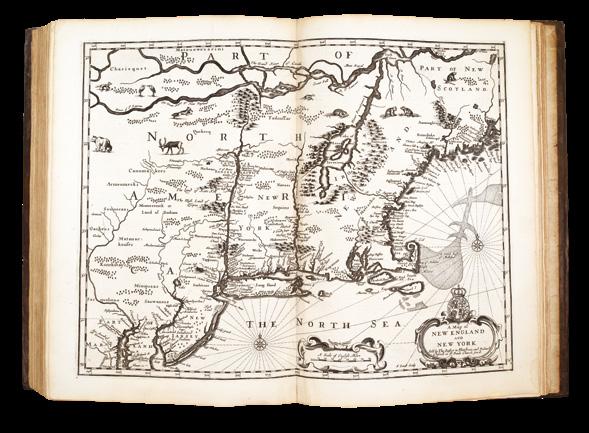
The maps are embellished in the Baroque style, and are among the most beautiful ever made. Of particular note are the famous side-panelled maps of the continents, the 58 maps devoted to England and Wales (vol. V), Martini’s Atlas of China, the first atlas of China published in Europe (vol. X), and a series of 23 maps of America, including important early maps of Virginia and New England (vol. XI). Of particular note is the double hemispheric world map, newly prepared for the atlas by Joan. Jerry Brotton suggests that this is the first world map in an atlas to portray the Copernican solar system.
Contents
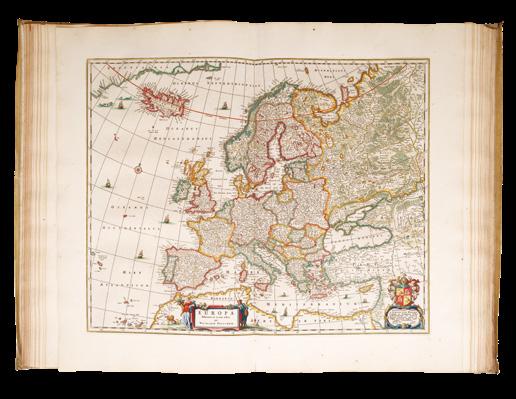
Volume I World, Europe and Scandinavia. 61 maps and plates; map of Denmark replaced by: VISSCHER, Nicolas ‘Regni Daniae Novissima et Accuratissima Tabula’; extra-illustrated with: VISSCHER, Nicolas, ‘Europa delineata et recens edita’, with Blaeu text to verso.
Volume II Northern and Eastern Europe. 39 maps and plates, extra-illustrated with eight maps: JANSSONIUS-WAESBERGIOS [and] Moses PITT, Novissima Russiae Tabula; DE WIT, Frederick, Regni Poloniae et Ducatus Lithuaniae Voliniae; BLAEU, Johannes, Ukrainae Pars quae Podolia; BLAEU, Johnanes, Ukrainae pars, quae Barclavia Palatinatus; BLAEU, Johannes, Ukrainae pars quae Pokutia; BLAEU, Johannes, Ukrainae pars quae Kiovia Palatinatus; VISSCHER, Nicolas, Totius Regni Hungariae Maximaeque; DE WIT, Frederick, Insula Candia Ejusque Fortificatio.
Volume III Germany. 96 maps, extra-illustrated with 1 map: VISSCHER, Nicolas,...Pomeraniae Ducatus Tabulam.
Volume IV The Low Countries. 63 maps, extra-illustrated with two maps: VISSCHER, Nicolas, Novissima et accuratissima XVII Provinciarum Germaniae Inferioris; VISSCHER, Nicolas, Belgii Regii accuratissima Tabula.
Volume V England and Wales. 58 maps.
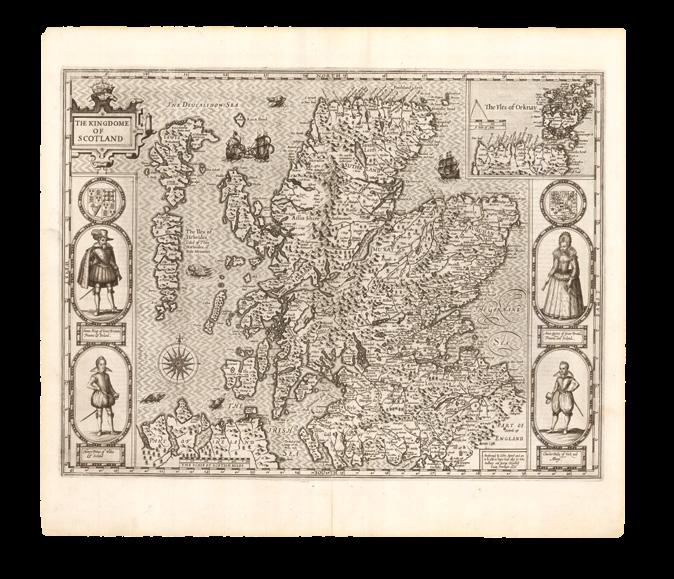
Volume VI Scotland and Ireland. 55 maps.
Volume VII France and Switzerland. 70 maps.
Volume VIII Italy. 60 maps, extra-illustrated with 1 map: DE WIT, Frederick, Insula sive Regnum Siciliae.
Volume IX Part 1. Spain and Portugal. Part 2. Africa. 41 ( 28 + 13), extra-illustrated with three maps: VISSCHER, Nicolas, Hispaniae et Portugalliae Regna; VISSCHER, Nicolas, Portugalliae et Algarbiae Regna; VISSCHER, Nicolas, Africae Accurata Tabula.
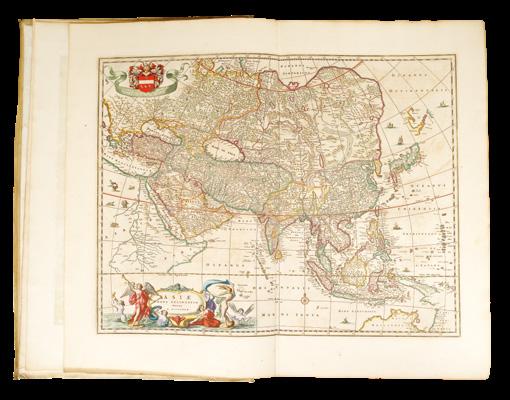
Volume X Asia. 28 maps, Blaeu Asia replaced by: VISSCHER, Nicolas, Asiae Nova Delineatio, with blaeu text to verso; extra illustrated with 1 map: VISSCHER, Nicolas, Terra Sancta sive Promissionis. olim Palestina.
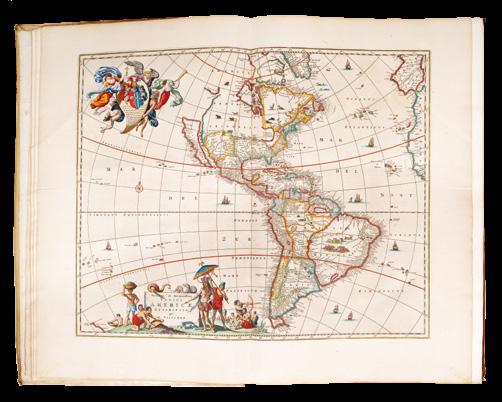
Volume XI America. 23 maps, extra-illustrated with 1 map: VISSCHER, Nicolas, Novissima et Accuratissima Totius Americae Descriptio.
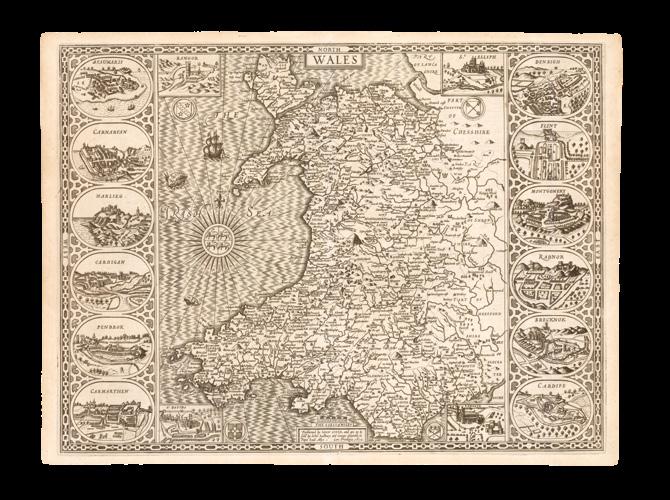
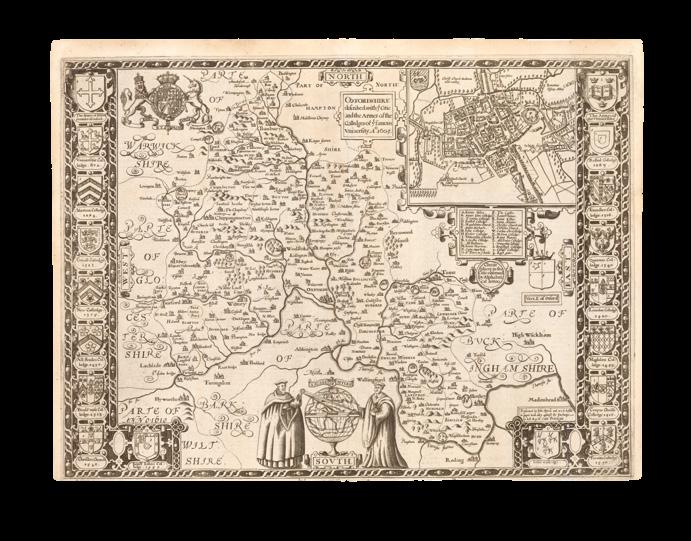
SPEED, John
The Theatre of the Empire of Great-Britain... Together with a Prospect of the Most Famous Parts of the World, viz. Asia, Africa, Europe, America....
Publication
London, Thomas Bassett and Richard Chiswell, 1676.
Description
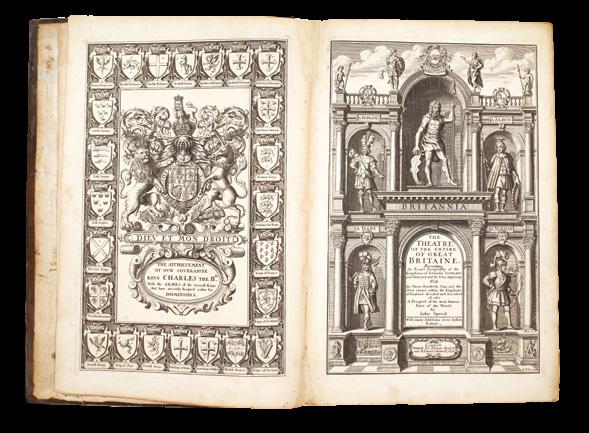
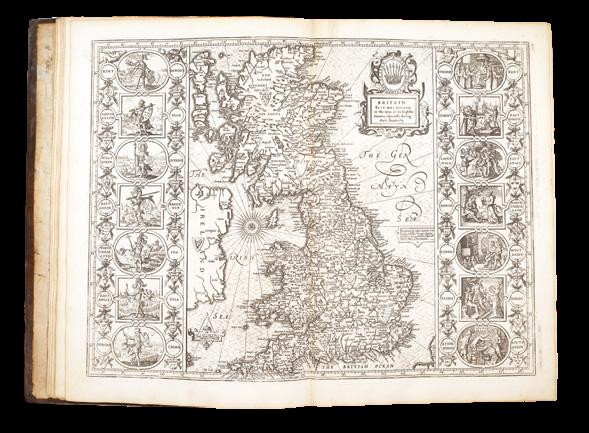
Folio (435 by 300 mm), engraved additional title with the achievement of Charles II, letterpress title in red and black, four letterpress sectional titles, the Theatre with sixty-eight double-page engraved maps, five letterpress tables of road distances, the Prospect with twenty-eight double-page engraved maps, including a doublehemisphere world map, totalling ninety-six maps; the British Isles map replaced by that of the British Islands (with the correct text), the map of Surrey replaced by the contemporary Anonymous-William Smith map with Overton imprint (without text on the verso), the Bohemia with paper flaw affecting the lower border, contemporary panelled calf, spine in six compartments, separated by raised bands, with red morocco label lettered in gilt, rebacked, boards slightly scored and worn.
£125,000
The first world atlas published by an Englishmen
A fine example of the first world atlas by an Englishman published in England.
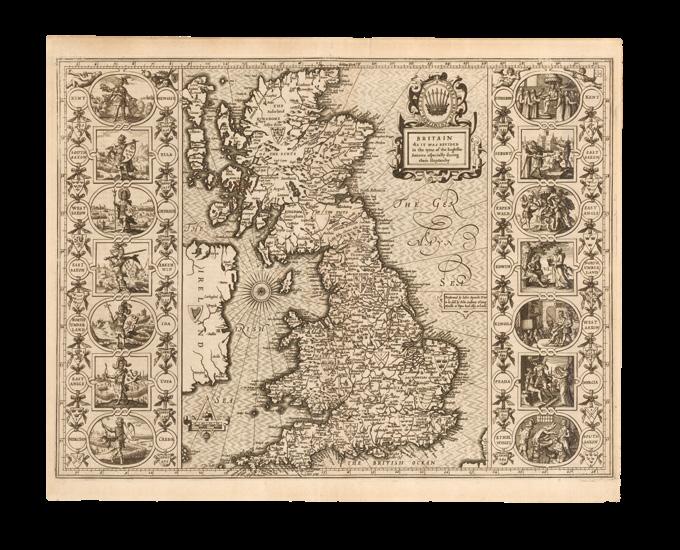
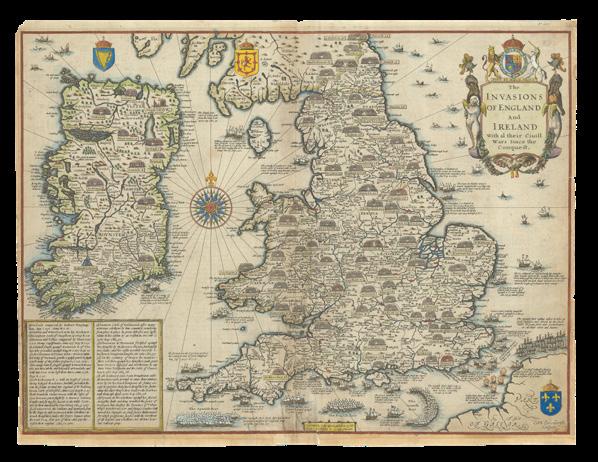
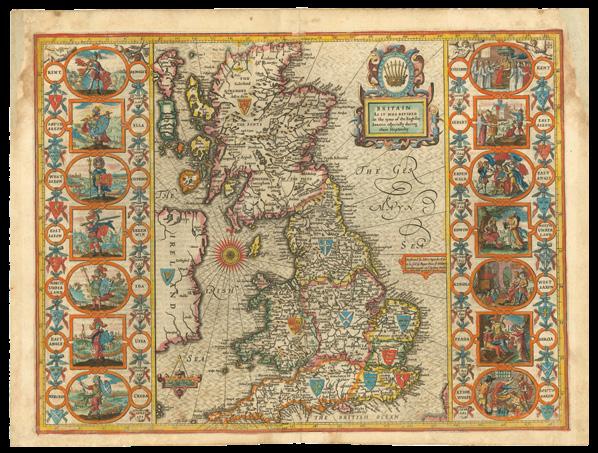
John Speed is perhaps the most famous single figure in the early history of the English map trade. He was a member of the Merchant Taylors’ Company, made free in September 1580, and later Fellow of the Society of Antiquaries. By training he was probably a rolling-press printer, but by interest he was a historian, and Queen Elizabeth granted him a sinecure in the Customs House, to give him the opportunity to pursue these interests. His earliest cartographic publications were historical; in 1595, he published a wall map of the Holy Land, Canaan as it was Possessed both in Abraham and Israels Dayes, a two-sheet map of The Invasions of England and Ireland with all their Civill Warres since the Conquest (1601) and a wall map of England, Wales and Ireland showing the same information, [1603-1604]. In 1611 he prepared two Bible maps, the larger inserted in folio editions of the great King James Bible, the smaller in octavo printings; Speed also secured a privilege, dated 31st October 1610, to ensure that the map was inserted in every copy of the Bible sold, a lucrative arrangement that the Stationers’ Company eventually felt impelled to buy out from his heirs. Speed always considered his History of Great Britaine (1611) his major work, but his reputation was established by the companion atlas volume ‘The Theatre of the Empire of Great Britaine’.
The ‘Theatre’ followed the model of Ortelius’s ‘Theatrum orbis terrarum’ - first published in English in 1606 - in its title and its format, with map-sheets backed by historical and geographical texts and gazetteers of place names.
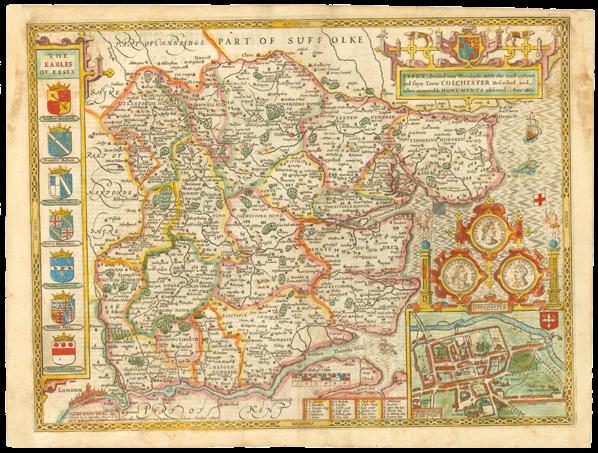
This was the earliest English attempt at producing an atlas on a grand scale, with the first detailed maps of the provinces of Ireland, the first set of county maps consistently attempting to show the boundaries of territorial divisions, and the first truly comprehensive set of English town plans-a notable contribution to British topography. Perhaps as many as fifty of the seventy-three towns had not previously been mapped, and about fifty-one of the plans were probably Speed’s own work.
In 1606, Speed might have been helped by his son John in surveying towns. A balance is struck between the modern and historical, with information placed on the edges of the maps about antiquarian remains, and sites and vignettes of famous battles, together with arms of princes and nobles. This additional information is one of the ‘Theatre’’s most significant contributions. Scotland is covered in less detail, as Timothy Pont was surveying there.
Individual maps for the Theatre were prepared from about 1602, plates were engraved by Jodocus Hondius-noted for his skills in decorationfrom 1607, George Humble was granted a privilege to print the ‘Theatre’ for twenty-one years from 1608, and the ‘Theatre’ and ‘History’ were published together in 1611-12. They were an immediate success: three
new editions and issues of each appeared during Speed’s lifetime, and a miniature version was first published about 1619-20. The maps in the ‘Theatre’ became the basis for subsequent folio atlases until the mideighteenth century. By 1625 Speed had lost his sight. Nevertheless, in 1627 he published ‘A Prospect of the most Famous Parts of the World’, the first world atlas compiled by an Englishman and published in England, although the maps were engraved in Amsterdam, using Dutch models. Again, this was printed with English text on the verso, and reprinted thereafter. While early editions are rarer, perhaps the most important edition was the 1676 printing (the present example), which added newly prepared English maps of New England, Virginia, the Carolinas, Barbados and Jamaica.
[WILLDEY, George]
[Composite atlas].
Publication London, [c1721].
Description
Large folio (482 by 317 mm). 21 double page maps, 19 in original outline hand colour, brown calf, gilt, turn-ins gilt, spine divided into six compartments by raised bands, gilt fillets and title in gilt lettering.
References
Shirley, T-Anon 3a; Worms, Laurence and Baynton-Williams, Ashley, British Map Engravers, (London: Rare Book Society, 2011).
£75,000
Willdey’s rare composite atlas
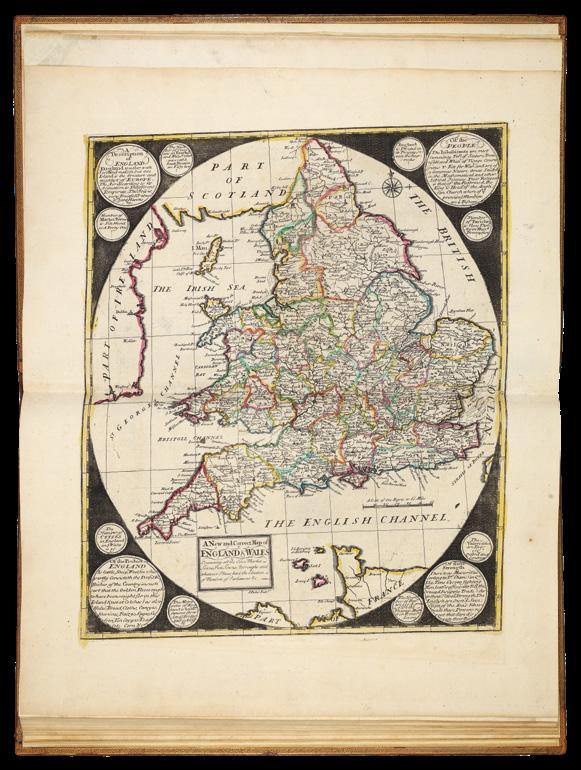
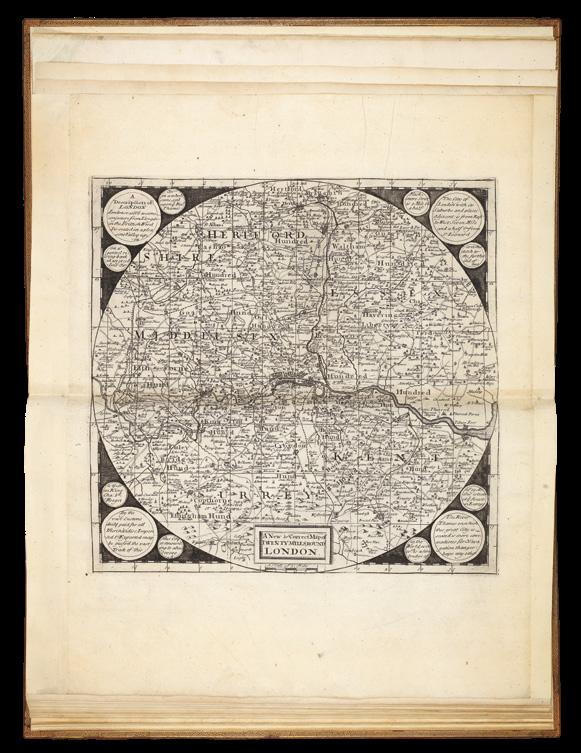
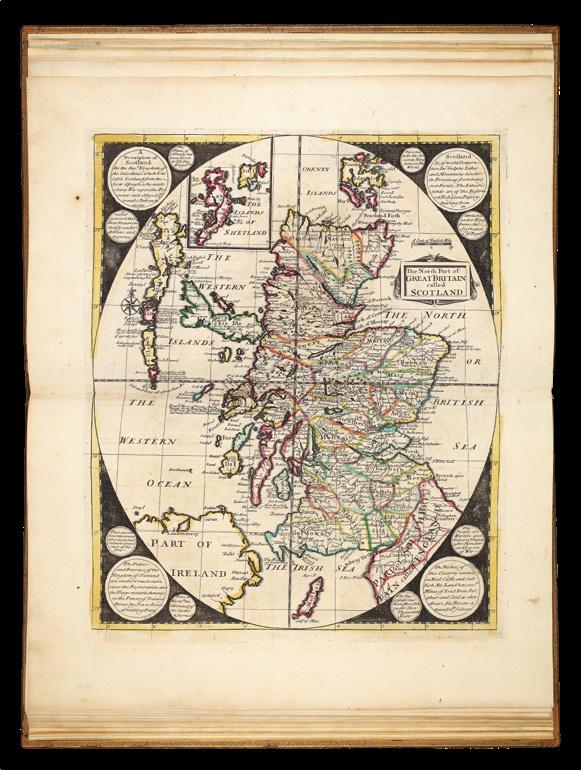
A composite atlas by George Willdey, made up of unusual round maps with information about the areas portrayed included in small roundels in the black border surrounding the cartographical elements. Although the atlas has no title page, it was in all likelihood compiled by Willdey’s establishment. The maps are almost identical to the series advertised by Willdey in ‘Post Man’ (issue 4112) on the 23rd-25th November 1721:
“a Set of 20 different New Sheet Maps, of the Principal Kingdoms and States of Europe, with particular Historical Explanations to each Map, so as to make it when put together, with its proper Colours and Illuminations, one of the largest, beautifullest, most useful, and diverting Ornaments, as well as best Set of Geography ever yet done of this kind; the Names of the Maps aforesaid, are a Northern Celestial Hemisphere, a Southern, ditto England, Scotland, Ireland, 20 Miles round London, 20 Miles round Oxford, 20 Miles round Cambridge, Germany, France, Spain, Italy, Sweedland, Poland, Denmark, Muscovy, Hungary, the Turks Dominions in Europe, Flanders, and the Seven United Provinces. This Set of Maps may be fitted up several ways and sizes, or bound in a Book, or Sold single, to fit Gentlemens Conveniency; it is done by the Direction and Charge, and Sold by George Willdey...”
Clearly, the customer in question chose to have the maps bound into an atlas rather than pasted together, adding a map of the electorate of Brunswick-Lunsberg, the ancestral holdings of the Hanoverian dynasty of British monarchs. There was substantial British interest in the European territories of their rulers.
Two maps are signed by Samuel Parker (b.1695, fl.1718-1728), draughtsman and engraver. At least three of the maps - the southern hemisphere, England and Wales, and Sweden and Norway - can be attributed to him, and given the similarity of the others in style it is probable that he engraved them as well (Worms and Baynton-Williams).
To find the maps together as an atlas is rare. Shirley notes a composite atlas held by the British Library containing 19 of the 21 maps in the present example. In the British Library copy, the map of Sweden and Norway is dated c1790 and signed by James Barlow, indicating that the Library copy is dated later than the present example, which appears to have been compiled at the time of the advert. The British Library also holds an example of later states of the maps, printed by Thomas Jefferys, made up into a screen.
George Willdey (?1671-1737) was a flamboyant London shopkeeper and self-publicist. His principal business was as a toy-man and seller of luxury goods, jewellery, gold and silver trinkets, and china. However, he was perhaps the first mapseller to widen the appeal of maps from an intellectual elite to the general public; adverts like the one above show his attempts to broaden their appeal.
[SAXTON, Christopher]
[The Shires of England and Wales... Sold by Thomas Jefferys, Geographer to his Royal Highness the Prince of Wales; in Red Lyon Street near St John’s Gate].
Publication [London, Thomas Jefferys, c1749].
Description
Folio (570 by 425mm), 38 engraved maps (map of Yorkshire on two sheets), 16 with original hand-colour in outline, most maps trimmed to neatline, Yorkshire and Worcester with loss, Berry England and Wales with large tear, contemporary quarter cloth over blue paper boards, rubbed.
References Hodson 184.
£30,000
Jefferys’s edition of Saxton’s atlas of England and Wales
After Christopher Saxton’s death (1542-1610), the plates for his atlas of England and Wales were used to publish editions in 1645 (William Web), 1665 (unknown publisher), c1689, and c1693 (Philip Lea). On Philip Lea’s death in 1700, his widow, Anne, continued the business. The date of Anne Lea’s death is unknown, but on 5 August 1730 the Daily Journal carried an advertisement:
“To be sold by Auction, On Friday the 14th Instant... All the Copper Plates belonging to the Estate of Mrs Anne Lea, deceased, late of Cheapside... with the County Maps of Great Britain and Ireland, many of them done from an actual Survey thereof...”.
“For many years George Willdey advertised his stock regularly in the newspapers, and almost from the start he sold maps... Evidently Willdey decided to enlarge his range of maps by bidding at the Lea sale of 1730, and among his purchases were the old Saxton plates. The first Willdey advertisement to be discovered mentions his new acquisition appeared in the Daily Post 3 February 1731/2:
The 70 maps of one Sheet each are as good as ever were done of the Size, most of them are actual Surveys, they contain... all of the Counties of England and Wales.
The one-sheet maps were sold singly at 4d. each. There is no mention of the county maps bound as an atlas with a title-page in this or any of the numerous advertisements for the maps which appeared in the following five years until Willdey’s death in 1737... [However] it is unlikely that this enterprising retailer, the ‘most noted Toyman in Europe’ would have long overlooked the possibility of offering a county atlas and it seems reasonable to suppose that the atlas was made available at around the same time as the loose maps, in 1732” (Hodson).
Following George Willdey’s death the business was carried on by Thomas Willdey - though whether this was his son or his brother (both unhelpfully named Thomas) - with Thomas continuing to sell the Saxton maps separately until his death in 1748. Although the exact date is uncertain, it is probably at this point that the plates were acquired by Thomas Jefferys. They were certainly in his possession after 1746, as the only known example with a title page, describes Jefferys as Geographer to the Prince of Wales, a position he took up in 1746. The title also bears his address at: Red Lyon Street - he moved from this premises to Charing Cross in 1750.
The plates would continue to be in Jefferys’ possession up to his death, in 1771, when they were acquired by their final owner Cluer Dicey and Co.
The present example confirms to Hodson 184, though lacks the Saxton map of England and Wales. The work also lacks a title pagethough none of the extant examples bear one either - two in the BL, and the National Library of Wales. The title page referenced by Hodson is mentioned by Whitaker and bound into an example of a Saxton Willdey atlas in his possession.
All extent examples are incomplete: British Library Map C.21.e.12 lacks the map of Yorkshire; British Library deposit no. 1234 lacks map of Northumberland; and the National Library of Wales’ example lacks maps of Devon, Essex, Northumberland, Suffolk, and Yorkshire.
All the maps have Willdey’s imprint removed. The present map of Sussex, Surrey, and Kent is in the a slightly earlier state to the one listed by Hodson; with the names of Surrey, Sussex, and Canterbury amended, but with Philp Lea’s imprint still present.
List of maps
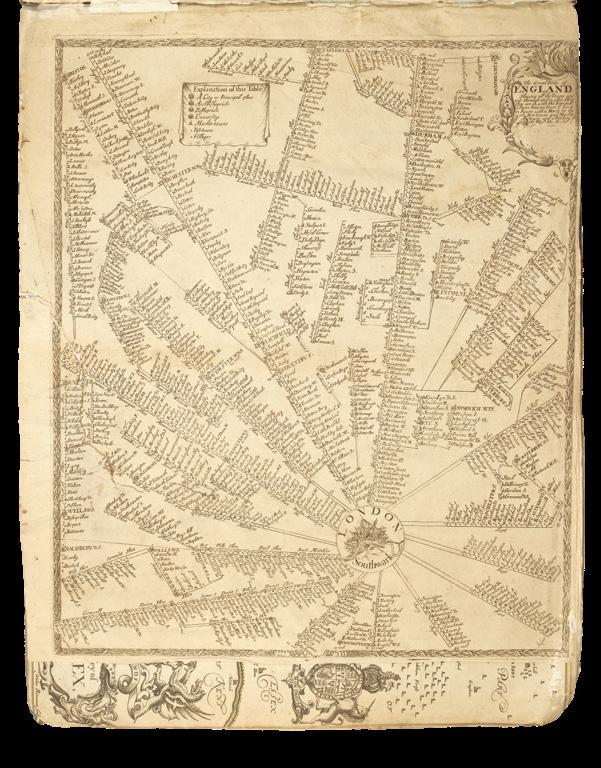
1. [BERRY, William] The Grand Roads of England, Shewing All the Towns you Pass thorough and in what Shire they are in with the Reputed distance between Town & Town in Figures with a Mark for the Posttowns and Market-towns and what Day of the Week the market is. [London, 1679 but c1749].
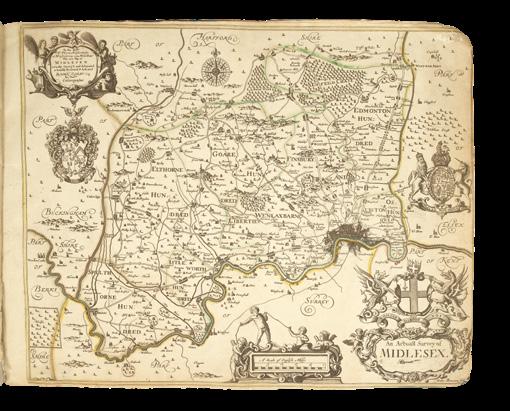
2. OGILBY, John. An Actuall Survey of Middlesex. [London, 1674 but c1749] Imprint erased. Morgan fialing to find support for Ogilby’s county atlas of England and Wales sold the only 3 completed maps (Kent, Essex, and Middlesex) before 1689. They were in the possession of Philip Lea along with a plan of London. Lea imprint removed.
3. SAXTON, Christopher. A Map of Essex, newly revised & Amended by P. Lea. [London, c1749].
4. SAXTON, Christopher. Sussex, Surry and Kent by C. S. Corrected & Ammended with many Additions by Phil Lea [London, c1749].
5. SAXTON, Christopher. Oxford, Buckingham, Bark-shire. By C. S. Corrected and Amended with many Additions by P: Lea. [London, c1749].
6. LEA, Philip. A Map of the Isle of Wight, Portsea Halinge... [London, c1749]. Willdey’s imprint erased.
7. SAXTON, Christopher. Hampshire by C. Saxton Corrected & many Aditions by P. Lea. [London, c1749].
8. SAXTON, Christopher. Glocester-shire Described by C. S. Corrected and Amended with many Additions by P. Lea. [London, c1749].
9. [WILLDEY, George. after] John SELLER. Hertfordshire Actually Surveyed and Delineated by John Seller Hydrograher to the King. [London, c1749]. Imprint of George Willdey removed.
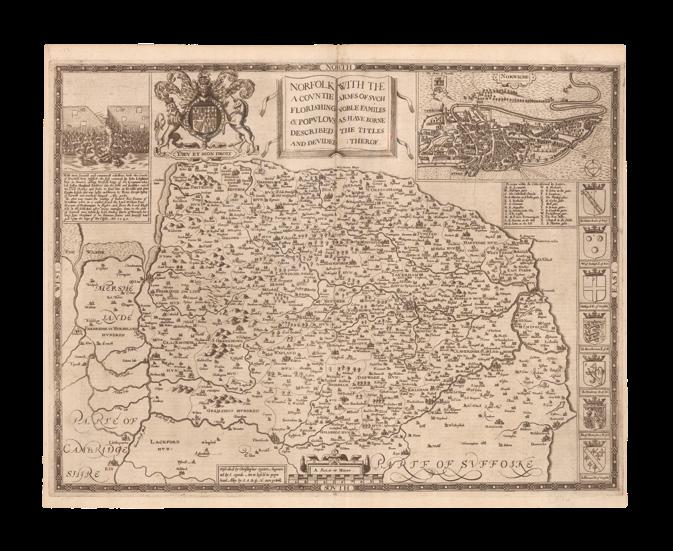
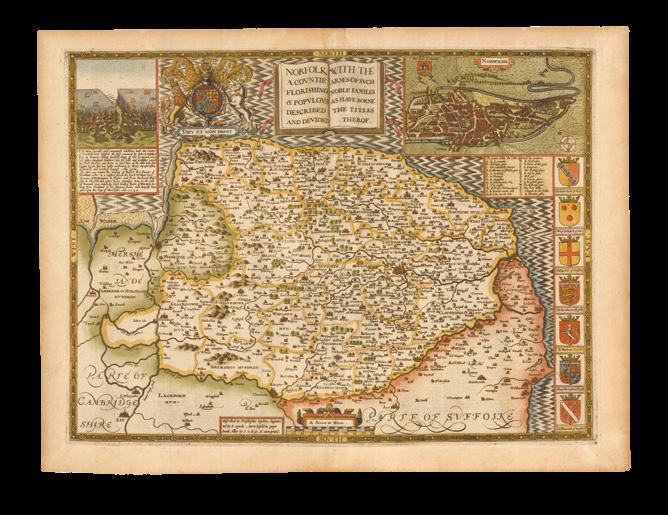
10. SAXTON, Christopher. Norfolfk Described by C. Saxton Corrected and Amended with many Additions of Roads &c. By P. Lea. [London, c1749].
11. SAXTON, Christopher. Suffolk Described by C. Saxton Corrected & Amended with many Additions as Roads &c. By P. Lea. [London, c1749].
12. SAXTON, Christopher. Wiltshire w[i]th Salisbury Citty & stone heng described Ano. 1689. [London, c1749].
13. SAXTON, Christopher. Dorestershire, Described by C. Saxton Corrected and Amended with many Additions as Roads &c. P. Lea [London, c1749].
14. SAXTON, Christopher. Sommersetshire Described by C. Saxton... P. Lea [London, c1749].
15. SAXTON, Christopher. Devon-Shire Described by C. Saxton... P. Lea [London, c1749].
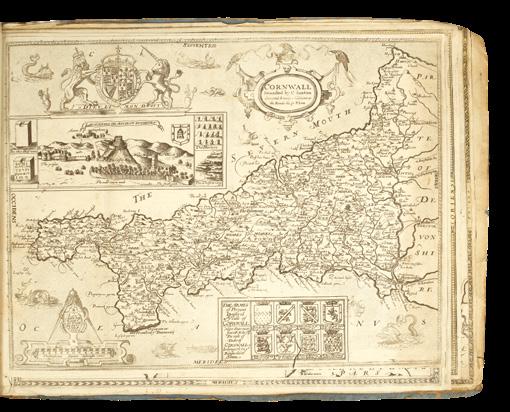
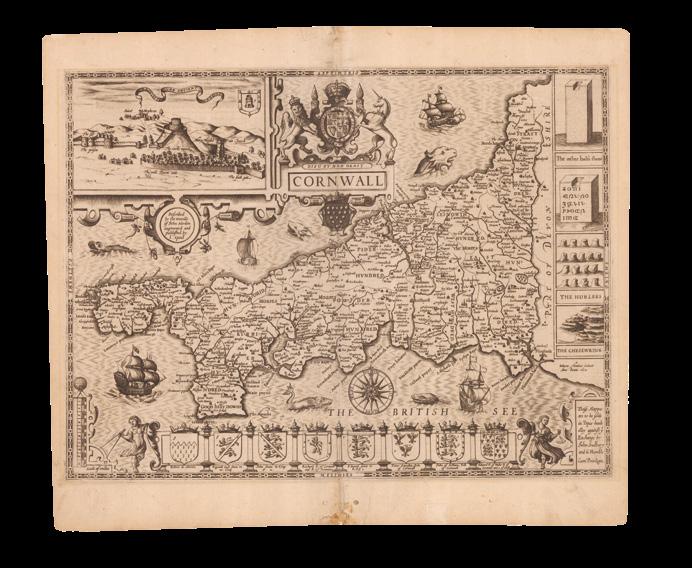
16. SAXTON, Christopher. Cornwall Described by C. Saxton... P. Lea. [London, c1749].
17. SAXTON, Christopher. Pembrockshire Discribed by C. S.... P. Lea [London, c1749].
18. SAXTON, Christopher. Monmouthshire... by C. S.... P. Lea [London, c1749].
19. SAXTON, Christopher. Glamorgashire Described by C. S.... P. Lea. [London, c1749].
20. SAXTON, Christopher. Denbigh and Flintsh. Described by C. S.... P.Lea [London, c1749].
21. SAXTON, Christopher. Mona Insula alias Angelsey... Described by C. S.... Phl: Lea. [London, c1749].
22. SAXTON, Christopher. Merioneth and Montgomery Described by C. S.... By P. Lea [London, c1749].
23. SAXTON, Christopher. Radnor, Breknoke, Cardigan... Discribed by C. S..... by P. Lea [London, c1749].
24. SAXTON, Christopher. Comberland and Westmorland Exactly Described by C. S.... By P. Lea. [London, c1749].
25. SAXTON, Christopher. The County Palatine of Chester by C. S.... by P. Lea. [London, c1749].
26. SAXTON, Christopher. Lincolnshire and Nottinghame Shire by C. Saxton [London, c1749].
27. SAXTON, Christopher. Warwick and Leicester shires Described by C. Saxton... by P. Lea. [London, c1749].
28. SAXTON, Christopher. Shropshire accurately drawen... C. Saxton.. P. Lea. [London, c1749].
29. SAXTON, Christopher. Worcester Shire Described by C. Saxton... P. Lea. [London, c1749].
30. SAXTON, Christopher. The County of Hereford resurveyed & Enlarged 1665. [London, c1749].
31. SAXTON, Christopher. Derby Shire Described by C. Saxton... P. Lea. [London, c1749].
32. SAXTON, Christopher. Stafford Described by C. S.... P. Lea [London, c1749].
33. MOORE, Jonas. Cambridge-Shire and the Great Level of ye Fenns... by Sr. Jonas Moore &c. [London, c1749]. Willdey’s imprint removed.
34. SAXTON, Christopher. The County of Northampton... Bedford, Huntington & Rutland exactly drawen by one Scale by C. S.... P. Lea. [London, c1749].
35. SAXTON, Christopher. The County Palatine and Bishoprick of Durham Described by C. Saxton.... P. Lea. [London, c1749]. Willdey’s imprint removed.
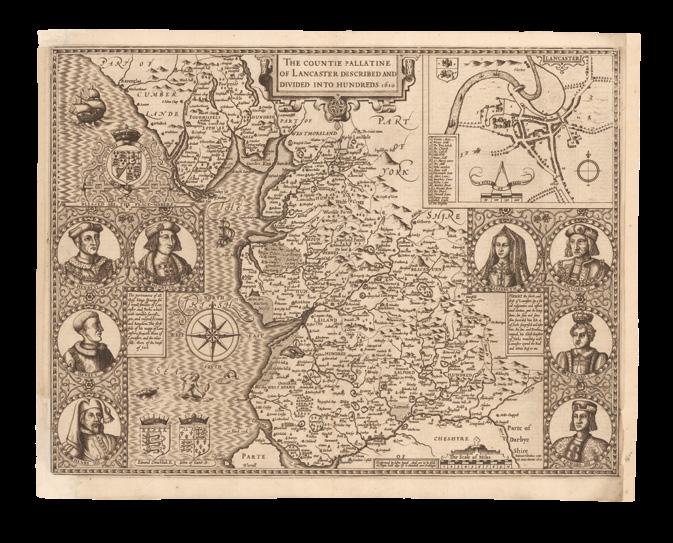
36. SAXTON, Christopher. The County Palatine of Lancaster Described by C. Saxton.. P. Lea. [London, c1749]. Willdey’s imprint removed.
37. SAXTON, Christopher. York-shire Described by Ch. Saxton.. P. Lea. [London, c1749]. On two sheets, loss to lower left and right.
38. SAXTON, Christopher. Northumberland Described by C. Saxton... P. Lea. [London, c1749].
[The Chaworth Master]
[Genealogical roll].
Publication [c1321-1327].
Description
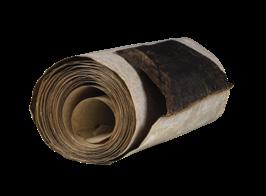
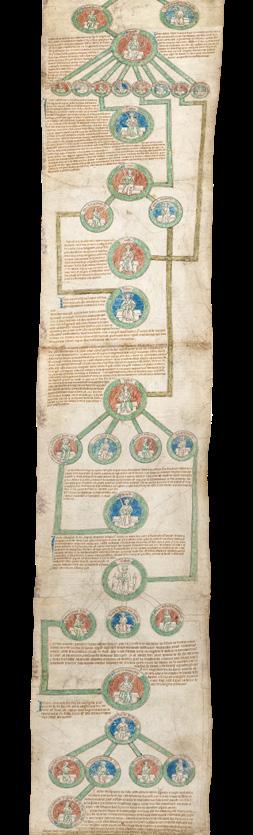
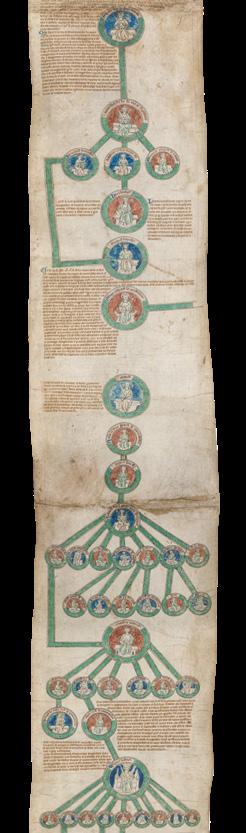
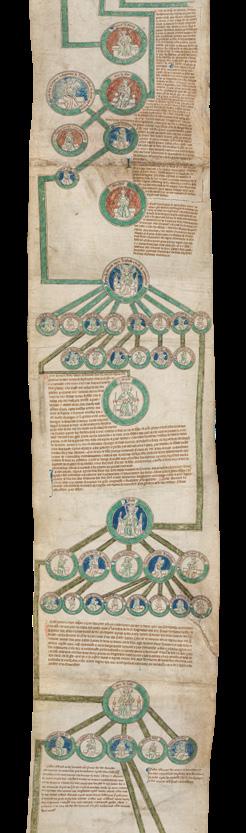
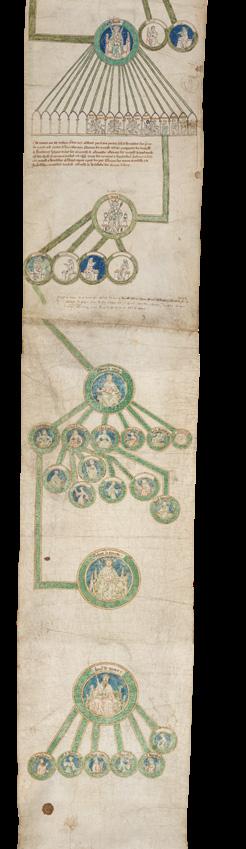
Pen and ink with polychrome wash, text in Anglo-Norman French, nine parchment membranes glued end to end. The first eight of these membranes were assembled and executed between 1321-7. A ninth membrane was added to the roll during the reign of Henry IV, between 13991413, which continues the genealogy from Edward III to Henry IV’s children. Modern repairs have patched the parchment where it has been damaged by the corrosive action of the verdigris green pigment used liberally in the genealogy. The surface of the parchment is rubbed, testimony to the wear and tear of repeated unfurling and re-rolling of the manuscript over seven centuries. Overall, the Chaworth Roll is in very good physical condition.
Dimensions
6500 by 245mm (256 by 9.75 inches).
£750,000
The Chaworth
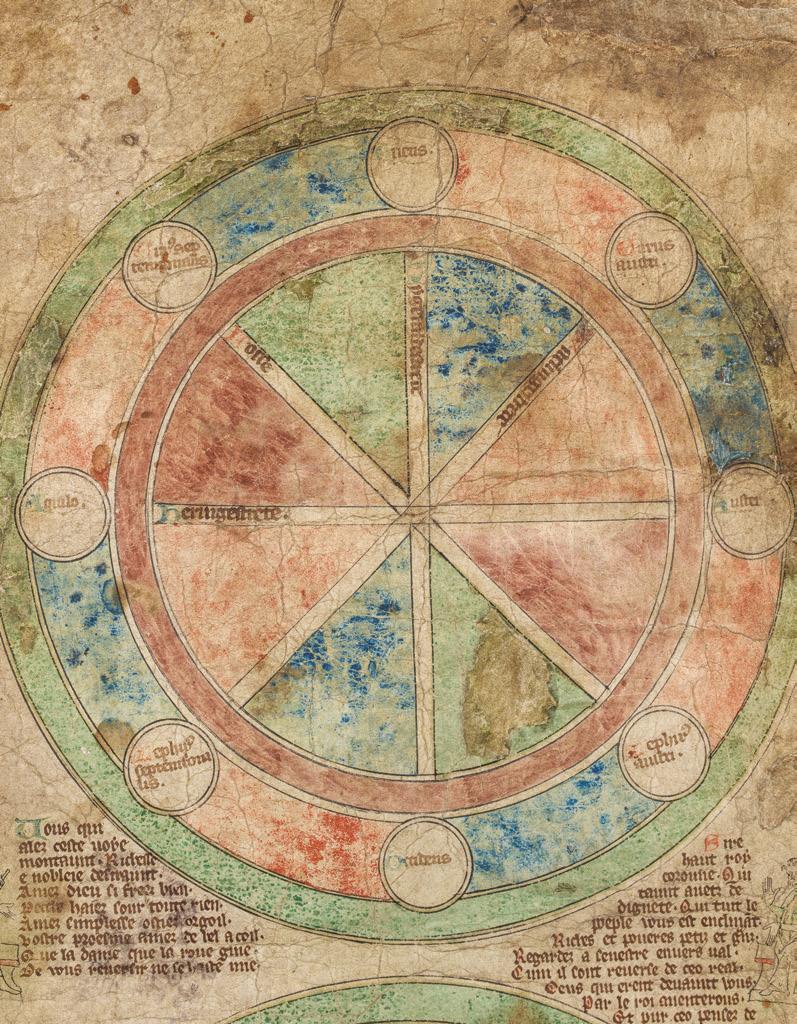
The Chaworth Roll is a genealogical roll that traces the pedigree of the kings of England from Egbert (829-839) to Edward II (1307-1327), with a later an extension to Henry IV (1399-1413). Written in Anglo-Norman French, and comprising nine parchment membranes at some 6.5 metresin length, it also incorporates the second earliest recorded road map of the British Isles, a fine example of early English vernacular art, and astylised map of the Anglo-Saxon Heptarchy.
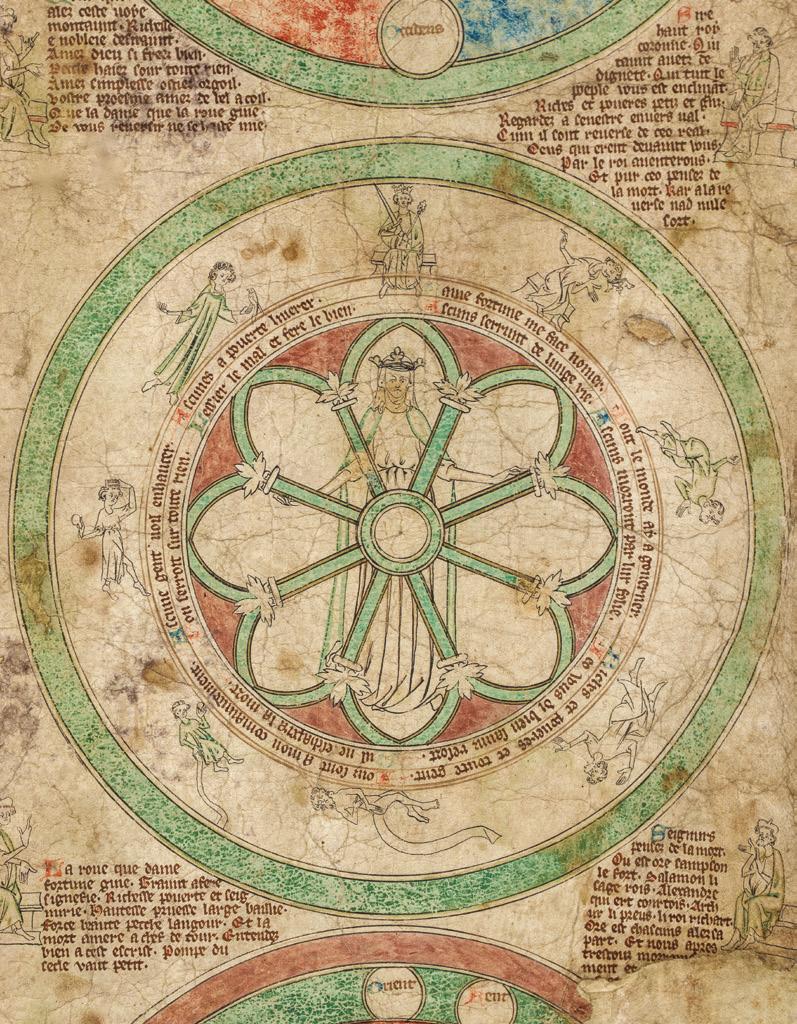
Such rolls were chiefly didactic in purpose, and often made to educate children. Indeed, it is likely that the Chaworth roll was commissioned as one of four scrolls made for the children of Sir Thomas Chaworth (1290-1343). However, as easily understood documents presenting a popular narration of history, they also serve as secular and pictorial justifications for the authority of the royal line. British historical convention dictates that the crown’s pedigree begins with Egbert as he is traditionally credited with bringing peace to, and uniting, the seven disparate Anglo-Saxon kingdoms of Kent, Essex, East Anglia, Northumbria, Mercia, Wessex, and Sussex. Because of this, medieval genealogical rolls often begin with a description of these disparate kingdoms in order to illustrate the historical legitimacy of the power of the crown. What marks the Chaworth roll as distinctive, however, is the inclusion of additional “pictorial prefaces” showing both the Royal Roads of England, and the “Wheel of Fortune”. It can be argued that the Royal Roads map is included to depict the legal authority of the crown, the wheel of fortune illustrates the role of the fates in monarchical power, and the second “map” of the Anglo-Saxon Heptarchy represents the historical legitimacy of the royal line. Taken together these three prefaces can be seen as statements of the power of the crown and the right to rule by dint of geography, fate, and history. This moves the role of the roll from that of an educational tool to an instrument of power, politics, and propaganda.
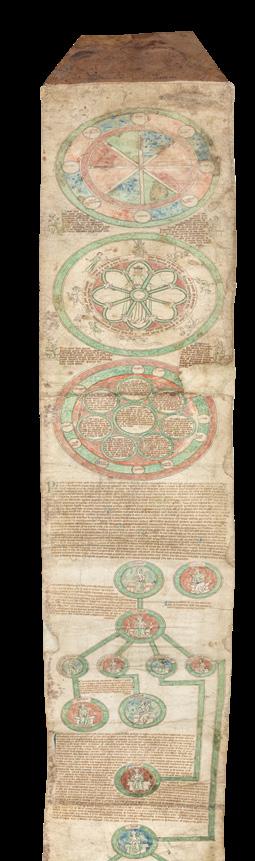
Content
The roll begins with three large roundels representing, in turn, the Royal Roads of Britain, a Wheel of Fortune, and the seven Anglo-Saxon kingdoms, known as the Heptarchy. The Heptarchy diagram is followed by a passage explaining its content. The royal pedigree then begins with King Egbert, and continues to Edward II and his four children, before an additional membrane continues the genealogy from Edward III to Henry IV’s children (c1399-1413).
The backbone of the genealogy is the representation of the Kings of England and their children in medallions interconnected with green bands. Large medallions containing fictive portraits of the kings are arranged along a central axis, with smaller medallions containing images of each monarch’s children. Kings themselves are depicted twice, first among their siblings as their fathers’ sons, and again in larger roundels as
crowned monarchs. Only the depiction of Edward l’s children deviates from this circle-and-line pattern: these portraits are represented in a quasiarchitectural arcade of niches. A single artist, dubbed here the Chaworth Master, executed all of the drawings on the first eight membranes of the roll, except for six portrait roundels and eight of the children of Edward I portrayed in niches on the eighth membrane.
All of the portrait medallions contain full-length figures seated on benches. The kings are crowned, and hold swords, scepters, or both. Most of the kings face forward, confronting the viewer directly, while their children usually turn to face one another in pairs, gesturing towards one another conversationally. These pen-and-ink portraits are subtly washed with colour, the drapery of their clothes tinted with pale green and red. Backgrounds are painted in solid washes of either red or blue or, occasionally, left as bare parchment. The compass-drawn roundels and the bands that connect them are washed with a bold green.
Passages written in Anglo-Norman French accompany the circleand-line pedigree, summarizing the main features of each monarch’s tenure, including the duration of the reign and the place of the king’s burial. A single scribe is responsible for the text on the first seven membranes of the roll, including the inscriptions that identify each portrait, in a clear Gothic book-hand3. Two additional scribal hands added texts to the penultimate membrane.
The Chaworth Roll has been well researched and discussed as noteworthy for both its content and artistic merit, both of which have been well described in an essay by Professor Alixe Bovey, Head of Research at the Courtauld Institute of Art. However, the Chaworth Roll has not been previously appreciated as a work of medieval cartography. New medieval maps rarely come to light, and fewer still are offered for sale. When they do, they are usually small scraps and partial maps of estates or settlements, parochial in nature. The Chaworth Roll is, therefore, remarkable in its use of highly stylised cartography as data visualisation and propaganda.
There is a close relationship between the Chaworth Roll, and three other genealogical rolls, now in the Bodleian (Oxford, Bodleian MS Fr. d. 1 (R)) and Cambridge University Library (Cambridge, University Library MS O0.7.32 and MS Dd.3.58).
A full catalogue description and Professor Bovey’s essay is available on request.
[BRAUN, Georg and Franz HOGENBERG]
Londinium Feracissmi Angliae Regni Metropolis.
Publication [Cologne, 1572].
Description
Double-page engraved map, hand-colour.
Dimensions
330 by 480mm (13 by 19 inches).
Scale
6 1/2 inches to 1 statute mile.
References Van der Krogt, 2433 [London: 41.2].
£15,000
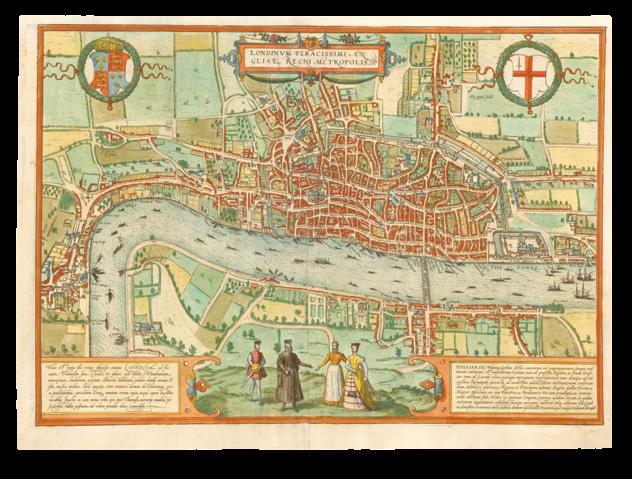
The earliest extant plan of London
This magnificent plan was first published in Braun and Hogenberg’s seminal town book ‘Civitates Orbis Terrarum’, 1572. London is depicted in birds-eye view from the south looking north. Above the plan is the title in Latin flanked by the royal and the City of London’s arms. In the foreground are four figures in traditional Tudor dress, together with two cartouches with text. The text on the left hand side is a paean to London, which is said to be “famed amongst many peoples for its commerce, adorned with houses and churches, distinguished by fortifications, famed for men of all arts and sciences, and lastly for its wealth in all things”; the text to the right deals with the Hanseatic League, which is praised for its global trade and its “tranquility and peace in public affairs”, and names their trading hall in London, known as the Stillard.
Although first published in 1572, the plan is clearly based upon information gathered some years earlier. St Paul’s is shown with its spire, which was destroyed in 1561; the cross in St Botolph’s Churchyard is shown, although it was destroyed in 1559; and York Place, so named in 1557, is given its old name ‘Suffolke Place’. Upon the Thames, the royal barge can be seen, together with numerous ferrymen and sailing vessels. On the south bank of the river is the new district of Southwark, with its theatres, and bull and bear baiting pits. To the left is Westminster - connected to the City by a single road - with Westminster Abbey clearly visible. To the north of Westminster, cows are depicted grazing in open fields.
The view was most definitely derived from a 15-sheet city plan, of which only three plates have survived. The original plan was probably commissioned by the Hanseatic League, at sometime around 1550, hence the praise heaped upon the League in the text on the plan.
The present example is the second state of the view, from the 1572 edition, identifiable by the spelling of Westminster as “West Muster”, rather than “Westmester” (as it appears in the first state); but without the “cum privilegio” bottom-right (which is added to the third state).
SAXTON, Christopher
[Durham] Dunelmensis
Episcopatus Qui comitatus est palatinus vera et accurata descriptio. An. Dnu. 1576.
Publication [London, 1579].
Description
Double-page engraved map, fine original hand-colour, bunch of grapes watermark.
Dimensions 375 by 485mm (14.75 by 19 inches).
References
‘Dunelmiensis Episcopatus Sheet 29’ (The British Library Online Gallery, 2009).
£3,600
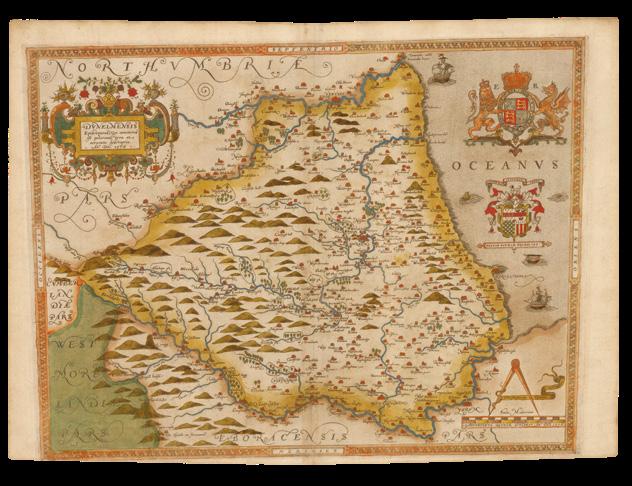
This is the first printed map of County Durham, on which the region is labelled with the Latin name “Dunelmiensis Episcopatus”, or the Bishopric of Durham. It is one of the early maps created by Christopher Saxton under commissioned by the Privy Council in late 1570s. With royal patronage, the cartographer surveyed the counties of England and Wales, the results of which were compiled in the first national atlas, his ‘Atlas of England and Wales’. The maps contained within the atlas were used both as tools for strategic defensive planning, which explains the attention devoted to coastal areas, and later as a decorative piece, as hinted at by the galleons, sea-monsters and elaborate embelms that adorn this map around the surveyed region. Saxton gives particular prominence to the hills which dominate the Western half of the county, and many enclosed parklands also feature, identifying the land owned by the local gentry. The two major settlements of Durham and Darlington are shown as dense collections of buildings, while smaller towns are represented by single Churches or houses. They are all labelled with their English name, whereas the surrounding counties are denoted by their Latin titles.
The Latin county name is boldly presented in an intricate cartouche in the upper left corner, while on the opposite side, the royal coat-of-arms is flanked by the English lion and Welsh dragon. Directly below this the Seckford family crest is accompanied by both its earlier and later Latin mottoes, in tribute to Saxton’s patron, the courtier Thomas Seckford. In the lower right corner, the map’s scale is found, along with two banners identifying Saxton as the cartographer and Augustine Ryther as the engraver. Ryther was a well-known craftsman, originally from Leeds, who was responsible for several other maps in Saxton’s atlas, such as Gloucestershire and Yorkshire, and who was also known for producing mathematical instruments. Additionally, like all the maps in Saxton’s ‘Atlas of England and Wales’, this map bears his watermark, a bunch of grapes, to identify the work as original.
SAXTON, Christopher
[Pembrokeshire] Penbrok comitat qui inter meridionales cambriae ptes hodie censetur olim demetia L Dyfet B hoc est occidentalis wallia descriptio An Dni 1578.
Publication [London, 1579].
Description
Double-page engraved map, fine original hand-colour in outline, contemporary annotation on verso in brown ink.
Dimensions 420 by 550mm (16.5 by 21.75 inches).
References Boling, ‘Anglo-Welsh Relations in Cymbeline’ (Shakespeare Quarterly, 2000); ‘Penbrok Comitat’ (The British Library Online Gallery, 2009); Klein, ‘Maps and the Writing of Space in Early Modern England and Ireland’ (Palgrave Macmillan, London, 2001).
£3,500
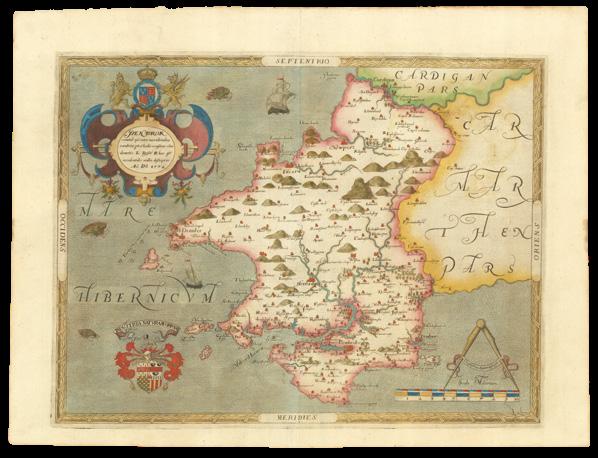
The first printed map of Pembrokeshire
In 1575, Christopher Saxton was authorised by the Queen’s Privy Council to survey and map the counties of England and Wales, a task which he had completed by 1579, when the resulting maps were compiled and published in his seminal ‘Atlas of England and Wales’. Included in the Welsh section of the atlas is this map of Pembrokeshire, the first map of the county ever to be produced. After the 1536 Act of Union, Wales was officially incorporated into the Kingdom of Henry III, and for the rest of the Tudor period, the country largely benefitted from the increased trading opportunities that emerged. What had been smaller settlements grew into major towns, such as Tenby, Haverfordwest, Pembroke, Newport and St Davids, all of which are represented here as a collection of buildings. Saxton also records many of the smaller villages that populated the county, as well as expressing the landscape with illustrations of its rivers, hills and woodlands, albeit in less detail that the majority of the English county maps. For defensive reasons, the coastal areas receive greater attention, including the small islands a little way off the Welsh shore. It has been suggested that Pembroke was of particular significance as the closest part of the Kingdom to Ireland, for which reason it has been designated its own map while certain other counties are combined together. Indeed, the personal copy of this map owned by the Secretary of State, Lord Burghley, contains hand-written annotations around the coastal regions, indicating that these areas were of greater concern.
The upper left corner is dominated by a bold cartouche, surmounted by the royal coat-of-arms flanked by English lion and Welsh dragon, and containing the Latin county name. Below this in the lower corner, the Seckford family crest with its later Latin motto pays tribute to Saxton’s patron, Thomas Seckford. On the opposite side, the map’s scale is entwined with a banner identifying Saxton as the cartographer. Unusually, the engraver is not named, but it is likely to have been one of the craftsmen listed on another of Saxton’s maps, since there is no evidence that the cartographer himself was responsible for the production of the copper plates. Additionally, like all the maps in Saxton’s ‘Atlas of England and Wales’, this map bears his watermark, a bunch of grapes, to identify the work as original.
SAXTON, Christopher
[Oxfordshire, Buckinghamshire and Berkshire] Oxonii buckinghamiae et berceriae Comitatum una cum suis undiq confinibus, oppidis, pagis, villis, et fluminibus in eisdem vera descriptio. An Dm 1574.
Publication London, Christopher Saxton, 1579.
Description
Double-page engraved map, fine original full-wash colour, some minor offsetting, contemporary annotation on verso in brown ink, some light marginal soiling.
Dimensions 420 by 550mm (16.5 by 21.75 inches).
References
Bragg, ‘The Development of Printed Maps of Buckinghamshire and Oxfordshire’ (Archaeology in Marlow, 2008); ‘Oxonii buckinghamiae et berceriae Comitatum’ (The British Library Online Gallery, 2009).
£5,000
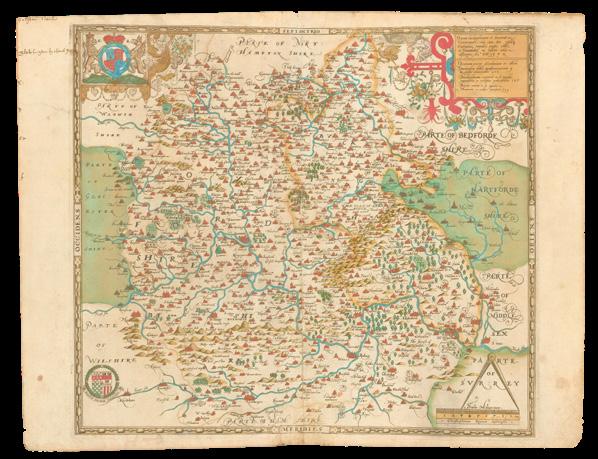
The first printed map of Oxfordshire, Buckinghamshire and Berkshire
Oxfordshire, Buckinghamshire and Berkshire, each boldly distinguished in its own colour, are presented here on the first ever map to show these respective counties. Commissioned by the Queen’s Privy Council in 1575, Christopher Saxton surveyed the landscape, settlements and estates of England and Wales. The results were represented on 35 maps compiled into the first national atlas, his ‘Atlas of England and Wales’. The densely packed features of this map are all labelled with their English names in sixteenth century form, while the surrounding counties are recorded in Latin. Major cities, such as Oxford, Uxbridge and Dunstable, are denoted by more elaborate illustrations than the single buildings used to signify minor towns, while at Windsor a small but detailed image of the royal castle can be seen. This map not only offers the typical markers of locations, bridges, hills and rivers, but also records of the number of parishes and merchant towns contained within each county, written in an elaborate cartouche in the upper right corner.
Directly opposite another detailed cartouche contains the royal coat-of-arms, as it appears on all of Saxton’s maps, along with the Seckford crest in the lower left corner, here featured with its early Latin motto “pestis patriae pigricies”. The scale in the lower right corner attests to the expansive area covered by this map, and contains a banner identifying Saxton as the cartographer, although it fails to record the engraver. There is no evidence that Saxton engraved any of the copper plates used to print his maps, but employed a team of seven English and Flemish craftsmen to carry out the task. Additionally, like all the maps in Saxton’s ‘Atlas of England and Wales’, this map bears his watermark, a bunch of grapes, to identify the work as original.
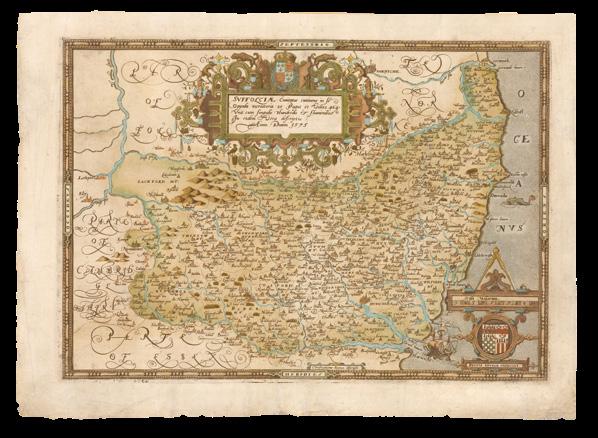
SAXTON, Christopher
[Suffolk] Suffolciae comitatus continens in se Oppida mercatoria 25, Pagos et villas 464, una cum singulis hundredis & fluminibus in eodem Vera descriptio. Anno Domini 1575.
Publication
London, Christopher Saxton, 1579.
Description Double-page engraved map, handcoloured, old tear to right sheet skilfully repaired.
Dimensions 335 by 480mm (13.25 by 19 inches).
References
‘Suffolciae Comitatus f.38’ (The British Library Online Gallery, 2009); Gardham, ‘Atlas of the Counties of England and Wales’ (Glasgow University, 2002); Young, ‘Thomas Heming and the Tatton Cup’ (The Burlington Magazine, 1983).
£4,000
The first printed map of Suffolk
In 1575, Christopher Saxton was authorised by the Queen’s Privy Council to survey and map the counties of England and Wales, a task which he had completed by 1579, when the resulting maps were compiled and published in his seminal ‘Atlas of England and Wales’. As part of this task, he created this map of Suffolk, the first map ever to be printed of the county. As one of the earlier maps in his Atlas of England and Wales, Suffolk is here shown divided into ‘hundreds’, or administrative districts. These would have allowed the government to use the map as a tool in managing distant areas of the country. Similarly, Saxton’s maps contained information important for defensive strategy, used by the Secretary of State, Lord Burghley, to makes plans in case of conflict. For this reason, coastal regions receive particular attention, being vulnerable to attack by sea. In fact, Burghley’s personal proof copy of the Suffolk map was heavily annotated by hand with notes relating to naval fortifications. On the other hand, the galleon and sea-creature illustrated in the ocean attest to the decorative co-purpose of Saxton’s maps.
Inland, the map features the rivers, hills, woodlands and settlements of Suffolk, including the city of Ipswich, represented by a small but intricate collection of buildings, complete with turrets and Church spires. Nearby, Woodbridge is identified, the seat of the Saxton’s patron, Thomas Seckford. It is in this county too that Saxton himself held land, granted to him by Elizabeth I for his ‘survey of divers parts of England’, according to Gardham.
A large, ornate cartouche dominates the upper central portion of this map, containing the Latin county name, along with a record of the number of merchant towns, estates and rivers within Suffolk, and surmounted by the royal coat-of-arms. This cartouche replicates a design found in Clément Perret’s 1569 publication on calligraphy, the ‘Exercitatio Alphabetica’, engraved by Nicholas de Hooghe, who also worked on several of Saxton’s maps. While the name of the engraver who created the copper plate of Suffolk is not detailed on the map, it is known to have been Lenaert Terwoot, and a banner on the lower border of the map identifies Saxton as the cartographer. To the right of this, the map’s scale sits above the Seckford family crest, complete with its early Latin motto. Additionally, like all the maps in Saxton’s ‘Atlas of England and Wales’, this map bears his watermark, a bunch of grapes, to identify the work as original.
The
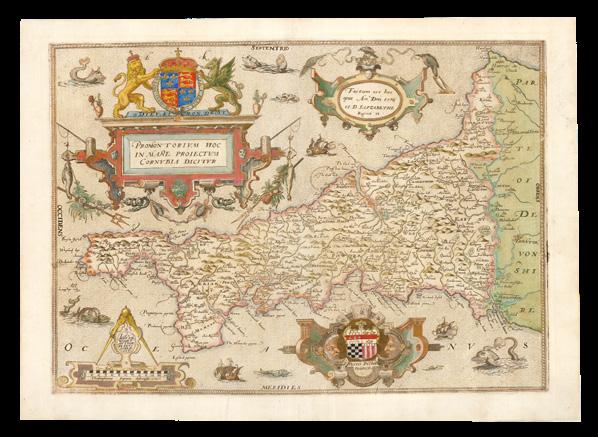
SAXTON, Christopher
Promontorium hoc in mare proiectum Cornubia dicitur.
Publication
London, Christopher Saxton, 1579.
Description
Double-page engraved map backed on Japan paper, original hand-colour in outline.
Dimensions
372 by 497mm (14.75 by 19.5 inches).
References ‘Promontorium hoc in mare proyectum cornubia dicitur f.8’ (The British Library Online Gallery, 2009).
£12,000
In 1575, Christopher Saxton was authorised by the Queen’s Privy Council to survey and map the counties of England and Wales, a task which he had completed by 1579, when the resulting maps were compiled and published in his seminal ‘Atlas of England and Wales’. It includes this map of Cornwall, the first map of the county ever to be produced. It was designed with several aims in mind: on the one hand, the intricately illustrated sea-creatures and Elizabethan galleons featured in the surrounding ocean attest to the ornamental purpose of this map, while on the other, the detailed survey of the county’s landscape and settlements point towards its use as an administrative and defensive tool. The country’s coastal regions receive far more attention in Saxton’s national survey, and for this reason the map of Cornwall provides a detailed record of the inlets, harbours, rivers and towns that bordered the sea. Although some of these are far from accurate geographically, such as Land’s End, which is presented much further North than it is in reality, the map was nevertheless useful to the Secretary of State, Lord Burghley, who annotated his personal copy with additions that might prove useful in case of an attack by sea. Further inland, hills, towns, villages and unusually sparse woodlands are represented pictorially and labelled with their name in English. The fishing town of Padstow is shown with surprising prominence, comparable to that of Penzance and Newquay, perhaps because of the influential Prideaux family who lived there.
A majestic cartouche, surmounted by the royal coat-of-arms, dominates the ocean to the North of the Cornish promontory, containing the county name in Latin. To the right of this, the dedication and date of the map is enclosed within a similar, but smaller, cartouche. Along the lower border, the map’s scale also identifies Saxton as the cartographer and Lenaert Terwoort as the engraver responsible for creating the copper plates from which the map was printed. On the opposite side, the heraldic crest of the Seckford family is cased within another elaborate cartouche, in tribute to Saxton’s patron, Thomas Seckford. Additionally, like all the maps in Saxton’s ‘Atlas of England and Wales’, this map bears his watermark, a bunch of grapes, to identify the work as original.
SAXTON, Christopher
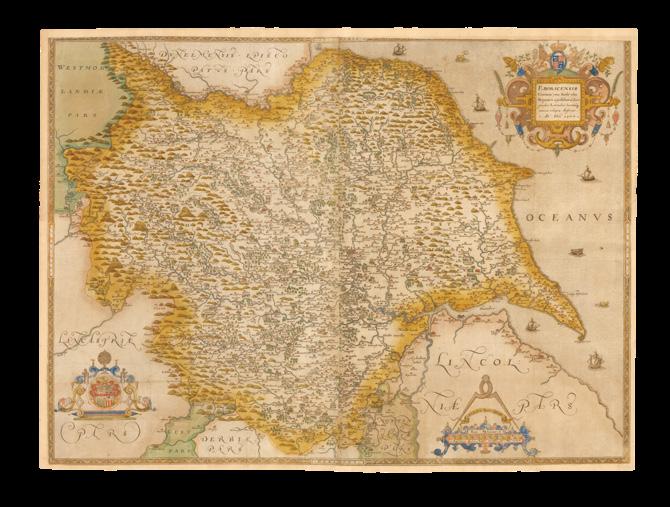
[Yorkshire] Eboracensis Comitatus (cuius incolae olim Brigantes appellabantur) Longitudine Latitudine hominuq. numero reliquiis illustrior. An. Dni. 1577.
Publication [London, 1579].
Description
Double-page engraved map, on two sheets, fine original colour, backed on eighteenthcentury paper, trimmed to upper border and to image.
Dimensions 520 by 720mm (20.5 by 28.25 inches).
References ‘Eboracensis Comitatus f.61’ (The British Library Online Gallery, 2009); Jones, ‘The maps of Yorkshire, printed in the period 1577-1857, as sources of topographical information’ (University of Leeds, 1981); Mitchell, ‘Maps in Sixteenth-Century English Law Courts’ (Imago Mundi, 2006).
£7,500
The first printed map of Yorkshire
In 1575, Christopher Saxton was authorised by the Queen’s Privy Council to survey and map the counties of England and Wales, a task which he had completed by 1579, when the resulting maps were compiled and published in his seminal ‘Atlas of England and Wales’. This is the first full map of Yorkshire ever produced, depicting the cartographer’s home county with its settlements, rivers, moors, forests, parks and hills illustrated in detail. The vast area surveyed by Saxton presents a land of contrasts, with the larger, labelled hills in the East giving way to the flatter landscape of the central county, dominated by the estates of the local gentry. Larger towns such as Scarborough and Hull are identified as a collection of buildings, while the most prominent city, York, is depicted with a small but intricate figure of York Minster. Areas on the coast, and at the mouth of the Humber, receive particular attention due to the threat of naval attack which was a constant and unwelcome presence during the reign of Elizabeth I. The Secretary of State, Lord Burghley, played an important role in Saxton’s commission and took a keen interest in the production of his county maps, which he then used for administrative and defensive purposes. On his own personal proof copy of the Yorkshire map, Burghley added his own annotations, in particular a line drawn from Hull to Welton, perhaps influenced by the military importance of Hull, whose fortifications were reinforced around the same time.
The county name, in Latin, is contained within an elaborate cartouche in the upper right corner, intricately decorated, boldly coloured in blue, and surmounted with the royal coat-of arms. Below this, at the bottom of the map, the heraldic crest of Saxton’s patron, Thomas Seckford, is featured on the left, also held within an ornamental cartouche, while on the right the map’s scale is accompanied by two banners, which identify Saxton as the cartographer and Augustine Ryther as the engraver. The map of Yorkshire is the largest of the 34 county maps included in Saxton’s ‘Atlas of England and Wales’, due to the fact that it combines all three Ridings. Legal documents from the early seventeenth century record that Saxton was called to testify to the accuracy of his Yorkshire map in court, which he did on the basis that it had been granted the royal seal of approval.
The
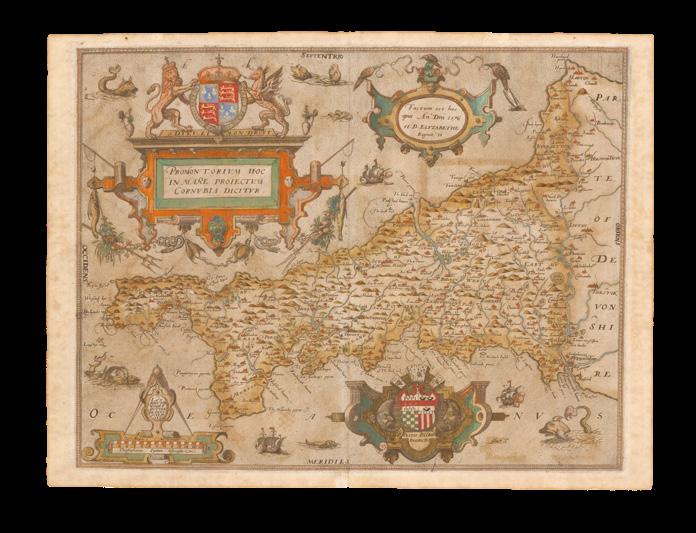
SAXTON, Christopher
[Cornwall] Promontorium hoc in mare proiectum cornubia dicitur.
Publication [London, 1579].
Description
Double-page engraved map, fine original hand-colour, bunch of grapes watermark.
Dimensions 370 by 485mm (14.5 by 19 inches).
References ‘Promontorium hoc in mare proyectum cornubia dicitur f.8’ (The British Library Online Gallery, 2009).
£12,000
In 1575, Christopher Saxton was authorised by the Queen’s Privy Council to survey and map the counties of England and Wales, a task which he had completed by 1579, when the resulting maps were compiled and published in his seminal ‘Atlas of England and Wales’. It includes this map of Cornwall, the first map of the county ever to be produced. It was designed with several aims in mind: on the one hand, the intricately illustrated sea-creatures and Elizabethan galleons featured in the surrounding ocean attest to the ornamental purpose of this map, while on the other, the detailed survey of the county’s landscape and settlements point towards its use as an administrative and defensive tool. The country’s coastal regions receive far more attention in Saxton’s national survey, and for this reason the map of Cornwall provides a detailed record of the inlets, harbours, rivers and towns that bordered the sea. Although some of these are far from accurate geographically, such as Land’s End, which is presented much further North than it is in reality, the map was nevertheless useful to the Secretary of State, Lord Burghley, who annotated his personal copy with additions that might prove useful in case of an attack by sea. Further inland, hills, towns, villages and unusually sparse woodlands are represented pictorially and labelled with their name in English. The fishing town of Padstow is shown with surprising prominence, comparable to that of Penzance and Newquay, perhaps because of the influential Prideaux family who lived there.
A majestic cartouche, surmounted by the royal coat-of-arms, dominates the ocean to the North of the Cornish promontory, containing the county name in Latin. To the right of this, the dedication and date of the map is enclosed within a similar, but smaller, cartouche. Along the lower border, the map’s scale also identifies Saxton as the cartographer and Lenaert Terwoort as the engraver responsible for creating the copper plates from which the map was printed. On the opposite side, the heraldic crest of the Seckford family is cased within another elaborate cartouche, in tribute to Saxton’s patron, Thomas Seckford. Additionally, like all the maps in Saxton’s ‘Atlas of England and Wales’, this map bears his watermark, a bunch of grapes, to identify the work as original.
The
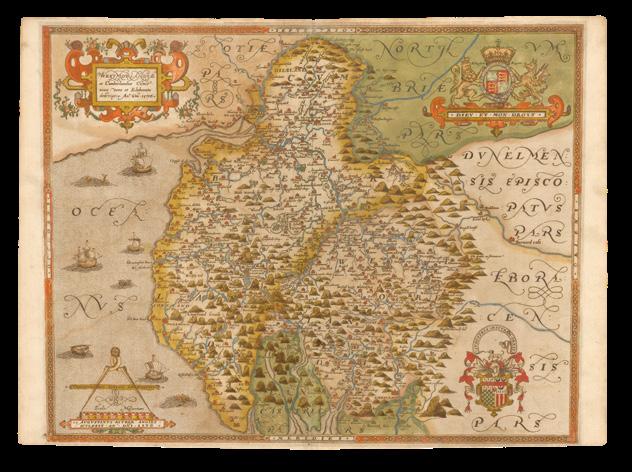
SAXTON, Christopher
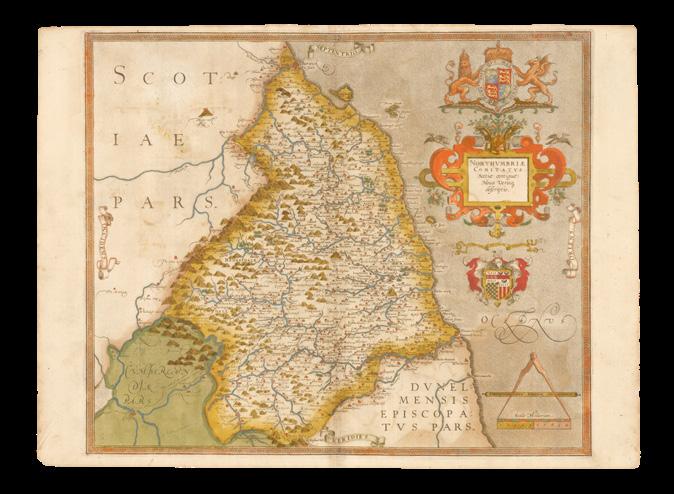
[Northumberland] Northumbriae Comitatus (Scotiae continguae) Nova Veraq. descriptio.
Publication [London, 1579].
Description
Double-page engraved map, fine original hand-colour, bunch of grapes watermark.
Dimensions 380 by 460mm (15 by 18 inches).
References Batten, Bennett, ‘The printed maps of Devon: county maps, 1575-1837’ (Devon Books, 1996); ‘Northumbria Comitatus’ (The British Library Online Gallery, 2009); Brotton, ‘Great Maps: The World’s Masterpieces Explored and Explained’ (Penguin, 2014).
£4,500
In 1575, Christopher Saxton was authorised by the Queen’s Privy Council to survey and map the counties of England and Wales, a task which he had completed by 1579, when the resulting maps were compiled and published in his seminal ‘Atlas of England and Wales’. It included this map of Northumberland, the first map of the county ever to be printed. It depicts the landscape and settlements of the region in great detail, notably including Hadrian’s Wall, listed as ‘the wall of the Picts’, as a bold red line running from Newcastle across the county, into Cumberland and past Carlyle, although it is surprisingly absent from the separate map of Cumberland itself. It is the only such feature of its kind to appear on Saxton’s maps, which are generally limited to the illustration of hills, rivers and settlements. The high degree of attention with which Saxton documents the castles, estates and towns of Northumberland can be attributed to the county’s vulnerable position on the border with Scotland and the coast. During the reign of Elizabeth I, England was at constant risk of attacks by both sea and land. For this reason, numerous Scottish settlements are also highlighted, including the prominent Hume Castle, at which Mary, Queen of Scots, stayed in 1566. One key purpose of Saxton’s commission was to produce a tool with which the Secretary of State, Lord Burghley, could strategise in the case of conflict. The annotations on his own personal proof copy of this map list the ‘names of ye principall lorsh[ips] in ye Middle march’, written densely by hand around the Anglo-Scottish border. Alnwick in particular, as the seat of Earl Henry Percy, a Catholic sympathiser, is expressed on the map with particular prominence, attesting to its political purpose.
Most of the common emblems found on Saxton’s maps are featured on the right side of the map, with the royal coat-of-arms in the upper corner, directly above an elaborate cartouche enclosing the county name in Latin. Below this the Seckford family crest appears with its later Latin motto, and in the lower corner the scale is accompanied by a banner identifying Saxton as the cartographer. Omitted, however, are the name of the engraver and the date of the map. This is the only one of the 35 county maps not to include a date. whereas the copper plates of some other counties continued in existence for centuries, the original plate used to make this map had been lost by 1689, along with that of Devon. Additionally, like all the maps in Saxton’s ‘Atlas of England and Wales’, this map bears his watermark, a bunch of grapes, to identify the work as original.
The first map of England and Wales printed
in England
SAXTON, Christopher
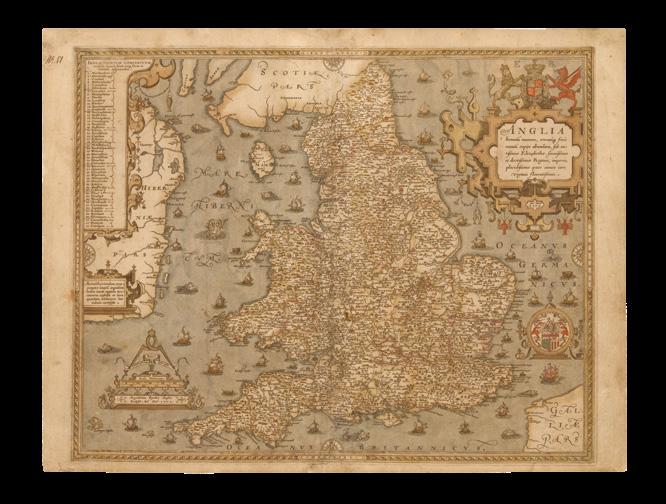
Anglia hominu[m] numero, rerumq[ue] fere omniu[m] copiis abundans, sub mitissimo Elizabethae, serenissimae et doctissimae Reginae, imperio, placidissima pace annos iam viginti florentissima.
Publication [London], 1579.
Description
Double-page engraved map, fine original hand-colour, bunch of grapes watermark, centre-fold and margins reinforced.
Dimensions
385 by 490mm (15.25 by 19.25 inches).
£5,000
In 1575, Christopher Saxton was authorised by the Queen’s Privy Council to survey and map the counties of England and Wales, a task which he had completed by 1579, when the resulting maps were compiled and published in his seminal ‘Atlas of England and Wales’. This map of England is one of the 35 maps included in the atlas and is the first map of England and Wales printed in England.
The map records the country’s landscapes and settlements, represented by small illustrations of churches, rivers, and hills. An elaborate cartouche dominates the top-right corner of the map, with lobsters and fish hanging from the bottom, attesting to England’s strong maritime culture in this period. Above the cartouche are the arms of Elizabeth I, to whom the title of the map is also a tribute: “England: abundant in men and in nearly all resources, has been flourishing for 20 years, now, in calm peace, under the most gentle rule of Elizabeth, our fairest and most learned Queen” (trans.). Below this is illustrated the Seckford coat-of-arms, along with its later Latin motto “industria naturam ornat”, in honour of Saxton’s patron, Thomas Seckford. Top-left is an index of the counties, with their Latin names, which corresponds to numbers on the map. Bottom-left is the map’s scale-bar, along with two banners identifying Saxton as the cartographer and Augustine Ryther as the engraver. Ryther (d1593) was the most accomplished of a team of seven English and Flemish engravers who worked on the county maps in Saxton’s atlas. Originally from Leeds, he was also known for producing mathematical instruments. Additionally, like all the maps in Saxton’s ‘Atlas of England and Wales’, this map bears his watermark, a bunch of grapes, to identify the work as original.
The
SAXTON, Christopher
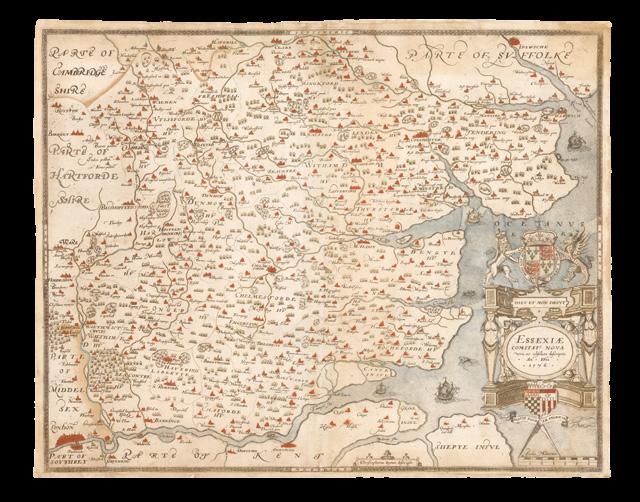
[Essex] Essexiae Comitat[us] nova vera ac absoluta descriptio An. Dnu. 1576.
Publication [London, 1579].
Description
Double-page engraved map, fine original hand-colour, bunch of grapes watermark, minor loss to centre-fold, skilfully repaired, upper-margin strengthened, lower-margin trimmed to image and margin added.
Dimensions 415 by 530mm (16.25 by 20.75 inches).
References
Batho, ‘Two Newly Discovered Manuscript Maps by Christopher Saxton’ (The Geographical Journal, 1959; ‘Essexiae Comitat f.36’ (The British Library Online Gallery, 2009); Kain, ‘Maps and Rural Land Management in Early Modern Europe’ (University of Chicago, 2007).
£4,500
In 1575, Christopher Saxton was authorised by the Queen’s Privy Council to survey and map the counties of England and Wales, a task which he had completed by 1579, when the resulting maps were compiled and published in his seminal Atlas of England and Wales. This map of Essex is one of the 35 maps included in the atlas, and the first county map of Essex ever to be produced. It records the county’s landscape and settlements, represented by small illustrations of Churches, enclosed parklands, rivers, bridges, and the occasional hill. Details of the surrounding counties, labelled with their Latin names, are also included, most prominently London, represented by a mass of buildings, intricately illustrated. Saxton has also expressed certain features of Essex which would be of interest to the crown, such as the Blockhouse Fort on Mersea Island, an unlabelled beacon South West of Colcester, and New Hall in the crown estate of Boreham, previously home to Queen Mary. Alongside its administrative function, Saxton’s county maps were commissioned as a tool for defensive planning, and for this reason coastal areas receive particular attention. Lord Burghley, then Secretary of State, annotated his personal proof copy of the Essex map with details about coastal settlements and local gentry, noting ‘Heyghfeld fayre and fatt, Barndon park better than that, Coppledon beares a Crown, Copthall best of all’. Illustrations of Elizabethan ships and one suspect sea-creature in the ocean attest to the decorative purpose of this map, as well as its functionality.
An elaborate cartouche dominates the lower right corner of the map, with the Latin county name flanked by caryatids and surmounted by the royal coat-of-arms and motto. Directly below this is the heraldic crest and early Latin motto of the Seckford family, in honour of Saxton’s patron, Thomas Seckford. Found underneath the crest is the map’s scale. A small banner along the lower border identifies Saxton as the cartographer, but the name of the engraver is omitted from this map. There is no evidence that Saxton himself took any part in the engraving of the copper plates used to make his maps, instead employing a small team of Fleming and English craftsmen. Additionally, like all the maps in Saxton’s ‘Atlas of England and Wales’, this map bears his watermark, a bunch of grapes, to identify the work as original.
SAXTON
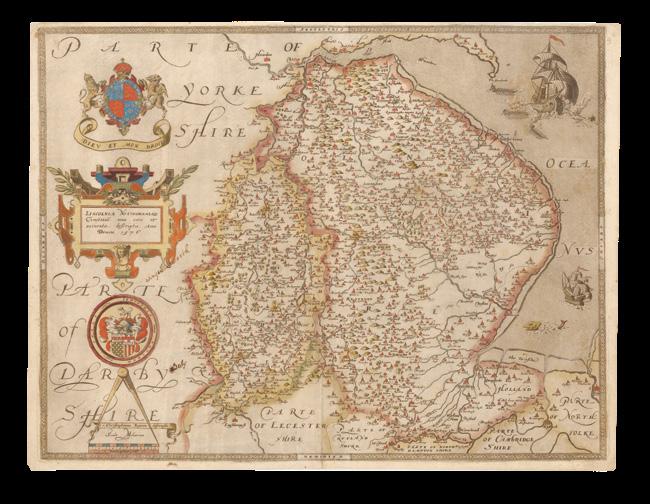
[Lincolnshire and Nottinghamshire] Lincolniae Notinghamiaeque. Comitatuu nova vera et accurata descriptio. Anno Domini 1576.
Publication [London, 1579].
Description
Double-page engraved map, fine original hand-colour, bunch of grapes watermark.
Dimensions 405 by 535mm (16 by 21 inches).
References ‘Lincolniae Notinghamiaque Comitatum’ (The British Library Online Gallery, 2009).
£4,400
The first printed map of Lincolnshire and Nottinghamshire
In 1575, Christopher Saxton was commissioned by the Queen’s Privy Council to survey the counties of England and Wales, and eventually to compile the first national atlas, his ‘Atlas of England and Wales’. This map formed part of that task, and was in fact the first printed map ever made of either Lincolnshire or Nottinghamshire. The elaborate design of these maps makes it clear that they had an ornamental purpose, but their primary use was as tools with which the Secretary of State, Lord Burghley, could make strategic defensive and administrative decisions. In fact, his own personal proof copies are covered in hand-written annotations, such as a sketch of a battlefield at the mouth of the Humber in Northern Lincolnshire. To fulfil this requirement, Saxton’s maps have a particular focus on vulnerable borders and coastal regions. The numerous inlets from ‘The Washe’ estuary receive attention as potential points of attack, attesting to the map’s functionality, while the grand Elizabethan galleon illustrated on the sea simultaneously points towards its decorative purpose. Combined on this one map, Nottinghamshire is differentiated from its larger neighbour in a light yellow colour. Although less important from a military perspective, Saxton nevertheless presents the county in great detail, particularly its settlements and woodland areas, including the famous Sherwood Forest. Certain significant buildings are also labelled, such as ‘the Lodge’ in the crown estate of Bestwood Park above Nottingham, and ‘the manor’ at Worksop to the North, where Mary Queen of Scots had previously been held prisoner.
The four common features of Saxton’s county maps are found along the left side, with the royal coat-of-arms in the upper corner, complete with a large banner containing the monarch’s motto. Below this, the names of the counties, written in Latin, are held by an elaborate cartouche in bold blue colouring. The Seckford family crest sits below this, accompanied by its later Latin motto, in tribute to Saxton’s patron, Thomas Seckford. In the lower corner the map’s scale is found, alongside which banners identify Saxton as the cartographer and Remigius Hogenberg as engraver. Hogenberg was a prominent Flemish craftsman, who worked alongside Saxton’s team of engravers to produce the copper plates from which the maps were made. Additionally, like all the maps in Saxton’s ‘Atlas of England and Wales’, this map bears his watermark, a bunch of grapes, to identify the work as original.
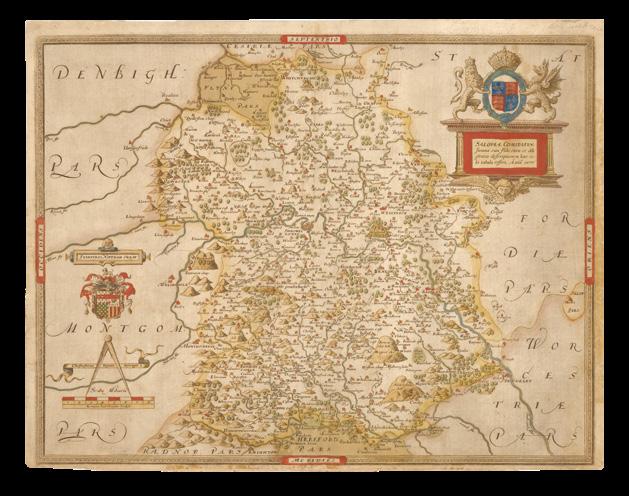
SAXTON, Christopher
[Shropshire] Salopiae comitatus. summa cum fide, cura et diligentia descriptionem haec tibi tabula refert. A.Dm. 1577.
Publication [London, 1579].
Description Double-page engraved map, fine original hand-colour, bunch of grapes watermark, lower-margin reinforced.
Dimensions 390 by 510mm (15.25 by 20 inches).
References ‘Salopiae Comitatu f.86’ (The British Library Online Gallery, 2009); Evans, ‘A Cartographic Evaluation of the Old English Mile’ (The Geographical Journal, 1975); Morris, ‘Shropshire Deer Parks c.1500c.1914 Recreation Status and Husbandry’ (University of East Anglia, 2015).
£1,800
The first printed map of Shropshire
This map of Shropshire, or “Salopia”, is the earliest detailed map dedicated solely to the county, and the second county map in Saxton’s ‘Atlas of England and Wales’, the first national atlas ever produced. Courtiers of Queen Elizabeth I, Thomas Seckford and Lord Burghley, sponsored Saxton to survey and map the counties. The resulting atlas was originally intended to provide Burghley, as Secretary of State, with a detailed record of the countries’ domestic arrangements for the purposes of defence, with Shropshire included as a Welsh border county. To this end, Saxton produced this precise survey of the towns, estates and landscape of Shropshire, with the surrounding counties labelled in Latin. Each element within Shropshire is labelled with its English name in its sixteenth century form, for example, ‘Showesbvrye’ for modern Shrewsbury, with major towns identified in larger script. Rivers, forests and the county’s distinctive hills are all also illustrated and labelled, along with 31 deer-parks, used to signify the land owned by local gentry.
As on all of Saxton’s maps, the county name is enclosed within a cartouche surmounted by the royal coat-of-arms, which here features in the top right corner. Similarly, the distinctive Seckford crest, with its later Latin motto, is featured on the left, below which there is the scale, complete with banners identifying Saxton as the cartographer and Remigius Hogenberg as engraver. Additionally, like all the maps in Saxton’s ‘Atlas of England and Wales’, this map bears his watermark, a bunch of grapes, to identify the work as original.
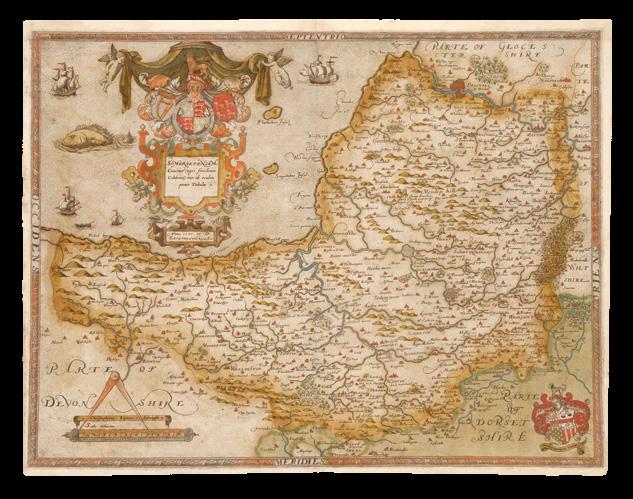
Double-page engraved map, fine original hand-colour.
Dimensions 395 by 515mm (15.5 by 20.25 inches).
References ‘Somersetensem Comitat.’ (The British Library Online Gallery, 2009); Wardell, ‘Queen Elizabeth I’s Progress to Bristol in 1574: An Examination of Expenses’ (Early Theatre, 2011).
£6,000
The first printed map of Somerset
In 1575, Christopher Saxton was authorised by the Queen’s Privy Council to survey and map the counties of England and Wales, a task which he had completed by 1579, when the resulting maps were compiled and published in his seminal ‘Atlas of England and Wales’. Included in it was this, the first map of Somerset ever produced, presenting the landscape and settlements of the county in full. The various features of the land, its rivers, hills and woodlands, are represented pictorially and labelled with their English names, sometimes with added details, such as the series of three windmills found atop the hills in the centre of the map, and information, the note that “this spring driveth 12 mils within one quarter of a myle of his head”, for example. Out at sea, Flat Holm and Steep Holm islands are marked, albeit inaccurately in location and shape, while inland, the city of Bristol dominates North Somerset. Across Saxton’s atlas, the dense collection of buildings which represent Bristol are paralleled only by London, attesting to the importance of the city, which was visited by Queen Elizabeth the previous year, where a mock battle staged between the allegorical figures of War and Peace. Across the border in Wiltshire, Longleat Estate is represented by a small enclosure, due to the fact that its renovation and expansion was a work in progress during the late 1570s. Within the county, other notable estates such as Castle Cary and Evercreech Lodge, are similarly represented and labelled.
Alongside the galleons, boats and huge fish that adorn the sea to the North West of Somerset, Saxton has included an elaborate cartouche, flanked by putti and majestically illustrated in bold red, blue and green. This contains the Latin county name, with the royal coat-of-arms presented above it, surmounted by a crowned lion. The map also features another coat-of-arms, that of Saxton’s patron, Thomas Seckford, in the lower right corner, complete with his family’s earlier Latin motto. On the opposite side, the map’s scale is presented, accompanied by two banners identifying Saxton as the cartographer and Leonard Terwoort as the engraver. Tertwoort was a Flemish craftsman who worked alongside other engravers to produce the 35 copper plates from which the ‘Atlas of England and Wales’ was printed.
SAXTON, Christopher
[Westmorland and Cumberland] Westmorlandiae et Cumberlandiae Comit nova vera et Elaborata descriptio. An. Dni. 1576.
Publication [London, 1579].
Description
Double-page engraved map, fine original hand-colour, bunch of grapes watermark.
Dimensions 385 by 495mm (15.25 by 19.5 inches).
References
‘Westmorlandiae et Cumberlandiae Comit’ (The British Library Online Gallery, 2009); Curwen, ‘The Chorography, Or, A Descriptive Catalogue of the Printed Maps of Cumberland and Westmorland’ (1917); Manley, ‘Saxton’s Survey of Northern England’ (The Geographical Journal, 1934); Scanlan, ‘Through Mountains to the Sea’ (Places Journal, 2019).
£4,500
The first printed map of Westmorland and Cumberland
In the sixteenth century Westmorland and Cumberland, now part of the larger Cumbria, were independent counties, surveyed together here on the first map to show either county. It forms part of the series of maps which Christopher Saxton was commissioned to produce by the Queen’s Privy Council in 1755. Four years later the results were collected into the first nation atlas, his ‘Altas of England and Wales’. The two regions are distinguished in colour, but many of the illustrations representing their geographical features straddle the counties’ border, such as hills, rivers, and even one bridge. The hills shown here are larger in general than those found on Saxton’s other county maps, and while they are not drawn to scale, their larger size attests to the significance of the Pennines, which run mainly along Westmorland’s Western border. A far smaller hill towards Cumberland’s coastline features a rare beacon, although the cartographer failed to note its name. The area in the South East of the county is characterised by the dense collection of lakes and rivers, including Lake Windermere and the small island in the centre of the River Derwent. On the sea itself, there are depictions of Elizabethan galleons, fish and seamonsters, as typically found in all of Saxton’s maps of coastal regions. The ever-present threat of naval attack during the period meant that these maps are expressed in far greater detail than those of the inland counties. The four corners of the map contain the features common to all 34 of Saxton’s county maps. In the upper left corner, an elaborate cartouche contains the Latin county names. The royal coat-of-arms is featured in the upper right, with the Seckford family crest directly below it, accompanied by its later Latin motto. In the lower left corner, the map’s scale is found, along with two banners identifying Saxton as the cartographer and Augustine Ryther, an English engraver as the craftsman behind the copper plate, with which the map was produced. The maps of Durham, Gloucestershire and Yorkshire are also attributed to him, all created in 1577. Additionally, like all the maps in Saxton’s ‘Atlas of England and Wales’, this map bears his watermark, a bunch of grapes, to identify the work as original.
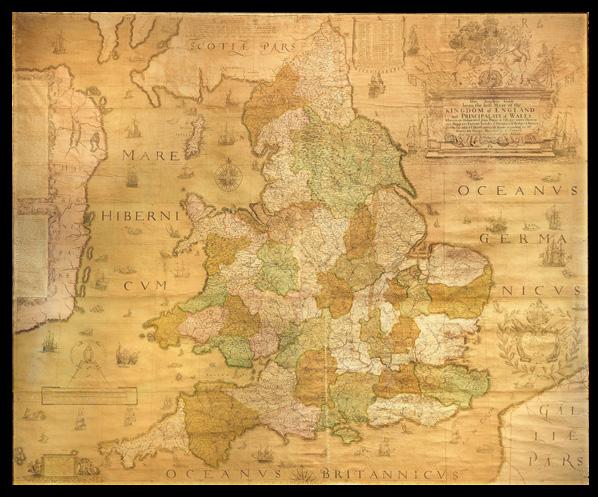
SAXTON, Christopher
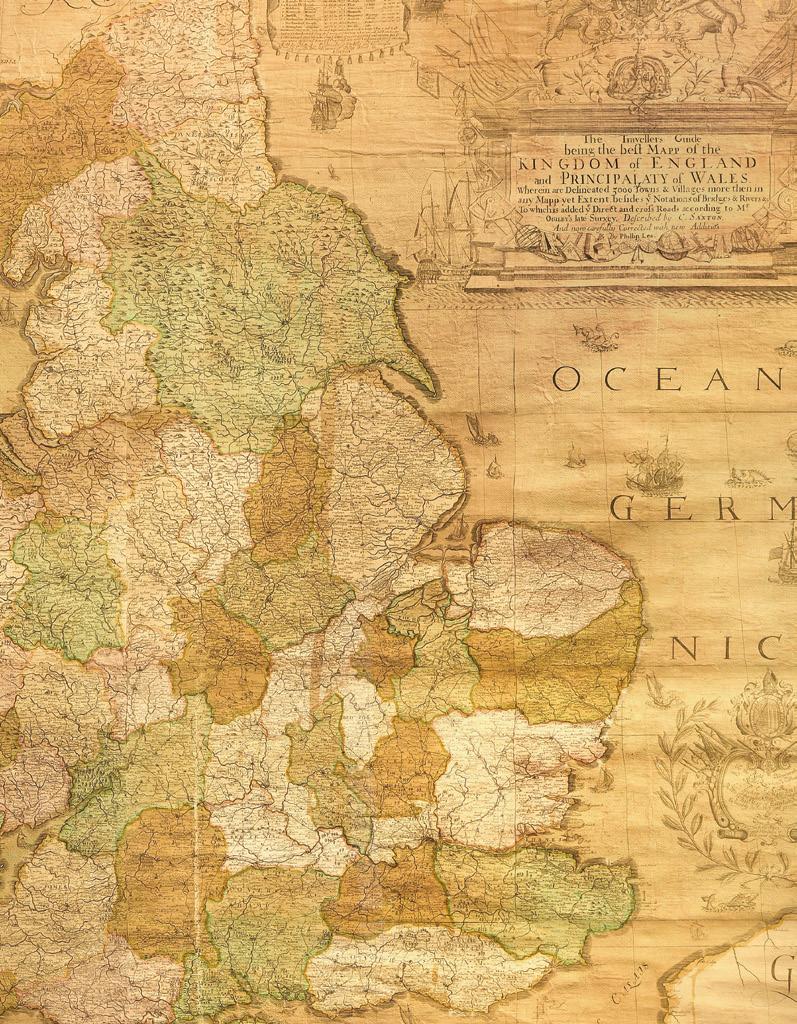
The Travellers Guide being the best Mapp of the Kingdom of England and Principality of Wales Wherein are Delineated 3000 Towns & Villages more than in any Mapp yet Extent besides ye Notations of Bridges & Rivers &c. To which is added ye Direct and cross Roads according to Mr Ogilby’s late Survey. Described by C. Saxton And now carefully Corrected with New Additions by Phillip Lea.
Publication London, [1583, but c.1716].
Description Engraved wall map, printed on 20 sheets, joined, with fine original full body colour.
Dimensions 1350 by 1710mm (53.25 by 67.25 inches).
References Ifor M. Evans and Heather Lawrence, Christopher Saxton, Elizabethan map maker (London: Holland Press, 1979), 9-43; Shirley, British Isles, 137.
£75,000
A nation defined… An Elizabethan wall map by “the father of English cartography”
Christopher Saxton’s wall map is a result of the first survey of the whole of England and Wales, and is the first map of those countries to give all the place names in English. Saxton has been dubbed “the father of English cartography” (Skelton).
The idea of making a survey of the kingdom and its parts in a consistent format developed in the mid sixteenth century. Although the first English map of Britain, by Matthew Paris, had appeared in about 1250, it was not until the mid fifteenth century that the principles of mapping were fully understood. These techniques emerged, in part, as a result of the practical needs of military engineers: military surveyors were well able to draft plans and topographical maps to scale by the 1540s. Estate surveys also became increasingly popular, as the advent of enclosures necessitated the definition of land boundaries. Thus, a large number of treatises on surveying and the use of the cross-staff appeared. Such interest led to the construction of increasingly sophisticated surveying instruments, resulting in a new accuracy in mapping.
Saxton’s wall map dates from 1583, and was published separately from his atlas of 1579. Only two copies of the first state of the map are known to exist: one in Birmingham Public Library, printed on paper with watermarks consistent with the date on the map; the second example is bound in atlas form in the British Library and is probably a reprint from the original plates by William Web, dating from c.1642. “After the Restoration, Saxton’s map was reissued on several occasions by publishers who made considerable alterations to the plates” (Shirley). Of these, only the second state, published by Cade and Morgan in 1678, is known to have been issued as a 20-sheet wall map. The others were printed in a travelling “portmanteau” format by Philip Lea. However, “the excellence of the engraving and the rich style of the Elizabethan decoration can only be appreciated fully when the map is seen as a single work” (Shirley). The present example, however, was issued once again in the intended wall map format. It bears the imprint of Philip Lea, but with the “Fleet Street” address of his widow, Anne. It is, therefore, according to Skelton, the seventh state of the map and dates from 1716-1720.
The map does not include the name of an engraver, but it is generally accepted that it is Augustine Ryther, who engraved Saxton’s earlier map of England published in his county atlas. Ryther was the most accomplished of a team of seven English and Flemish engravers who worked on the county maps in the atlas. Comparison with the county maps shows that Saxon has modernised the spelling of several of the place names and redrawn the Isle of Wight. Bodies of water, vegetation, settlements and notable buildings are all identified. Hills and mountains are also pictorially
defined; the “aim was to convey an impression of topography rather than to provide precise information on the location and altitude of individual summits” (Evans and Laurence). Saxton has used the old English mile of ten furlongs, as the eight furlong mile was not instituted until 1593.
Saxton’s depiction was adopted subsequently by Mercator, Speed, Blaeu, and Jansson, and was recognised internationally as the standard representation of England and Wales until the second half of the eighteenth century.
Examples of Saxton’s map, in any form, rarely come to market. We are only aware of one example selling at auction in the past 50 years: a later version by Thomas Bowles from around 1720 at Sotheby’s New York on 12 November 1968, lot 28A.
SPEED, John
Cambridgeshire described with the devision of the hundreds, the Townes situation, with the Armes of the Colleges of that famous Universiti.
Publication [London], And are to be solde in popes head alley, by John Sudbury and G. Humbell, 1610 [but 1610-1616].
Description
Double-page engraved map, false margins to left and right.
Dimensions
385 by 530mm (15.25 by 20.75 inches).
£2,800
Speed’s map of Cambridge
A map of Cambridge from the first large-scale atlas of the British Isles, Speed’s ‘Theatre’. In the top left-hand corner is an inset plan of Cambridge, including details such as “Pithagoras house”, “Pembrok Hall Orchard”, and “Iesus colledg walkes and groves”. Down each side of the map are represented the arms of the Cambridge colleges, with royal arms depicted along the bottom, and four figures in academic dress above, one of whom is holding a compass that acts as the scale-bar.
John Speed (1552-1629) was the outstanding cartographer of his age. By trade a merchant tailor, but by proclivity a historian, it was the patronage of Sir Fulke Greville, poet and statesman, that allowed him to pursue this interest in earnest. His ‘Theatre of Great Britain’, from which the present work is drawn, was first published in 1611 or 1612 and is “the earliest English attempt at atlas-production on a grand scale” (Skelton). Drawing heavily on the work of Saxton and Norden, little of Speed’s cartography is original (he acknowledges, “I have put my sickle into other mens corne”), instead it is his blend of cartography and history, incorporating town-plans, vignettes, and genealogy, that makes Speed an innovator.
SPEED, John
The Countie Pallatine of Lancaster Described And Divided Into Hundreds.
Publication [London], And are to be solde in Popes head alley by G. Humbell cum Privilegio, [1610-1616].
Description Double-page engraved map, left and right margins remargined.
Dimensions 385 by 510mm (15.25 by 20 inches).
£1,500
Speed’s map of Lancaster
A map of Lancashire from the first large-scale atlas of the British Isles, Speed’s ‘Theatre’. In the top right-hand corner is an inset town-plan of Lancaster, probably the first printed plan of Lancaster. On the left-hand side are portraits of monarchs from the house of Lancaster, including Henry IV, and on the right of monarchs from the house of York, including Richard III.
John Speed (1552-1629) was the outstanding cartographer of his age. By trade a merchant tailor, but by proclivity a historian, it was the patronage of Sir Fulke Greville, poet and statesman, that allowed him to pursue this interest in earnest. His ‘Theatre of Great Britain’, from which the present work is drawn, was first published in 1611 or 1612 and is ‘the earliest English attempt at atlas-production on a grand scale’ (Skelton). Drawing heavily on the work of Saxton and Norden, little of Speed’s cartography is original (he acknowledges, ‘I have put my sickle into other mens corne’), instead it is his blend of cartography and history, incorporating town-plans, vignettes, and genealogy, that makes Speed an innovator.
SPEED, John Cornwall.
Publication [London], are to be solde in Popes-heade alley against ye Exchange by John Sudbury and G. Humble Cum Privilegio, [1610-1616].
Description
Double-page engraved map, minor loss, small tear to lower margin skilfully repaired, minor frame burn.
Dimensions
385 by 510mm (15.25 by 20 inches).
£2,200
Speed’s map of Cornwall
A map of Cornwall from the first large-scale atlas of the British Isles, Speed’s ‘Theatre’. In the top left-hand corner is a prospect of ‘Launceston or Ancient Dunhevet’. Along the right-hand side of the map four antiquities are illustrated, including the Hurlers Stones, which, according to legend, are men petrified for playing hurling on a Sunday. The sea around the peninsula is filled with sea-monsters and ships.
John Speed (1552-1629) was the outstanding cartographer of his age. By trade a merchant tailor, but by proclivity a historian, it was the patronage of Sir Fulke Greville, poet and statesman, that allowed him to pursue this interest in earnest. His ‘Theatre of Great Britain’, from which the present work is drawn, was first published in 1611 or 1612 and is ‘the earliest English attempt at atlas-production on a grand scale’ (Skelton). Drawing heavily on the work of Saxton and Norden, little of Speed’s cartography is original (he acknowledges, ‘I have put my sickle into other mens corne’), instead it is his blend of cartography and history, incorporating town-plans, vignettes, and genealogy, that makes Speed an innovator.
SPEED, John
Norfolk A Countie Florishing & Populous Described And Devided With The Armes Of Such Noble Familes As Have Borne The Titles Therof.
Publication [London], Are to be sold in popes head Alley by J.S. & G.H. cum privil., [1610-1616].
Description Double-page engraved map.
Dimensions
385 by 510mm (15.25 by 20 inches).
£1,000
Speed’s map of Norfolk
A map of Norfolk from the first large-scale atlas of the British Isles, Speed’s ‘Theatre’. Inset top-left is a battle-scene, with a note below describing two rebellions that have featured in the history of Norfolk: the first, the 1381 Battle of North Walsham, the second Kett’s Rebellion, of 1549. Inset top-right is a plan of Norwich, with an alphabetical key below noting points of interest, from “S. Peters Permantigate”, to “Hell gate”. Down the right-hand side of the map are represented the arms of prominent Norfolk families.
John Speed (1552-1629) was the outstanding cartographer of his age. By trade a merchant tailor, but by proclivity a historian, it was the patronage of Sir Fulke Greville, poet and statesman, that allowed him to pursue this interest in earnest. His ‘Theatre of Great Britain’, from which the present work is drawn, was first published in 1611 or 1612 and is “the earliest English attempt at atlas-production on a grand scale” (Skelton). Drawing heavily on the work of Saxton and Norden, little of Speed’s cartography is original (he acknowledges, “I have put my sickle into other mens corne”), instead it is his blend of cartography and history, incorporating town-plans, vignettes, and genealogy, that makes Speed an innovator.
SPEED, John
The Kingdome of Scotland.
Publication [London], and are to be sold in Popes head alley by John Sudbury and George Humbell Cum Privilegio, 1610 [but 1610-1616].
Description
Double-page engraved map.
Dimensions
385 by 515mm (15.25 by 20.25 inches).
£3,500
Speed’s map of Scotland
A map of Scotland, from the first large-scale atlas of the British Isles, Speed’s ‘Theatre’. Running down the left of the map is a decorative border, with portraits of James VI of Scotland (and I of England), and of his son and heir, Henry, Prince of Wales and Ireland (who would die in 1612), while, running down the right of the map are portraits of James’s wife, Anna, and of James’s second son, Charles, Duke of York and Albany, who would go on to become King Charles I. Top-right is an inset map of the Orkney Islands.
Speed’s map of Scotland is famous for the radical alterations made to its borders during the Interregnum. For the 1652 edition of Speed’s ‘Theatre’, the royal portraits and coats-of-arms would be erased, replaced by figures of Scottish characters (“A Scotch Man”; “A Highland Man”; “A Scotch Woman”; and “A Highland Woman”.)
John Speed (1552-1629) was the outstanding cartographer of his age. By trade a merchant tailor, but by proclivity a historian, it was the patronage of Sir Fulke Greville, poet and statesman, that allowed him to pursue this interest in earnest. His ‘Theatre of Great Britain’, from which the present work is drawn, was first published in 1611 or 1612 and is “the earliest English attempt at atlas-production on a grand scale” (Skelton).
Drawing heavily on the work of Saxton and Norden, little of Speed’s cartography is original (he acknowledges, “I have put my sickle into other mens corne”), instead it is his blend of cartography and history, incorporating town-plans, vignettes, and genealogy, that makes Speed an innovator.
SPEED, John
Norfolk A Countie Florishing & Populous Described And Devided With The Armes Of Such Noble Familes As Have Borne The Titles Thereof.
Publication [London], Are to be sold in popes head Alley by J.S. & G.H. cum privil., [1616].
A map of Norfolk from 1616 Latin edition of the first large-scale atlas of the British Isles, Speed’s ‘Theatre’. Inset top-left is a battle-scene, with a note below describing two rebellions that have featured in the history of Norfolk: the first, the 1381 Battle of North Walsham, the second Kett’s Rebellion, of 1549. Inset top-right is a plan of Norwich, with an alphabetical key below noting points of interest, from “S. Peters Permantigate”, to “Hell gate”. Down the right-hand side of the map are represented the arms of prominent Norfolk families.
John Speed (1552-1629) was the outstanding cartographer of his age. By trade a merchant tailor, but by proclivity a historian, it was the patronage of Sir Fulke Greville, poet and statesman, that allowed him to pursue this interest in earnest. His ‘Theatre of Great Britain’, from which the present work is drawn, was first published in 1611 or 1612 and is “the earliest English attempt at atlas-production on a grand scale” (Skelton). Drawing heavily on the work of Saxton and Norden, little of Speed’s cartography is original (he acknowledges, “I have put my sickle into other mens corne”), instead it is his blend of cartography and history, incorporating town-plans, vignettes, and genealogy, that makes Speed an innovator.
Superb example of Speed’s map of Great Britain
and Ireland
SPEED, John
The Kingdome of Great Britaine and Ireland
Publication
London, I. Sudbury and George Humble, Popes Head Alley, 1610.
Description
Fine original hand-colour, heightened in gold.
Dimensions
390 by 515mm (15.25 by 20.25 inches).
£5,000
A map of Great Britain and Ireland, with inset views of London and Edinburgh and a map of the Orkneys. The pendants to the views are each side of a coin issued by Cunobeline, an Ancient British king, later immortalised by William Shakespeare in his play Cymbeline, produced for the first time the year before Speed’s work was published.
The royal coat of arms in the top corner and the inset views of both London and Edinburgh demonstrates Speed’s royalist intention to show all the kingdoms under James I of England and VI of Scotland. The map is decorated with ships and sea monsters, with several cherubs posing with feathers, sextons, and globes.
John Speed (1552-1629) was the outstanding cartographer of his age. By trade a merchant tailor, but by proclivity a historian, it was the patronage of Sir Fulke Greville, poet and statesman, that allowed him to pursue this interest in earnest.
His ‘Theatre of Great Britain’ was the first atlas of the British Isles: Speed prepared the maps himself about two years before they were published. The present map is taken from the 1627 English edition published by George Humble, who was granted a privilege to print it for twenty-one years from 1608. The ‘History of Great Britaine’ (1611) and its companion atlas volume, the ‘Theatre of the Empire of great Britaine’ (1612) were published together and “were an immediate success: three new editions and issues of each appeared during Speed’s lifetime, and a miniature version was first published about 1619-20. The maps in the ‘Theatre’ became the basis for subsequent folio atlases until the mideighteenth century.
SPEED, John Holy Iland; Garnsey; Farne; Iarsey
[Islands off the coast of Britain].
Publication [London], Performed by Iohn Speede and are to be solde in Popes heade alley by Ioh[n] Sudb. and G. Humbell. cu[m] Privilegio, [1611-1623].
Description
Double-page engraved map with hand-colour.
Dimensions
390 by 510mm (15.25 by 20 inches).
£1,500
Speed’s map of the British Islands
A map of islands off the coast of Britain from the first printed atlas of the British Isles, Speed’s ‘Theatre’. Unusually, this map is not in the carte-àfigure style that so characterizes Speed’s work. Instead, the map is divided into four quarters, depicting ‘Holy Iland’ (Lindisfarne) and the Farne Islands, off the coast of Northumberland, and Guernsey and Jersey, two of the Channel Islands.
Accompanying text in English, ‘The Ilands’, is printed on the reverse. John Speed (1552-1629) was the outstanding cartographer of his age. By trade a merchant tailor, but by proclivity a historian, it was the patronage of Sir Fulke Greville, poet and statesman, that allowed him to pursue this interest in earnest. His ‘Theatre of Great Britain’, first published in 1611 or 1612, was the first large-scale printed atlas of the British Isles. The ‘Prospect of the Most Famous Parts of the World’, from which the present work is drawn, appeared in 1627, bound with the ‘Theatre’, and is the first world atlas compiled by an Englishman to be published in England. Engraved in Amsterdam, many of the maps are anglicized versions of works by Dutch makers in distinctive carte-à-figure style, featuring borders with figures in local costume and city views.
SPEED, John
Britain As It Was Devided in the tyme of the Englishe Saxons especially during their Heptarchy.
Publication
London, & are to be sold by John Sudbury & Georg Humble in Popes head alley, [16141616].
Description
Double-page engraved map.
Dimensions
380 by 505mm (15 by 20 inches).
£3,600
Speed’s map of Britain in the time of the Heptarchy
A map of Britain, from the first large-scale atlas of the British Isles, Speed’s ‘Theatre’, as it was in the time of the Heptarchy. This is the period, which spanned the late-sixth to the ninth century, in which England was divided into seven kingdoms: Northumbria, Mercia, Wessex, East Anglia, Kent, Essex, and Sussex. Down the left-hand side of the map are illustrated, chronologically, the founding kings of each kingdom, among them Hengist, king of Kent, and Uffa, king of East Anglia. Down the right-hand side of the map are illustrated, also chronologically, the kings of each kingdom who first converted to Christianity, among them Erpenwald, king of East Anglia (shown, here, at the point of his murder, motivated by his Christian faith), and Ethelwolfe, king of Sussex (shown, here, being baptized).
John Speed (1552-1629) was the outstanding cartographer of his age. By trade a merchant tailor, but by proclivity a historian, it was the patronage of Sir Fulke Greville, poet and statesman, that allowed him to pursue this interest in earnest. His ‘Theatre of Great Britain’, from which the present work is drawn, was first published in 1611 or 1612 and is “the earliest English attempt at atlas-production on a grand scale” (Skelton). Drawing heavily on the work of Saxton and Norden, little of Speed’s cartography is original (he acknowledges, “I have put my sickle into other mens corne”), instead it is his blend of cartography and history, incorporating town-plans, vignettes, and genealogy, that makes Speed an innovator.
SPEED, John
Cornwall, Described by the travills of John Norden, augmented and published by John Speed.
Publication London, [Sudbury & Humble, 1616].
Description
Double-page engraved map, fine original hand-colour in outline, Latin text verso.
Dimensions
385 by 510mm (15.25 by 20 inches).
£5,000
Speed’s striking map of Cornwall in fine original colour
One of the most decorative maps of the county, in fine original colour. The map appears in John Speed’s ‘Theatre and Empire of Great Britaine’. The ‘Theatre’ followed the model of Ortelius’s ‘Theatrum orbis terrarum’ - first published in English in 1606 - in its title and its format, with map-sheets backed by historical and geographical texts and gazetteers of place names. It was the earliest English attempt at producing an atlas on a grand scale, with the first detailed maps of the provinces of Ireland, the first set of county maps consistently attempting to show the boundaries of territorial divisions, and the first truly comprehensive set of English town plans-a notable contribution to British topography. Perhaps as many as fifty of the seventy-three towns had not previously been mapped, and about fifty-one of the plans were probably Speed’s own work.
His map of Cornwall is based on the work of John Norden’s map of the county. John Norden (1548-1625) had himself planned a county atlas of England and Wales. However, he only managed to survey eight of the fifty-two counties before he ran into financial trouble
John Speed is perhaps the most famous single figure in the early history of the English map trade. He was a member of the Merchant Taylors’ Company, made free in September 1580, and later Fellow of the Society of Antiquaries. By training he was probably a rolling-press printer, but by interest he was a historian, and Queen Elizabeth granted him a sinecure in the Customs House, to give him the opportunity to pursue these interests. His earliest cartographic publications were historical; in 1595, he published a wall map of the Holy Land, Canaan as it was Possessed both in Abraham and Israels Dayes, a two-sheet map of The Invasions of England and Ireland with all their Civill Warres since the Conquest (1601) and a wall map of England, Wales and Ireland showing the same information, [1603-1604]. In 1611 he prepared two Bible maps, the larger inserted in folio editions of the great King James Bible, the smaller in octavo printings; Speed also secured a privilege, dated 31st October 1610, to ensure that the map was inserted in every copy of the Bible sold, a lucrative arrangement that the Stationers’ Company eventually felt impelled to buy out from his heirs. Speed always considered his History of Great Britaine (1611) his major work, but his reputation was established by the companion atlas volume, Theatre of the Empire of great Britaine, published in 1612, the first printed atlas of the British Isles. The earliest map prepared was The County Palatine of Chester [1604], but the death of the engraver William Rogers meant that Speed’s publishers had to turn to Jodocus Hondius, an Amsterdam engraver, to prepare the maps. The atlas was completed in 1612; the maps are notable for the decorative elements included, evidence of Speed’s interest in antiquities and most have inset town-plans, the first series of printed town-plans of the British Isles, and were issued with descriptive English text printed on the verso. In the hands of different publishers, there were numerous
editions to 1676 with text; later printings into the 1770s were issued without text. Towards the end of his career, Speed also prepared a world atlas: the Prospect of the most Famous Parts of the World (1627), the first world atlas compiled by an Englishman and published in England, although the maps were engraved in Amsterdam, using Dutch models. Again, this was printed with English text on the verso, and reprinted thereafter. While early editions are rarer, perhaps the most important edition was the 1676 printing, which added newly prepared English maps of New England, Virginia, the Carolinas, Barbados and Jamaica. Speed’s publishers also prepared two pocket atlases, colloquially called “miniature Speeds”, reproducing the Theatre and Prospect on a smaller, less expensive, format. The county atlas, England, Wales, and Ireland: … their several Counties abridged, first appeared in 1627, although there is an earlier proof version from about 1620; the A Prospect of the Most Famous Parts of the World appeared in 1646; both were reprinted in several editions up to 1675. However, Speed himself probably had little creative contribution to either atlas.
SPEED, John
Wales.
Publication [London], are to be sold by John Sudbury and George Humble in Popes head Allye, 1610 [but 1616].
Description
Double-page engraved map.
Dimensions
385 by 520mm (15.25 by 20.5 inches).
£2,800
Speed’s map of Wales
A map of Wales, from the first large-scale atlas of the British Isles, Speed’s ‘Theatre’. Running down each side of the map is a decorative border, with a series of city views, including Cardigan, Carmarthen, and Cardiff. Within this, in each corner of the map, is illustrated a cathedral: Bangor, St Asaph, Llandaff, and St David’s.
John Speed (1552-1629) was the outstanding cartographer of his age. By trade a merchant tailor, but by proclivity a historian, it was the patronage of Sir Fulke Greville, poet and statesman, that allowed him to pursue this interest in earnest. His ‘Theatre of Great Britain’, from which the present work is drawn, was first published in 1611 or 1612 and is “the earliest English attempt at atlas-production on a grand scale” (Skelton).
Drawing heavily on the work of Saxton and Norden, little of Speed’s cartography is original (he acknowledges, “I have put my sickle into other mens corne”), instead it is his blend of cartography and history, incorporating town-plans, vignettes, and genealogy, that makes Speed an innovator.
SPEED, John
Oxfordshire described with ye Citie and the Armes of the Colledges of yt famous University. Ao. 1605.
Publication [London], are to be sold in popes head alley against the Exchange by I.S. & G.H. Cum Privilegio, [1616].
Description
Double-page engraved map, trimmed to lower neatline.
Dimensions 390 by 530mm (15.25 by 20.75 inches).
£2,800
Speed’s map of Oxford
A map of Oxfordshire from the 1616 Latin edition of the first largescale atlas of the British Isles, Speed’s ‘Theatre’. In the top right-hand corner is an inset town-plan of Oxford, with points of interest including ‘The Castle’ and ‘All Soules Colledge’ marked using an alphabetical key. Along both the left and right-hand side of the map are depicted the arms of the university colleges. At the bottom of the map, a globe has been drawn around the scale bar, with a scholar standing on each side, one of whom is measuring the scale bar with a compass.
John Speed (1552-1629) was the outstanding cartographer of his age. By trade a merchant tailor, but by proclivity a historian, it was the patronage of Sir Fulke Greville, poet and statesman, that allowed him to pursue this interest in earnest. His ‘Theatre of Great Britain’, from which the present work is drawn, was first published in 1611 or 1612 and is ‘the earliest English attempt at atlas-production on a grand scale’ (Skelton). Drawing heavily on the work of Saxton and Norden, little of Speed’s cartography is original (he acknowledges, ‘I have put my sickle into other mens corne’), instead it is his blend of cartography and history, incorporating town-plans, vignettes, and genealogy, that makes Speed an innovator.
SPEED, John
[Derbyshire] Darbieshire described 1610.
Publication
London, Performed by John Speede, and are to be sold in popes head Alley by Iohn Sudbury and G. Humble, [1627].
Description Engraved map with hand colouring.
Dimensions 380 by 510mm (15 by 20 inches).
References Chubb XXV.
£900
Speed’s map of Derbyshire
A beautifully coloured map of Derbyshire, with insets of the city of Derby and the springs at Buxton.
John Speed (1552-1629) was the outstanding cartographer of his age. His ‘Theatre of Great Britain’ was the first atlas of the British Isles: Speed prepared the maps himself about two years before they were published. His maps and books dominated the seventeenth-century English market. The present map is taken from the 1627 English edition published by George Humble.
SPEED, John
Montgomery.
Publication London, Described by Christopher Saxton, augmented and published by John Speed, and are to be sold in Popes head alley against the Exchange of London by John Sudbury and George Humbell, [1627].
Description Engraved map with hand colouring.
Dimensions 396 by 510mm (15.5 by 20 inches).
References Chubb XXV.
£500
Speed’s map of Montgomeryshire
A beautifully coloured map of the historic county of Montgomeryshire, with an inset map of Montgomery.
John Speed (1552-1629) was the outstanding cartographer of his age. His ‘Theatre of Great Britain’ was the first atlas of the British Isles: Speed prepared the maps himself about two years before they were published. His maps and books dominated the seventeenth-century English market. The present map is taken from the 1627 English edition published by George Humble.
SPEED, John
Oxfordshire described with ye citie and the armes of the colledges of ye famous university Anno 1605.
Publication
London, Performed by John Speede and are to be sold in popes head alley against the Exchange by I.S. & G.H., [1627].
Description
Engraved map with hand colouring, blank to verso
Dimensions 380 by 520mm (15 by 20.5 inches).
References Chubb XXV.
£2,000
Speed’s map of Oxfordshire
A map of Oxfordshire, with an inset map of the city of Oxford and a border made up of the coats of arms of the university colleges. At the bottom, the scale bar has been decorated with a globe and two scholars, one of whom is using a pair of compasses to measure out the scale bar.
John Speed (c1551-1629) is perhaps the most famous single figure in the early history of the English map trade. He was a member of the Merchant Taylors’ Company, made free in September 1580, and later Fellow of the Society of Antiquaries. By training he was probably a rolling-press printer, but by interest he was a historian, and Queen Elizabeth granted him a sinecure in the Customs House, to give him the opportunity to pursue these interests.
Speed always considered his ‘History of Great Britaine’ (1611) his major work, but his reputation was established by the companion atlas volume, ‘Theatre of the Empire of great Britaine’, published in 1612, the first printed atlas of the British Isles. The earliest map prepared was ‘The County Palatine of Chester’ [1604], but the death of the engraver William Rogers meant that Speed’s publishers had to turn to Jodocus Hondius, an Amsterdam engraver, to prepare the maps.
The atlas was completed in 1612; the maps are notable for the decorative elements included, evidence of Speed’s interest in antiquities and most have inset town-plans, the first series of printed town-plans of the British Isles, and were issued with descriptive English text printed on the verso. In the hands of different publishers, there were numerous editions to 1676 with text; this example, published by George Humble, was issued in 1627.
SPEED, John
The Invasions of England and Ireland With al their Civill Wars Since the Conquest.
Publication [London], Performed by Iohn Speed and ar to be solde in Popes head alley by George Humble, [1627-1632].
Description Double-page engraved map with hand-colour.
A map of England, Wales, and Ireland illustrating the invasions and battles that had played out in these countries, up until the point of the map’s production, from the first atlas compiled and published by an Englishman, Speed’s ‘Prospect’.
Deriving from an earlier map by Speed, ca. 1601, the map is peppered with vignettes that depict battles from Todcaster, to Blackheath, to Cardigan. Along the English Channel is illustrated the progress of the Spanish Armada, in 1588, from the inception of their ‘pretensed invasion’, to their defeat, driven up round Scotland, and ‘forced about the coasts of Ireland to their contrye’. In the bottom left-hand corner is an inset text that explains the sites in Ireland, numbered for ease of reference.
Accompanying text in English, ‘A Briefe Description of the Civill Warres, and Battails fought in England, Wales, and Ireland’, is printed on the reverse.
John Speed (1552-1629) was the outstanding cartographer of his age. By trade a merchant tailor, but by proclivity a historian, it was the patronage of Sir Fulke Greville, poet and statesman, that allowed him to pursue this interest in earnest. His ‘Theatre of Great Britain’, first published in 1611 or 1612, was the first large-scale printed atlas of the British Isles. The ‘Prospect of the Most Famous Parts of the World’, from which the present work is drawn, appeared in 1627, bound with the ‘Theatre’, and is the first world atlas compiled by an Englishman to be published in England. Engraved in Amsterdam, many of the maps are anglicized versions of works by Dutch makers in distinctive carte-à-figure style, featuring borders with figures in local costume and city views.
SPEED, John
Britain As It Was Devided in the tyme of the Englishe Saxons especially during their Heptarchy Performed by Iohn Speede.
Publication [London], are to be sold by Roger Rea ye Elder and younger at ye Golden Crosse in Cornhill against ye Exchange, [1665].
Description
Double-page engraved map, fine contemporary outline hand colour, upper left and right margin skilfully repaired.
Dimensions 410 by 550mm (16.25 by 21.75 inches).
References Skelton 81.
£3,800
Rare Roger Rea edition of Speed’s Heptarchy
The map bears the imprint of Roger Rea the Elder and Younger. The Reas had purchased the rights to Speed’s work from William Garrett in 1659, who had previously purchased them from the widow of William Humble in the same year. Skelton suggests that the father and son intended a new edition of the atlas for the Restoration of 1660. However, the atlas would appear not to have been published until 1665. This is borne out by an advertisement in the Term Catalogue by the subsequent owners of the plates, Thomas Bassett and Richard Chiswell, in 1675:
“Mr John Speed’s... Geography of the Kingdoms of England, Scotland, and Ireland... together with his Prospect... all in one entire Volume, hath been, for seven Years past, out of Print, the greatest part of an Impression, then newly Printed, being destroyed by the late dreadful Fire, 1666”. This is borne out by the rarity of the Rea edition of the atlas. There is evidence that they planned an edition of 1666, as there are impressions of Sussex, Buckingham and Derby, with Rea’s imprint, which bear that date. Rea would later sell the plates to Bassett and Chiswell, who would publish a new edition in 1676.
SPEED, John
Essex, devided into Hundreds, with the most antient and fayre Towne Colchester Described and other memorable Monuments observed.
Publication [London], to be solde by Roger Rea ye elder & younger at ye Golden Crosse in Cornhill agt. ye Exchang, 1665.
Description
Double-page engraved map, fine contemporary outline hand colour, upper left and right margins skilfully repaired, margins reinforced with japan paper.
Dimensions
410 by 550mm (16.25 by 21.75 inches).
£1,700
Rare Roger Rea edition of Speed’s map of Essex
The map bears the imprint of Roger Rea the Elder and Younger. The Reas had purchased the rights to Speed’s work from William Garrett in 1659, who had previously purchased them from the widow of William Humble in the same year. Skelton suggests that the father and son intended a new edition of the atlas for the Restoration of 1660. However, the atlas would appear not to have been published until 1665. This is borne out by an advertisement in the Term Catalogue by the subsequent owners of the plates, Thomas Bassett and Richard Chiswell, in 1675:
“Mr John Speed’s... Geography of the Kingdoms of England, Scotland, and Ireland... together with his Prospect... all in one entire Volume, hath been, for seven Years past, out of Print, the greatest part of an Impression, then newly Printed, being destroyed by the late dreadful Fire, 1666”. This is borne out by the rarity of the Rea edition of the atlas. There is evidence that they planned an edition of 1666, as there are impressions of Sussex, Buckingham and Derby, with Rea’s imprint, which bear that date. Rea would later sell the plates to Bassett and Chiswell, who would publish a new edition in 1676.
SPEED, John
Herefordshire described With the true plot of the Citie Hereford, as alsoe the Armes of thos Nobles that have bene intituled with that Dignitye.
Publication [London], to be solde by Roger Rea the Elder and younger at the Golden Crosse in Cornhill against the Exchange, 1665.
Description
Double-page engraved map, fine contemporary outline hand colour, upper left and right margins skilfully repaired, margins reinforced with japan paper.
Dimensions
410 by 550mm (16.25 by 21.75 inches).
£1,000
Rare Roger Rea edition of Speed’s map of Herefordshire
The map bears the imprint of Roger Rea the Elder and Younger. The Reas had purchased the rights to Speed’s work from William Garrett in 1659, who had previously purchased them from the widow of William Humble in the same year. Skelton suggests that the father and son intended a new edition of the atlas for the Restoration of 1660. However, the atlas would appear not to have been published until 1665. This is borne out by an advertisement in the Term Catalogue by the subsequent owners of the plates, Thomas Bassett and Richard Chiswell, in 1675:
“Mr John Speed’s... Geography of the Kingdoms of England, Scotland, and Ireland... together with his Prospect... all in one entire Volume, hath been, for seven Years past, out of Print, the greatest part of an Impression, then newly Printed, being destroyed by the late dreadful Fire, 1666”. This is borne out by the rarity of the Rea edition of the atlas. There is evidence that they planned an edition of 1666, as there are impressions of Sussex, Buckingham and Derby, with Rea’s imprint, which bear that date. Rea would later sell the plates to Bassett and Chiswell, who would publish a new edition in 1676.
Rare Roger Rea edition of Speed’s map of
Worcestershire
SPEED, John
Worcestershire Described.
Publication [London], to be solde by Roger Rea the Elder and younger at ye Golden Crosse in Cornhill against the Exchange 1665.
Description
Double-page engraved map, fine contemporary outline hand colour, upper left and right margins skilfully repaired, margins reinforced with japan paper.
Dimensions 410 by 550mm (16.25 by 21.75 inches).
£1,200
The map bears the imprint of Roger Rea the Elder and Younger. The Reas had purchased the rights to Speed’s work from William Garrett in 1659, who had previously purchased them from the widow of William Humble in the same year. Skelton suggests that the father and son intended a new edition of the atlas for the Restoration of 1660. However, the atlas would appear not to have been published until 1665. This is borne out by an advertisement in the Term Catalogue by the subsequent owners of the plates, Thomas Bassett and Richard Chiswell, in 1675:
“Mr John Speed’s... Geography of the Kingdoms of England, Scotland, and Ireland... together with his Prospect... all in one entire Volume, hath been, for seven Years past, out of Print, the greatest part of an Impression, then newly Printed, being destroyed by the late dreadful Fire, 1666”. This is borne out by the rarity of the Rea edition of the atlas. There is evidence that they planned an edition of 1666, as there are impressions of Sussex, Buckingham and Derby, with Rea’s imprint, which bear that date. Rea would later sell the plates to Bassett and Chiswell, who would publish a new edition in 1676.
SPEED, John Northamptonshire.
Publication [London], to be sold by Roger Rea the Elder and younger at the Golden Crosse in Cornhill against ye Exchange, 1665.
Description
Double-page engraved map, fine contemporary outline hand colour, upper left and right margins skilfully repaired, margins reinforced with japan paper.
Dimensions 410 by 550mm (16.25 by 21.75 inches).
£1,200
Rare Roger Rea edition of Speed’s map of Northamptonshire
The map bears the imprint of Roger Rea the Elder and Younger. The Reas had purchased the rights to Speed’s work from William Garrett in 1659, who had previously purchased them from the widow of William Humble in the same year. Skelton suggests that the father and son intended a new edition of the atlas for the Restoration of 1660. However, the atlas would appear not to have been published until 1665. This is borne out by an advertisement in the Term Catalogue by the subsequent owners of the plates, Thomas Bassett and Richard Chiswell, in 1675:
“Mr John Speed’s... Geography of the Kingdoms of England, Scotland, and Ireland... together with his Prospect... all in one entire Volume, hath been, for seven Years past, out of Print, the greatest part of an Impression, then newly Printed, being destroyed by the late dreadful Fire, 1666”. This is borne out by the rarity of the Rea edition of the atlas. There is evidence that they planned an edition of 1666, as there are impressions of Sussex, Buckingham and Derby, with Rea’s imprint, which bear that date. Rea would later sell the plates to Bassett and Chiswell, who would publish a new edition in 1676.
SPEED, John
The Countie of Nottingham described The Shire Townes Situation and the Earls thereof observed.
Publication [London], to be sold by Roger Rea the Elder and younger at the Golden Crosse in Cornhill against the Exchange, 1665.
Description Double-page engraved map, upper left and right margins skilfully repaired, margins reinforced with japan paper.
Dimensions
410 by 550mm (16.25 by 21.75 inches).
£400
Rare Roger Rea edition of Speed’s map of Nottinghamshire
The map bears the imprint of Roger Rea the Elder and Younger. The Reas had purchased the rights to Speed’s work from William Garrett in 1659, who had previously purchased them from the widow of William Humble in the same year. Skelton suggests that the father and son intended a new edition of the atlas for the Restoration of 1660. However, the atlas would appear not to have been published until 1665. This is borne out by an advertisement in the Term Catalogue by the subsequent owners of the plates, Thomas Bassett and Richard Chiswell, in 1675:
“Mr John Speed’s... Geography of the Kingdoms of England, Scotland, and Ireland... together with his Prospect... all in one entire Volume, hath been, for seven Years past, out of Print, the greatest part of an Impression, then newly Printed, being destroyed by the late dreadful Fire, 1666”. This is borne out by the rarity of the Rea edition of the atlas. There is evidence that they planned an edition of 1666, as there are impressions of Sussex, Buckingham and Derby, with Rea’s imprint, which bear that date. Rea would later sell the plates to Bassett and Chiswell, who would publish a new edition in 1676.
SPEED, John
[Lancashire] The Countie Pallatine of Lancaster Described and Divided into Hundreds.
Publication [London], to be solde by Roger Rea ye Elder and younger at ye Golden Crosse in Cornhill against the Exchange, 1665.
Description
Double-page engraved map, upper left and right margins skilfully repaired, margins reinforced with japan paper.
Dimensions 410 by 550mm (16.25 by 21.75 inches).
£1,800
Rare Roger Rea edition of Speed’s map of
Lancashire
The map bears the imprint of Roger Rea the Elder and Younger. The Reas had purchased the rights to Speed’s work from William Garrett in 1659, who had previously purchased them from the widow of William Humble in the same year. Skelton suggests that the father and son intended a new edition of the atlas for the Restoration of 1660. However, the atlas would appear not to have been published until 1665. This is borne out by an advertisement in the Term Catalogue by the subsequent owners of the plates, Thomas Bassett and Richard Chiswell, in 1675:
“Mr John Speed’s... Geography of the Kingdoms of England, Scotland, and Ireland... together with his Prospect... all in one entire Volume, hath been, for seven Years past, out of Print, the greatest part of an Impression, then newly Printed, being destroyed by the late dreadful Fire, 1666”. This is borne out by the rarity of the Rea edition of the atlas. There is evidence that they planned an edition of 1666, as there are impressions of Sussex, Buckingham and Derby, with Rea’s imprint, which bear that date. Rea would later sell the plates to Bassett and Chiswell, who would publish a new edition in 1676.
SPEED, John
The Countie Westmorland And Kendale the Cheif Towne Described With the Armes of such Nobles, as have bene Earles of either of them.
Publication [London], to be sold by Roger Rea the Elder ad younger at the Golden Crosse in Cornhill against the Exchange. 1665.
Description
Double-page engraved map, fine contemporary outline hand colour, upper left and right margins skilfully repaired, margins reinforced with japan paper.
Dimensions
410 by 550mm (16.25 by 21.75 inches).
£850
Rare Roger Rea edition of Speed’s map of Westmorland
The map bears the imprint of Roger Rea the Elder and Younger. The Reas had purchased the rights to Speed’s work form William Garrett in 1659, who had previously purchased them from the widow of William Humble in the same year. Skelton suggests that the father and son intended a new edition of the atlas for the Restoration of 1660. However, the atlas would appear not to have been published until 1665. This is borne out by an advertisement in the Term Catalogue by the subsequent owners of the plates, Thomas Bassett and Richard Chiswell, in 1675:
“Mr John Speed’s... Geography of the Kingdoms of England, Scotland, and Ireland... together with his Prospect... all in one entire Volume, hath been, for seven Years past, out of Print, the greatest part of an Impression, then newly Printed, being destroyed by the late dreadful Fire, 1666”. This is borne out by the rarity of the Rea edition of the atlas. There is evidence that they planned an edition of 1666, as there are impressions of Sussex, Buckingham and Derby, with Rea’s imprint, which bear that date. Rea would later sell the plates to Bassett and Chiswell, who would publish a new edition in 1676.
SPEED, John
Cumberland and the Ancient Citie Carlile Described with Many Memorable Antiquities Therein Found Observed.
Publication [London], to be sould by Roger Rea the Elder and younger at the Golden Cross in Cornhill against the Exchange, 1665.
Description
Double-page engraved map, fine contemporary outline hand colour, upper left and right margins skilfully repaired, margins reinforced with japan paper.
Dimensions
410 by 550mm (16.25 by 21.75 inches).
£1,000
Rare Roger Rea edition of Speed’s map of Cumberland
The map bears the imprint of Roger Rea the Elder and Younger. The Reas had purchased the rights to Speed’s work form William Garrett in 1659, who had previously purchased them from the widow of William Humble in the same year. Skelton suggests that the father and son intended a new edition of the atlas for the Restoration of 1660. However, the atlas would appear not to have been published until 1665. This is borne out by an advertisement in the Term Catalogue by the subsequent owners of the plates, Thomas Bassett and Richard Chiswell, in 1675:
“Mr John Speed’s... Geography of the Kingdoms of England, Scotland, and Ireland... together with his Prospect... all in one entire Volume, hath been, for seven Years past, out of Print, the greatest part of an Impression, then newly Printed, being destroyed by the late dreadful Fire, 1666”. This is borne out by the rarity of the Rea edition of the atlas. There is evidence that they planned an edition of 1666, as there are impressions of Sussex, Buckingham and Derby, with Rea’s imprint, which bear that date. Rea would later sell the plates to Bassett and Chiswell, who would publish a new edition in 1676.
SPEED, John
Cambridgeshire described with the devision of the hundreds, the Townes, situation, with the Armes of the Colleges of that famous Universiti. And also the Armes of all such Princes and noble men as have heer:tofore borne the honor:able tytles & dignities of the Earldome of Cambridg.
Publication [London], And are to be solde by Henry Overton at the White Horse without Newgate London, [1710-1743].
Description
Double-page engraved map with hand colour, minor frame-burn to margins.
Dimensions
390 by 525mm (15.25 by 20.75 inches).
£1,400
Speed’s map of Cambridge
A map of Cambridgeshire from one of the Overton editions of the first large-scale atlas of the British Isles, Speed’s ‘Theatre’. In the top left-hand corner is an inset plan of Cambridge, including details such as ‘Pithagoras house’, ‘Pembrok Hall Orchard’, and ‘Iesus colledg walkes and groves’. Down each side of the map are represented the arms of the Cambridge colleges, with royal arms depicted along the bottom, and four figures in academic dress above, one of whom is holding a compass that acts as the scale bar.
John Speed (1552-1629) was the outstanding cartographer of his age. By trade a merchant tailor, but by proclivity a historian, it was the patronage of Sir Fulke Greville, poet and statesman, that allowed him to pursue this interest in earnest. His ‘Theatre of Great Britain’, from which the present work is drawn, was first published in 1611 or 1612 and is ‘the earliest English attempt at atlas-production on a grand scale’ (Skelton).
Drawing heavily on the work of Saxton and Norden, little of Speed’s cartography is original (he acknowledges, ‘I have put my sickle into other mens corne’), instead it is his blend of cartography and history, incorporating town-plans, vignettes, and genealogy, that makes Speed an innovator. This map is from one of the editions of the ‘Prospect’ published by Henry Overton between ca. 1710 and 1743. Unlike in earlier editions, the verso of the maps tend to be blank.
KIP, Johannes
A Prospect of the City of London, Westminster and St. James’s Park.
Publication London, [Thomas Millward?, after 1726].
Description
Engraving, printed on 8 sheets, joined, some areas of restoration and of loss, evenly age-toned.
Dimensions 990 by 2075mm (39 by 81.75 inches).
References
BM 1880,1113.1181.1-12 (first state).
Ralph Hyde and Peter Jackson, Jan Kip’s Prospect of London (Richmond: London Topographical Society, 2003); Ralph Hyde, private notes.
£75,000
“The largest view of London ever to be published
A fine example of Kip’s view of London, the “largest view of London ever to be published” (Hyde and Jackson). Johannes Kip (c1652-1722) was a Dutch engraver and printer who moved to London, following William of Orange and his wife Mary after the Glorious Revolution.
Kip’s prospect was not only innovative in scale, but also in perspective. Most prospects of London focused on the city, usually viewed from the south of the river. Kip used “an entirely novel view-point - the roof of Buckingham House” (Hyde and Jackson). The cost to the prospect of giving the Palace such prominence is a radical distortion of the more distant townscape. A satisfactory profile view of the City of London is achieved only by doubling the Thames back on itself. The focus of the print is on St James’s Park, an epicentre of urban life. There is a herd of deer, who were tame enough to eat out of visitors’ hands, and a flock of cows who were driven to the Whitehall end of the park every day to be milked (Kip has changed this to the Buckingham House end). The inhabitants range from the trio of women selling oranges (wearing kerchiefs as a sign of respectability), to the men playing pall-mall, a game similar to croquet which gave the London street its name, to the family of beggars just outside the gate. The most important characters, however, are George I, shown in his coach, and the Prince and Princess of Wales in their own coach just behind, escorted by a group of Horse Guards. Kip’s decision to include them, as well as to use the viewpoint from Buckingham House, is a clear statement about his loyalty and about where the power in Britain now lay - in Westminster.
Publication was delayed by the Jacobite rebellion in 1715, and by the rift between the King and the Prince of Wales. Kip was left in a difficult position. Not only was the view dedicated to Caroline, Princess of Wales, who had defiantly chosen to go into political exile with her husband, even though it meant losing access to her children, but it also showed the Prince and Princess riding in a coach immediately behind the King. Luckily, the two were eventually reconciled and Kip was able to publish his view in 1720.
Hyde identifies it as the third state, distinguished by the updated James Gibbs steeple on the church of St Martin in the Fields on sheet six (numbered 14) and the continuation of the neat lines around the references and title below the image. It must have been published after 1726, when St Martin in the Fields was reconsecrated, possibly by Thomas Millward who also published the second state (Hyde).
ROCQUE, John
A Plan of the Cities of London and Westminster and Borough of Southwark, with the contiguous Buildings. From an Actual Survey taken by John Rocque, Land Surveyor and engraved by John Pine.
Publication London, John Pine and John Tinney, 1746.
Description Engraved plan on 24 sheets.
Dimensions 2100 by 4000mm (82.75 by 157.5 inches).
References Howgego 96 (1).
£100,000
John Rocque’s
magnificent
map of early Georgian London
It would appear that John Rocque, a French Huguenot, emigrated with the rest of his family to London in the 1730s, where he began to ply his trade as a surveyor of gentleman’s estates, and with plans of Kensington Gardens, and Hampton Court. However, in 1737 he applied his surveying skills to a much great task, that of surveying the entire built-up area of London. Begun in the March of 1737, upon a scale of 26 inches to 1 statute mile, the map would take nine years to produce, eventually being engraved upon 24 sheets of copper and published in 1746. The plan stretches west to east from Hyde Park to Limehouse and north to south from New River Head to Walworth.
HORWOOD, Richard
Plan of the Cities of London and Westminster The Borough of Southwark and Parts Adjoining, Shewing Every House.
Publication London, 1799.
Description
Folio (570 by 360mm), calligraphic title in an oval cartouche, engraved plan on 32 sheets, dedication to the Phoenix Fire Office on sheet G4, occasional very light browning and offsetting as usual, original calf over marbled paper boards, spine lacking, disbound.
Dimensions 2280 by 4000mm (89.75 by 157.5 inches).
Scale
26 inches to 1 statute mile.
References Howgego 200 (1).
£40,000
Horwood’s map was produced for use by the Phoenix Fire Office and is dedicated to the Trustees and Directors. It was the largest map ever printed in Britain at the time, and the first attempt to produce a map of London with all of the houses delineated and numbered, an invaluable aid for the insurance office and very useful in identifying the street numbering of eighteenth century London. The numbering of buildings did not begin until about 1735, when the practice of identifying a building by describing it as ‘by’, ‘opposite’ or ‘over against’ some other building was recognized as confusing and erroneous. However, even by the date of printing of Horwood’s map, it was still not universal.
The map is produced to exactly the same scale as the Rocque map of fifty years before and so enables us to compare the development of London on a street-by-street basis in the second half of the eighteenth century. It is also fascinating to look at the fringes of London and see the areas which were soon to be swallowed up. Thomas Lord’s cricket ground is shown in its original place, in what is now Dorset Square. It was opened there in 1787 (7 years before the relevant sheet on the map was published). The pressure of London’s development led to a rent increase in 1809 which resulted in Lord moving his cricket ground to the greener pastures of St. John’s Wood.
Very little is known about Horwood (1758-1803). Most likely he was working for the Phoenix Assurance Company on surveying jobs when he began the enormous task of surveying the whole of the built-up area of London. “According to his own account the prepration of the plan gave him nine years’ severe labour and he himself “took every angle, measured almost every line, and after that plotted and compared the whole work”. He sent a small sample of the plan showing Leicester Square and its neighborhood to all the London vestries with a letter promising that those “who gave him Encouragement” could have a “compleat” copy by “the year 1792”. His estimate proved to be over-optimistic and only one sheet - B2 (Grosvenor Square-Piccadilly) - was published by 1792 (Howgego, p. 22). In January 1798 he wrote to the Phoenix Assurance Company offering to dedicate his map to the company if the directors would make him a loan of £500 to enable him to finish the work. His request was granted but this, in addition to an award from the Society of Arts, were too little and too late and, in 1803, Richard Horwood died in Liverpool in poverty and obscurity, so sharing the fate of other great men like John Stow and Wenceslaus Hollar, to whom London had failed to honour her debt of gratitude.
GREENWOOD, Christopher
Map of London from An Actual Survey made in the Years 1824, 1825, and 1826.
Publication London, Greenwood, Pringle & Co., August 21st, 1827.
Description
Engraved map on six sheets joined, handcoloured, dissected and mounted on linen, housed in tree calf pull-off slipcase, with red morocco label lettered in gilt.
Dimensions
1270 by 1898mm (50 by 74.75 inches).
References
Howgego 309 (1). MOTCO Hyde state 2. Showing the proposed Collier Docks, which were never constructed.
£35,000
Greenwood’s majestic large-scale plan of London
Christopher and John Greenwood state in the title that the plan was made from an “Actual Survey”, which had taken three years. Plans at the time were often copied from older surveys, or re-issued with minor updating; so conducting a new survey was indeed something to boast about. The plan, which was finely engraved by James and Josiah Neele, is stylistically similar to the Ordnance Survey maps of the time, although it was engraved on a much larger scale of 8 inches to the mile, compared to the OS one inch to the mile. It includes detailed depictions of streets, houses, public buildings, parks, squares, woods, plantations, rivers, hills, windmills; also the marking of the boundaries of the City of London, Westminster, Southwark, Rules of the King’s Bench & Fleet Prison, Clink Liberty, counties and parishes. Below the plan is a dedication to George IV, which is flanked by views of Westminster Abbey and St Paul’s Cathedral.
The maps by Christopher and John Greenwood set new standards for large-scale surveys. Although they were unsuccessful in their stated aim to map all the counties of England and Wales it is probably no coincidence that of the ones they missed, Buckinghamshire, Cambridgeshire, Herefordshire, Hertfordshire, Norfolk and Oxfordshire, all except Cambridgeshire were mapped by Andrew Bryant in a similar style and at the same period. From a technical point of view the Greenwoods’ productions exceeded the high standards set in the previous century though without the decoration and charming title-pieces that typified large scale maps of that period.
The Greenwoods started in 1817 with Lancashire and Yorkshire and by 1831 they had covered 34 counties. Their maps were masterpieces of surveying and engraving techniques, and in view of the speed at which they were completed, their accuracy is remarkable. They mark the boundaries of the counties, hundreds and parishes, churches and chapels, castles and quarries, farmhaouses and gentlemen’s seats, heaths and common land, woods, parliamentary representatives and distances between towns. The price of 3 guineas each compares with the first edition Ordnance Survey sheets of 7s 6d, though the latter did not relate to complete counties.
BOOTH, Charles
Life and Labour of the People in London.
Publication London, 1902.
Description 18 volumes. Octavo (210 by 140mm). Half titles, tables, and folding maps, 5 folding coloured lithographed maps contained in separate wallet, exlibris of Hammersmith Reference Library, original vellum lettered and decorated in gilt, with library number in manuscript to spine.
Dimensions 1050 by 1250mm (41.25 by 49.25 inches).
Scale 6 inches to 1 statute mile.
References Ralph Hyde, Printed Maps of Victorian London 1851-1900 (Folkestone: Dawson, 1980), p.252.
£20,000
“The Lowest Class. Vicious, semi-criminal”
The definitive edition of Charles Booth’s seminal work on London Poverty; the last edition to include Booth’s highly important map of London poverty.
The work is split into four sections: First Series: Poverty, first five volumes, each text volume bears notes to the original date of publication, 1889-1891; the seminal map is housed in volume five and is dated 1889; Second Series: Industry, five volumes, each volume of which bears notes to the original date of publication, 1895-1897; Third Series: Religious Influences, seven volumes, dated 1902; Final Volume: Notes on Social Influences and Conclusion, 1902.
This monumental work contains: “Quite the most important thematic maps of the Metropolis in the nineteenth century were those which accompanied Charles Booth’s Monumental survey.” (Hyde)
A fascinating map of fundamental importance to British social reform. Based upon Stanford’s ‘Library Map of London’. The colouring of the map depicts, by street: “The Lowest Class. Vicious, semi-criminal” (black); “Very Poor, casual. Chronic Want” (blue); “Poor. 18s to 21s a week for a moderate family” (light blue); “Mixed. Some comfortable, others poor” (purple); “Fairly Comfortable. Good ordinary earnings” (pink); “Well-to-do. Middle class” (red); “Upper-middle and Upper classes. Wealthy” (yellow).
Charles Booth (1840-1916), shipowner and writer on social questions, began his long and successful career as shipowner at the age of twentytwo, when he joined his eldest brother Alfred as partner in Alfred Booth & Co. He grew up with the Trade Union movement, and in general sympathy with its earlier policy, but its later developments he regarded with misgiving.
Booth had always taken an interest in the welfare of working men, but it was not until he was past middle age that there began to appear the works which established his reputation as a writer on social questions, including his ‘inquiry into the condition and occupations of the people of London’, the earlier part of which appeared, along with this map, as Labour and Life of the People (1889), and the whole as Life and Labour of the People in London (1891-1903). Booth’s works appeared at a critical time in the history of English social reform. A lively interest was being taken in the problems of pauperism, and it was coming to be recognized that benevolence, to be effective, must be scientific. Life and Labour was designed to show ‘the numerical relation which poverty, misery and depravity bear to regular earnings and comparative comfort, and to describe the general conditions under which each class lives’. Among the many who helped him to compile his material, and edit it, were his wife’s cousin, Miss Beatrice Potter (Mrs. Sidney Webb) and (Sir) Graham Balfour for the earlier volumes, and Ernest Aves for the later. It was no proper part of Booth’s plan to analyse economic changes or to trace the course of social development. His object was to give an accurate picture
of the condition of London as it was in the last decade of the nineteenth century. In this light, his Life and Labour was recognized as perhaps the most comprehensive and illuminating work of descriptive statistics which had yet appeared.
Booth married in 1871 Mary, only daughter of Charles Zachary Macaulay, and granddaughter of Zachary Macaulay. There were three sons and four daughters of the marriage. He died 23 November 1916 at his home, Gracedieu Manor, Whitwick, and was buried at Thringstone, Leicestershire.
Mind
STINGEMORE, Fred H.; Harry BECK; Hans SCHLEGER; Harold HUTCHISON; Paul E. GARBUTT; and LONDON UNDERGROUND
[Group of 50 maps of the London Underground].
Publication 1932-2025.
Description 50 chromolithograph maps.
Dimensions [smallest size] 120 by 150mm (4.75 by 6 inches); [largest size] 150 by 300mm (6 by 11.75 inches).
£75,000
A remarkable group of 50 maps of the London Underground, with highlights including: the rare first state of the first edition of Harry Beck’s iconic map; an unusual Hans Schleger map, printed in brown, under war-time rationing to colour-printing; the 1949 map that Beck considered to be his finest work; and, appropriately, a 2005 map with the Frieze Art Fair cover.
1. Fred H. Stingemore, ‘Map of London’s Underground Railways’, 1932 - the final pre-Beck edition of the Underground map, it shows the completed Piccadilly line extension north of Finsbury Park and west of Baron’s Court.
2. Harry Beck, ‘Map of London’s Underground Railways’, 1933 - rare first state of the first edition of Beck’s iconic map of the London Underground. Beck’s map was first published as a trial, with the public invited to comment on the new design, as is explained on the verso of the map: “A new design for an old map. We should welcome your comments. Please write to Publicity Manager, 55, Broadway Westminster, S.W.1”.
3. Harry Beck, ‘Railway Map’, 1934 - with the East London Railway, which ran from Shoreditch to New Cross, now incorporated into the Metropolitan line, and the Central and Bakerloo lines brown and red, respectively.
4. Harry Beck, ‘Railway Map’, 1935 - a diagram of interchange stations in central London now appears on the verso.
5. Harry Beck, ‘Railway Map’, 1936 - as the 1935 edition, this example, too, has a diagram of interchange stations in central London on the verso.
6. Harry Beck, ‘Railway Map’, 1937 - the last map to show the Metropolitan line as distinct from the District line until 1949.
7. Hans Schleger, ‘Underground Railway Map’, 1938 - the first tube map to be designed by poster artist Hans Schleger, as “Zero”. It shows the planned extensions to the Northern, Central, and Bakerloo lines, marked with dashed lines - plans that would be scuppered by the outbreak of the Second World War. To the verso are two maps of London above ground, the first extending from Green Park to Charing Cross, and the second from Blackfriars to Liverpool Street. Schleger’s redesign of the tube map would be a short-lived departure from Beck’s iconic scheme, with editions published only between 1938 and 1941.
8. Hans Schleger, ‘Underground Lines’, 1939 - a further example of Schleger’s design.
9. Hans Schleger, ‘Underground Lines’, 1940 - this is the second of only three maps of the London Underground, printed during the Second World War, with all the tube lines printed in brown, due to restrictions on colour-printing. Schleger’s maps of London above ground, which feature on the verso, no longer have the precise location of tube stations marked, perhaps to protect from German bombing.
10. Harry Beck, ‘Underground Lines’, 1941 - the first tube map to be designed by Beck after Schleger’s interlude, though still with the red Schleger cover, and the only one of Beck’s maps to use the interlocking ring motif to illustrate interchanges.
11. Harry Beck, ‘Underground Lines’, 1943 - with the proposed extensions to the Central and Northern lines removed, interrupted by the War (although the tunnels, already dug for the Central line, would be used as a secret factory by the Plessey defence electronics company).
12. Harry Beck, ‘Underground Lines’, 1945 - Beck’s final map to be published during the Second World War, with a note about the closure until further notice of Aldwych Station and the suspension of services between Earls Court and Willesden Junction and between Addison Road and Latimer Road.
13. Harry Beck, ‘Underground: Diagram Of Lines’, 1946 - one of the first tube maps to be published after the end of the Second World War, showing proposed extensions to the Northern and Central lines, some of which would never be completed.
14. Harry Beck, ‘Underground: Diagram Of Lines’, 1947 - the Central line now extends east to Leytonstone and west to Greenford.
15. Harry Beck, ‘London Railways Transport: Diagram Of Lines’, 1948 - this is the last map not to show the Circle line in yellow, with, instead the Inner Circle distinguished from the rest of the District line by green lines outlined in black.
16. Harry Beck, ‘Railways: Diagram Of Lines’, 1949 - the first map to show the Circle line in yellow and to show the Metropolitan line in magenta, once more, to distinguish it from the District line. Harry Beck considered this to be his best work, according to his biographer, Ken Garland.
17. Harry Beck, ‘Railways: Diagram Of Lines’, 1950 - with proposed extensions to the Northern, Central, and Bakerloo lines.
18. Harry Beck, ‘Railways: Diagram Of Lines’, 1951 - with the proposed extensions to the Bakerloo and Northern lines no longer shown, deemed not to be financially viable.
19. Harry Beck, ‘Railways: Diagram Of Lines’, 1953 - this example is virtually identical to the 1951 edition, with few extensions made to the Underground, amid post-War austerity.
20. Harry Beck, ‘Railways: Diagram Of Lines’, 1954 - with a new shape to the River Thames.
21. Harry Beck, ‘Railways: Diagram Of Lines And Station Index’, 1955 - the first map to include a grid and an index of all stations on the reverse.
22. Harry Beck, ‘Railways: Diagram Of Lines And Station Index’, 1956 - with, as the 1955 edition, a background grid and index.
23. Harry Beck, ‘Underground: Diagram Of Lines And Station Index’, 1957 - the roundel logo has changed from “Railways” to “Underground”.
24. Harry Beck, ‘Underground: Diagram Of Lines And Station Index’, 1958 - virtually identical to the 1957 edition.
25. Harry Beck, ‘Underground: Diagram Of Lines And Station Index’, 1959 - one of the last editions of the trifold tube map to be designed by Beck. The River Thames is now named on the map.
26. Harry Beck, ‘Underground: Diagram Of Lines And Station Index’, 1960 - the final edition of the trifold pamphlet maps designed by Harry Beck for the London Underground.
27. Harold Hutchison, ‘Underground: Diagram Of Lines And Station Index’, 1961 - the first tube map designed by Hutchison, with London Underground interchange stations marked with circles and British Railway interchange stations marked with squares. Sunday and off-peak weekday station closures are also marked.
28. Harold Hutchison, ‘Underground: Diagram Of Lines And Station Index’, 1962 - virtually identical to the 1961 edition.
29. Harold Hutchison, ‘Underground: Diagram Of Lines And Station Index’, 1963 - Hutchison’s final tube map.
30. Paul E. Garbutt, ‘Underground: Diagram Of Lines And Station Index’, 1964 - Garbutt’s first tube map, with London Underground interchange stations marked with a circle and British Railway interchange stations marked with a circle with an internal dot.
31. Paul E. Garbutt, ‘Underground: Diagram Of Lines And Station Index’, 1965 - with the Victoria line underway, and the section between Finsbury Park and Drayton Park closed during its construction marked with a plus-sign.
32. Paul E. Garbutt, ‘Underground: Diagram Of Lines And Station Index’, 1966 - virtually identical to the 1965 edition.
33. Paul E. Garbutt, ‘Underground: Diagram Of Lines And Station Index’, 1967 - virtually identical to the 1966 edition.
34. Paul E. Garbutt, ‘Underground: Diagram Of Lines And Station Index’, 1968 - with the Victoria line now opened, between Walthamstow Central and Highbury & Islington, and its projected route from Highbury & Islington to Victoria illustrated with dashed lines.
35. Paul E. Garbutt, ‘Underground: Diagram Of Lines And Station Index’, 1969 - the first tube map to show the newly-opened Victoria line, running all the way from Walthamstow Central to Victoria.
36. Paul E. Garbutt, ‘Underground: Diagram Of Lines And Station Index’, 1970 - British Rail interchange stations are now shown with the “double arrow” British Rail logo.
37. Paul E. Garbutt, ‘Underground: Diagram Of Lines And Station Index’, 1971 - the Victoria line is now shown as extending south to Brixton.
38. Paul E. Garbutt, ‘Underground: Diagram Of Lines And Station Index’, 1972 - with the London Underground logo now appearing as an all-red roundel.
39. Paul E. Garbutt, ‘Underground: Diagram Of Lines And Station Index’, 1973 - Strand station is marked through with a cross, with a note that it will be closed from June 1973 until 1976.
40. Paul E. Garbutt, ‘Underground: Diagram Of Lines And Station Index’, 1974 - with a note “Strand station closed for rebuilding”.
41. Paul E. Garbutt, ‘Underground: Diagram Of Lines And Station Index’, 1975 - showing the planned extension of the Piccadilly line from Hatton Cross to Heathrow Central.
42. Paul E. Garbutt, ‘Underground: Diagram Of Lines And Station Index’, 1976 - Charing Cross station has been renamed as Embankment.
43. Paul E. Garbutt, ‘Underground: Diagram Of Lines And Station Index’, 1977 - showing the North London Line, running from Richmond to Broad Street.
44. Paul E. Garbutt, ‘Underground: Diagram Of Lines And Station Index’, 1978 - with the extension of the Piccadilly line from Hatton Cross to Heathrow Central now opened, and a section of the Jubilee line, from Baker Street to Trafalgar Square, shown as under construction.
45. Paul E. Garbutt, ‘London Tube: Diagram Of Lines’, 1979 - the last tube map to be produced by Garbutt, showing the Jubilee line, now running from Stanmore to Charing Cross.
46. London Underground, ‘Pocket Map’, 1985 - with an index of stations, including a key to explain which stations have car parks and which bicycle storage facilities, on the reverse.
47. London Underground, ‘Tube Map’, 1995 - showing the proposed extension of the Jubilee Line from Green Park to Stratford.
48. London Underground, ‘Tube Map’, 2005 - featured on the cover is ‘You Are in London’ by Emma Kay (2004), the image commissioned by London Underground’s Platform for Art programme, in collaboration with Frieze Art Fair.
49. London Underground, ‘Tube Map’, 2015 - featured on the cover is ‘Design for a magnificent London Underground Grand Pendulum in gilt bronze’, by Pablo Bronstein (2015).
50. London Underground, ‘Tube Map’, 2025 - featured on the cover is ‘Map Projections’, by Agnes Denes (2025).
BECK, Harry
Map of London’s Underground Railways. A new design for an old map. We would welcome your comments. Please write to Publicity Manager, 55, Broadway, Westminster, S.W.1.
Publication
London Transport, 55, Broadway, Westminster, S.W.1, [January, 1933].
Description
Chromolithograph plan, title, list of places of interest and theatres to verso.
Dimensions
142 by 202mm (5.5 by 8 inches).
£3,000
First state of Beck’s iconic tube map
A fine example of Beck’s iconic map of the London Underground System. The map was designed by the 29 year-old engineer Harry Beck. Abandoning the restrictions of a geographically correct layout, the map actually constitutes a diagram of the network, showing relationships rather than distances to scale. By using only verticals, horizontals and diagonals, and adopting a clear colour scheme, Beck created a design classic, both easy to use and aesthetically appealing. After the positive public response to the limited trial run issued in 1932, the design was formally adopted in 1933, becoming an essential part of London Transport’s campaign to project itself as a modern, rational and efficient system. The design remains in use to this day, having become essential to the comprehensibility of complex transport networks all over the world.
The present example is the first state of the map issued in January of 1933: the interchange stations are marked with a diamond; the Piccadilly Line is under construction between Enfield West and Cockfosters, due to be opened mid-summer of 1933.
[?MARKE, John]
[Brass Astrolabe and Slide Rule].
Publication [1678].
Description
Brass astrolabe, the front of the plate engraved for a universal astrolabe with De Rojas projection, graduated regula and cursor, below the throne a table of 24 stars and a perpetual calendar for Leap Years and Epact, dated 1678; the reverse of the plate with scales for a circular slide rule with scales for tangents, sines and numbers, two rotating index arms.
Dimensions
713 by 659mm (28 by 26 inches).
£500,000
One of the largest and grandest computational devices made in the seventeenth century.
The so styled “Panchronologia” combines one of the most ancient of scientific instruments, the astrolabe, with one of its most modern (for the time), the slide rule. At 26 inches (66 cm) in diameter and weighing 23 lbs (10.4kg) it is not only one of the largest astrolabes ever produced but arguably the largest computational device to have survived from the seventeenth century, and thus a hugely important work in the history of computing.
The Astrolabe
The astrolabe some times called the slide rule of the heavens, traces its history back to Hellenistic times. The smart phone of it’s day it could perform numerous functions including calculating the time day or night, determine your position, show the movement and identify heavenly bodies, cast horoscopes, help you navigate the oceans, and survey your land.
The astrolabe is on a De Rojas or orthographic projection. The De Rojas is a form of universal projection, i.e. one that can be used at any northern latitude, unlike their traditional cousins which were bound to a particular latitude. Such universal astrolabes had been pioneered by Islamic instrument makers in the twelfth century, but were made popular in the Europe in the sixteenth century when De Rojas published his ‘Commentariorum in astrolabium’, in Paris, in 1551.
To the upper part below the throne is a list of 24 stars marked a-z:
a - Aliot;
b -Cin: Andr
c - Spica [Virgo]
d - Cap [Aries]
e - Arctu
f - Os: Ceti
g - Corona
h - Cor [Scorpio]
i - Ocul. [Taurus]
k - Hircus
l - Pes: Ori S.
m - Cin Orio.
n - Auriga
o - Lyra
p - Can. ma:
q - Can: mi: Aquila
r - Aquila
s - Corn: VS.
t - Cignus
u - Cor: hy:
w - Cor: [Leo]
x - Fomaha
y - Caud [Leo]
z - Ala peg.
Below this a perpetual calendar for Leap Years, and Epact (age of the moon at the beginning of the year), dated 1678.
The instrument is bisected by a graduated regula and cursor.
The Slide Rule
A Brief History
The slide rule was central to the practice of mathematics, from its invention at the beginning of the seventeenth century, to its hasty demise at the hands of the pocket calculator some 340 years later. Its invention by William Oughtred (1574-1660), in 1632, would revolutionises the area of computing, allowing the user to perform quickly complex computations; its use was not only mathematical but practical, with rules designed for engineers, brewers, printers, customs officers, shipwrights, and astronomers among many others. They were even used during the Cold War to calculate radiation exposure over time, and Buzz Aldrin is said to have used one for last minute calculations before landing on the moon, though suggestions that his failed attempts to put it back in his pocket was the reason he was second out of the lander have not been verified.
In its purest form, two logarithmic scales are placed next to each other on two rules, enabling calculations to be made when sliding the rules past each other, hence slide rule. The earliest extant example of such an instrument (though not the instrument itself - which is now lost) is housed the in Macclesfield collection at the University of Cambridge Library, where a counter proof print of Elias Allen’s (1588-1653) instrument is attached to a letter from Oughtred to Allen, dated 1638. Oughtred laments to Allen that he is yet to have one made.
However, the very first slide rules were circular, as here. The earliest extant example of such an instrument was produced by Elias Allen - him again - and although not dated, is believed to have been produced in around 1634. It currently resides in the History of Science Museum, Oxford (HSM 40847). The earliest dated circular slide rule, marked 1635 (though lacking the rule) and signed by the Oxford instrument maker Johannes Hulett, is in the British Museum (BM 2002,0708.1).
Slide Rules on Astrolabes
It would seem from our research that it took a while before slide rules were added to astrolabes (though further study is required). The earliest example we were able to trace is housed in the National Maritime Museum (NMM AST0567). The astrolabe was originally made for Edward VI around 1552 by the instrument maker Thomas Gemini. Over one hundred years later, Henry Sutton (c.1635-65), the pre-eminent instrument maker of his day (and John Marke’s master) engraved inside the mater - which was originally blank - a circular slide rule, signed and dated 1655. A rather stylish seventeenth century retrofit.
The circular slide rule on the present instrument is clearly the largest ever produced in the seventeenth century, and certainly the largest ever on an astrolabe. The two rotating index arms are marked for tangents, sines, and numbers i.e. in order to perform complex trigonometrical calculations. One assumes this was in order to calculate the accurate positioning of celestial bodies where triangulation was essential. Its sheer size allowed for an unprecedented number of gradations, making the most accurate slide rule of the time, and allowing the user of the instrument unmatched precision.
Attribution, Association, and Date
One of the most curious aspects of the instrument is that it’s neither signed nor dated. However, documents in the Archer-Houlbon Archive at Welford Park, do shed some light on to both aspects.
They reveal that the object was sent on a four year loan to Professor Karl Pearson F.R.S. (1857-1936) at University College London, alongside a now lost manuscript which bore the title ‘Panchronologia’ and was dated 1672/3. The letters confirm that the ‘Panchronologia’ was first cleaned in December 1900 and that Pearson appears to have been more interested in the face with the slide rule than the astrolabe: when he exhibits it at the Royal Society it was described as the former.
Furthermore, he writes that he compared the handwriting of the manuscript to that of Sir Isaac Newton (1642-1726) but that there was no match to indicate his involvement – his investigation stems from the familial tradition that asserted the manuscript and astrolabe were passed down the generations from Newton himself, to whom they were related.
A similar, but smaller, 17 inch (43 cm) universal astrolabe at the History of Science Museum in Oxford (HSM 51786) is signed and dated 1659 by Henry Sutton (c.1635-65). Indeed, it is tempting to speculate that Sir John Houblon (1632-1712) may have even known Sutton since he lived on Threadneedle Street, where Sutton had his workshop, although no known documentation exists to confirm the acquaintance. What is more concrete however is that the current astrolabe is clearly related to that in Oxford. Although dated thirteen years after Sutton’s death, the
table of stars on the 1678 astrolabe includes and expands upon those on the earlier instrument. Further a copying error on the perpetual calendar attest to this relationship: a ‘78’ on the Oxford astrolabe is punched incorrectly with the ‘8’ on its side resembling ‘00’; this is copied onto the larger astrolabe’s perpetual calendar as ‘700’. The maker of the instrument in 1678 either had access to the Sutton astrolabe or the counter proof, also preserved in Oxford (HSM 56420).
The most likely candidate to have had that access to the master maker’s instruments are amongst one of Sutton’s five recorded apprentices: specifically John Marke (fl. 1664-79) who caught the attention of John Collins (1625-83) when he wrote that “We hope he may prove as good a Workeman as his deceased Master”. From his surviving instruments, the visible similarity in the style of engraving mixed with the use of smaller punched numbers is striking. He is also known in 1673 to have engraved a new plate for the then century old “Great Astrolabe” (University of St. Andrews ID PH201) by Humphrey Cole (d 1591), which is the only other extant English astrolabe on this scale, having a diameter of 24 inches (61 cm).
Conclusion
Although astrolabes had a variety of functions the sheer size of the present instrument, its grand title ‘Panchronolgia’ (All Time Calculator), the perpetual calendar, together with its use of the universal projection would suggest its primary function was the precise calculation of the position of the heavenly bodies over the previous and coming years i.e. as the most accurate calendar of its day. A function greatly reinforced by the addition of the huge circular slide rule on the reverse.
This would be the last great flowering of the astrolabe in the western world, with the instrument superseded by the scientific advances of the coming century. The slide rule on the other hand would last for a another 300 years, until 1972 when Hewlett-Packard produced the first pocket calculator.
Provenance
Sir John Houblon (1632-1712), thence by descent. Exhibited: London: Royal Society Soirée, 14 May 1902.
CARY, [John]
[Waywiser].
Publication
London, [?188, the Strand] [c1780].
Description
Signed to dial ‘Cary, London’, with engraved brass dial divided for furlongs, miles, poles, and yards, six-spoke wheel with steel rim tread, square mahogany forked body, hoop handle, on modern brass and wood stand.
Dimensions (height) 1300mm (51.25 inches)
£9,000
A Cary Waywiser
The origins of mechanically measuring and recording distance can be traced speculatively to 336-323 BC when Alexander the Great employed bematists for his campaign into Asia. As Donald W. Engels theorises in his publication, ‘Alexander the Great and the Logistics of the Macedonian Army’, “The accuracy of the measurements implies that the bematists used a sophisticated mechanical device for measuring distances, undoubtedly an odometer such as described by Heron of Alexandria.”
The re-introduction of this process in the seventeenth century, with the development of the waywiser, accounted for an influx of cartographic accuracy, and paved the way for the large-scale surveys of the 18th and 19th centuries. Each revolution of the wheel measured a set distance, while a counter kept track of the number of revolutions, thus allowing the surveyor to walk from one place to another and gain an accurate measurement of the distance in between.
John Cary (1754-1835) served his apprenticeship as an engraver in London, before setting up his own business in the Strand in 1783. He soon gained a reputation for his maps and globes. His atlas, ‘The New and Correct English Atlas’, published in 1787, became a standard reference work in England. In 1794 Cary was commissioned by the Postmaster General to survey England’s roads. This resulted in Cary’s ‘New Itinerary’ (1798); a map of all the major roads in England and Wales. He also produced Ordnance Survey maps prior to 1805. In his later life he collaborated on geological maps with the geologist William Smith. His business was eventually taken over by G. F. Cruchley.
ADAMS, Dudley
A New Globe of the Earth by Dudley Adams [and Celestial Globe].
Publication [London] Dudley Adams, J. Mynde Sc. [engraver], [c1795-1808, date removed in the plate].
Description
A pair of terrestrial and celestial globes, each with 12 hand-coloured engraved paper gores, over a papier mâché and plaster sphere, each globe with brass meridian ring, mounted on papier mâché horizon ring, raised on four quadrants, with wooden tripod stand.
This pair of globes are a later issue of Dudley’s 1808 globe, with the date removed in the plate.
Biography
Dudley Adams (1762-1830) was the son of George Adams (c1704-1773). Dudley Adams’s brother, George Adams, (1750-1795) took over the family business after the death of their father, and Dudley Adams worked independently at 53 Charing Cross, where he published new editions of his father’s 305 and 460mm (12 and 18 inch) globes. In 1796, Dudley returned to Fleet Street and continued to operate there before becoming bankrupt in 1817.
The Adams firm does not appear to have ever designed a pocket globe of its own, but rather acquire the copper plates of John Senex, and thereafter produced versions of his pocket globe to be used in their tellurium. Dudley also acquired the copper plates for a pocket globe of James Ferguson, dating to 1756, which he updated and replaced Ferguson’s name with his own.
Geography
The cartography is based on Ferguson’s 1756 globe. There have also been several additions, including the tracks of “Cook’s going out 1776” with the “Endeavour” and “C.n King’s return 1780”, and improvements to the coastlines of Australia and New Zealand according to Cook’s discoveries. “New South Wales”, “Botany Bay” and “Hawaii” are now labelled. The west coast of America has been filled in above California to include “Alaska” and “Behring”and “English Colonies” are identified. All of the above additions appear in an Adams globe dated 1795. The present globe also includes the identification of “English colonies” in North America, suggesting it is a suggesting it is a later version, although it is undated.
Astronomy
The celestial gores are the same as Adams’s 1808 globe, which in turn followed the cartography of Ferguson’s 1756 globe.
MINSHULL, [George] [after LANE, Nicholas; ADAMS, Dudley and FERGUSON, James]
Minshull’s.
Publication [London, c1813].
Description
Globe, 12 hand-coloured engraved paper gores, clipped at 70 degrees latitude, with two polar calottes, over a papier mâché and plaster sphere, paste-over imprint to cartouche, varnished, housed in original shagreen over paste-board clamshell case, with hooks and eyes, lined with two sets of 12 hand-coloured engraved celestial gores.
Dimensions
Diameter: 70mm (2.75 inches).
References
Dekker, pp.393-394; Sumira 35 and 45; Worms and Baynton-Williams, p.451.
£15,000
A toymaker’s globe
Biography
George Minshull (fl1800-1835) was a toymaker and carver. Although based in Birmingham, there was a “George Minshull & Son” registered in Hatton Garden in London in 1814, suggesting the globe was sold there. It was common for small cartographic items and scientific instruments to be sold alongside toys.
Though the globe bears Minshull’s name it is actually the work of Nicholas Lane (fl1775-1783) whose business was particularly associated with pocket globes, and seemed to have sold globes wholesale, to retailers such as Linshull. Little is known about Lane’s output, but Dekker suggests that his three inch globes were produced from the earlier works of James Ferguson and Dudley Adams. When Dudley went bankrupt in about 1810, the copper plates appear to have come into the hands of the Lane firm, where the old cartouche was completely erased in favour of a new circular one. However, the name of the engraver, J. Mynde, was kept just below the cartouche. Later on, after 1820, Lane would erase Mynde’s name from the plates.
Lane not only produced globes under his own name but also sold them wholesale, as here: with Minshull’s name pasted over the title.
Geography
Australia is well delineated with “New South Wales” labelled along with “Botany Bay” and “Port Jackson” noted. The Bering Straits are named. India is labelled as “Hindoostan” with “Tartary” in the north. To the west coast of America, “California” is labelled along with “New Albion” and “Nootka Sound”, the scene of the Nootka Crisis of 1790.
Astronomy
The celestial gores are taken from the Adams-Ferguson plates, but includes Lane’s added hour angles along the equator in the southern hemisphere and a zodiacal belt along the ecliptic.
MINSHULL, George after LANE, Nicholas
Minshull’s.
Publication [London], 1816.
Description
Globe, 12 hand-coloured engraved paper gores, clipped at 70 degrees latitude, with two polar calottes, over a papier mâché and plaster sphere, paste-over imprint to cartouche, varnished, housed in original shagreen over paste-board clamshell case, with hooks and eyes, lined with two sets of 12 hand-coloured engraved celestial gores.
Dimensions
Diameter: 70mm (2.75 inches).
References
Dekker, pp.393-394; Sumira 35 and 45; Worms and Baynton-Williams, p.451.
£15,000
A toymaker’s globe
Biography
George Minshull (fl1800-1835) was a toymaker and carver. Although based in Birmingham, there was a “George Minshull & Son” registered in Hatton Garden in London in 1814, suggesting the globe was sold there. It was common for small cartographic items and scientific instruments to be sold alongside toys.
Geography
Minshull’s globe is an updated version of Thomas Lane’s issue of his father’s pocket globe. Minshull was one of several makers who reissued Lane family globes - his imprint has been pasted over the original. Nicholas Lane’s pocket globe, with completely new terrestrial plates, was first issued in 1779. His son, Thomas, updated the plates in 1807 and sold them wholesale. The present globe is based on Thomas’s updated plates.
“New South Wales, Botany Bay and Cape Byron are depicted in New Holland (Australia), and “Buenos Ayres” (Buenos Aires) appears in South America. Two years later there were more changes: Dimens Land (Tasmania) is separated from New Holland by the Bass Strait; Port Jackson (Sydney) is added to the eastern coast of the mainland; and Sharks’ Bay and ‘South C.’ are newly marked on the western side. The Antipodes of London are also shown. In northwest America, “New Albion” and the “Stony Mountains” (the Rockies) have been added. Curiously, the date of Captain Cook’s death, 14 February 1779, is another late addition squeezed in below the Sandwich Islands” (Sumira).
By 1816, the date of the globe shown here, the geography has been altered yet again: “At the southern tip of the Californian peninsula, “C. S. Lucas” (Cape San Lucas) is now shown... “Dampier’s Anchor”, where William Dampier first reached Australia, is marked off the north west coast of New Holland, and we see a mysterious “Labyrinth” [The Great Barrier Reef] off the north-east coast” (Sumira).
Astronomy
The celestial gores, which were acquired by Nicholas Lane from Richard Cushee sometime in the mid-eighteenth century, are geocentric in orientation. The difference is most noticeable in the orientation of Ursa Major, with the bear facing the other direction. The deep green colour is characteristic of Lane globes. Minshull has put his own stamp on the celestial gores by only colouring the constellations in green.
LANE, [Thomas after ADAMS, Dudley; and FERGUSON, James]
Lane’s Improved Globe.
Publication London, [c.1833].
Description
Terrestrial globe lined with 12 handcoloured engraved paper gores, one calotte at north pole, over a papier mâché and plaster sphere, varnished, housed within original shagreen over paste-board clamshell case, with hooks and eyes, lined with two sets of 12 hand-coloured engraved celestial gores, varnished.
Dimensions
Diameter: 75mm (3 inches).
References Dekker, pp.393-394; Sumira 35 and 45; Worms and Baynton-Williams, p.387.
£15,000
The Swan River Colony
A magnificent Lane’s terrestrial pocket globe.
Biography
The present globe is the work of Nicholas Lane (fl.1775-1783) whose business was particularly associated with pocket globes. Little is known about Lane’s output, but Dekker suggests that his three inch globes were produced from the earlier works of Ferguson and Dudley Adams. When Dudley went bankrupt in about 1817, the copper plates appear to have come into the hands of the Lane firm, then run by Thomas Lane (fl.18011829), where the old cartouche was completely erased in favour of a new circular one. However, the name of the engraver, J. Mynde, was kept just below the cartouche. Later on, after 1820, Lane would erase Mynde’s name from the plates.
Geography
There have been several additions to this “improved” globe: compass points to the west of Cape Horn, monsoons in the Indian Ocean and the Great Wall of China. “Enderby’s Land 1833” is marked (part of Antarctica) discovered and named by the John Briscoe.
The tracks of Captain James Cook’s voyages are shown and the coastline of Australia drawn according to his reports. The most notable addition is the marking on the west coast of Australia of the “Swan R. Settlement”.
The Swan River Colony was the brainchild of Captain James Stirling who in 1827, aboard HMS ‘Success’, had explored the Swan River. On his return to London he petitioned Parliament to grant land for a settlement along the river. A consortium was set up by the MP Potter McQueen, but was disbanded after the Colonial Office refused to give them preference over independent settlers. One of the members of the consortium, Thomas Peel, did, however, accept the terms set down by Colonial Office. In late 1829, Peel arrived with 300 settlers and was granted 250,000 acres. The first reports of the new colony arrived back in England in late January 1830. They described the poor conditions and the land as being totally unfit for agriculture. They went on to say that the settlers were in a state of “near starvation” and (incorrectly) said that the colony had been abandoned. As a result of these reports, many people cancelled their migration plans or diverted to Cape Town or New South Wales.
Astronomy
The celestial gores, which were acquired by Nicholas Lane from Richard Cushee sometime in the mid-eighteenth century, are geocentric in orientation. The difference is most noticeable in the orientation of Ursa Major, with the bear facing the other direction. All three sets of celestial gores have been coloured differently, in order to highlight different aspects of the heavens.
[Offset staff].
Publication c1850.
Description
£7,500
Surveyor’s offset staff
A finely made example of an offset staff. The instrument consists of a turned wooden pole. At one end is a metal spike so that the pole can be easily driven into the ground. On the other end is a wooden ball with a cross-slight. The instrument was designed to measure off sets, that is, to locate objects that are at a 90 degree angle to the surveying centreline.
Mahogany staff (4 feet 9 inches) with steel shod pointed foot, the pole 1 inch dia., 4 inch dia. hard ball.