Catalogue edited by Arnie Anonuevo, Daniel Crouch, Rose Grossel, Kate Hunter, Ellida Minelli, Mia Rocquemore and Nick Trimming
Design by Ivone Chao
Photography by Louie Fasciolo and Marco Maschiao
Cover: item 16
Terms and conditions: The condition of all books has been described. Each item may be assumed to be in good condition, unless otherwise stated. Dimensions are given height by width. All prices are net and do not include postage and packing. Invoices will be rendered in £ sterling. The title of goods does not pass to the purchaser until the invoice is paid in full.
Printed by Park Communications on FSC® certified paper. Park is an EMAS certified company and its Environmental Management System is certified to ISO14001. 100% of the inks used are vegetable oil based, 95% of press chemicals are recycled for further use and, on average 99% of any waste associated with this production will be recycled. This document is printed on Galerie Matt made of material from wellmanaged, FSC®-certified forests and other controlled sources. The pulp used in this product is bleached without the use of chlorine (ECF).
Abu Dhabi Art Fair 2025
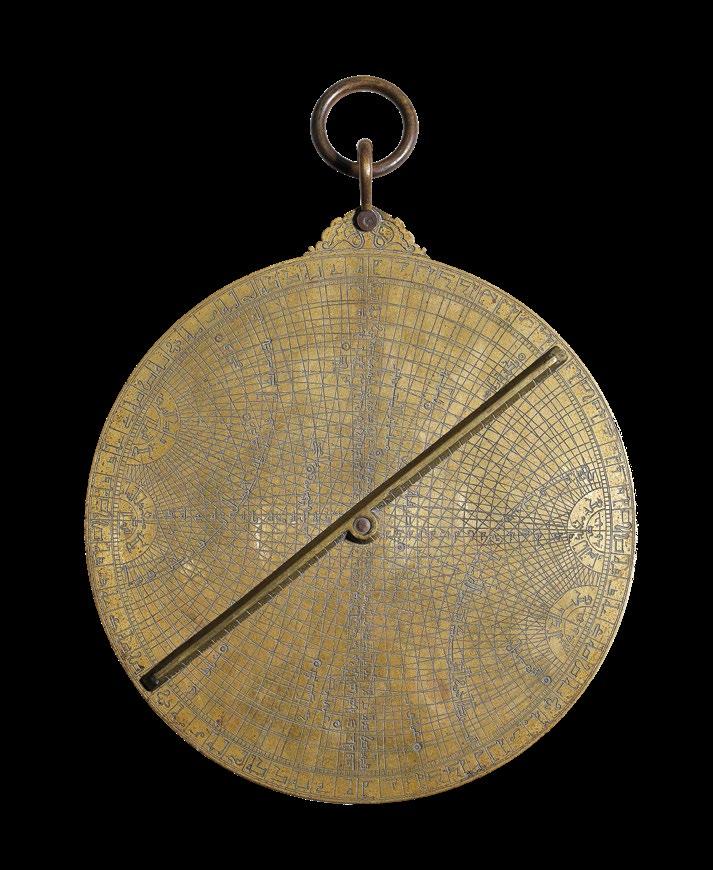
[Anonymous]
[Universal Astrolabe].
Publication [c.1250].
Description
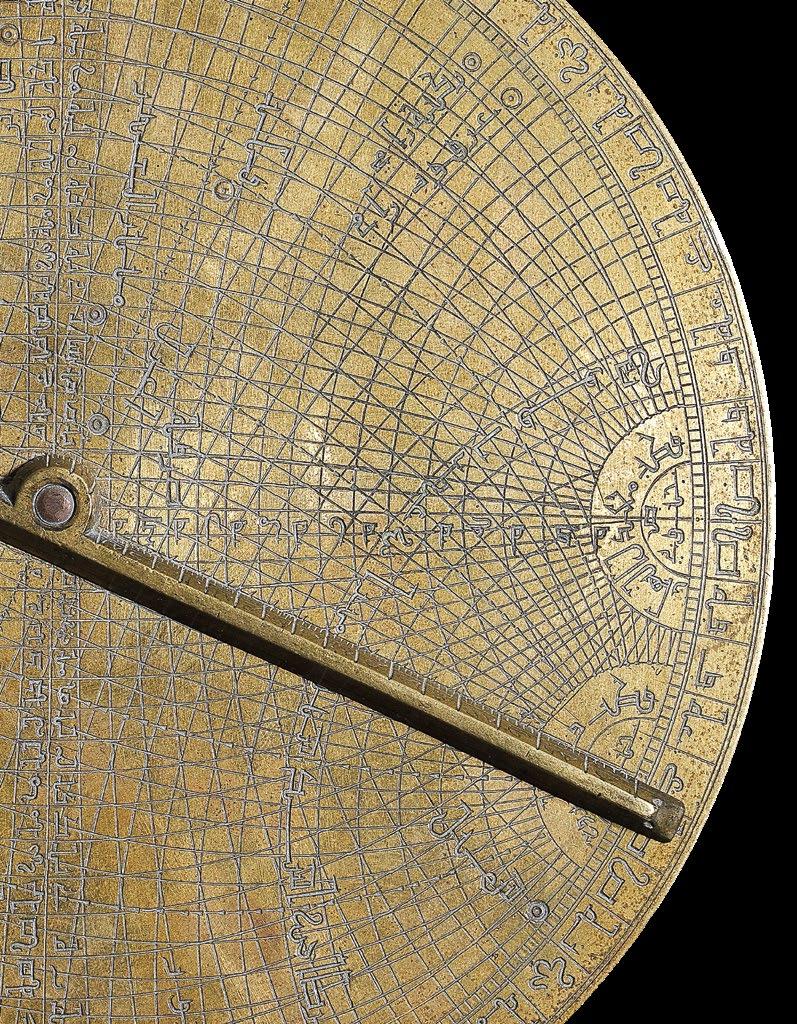
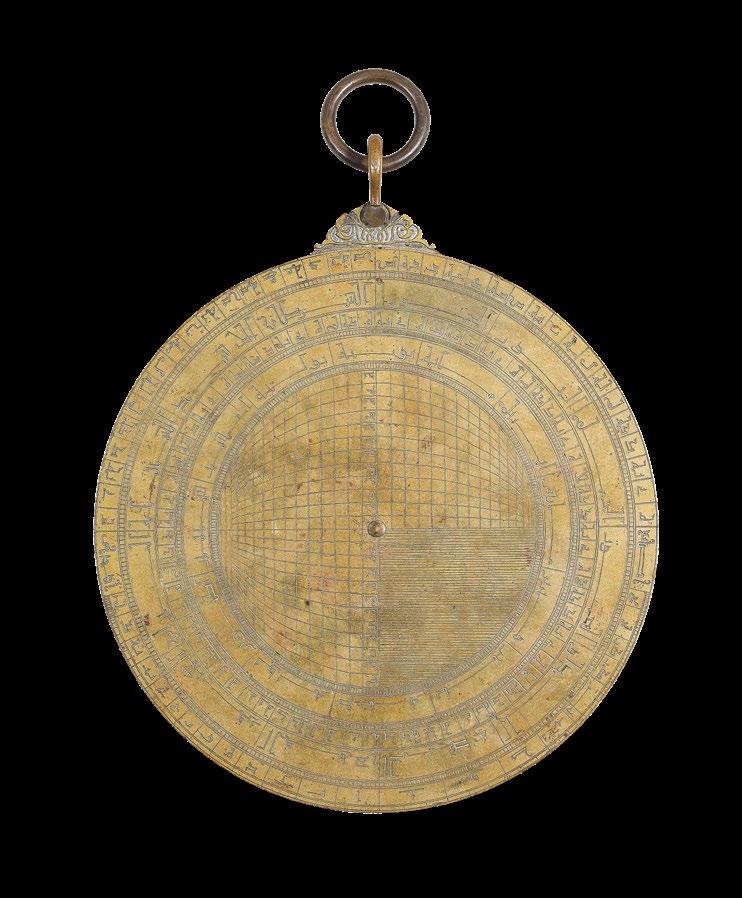
Brass astrolabe, in western kufic script, throne decorated with geometric shapes in different mediums, engraved on recto, but embossed on the verso, a plain shackle with a ring on top is attached to the plate by a pin, the chamfered alidade attached by a central pin.
Dimensions
Diameter: 185mm.
3,600,000 AED
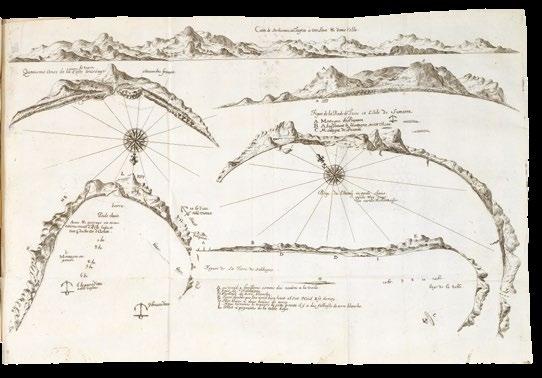
The Saphea - a wonder of Islamic science
A rare and early Islamic universal astrolabe, produced in Al Andalus (Moorish Spain), during the Islamic Golden Age.
The Astrolabe
The astrolabe, sometimes called the slide rule of the heavens, traces its history back to Hellenistic times. The smart phone of its day, it could perform numerous functions: calculate the time of day or night; determine your position; show the movement and identify of heavenly bodies; cast horoscopes; help you navigate the oceans, and survey all the land you can see.
Among numerous other advances in the sciences, and mathematics, the early Islamic scholars were responsible for a spectacular leap forward in astrolabe design - the invention of the ‘universal’ astrolabe - also known as the ‘Saphea’ or catholic astrolabe.
Whereas the classical astrolabe required a specific plate - a disc that would sit in the body of the astrolabe or ‘mater’ - for each latitude, its universal cousin could be used at any given latitude. While the idea of the Saphea originated in Baghdad during the ninth century CE, actual instruments would not be produced until the eleventh century CE in Toledo, Spain.
Spain under Islamic rule was, for the time, a beacon of religious tolerance in Europe, with Muslims, Christians, and Jews, living relatively harmonious, multicultural lives. It was within this culture that one of the greatest mathematicians and instrument makers of their (or any other) generation was born: Abu Ishaq Ibrahim ibn Yahya a-Naqqash al-Tujibi al-Zarqali, better known as Al-Zarqali or al-Zarqalluh (c.420-480 H / c.1029-1087 CE), which literally translates as ‘engraver’, as he was so proficient at the craft. In the west his name would become Latinized as Azarquiel.
Azarquiel devised a new stereographic projection in which he cast both the equatorial and ecliptic coordinate systems on to a vertical plane that cut the celestial sphere at the solstices. Adding a selection of important stars to this grid system produced a universal projection that was valid for every latitude without sacrificing any of the functionality of a standard projection.
Although the new instrument was a significant step forward, it did require the user to have a much better understanding of mathematics in order to use it effectively, and thus the classical astrolabe would continue to be the more popular instrument. This is reflected in the number of surviving examples from this period. The universal astrolabe would not catch on in Western Europe until some 500 years after the first example was made by Azarquiel.
Dating
Although this Saphea is not dated, an approximate date can be ascertained by the Zodiac scale and Julian calendar - to the verso - and the placement of the stars on the projection on the recto.
The scale and calendar show that 0-degree Aries corresponds with approximately 13.8 March. This puts the possible date of construction between 1150 and 1250. The position of the stars corroborates this, with the closest match being from the thirteenth century.
A further comparison was made with two universal astrolabes dating from the thirteenth century: one from 1218/19 by Muammad ibn Fattū al-Khamāi’rī - housed in the Bibliothèque nationale de France (inv. cote Ge A 408)- and another from 1270/71 made by Ibrāhīm al-Dimashqī - which is in the British Museum (inv. 1890,0315.3). The present astrolabe has a very close match with the star placements on both astrolabes. However, the few misaligned stars indicate a later date when compared to the Khamāi’rī astrolabe and earlier when compared to the Dimashqī example. This suggests that the present instrument sits somewhere in between the two i.e. from 1219 to 1270. Therefore a date of around 1250 is not unreasonable.
Attribution
The thirteenth century was a lively period for astrolabe making in the Islamic West i.e. Maghrib and al-Andalus. Khamāi’rī was arguably the most prominent of the instrument makers of his time. At least fourteen astrolabes by his hand survive, albeit most of them are planispheric. However, as he tends to sign his works it would seem unlikely that the present instrument is by him.
Rarity
We are only able to trace six institutional examples of early, i.e. pre-1300, universal astrolabes: Louvre Abu Dhabi; The Observatory Rome; Bibliothèque Nationale, Paris; Institutio Historico de Marina, Madrid; The Victoria and Albert Museum; and The British Museum. A seventh formerly in The Time Museum, Rockford, Illinois, is now in private hands.
Full description of the Astrolabe
Recto
Engraved along the circumference of the recto is four sets of 90-degree scales arranged in four quadrants. Each scale is divided into 5-degrees and labelled with alphanumeric notation (i.e., abjad) and further subdivided into 1-degree. Inside the scales is a double universal astrolabe projection of the same style which was first designed by the eleventh-century Andalusian astronomer al‐Zarqālī known as saphea azarchelis. The first projection
represents the celestial coordinates. The second is superimposed at an angle of approximately 23.5 degrees and represents the ecliptic coordinates.
The equatorial longitudes are labelled in abjad for every 5-degrees from 5- to 180-degree and in reverse 185- to 360-degree along the equator. The equatorial latitudes are also labelled for 5-degrees from the equator to the poles in the order of 5-10-5-20-5-30-… instead of 5-10-15-20-25-…
The poles are inscribed:
The southern celestial pole - Quṭb mu‘addil al-nahār janūbī
The northern celestial pole - Quṭb mu‘addil al-nahār shimālī
On the ecliptic projection the ecliptic and longitude arcs for every 30-degrees are marked with arrow-shaped patterns. The poles are inscribed:
The southern ecliptic pole - Quṭb falak al-burūj janūbī
The northern ecliptic pole - Quṭb falak al-burūj shimālī
The names of the signs of the zodiac are engraved between 35- and 40-degree ecliptic latitude curves on both northern and southern sides.
Sagittarius - Scorpio - Libra - Virgo - Leo - Cancer
There are seventeen stars that are labelled and marked by a small dot inside a circle. These are:
(Starting at northern ecliptic pole towards the ecliptic)
α Lyrae - wāqi‘
α Cygni - ridf
α Bootis - rāmiḥ
β Pegasi - mankib faras
α Aquilae - ṭā’ir
β Persei - ghūl
α Aurigae - ‘ayyūq
? - munīr al-?
(Starting at southern ecliptic pole towards the ecliptic)
α Carinae - Suhayl
α Canis Maioris - ‘abūr
β Sagittarii - ‘urqūb al-rāmī
β Leonis - ṣarfa
α Sagittarii - rukbat rāmī
β Canis Minoris - ghumayṣā
α Tauri - dabarān
α Scorpionis - qalb
α Virginis - a‘zal
Alidade
Attached by a central pin on the recto is a chamfered alidade. On the chamfer is a ruler with 5-unit divisions and 1-unit subdivisions. Each 5-unit is labelled in abjad. Divisions are engraved neatly and correspond well with the engravings on the universal astrolabe projection on the recto. Style of inscription and near-perfect match of the divisions indicate that the alidade is highly likely to be the original.
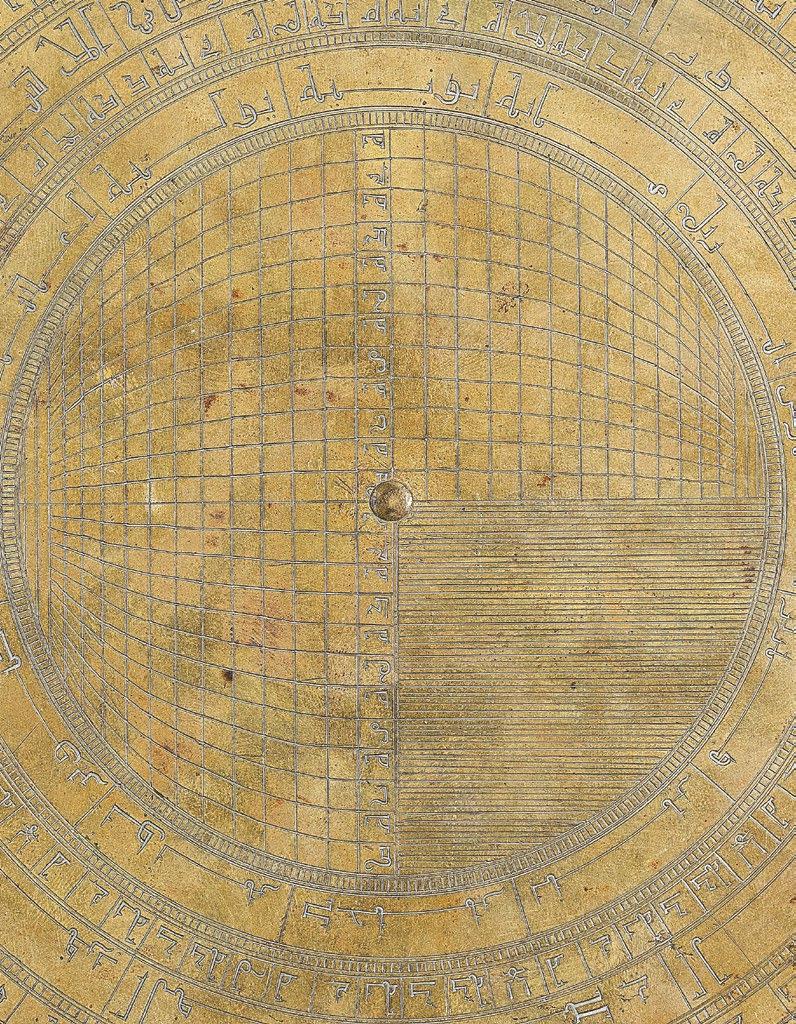
Verso
On the upper half of the circumference is a double 90-degree altitude scale, divided into 5-degree and labelled in abjad, and further subdivided into 1-degree. Lower half of the circumference carries non-linear shadow scales or cotangent scales for 12-base on the right and 7-base on the left. The scale for 12-base is divided and labelled for 3, 6, 9, 12, 17, 22, 27, 39, and 48 units. The scale for 7-base is divided and labelled for 1, 2, 3, 4, 5, 6, 7, 8, 10, 12, 15, 20, and 30 units.
Inside these are two nested circular scales, one for the zodiac calendar and the other for the Julian calendar. The Julian calendar is also divided into five-day intervals and labelled, and further subdivided into one-day intervals.
The inscription for the Julian calendar reads: August - July - June - May - April - March February - January - December - November - October - September
At the centre of the verso is an orthographic projection on three quadrants while the lower right quadrant carries a sine graph (mujayyab) with 59 parallel lines for the sexagesimal (60-base) system. The divisions of the projection are labelled for each 5-degree.
We are grateful to Dr Taha Yasin Arslan, Medeniyet University, Istanbul, for his assistance with this description.
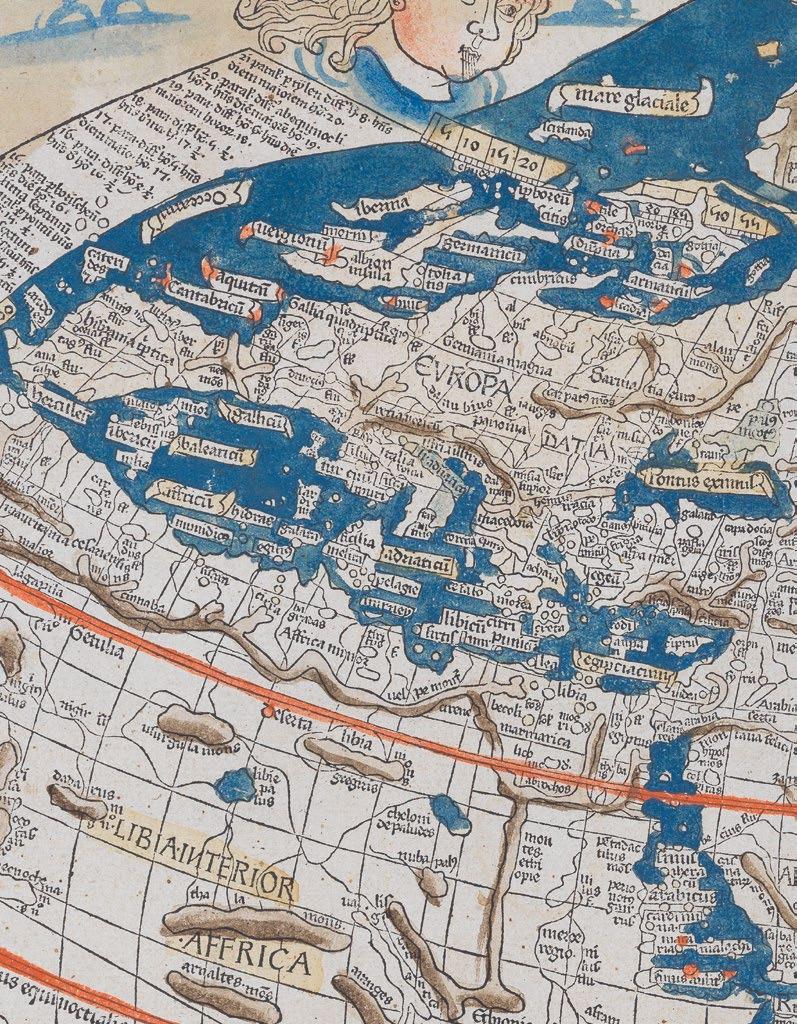
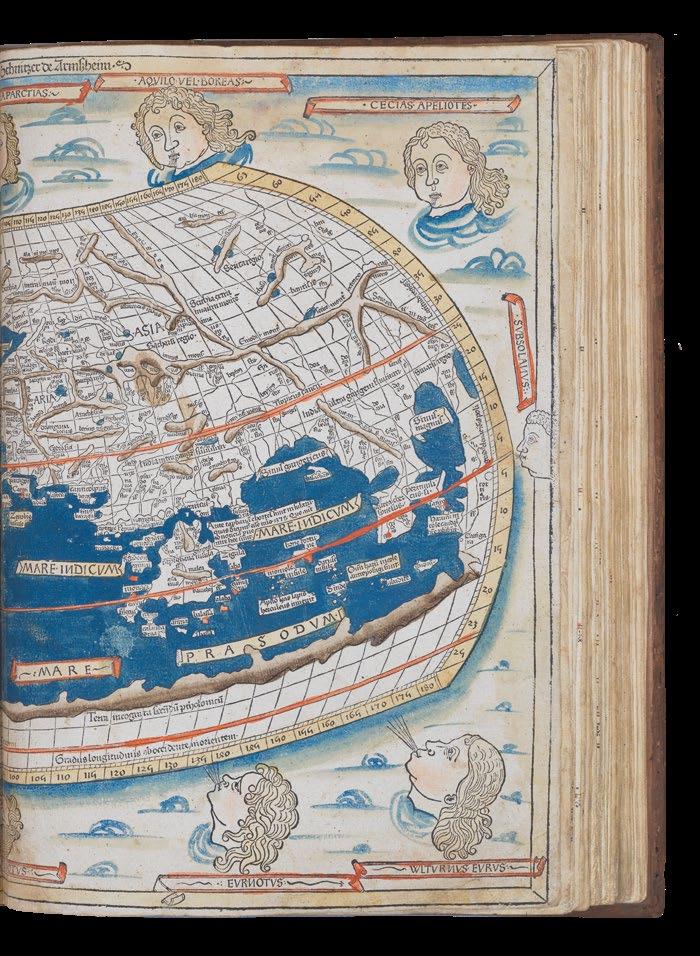
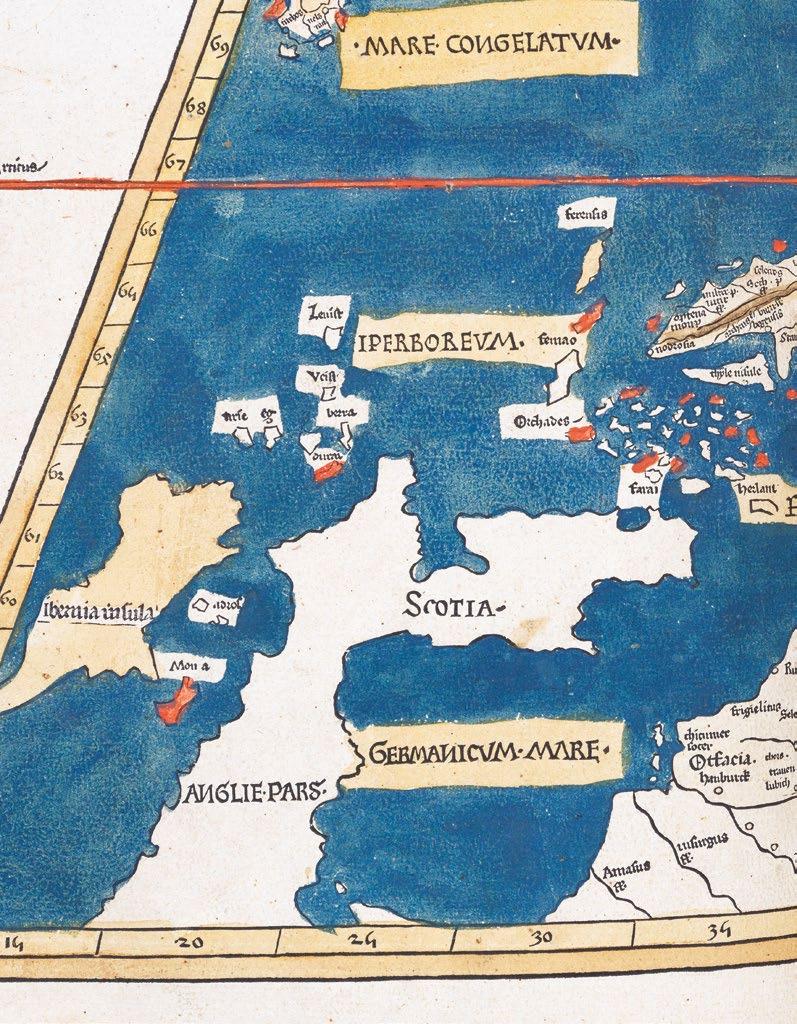
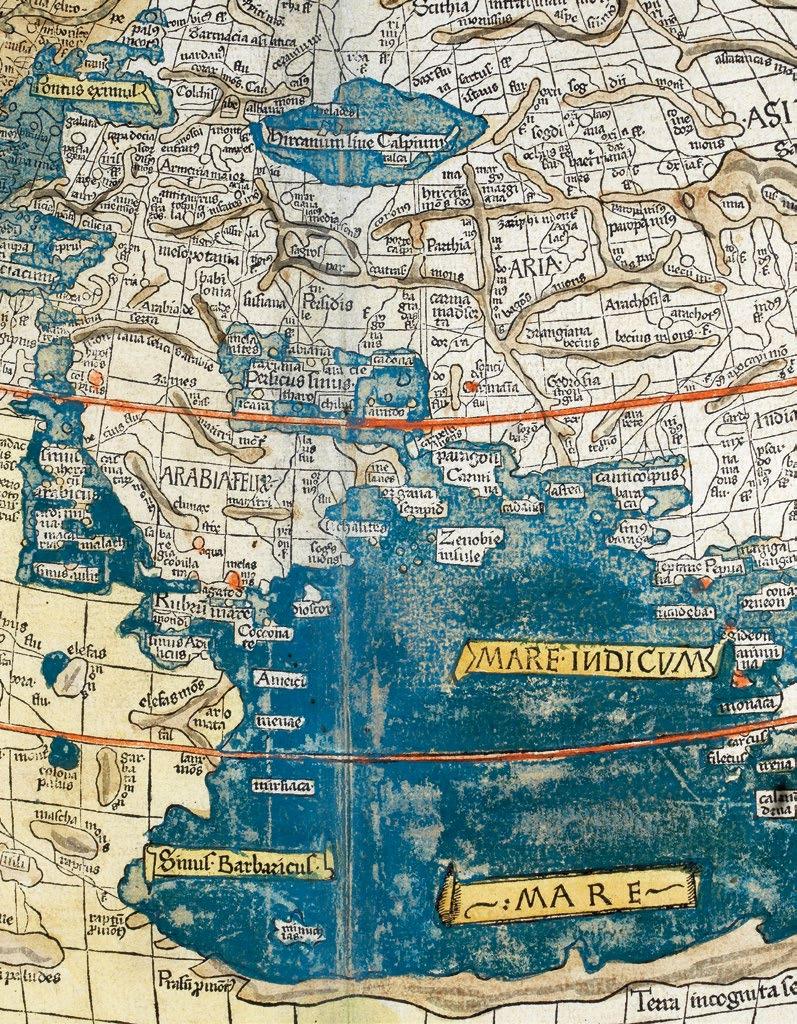
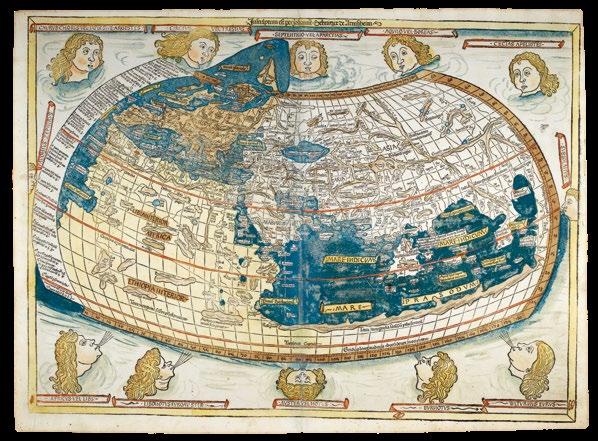
PTOLEMAEUS, Claudius; translated by ANGELUS, Jacobus, and edited by Nicolaus GERMANUS.
Cosmographia.
Publication
Ulm, Lienhart Holle, 16 July 1482.
Description
Folio (428 by 310mm), 102 leaves, doublecolumn, 44 lines and headline, Gothic letter, 32 double-page woodcut maps with fine original hand-colour, 4 woodcut diagrams in the text, 2 large illuminated historiated initials, one showing Donnus Nicolaus presenting his book to Pope Paul II, the other of Ptolemy, 159 other woodcut initials coloured in red, green and ochre, paragraph marks and initial-strokes supplied in ochre, tear to d6, and repaired tear to the map ‘Tertia Africa’, some dampstaining and discolouration throughout, including spotting affecting the final three maps, skilful reinforcement to weakened lower page corners on maps, single leaf free endpaper bearing ownership inscription, re-cased in contemporary doeskin over clasped oak boards, joints reinforced with vellum waste, remnants of one clasp remaining.
[Bound after]: ‘Registrum’ from Johannes Reger’s 1486 edition of Ptolemy’s ‘Cosmographia’,decorated with 17 5- and 6-line manuscript initials in red and blue, 30 leaves bound in 6s (not 8s as is usually the case); 9 leaves in the ‘Registrum’ uncut, tear to d6.
The world Columbus knew – Ptolemy’s Second Projection, and the first map signed by its author
A fine example in a contemporary binding, here bound with Johannes Reger’s ‘Registrum’ made for his 1486 edition of the work.
The text of Claudius Ptolemy’s (c.100-170AD) ‘Cosmographia’ was translated into Latin from the original Greek by Jacobus Angelus (c.13601411) and was first published, in Renaissance times, at Vicenza (1475), Bologna (1477) and Rome (1478). The sumptuous edition published at Ulm in 1482, however, far surpassed all earlier efforts and remains one of the most important publications in the history of cartography. This is the first redaction of the ‘Geographia’ to be printed outside Italy, the earliest atlas printed in Germany, the first to depart from the classical prototype to reflect post-antique discoveries, the first to be illustrated with woodcuts rather than engravings, and the first to contain hand-colored maps, the design and execution of which were ascribed to a named cartographer, and the first to incorporate the five modern maps by Nicolaus Germanus (c.1420-1490). Though printed outside Italy, the paper this magnificent atlas was printed on was imported from Italy, and payment made in part by complete copies of the finished atlas.
The maps
The 1482 edition is the first printed edition to contain the full complement of 32 maps, and its world map, extended to the northwest, is the first printed cartographical representation of Greenland, Iceland and the North Atlantic.
“The artist responsible for the woodcut maps identifies himself at the top of the world map as Johannes of Arnsheim, making it the earliest datable printed map to bear a signature” (Campbell p.137). He has incorporated as his sign a backwards N into the woodcut text on each map.
The Ulm edition, moreover, was the first to depart from the classical prototype by expanding the atlas to reflect post-antique discoveries about the size and shape of the earth. To the canonical twenty-seven Ptolemaic maps were added five “modern maps” of Spain, France, Italy, the Holy Land and northern Europe. The world map is of particular interest as it is the first to be signed, by Johannes Schnitzer (i.e. woodcutter) of Armszheim, who in trade mark fashion has reversed every capital N, and inadvertently provided two Tropics of Cancer. This map is the first to be based on Ptolemy’s second projection, in which both parallels and meridians are shown curved to convey the sphericity of the earth. Armszheim, furthermore, updated the Ptolemaic world picture by incorporating improvements that were probably based on a manuscript of the 1470s by Nicolaus Germanus (c.1420-1490), a Benedictine monk of Reichenbach Abbey in Bavaria, who is depicted in the first illuminated letter of the atlas presenting his book to the dedicatee Pope Paul II. One notable addition is a rudimentary depiction of Scandinavia to the north, within an extension of the map’s
Watermark:
Late fifteenth century Italian watermark of a flower with 7 petals throughout, with the exception of the front endpaper/ “initial blank”, which bears the watermark of an upper case letter “B” on a crowned shield. These were used by the le Bé family of Troyes, in this case “Ioane le Bé”. Three members of the Troyenne papermaking le Bé family bore the Christian name “Jean”: Jean I started his business in 1406. Jean II owned two paper mills around the 1470s, and Jean III lived in Troye in the first half of the 16th century. The le Bé family were accredited papermaker for the Université de Paris from 1520 onwards.
Dimensions 414 by 297mm (16.25 by 11.75 inches).
References
Camptell, T., Earliest Printed Maps, p. 179-210; Schreiber 5032; Skelton, R.A., Bibliographical note prefixed to the facsimile of the 1482 Ulm Ptolemy; P-J Troley, Mémoires historiques et critiques pour l’histoire de Troyes, t.2 p.636.
6,000,000 AED
top border. This is also the earliest printed map to show the northernmost reaches of the Atlantic Ocean. The world map embodies what is perhaps the most readily apparent feature of the Ulm Ptolemy: its beauty.
The text
“The text is the early Latin translation by Jacopo d’Angelo [Jacobus Angelus], and its maps are the reworking of the Ptolemaic corpus by the cartographer Donnus (Dominus) Nicolaus Germanus. Three recensions of Nicolaus’s reworkings have been distinguished: the first, drawn on a trapezoid projection reputedly devised by Nicolaus himself and, therefore, also known as the Donis (Donis = Dominus) projection; the second on a homeotheric projection and with three additional modern maps; and the third on the same projection with further revisions and two additional modern maps. The Ulm Ptolemy derives from the third recension, and thus represents Nicolaus’s most mature work” (Campbell).
Printing history
“That the stock of the 1482 edition was not exhausted by 1486 is indicated by the existence of a number of copies (some in early binding) containing the additional texts printed by Johannes Reger in the latter year for his own edition...” (Skelton) - The present work is just such a book.
“For Leinhart Holle, the handsome edition of the ‘Cosmographia’ which he printed at Ulm in 1482 was an unprofitable investment. Only one more book came from his press; and by 1484 he was out of business and gone from Ulm, and his stock of type, blocks, and printed sheets passed into the hands of Johann Reger, Ulm factor or agent (pro-visor) or Giusto de Albano, of Venice...
Reger lost little time in bringing the ‘Cosmographia’ back on the market. He compiled a gazeteer or geographical index to the text under the title ‘Registrum alphabeticum super octo libros Ptolemei’, to which he prefixed a ‘Nota ad inueniendum igitur regiones’; explaining its purpose and use; and he also obtained, or composed, an anonymous tract entitled ‘De locis ac mirabilibus mundi’... they were printed by Reger in 1486 and inserted into some unsold copies of the 1482 edition...
In the map Europa IV in the 1482 edition, Reger found the Ptolemaic name Chetaori, corresponding to his birthplace Kemnat in Bavaria; he introduced this into Ptolemy’s list of towns in bk. II ch. 10 [not present in this 1482 edition of the main text], and inserted in his “Registrum’ the entry: ‘Chemmat siue chetaori li 2 c 10 ta 4 e Hic iohannes reger duxit origine et ano etatis 32 compposuit hoc register in vlma anno domini 1486”. This is the evidence for Reger’s authorship of the ‘Registrum’, which is otherwise unsigned” (Skelton).
Cladius Ptolemaeus
Claudius Ptolemy was an Alexandrine Greek, and a dominant figure in both astronomy and geography for more than 1500 years. He compiled a mapmaker’s manual usually referred to simply as the ‘Geography’. He demonstrated how the globe could be projected on a plane surface, provided coordinates for over 8,000 places across his the Roman world, and expressed them in degrees of longitude and latitude. Now maps drawn by Ptolemy himself are known to survive, but maps compiled from his instructions as outlined in his ‘Geography’ were circulated from about 1300. This Ulm edition of Ptolemy’s ‘Geography’ is one of the earliest printed.
Provenance
1. Inscribed on front free endpaper “Donnait Le Sr. munery mon beaufrere [given by my brother-in-law Sr. Munery] anno 1672 Morel Senator” 2. Inscribed on d2 “Josephus Mattheus de Morel 1718, Franciseii de Morel”
This is probably André de Morel (Maurel) (1603-1690), Senator in the Parlement de Provence. Morel’s family began their social elevation under Charles d’Anjou (1446-1481) who was also King of Naples and Earl of Provence. It is said that the King put Pierre de Morel in his will and, at his death in 1481, he inherited a part of his library. The family served the French Crown as advisors and officers during wars in Northern Italy and Spain until Henri IV of France. Then in the late 1620’s André de Maurel became a prominent magistrate and member of Parliament of Provence. He ruled his office for 67 years and was known as Senator Morel. His second son, Joseph de Maurel (1658-1717) was Bishop of Saint PaulTrois-Chatêaux between Aix and Valence. His heir and nephew, François de Maurel, Captain in the ‘Regiment de Toulouse’ in 1719, inherited his belongings after his death.
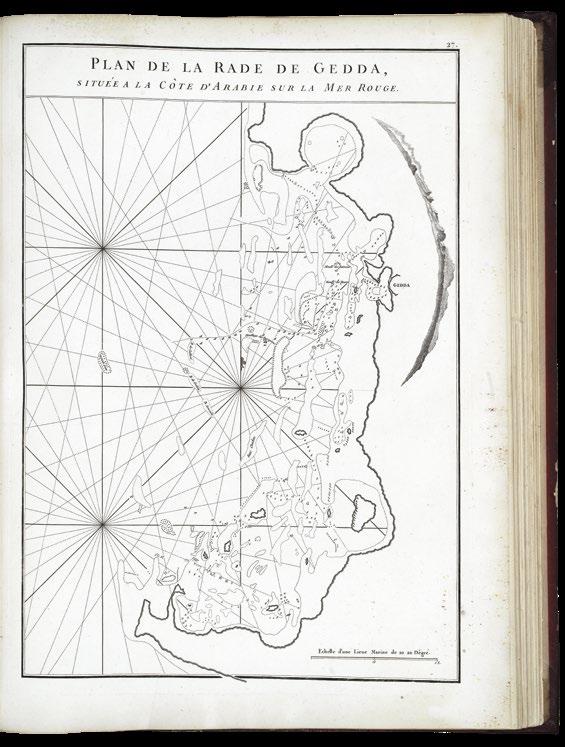
D’APRES DE MANNEVILLETTE, Jean-Baptiste
Le Neptune Oriental, dédié au Roi [with] Supplement.
Publication
Paris & Brest, Demonville & Malassis, [1775 – 1781].
Description
Folio (570 by 470mm), second edition, half-title, one index leaf, 69 engraved maps and charts or coastal views, 32 doublepage and folding, mainly by Alexander Dalrymple, featuring inset plans and relief, rhumb lines, soundings, hazards, shoals, and anchorages, very light marginal toning, occasional dust soiling and spotting, red half morocco gilt over original red glazed paper boards, spine gilt in compartments with floral motifs, slightly rubbed.
References
Phillips, ‘Atlases’, 3166; Howgego, ‘Encyclopediae of Exploration to 1800’ cf. Al-Ankaray p380; Al-Qasimi p212; Tibbetts p157 (nos 264, 265, and 266).
175,000 AED
The greatly enlarged second edition of this rare French Sea Atlas with four maps of the Arabian Peninsula
The greatly enlarged second edition of this rare French Sea Atlas showing the coasts of the East Indies, Indochina and Formosa, Africa, Australia, the Red Sea, and India. It includes some fine maps of the Arabian Peninsula, one covering the central portion of the western coast of present-day Saudi Arabia.
Jean Baptiste Nicolas Denis d’Apres de Mannevillette (1707-1780) was a famous French sailor and hydrographer. He was the son of a French sea-captain and, at the age of twelve, sailed with his father to Bengal.
After his return he studied astronomy and geometry in Paris. During a long career in the French merchant marine, starting as fourth officer in 1726, he visited many parts of the world and collected valuable navigational information. He studied under the famous Guillaume Delisle, the King’s geographer. He experimented with improved scientific instruments and navigational methods. During his voyage to China in 1728 he was the first to use the octant (or Hadley’s quadrant) on a voyage to measure latitudes, and determined longitudes by measuring the angular distance between the moon and sun and succeeded in correcting the latitudes of many place. He first visited the Cape of Good Hope in 1737 while on his way to China as a lieutenant aboard the Prince de Conti. During his many voyages d’Apres de Mannevillette created a number of charts for a hydrographic atlas which, with the support of the Academie des Sciences, was published in Paris in 1745 under the title “Le Neptune Oriental” with 25 maps. The atlas contained charts of the route to China: the Red Sea, the coasts of India, Malaya, the northern parts of Indonesia, Indochina and China.
“The new sea atlas quickly found its way into the pilot cabins of ships of several nations, and its 22 charts were immediately recognised as being superior to all previous maps of Southeast Asian coasts” (Suárez p.238).
In 1745 he published an important collection of sea-charts titled ‘Le Neptune’ oriental which established his reputation as a cartographer and remained authoritative for more than half a century. In 1751 his work on navigational instruments and methods, ‘Description et usage d’un nouvel instrument pour observer la latitude sur mer...’ was published in Paris. It included a discussion of the new English quadrant and various observational methods.
In 1762 the Compagnie des Indes - French East India Companyappointed D’Apres de Mannevillette as director of maps and plans at Lorient, and five years later he was decorated with the order of St. Michael. In 1765 he published his ‘Memoire sur la navigation de France aux Indes’, which was translated into English (1769) and Dutch (1770), and served all who sailed round the Cape to the East. The 1768 edition includes descriptions of Tristan da Cunha, False Bay, and Simon’s Bay.
Mannevillette spent 30 years, often in concert with his friend, and eminent British hydrographer, Alexander Dalrymple, working on the
second edition of his maritime atlas. It was substantially enlarged from the first edition of 1745 and was heavily used throughout the end of the eighteenth and beginning of the nineteenth centuries. Most maps are now corrected with paste-on labels, and among the many new charts prepared by Dalrymple is his famous map of Hong Kong area: ‘Carte d’une partie des Côtes de la Chine et des Isles adjacentes depuis l’Isle nommée la Pierre Blanche, jusqué à celle de l’Artimon’. This milestone chart was based upon Dalrymple’s surveys and soundings taken in 1754, 1759, and 1760. The chart extends from just West of Macao, which is shown, as is ‘Bocca’. Tigris narrows on the Pearl River to the North.
Prominently shown are the islands around present-day Hong Kong with Lantao and Lamma both identified. Hong Kong island is depicted and identified as Fanchinchow with its island nature only tentatively shown. The promontories of Stanley Peak and D’Agular Peaks both tentatively shown in dotted outline.
This comprehensive atlas was used on all French ships for navigating the Indian Ocean. It replaced the “English Pilot” published by John Thornton in 1700 and the charts of the van Keulens, the hydrographers of the Dutch East India Company.
This second edition eventually required a supplement, published posthumously in 1781 and reissued in 1797. The second edition includes some fine maps of the Arabian Peninsular. One of the charts covers the central portion of the western coast of present-day Saudi Arabia. Jeddah, the largest port on the Red Sea and a major gateway to Mecca, is the only city shown. The rest of the detail is confined to the sea, which is filled with rhumb lines, soundings, hazards, shoals, and anchorages.
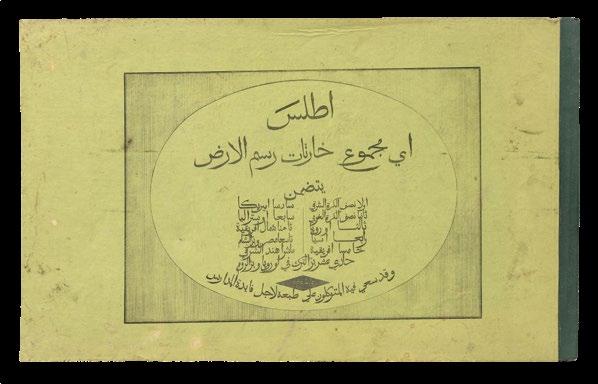
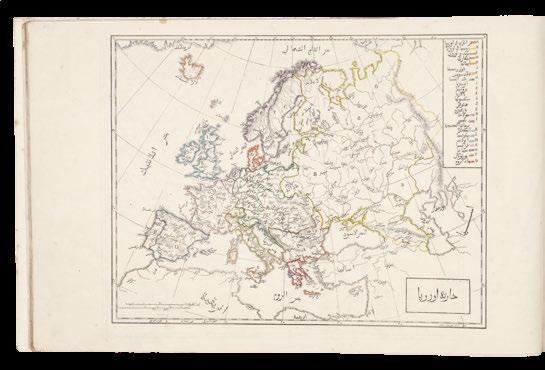
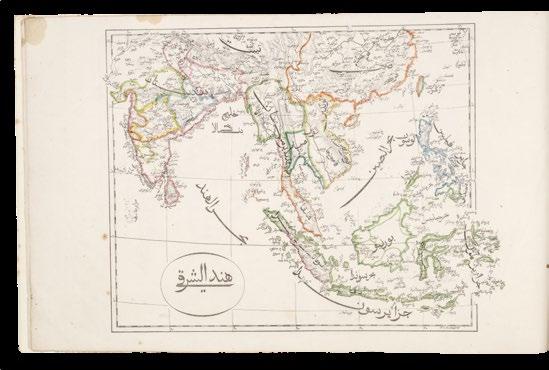
[CHURCH MISSIONARY SOCIETY]
Atlas, ay majmu’ kharitat rasm al-ard... [Atlas or a collection of maps, drawings of the earth comprising: first Eastern half of the globe, second Western half of the globe, third Europe, fourth Asia and Australia, fifth Africa, sixth America, seventh The Land of Egypt, eight The Land of Sham and offers it in a valued printing for the benefit of schools].
Publication [Malta, 1835].
Description Oblong 4to (310 by 455mm), 11 lithograph maps, original hand-colour in outline, bound in plano, original wrappers with title.
References Ganado, A., Schiro, J. and Attard, C.M., ‘The Brocktorff Mapmakers’, BDL, 2012.
300,000 AED
The earliest obtainable atlas printed in Arabic
The earliest obtainable atlas printed in Arabic.
Cartographic publishing in the Muslim world was largely stifled until the nineteenth century by Ottoman proscriptions on printing. Although several atlases, such as the Celebi and Cedid atlases, and maps, the Hajji Anmed Mappamundi for example, were published in Venice with the intent of exportation to the Ottoman Empire, these attempts were unsuccessful. Furthermore, they were all printed in Ottoman Turkish, not Arabic. Malta, with its proximity to the Arab world and Ottoman Empire, but its status as a British Crown Colony, was a natural place for the first Arabic atlas to be published.
”When the Anglican Church Missionary Society decided to establish a Mediterranean Mission in 1815 to evangelize the peoples of Southern Europe, North Africa and the Middle East, they directed their attention to Malta which occupied a central position in the Mediterranean and so geographically lay on the main communication and trading routes between east and west and north and south. The C.M.S. immediately appointed Dr Cleardo Naudi, a Maltese Professor of Chemistry, at the University of Malta, as their correspondent in Malta and sent William Jowett in 1815 to go to the Mediterranean and the Middle East to study the different religious communities and to formulate plans for ‘propagating Christian knowledge’ among them.
After nine years sojourning and travelling in the Eastern Mediterranean, Jowett concluded by emphasizing the importance of education first, before trying to spread the evangelical message, and he felt it very important that the C.M.S. should provide a range of educational books by creating a printing establishment. Malta offered the best advantages for such an undertaking. The Committee of the C.M.S. were impressed with Jowett’s reports and pledged their support but after many delays in the procurement of Arabic and Greek founts [sic?] and other equipment, the first Arabic books came out only in 1827.
However the C.M.S. Press initially faced many problems with their setters and printers as they had no knowledge of Arabic. This changed when Christoph Friedrich Schlienz (1803-68) who was born in Kirchheim in Wurttemberg joined the C.M.S. Press in Malta and eventually became its Superintendent.
With the aid of Matthdus Weiss, the C.M.S. printer in Malta, and George Percy Badger and Faris al-Shidyaq acting as translators into Arabic and editors of the Arabic script, the C.M.S. published most of the Arabic books in Malta between 1827 and 1840. Besides, it results from the Malta Government Accounts for 1831 that an allowance of £30 was being paid to a student in Asia Minor to study Arabic, and in 1832 an allowance of £70 was paid to a gentleman abroad to perfect himself in the Arabic language.
When in 1832 Schlienz discovered that a German lithographer was living in Malta, he immediately contracted two of his sons, Frederico and Luigi [Brocktorff] as lithographers, and Francesco, another son, as a binder. The C.M.S. took a pioneering role in the introduction of printing in the Arab world... However although the output of printed works was impressive, the distribution of books was weak and with mounting debts the C.M.S. printing press had to close down in 1842 and was eventually bought by Matthaus Weiss”.
Although it was not printed in large numbers, the atlas had a significant impact in the Arab world. It was quickly reproduced in Cairo, from where Lord Lindsay wrote in December 1836: “perhaps the most useful work the Pasha has published is an Atlas in Arabic. Copied from one the missionaries have executed at Malta” (Ganado, Shiro and Attard).
The 1833 Malta atlas, the very first example of this kind, is unobtainable today, with the only known copies held in the Albert Ganado Melitensia Collection, and by the British Museum. The present example, published two years later at Malta, is also exceptionally rare.
Complement of Maps
1. [Map of the World, Western Hemisphere]
2. [Map of the World, Eastern Hemisphere]
3. [Map of Europe]
4. [Map of Russia]
5. [Map of Africa]
6. [Map of North and South America]
7. [Map of Australia]
8. [Map of North Africa]
9. [Map of Asia]
10. [Map of Asia]
11. [Map of Eastern Mediterranean].
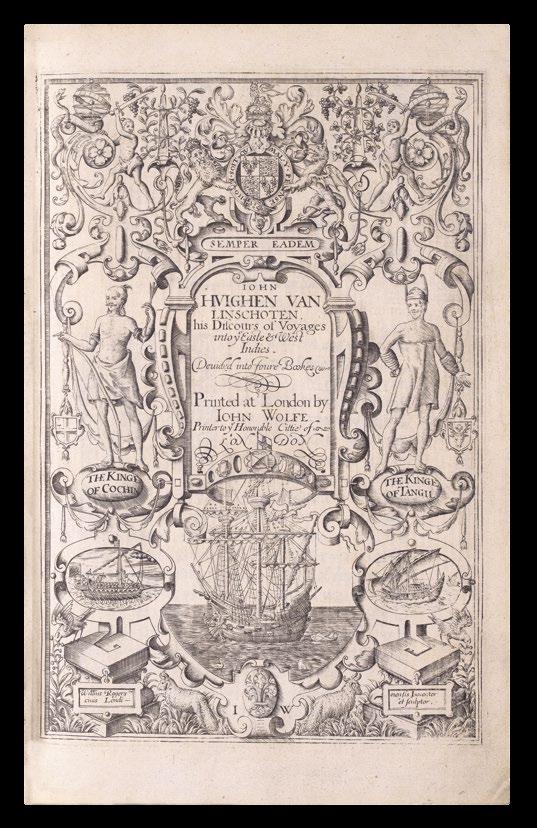
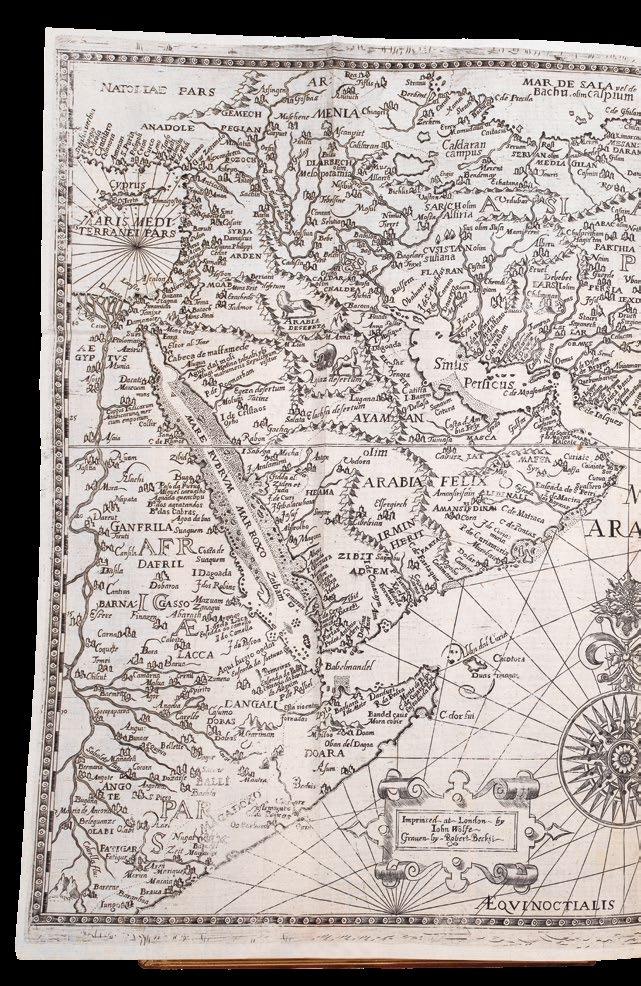
LINSCHOTEN, Jan Huygen van
John Huighen van Linschoten his Discours of Voyages unto ye Easte & West Indies. Devided into Foure Bookes.
Publication
London, John Wolfe, 1598.
Description
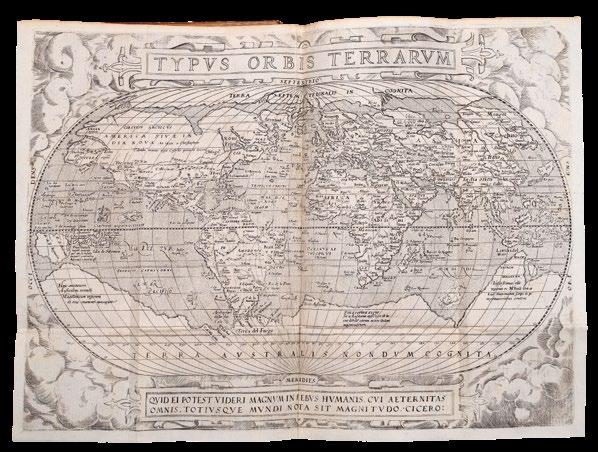
4 parts in one volume. Folio (290 by 190mm), mostly black letter, double column. [6] leaves, blank, engraved general title-page by William Rogers (Johnson, p.2, Rogers no.3), dedication, ‘To the Reader’, pages numbered 1-197 ‘The First Booke’, [1] leaf sectional vignette title-page with engraved map of the Congo, pages numbered [197]- 259 (ie 295) ‘The Second Booke’, [1] leaf sectional vignette title-page with engraved double- hemisphere map of the world, Shirley 182, pages numbered 307447 ‘The Thirde Booke’, [1] leaf sectional vignette title- page with engraved map of Spain, pages numbered [451]-462 ‘The Fourth Booke’; double-page engraved folding map of the world ‘Typus Orbis Terrarum’ (Shirley 169), 8 large doublepage folding maps, and 3 folding views of St. Helena and Ascension, 4 woodcut maps in text, woodcut initials, factotums and head-piece ornaments; EXTRAILLUSTRATED with 29 plates by the van Deutecum brothers from the Dutch edition, some minor reinforcement at some of the folds, otherwise a fine crisp example; full calf, five line gilt panelled boards, spine with raised bands, each compartment with similar gilt panels, gilt titles.
Alden and Landis, 598:57; Borba de Moraes, I:417; Church, 321; ESTC, S111823; Hill, 182; Howgego, L131, G40; Luborsky and Ingram, 509; Parker, 159-161; Sabin, 41374; Schilder, 195228; Shirley [World], nos. 167 and 216; Shirley [Atlases], G.Lin 2a; Streeter Sale, 1:31; Worms, 1705; Worms and BayntonWilliams.
750,000 AED
“The navigator’s vade mecum for the Eastern seas” - one of the most influential English travel books of the sixteenth century
The very rare English edition of Linschoten’s ‘Itinerario’, first published in Dutch in 1595-1596, and translated from the Dutch by William Phillip.
Linschoten’s was the first printed work to include precise sailing instructions for the East Indies. Its exposition of a route to the south of Sumatra through the Sunda Strait allowed Dutch and, later, English merchants to circumvent the Portuguese stranglehold on passage, and, therefore, trade, to the East through the Straits of Malacca. This enabled the British East India Company and the Dutch East India Company to set sail for the Spice Islands and, ultimately, China and Japan, and was of such economic utility that, according to Church, and others, “it was given to each ship sailing from Holland to India” and soon became “the navigator’s vade mecum for the Eastern seas” (Penrose).
“This important work contains all the knowledge and learning related to the East and West Indies and navigations to those parts that was available at the end of the sixteenth century. It was held in such high esteem that for nearly a century a copy was given to each ship sailing to India as a guide to the sailing directions. The fact that most copies were in continual use is in no doubt the reason that fine copies, especially with all correct plates and maps, are so very rare” (Hill).
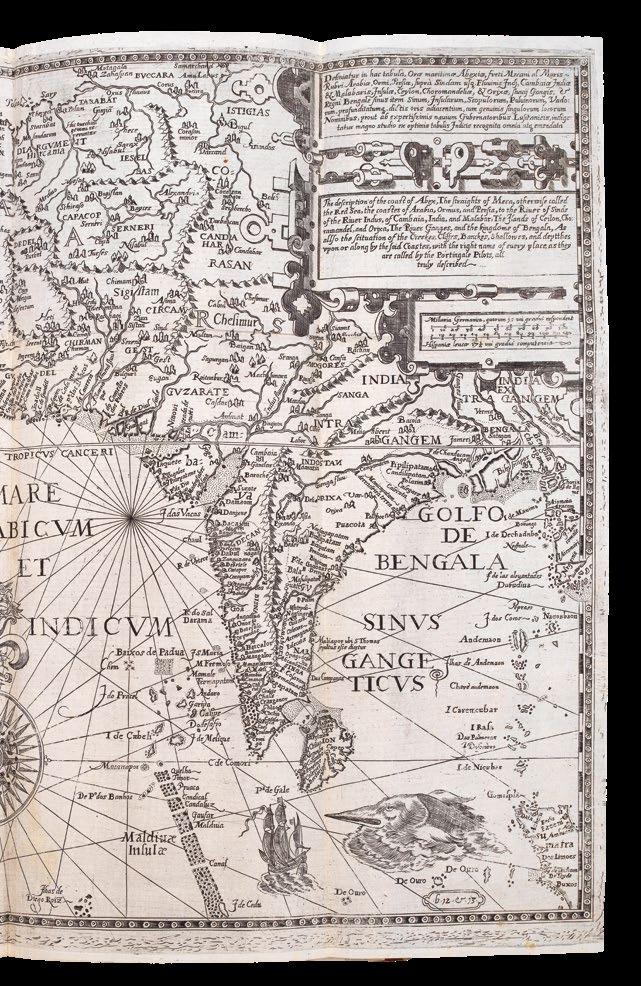
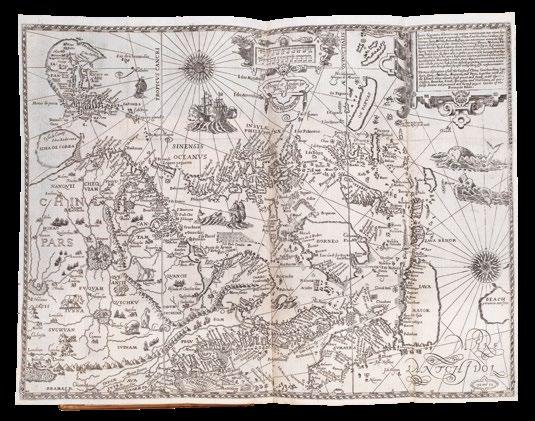
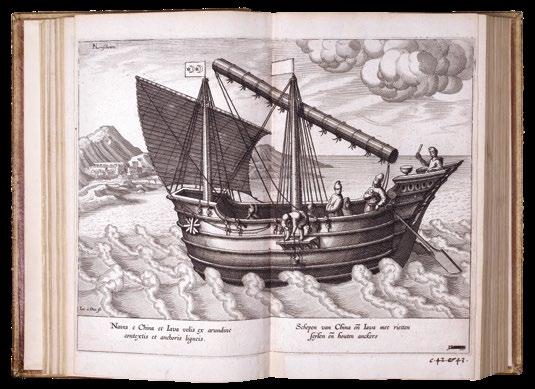
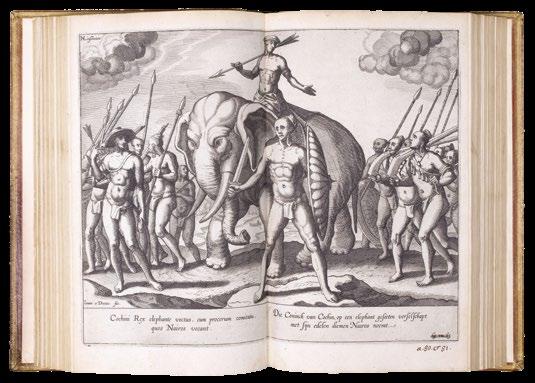
The work is made up of four parts. The first, provides the account of Linschoten’s travels in Asia and includes accounts of the east coast of Africa, Arabia, and as far east as Japan. The chapter is accompanied by fine folding maps of the world, Arabia and India, the southeast coast of Africa, a superb map of east Asia and the East Indies and finally one of southwest Africa.
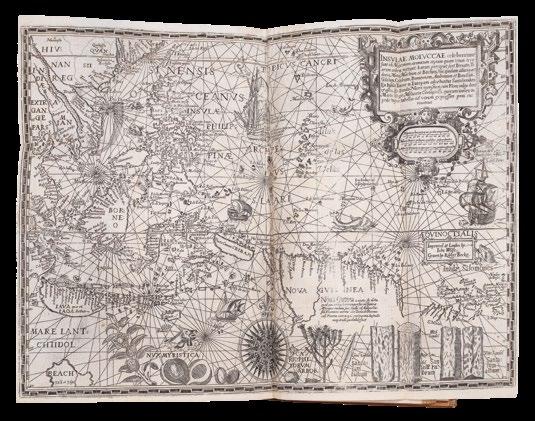
The second book focuses on the west coast of Africa, around the Cape of Good Hope to Arabia and India. It also details the New World accompanying which is a fine map of South America extending northwards to Florida. The third book is derived from the discoveries of the Portuguese Royal pilot Diego Affonso, and details the navigation from Portugal to India, and onwards to the East Indies. Similar detail is also provided for Spanish America and Brazil. Accompanying this is the superb “Spice Islands” map illustrated with spices of the region. The final fourth book provides economic details provided by the territories of the King of Spain.
In fact, until its publication, no other book contained anything like the amount of useful information on the East and West Indies, and it soon became required reading for all navigators sailing to the East, with chapters on the coast of “Arabia Felix”, ie., the southern coast of the Arabian peninsula, the island of Ormus, and Islamic India.
“This is the first work outside of Portugal and Spain to provide detailed practical information on how to get to and engage in trade with America and India. The work was indispensable to sailors on the route to the Indies [and] served as a direct stimulus to the building of the vast English and Dutch overseas empires” (Streeter).
Jan Huyghen van Linschoten (1563-1611)
Linschoten was a native of Enkhuizen who travelled to Spain in 1576 to join his two elder brothers. The family moved to Lisbon during the troubles of 1581. Through family contacts the young Linschoten became attached to the retinue of Vincente de Fonseca as he was sent to Goa as Archbishop. Arriving in September 1583 he spent time travelling through Malabar and Coromandel. All the while he compiled a secret account of his findings. In 1586 Dirck Gerritsz (1544-1604) passed through Goa returning from Japan having also been to China. He was probably the first Dutchman to visit the former. He passed much of his knowledge to Linschoten.
The archbishop returned to Europe in 1587 to report to Philip II but Linschoten remained. Expecting his return, he later found out that he had died at sea. He resolved to return himself and through the auspices of Dutch traders such as the Fuggers and Welsers in India obtained the position of a factor on one of their returning vessels in 1589. He remained on the island of Terceira in the Azores for two years and made his way back to Holland in September 1592. He continued to gather further information from Dutch sailors even accompanied William Barentsz’s second voyage to the Kara Sea in 1594-95. In 1594 he received permission to publish his work. The ‘Itinerario’ was an instant success and combined his first-hand accounts with translations of Portuguese and Spanish documents. The work provided accurate sailing information and detailed descriptions of how to trade in both Asia and South America and the nature of their commodities. Legend has it that examples were given to every Dutch ship sailing to Asia.
Translation
Word of the significance of the book reached the publisher John Wolfe ((fl.1579-1601) who records in the dedication:
“About a Twelvemonth agoe, a learned Gentleman brought unto mee the Voyages and Navigation of John Huyghen van Linschoten into the Indies written in the Dutche Tongue, which he wished might be translated into our Language, because hee thought it would be not onley delightfull, but also very commodious for our English Nation. Upon this commendation and opinion, I procured the Translation thereof accordingly, and so thought goo to publish the same in Print...’. That gentleman was identified in the address to the reader: ‘Which Booke being commended, by Richard Hackluyt, a man that laboureth greatly to advance our English Name and Nation”.
Wolfe was ideally placed to undertake the work, being “the first London bookseller to produce a sequence of map-illustrated works. He clearly kept a rolling-press and was possibly the first regular London book-printer to do so” (Worms & Baynton-Williams). The translation was undertaken by William Phillip. The maps and plates were engraved by
Robert Beckit, Ronald Elstrack and William Rogers. Most are re-engravings of those in the Dutch edition. “Wolfe’s turbulent career, his clashes with his old master John Day and the Stationers’ Company, his imprisonments, secret presses, and faked imprints have sometimes obscured his other achievements. He had an extensive international trade and was ‘the father of news publishing’ in London” (Worms).
“Financial help came from a group of London merchants who provided ten pounds to Hakluyt to see the book in print alongside a further thirty shillings towards the production of maps to accompany it” (Parker).
Extra illustration
This is a slightly taller example than the Church copy. The English edition did not include copies of the thirty or so illustrations of native peoples found in the Dutch edition. However, ‘sets of the Dutch engravings were apparently imported by the publisher and bound into some exemplars’ (Luborsky & Ingram), as found in this example. Examples do vary in content and some are found with examples of the Dutch maps inserted. Indeed, the British Library possess three examples, none are complete. This example only includes the English engraved maps.
List of maps
Most of the maps and views of the English edition are re-engravings of the plates of the original Dutch edition of 1595-1596, with captions in Latin and English.
1. [Anonymous after] ORTELIUS, Abraham, ‘Typus Orbis Terrarum’. An English derivative of Ortelius’ more up to date plate of 1587 and the earlier more decorative cloud border. Shirley (1993) 167.
2. [Mozambique], ‘The description of the Islandes and Castle of Mozambique...’, engraved by William Rogers.
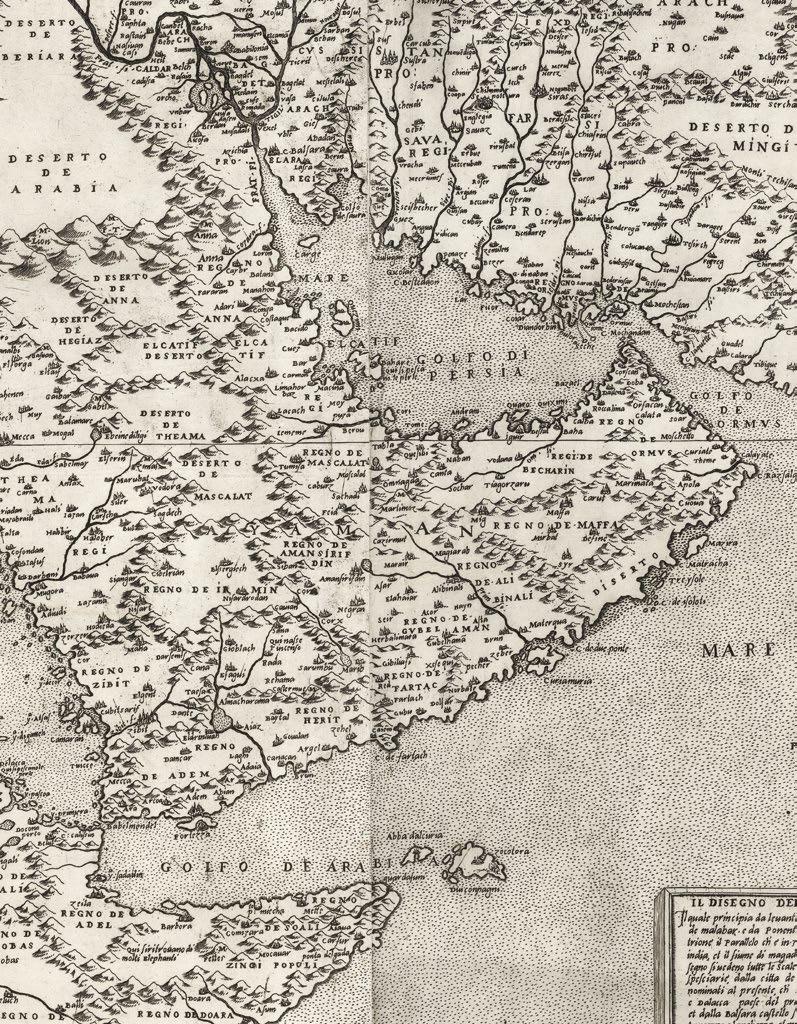
3. [Arabia, the Indian Ocean and India], ‘The description of the coast of Abex...’ A much-improved depiction of the Arabian Peninsula. Al-Qasimi (1999) p. 32 Dutch edition only; Ankary (2001) pp. 74-6, 148-9 referring only to the Dutch plate; Gole (1978) no. 8 listing only the Dutch plate; Schilder (2003) pp. 220-3; Tibbets (1978) no. 51: “The surprising fact about the representation of the [Arabian] peninsula is the close resemblance of the outline to that of a modern map when compared with other engraved maps of the time. There is a vague suggestion of the Qatar peninsula, which is not seen again until the nineteenth century” (Tibbets).
4. [East Africa], ‘The description or Caerd of the Coastes of the Countreys following called Terra do Natal...’, engraved by Robert Beckit, including the western half of the Indian Ocean along the coast of South Africa, all of Madagascar.
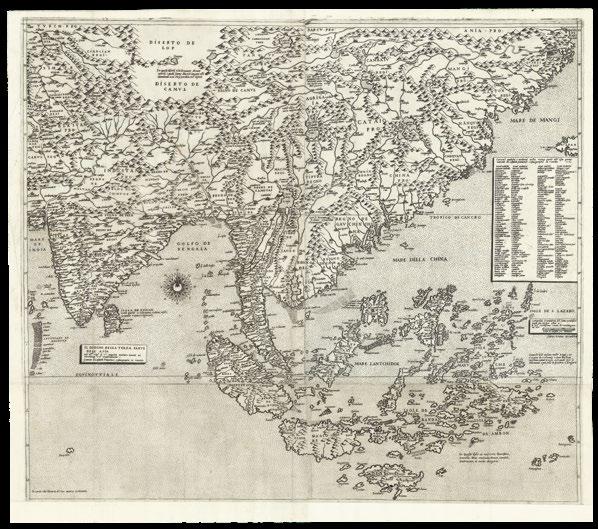
5. [Southeast Asia], ‘The Trew Description of All the Coasts of China...’, extending from the island of Korea and Japan south of ‘Beach’ (Australia), Java, Timor, the Philippines, the Indochina peninsula, and most of the coast and much of the interior of China), Chang (2003) pl. 16, p. 147 Dutch only, p. 192 no. 134 English; Geldart (2017) p. 19; Hubbard (2012) p. 47, fig. 36; Schilder (1976) no. 18 Dutch; Schilder (2003) pp. 222-6; Suarez (1999) pp. 178-9; Suarez (2004) p. 79; Walter (1994) no. 12 Dutch.
6. [St. Helena]
a. ‘The Island of St. Helena full of Sweet and pleasaunt ayre fructfull ground and fresh water...’, b. ‘The true description, and situation of the Island St. Helena, on the East, North, and West Sydes’, both engraved by Raygnald Elstrak.
7. [Ascention Island], ‘The True Description of the Island of Ascention...’, engraved by William Rogers.
8. [Southwest Africa], ‘The description of the Coast of Guinea...’. Norwich (1983) no. 239a Dutch; Schilder (2003) pp. 215-19; Tooley (1969) p. 67 Dutch.
9. [South America], ‘The description of the whole coast lying in the South Seas of Americae called Peru...’, displays the whole of South America, Caribbean and Florida. Schilder (2003) pp. 226-8.
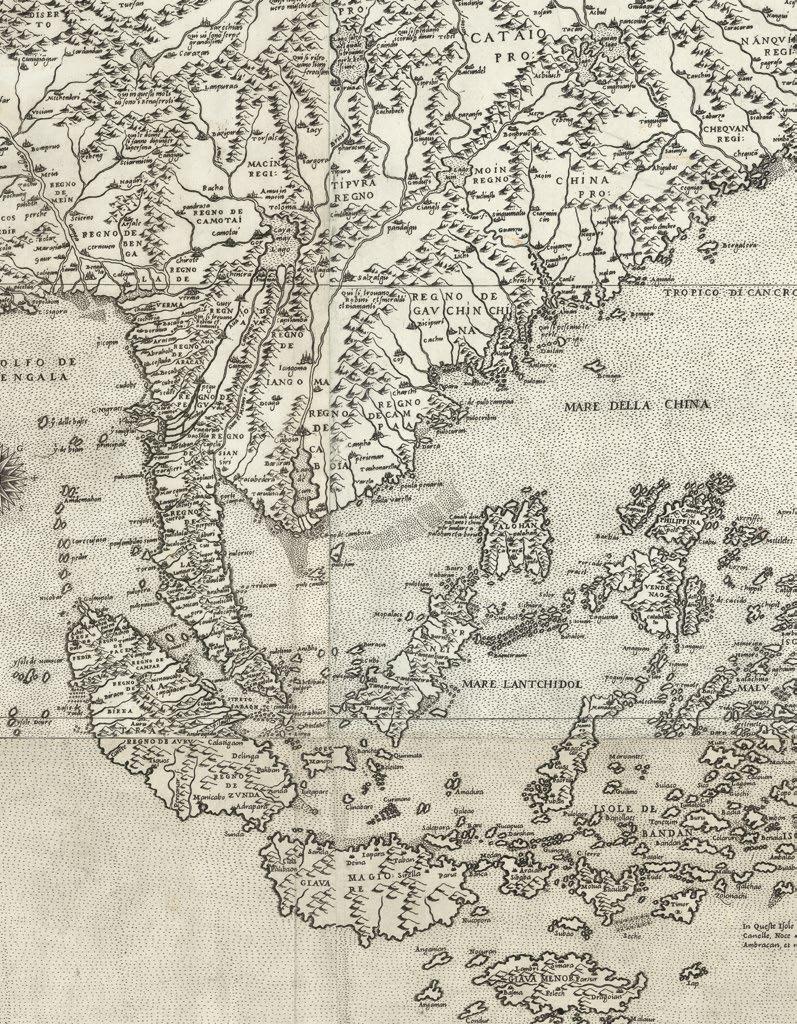
10. [The Spice Islands Map], ‘Insulae Molucca celeberrimae...’, extends from southeast Asia to the Solomon Islands and northwards to include the Philippines. The famous Spice Island map, so called for its depiction of the spices nutmeg, clove, and sandalwood along the bottom after the original by Petrus Plancius who obtained his information covertly from the Portuguese maps of Bartolomeu Lasso. Schilder (2003) pp. 117-22; Suarez (1999) pp. 177-9.
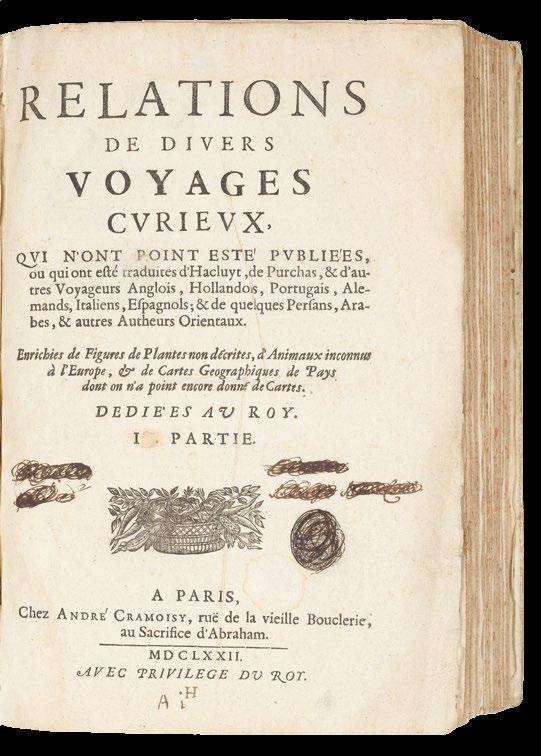
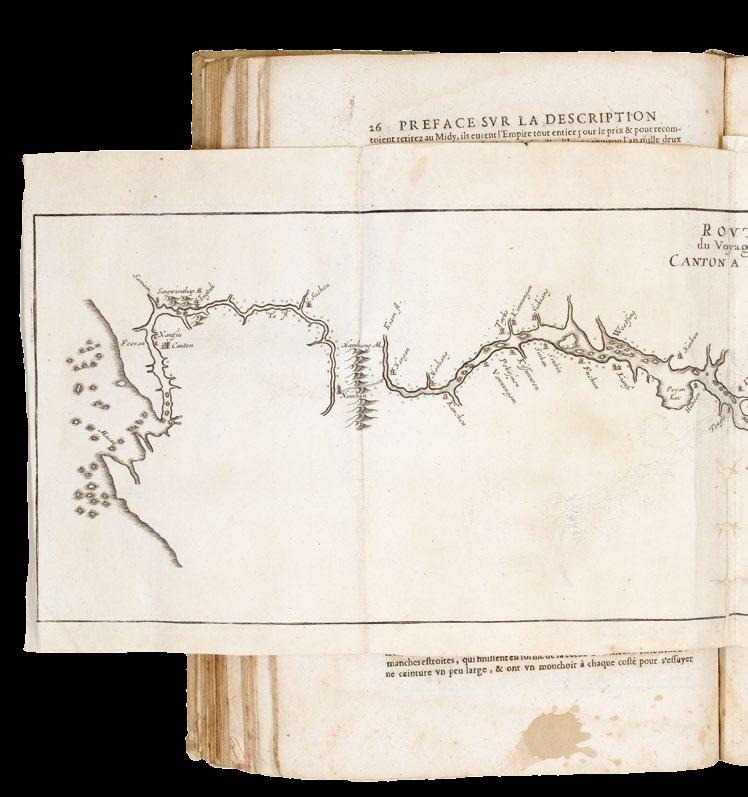
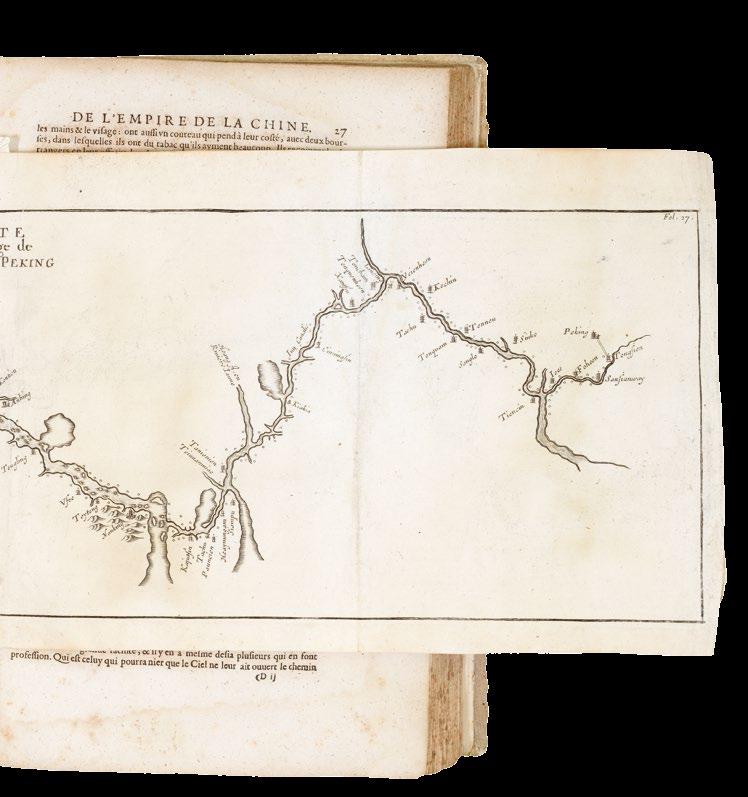
THEVENOT Melchisédec
Relations de divers voyages curieux, qui n’ont point esté publiées, ou qui on esté traduits d’Hacluyt, de Purchas, et d’autres voyageurs Anglais, Hollandois, Portugais, Allemands, Espagnols, et de quelques Persans, Arabes, et autres auteurs orientaux.
Publication
A Paris, chez André Cramoisy, 1666 - 1672.
Description
4 volumes in 2. Folio (334 by 230mm). Text in French and Greek, title-pages printed in red and black, 3 of the 4 title-pages match those for the fourth part, and are dated 1672 (see Brunet V, 810), with original Roman numerals (1663 and 1664) altered in early manuscript; full vellum over pasteboard, title in manuscript of the spines, some minor restoration.
References Brunet, t. V, col. 810-813; Sabin 95333.
175,000 AED
The most up-to-date practical knowledge on navigation and information on foreign countries
Volume one, part I: pp. [8] 52, 40, 12, 80, 30, 24, 35 [1], 52, XXV [3] with 3 large folding engraved maps, and illustrations throughout; without Routier des Indes orientales, but with Description des Pyramides d’Egypte, and numerous tables related to China; part II: pp. [16] 20, 60, 128, 40, 16, 48, 4, 26 with 10 folding engraved plates including 2 large folding maps, and some folding tables.
Collation
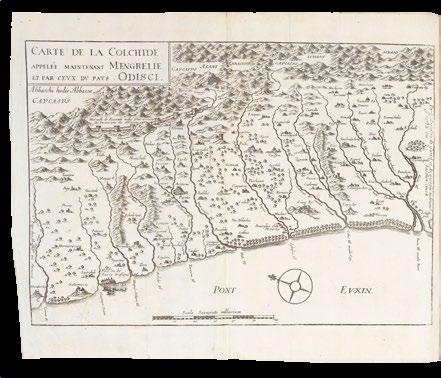
Part I: [4] leaves, 52 pages, with map of Colchide; 1-26; 17-40; 12 pages with map of India under Mogol; 80 pages; 30 pages; 1-10; 19-24; 17-24; 35 pages; [1] page; 56 pages with map of Australia; XXV; [1] with two plates of Egyptian mummies; bound without 2 plates with Caldean characters, and one map of Bassora. Part II: [8] leaves, 20 pages; 60 pages with 4 plates of Arabic coasts; 128 pages with map of Serloine; 40 pages with map of China and Philippines; 16 pages; 48 pages with plate justice en iapon between pages 45 and 46; 4 pages; 26 pages; bound without, 1 map of Arabia, 1 map of Pegu et Japon, and 2 leaves of text (pages 27-30, last part on China).
Volume two, part IV: La science des Chinois with its own title-page; pp. [4] 14, 24, 16, 16, 8, [4] 58, 40, 23 [1], 24, 4 with one folding engraved plate; part III: engraved frontispiece titled Ambassade des Hollandois a la Chine (1666); pp. [8] 68, 216, 12 with 15 engraved plates, including 2 large folding maps, and one folding table.
Part IV: [2] leaves, 14 pages; 24 pages; 16 pages; 16 pages; 8 pages; 4 pages; map of the Red Sea; 46 pages with 63 plates and pages 47-58 of text; 23 pages; 24 pages; 4 pages, 2 plates with animals and plants from China; bound without: frontispiece particulier du voyage du sieur Acarette, ??? 23 of 24 pages of Viaggio del P. Grueber including the plate of the Chinese alphabet, with only the French translation of the account and map of Ethiopia. Part III: 1 leaf; [3] leaves; 28 pages; pages 31-68 with plate of the route (bound between pages 26 and 27 of following work); map of China; 216 pages; 12 pages; 10 plates not called for by Brunet, from the Voyage des ambassadeurs bound at the end; bound without the frontispiece to the part III, 2 leaves of text at the end of the first avis, 2 plates from the Voyage des ambassadeurs. Thevenot’s monumental collection of voyages and exploration: a continuation of Haklyut and Purchas, and with the addition of accounts of exploration in the southern oceans, the East Indies, China and Arabia. His compilation was issued in five parts over more than thirty years: part I in 1663, part II in 1664, part III in 1666, part IV during 1672-1674, and part V in 1696. During the course of publication, the parts of the collection already printed were reissued with new title-pages in 1664, 1666, 1672 [as here], 1683, and 1696. Some sheets were reprinted for these reissues, and any two examples, issued before 1683, are rarely the same, with some “inserts” being
more scarce than others. The current example is as originally issued, and seems to be composed of sheets for the 1666 re-issue, with new title-pages to parts I, II, and IV. It has been bound without some maps and inserts found in other examples, but is with others not so commonly found (see ‘Collation’).
Of all the truly legendary voyages undertaken in perilously small open boats, Pelsaert’s voyage from the Abrolhos to Bavatia in June and July of 1629 is an extraordinary feat of endurance in extremis. The current set includes the very rare ‘La Terre Avstrale decovverte par le Capitaine Pelsart, qui y fait naufrage’: just seven pages that recount the tragedy of shipwreck, the bloody savagery of mutiny, Pelsaert’s extraordinary journey, and the viscious aftermath of just retribution. The account is illustrated with the large folding map ‘Terre Avstrale decouverte l’an 1644’, after Tasman, here in its third state, with the Tropic of Capricorn and rhumb lines, 1672.
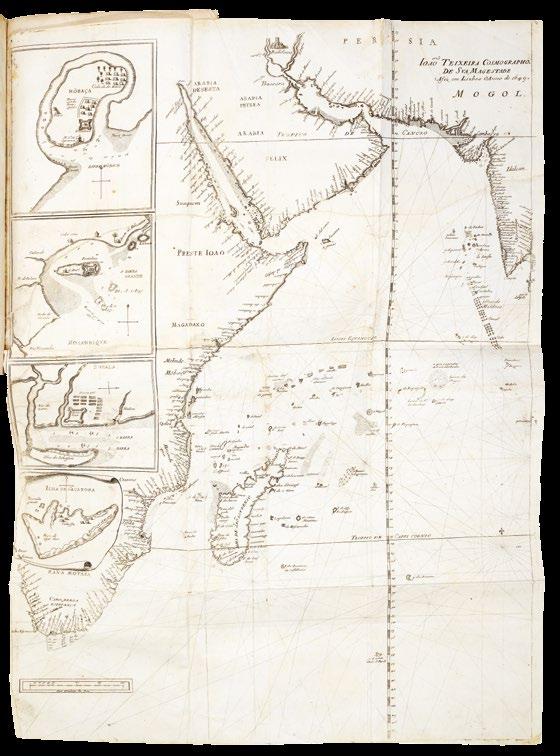
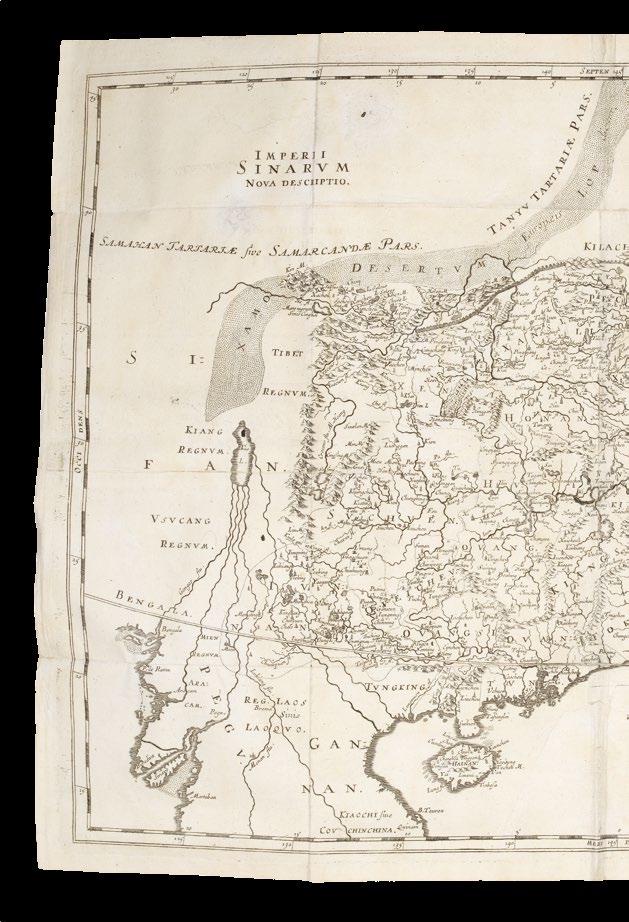
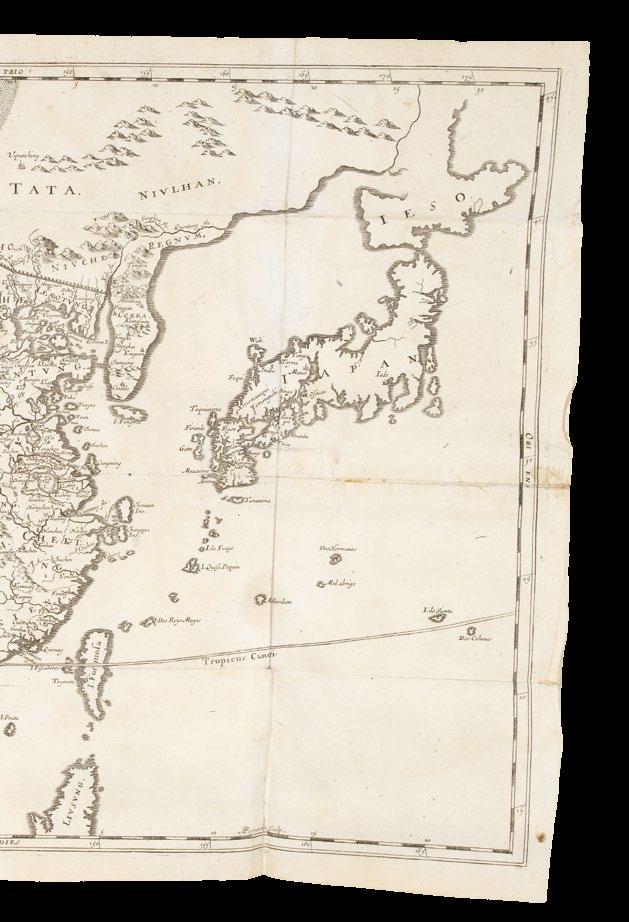
Other important maps include: the second printing of an important untitled map of the East Indies, after Teixeira’s chart which had been prepared in the 1640s for Portuguese cartographers. Drawn in the same style as a portolan, with no inland details, there are two insets showing the Ganges Delta and Chittagong, Hokkaidō is shown as an island north of Japan (”Iezo”); ‘Imperii Sinarum Nova Descriptio, a map of China’, including Korea, Taiwan and Japan, drawn after the work of Martino Martini as published by the Blaeus, but showing Hokkaidō joined to the mainland; and ‘Ioao Teixeira Cosmographo de Sua Magestade Afex em Lixboa O Anno de 1649’, an important chart of the entire east coast of Africa, the Arabian Peninsula, Persia, the west coast of India and adjacent Indian Ocean islands, one of the few printed charts taken directly from Portuguese sources, based upon a 1649 portolan chart by João Teixeira, royal cosmographer of Portugal.
One of the great driving forces behind ‘Divers voyages’ was Thévenot’s desire to help France achieve her aim to increase colonial trade to compete with other European nations. The book aimed to gather together the most up-todate practical knowledge on navigation and information on foreign countries.
Melchisedech Thévenot (1620-1692) was a French diplomat, scientist, and travel writer. He was a scholar with interests in mathematics, physics, and medicine, acting as the patron of several early scientific societies and most notably contributing to the formation of the Académie des Sciences. His early career included two missions to Italy in the 1640s and 1650s, and it was there that he first developed an interest in the study of Oriental languages. In 1663, he published the first part of his ‘Relations de Divers Voyages’, a work that would secure his reputation as one of the most important travel compilers of the seventeenth century. He would go on to publish a second and third part in 1666, a fourth in 1672, and a final fifth part was being assembled in 1692 when Thévenot died, and would not be published until 1696.
1. With the Ex libris on two frontispieces of the convent of the Discalced Carmelites in Como (suppressed in 1792).
2. Early manuscript purchase annotation on the verso of the top board of Vol 1 of the Como bookseller Pasquale Ostinelli (1804).
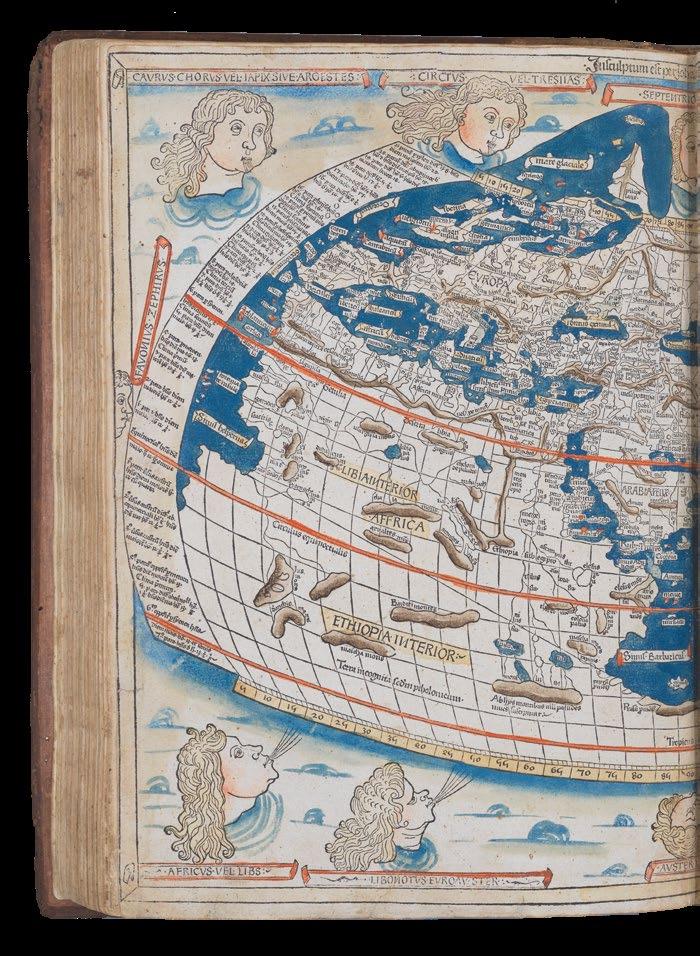
PTOLEMAEUS, Claudius and Johannes SCHNITZER OF ARMSZHEIM
[Untitled Map of the World].
Publication [Ulm, Lienhart Holl, 1482].
Description
Double-page woodcut map, with contemporary hand-colour in full.
Dimensions 420 by 580mm (16.5 by 22.75 inches).
References Shirley 10.
2,000,000 AED
Extending to the northernmost reaches of the Atlantic Ocean
The first woodcut map of the world on a Ptolemaic projection, by Johannes Schnitzer (‘woodcutter’ in German) of Armszheim, signed in the block by him along the top edge “Insculptum est per Johane Schnitzer de Armszheim”, as it was understood by the Alexandrine ancients, on a Ptolemaic projection extending from Great Britain in the northwest, the Canary islands in the west, mid-China in the east, and northern Africa in the south, the Indian Ocean features a large island, Taprobana, now Sri Lanka, with the new addition of a rudimentary Scandinavia within an extension of the map above the neatline, the whole surrounded by a broad decorative border including 12 windheads.
Issued by Lienhart Holl in Ulm in 1482, and showing Greenland and Scandinavia in a Ptolemaic map for the first time. Holl’s atlas was the first to be printed in Germany, the first to contain maps made from woodcut blocks, the first to be issued with hand-coloured maps, and the first to name the cartographer of the maps.
The world map is the first to be signed, by Johannes Schnitzer of Armszheim, who, in trade-mark fashion has reversed every capital N, and inadvertently provided two Tropics of Cancer. Further, the mapmaker updated the Ptolemaic world picture by incorporating improvements that were probably based on a manuscript of the 1470s by Nicolaus Germanus (c1420-1490), a Benedictine monk of Reichenbach Abbey in Bavaria, who is depicted in the first illuminated letter of the atlas presenting his book to the dedicatee Pope Paul II. One notable addition is a rudimentary depiction of Scandinavia to the north, within an extension of the map’s top border. This is also the earliest printed map to show the northernmost reaches of the Atlantic Ocean. The world map, moreover, embodies what is perhaps the most readily apparent feature of the Ulm Ptolemy: its beauty.
The text of Claudius Ptolemy’s ‘Cosmographia’ was translated into Latin from the original Greek by Jacobus Angelus and was first published, in Renaissance times, at Vicenza (1475, unillustrated), Bologna (1477) and Rome (1478). The sumptuous edition published at Ulm in 1482, however, far surpassed all earlier efforts and remains one of the most important publications in the history of cartography. This is the first redaction of the ‘Geography’ to be printed outside of Italy, the earliest atlas printed in Germany, the first to depart from the classical prototype to reflect post-antique discoveries, the first to be illustrated with woodcuts rather than engravings, and the first to contain handcolored maps, the design and execution of which were ascribed to a named cartographer, and the first to incorporate the five modern maps by Nicolaus Germanus.
The Ulm edition, moreover, was the first to depart from the classical prototype by expanding the atlas to reflect post-antique discoveries about the size and shape of the earth. To the canonical twenty-seven Ptolemaic maps were added five “modern maps” of Spain, France, Italy, the Holy Land and northern Europe. Though printed outside Italy, the paper this magnificent atlas was printed on was imported from Italy, and payment made in part by complete copies of the finished atlas.
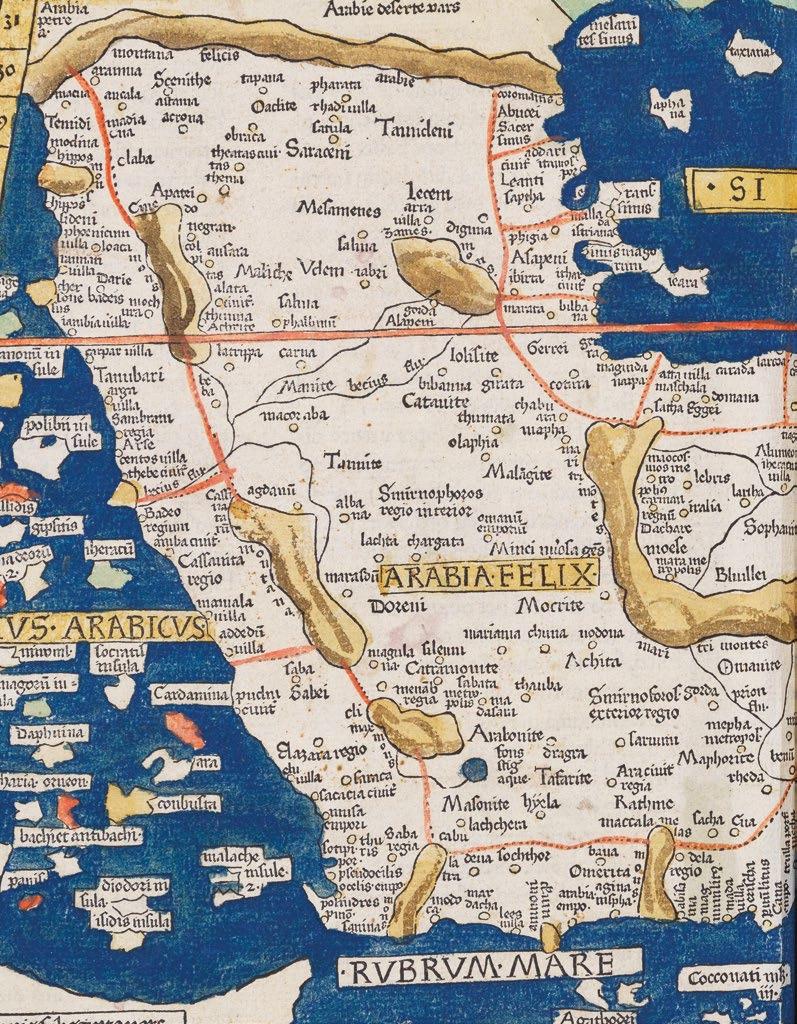
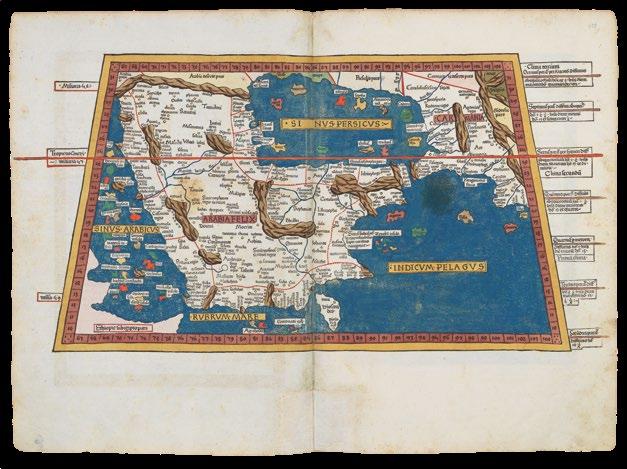
PTOLEMAEUS, Claudius
[translated by ANGELUS, Jacobus, edited by GERMANUS, Nicolaus]
[Arabia] Sexta Asie Tabula.
Publication
Ulm, Lienhart Holle, 16 July 1482.
Description
Woodcut map, fine original hand-colour, old repair to bottom of gutter, minor losses to top gutter skilfully repaired.
Dimensions 430 by 590mm (17 by 23.25 inches).
References Campbell, T., ‘Earliest Printed Maps’, p. 179-210; Schreiber 5032; Skelton, R.A., Bibliographical note prefixed to the facsimile of the 1482 Ulm Ptolemy.
750,000 AED
A striking map of Arabia from the 1482 Ulm Ptolemy
The map was published in the first atlas printed outside Italy and the first atlas illustrated with woodcut maps.
In 1482 Lienhart Holle in Ulm published a revised edition of Ptolemy’s Geographia with the reworking of the Ptolemaic corpus by the cartographer Nicolaus Germanus Donis. The atlas included five additional “modern” maps: Italy, Spain, France, Scandinavia, and the Holy Land. The atlas would be the first book printed by Lienhart Holle, however, it would appear that the venture proved ruinously expensive and his business would go bankrupt shortly after publication. The remaining sheets, the woodblocks and the types passed to Johann Reger in Ulm, who reissued the work in 1486.
As well as the modern maps the atlas bears some other notable first. It was the first time that maps were signed by the artist responsible for the woodcutting; in this case Johannes of Armsheim, who signed the world map, and incorporated a backwards N into the woodcut text on each map. It is also the first to print the accompanying text on the verso of the map to which it refers. Another important feature of the Ulm editions is the introduction of the publisher’s colouring upon the maps. Maps from 1482 usually have a rich blue colour in the sea which was replaced with a soft brown colour in 1486.
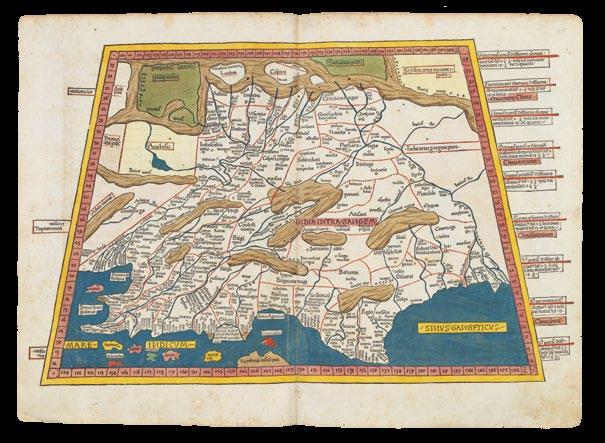
PTOLEMAEUS, Claudius [translated by ANGELUS, Jacobus, edited by GERMANUS, Nicolaus]
[India] Decima Asie tabula.
Publication Ulm, Lienhart Holle, 16 July 1482.
Description
Woodcut map, fine original hand-colour, a few minor worm holes.
Dimensions
430 by 590mm. (17 by 23.25 inches).
References
Campbell, T., ‘Earliest Printed Maps’, p. 179-210; Schreiber 5032; Skelton, R.A., Bibliographical note prefixed to the facsimile of the 1482 Ulm Ptolemy.
185,000 AED
A striking map of India from the 1482 Ulm Ptolemy
The map was published in the first atlas printed outside Italy and the first atlas illustrated with woodcut maps.
In 1482 Lienhart Holle in Ulm published a revised edition of Ptolemy’s Geographia with the reworking of the Ptolemaic corpus by the cartographer Nicolaus Germanus Donis. The atlas included five additional “modern” maps: Italy, Spain, France, Scandinavia, and the Holy Land. The atlas would be the first book printed by Lienhart Holle, however, it would appear that the venture proved ruinously expensive and his business would go bankrupt shortly after publication. The remaining sheets, the woodblocks and the types passed to Johann Reger in Ulm, who reissued the work in 1486.
As well as the modern maps the atlas bears some other notable first. It was the first time that maps were signed by the artist responsible for the woodcutting; in this case Johannes of Armsheim, who signed the world map, and incorporated a backwards N into the woodcut text on each map. It is also the first to print the accompanying text on the verso of the map to which it refers. Another important feature of the Ulm editions is the introduction of the publisher’s colouring upon the maps. Maps from 1482 usually have a rich blue colour in the sea which was replaced with a soft brown colour in 1486.
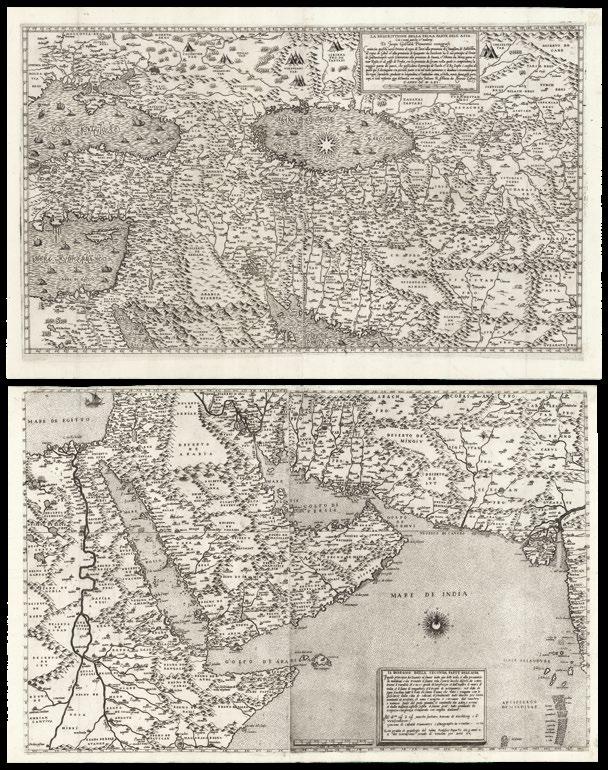
GASTALDI, Giacomo & LAFRERI, Antonio
La descrittione della prima parte dell’Asia. [and] Il disegno della seconda parte dell’Asia.
Publication [Rome and Venice respectively, 1561].
Description
Pair of engraved maps, each on two sheets joined, watermark of ladder in shield under six-pointed star (Woodward 253), to all four sheets.
Dimensions
495 by 795mm (19.5 by 31.25 inches) 450 by 780mm (17.75 by 30.75 inches)
References
Bifolco 68 state 1, and 71 state 1; Nordenskjöld, pp. 396-406, The Geographical Journal vol. 13, April 1899; Schilder p.7, The Map Collector 17, December 1981; Suárez, The early mapping of Southeast Asia, pp.130-157, 1999; Tooley pp.20, 21; Witcombe 234, 2008.
625,000 AED
The most important maps of the Middle East and Arabia published in the sixteenth century
Fine examples of the most influential sixteenth century maps of Central Asia and the Middle East, by Giacomo Gastaldi, the greatest cartographer of his era. Not only are these works the most accurate depiction of the area to date, but would go on to dominate the European view of the area for the rest of the sixteenth century.
Giacomo Gastaldi (c1500-1567), originally from Piedmont, established himself as a cartographer in Venice, where he was given the notable title of ‘Cosmographer to the Republic’. He was a prolific mapmaker, with a body of work numbering at least 109 pieces, including contributions to the 1548 Venice edition of Ptolemy’s ‘Geogra a’, and Ramusio’s ‘Navigationi et viaggi’. Gastaldi’s maps of Asia are considered amongst the most significant representations of the continent, as the first pieces of cartography to name, and even show, many of the areas depicted. They were also responsible for numerous features which would later become standardised, such as the ovalized Caspian Sea. Originating from Venice, the maps are also a reflection of the Republic’s dominance of early exploration, particularly in Asia. The city’s crucial position allowed for Western contact with the East, although this relationship was becoming progressively threatened by the expansion of the Ottoman Empire.
The first part of Asia, here in its first state by Lafreri, is based on Gastaldi’s map of 1559. Although Lafreri had permission to print and sell Gastaldi’s original maps, this map was made from a re-engraving by Jacopo Bos, perhaps because of damage to the original plates. Bos’ work is very similar to that of Gastaldi’s own engraver, Fabio Licinio, with stylistic differences in the waters and ships revealing the new engraver’s hand. It has been suggested that Bos engraved this edition for the Roman publisher Michele Tramezzino, and that only later did Lafreri acquire the publishing rights (Witcombe). The second part is here in its first state and was engraved by Licinio. The upper part repeats some areas of the previous map, however the two were intended to form one, as shown by the identical scale bars and projection.
Together the two parts extend from southern Siberia to the Indian Ocean, encompassing huge swathes of the continent. They cover Turkey, the Middle East, the Black and Caspian Seas, the Eastern Mediterranean with Cyprus, the stream of the Nile and the whole of the Arabian Peninsula, with part of Western India and the Maldives. The coastal and island names, as noted by Nordenskjöld, are taken from portolans and from voyages of Spanish and Portuguese exploration. Some interior names are taken directly from Marco Polo and almost identical in orthography to those used by Ramusio. The abundance of toponyms suggests further sources,
which Gastaldi may have accessed in the large library of the Fugger family. Markus Fugger, a prominent businessman and politician, was among the cartographer’s acquaintances, and the second part of Asia is dedicated solely to him. Importantly, Gastaldi’s maps of Asia provided the basis for those later published by Ortelius, De Jode and Mercator. Bifolco records 33 examples of the first map held in institutions, and 42 of the second, but both are rare on the market. We have been able to trace only four examples of the first, and seven of the second, appearing at auction in the last 50 years.
GASTALDI, Giacomo’ Paolo FORLANI; and Ferrando BERTELLI
Il disegno della terza parte dell’Asia.
Publication [Venice, 1562 and c1568].
Description
Engraved map on three sheets joined, bearing three watermarks, upper left sheet with ladder in shield under cross pommy B (Woodward 256), upper right with lamb, paschal with straight standard C (Woodward 48), lower sheet, only lower half of ladder in shield under six-pointed star K (Woodward 253).
Dimensions
680 by 775mm. (26.75 by 30.5 inches).
References
Bifolco 74 state 2; Nordenskjöld, pp. 396406, The Geographical Journal vol. 13, April 1899; Schilder p.7, The Map Collector 17, December 1981; Suárez, The early mapping of Southeast Asia, pp.130-157, 1999; Tooley pp.20, 21.
625,000 AED
Gastaldi’s seminal map of Southeast Asia
A fine example of Gastaldi’s map Southeast Asia, the most influential map of the region published in the sixteenth century, and the first map to name Singapore; here present with the rare southern extension sheet, incorporating the Java and the lucrative Spice Islands.
Giacomo Gastaldi (c1500-1567), originally from Piedmont, established himself as a cartographer in Venice, where he was given the notable title of ‘Cosmographer to the Republic’. He was a prolific mapmaker, with a body of work numbering at least 109 pieces, including contributions to the 1548 Venice edition of Ptolemy’s ‘Geogra a’, and Ramusio’s ‘Navigationi et viaggi’. Gastaldi’s maps of Asia are considered amongst the most significant representations of the continent, as the first pieces of cartography to name, and even show, many of the areas depicted. Originating from Venice, they also reflect the Republic’s dominance of early exploration, particularly in Asia. The city’s crucial position allowed for Western contact with the East, although this relationship was becoming progressively threatened by the expansion of the Ottoman Empire.
The present map bears the same scale bar as Gastaldi’s first and second parts of Asia, and matches with their latitudes and longitudes. It has been dubbed the most influential map of the region published in the sixteenth century and, as noted by Schilder, ‘in the representation of the coastlines, his maps are superior to all previous known maps of Asia, either drawn by hand or printed’. After Gastaldi’s death, it was augmented by two further sheets, as in the present example, narrower in size, and with the imprint ‘To be sold at the San Marco bookshop in Venice’ (transl.).
The map extends from central Asia to China and is particularly important for its depiction of the islands below the Equator. Alongside the Moluccas, labelled the “Isole di Ambon”, Gastaldi includes a note explaining that “in these islands there are cloves, cinnamon, nutmeg, pepper, sandalwood, ambergris, and many spices” (transl.), reflecting the importance of these resources to Venetian trade. e Philippines appear as “Philippina” and Borneo in its present nomenclature; found below these is Java, labelled “Giava Magiore” to distinguish it from the fictitious “Giava Minore” added by Forlani. Significantly, this is the first map to name Singapore and Cambodia.
Gastaldi’s sources vary from Venetian explorers, such as Marco Polo and Pigafetta, to the records of Spanish and Portuguese voyages, most notably that of Magellan. As noted by Nordenskjöld, it is likely that he had access to the extensive library of the Fugger family, since Marcus Fugger was an acquaintance and the sole dedicatee of this map, as well as to the maps in the Sala dello Scudo, which he was commissioned to paint, thanks to his close connection with the Venetian Secretary of State. Gastaldi’s maps set a new standard in cartographic representations of Asia, and formed the basis of those subsequently published by Ortelius, De Jode and Mercator.
Although Bifolco records 41 examples of this map held in institutions worldwide, this map is extremely rare on the market. We have been able to trace only two examples appearing in the last 50 years.
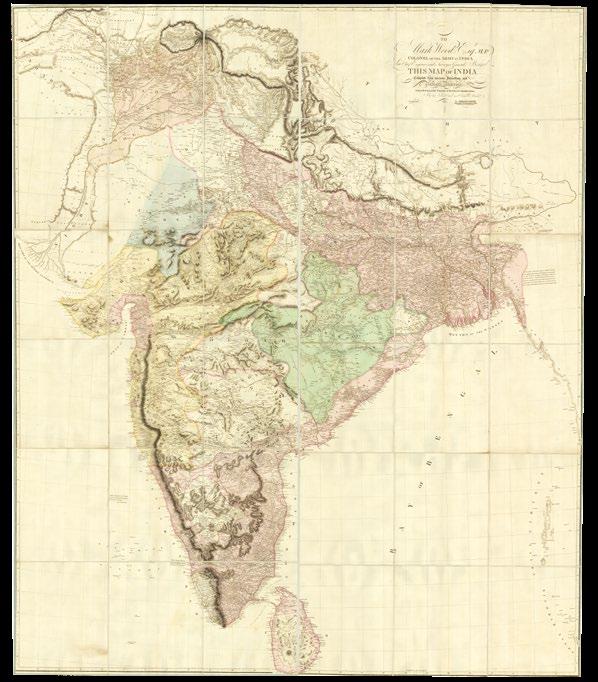
ARROWSMITH, Aaron
To Mark Wood Esq. M.P., Colonel of the Army in India, Late Chief Engineer and Surveyer General, of Bengal, This Map of India Compiled from various Interesting and Valuable Materials Is Inscribed in Grateful Testimony of His Liberal Communications By his obedient and most humble Servant A. Arrowsmith.
Publication
London, A. Arrowsmith, 1804.
Description
First edition. Large engraved map, on six sheets, in three sections joined, fine original hand colour, edged in blue silk; housed in two yellow cloth slipcases, the outer gilt tooled in five compartments, black morocco labels, gilt lettering and tooling, inked call number with sticker, red and white cloth ties, slightly wrinkled.
Dimensions 1971 by 1595mm (77.5 by 62.75 inches).
50,000 AED
Rare large-scale map of India in full original colour
Originally published in six sheets, it shows the British Empire in India at the height of the expansionist era of Richard, Marquess Wellesley (1760–1842), governor-general of Bengal, who was, nonetheless, to leave the subcontinent in ignominy two years later.
Arrowsmith’s dedication of this map to Wood is probably more a reflection of the fact that Wood was in the public eye (he had recently published two successful works on India and the route to India), than a recognition of his work as a surveyor (which had ended over ten years earlier). Sir Mark Wood (1747- 1829) had returned to England in 1793 after a distinguished career in the East India Company, culminating with his appointment as surveyor-general in 1787 and chief engineer in Bengal in 1790.
Aaron Arrowsmith (1750-1823) was the finest cartographer of his generation. Although he received little formal education it is believed that he was taught some mathematical instruction by William Emerson, an author of several books on the application of mathematics to the area of cartography. Around 1770, Arrowsmith moved to London to seek employment. It is believed that he worked for William Faden before joining John Cary Sr. in the early 1780s. There he provided the measurements for John Cary’s early publication detailing the roads from London to Falmouth, his first signed work. Arrowsmith set up on his own in 1790 and over the next thirty years produced some of the most beautiful and elegant maps of the era.
Rare, OCLC records three institutional examples: British Library, Harvard, and BNF.
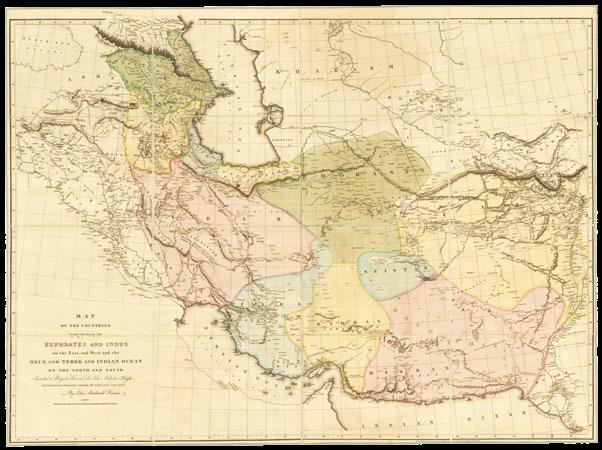
KINNEIR, John Macdonald
Map of the countries lying between the Euphrates and Indus on the East and West, and the Oxus and Terek and Indian Ocean on the North and South. Inscribed to Brigadier General Sir John Malcolm Knight of the Royal Persian Order of the Lion and Sun By John Macdonald Kinneir.
Publication
London & Calcutta, A. Arrowsmith, No. 10 Soho Square, Hydrographer to H.R.H. the Prince of Wales; Lithographed by order of the Supreme Government of India at the Surveyor General’s Office, 1813, but November 1856.
Description
Lithographed map, with contemporary full colour wash, laid down on linen in sixteen sections, edged in blue silk; housed in two yellow cloth slipcases, the outer gilt tooled in five compartments, black morocco labels, gilt lettering and tooling, inked call number with sticker, red and white cloth ties, slightly wrinkled.
Dimensions
980 by 1310mm (38.5 by 51.5 inches).
40,000 AED
Iran becomes acquainted with the potato
Large and detailed map of Iran and its environs.
The map is inscribed by John Macdonald Kinneir to Brigadier General Sir John Malcolm. Sir John Malcolm (1769-1833) spent the majority of his career in India in the employ of the East India Company. Whilst in India he gained a keen interest in the Persian Empire that would lead him to undertake several envoys to Persia under the auspices of the East India Company. In Persia, Malcolm not only successfully introduced the potato, but also took with him several men to conduct research into the country. One such was Kinneir, who in 1813, produced a ‘Geographical Memoir of the Persian Empire’, which described in detail the routes between the major towns. The present map was intended to accompany that work.
The major reason for his research was Britain’s increasing concern over Russia gaining power within the region, and whom they feared might invade India. This battle for influence in the area would continue throughout the nineteenth century and become known as ‘The Great Game’.
Aaron Arrowsmith (1750-1823), “easily the foremost cartographer of his time” (R.V. Tooley), was the founder of the Arrowsmith dynasty of cartographers. Born in County Durham, he was in London by 1777 when he witnessed the will of Andrew Dury, a mapseller and publisher, and was probably training with him; he may have trained with William Faden, Geographer to the King, but was certainly employed by John Cary in 1782, as he is credited with the survey work for ‘Cary’s Actual Survey, of the Great Post Roads between London and Falmouth’, published in 1784; he is frequently credited with some of the survey work for Cary’s county atlas, ‘Cary’s New and Correct English Atlas: being a set of county maps from actual surveys’ (1787), but the sources are silent on this and by this time Arrowsmith had established his own business.
Arrowmsith’s maps set a new standard; he was assiduous in analysing and verifying his sources, discarding not only the fictional but also the uncertain, going to printed and manuscript sources for his information, and engraved in a clear and highly legible style. Arrowsmith was also diligent in revising and improving his maps to keep them current, and served as an inspiration for the next generation of (particularly American) surveyors.
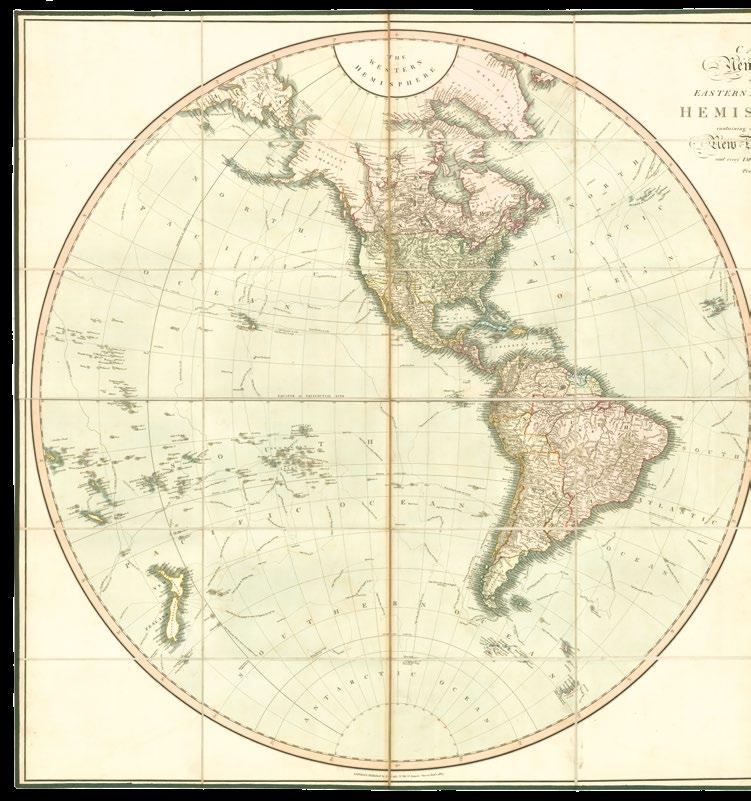
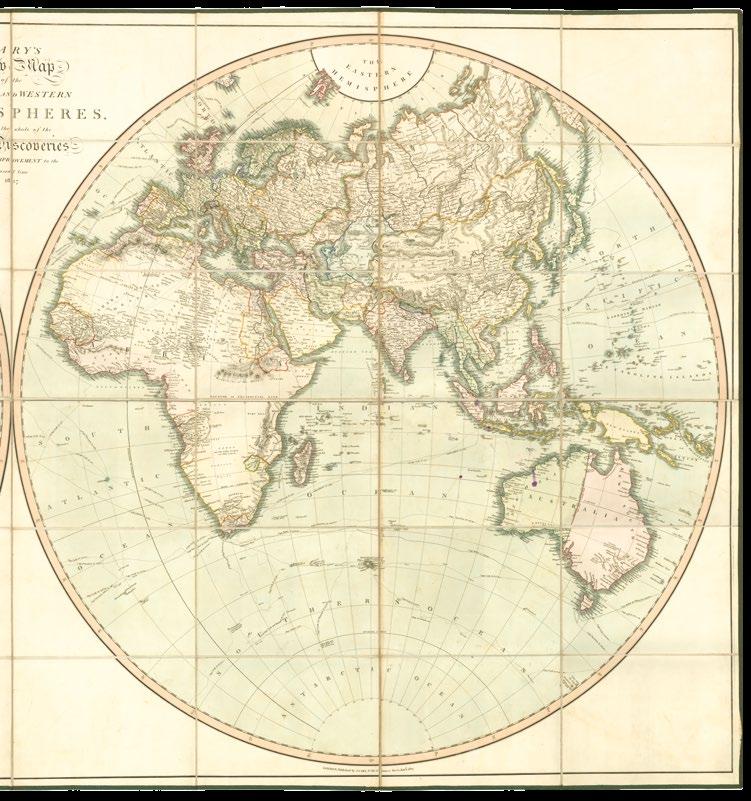
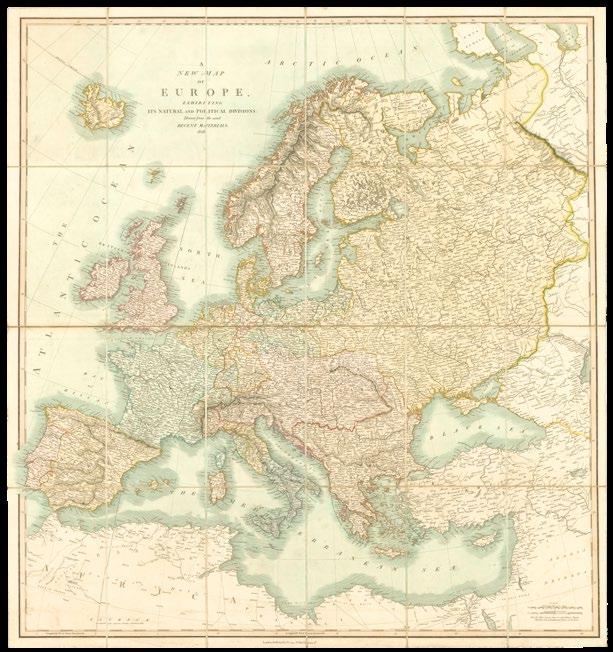
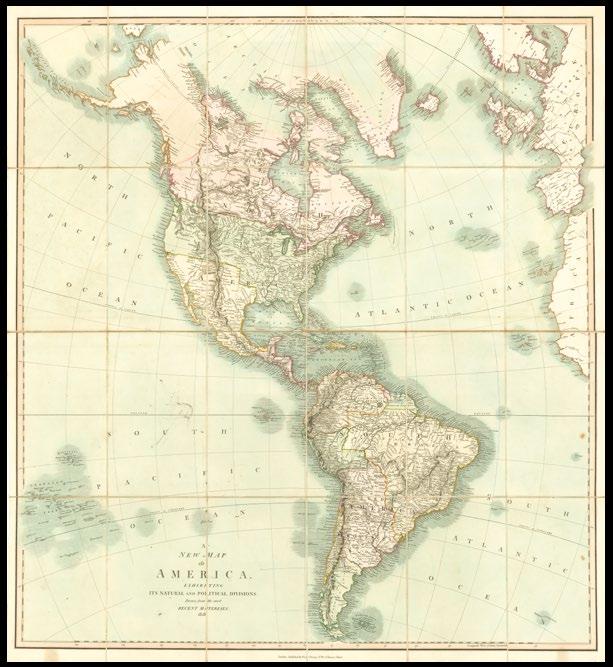
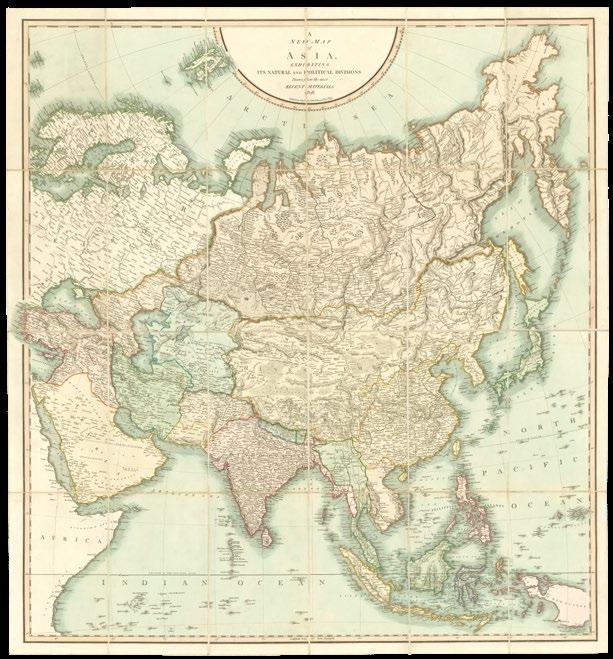
CARY, John
[World and four continents] Cary’s New Map of the Eastern and Western Hemisphere, containing the whole of the New Discoveries, and every Improvement to the Present time 1827; A New Map of Africa Exhibiting Its natural and Political Divisions Drawn from the most recent materials. 1828; A New Map of Europe exhibiting Its Natural and Political Divisions: Drawn from the most Recent Materials. 1828; A New Map of Asia, Exhibiting It’s Natural and Political Divisions Drawn from the Most Recent Materials 1828; A New Map of America, Exhibiting It’s Natural and Political Divisions Drawn from the Most Recent Materials. 1828.
Publication London, Published by J. Cary, No.86 St. James’s Street, Jan.y, 1st, 1827 & 1828.
Description
Set of five hand-coloured engraved maps, dissected and mounted on linen, each folding into original green paper slipcase, with publisher’s labels, rubbed.
Dimensions (world) 890 by 1720mm. (35 by 67.75 inches). (continents only) 920 by 860mm (36.25 by 33.75)
75,000 AED
Cary’s rare wall maps of the world and four continents
Rare set of John Cary’s four sheet world map together with his four sheet maps of the continents.
John Cary (1754-1835) was a London based cartographer active in the early part of the 19th century. Ronald Vere Tooley, the prominent English map historian, writes of Cary, “As an engraver he was elegant and exact with fine clear lettering and great delicacy of touch.” Cary began his work as an engraver, cartographer, and globe maker in 1776 with his New and Correct English Atlas. This important atlas represented a new phase in cartography where accuracy and detail rose in prominence over the decorative embellishments of the 18th century. This change was indicative of the times when travel and commerce were expanding globally as never before. Cary’s mastery of both engraving and cartography resulted in a series of seminal works that redefined mapmaking in the early 19th century. His New Universal Atlas, published in 1808, set the standard for all cartographers who followed. Cary reissued this seminal atlas in 1811, 1819, 1824, 1828, 1833, 1836 and 1844. Cary also did considerable work on the English Ordinance Survey prior to 1805. His cartographic work particularly inspired the Edinburgh school of cartography as represented by John Pinkerton and John Thomson. In America, Cary’s work was used as the basis for Tanner’s important New American Atlas. Cary’s last published atlas appeared posthumously in 1844, however, by 1850 Cary’s work was being carried on by his sons and other well-known cartographers including James Wyld, John Tallis & Company, and Crutchley. Rare. We are unable to trace an institutional example of the four sheet map of the world.
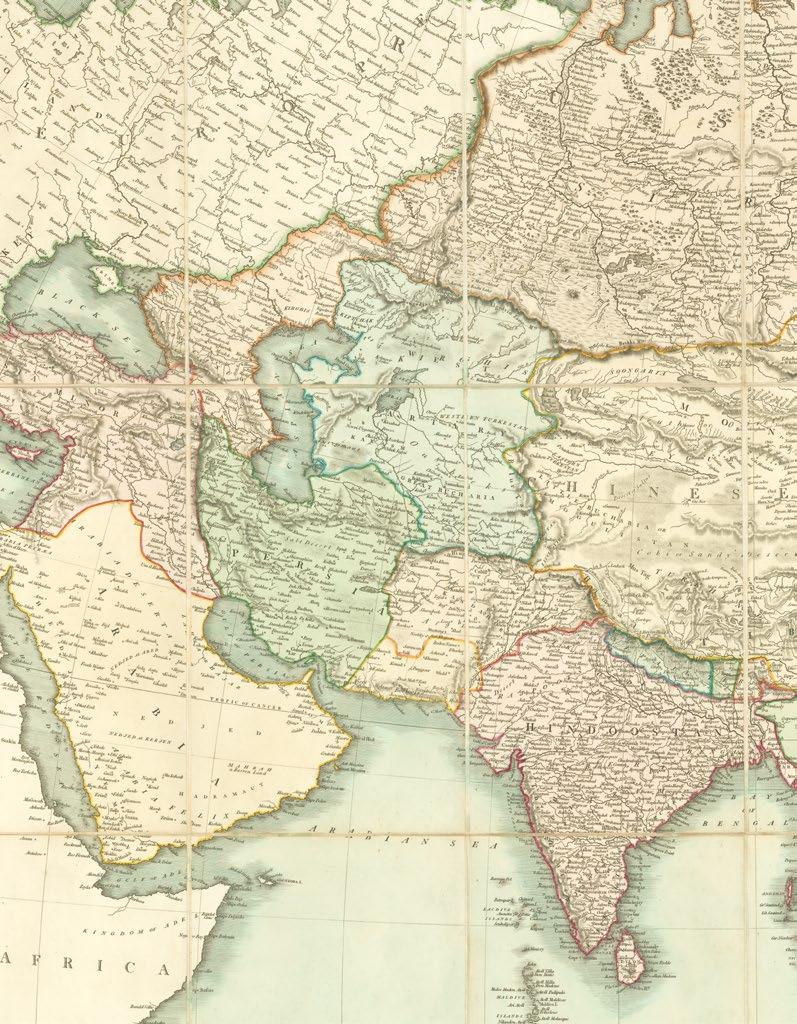
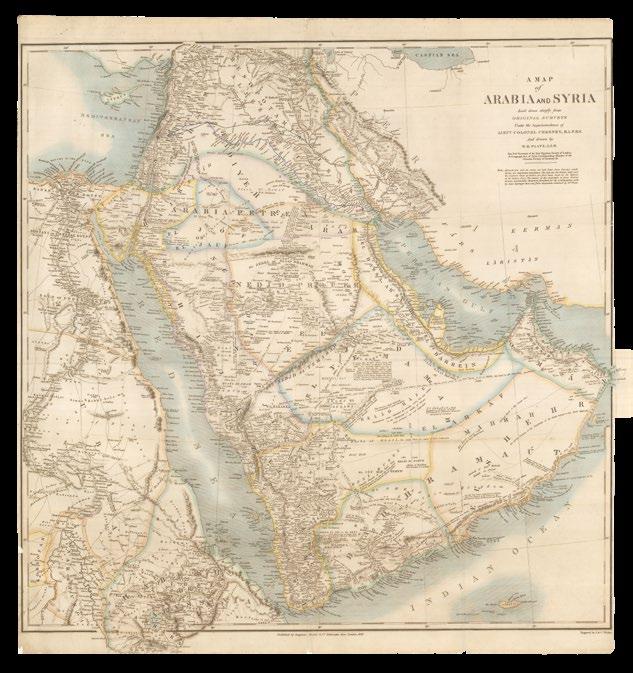
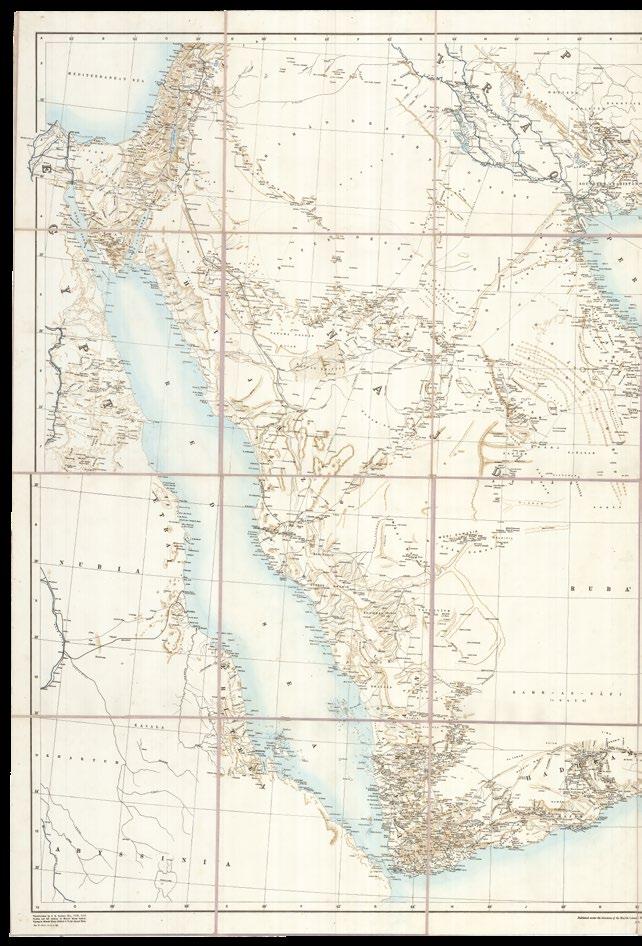
CHESNEY, [Francis Rawdon] and W[illiam] H[enry] PLATE
A Map of Arabia & Syria. Laid down chiefly from Original Surveys Under the Superintendence of Lieut. Colonel Chesney, R.A. F.R.S. And drawn by W.H. Plate, L.L.D. Hon. Forn. Secretary of the Syro-Egyptian Society of London, M. Geograph. Soc. of Paris, Corresponding Member of the Oriental Society of Germany &c.
Publication
London, Published by Longman, Brown & Co. Paternoster Row, 1849.
Description Engraved map, with hand-colour in part, left and right margin trimmed to neatline, fold-out section on right edge showing Ras al Hadd.
Dimensions
700 by 650mm (27.5 by 25.5 inches).
200,000 AED
Chesney’s and Plate’s map of Arabia and Syria
Beautifully engraved map of Arabia and Syria.
The present map was published in 1849, a revised edition of a map first published in 1847, under the title “Arabia”, of which only one institutional example is known, held at the British Library.
Cartographically, it is a compilation of various sources. As the note underneath the title explains: “Mesopotamia and its rivers are laid down from Surveys made during the Euphrates Expedition. The Red Sea, the Persian Gulf and the Southern Coast of Arabia, are from those made by the Officers of the Indian Navy. The interior of the peninsula is from various sources, particularly Materials furnished for the accompanying work by Aloys Sprenger M.D. and from documents obtained by Dr Plate”.
General Francis Rawdon Chesney (1789-1872) was a British soldier and explorer. Known for his proposal to build the Suez Canal, a proposal which would form the basis of Ferdinand de Lesseps’s undertaking, he also oversaw an 1836 survey of the River Euphrates (likely the “Euphrates Expedition” mentioned in the note on the present map), in an attempt to open a faster route between England and India for the East India Company.
The Indian Navy was the naval arm of the English East India Company, which systematically charted the Arabian Coast between 1820 and 1839. In 1820, Captain George Barnes Brucks began to chart the Arabian Gulf; in 1829, Captains Elwon, Moresby, and Careless began to chart the Red Sea; and in 1837, Captain Haines would begin to chart Aden and the southern Arabian coast. So accurate were these surveys, designed to aid shipping, encourage trade, and suppress piracy, that they would become the standard works for much of the coast until well into the twentieth century, as the present map attests.
We have been unable to trace much information about William Henry Plate. He is named as the author of the 1847 “Arabia” map, also a collaboration with Chesney, and of a map of Asia Minor, published by Edward Stanford in around 1849.
Rarity
We have located only five institutional examples of this map: the National Library of Scotland, the University of Glasgow, Harvard University, the British Library, and Qatar National Library.
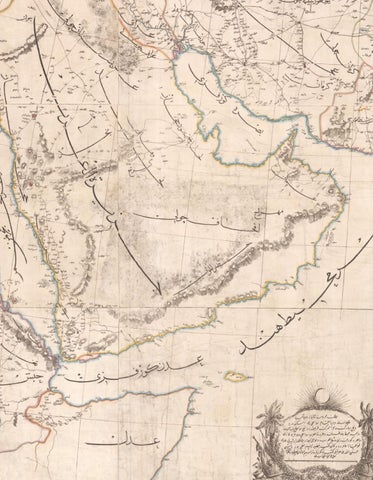
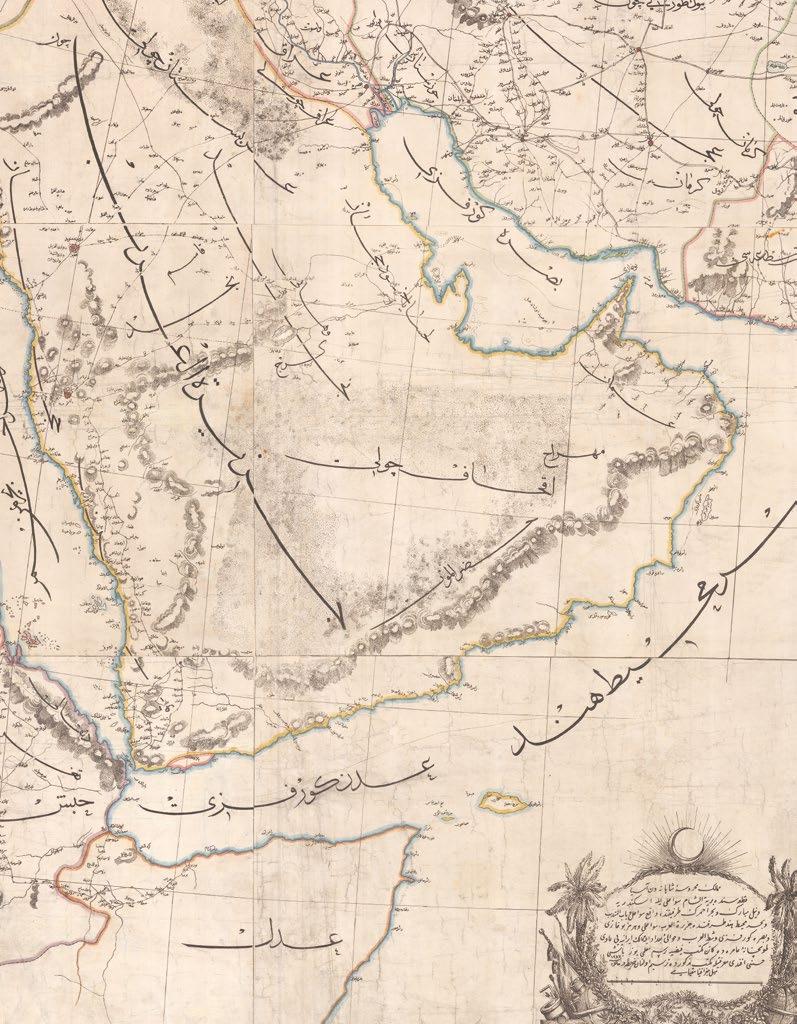
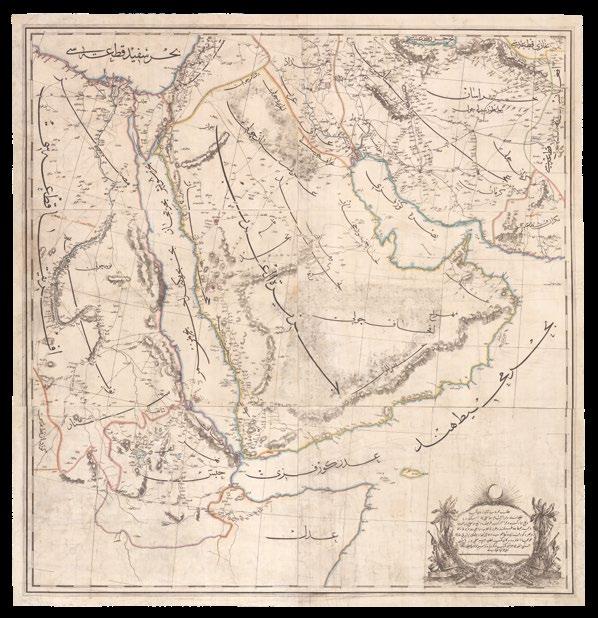
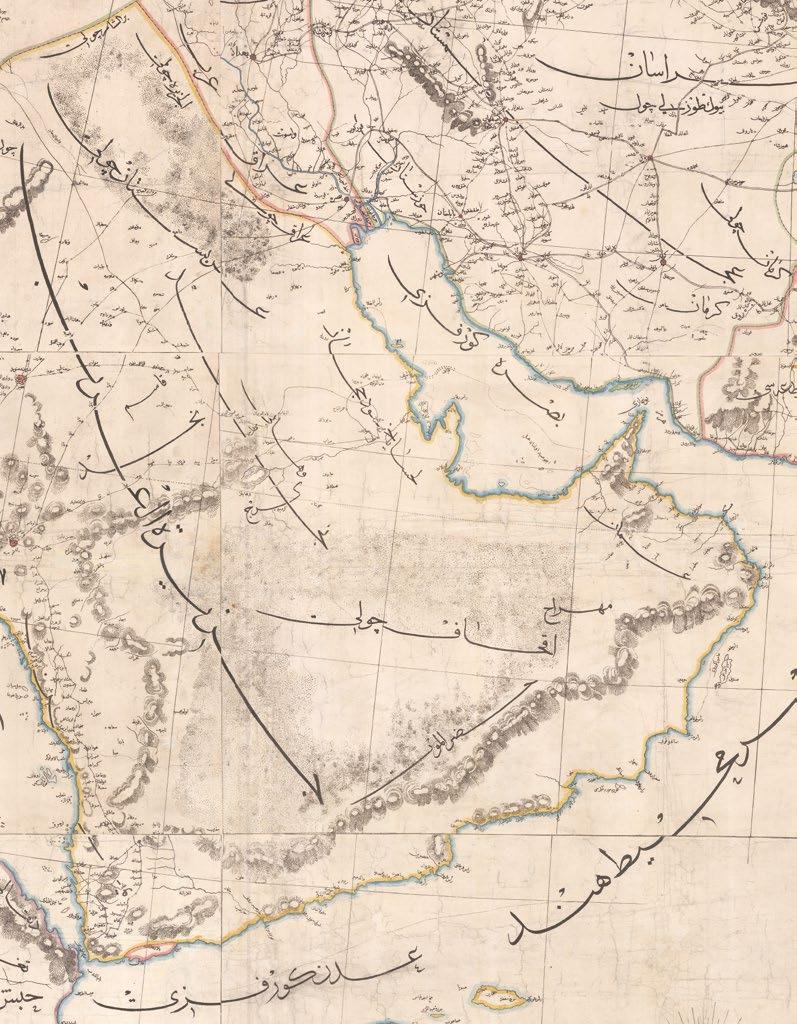
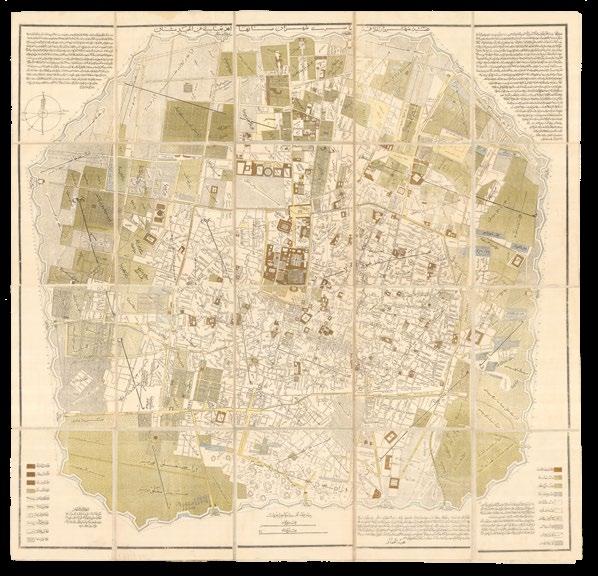
[EFENDI, Hüseyin Hüsnü] )...
The Kingdom of Asia’s Imperial Palace).
Publication [Istanbul, 1871].
Description
Lithographed map with hand-colour in outline, in six sheets joined, backed on Japan paper, some creasing and minor tears skilfully repaired
Dimensions
1000 by 980mm (39.25 by 38.5 inches).
500,000 AED
The earliest Islamic wall map of Arabia
The earliest known large-scale Islamic wall map of Arabia.
Extending from the Mediterranean and Egypt to Iran, focusing on the Arabian Peninsula. Cities, towns, roads, and geographic features such as waterways and mountains are labelled in Arabic script throughout.
The map includes particularly detailed hachures and terrain markings, including in the hithero poorly-mapped interior of Arabia. Major fortified cities including Jersualem, Damascus, Baghdad, and even cities beyond Ottoman control, such as Shiraz, are shaded red and displayed with fortifications.
The map was produced during major administrative and cartographic developments, when the Ottoman Empire was securing its fragile control of Mecca, Medina, and Yemen against both internal and external pressure.
Outside of Palestine and Iraq, most of the territory shown in the present example was beyond direct Ottoman control at the time. For instance, the Suez Canal, completed only two years before the map’s publication, is clearly demarcated, as is Najd, the large central region of Arabia and the homeland of the Wahhabi Movement and its affiliated Saudi State. The British-administered free port of Aden is also illustrated with a hand-drawn border. As these areas posed threats to the Ottomans, including them in military maps was of the utmost strategic importance.
In the preceding decades, the Ottomans embarked upon a range of modernizing reforms collectively known as the Tanzimat (’Reorganisation’). These included the most significant administrative reorganisation in centuries, replacing most eyalets (provinces or pashaliks) with more centrally-controlled vilayets. Such reforms were incomplete at the time of this map’s publication. For instance, Basra remains part of the Baghdad Eyalet on this map, but was made its own vilayet in 1875.
The primary aim of these reforms was to cement the empire’s territory, which had drastically reduced in Egypt and the Balkans. The fringes of the empire, historically ruled loosely through local intermediaries, were susceptible to European powers and nationalist movements. Amongst other concerns, the Ottomans were eager to remain overseers of Mecca and Medina, which operated largely autonomously under Ottoman protection. Aside from religious prestige, this ‘custodianship’ brought trade and business from visiting pilgrims.
The First Saudi State (Emirate of Diriyah) had briefly expelled the Ottomans from both cities in the early nineteenth century, but they were re-conquered by the Ottoman Commander of Egypt, Muhammed Ali Pasha. Although the Saudi State was crushed, it regrouped as the Emirate of Nedj (Second Saudi State) and posed a continuous threat on the frontier. Although Muhammad Ali Pasha had launched successful military campaigns, he was forced to relinquish control over Yemen due to outside diplomatic pressure, especially from Great Britain. His successors left Egypt to fall under increasingly forceful influence from Britain and
France, although they still remained problematic for the Ottomans. To the east, the Ottomans feuded with the Persian Qajar over their mutual borderlands.
Captain Hüseyin Hüsnü Efendi (1849-1911) was a military offer attached to the Tophane-i-Amire (Imperial Armory) in Istanbul. After rising from Lieutenant to Undersecretariat for Court Inspection, he shifted careers to becoming a law teacher and, later in Yemen, was appointed sheik al-Islam.
Rare: we have been unable to trace any other examples, either in institutions or on the market.
REZA, Mohammad [City of Tabriz Qajar Persia].
Publication [Qajar, July, 1880].
Description
Lithograph plan, hand-coloured, dissected and mounted on linen, large and small captions in naskhi script, the various quarters of the city outlined in orange, yellow and blue, legend at upper right, gazetteer of places at lower left.
Description 875 by 1090mm. (34.5 by 43 inches).
60,000 AED
Nineteenth Century Tabriz
The map was ordered by the Crown Prince (Muzaffar Mirza, later Muzaffar al-Din Shah) and under the supervision of Mirza ‘Abbas Khan, the colonel (sartip) in charge of the State School of Tabriz and with the teaching of Muhammad Mirza, the teacher of mathematics. It is signed by Muhammad Reza, Geometrician (muhandis) and the deputy to the Chief aide-de-camp (ajudan) (unidentified), a son of Hasan ‘Ali Khan, Colonel (sarhang) Qarajah-daghi.
[after ROSE, Frederick William]
[A Persian caricature map based on Fred Rose’s ‘Octopus’ map of 1877].
Publication [c1880].
Description Engraved maps with hand colouring, in Farsi.
Dimensions 420 by 645mm. (16.5 by 25.5 inches).
80,000 AED
The octopus in Persian
A previously unrecorded Persian serio-comic map issued around 1880 in Iran.
The octopus map is a copy of Fred Rose’s ‘Serio Comic War Map’, published in 1887 in response to the Balkan Crises. It shows imperial Russia as a menacing octopus, reaching out into Europe, forgetting the lesson learned during the Crimean War: although not the first to use the octopus to represent a power-hungry state, Rose’s map popularised it in propaganda maps from then on. The map appears to be a copy of a French variant, as a Farsi inscription at the bottom reads “Replica of a map which was published and illustrated in Paris”. This may explain the variations from Rose’s original; for example, France is shown as Marianne in Phrygian cap holding a scroll with a heart rather than as Marshal MacMahon, suggesting an Iranian sympathy with France. It therefore no longer attracts the attention of Germany as in the Rose map; Germany looks east towards Russia instead.
At the time this map was printed, Persia was ruled by Naser alDin Shah Qajar. Naser al-Din’s reign saw conflict with both Britain and Russia; the Anglo-Persian War from 1856-7 forced him to renounce the Persian claim on the city of Herat, and Russia has conquered Turkmenistan and Uzbekistan in 1881. Those within Iran were aware that the Qajar dynasty was financially dependent on both countries, even as Naser al-Din tried to regain power over Persian territories and exploit the enmity between them. This pair of maps was clearly issued together, and were intended to illustrate and satirize conflicting perspectives of the political atmosphere in Europe for an educated Iranian elite.
Abdol-Ghaffar Khan Najmol Molk
[Map of the city of the Nasserite caliphate of Tehran].
Publication
[Maḥmūd & Qulī Khān 1891 but later].
Description Coloured lithograph plan, dissected and mounted on linen.
Dimensions 1350 by 1390mm (53.25 by 54.75 inches).
50,000 AED
The most detailed and comprehensive plan published in the nineteenth century.
Spectacular folding wall map of the city of Tehran during the reign of Nasser al-Din Shah Qajar, in Farsi script.
This map by Abd al-Ghaffar Khan Najm al-Mulk (died 1908) appears to be a proposal for the redesigning of the Iranian capital. Najm al-Mulk was the Royal Astronomer to the court and an important figure in Persian cartography during the late nineteenth century. He was also the first Iranian professor of Cartography at Dar Al-Fonun University.
In 1868, Najm al-Mulk began work on this map with the help of his students, in an attempt to re-envision the capital. The map was derived from the 1858 map by the Austrian professor of Geography at Dar Al-Fonun University, Augustus Krziz who designed a blueprint of the city between 1857-1858. It has been updated here to show fortified exterior walls to the outer districts in the style of Sébastien Le Prestre de Vauban.
Both of the lower corners of the map bear detailed legends explaining land use and infrastructure, as well as highlighting iconography to identify important buildings and places of worship across the city.
Published circa 1891-1902 in Vizārat-i ‘Ulūm [Tehran] by Munajjim‘bāshī Maḥmūd and Rizā Qulī Khān.
HUNTER, F[rederick] F[raser]
Map of Arabia and the Persian Gulf.
Publication Calcutta, the Survey of India Offices, 1908.
Description
Heliozincograph map, in twenty four sheets joined, print and hand-colour in part, mounted on linen, university library stamp on verso
Dimensions 1335 by 1825mm (52.5 by 71.75 inches).
600,000 AED
Extremely rare first edition of Hunter’s map of Arabia, compiled from secret sources
First independently issued large-scale wall map of Arabia and the Persian Gulf, instantly recognised as superior in detail to its contemporaries.
Displaying a huge range of important features, including roads, routes, rivers, telegraph lines, and railways, both completed and under construction. Relief is shown by hachures and the names of numerous towns, cities and other settlements are to be found across the map, mostly congregated around the peripheries of the huge peninsula. In the bottom right corner, an extensive index gives toponyms in both English and Arabic, providing a key to the symbols, abbreviations, and even typeface used across the map.
Drawn meticulously from details supplied by both travellers, earlier official surveys, and local political agent enquiries - most of these sources were considered secret at the time. This information, collected over three years, led to an unprecedented degree of accuracy in depicting the interiors of Arabia, especially on such a grand scale.
Seeking to strengthen its links with India at the beginning of the twentieth century, Britain took measures to better understand and explore the Persian Gulf. In 1903, Lord Curzon visiting the region in 1903 and the same year, British authorities commissioned John Gordon Later to compile a handbook for British agents there. Lorimer, who had previously served as a member of the Indian Civil Service, was given six month to complete the project, which was supposed to produce a portable and easily accessible manual.
Twelve years later, his ‘Gazetteer of the Persian Gulf, Oman, and Central Arabia’, a five-thousand page document divided into two volumes. The first detailed the region’s history, while the second contained an extensive description of its geography. This second volume had actually been completed first, and was available from 1908. It contained information uncovered by Lorimer’s own research missions, 56 images of the region, and two maps. One of these showed the distribution of the peninsula’s pearling sites; the other was a depiction of the whole region.
Lieutenant Frederick Fraser Hunter (1876-1959) served as a liberal politician in Ontario, Canada. Hunter went on to become a major figure in British India’s Intelligence Service. Upon joining the Army in 1905, he was ordered to produce an up-to-date map of Arabia, which was growing in strategic significance. This mission involved twice traversing the interior of Arabia, disguised as an Arab. Although completed in 1905, disagreements over transliteration allowed Hunter to redraw and improve the map for a further three years.
When first published in 1908, Lorimer’s ‘Gazetteer’ was classified ‘for official use only’; there were under one hundred copies in circulation until its declassification in 1955, upon which its detailed historical and geographical description of the peninsula was met with great praise. Hunter’s map was instantly acknowledged as superior to any previous work of the kind and recognised as a valuable research tool. The Times Literary Supplement declared the ‘Gazetteer’’s geographical section as “without modern substitute” in 1971.
Rare: we have traced this map in two auction sales, but only for the 1914 edition (Christie’s in 2012; Sothebys in 2013). Not in Al-Qassimi.
[ANONYMOUS]
[Persian World Map].
Publication [Iran], 1911.
Description
Lithograph map, hand-coloured, dissected and mounted on linen.
Dimensions
690 by 860mm (27.25 by 33.75 inches).
40,000 AED
Arabic World Map
Large and detailed early twentieth century world map in Arabic. The map, based on European maps of the time, consists of a twin hemisphere world surrounded by stereographic and polar projections, and diagrams of the frigid, temperate, and arid zones.
CARRUTHERS, Alexander
Douglas Mitchell
Northern Arabia. Shakespear’s Last Journey. Carruthers.
Publication [London], War Office for the Geographical Society, 1922.
Description
Chromolithograph map, folded.
Dimensions
705 by 990mm. (27.75 by 39 inches).
10,000 AED
Captain William Shakespeare’s last journey
British explorer, naturalist and cartographer, Alexander Douglas Mitchell Carruthers (1882-1962), travelled widely throughout the early twentieth century. After studying at Cambridge, he became a secretary to the scholars of the Royal Geographical Society, and thereby came to train as a surveyor. His marriage in 1815 seems to have put an end to his explorations abroad, as from then on Carruthers dedicated himself to compiling maps of the Middle East for the War Office in London. In this role, he worked with cartographic information provided from important contemporary figures including Gertrude. Bell, Harry St. John Bridgen Philby, T.E. Lawrence and Captain William Shakespear.
The latter, who was the first European to map large swathes of the Arabian interior, is credited on the present chart. The tracks of his final journey are shown and overprinted notations in red highlight his achievements. Shakespear was a key link between the British authorities and the al Sau: in fact he was the one to arrange the first ever photograph of Ibn Saud, who would soon become King of Arabia.
Britain’s keen interest in consolidating its relationship with the Middle East is evidenced by the cartographical effort it sponsored in the region during the 1920s. The Royal Geographical Society commissioned numerous surveys of the Levant and Arabian Peninsula during this time, including the present map, which extends from the Mediterranean in the west to the “Persian Gulf” in the east.
It is a highly detailed piece of cartography, presenting towns, cities, roads and railways in black, lakes, rivers and wadis in blue, and desert areas in brown, with the Nefud Desert and its prominent dunes occupying the centre of the map. Many mountains are labelled, with contour lines to represent relief. The Jaffa-Jerusalem section of the Hejaz Railway is shown, running through Amman in the north and extending south towards Medina. Although intended to extend all the way to Mecca, efforts to complete the railway were hampered by the First World War.
US GEOLOGICAL SURVEY, ARABIAN AMERICAN OIL COMPANY
Geologic Map of the Arabian Peninsula. Compiled by the U.S. Geological Survey and the Arabian American Oil Company under the joint sponsorship of the Kingdom of Saudi Arabia, Ministry of Petroleum and Mineral Resources, and the U.S. Department of State.
Publication Washington, D.C., The US Geological Survey, 1963.
Description Chromolithograph map.
Dimensions
1290 by 1850mm (50.75 by 72.75 inches).
References Powers, Ramirez, Redmond, Elberg, Geology of the Arabian Peninsula, Sedimentary Geology of Saudi Arabia, U.S. Geological Survey Professional Paper, 1966.
75,000 AED
Black Gold
Large and detailed map depicting the geology of the Saudi Arabian Peninsula.
The search for oil on the Peninsula started in 1933, when the Saudi Arabian government granted an oil concession to Standard Oil Co. of California (which was later joined by Texaco buying a 50% stake in the concession). Geologists soon followed to start the surface mapping of the area and beyond, achieving by 1937 a broad understanding of the region’s geological strata. The first test to yield oil was in Dhahran on 4 March 1938.
After a hiatus during WWII, the activity of surveying and test-drilling resumed with reinvigorated effort. Aerial photography was introduced in 1949 and proved an invaluable tool for the surveying. In 1954 the US Geological Survey and Aramco, the Arabian American Oil Company, began work on a series of geological and geographic maps which would incorporate the data collected over the years. The project was sponsored by the US Department of State and the Kingdom of Saudi Arabia. The effort resulted in 1:500,000-scale geologic sheets and a 1:200,000-scale geological map of the Arabian Peninsula, and the base topographical map - the present maps.
The geological map delineates the strata of the peninsula, with colour codes in two tables on either sides, and text within the blank regions of Eastern Africa and Iran. A paper to accompany the map and further explain the geology was published in 1966 by the US Geological Survey.
Aeronautical charts of the Middle East during a period of waning British influence
MINISTRY OF DEFENCE
ONC-H-5 [and] ONC-H-6.
Publication
London, Ministry of Defence, 1969.
Description
Double-sided map printed on rayon.
Dimensions
1040 by 780mm. (41 by 30.75 inches).
1,250 AED
Operational Navigation Charts (ONCs) were used by British military forces throughout the latter twentieth century, issued to Special Forces and Aircrew. Based on topographic maps produced by the American Defence Mapping Agency at a scale of 1:1,000,000 metres, they spanned a wide region and were designed to help pilots to identify the area below them. Outlining different types of terrain, significant landmarks and notable topographic features, the charts allowed pilots flying between 2,000 and 25,000 feet at high speeds to efficiently and accurately recognise their location. In the event of an unintended landing, ONCs doubled as Escape And Evasion Charts, their durable material making them suitable for harsh conditions and also easy to hide.
ONCs were two-sided, with a different map printed on either side. To the recto of the present example is ONC-H-5, showing parts of Saudi Arabia, Iraq, Jordan, Israel and Egypt, while the verso, ONC-H-6, focuses on the central Saudi region of Riyadh. Toponyms are minimal, with only most important cities and sites labelled by name, such as Damascus, Riyadh, and Baghdad, but relief, rivers, bodies of water, routes and settlements are all depicted in detail. Relief is shown by contours, shading, tints and spot heights, with warnings in several regions that “relief data incomplete”.
Along the lower edge of ONC-H-5, there is a simple glossary giving the English meaning of Romanised Arabic terminology; to the left of ONC-H-6, there is a great deal more useful information. Legends explain “maximum elevation data”, “spot elevations” and “aeronautical information”, while symbols and diagrams explain further details. At the bottom of both maps are three-part scale bars.
This edition of ONC-H-5 and ONC-H-6 was published in 1969, in a period of waning British influence in the Middle East. During the later stages and aftermath of the Second World War, the British government had responded to the growing tide of nationalism in many Arab countries by attempting to ingratiate itself with the newly formed League of Arab States. Their efforts, however, were largely thwarted by anti-Western feeling, greatly encouraged by Soviet influence in the region, which was on its way to becoming a secondary arena for Cold War tensions.
Furthermore, during the following decade, the United States began take over what had been the British monopoly on Middle Eastern oil concessions. America thus started to exert more diplomatic power in the region, especially in Saudi Arabia, where it established an air base, built the Trans-Arabian Pipeline (marked on ONC-H-5), and became the dominant foreign source of arms. In contrast, Anglo-Saudi relations were compromised by the Buraymi Oasis Dispute, which led to armed conflict between Saudi Arabia and local tribes supported by British forces between 1952 and 1955. In 1955, the western powers made a final attempt to promote its influence in the Middle East with the. Baghdad Pact, a multilateral military aid treaty signed by Britain, Iraq, Turkey,
Iran, and Pakistan. With the exception of Iraq, every other Arab state refused to join the Pact, again demonstrating the decline of British authority in the region.
This decline was consolidated by the events of the 1960s, as revolutions in Syria, Iraq and Libya saw the ascendence of radical anti-Western regimes, Britain was forced to evacuate its important military headquarters at Aden, Yemen, the British economy was weakened by the closure of the Suez Canal during the Arab-Israel War, and Prime Minister Harold Wilson announced, at the beginning of 1968, withdrawal of all British forces from the Persian Gulf by the end of 1971.
The present maps were produced during this turbulent period of Middle Eastern history, in which Britain found itself increasingly side-lined. Restrictions on western presence and authority in the region is demonstrated by legends on the map warning that “flying over JORDAN without prior approval is PROHIBITED” and “all aircraft overflying IRAQ must remain within the boundaries of airways, advisory routes or permitted flying routes unless otherwise authorised by ATC”.
ABDULLAH, Muhammad Morsi; and Federico de AGOSTINI
[Physical map of Abu Dhabi].
Publication
Beirut, Dar Akashaf, [c1971].
Description
Chromolithograph map, folding into original publisher’s card covers.
Dimensions
950 by 130mm (37.5 by 5 inches).
140,000 AED
The first map of Abu Dhabi as the capital of the UAE
The first, the rarest, and the most detailed map of Abu Dhabi as the capital of the United Arab Emirates, commissioned by Sheikh Zayed, the first president of the UAE, and published just after the formal establishment of the UAE, on December 2, 1971.
The map extends from Qatar, in the west, to Sharjah, in the east. To the left, an explanatory key sets out various points of interest, including: terrain, waterways, roads, oil fields, and archaeological sites. In the Gulf, areas shaded in purple indicate spots for pearl diving. To the right, explanatory text sets out the geography of Abu Dhabi. Below the map are four insets, showing: oil concessions (colour-shaded by company), the Liwa oasis villages, a town-plan of Al-Ain, and a town-plan of Abu Dhabi.
Illustrated on the cover are Sheikh Zayed, the Qasr Al Hosn fort, and the shoreline of Abu Dhabi.
The map was produced by Muhammad Morsi Abdullah (1929-2005), historian, cartographer, and social scientist, who would serve as the director for the Centre for Documentation and Research (precursor to the UAE National Archives). He was responsible for the first official maps both of Abu Dhabi and of the UAE and would write ‘The United Arab Emirates: A Modern History’, in 1978.
Morsi’s work incorporates that of Italian cartographer Federico de Agostini (1905-1960), son of Giovanni de Agostini, who had founded, in 1901, the Istituto Geografico De Agostini, which published atlases and calendars. Federico would produce a range of maps, textbooks, and encyclopedias, with some of his work in Arabic.
Rare
The Arabic edition of the present map is particularly rare. We have only been able to trace four institutional examples: University of California, Berkeley; Library of Congress; The National Security Agency (US); and Texas A&M University Libraries.
MUSTAFA, Ezzedin Ibrahim; and Muhammad Morsi ABDULLAH
United Arab Emirates.
Publication
Maidenhead & Abu Dhabi, Fairey Surveys Ltd & Centre for Documentation and Research, Ministry of Cabinet Affairs, 1973.
Description
Chromolithograph map, folding into publisher’s blue paper covers.
Dimensions 970 by 1200mm (38.25 by 47.25 inches).
90,000 AED
A landmark in the cartography of the
UAE
The first English edition of a landmark in the cartography of the UAE, the most detailed map of the region to be published to this point, just two years after the formal establishment of the UAE, on December 2, 1971.
The map illustrates, in the year before the Treaty of Jeddah (1974), the undefined borders between the UAE and Qatar, the UAE and Saudi Arabia, and the UAE and Oman, all of which would go on to be contested.
In the Gulf, pearl fisheries are denoted in pink, while infrastructure including oil fields, airports, and water pipelines are also depicted. Abu Dhabi, Dubai, and Sharjah are all marked, as are the villages around the Liwa Oasis. Below the map is an inset showing the UAE in its broader regional context, an inset showing the areas populated by different oil companies (including Abu Dhabi Oil Company, Pan Ocean Oil Company, and Dubai Petroleum Company), along with a table of oil production, between 1968 and 1972, and some explanatory text about the United Arab Emirates (which opens: “On 2/12/1971 the birth of the U.A.E. was announced”).
This English edition would be issued simultaneously with an edition in Arabic.
The map was produced by Muhammad Morsi Abdullah (1929-2005), historian, cartographer, and social scientist, who would serve as the director for the Centre for Documentation and Research (precursor to the UAE National Archives). He was responsible for the first official maps both of Abu Dhabi and of the UAE and would write ‘The United Arab Emirates: A Modern History’, in 1978.
Ezzedin Ibrahim Mustafah (1928-2010) was an Egyptian-born scholar, who would serve as cultural adviser to Sheikh Zayed, playing a fundamental role in the establishment of the Cultural Foundation in Abu Dhabi, comprising: the National Archives, National Library, and Institute of Culture and Art. In recognition of his work, he would be granted citizenship of the UAE.
MUSTAFA, Ezzedin Ibrahim; and Muhammad Morsi ABDULLAH
[United Arab Emirates].
Publication
London & Abu Dhabi, George Philip & Son & Centre for Documentation and Research, Ministry of Cabinet Affairs, 1974.
Description
Chromolithograph map, folding into publisher’s blue paper covers.
Dimensions 587 by 735mm (23 by 29 inches).
37,500 AED
Arabic edition of a landmark in the cartography of the UAE
Arabic and smaller-format edition of a landmark in the cartography of the UAE, the most detailed map of the region, first published in 1973, just two years after the formal establishment of the UAE, on December 2, 1971.
The map illustrates, in the year before the Treaty of Jeddah (1974), the undefined borders between the UAE and Qatar, the UAE and Saudi Arabia and the UAE and Oman, all of which would go on to be contested.
In the Gulf, pearl fisheries are denoted in pink, while infrastructure including oil fields, airports, and water pipelines are also depicted. Abu Dhabi, Dubai, and Sharjah are all marked, as are the villages around the Liwa Oasis. Below the map is an inset showing the UAE in its broader regional context, an inset showing the areas populated by different oil companies (including Abu Dhabi Oil Company, Pan Ocean Oil Company, and Dubai Petroleum Company), along with a table of oil production, between 1968 and 1972, and some explanatory text about the United Arab Emirates.
This Arabic edition would be issued simultaneously with an edition in English.
The map was produced by Muhammad Morsi Abdullah (1929-2005), historian, cartographer, and social scientist, who would serve as the director for the Centre for Documentation and Research (precursor to the UAE National Archives). He was responsible for the first official maps both of Abu Dhabi and of the UAE and would write ‘The United Arab Emirates: A Modern History’, in 1978.
Ezzedin Ibrahim Mustafah (1928-2010) was an Egyptian-born scholar, who would serve as cultural adviser to Sheikh Zayed, playing a fundamental role in the establishment of the Cultural Foundation in Abu Dhabi, comprising: the National Archives, National Library, and Institute of Culture and Art. In recognition of his work, he would be granted citizenship of the UAE.
LANDSAT
[Group of four aerial photographs of Abu Dhabi].
Publication 1984-1985.
Description
Dimensions 855 by 805mm. (33.75 by 31.75 inches).
400,000 AED
A group of four mammoth aerial photographs of Abu Dhabi, most likely commissioned for a construction firm, taken at a point when the city was in the midst of rapid development.
Aerial photography and cartography share a deep artistic and scientific relationship rooted in the ways both practices translate the earth’s surface into visual form. While cartography traditionally relies on symbolic representation and abstraction, aerial photography offers a direct visual record of landscapes. Together, they create a dialogue between realism and interpretation, between the literal and the symbolic, and between the observable world and human patterns of meaning.
Shared Visual Languages
Both aerial photography and cartography engage with scale, perspective, and spatial accuracy. An aerial photograph, taken from above, flattens the landscape into a plane, much like a map. This bird’s-eye view eliminates the immediacy of ground-level perception, replacing it with a detached, omniscient perspective that emphasizes form, pattern, and relation. Cartographers have historically used this vertical perspective as the foundation of map-making, abstracting geographic features from either direct observation, surveys, or - later - the photographic record.
This shared viewpoint has artistic implications. Seen from above, landscapes organize themselves into patterns of symmetry, rhythm, and contrast. Agricultural fields resemble geometric mosaics; rivers carve graphic lines; and cities display intricate grids or organic webs. Both cartographic drawings and aerial photographs highlight this aesthetic of order and abstraction, often blurring the boundary between functional technique and visual art.
From Documentation to Interpretation
A twentieth-century shift brought aerial photography into the realm of cartographic practice as tools like photogrammetry were developed. Photographs became raw data for map-making, yet artists also recognized their visual power as independent works, not merely technical resources. Similarly, maps have always walked a line between utility and artistry. Medieval maps, with their elaborate illustrations, and modern artistic maps that emphasize concept over accuracy, demonstrate how mapping is as much an act of storytelling as it is one of measurement. Aerial photographs extend this tradition, creating images that are truthful records yet still demand interpretation, inviting viewers to consider the aesthetic and symbolic qualities of land.
Both practices involve choices of framing, emphasis, and omission. A cartographer simplifies a world full of infinite data into a legible system of symbols, colours, and boundaries. An aerial photographer
Four mammoth c-type photographs, on Kodak paper.
frames particular regions, angles, and moments that highlight shapes invisible from the ground. In this way, both acts turn complex realities into constructed narratives. Artistically, this creates parallels with painting: just as a painter emphasizes certain features to reveal essence or mood, both cartographer and aerial photographer reveal the hidden structures of place.
Landsat
Landsat is the world’s longest-running land-observing satellite program, launched in 1972 and jointly managed by NASA and the US Geological Survey[astronomy +1]. Its satellites capture multispectral images every 16 days, enabling monitoring of agriculture, climate change, and disasters, with all resulting data available to the public for free.
Original Landsat colour prints from the early years of the program (1970s–1980s) are quite rare, especially as stand-alone colour photographic prints and mosaics, because they were produced in limited quantities for government, scientific, and select public uses, rather than commercial distribution or mass retail sales.
Individual Landsat colour prints—especially large-format mosaics or photoprints from the 1970s and early 1980s—were expensive to produce and priced accordingly (large colour prints could cost hundreds to over a thousand dollars, even in the 1980s), restricting their circulation.
[LANDSAT, attributed to]
[Aerial photograph of Dubai].
Publication [c1984-1985].
Description
Mammoth c-type photograph, on Kodak safety paper, pinhole marks to corners, small tear to right margin. Together with Gabriel, ‘The Dubai Handbook’ (1987).
Dimensions 1267 by 1254mm. (50 by 49.25 inches).
150,000 AED
Dubai from the sky
Mammoth aerial photograph of Dubai, taken at a vital point in its development.
The image would almost certainly have been commissioned for a construction firm, the pinholes in the corners of the photograph suggesting that, at one stage, it would have been pinned up on an office wall. Visible in the photograph are the Dubai Creek, flowing into Port Rashid, Dubai International Airport, with two aeroplanes, and the World Trade Centre, construction of which had been completed in 1979.
Aerial photography and cartography share a deep artistic and scientific relationship rooted in the ways both practices translate the earth’s surface into visual form. While cartography traditionally relies on symbolic representation and abstraction, aerial photography offers a direct visual record of landscapes. Together, they create a dialogue between realism and interpretation, between the literal and the symbolic, and between the observable world and human patterns of meaning.
Shared Visual Languages
Both aerial photography and cartography engage with scale, perspective, and spatial accuracy. An aerial photograph, taken from above, flattens the landscape into a plane, much like a map. This bird’s-eye view eliminates the immediacy of ground-level perception, replacing it with a detached, omniscient perspective that emphasizes form, pattern, and relation. Cartographers have historically used this vertical perspective as the foundation of map-making, abstracting geographic features from either direct observation, surveys, or - later - the photographic record.
This shared viewpoint has artistic implications. Seen from above, landscapes organize themselves into patterns of symmetry, rhythm, and contrast. Agricultural fields resemble geometric mosaics; rivers carve graphic lines; and cities display intricate grids or organic webs. Both cartographic drawings and aerial photographs highlight this aesthetic of order and abstraction, often blurring the boundary between functional technique and visual art.
From Documentation to Interpretation
A twentieth-century shift brought aerial photography into the realm of cartographic practice as tools like photogrammetry were developed. Photographs became raw data for map-making, yet artists also recognized their visual power as independent works, not merely technical resources. Similarly, maps have always walked a line between utility and artistry. Medieval maps, with their elaborate illustrations, and modern artistic maps that emphasize concept over accuracy, demonstrate how mapping is as much an act of storytelling as it is one of measurement. Aerial
photographs extend this tradition, creating images that are truthful records yet still demand interpretation, inviting viewers to consider the aesthetic and symbolic qualities of land.
Both practices involve choices of framing, emphasis, and omission. A cartographer simplifies a world full of infinite data into a legible system of symbols, colours, and boundaries. An aerial photographer frames particular regions, angles, and moments that highlight shapes invisible from the ground. In this way, both acts turn complex realities into constructed narratives. Artistically, this creates parallels with painting: just as a painter emphasizes certain features to reveal essence or mood, both cartographer and aerial photographer reveal the hidden structures of place.
Landsat
The photograph is attributed to Landsat, the world’s longest-running land-observing satellite program, launched in 1972 and jointly managed by NASA and the US Geological Survey[astronomy +1]. Its satellites capture multispectral images every 16 days, enabling monitoring of agriculture, climate change, and disasters, with all resulting data available to the public for free.
Original Landsat colour prints from the early years of the program (1970s–1980s) are quite rare, especially as stand-alone colour photographic prints and mosaics, because they were produced in limited quantities for government, scientific, and select public uses, rather than commercial distribution or mass retail sales.
Individual Landsat colour prints—especially large-format mosaics or photoprints from the 1970s and early 1980s—were expensive to produce and priced accordingly (large colour prints could cost hundreds to over a thousand dollars, even in the 1980s), restricting their circulation.