


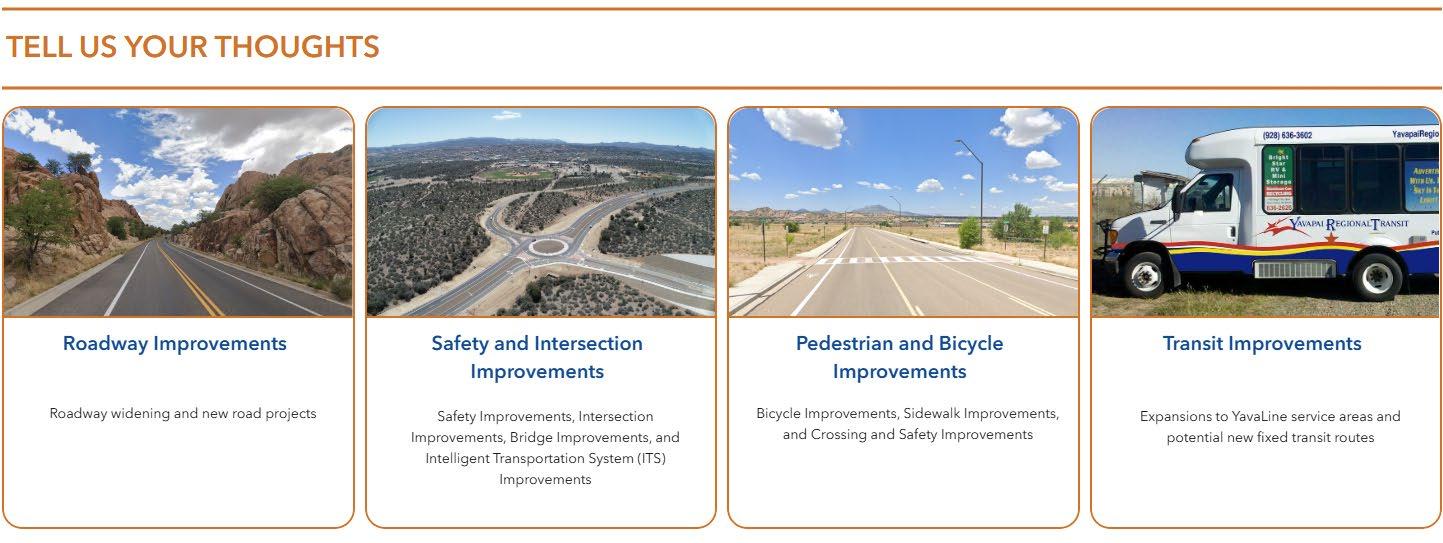
What is Move 2050?
The Central Yavapai Metropolitan Planning Organization (CYMPO) is the federally designated metropolitan planning organization (MPO) of the quad-cities urban area in north central Arizona. CYMPO member agencies include the City of Prescott, towns of Prescott Valley, Chino Valley, and Dewey-Humboldt, Yavapai County, and the Arizona Department of Transportation (ADOT). Additional participating agencies in CYMPO regional transportation planning include the Yavapai-Prescott Indian Tribe, United States Forest Service, and the Arizona State Transportation Board.


• A federally designated organization as approved by the governor and the local governments of the MPO
• Represents Census-designated urbanized areas with populations exceeding 50,000
In recent years, CYMPO has undertaken several planning studies to promote safety and multimodal transportation and improve existing transportation facilities in the region. The CYMPO region is experiencing ongoing population growth and increasing transportation demand. Accordingly, CYMPO is updating its Regional Transportation Plan (RTP), which is a federally required document. The RTP, called Move 2050, provides a long-term vision for the region’s transportation network through the horizon year of 2050. This update establishes regional objectives and potential transportation projects to address future needs, while balancing development and preserving the area’s rural culture.
The Move 2050 RTP defines the region’s strategy for creating a regional transportation system that addresses the current mobility needs of residents while planning for future needs. It is a 25-year transportation plan developed for CYMPO and its member agencies. Move 2050 develops a strategy for implementation of transportation improvement funds between now and 2050 within CYMPO’s planning area boundary.
• Serves as a long-term blueprint for the region’s transportation system
• Fulfills federal requirements and serves as the region’s 25-year vision
• Guides federal funding allocation to transportation projects and programs
• Exists as a flexible document that may be amended and is required to be updated every 5 years to ensure that it continues to meet the region’s needs
As part of the Move 2050 development, goals for the RTP process were developed to ensure it aligns with the specific needs of the CYMPO region. The goals for the Move 2050 process include:
Spatial data on existing transportation facilities and surrounding context is maintained by local, regional, and state agencies and is inconsistent in the type and quality of the maintained data. The RTP will develop consistent, regional data for use by CYMPO and its member agencies.
The RTP identifies a cohesive vision for transportation needs and priorities, along with measurable objectives to reflect how the region wants to evolve its multimodal transportation networks and the tools to measure progress toward its goals.
A quantitative analysis of regionally significant corridors will identify where investing the region’s limited transportation dollars in improvements will provide maximum benefit to the region’s residents and the environment.
The planning process includes engagement with the public and targeted stakeholders throughout to ensure that publicly supported investments are recommended and to promote CYMPO as a resource for regional planning.
The Plan meets all federal requirements for long-range transportation planning to ensure federal funds continue to flow to the CYMPO region.
The Move 2050 development process prioritizes community involvement, with opportunities for stakeholder feedback occurring throughout the process shown in Figure 1. It is important to recognize that member agencies and community members have considerable insight into the places they travel and the implementation feasibility of the Move 2050 RTP’s recommendations.
1. Move 2050 Development Process
The first step of the RTP development was to review the region’s current conditions. During the region assessment, public and stakeholder input was used to enhance understanding of current conditions. Strategies to evaluate existing conditions included geospatial analysis using mapping software, a review of federal, state, and local sources of transportation and land use data, review of public feedback on the existing transportation network, and review of previous planning studies done by CYMPO and its member agencies.
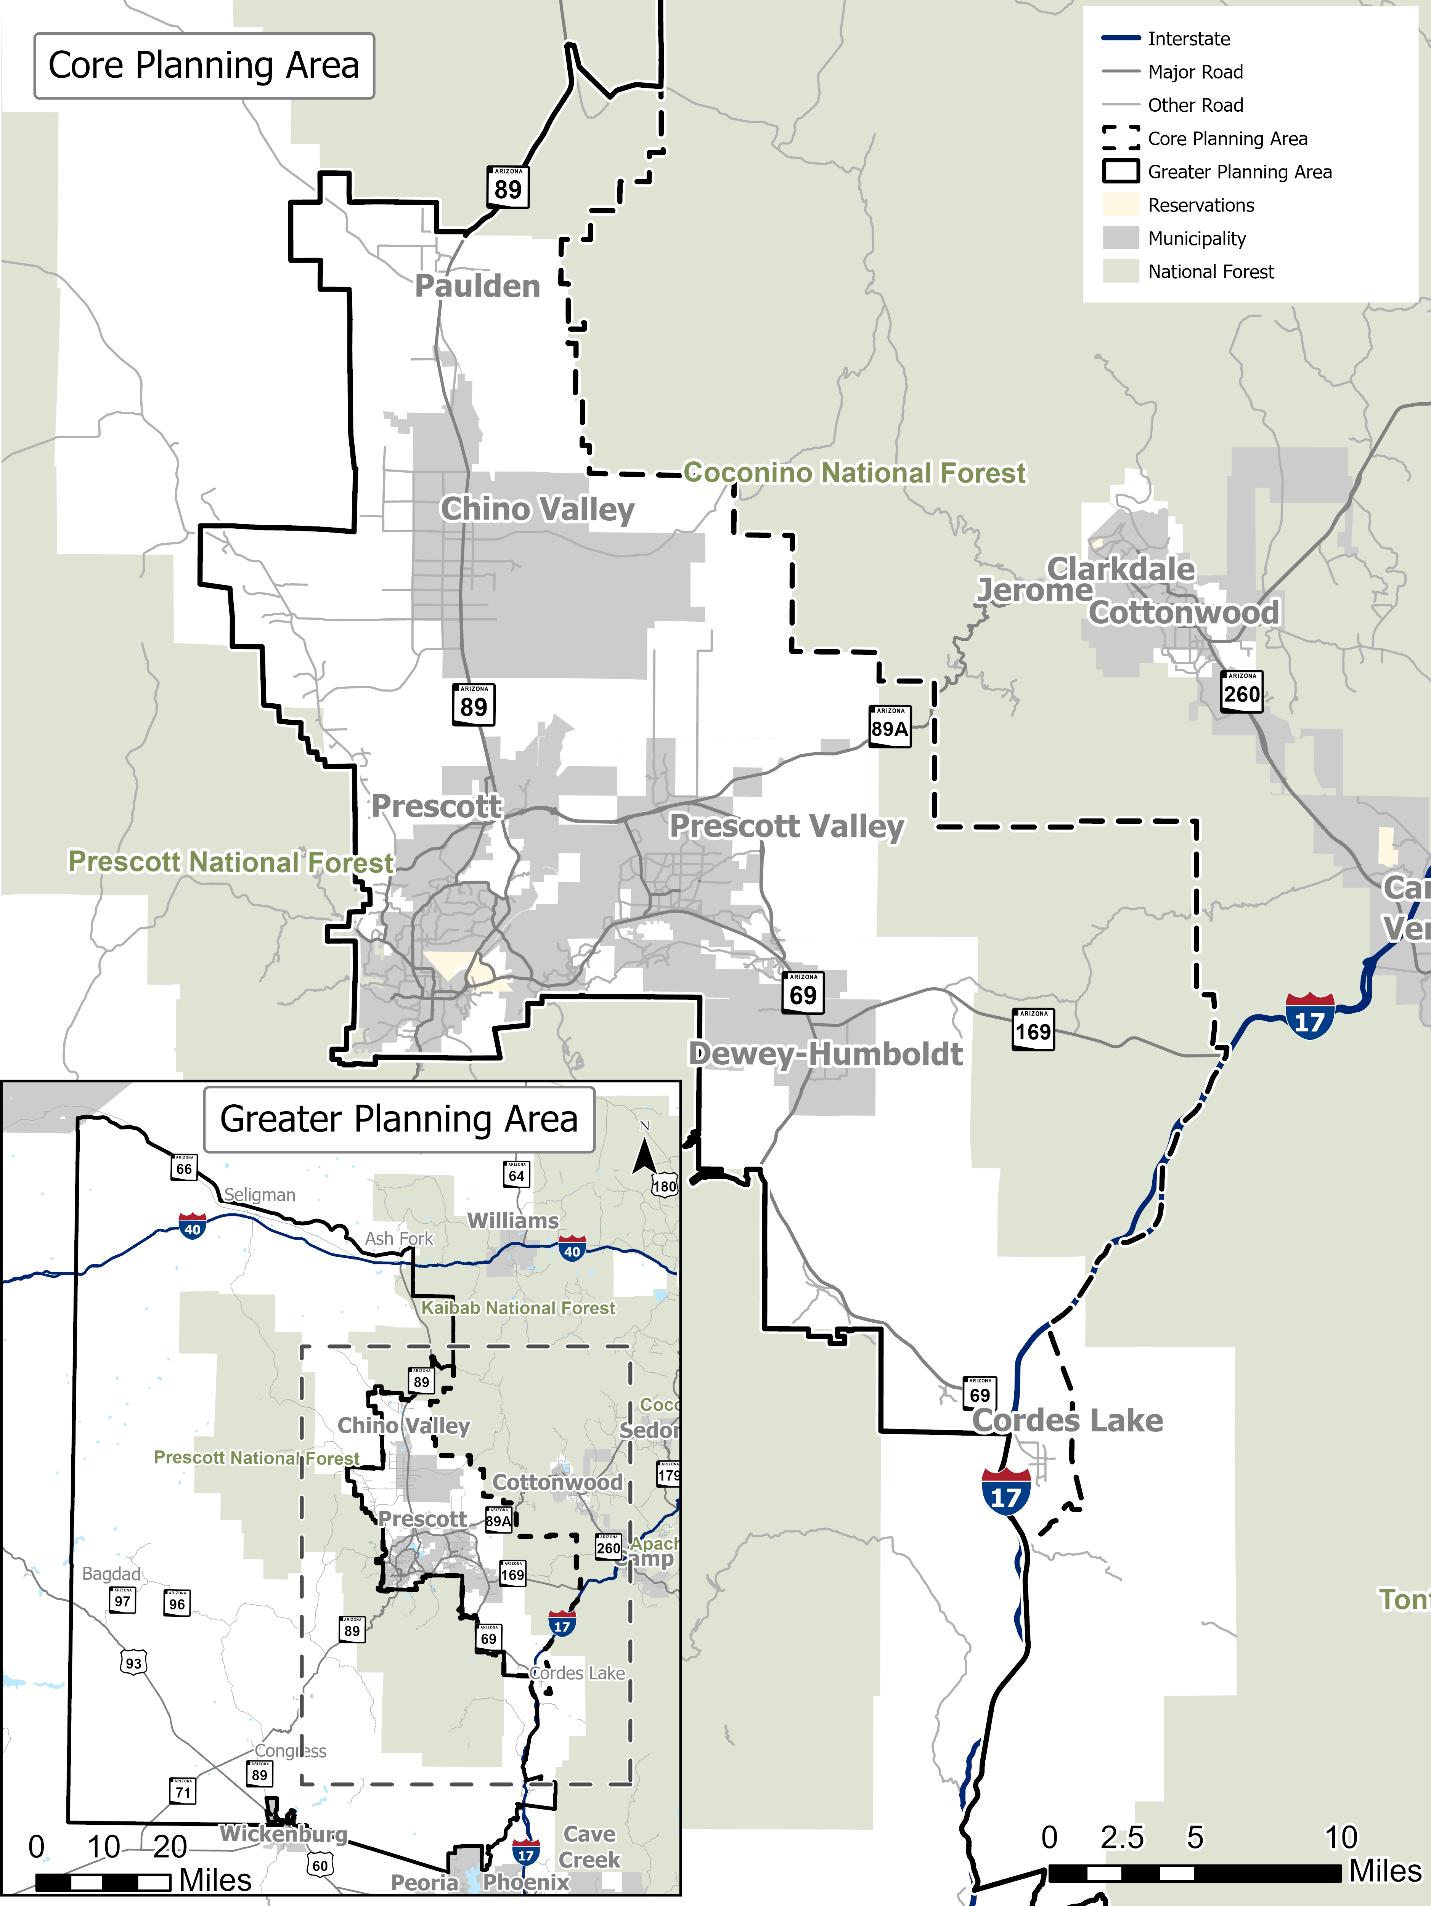
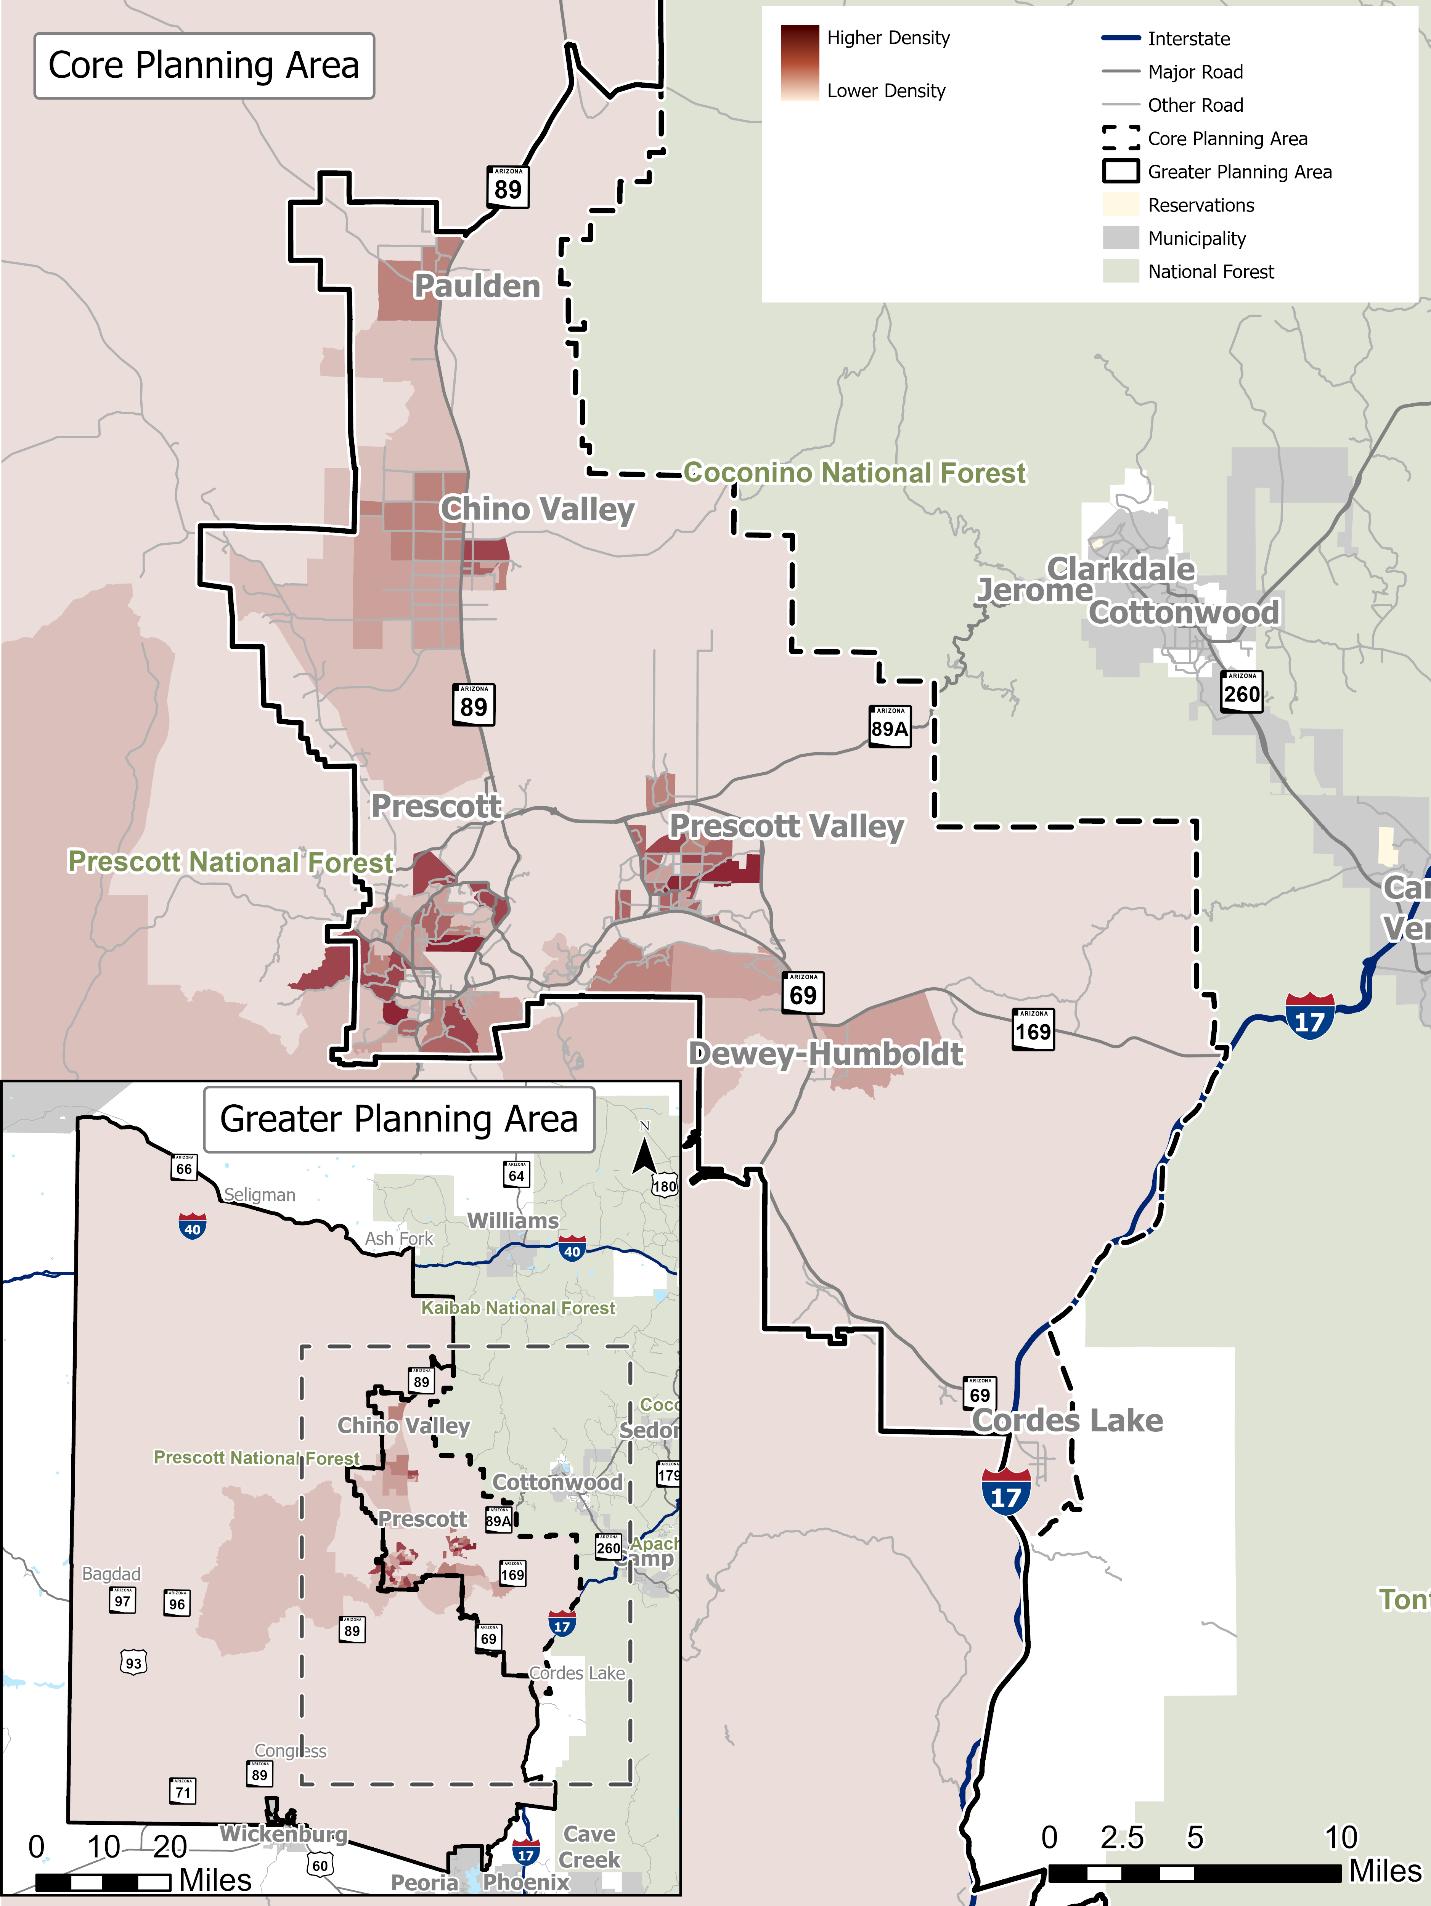
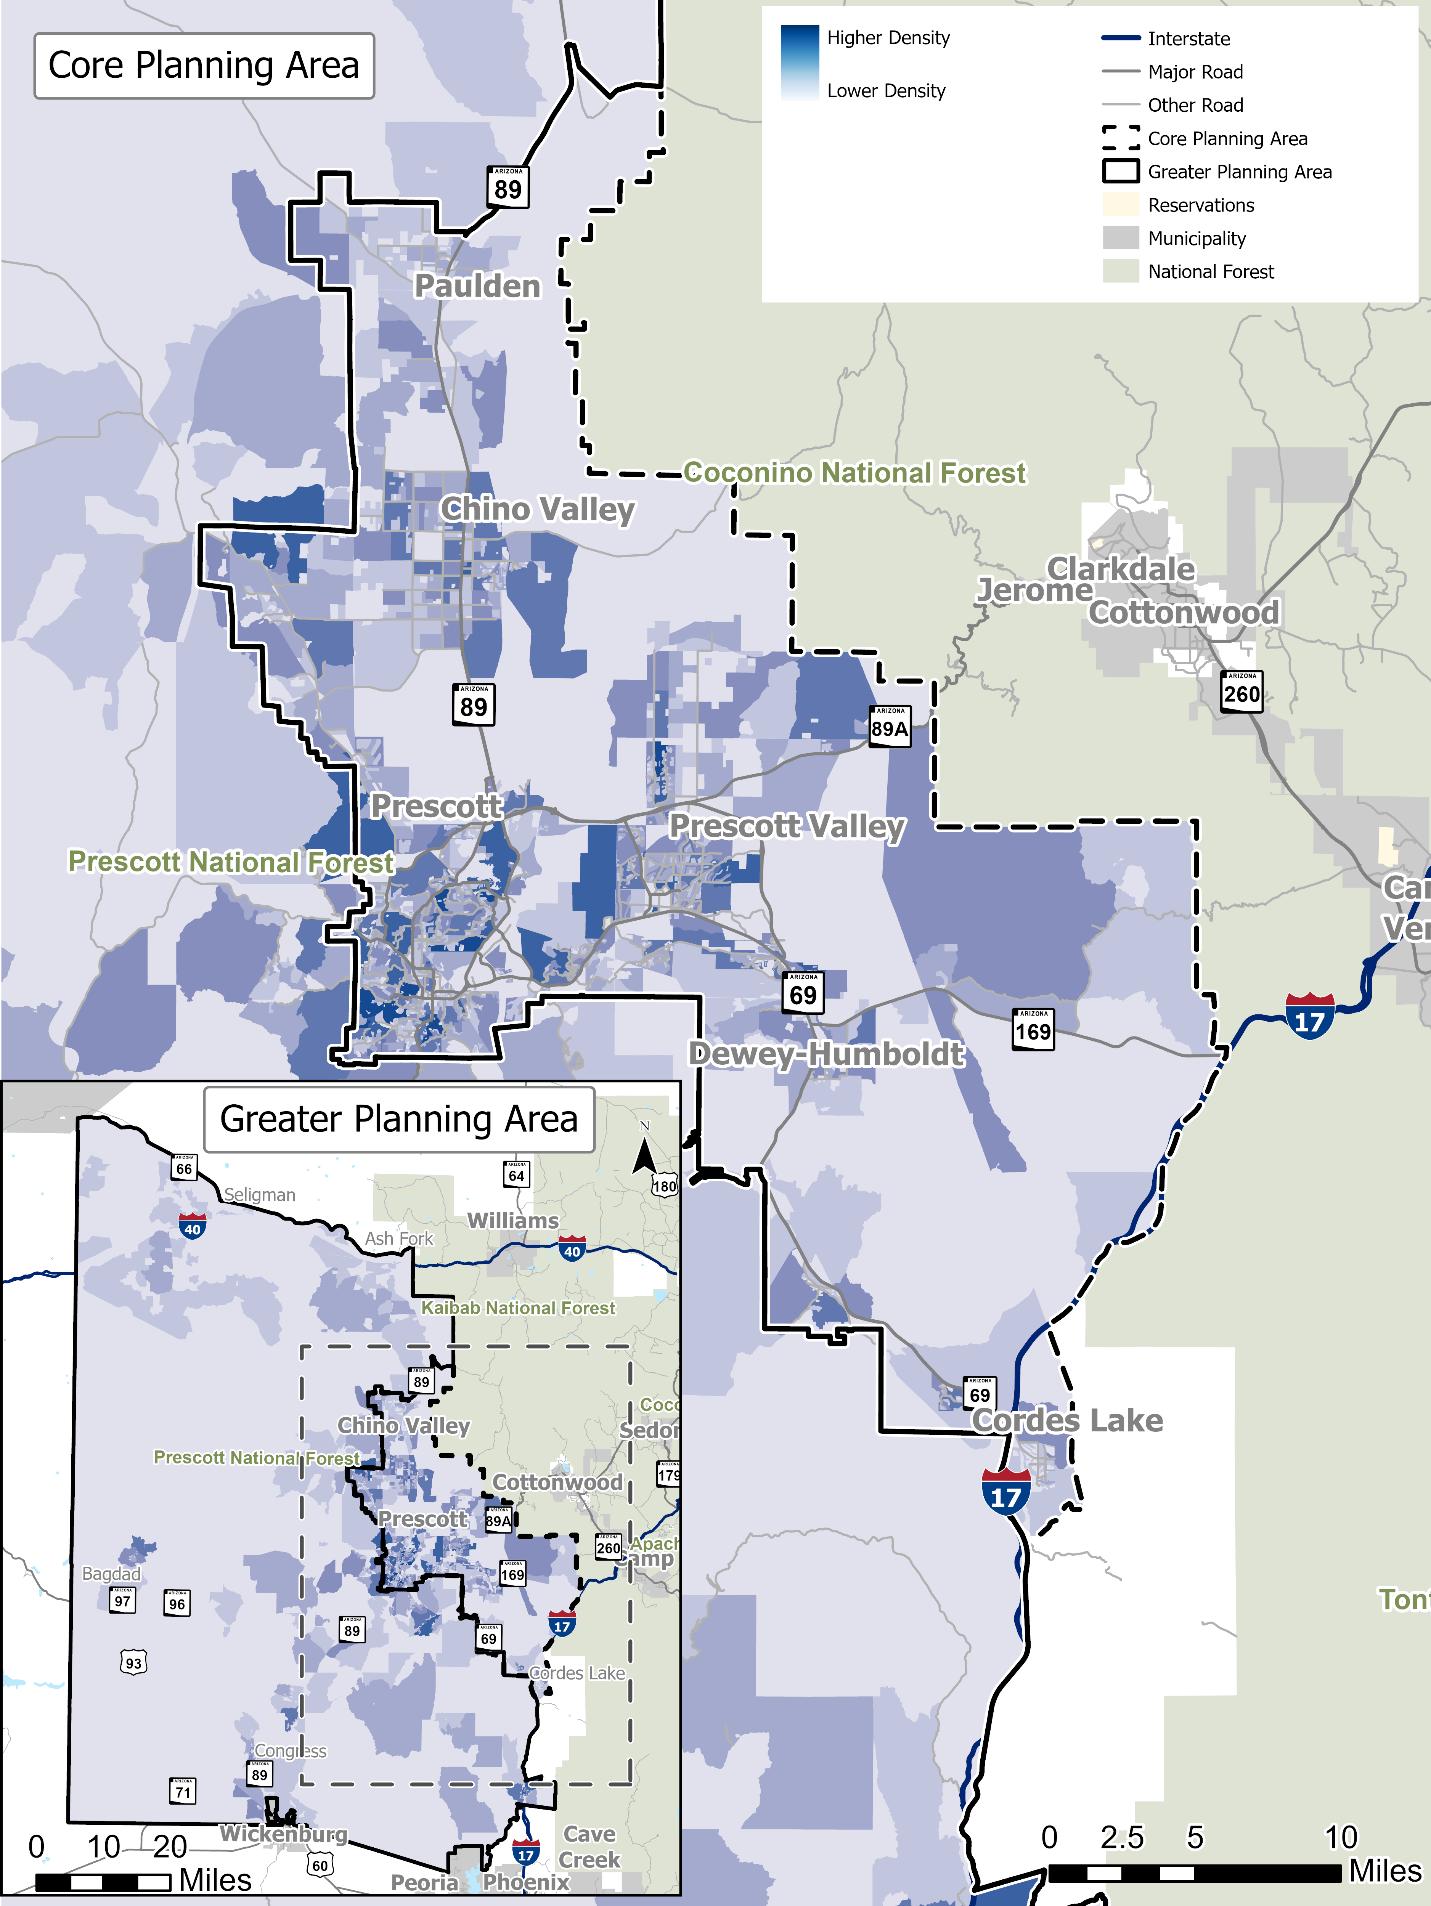
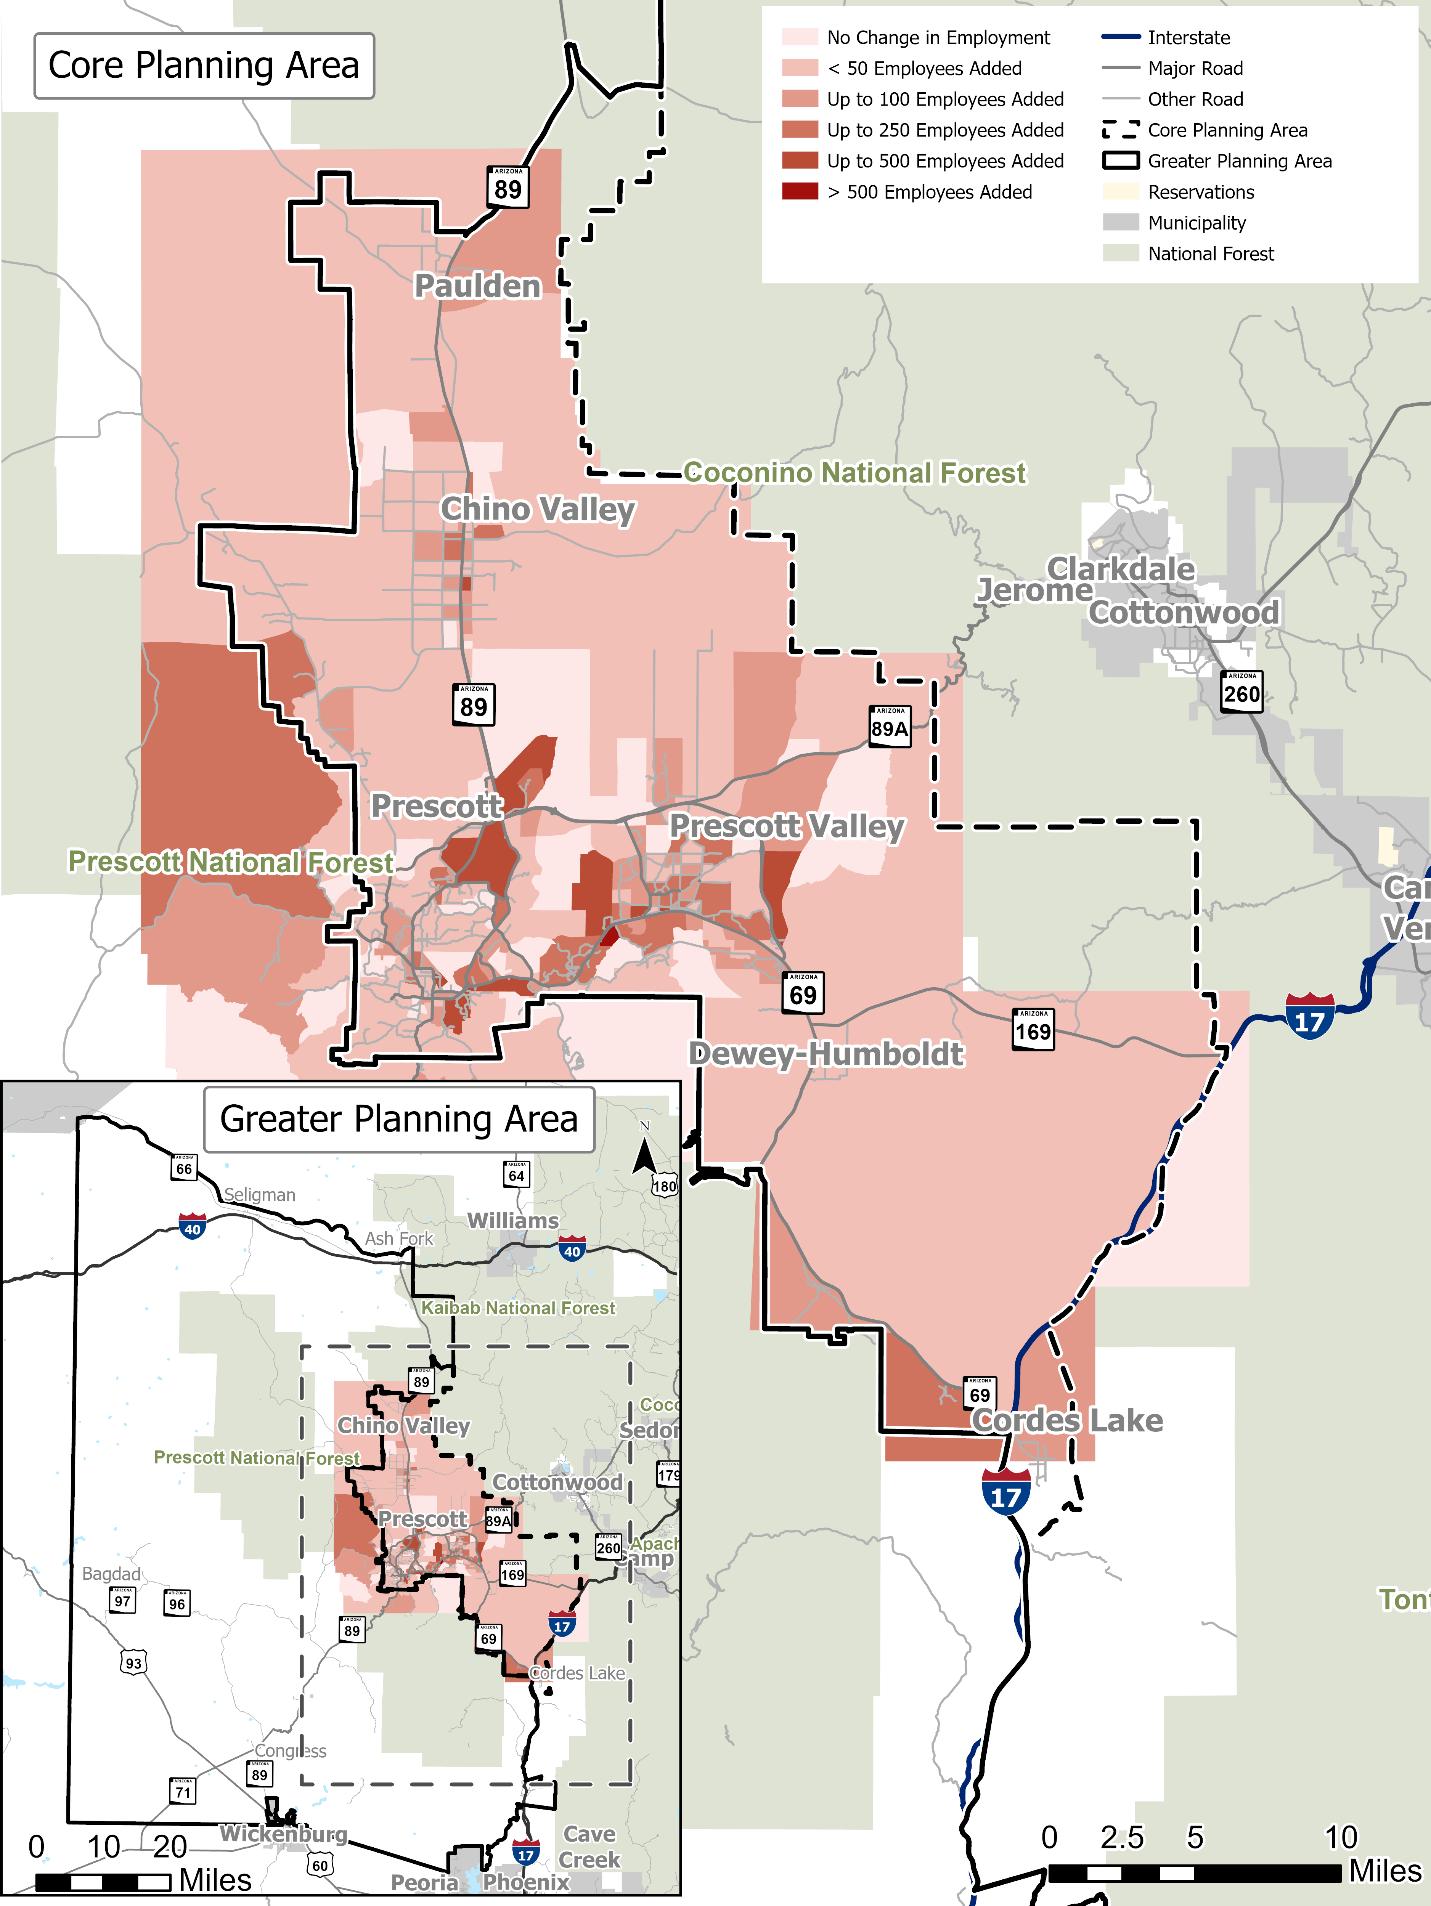
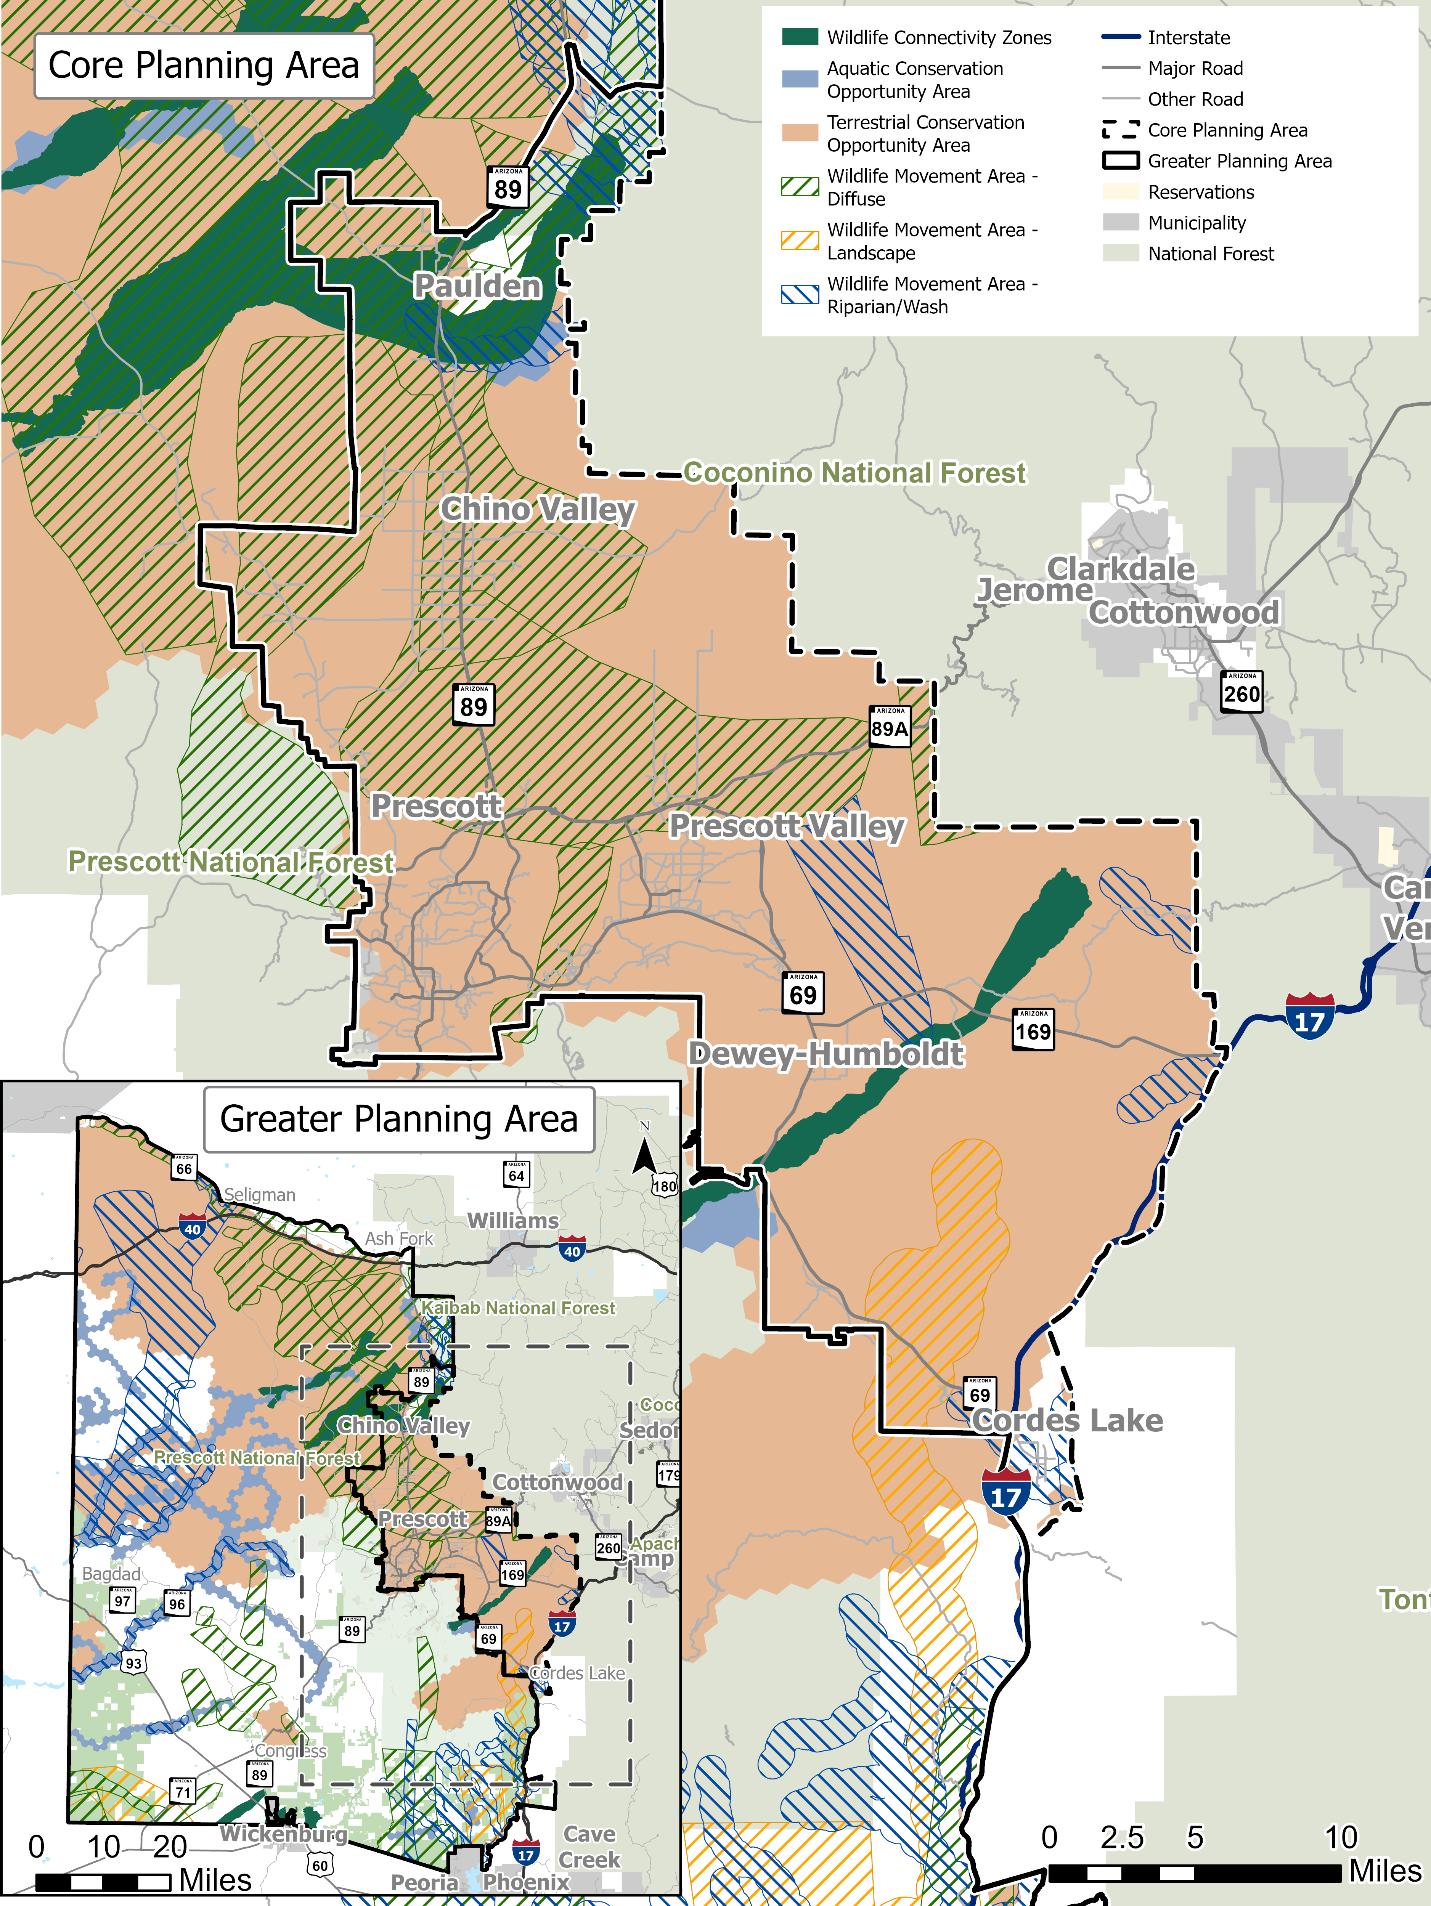
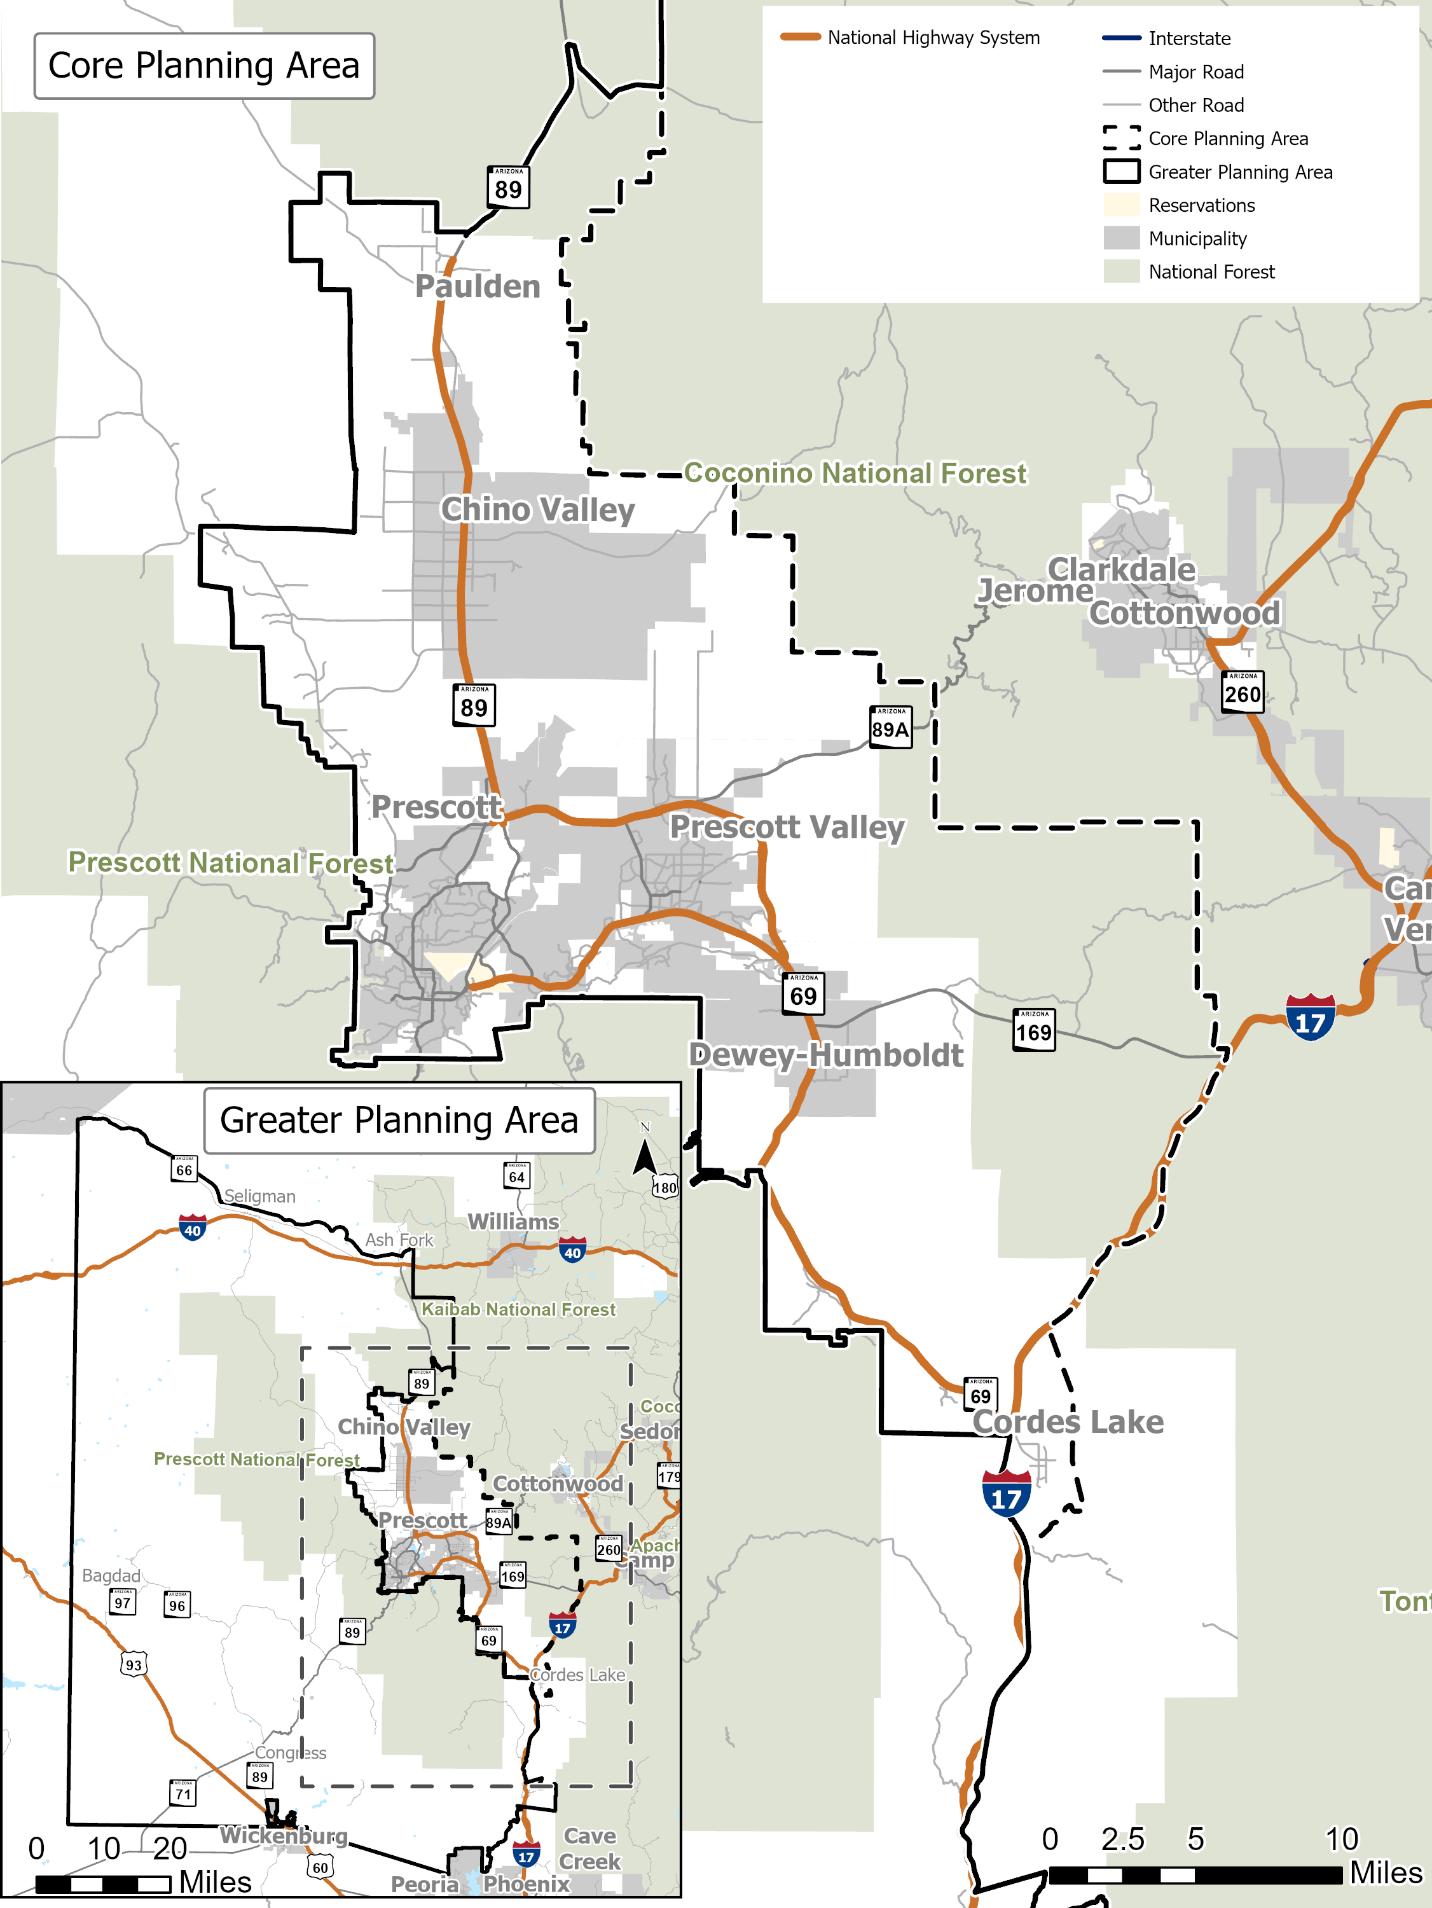
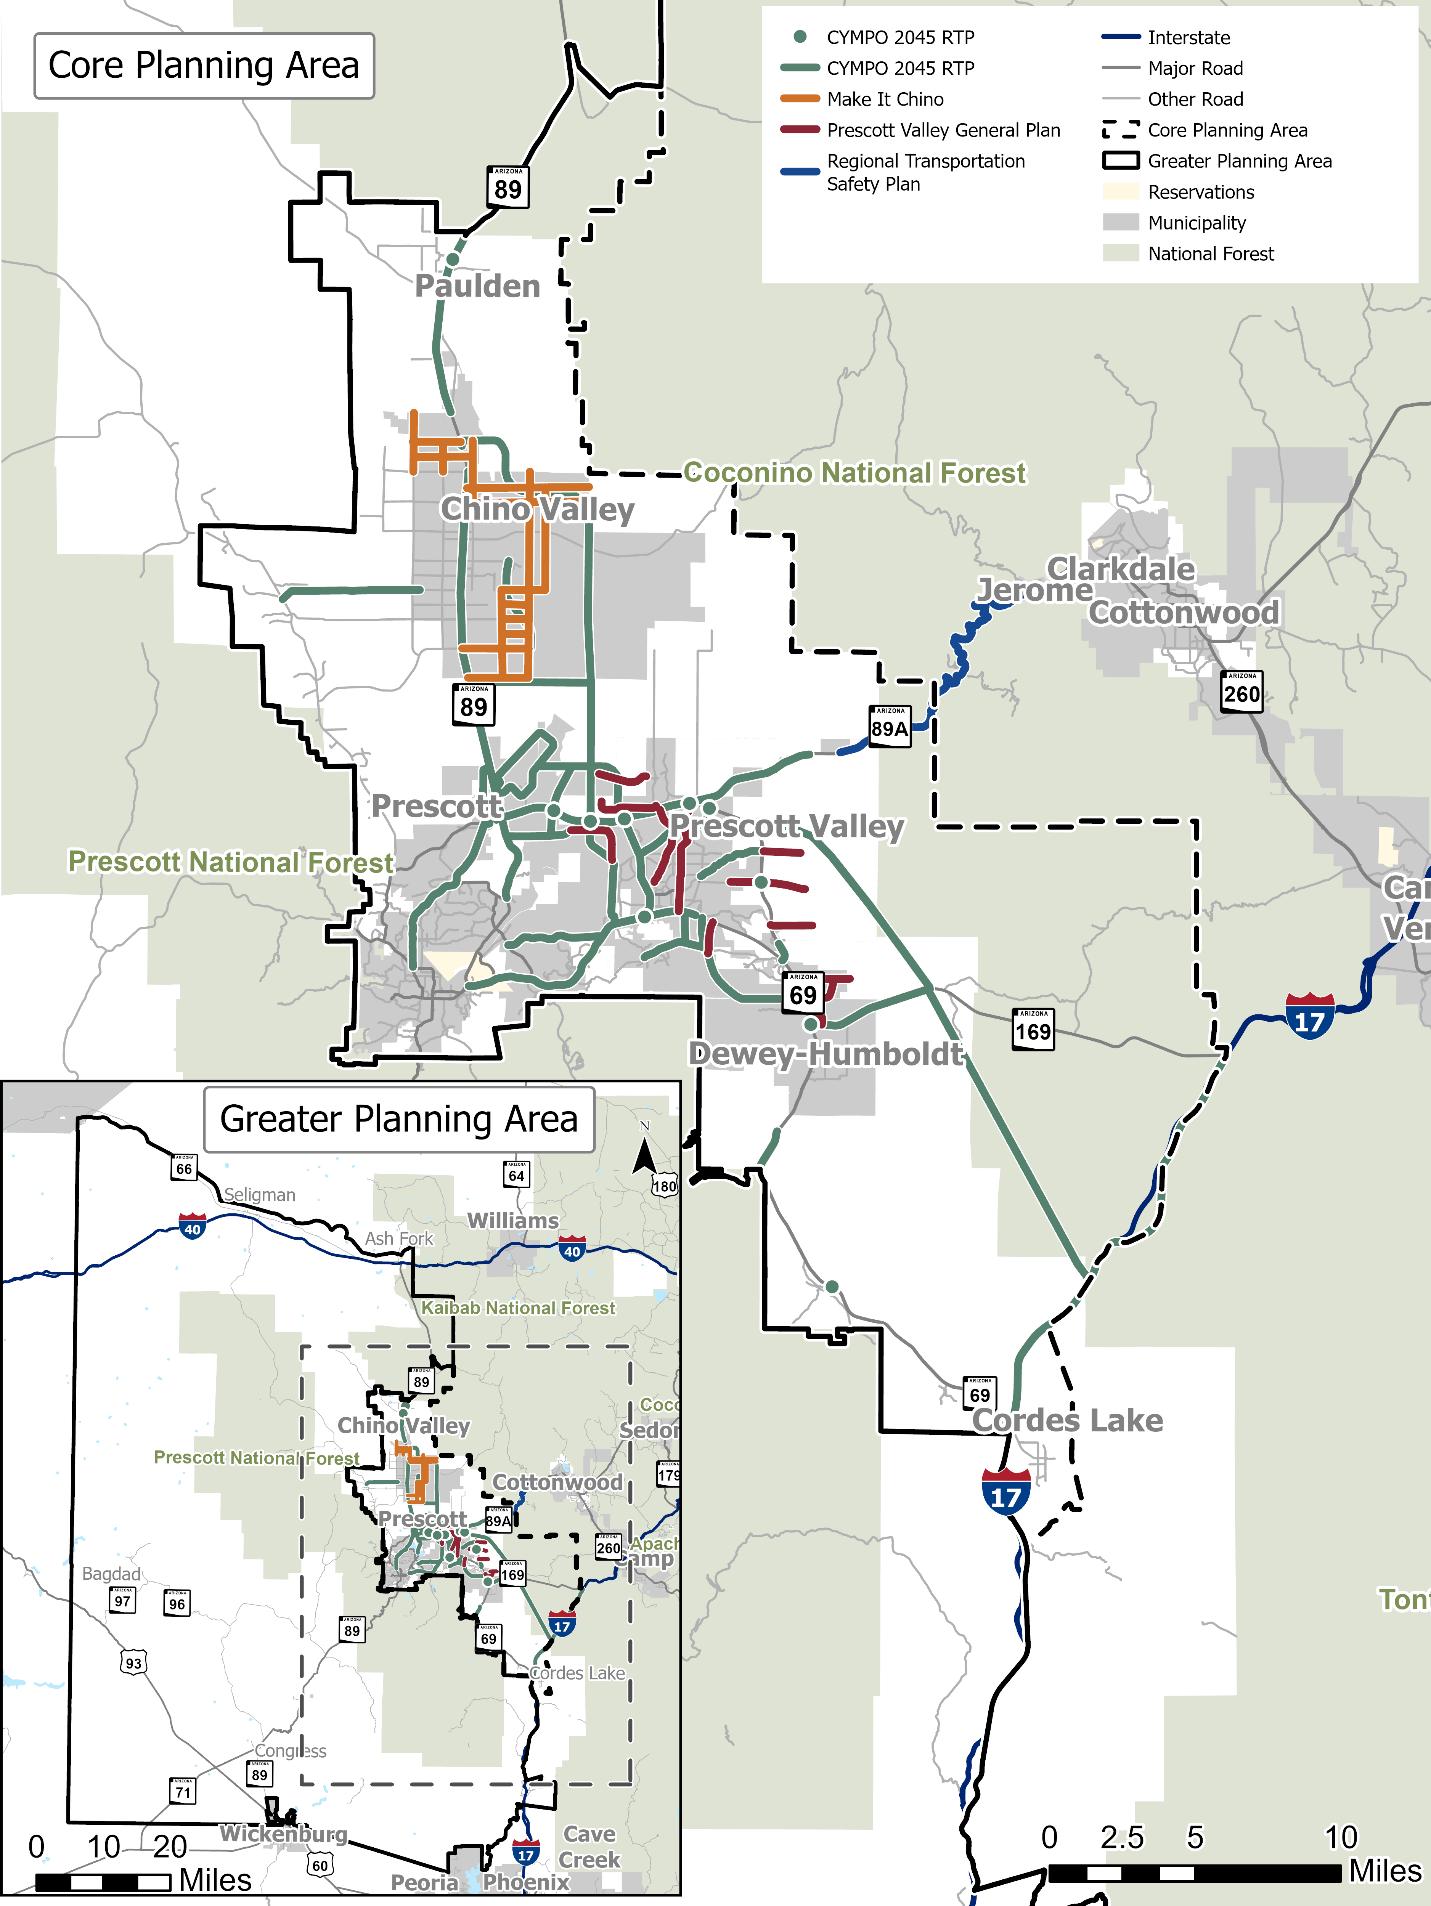
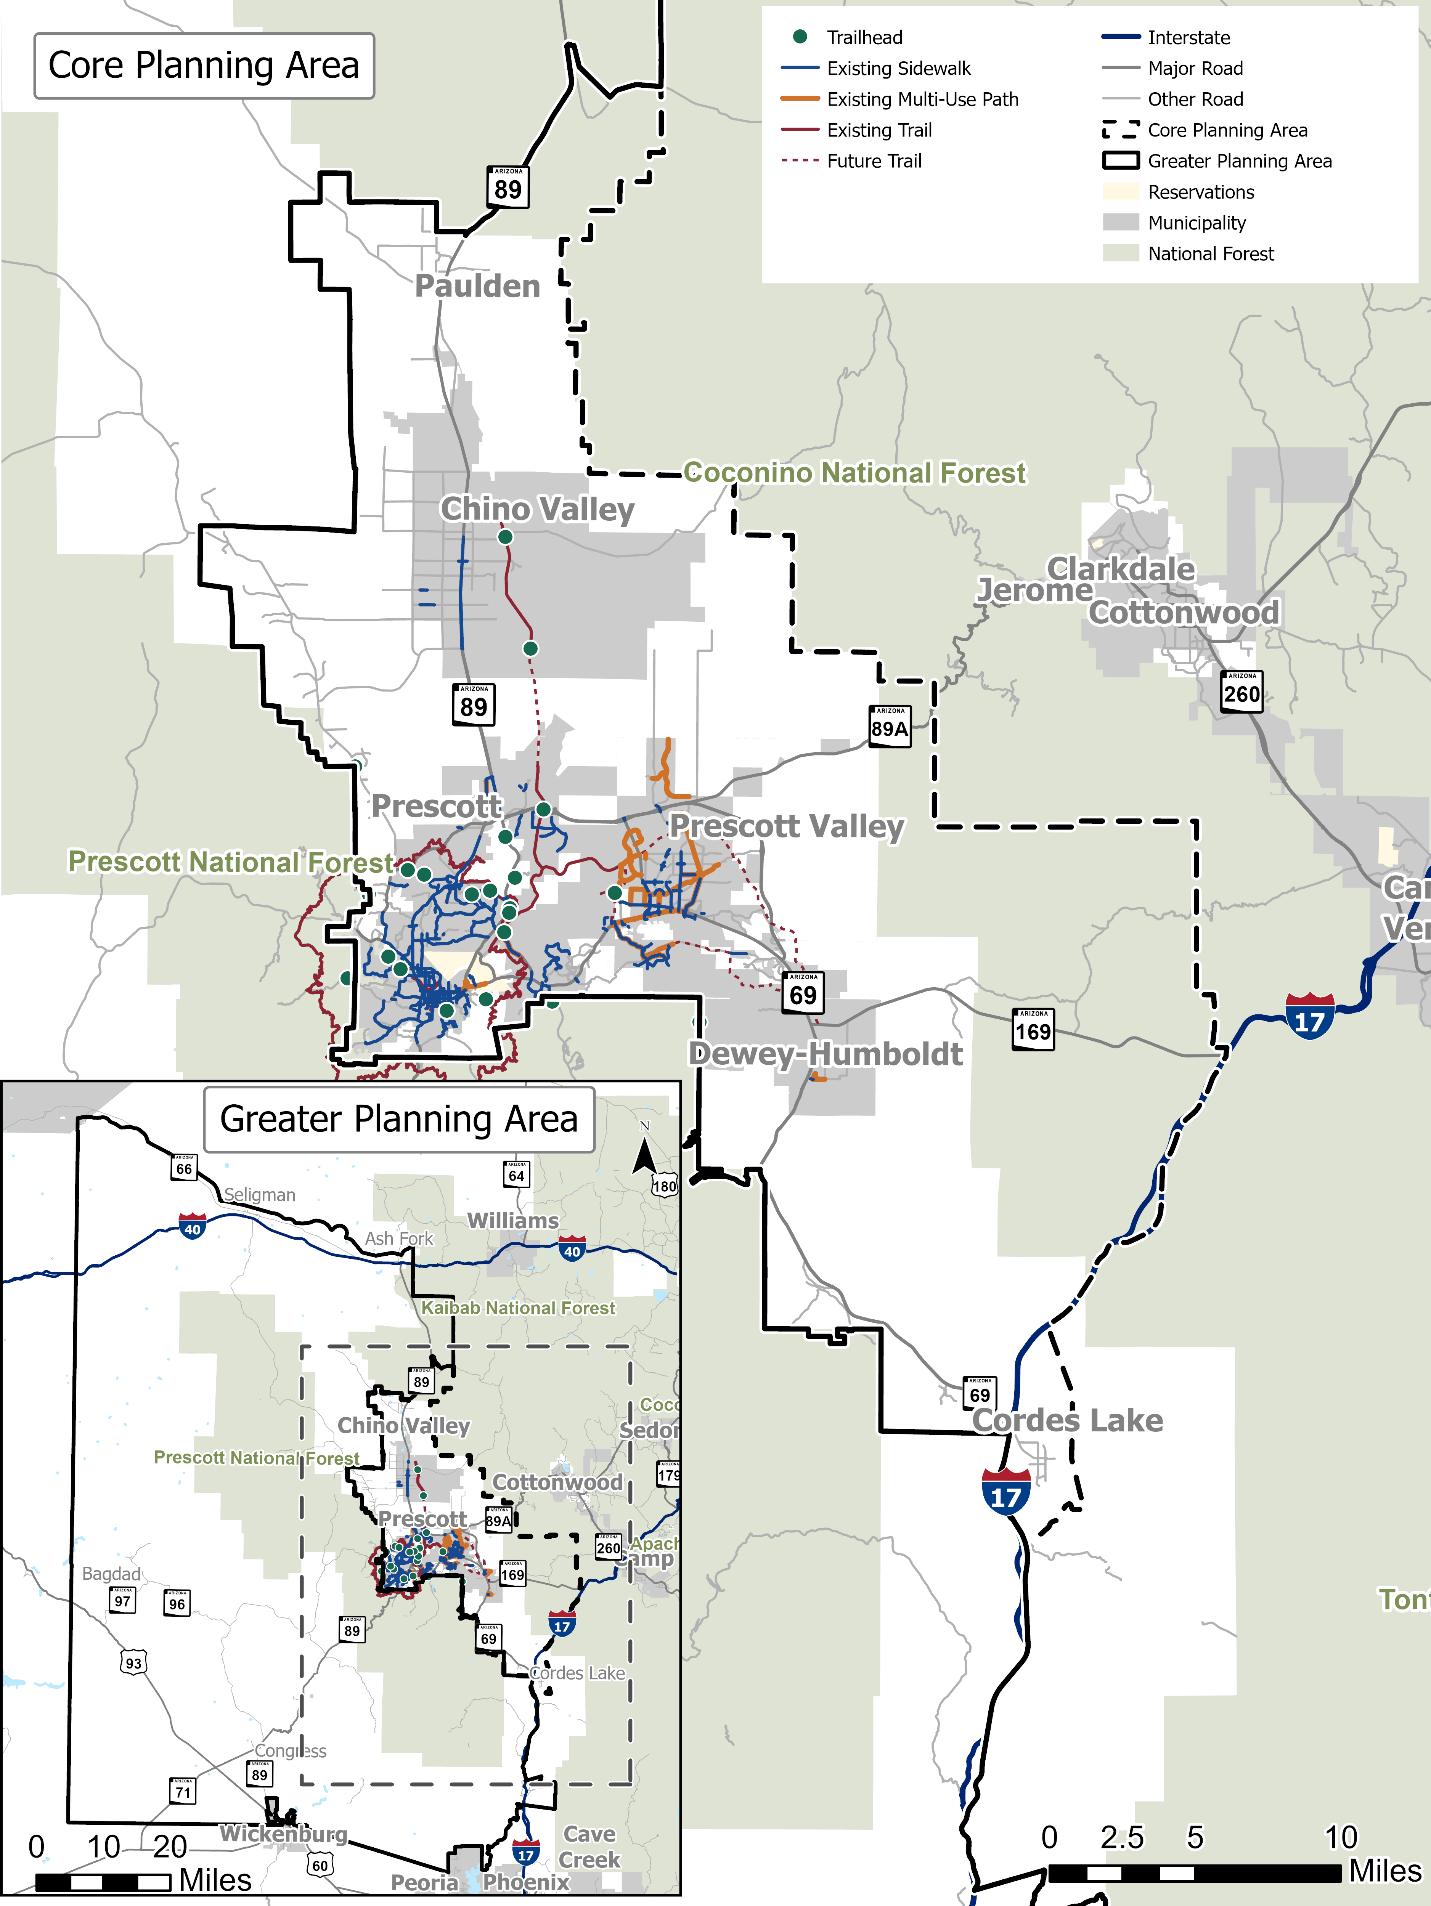
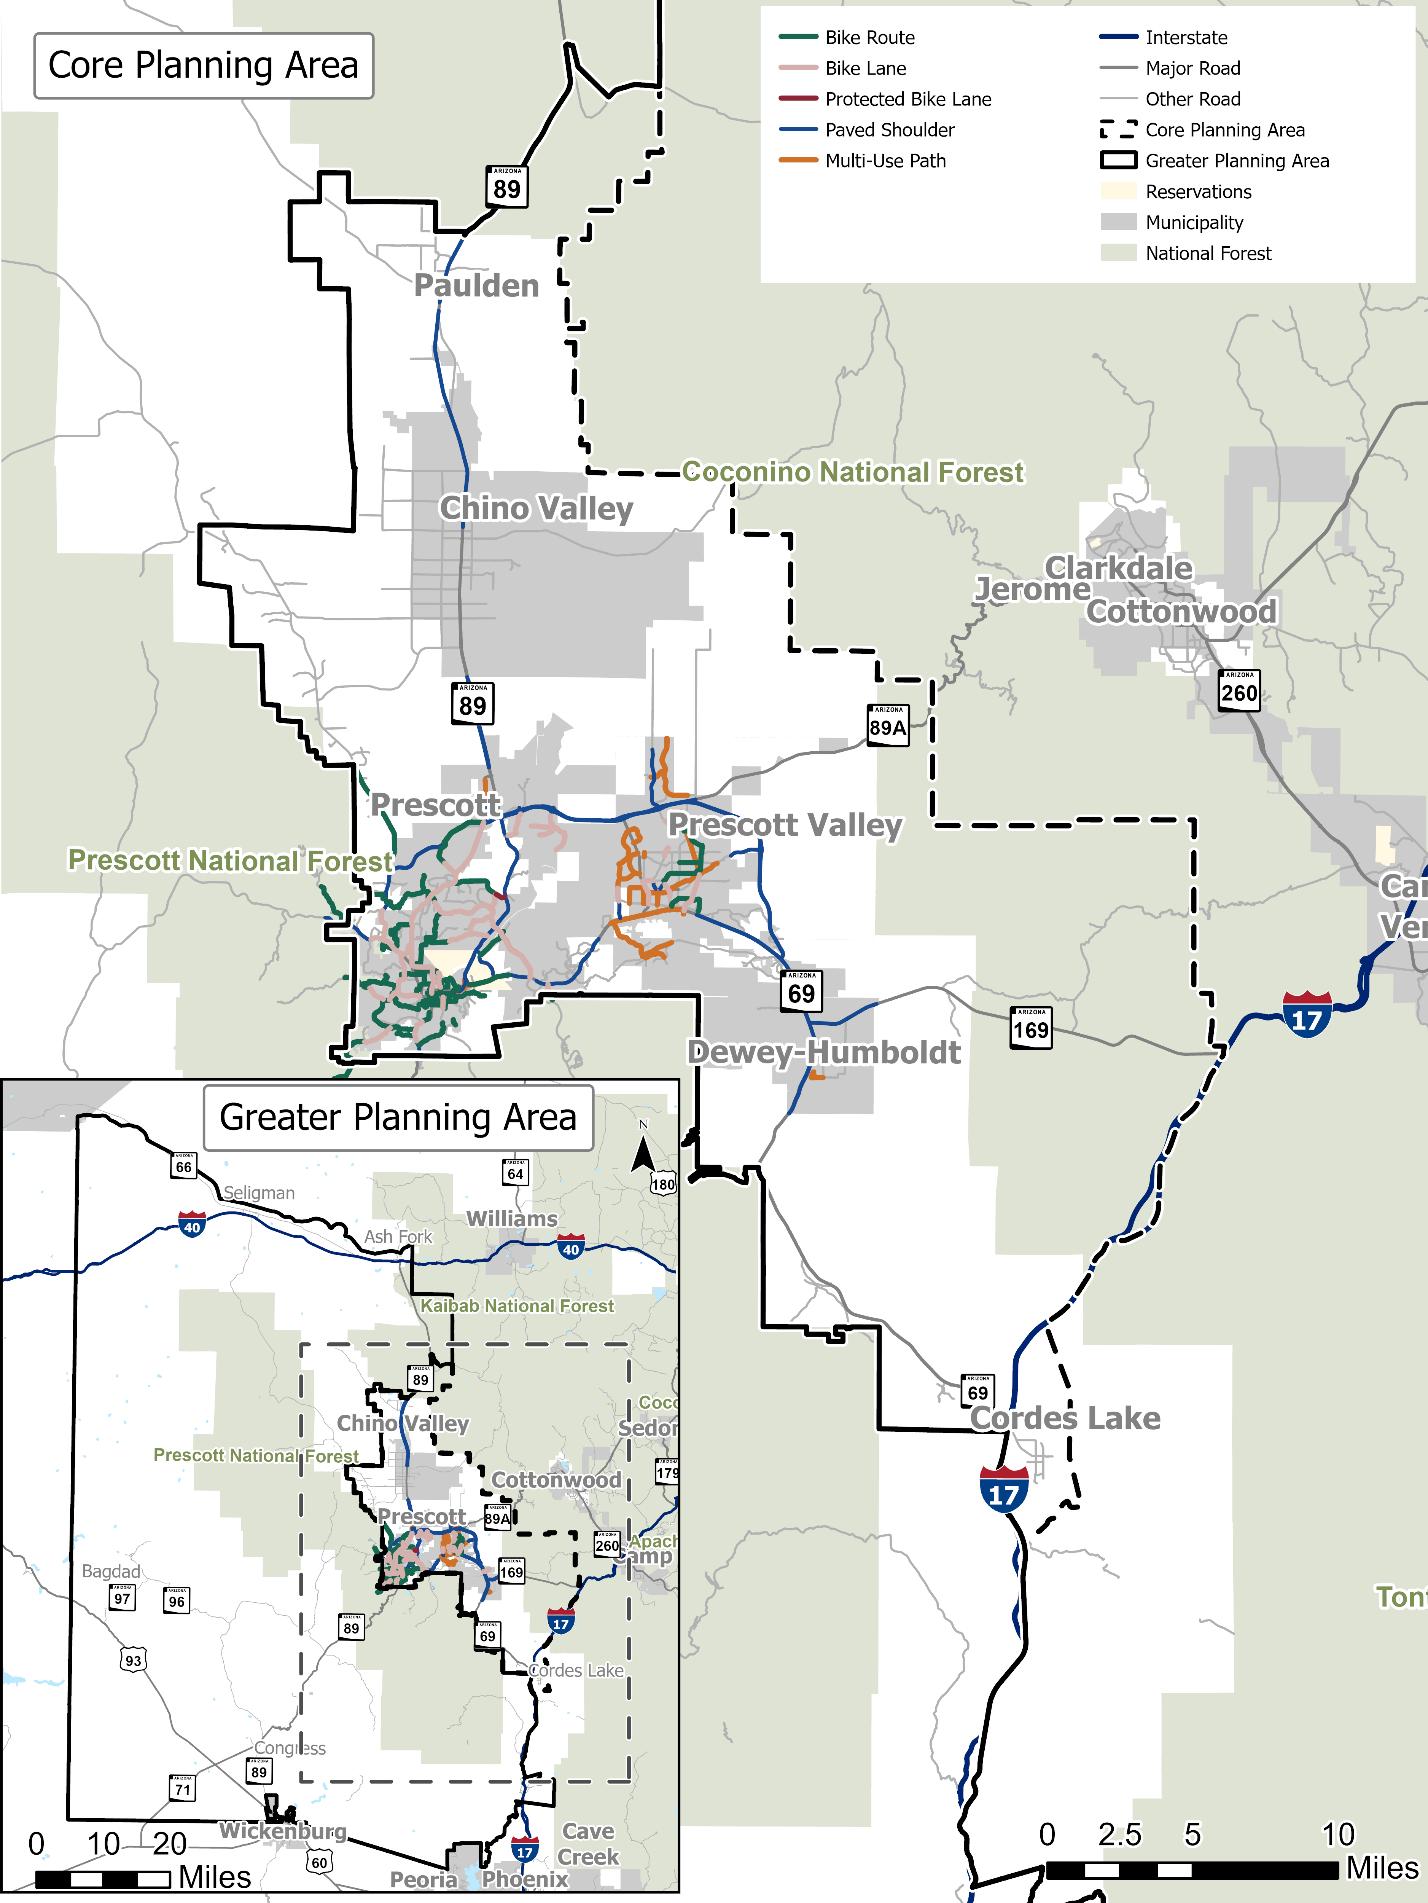
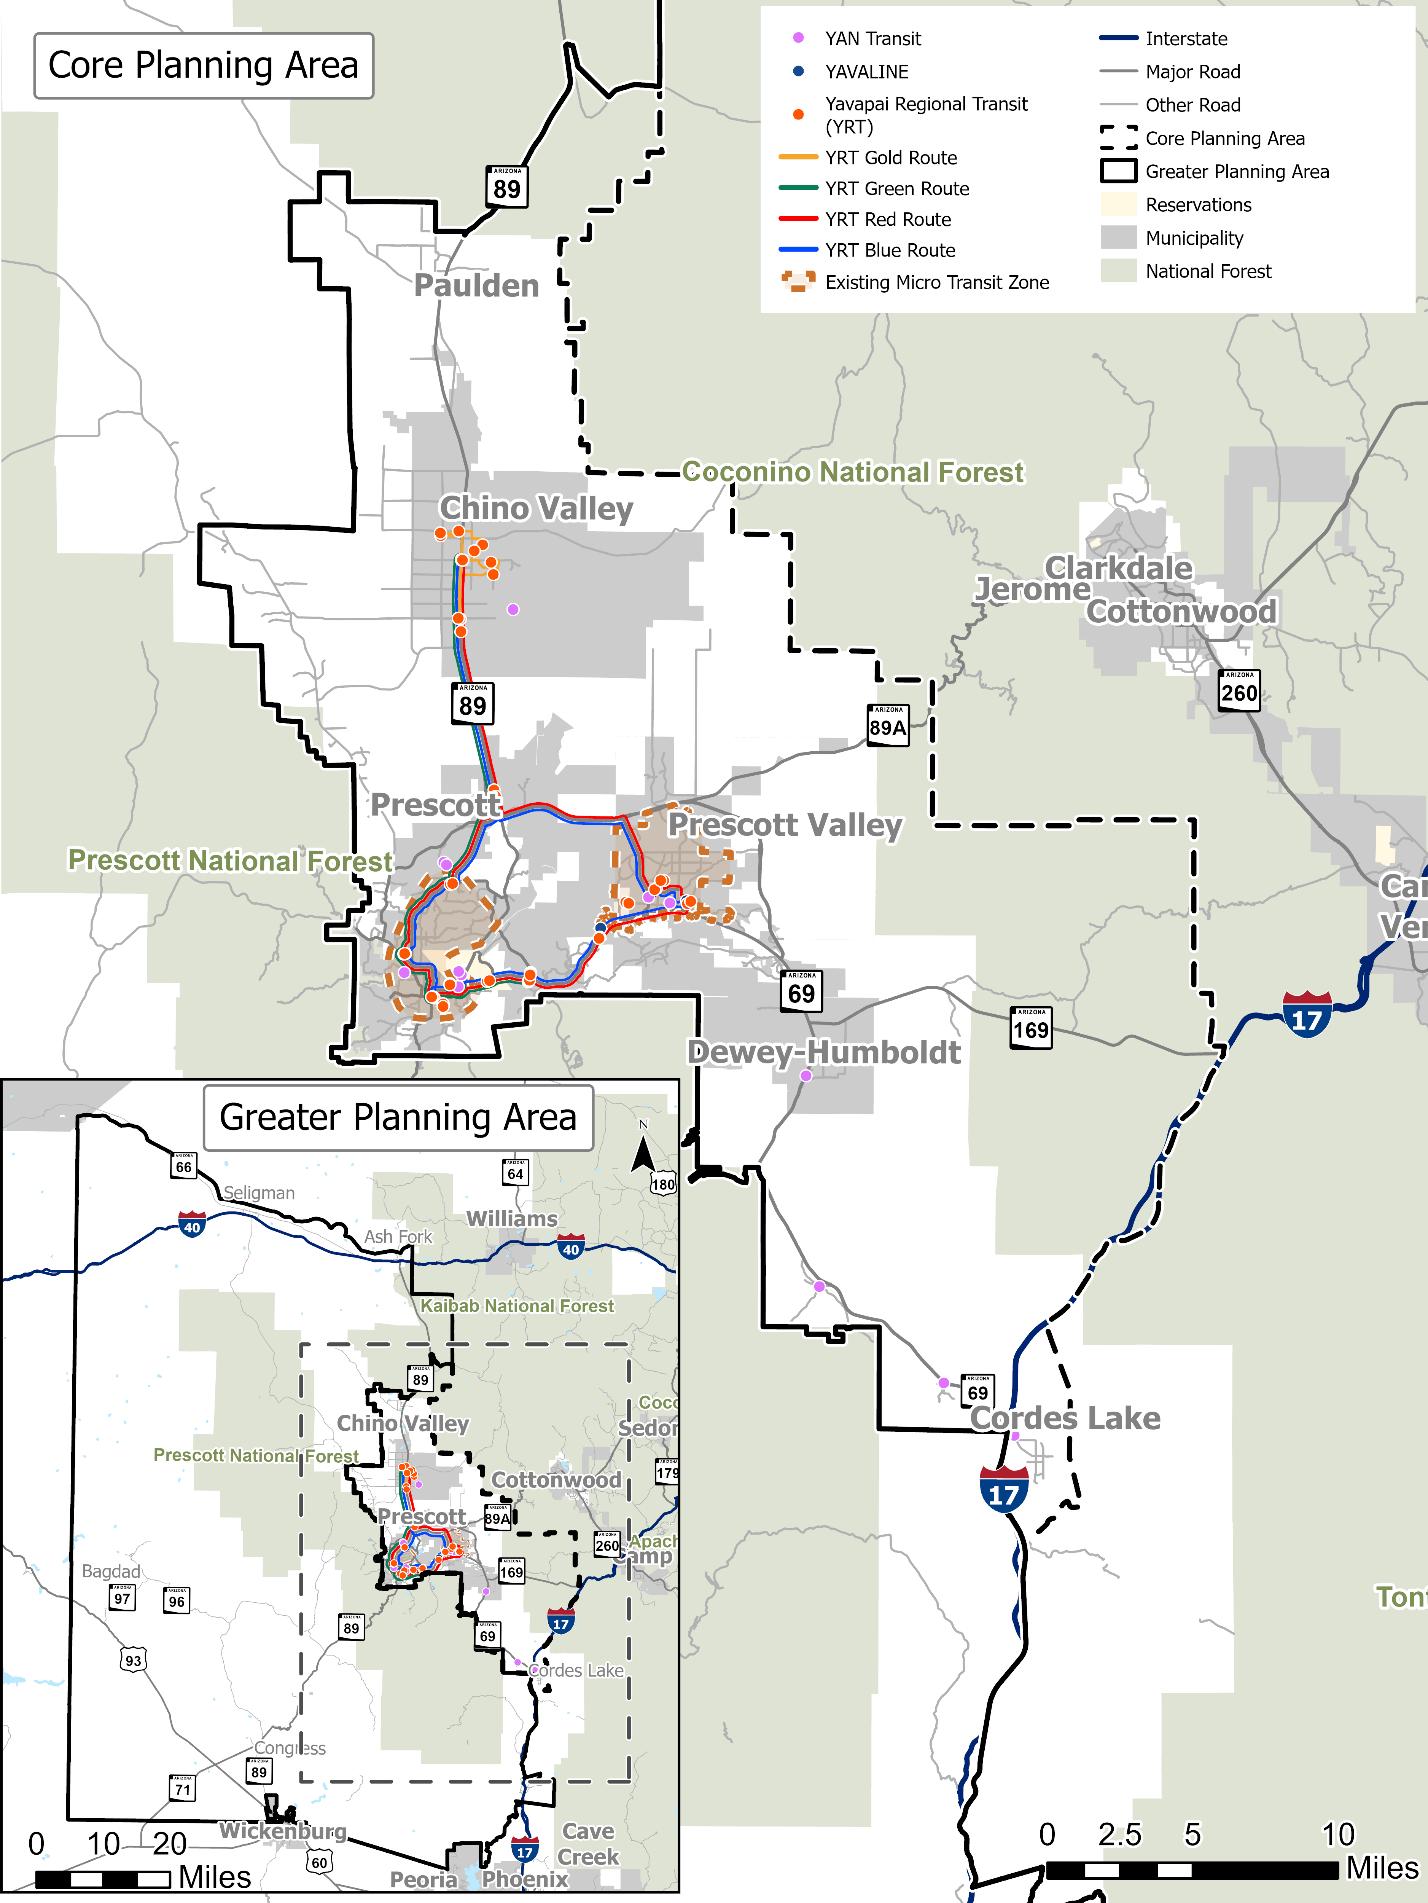
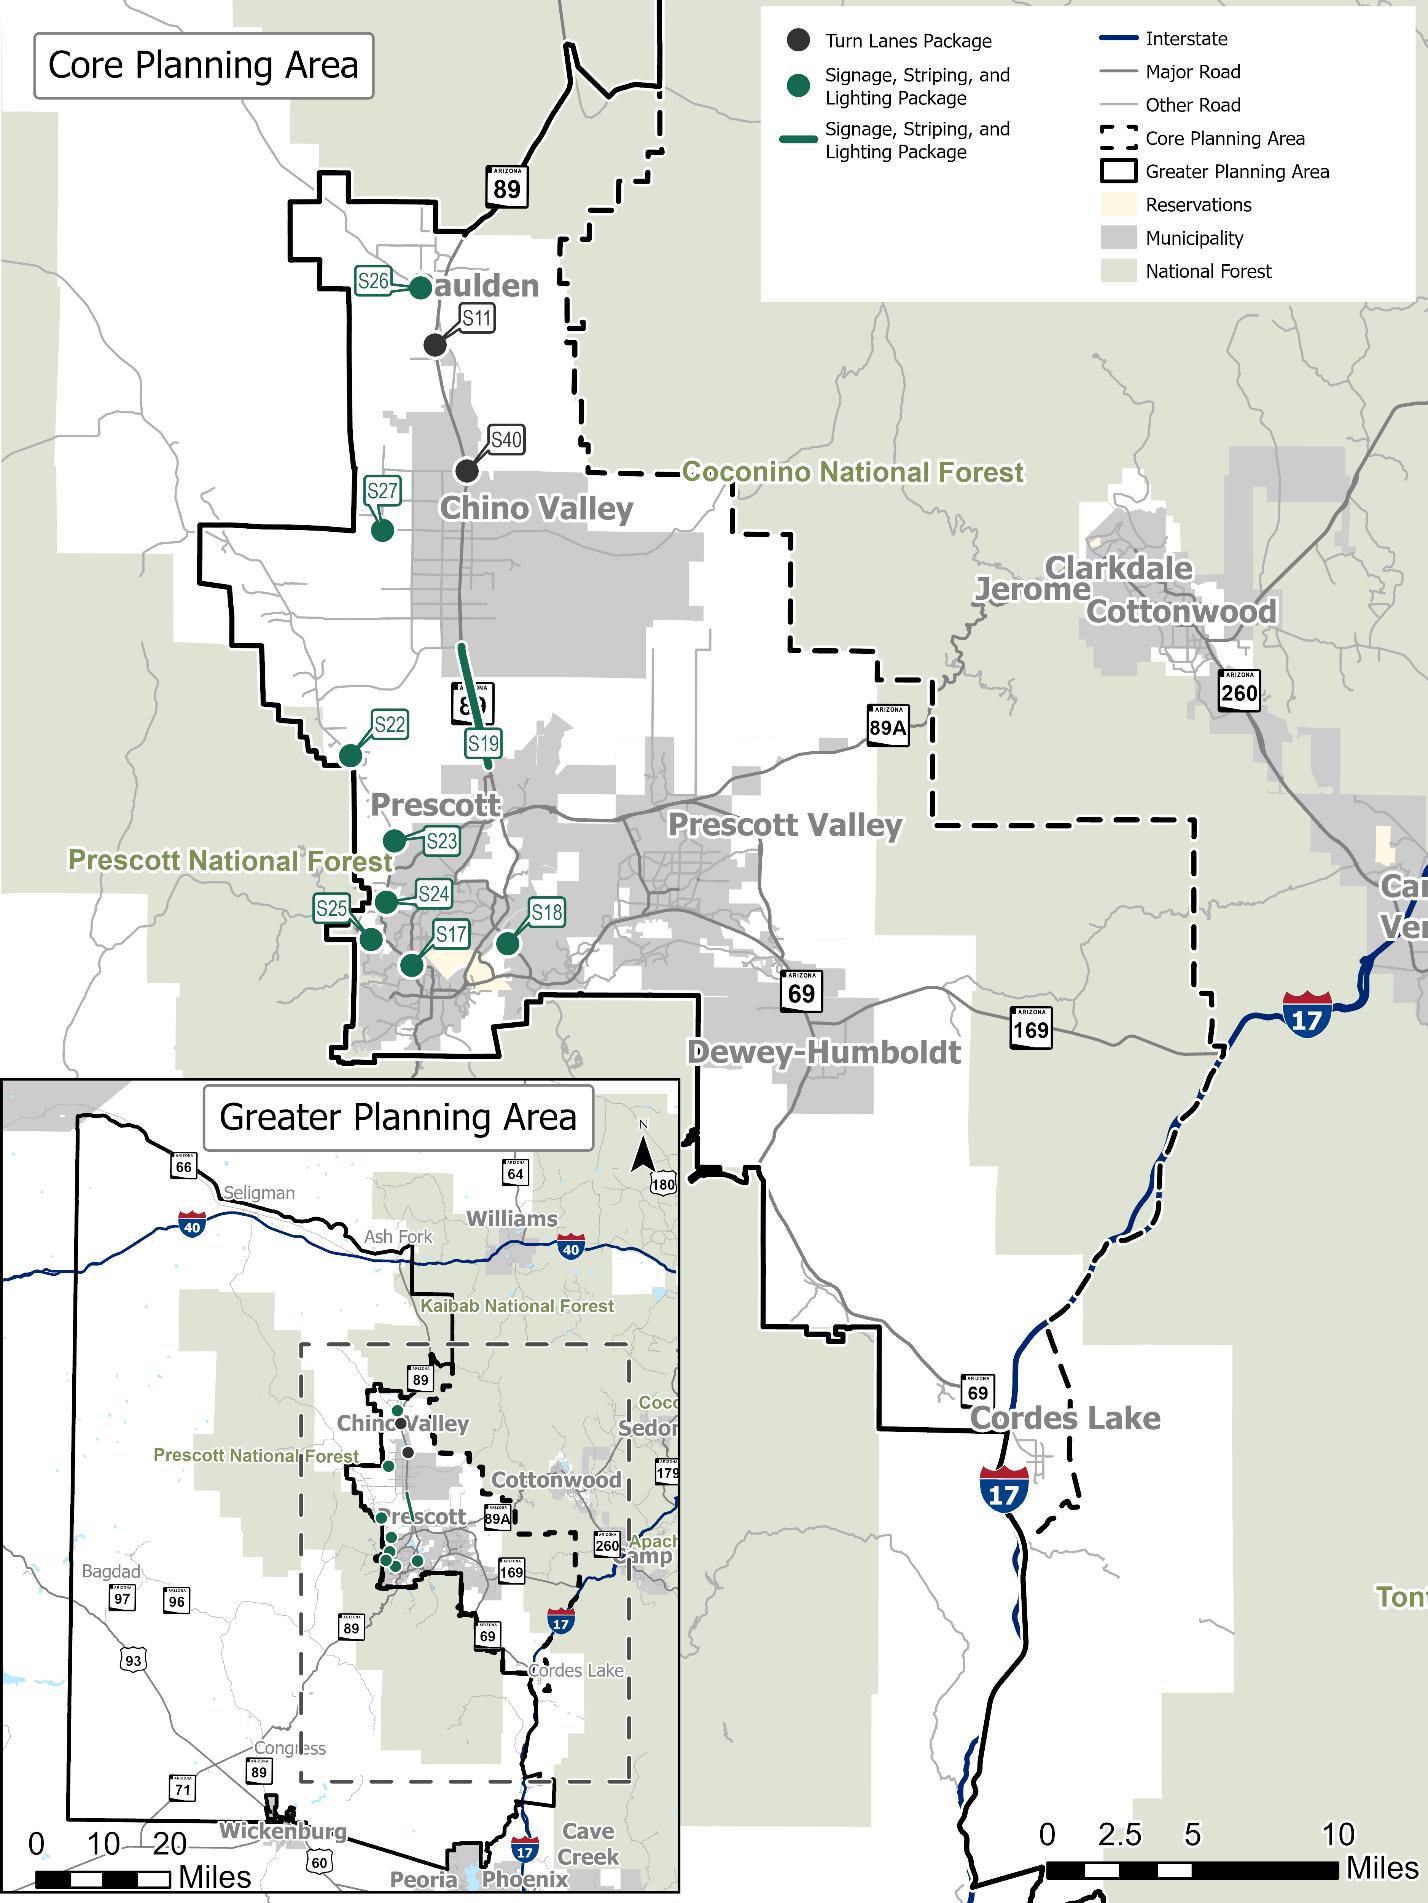
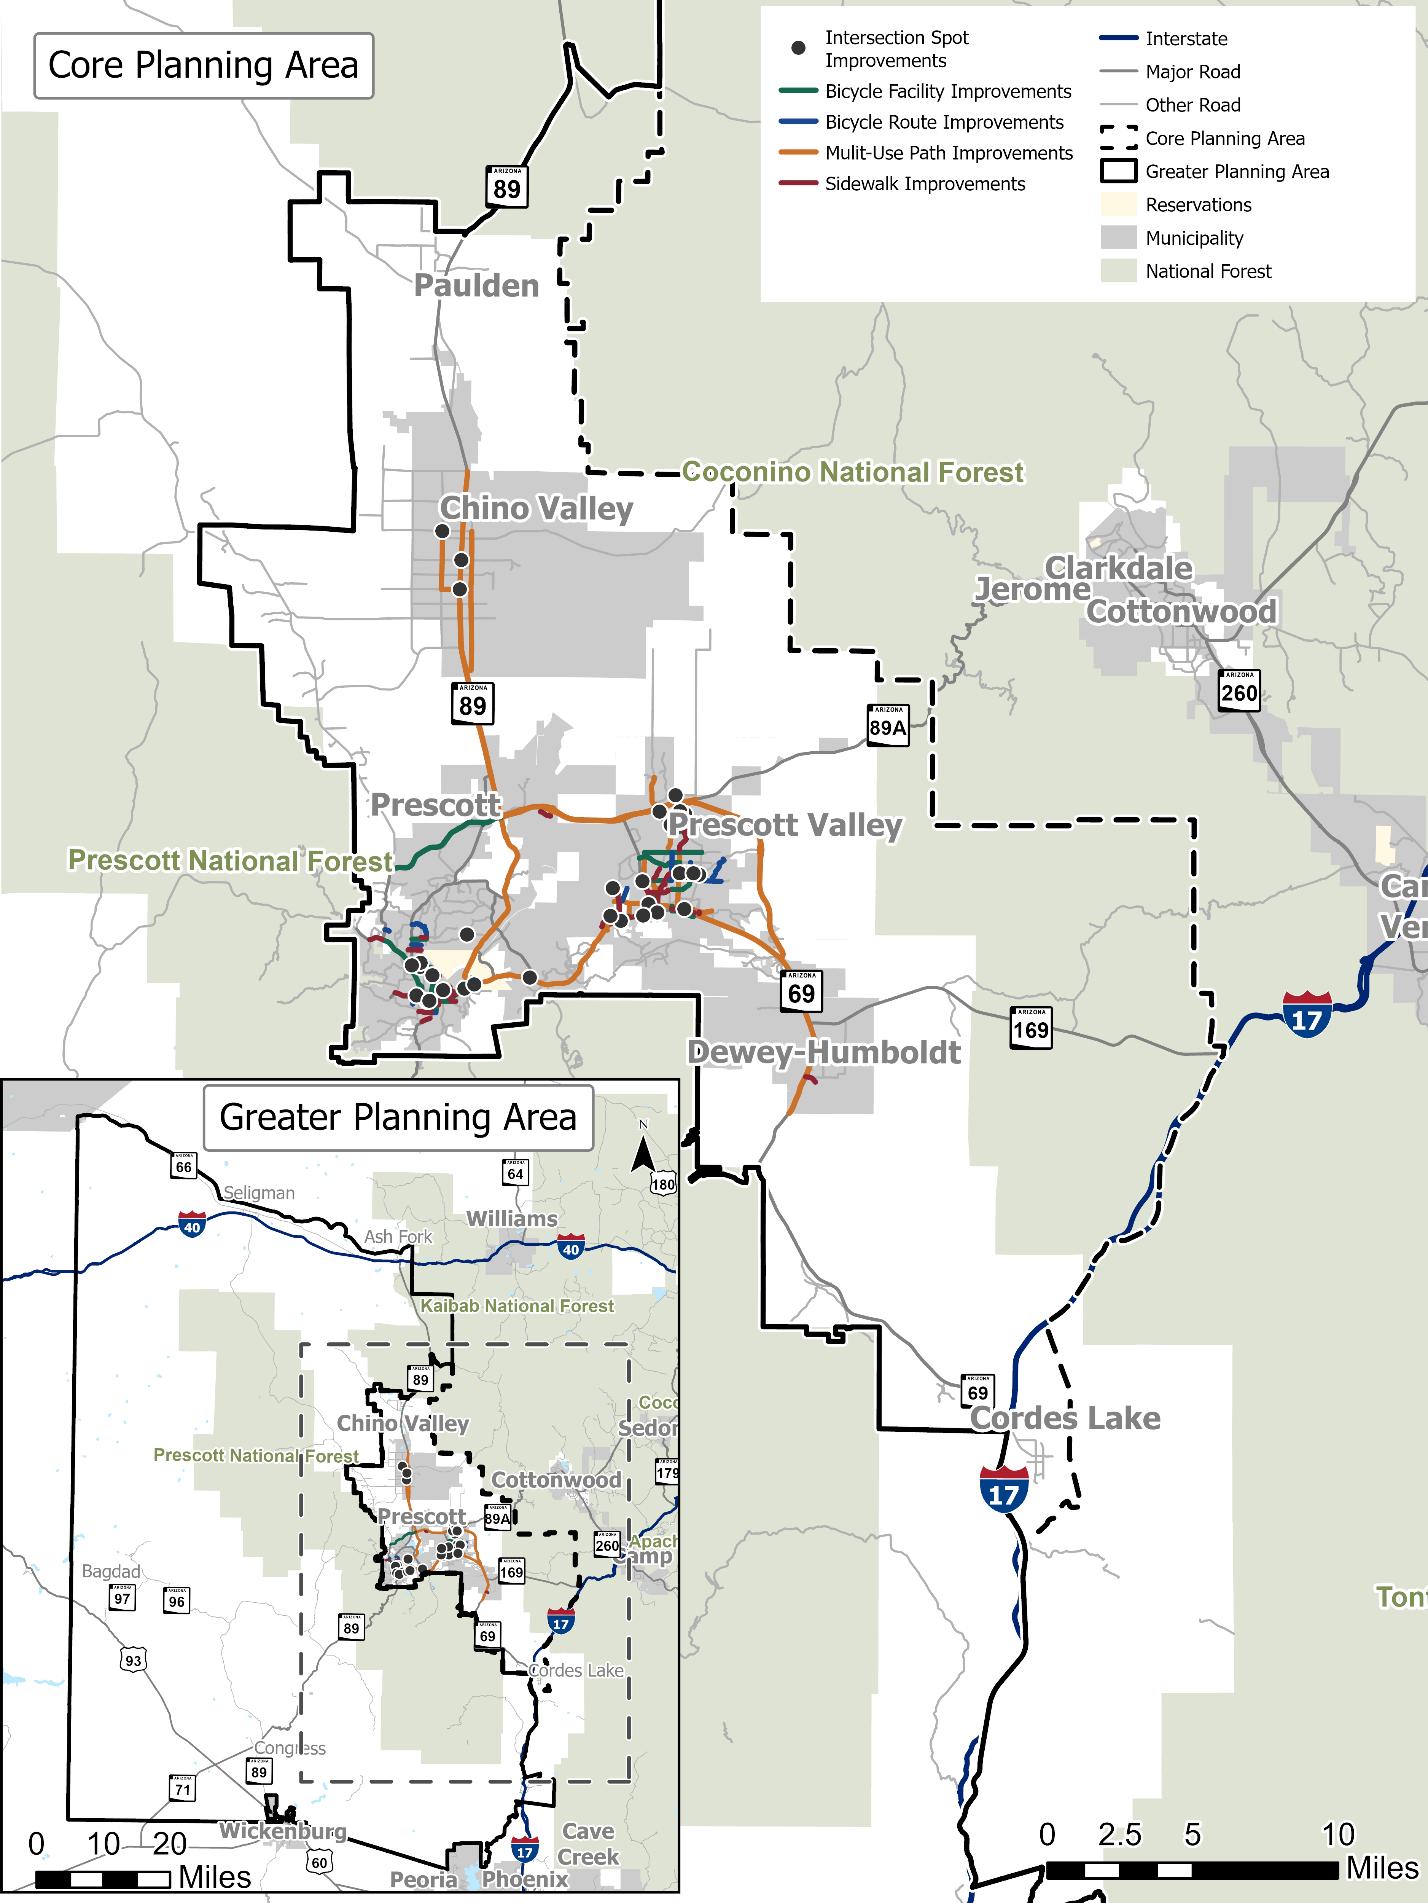
CYMPO is in north central Arizona and includes the City of Prescott, Town of Prescott Valley, Town of Chino Valley, Town of Dewey-Humboldt, and much of unincorporated Yavapai County. The Move 2050 study area encompasses the entirety of the CYMPO planning area, but it is sometimes useful to differentiate between the more urbanized areas of the region compared to the large, rural areas. The study area has been divided up three ways in Move 2050:
• CYMPO Region. Any place that the “CYMPO region” is noted or there is not an area specified, the entire CYMPO planning area is being referred to.
• Core Planning Area. This area includes the incorporated limits of Prescott, Prescott Valley, Chino Valley, and Dewey-Humboldt along with the more populated portions of Yavapai County adjacent to these municipalities.
• Greater Planning Area. This area includes much of the newly added areas to the MPO boundary that encompass western and southern Yavapai County
The CYMPO region, showing both the Core and Greater planning areas, is shown in Figure 2
2. Study Area
CYMPO has elected to adopt and support ADOT’s transportation planning goals. The adopted goals are reviewed on an annual basis and aid the region in setting reasonable targets for state-level planning goals. CYMPO’s adopted ADOT goals include:
Safety. Reduce traffic fatalities and serious injuries on all public roads.
Infrastructure Conditions. Maintain the National Highway System (NHS) in a state of good repair.
Congestion Reduction. Reduce congestion on the NHS.
System Reliability. Improve the efficency of the surface transportation system.
Freight Movement and Economic Vitality. Improve the national freight network, strengthen rural access to national/international markets and support economic development.
Environmental Sustainability. Enhance performance of the transportation system while protecting and enhancing the natural environment.
Source: ADOT, CYMPO
To align with Federal Highway Administration (FHWA) requirements, CYMPO adopted ADOT’s performance targets identified in the ADOT Long-Range Transportation Plan (LRTP). To determine whether the region has met these measures, the performance measures and CYMPO’s performance are summarized below. CYMPO’s population was evaluated proportionally to the entire state’s population to identify CYMPO’s target for each performance measure. Performance measures were evaluated for CYMPO’s greater planning area.
Legislation promoting a performance-based approach for transportation decision making
• Moving Ahead for Progress in the 21st Century Act (MAP-21)
• Fixing America’s Surface Transportation (FAST) Act
• Infrastructure Investment and Jobs Act (IIJA)
Freight Reliability on the Interstate (Truck Travel Time Reliability Index, where a value of 1.0 is reliable and a value over 1.35 as unreliable)
of Person-Miles That Have Reliable Travel Times on the Interstate
Percent of Person-Miles That Have Reliable travel times on the Non-Interstate NHS
Source: ADOT, CYMPO
Priorities have been created through the Move 2050 development process to guide project implementation based on factors that are unique to the CYMPO region. The identified priorities set the framework for project development, prioritization, and implementation and will guide the future of the region’s transportation network. Figure 3 shows CYMPO’s regional priorities.
CYMPO Today and Tomorrow
The CYMPO region’s current and projected socioeconomic conditions help define the transportation needs and choices of the community. As the population grows and changes, the need for the transportation system to facilitate travel and mobility needs also grow and change with the community. Understanding the region’s current environmental considerations can highlight areas of preservation. CYMPO Today and Tomorrow summarizes the region’s current and future socioeconomic profile and environmental considerations for CYMPO’s greater planning area
Population, employment, demographics, and development help define transportation needs and choices. As the region grows and changes, the transportation system must also evolve.
Land in the core and greater planning areas are predominately owned by public agencies. Most State-owned parcels are concentrated between Prescott National Forest and Tonto Nation Forest. Much of southern Yavapai County is owned by the Bureau of Land Management. Agriculture is the most common land use in the region. Government facilities and vacant land uses are also prevalent and may provide opportunities for transportation uses.
Land Ownership by Percentage
Source: Yavapai County
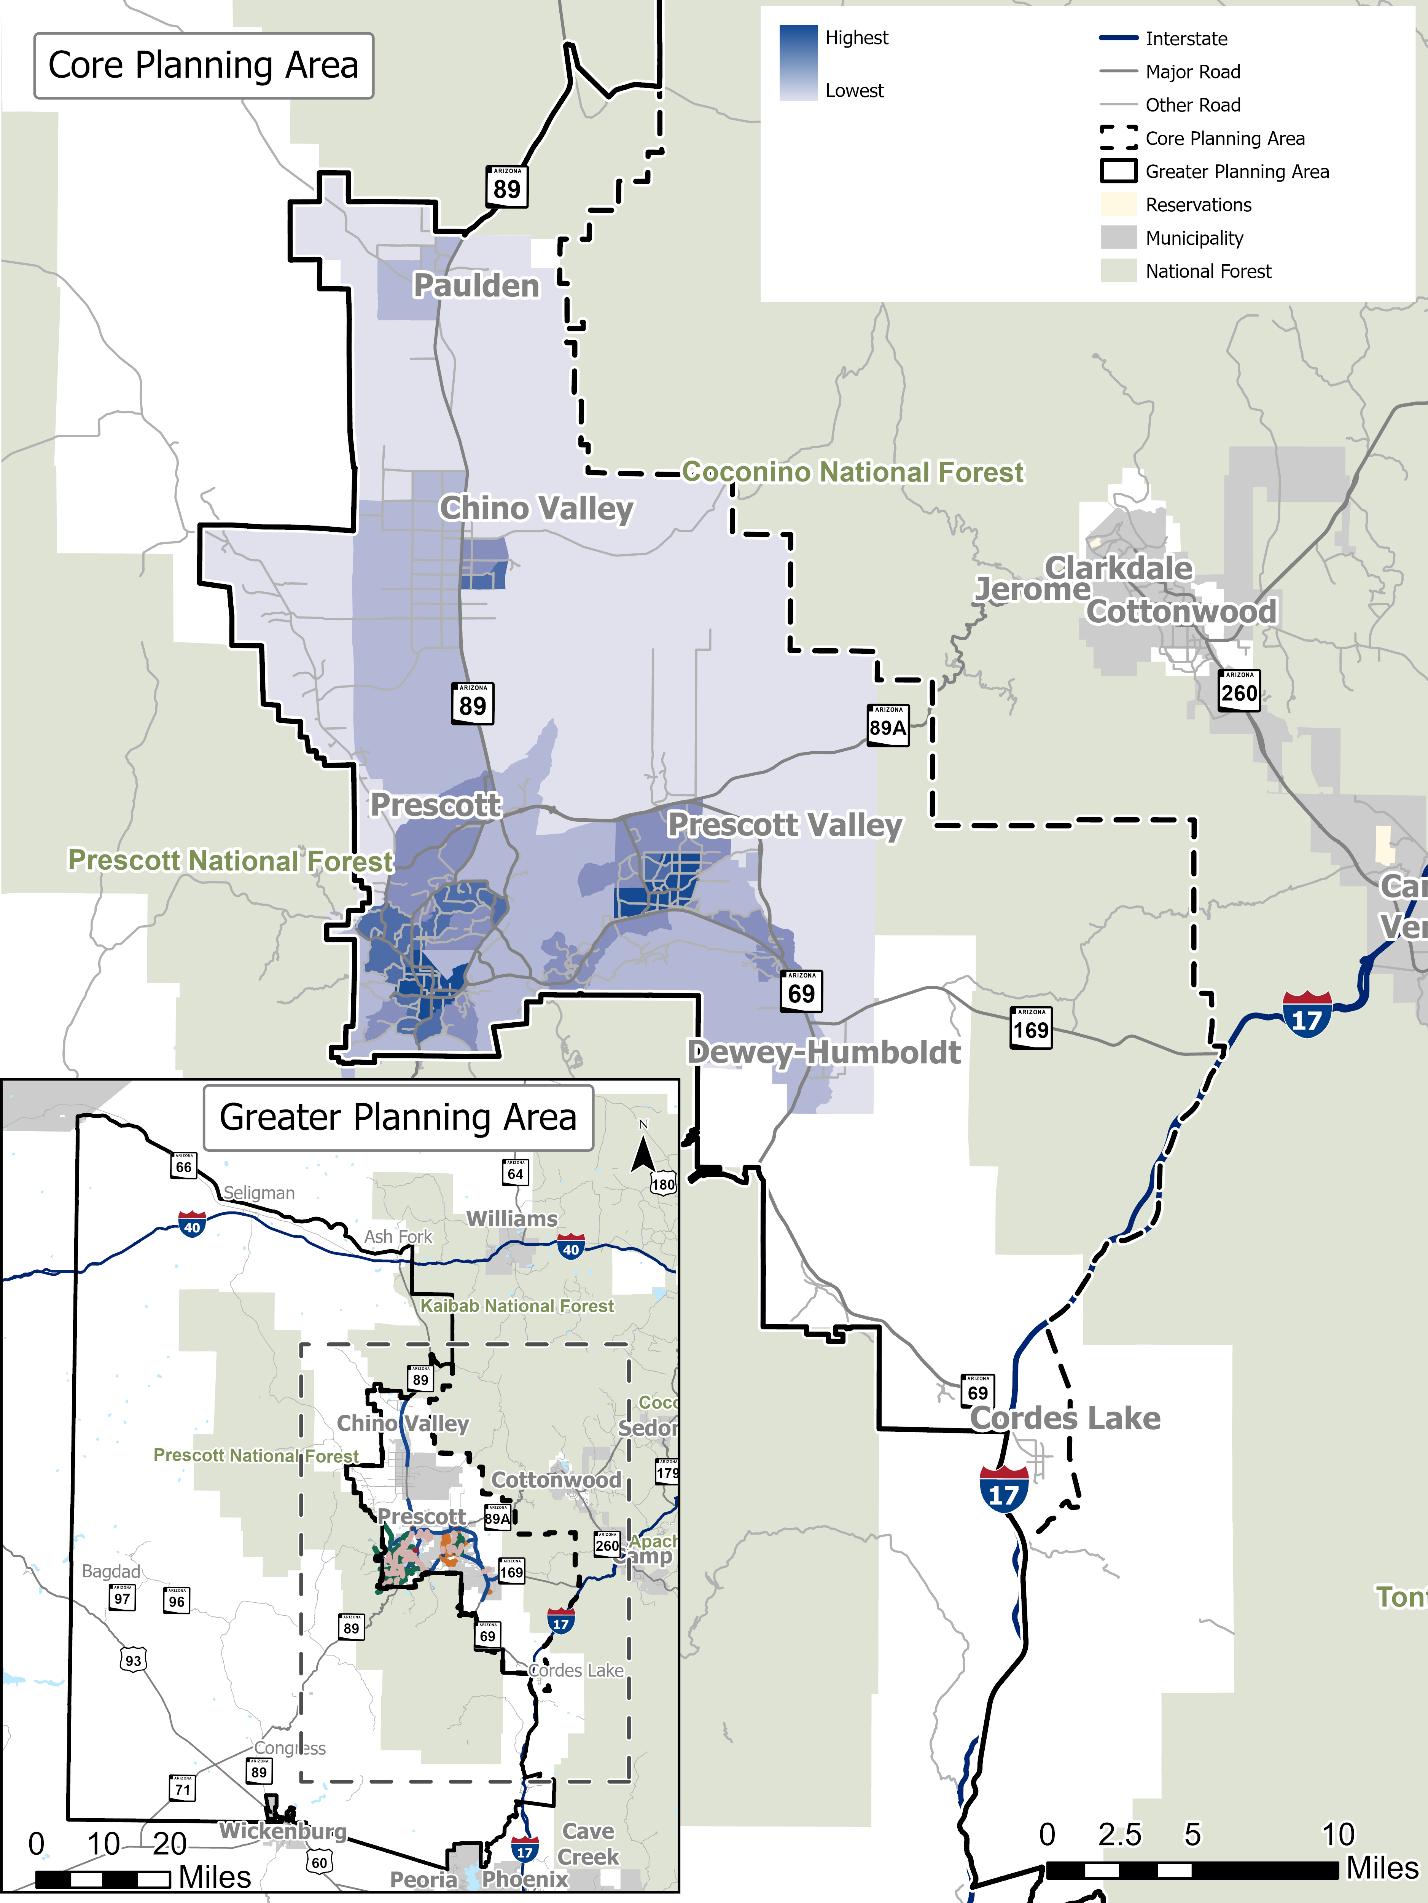
Population and employment density is highest in Prescott and Prescott Valley. Notable employment density is also at the Bagdad Mine in western Yavapai County. Population and employment density are shown in Figure 4 and Figure 5, respectively.
Source: U.S. Census Bureau
4. Population Density
Source: U.S. Census Bureau
Figure 5. Employment Density
Source: U.S. Census Bureau
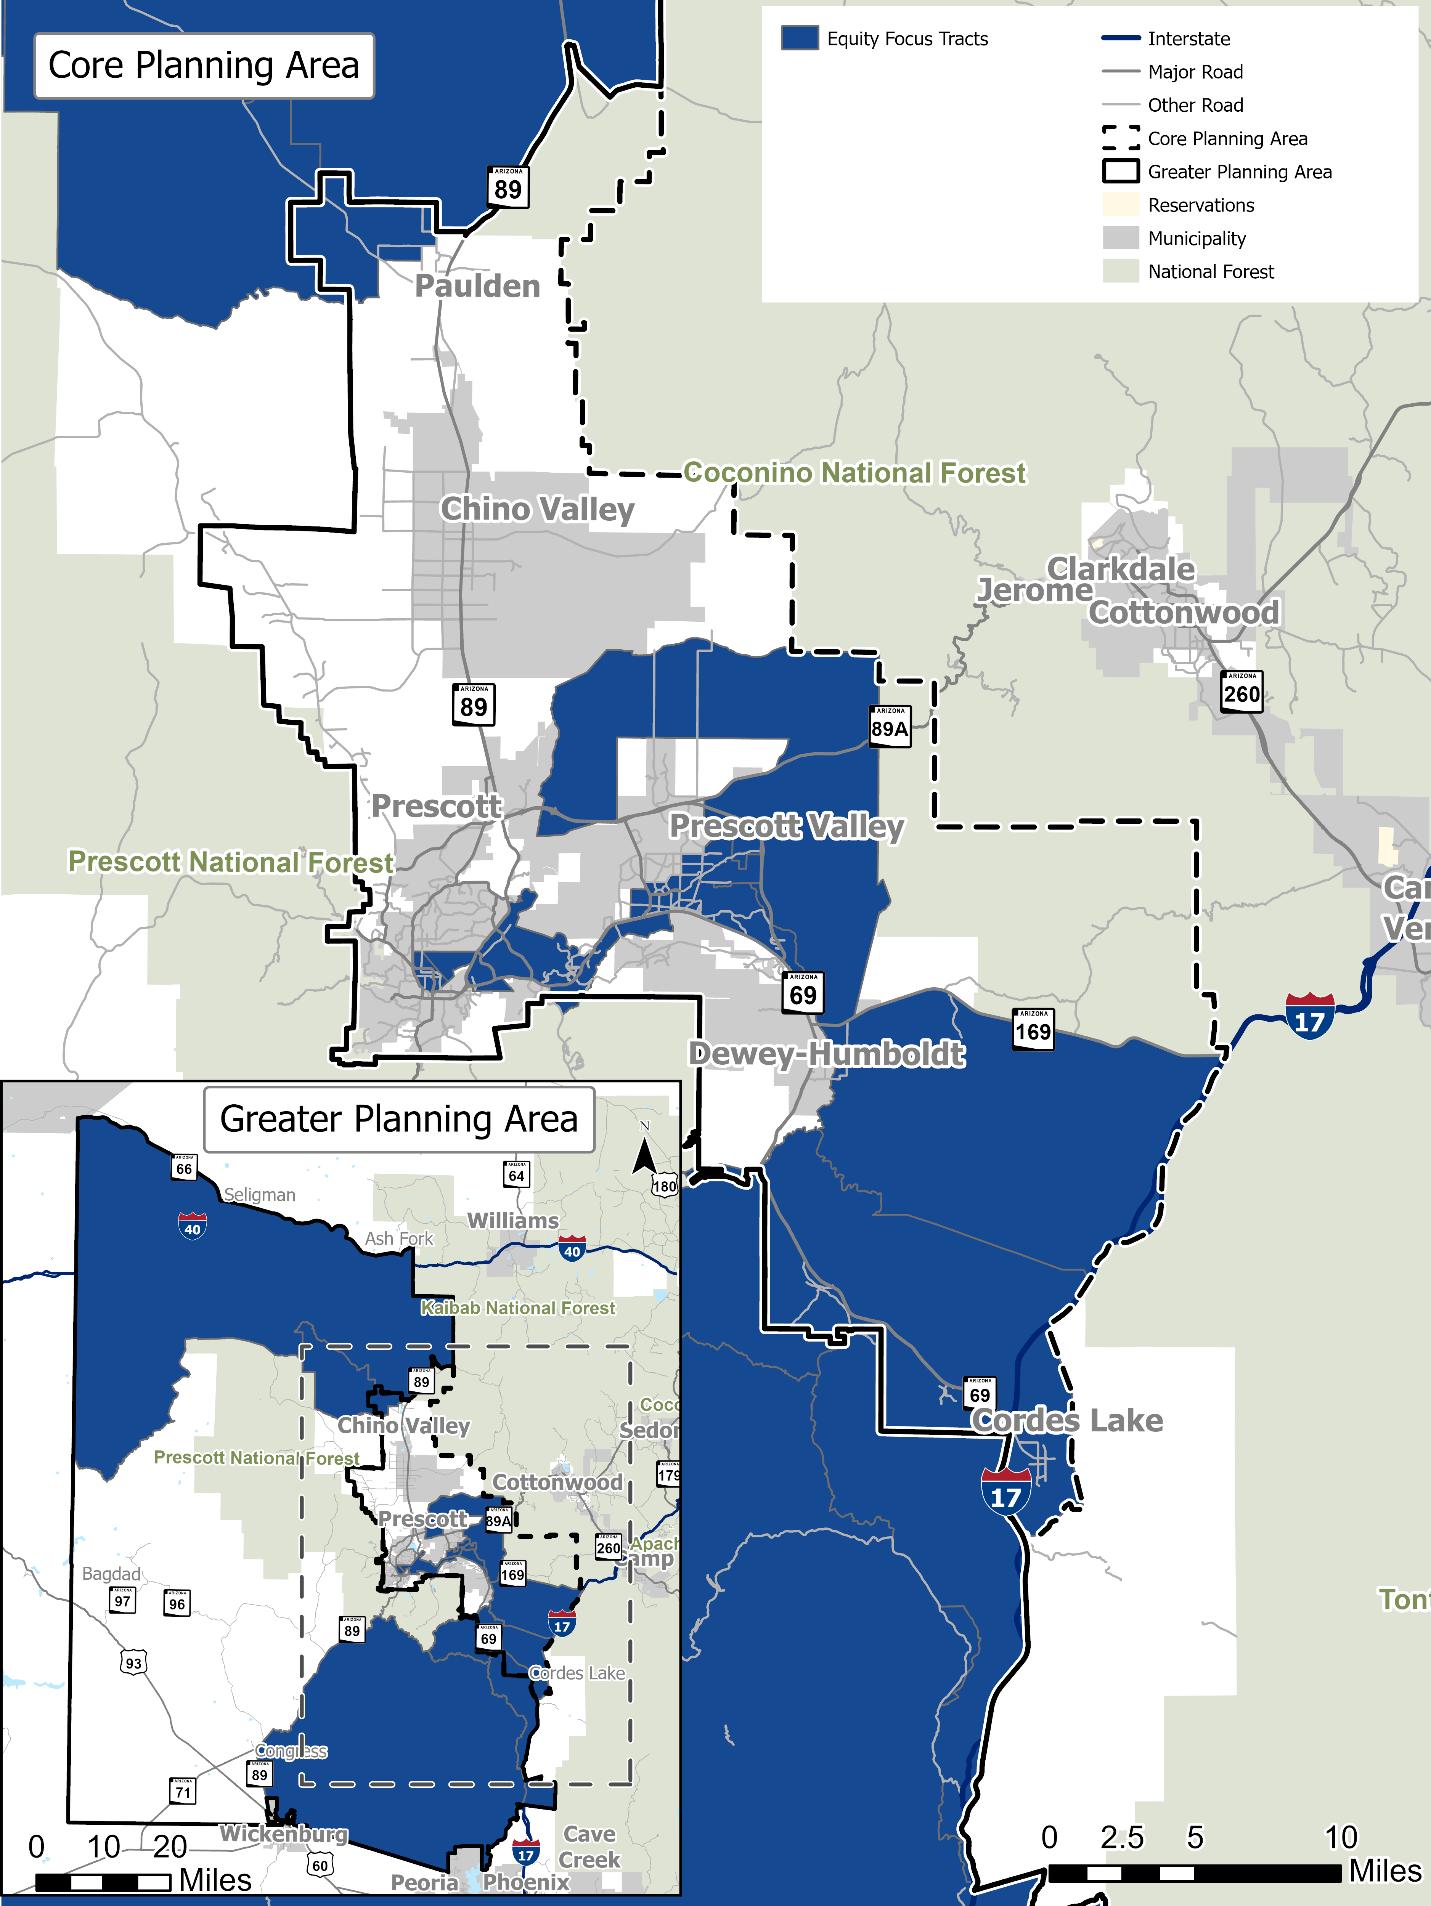
Move 2050 identified disadvantaged communities by identifying vulnerable populations through the US Census Bureau and federally recognized disadvantaged areas. Title VI and environmental justice analysis identifies where vulnerable populations live in the region. To assess vulnerable populations in the region, the following indicators were considered:
• Persons with Limited English Proficiency
• Minority populations
• Low-income populations
• Households without reliable internet
• Households without a personal vehicle
• Persons with disabilities
• Senior populations
are minorities
Outreach efforts should be proactive to engage minority populations who may be harder to reach with virtual engagement. have LimitedEnglish Proficiency are below the poverty line
Understanding community reliance on the active transportation and transit networks are vital when planning for the region’s future transportation network. do not have access to a personal vehicle
have a disability
Additional transportation assistance may be required for aging and disabled populations. These communities may be reliant on the public transportation system. are senior citizens
The federal government has historically defined disadvantaged communities through the following sources:
• United States Department of Transportation (USDOT) Equitable Transportation Community (ETC) Explorer tool
• USDOT Climate and Economic Justice Screening Tool (CEJST)
• USDOT Areas of Persistent Poverty
The focus areas for equitable investments were selected at locations that overlap and have intense need. Move 2050 equity focus areas are shown in Figure 6 Equity focus areas are commonly located in southern Prescott and Prescott Valley and near the Yavapai-Prescott Indian Tribe.
Source: U.S. Census Bureau, USDOT ETC Explorer, CEJST
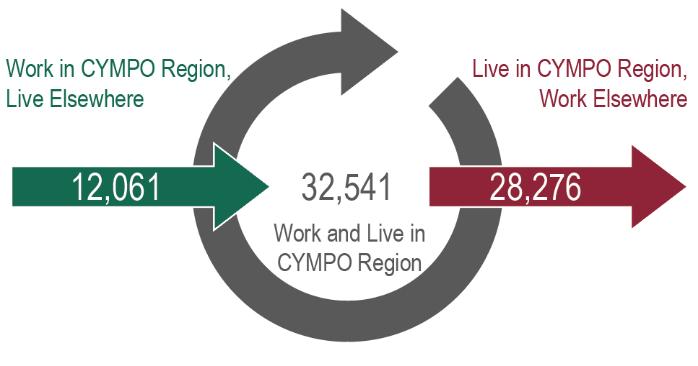
Understanding how residents, employees, and visitors travel in the CYMPO region helps to determine the transportation needs of the region. Commuting flows and where residents and workers travel are summarized below.
Figure 7 shows commute flows in and out of the region. Although the majority of CYMPO residents work in the region, over 28,000 residents travel outside of the region for work. Commuters working in the region that live elsewhere are traveling from the south, from the Phoenix area. Due to the rural nature of the region, employment is concentrated in the quadcities area or residents are traveling to the Verde Valley or Phoenix for work.
Most activity centers are located predominately in the urbanized areas of the region. Outside of the core planning area, Bagdad has the most activity centers attracting vehicular trips
As the CYMPO population grows and evolves, the transportation network will need to facilitate travel and mobility needs to support a variety of travel options. This section reviews future socioeconomic conditions in the region to predict how the transportation system will need to support the community in the future.
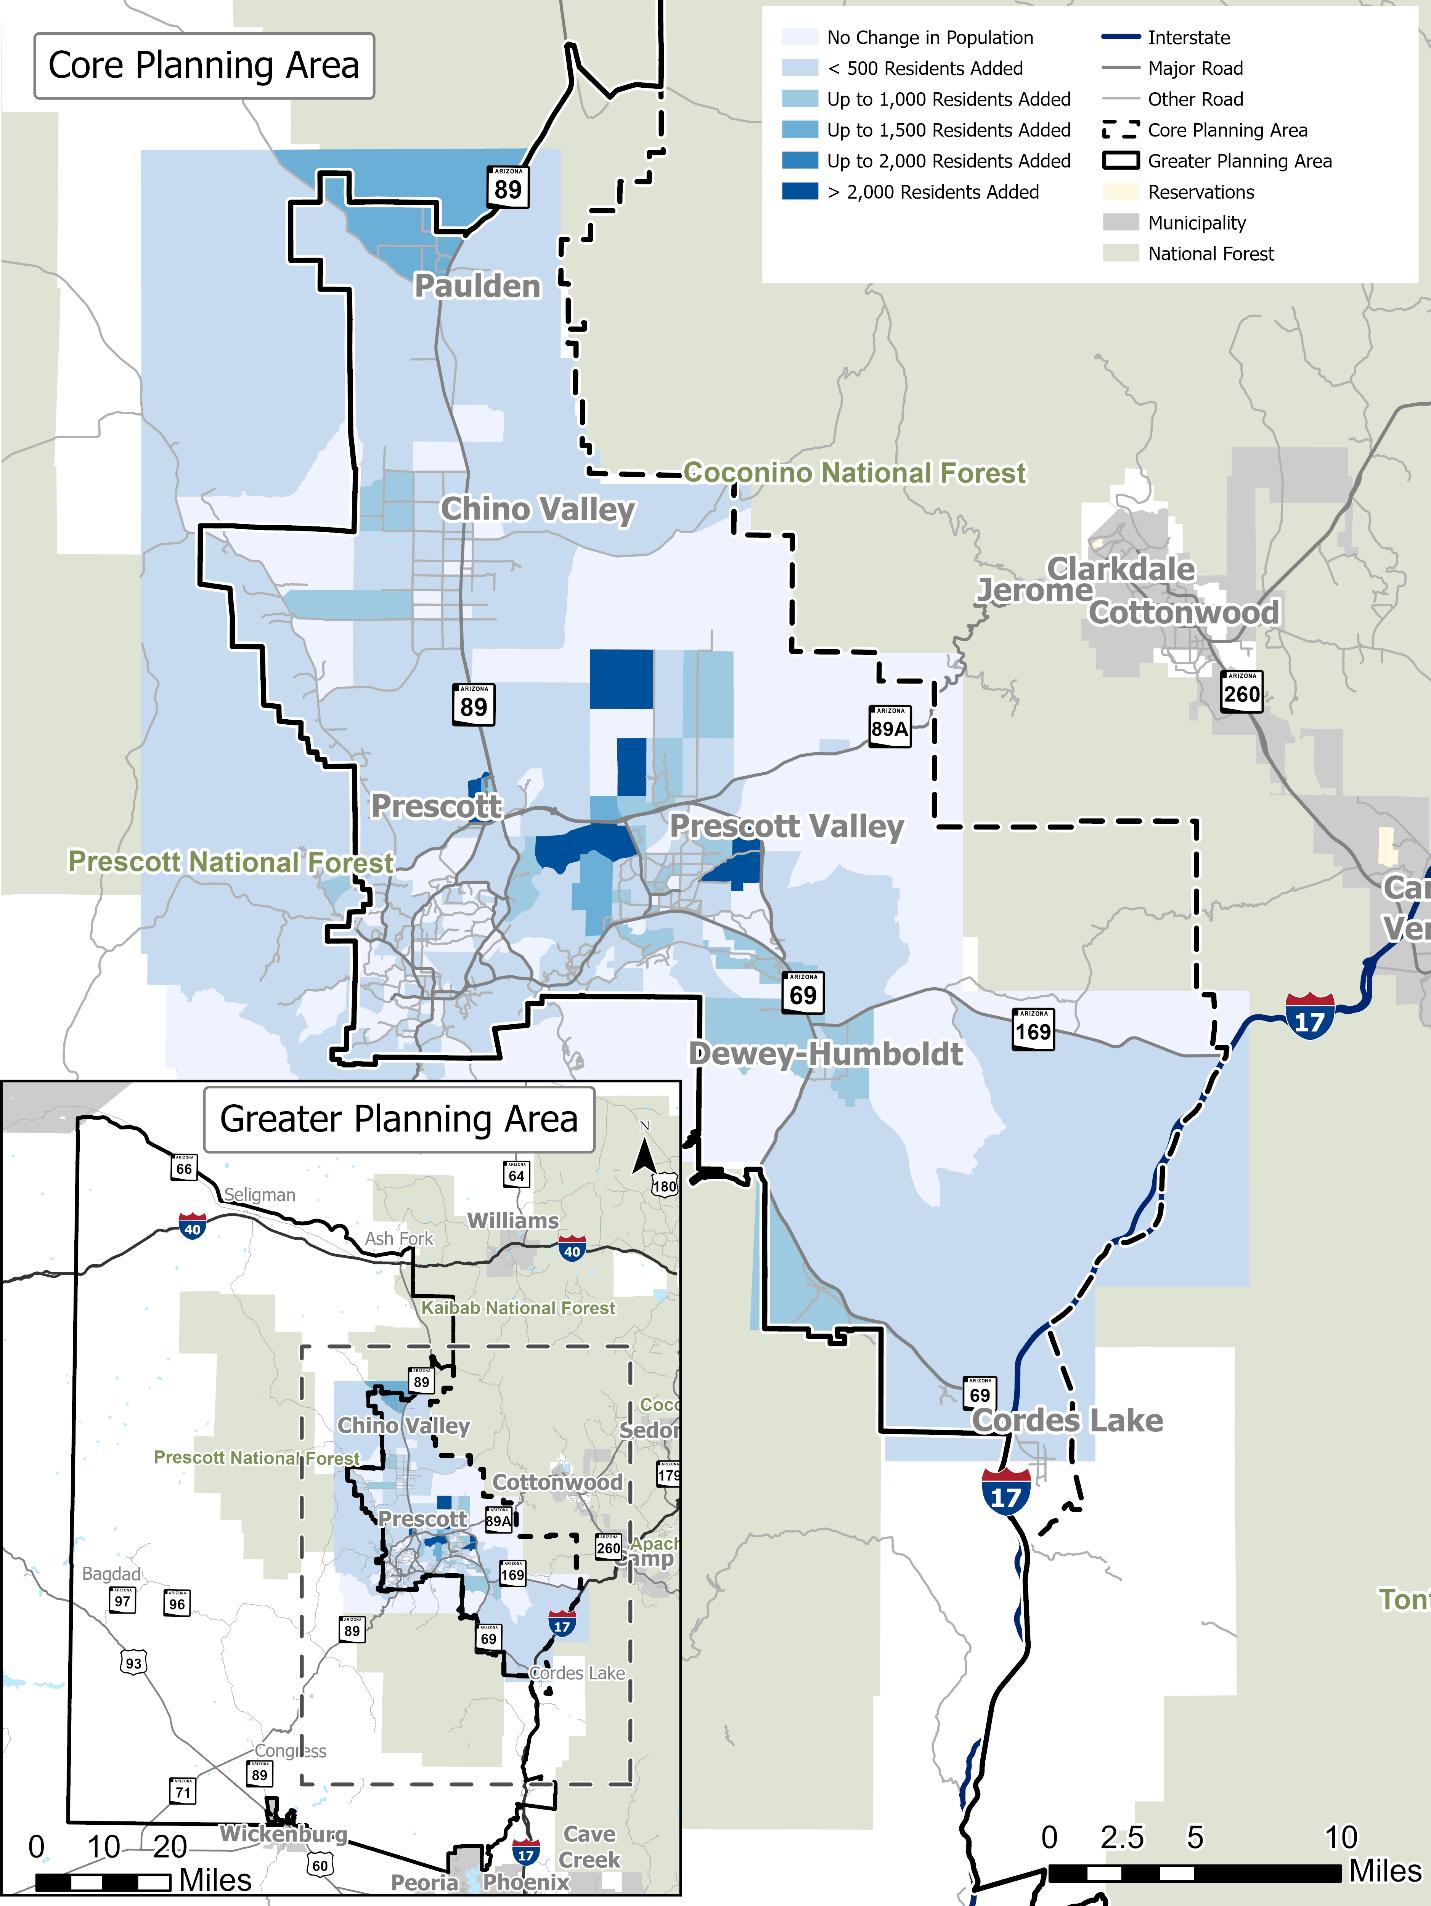
The CYMPO region has experienced significant growth, and it is anticipated for this growth to continue current predictions anticipate the region will grow by 30.58% by 2050. Anticipated population changes can provide insight into the future needs of CYMPO’s transportation system. Figure 8 shows forecasted population changes in Yavapai County and CYMPO’s incorporated member agencies. The county is anticipated to grow by 29% by 2050, with significant growth in Prescott Valley and Chino Valley.
Figure 8. Forecasted Population for Yavapai County
Source: Arizona Office of Economic Opportunity
Change in population density throughout the CYMPO region are shown in Figure 9. Population density change comes from CYMPO’s regional travel demand model (TDM) and are represented by transportation analysis zones (TAZs).
A Transportation Analysis Zone is a geographic area used in transportation planning models to simplify traffic analysis and modeling by grouping areas
A travel demand model is a mathematical model used to predict future travel characteristics and test network or demographic scenarios to
9. Population Growth (2024 - 2050) by TAZ
Source: TDM
Forecasted employment growth was applied to each TAZ in the 2050 baseline TDM scenario. Understanding employment changes allows CYMPO to plan appropriately for the region’s future. Employment forecast by jurisdiction is displayed in Figure 10. The core planning area employment is anticipated to grow by 26.8% by 2050, with significant growth in Prescott Valley and surrounding the Prescott Airport, as shown in Figure 11.
Source: CYMPO
11. Employment Growth (2024 - 2050) by TAZ
Source: TDM
Understanding the environmental conditions of the region serves as a guide for Move 2050 when developing and evaluating potential transportation projects. As part of Move 2050, the following goals were developed to ensure environmental considerations align with the region’s resources and desire for environmental protection:
Spatial data on the status of pertinent environmental data within the planning area is captured by a multitude of agencies, causing some data to be hard to find. Move 2050 has developed consistent, regional data for use by CYMPO and its member agencies.
Move 2050 identifies areas that would be difficult to implement transportation improvements due to a variety of environmental conditions as well as areas where the impacts could be harmful to the natural environment.
An analysis of the future land use designations across the region helps determine where open space has been identified for preservation or where connectivity to and between the recreation opportunities across the region need to be enhanced.
Natural features and wildlife can be impacted by transportation corridors. Move 2050 has integrated natural features and wildlife considerations into the project prioritization framework to de-emphasize projects that have a greater impact on sensitive areas or where transportation improvements may need mitigation features included in their future designs.
Move 2050 meets federal environmental requirements for long-range transportation planning to ensure federal funds continue to flow to the CYMPO region.
Natural features within the CYMPO region present constraints when implementing transportation improvements which may require mitigation or specialized analysis to ensure that projects minimize degradation of features that make the region unique. Figure 12 shows surface water and topography in CYMPO.
Special flood hazard areas in the region, commonly referred to as the 100-year floodplain, account for 136,000 acres, including surrounding lakes, ponds, and reservoirs throughout the region.
Incorporated jurisdictions in the region are often situated between steep slopes in the Kaibab National Forest and the Prescott National Forest. In the core planning area, areas that may be constrained by topography are south of Dewey-Humboldt and throughout Prescott.
Many levels of government identify land for conservation. The land designation for open space or conservation can be a constraint to transportation projects by either prohibiting them due to the sensitivity of the area’s environment or by adding additional levels of approval to obtain right-of-way or permit construction. Figure 13 shows projected lands and designated open space and conservation areas.
FEDERAL AND STATE PROTECTED LANDS
Within the City of Prescott, there is land designated for conservation by the Yavapai-Prescott Indian Tribe and land designated for military use by the Veterans Administration. To the south, there are pockets of land owned and maintained by the Bureau of Land Management, including the Agua Fria National Monument.
Future open space land is identified in general and comprehensive plans of CYMPO’s member agencies. There are 34,000 acres of future designated open space in the region.
To ensure wildlife are not threatened by the projects promoted by Move 2050, key wildlife datasets were assessed to understand where protected wildlife is present. Key findings in the CYMPO region include:
10 Threatened or endangered species 1,500,000+ Acres identified as wildlife conservation opportunity areas
2 Wildlife connectivity zone links in the core planning area 15 Aquatic conservation opportunity areas
Figure 14 shows wildlife areas of consideration, including wildlife conservation opportunity areas and wildlife connectivity zones.
Figure 12. Floodplains and Topography
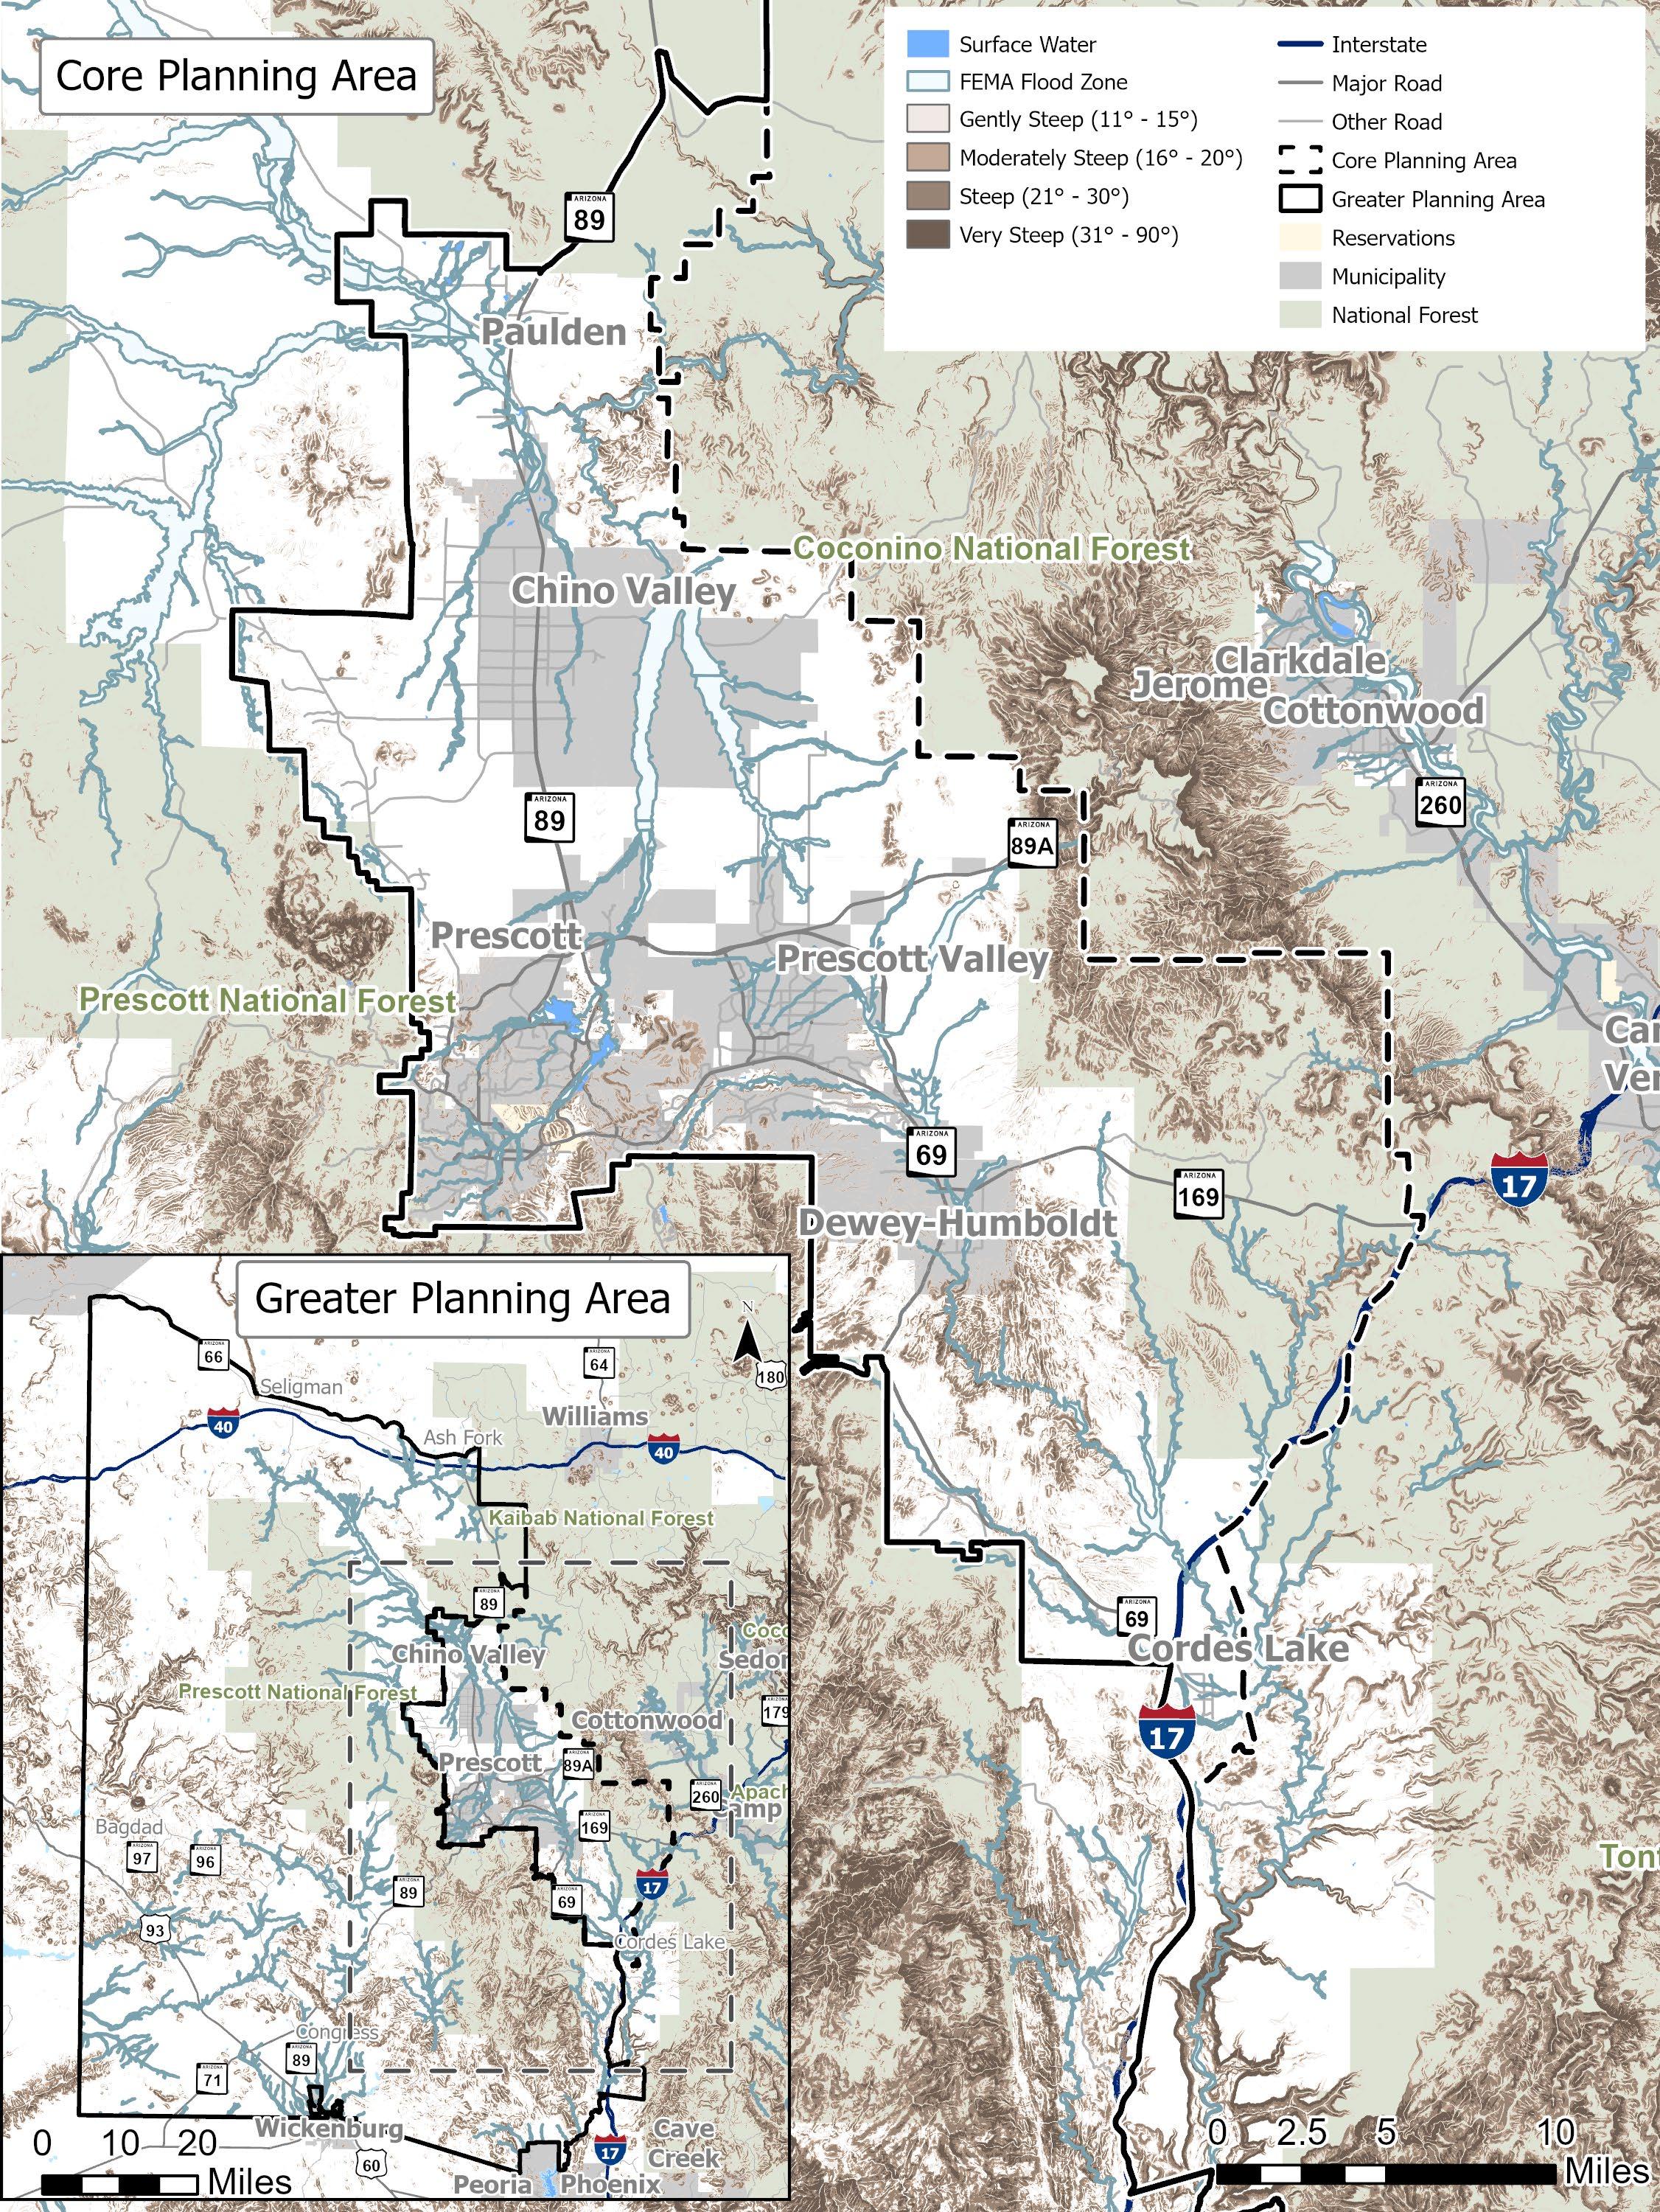
Source: FEMA, Esri
Figure 13. Protected Lands and Local Open Space/Conservation Areas
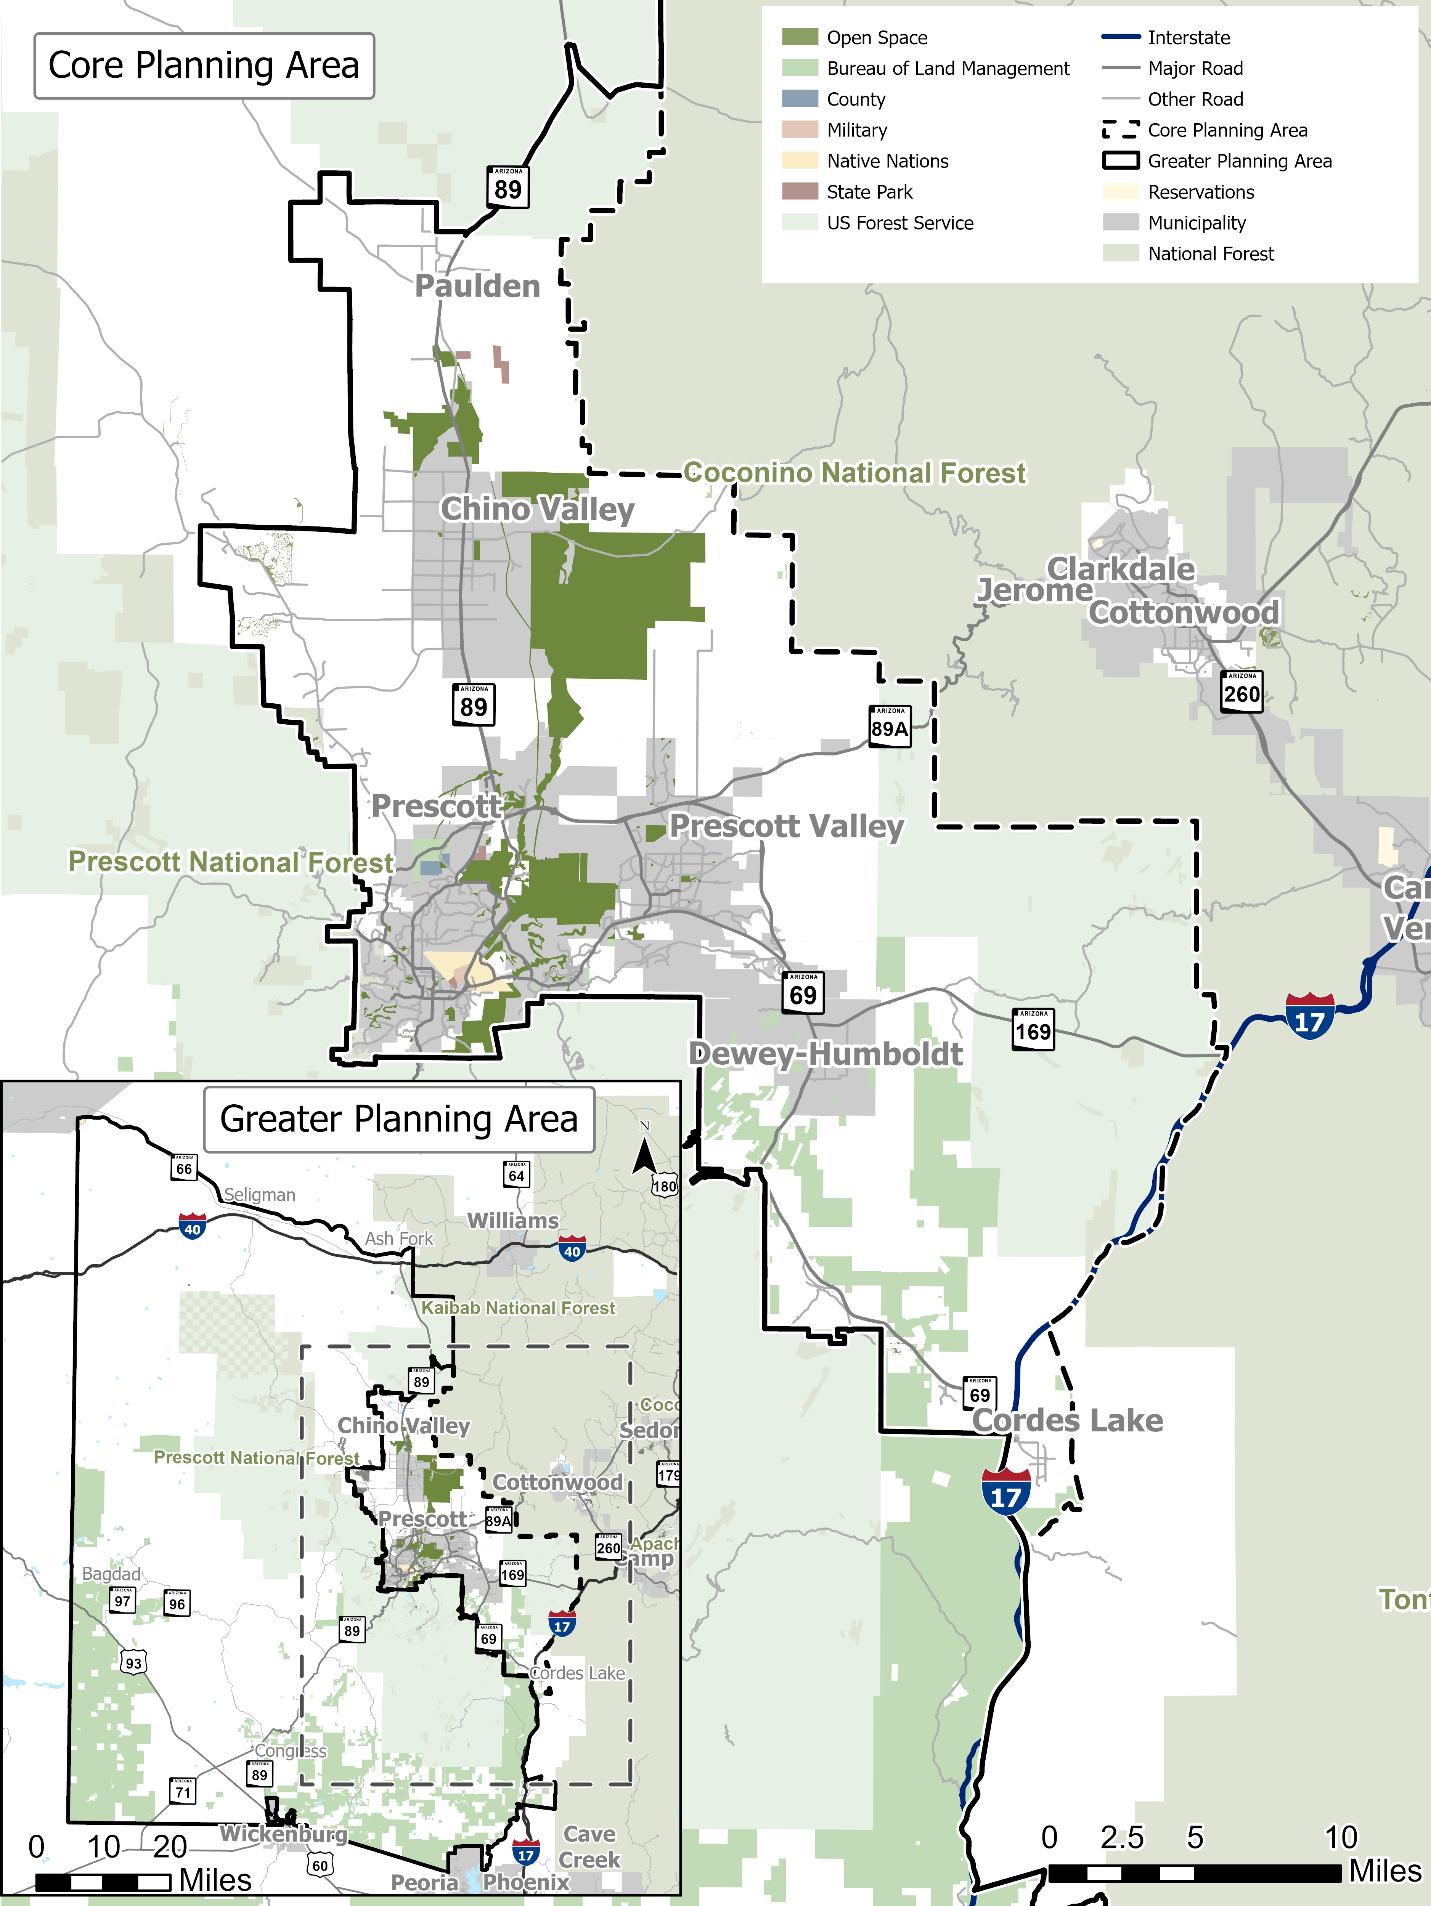
Source: Arizona Game and Fish Department
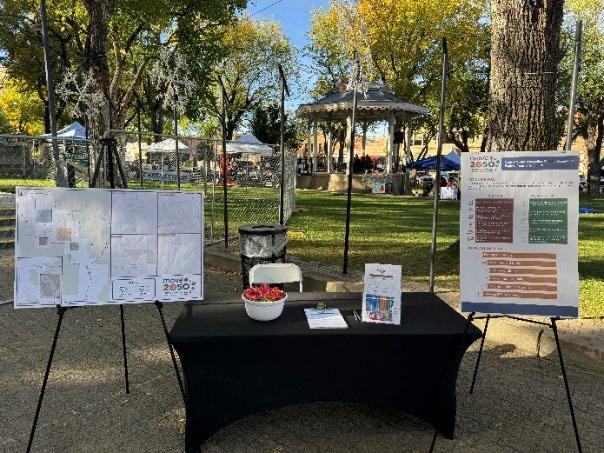
Public input is vital to the success of Move 2050. The RTP’s two rounds of public engagement occurred at key points throughout the planning process to ensure the resulting transportation improvements reflect the community’s needs and desires. Move 2050 public engagement included:
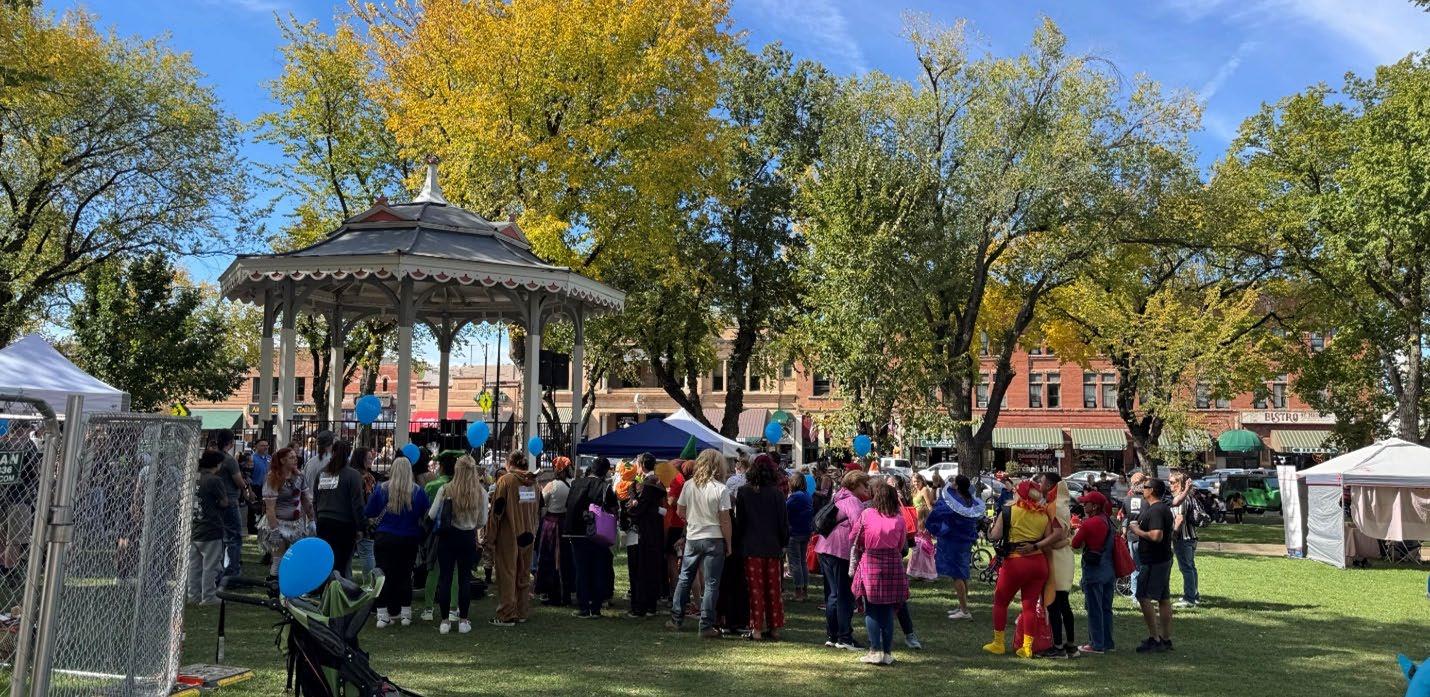
To engage with the public, Move 2050 project staff did extensive virtual and in-person engagement activities.
In-Person Engagement Pop-Up Events
Costumes for Kids 5K Truck or Treat Acker Night Pine Ridge Prowl at the Mall
Virtual Web Map and Survey Virtual Raffles for Survey Respondents
Round 1 of public engagement for Move 2050 aimed to get feedback on the region’s transportation priorities for each mode of travel. This ensures that the RTP represents the community’s priorities prior to developing potential transportation improvements for the region. The first round of public engagement comprised of a virtual survey that was shared at in-person pop-up events and advertised online.
96% of respondents use driving as their primary mode of travel.
57% of respondents would be interested in using transit if the system was improved.
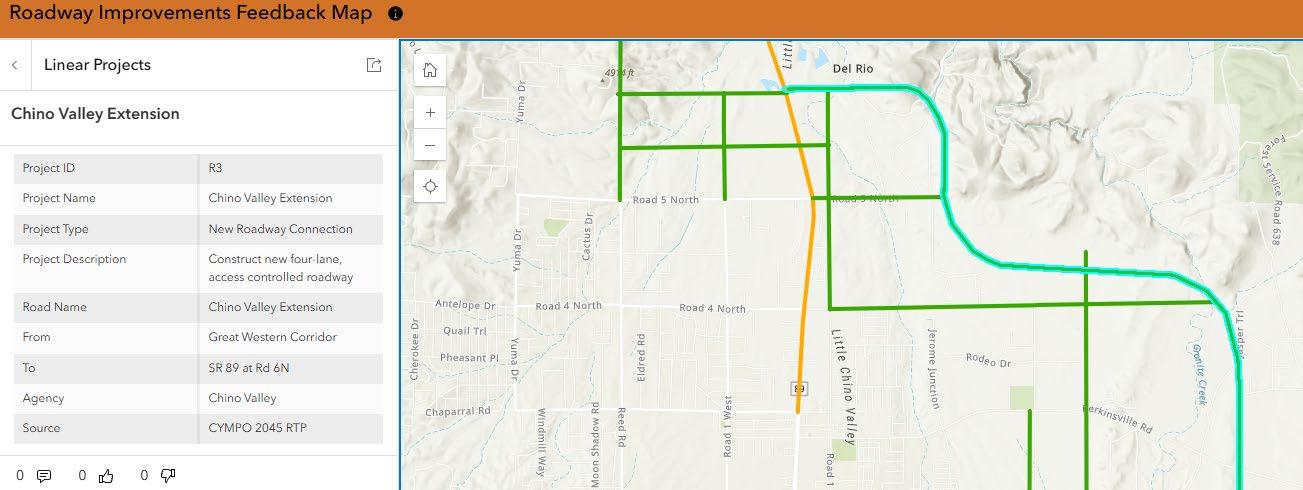
Round 2 of Move 2050 public engagement occurred in coordination with ACT-UP engagement. Respondents were asked to rank and comment on proposed roadway, active transportation, and transit improvements recommended by the planning efforts. Respondents can browse the projects by type on a web map and can select a project of interest, where they can comment, like, or dislike the project. Figure 15 shows the map for roadway improvements.
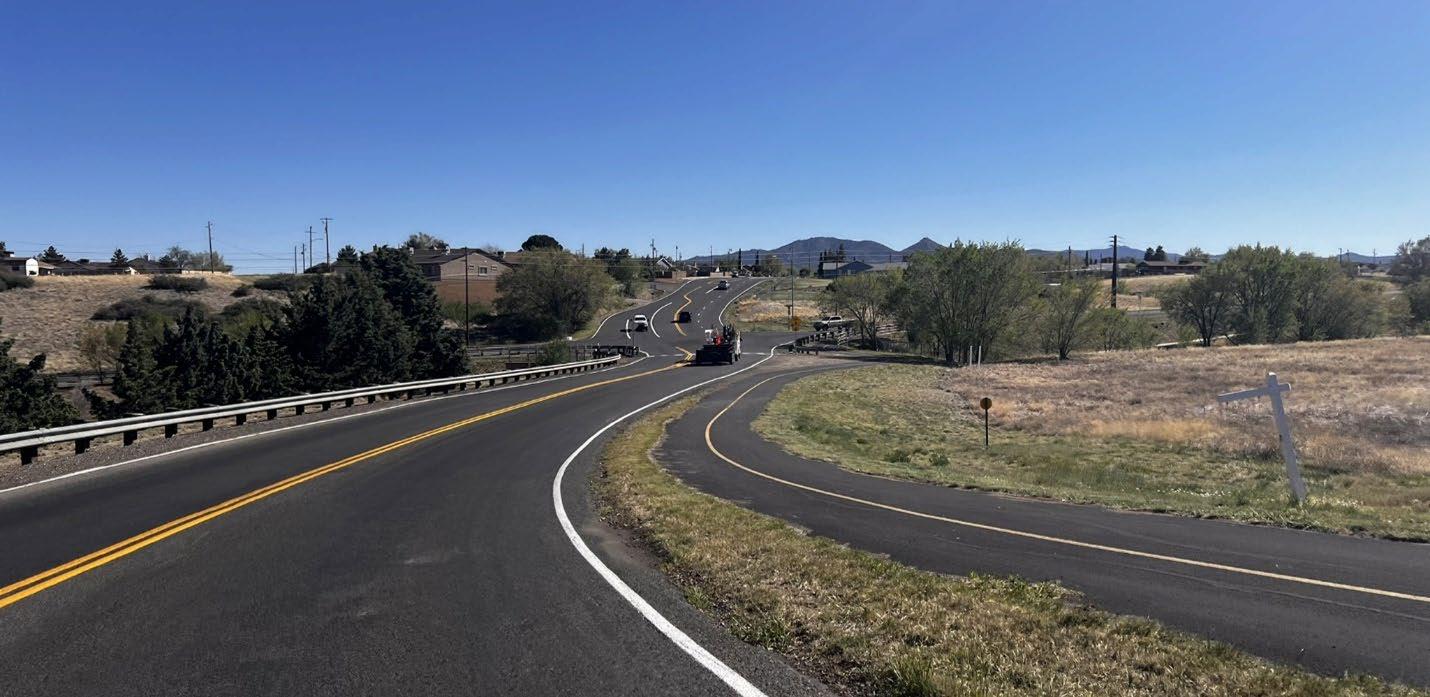
The roadway network serves as the foundation of the regional transportation network, accommodating vehicles, freight, transit users, pedestrians, and bicyclists. The efficiency, safety, and condition of the region’s roadway network is essential to the functionality of the other modes of transportation in the region.
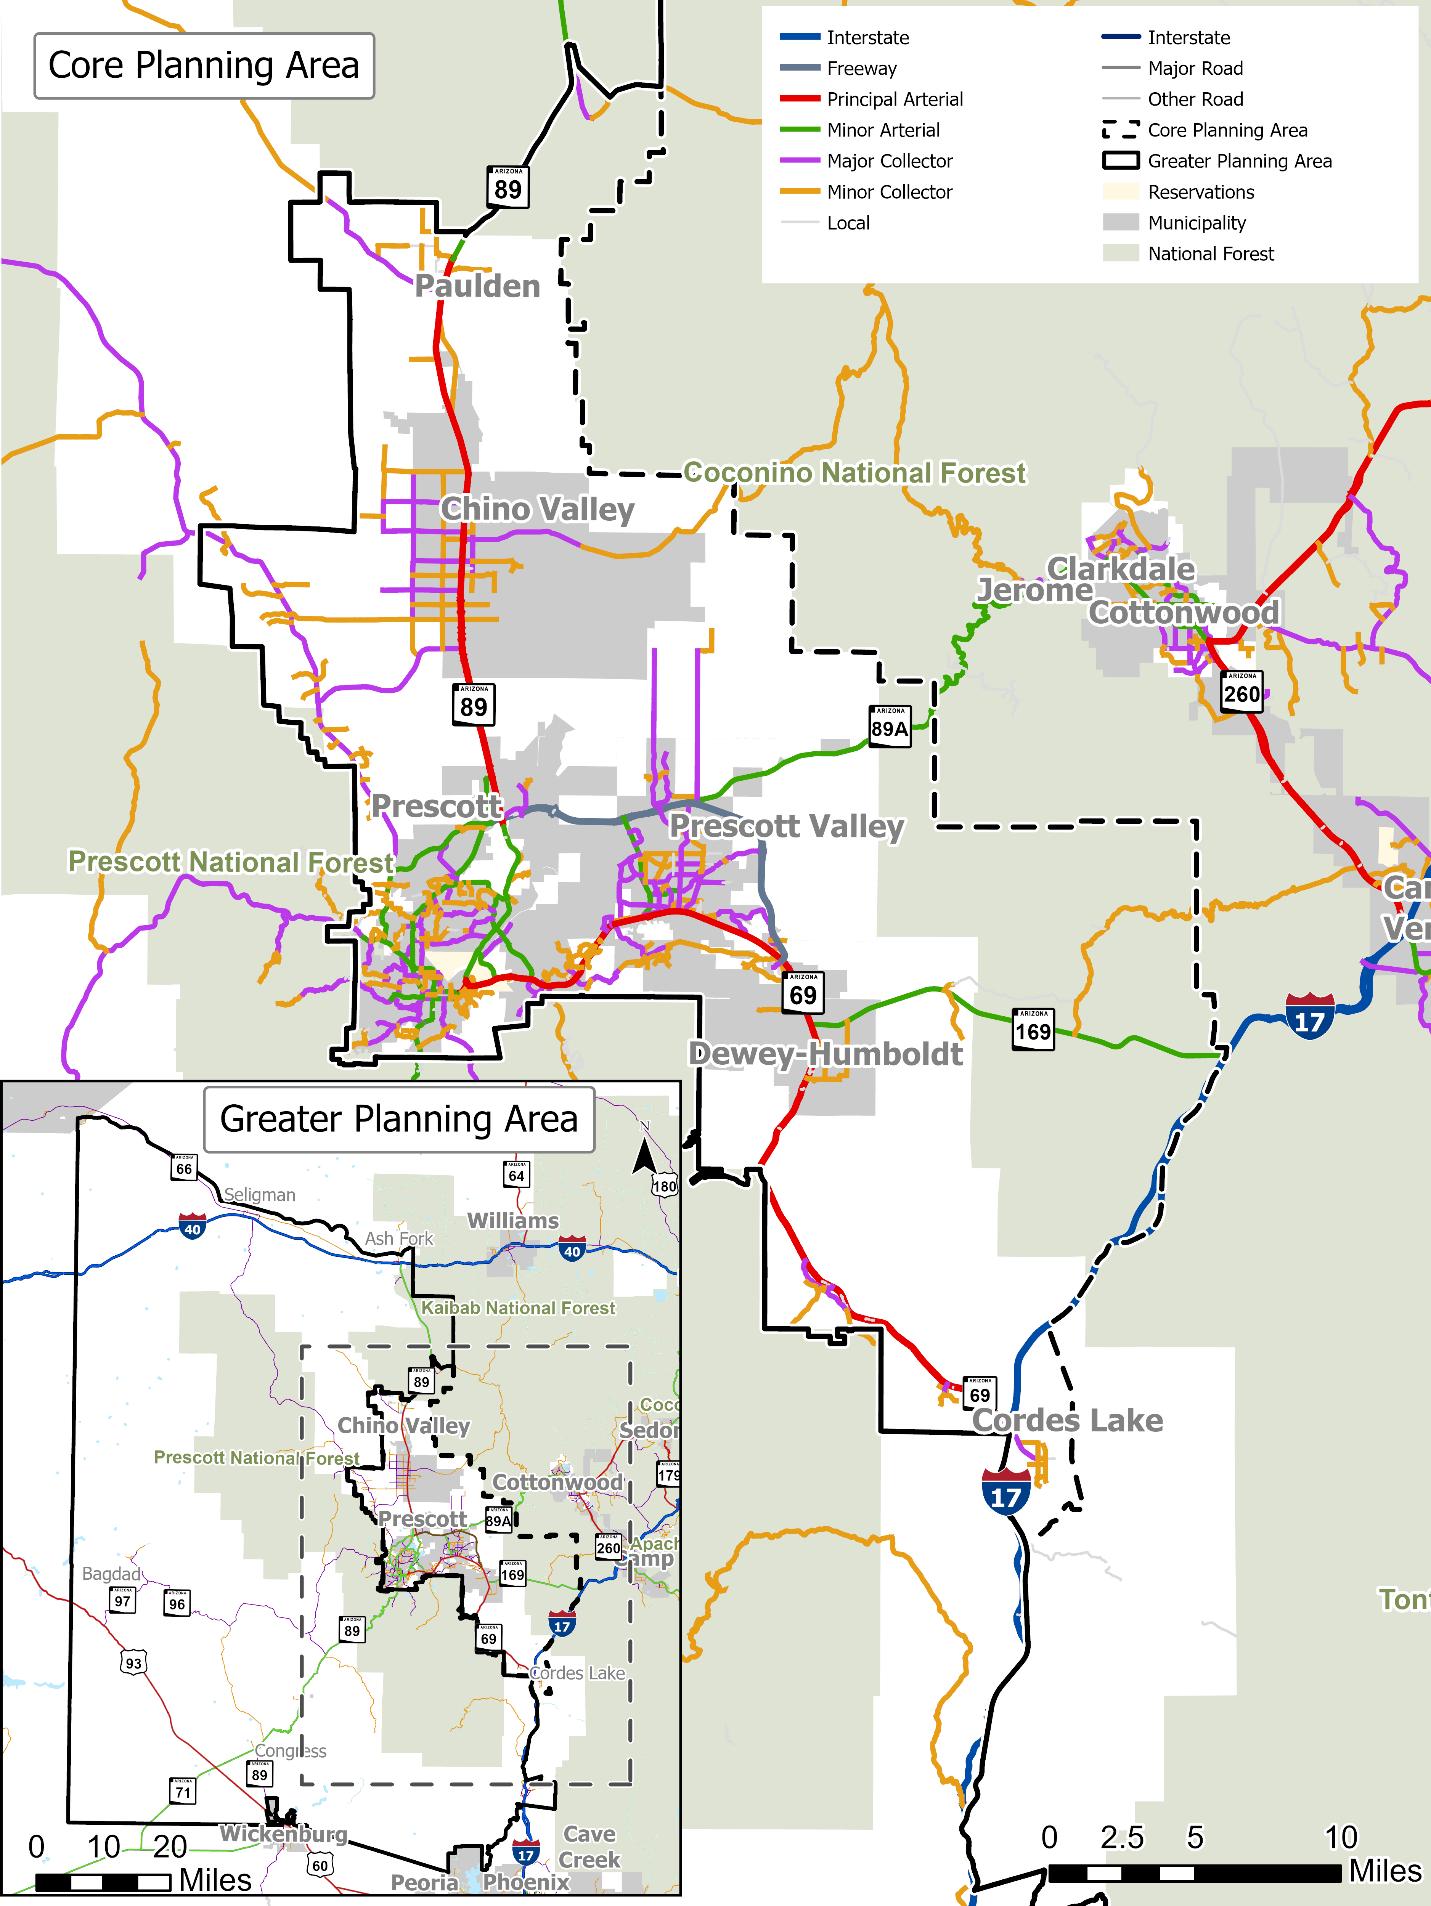
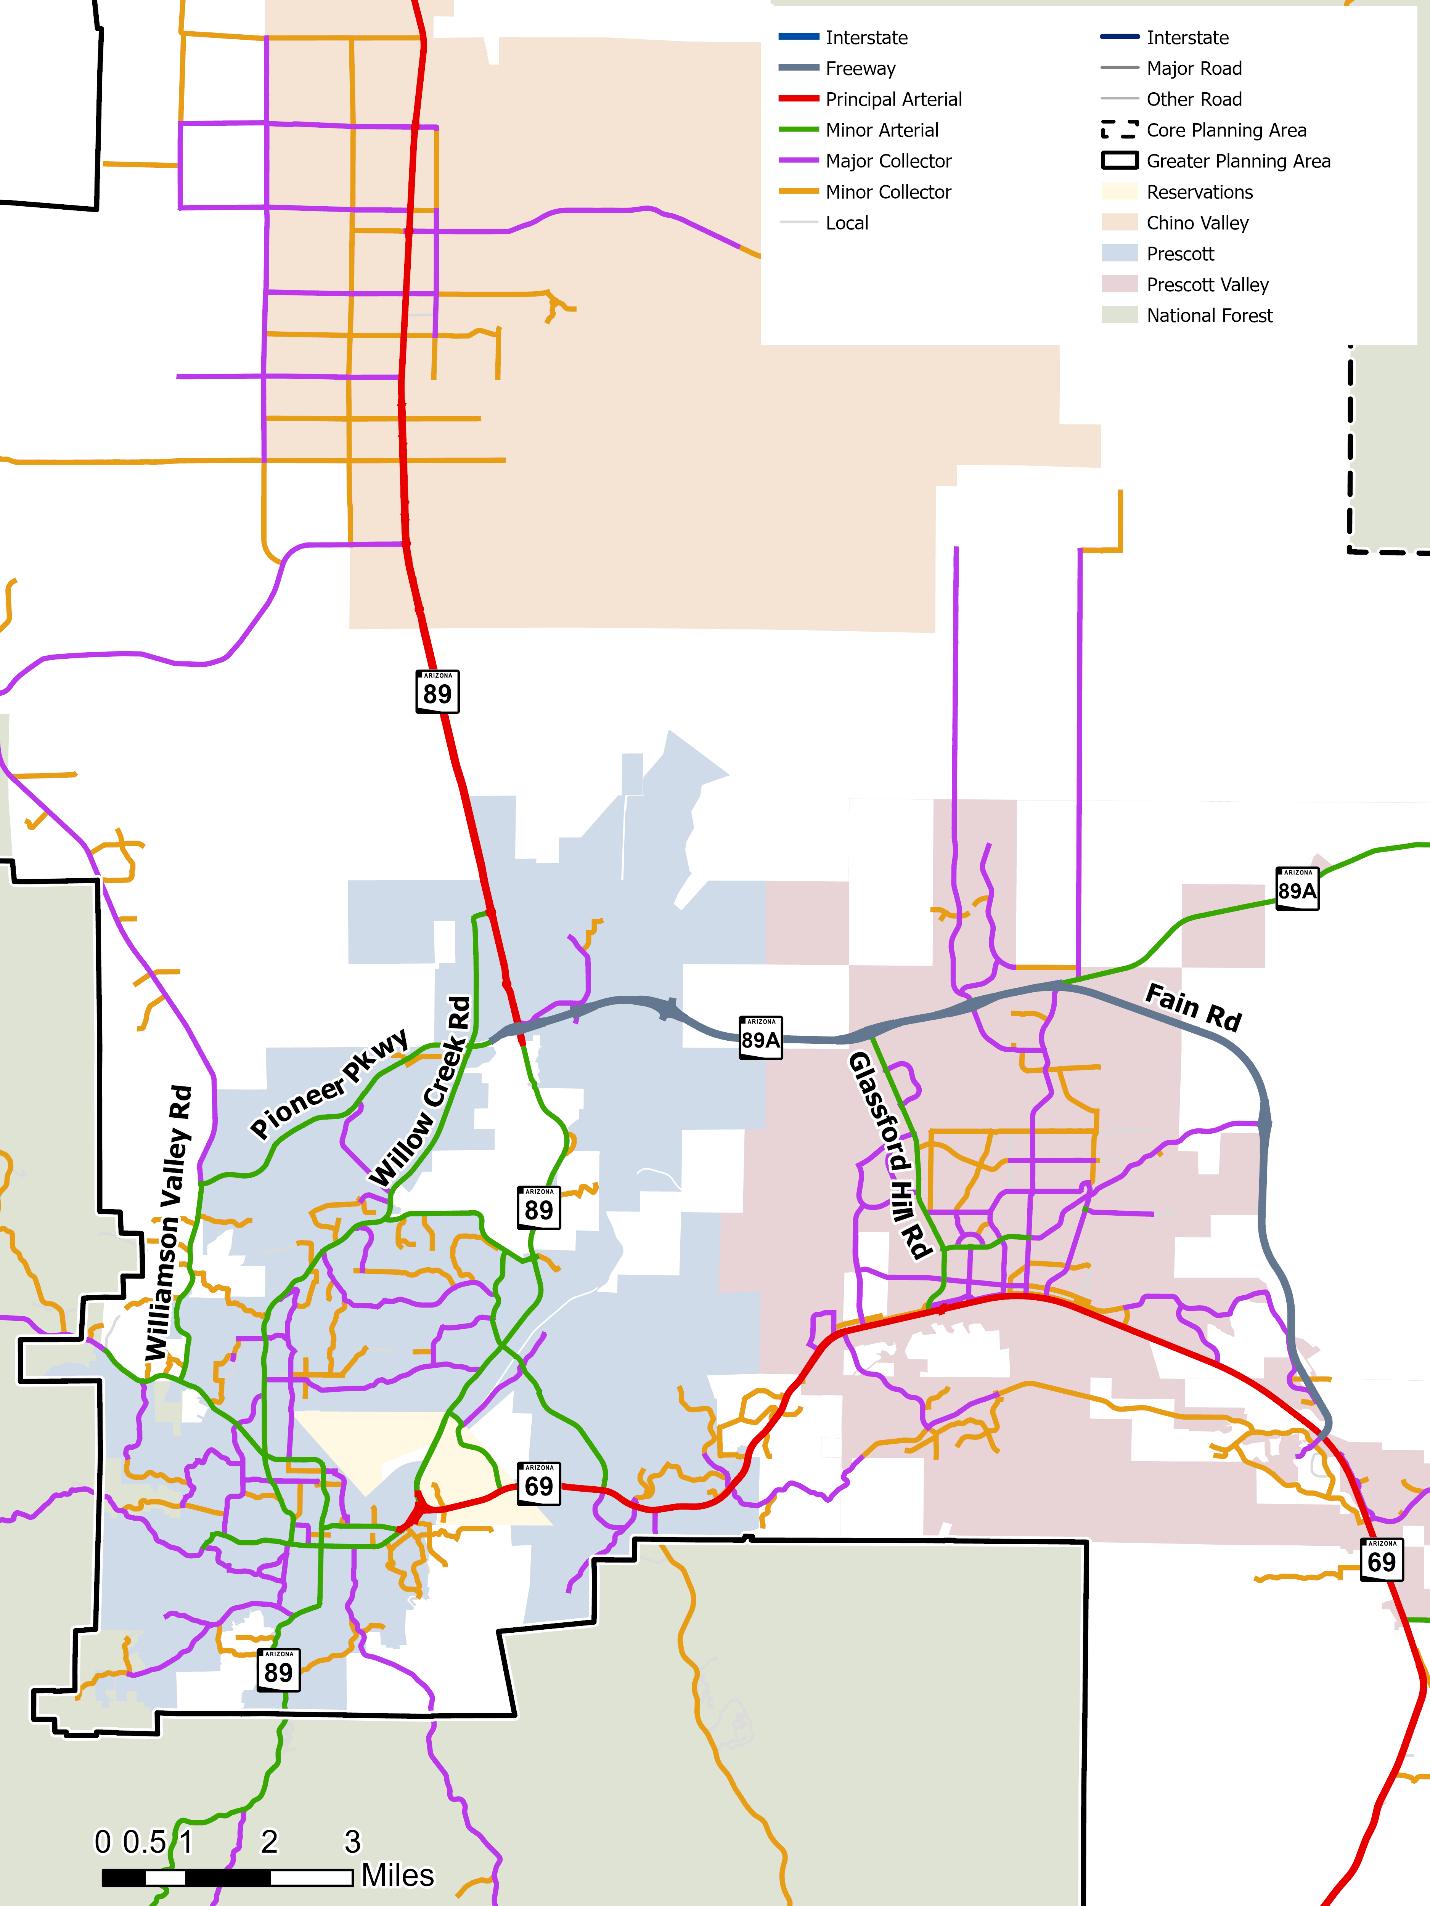
The region’s current roadway network supports elements of the National Highway System (NHS), shown in Figure 16. The network was assessed by the roadway’s characteristics, conditions, and usage. Figure 17 shows the region’s roadways by functional classification —a system of sorting roads by their intended use in the overall transportation network. Figure 18 shows a zoomed in version of functional classification in the denser portions of the region.
1,505 miles of federal functionally classified roadways
Source: ADOT, CYMPO
Source: FHWA, ADOT, AZ Geo
Figure 17. Functional Classification
Source: ADOT
Figure 18. Functional Classification Inset
Source: ADOT
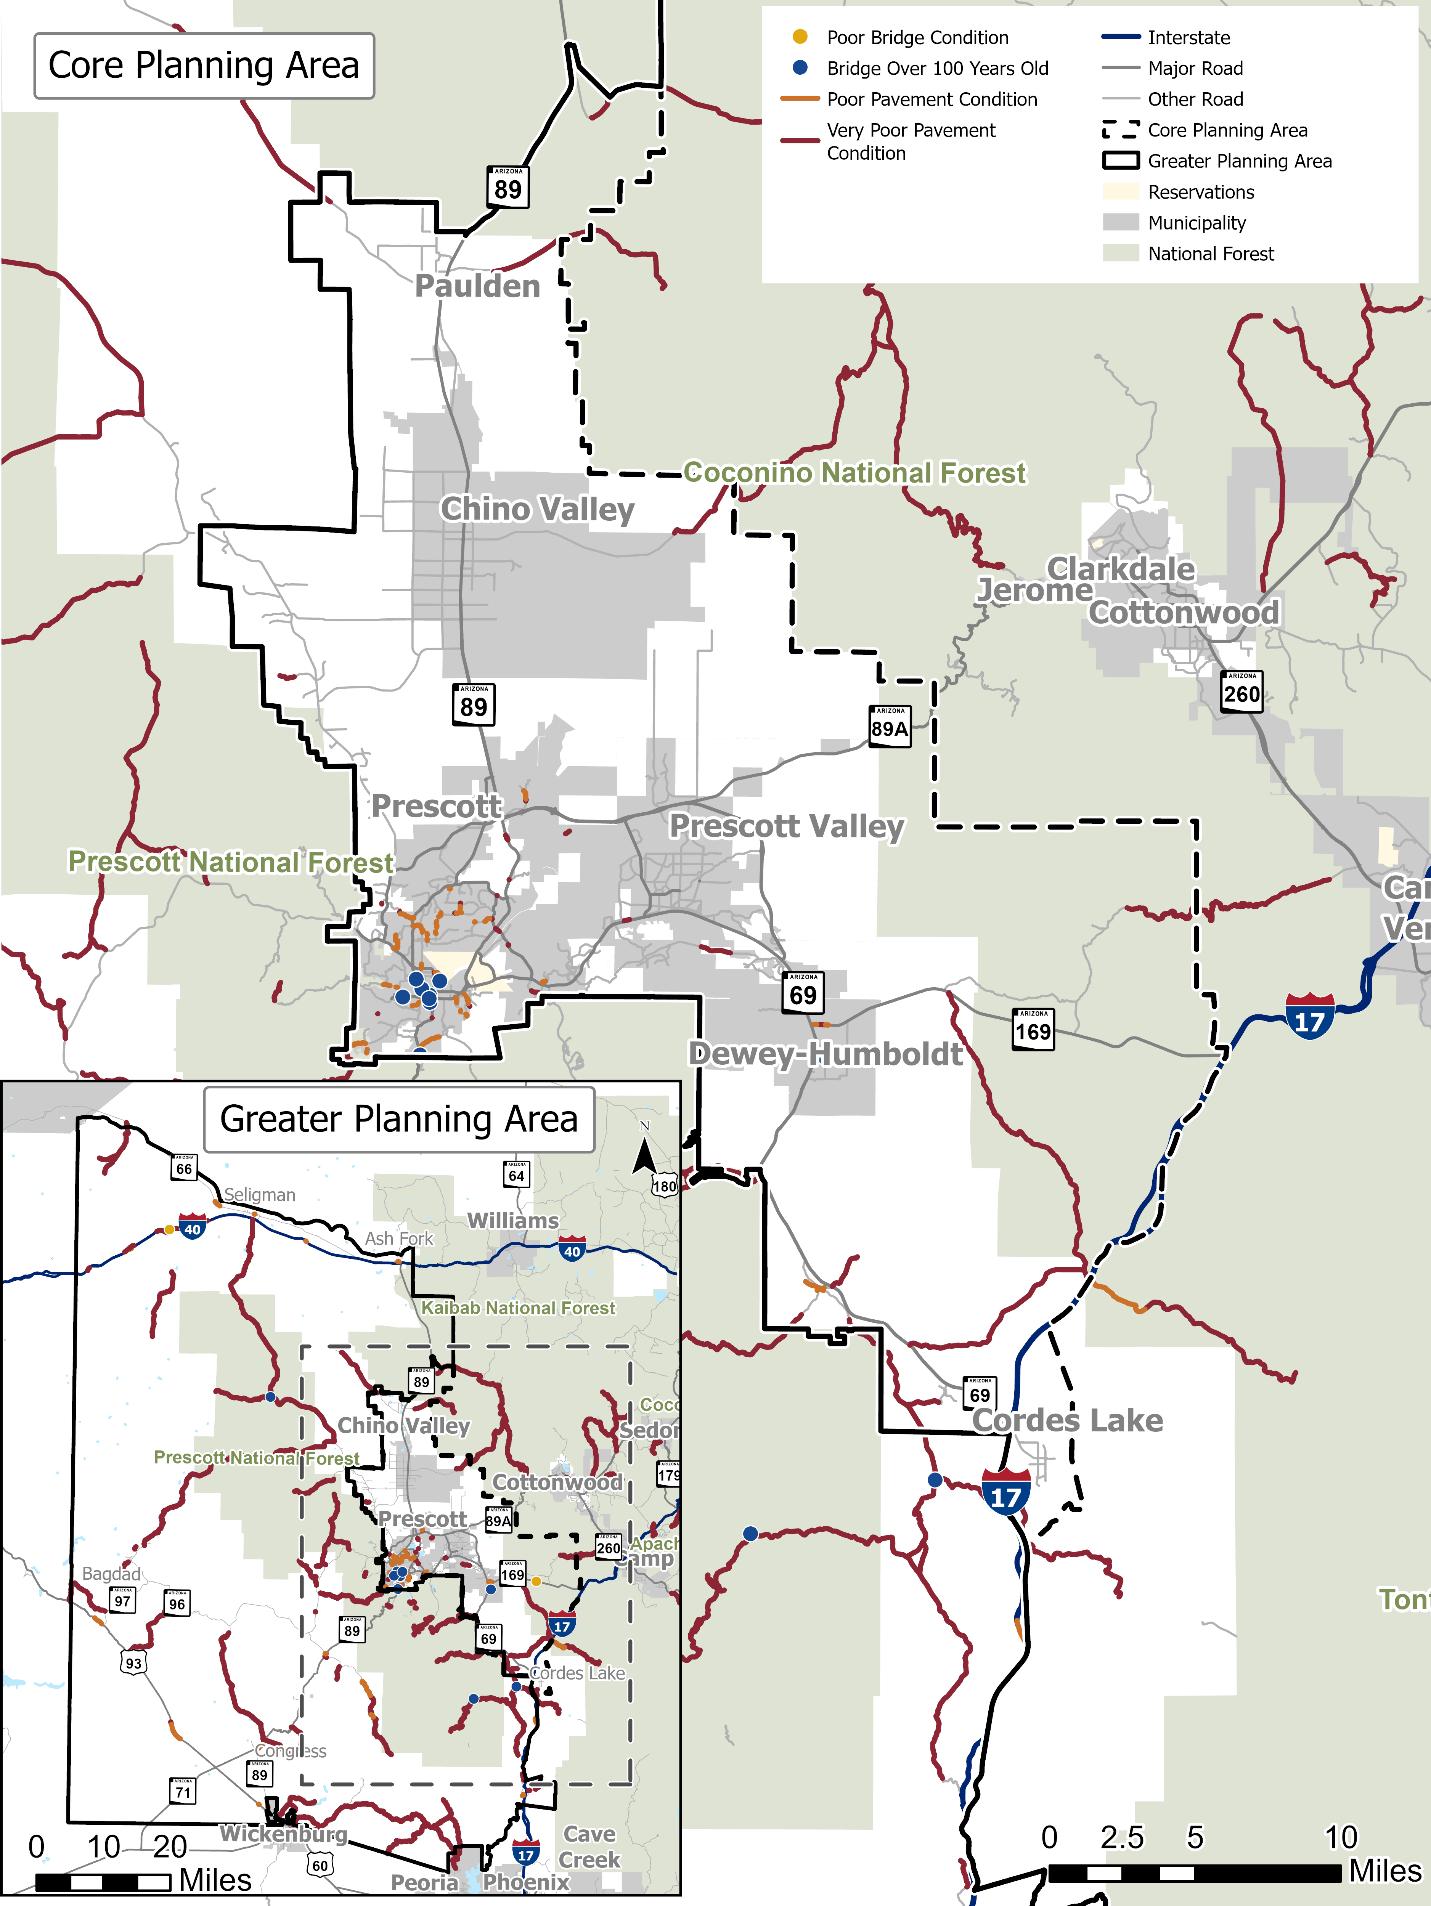
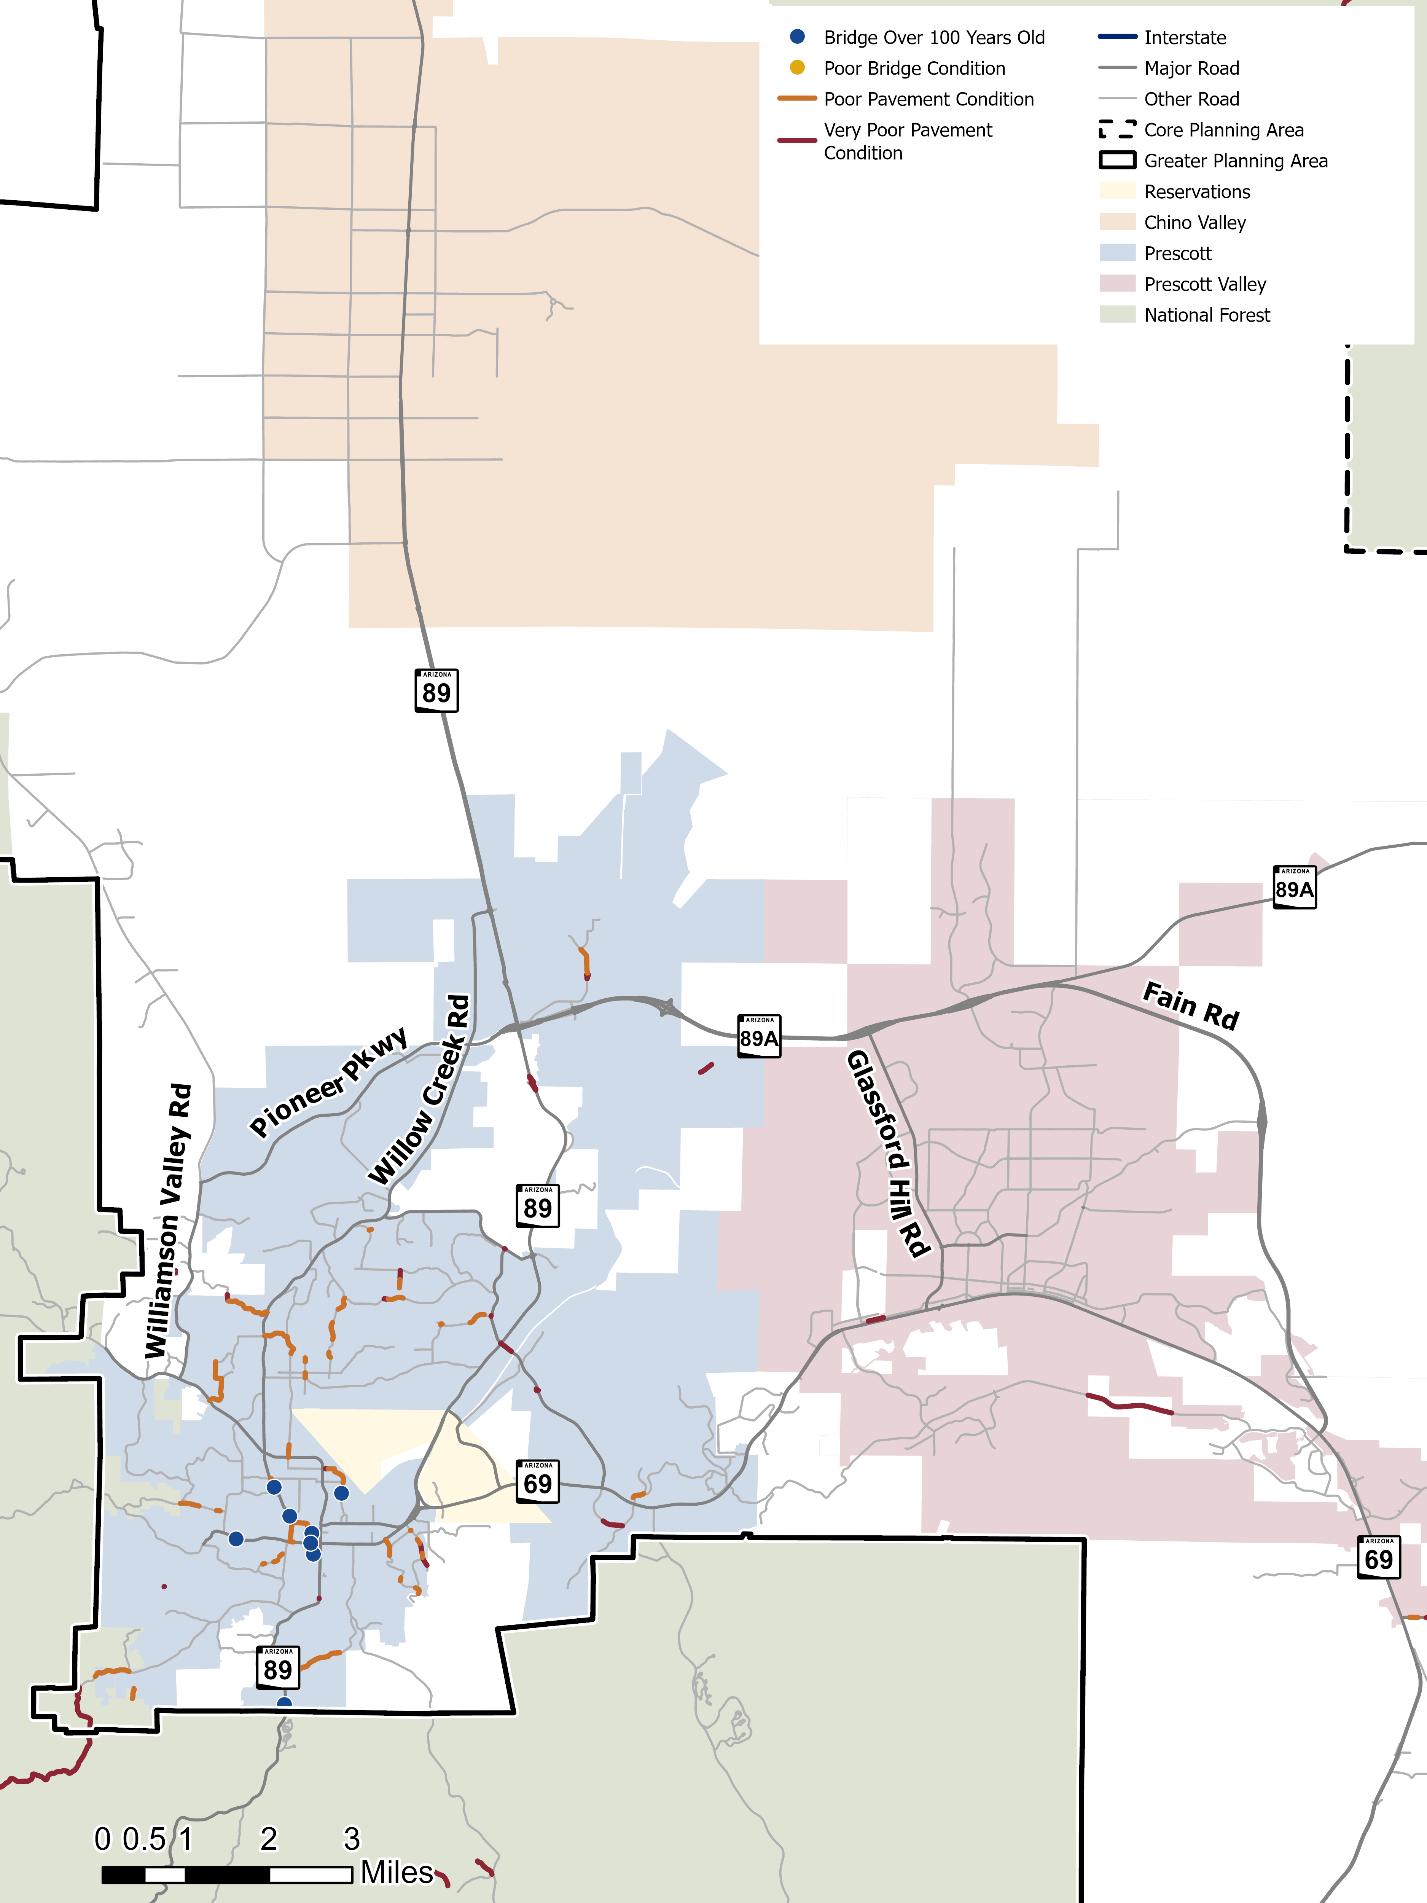
Most roadways have fair or better pavement condition, although roads in the mountainous areas of the CYMPO region were more commonly rated as poor. There are 378 bridges in the CYMPO region. Four bridges are rated as poor. Bridges are not just measured on their structural condition but age as age has an impact on the structural condition of the bridge. Bridges should be replaced every 100 years of operation. Of the regional bridges, 248 exceed 50 years of age and 12 bridges exceed the 100-year replacement marker. Figure 19 shows poor pavement and bridges that should be replaced due to condition or age. Figure 20 shows poor pavement condition and bridges for the denser areas of the CYMPO region.
Pavement Condition by Percentage
Source: Yavapai County, ADOT, City of Prescott
Bridges in poor condition should be urgently rehabilitated or replaced to ensure that they are safe for continued use.
Source: National Bridge Index, FHWA
19.
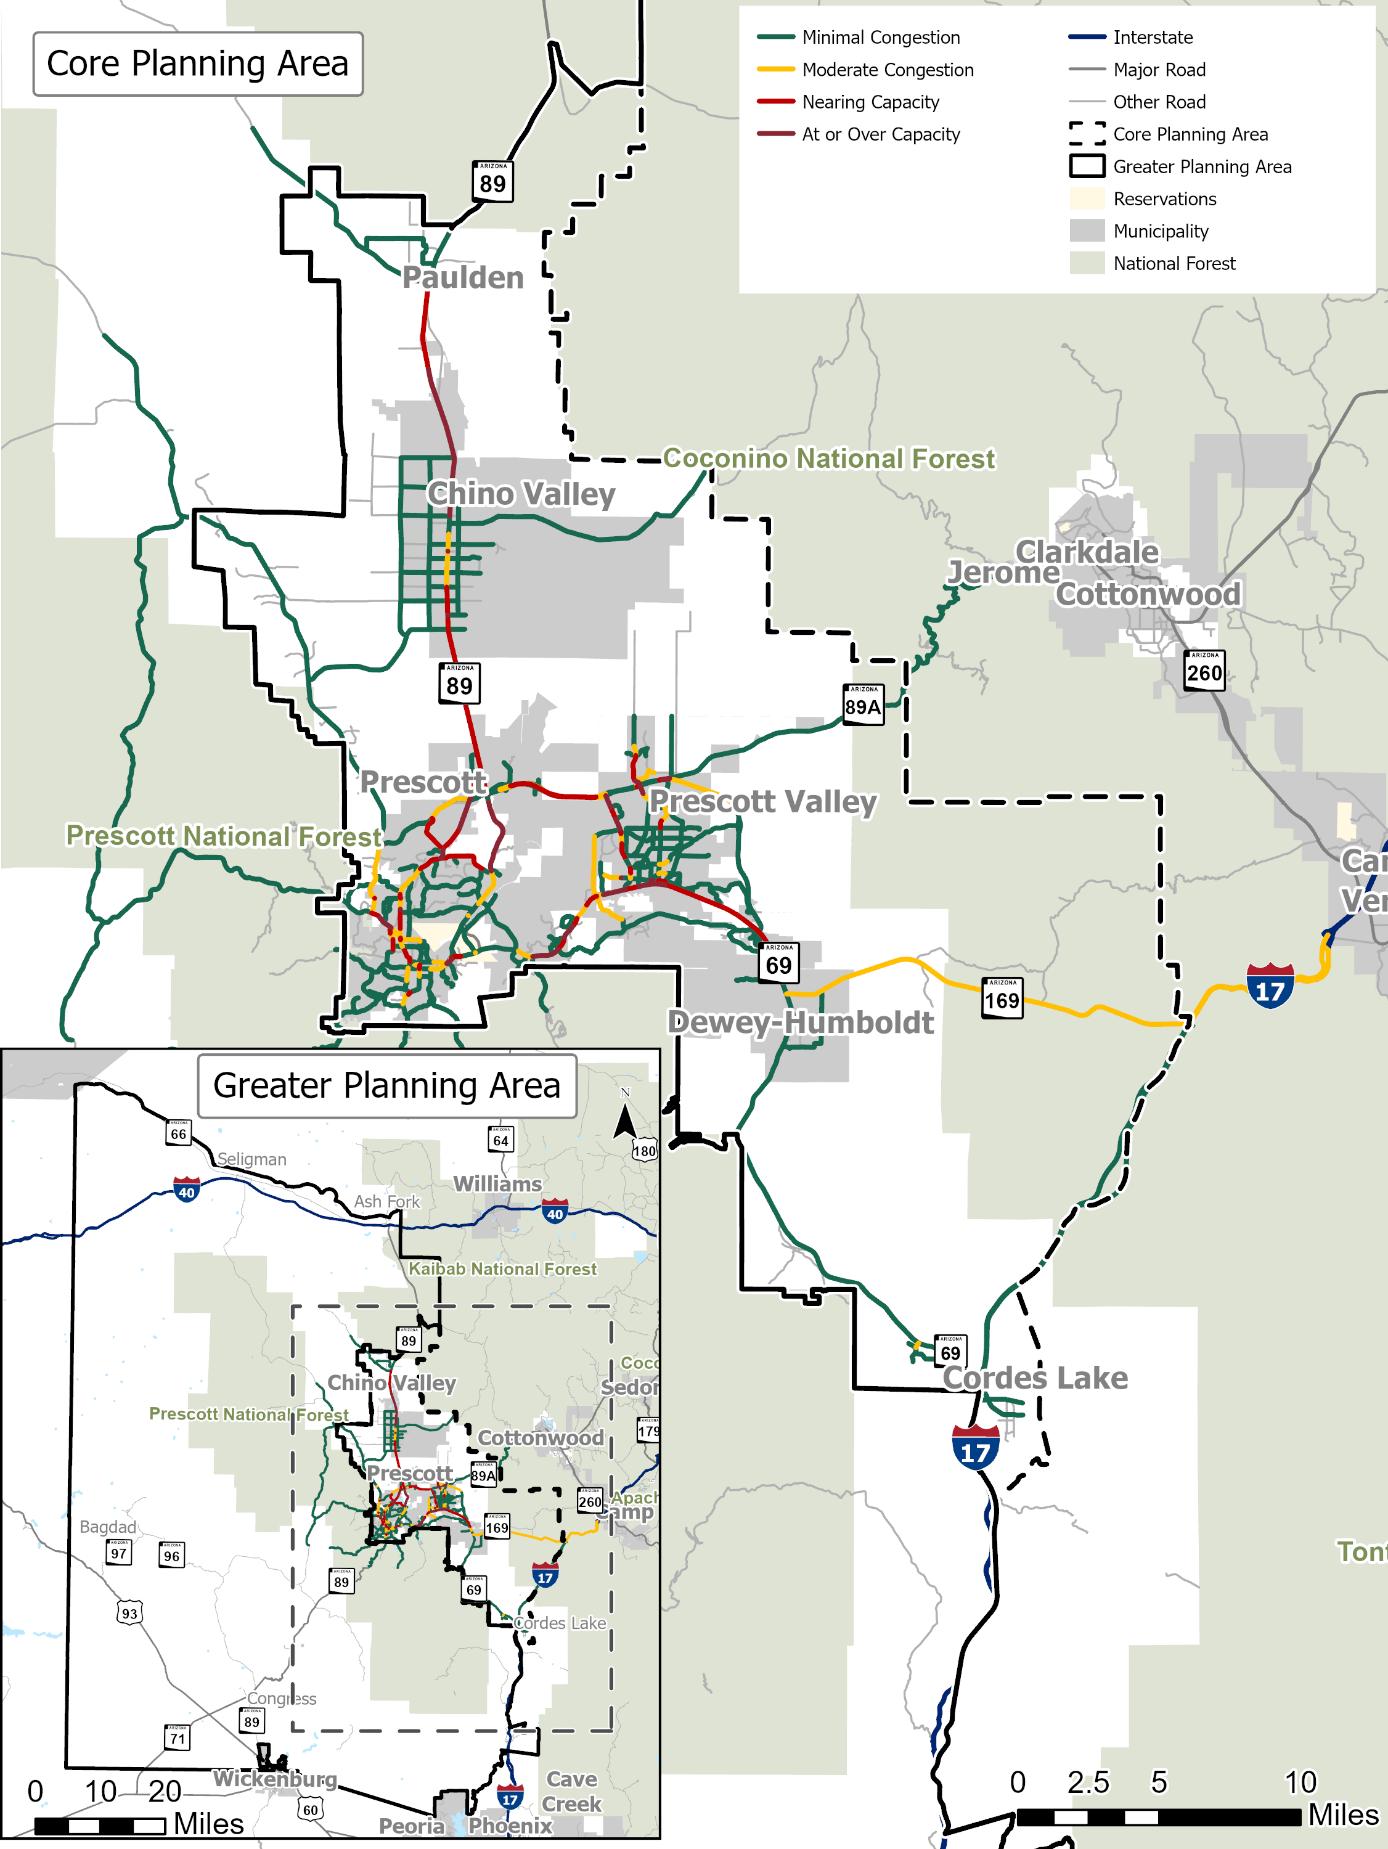
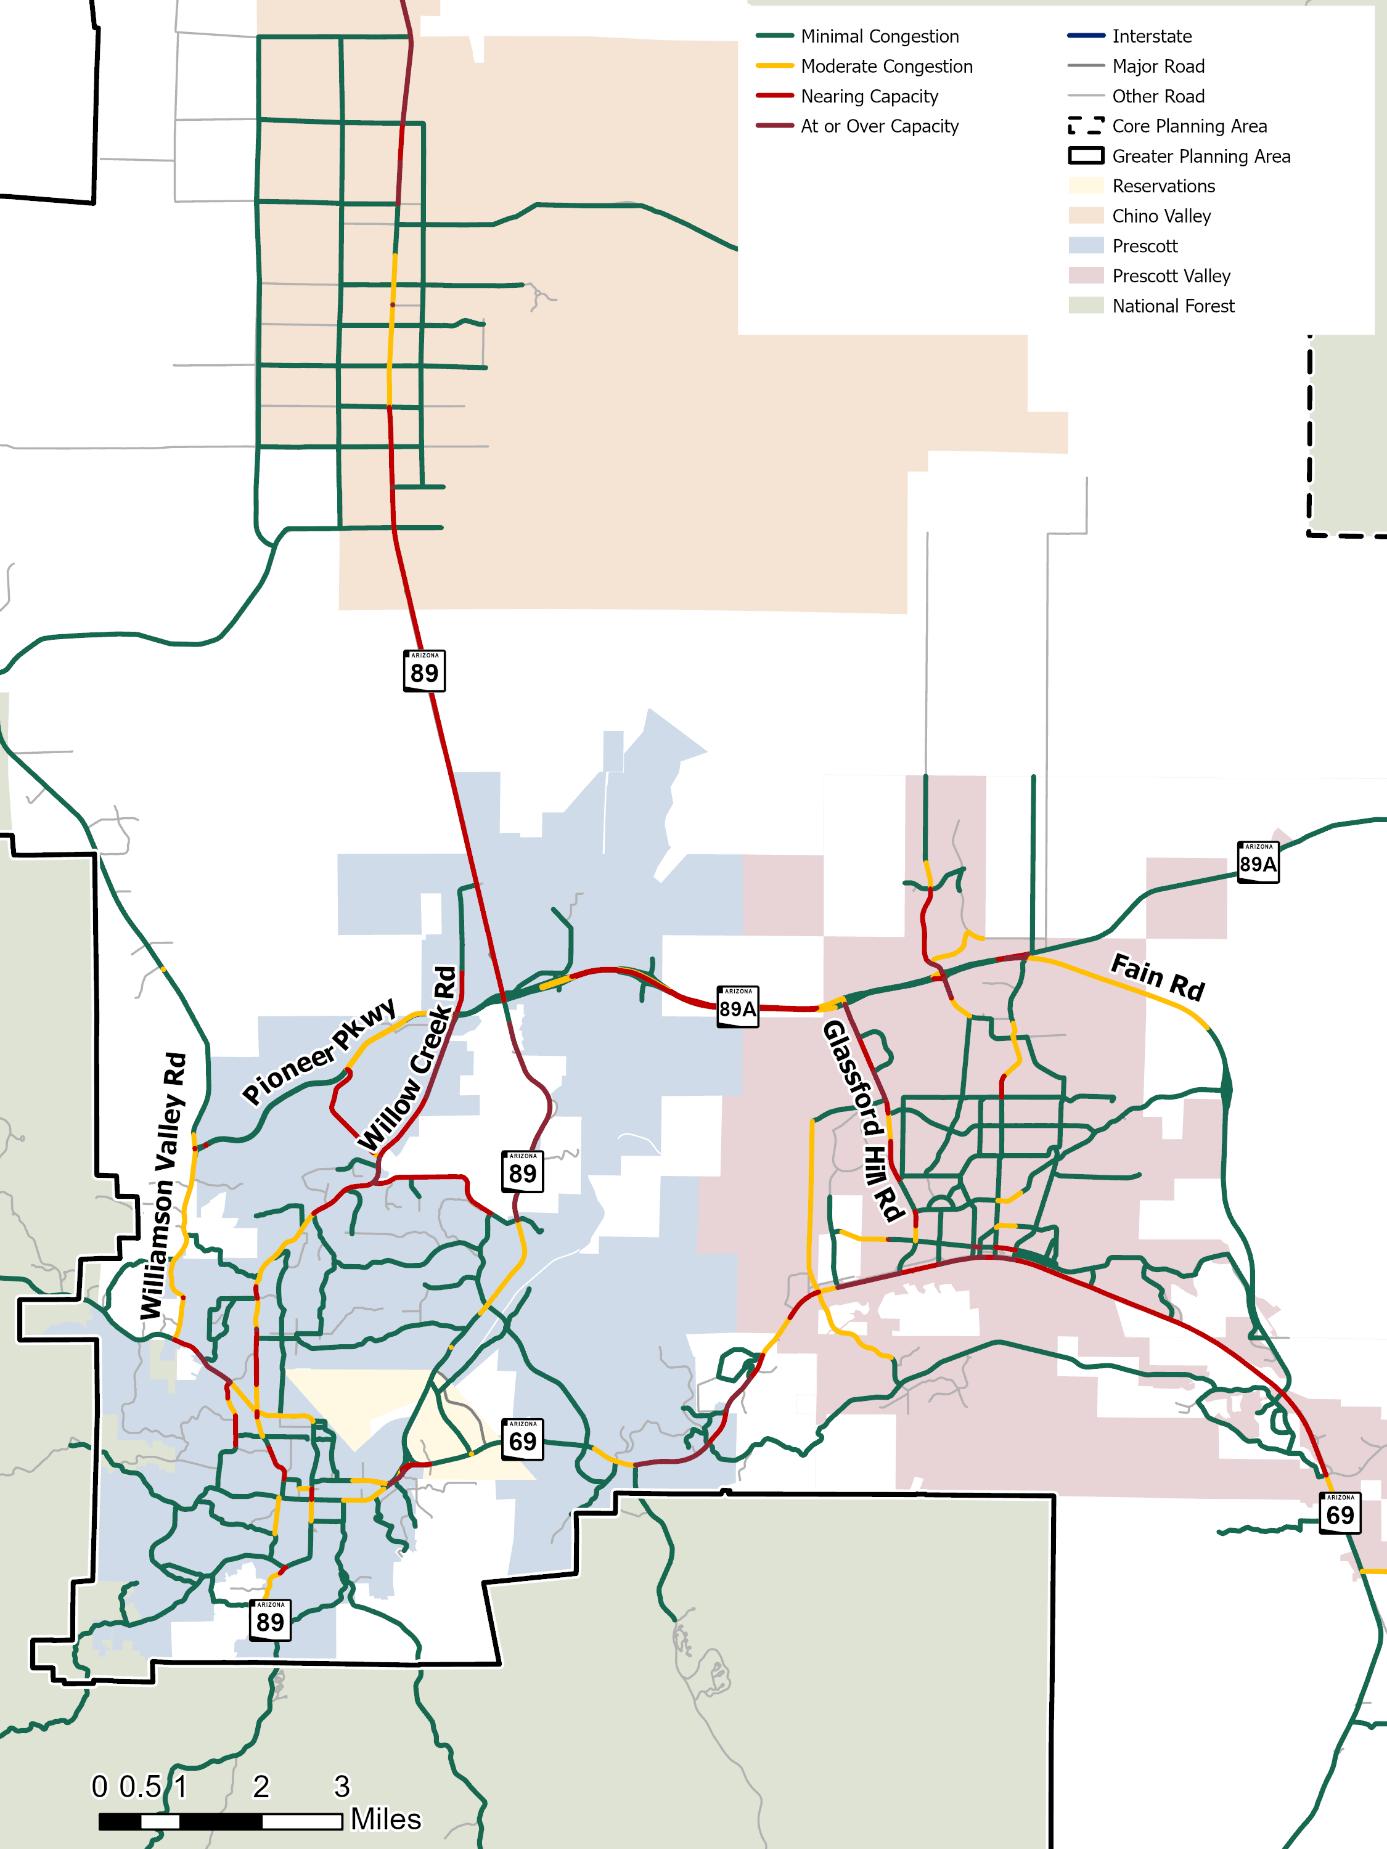
Understanding where this congestion occurs helps inform where additional capacity may be needed to maintain a reliable transportation network. Existing roadway usage was derived from the CYMPO regional TDM. Traffic congestion is based on the daily modeled traffic volumes compared to the daily roadway capacity to create a volume-to-capacity (V/C) ratio.
Minimal Congestion V/C < 0.70 Moderate Congestion: V/C < 0.70 - 0.85 Nearing Capacity: V/C > 0.85 - 1
The model calibration was based on the available 2023 data with all demographic and socioeconomic input updated to reflect the 2023 conditions. The TDM shows overall roadway capacity deficiencies but does not identify minor operational sources of congestion such as traffic signal phasing. Base year traffic congestion results are shown in Figure 21 . A zoomed in version for the denser areas of the CYMPO region is shown in Figure 22 From the findings, most roadways operate within their capacity limits (V/C < 1.00), apart from the following segments:
Source: CYMPO Regional TDM
21. Existing Modeled Traffic Congestion
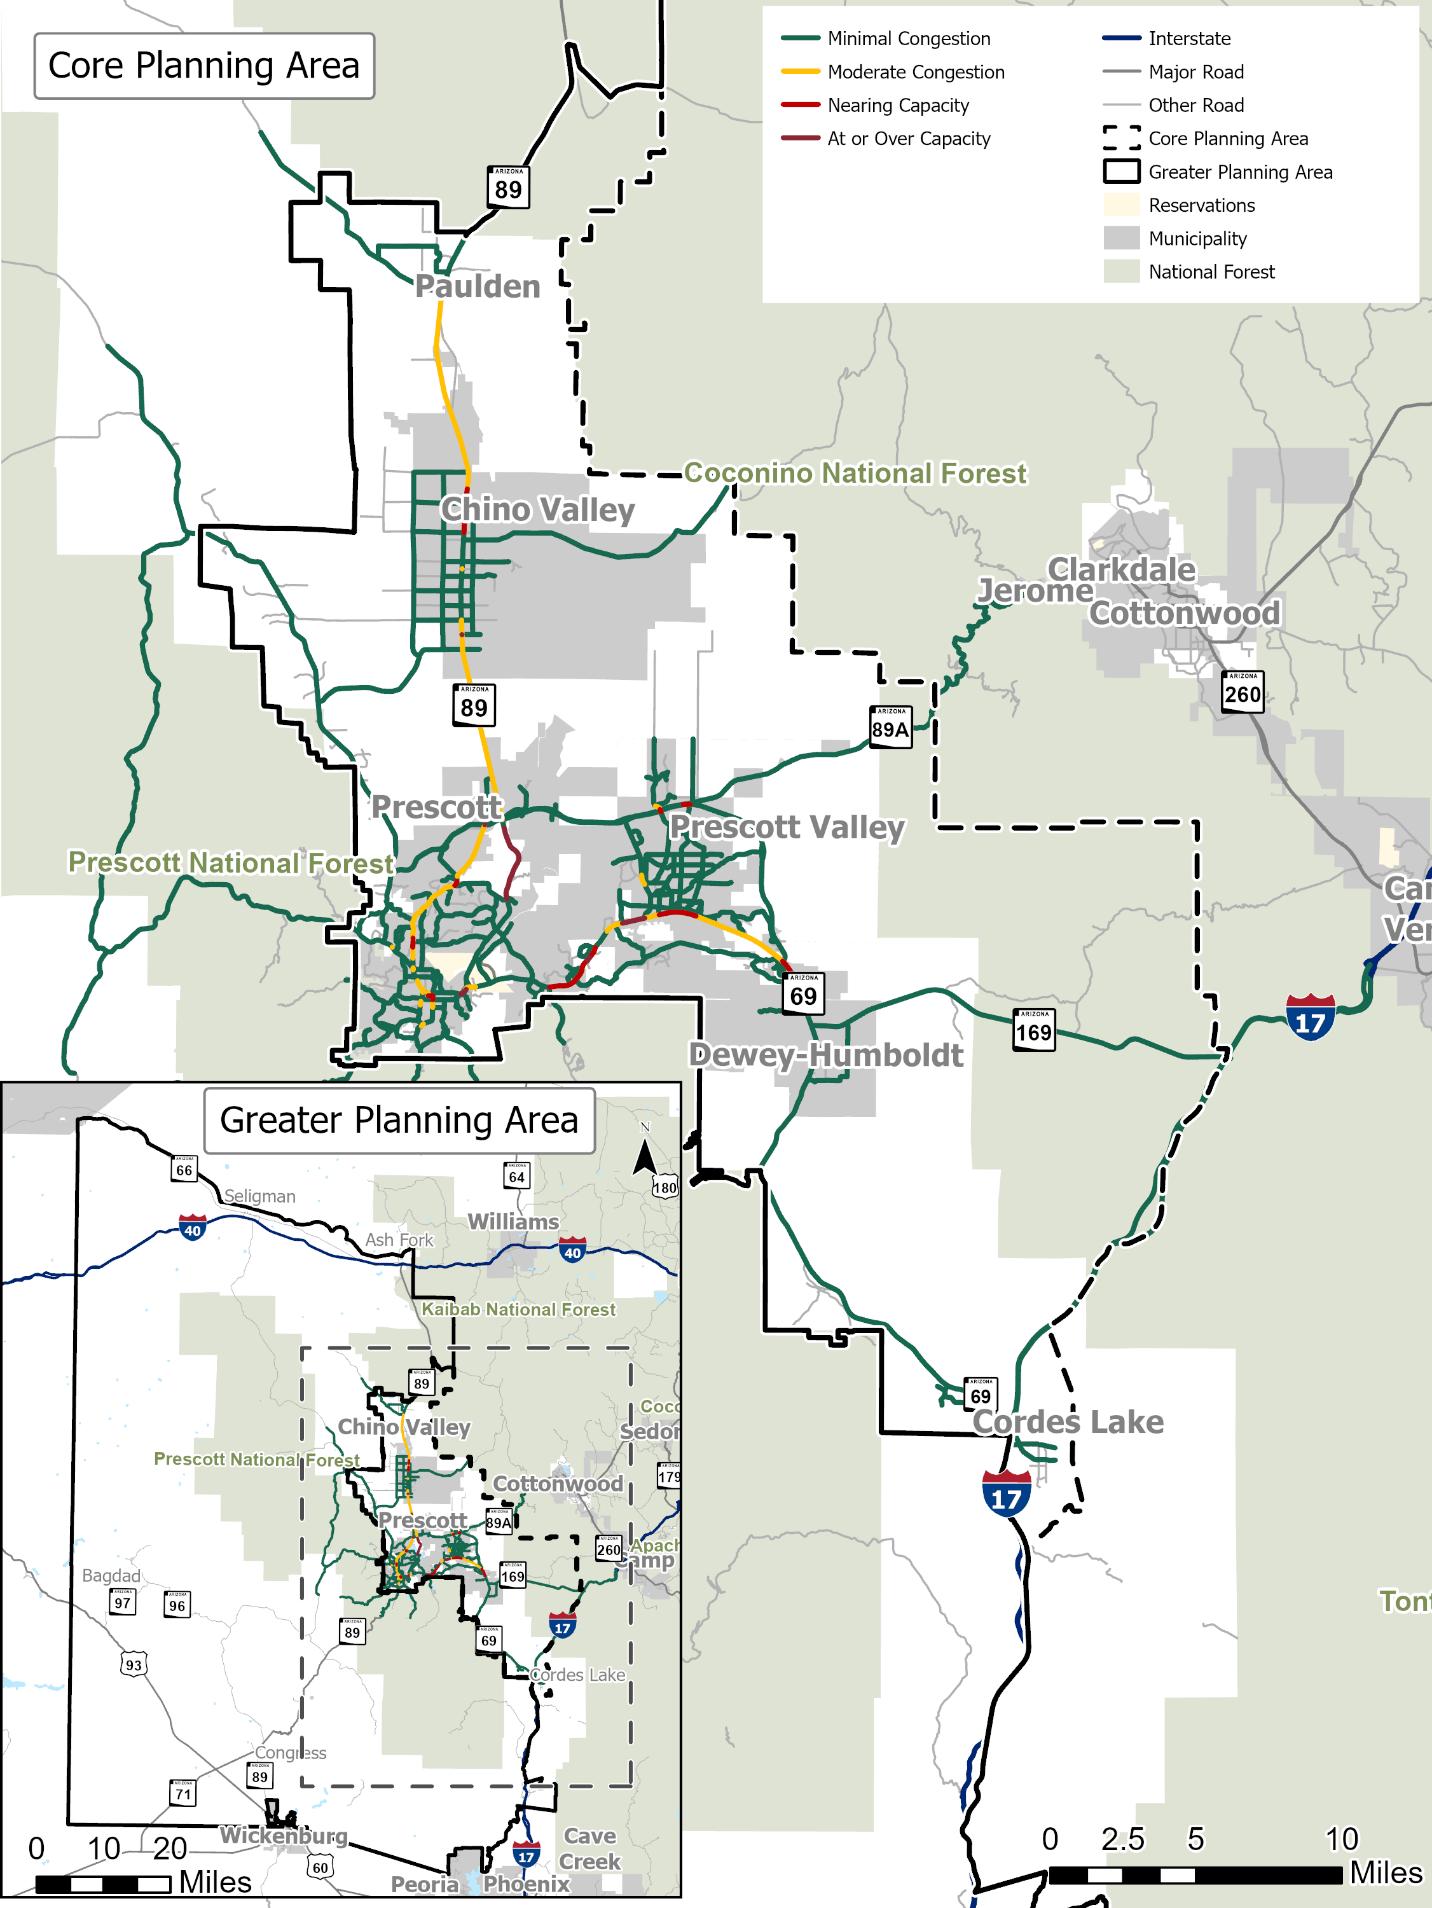
Source: CYMPO Regional TDM
22. Existing Modeled Traffic Congestion Inset
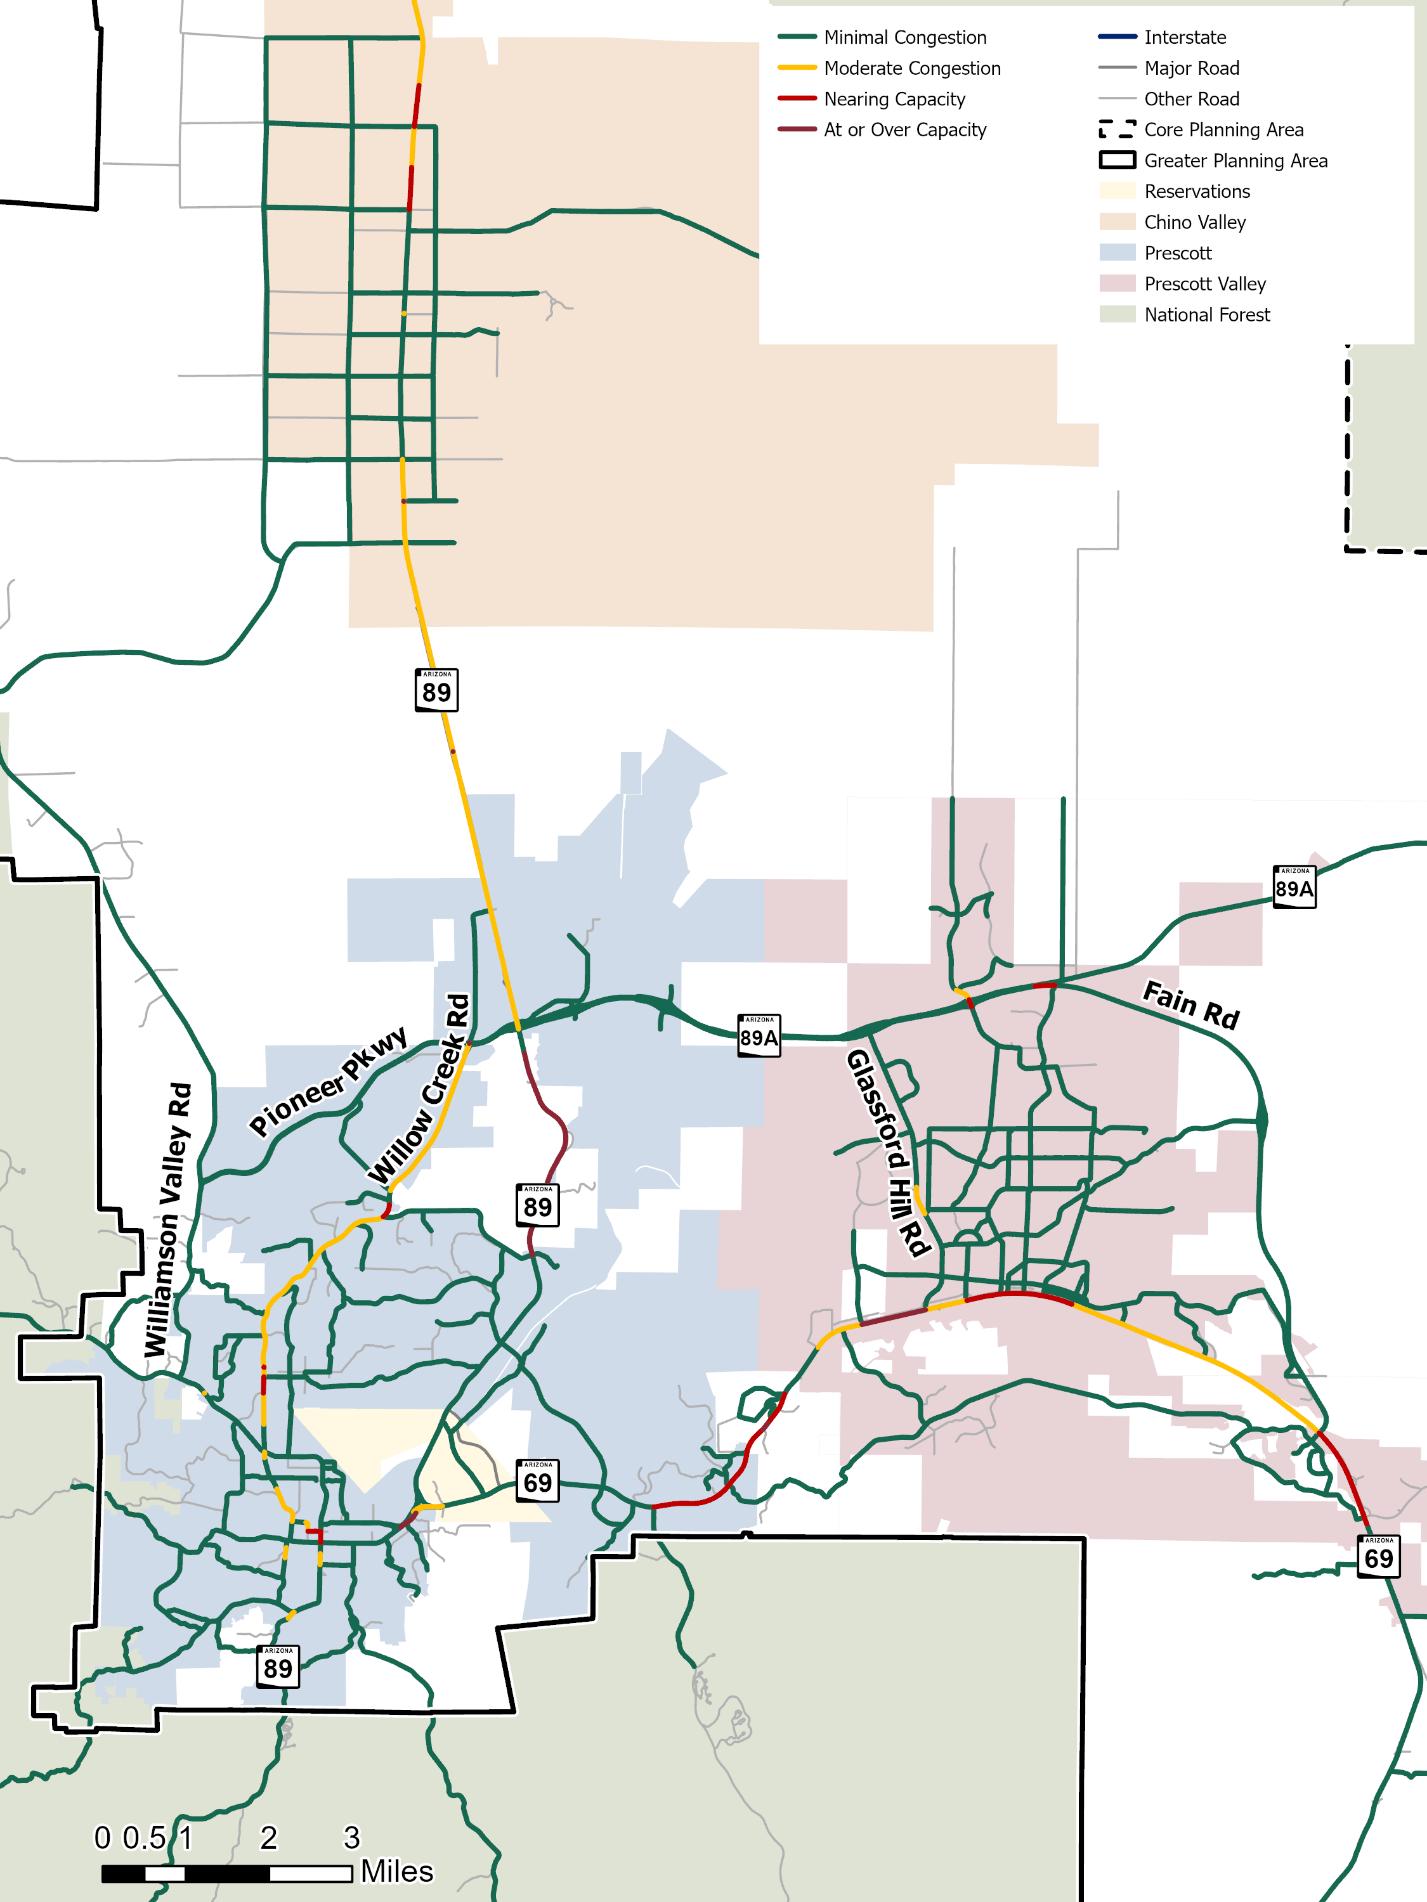
Source: CYMPO Regional TDM
Crash history for the study area was analyzed using ADOT’s Arizona Crash Information System (ACIS) database from 2018 through 2022.
Crashes by Year
Crashes by Injury
The number of crashes in the region is generally consistent year-to-year.
There were 13,189 crashes from 2018 to 2022.
Most crashes are concentrated in Prescott and Prescott Valley. Although, fatal crashes typically occur on major, high-speed roadways between communities and on I-17.
The high-injury network, developed as part of the CYMPO Regional Transportation Safety Plan, identified roadway segments with the highest rate of fatalities and serious injuries. Figure 23 shows the high-injury network. The resulting network encompasses many of the rural highways in the region.
Source: ADOT ACIS (2018-2022)
Crashes by Collision Manner
Figure 23. High-Injury Network
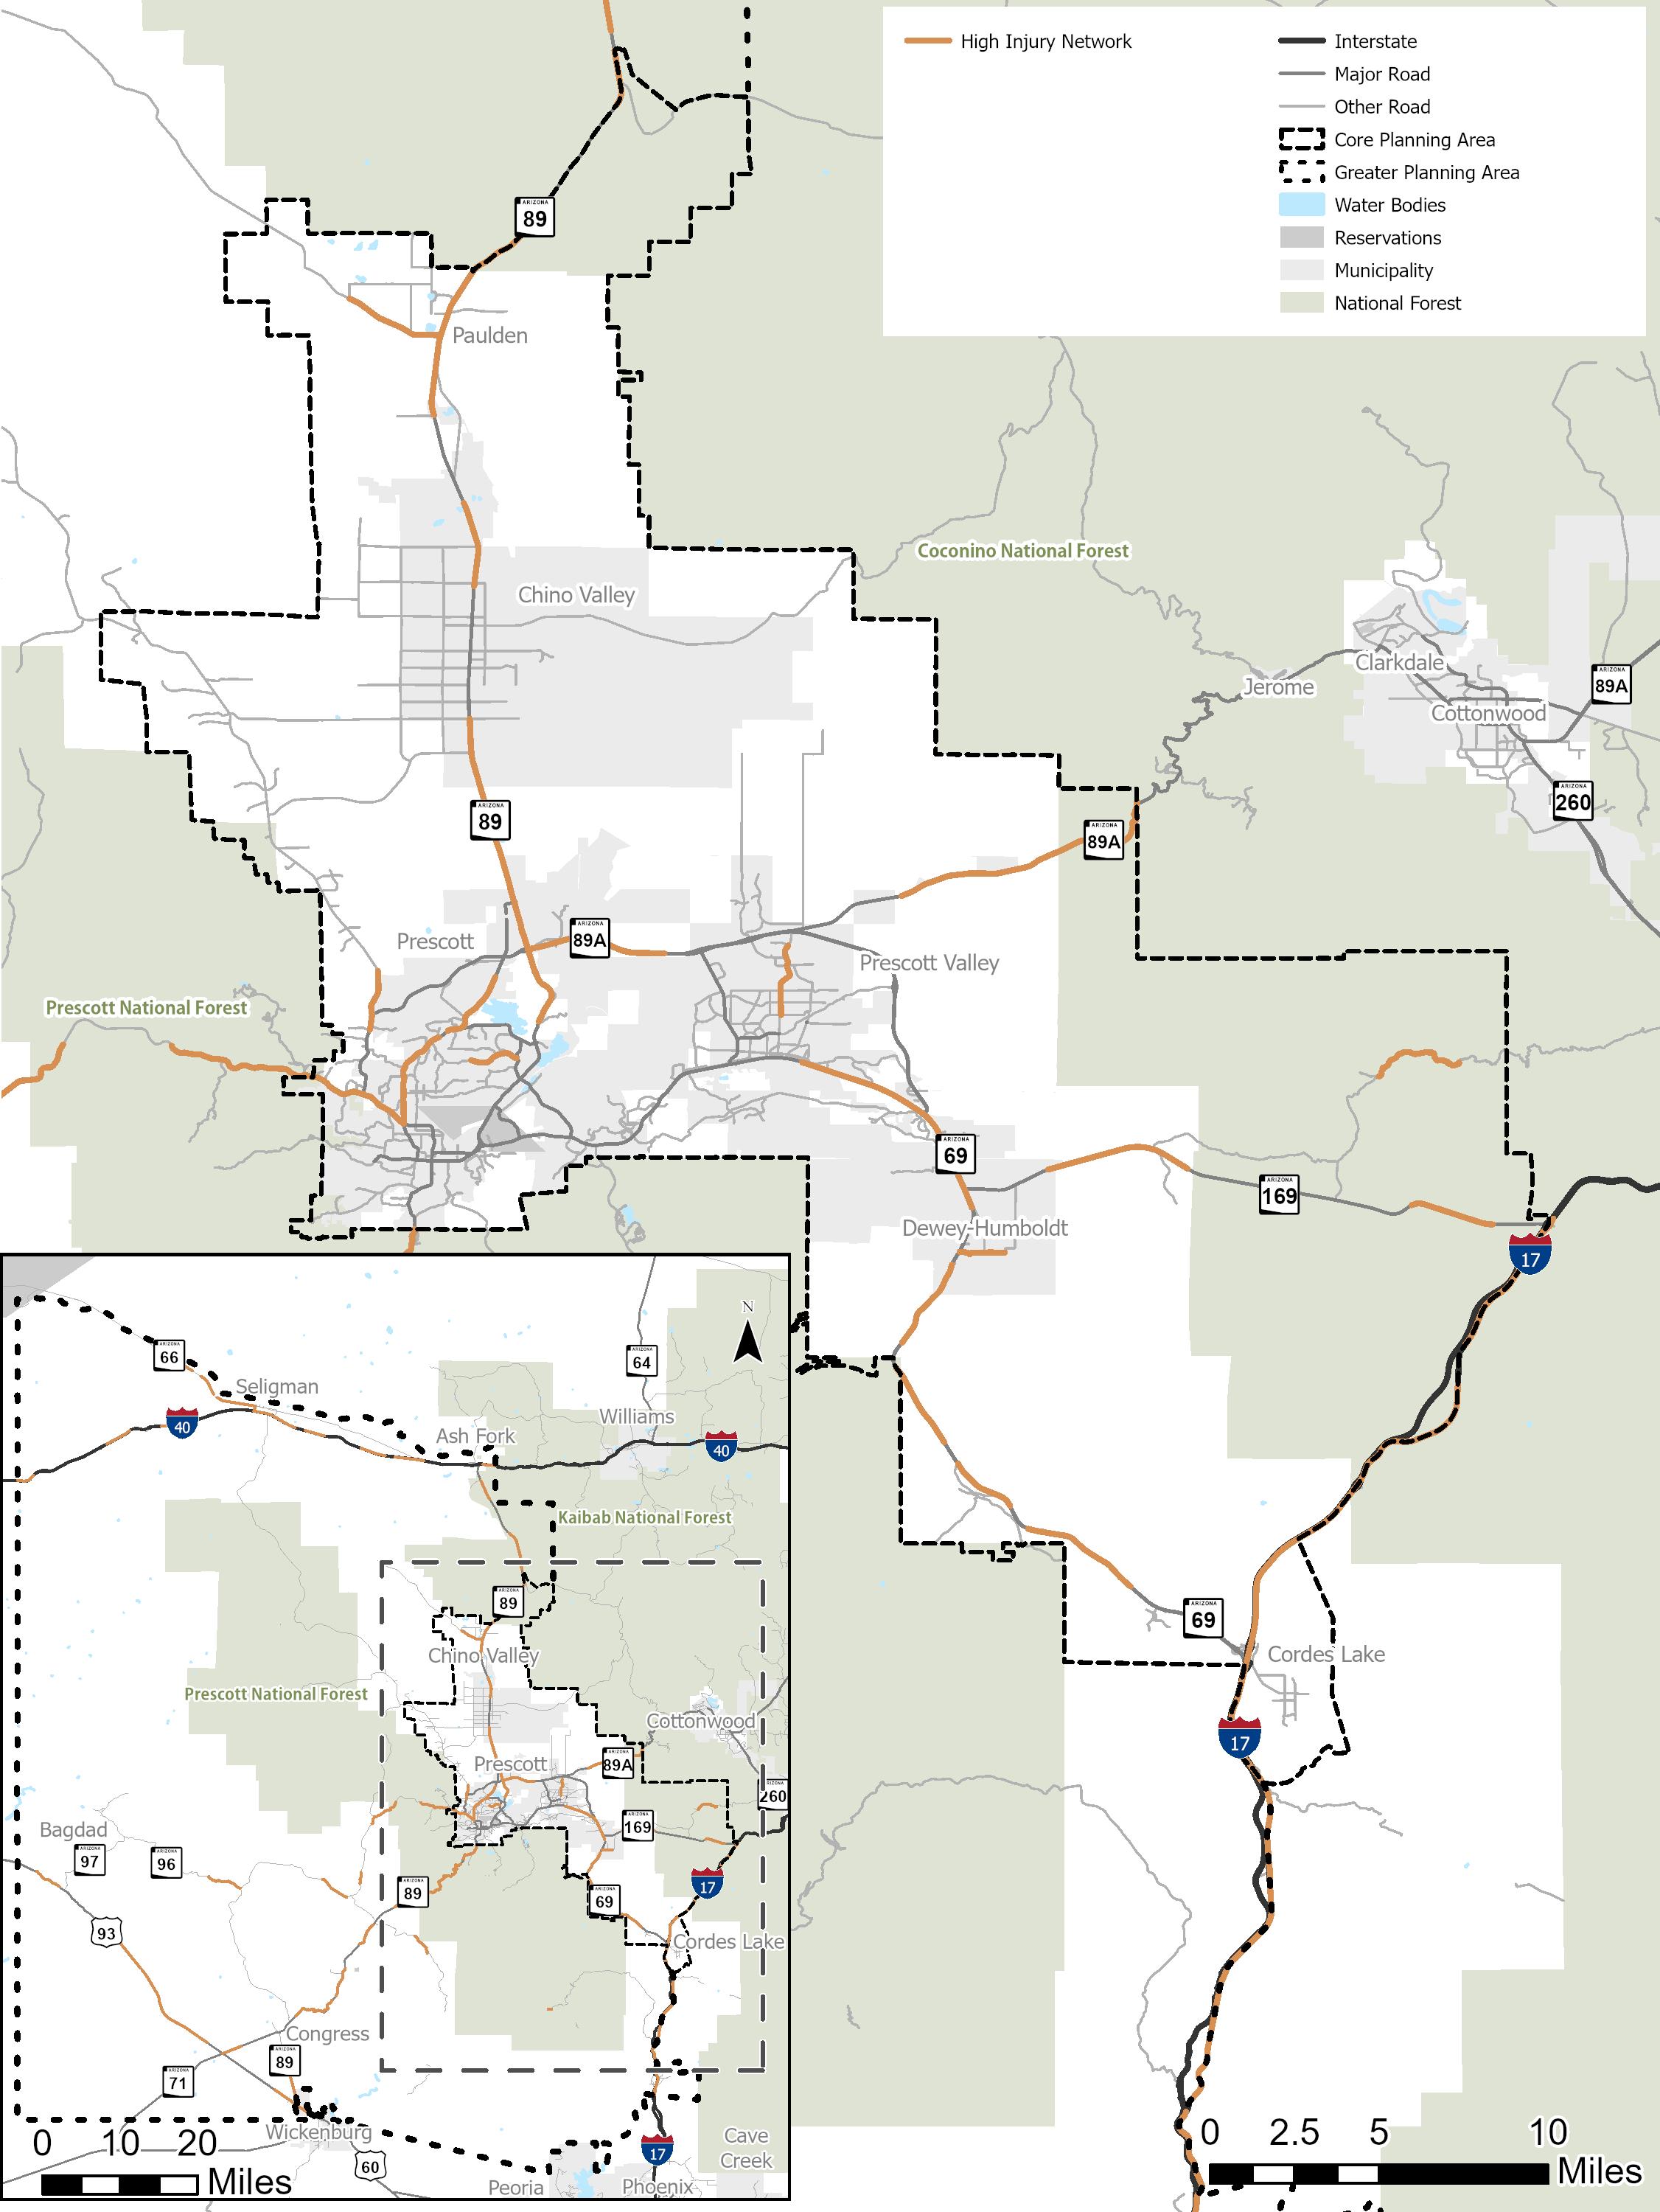
Source: Northern Arizona Regional Transportation Safety Plan
The Move 2050 Plan builds upon previous planning efforts done by CYMPO and its member agencies. Previously recommended and programmed roadway improvement projects were summarized to understand previously identified needs of the roadway network. The following plans and programs recommended roadway improvements:


Technology improvements
Figure 24 shows the previously recommended roadway projects in the CYMPO region.
24. Previously Recommended Roadway Projects
Understanding how future demographic changes in the region will impact the region’s roadway network can help inform potential transportation investments. Based on projected demographics for the region and future planned developments, a long-term baseline scenario was developed to understand anticipated travel conditions in 2050. The 2050 baseline scenario assumes that projects that have programmed construction funding in the region are implemented as planned.
The forecasted traffic congestion results for the CYMPO region are shown in Figure 25 and a zoomed in version for the denser areas of the region is shown in Figure 26 Table 1 identifies roadway segments in the region that are anticipated to exceed their capacity.
25.
Source: CYMPO Regional TDM
Source: CYMPO Regional TDM
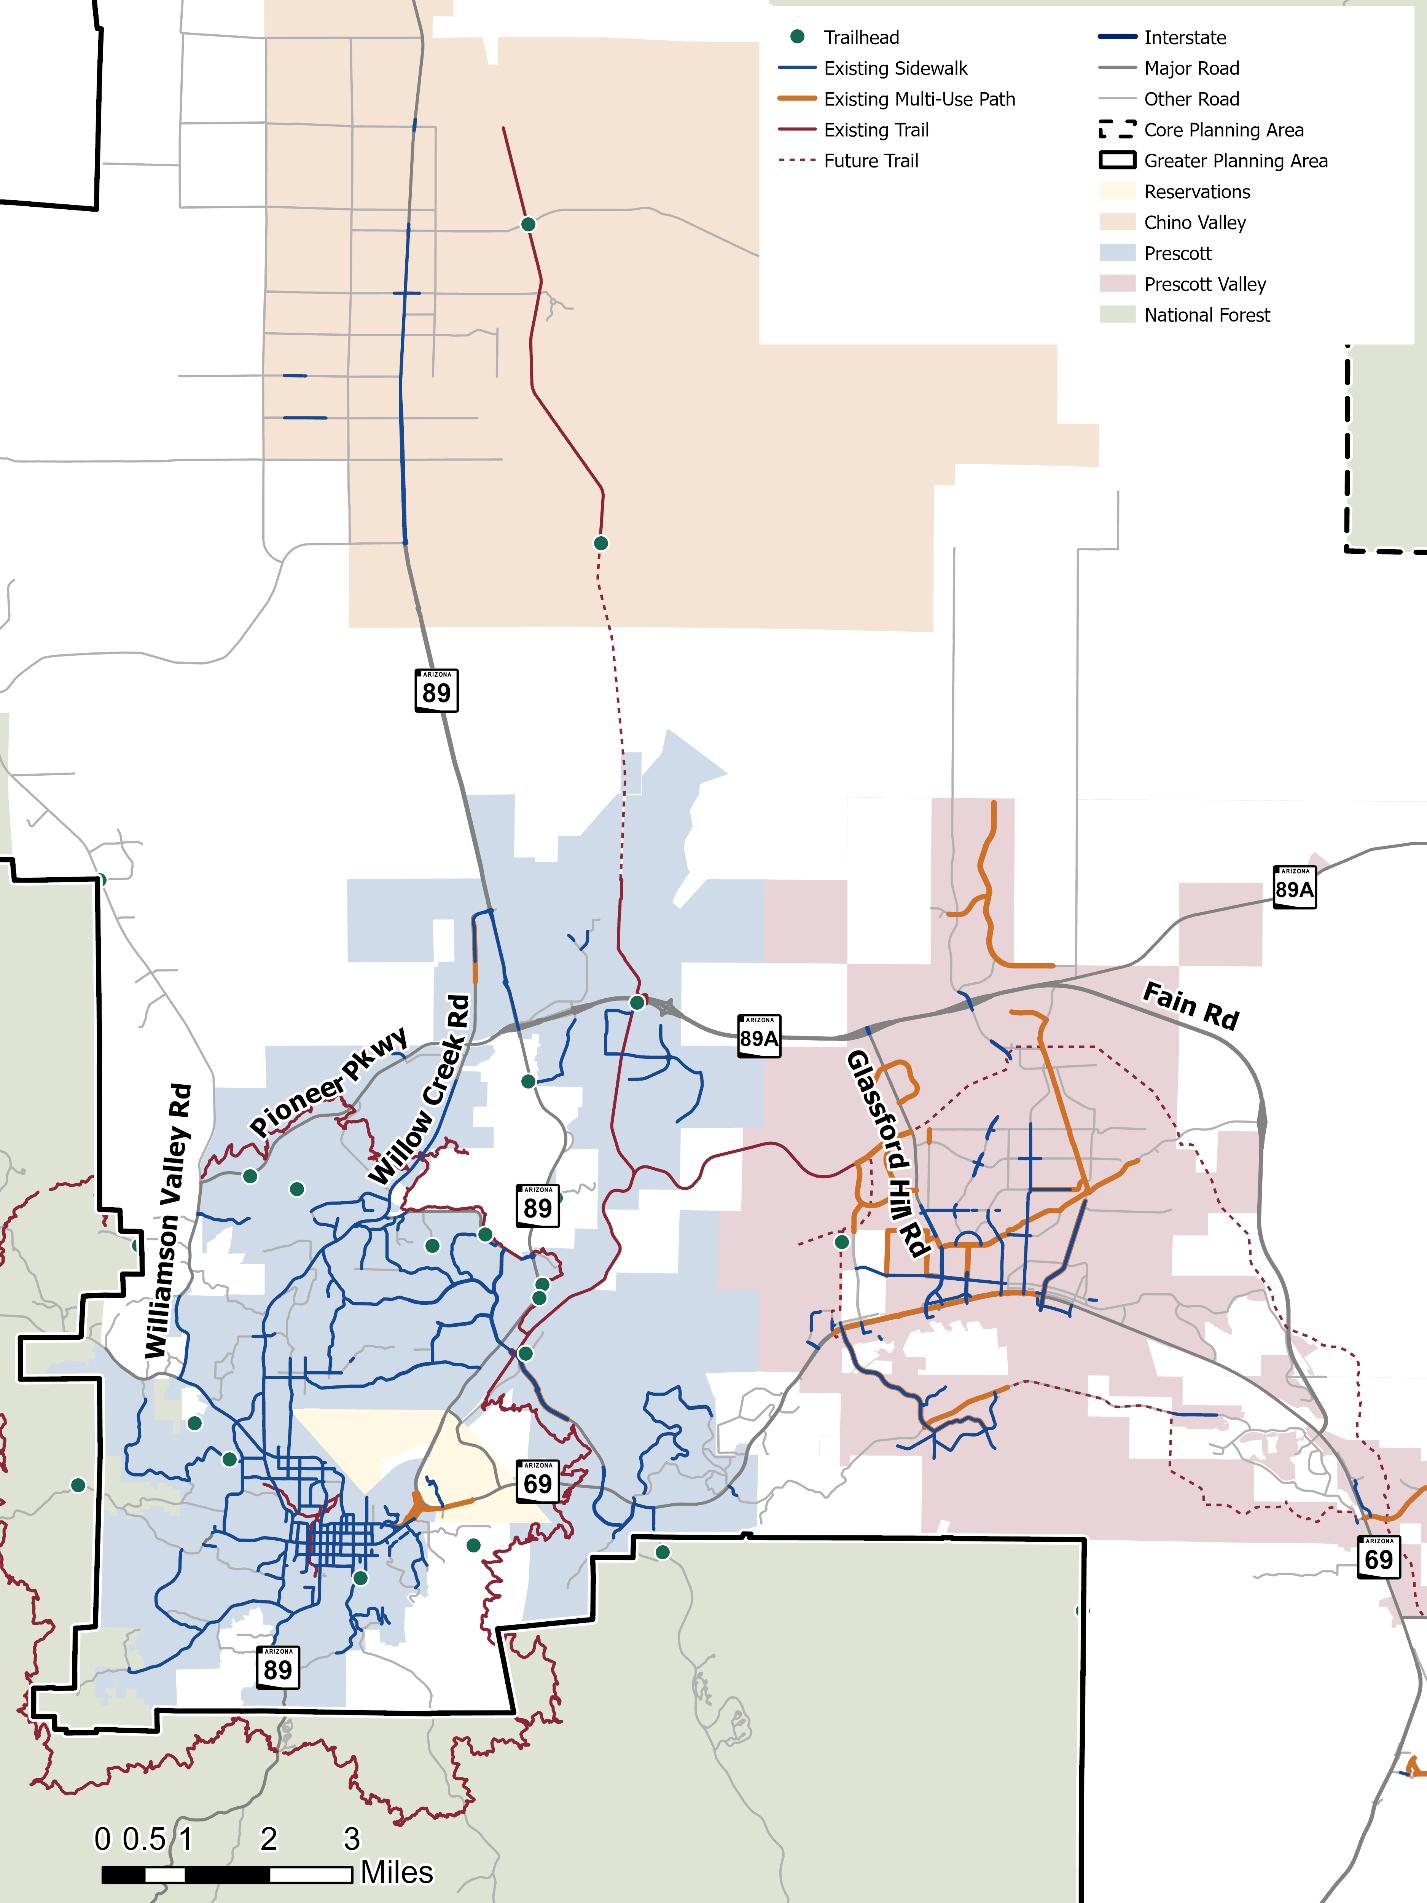
Understanding the current active transportation system in the region provides insight on how pedestrians and bicyclists travel in the CYMPO region. The following section reviews current active transportation facilities, pedestrian and bicycle travel patterns, and previous active transportation recommendations.
Active transportation is an important component of mobility in the CYMPO region. Investments in walking and bicycling infrastructure not only results in a more balanced and accessible transportation network, but also support the region’s economy, health, and quality of life. Active transportation trips in the region account for 3.6% of all trips.
The region’s active transportation network comprises of:
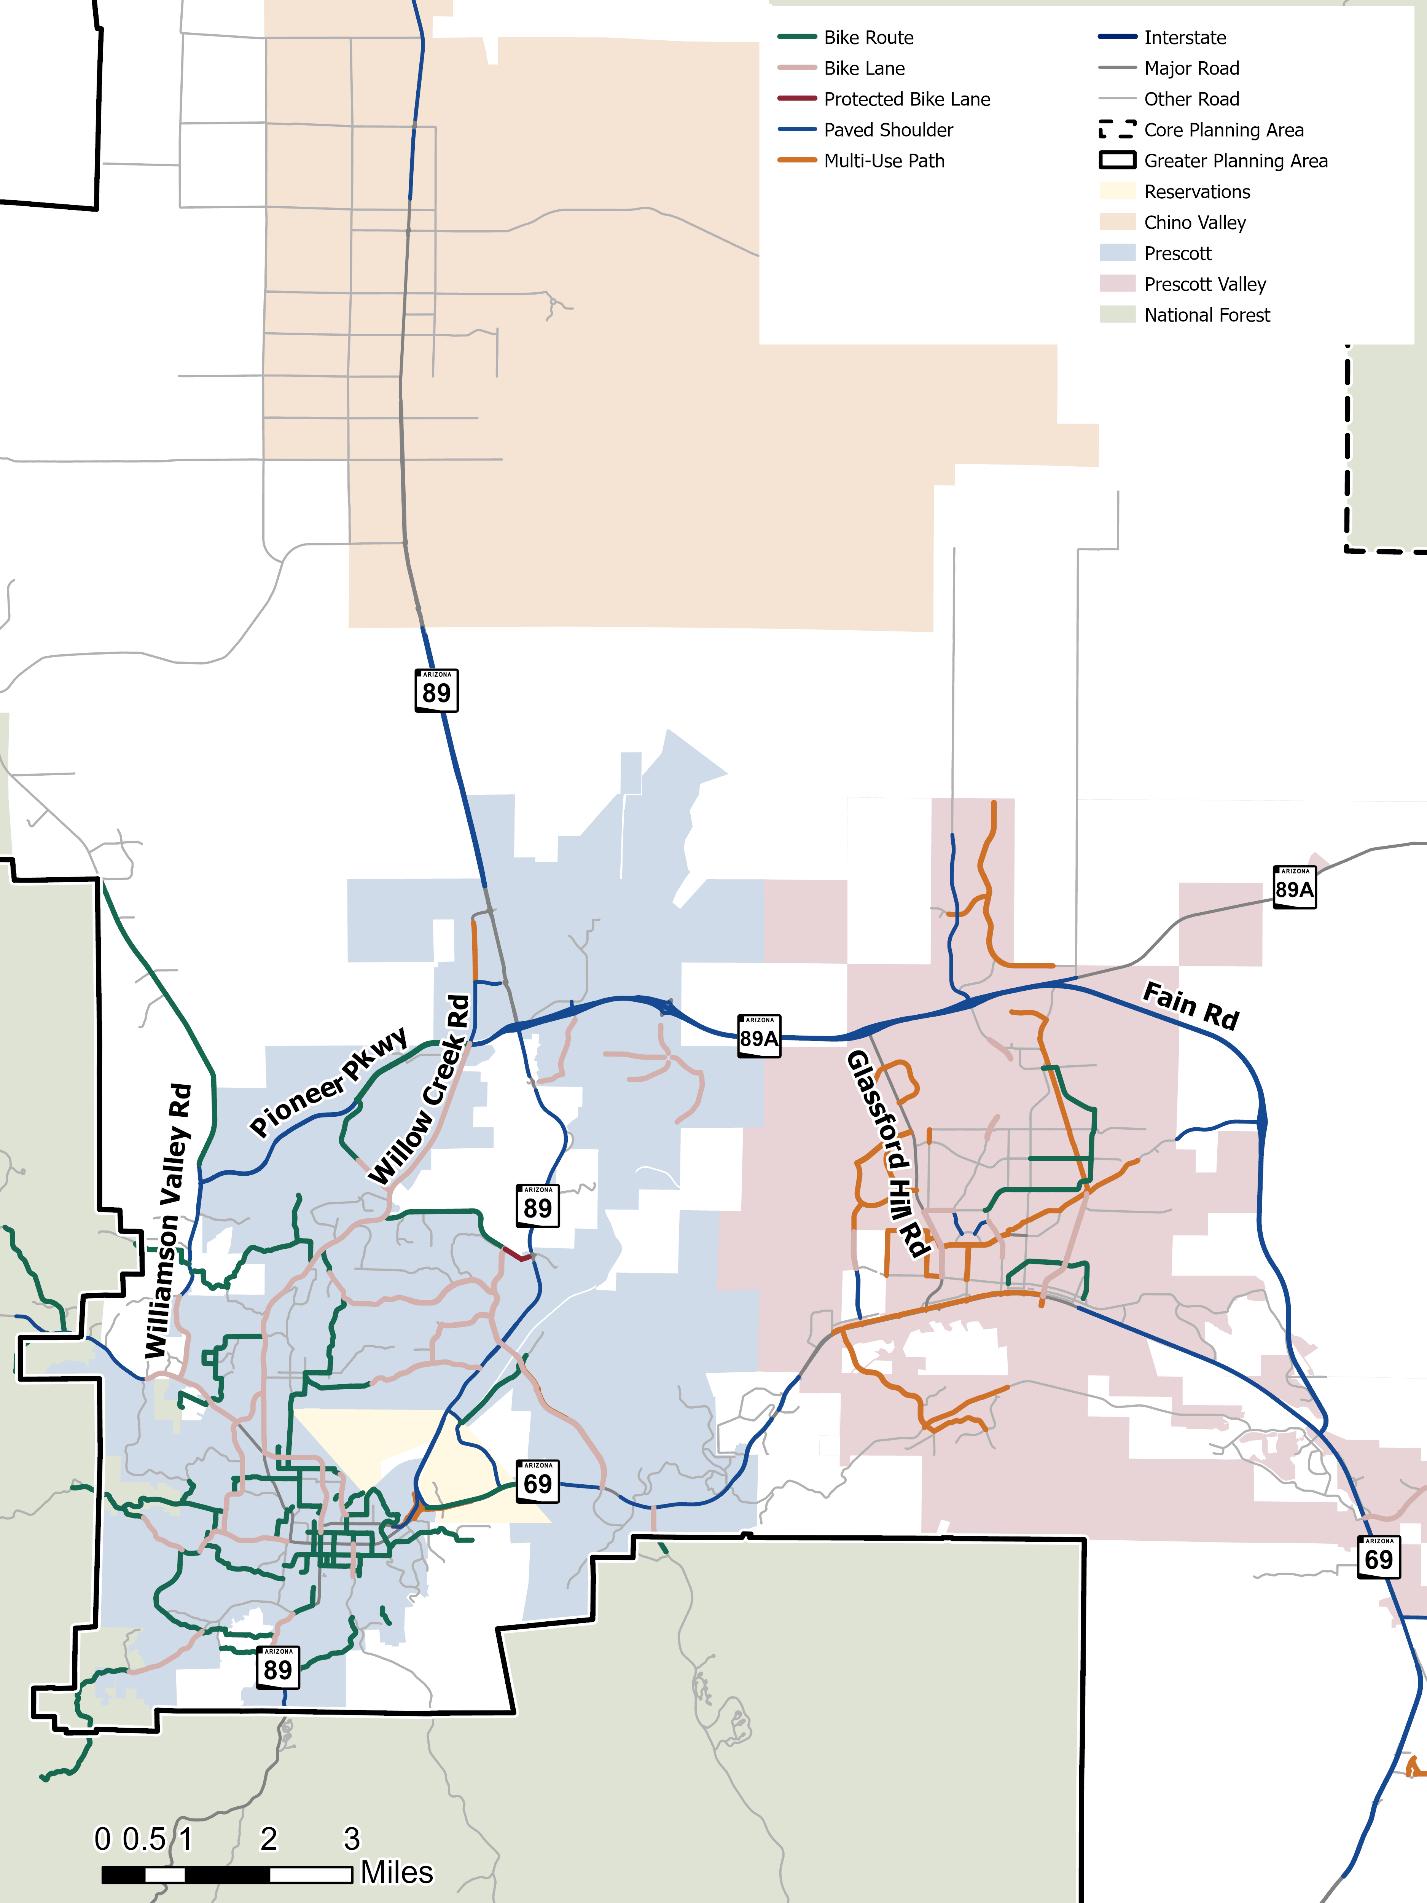
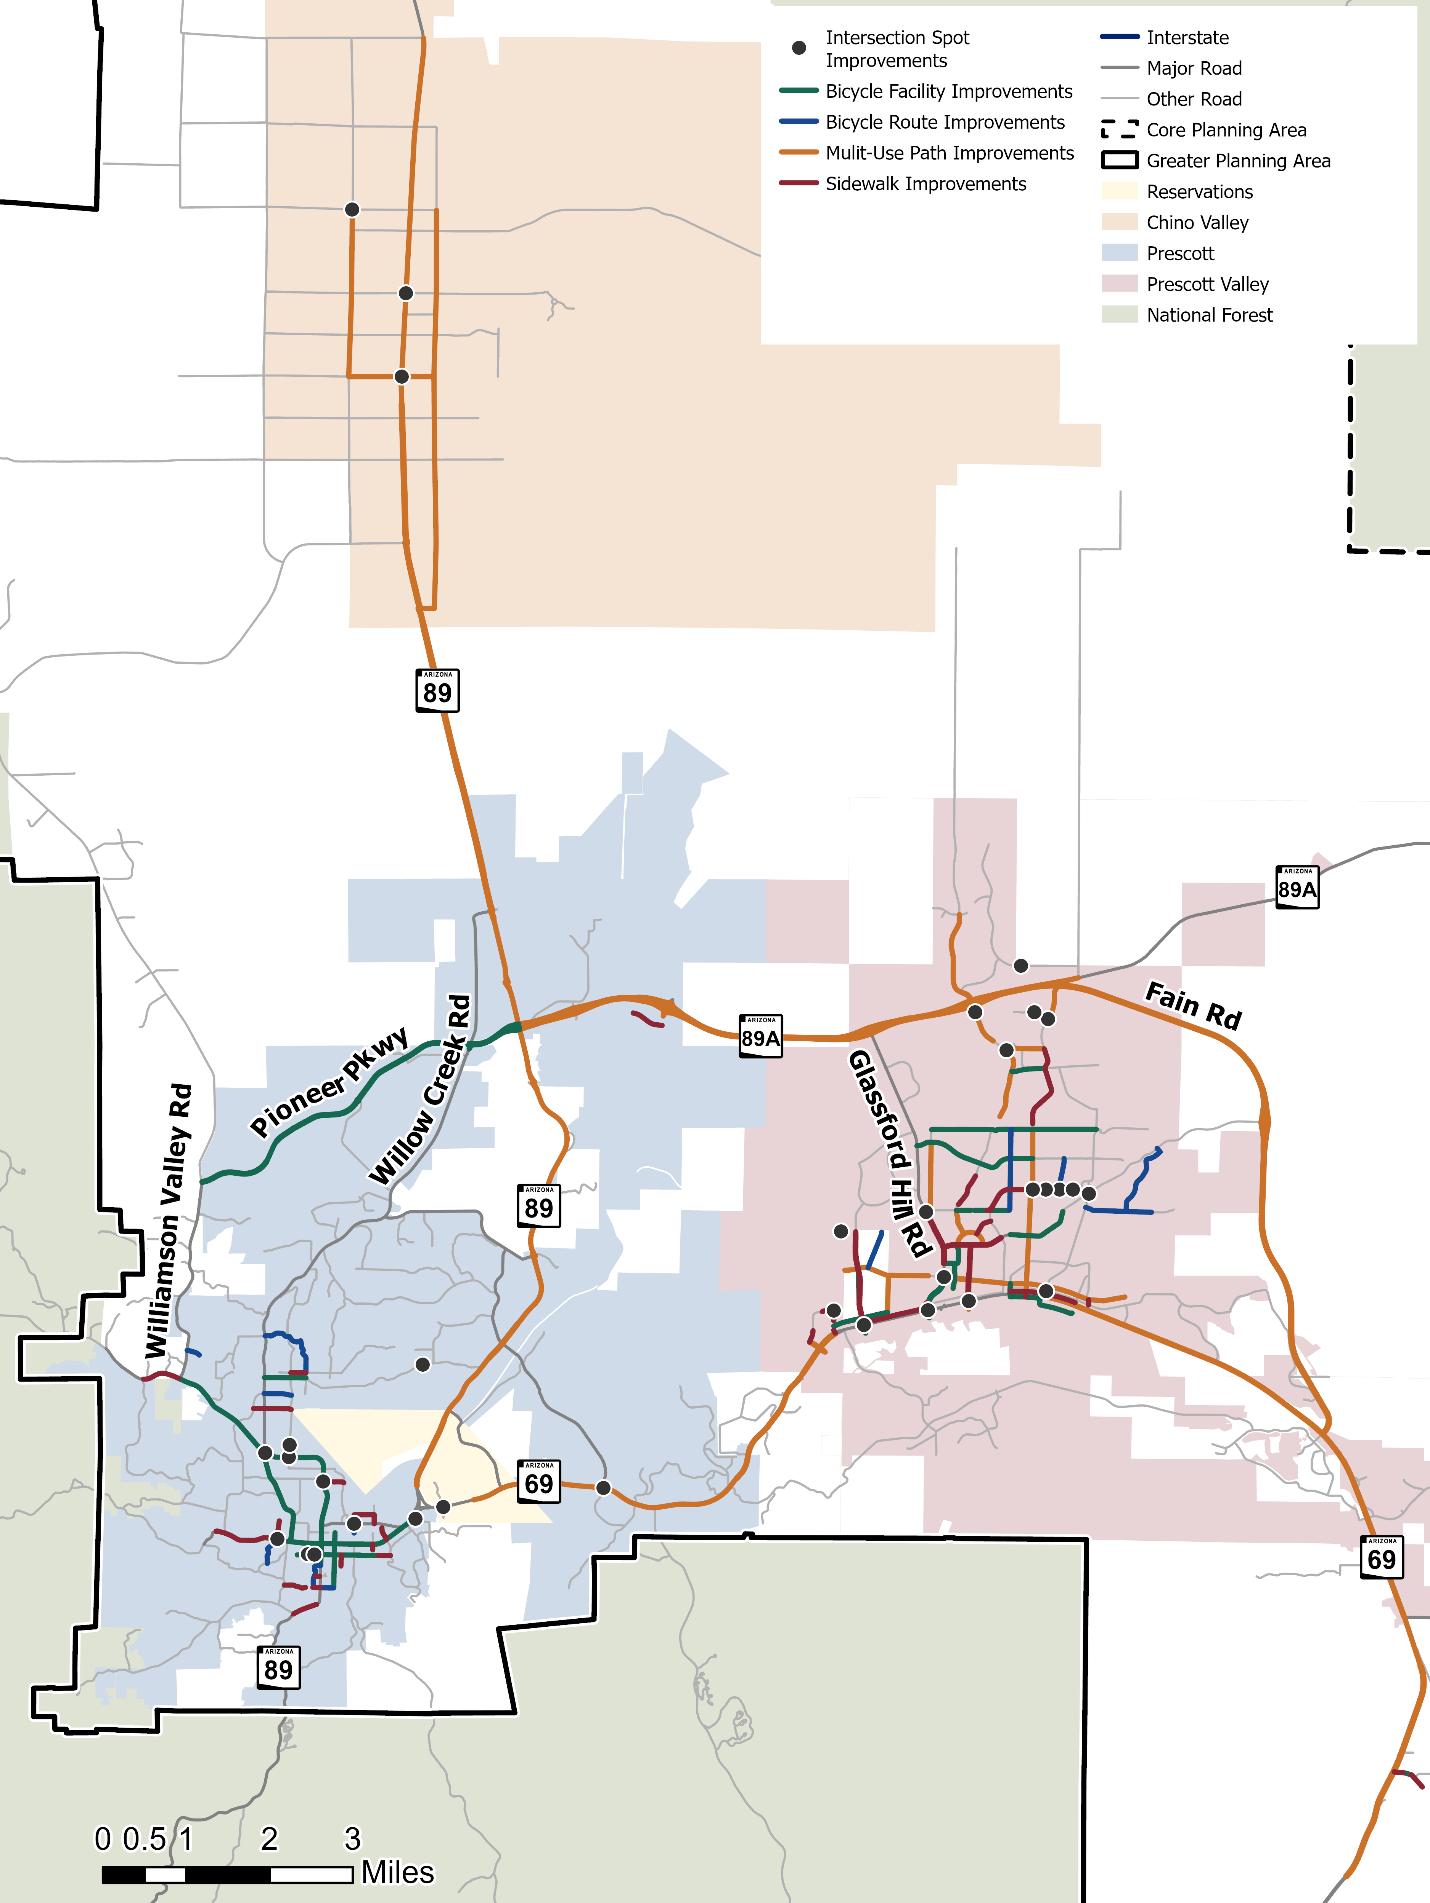
Many existing sidewalks have poor surface condition that decreases comfort for pedestrians and limits accessibility. Many corridors with sidewalk have gaps along the roadway, forcing pedestrians to walk on the roadway or on its shoulder. Supplementing the pedestrian network, the region’s trail network connects pedestrian and bicycle facilities to parks and other recreational facilities. Trails and multi-use paths are commonly located in Prescott and Prescott Valley. Figure 27 shows the location of current and planned pedestrian and trail facilities in the CYMPO region and Figure 28 shows a zoomed in version for the denser areas of the region..
Figure 29 shows the existing bicycle facilities in the CYMPO region and Figure 30 shows a zoomed in version for the denser areas of the region. Bicycle facilities are commonly located in Prescott and Prescott Valley, with some facilities in rural areas of the region.
27. Existing and Planned Pedestrian Network
Source: Kittelson & Associates
28. Existing and Planned Pedestrian Network Inset
Source: Kittelson & Associates
Source: Kittelson & Associates
Source: Kittelson & Associates
To quantify accessibility, the region was assessed for how far people can travel to access key destinations using the low-stress bicycle network. Accessibility of the region includes:
• Chino Valley has low accessibility due to the lack of destination density.
• Dewey-Humboldt has low accessibility due to lack of destination density. East of SR 69 has higher accessibility to key activity centers.
• Prescott generally has high accessibility within and surrounding downtown Prescott. Accessibility decreases farther from downtown.
• Prescott Valley has high accessibility in the town’s core. Accessibility decreases in residential neighborhoods to the north and outside the town’s boundary.
• Unincorporated Yavapai County has very low accessibility due to low development
Walking and bicycling origin and destination data can identify where people already walk and bike in the region, as well as where short trips are occurring that can be shifted to active transportation trips.

Walking trips most commonly begin in:
• Downtown Prescott
• Prescott Valley, along Civic Center Road and SR 69
• Chino Valley, connecting to destinations such as Safeway and the Chino Valley Community Center
Bicycling trips most commonly begin in:
• Downtown Prescott
• Prescott, along Willow Creek Road and Willow Lake area
• Prescott Valley, along Civic Center Road and SR 69
• Chino Valley, connecting to destinations such as Safeway and the Chino Valley Community Center

Of 545,000 vehicle trips taken on a typical weekday, 26% are 2 miles or less in length.
Short trips are concentrated in and around downtown areas in Prescott and Prescott Valley. These trips, shown in Figure 31, have the potential to be converted to walking or bicycling trips if low-stress active transportation facilities are available.
31. Short Trip Origin Locations
Source: Kittelson & Associates
Pedestrian and bicycle involved crashes were assessed from 2018 to 2022 using ADOT ACIS.
199 active transportationinvolved crashes
Active transportation crashes account for <1% of crashes, but 4% of fatalities and serious injuries
Most active transportation-involved crashes occur on major roadways near an intersection.
Understanding the current and future conditions for shared mobility opportunities in the region provides insight on how residents’ transportation options can expand. As mobility options increase, the community can leverage multiple modes for their daily transportation trips. This section provides an overview of the region’s current mobility systems, including the transit system and aviation, and explores the future of shared mobility.
CYMPO has three transit services, providing transit access to residents in the urban and rural areas of the region. Transit services are shown in Figure 32
The YRT operates four routes in Prescott, Prescott Valley, and Chino Valley. Routes include:
Gold Route serves Chino Valley and operates 13 stops on weekdays.
Green Route is a commuter service between Chino Valley and Prescott and operates weekdays besides Wednesdays.
Red Route and Blue Route provide bi-directional service to Prescott, Prescott Valley, and Chino Valley on Wednesdays
The YavaLine is a regional transit service that provides on-demand microtransit service to zones in Downtown Prescott and central Prescott Valley. Service is available on weekdays. YavaLine began operations in 2022 in Prescott Valley and added the Prescott zone in 2024. CYMPO is currently operating the YavaLine service after transitioning operating responsibilities from Prescott Valley to expand into additional jurisdictions.
NATION (YAN) TRANSIT
Yavapai-Apache Nation Transit is provided by the Yavapai-Apache Nation and provides weekday fixed route service with stops in Cordes Junction, Spring Valley, Mayer, DeweyHumboldt, Prescott Valley, and the City of Prescott.
Overlapping Transit Service
Several lines from the supporting agencies have stops that overlap with one another in the CYMPO region. The services and their overlapping locations are shown below.
Table 2. Transit Service Overlap
YavaLine, YAN, Red, Blue
YavaLine, Red, Blue
Prescott Valley Library
Prescott Valley Department of Economic Security
YAN, Red, Blue Prescott Walmart
YAN, Green, Red, Blue Courthouse Plaza
Prescott Regional Airport (PRC) is the primary airport in the CYMPO region, providing commercial service, general aviation, pilot training, and forest fire operations. The airport is serviced by United Airlines, providing flights to Denver and Los Angeles.
Previously recommended transit improvements were developed in the following planning effort:
Electric bike and scooters have become a popular new mobility option. In the region, there are numerous e-bike rental businesses and e-bike sellers. Infrastructure gaps and policy make electric bike and scooter usage limited in the region. There are no bikeshare or scooter-share programs in the study
The CYMPO Phased Transit Development Plan recommended two future microtransit zones for the region. Recommendations include:
Implement microtransit service in northern Prescott, near SR 89.
Implement microtransit service between the existing Prescott Valley and Prescott zones.
From existing conditions deficiencies, previous plan recommendations, and public feedback, potential transportation projects were developed for the region. The following sections review the project development process and the resulting potential roadway, active transportation, and transit projects that have been prioritized in Move 2050.
Needs and deficiencies of the region’s roadway system were identified to guide potential projects. A variety of sources were leveraged to develop potential projects, including previous planning efforts, existing conditions assessment, public engagement, and local experts, including CYMPO staff and project development workshops with member agencies. Potential project sources are summarized below.
Potential active transportation projects were sourced from the Central Yavapai ACT-UP Active Transportation Plan, set to be adopted in June 2025. Potential projects were developed based on active transportation need. ACT-UP identified a comprehensive list of locations that may benefit from pedestrian or bicycle facility improvements. Project locations include linear improvements where there are existing infrastructure gaps, spot improvements, first and lastmile connections, locations where a low-stress bicycle network can be developed, and locations that were identified by public, local agency, or CYMPO staff.
Potential transit projects were sourced from CYMPO’s Phased Transit Plan and discussion with CYMPO staff.
Move 2050 staff met with staff from each member agency to review the potential roadway capital projects to refine the list in advance of project prioritization. The project development workshops were key to refining the potential transportation investments for the RTP. Methods of refining the list of potential roadway capital projects included:
Remove projects that are not feasible or politically acceptable
Refine project scopes to improve their feasibility
Combine adjacent projects or develop systematic recommendations
Break projects into separate phases or into projects with different focuses
Convert projects to future study recommendations if additional investigation is required
Add additional projects if there are gaps
The project development workshops resulted in:
a developer-driven list that will not be prioritized with other roadway capital projects
A total of 135 potential capital roadway projects were identified during the project development process and were categorized by type. Projects anticipated to be driven by future development and paid for by the developer were separated into a separate category as they will not be paid for by CYMPO’s member agencies. Roadway capital projects identified in Move 2050 are not mandated for implementation but are strongly recommended to improve transportation in the region.
The project list and maps showing their locations in the CYMPO region are provided in the following subsections. Sources for each project reviewed are denoted
Of the 135 potential roadway capital projects, four are bridge projects. Bridge projects identified in the study area are shown in Table 3 and Figure 33
Table 3. Potential Bridge Projects
B1 Willis Street Bridge at Granite Creek
B2 Prescott Street Bridge at Agua Fria River
B3 Prescott Lakes Parkway Bridge Improvements at Granite Creek
B4 Lincoln Avenue Bridge at Butte Creek
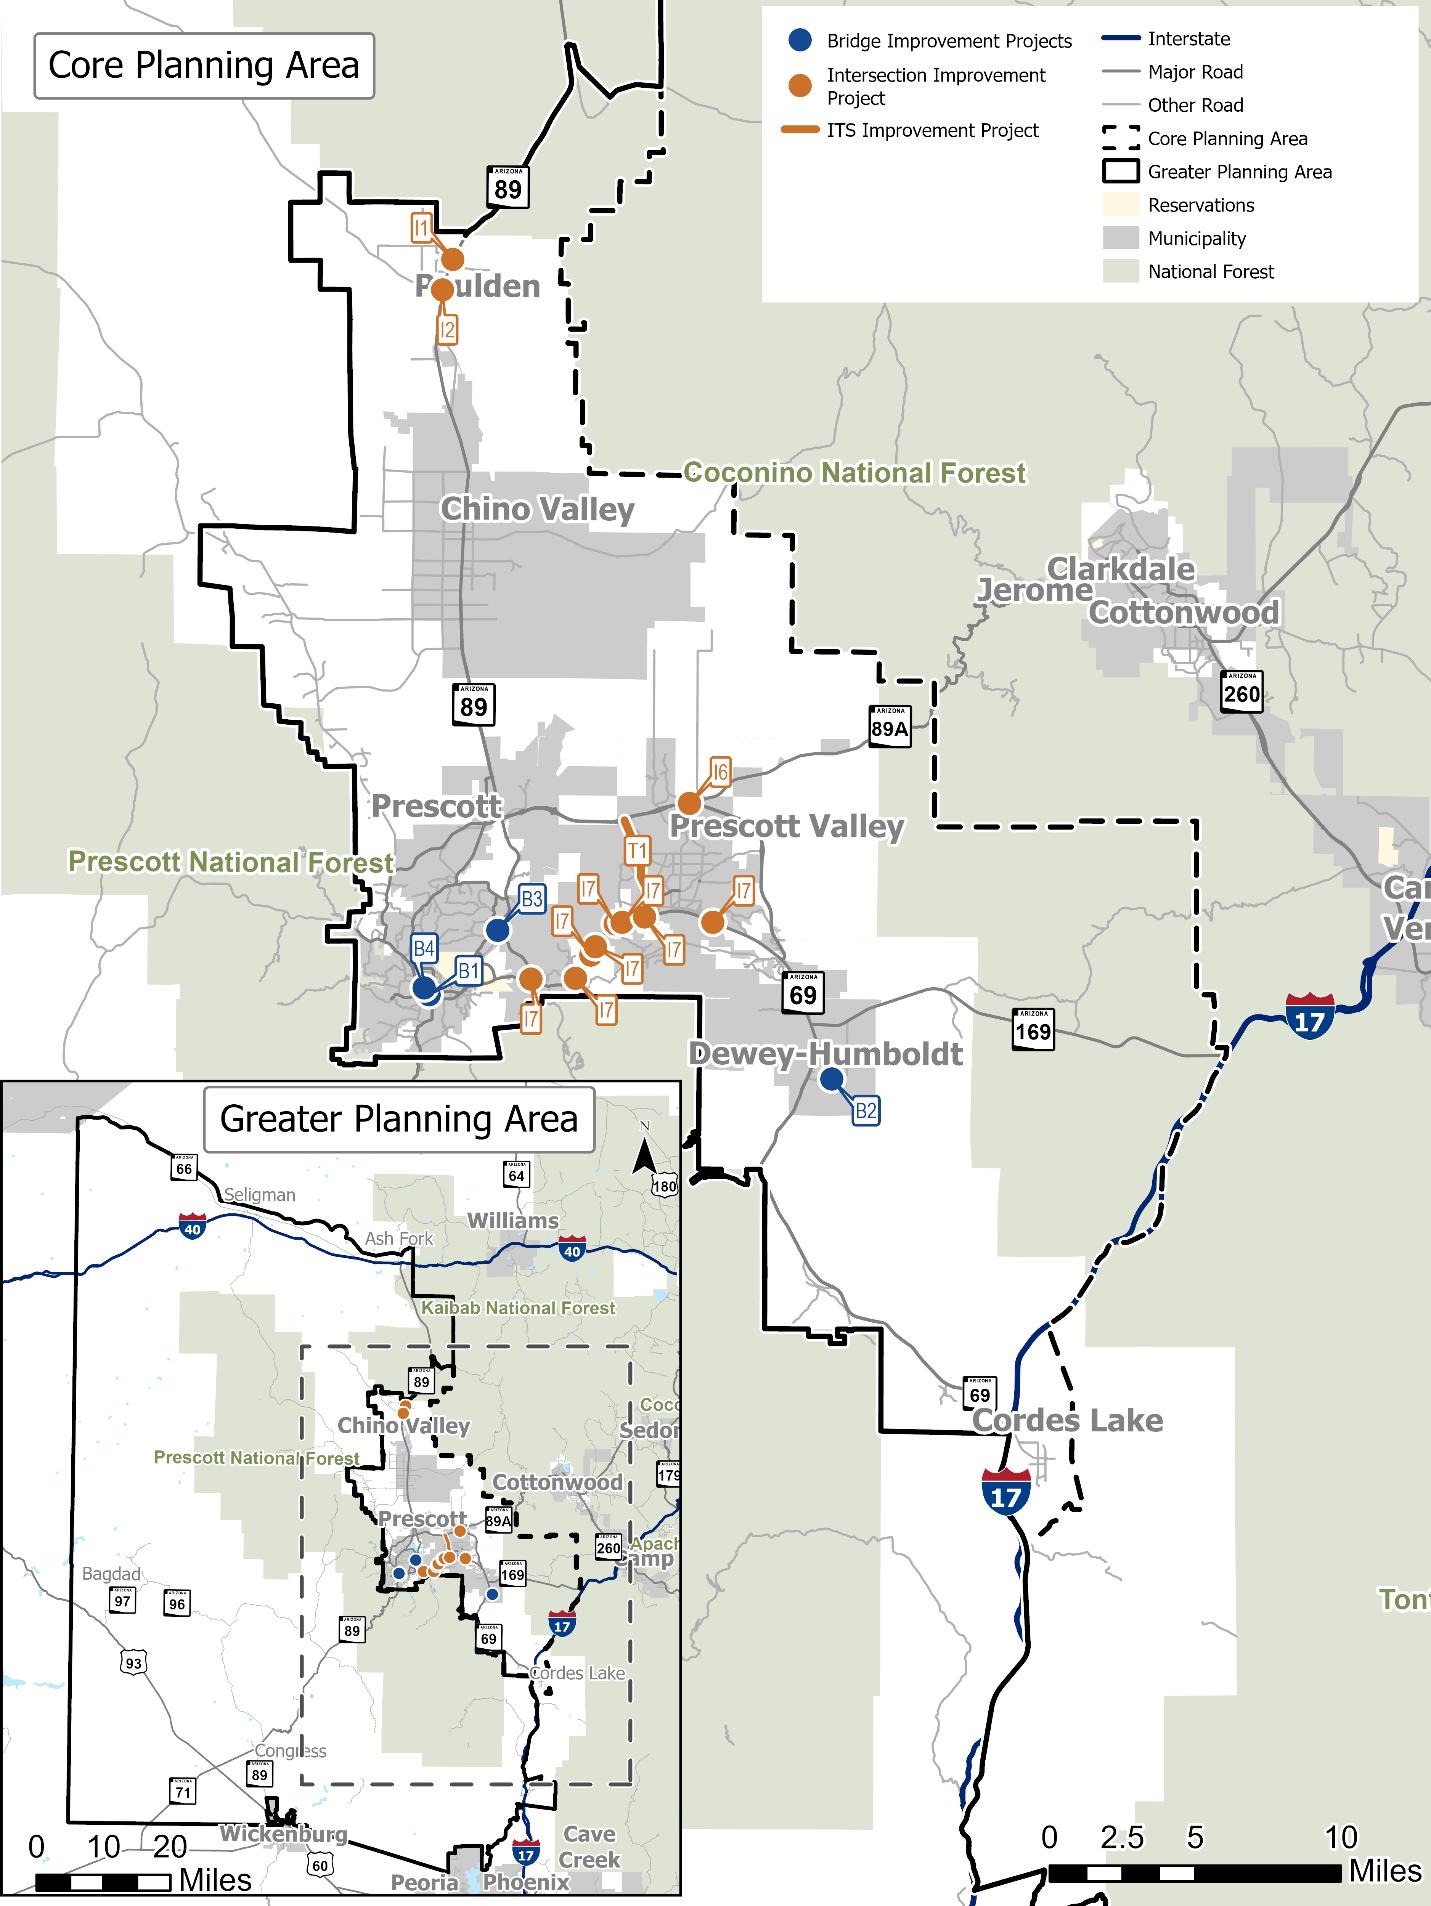
Of the 135 potential roadway capital projects, four are intersection improvements and one is an intelligent transportation system (ITS) project. Intersection and ITS improvement projects identified in the study area are shown in Table 4 and Figure 33
Table 4. Potential Intersection and ITS Projects
Figure 33 Potential Bridge, Intersection, and ITS Projects
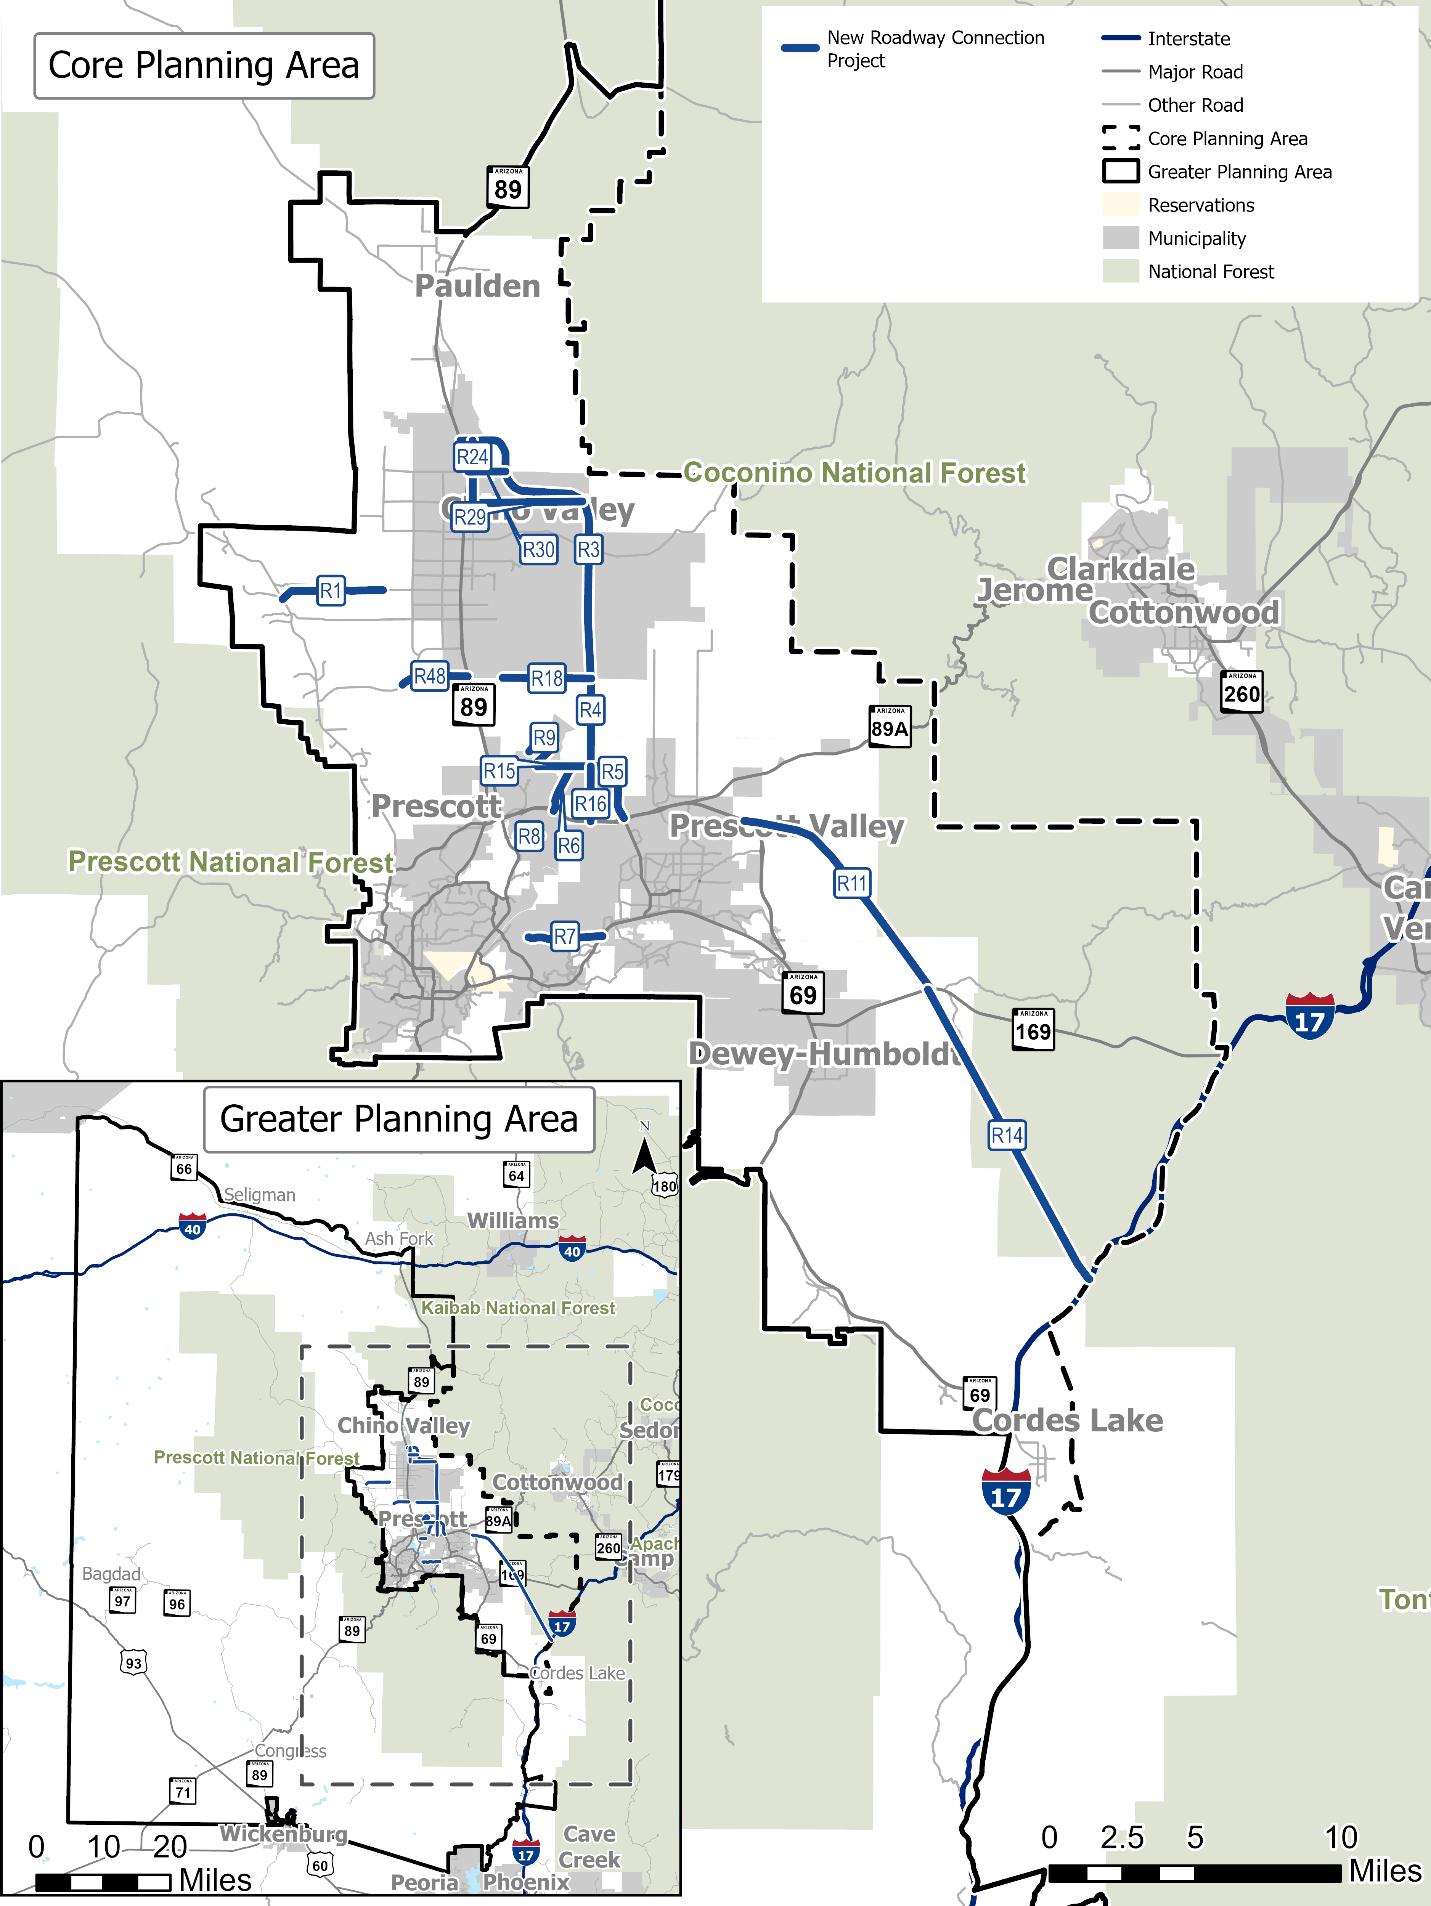
Of the 135 potential roadway capital projects, 17 are new roadway connections. New roadway connection projects identified in the study area are shown in Table 5 and Figure 34 Table 5. Potential New
34
Of the 135 potential roadway capital projects, 29 are roadway widening projects. Potential roadway widening projects identified in the study area are shown in Table 6 and Figure 35.
Table 6. Potential Roadway Widening Projects Primary Route
W3 SR 89 Widening (Rd 3N-Rd 4N)
W4 SR 89 Widening (Old Hwy 89-Frontier Rd)
W5 SR 89 Widening (Deep Well Ranch Rd-Center St)
W17 US 93 Ranchland: MP 166 to MP 170 Corridor Improvements
W18 US 93 Tres Alamos: MP 174 to MP 170 Corridor Improvements
W19 US 93 Date Creek: MP 174 to MP 178 Corridor Improvements
W20
W27 Willow Creek Rd Widening
W28
W31 SR 69 Widening (Prescott Lakes Pkwy to Walker Rd) SR 69 Prescott Lakes Pkwy Walker Rd Add third lane WB from Lee Blvd to Walker Rd, add median from Prescott Lakes Pkwy to Walker Rd, add a Green T at Gateway Rd 11
W32 SR 69 Widening (Stoneridge Dr to Truwood Dr)
SR 69 Stoneridge Dr Truwood Dr Add third lane EB from Prescott East Hwy to Glassford Hill Rd, third lane EB from Glassford Hill Rd to Truwood Dr, median from Stoneridge Dr to Navajo Rd, MUP to south side from Stoneridge Dr to Navajo Rd, MUP on both sides from Navajo Rd to Truwood Dr 11
W33 SR 69 Widening (Walker Rd to Sundog Ranch Rd)
SR 69 Walker Rd Sundog Ranch Rd Add third lane from Walker Rd to Sundog Ranch Rd, median from Walker Rd to Old Black Canyon Hwy, MUP on south side from Walker Rd to Sundog Ranch 11
W34 SR 69 Widening (Truwood Dr to Fain Rd)
SR 69 Truwood Dr Fain Rd
Add third lane EB and WB from Truwood Dr to Fain Rd, median from Enterprise Pkwy to Fain Rd, MUP on north side from Truwood Dr to Fain Rd 11
Of the 135 potential roadway capital projects, 40 are safety improvement projects. Potential safety improvement projects on segments are shown in Table 7 and projects at intersections are shown in Table 8. Potential safety improvement projects are shown in Figure 36.
Table 7. Potential Segment Safety Improvement Projects
S1 SR 89 Chino Valley Safety Improvements
SR 89 Center St Rd 2N
S2 SR 89 Safety Improvements
raised median 3
SR 89 Perkinsville Rd Rd 3N Install raised median, convert Rd 3N to two-lane roundabout 3
S4 Fain Rd Safety Improvements
Fain Rd SR 69 Sarah Jane Ln Install curve warning and speed reduction signage/beacons, chevrons, lighting 3
S5 SR 69 Shoulder Widening
SR 69 MP 275 MP 277 Widen shoulders 3
S8 Southbound SR 69 Safety Improvements
SR 69 Poland Rd Finley Rd Install intersection lighting, wildlife fencing, and right-turn lanes at intersections 6
S9 Southbound SR 69 Safety Improvements
SR 69 Jagged Tooth Trl Old Sycamore Rd
S13 SR 89 from MP 340 to 342 Corridor Improvements
SR 89 MP 340 MP 342
S16 Willow Creek Road Safety Improvements
passing lane and cure warning signs 6
Willow Creek Rd Whispering Oak Dr Commerce Dr Install speed feedback signs, targeted speed enforcement, and buffered bicycle lanes, intersection warning signage 8
S19 SR 89 Safety Improvements from One Mile South of Outer Loop Road to North of Deep Well Ranch Road
SR 89 Outer Looper Rd Deep Well Ranch Rd
Evaluate for median crossover protection, maintain raised pavement markers, and strategic placement of speed feedback signs 8
S20 SR 89A Corridor Improvements from Prescott Ridge Road - Hull Avenue
SR 89A Prescott Ridge Rd Hull Ave Install paved shoulders and edge-line rumble strips, speed feedback signs, nighttime speed limit, widen shoulders 8
S28 Robert Road (SR 69 – Tranquil Boulevard)
Primary Route From/At To
Robert Rd SR 69 Tranquil Blvd
S29 Robert Road (Tranquil Boulevard – SR 89A)
Robert Rd Tranquil Blvd SR 89A
Roundabouts at Florentine Rd, Yavapai Rd, Lakeshore Dr, Loos Dr, Spouse Dr, and Manley Dr. Lane reconfiguration. 9
Roundabouts at Long Mesa Dr and Roundup Dr. Lane reconfiguration. Sidewalk, curb, and gutter improvements from Tranquil Blvd and Powers Ave. Install traffic signal at Powers Ave. Extend shared-use path from Powers Ave to SR 89A. 9
S30 Glassford Hill Road (Centre Court – Granville Parkway/Tuscany Way)
Glassford Hill Rd Centre Ct Granville Pkwy
Offset left turns at Centre Ct, Lakeshore Dr, Spouse Dr, Sanat Fe Loop Rd, Granville Pkwy. Curb, gutter, and sidewalk on east side from Veterans Way to Main St. 9
S31 Lakeshore Drive (Glassford Hill Road – Windsong Drive)
Lakeshore Dr Glassford Hill Rd Windsong Dr Roundabout. Sidewalk, curb, and gutter improvements. 9
S32 Lake Valley Road (SR 69 – Lakeshore Drive)
Lake Valley Rd SR 69 Lakeshore Dr
Median at Lake Valley Rd. Offset left turns at Pav Way and Florentine Rd. Sidewalk, curb, gutter improvements. 9
S33 Windsong Drive (Pav Way – Long Look Drive/Loos Drive)
Windsong Dr Pav Way Long Look Dr
S35 Viewpoint Drive Access Management
Viewpoint Dr SR 89A EB Ramps Addis Ave
S37 Ranger Road Corridor Improvements
Median at Pav Way. Sidewalk, curb, and gutter improvements from Lakeshore Dr to The Landings. Positively offset left turns at Windsong Dr and Lakeshore Dr. Roundabout at Civic Dr and Long Look Dr. 9
Median from SR 89A to Addis Ave, Addis Ave Roundabout
Ranger Rd Manley Dr Spouse Dr Roundabouts at Manley Dr and Spouse Dr 9
S38 SR 89 Yarnell Safety Improvements
SR 89 MP 276 Young Ln
Restripe roadway into one lane per direction with a middle lane, pedestrian curb extensions, pedestrian refuge islands, parking space removal 10
Figure 37. Developer-Driven Projects
CYMPO’s ACT-UP Plan identified a total of 361 projects for the region. Projects were categorized by type and jurisdiction. Recommended active transportation projects are shown in Appendix A
Bike Facility Recommendations
Intersection and Spot Recommendations
Multi-Use Path Recommendations Sidewalk Recommendations
A total of five potential transit projects were identified based on previous recommendations and discussion with CYMPO staff. Potential projects are summarized below and shown in Figure 38
Potential Microtransit Projects
A North Prescott Microtransit Service
B Embry-Riddle University Microtransit Service
C Pronghorn Ranch Microtransit Service
D Prescott Golf and Country Club Microtransit Service
Potential Fixed-Route Projects
E Prescott-Prescott Valley Express Route
Microtransit service in northern Prescott, loosely bound by Iron Springs Rd, Willow Creek Rd, and Lakewood Dr.
Microtransit service to include land loosely bound by Willow Creek Rd, Lakeview Dr, Whispering Rock Rd, and Commerce Dr.
Microtransit service in Prescott Valley to include northern Prescott Valley, north of SR 89A, encompassing Viewpoint and Pronghorn Ranch.
Microtransit service in Prescott Valley to include southeastern Prescott Valley, including Prescott Golf and Country Club and Villages at Lynx Creek.
Implementation of an express route connecting downtown Prescott and downtown Prescott Valley via SR 69.
38. Potential Transit Projects
Planning-level cost estimates were developed for each potential transportation project for use in the prioritization process. Planning-level costs are based on unit costs for similar types of projects; additional study will be needed for each project to identify more detailed cost estimates that will be used for programming of construction funds.
The unit costs for roadway capital projects, shown in Figure 39, were used to apply a planninglevel cost estimate to each potential roadway capital project.
Planning-level project cost estimates were prepared by examining and quantifying the physical extents of each potential roadway capital projects and then using the unit costs above. Planning-level cost estimates do not identify specific funding sources and are only reflective of the total cost to implement the improvement. The potential roadway capital projects and their planning-level costs are shown in Table 10.
S19
The following section reviews how the region’s priorities were identified and applied to the potential regional projects to identify the region’s implementation strategy. The potential projects identified for the CYMPO region were developed and prioritized from the Move 2050 Plan and CYMPO’s other mode-specific plans. Prioritization of potential modal projects are summarized below.
Roadway Capital Projects Active Transportation Projects Transit Projects
After identifying potential roadway capital projects, a prioritization framework was developed. Prioritizing potential projects is an important factor as funding for transportation improvements in the region is limited and not all projects can be funded by 2050. Ranking investments by priority helps determine where CYMPO and its member agencies should focus resources to make the most effective investments to the roadway network. The priorities and their weighting are shown in Figure 40
Figure 40. Priorities and Weighting
To analyze potential investments based on Move 2050’s goals, each priority is supported by a set of evaluation criteria. These criteria allow the potential projects to be measured with quantifiable metrics. The evaluation criteria are shown below.
• Number of crashes by severity
• Number of FHWA proven safety countermeasures
• Number of vulnerable road user crashes
• Project is located on the high injury network
• Project addresses identified poor pavement or bridge condition
• Number of modes of travel with improved conditions (pedestrian, bicycle, transit, vehicular)
• Average short-trip intensity of project with active transportation improvements
• Number of activity centers within ¼ mile of the project.
• Average walking trip origin intensity of project with active transportation improvements
• Average bicycling trip origin intensity of project with active transportation improvements
• Percentage of project with added active transportation facilities within 1/4 mile of a transit stop or within micotransit service
Equity
• Percentage of ¼ mile buffer around project that falls in an equity focus area
• Project adds active transportation or transit access to an equity focus area
Environmental Quality
• Project is within a FEMA-designated floodplain
• Mileage of project within state or federally protected lands, or locally-designated open space
• Mileage of project within a wilfdlife connectivity zone or wildlife stakeholder corridor
• Number of special status species potentially impacted by project (as identified by AGFD ERT)
Public Support
• Project was recommended in a previous planning effort
• Project rank from public engagement round 2
Implementation
• Total improvement cost
• Improvement cost per mile
• Percentage of project that is in a steep slope area
• Additional right-of-way is required
• CYMPO and member agency support
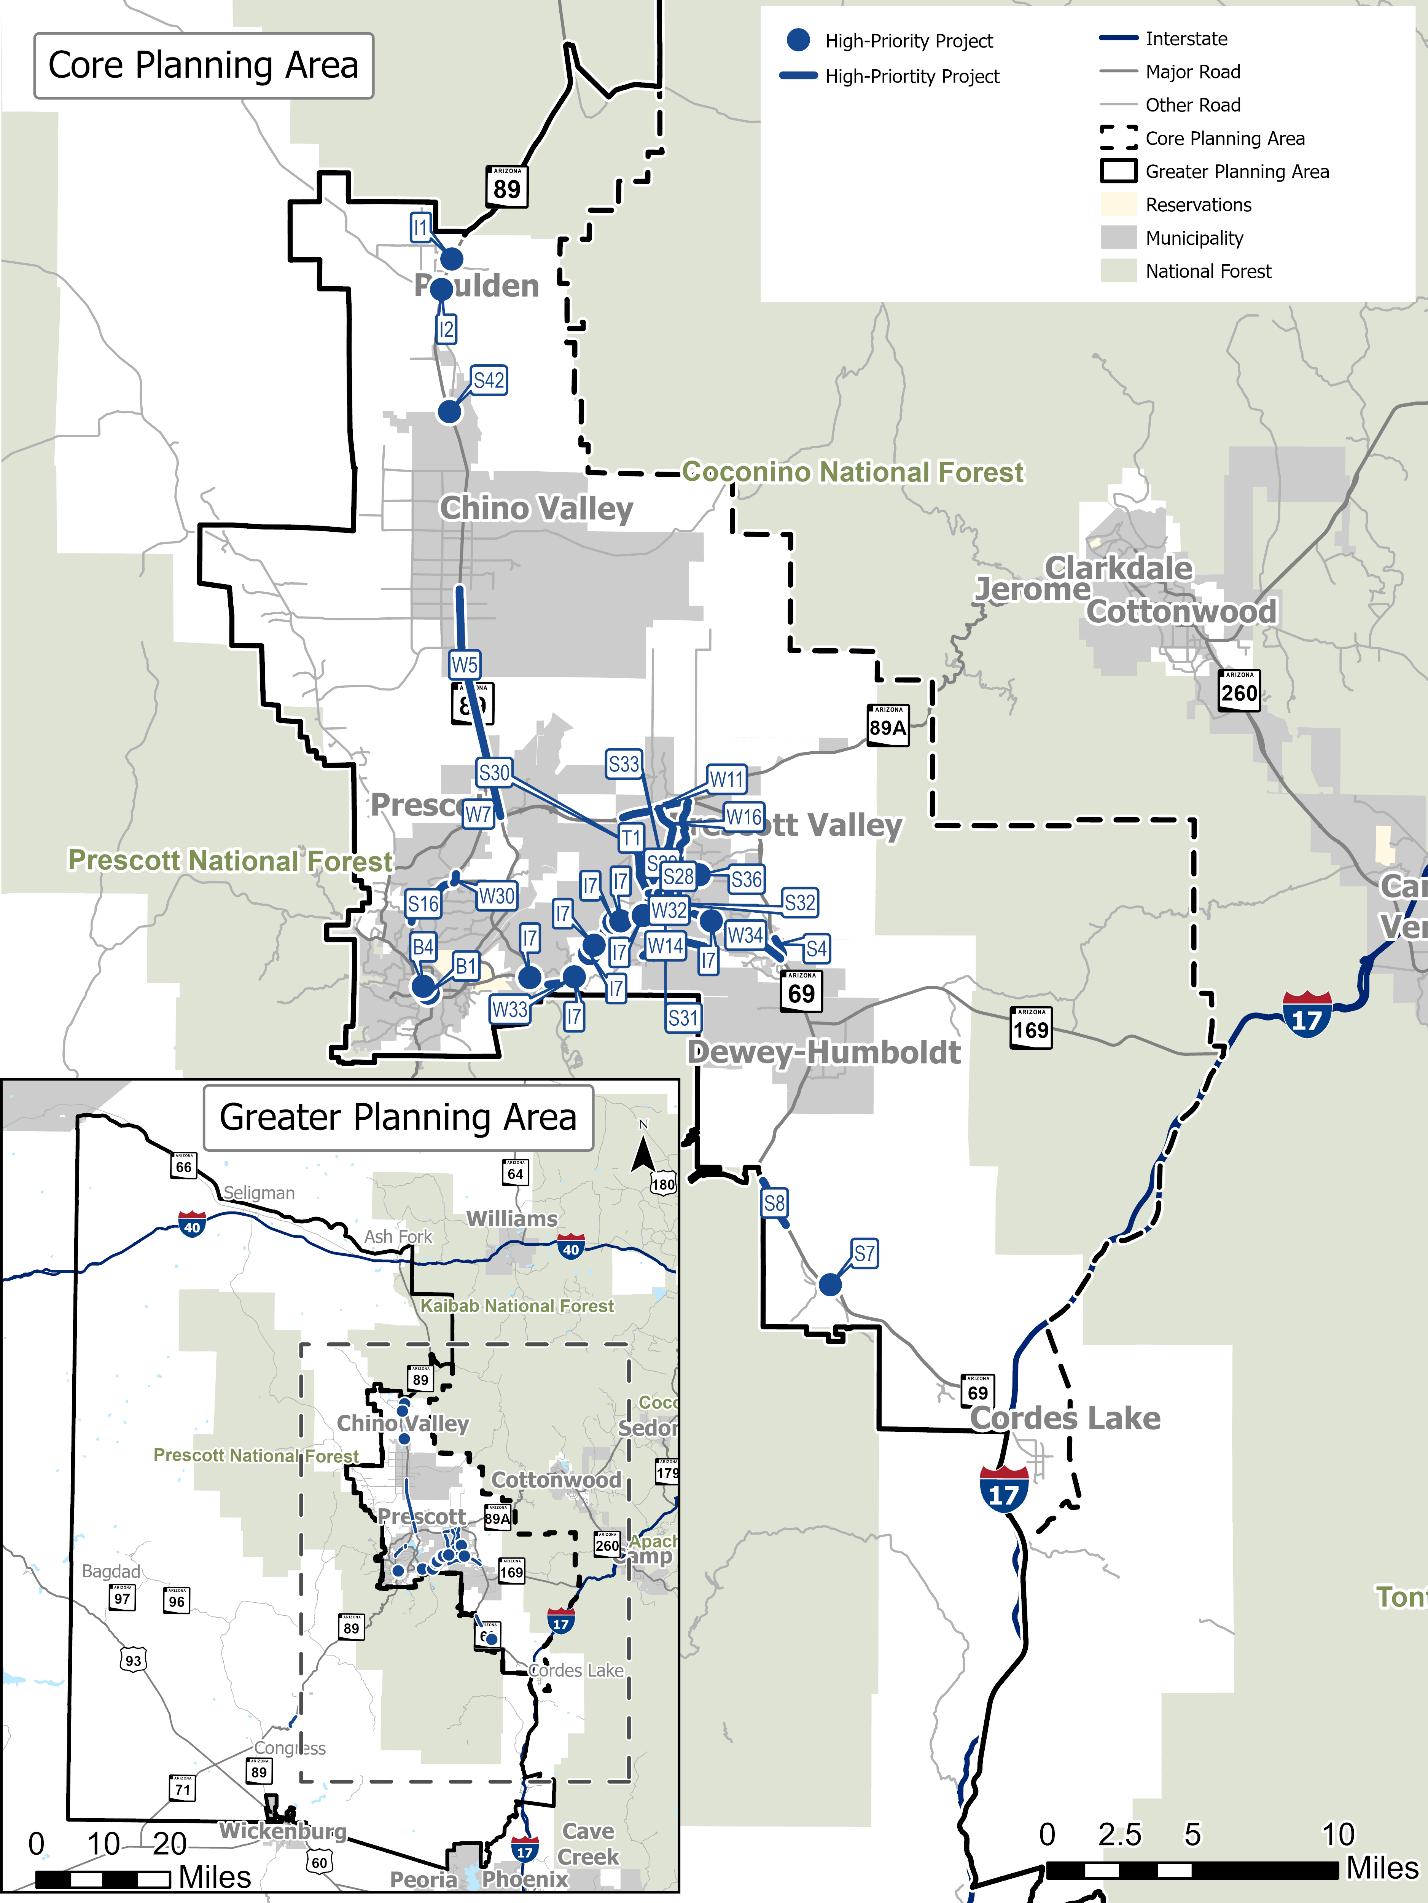
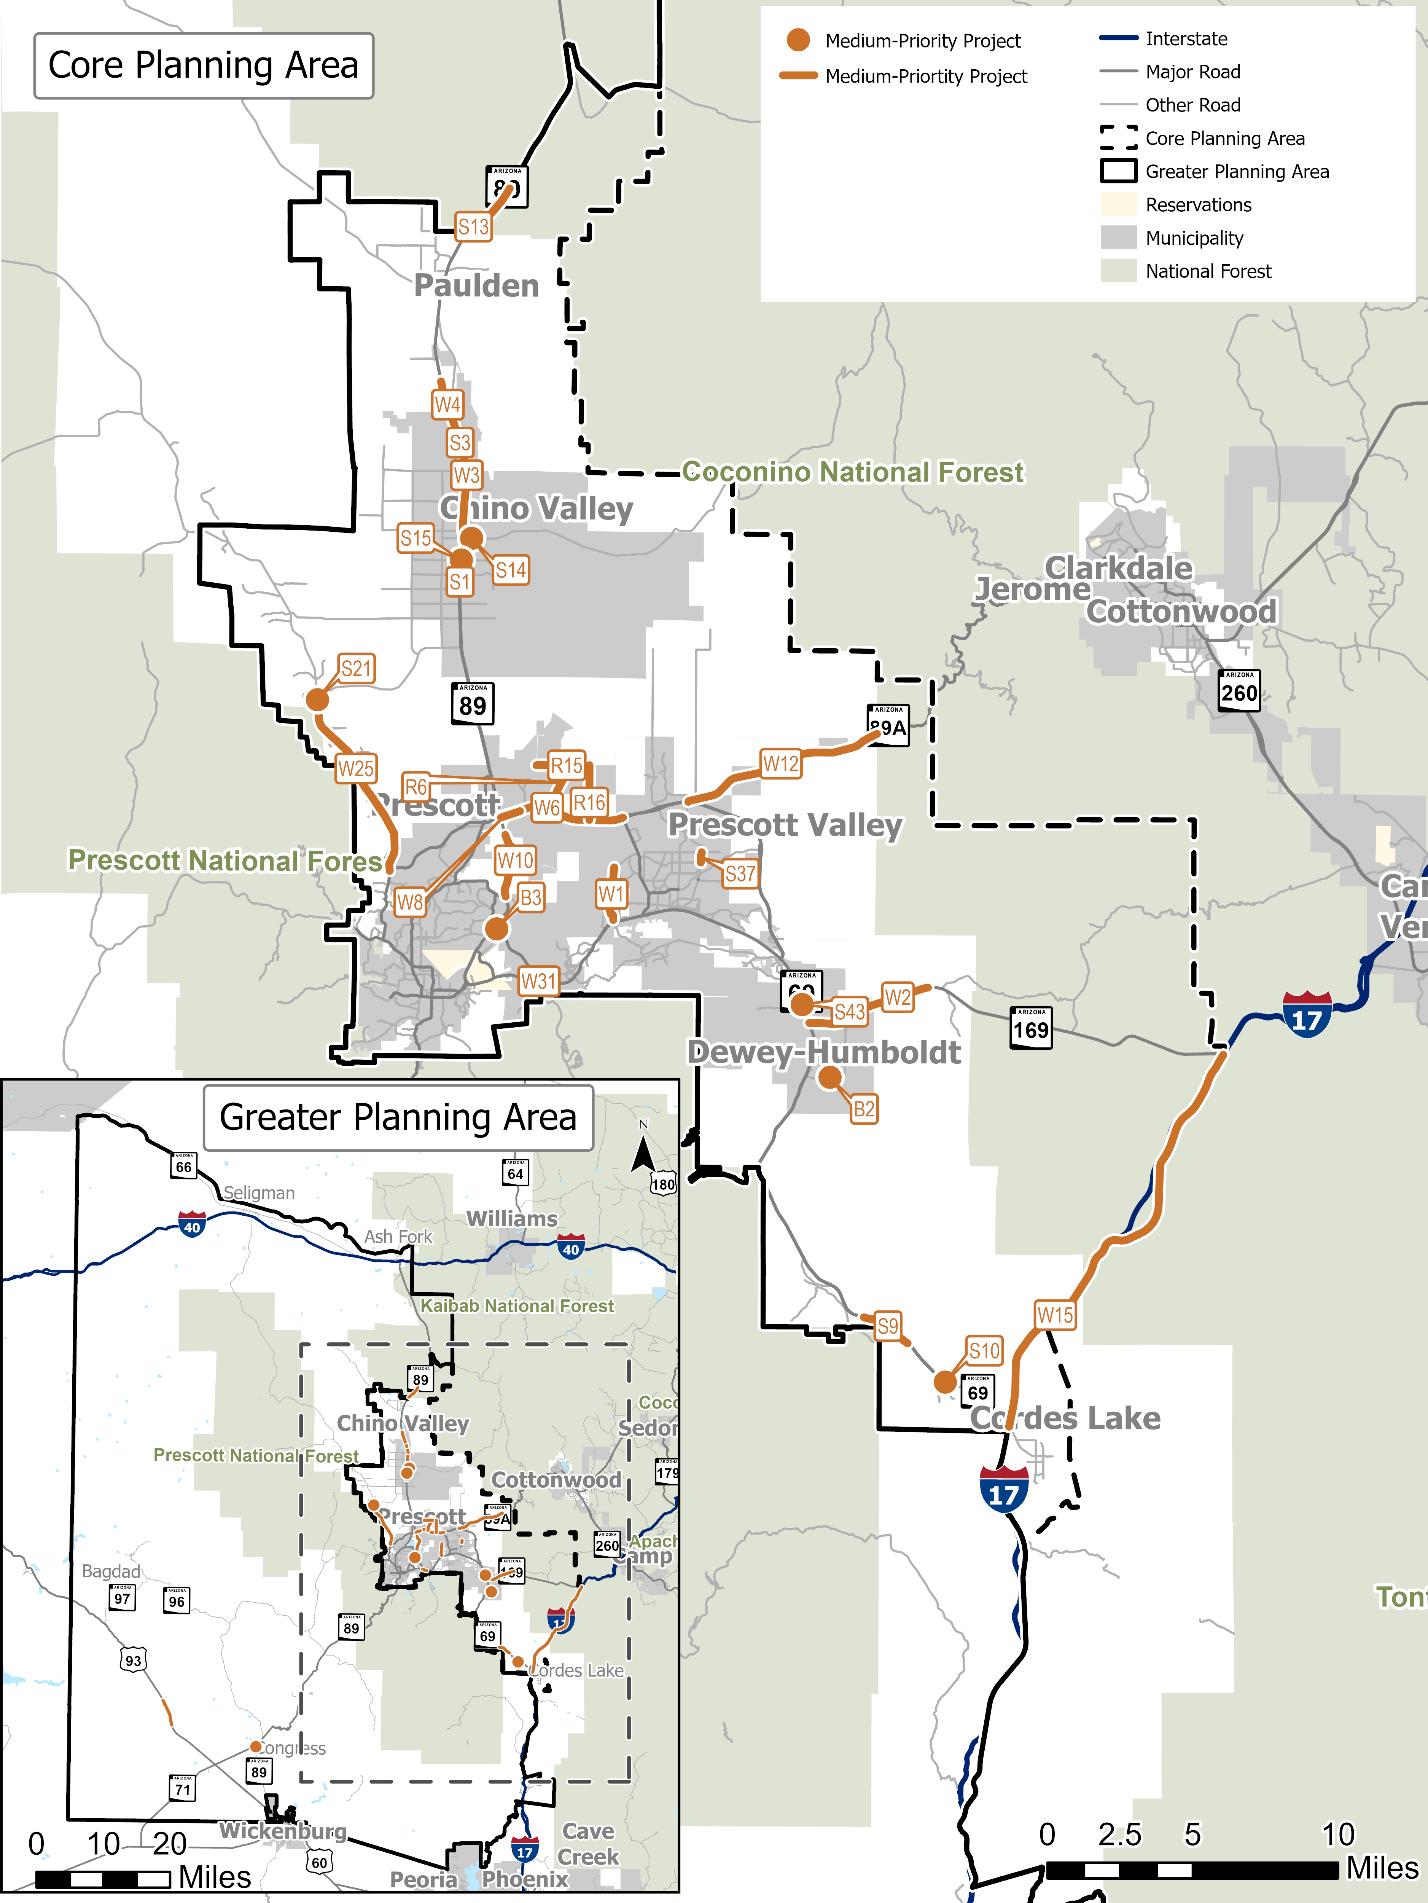
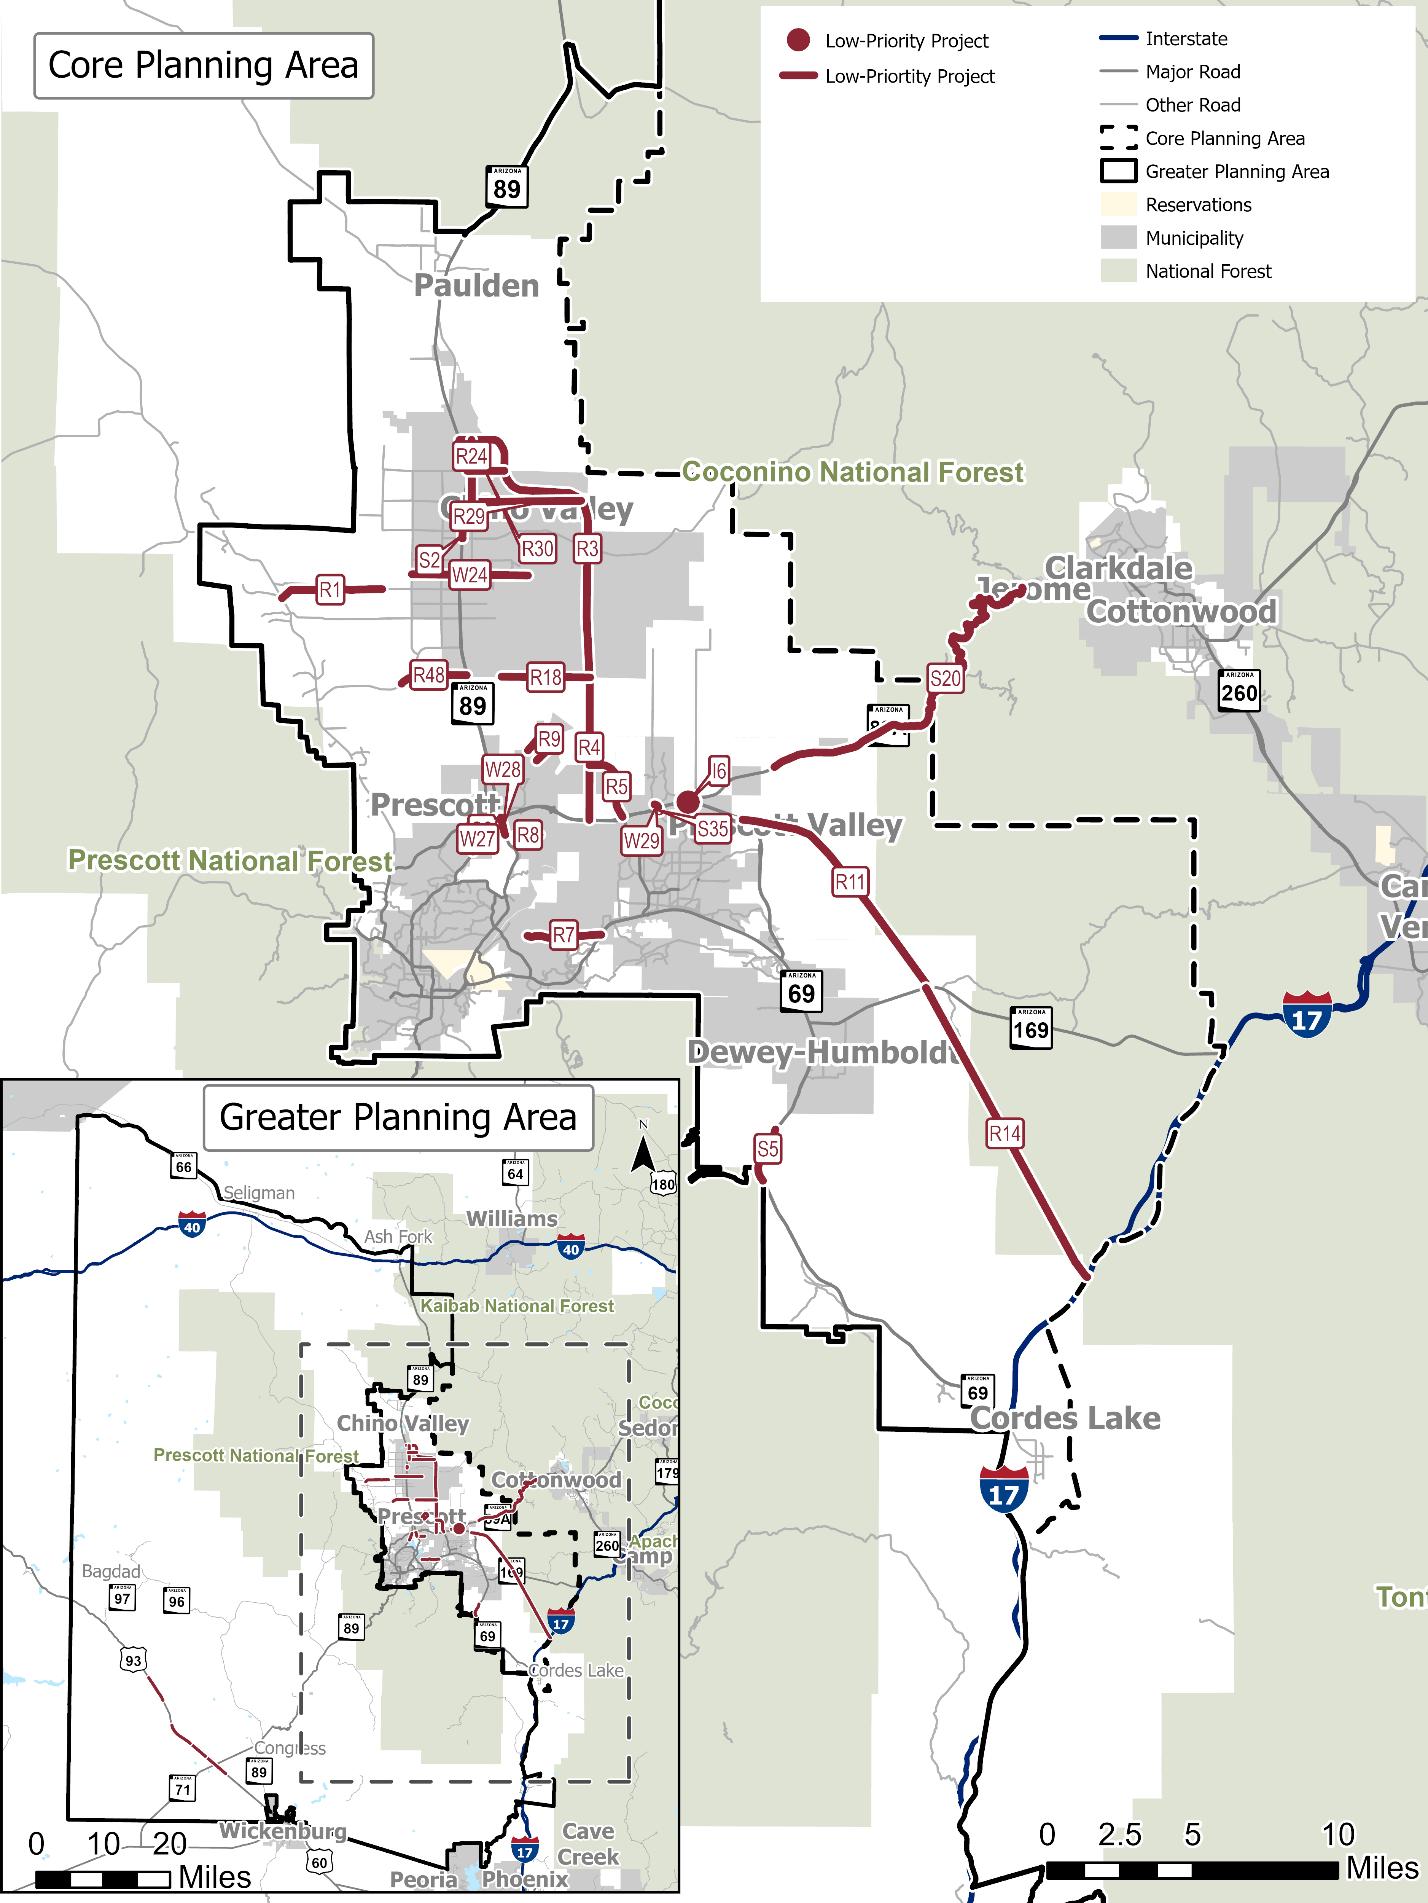
Once potential projects were identified, they were assessed using the above priorities and evaluation criteria to determine which are most impactful to the region and Move 2050’s goals. Developer-funded projects and project packages were excluded from the prioritization process to allow CYMPO and its member agencies to focus on projects that will not be funded in the future as development occurs or that require significant funding to implement. Roadway capital projects are assigned into high priority (short-term 2026 to 2040), medium-priority (mid-term 2041 to 2050), and low-priority (long-term beyond 2050). The roadway capital project prioritization results are shown in Figure 41.
41. Potential Project Priority Levels
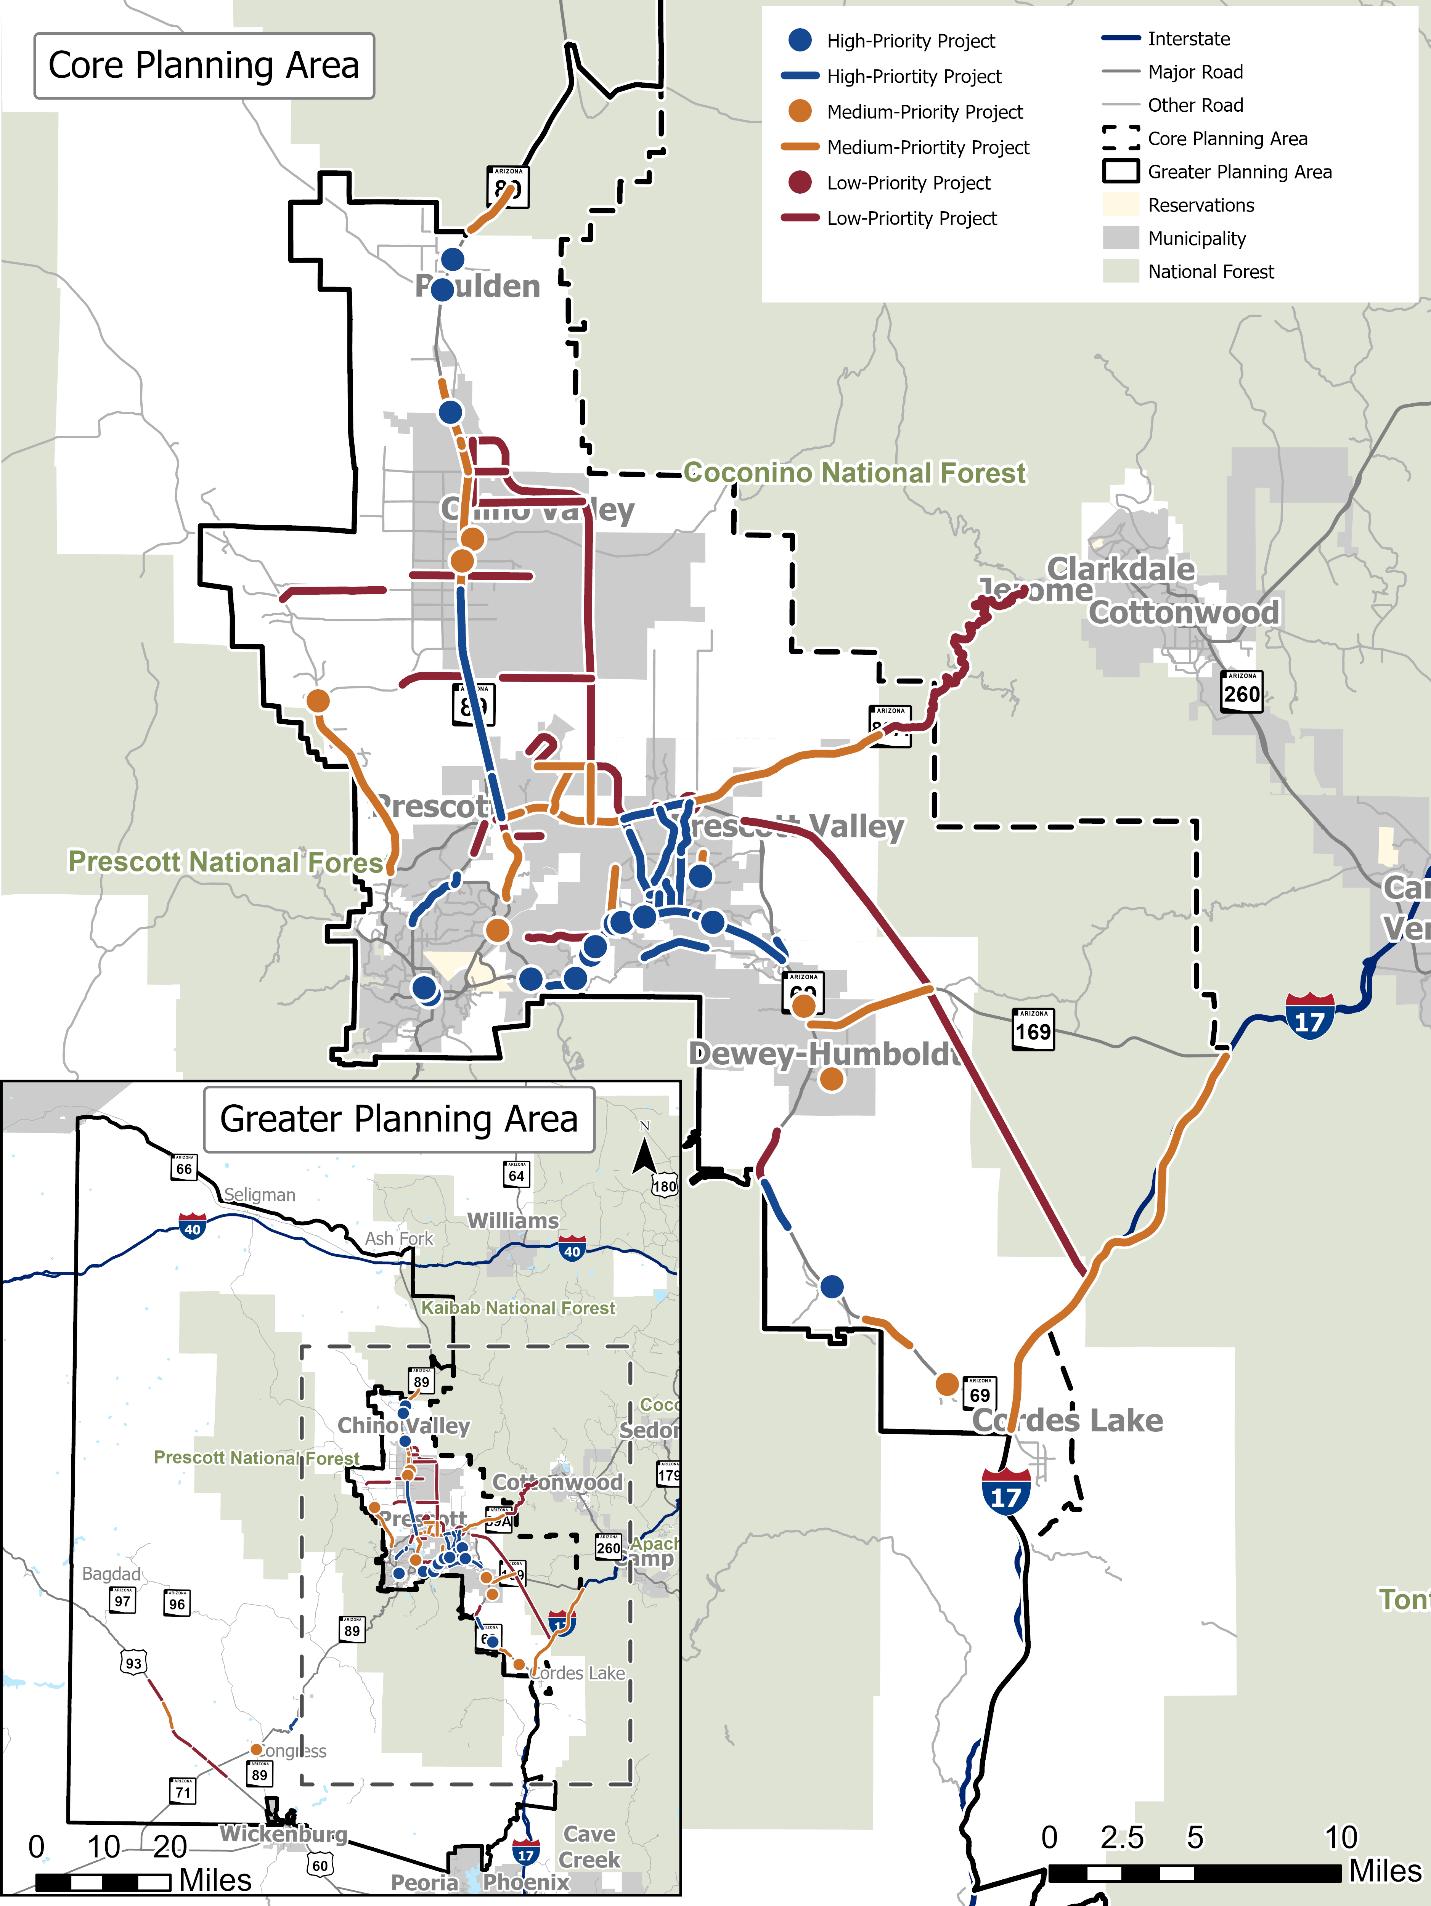
High-priority, short-term projects are shown in Table 11 in the order of their prioritization composite score and are shown graphically in Figure 42.
Medium-priority projects are shown in Table 12 in the order of their prioritization composite score and are shown graphically in Figure 43. Table 12. Medium-Priority Roadway Capital Projects
Low-priority projects are shown in Table 13 in the order of their project ID and are shown graphically in Figure 44 .
13.
Systemic improvement packages were developed for low-cost improvements throughout the region. Table 14 and Figure 45 shows the improvement packages and the associated projects in each.
S19
Active transportation recommendations were prioritized to quantify the magnitude of each project. Four key prioritization categories were identified and weights were assigned based on their overall contribution to the goals of the CYMPO ACT-UP:
Safety. Project addresses a location that has a history of pedestrianor bicycle-related crashes and provides a less stressful facility for users of all ages and abilities.
Access and Connectvity. Project fills a gap in the system and improves pedestrian and bicycle access to key destinations, such as schools, services, and recreation.
Community Livability. Project serves an underserved area with population groups that traditionally rely on nonmotorized transportation.
Implementation. Project has few physical constraints and is a modest investment
40 points
30 points
15 points
15 points
Recommendations were prioritized into three tiers, ‘Tier 1’ being key near-term recommendations. Tier 1 projects by type and jurisdiction are shown below and in Figure 46 and Figure 47 Appendix A shows all ACT-UP recommendations by tier.
Location
Mount Vernon Ave / Sheldon St
Description
Perform an engineering evaluation to determine the need and feasibility of upgrading the intersection to incorporate PHB, bike crossing treatments, high visibility crosswalks, or other crossing treatments to improve safety.
Willow St / Gurley St Upgrade intersection to include sidewalks and pedestrian crossing facilities
McCormick St / Goodwin St Perform an engineering evaluation to determine the need and feasibility of upgrading the intersection to incorporate bike crossing treatments, high visibility crosswalks, pedestrian lighting, or other crossing treatments to improve safety.
Willow Creek Rd / Whipple St
Granite St / Goodwin St
Perform an engineering evaluation to determine the need and feasibility of upgrading the intersection to incorporate a pedestrian overpass or underpass, bike detection, or other crossing treatments to improve safety.
Upgrade intersection to include sidewalks, curb extensions, and pedestrian crossing facilities
Cloudstone Dr / Rosser St
Ruth St / Sun St
Ruth St / Whipple St
Gateway Blvd / SR 69
Montezuma St / Navajo Dr
Overland Rd / SR 89
Heather Heights / SR 69
Upgrade intersection to include sidewalks and pedestrian crossing facilities
Perform an engineering evaluation to determine the need and feasibility of upgrading the intersection to incorporate signalization, bike crossing treatments, high visibility crosswalks, or other crossing treatments to improve safety.
Perform an engineering evaluation to determine the need and feasibility of upgrading the intersection to incorporate pedestrian and bicycle signalization, bike crossing treatments, high visibility crosswalks, or other crossing treatments to improve safety.
Conduct project assessment to identify and implement intersection safety improvements
Perform an engineering evaluation to determine the need and feasibility of upgrading the intersection to incorporate signalization, bike crossing treatments, high visibility crosswalks, or other crossing treatments to improve safety.
Evaluate the need and feasibility for pedestrian crossing facilities on Overland Road. Coordination with Yavapai County may be required.
Conduct project assessment to identify and implement intersection safety improvements
Location
Glassford Hill Rd / SR 69
Navajo Dr / Lakeshore Dr
Glassford Hills Rd / Long Look Dr
Hoffman Rd / Loos Dr
Katie Circle / Loos Dr
Robert Rd / Powers Ave
Description
Conduct project assessment to identify and implement intersection safety improvements
Perform an engineering evaluation to determine the need and feasibility of upgrading the intersection to incorporate RRFB, bike crossing treatments, high visibility crosswalks, or other crossing treatments to improve safety.
Upgrade intersection to include sidewalks and pedestrian crossing facilities
Perform an engineering evaluation to determine the need and feasibility of upgrading the intersection to incorporate RRFB, bike crossing treatments, high visibility crosswalks, or other crossing treatments to improve safety. Incorporate project into recent City crossing installation.
Upgrade intersection to include sidewalks and pedestrian crossing facilities into the school expansion.
Perform an engineering evaluation to determine the need and feasibility of upgrading the intersection to incorporate PHB, bike crossing treatments, high visibility crosswalks, or other crossing treatments to improve safety.
Katie Circle / Loos Dr
Lake Valley Rd / SR 69
Robert Rd / Loos Dr
Glassford Hill Rd / Florentine Rd
Navajo Dr / Valley Rd
Roundup Dr / Viewpoint Dr
Great Western Dr / Market St
Prescott E Hwy / SR 69
Viewpoint Dr / Addis Ave
Antelope Ln/Castle Dr
Location
Rd 1 W / Rd 3 N
SR 89 / Center St
SR 89 / Rd 2 N
Upgrade intersection to include sidewalks and pedestrian crossing facilities
Conduct project assessment to identify and implement intersection safety improvements
Upgrade intersection to include sidewalks and pedestrian crossing facilities
Upgrade intersection to include sidewalks and pedestrian crossing facilities
Upgrade intersection to include sidewalks and pedestrian crossing facilities
Perform an engineering evaluation to determine the need and feasibility of upgrading the intersection to incorporate PHB, bike crossing treatments, high visibility crosswalks, or other crossing treatments to improve safety.
Upgrade intersection to include sidewalks and pedestrian crossing facilities
Conduct project assessment to identify and implement intersection safety improvements
Upgrade intersection to include sidewalks and pedestrian crossing facilities
Evaluate the need to upgrade intersection to a RRFB with a high visibility crosswalk
Description
Upgrade intersection to include sidewalks and pedestrian crossing facilities
Perform an engineering evaluation to determine the need and feasibility of upgrading the intersection to incorporate bike crossing treatments, high visibility crosswalks, Leading Pedestrian Interval, or other crossing treatments to improve safety.
Perform an engineering evaluation to determine the need and feasibility of upgrading the intersection to incorporate bike crossing treatments, high visibility crosswalks, Leading Pedestrian Interval, or other crossing treatments to improve safety.
• Gurley St: Josephine St to Garden St
• Leroux St: Park Ave to Montezuma St
• Arizona Ave: Gurley St to 350 ft n/o Goodwin St
• Goodwin St: Penn Ave to Bradshaw Dr
• Willow St: Sheldon St to Gurley St
• Alarcon St: Goodwin St to Carleton St
• Rush St: 230 ft w/o Sheldon St to Gurley St
• Arizona Ave: Moeller St to Sheldon St
• Aubrey St: Granite St E to Montezuma St
• Navajo Dr: 3rd St to 6th St
• Moeller St: Mount Vernon Ave to Arizona Ave
• Iron Springs Rd: Starry Peaks Dr to Williamson Valley Rd
• Delano Ave: Demerse Ave to Campbell Ave
• Centerpointe East Dr: Side Rd to Granite Dells Pkwy
• Whitespar Rd: Copper Basin Rd to Granite St
• 2nd St: Hillside Ave to Navajo Dr
• Whetstine Ave: Gail Gardner Way to Ruth St
• Lake Valley Rd: Lakeshore Dr to SR 69
• Glassford Hill Rd: Main St to Veterans Way
• Lakeshore Dr: Glassford Hills Rd to Windsong Dr
• Frontage Rd: Yavapai Rd to Truwood Dr
• Frontage Rd: Prescott E Hwy to Glassford Hill Rd
• Loos Dr: Long Look Dr to Robert Rd
• Robert Rd: SR 69 to Frontage Rd
• Market ST: Crownpointe Dr to Sundog Ranch Rd
• Great Western Dr: Market St to SR 69
• Grizzly Bear Rd: Florentine Rd to Valley Rd
• Civic Dr: Windsong Dr to Skoog Blvd
• Viewpoint Dr: 830 ft s/o Spouse Dr to 165 ft n/o Long Look Dr
• Robert Rd: Roundup Dr to Tranquil Blvd
• Main St: SR 69 to Prescott St
• Main St: SR 69 to Third St
• Prescott East Highway: Antelope Ln to Frontage Road
Name Description
Whetstine Ave: Gail
Gardner Way to Demerse Ave
Marina St: Willis St to Leroux St
Rosser St: Willow Creek Rd to Campbell Ave
Whitespar Rd: Copper Basin Rd to Granite St
Goodwin St: Summit Ave to Bradshaw Dr
Gurley St: Park Avenue to Robinson Dr
Miller Valley Rd: Whipple St to Gurley St
Iron Springs Rd: Williamson Valley Rd to Miller Valley Rd
Montezuma St: Sheldon St to Carleton St
Montezuma St: Miller Valley Rd to Sheldon St
Designate as bike route. Evaluate need for traffic calming measures to create a bike boulevard. As demand increases, the need for a striped or buffered bike lane may be warranted.
Designate as bike route. Evaluate need for traffic calming measures to create a bike boulevard. As demand increases, the need for a striped or buffered bike lane may be warranted.
Install bike lanes and evaluate the need for traffic calming measures. If space allows, evaluate the potential for a multiuse path.
Extend bike lanes to create a complete and connected bike network
Evaluate feasibility for protected bike lanes or traffic calming measures to create a more comfortable cycling experience for users
Conduct a corridor assessment to evaluate the community desire and feasibility of reconfiguring the roadway to incorporate a buffered or protected bike facility.
Evaluate feasibility of reconfiguring the roadway to incorporate a protected bike facility.
Conduct a corridor assessment to evaluate the community desire and feasibility of reconfiguring the roadway to incorporate a buffered or protected bike facility.
Conduct a corridor assessment to evaluate the community desire and feasibility of reconfiguring the roadway to incorporate a buffered or bike facility.
Conduct a corridor assessment to evaluate the community desire and feasibility of reconfiguring the roadway to incorporate a buffered or protected bike facility.
Name Description
Long Mesa Dr:
Viewpoint Dr to Robert Rd
Manley Dr: Lone Cactus Dr to Ranger Rd
Spouse Dr: Glassford Hill Rd to Robert Rd
Designate as bike route. Evaluate need for traffic calming measures to create a bike boulevard.
Designate as bike route. Evaluate need for traffic calming measures to create a bike boulevard.
Designate as bike route. Evaluate need for traffic calming measures to create a bike boulevard.
Long Look Dr: Viewpoint Dr to Tonto Way
Lakeshore Dr: 250 ft
w/o Victor Dr to 500 ft n/o Warren Rd
Main St/Veterans Way:
Glassford Hill Rd to Lakeshore Dr
Main St: Veterans Way to Main St
Yavapai Rd: Florentine Rd to Frontage Rd
Eastridge Dr/Frontage Rd: Yavapai Rd to Truwood Dr
Prescott East Hwy: Antelope Ln to 2nd St
Glassford Hill Rd: Florentine Rd to 2nd St
Florentine Rd: 150 ft
e/o Grizzly Bear Dr to Mendecino Dr
2nd St: Prescott E Hwy to Lake Valley Rd
Yavapai Rd: Florentine Rd to Florentine Rd
Windsong Dr: Long Look Dr to SR 69
Bradshaw Mountain Rd: SR 69 to Villa St
Lakeshore Dr: Badger Rd to Fain Rd
Designate as bike route. Evaluate need for traffic calming measures to create a bike boulevard.
Evaluate need for bike lanes to create a complete and connected bike network
Designate as bike route. Evaluate need for traffic calming measures to create a bike boulevard.
Designate as bike route. Evaluate need for traffic calming measures to create a bike boulevard.
Designate as bike route to connect to SR 69 multi-use path. Evaluate need for traffic calming measures to create a bike boulevard.
Designate as bike route. Evaluate need for traffic calming measures to create a bike boulevard.
Evaluate need to install traffic calming measures to create a bike boulevard or to install designated bike lanes.
Evaluate feasibility for protected bike lanes or multi-use path to provide connectivity to key destinations.
Designate as bike route. Evaluate need for traffic calming measures to create a bike boulevard.
Designate as bike route. Evaluate need for traffic calming measures to create a bike boulevard.
Designate as bike route and evaluate the need for traffic calming measures to create a bike boulevard.
Evaluate feasibility of constructing a buffered or protected bike facility.
As demand increases, evaluate the need to upgrade on-street facilities to include a buffered bike lane.
Widen shoulders to provide space for recreational cyclists. If warranted, install multi-use path to increase safety and comfort for riders.
TOWN OF DEWEY-HUMBOLDT
Name
Main St: SR 69 to Third Street
Description
Designate as bike route. Evaluate need for traffic calming measures to create a bike boulevard.
UNINCORPORATED YAVAPAI COUNTY
Name
Copper Hill Dr: Great Western Dr to Starling Dr
Pioneer Pkwy: Williamson Valley Rd to SR 89
Description
Evaluate need to install traffic calming measures to create a bike boulevard or to install designated bike lanes.
Evaluate feasibility of widening shoulders or installing a DG or concrete multi-use path. Connectivity to the Pioneer Parkway Trailhead should be considered.
• Viewpoint Dr: Park View Dr to SR 89
• Robert Rd: Fain Rd to Powers Ave
• Viewpoint Dr: SR 89 to Acorn Cir
• Roundup Dr: Viewpoint Dr to Robert Rd
• Viewpoint Dr: 800 ft n/o Long Mesa Dr to 975 ft n/o Manley Dr
• Viewpoint Dr: Long Look Dr to Skoog Blvd
• Skoog Blvd: Lakeshore Dr to Lakeshore Dr
• Lone Cactus Dr: Spouse Dr to Long Look Dr
• Sunset Ln: Castle Dr to Pine View Dr
• Florentine Rd: Glassford Hill Rd to Mendecino Dr
• Starlight Dr: Sunset Ln to Frontage Rd
• Lake Valley Rd: Florentine Rd to 2nd St
• Robert Rd: Manley Dr to Frontage Rd (south)
• Navajo Dr: Lakeshore Dr to 150 ft n/o Navajo Ct
• Sundog Ranch Rd: Market St to Cracker Barrel Dwy
• Pronghorn Ranch Pkwy: West terminus to Antelope Meadows Dr
• Rd 1 E: Center St to 89
• Rd 1 E: Rd 3 N to Center St
• Rd 1 W: Rd 3 N to Center St
• Center Street: SR 89 to Rd 1 E
• Center St: Rd 1 W to SR 89
• SR 89: Southern Chino Valley Limits to SR 89/SR 69 Interchange
• SR 69: Yavapai Connector to Great Western Dr
• SR 89: Deep Well Rach Road/Willow Creek Road to 2000' north
Source: ACT-UP
Source: ACT-UP
Potential transit projects were prioritized in previous plans, by CYMPO staff, and by the public during round 2 of public engagement. The prioritized transit projects are shown in Table 15 and shown graphically in Figure 38
Table 15. Transit Projects by Priority
To support the advancement of its recommendations, Move 2050 outlines the region’s recommended investment choice, potential funding opportunities, and recommended project phasing. Move 2050 identifies high-priority projects as well as future planning opportunities, and potential partnerships to implement its recommendations.
CYMPO’s Recommended Investment Choice (RIC) establishes how the region plans to invest in its transportation system over the next 25 years. The identified RIC aims to provide CYMPO and its member agencies with flexibility in decision-making for the transportation system by identifying goals for funding preservation improvements, modernization projects, and expansion efforts.
• Preservation Projects that maintain existing transportation infrastructure by mitigating the deterioration of existing transportation facilities and elongating infrastructure’s service life.
• Modernization. Projects that improve congestion, functionality, or safety on the roadway network without adding additional capacity.
• Expansion. Projects that increase roadway capacity through development of new roadway facilities or additional infrastructure.
CYMPO identified its first RIC during the development of the 2045 Regional Transportation Plan. To ensure the region’s RIC is still appropriate for Move 2050’s implementation period, the CYMPO TAC and Executive Board reviewed the RIC during CYMPO’s annual Strategic Planning Retreat in April of 2025. Figure 48 shows the proposed Move 2050 RIC.
Transportation funding forecasts have been developed to identify how much federal funding is anticipated to be available for transportation capital projects through CYMPO. The transportation funding forecast is based on several recent CYMPO Metropolitan Transportation Improvement Programs (MTIPs). The MTIP is a document that includes all projects funded with transportation improvement sources over a 5 year period. The analysis was conducted using the 2022-2026 MTIP, 2020-2024 MTIP, and the 2019-2023 MTIP to get a long-term history of funding levels.
The transportation-specific funding levels from past MTIPs were extrapolated to forecast transportation revenues from the years 2026 (the first year after projects have already been programmed) through 2050 using two methods. The first method was to utilize an inflation calculation, by adding the 20-year United States inflation rate (2.3% annually). A second forecast was developed using the annual rate of change observed from the three most recent MTIPs. These two forecasts were averaged to develop an average transportation funding forecast. The average transportation funding projection is shown in Figure 49.
Figure 49. Local Funding Forecast
$2,580,069 $1,834,412
$1,529,297
To determine what projects can be funded in short-, mid-, and long-term horizons, the forecasted transportation funding has been grouped into three funding tiers as shown in Figure 48 .
Figure 50. Local Funding Forecast by Tier
$18,593,476 $23,340,864
$6,331,485
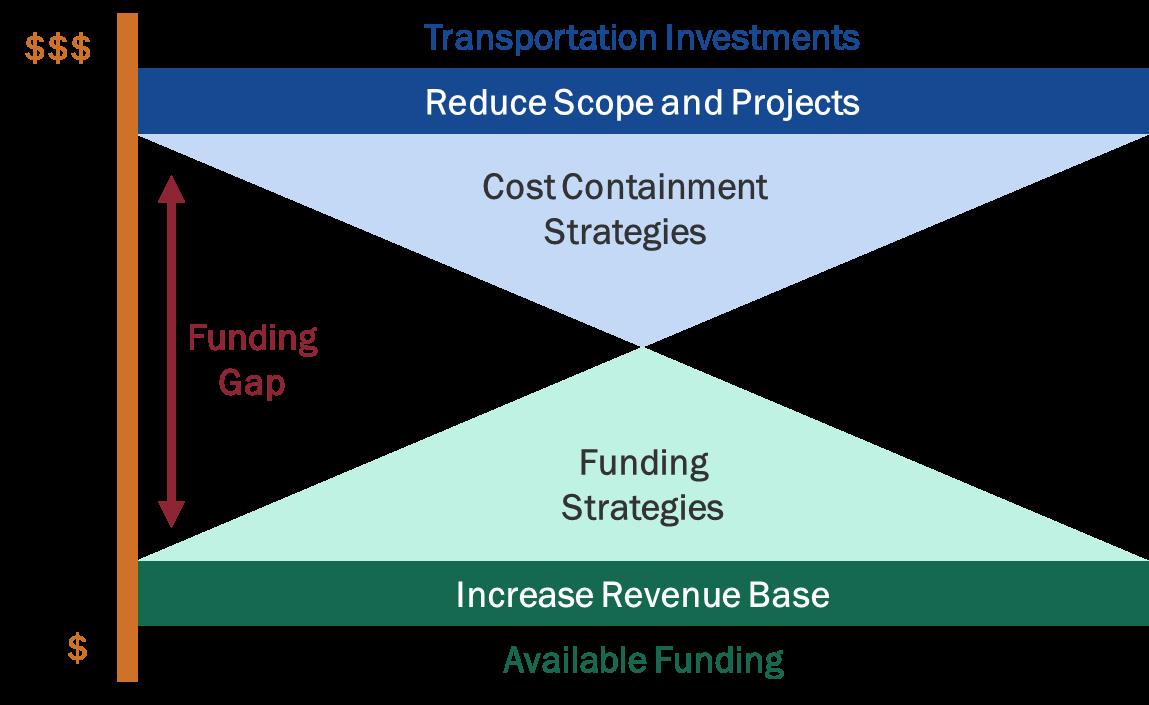
Due to limited funding available to CYMPO and its member agencies, there is a funding gap between the available funding for the region and the cost of the recommended transportation projects in Move 2050. A variety of strategies will be needed to leverage the limited regional funding to obtain additional funds through funding sources defined in the following subsections. If funding is not secured, the number of projects implemented, or the project scopes will need to be reduced. Figure 51 shows funding gap strategies for Move 2050.
Most federal and state grants require that a certain percentage of project funding is provided by the sponsoring local agency using non-federal or non-state funding sources. These funds typically come from local sources, including local sales taxes, property taxes, or other revenues raised at the local level. For some grants, other resources, such as inkind services or equipment, can count toward the local match.
Sponsoring agencies are required to enter formal funding agreements with the federal or state agency providing the grant funds where the local agency is required to identify sources and amounts of match funding or services to meet the required match percentage.
ADOT is the designated recipient of the Federal-Aid Highway funds used for planning and research purposes. ADOT receives Statewide Planning and Research funds (SPR) from FHWA and distributes them to local agencies to conduct transportation planning activities. Metropolitan Planning (PL) funds are apportioned to states based on population in urbanized areas and relative to the amount of highway construction funds the state receives. ADOT maintains multi-year contracts with local agencies to conduct transportation-related planning activities within their region. SPR funds are discretionary and are administered by the State to carry out specific technical activities. Within the CYMPO region, SPR funds are used to conduct transportation planning activities and administer the program. Annual funding opportunities from PL and SPR funds are $120,000 and $125,000, respectively.
Local Match: 20% (SPR), 5.7% (PL)
The Surface Transportation Block Grant (STBG) program is a federal-aid highway flexible funding program that funds a broad range of surface transportation capital improvements, including roads, transit, airport access, and active transportation facilities. Planning, research, and development activities are also eligible for the use within specifically defined project types. CYMPO receives approximately $650,000 in STBG funds annually, making up the primary regularly distributed funding source directly to CYMPO and can be used for project scoping, design, or construction.
The Off-System Bridge (OSB) Program is a special set-aside of STBG funds. The set-aside of a share of each state’s STBG apportionment for use on bridges not on the Federal-aid highway system. The amount is to be not less than 15% of the State’s FY 2009 Highway Bridge Program apportionment. The purpose of the OSB Program is to fund the design or construction for replacement of rehabilitation of roadway bridges over waterways, other topographical barriers, other roadways, railroads, canals, ferry landings, etc. on bridges that are not on the federal-aid highway system when those bridges have been determined deficient because of structural deficiencies, physical deterioration, or functional obsolescence.
Section 5305(d) transit funds may be used for planning and technical studies related to regional transportation planning in the CYMPO region, typically for transit-related activities. Funds are allocated from the Federal Transit Administration (FTA), through ADOT, to CYMPO. FTA funds lag one federal fiscal year before becoming available to the regional planning agency and transit provider. If this innovative funding practice proves to be cost effective, it
will continue as a Consolidated Planning Grant into future funding years. CYMPO receives an estimated $55,000 in 5305(d) funding annually.
Local Match: 20%
The Highway Safety Improvement Program (HSIP) is a core federal-aid program with the purpose of achieving a significant reduction in traffic facilities and serious injuries on all public roads, including non-state-owned roads and roads on tribal land. The HSIP requires a datadriven, strategic approach to improving highway safety on all public roads with a focus on performance. CYMPO may compete for HSIP funding through a statewide HSIP call for projects administered by ADOT. Most safety projects are eligible for 100% funding with no local match; however, the awarded jurisdiction must provide in-kind or third-party project management and support for applicable projects to be completed. All awarded systemic project applications are limited to a total annual awarded amount of no more than 20% of all available funds. HSIP funding is distributed by ADOT. For Fiscal Year 2023, $40 million dollars were made available for distribution.
Local Match: 0%
The Highway User Revenue Fund (HURF) Exchange Program was created by the Arizona Legislature in 1997 and authorizes ADOT to provide State Highway Funds to eligible entities in exchange for federal STBG funds. This process enables eligible cities, towns, and counties to potentially build projects faster and cheaper by allowing the local jurisdiction to use their own local processes and expertise to provide cost-effective project design and construction phases. Eligible projects are those with the primary purpose of improving the efficiency and safety of motor vehicles. Projects must be on the federal aid system (major collectors and above) and be eligible for STBG funding. Local agencies may provide additional funds to these projects and are responsible for any costs that exceed the approved HURF exchange funding.
Local Match: 0% (requires local agency to provide in-kind project management)
Annually, the Arizona legislature, and subsequently the Arizona Governor, have the discretion to allocate surplus state funding toward a variety of different State department funds and/or specific projects. Historically, a portion of these funds have been allocated toward specific transportation projects across the state. Considering the limited statewide expansion funding mechanism, these directly-allocated funds provide an opportunity for large-budget funding opportunities.
On the August 25, 2015, City of Prescott voters approved an increase to the existing September 1, 2009-approved three-quarters percent transaction privilege tax to a full percent transaction privilege tax (sales tax) dedicated to streets and roads for 20 years beginning January 1, 2016. The entirety of this tax’s proceeds is dedicated toward planning, design, right-of-way acquisition and improvements and other costs associated with the construction, rehabilitation and maintenance of City streets, highways, alleys and roadways; including but not limited to curbs, gutters, drainage, bridges, sidewalks, shoulders and medians. The accumulation of such tax proceeds to be in accordance with Article IX, Section 20 of the Arizona State Constitution.
In June 2002 the Town of Prescott Valley formally dedicated one-third percent of the Town’s total 2.83% transition privilege tax (sales tax) toward funding capital improvements to major arterial routes within the Town. This funding mechanism is dedicated specifically for use on major street improvements for Robert Road, Navajo Drive, Lakeshore Drive and Viewpoint Drive only and cannot be used for additional transportation maintenance and/or improvements outside of that qualification.
Additionally, on January 1, 2016, one-half percent of the Town’s transition privilege tax became primarily allocated to street maintenance and public safety. While this funding is not explicitly dedicated, the existing budget allows for these funds to be used for additional construction and maintenance investments to the Town’s roadway network.
Yavapai County utilizes a portion of the county-wide half-cent sales tax for roadway improvements to regional roads across the entirety of Yavapai County, within the CYMPO region and otherwise. While this funding is not explicitly dedicated, the existing budget allows for these funds to be used for additional transportation construction and maintenance investments into the County’s vast roadway network.
Arizona’s enabling legislation for development fees (ARS § 9-463.05) calls for three integrated products: 1) Land Use Assumptions (LUA) for at least 10 years, 2) Infrastructure Improvements Plan (IIP), and 3) Development Impact Fees (DIF). Development fees are onetime payments used to construct system improvements needed to accommodate new development. The fees represent future development’s proportionate share of infrastructure capacity. Development fees may only be used for capital improvements or debt service for growth-related infrastructure. In contrast to general taxes, development fees may not be used for operations, maintenance, replacement or correcting existing deficiencies.
• The Town of Prescott Valley maintains an Impact Fee Fund, funded by the impact fees collected by the Town upon building permit issuance. In contrast to project-level improvements, development fees fund growth-related infrastructure that will benefit
multiple development projects, or the entire jurisdiction (usually referred to as system improvements).
• The City of Prescott similarly collects impact fees from private developers that are used to offset costs associated with city infrastructure investments required to support respective developments. Impact fees are determined based on type of development as well as size and can extend across various investments categories, including streets.
In addition to existing funding sources that CYMPO and its member agencies already or can leverage, there are several alternative funding sources available to pursue. Due to the limited funding available for large infrastructure projects, particularly roadway widening and new roadways, identification of alternative funding is increasingly important to be able to fund investments for existing and emerging needs. The opportunities summarized below are eligible to CYMPO’s member agencies to pursue to aid in funding larger infrastructure improvements.
The USDOT administers the BUILD Grant program, which allows local governments to compete for discretionary funds for transportation infrastructure projects. In FY 2025, there is $1.5 billion available in BUILD funding. The focus of the BUILD grant is to stimulate job creation and spur economic growth in local economies. These projects will have a local and or regional impact and improve transportation infrastructure. In the past, the lowest amount that was awarded through this program was $160,000 while the maximum award is $25 million.
The INFRA Grant, also known as the Nationally Significant Multimodal Freight & Highway Projects Program, a subset of the Multimodal Project Discretionary Grant (MPDG), awards competitive grants for multimodal, freight, and highway projects of national or regional significance to improve the safety, efficiency, and reliability of the movement of freight and people in and across rural and urban areas. The minimum grant size is $5 million for small projects (total project cost of under $100 million) and $25 million for large projects.
The SMART program was established to provide grants to eligible public-sector agencies to conduct demonstration projects focused on advanced smart community technologies and systems to improve transportation efficiency and safety. SMART is a two-stage program. Stage 1 (funds up to $2 million) grants are open for any eligible entity to apply. Recipients of Stage 1 grants are eligible to expand their projects through Stage 2 grants (up to $15 million). The SMART program is currently funded at $100 million per year.
Local Match: 0%
The SS4A grant program aims to provide funding through a competitive selection process. This funding is intended to support various initiatives related to planning, infrastructure, behavior, and operations. The goal is to prevent fatalities and serious injuries on roads and streets, involving all types of road users including pedestrians, bicyclists, public transportation users, personal conveyance and micromobility users, motorists, and commercial vehicle operators. The funds available for implementation grants provides a minimum award of $2,500,000 and a maximum award of $25,000,000. Jurisdictions must already have an SS4A-compliant Safety Action Plan in place to apply for implementation funds. The SS4A program is scheduled to sunset in 2026 with the final year of the IIJA unless it is reauthorized in the next federal transportation authorization.
Local Match: 20%
When project funding is partially or fully funded by state or federal grant funding, there is a process that sponsor jurisdictions must go through to obtain and administer the funding through the construction phase as shown in Figure 52
Figure 52 Grant Funding Process
• Project is awarded funding by state or federal agency
• Sponsor agency enters into formal funding agreement with state or federal agency
• Local match funding identified and committed
• 100% project design
• Funding obligation for construction
• Project construction
• Ongoing administration and reporting per grant requirements
• Project incorporated into sponsor agencies maintenance program
• Ongoing preventative maintenance to maintain project in acceptable condition
To implement high-priority recommendations from Move 2050, CYMPO and its member agencies must have an implementation plan for each project. There are many steps between identifying a high-priority project in Move 2050 and its implementation. For most projects, additional study is needed to develop a cost estimate accurate enough to apply for grant funding or negotiate with partnering jurisdictions. Figure 53 shows the steps between identified projects in Move 2050 and construction.
Figure 53. High-Priority Project Implementation Process
Project partnerships are key to successfully implementing Move 2050 recommendations. As the MPO, CYMPO relies on the support of its member agencies to commit to the implementation of the recommendations of Move 2050. CYMPO should leverage its relationship with ADOT and its member agencies to identify funding for project implementation.
After adoption of Move 2050, the following studies are recommended to further plan for the needs of the region’s transportation system:
Yavapai Regional Transit Short-Range Transit Plan
•To support CYMPO's growing transit system, the agency should develop a shortrange transit plan that develops an implementation plan for the next five years as well as identifies a comprehensive long-range vision for regional transit.
Great Western Alignment Study
•To support the Great Western Corridor Feasibility Study and Move 2050 project recommendations, CYMPO should complete a corridor alignment study for the Great Western Corridor from south of SR 89A to the north side of Chino Valley.
Continued Conservation Planning
•CYMPO prioritizes environmental quality and conservation throughout the region. To further support these goals, the MPO should pursue additional conversation studies.
CYMPO’s build-out transportation network, as recommended by Move 2050, will improve travel throughout the region. The regional build-out network, represented in Figure 54, shows new roadway connections and roadway widenings anticipated in 2050.
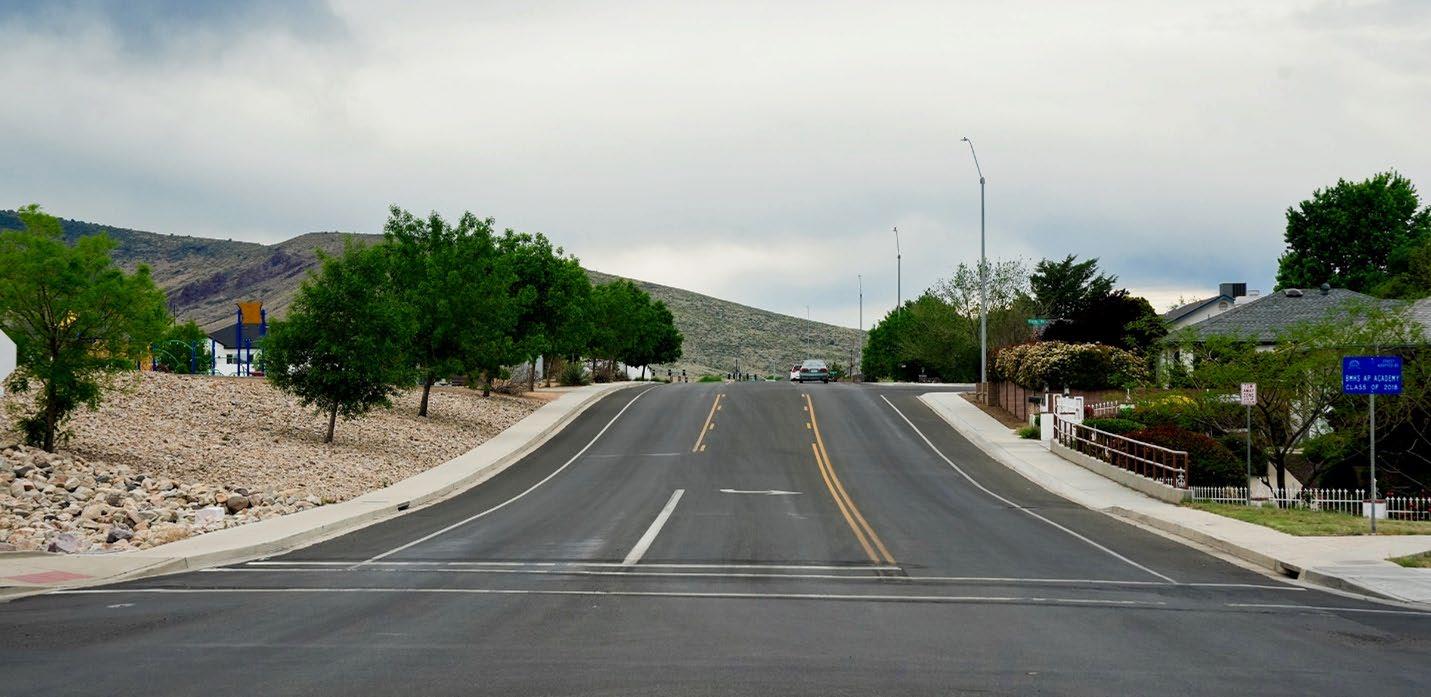
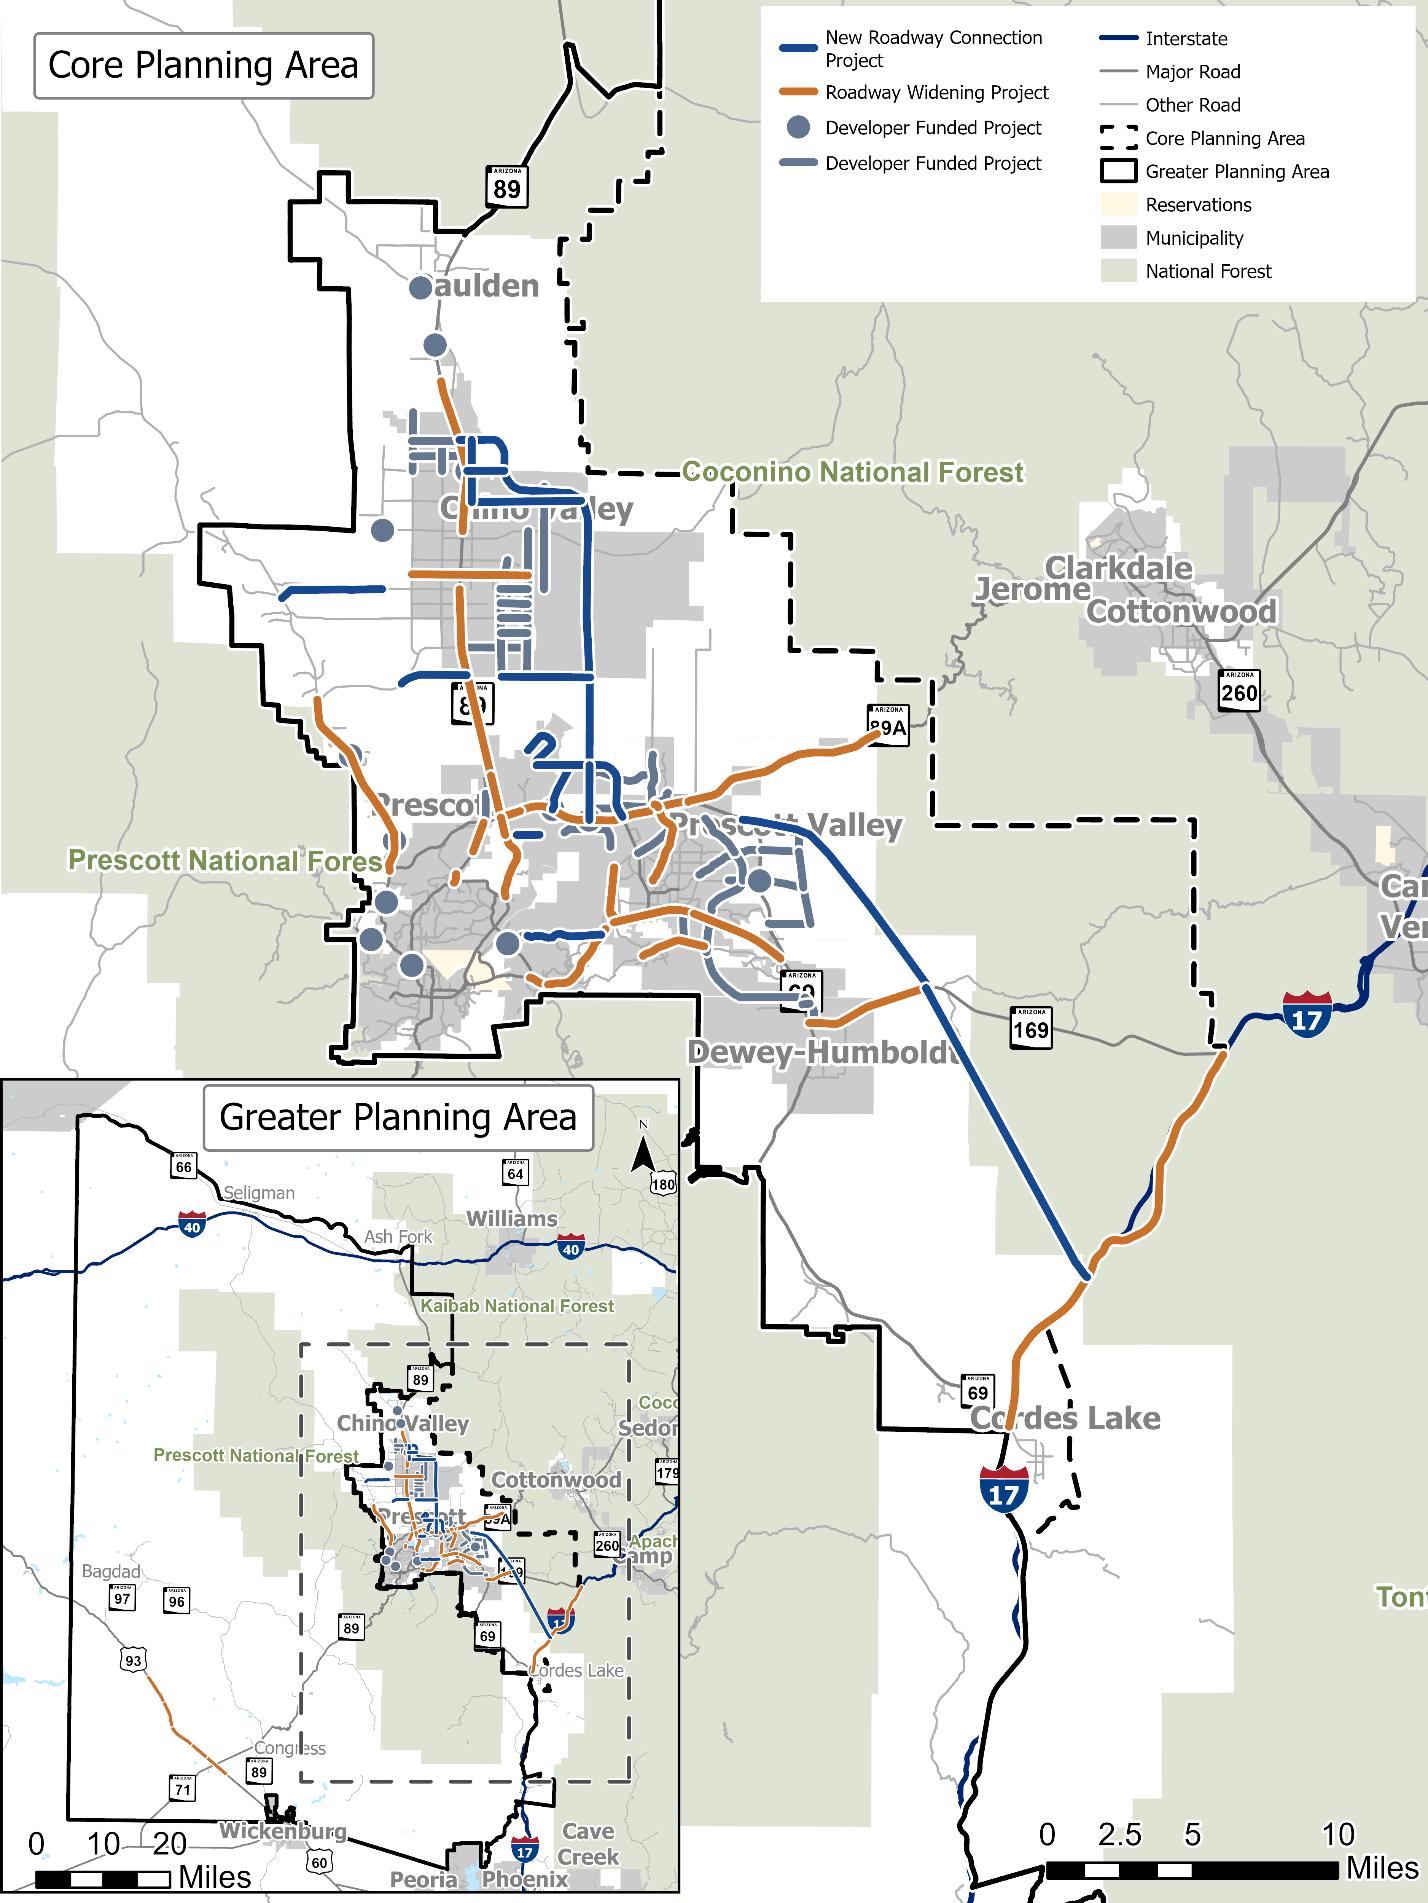
A summary of all performance measures and targets adopted by CYMPO is provided below. The metrics shown should be updated annually with the latest available data on a regular basis to create a more adaptive management plan and to be able to quickly react to changes in trends. Easily obtainable data for the MPO, such as crashes obtained from ADOT or transit asset conditions, should be updated annually. Datasets that do not get updated as regularly, such as pavement, and bridge conditions, should be updated at least once every five years to support future LRTP updates.
SAFETY TARGET FOR 2025: established annually – targets are based on a 5 year rolling
Performance Measure CYMPO Status
Number of Fatalities
Rate of Fatalities/100 Million Vehicle
Miles Travelled
Number of Serious Injuries
Rate of Serious Injuries/100 Million
Vehicle Miles Traveled
Number of Non-motorized Fatalities and Serious Injuries
BRIDGE AND PAVEMENT TARGETS FOR 2025:
2050 Investments Contributing to Target
CYMPO and its member agencies will advocate for safety improvement projects recommended in Move 2050 as well as additional existing and future safety plans such as the Regional Strategic Transportation Safety Plan, Prescott Valley Safety Action Plan, and SS4A funding obtained by the City of Prescott and CYMPO to continue to reduce serious injury and fatal crashes in the region.
Performance Measure
Percent of NHS Bridges classified in Good
Condition Based on Deck Area
Percent of NHS Bridges Classified in Poor Condition Based on Deck Area
Percent of Interstate Pavements in Good Condition
Percent of Interstate Pavements in Poor Condition
Percent of Non-Interstate NHS Pavements in Good Condition
SYSTEM PERFORMANCE TARGETS FOR 2025
Performance Measure
Freight Reliability on the Interstate (Truck Travel Time Reliability Index, where a value of 1.0 is reliable and a value over 1.35 as unreliable)
Percent of Person-Miles That Have Reliable Travel Times on the Interstate
Percent of Person-Miles That Have Reliable Travel Times on the Non-Interstate NHS
2050 Investments Contributing to Target
CYMPO and its member agencies will continue to ensure bridge and pavement condition is maintained throughout the region, including through the implementation of bridge projects recommended in Move 2050.
CYMPO Status Move 2050 Investments Contributing to Target
Move 2050 recommendations include projects that aim to reduce congestion on roadways in 2050 forecasted traffic conditions. Implementation of the plan’s capital roadway projects will ensure system performance targets continue to be maintained.
Appendix A. ACT-UP Recommendations is shown on the pages below.