RED DANISH INVESTMENT ATLAS 2024
PUBLISHED BY IN COLLABORATION WITH
ENGLISH EDITION
HOTEL RETAIL OFFICE LOGISTICS RESIDENTIAL ANNUAL REVIEW
COPENHAGEN 12.5 BN DKK 29% COPENHAGEN 8.8 BN DKK 20% 6.8 BN DKK 16% OTHER ZEALAND 2.1 BN DKK 5% FUNEN GREATER COPENHAGEN Danish 66% Foreign 34% Danish 58% Foreign 42% Danish 83% Foreign 17% Danish 88% Foreign 12% 12.5 BN DKK 29% COPENHAGEN 8.8 BN DKK 20% 6.8 BN DKK 16% OTHER ZEALAND 2.1 BN DKK 5% FUNEN 43.4 VOLUME IN TOTAL GREATER COPENHAGEN Danish 66% Foreign 34% Danish 58% Foreign 42% Danish 83% Foreign 17% Danish 88% Foreign 12% BN DKK 100% 12.5 BN DKK 29% COPENHAGEN 8.8 BN DKK 20% 6.8 BN DKK 16% OTHER ZEALAND 2.1 BN DKK 5% FUNEN GREATER COPENHAGEN Danish 66% Foreign 34% Danish 58% Foreign 42% Danish 83% Foreign 17% Danish 88% Foreign 12% 12.5 BN DKK 29% COPENHAGEN 8.8 BN DKK 20% 6.8 BN DKK 16% OTHER ZEALAND 2.1 BN DKK 5% FUNEN 1.7 BN DKK 4% AARHUS AALBORG 43.4 VOLUME IN TOTAL GREATER COPENHAGEN Danish 66% Foreign 34% Danish 74% Foreign Danish 58% Foreign 42% Danish 83% Foreign 17% Danish 88% Foreign 12% Danish 88% Foreign 12% BN DKK 100% 12.5 BN DKK 29% COPENHAGEN 8.8 BN DKK 20% 6.8 BN DKK 16% OTHER ZEALAND 2.1 BN DKK 5% FUNEN 1.7 BN DKK 4% AARHUS 0.8 BN DKK 2% AALBORG 43.4 VOLUME IN TOTAL GREATER COPENHAGEN Danish 66% Foreign 34% Danish 74% Foreign 26% Danish 58% Foreign 42% Danish 83% Foreign 17% Danish 88% Foreign 12% Danish 88% Foreign 12% Danish 93% Foreign 7% BN DKK 100% 8.8 BN DKK 20% 6.8 BN DKK 16% OTHER ZEALAND 2.1 BN DKK 5% FUNEN 1.7 BN DKK 4% AARHUS 0.8 BN DKK 2% AALBORG 10.6 BN DKK 24% OTHER JUTLAND GREATER COPENHAGEN Danish 58% Foreign 42% Danish 83% Foreign 17% Danish 88% Foreign 12% Danish 88% Foreign 12% Danish 93% Foreign 7% Danish 85% Foreign 15% 1.7 BN DKK 4% AARHUS 0.8 BN DKK 2% AALBORG 10.6 BN DKK 24% OTHER JUTLAND Danish 88% Foreign 12% Danish 93% Foreign 7% Danish 85% Foreign 15% 8.8 BN DKK 20% 6.8 BN DKK 16% OTHER ZEALAND 2.1 BN DKK 5% FUNEN 1.7 BN DKK 4% AARHUS 0.8 BN DKK 2% AALBORG 10.6 BN DKK 24% OTHER JUTLAND GREATER COPENHAGEN Danish 58% Foreign 42% Danish 83% Foreign 17% Danish 88% Foreign 12% Danish 88% Foreign 12% Danish 93% Foreign 7% Danish 85% Foreign 15% Source: ReData
& INVESTORS 2023
VOLUME
INTRODUCTION
Dear reader,
Welcome to ”RED Danish Investment Atlas 2024”.
The past year became a year where the real estate market faced a new reality. After several years with attractive conditions for real estate investments, the players had to navigate under new turbulent circumstances in 2023. Despite continuing strong underlying conditions in the occupier market, substantial interest rate increases and uncertainties about the future brought the investment market to a standstill.
However, the year ended with low inflation, several interest rate cuts, several large transactions, and a general increasing optimism among the industry’s players.
On the following pages, you can get a detailed insight into the Danish commercial real estate market in the past year, as well as RED’s forecast on how we expect the market to develop in the coming year.
The report is structured as an easily accessible reference work, where you can either get a quick overview of a single segment or immerse yourself in all the tendencies segment by segment.
The data for this year’s report is made in collaboration with ReData, which collects and validates data on every single transaction on the Danish real estate market.
Enjoy the report.
Nicholas Thurø, Managing Partner Cushman & Wakefield | RED

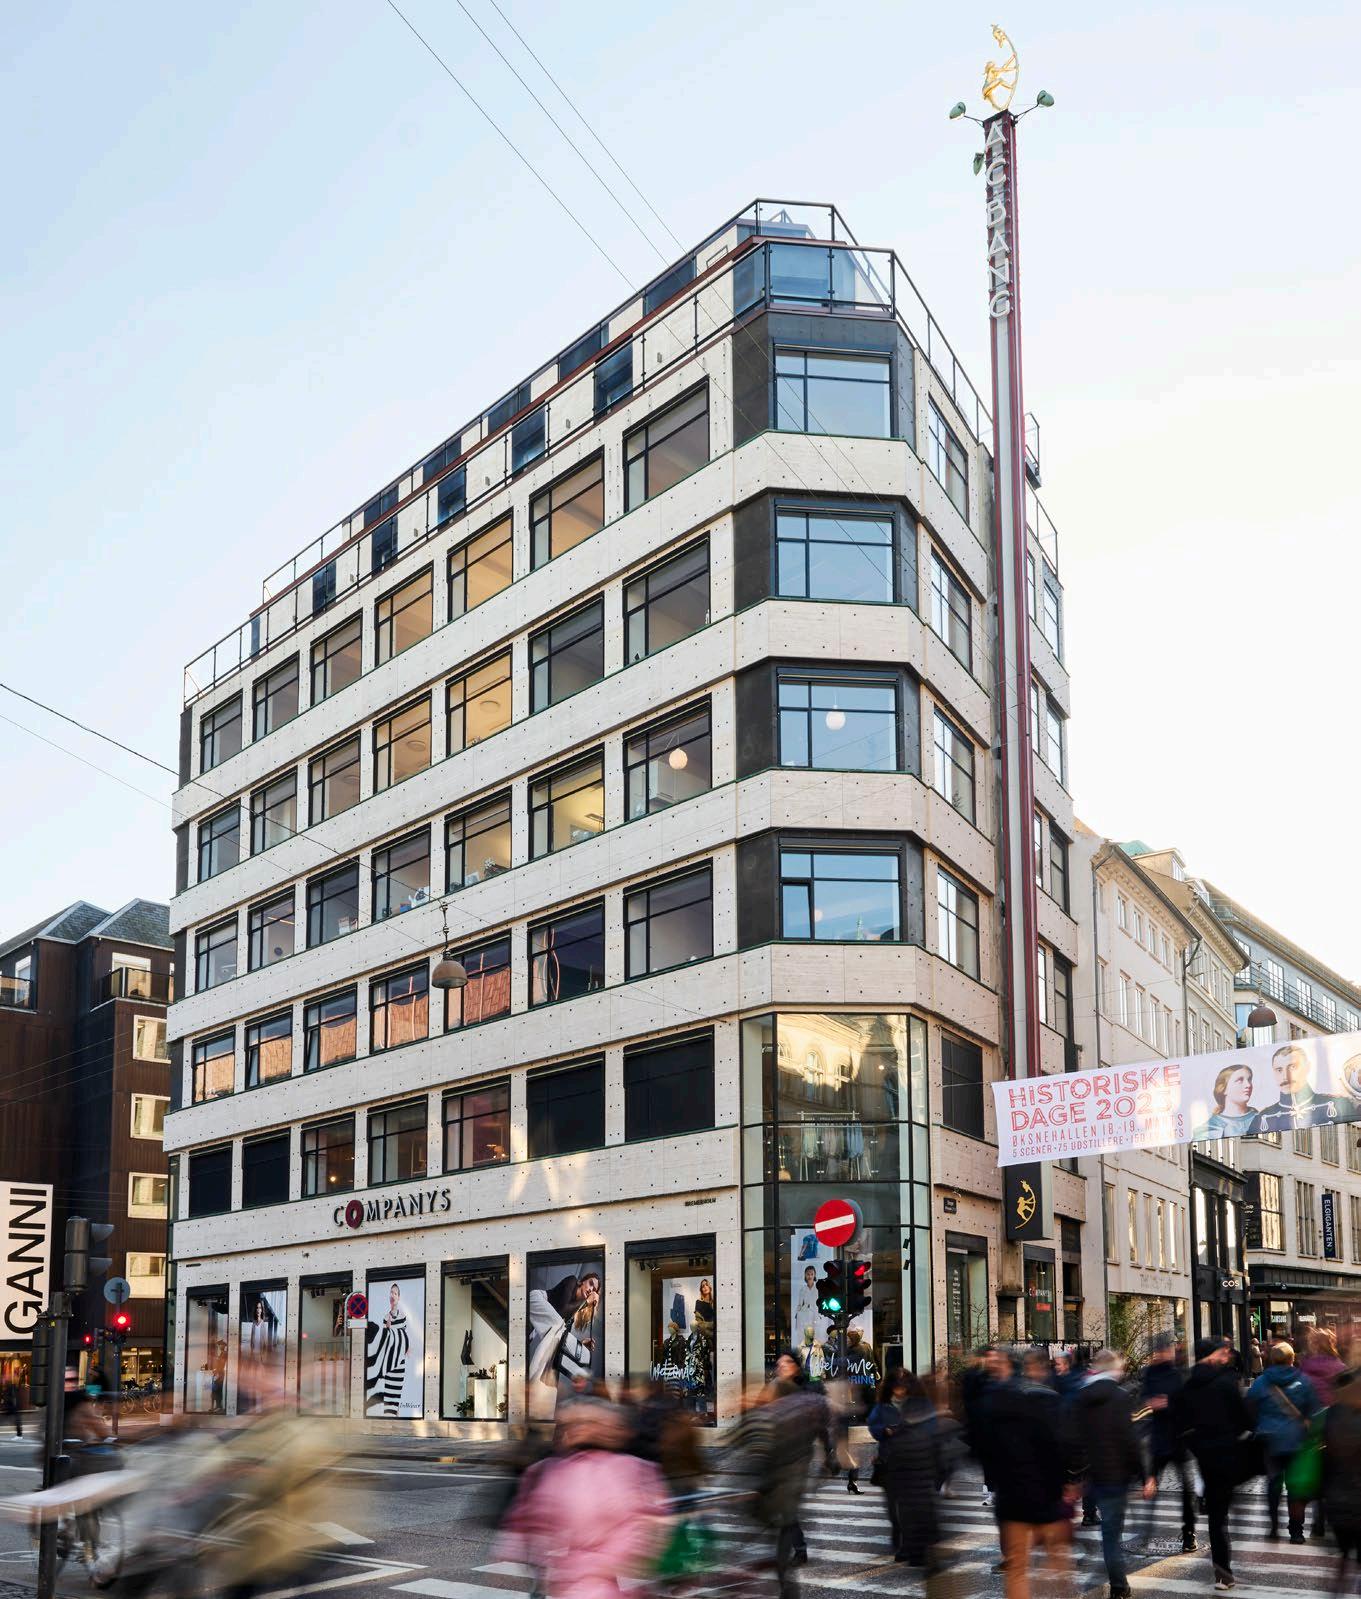
RED assisted ATP Ejendomme with the letting of 1,205 m² of offices in the architect designed property at Nicolai Eigtveds Gade 28 in Copenhagen.
| 3
HOTEL RETAIL OFFICE LOGISTICS RESIDENTIAL ANNUAL REVIEW
EXECUTIVE SUMMARY
A PARALYSED INVESTMENT MARKET
2023 was a year in which the new high interest rates paralysed all parts of the investment market. Despite strong underlying conditions on the occupier markets, buyers and sellers could not meet each other’s price expectations. Regardless of investor types, segments, and geographical areas, we saw a slowdown in the investment activity. Therefore, the total transaction volume only reached DKK 43.4 bn, and the volume was thus more than halved from 2022 to 2023.
FOREIGN CAPITAL ON RETREAT
In recent years, the Danish market has been characterised by an increasing degree of professionalism, which can largely be attributed to the fact that foreign capital has been behind a significant share of the investment activity. However, foreign investors have been characterised by leveraging their investments, and they were, therefore, particularly challenged by the new high interest rates. Consequently, foreign investors only accounted for 26% of the total volume in 2023, which is the lowest share in nine years.
THE MARKET’S DARLING CONTINUES ITS DOMINANCE
Despite the fact that demand for rental housing was intensified by a skyrocketing housing burden for owner-occupied homes, the transaction volume in the residential segment decreased by almost 60%. However, the segment was still the investors’ most preferred segment, and with a transaction volume of DKK 16.8 bn the residential segment maintained its position as the largest segment. The activity was primarily driven by the fact that the foreign investors acquired prime residential properties in Copenhagen, while the Danish investors, in search of returns, invested more broadly in the country.
THE HUNT FOR YIELD DEFINED THE LOGISTICS MARKET
A search for returns characterised the logistics segment in 2023, but this search resulted in two opposing trends. For many years, the segment for modern logistics properties has benefited from offering higher yields than our neighbouring countries. However, in 2023, this advantage
disappeared as we did not experience the same price corrections as seen in other comparable countries. Consequently, the investors allocated their capital to other markets with higher yields. One asset type that did, however, become particularly attractive in Denmark was value-add logistics properties. This was due to the fact that investments in these properties could still be leveraged and that investors have great confidence in the future leasing terms.
Despite the absence of investments in prime logistics properties (and that it was, therefore, investments in the cheaper value-add properties that were to drive the activity), the logistics segment took the position as the second-largest real estate segment for the first time, with a volume of DKK 8.9 bn.
THE OFFICE MARKET WAS UNDER PRESSURE FROM SEVERAL FRONTS
With a transaction volume of only DKK 8.6 bn, the office segment had to see itself defeated in the battle for the place as the second-largest segment in Denmark for the second year in a row. This can be attributed to the fact that the office market (in addition to the general conditions that challenged the real estate market) was also challenged by international concerns that an increasing share of remote work would result in a fundamentally changed office market with increasing vacancy rates and decreasing rent levels. As a result, many investors sought to reduce their exposure in the office segment, which resulted in foreign investors accounting for only 2% of the capital invested in the segment.
NOTHING COULD SAVE THE RETAIL SEGMENT, BUT WHY NOT?
Even though the retail segment includes widely different asset types, each with its unique appeal to investors, the investor appetite for retail assets remained limited, and in contrast to 2022, there were no portfolio or standalone transactions in the billion-kroner range to boost the volume. Therefore, investments in retail properties decreased by 74%, and the segment thus became the segment that experienced the largest decrease in volume from 2022 to 2023.
However, several factors indicate that retail assets may once again become interesting in the search for attractive risk-adjusted returns. For instance, the yield levels for high street properties located in Copenhagen are more or less on par with those for logistics properties and hotel properties, where there has traditionally been a significant risk premium differentiating the yields.
THE HOTEL SEGMENT MIGHT BE THE NEW BIG THING
Historically, investment activity in the hotel segment has been characterised by large standalone transactions, and 2023 was no exception. The volume in the hotel segment reached DKK 1.2 bn, which was primarily driven by NREP’s acquisition of Comfort Hotel Vesterbro. However, the hotel market in Copenhagen has shown positive trends, with high occupancy rates and increasing room prices. Several factors, therefore, indicate that there may be potential for generating attractive returns in the segment going forward.
RECORD-HIGH VOLUMES BELONG TO THE PAST
The year ended with increasing optimism, which was driven by a belief in interest rate reductions, continued strong underlying conditions on the occupier markets and a general confidence in the Danish market. As buyers’ and sellers’ price expectations are approaching each other and the interest rate stabilises, we expect to see increasing activity on the real estate market once again.
However, we do not expect to see the same high volumes in 2024 as we have been used to in recent years. This is, among others, due to the fact that the leveraged returns on real estate investments will be significantly lower than before. At the same time, attractive and more liquid assets, such as bonds, will continue to give investors an attractive risk-adjusted return, thereby reducing the appetite for real estate investments.
4 | RED Danish Investment Atlas 2024
Investment highlights
| 5 BN DKK RESIDENTIAL VOLUME IN TOTAL 16.8 BN DKK LOGISTICS VOLUME IN TOTAL 8.9 8.6 BN DKK OFFICE VOLUME IN TOTAL BN DKK RETAIL VOLUME IN TOTAL 4.9 BN DKK HOTEL VOLUME IN TOTAL 1.2 Foreign34% Foreign44% Foreign22% Danish66% Danish56% Danish98% Danish78% Danish94% RESIDENTIAL RETAIL OFFICE HOTEL LOGISTICS
2023 Northern Horizon Capital became the largest residential investor with their acquisition of NREP’s care home portfolio 1.5 Investment highlights 2023 IKEA became the largest logistics investor with their acquisition of their logistics centre in Hedehusene 1.8 Investment highlights 2023 Swiss Life became the largest retail investor with their acquisition of the shopping centre Næstved Storcenter 840
2023 AP Pension became the largest office investor with their acquisition of Codanhus and Kalvebod Bygge 32 2.5 Investment highlights 2023 NREP became the largest hotel investor with their acquisition of the Comfort Hotel Vesterbro 700 Area Volume Change Copenhagen 6.1 -55% Greater Copenhagen 1.6 -77% Aarhus 0.9 -86% Rest of Denmark 8.2 -41% Total 16.8 -59% Area Volume Change Copenhagen 4.9 -29% Greater Copenhagen 1.7 -12% Aarhus 0.3 -45% Rest of Denmark 1.8 -63% Total 8.6 -39% Area Volume Change Copenhagen 0.5 -90% Greater Copenhagen 0.5 -82% Aarhus 0.2 -86% Rest of Denmark 3.7 -61% Total 4.9 -74% Area Volume Change Copenhagen 0.8 -33% Greater Copenhagen - -100% Aarhus - -100% Rest of Denmark 0.5 97% Total 1.2 -21% Outlook 2024 Prime rent Prime yield Transaction volume Outlook 2024 Prime rent Prime yield Transaction volume Outlook 2024 Prime rent Prime yield Transaction volume Outlook 2024 Prime rent Prime yield Transaction volume Outlook 2024 Prime rent Prime yield Transaction volume BN DKK BN DKK BN DKK M DKK M DKK Area Volume Change Copenhagen 0.1 -71% Greater Copenhagen 4.5 72% Aarhus 0.2 -63% Rest of Denmark 4.1 -60% Total 8.9 -35% HOTEL RETAIL OFFICE LOGISTICS RESIDENTIAL ANNUAL REVIEW
Investment highlights
THE YEAR IN REVIEW
2023 was a year where numerous factors made it more challenging for players in the real estate market to make decisions. Was it the right time to invest when there was no evidence that prices had stopped decreasing? Could future expectations justify acquisitions when getting financing and yield levels to match in the current market was difficult? Should tenants choose to move to a new office when the future was and still is uncertain?
These were just some of the dilemmas that defined the market in 2023, which will be explored in the following.

THE SELLERS DEFINED THE MARKET
Across the globe, significant interest rate hikes meant that players in the real estate market had to operate in a new reality in 2023, where real estate financing became more expensive and challenging, and other more liquid assets suddenly became attractive alternatives. Although there were still buyers in the market, general low leverage and strong underlying conditions in the occupier markets meant that sellers were not forced to sell and that it became more attractive to keep the properties rather than sell at prices that were lower than in the good old days. The sellers’ slow adjustment pace thus put a brake on the activity in 2023.
However, prospects of interest rate reductions and continued strong underlying conditions have resulted in an improving optimism in recent months. Therefore, we have entered 2024 with expectations of the market being aligned by mid-year –albeit with lower activity than in recent years.”
Nicholas Thurø, Managing Partner, Capital Markets
6 | RED Danish Investment Atlas 2024

RESIDENTS PUSHED TOWARDS THE RENTAL MARKET
“Every decision is made based on an assessment of pros and cons, and when tenants are to decide between buying and renting a home, the housing burden is one of the most critical parameters. An essential advantage of owner-occupied housing has been that it was cheaper than renting for many years. However, the high prices for owneroccupied housing and the high interest rates have meant that the monthly costs of owning today exceed the monthly costs of renting. Thus, as the market is now, there are not many advantages left to owning, which has resulted in a significant search towards rental properties. Combined with the demographic trends and the low construction activity, this implies that the rental market will be strong in the coming years, and especially in Copenhagen, we expect to see increasing rent levels and a continued high investor appetite.”
Kjeld Pedersen Partner, Capital Markets


THE RETAIL MARKET SURPRISED
“As we entered 2023, it was with prospects of increasing interest rates, high inflation, and low consumer confidence. Thus, not many factors indicated that a year later, we would look back on the year as a positive one for the high streets of Copenhagen. However, that’s what happened. Customers flocked to the high streets, and both well-known and new brands opened stores, resulting in a reduced vacancy. However, some things remained the same. For instance, there is still a direct correlation between the stores’ ability to attract customers and the development in tenant demand. In this context, Amagertorv remains the winner, and Frederiksberggade is the loser.”
Kristian Vinggaard Partner, Retail

THE OFFICE MARKET IS NO LONGER ONE MARKET
“It’s not always easy to know what tenants want and don’t want, but in 2023, office tenants made it clear. They want a physical office located centrally in Copenhagen with easy access to public transport and one that can meet their requirements for shared facilities, sustainability, flexibility, etc. – and as if that wasn’t enough, the office must also be unique to fit the identity of each company. We have, therefore, seen that the market has been divided into leases that can meet all of the tenants’ requirements and those that cannot. Therefore, the supply of older and less well-located offices has increased significantly, whereas there is competition for the most well-located modern offices. In 2024, we are, therefore, looking at a market characterised by an increasing rent spread between primary and secondary office leases.”
Anders Krogh Partner, Office Letting
LOGISTICS INVESTORS CHASED RETURNS
“In recent years, we have seen an insatiable investor demand for core logistics properties. However, in 2023, a different asset type suddenly topped the investors’ wish lists – value-add logistics properties. This shift in preference is due to the fact that, despite the rapid development of logistics tenants’ requirements, a continued large undersupply of logistics areas near the major cities implies that investors have expectations of continued low vacancy rates and increasing rent levels - even for the older and more outdated warehouse properties. At the same time, the yields are at a level where investments can be leveraged despite the worsened financing terms. Therefore, it will be interesting to see whether the investors’ preference shifts back to the core segment if we see further interest rate reductions or if there will continue to be the greatest demand for value-add properties with higher yields.”
Lior Koren, Partner and Head of Capital Markets
| 7
HOTEL RETAIL OFFICE LOGISTICS RESIDENTIAL ANNUAL REVIEW
RED assisted Aage Bangs Fond with the letting of 269 m² of exclusive offices in A.C. Bangs Hus in the city centre of Copenhagen.
8 | RED Danish Investment Atlas 2024
| 9 11 31 53 71 91 111 CONTENT ANNUAL REVIEW The Investment Market 12 Volume & Investors 14 Interview: Are Interest Rate Increases the Golden Opportunity for Pension Funds? 16 Highlight: No Transactions Without Belief in the Future 20 Highlight: Are the Risks Lower, or Are We Simply Behind? 24 Expectations for 2024 26 RESIDENTIAL Volume & Investors 32 Geographical Distribution 34 Top 5 Transactions 2023 38 Interview: Both Pros and Cons in the Danish Residential Market 40 Interview: The Developers’ Business Plans Are Challenged 42 Highlight: Renting Beats Owning – For a Little Longer 44 Highlight: A Capital Gains Tax of 50% Can Be the Solution 46 Expectations for 2024 48 Transactions & Key Figures 50 LOGISTICS Volume & Investors 54 Geographical Distribution 56 Top 5 Transactions 2023 60 Interview: From Core to Value-Add, but What Now? 62 Expectations for 2024 66 Transactions & Key Figures 68 OFFICE Volume & Investors 72 Geographical Distribution 74 Top 5 Transactions 2023 78 Highlight: Is the Physical Office a Thing of the Past? 80 Highlight: Complex Requirements 82 Expectations for 2024 84 Key Figures & Transactions 88 RETAIL Volume & Investors 92 Geographical Distribution 94 Top 5 Transactions 2023 98 Interview: The Winners Will Be Those Who Prioritise the Customers 100 Highlight: The High Streets of Copenhagen in 2023 102 Expectations for 2024 104 Transactions & Key Figures 108 HOTEL The Hotel Market Is Stronger Than Ever 112 Top 3 transactions 2023 116 HOTEL RETAIL OFFICE LOGISTICS RESIDENTIAL ANNUAL REVIEW

10 | RED Danish Investment Atlas 2024
RED assists Realdania By & Byg with the letting of office leases in the iconic multi-tenant property BLOX.
Photo: Realdania By & Byg / Rasmus Hjortshøj
Annual Review | 11 ANNUAL REVIEW
The Investment Market Volume & Investors Interview: Are Interest Rate Increases the Golden Opportunity for Pension Funds? Highlight: No Transactions Without Belief in the Future Highlight: Are the Risks Lower, or Are We Simply Behind? Expectations for 2024 12 14 16 20 24 26 HOTEL RETAIL OFFICE LOGISTICS RESIDENTIAL
ANNUAL REVIEW
THE INVESTMENT MARKET
A New, Different, and Illiquid Market
In 2023, the Danish commercial real estate market faced a new reality. The market’s long-lasting boom came to an end, and investors had to wait for sellers’ price expectations to adjust to the new financing conditions. The combination of non-distressed sellers in the Danish market and that investors saw quicker and more significant price corrections in our neighbouring countries resulted in a significant decrease in the investment activity in 2023.
LOWEST VOLUME SINCE 2014
While the buyers adjusted their business plans to the new high interest rates, the sellers struggled to meet the buyers’ yield adjustments. A significant gap between buyers’ and sellers’ price expectations, therefore, slowed down activity in 2023. Consequently, the volume only reached DKK 43.4 bn, which is the lowest volume on the Danish market since 2014 ( figure 2).
ACTIVITY IMPACTED BY INTEREST RATES
Capital has sought the safest assets in the safest locations for many years. However, in 2023, we saw that the high interest rates impacted the investment activity, resulting in an increase in activity with investment
opportunities that could offer higher returns and positive gearing effects using debt capital.
Within the logistics segment, investors increasingly sought value-add properties, in the residential segment, half of the volume came from investments outside the country’s largest cities, and prime office assets were primarily acquired by Danish equity-financed investors. Finally, the investors demanded the retail assets that could secure the highest returns. A transaction volume driven by different types of properties within the segments, therefore, implied that the volume was widely geographically distributed between Copenhagen,
Greater Copenhagen and the “rest of Denmark” ( figure 3).
INVESTORS WANT RESIDENTIAL AND LOGISTICS PROPERTIES
With a share of 39% of the total volume, residential properties continued to be the investors’ most preferred segment in 2023. While both Danish and foreign investors demanded residential and logistics properties, foreign investors were particularly hesitant to invest in the office segment, which was driven by global trends with increasing vacancy rates on the office market. Nevertheless, Danish investors’ acquisitions of Copenhagen office properties ensured that the office segment reached a total volume which was more or less on par with the logistics segment.
THE INTERNATIONALISATION HAS SLOWED DOWN
For many years, foreign investors have accounted for a significant share of the total transaction volume, and for the first time in 2022, foreign capital dominated the Danish market. However, in 2023, Danish investors reclaimed their position, accounting for almost three-quarters of the total investment volume ( figure 1). Thus, the foreign investors’ appetite for Danish commercial properties decreased in 2023.
43.4 BN DKK VENDORS INVESTORS Asset deals 49% Foreign 22% Share deals 51% Danish 78% Foreign 26% Danish 74% TOTAL VOLUME 2023 12 | RED Danish Investment Atlas 2024 Source: ReData
ANNUAL REVIEW
Figure 1: Origin of the investors & transaction structure 2023
0 20 40 60 80 100 120 140 2023 2022 2021 2020 2019 2018 2017 2016 2015 2014 31% 21% 32% 37% 27% 16% 12% 41% 11% 6% 10% 28% 41% 20% 9% 6% 6% 17% 45% 10% 4% 23% 8% 9% 44% 6% 9% 7% 7% 27% 56% 16% 10% 10% 7% 50% 15% 13% 8% 13% 42% 14% 15% 20% 8% 39% 20% 20% 11% TRANSACTION VOLUME (BN DKK) FOREIGN INVESTORS’ SHARE Residential Logistics Office Retail Hotels Other Foreign investors’ share 0% 10% 20% 30% 40% 50% 60% 70% Source:
COPENHAGEN
COPENHAGEN
REST OF DENMARK 0 10 20 30 40 50 60 2023 2022 2021 2023 2022 2021 2023 2022 2021 2023 2022 2021 53% 47% 49% 51% 34% 66% 43% 81% 57% 19% 48% 58% 32% 66% 57% 15% 43% 34% 42% 68% 85% 52% BN DKK Annual Review | 13 ANNUAL REVIEW
ReData Danish Foreign
GREATER
AARHUS
Figure 2: Total transaction volume 2014-2023
HOTEL RETAIL OFFICE LOGISTICS RESIDENTIAL
Figure 3: Geographic breakdown of transaction volume 2021-2023
VOLUME & INVESTORS
WELL-KNOWN INVESTORS
OCCUPY THE PODIUM
Before the interest rate hikes and general uncertainty took over the market in the second half of 2022, favourable financing conditions combined with political stability led to the entry of many new investors into the Danish market. However, in 2023, new investors were cautious about investing in Denmark, which is reflected in the fact that nine out of the top ten investors in 2023 (all except Quantum Immobilen) were wellknown investors ( figure 5).
STANDALONE TRANSACTIONS
SECURED THE TOP SPOTS
The residential segment has for many years been the investors’ most preferred property segment, which was previously also reflected in the fact that the largest investors were primarily those who invested in residential properties. However, unlike in the past years, residential investors did not secure the first and second places on the podium of 2023’s largest investors. With the acquisition of a portfolio with two prime office properties (Codanhus and KB32),
AP Pension took the position as the absolute largest investor, and IKEA followed with the user acquisition of their logistics centre located in Hedehusene.
THE HISTORICALLY DOMINANT INVESTORS MAINTAINED THEIR POSITION
Despite the influx of many new investors to the market in recent years, there have been no changes in the top ten investors that have historically invested the most capital in commercial properties in Denmark. Instead, there were some internal rotations among the top ten investors. Thus, Heimstaden, Niam, Koncenton, NREP, and Patrizia maintained their positions as the historically largest investors in Denmark ( figure 6).
THE INVESTORS DEMANDED RISK DIVERSIFICATION
For many years, the Danish market was characterised by an insatiable investor appetite for the safest assets, where portfolios and volumes could not be too large.
However, in 2023, uncertainties left their mark on the activity, which is why it could
be observed that the investors generally demanded smaller volumes and greater risk diversification. Therefore, volume fell proportionally more for larger transactions (> DKK 200 m) than for smaller transactions ( figure 4). For the very large transactions with a volume of > DKK 500 m, the total volume was reduced by 64%, and the number of trans actions decreased significantly (from 30 transactions in 2022 to 14 transactions in 2023). Thus, the year proved that the saying “the bigger, the better” does not apply in uncertain times.
INCREASING OPTIMISM TOWARDS THE YEAR-END
Although the market in 2023 was generally characterised by uncertainty and limited investment activity, we saw a renewed optimism in the market towards the year-end, which was driven by low inflation rates, decreasing interest rates, and a belief in a more stable investment environment.
As a result, the fourth quarter of the year reached a volume that exceeded the total volume for the second and third quarters.
14 | RED Danish Investment Atlas 2024
Price range (M DKK) No. of transactions Volume (M DKK ) 2022 2023 2022 2023 0 - 20 3,263 2,621 14,670 10,309 20 - 50 271 171 8,328 5,523 50 - 100 110 62 7,744 4,289 100 - 200 63 33 8,983 4,718 200 - 300 28 9 7,112 2,127 300 - 500 25 5 9,268 1,763 500 - 1,000 20 9 14,556 6,550 > 1,000 10 5 26,111 8,115 Total 3,790 2,915 96,771 43,394 ANNUAL REVIEW
Figure 4: Breakdown in price ranges 2022 & 2023
Source: ReData
*
Annual Review | 15 ANNUAL REVIEW
Investor Origin Volume (M DKK) No. of transactions 1 AP Pension DK 2,503 2 2 IKEA SE 1,800 1 3 Northern Horizon Capital DK 1,500 1 4 CapMan FI 1,240 1 5 Koncenton DK 1,201 10 6 Quantum Immobilien DE 1,075 1 7 PenSam DK 1,062 2 8 Round Hill Capital GB 1,035 4 9 Swiss Life CH 1,004 2 10 PensionDanmark DK 952 1 Source: ReData
Figure 5: Top 10 investors 2023
Investor Origin Volume (M DKK) No. of transactions 1 Heimstaden SE 45,097 70 2 Niam SE 22,483 84 3 Koncenton DK 20,397 114 4 NREP DK 19,327 65 5 Patrizia DE 14,752 25 6 PFA Ejendomme DK 12,631 57 7 PensionDanmark DK 10,678 37 8 ATP Ejendomme DK 10,567 15 9 Orange Capital Partners NL 10,400 10 10 Jeudan DK 9,974 46 Source: ReData
Figure 6: Top 10 investors 2014-2023
several large transactions
are
included
data, which is
actual volumes
HOTEL RETAIL OFFICE LOGISTICS RESIDENTIAL
After the preparation of data for this publication,
from 2023 have been published. These
not
in the
why the
deviate slightly from the above.
We believe that buyers and sellers will continue to get closer to each other in the new year, which is why we will probably see more transactions.”
Mikkel Lieberkind Head of Projects, AP Ejendomme

86%
16 | RED Danish Investment Atlas 2024
Figure 7: How much should real estate make up of your total assets?
Figure 8: Have the interest rate increases in 2023 meant that your allocation in real estate has changed?
14%
Foto: Muus foto NO YES 0% 2% 4% 6% 8% 10% 12% PenSam Nordea Pension Ejendomme AP Pension Danica Pension Sampension AkademikerPension Industriens Pension 5% 7.5% 8% 8-10% 12%* 10-12% 10% * 9% in Danish properties and 3% in foreign properties
ARE INTEREST RATE INCREASES THE GOLDEN OPPORTUNITY FOR PENSION FUNDS?
The significant interest rate increases from 2022 continued into 2023, leading to diminished or completely disappearing benefits for leveraged investors. The worsened financing conditions made it challenging for geared investors to make profitable business plans, resulting in both increasing yield requirements and a significantly narrowed investor field.
After many years of competing for the assets, this scenario could potentially be a dream scenario for the equityfinanced pension funds, which could now once again become the highest bidders. The question is, therefore, whether the significant interest rate increases have become a golden opportunity for the pension funds?
To shed light on the subject, we have asked a number of the country’s largest pension funds about how their investment strategy has been affected by the new high interest rates, and based on the answers from the pension funds, it can be concluded that the significant interest rate increases did not become the golden opportunity for pension funds, which is due to several different factors.
The pension funds’ allocation to real estate is set as a share of their total asset base – and since six out of seven pension funds state that the increasing interest rates have not led them to change their allocation strategy ( figure 8), real estate must therefore continue to constitute 5-12% of their total asset base ( figure 7). However, to maintain balance in their accounts, pension funds must align the values of their properties against the values of their other assets. This implies that several pension funds have become overexposed to real
(…) We have slowed down the investment pace due to the market situation, and our allocation in absolute terms is affected by the denominator effect, as is the case with many others.”
Søren Møller-Larsson Head of Real Estate, AkademikerPension
estate, as the values of their other assets have fallen proportionally more than the values of their properties.
At the same time, the increased returns for alternative and more liquid investments have also resulted in increasing yield
requirements for real estate among the pension funds, but the sellers in the market have not been willing to adjust their price expectations accordingly.
Although pension funds have been able to execute quickly and without financing contingencies, several factors have thus put a brake on the pension funds’ investment activity. However, the appetite and allocation are still there, so when the price expectations are aligned and the risk-adjusted returns once again become competitive, we expect to see higher activity among Danish pension funds.
To gain a deeper insight into the pension funds’ strategies and considerations, we have conducted a more in-depth interview with Mikkel Lieberkind from AP Ejendomme, who was one of the pension funds that invested in real estate in 2023.
Continued on next page
Annual Review | 17 ANNUAL REVIEW
HOTEL RETAIL LOGISTICS RESIDENTIAL OFFICE
Continued from previous page
AP EJENDOMME Q&A
Which advantages do you have as an institutional investor compared to other investors in the market?
In the current market characterised by significant uncertainty, high interest rates, limited willingness to lend from financial institutions, substantial construction prices, geopolitical uncertainties, climate change, etc., we believe that AP Ejendomme, as an institutional investor, can benefit from several factors. For example, we are not forced to sell our assets in a market with high yield requirements, and the vast majority of our properties are financed with pure equity, which reduces our vulnerability to the interest rate increases we have experienced in recent years. This capital structure also
implies that when attractive investment opportunities arise, we can execute quickly without financing contingencies, which has proven to be reassuring for sellers requiring high transaction security.
How has your investment strategy changed in recent years?
Our primary investment strategy remains “Develop to Core,” with a focus on investments in larger growth cities in Denmark, combined with active portfolio management. Overall, our investment strategy is characterised by a strong ESG agenda, which applies to both new investments and the existing portfolio.
The investment strategy is continuously evaluated and has naturally evolved in line with the dynamics of the real estate market and the changing conditions during the past 1.5 years. An example of our strategy adapting to the market is our recent acquisition of Codanhus and KB32, which fall outside our primary “Develop to Core” strategy. Such adjustments to the strategy make sense for us in a market like the current one, where the costs and risks of a similar development property exceed what we can buy a standing asset for.
MIKKEL LIEBERKIND
Mikkel Lieberkind is Head of Projects at AP Ejendomme. Mikkel has a Master’s degree in Construction Management and Building Informatics from Aalborg University and previously worked as a Project Development Manager at MT Højgaard Projektudvikling.
AP Ejendomme, which is a subsidiary of the pension fund AP Pension, invests in both Danish and international properties across all segments, ranging from office and residential properties to logistics and retail properties. In 2023, AP Ejendomme became the largest investor in the Danish real estate market with their acquisition of two office properties, Codanhus and Kalvebod Brygge 32.

18 | RED Danish Investment Atlas 2024
Which segment(s) do you expect to experience the greatest investor interest in 2024?
We expect the greatest investor interest to be in residential and office properties on prime locations in the country’s largest cities, especially Copenhagen and central Aarhus. These areas are expected to experience population growth, high employment, and stable rent levels. Additionally, we expect that ESG performance will have an increasing importance for the investment interest.
Which factors do you expect to be decisive for the activity on the commercial real estate market in the coming year?
Interest rate fluctuations and interest levels
Since the summer of 2022, we have witnessed significant interest rate increases, and only now are we experiencing stabilisation of the interest rates. The significant interest rate increases have resulted in several investors using leverage, putting acquisitions on hold and having to cancel ongoing transaction processes. Only now are the central banks starting to signal stagnant interest levels, even though the fight against inflation still cannot be declared “won” with certainty. In connection with this, we, like many investors and financial institutions, expect that we will probably see a slight decrease in interest rates in 2024. A decrease in interest rates is expected to result in more investors being able to justify their business cases, which will probably be reflected in the activity.
ESG
We and the majority of the investors and tenants we speak with are already imposing requirements on ESG, sustainability certifications, energy efficiency, and CO2 emissions. In the coming year, we expect these requirements to become even more significant and
that ESG Due Diligence will play a much larger role in new investments. Furthermore, we expect a strong focus on identifying and reducing CO2 emissions from both operations and embedded sources. We also observe that several investors are currently expanding their organisations with specialised ESG expertise, which is also the case at AP Ejendomme.
Bid-Ask Spread
Especially 2022 and 2023 have been characterised by a very large “Bid-Ask Spread”, which we experience in certain cases, has become smaller at the end of 2023. We believe that buyers and sellers will continue to get closer to each other in the new year, which is why we will probably see more transactions.
(…) when attractive investment opportunities arise, we can execute quickly without financing contingencies, which has proven to be reassuring for sellers requiring high transaction security.”
Mikkel Lieberkind Head of Projects, AP Ejendomme

Annual Review | 19 ANNUAL REVIEW
HOTEL RETAIL LOGISTICS RESIDENTIAL OFFICE
NO TRANSACTIONS WITHOUT BELIEF IN THE FUTURE
FUNDAMENTALLY CHANGED
MARKET CONDITIONS
There is no doubt that the new higher interest rates challenged the real estate market again in 2023. However, what do the investors’ business plans actually look like under the new market conditions, and what will it take to make it more attractive for the investors to place their capital in real estate instead of other asset classes again?
Whether we are talking about real estate, bonds, stocks or other asset types, investment decisions will always be based on whether or not the investors expect that they can achieve a given return on their equity during a given period of time. The size of this return depends on the risk-free interest rate and the risks associated with the investment (a risk premium) – the greater the risks, the higher the risk premium.
While the risk-free interest rate is most often defined as the effective interest rate on government bonds, the risk premium depends on both the market risks, the illiquidity risks, the lease agreement risks and the reletting risks. In both the residential, office and logistics segments, the investors were able to generate attractive cash flows and large profits from sales for several years due to significant yield compressions, making it possible to sell the assets at higher prices than they were acquired at. Thus, the investors could achieve high returns on their equity, which was driven by the perfect combination of a low interest rate and low risks.
However, the market’s development in recent years has turned the investment landscape upside down, and the investors are now facing a market where both the risk-free rate and the risks have increased significantly;
The risk-free rate: The significant increases in the interest rates have led to i) an increase in the returns on bonds, ii) an increase in the financing costs associated with real estate investments, and iii) that it has become more challenging to obtain financing. As a result, the investors can no longer derive the same benefits from making leveraged investments in real estate.
Lease agreement risks: Private households and businesses are still doing well, but there is still uncertainty about the future, which could increase the risks of missing rent payments and the possibility of commercial tenants going bankrupt.
Reletting risks: Both the residential, office and logistics segments continue to be characterised by a strong underlying tenant demand. However, it is not expected that the demand (and thus the rent) will increase to the same extent as seen in recent years.
Illiquidity risks: The combination of the above factors has resulted in a decreasing investor demand from Danish as well as foreign investors, and consequently in a lower activity, highlighting the illiquidity associated with investments in commercial real estate.
Market risks : However, Denmark continues to be characterised by political stability and a strong national economy. Therefore,
investors consider Denmark to be a ’safe haven’ and an attractive market.
As a result of the increase in the interest rates and the higher risks, the yield requirements in both the residential, office and logistics segments have increased by approximately 100-125 basis points during 2023, and the prime yields are, therefore, respectively, 3.75%, 4.25% and 5.00% in today’s market.
The development in the market has also resulted in an increase in the investors’ requirements for their return on equity, and in today’s market, the majority of leveraged core investors operate with a return requirement of 9-11% for residential properties and 10-14% for office and logistics properties. To shed light on how the investors’ business plans unfold under the new market conditions, we have calculated the investors’ return on equity under a number of different scenarios below.
While scenario 1 is our benchmark scenario, one parameter is changed at a time in each of the following four scenarios. This is done to highlight the consequences of the changes – even though the investors’ return on equity depends on the combination of several different parameters. Furthermore, the changes are only described for the residential properties in the following texts. However, the return on equity for both residential, office and logistics properties in the various scenarios is shown in the tables on page 23.
All scenarios are based on an assumption of a five-year investment period and that a gearing of 60% can be achieved for residential properties and 50% for office and logistics properties.
20 | RED Danish Investment Atlas 2024
SCENARIO 1
STABILISED MARKET
Scenario 1 is our benchmark scenario for the following scenarios. In this scenario, we have calculated the investors’ return on equity, assuming that the investors expect the market to remain stable, which implies that it is assumed that the investors buy at the current yield levels and the rental income remains unchanged throughout the investment period (i.e., there is no increase in the market rent). In this scenario, the investors’ annual return on their equity will be 3.5%.
The investors’ requirements are thus approximately twice as high as the expected return in this scenario. This significant difference explains the low investment activity that we have witnessed in the past year and which we also expect to see in early 2024. Thus, the question is, what will it take for the risk-adjusted returns to become attractive again and for the investment activity to return?
Continued on next page
SCENARIO 2
HIGHER INITIAL YIELD
One of the primary reasons for the limited investment activity in the market is that the sellers are holding onto the historically low yield levels from 2021/2022. Scenario 2 is, therefore, based on the assumption that the sellers acknowledge that the current risk-adjusted yields are still too low (compared to the interest rate), resulting in upward pressure on yields across all three segments. In this scenario, investors are assumed to buy at yields that are 50 basis points higher than the current levels (i.e., at 4.25%). Although this scenario will require the sellers to adjust their price expectations quite significantly, the investors’ return on equity will only increase by approx. 1.2 percentage points to 4.8%.
LOWER INTEREST RATE
Investors in the market are increasingly expecting that the interest rates will decrease during 2024. However, at the same time, there is also consensus on not expecting that the interest rate will drop to the same low level as we saw a few years ago. Therefore, scenario 3 is based on the assumption that the interest rates will decrease by 50 basis points (i.e., to 3.40%, including the margin), which will increase the return on equity by 0.7 percentage points (i.e., to 4.3%). However, for this scenario, it should be noted that a lower interest rate will also lead to a lower return on alternative investments, and therefore, the investors will most likely also be willing to accept a lower return on their real estate investments.

Annual Review | 21 ANNUAL REVIEW
SCENARIO 3
HOTEL RETAIL LOGISTICS RESIDENTIAL OFFICE
YEARLY NPI RENTAL GROWTH
Scenario 4 is based on the assumption that the investors expect the rent to increase with inflation (i.e., a yearly increase of 2% over the investment period) - an estimation that many investors factor into their business plans across asset types and locations. In this scenario, the return on equity for residential properties increases by 3.9 percentage points to 7.4%. Although the return in this scenario becomes higher than in the previous two scenarios, this expectation alone is still not sufficient to meet the investors’ current return requirements (9-11%).

SCENARIO 5
RENTAL GROWTH HIGHER THAN NPI
In scenario 5, it is assumed that the investors have a slightly more positive outlook and now expect the rent levels to increase at an annual average of 4% over the investment period. This results in an increase in the return on equity by 7.5 percentage points to 11.0%. Thus, this scenario is the only one of the five scenarios that (viewed in isolation) meets the level of the investors’ return requirements in today’s market.
However, this scenario is only assessed to be realistic for modern logistics properties and residential properties located in Copenhagen, whereas we expect more limited growth in the market rent for office properties and for the less attractive properties within the residential and logistics segments. For investors with a long investment horizon, it can also be questioned whether an average rent increase of 4% for logistics properties is realistic, as these properties quickly become technically obsolete, which will be reflected in the rent over time (all other things being equal).
SCENARIO 6
A COMBINATION CAN KICKSTART THE MARKET
Based on the above scenarios, it can be concluded that if the investors do not expect a significant rent increase during their investment period, the investors cannot reach their return requirements if just one of the other scenarios unfolds. In fact, for the investors to reach their return on equity requirements in all segments, it will require a combination of the initial yields increasing, the interest rates dropping, and the investors to expect the rent to increase on par with the inflation (i.e., a combination of scenario 2-4) – and despite this, the return on equity for office and logistics properties is still in the very low end.
Thus, the real estate market still has a long way to go before being an attractive alternative to the other more liquid assets, and it will, therefore, be interesting to see when the investors can reach their return on equity requirements and to what extent the investment activity will then increase.
Finally, it should be noted that all of the above calculations are based on assumptions that the investors buy and sell at the same yield levels. However, there may be conditions for the individual property that result in the investors expecting to be able to sell the property at a lower yield than the property was bought (e.g., improving leasing situation, energy improvements in the property, etc.).
Continued from previous page 22 | RED Danish Investment Atlas 2024
SCENARIO 4

* The calculations do not account for potential capital gains.
Annual Review | 23 ANNUAL REVIEW SCENARIO STABILISED MARKET HIGHER INITIAL YIELD LOWER INTEREST RATE YEARLY NPI RENTAL GROWTH RENTAL GROWTH HIGHER THAN NPI A COMBINATION Net initial yield 3.75% 4.25% 3.75% 3.75% 3.75% 4.25% Interest rate 3.90% 3.90% 3.40% 3.90% 3.90% 3.40% Expected yearly rental growth 0.00% 0.00% 0.00% 2.00% 4.00% 2.00% Return on equity 3.5% 4.8% 4.3% 7.4% 11.0% 9.3% SCENARIO STABILISED MARKET HIGHER INITIAL YIELD LOWER INTEREST RATE YEARLY NPI RENTAL GROWTH RENTAL GROWTH HIGHER THAN NPI A COMBINATION Net initial yield 4.25% 4.75% 4.25% 4.25% 4.25% 4.75% Interest rate 3.90% 3.90% 3.40% 3.90% 3.90% 3.40% Expected yearly rental growth 0.00% 0.00% 0.00% 2.00% 4.00% 2.00% Return on equity 4.6% 5.6% 5.1% 7.7% 10.7% 9.2% SCENARIO STABILISED MARKET HIGHER INITIAL YIELD LOWER INTEREST RATE YEARLY NPI RENTAL GROWTH RENTAL GROWTH HIGHER THAN NPI A COMBINATION Net initial yield 5.00% 5.50% 5.00% 5.00% 5.00% 5.50% Interest rate 3.90% 3.90% 3.40% 3.90% 3.90% 3.40% Expected yearly rental growth 0.00% 0.00% 0.00% 2.00% 4.00% 2.00% Return on equity 6.1% 7.1% 6.6% 9.2% 12.2% 10.7%
RESIDENTIAL OFFICE LOGISTICS
HOTEL RETAIL OFFICE LOGISTICS RESIDENTIAL
RESIDENTIAL AND LOGISTICS:
ARE THE RISKS LOWER, OR ARE WE SIMPLY BEHIND?
Before a series of economic and geopolitical uncertainties slowed down the investment activity, the real estate markets in both Denmark, Sweden, Norway and Finland were characterised by an insatiable investor appetite and a significant yield compression in the core segments. However, the yield curve turned when interest rate increases challenged the historically low yield requirements.
Despite the Nordic countries being comparable in many ways, we have seen significant differences in the rate at which buyers and sellers have adapted to the changed market conditions across the Nordic region. The question now is whether the lower yield levels in Denmark reflect investors demanding a lower risk premium or if we, in reality, are simply lagging behind.
2.40% 2.90% 3.40% 3.90% 4.40% Q4 2023 Q1 2023 Q1 2022 Q1 2021 Denmark Finland Norway Sweden 3.20% 3.70% 4.20% 4.70% 5.20% 5.70% Q4 2023 Q1 2023 Q1 2022 Q1 2021 Denmark Finland Norway Sweden 24 | RED Danish Investment Atlas 2024
Figure 9: Prime yields – Residential properties in the Nordics
Figure 10: Prime yields – Logistics properties in the Nordics
Source: Cushman & Wakefield | RED
THE ADAPTION TO THE MARKET IS TAKING LONGER
In recent years, residential and logistics properties have been at the top of the global investors’ wish lists, and when looking at the yield development across the Nordic region, a trend in the pace of adaptation to the changing market conditions in the individual countries can be observed.
When the market was at its peak and characterised by significant competition and investor appetite, the yield for prime residential properties in Denmark was higher than in both Sweden, Norway and Finland. However, today, we see the opposite situation, where the prime residential yield in Denmark is approximately 35-55 basis points lower than in the rest of the Nordic region ( figure 9). Both during the upswing and the downturn, the market has thus adapted slower to the changed market conditions in Denmark than in the other Nordic markets.
In the logistics segment, we have observed the same trend, as there have also been larger price adjustments in our neighbouring countries than in Denmark. While the yields in Denmark have shifted by 100 basis points from early 2022 to the end of 2023, prime logistics yields in the rest of the Nordic region have moved by 145-185 basis points (i.e., 45-85 basis points more), despite starting from a lower level ( figure 10).
ARE WE COMING FROM A STARTING POINT THAT IS TOO HIGH?
The question now is whether the yield levels for prime residential and logistics properties in Denmark should increase to the same extent as seen in the rest of the Nordic markets or if the risk premium for investing in residential and logistics properties in Denmark should actually be lower than in the other Nordic markets?
FEW DISTRESSED SELLERS IN DENMARK
A significant reason why we have not seen the same price adjustments in Denmark as, for example, in Sweden is that there have been (and still are) few financially distressed sellers on the Danish market. This is because a large share of the property owners in
Denmark are investors with limited use of leverage. However, looking at the Swedish market, the increases in the interest rate have squeezed the owners much harder, as Swedish real estate companies in recent years have financed a large share of their acquisitions with corporate bonds, which had to be refinanced within a short period of time. During the market’s downturn, this has implied that the buyers on the Danish market have had to wait for the sellers to mature and for their price expectations to adjust, whereas the sellers on the Swedish market, to a greater extent, had to accept the prices, that the buyers were willing to pay.
THE SAFE AND LIQUID DANISH RESIDENTIAL MARKET
When looking at the residential market in isolation, the rent levels for prime properties in both Denmark and Sweden have historically been somewhat lower than in Norway and Finland. However, when the market was most attractive, the low rent levels in Sweden were offset by the fact that the yield levels for Swedish residential properties were 50 basis points lower than for Danish properties. This resulted in the market values per square meter being considerably lower in Denmark than in the rest of the Nordic region. Consequently, many investors expected (during the upswing) that we would see further yield compression for prime residential assets in Denmark, bringing yields closer to the levels seen in the other Nordic markets.
Moreover, the rental housing market in Denmark is currently characterised by a significant demand, as the high interest rates combined with the continued high condominium prices have created a high housing burden on the owner-occupied market, pushing residents into the rental market (read more on page 44 “Renting beats owning – for a little longer”). The fact that the residential yields are currently the lowest in Denmark could, therefore, also indicate that the Danish market is a ‘safe haven’ with high liquidity and strong demand.
UNREALISED POTENTIAL IN DANISH LOGISTICS PROPERTIES
Looking into the yield development in the logistics segment, we see many similar trends. Before the interest rate increases, the segment was characterised by a significant yield compression across the Nordic markets. Despite Denmark being a strong logistics hub with efficient access to Continental Europe, the yield levels were higher than in the other Nordic countries. Simultaneously, the rent levels for prime assets were significantly lower in Denmark than in Sweden, Norway, and Finland.
The higher yields in Denmark can partly be attributed to a lack of foreign capital. While it was first around 2020-2021 that foreign investors truly started paying attention to the Danish market, their interest in the logistics market in the other Nordic countries goes back way further. Thus, for a long period, international investors did not have the same focus on Denmark as on the rest of the Nordic region. The Danish market was, therefore, behind – both in terms of market rent and yield requirements.
ARE THE RISKS LOWER IN DENMARK?
During the downturn, the Danish market has proved superior. We have seen few distressed sellers in Denmark, the inflation fell significantly faster and to a lower level than in the rest of the Nordic region. Furthermore, the investors can obtain better financing terms in the Danish market, which also speaks for a lower yield (all else being equal). Finally, the occupier market in both the residential and logistics segments is strong in Denmark. While the Danish rental housing market is (and is expected to continue to be) characterised by significant demand, investors expect to see a continued undersupply of Danish logistics properties and, consequently, a future growth in the market rent.
So, is the Danish market just lagging behind, or are the risks associated with residential and logistics properties actually lower than in our Nordic neighbouring countries? We believe in the latter.
Annual Review | 25 ANNUAL REVIEW
HOTEL RETAIL LOGISTICS RESIDENTIAL OFFICE
EXPECTATIONS FOR 2024
After a challenging 2023 with headwinds, a frozen investment market, and the lowest transaction volume in nine years, we sensed a growing optimism from investors towards the end of the year.
In 2024, we expect to see reduced uncertainty in the market, leading to increased alignment between the buyers’ and the sellers’ price expectations and, consequently, a higher activity.
INCREASED ACTIVITY IN 2024
Following years of high uncertainty in the investment market, impacted by interest rate hikes and high inflation figures, we observed more sellers accepting the buyers’ price adjustments by the end of 2023 and that the investors had an increasing optimism and a belief in future interest rate cuts. Therefore, we expect to see decreasing uncertainty in the market and, as a result, a higher investment activity in 2024.
The increasing optimism and the expectation of increased investment activity among the investors is supported by our Q1 2024 investor survey, which shows that the share of investors who expect to buy more than they expect to sell has increased to 61%, which is equivalent to an increase of approximately 10%-points compared to the previous three surveys ( f igure 11).
Despite the growing investor optimism, we do not expect to witness the same volume as experienced up to the market turnaround. This is because the risk-adjusted return on real estate is still too low in the eyes of many investors, given the returns they expect from more liquid alternatives such as bonds and other types of loans, which will reduce

investors’ appetite and, consequently, their allocation to real estate.
RESIDENTIAL PROPERTIES REMAIN
THE INVESTOR’S FAVOURITE
Recent years’ yield compression in the residential segment implied that the yield had reached a level creating a significant gap between the buyers’ and sellers’ price expectations in the residential segment. This limited the investment activity with all types of residential properties in 2023. However, towards the end of the year, we observed sellers’ price expectations becoming more aligned, and in 2024, we therefore expect to see a higher activity in the investors’ always preferred property segment, the residential segment.
This expectation is further based on the fact that the owner-occupied housing market has maintained a surprisingly high price level, resulting in a housing burden that pushes residents from the owner-occupied market towards the rental market. Therefore, the residential rental market is expected to be in high demand – both for tenants and investors in the Danish market.
Our investor survey from early 2024 shows that investors also have great confidence
in the residential segment, as more than two-thirds of the respondents consider the residential segment as the segment with the best potential to perform well in the coming time ( figure 12).
THE GREEN TRANSITION GAINS MOMENTUM
In addition to a continued appetite for residential properties, we expect to see an increased focus on sustainability in 2024. This expectation is based on the observation that across asset classes, both tenants and owners are increasingly focusing on sustainability. Our investor survey from Q1 2024 further shows that more than four-fifths of respondents have an ESG strategy from which they see several commercial benefits. The majority of investors believe that initiatives implemented through ESG strategies contribute to improving the value of their properties ( figure 13). Furthermore, almost half of the investors expect that a focus on sustainability will i) increase demand from tenants, ii) ensure their organisation’s longterm success, and iii) secure the company against future regulatory requirements.
Continued on next page
Despite the growing investor optimism, we do not expect to witness the same volume as experienced up to the market turnaround. This is because the risk-adjusted return on real estate is still too low in the eyes of many investors, given the returns they expect from more liquid alternatives such as bonds and other types of loans, which will reduce investors’ appetite and, consequently, their allocation to real estate.”
Nicholas Thurø Managing Partner, Capital Markets, RED
26 | RED Danish Investment Atlas 2024
ANNUAL REVIEW
Q1 2024
Q3 2023
Q1 2023
Q3 2022
Increase – more acquisition the disposal
Stable – as much disposal as acquisition
Decrease – more disposal than acquisition
We get more favourable financing conditions
We believe that it improves the occupier demand (i.e., lower vacancy, higher rent levels)
We find it important to secure our organisations’ long-term success (i.e., trust/credibility, customer loyalty, attracting talent, competitive advantage, etc.)
We secure ourselves against future requirements from the authorities
We believe that it improves the value of the properties (i.e., lower yield requirements)
Q3 2022 Q1 2023 Q3 2023 Q1 2024 0% 10% 20% 30% 40% 50% 60% 70% Hotel Retail Office Logistics Industrial Residential 61% 50% 49% 51% 30% 39% 42% 32% 9% 11% 9% 17% 49% 49% 34% 62% 46% Annual Review | 27 ANNUAL REVIEW
Figure 11: Investor Confidence Index - Portfolio size
What is your objective with regard to the size of your portfolio in terms of acquisition/disposal during the coming six months?
Figure 12: Investor Confidence Index - Segment with best potential
Which segment do you consider to have the best potential to perform well during the coming six months?
Figure 13: Investor Confidence Index – Commercial advantages of ESG Strategy
Which commercial advantages do you think are the most important of implementing an ESG strategy?
HOTEL RETAIL LOGISTICS RESIDENTIAL OFFICE
Continued from previous page
EXPECTATIONS OF STABLE YIELD LEVELS
After a long period with an upward pressure on the yields, sellers’ price expectations began to align by the end of 2023. Therefore, we expect yield levels across segments to have found their new level and thus to remain more or less stable in 2024. However, global trends and expectations of increasing risks in the office segment could put upward pressure on yield requirements for office properties – despite fundamental differences between the office market in Denmark and other countries.
The expectation of stable yield requirements is supported by our investor survey, which shows that investors at the beginning of 2024 have become more optimistic about how they expect the value of their portfolio to develop in the next six months ( figure 14).
While 60% of investors expect the value of their portfolio to remain stable, almost a third expect their portfolio value to increase.
INCREASED ECONOMIC STABILITY
After a longer period with macroeconomic fluctuations and worsened financing conditions, there are prospects for a more stable macroeconomic environment in 2024 due to lower inflation rates and expectations of stable, potentially declining interest rates.
When asked about their expectations for their future financing conditions, investors are significantly more optimistic than before ( figure 15). In the previous surveys, more than half of the respondents expected worsened conditions, and this share has now fallen to a quarter. Simultaneously, the same share of investors expects improved
financing conditions, while half of the investors expect their financing conditions to remain unchanged in the coming time.
As also seen in 2023, the development of interest rates will be crucial for investor appetite and activity in 2024. Therefore, Danske Bank’s Chief Economist, Las Olsen, will provide his insights into how interest rates are expected to evolve in 2024 and how it will impact the real estate market.
The Cushman & Wakefield | RED Investor Confidence Index
The index monitors 115 of the most active investors’ expectations for the Danish commercial real estate market during the coming six months. The broad coverage ensures that the findings are representative reflections of the investors’ confidence in the Danish market. By conducting the survey on a biannual basis, we are also able to track changes in the confidence.
31% 8% 26% 17% 15% 13% 8% 60% 43% 48% 40% 43% 48% 37% 28% 9% 49% 26% 55% 40% 37% 50% 64% 28 | RED Danish Investment Atlas 2024
Figure 14: Investor Confidence Index – Portfolio value
How do you see the value of your portfolio developing during the coming six months?
Figure 15: Investor Confidence Index – Financing conditions
Q1 2024 Q1 2024 Q3 2023 Q3 2023 Q1 2023 Q1 2023 Q3 2022 Q3 2022 Increasing Unchanged Declining Improved conditions Unchanged conditions Worsened conditions
What is the future outlook for your financing compared with your current financing? (In terms of the financing of new acquisitions or the refinancing of your existing properties)
DANSKE BANK Q&A
How do you expect the short- and longterm interest rates to develop in 2024?
It is, of course, very uncertain, but we believe that the ECB will gradually normalise the interest rate level because inflation is under control. On the other hand, one does not want to risk inflation flaring up again, and there are still significant wage increases that can push prices up. Our main scenario is that the first interest rate cut of 25bp will come in the second quarter and that two more will follow before the end of the year. Long-term interest rates may decrease slightly as the interest rate cuts are implemented, but, in principle, we do not expect much.
How do you expect the developments in financial markets will affect the real estate market?
The yield requirements for some properties decreased quite sharply during the period with very low interest rates, and now there is an adjustment (red: in yield requirements) in progress to the higher interest rate level. Since we do not expect significant declines, especially in long-term interest rates in 2024, it could look like this adjustment will continue. On the other hand, we also believe that interest rates have peaked for this time, and it may provide a bit more stability in the market in the longer term - for example, in 2025.
Do you expect the ESG profile of companies and properties to affect investors’ financing conditions in the coming year?
In the future, a company’s ESG profile and a property’s energy efficiency will be part of the credit rating, just like the other key elements in the company’s performance. For real estate investors, this means that, in the slightly longer term, companies are expected to regularly report on ESG, and the companies are expected to have a plan for ESG, including a plan for reducing CO 2 emissions property by property. The answer is, therefore, “yes” – in the slightly longer term, there will be differences in financing conditions depending on the ESG profile and the energy efficiency of the property.
In the future, a company’s ESG profile and a property’s energy efficiency will be part of the credit rating, just like the other key elements in the company’s performance.”
Las Olsen Chief Economist, Danske Bank
LAS OLSEN
Las Olsen is Chief Economist at Danske Bank. Las Olsen has been with Danske Bank since 2007 and has a master’s degree in Economics from the University of Copenhagen.

Danske Bank is a Nordic bank headquartered in Denmark. The bank, which is the largest in Denmark, has customers in ten countries and advises both private and business customers as well as institutional customers.
Annual Review | 29 ANNUAL REVIEW
HOTEL RETAIL LOGISTICS RESIDENTIAL OFFICE
RED facilitated the sale of a property with 28 residential units and a grocery store located at Vesterbrogade 162/Platanvej 32 on the border between Vesterbro and Frederiksberg.

30 | RED – Danish Investment Atlas 2023
RESIDENTIAL
32 34 38 40
Volume & Investors
Geographical Distribution
Top 5 Transactions 2023
Interview: Both Pros and Cons in the Danish Residential Market
Interview: The Developers’ Business Plans Are Challenged
Highlight: Renting Beats Owning – For a Little Longer
Highlight: A Capital Gains Tax of 50% Can Be the Solution
Expectations for 2024
Transactions & Key Figures
Residential | 31 RESIDENTIAL
50 HOTEL RETAIL LOGISTICS ANNUAL REVIEW OFFICE
42 44 46 48
A SIGNIFICANTLY LOWER ACTIVITY
Since 2015, the residential segment has been the investors’ most preferred real estate segment, and it remained so in 2023. With a total transaction volume of DKK 16.8 bn, the residential properties accounted for 39% of the total volume ( figure 18). Despite the residential segment maintaining its position as the investors’ most preferred segment, the investment activity decreased by 59% in 2023 compared to the previous year, and we must go back to 2014 to see a lower transaction volume in the segment.
CONTINUED INTEREST IN ALL TYPES
The decline in transaction volume in 2023 should not be seen as an expression of a lack of investor appetite for residential properties but rather that substantial interest rate increases coupled with limited yield adjustments within the segment made it challenging for buyers and sellers to meet.
While investors in the other segments in the search for higher yields can search either for secondary locations or for the more risky asset types within the segments (e.g. for big box in the retail segment), the difference in the risk premium for residential properties is smaller. This means that the volume is
limited by investors not being able to look to alternative residential investments to the same extent but instead having to wait for sellers’ price adjustments.
DANISH INVESTORS DOMINATE AGAIN
Foreign investors dominated the residential segment in 2022, but the situation reversed in 2023, as Danish capital was behind 66% of the total investment volume ( figure 16). Although Danish capital dominated the segment, three out of the top five investors were foreign ( figure 19), and four out of the five largest transactions were carried out by foreign investors.
Source: ReData
”THE BIGGER, THE BETTER” IS OVER
Before increases in the interest rates affected the market, the residential segment was characterised by an insatiable investor appetite, where portfolios and volumes could not be large enough. However, last year, we observed that investors were more cautious with larger investments and instead wanted risk diversification, which is reflected in the fact that both the number of transactions and the total volume fell proportionally more in the transactions with higher volume than in the transactions with lower volume ( figure 17).
16.8 BN DKK RESIDENTIAL VOLUME 2023 VENDORS INVESTORS Asset deals 37% Foreign 8% Share deals 63% Danish 92% Foreign 34% Danish 66% 32 | RED Danish Investment Atlas 2024
Figure 16: Origin of the investors & transaction structure 2023
Price range (M DKK) No. of transactions Volume (M DKK) 2022 2023 2022 2023 0 - 50 1,734 1,144 7,754 4,822 50 - 150 32 32 2,883 2,830 150 - 250 23 12 4,302 2,180 250 - 500 19 3 6,037 1,131 > 500 16 6 19,940 5,838 Total 1,824 1,197 40,915 16,802
Figure 17: Residential – Breakdown in price range 2023
RESIDENTIAL VOLUME
& INVESTORS Source: ReData
0 10 20 30 40 50 60 70 2023 2022 2021 2020 2019 2018 2017 2016 2015 2014 Danish BN DKK Foreign Source: ReData 60% 37.6 40% 51% 35.0 49% 54% 44.2 46% 53% 63.3 47% 57% 40.9 43% 34% 16.8 66% 38% 27.7 62% 41% 28.6 59% 37% 20.3 63% 23% 11.0 77% Residential | 33 RESIDENTIAL
Figure 18: Residential – Transaction volume 2014-2023
Investor Origin Volume (M DKK)* No. of transactions 1 Northern Horizon Capital DK 1,500 1 2 CapMan FI 1,206 1 3 Koncenton DK 1,186 10 4 Quantum Immobilien DE 1,075 1 5 Round Hill Capital GB 1,014 4 Source: ReData
Figure 19: Residential – Top 5 investors 2023
Investor Origin Volume (M DKK)* No. of transactions 1 Heimstaden SE 44,233 73 2 Koncenton DK 19,870 121 3 Niam SE 12,868 59 4 Patrizia DE 11,132 19 5 Orange Capital Partners NL 9,949 10 Source: ReData
HOTEL RETAIL LOGISTICS ANNUAL REVIEW OFFICE
Figure 20 : Residential – Top 5 investors 2014-2023
* The stated volumes are for the residential part only, which is why any other uses in mixed properties are not included in the volume.
COPENHAGEN 6.1 BN DKK 36% COPENHAGEN Danish 30% 70% Foreign Investor distribution Danish Foreign Investor distribution Danish Foreign Investor distribution 10% 70% 20% AARHUS 2.7 BN DKK 16% OTHER ZEALAND 98% 54% 32% 14% 1.6 BN DKK 10% GREATER COPENHAGEN 25% 37% 48% 15% 75% Old housing Danish 30% 70% Foreign Investor distribution Investor distribution Danish Foreign Investor distribution Danish Foreign Investor distribution Danish Foreign Investor distribution Danish Foreign Investor distribution 5.5 BN DKK 33% OTHER JUTLAND AND FUNEN 85% 49% 30% 21% 0.9 BN DKK 5% AARHUS 89% 19% 48% 33% 2.7 BN DKK 16% OTHER ZEALAND 98% 54% 32% 14% 1.6 BN DKK 10% GREATER COPENHAGEN 25% 37% 48% 15% 16.8 BN DKK Danish 34% Foreign 100% 66% 75% Old housing stock 19% 6.1 BN DKK 36% COPENHAGEN Danish 30% 70% Foreign Investor distribution Investor Danish Foreign Investor distribution Danish Foreign Investor distribution 10% 70% 20% AARHUS 2.7 BN DKK 16% OTHER ZEALAND 98% 54% 32% 14% 1.6 BN DKK 10% GREATER COPENHAGEN 25% 37% 48% 15% 16.8 VOLUME Others 33% Danish 66% 75% Old housing stock 19% Danish 30% 70% Foreign Investor distribution Danish Foreign Investor distribution Danish Foreign Investor distribution Danish Foreign Investor distribution Danish Foreign Investor distribution 5.5 BN DKK 33% OTHER JUTLAND AND FUNEN 85% 49% 30% 21% 0.9 BN DKK 5% AARHUS 89% 19% 48% 33% 2.7 BN DKK 16% OTHER ZEALAND 98% 54% 32% 14% 1.6 BN DKK 10% GREATER COPENHAGEN 25% 37% 48% 15% BN DKK Danish 34% Foreign 100% 66% 75% Old housing stock 19% 6.1 BN DKK 36% COPENHAGEN Danish 30% 70% Foreign Investor distribution Danish Foreign Investor distribution Danish Foreign Investor distribution 10% 70% 20% AARHUS 19% 2.7 BN DKK 16% OTHER ZEALAND 98% 54% 32% 14% 1.6 BN DKK 10% GREATER COPENHAGEN 25% 37% 48% 15% 75% Old housing 6.1 BN DKK 36% COPENHAGEN Danish 30% 70% Foreign Investor distribution Investor distribution Danish Foreign Investor distribution Danish Foreign Investor distribution Danish Foreign Investor distribution 10% 70% 20% 5.5 BN DKK 33% OTHER JUTLAND AND FUNEN 49% 30% 21% 0.9 BN DKK 5% AARHUS 89% 19% 48% 33% 2.7 BN DKK 16% OTHER ZEALAND 98% 54% 32% 14% 1.6 BN DKK 10% GREATER COPENHAGEN 25% 37% 48% 15% 16.8 BN DKK RESIDENTIAL VOLUME IN TOTAL Others 33% Market rent 48% Danish 34% Foreign 100% 66% 75% Old housing stock 19% 34 | RED Danish Investment Atlas 2024 Source: ReData MARKET RENT OLD HOUSING STOCK OTHERS RESIDENTIAL
GEOGRAPHICAL DISTRIBUTION
KEY FIGURES FOR ASSET TYPES
MARKET RENT
OLD HOUSING STOCK
*
OTHERS
Residential | 35 RESIDENTIAL
The value is impacted by the sale of a number of larger transactions with properties located outside Aarhus and in other regional growth cities.
The properties are characterised by very different characteristics, which is why the price per m² or the change herein is not shown. RESIDENTIAL
**
AREA NO. OF PROPERTIES VOLUME (M DKK) AVG. VOLUME (M DKK) WEIGHTED PRICE PER M² 2023 Δ 2022-2023 Copenhagen 13 4,246 326.6 45,300 -4% Greater Copenhagen 4 776 194.1 31,700 -6% Other Zealand 15 863 57.6 28,900 7% Aarhus 6 441 73.6 33,800 -14% Other Jutland & Funen 45 1,673 37.2 23,400* 23% Total 83 8,000 96.4 34,600 -7%
AREA NO. OF PROPERTIES VOLUME (M DKK) AVG. VOLUME (M DKK) WEIGHTED PRICE PER M² 2023 Δ 2022-2023 Copenhagen 28 1,187 42.4 26,100 -22% Greater Copenhagen 24 233 9.7 20,600 -18% Other Zealand 93 362 3.9 10,500 15% Aarhus 13 302 23.2 23,500 -25% Other Jutland & Funen 382 1,144 3.0 8,000 -11% Total 540 3,229 6.0 13,200 -3%
AREA NO. OF PROPERTIES VOLUME (M DKK) AVG. VOLUME (M DKK) WEIGHTED PRICE PER M² 2023 Δ 2022-2023 Total 634 5,573 8.8 N/A** N/A** HOTEL RETAIL LOGISTICS ANNUAL REVIEW OFFICE
GEOGRAPHICAL DISTRIBUTION
DECLINING ACTIVITY NATIONWIDE
Despite investors continuing to show significant interest in residential properties, investment activity declined in all geographical areas from 2022 to 2023 ( figure 21). This is mainly because the recent years’ yield compression had resulted in extremely low yield levels for residential properties across the country, making it more challenging to finance residential properties with the new higher interest rates. At the same time, the solid underlying conditions in the rental market also made it attractive for owners to keep their properties and instead get a reasonable cash flow, which caused the sellers to be unwilling to adjust their price expectations sufficiently to meet the buyers.
AARHUS LOSES TO COPENHAGEN
2023 also marked a year where we observed clear differences between the areas. Historically, Aarhus and Copenhagen have followed each other closely, but while the rental market in Copenhagen continued at a high pace in 2023, the completion of many new buildings in Aarhus resulted in a pressure on the rental market. This development is reflected in the fact that the investment activity and the prices per m² fell more in Aarhus than
in Copenhagen. As a result, residential properties in Copenhagen are now traded at an average price that is 34% higher than in Aarhus (see table on p. 35).
The fact that Aarhus and Copenhagen no longer follow the same trends is further reflected in foreign investors’ allocation of capital. While Danish investors were solely dominant in the “rest of Denmark” in 2022, they were dominant in all areas except Copenhagen in 2023. Thus, we once again witnessed a “flight to safety,” with foreign investors allocating their capital to the central areas where the risk is assessed to be the lowest.
OTHER ASSET TYPES ARE DRIVING THE MARKET
For the regions “Other Zealand” and “Other Jutland and Funen,” the increase in prices per m² reflected a completely opposite trend compared to the general market, primarily because the activity was driven by different asset types than previously.
While the volume in previous years was largely dominated by transactions with properties located across “Other Zealand”
and “Other Jutland and Funen”, the activity in 2023 was driven by the sale of several prime properties located in the most attractive cities of the areas (including suburbs of Aarhus, Odense, Rungsted, Birkerød, etc.) as well as the sale of NREP’s care homes.
THE WAITING PERIOD DESTROYS INVESTORS’ BUSINESS PLANS
When comparing the price developments of properties with free market rent determination with the properties in the old housing stock, it is evident that sellers of properties in the old housing stock have had to accept a significantly greater decline in the prices. This is because the government’s enactment of the waiting period has also affected these properties. While the current owners can modernise the properties from day one, new owners must wait until after the five-year waiting period before modernising the same property and increasing the rent. Thus, the waiting period has meant that new owners have to accept a longer period with a lower cash flow and that investors with a shorter time horizon (5-7 years) can no longer capture the properties’ potential within their investment horizon.
BN DKK 0 5 10 15 20 25 30 Source: ReData Danish Foreign COPENHAGEN GREATER COPENHAGEN AARHUS REST OF DENMARK 2023 2022 2021 2023 2022 2021 2023 2022 2021 2023 2022 2021 63% 37% 72% 28% 70% 30% 44% 56% 17% 83% 75% 69% 71% 29% 31% 35% 65% 25% 75% 89% 36 | RED Danish Investment Atlas 2024
Figure 21: Residential – Historic geographic breakdown 2021-2023
RESIDENTIAL
RED carries out the valuation of PenSam’s property portfolio, including the residential property located on Omøgade in Copenhagen.
Residential | 37 RESIDENTIAL
HOTEL RETAIL LOGISTICS ANNUAL REVIEW OFFICE
TOP 5 TRANSACTIONS 2023
NREP CARE HOMES
The largest residential transaction of the year took place in March when Northern Horizon acquired a portfolio with care homes from NREP. The portfolio consists of a total of six properties, two of which are in operation (located in Holte and Odense), whereas the remaining four properties (located in Sorø, Greve, Helsinge, and Kolding) are expected to be delivered between 2023 - 2025. In addition to the six residential properties, the portfolio includes two daycare institutions.
KØHLERS HAVE
In November 2023, the Finnish asset manager CapMan acquired Køhlers Have from NREP and AG Gruppen, who jointly developed and constructed the property. Køhlers Have is located in Copenhagen’s South Habour and comprises three buildings with a total of 384 rental apartments, two smaller retail units, and a parking basement. The building, which was built in 2022, was designed by Sweco Architects and was pre-certified with DGNB Gold.
38 | RED Danish Investment Atlas 2024
2 1
RESIDENTIAL
Photo: Northern Horizon Capital Photo: CapMan
Est. price (DKK) 1,500,000,000 Investor Northern Horizon Capital Gross area (m²) 41,887 Vendor NREP Price (DKK) 1,240,000,000 Investor CapMan Gross area (m²) 37,351 Vendor AG Gruppen & NREP
BECKMANN
TÅRN & VILHELM HUS
The German property investor Quantum Immobilien KVG entered the Danish market in September 2023 with the acquisition of the turnkey residential projects Beckmanns Tårn and Vilhelms Hus located in Carlsberg Byen. The projects are delivered by Udviklingsselskabet Carlsberg Byen and are expected to be completed in the spring of 2025. Beckmann Tårn and Vilhelms Hus will accommodate 196 apartments distributed over 20,000 m².

KOBBELVÆNGET
In November 2023, the German asset manager DWS Group acquired the newly constructed residential property Kobbelvænget from the Danish real estate company De Forenede Ejendomsselskaber. The property, which was completed in 2023, is located in a former industrial area in Brønshøj, north of Copenhagen, and comprises a total of 361 units (including 167 apartments, 170 micro-living apartments, and 24 townhouses).
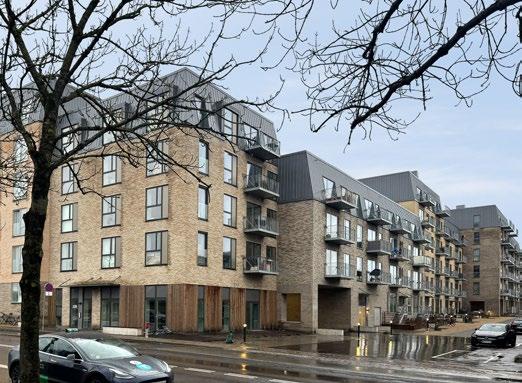
STRUNGES HUS & MØRCHS HUS
In December 2023, the French institutional investor Caisse des Dépôts entered the Danish market when they acquired the residential properties Strunges Hus and Mørchs Hus located in Ørestad, Copenhagen. The seller was Bellakvarter, which is owned by Sampension and AkademikerPension. The properties, which are certified with the DGNB Gold standard, comprise a total of 182 residential units and three commercial units.
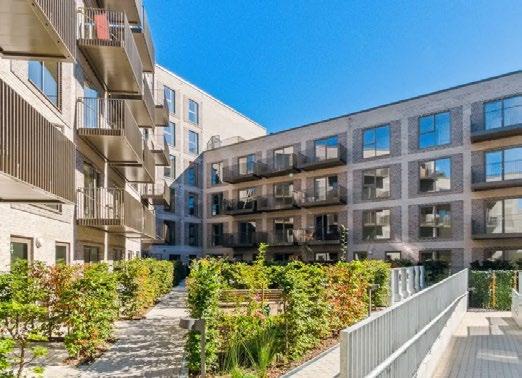
3
5 Residential | 39 RESIDENTIAL
4
Photo: Studio Sang, Architect: Dorte Mandrup
Photo: RED
The stated prices are for the transactions as a whole, which is why the prices may include uses other than residential. Price (DKK) 620,000,000 Investor Caisse des Dépôts Gross area (m²) 15,095 Vendor Sampension & AkademikerPension Est. price (DKK) 1,075,000,000 Investor Quantum Immobilien Gross area (m²) 20,186 Vendor Udviklingsselskabet Carlsberg Byen Est. price (DKK) 850,000,000 Investor DWS Group Gross area (m²) 22,338 Vendor De Forenede Ejendomsselskaber HOTEL RETAIL LOGISTICS ANNUAL REVIEW OFFICE
Photo: Colliers
INFLUENTIAL FOREIGN INVESTOR:
BOTH PROS AND CONS IN THE DANISH RESIDENTIAL MARKET
For many years, foreign investors have accounted for a significant share of investments in Danish residential properties, and with total investments of nearly DKK 10 billion, Orange Capital Partners has been the largest investor in the residential segment from 2021-2023.
In the following interview, Managing Partner at Orange Capital Partners, Hedde Retisma, explains what advantages and disadvantages they see in investing in residential properties in Denmark and how economic factors and regulatory changes affect their investment decisions.

HEDDE RETISMA
Hedde Reitsma is Managing Partner at Orange Capital Partners. Hedde previously worked at Goldman Sachs in London and graduated from Erasmus University Rotterdam in Finance & Economics.
Orange Capital Partners is a European real estate investment and asset management company with offices in Amsterdam, Dublin, Copenhagen and Helsinki. The company was founded in 2014 and acts as a joint venture partner for sovereign wealth funds, international pension funds, investment banks and family offices.
40 | RED Danish Investment Atlas 2024
What advantages do you find in investing in residential rental properties in Denmark?
Denmark, much like our home country, the Netherlands, benefits from a diversified economy with high average education levels, low unemployment, sound social welfare systems, and political stability. All these fundamental characteristics are crucial to longterm investors like ourselves.
Additionally, given the size of the Danish economy, the Danish real estate investment market is fairly liquid, benefits from a very attractive bank financing climate, and has an easy-to-understand and logical regulatory backdrop. Compared to the other countries that OCP is active in, the Danish investment market has a sizable share of high-quality newly built residential properties with a strong sustainability footprint as part of the transaction market.
What disadvantages do you find in investing in residential rental properties in Denmark?
Apart from (Greater) Copenhagen, there is some degree of imbalance in supply and demand characteristics in the rest of the country. We see excess supply in cities like Aarhus and Odense, with price expectations not necessarily reflecting the same. Thus, from a pure risk-reward basis, in our opinion, the best opportunities are centred around the greater Copenhagen area.
Also, operating in a strong economy comes at a cost, and therefore, operating in Denmark is expensive compared to the other countries we operate in, with property administration fees being high in absolute and relative terms. The high costs are also reflected in the net market yields, which are lower than in our other operating markets.
Also, operating in a strong economy comes at a cost, and therefore, operating in Denmark is expensive compared to the other countries we operate in, with property administration fees being high in absolute and relative terms.”
Hedde Retisma Managing Partner, Orange Capital Partners
We can see that – so far – you have only invested in newly built residential properties in Denmark. What prevents you from investing in the old housing stock?
Generally, we are not opposed to investing in old housing stock. We own significant old housing portfolios in other countries where we are able to implement extensive sustainability capex programmes. In the past, we have assessed old housing stock cases in Denmark as well.
That said, the implementation of the new regulation late in 2019 drove a wedge between bid and ask prices. A seller who is allowed to renovate units would demand more for its portfolio than a buyer (who is not allowed to do the same for the first five years) would be able to pay. Furthermore, old housing stock properties are characterised by low yields and low cash flows, which impacts their financeability considerably. As such, as per observations, the trans action market in the old housing stock has been frozen to a large extent since that regulation, and we have accordingly not participated in it.
How do you expect the rental and yield in the residential segment to develop in the coming year?
In absolute terms, in-place rents will not grow by much this year, given the low YoY NPI numbers. That said, we have a positive outlook on the development of market rents, particularly in (Greater) Copenhagen, driven by high expected wage growth over the next couple of years, wherein wages are expected to increase by 10% over this period.
As for the yields, it is important to note that Denmark has one of the lowest inflation readings in North-Western Europe. Globally, barring another shock, we expect interest rates and, thus, yields to top out in the first half of 2024, with a sustained downward drift thereafter.
Apart from (Greater) Copenhagen, there is some degree of imbalance in supply and demand characteristics in the rest of the country. We see excess supply in cities like Aarhus and Odense, with price expectations not necessarily reflecting the same.”
Residential | 41 RESIDENTIAL
HOTEL RETAIL LOGISTICS ANNUAL REVIEW OFFICE
Hedde Retisma Managing Partner, Orange Capital Partners
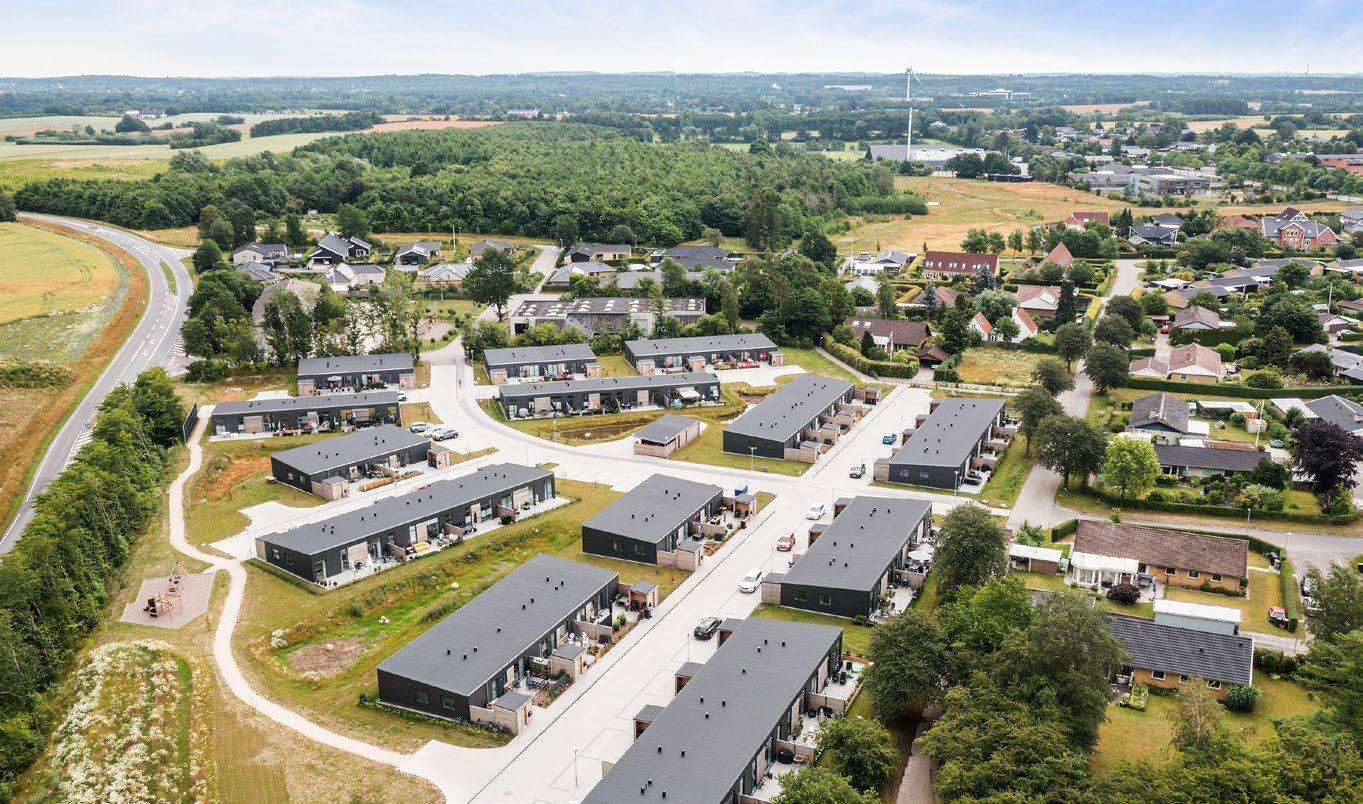

Torben Røsler founded Ejendomsselskabet Casa Nord in 2004 and is currently the Managing Director of the company. In addition to his role in the company, Torben has experience from several board and executive positions in the Danish business sector.
Ejendomsselskabet Casa Nord is a property development company focusing on the residential segment. The company is behind a series of development projects for both private individuals, retail, and commercial.
BN DKK 0 2 4 6 8 10 2023 2022 2021 2020 2019 2018 2017 2016 2015 2014 42 | RED Danish Investment Atlas 2024
TORBEN RØSLER
Figure 22: Residential building rights – Transaction volume 2014-2023
THE DEVELOPERS’ BUSINESS PLANS ARE CHALLENGED
Continued high construction costs, higher financing costs and the sellers’ unchanged price expectations for land continue to challenge the developers’ business plans, which is reflected in a significant decline in the transaction activity with building rights ( figure 22). In the following interview, Managing Director of Ejendomsselskabet Casa Nord, Torben Røsler, shares his perspective on how the developers’ business plans have changed.
How have your development cases within the residential segment changed in recent years?
The price of building rights has decreased slightly, but not as much as we had expected. Material prices have fallen quite a bit – but not for steel and concrete, where the prices remain high (RED: see figure 23). Strangely enough, labour costs have not fallen yet – but I expect they will do so shortly. We hear that many contractors do not have enough projects on the other side of new year (RED: 2023/2024), and there are no significant supply problems at the moment.
Do you observe any general changes in your development projects?
Yes, there are some changes in the market. The homes are becoming smaller to accommodate a lower rent and sales price. Due to significantly higher construction financing – both in terms of the interest rate and equity financing – I do not expect that we will make the same profit on our projects. We have typically had a margin of 20%, and now I expect that we will come down to a 14-15% margin.
Which factors do you expect will be decisive for the construction activity in the real estate market in the coming year?
The interest rate will clearly be the most decisive factor – but we do not expect any change in this in 2024. So, it will be a flat year in which we reduce our construction activities by 50%.
This means that we will only initiate half of our projects and wait for an improvement in the market before initiating more of our projects or acquiring new building plots.
Right now, we keep our arms close to the body and observe the situation.
CONSTRUCTION COST INDEX (INDEX 100=2015) LONG-TERM INTEREST RATE 90 95 100 105 110 115 120 125 130 135 2023 2022 2021 2020 2019 2018 2017 2016 2015 0.00% 1.00% 2.00% 3.00% 4.00% 5.00% 6.00% Materials Labor costs Long-term interest rate Residential | 43 RESIDENTIAL
HOTEL RETAIL LOGISTICS ANNUAL REVIEW OFFICE
Figure 23: Construction costs and the long-term interest rate (13-week moving average)
RENTING BEATS OWNING – FOR A LITTLE LONGER
Historically high condominium prices, doubledigit inflation figures, rising interest rates and other uncertainties in the market resulted in expectations of declining owner-occupied housing prices. However, the owner-occupied market in Copenhagen has surprisingly maintained its high price levels, resulting in a high housing burden for homeowners and, thereby, a fragile market. Thus, after a long period with attractive conditions on the owner-occupied market, the situation has now reversed, with the economic advantages leaning towards the rental market.
Now, the question is whether renting can maintain its economic superiority over owning in the long run or if we will witness a price correction in the owner-occupied market, as proved by historical trends.
INTEREST RATE FLUCTUATIONS
AFFECT CONDOMINIUM PRICES
Increasing interest rates make it more expensive for buyers and existing homeowners (with variable loans) to finance their loans.
History shows that while short-term interest rate fluctuations have no notable effects on prices, long-term and significant interest rate increases have led to lower demand and, thus, a decrease in the number of transactions and, ultimately, a decrease in the condominium prices ( figure 24).
THE PRICES REMAIN HIGH
Even though buyers are facing more expensive financing terms, the condominiums in Copenhagen have maintained a surprisingly high price level. As a result of increasing interest rates, we saw a drop in condominium prices at the end of 2022 and the
INDEX DEALS, PRICES AND INTEREST RATE INDEX HOUSING BURDEN 0 30 60 90 120 150 180 2023 2021 2019 2017 2015 2013 2011 2009 2007 2005 Condominium prices No. of transactions Long-term interest rate Housing burden 0 50 100 150 200 250 300 44 | RED Danish Investment Atlas 2024
Figure 24: No. of deals, prices, long-term interest rate & housing burden – Copenhagen (index 100 = 2005)
Source: Realkredit Danmark, Finans Danmark and Statistics Denmark
ASSUMPTIONS
– OWNER- OCCUPIED HOME
• Owner-occupied apartment in Copenhagen Municipality
• 95% leverage (80% mortgage & 15% bank loan)
• Fixed-rate mortgage loan
• No installments on the debt
• Expense for owner’s association on DKK 2,000 per month
ASSUMPTIONS
– RENTAL HOME
• Rental apartment in Copenhagen Municipality
• Market rent
• Indicative rent upper quartile
beginning of 2023. However, paradoxically, we witnessed an upswing in both the number of transactions and the sales prices in Copenhagen at the end of 2023. One explanation for this paradox lies in the new tax regulations that are expected to result in significant increases in property taxes in the big cities in the future, and many buyers, therefore, received a permanent tax discount if they acquired their home before the turn of the year 2023/2024.
OWNING VS. RENTING
When searching for a home, residents will consider the advantages and disadvantages of the two alternatives, especially the monthly expenses of owning vs. renting.
By comparing the monthly costs of owning a 90 m² property in Copenhagen with the monthly rent for the same apartment (free rent determination), it has for many years (2010-2022) been cheaper to be on the owner-occupied market rather than the rental market ( figure 25).
LEASING IS CURRENTLY THE CHEAPEST SOLUTION
Thus, a significant disadvantage for tenants in Copenhagen has historically been that it has been more expensive to live in a rental home than in a similar owner-occupied home. On the other hand, there are also several advantages to rental housing in Denmark. Among other things, tenants enjoy greater
Monthly expenses for 90 m2 owner-occupied home in Copenhagen Recession
Monthly rent for 90 m2 rental home in Copenhagen
Source: Realkredit Danmark and Cushman & Wakefield | RED
flexibility, fewer obligations, and lower equity requirements. At the same time, tenants do not have to worry about unforeseen costs for maintenance and repairs or whether the value of their condominium declines due to external factors (macroeconomic fluctuations, demographic development, etc.).
After many years where the monthly expenses of owning have been lower than for renting, the combination of the higher interest rates and the continued high prices has meant that the monthly costs for owner-occupied homes have risen significantly more than the monthly rent for similar rental homes, which is why it is currently cheaper to rent than to own.
THE HOUSING BURDEN SEEMS UNSUSTAINABLE
The housing burden, which is calculated by Realkredit Danmark, tells how much of your disposable income one must spend on owning a home. In fact, the housing burden of owning today is at the same level as just before the financial crisis. Therefore, the current housing burden of living in an owner-occupied condominium seems fragile –both when comparing the housing burden to historical levels or when considering the monthly expenses of owning versus renting.
WHAT CAN WE LEARN FROM HISTORY?
Now, the question is what it will take to return to normal conditions on the owner- occupied market.
The last time we witnessed a situation like today was just before the prices crashed during the financial crisis (from 2006 until 2009) when owning was more expensive than renting in Copenhagen. After this period, with a historically high (and increasing) housing burden, the prices on the owner-occupied market in Copenhagen declined.
THE PRICES OR THE INTEREST RATE MUST DROP FURTHER
We can only speculate on whether we are going to see a decline in the owner-occupied housing prices. However, one thing is certain. The housing burden must be normalised before the owner-occupied market becomes attractive again, and this will require a further decline in either the interest rates or the condominium prices.
If the economists’ expectations of stable or only slightly decreasing interest rates hold, the condominium prices will become under pressure, as history shows that it needs to be economically advantageous for residents to take on the risk of investing in owner- occupied homes rather than signing a lease.
5,000 10,000 15,000 20,000 2023 2021 2019 2017 2015 2013 2011 2009 2007 2005
MONTH
EXPENSES PER
Residential | 45 RESIDENTIAL
Figure 25: Expenses per month – 90 m² owner-occupied vs. rental home – Copenhagen
HOTEL RETAIL LOGISTICS ANNUAL REVIEW OFFICE
THE HOUSING MARKET
A CAPITAL GAINS TAX OF 50% CAN BE THE SOLUTION
The new property assessment system made many headlines in 2023 – and it was not with words of praise. A system that is the most expensive in the Danish history, yet filled with errors and randomness, has created distrust among the population. Therefore, we have made a calculation of how to implement a simple capital gains tax on private homes to generate the same revenue as the land tax and property value taxation generate now.
THE POPULATION’S TRUST HAS DISAPPEARED
We have reached a point where i) confidence in the property assessment system is so low, ii) taxation appears random, and iii) the costs associated with collecting property taxes can no longer justify continuing the current tax legislation in the private housing sector.
There seem to be no good arguments left for the current system - other than a political stubbornness to maintain the ongoing annual property taxation of real estate (for which most have forgotten the rationale) and a corresponding stubbornness regarding implementing the new property assessment system – no matter the cost.
It is simply not a fair way to manage citizens’ tax contributions or legal rights. At the same time, it is against better judgment, as experts have warned about the lack of accuracy in the property assessment system and the bureaucracy that comes with it. Most recently, IT experts have warned that the costs for improving and maintaining the system will continue to be in the billionkroner range and that it is not expected that it will be possible to successfully implement a system citizens will find precise or fair.
THE SOLUTION IS OBVIOUS
The reasonable and legislative solution has been evident all along, and more and more voices in the debate are now also beginning to suggest that a capital gains tax would be the right path to take if one wants to replace the extensive bureaucracy with a simple legal text that the citizens can understand and see the justice in. That is, you are only taxed when you sell your home, and you are taxed on the profit you have had during your ownership.
WHY IS IT SMART?
It is, first and foremost, smart because it represents a fairer taxation. You are only taxed on actual gains realised - not on unrealised price increases as it is now. It is a form
Right now, there is a political opportunity to get rid of the ongoing annual property taxation once and for all – so better late than never.
Lior Koren Partner and Head of Capital Markets, RED
of taxation that citizens can understand, and it is expected that most people will be able to see the fairness in taxing significant taxfree profits in line with profits on securities, earned income, etc.
Furthermore, the new IT system for property assessment can be scrapped, and the forthcoming billion-kroner bills for its improvement can be saved. The IT systems for capital gains taxation are already in place, as we have a very well-functioning land registration system where sales prices are recorded quickly, efficiently, and correctly.
The rapidly growing Danish Property Assessment Agency, which now has over 900 employees, could also be significantly reduced, and the ongoing billion-kroner expense for the agency could be saved. Politicians from across the spectrum agree on reducing bureaucracy in the state and municipalities – here is the obvious opportunity.
BETTER LATE THAN NEVER
It can be painful to discard failed investments. The economic term is ’sunk cost.’ In plain Danish, it means that one should not throw good money after bad. However, right now, there is a political opportunity to get
46 | RED Danish Investment Atlas 2024
rid of the ongoing annual property taxation once and for all – so better late than never.
WHICH TAX SHOULD REPLACE THE LAND TAX AND PROPERTY VALUE TAXATION?
The revenue from land tax and property value taxation (i.e., the tax revenue) has been in the range of DKK 28-34 bn over the past ten years, where the land taxes have accounted for slightly more than half of the total revenue. This tax revenue is thus what should be collected through an alternative taxation.
Our proposal for capital gains taxation can be formulated simply as: (Sales price ÷ Improvements ÷ Purchase price) x Tax rate. Since one should not be double-taxed on the improvements made during ownership, the documented expenses for this should be deducted from the sales proceeds. In our calculations, we have estimated that 10% of the
value increases can be attributed to improvements. In practice, a simple portal can be created to handle improvements, where receipts for materials and work on home improvements can be uploaded. A positive side effect of this would be a significant reduction in the amount of undeclared work.
The conclusion of our calculations is that if, over the past ten years, there had been taxation where capital gains were taxed based on the above formula, a tax rate of 34.7% would have been needed to achieve the same tax revenue as land tax and property value taxation currently generate.
A simple proposal for rebuilding trust
The reference period of the past ten years has been during a boom, where there predominantly have been price increases. Therefore, going forward, one should assume a more conservative price
development. Therefore, our headline suggests that a tax rate of 50% on property profits could be the new starting point.
The purpose of this contribution to the debate is to demonstrate that capital gains taxation is economically feasible. There would be sufficient proceeds to phase out the ongoing taxation.
We leave it to the politicians to assess the need for various transitional provisions and to formulate them.
The entire basis for our calculations is freely available on our website, and there is certainly a need for fine-tuning by the Ministry of Taxation’s economists. However, this is a proposal for a system that we believe will restore citizens’ trust in the Danish tax system.
Residential | 47 RESIDENTIAL
PROPERTY SALES AND TAXES IN THE LAST 10 YEARS PER HOME Average sales price per home 2,290,000 Average purchase price per home* 820,000 Average profit per home 1,470,000 Deduction for improvements** 147,000 Tax base per home 1,323,000 TOTAL Average no. of home sales per year 68,621 Average tax base per year 90.8 BN DKK Average land taxes per year 17.4 BN DKK Average property value taxes per year 14.1 BN DKK Average total tax revenue per year 31.5 BN DKK Average theoretical tax rate on the profit 34.70% * Based on an estimated avg. sales frequency on 20 years. ** Estimated 10% of the profit. HOTEL RETAIL LOGISTICS ANNUAL REVIEW OFFICE
EXPECTATIONS FOR 2024
In recent years, substantial increases in interest rates have caused an upward pressure on the yield requirements for residential properties. However, by the end of 2023, we witnessed increasing optimism and activity in the residential segment, where yield levels seem to have stabilised. In 2024, we expect to see a continued high tenant demand for rental properties and stable yield requirements for newly built residential properties. This is partly driven by high interest rates, resulting in a very high housing burden on the owner-occupied housing market.
THE OCCUPIER MARKET
OWNER-OCCUPIED HOUSING PRICES WILL PUSH PEOPLE TO RENTAL PROPERTIES
In 2024, we expect that the high demand for rental properties will continue. This is particularly derived from the current interest rate levels, creating a very high housing burden on the owner-occupied market, thereby pushing residents towards the rental market.
Even if the housing burden on the owneroccupied market normalises in the coming period, we expect to see a continued high demand for rental housing in the country’s largest cities. This expectation is based on the fact that there is (and will continue to be) a large migration to the largest cities and an undersupply of rental housing in Copenhagen, which is a result of the fact that there are few development opportunities left.
INCREASING RENT LEVELS IN COPENHAGEN
While we expect to see increasing rent levels in Copenhagen, we expect that the rent levels in Greater Copenhagen will remain more stable. This expectation is based on the fact that we have seen a significant construction

activity in the surrounding municipalities in recent years, resulting in a supply that can meet the demand for newly built homes.
Our expectation of a more stable but still strong residential market in Copen hagen is supported by our investor survey, which shows that the majority of investors in Q1 2024 expect stable or increasing rent levels in Copenhagen ( figure 26). Moving further out to the provinces, most investors expect the rent levels to remain unchanged ( figure 27).
COPENHAGEN OUTCOMPETES AARHUS
Historically, Aarhus and Copenhagen have followed each other closely. However, in 2023, we saw that the Copenhagen market outcompeted Aarhus as the completion of several residential properties in Aarhus led to an oversupply, putting pressure on the rent levels and extending leasing periods. Therefore, we expect to see a significant competition for tenants in Aarhus in 2024, resulting in stable to decreasing rent levels.
Our investor survey shows that the investors have picked up on these trends in Aarhus, as
nearly half of the investors expect decreasing rent levels in 2024 ( figure 28).
THE INVESTMENT MARKET
STABLE YIELD LEVELS
Due to significant increases in interest rates, the buyers adjusted their price expectations in 2023, resulting in low transaction volumes and increasing yield requirements. Prime yield requirements in Copenhagen currently range between 3.90% (down to 3.75% for the most prime locations) and 4.25%. In the surrounding municipalities, investors still apply a risk premium, and the yields for newly built properties are, therefore, in the range 4.50-5.00%.
However, based on an increasing optimism and expectations of interest rate drops, we expect that the yield requirements in the residential segment have stabilised and will remain unchanged in the coming time. This expectation is based on the fact that by the end of 2023 there was an increased activity in the segment, where several transactions with newly built residential properties were
However, based on an increasing optimism and expectations of interest rate drops, we expect that the yield requirements in the residential segment have stabilised and will remain unchanged in the coming time.”
Kjeld Pedersen Partner, Capital Markets, RED
48 | RED Danish Investment Atlas 2024
RESIDENTIAL
in process or completed. Moreover, the yield requirements in the surrounding municipalities have reached a level where even investors using leverage can make profitable business plans.
LOWER LIMIT FOR PRIME ASSETS
Although yield requirements in Copen hagen are still low compared to the financing rate, we do not expect further upward pressure on the yield level for residential properties in Copenhagen. This expectation is based on prospects of decreasing interest rates, a continued high (though somewhat lower) investor appetite, and the investors having confidence in future rent increases in Copenhagen, ensuring an attractive yield in the long run. Furthermore, the persistently high prices on owner-occupied housing set
a lower limit for prices of condominiumdivided residential properties, as investors have the option to sell the units on the owner- occupied market.
The increasing optimism and our expectations of stable yield requirements for residential properties are supported by our investor survey. While the majority of investors expected increasing yield requirements a year ago, the majority (60%) now expect stable yield requirements, and more than one-fourth expect decreasing yield requirements ( figure 29).
RENT-CONTROLLED PROPERTIES ARE FOR LONG-TERM INVESTORS
The introduction of the waiting period for rent-controlled properties implies that the
During the coming six months, the market rent for residential units will:
COPENHAGEN
During the coming six months, the market rent for residential units will:
AARHUS
The Cushman & Wakefield | RED Investor Confidence Index
The index monitors 115 of the most active investors’ expectations for the Danish commercial real estate market during the coming six months. The broad coverage ensures that the findings are representative reflections of the investors’ confidence in the Danish market. By conducting the survey on a biannual basis, we are also able to track changes in the confidence.
segment will continue to be a marketplace for investors with a long investment horizon. In addition to requiring significant equity from investors (as these properties are challenging to finance), buyers can only relet the homes according to the rules for thoroughly improved homes after five years of ownership and a comprehensive refurbishment.
Therefore, the investor demand for rentcontrolled properties will continue (primarily) to be from Danish investors with long-term business plans and the ability to purchase with a large share of equity. In 2024, we expect to see slightly more investments in rent-controlled properties, but still far from the level seen before the legal intervention and the interest rate hikes.
During the coming six months, the market rent for residential units will:
THE PROVINCES
During the coming six months, market yields for residential properties will:
49% 37% 49% 57% 49% 47% 37% 29% 58% 56% 15% 14% 58% 41% 12% 13% 59% 58% 64% 60% 30% 23% 30% 46% 24% 26% 12% 13% 19% 15% 56% 61% 25% 24% 17% Q1 2024 Q1 2024 Q3 2023 Q1 2023 Q3 2022 Q1 2024 Q3 2023 Q1 2023 Q3 2022 Q1 2024 Q3 2023 Q1 2023 Q3 2022 Residential | 49 RESIDENTIAL
Increase Remain stable Decrease Increase Remain stable Decrease
Figure 28: Investor Confidence Index – Residential market rent
Figure 29: Investor Confidence Index – Residential yields
Figure 27: Investor Confidence Index – Residential market rent
Figure 26: Investor Confidence Index – Residential market rent
Increase Remain stable Decrease
Increase Remain stable Decrease
HOTEL RETAIL LOGISTICS ANNUAL REVIEW OFFICE
50 | RED Danish Investment Atlas 2024 PROPERTY CITY MONTH GROSS AREA PRICE (DKK) INVESTOR VENDOR 1 NREP care homes Across nation March 41,887 m2 1,500,000,000* Northern Horizon Capital NREP 2 Køhlers Have Copenhagen SW November 37,351 m2 1,240,000,000 CapMan AG Gruppen & NREP
Beckmanns Tårn & Vilhelm Hus Copenhagen W September 20,186 m2 1,075,000,000* Quantum Immobilien Udviklingsselskabet Carlsberg Byen 4 Kobbelvænget Brønshøj November 22,338 m2 850,000,000* DWS Group De Forenede Ejendomsselskaber 5 Strunges Hus & Mørchs Hus Copenhagen S December 15,095 m2 620,000,000 Caisse des Dépôts Sampension & AkademikerPension 6 Pareto Sec. portfolio Jutland January 23,026 m2 607,300,000 Round Hill Capital Pareto Securities 7 Herning+ Herning February 17,000 m2 425,000,000* PKA Nordstern 8 Vejlesvinget Vallensbæk Strand October 17,116 m2 406,368,000 Round Hill Capital Invesco 9 Kilehaven Birkerød October 9,200 m2 300,000,000* Velliv Nordstern 10 A Place To Esbjerg February 8,020 m2 267,600,000* Heimstaden Windrose Partners 11 Gammel Jernbanevej 27 Valby April 9,164 m2 248,850,000 Viga Real Estate Patrizia 12 Lyspunktet Aarhus N October 7,809 m2 220,000,000* OPA Ejendomsinvest Domis 13 Erik Olesens Ejendomsselskab portfolio Greater Copenhagen December 8,108 m2 201,000,000 Pears Erik Olesens Ejendomsselskab 14 Kong Georgs Vej 57A Frederiksberg May 3,616 m2 195,000,000* Walter Immobilien Bonum Development & SEBC 15 Minos Park Aalborg SE October 7,469 m2 182,500,000* Kong Minos Vej Holding Brudebakke Holding 16 Solgården Aarhus C November 8,098 m2 175,500,000 Vidar Ejendomme Privat Investor 17 Amalieparken Vallensbæk Strand February 5,497 m2 172,500,000* Sampension Livsforsikring Scandinavian Property Development 18 AB Grønne Eng Copenhagen S June 3,961 m2 156,114,000 Andelsboligforeningen Grønne Eng FB Gruppen 19 Ballerup Boulevard 11 Skovlunde January 5,151 m2 155,000,000* Koncenton 1927 Estate 20 Dades portfolio Greater Copenhagen September 6,283 m2 149,200,000 Pears Dades 21 Ringstedgade 58 Roskilde October 5,880 m2 148,000,000 Koncenton Tjærebygård Holding 22 Skovsbo Eng 1 Svendborg March 6,200 m2 140,000,000 Koncenton Milton Huse 23 Spinderiparken Slagelse November 4,959 m2 140,000,000* StockRate Holding Vest-Invest Holding 24 Signaturbyen Odense W August 5,634 m2 125,000,000 BlackRock Gartnerbyen 25 Blomsterhaven Tilst February 4,070 m2 120,972,000 Koncenton 1927 Estate 26 Roskildevej 33A Frederiksberg March 2,506 m2 119,700,000 Viga Real Estate Mathiesen Familieholding 27 Horsevænget 27 Hillerød April 6,752 m2 115,000,000* Bimse Elverhøj Investment Group 28 Snærild Bakke Odder June 4,275 m2 112,700,000* Snærildgaard 2018 Milton Huse 29 Hanebakken Frederiksværk March 4,437 m2 110,000,000 Koncenton Nectar Invest 30 Vesterbrogade 162 Frederiksberg C June 4,620 m2 98,000,000 Platan Holding Andelsboligforeningen Vesterbrogade 162/ Platanvej 32 * Estimated price Source: ReData RESIDENTIAL – TOP 30 TRANSACTIONS 2023 RESIDENTIAL TRANSACTIONS
3
KEY FIGURES
The tables below show statistics on the offering rent and the offering period for residential leases with free rent determination in 2023, based on 48,387 observations. Moreover, the expected prime yield for Q1 2024 is stated.
COPENHAGEN
GREATER COPENHAGEN
OTHER ZEALAND
AARHUS
OTHER JUTLAND & FUNEN
* The average offering rent is based on 48,387 observations from 2023, and is stated in DKK per m² per year (rounded).
** The figure indicates the change in the offering rent (in %) and in the offering period (in days) from 2022 to 2023.
*** The average offering period is the number of days, in which the lease was offered on the market.
Residential | 51 RESIDENTIAL
RESIDENTIAL
SIZE OFFERING RENT* OFFERING PERIOD*** (M 2) 2023 ∆ 22-23** 2023 ∆ 22-23** 0 - 55 2,660 6% 38 1 56 - 70 2,220 4% 37 9 71 - 85 2,050 3% 31 2 86 - 100 1,960 5% 38 6 101 - 115 1,930 5% 44 3 116 - 130 1,900 6% 45 6 > 130 1,880 7% 51 8 Average 2,050 5% 39 4
SIZE OFFERING RENT* OFFERING PERIOD*** (M 2) 2023 ∆ 22-23** 2023 ∆ 22-23** 0 - 55 2,110 -1% 46 11 56 - 70 1,890 2% 50 17 71 - 85 1,770 3% 61 26 86 - 100 1,710 -1% 61 17 101 - 115 1,610 1% 59 19 116 - 130 1,600 0% 60 19 > 130 1,800 10% 63 19 Average 1,750 1% 58 19
SIZE OFFERING RENT* OFFERING PERIOD*** (M 2) 2023 ∆ 22-23** 2023 ∆ 22-23** 0 - 55 1,490 8% 31 14 56 - 70 1,410 9% 32 13 71 - 85 1,390 10% 42 9 86 - 100 1,350 8% 43 11 101 - 115 1,330 8% 51 10 116 - 130 1,220 13% 52 15 > 130 1,070 10% 56 6 Average 1,290 9% 43 12
SIZE OFFERING RENT* OFFERING PERIOD*** (M 2) 2023 ∆ 22-23** 2023 ∆ 22-23** 0 - 55 1,690 2% 44 7 56 - 70 1,550 2% 46 9 71 - 85 1,460 1% 47 15 86 - 100 1,400 1% 53 14 101 - 115 1,370 1% 51 19 116 - 130 1,310 3% 50 20 > 130 1,230 2% 55 19 Average 1,480 2% 47 15
SIZE OFFERING RENT* OFFERING PERIOD*** (M 2) 2023 ∆ 22-23** 2023 ∆ 22-23** 0 - 55 1,150 6% 46 11 56 - 70 1,050 3% 50 13 71 - 85 1,020 5% 55 16 86 - 100 1,000 6% 57 16 101 - 115 990 8% 60 19 116 - 130 940 9% 60 17 > 130 770 11% 59 16 Average 1,000 6% 54 15 PRIME YIELD Q1 2024 3.75-4.25% PRIME YIELD Q1 2024 4.50-5.00% PRIME YIELD Q1 2024 5.00-5.75% PRIME YIELD Q1 2024 4.00-4.75% PRIME YIELD Q1 2024 5.00-6.00% HOTEL RETAIL LOGISTICS ANNUAL REVIEW OFFICE
On behalf of AKF Holding, RED facilitated the sale of ten warehouse and logistics properties located in Greater Copenhagen to Blackstone.
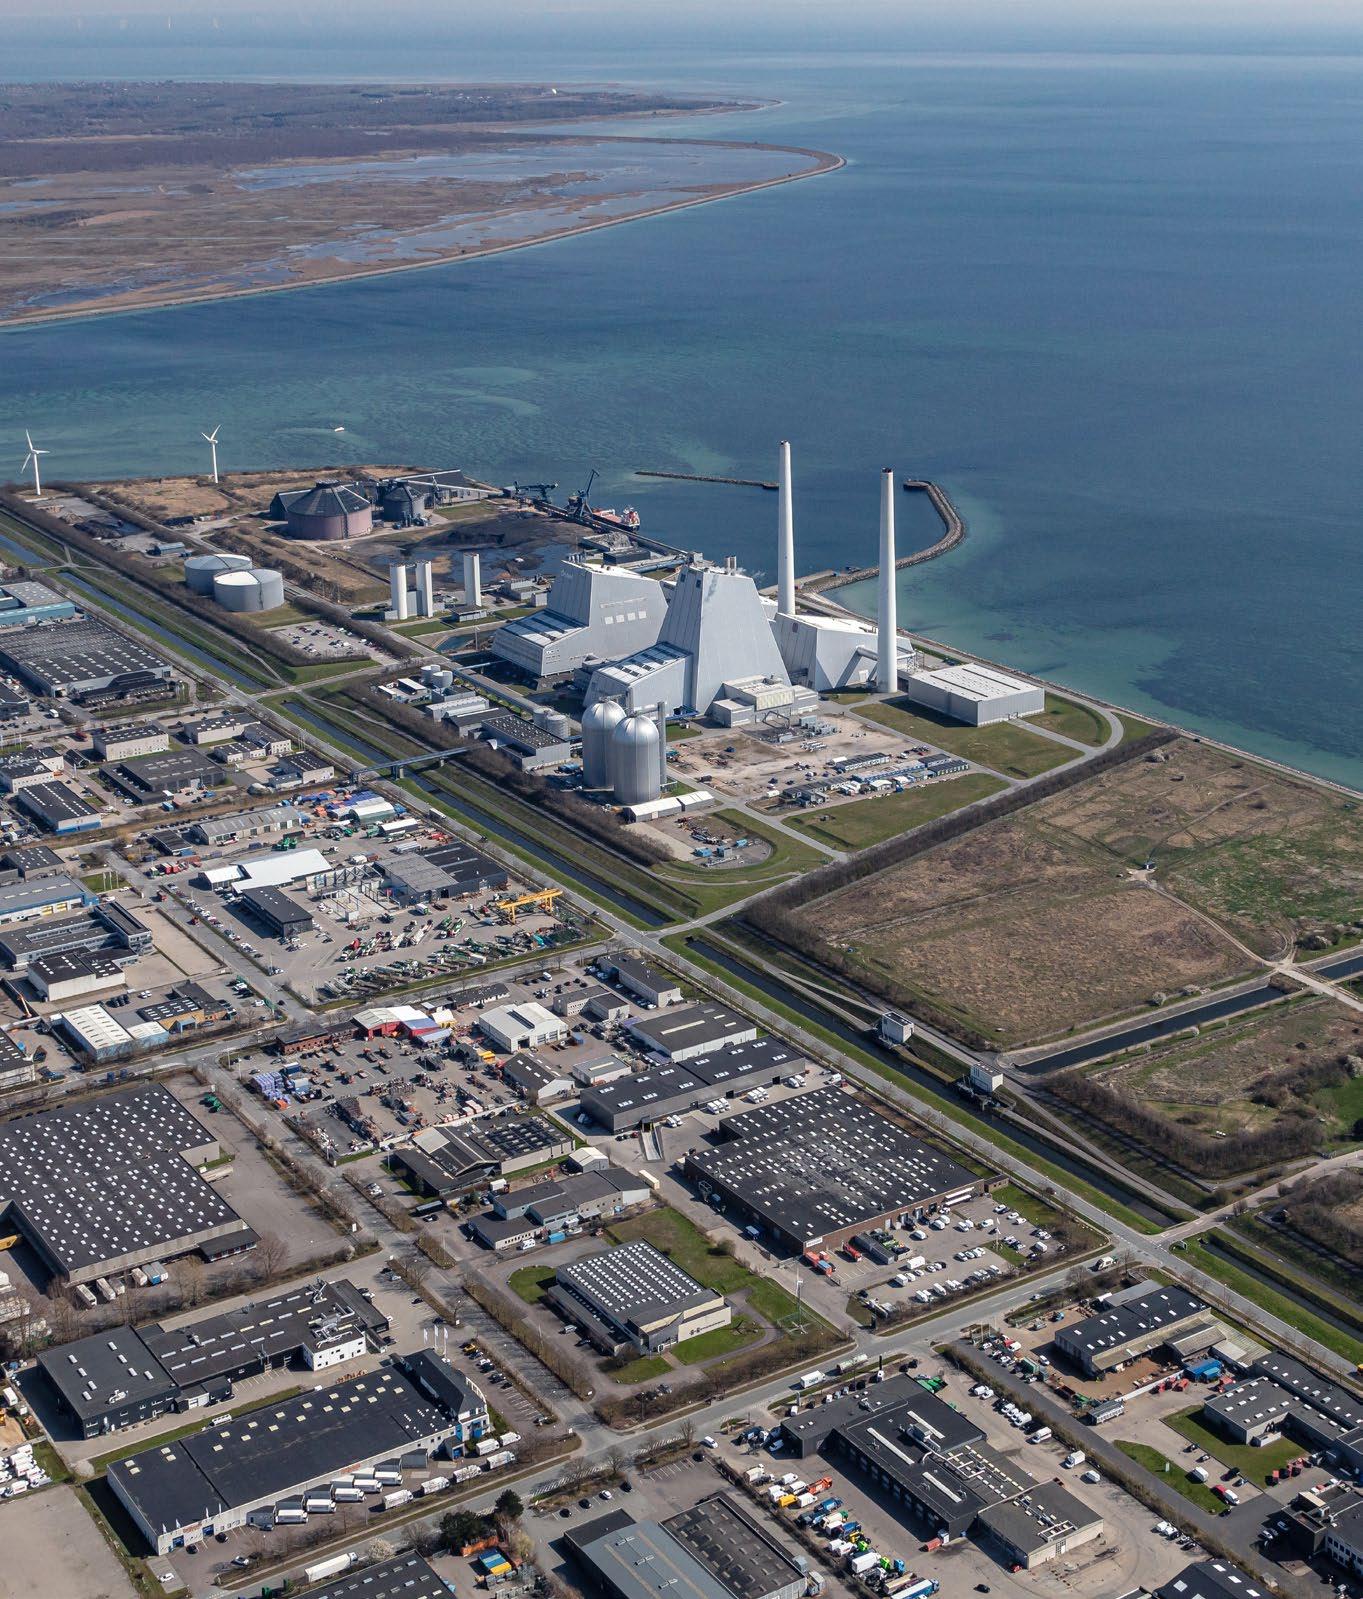
52 | RED Danish Investment Atlas 2024
When
Logistics | 53 LOGISTICS LOGISTICS Volume & Investors Geographical Distribution Top 5 Transactions 2023 Interview: From Core to Value-Add, but What Now? Expectations for 2024 Transactions & Key Figures 54 56 60 62 66 68
the logistics segment is mentioned in this publication, the term ’logistics’ not only includes logistics properties but also industrial and warehouse properties. HOTEL RETAIL RESIDENTIAL ANNUAL REVIEW OFFICE
VOLUME & INVESTORS
THE SECOND LARGEST SEGMENT
With a transaction volume of DKK 8.9 bn ( figure 32), the logistics segment accounted for 20% of the total volume, and for the first time ever, the logistics segment took the place as the second largest segment in Denmark. However, there was close competition between the logistics and the office segments, with only a few hundred thousand in difference separating the segments from claiming the positions as the second and third-largest segments of the year.
VALUE-ADD BECAME A HIT
Although the segment went from being the fourth largest segment to the second largest segment, the transaction volume fell by 35% in 2023. The reasoning behind the lower volume can be attributed to the high interest rates during the year, which created an upward pressure on the yield requirements for core assets and made it difficult for buyers and sellers to meet. Instead, we saw that investors were increasingly looking towards value-add properties in the search for higher yields.
DANISH CAPITAL DOMINATES
In recent years, foreign investors have left a significant mark on the Danish logistics
market, but for the first time since 2019, Danish capital dominated, as they were behind 56% of the total investment volume in the segment in 2023 ( figure 30).
While the volume invested by Danish investors remained at approximately the same level in 2023 as in 2022, foreign investors invested less than half of the volume they invested in the previous year. This is because the yield requirements for Danish logistics properties have historically been higher than in other Nordic markets. However, in 2023, this advantage disappeared, leading foreign capital to increasingly target other markets,
Source: ReData
where it was possible to achieve higher yields by the end of the year.
MANY SMALL TRANSACTIONS
When looking at the activity within different price ranges, it is also clear that Danish investors have had a more significant presence in 2023 than earlier. While foreign investors are typically more visible in the larger transactions, smaller properties are most often traded among Danish investors. While the number of transactions with a price of > DKK 250 m was halved in 2023, the transactions with a volume < DKK 50 m accounted for just below half of the total volume ( figure 31).
8.9 BN DKK LOGISTICS VOLUME 2023 VENDORS INVESTORS Asset deals 54% Foreign 34% Share deals 46% Danish 66% Foreign 44% Danish 56% 54 | RED Danish Investment Atlas 2024 LOGISTICS
Figure 30: Origin of the investors & transaction structure 2023
Price range (M DKK) No. of transactions Volume (M DKK) 2022 2023 2022 2023 0 - 50 1,100 808 5,600 4,046 50 - 150 33 11 2,569 993 150 - 250 2 3 304 514 250 - 500 4 1 1,243 250 > 500 4 3 4,037 3,081 Total 1,143 826 13,752 8,884
Figure 31: Logistics – Breakdown in price range 2023
Source: ReData
0 2 4 6 8 10 12 14 16 2023 2022 2021 2020 2019 2018 2017 2016 2015 2014 BN DKK Source: ReData 46% 4.4 54% 67% 16.0 33% 60% 13.8 40% 44% 8.9 56% 8.1 69% 31% 46% 6.4 54% 47% 8.5 53% 48% 4.1 52% 17% 2.6 83% 86% 1.3 Danish Foreign Logistics | 55 LOGISTICS
Figure 32: Logistics – Transaction volume 2014-2023
Investor Origin Volume (M DKK)* No. of transactions 1 IKEA SE 1,774 1 2 Blackstone US 703 1 3 PensionDanmark DK 604 2 4 Genesta SE 250 1 5 DSV DK 190 1 Source: ReData
Figure 33: Logistics – Top 5 investors 2023
Investor Origin Volume (M DKK)* No. of transactions 1 Mileway US 4,021 25 2 NREP DK 3,780 11 3 Savills Investment Management GB 2,446 4 4 Niam SE 1,898 3 5 Allianz DE 1,893 2 Source: ReData * The stated volumes are for the logistics part only, which is why any other uses in mixed properties are not included in the volume. HOTEL RETAIL RESIDENTIAL ANNUAL REVIEW OFFICE
Figure 34: Logistics – Top 5 investors 2014-2023
COPENHAGEN 0.1 BN DKK 1% COPENHAGEN 4.5 BN DKK 50% 1.0 BN DKK 11% OTHER ZEALAND 0.2 BN DKK 2% AARHUS 8.9 BN DKK LOGISTICS VOLUME IN TOTAL GREATER COPENHAGEN Danish 100% Foreign 0% Danish 56% Foreign 44% Danish 30% Foreign 70% Danish 89% Foreign 11% Danish 51% Foreign 49% 3.1 BN DKK 35% OTHER JUTLAND AND FUNEN Danish 81% Foreign 19% 100% 0.1 BN DKK 1% COPENHAGEN 4.5 BN DKK 50% 1.0 BN DKK 11% OTHER ZEALAND 0.2 BN DKK 2% AARHUS 8.9 BN DKK LOGISTICS VOLUME IN TOTAL GREATER COPENHAGEN Danish 100% Foreign 0% Danish 56% Foreign 44% Danish 30% Foreign 70% Danish 89% Foreign 11% Danish 51% Foreign 49% 3.1 BN DKK 35% OTHER JUTLAND AND FUNEN Danish 81% Foreign 19% 100% 0.1 BN DKK 1% COPENHAGEN 4.5 BN DKK 50% 1.0 BN DKK 11% OTHER ZEALAND 0.2 BN DKK 2% AARHUS GREATER COPENHAGEN Danish 100% Foreign 0% Danish 30% Foreign 70% Danish 89% Foreign 11% Danish 51% Foreign 49% 0.1 BN DKK 1% COPENHAGEN 4.5 BN DKK 50% 1.0 BN DKK 11% OTHER ZEALAND 0.2 BN DKK 2% AARHUS GREATER COPENHAGEN Danish 100% Foreign 0% Danish 30% Foreign 70% Danish 89% Foreign 11% Danish 51% Foreign 49% 0.1 BN DKK 1% COPENHAGEN 4.5 BN DKK 50% 1.0 BN DKK 11% OTHER ZEALAND 0.2 BN DKK 2% AARHUS 8.9 BN LOGISTICS VOLUME GREATER COPENHAGEN Danish 100% Foreign 0% Danish 30% Foreign 70% Danish 89% Foreign 11% Danish 51% Foreign 49% 100% 0.1 BN DKK 1% COPENHAGEN 4.5 BN DKK 50% 1.0 BN DKK 11% OTHER ZEALAND 0.2 BN DKK 2% AARHUS 8.9 BN DKK LOGISTICS VOLUME IN TOTAL GREATER COPENHAGEN Danish 100% Foreign 0% Danish 56% Foreign 44% Danish 30% Foreign 70% Danish 89% Foreign 11% Danish 51% Foreign 49% 3.1 BN DKK 35% OTHER JUTLAND AND FUNEN Danish 81% Foreign 19% 100% 56 | RED Danish Investment Atlas 2024 Source: ReData LOGISTICS
DISTRIBUTION
GEOGRAPHICAL
The property at Broenge 10 in Ishøj was one of the ten warehouse and logistics properties that RED facilitated the sale of to Blackstone on behalf of AKF Holding.
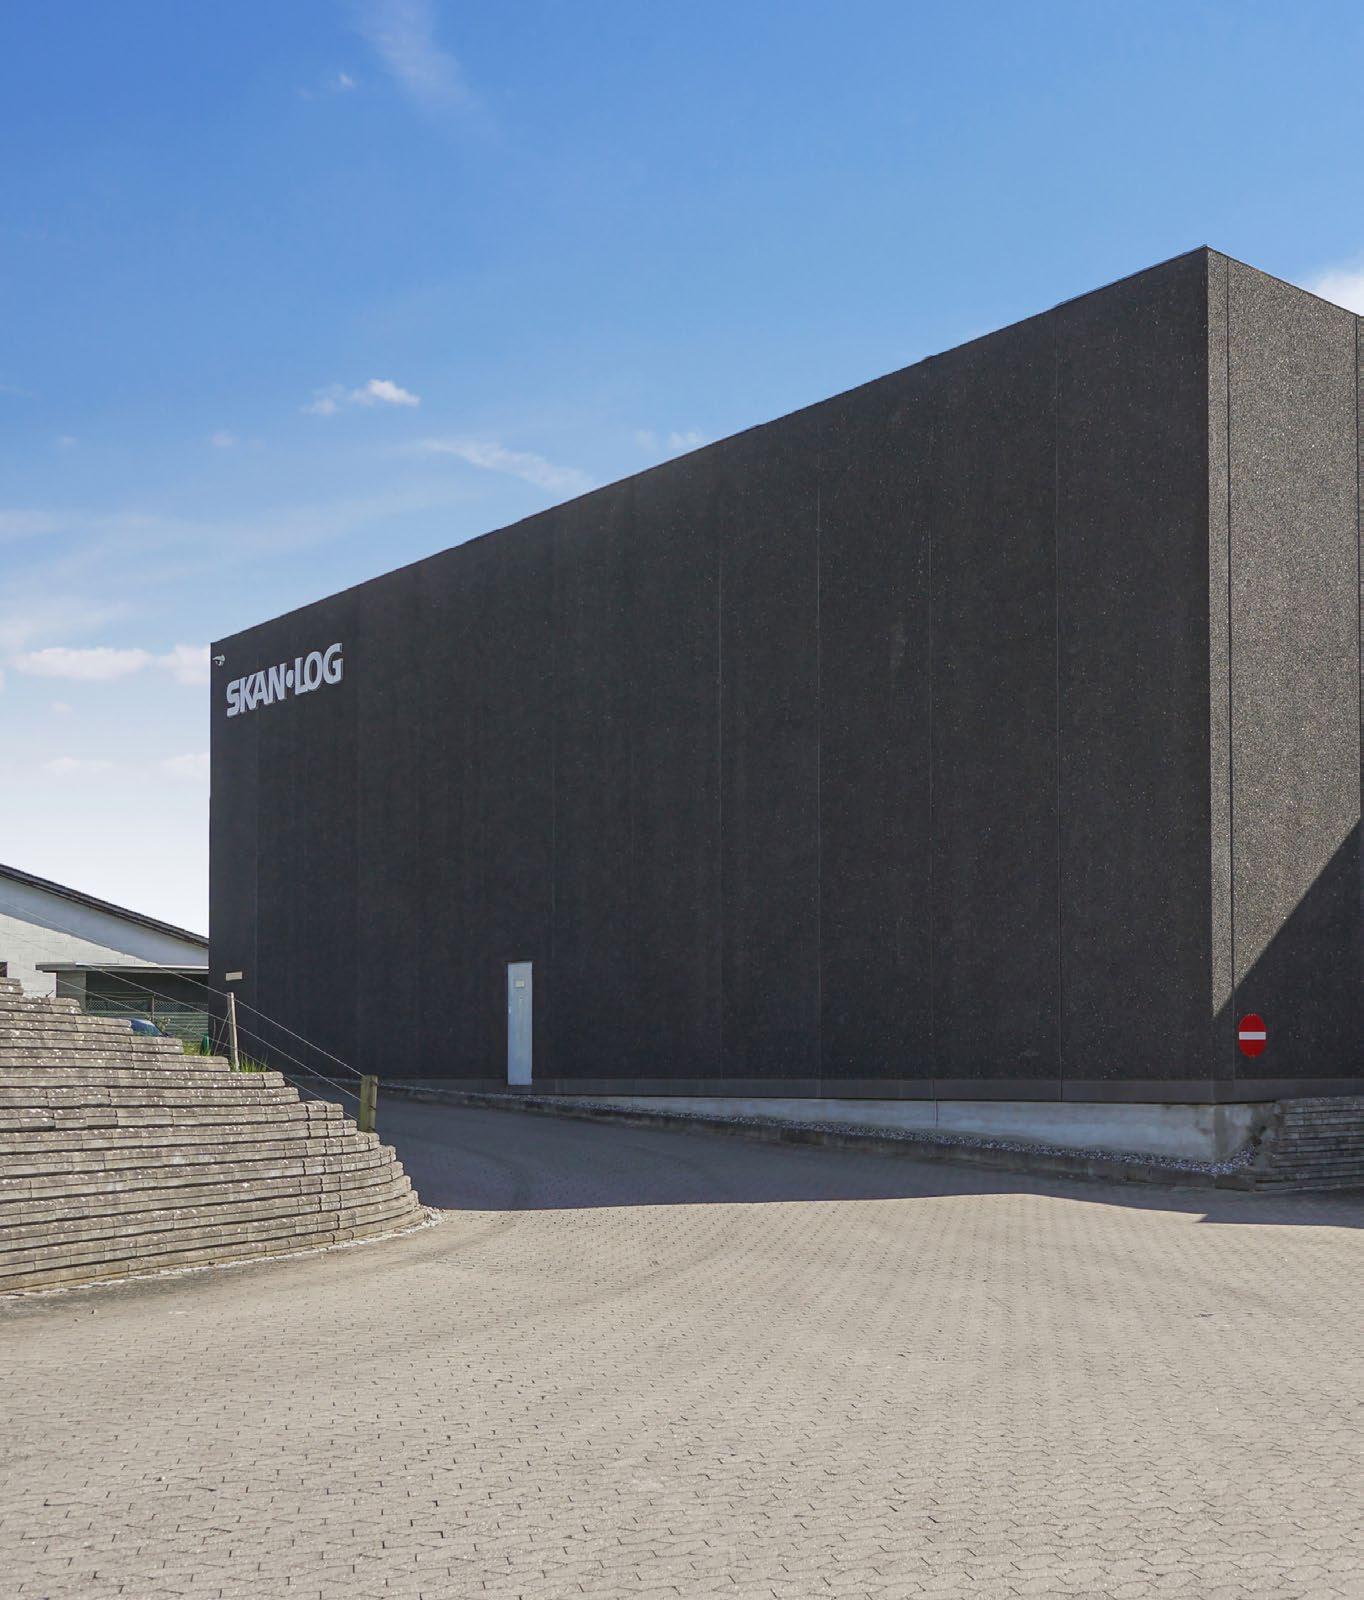
KEY FIGURES FOR LOGISTICS 2023
* The number of properties with industrial use in Aarhus mainly consists of properties with a secondary use as storage.
Logistics | 57 LOGISTICS
AREA NO. OF PROPERTIES VOLUME (M DKK) AVR. VOLUME (M DKK) WEIGHTED PRICE PER M² 2023 Δ 2022-2023 Copenhagen & Greater Copenhagen 100 4,542 45.4 10,300 21% Other Zealand 171 1.009 5,9 4,200 -22% Aarhus 13* 193 14.8 6,600 -29% Other Jutland & Funen 567 3,141 5,5 3,400 -23% Total 851 8,884 10.4 5,500 6%
HOTEL RETAIL RESIDENTIAL ANNUAL REVIEW OFFICE
GEOGRAPHICAL DISTRIBUTION
LARGE INVESTMENTS IN GREATER COPENHAGEN
Although the total transaction volume in the logistics segment decreased by approximately 35% from 2022 to 2023, the investment activity with warehouse and logistics properties in Copenhagen and the Greater Copenhagen area increased by about 61% ( figure 35). Thus, the overall decrease in the volume in the logistics segment is solely due to a significantly reduced investment activity in the other areas (a reduction of 47% - 65%).
This development in volume is partly driven by the fact that both tenants and investors primarily demand the most well-located properties in the capital area, but also, the sale of two large portfolios (AKF and Coop portfolios) and a user property (IKEA’s purchase of a logistics centre in Hedehusene) contributed to the geographical distribution of the volume, as the transactions together accounted for more than three-quarters of the total volume in Greater Copenhagen.
FOREIGN INVESTORS DOMINATE
GREATER COPENHAGEN
While all geographical areas (except for Greater Copenhagen) have shifted from being dominated by foreign capital in 2022 to being dominated by Danish capital in 2023, foreign investors are still the most active in Greater Copenhagen. The reasoning behind this can, once again, largely be explained by the sale of the AKF port folio and the logistics centre in Hedehusene to foreign investors (Blackstone and IKEA). However, looking at the number of transactions, the market is primarily dominated by Danish capital.
GREATER COPENHAGEN WINS
The tenants’ and investors’ continued preference for Greater Copenhagen is also evident when looking at the square meter prices for industrial and logistics properties located in Greater Copenhagen compared with the prices in the rest of Denmark. Not only were the properties in Greater Copenhagen, on average, sold at prices almost twice
as high as the properties in the other areas (see table on p. 57). At the same time, the prices in Greater Copenhagen increased by over 20% despite significant increases in the interest rates, making it both more expensive and more challenging to finance investments in logistics properties.
The development in Greater Copenhagen can, among others, be attributed to the strong tenant demand. While newly built logistics properties have been occupied very quickly, the demand for even the older and outdated properties has also increased. As a result, we have witnessed increasing rent levels and a continued low vacancy rate for logistics properties.
The significant decline in the prices per m² in the rest of the country must be seen in the light that in 2023, it was primarily small and older properties located outside the major cities that were sold in these areas.
Source: ReData
Danish Foreign 0 1 2 3 4 5 6 7 8 BN DKK 80% 20% 52% 48% 69% 31% 25% 75% 46% 54% 27% 73% 43% 47% 88% 53% 57% 86% 14% 53% 47% 63% 37% 2023 2022 2021 2023 2022 2021 2023 2022 2021 2023 2022 2021 COPENHAGEN & GREATER COPENHAGEN OTHER JUTLAND TRIANGLE REGION REST OF DENMARK
58 | RED Danish Investment Atlas 2024
LOGISTICS
Figure 35: Logistics – Historic geographic breakdown 2021-2023

Logistics | 59 LOGISTICS
HOTEL RETAIL RESIDENTIAL ANNUAL REVIEW OFFICE
The property at Broenge 10 in Ishøj was one of the ten warehouse and logistics properties that RED facilitated the sale of to Blackstone on behalf of AKF Holding.
TOP 5 TRANSACTIONS 2023
IKEA LOGISTICS CENTRE
The largest logistics transaction of the year was completed in July when Allianz sold a logistics centre on Hedelandsvej in Hedehusene to IKEA after only two years of ownership. Since the end of 2022, IKEA has had a temporary lease of approx. 38,000 m², while the remaining 95,000 m² is let to DSV, which entered into a 10-year lease agreement in early 2022. The acquisition of the property is part of IKEA’s strategy to ensure efficient and flexible service for their customers in Denmark.
COOP PORTFOLIO
In the spring of 2023, PensionDanmark acquired a portfolio with four properties from Coop. The portfolio includes a residential project (Coop Byen Vest in Albertslund) as well as three existing properties (two logistics properties located in Albertslund and Hasselager and Coop’s headquarters in Albertslund), with Coop staying as the tenant.
Prior to the transaction, PensionDanmark owned 50% of the residential project, but now the pension fund has full ownership.
2 1 60 | RED Danish Investment Atlas 2024
Price (DKK) 952,413,000 Investor PensionDanmark Gross area (m²) 134,785 Vendor Coop Danmark (hereof basement 7,059) Price (DKK) 1,800,000,000 Investor IKEA Gross area (m²) 132,214 Vendor Allianz
Photo: RED
LOGISTICS
Photo: Skråfoto
AKF PORTFOLIO
American Blackstone acquired a portfolio of ten logistics and warehouse properties from the real estate company AKF Holding in October 2023. Seven of the properties are located on Avedøre Holme, and the remaining three properties are located in Albertslund, Glostrup and Ishøj. At the time of the transaction, the properties were let to a wide range of tenants, from small manufacturing companies to large transport and logistics companies.
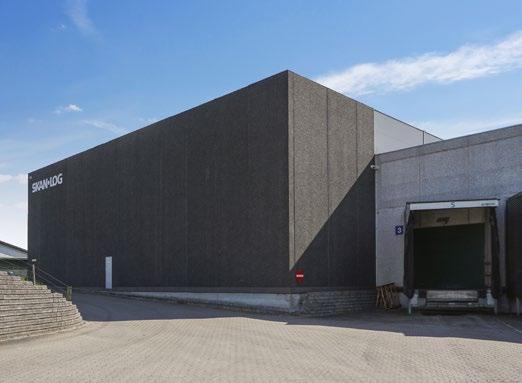
ÅSAGER 3
The Swedish property fund Genesta expanded its Danish port folio in October 2023 when it entered into a forward purchase agreement with Logistic Contractor to acquire a logistic property, which is expected to be delivered in late 2024. The property will be located right next to the highway in Solrød, and Genesta will handle the leasing themselves.

KUMLEHUSVEJ 1A
In May 2023, the logistics company DSV acquired back a property located on Kumlehusvej south of Roskilde from the Swedish property company Corem. The property was built by DSV in 2014 and sold to Corem in a sale and leaseback transaction in the same year. The divestment was made as part of Corem’s strategy to focus on office properties.
3 4 5 Logistics | 61 LOGISTICS
Est. price (DKK) 250,000,000 Investor Genesta Gross area (m²) 20,600 Vendor Logistic Contractor Price (DKK) 750,000,000 Investor Blackstone Gross area (m²) 100,606 Vendor AKF Holding (hereof basement 2,879) Price (DKK) 190,000,000 Investor DSV Gross area (m²) 23,682 Vendor Corem (hereof basement 103)
Photo: RED
Photo: Genesta
The stated prices are for the transactions as a whole, which is why the prices may include uses other than logistics.
Photo: RED
illustration is only an example of how the property will possibly look. HOTEL RETAIL RESIDENTIAL ANNUAL REVIEW OFFICE
The
FROM CORE TO VALUE-ADD, BUT WHAT NOW?
In recent years, investors have had an insatiable demand for core assets in the logistics segment, but now investors have turned their interest towards value-add assets. This shift is particularly driven by the fact that the high interest rates combined with the sellers’ price expectations for core assets pushed investors towards value-add assets in search of returns.
In this highlight, we have asked the same questions to two investors, both of whom have invested in Danish warehouse and logistics properties in recent years but who have been characte rised by investing in different asset types until now.
While Hüseyin Meric responds on behalf of Alma Property Partners, which has only invested in value-add assets, Lisen Heibel responds on behalf of Savills Investment Management, which has so far only invested in core and core plus assets.
In the interviews, the two respondents give their views on core vs. value-add segments and how they expect the market to develop.

HÜSEYIN MERIC
Hüseyin Meric is Partner, Co-owner, and Country Manager at the Swedish real estate investment company Alma Property Partners. Hüseyin has experience from Sampension, SF Management, and Sadolin & Albæk and is educated in Finance and Accounting from Copenhagen Business School.
Alma Property Partners is a real estate investment company focusing on the Nordic Region that currently has assets under management worth approximately 900 million euros. The company was founded in 2014 by a group of property experts with experience in the Nordic real estate investment market.

LISEN HEIJBEL
Lisen Heibel is Head of Investment, Nordics, at Savills Investment Management. Lisen graduated from the Stockholm School of Economics and has many years of experience in the real estate market through her executive positions at both CBRE and JLL.
Savills Investment Management is an international real estate investment management company that focuses on managing property investments on behalf of institutional investors, including pension funds, insurance companies, and other institutional clients.
62 | RED Danish Investment Atlas 2024
A strong rental growth outlook in combination with falling interest rates should lead to a sharpening in logistics yields in 2024-2025 (…)”
Lisen Heijbel Head of Investments, Nordics, Savills Investment Management

WHAT ADVANTAGES AND DISADVANTAGES DO YOU SEE IN INVESTING IN CORE VS. THE VALUE-ADD LOGISTICS SEGMENT IN DENMARK?
ALMA
For value-add properties, it is equally important to have a certification and a green lease agreement, but here, there is a bit more room to manoeuvre, and ESG can be an active part of the business plan, where the asset’s profile can be changed from brown to green.”
Hüseyin Meric Partner, Co-owner and Country Manager, Alma Property Partners
We only have funds with a value-add profile, so we rarely do a relative analysis between assets with different investment profiles. The advantage of investing in a core asset should, of course, be lower risk, but the current market situation with a lack of liquidity makes it difficult to assess the risk-adjusted returns.
We believe that the spread between core and value-add assets is relatively limited at the moment. Conceptually, the advantage for us of investing in value-add properties is that we believe we can transform a property from A to B, thereby adding alpha and taking less market risk. However, the current lack of liquidity in the market makes it very difficult to say whether the riskadjusted return is better for core vs. valueadd properties.
SAVILLS IM
Key for us is to invest in the right locations and implement a unique business plan for each asset to maximise the potential. In the typical last mile locations, there tend to be more value-add type assets which require more work and sometimes more risk. Core assets are generally attractive for our longterm capital if we can find them in the right locations at the right price. I would say there are both advantages and disadvantages with both core and value-add.
Continued on next page
Logistics | 63 LOGISTICS
HOTEL RETAIL RESIDENTIAL ANNUAL REVIEW OFFICE
Continued from previous page
WHICH FACTORS DO YOU EXPECT WILL BE DECISIVE FOR THE LOGISTICS SEGMENT IN THE COMING YEAR?
ALMA
We believe there will primarily be two decisive factors for the logistics segment in the short and medium term. One is definitely the property’s ESG profile. This applies both to the asset itself but also to the user/tenant. For core assets, it is a necessity that there is a certification of the property but also a green lease agreement that imposes requirements on the use of the property. For valueadd properties, it is equally important to have a certification and a green lease agreement, but here, there is a bit more room to manoeuvre, and ESG can be an active part of the business plan, where the asset’s profile can be changed from brown to green.
The second aspect we believe in is the location. There are areas in Denmark where the supply is – and continues to be – significantly increasing, and in these areas, it will be interesting to see if the demand can keep up. We believe that this can put a damper on the rent potential. Similarly, there are other areas in Denmark where we believe that the market is undersupplied, where there is room for both speculative construction and a rent growth that is above the national average.
SAVILLS IM
We believe location and ESG will remain the most important factors also in 2024 and beyond. With the right asset characteristics and fundamentals, you will both be able to target a broad tenant universe to optimise the leasing dynamics while also afford being able to keep redeveloping the asset at a healthy ROI over time to boost long-term returns.
HOW DO YOU EXPECT THE RENTAL AND YIELD LEVELS WITHIN THE LOGISTICS SEGMENT IN DENMARK TO DEVELOP IN THE FUTURE?
ALMA
It blends into my previous answer. It will be very nuanced. Rent potential and yield levels go hand in hand, but there are areas where we believe that there will be a greater rental growth than in others, where speculative construction has been very limited. And then there are areas where supply is increasing, which will dampen the rental growth.
We continue to believe in the logistics trends, where e-commerce is taking up more and more space, and logistics continues to be among the preferred segments for institutional capital. Overall, we expect slightly decreasing yield requirements and a flat to slightly increasing rental development in 2024.
SAVILLS IM
With historically low vacancy rates and various trends supporting steady demand for modern logistics space in the years to come, we are expecting healthy real rental growth for core logistics in the urban locations in the coming 3-5 years.
A strong rental growth outlook, in combination with falling interest rates, should lead to a sharpening in logistics yields in 2024-2025 from current levels somewhere between 5-6%, depending on asset and location. For real estate investors looking for real returns and moderate risk, we believe the repriced Danish logistics sector offers much better value now than it did 18-24 months ago.
We believe location and ESG will remain the most important factors also in 2024 and beyond.”
Lisen Heijbel
Head of Investments, Nordics, Savills Investment Management
However, the current lack of liquidity in the market makes it very difficult to say whether the risk-adjusted return is better for core vs. value-add properties.”
Hüseyin Meric
Partner, Co-owner and Country Manager, Alma Property Partners
64 | RED Danish Investment Atlas 2024
CONSENSUS AMONG THE INVESTORS
Despite the two investors’ different starting points, it can be concluded from the above interviews that they agree to a large extent:
There are advantages and disadvantages to both core and value-add properties, and investment decisions are therefore based on a specific assessment of the riskadjusted returns.
The assets’ location and ESG profile will be the two decisive factors in the logistics segment going forward.
In the most attractive areas, vacancy rates will remain low, rent levels will be increasing, and yield levels will be decreasing.
Logistics | 65 LOGISTICS
HOTEL RETAIL RESIDENTIAL ANNUAL REVIEW OFFICE
EXPECTATIONS FOR 2024
In recent years, the increasing tenant demand for well-located logistics properties has created a significant investor appetite in the logistics segment. This appetite has particularly been driven by the investors’ positive expectations for the occupier market as well as the yield spread compared to the other segments. In 2024, we expect the market to be characterised by increasing rent levels and stable yield requirements.
THE OCCUPIER MARKET
LOW VACANCY LEVELS AND HIGH DEMAND
Even though many older industrial areas have been converted to alternative uses, the building stock of storage and logistics square meters has increased during 2023. Despite the economic uncertainty in the market, the supply has been absorbed. Consequently, the vacancy rate within the segment remains very low (1.9 % in the fourth quarter of 2023).
In 2024, we expect that the recent trends in the occupier market will continue and that the users of warehouse and logistics properties will demand additional square meters – especially in the most well-established logistics hubs. However, we expect that the undersupply will diminish as more warehouse and logistics properties are being completed, creating a higher equilibrium in the market.
Our expectations of a continued high but more normalised demand are supported by our investor survey from early 2024, which shows that nearly 90% of investors expect

to see a stable or an increasing tenant demand in the logistics segment in the first half of 2024 but that the share that expects a higher demand has decreased compared to a year ago ( figure 36).
THE RENT WILL INCREASE FOR PRIME ASSETS
As a result of the expectations of a continued high demand, we expect to see increasing rent levels for the most attractive and well-located logistics properties in the coming year, whereas the rent level for the less well-located and older industrial properties is expected to be unchanged or only slightly increasing.
This expectation is based on the fact that the majority of vacant leases in today’s market are located in the older and more outdated properties that do not meet the tenants’ requirements. In contrast, the vacancy rate and the general supply of the most modern properties remain very low. This is, of course, also due to the tenants moving out of the older properties into the newer and more updated buildings. Additionally,
the expectation of continued rent growth for the most modern properties is based on the fact that the rent level for prime logistics properties in Denmark continues to be significantly lower than in our neighbouring Nordic countries.
The large logistics owners in Denmark, who have acquired and built many modern logistics properties in recent years, experience a more normalised demand. Consequently, it now takes longer to lease logistics properties compared to a year ago.
THE INVESTMENT MARKET
THE PREMIUM IS GONE
At the peak of the market, the yields for prime logistic properties were higher in Denmark compared to the rest of the Nordics. However, at the beginning of 2024, the situation had reversed, as the prime yield for the most modern and well-located properties in Denmark was around 5%, which is on par with Sweden but lower than in both Norway and Finland.
Although there is no longer a premium for Danish logistics properties, we expect to see continued high investor demand in the segment in 2024, which will be particularly driven by the investors’ expectations of increasing rent levels as well as the continued low vacancy rate and significant tenant demand.”
Kim Søberg Petersen Partner, Capital Markets, RED
66 | RED Danish Investment Atlas 2024 LOGISTICS
Although there is no longer a premium for Danish logistics properties, we expect to see continued high investor demand in the segment in 2024, which will be particularly driven by the investors’ expectations of increasing rent levels as well as the continued low vacancy rate and significant tenant demand.
EXPECTATIONS OF STABLE RETURNS
After a long period characterised by low transaction volume and increasing yield requirements for Danish logistics properties, we expect that the yield levels have found their new level and that we will see stable yield requirements in 2024. This expectation is, among other things, based on the fact that the yield requirements for both core and value-add properties have reached a level that enables investors to secure
positive leverage. Also, there is once again a risk premium compared to the traditionally more “safe” segments, such as the office and residential segments.
The expectation of more stable yield requirements in Denmark is supported by our investor survey, which shows that three-quarters of the investors expect that the yield requirements will remain stable in the first half of 2024 ( figure 37). The remaining investors are almost equally split between expecting increasing yield requirements (14%) and decreasing yield requirements (11%).
THE ACTIVITY WILL DEPEND ON THE INTEREST RATE
In 2023, we saw that the activity and demand for value-add industrial properties
During the coming six months, the demand on the logistics occupier market will:
increased significantly, as the high interest rates created a significant gap between buyers’ and sellers’ price expectations in the core segment. However, the sellers’ price expectations decreased during the year, and by the end of 2023, we, therefore, saw that the yield spread between core and valueadd properties had narrowed.
We expect that the interest rate development will impact which asset types the capital will flow to. If (as expected) we continue to see further declines in the interest rates during 2024, we expect that investors will increasingly look towards the core segment again. Consequently, these logistic assets are likely to constitute a larger share of the total volume in the segment in 2024.
During the coming six months, market yields for logistics properties will:
The Cushman & Wakefield | RED Investor Confidence Index
The index monitors 115 of the most active investors’ expectations for the Danish commercial real estate market during the coming six months. The broad coverage ensures that the findings are representative reflections of the investors’ confidence in the Danish market. By conducting the survey on a biannual basis, we are also able to track changes in the confidence.
30% 35% 66% 59% 63% 55% 11% 10% 7% 10% 23% 31% 14% 49% 30% 34% 75% 42% 56% 45% 11% 9% 14% 21% Logistics | 67 LOGISTICS
Figure 36: Investor Confidence Index – Logistics occupier demand
Figure 37: Investor Confidence Index – Logistics yields
Q1 2024 Q3 2023 Q1 2023 Q3 2022 Increase Remain
Decrease
stable
Q1 2024 Q3 2023 Q1 2023 Q3 2022 HOTEL RETAIL RESIDENTIAL ANNUAL REVIEW OFFICE
68 | RED Danish Investment Atlas 2024 LOGISTICS – TOP 30 TRANSACTIONS 2023 PROPERTY CITY MONTH GROSS AREA PRICE (DKK) INVESTOR VENDOR 1 IKEA logistics centre Hedehusene July 132,214 m2 1,800,000,000 IKEA Allianz 2 Coop portfolio Across Nation March 134,785 m2 952,413,000 PensionDanmark Coop Danmark 3 AKF portfolio Greater Copenhagen October 100,606 m2 750,000,000* Blackstone AKF Holding 4 Åsager 3 Solrød Strand October 20,600 m2 250,000,000* Genesta Logistic Contractor 5 Kumlehusvej 1A Roskilde May 23,682 m2 190,000,000 DSV Corem 6 Hundigevej 85 Greve June 13,301 m2 163,500,000 Swiss Life Corem 7 Industrivej Syd 1 Vejen March 20,760 m2 160,511,000 Leverandørselskabet Danish Crown AMBA Private investor 8 Hjulmagervej 12 Vejle March 23,760 m2 125,000,000 Blackstone Coop Danmark 9 Addtek portfolio Across Nation August 49,532 m2 123,343,000 Intermediate Capital Group Addtek Holding International 10 Frankrigsvej 15 Hammel February 24,491 m2 119,213,000 KK Wind Solutions Vestas Wind Systems 11 Tonsbakken 12 Skovlunde August 12,637 m2 110,000,000 atNorth CapMan 12 Valhøjs Alle 190 Rødovre July 11,978 m2 107,250,000* Calum Blackstone 13 Rasmus Færchs Vej 23 Holstebro February 14,293 m2 83,350,000 Hanssen Ejendomme Creativ Company 14 Kometvej 15A Horsens June 11,087 m2 82,500,000 Ares Management Christian F. Holding 15 Finervej 7 Gadstrup October 26,619 m2 70,000,000 DSV Miljø Group Ssg Holding 16 Hvidsværmervej 155 Rødovre November 7,919 m2 62,680,000* Fritzøe Eiendom CR Hvidsværmervej 17 Kærup Parkvej 10 Ringsted June 2,706 m2 57,000,000 Cromwell KT Ejendomsinvestering 18 Lundagervej 20 Hedensted March 9,027 m2 52,374,000 KMC Properties BEWI Insulation Danmark 19 Ørbækvej 280 Odense SE October 7,392 m2 50,000,000 The Agency Real Estate Schneider Electric Industries 20 Industriparken 34 Ballerup December 6,682 m2 49,250,000 LIWA Ejendomme Property Partners Opsa 21 Dronningens Kvarter 24 Fredericia June 9,631 m2 48,155,000* Cromwell Cemb 22 Kanalholmen 37A Hvidovre January 6,552 m2 46,000,000 Brunswick Real Estate Kanalholmen 31-39 23 Hvidkærvej 21 Odense SW August 9,802 m2 45,000,000 Hanssen Ejendomme FTZ Autodele & Værktøj 24 Omega 9 Hinnerup August 4,200 m2 41,000,000 Omega 9 Omega Building 25 Smedeland 2 Glostrup October 5,504 m2 40,600,000 J.M.S Holding Ana Invest 26 Naverland 17 Glostrup June 16,038 m2 40,500,000 Decorum Naverland Glostrup Auto Ophug 27 Slipshavnsvej 2 Nyborg April 20,779 m2 40,000,000 Jansen Ejendomme ARDO 28 Kirstinehøj 7 Kastrup April 4,555 m2 40,000,000 Privat Investor Anpartsselskabet af 14. december 2007 29 Herlev Hovedgade 15A Herlev November 8,454 m2 40,000,000 Promaxx & Co Bodycote 30 W Brüels Vej 11 Hjørring March 9,767 m2 39,000,000 BS Holding 2015 Sparekassen Danmark * Estimated price Source: ReData LOGISTICS
TRANSACTIONS
3
4
5
* DKK per m² per year excl. service charges
Source: Cushman & Wakefield | RED

Seven out of the ten warehouse and logistics properties that RED facilitated the sale of to Blackstone are located at Avedøre Holme, including the property at Stamholmen 175.
Logistics | 69 LOGISTICS LOGISTICS – PRIME RENT AND YIELD LEVELS Q1 2024 SUBAREA BASE RENT* YIELD LEVEL
Copenhagen (Avedøre
725 5.00 - 5.75%
Taastrup Area 725 5.00 - 5.75%
1
Holme and Amager)
2
Køge and Greve 725 5.00 - 5.75%
The Triangle Area (Fredericia, Kolding and Vejle) 550 5.25 - 6.25%
Odense Area 450 5.75 - 6.75%
Aarhus Area 550 5.50 - 6.50%
6
HOTEL RETAIL RESIDENTIAL ANNUAL REVIEW OFFICE
RED assisted Castellum with the letting of 1,256 m² of offices in the multi-tenant property located by the harbour front at Kalvebod Brygge 45 in Copenhagen.

70 | RED Danish Investment Atlas 2024
Office | 71 OFFICE
Volume & Investors Geographical Distribution Top 5 Transactions 2023 Highlight: Is the Physical Office a Thing of the Past? Highlight: Complex Requirements Expectations for 2024 Key Figures & Transactions 72 74 78 80 82 84 88 HOTEL RETAIL LOGISTICS RESIDENTIAL ANNUAL REVIEW
OFFICE
VOLUME & INVESTORS
THE OFFICE VOLUME DECREASED BY 39%
With a total transaction volume of DKK 8.6 bn, the office segment accounted for 20% of the total volume in 2023, making it the third-largest segment in Denmark ( figure 40). However, there was a close competition between the logistics and the office segments, with only a few hundred thousand in volume difference separating the segments from claiming the positions as the second and third-largest segments of the year.
The decline in transaction volume from 2022 to 2023 can, among others, be attributed to the continued low yields on prime office assets combined with the high interest rates that made it difficult - if not impossible - for leveraged investors to make profitable business plans.
THE INVESTOR APPETITE WAS DANISH
In addition to the worsened financing conditions, global trends also affected the Danish market, as expectations of increasing vacancy rates and lower rent levels, and thus increasing risks, led many foreign investors to reduce their exposure to the office segment.
Source: ReData Source: ReData
This resulted in foreign investors, who had previously shown a strong appetite for prime office assets in Copenhagen and accounted for a significant portion of the volume, being reluctant with their investments in the segment. In 2023, almost all office investments in Denmark (98%) were, therefore, made by Danish investors ( figure 38).
THE VOLUME WAS DRIVEN BY LARGE TRANSACTIONS
The worsened financing conditions and the reluctance among foreign investors are also
reflected in the five largest office investors of the year, which together accounted for 51% of the total volume in the segment.
The investors who invested the most in the office segment in 2023 were all Danish investors who were primarily equityfinanced (pension funds AP Pension and PenSam) or users of the property (Sparekassen Sjælland-Fyn, which acquired a new headquarters in Carlsberg Byen) ( figure 41).
8.6 BN DKK OFFICE VOLUME 2023 VENDORS INVESTORS Asset deals 50% Foreign 34% Share deals 50% Danish 66% Foreign 2% Danish 98% 72 | RED Danish Investment Atlas 2024 OFFICE
Figure 38: Origin of the investors & transaction structure 2023
Price range (M DKK) No. of transactions Volume (M DKK) 2022 2023 2022 2023 0 - 50 762 547 4,285 2,954 50 - 150 33 13 2,685 948 150 - 250 7 4 1,316 801 250 - 500 7 1 2,437 285 > 500 5 3 3,414 3,620 Total 814 568 14,135 8,608
Figure 39: Office – Breakdown in price range 2023
Danish BN DKK Foreign Source: ReData 0 4 8 12 16 20 2023 2022 2021 2020 2019 2018 2017 2016 2015 2014 67% 17.7 33% 50% 17.0 50% 28% 18.9 72% 19% 14.1 81% 8.6 98% 37% 12.9 63% 26% 17.9 74% 38% 19.5 62% 23% 14.8 77% 10% 11.5 90% Office | 73 OFFICE
Figure 40: Office – Transaction volume 2014-2023
Investor Origin Volume (M DKK)* No. of transactions 1 AP Pension DK 2,378 1 2 PenSam DK 978 2 3 Nordania Leasing DK 500 1 4 Sparekassen Sjælland-Fyn A/S DK 297 2 5 PensionDanmark DK 235 1 Source: ReData
Figure 41: Office – Top 5 investors 2023
Investor Origin Volume (M DKK)* No. of transactions 1 PensionDanmark DK 6,826 23 2 Niam SE 6,662 22 3 Jeudan DK 6,322 35 4 Wihlborgs SE 5,172 14 5 Klövern SE 4,302 5 Source: ReData
The stated volumes are for the office part only, which is why any other uses in mixed properties are not included in the volume. HOTEL RETAIL LOGISTICS RESIDENTIAL ANNUAL REVIEW
Figure 42: Office – Top 5 investors 2014-2023
*
COPENHAGEN 4.9 BN DKK 56% COPENHAGEN 1.7 BN DKK 19% 0.5 BN DKK 5% OTHER ZEALAND 0.3 BN DKK 3% AARHUS 8.6 BN DKK OFFICE VOLUME IN TOTAL GREATER COPENHAGEN Danish 97% Foreign 3% Danish 98% Foreign 2% Danish 99% Foreign 1% Danish 100% Foreign 0% Danish 99% Foreign 1% 1.3 BN DKK 15% OTHER JUTLAND AND FUNEN Danish 98% Foreign 2% 100% 4.9 BN DKK 56% COPENHAGEN 1.7 BN DKK 19% 0.5 BN DKK 5% OTHER ZEALAND 0.3 BN DKK 3% AARHUS 8.6 BN DKK OFFICE VOLUME IN TOTAL GREATER COPENHAGEN Danish 97% Foreign 3% Danish 98% Foreign 2% Danish 99% Foreign 1% Danish 100% Foreign 0% Danish 99% Foreign 1% 1.3 BN DKK 15% OTHER JUTLAND AND FUNEN Danish 98% Foreign 2% 100% 4.9 BN DKK 56% COPENHAGEN 1.7 BN DKK 19% 0.5 BN DKK 5% OTHER ZEALAND 0.3 BN DKK 3% AARHUS GREATER COPENHAGEN Danish 97% Foreign 3% Danish 99% Foreign 1% Danish 100% Foreign 0% Danish 99% Foreign 1% 4.9 BN DKK 56% COPENHAGEN 1.7 BN DKK 19% 0.5 BN DKK 5% OTHER ZEALAND 0.3 BN DKK 3% AARHUS GREATER COPENHAGEN Danish 97% Foreign 3% Danish 99% Foreign 1% Danish 100% Foreign 0% Danish 99% Foreign 1% 4.9 BN DKK 56% COPENHAGEN 1.7 BN DKK 19% 0.5 BN DKK 5% OTHER ZEALAND 0.3 BN DKK 3% AARHUS 8.6 BN OFFICE VOLUME GREATER COPENHAGEN Danish 97% Foreign 3% Danish 99% Foreign 1% Danish 100% Foreign 0% Danish 99% Foreign 1% 100% 4.9 BN DKK 56% COPENHAGEN 1.7 BN DKK 19% 0.5 BN DKK 5% OTHER ZEALAND 0.3 BN DKK 3% AARHUS 8.6 BN DKK OFFICE VOLUME IN TOTAL GREATER COPENHAGEN Danish 97% Foreign 3% Danish 98% Foreign 2% Danish 99% Foreign 1% Danish 100% Foreign 0% Danish 99% Foreign 1% 1.3 BN DKK 15% OTHER JUTLAND AND FUNEN Danish 98% Foreign 2% 100% 74 | RED Danish Investment Atlas 2024 Source: ReData OFFICE GEOGRAPHICAL DISTRIBUTION
RED assisted ATP Ejendomme with the letting of 1,205 m² of offices in the architect designed property at Nicolai Eigtveds Gade 28 in Copenhagen.

KEY FIGURES FOR OFFICES 2023
Office | 75 OFFICE
AREA NO. OF PROPERTIES VOLUME (M DKK) AVR. VOLUME (M DKK) WEIGHTED PRICE PER M² 2023 Δ 2022-2023 Copenhagen 58 4,858 83.8 37,000 6% Greater Copenhagen 70 1,656 23.7 12,500 1% Other Zealand 130 470 3.6 6,800 -24% Aarhus 18 297 16.5 15,500 -25% Other Jutland & Funen 314 1,327 4.2 6,200 -20% Total 590 8,608 14.6 15,600 9%
HOTEL RETAIL LOGISTICS RESIDENTIAL ANNUAL REVIEW
GEOGRAPHICAL DISTRIBUTION
THE OFFICE MARKET IS POLARISING
Both the occupier and investment markets for office properties have witnessed an increasing polarisation in the past year. While Copenhagen and parts of Greater Copenhagen have experienced a continued strong tenant demand, the occupier market in the rest of the country has been under pressure. This is, among others, reflected in the fact that the vacancy rates in the Capital Region have remained more or less unchanged during the past year, whereas the vacancy rates in the other regions have increased. At the same time, investors demand a significantly higher risk premium on investments outside Copenhagen.
This polarisation of the market is reflected in both the sales prices per m² for the different geographical areas and in the price development (see table on p. 75). While prices in Copenhagen and Greater Copenhagen have
increased slightly (despite the uncertainties in the market), prices in the other areas have decreased significantly. This implied that in 2023, office properties in Copenhagen were, on average, sold at a price that was more than twice as high as in Aarhus, which was the area with the second-highest prices.
PRIME OFFICE PROPERTIES DRIVE THE MARKET
In this regard, it is important to note that the development in Copenhagen and Greater Copenhagen should not be seen as an indication that market values have generally increased. In Copenhagen, the prices per m² are heavily influenced by the sale of large prime properties. In Greater Copenhagen, the prices per m² are influenced by the transactions primarily involving the most modern and attractive properties, as there were no sales of smaller and more outdated properties.
The investors’ preference for Copenhagen’s office properties is also reflected in the distribution of the capital, as more than half of the volume (56%) was invested in office properties in Copenhagen ( figure 43). Since the market peaked in 2021, the volume in Copenhagen has only decreased by 31%, and Copenhagen is, thus, also the area where the volume has decreased the least (a decrease of 60-88% in the other areas).
FOREIGN CAPITAL DISAPPEARED
Looking at the distribution of Danish and foreign capital, there is no doubt that Danish investors have dominated the office market across the country. In this regard, it is particularly interesting that foreign investors have only invested around DKK 50 m in total in properties where the primary use is office. The majority of foreign capital in the office segment is thus invested in logistics properties with associated office sections.
COPENHAGEN GREATER COPENHAGEN AARHUS REST OF DENMARK 0 1 2 3 4 5 6 7 8 BN DKK 55% 45% 14% 86% 97% 82% 26% 74% 18% 99% 79% 99% 99% 87% 13% 75% 25% 99% 2023 2022 2021 2023 2022 2021 2023 2022 2021 2023 2022 2021 76 | RED Danish Investment Atlas 2024
Source: ReData Danish Foreign
OFFICE
Figure 43: Office – Historic geographic breakdown 2021-2023
RED assisted Danfoss with the subletting of 767 m² of newly refurbished offices in Knud Højgaards Hus at Kultorvet in Copenhagen.
Office | 77 OFFICE
HOTEL RETAIL LOGISTICS RESIDENTIAL ANNUAL REVIEW
TOP 5 TRANSACTIONS 2023

CODANHUS & KALVEBOD BRYGGE 32
The largest office transaction of the year was completed in November when the Swedish real estate company Corem sold Codanhus on Gl. Kongevej and Kalvebod Brygge 32 to AP Pension. While Kalvebod Brygge 32 is fully let to Rigsarkivet and Poul Schmidt / Kammeradvokaten (legal adviser to the Danish Government), Codanhus is a multi-tenant property that, at the time of the acquisition, was fully let to companies such as Freja Ejendomme, Politiforbundet, and Sydbank.
NJALSGADE 17-23
In the final month of the year, the pension fund PenSam acquired an office complex from the developer Alfa Development. The complex comprises four historic buildings located on Islands Brygge in Copenhagen. The four buildings are let to a diversified mix of office and restaurant tenants. The acquisition was made as a part of PenSam’s strategy to strengthen its portfolio with high-quality properties located in strategic locations.
78 | RED Danish Investment Atlas 2024
2 1
Price (DKK) 2,500,000,000 Investor AP Pension Gross area (m²) 70,980 Vendor Corem (hereof basement 11,625) Est. price (DKK) 750,000,000 Investor PenSam Gross area (m²) 29,174 Vendor Alfa Development (hereof basement 3,733)
Photo: RED
OFFICE
Photo: RED
GN STORE NORD HQ
In November 2023, GN Store Nord sold their headquarters at Lautrupbjerg 7 in Ballerup to Nordania Leasing. The transaction was completed as a sale and leaseback agreement, with GN Store Nord having a buyback option after 10-15 years. Lautrupbjerg 7 consists of several interconnected buildings constructed between 1996 and 2007.
BLEGDAMSVEJ 124
After three years of ownership, Oskar Group sold the office property located at Østerbro in Copenhagen to the pension fund Pensam in February 2023. The property consists of three buildings, where all areas (except the ground floor facing Blegdamsvej) have undergone an extensive renovation. When Pensam took over the nearly 6,000 m² property, it was fully let to three office tenants and the grocery store Netto.

SPAREKASSEN SJÆLLAND-FYN HQ
In May 2023, the bank Sparekassen Sjælland-Fyn acquired a turnkey project in Carlsberg Byen. The project, which is expected to be completed in 2025, consists of a new headquarters for the company and is delivered by Udviklingsselskabet Carlsberg Byen. The office is located on the bottom five floors of the property Nebelongs Hus. When Sparekassen Sjælland-Fyn move, it plans to close its current branches in Copenhagen and consolidate them in its new office in Carlsberg Byen.

3 4 5 Office | 79 OFFICE
Price (DKK) 311,901,000 Investor PenSam Gross area (m²) 7,600 Vendor Oskar Group (hereof basement 940) Price (DKK) 500,000,000 Investor Nordania Leasing Gross area (m²) 35,608 Vendor GN Store Nord (hereof basement 2,965) Price (DKK) 285,000,000 Investor Sparekassen Sjælland-Fyn Gross area (m²) 4,500 Vendor Udviklingsselskabet Carlsberg Byen
Photo: GN Store Nord
Photo: Oskar Group
The stated prices are for the transactions as a whole, which is why the prices may include uses other than office. HOTEL RETAIL LOGISTICS RESIDENTIAL ANNUAL REVIEW
3D illustration: Cadwalk
IS THE PHYSICAL OFFICE A THING OF THE PAST?
Ghost-like conditions with half-empty offices have become a reality in many countries. We have, therefore, seen that many investors worldwide have reduced their exposure to the office segment due to a fear of an increase in remote work, leading to increasing vacancy rates and lower rent levels. The question now is whether these international trends will also affect the Copenhagen office market?
Based on data from a comprehensive analysis of working from home across the globe (over 42,000 respondents from 35 different countries, including approximately 1,000 from Denmark), we will in the following article explain why Denmark is not expected to be as affected by an increasing share of remote work as many other countries, and why we therefore also expect that the Copenhagen office market will remain strong in the long run.
NATIONAL CONDITIONS ARE DECISIVE
The global pandemic led to a sudden surge in the share of remote work worldwide, as everyone who could work from home did so. However, there are also several national factors which affect the share of remote work. These factors include employees’ physical opportunities for remote work, the types of businesses, and the use of performance and evaluation systems.
These factors contribute to the significant differences in the number of days per week employees work - and want to workfrom home across the globe ( figure 44). While countries like the USA, UK, and Canada are at the top of the list of nations where employees work from home the most (1.351.67 days per week), South Korea, Japan, and Greece are at the bottom (0.42-0.54 days per week).
EMPLOYERS ALSO PREFER MORE REMOTE WORK
Employees generally see many benefits in remote work, and at the same time, they do not consider productivity to decrease to the same extent as employers do. Therefore, in all countries, employees prefer more remote work than employers. However, it
0 1 day 2 days 3 days Denmark France Norway Sweden Finland Germany Spain UK USA Actual number of days with remote work Preferred number of days with remote work (employee) Preferred number of days with remote work (employer) The dashed lines indicate the average for all 35 countries in the analysis. 80 | RED Danish Investment Atlas 2024
Figure 44: Number of remote work days in selected countries
Source: Working from Home Around the Globe: 2023 Report
No commute
Save on gas and lunch costs
Flexibility over when I work
Less time getting ready for work
Individual quiet time
Spending more time with family and friends
Fewer meetings
Other
is noteworthy that the actual number of remote workdays is lower than even the number preferred by employers in 29 out of 35 countries. This may indicate that the share of remote work in general will increase in the coming years.
Assuming that the number of remote workdays in a stabilised market ideally lies in the middle between what employees and employers prefer, this would imply that the number of remote workdays in Denmark should increase by 0.3 days per week from the current level, which is the lowest increase among all of the countries in the analysis. In comparison, the number of remote workdays in the USA should increase three times as much (0.9 days) to achieve the same balance.
CONSENSUS BETWEEN DANISH EMPLOYEES AND EMPLOYERS
The fact that the number of remote workdays does not need to increase significantly in Denmark can partly be explained by the fact that Denmark is the country where employees prefer the lowest number of remote workdays (1.15 days in Denmark vs. 1.97 days on average). At the same time, Danish employers prefer significantly fewer remote workdays than the average (0.72 vs. 1.12 days). Denmark is, therefore, among the countries where employees and employers agree the most on the optimal number of remote workdays.
MARGINAL BENEFITS FOR THE DANES
The reasoning for the low number of preferred remote workdays can, among others, be explained by the fact that neither Danish employees nor employers see the benefits of remote work as being as significant as in other countries.
While shorter commuting time and lower costs (for gasoline, lunch, etc.) are the advantages most employees state as being the greatest benefit of remote work ( figure 45), the possibility of being able to get more qualified employees by recruiting from a larger geographic area is one of the biggest benefits for the employers. However, in Denmark, the geographical distances are generally limited, and therefore, the benefits of remote work are not as substantial as in countries with larger geographical distances.
Another advantage of remote work is that employers can reduce their letting costs for office space if their space requirements decrease. However, the rent level in Denmark is still significantly lower than in most comparable cities. Moreover, when comparing rent levels for office businesses with other industries, the letting costs generally constitute a considerably lower share of the companies’ revenue in the office segment than in, for example, the retail and hotel segment. Therefore, the savings companies can achieve by scaling down are not as substantial as in other cities or in other segments.
OFFICE TENANTS ARE HERE TO STAY
With a limited growth in the number of remote workdays and a continued low unemployment rate, where the physical office is used to attract employees, we do not foresee an office market where tenants are expected to reduce their space requirements significantly in the coming years. At the same time, there are very few development opportunities left in central Copenhagen, meaning that the office stock will remain more or less unchanged. The combination of a continued strong demand and a limited supply implies that the risks of investing in office properties in Copenhagen should be significantly lower than many investors fear.
ARE OFFICE INVESTMENTS WITHOUT RISKS?
However, we are looking at an increasingly diversified office market, and in order to make profitable investments, investors will need to continually adjust their investment strategies as the market develops. In today’s market, this includes i) focusing on the properties’ ESG profile (both the current profile and the possibility of improving it), ii) seizing any opportunities to acquire standing assets at an attractive risk-adjusted yield, iii) and not least being aware that tenants (to attract qualified employees) have an increasing preference for the best and most centrally located offices.
0% 10% 20% 30% 40% 50% 60%
Office | 81 OFFICE
Figure 45: Biggest employee benefits of working from home
HOTEL RETAIL LOGISTICS RESIDENTIAL ANNUAL REVIEW
Source: Working from Home Around the Globe: 2023 Report

Fortunately, we continued to see a high activity in large parts of the office occupier market in 2023. However, we also clearly saw that the market had shifted from nearly being a “one-size-fits-all” market to one where tenants not only have many demands for their leases but also where there are significant differences in those demands. Therefore, understanding the office market and its facets is more crucial than ever.
In the following article, we will provide our perspective on what characterises the office occupier market today and where it is heading by answering three simple questions.
THE OFFICE TENANTS:
COMPLEX REQUIREMENTS
After several years in which the office market was on a high with upward pressures on the rent levels and low vacancy rates, many players in the office market entered 2023 with apprehensions. Would a coming recession, an increasing share of remote work or something else put the office market under pressure in 2023?
WHO ARE THE TENANTS?
Although we have not yet experienced the recession many feared, we did observe how economic fluctuations and uncertainties about the future affected office tenants differently.
The smaller companies usually haven’t had the time to build up the same equity as larger, more established companies. Therefore, their business often depends on access to external financing sources, which became more expensive and challenging to obtain in 2023. Furthermore, these smaller companies may not withstand longer periods of declining revenues. Finally, to cut costs in less good times, employees in very small companies can also work partially or fully from home.
In the past year, we have, therefore, seen a decline in the activity among both small and medium-sized companies as they have a wait-and-see approach. This has resulted in an increase in the supply of smaller leases of 100-1,000 m², which are located in older buildings (among others in Copenhagen K).
However, it is essential to note that not all small and medium-sized companies can be generalised. For example, we have seen a significant growth in activity among companies within the energy industry, which has not been that active previously.
The picture is somewhat different for the large Danish and international companies, which are more financially robust and have already come back after crises several times.
Although moving from one office to another is a costly, difficult, and time-consuming process for these companies, they have acknowledged the value of having an attractive office where both existing and new employees want to work.
In 2023, we have, therefore, seen that the large Danish and international companies have been more able to make decisions despite the uncertainties in the market, and the supply of larger leases has, therefore, remained very low.
82 | RED Danish Investment Atlas 2024
WHERE DO THE TENANTS WANT TO BE LOCATED?
In general, companies are increasingly focusing on having the right location. Therefore, many companies moved from the surrounding municipalities and closer to Copenhagen or from less attractive areas in the surrounding municipalities to the most attractive areas in those municipalities (e.g., to Tuborg Havn in Hellerup, Gladsaxe Erhvervskvarter in Søborg, Lautrup in Ballerup, or in Lyngby).
In the surrounding municipalities, the activity was primarily driven by companies with i) a lower willingness to pay for office leases, ii) employees from all over Zealand, and/or iii) a significant need for parking spaces. In Copenhagen, the activity was driven by a wide range of companies that focus on the possibilities for recruiting the best employees.
Although Copenhagen is small in an international context, there are still significant differences in what the various areas offer and how much it costs to rent an office there.
In this regard, areas like Ørestad, Sydhavn, and Valby are counterparts to each other, as these areas all have a short distance to central Copenhagen but significantly lower rent levels. When the metro to Sydhavn opens, we expect Sydhavn to have a competitive advantage over other areas due to its waterfront location. However, due to the current high supply in Ørestad, the area can offer something that no other areas in Copenhagen can – the possibility for quick move-in in both large and small leases.
WHAT OFFICE AMENITIES DO TENANTS WANT?
The physical environment has become the aspect where it is most difficult to say anything general about the tenants’ demand, as the demand depends on the individual company’s identity and values. The most attractive leases can thus both be located in newly built office buildings as well as in historical properties that have been converted into unique offices.
An overarching trend in the office market is that all tenants are focusing on sustainability. While the large Danish and international companies demand that the sustainability profile of the leases can be documented (which leads to a natural preference for the newly built sustainability-certified properties), the demands from smaller companies are less formalised but nevertheless present. This has resulted in a lower demand for leases in the older office buildings in Copenhagen.
Another trend is that many companies, from small startups to large international corporations, are increasingly seeing benefits
in leasing offices in multi-tenant buildings, office hotels, or similar setups. This is because these leases offer more opportunities to scale up and down in the size of the leases and also offer attractive shared facilities.
A final and noteworthy trend is that it has become clear that tenants are no longer willing to compromise on their demands. Thus, if you, as a landlord, offer the right office that can meet the tenants’ demands for location and physical space (both aesthetics and functionality), it is not the rent that is decisive, and then you do not have to worry about vacancy in your lease.
Although the area around Nordhavn is among the most expensive locations in Copenhagen, there was a high demand for leases in the area. This is, among other things, due to the fact that Nordhavn is a “best-in-class” example of an area where tenants can more or less have all of their demands met ( figure 46).
At the other end of the spectrum, we saw a slowdown in activity in areas like Copenhagen K and the surrounding neighbourhoods. This can be attributed to the fact that these areas contain many office leases in old buildings that no longer meet all of the tenants’ demands. Moreover, these areas attract companies that have not been active in the market in the past year.
Figure 46:
EXAMPLES OF THE OFFICE TENANTS’ REQUIREMENTS
THE LOCATION
• Short distance to central Copenhagen
• Easily accessible by public transport
• Attractive nearby environment
• Attractive outdoor areas
• Proximity to water
• Short distance to the highway network
THE PHYSICAL ENVIRONMENT
• Modern newly built office buildings
• Unique offices in historic properties (silos, warehouses, etc.)
• Attractive shared facilities
• Focus on sustainability
Office | 83 OFFICE
HOTEL RETAIL LOGISTICS RESIDENTIAL ANNUAL REVIEW
EXPECTATIONS FOR 2024
Both the tenants and the investors are becoming more and more specific about what they want and don’t want. Therefore, in 2024, we expect both the occupier and the investment market to become more polarised. However, there are many indications that the players in the investment market, in particular, have to accept that the reality today is different than it was years ago and that we will not return to the same situation anytime soon.
THE OCCUPIER MARKET
NORMALISED ACTIVITY ON THE OCCUPIER MARKET
After several years of high demand for office spaces, there was a slowdown in the leasing activity in 2023. Small and medium-sized businesses, in particular, preferred to wait and see how the situation developed before deciding to move to new leases. However, large and well-established companies continued to show reasonable activity, and no factors indicate a significant change in the near future.
Therefore, we expect to see an overall leasing activity in 2024 that is on level with 2023. This expectation is supported by our investor survey from Q1 2024, which shows that more than three-quarters of the investors expect the tenant demand to remain stable in the first half of the year ( figure 47). Consequently, we anticipate seeing a more normalised market, where there again is room for negotiations without leases being quickly taken off the market.

SLOWDOWN IN CONSTRUCTION
In recent years, increasing material prices and interest rate increases have made it challenging for developers to make profitable business plans. Therefore, we have seen a slowdown in the construction activity. Although material prices and interest rates have dropped slightly, we expect developers to continue to be cautious about starting new office construction projects in the near future. Consequently, we anticipate only a limited addition of new office buildings to the market in the coming years.
Although we have not seen a significant change in the office vacancy rates in Denmark in recent years (unlike many parts of the world), the combination of limited new construction and the expectation of a more or less unchanged tenant demand implies that we expect the vacancy rate in Copenhagen to remain stable or only increase slightly in 2024.
FAR FROM TOP TO BOTTOM
As in 2023, we expect the tenants to continue making non-negotiable demands in terms of their leases’ location and physical features. Therefore, we expect to see an increasing difference in the tenant demand for primary and secondary leases in 2024.
The most sought-after leases will be those that can meet all of the physical requirements (sustainability, aesthetics, indoor climate, attractive shared facilities, flexibility in layout and size) and that are located in the most attractive areas (central Copenhagen with easy access to public transportation and an attractive nearby environment). However, only a certain share of the existing office leases can meet these requirements, and with limited new construction, the supply will, therefore, continue to be limited. Consequently, we expect vacancy rates for these types of leases to remain very low and that tenants will be willing to pay increasingly higher rents.
As in 2023, we expect the tenants to continue making non-negotiable demands in terms of the leases’ location and physical features. Therefore, we expect to see an increasing difference in the tenant demand for primary and secondary leases in 2024.”
Anders Krogh Partner, Office Letting, RED
84 | RED Danish Investment Atlas 2024 OFFICE
The leases in the older buildings and those located in the less attractive micro-locations will no longer be able to meet the demands of today’s office tenants. Therefore, we expect to see a more limited tenant demand for these older and less attractively located leases, which is why they are expected to constitute the majority of the vacant leases in Copenhagen. This limited demand and increasing vacancy are expected to result in rent levels remaining stable.
PARTS OF THE SURROUNDING MUNICIPALITIES ARE CHALLENGED
Similar to Copenhagen, the tenant demand in the surrounding municipalities is expected to depend largely on whether the properties
are newly built or older office buildings and whether they are located in one of the most sought-after areas or not.
The most attractive leases in the surrounding municipalities will be the newly constructed office leases that are located in one of the most attractive areas (e.g., Tuborg Havn in Hellerup, Gladsaxe Erhvervskvarter in Søborg, Lautrup in Ballerup, or in Lyngby). For these leases, we expect the tenant demand, and thus both vacancy rates and rent levels, to remain more or less unchanged.
However, secondary offices in the surrounding municipalities (i.e., the older
During the coming six months, the demand on the office occupier market will:
office buildings located outside the most sought-after areas) are expected to come under greater pressure. Therefore, we expect vacancy rates to increase and a slight decrease or, at best, stable rent levels for secondary offices in the surrounding municipalities.
Therefore, we expect to see an increasing spread in the rent levels both in terms of location (from prime locations in Copenhagen to secondary in the surrounding municipalities) and in terms of physical features (from the modern leases that can meet all of the tenants’ demand to the older leases that cannot).
Continued on next page


The Cushman & Wakefield | RED Investor Confidence Index
The index monitors 115 of the most active investors’ expectations for the Danish commercial real estate market during the coming six months. The broad coverage ensures that the findings are representative reflections of the investors’ confidence in the Danish market. By conducting the survey on a biannual basis, we are also able to track changes in the confidence.


60% 32% 10% 66% 24% 69% 25% 77% 12% 11% Office | 85 OFFICE
Figure 47: Investor Confidence Index – Office occupier demand
Increase Remain stable Decrease HOTEL RETAIL LOGISTICS RESIDENTIAL ANNUAL REVIEW


Q3 2022 Q1 2023 Q3 2023 Q1 2024 63% 25% 12% 52% 35% 13% 46% 36% 18% 22% 63% 15% Increase Remain stable Decrease 86 | RED Danish Investment Atlas 2024
During the coming six months,
for office properties will:
Figure 48: Investor Confidence Index – Office yields
market yields
Continued from previous page
THE INVESTMENT MARKET
THE YIELD WILL PEAK IN 2024
After many years of declining yield requirements for Copenhagen office properties, significant increases in the interest rates have caused the yield curve to turn. Consequently, prime office yields have increased by approximately 125 basis points since the market peaked. During the same period, long-term interest rates have increased by about 300 basis points. This implies that office investors are still not fully compensated for the significant increase in the interest rates, as the yield requirement started from a very low level.
Therefore, we expect to see a continued upward pressure on the yield levels for office properties in the coming period. However, with yield requirements having already increased significantly and interest rates expected to fall back slightly in 2024, we do not expect to see the same large adjustments in the yield levels as seen in 2023.
This expectation is supported by our investor survey, which shows that investors have become more optimistic during the
However, with yield requirements having already increased significantly and interest rates expected to fall back slightly in 2024, we do not expect to see the same large adjustments in the yield levels as seen in 2023.”
Lior Koren
Partner and Head of Capital Markets, RED
past year, as the share of investors expecting yield requirements to increase has decreased, and the majority of the investors are now expecting yield requirements to remain unchanged ( figure 48).
COPENHAGEN WILL DOMINATE
Even in times with minor differences between primary and secondary assets, the investors primarily demanded the safest office assets located in the country’s largest cities. As the occupier market becomes increasingly polarised, we also expect the investment market to become more polarised. In 2024, we expect the majority of the investment activity in the office segment to involve prime properties located in Copenhagen, and the further away from the country’s largest cities, the lower investment activity will be – even though the yield levels are increasing with distance (all else being equal).
ABSENCE OF FOREIGN CAPITAL
As only a limited share of foreign investors has a strong local insight, we expect it to be difficult to convince the investors
of the attractive underlying conditions in the Copenhagen office market. Moreover, the continued high interest rate levels continue to challenge the leveraged investors’ (which foreign investors typically are) business plans.
Therefore, we expect it to be difficult to attract foreign capital to the office segment, and Danish investors will, as a result, likely dominate the segment again in 2024. However, global trends also impact several Danish investors, and we, therefore, expect to continue seeing a lower number of potential investors and, consequently, a lower investment activity compared to what we were used to in the period from 2015 to 2022.
Office | 87 OFFICE
HOTEL RETAIL LOGISTICS RESIDENTIAL ANNUAL REVIEW
CLICK TO SEE DATA FOR ALL OF THE AREAS
On app.redata.dk/kontormarkedet there is a detailed overview for each of the 19 areas.
* The rent is the average gross rent (DKK per m² incl. operating expenses) for which all leases in the area were offered in 2023.
** The figure indicates the percentage change in the gross rent from 2022 to 2023.
*** The rent is the average gross rent (DKK per m² incl. operating expenses) for which the most expensive leases in the area were offered in 2023. The calculation of the top rent depends on the number of leases offered in the area, but is in most cases based on 1-5 leases.
6 9 10 5 3 2 4 7 11 15 12 19 18 17 16 14 13 8 1 88 | RED Danish Investment Atlas 2024 OFFICE
# AREA AVG. RENT TOP RENT PRIME YIELD 2023* Δ 22-23** 2023*** Q1 2024 1 Christianshavn & City Center 2,250 3% 2,840 4.25 - 4.75% 2 Copenhagen SW 2,370 -2% 2,690 4.25 - 4.75% 3 North Harbour 2,690 14% 3,130 4.50 - 5.00% 4 Frederiksberg & Cph. W 1,720 2% 2,310 4.50 - 5.00% 5 Copenhagen E 1,840 8% 2,360 4.50 - 5.00% 6 Carlsberg Byen 2,370 5% 2,550 4.50 - 5.00% 7 Copenhagen N 1,760 -2% 2,000 4.50 - 5.00% 8 Copenhagen NW 1,670 -1% 2,000 5.00 - 5.50% 9 Islands Brygge 1,980 -2% 2,440 5.00 - 5.50% 10 Ørestad 1,810 -9% 2,130 5.00 - 5.50% 11 Jernbanebyen N/A N/A N/A 5.25 - 5.75% 12 Valby 1,860 3% 2,020 5.25 - 5.75% 13 Amager East + CPH. Airport 1,690 1% 1,920 5.25 - 5.75% 14 Tuborg Harbour 2,270 -11% 2,450 5.25 - 5.75% 15 Kongens Lyngby 1,550 10% 2,020 5.25 - 5.75% 16 Søborg & Gladsaxe 1,060 -9% 1,560 6.25 - 7.00% 17 Inner Ring 3 830 -20% 1,320 6.50 - 7.25% 18 Ballerup & surrounding 1,180 8% 1,600 6.75 - 7.50% 19 Outer Ring 3 900 -11% 1,630 6.75 - 7.50%
KEY FIGURES
Office | 89 OFFICE OFFICE – TOP 30 TRANSACTIONS 2023 PROPERTY CITY MONTH GROSS AREA PRICE (DKK) INVESTOR VENDOR 1 Codanhus & Kalvebod Br. Copenhagen November 70,980 m2 2,500,000,000 AP Pension Corem 2 Njalsgade 17-23 Copenhagen S December 29,174 m2 750,000,000* PenSam Alfa Development 3 GN Store Nord HQ Ballerup November 35,608 m2 500,000,000 Nordania Leasing GN Store Nord 4 Blegdamsvej 124 Copenhagen E February 7,600 m2 311,901,000 PenSam Oskar Group 5 Sparekassen Sjælland-Fyn HQ Copenhagen W May 4,500 m2 285,000,000 Sparekassen Sjælland-Fyn Udviklingsselskabet Carlsberg Byen 6 Hausergården Copenhagen K February 6,857 m2 200,000,000 Hauser Plads Angelo Gordon 7 Revisorernes Hus Copenhagen K January 4,706 m2 169,000,000 COPI Group FSR – danske revisorer 8 Lautrupvang 24 Ballerup November 5,760 m2 89,000,000 Velliv PFA Ejendomme 9 Helseholmen 1 Hvidovre May 12,854 m2 84,800,000 Helseholmen 1 Spar Nord Bank 10 Langdyssen 6 Aarhus N March 6,418 m2 78,000,000 SL Erhverv Promovec Group 11 Roskildevej 342A Taastrup October 8,058 m2 76,150,000 Scanavo Holding Kka 2011 Holding 12 Kongevejen 495B Holte January 4,860 m2 71,500,000 Ejendomsselskabet Kongevejen 495b Corem 13 Klædemålet 9 Copenhagen E July 3,893 m2 71,500,000 Wihlborgs Private investor 14 Øens Pakhus Copenhagen S June 3,451 m2 70,000,000* Vision Properties Øens Invest 15 Jyllandsgade 79A Esbjerg November 8,200 m2 68,000,000 Holdingselskabet af 1.1.2005 F.E.I. Holding 16 Nordre Fasanvej 27 Frederiksberg March 2,826 m2 66,000,000 Liljegren Kaphi Ejendomme 17 Nymøllevej 59 Kongens Lyngby January 10,621 m2 64,000,000 K/S Nymøllevej, Lyngby Danica Ejendomme 18 Paludan-Müllers Vej 82 Aarhus N April 7,701 m2 58,700,000 Byggeselskab Mogens de Linde NAS Invest Group 19 Porsvej 2 Aalborg March 10,332 m2 55,000,000 Black Box Business Building Mehlum Holding 20 Admiralgade 15 Copenhagen K August 1,796 m2 55,000,000 Copenhagen Property Invest Holding Begravelseskassen Danmark 21 Kongens Kvarter 51 Fredericia August 3,525 m2 55,000,000 Energinet Danske Leasing 22 Dalgasgade 27 Herning November 4,520 m2 51,000,000 Ejendomsselskabet Dalgasgade 27 A.P. Møller og Hustru Chastine Mckinney Møllers Fond Til Almene Formål 23 Godthåbsvej 25 Skanderborg June 5,430 m2 47,500,000 Estatus Holding 3 Private investor 24 Jernbanegade 3A Roskilde August 3,631 m2 44,500,000 Ejendomsselskabet Jernbanegade 3A Danica Ejendomme 25 Bjerregårdsvej 16 Valby August 1,158 m2 41,250,000 Dansk Jernbaneforbund Blackstone 26 Antoinettevej 3 Valby April 1,177 m2 39,000,000 H.A.L. HOLDING Blackstone 27 Bjerregårdsvej 10 Valby April 537 m2 38,500,000 Private investor JD Gerner Holding 28 Dæmningen 34A Vejle October 4,692 m2 36,500,000 Bo-To Ejendomme Park Street 29 Herstedvang 7A Albertslund July 14,000 m2 35,000,000 Simpson Capital Jeudan 30 Vandkunsten 6 Copenhagen K March 1,448 m2 34,000,000 Vandkunsten 6 Holding Sydjysk Ejendomsaktieselskab * Estimated price Source: ReData OFFICE TRANSACTIONS HOTEL RETAIL LOGISTICS RESIDENTIAL ANNUAL REVIEW
RED assists Julius M. Goldschmidt
Holding with the letting of a retail lease on 240 m² located at Christian IX’s Gade in the city centre of Copenhagen.

90 | RED Danish Investment Atlas 2024
Interview: The Winners Will Be Those Who Prioritise the Customers Highlight:
Retail | 91 RETAIL RETAIL
& Investors
Volume
Geographical Distribution
Top 5 Transactions 2023
Copenhagen
Expectations for 2024 Transactions & Key Figures 92 94 98 100 102 104 108 HOTEL LOGISTICS RESIDENTIAL ANNUAL REVIEW OFFICE
The High Streets of
in 2023
VOLUME & INVESTORS
THE VOLUME DECREASED TO ONE-FOURTH
With a total transaction volume of DKK 4.9 bn, the volume in the retail segment decreased by 74% from 2022 to 2023, and the segment, therefore, went from being the second largest segment to the fourth largest segment ( figure 51).
The significant decline in volume can both be attributed to the fact that the investor appetite for retail assets continued to be limited, but also to an extraordinarily high volume in 2022, where several portfolios and larger standalone transactions boosted the volume. In contrast, in 2023, we observed that the volume was primarily invested in smaller properties with volumes below < DKK 50 m, which accounted for half of the volume in the segment ( figure 50).
THE HUNT FOR YIELDS
In the past few years, we have observed that investors have sought less cyclical assets within the retail segment, where portfolios of grocery stores, in particular, have made up a large share of the total volume.
The less cyclical assets remained attractive in 2023. However, the investment activity
was also influenced by the search for returns and an assessment of the individual business case rather than a general trend in demand. This can, for example, be seen from the fact that the five largest retail transactions of the year comprised various asset types, including a destination centre, a user purchase of a big box portfolio and a bankrupt local centre.
However, a trend that continued was the minimal investor appetite for high street properties. Consequently, not a single highstreet asset was traded in Copenhagen during the year.
THE INVESTORS WERE PRIMARILY DANISH
Source: ReData
Like in the other segments, Danish investors dominated the retail segment in 2023, as more than three-fourths of the invested capital was Danish ( figure 49). The foreign investors’ share in the retail segment is primarily driven by Swiss Life Asset Managers Nordic’s acquisition of the shopping centre, Næstved Storcenter and Lidl Danmark’s acquisition of a number of grocery stores.
Source: ReData
4.9 BN DKK RETAIL VOLUME 2023 VENDORS INVESTORS Asset deals 66% Foreign 30% Share deals 34% Danish 70% Foreign 22% Danish 78% 92 | RED Danish Investment Atlas 2024 RETAIL
Figure 49: Origin of the investors & transaction structure 2023
Price range (M DKK) No. of transactions Volume (M DKK) 2022 2023 2022 2023 0 - 50 823 675 4,263 2,599 50 - 150 20 9 1,571 633 150 - 250 7 3 1,257 544 250 - 500 4 1 1,231 320 > 500 4 1 10,690 840 Total 858 689 19,012 4,936
Figure 50: Retail – Breakdown in price range 2023
0 4 8 12 16 20 2023 2022 2021 2020 2019 2018 2017 2016 2015 2014 BN DKK Source: ReData Danish Foreign ATP/Danica deal Magasin deal 27% 4.4 73% 39% 9.6 61% 42% 19.0 35% 23% 22% 4.9 78% 8.1 44% 56% 31% 7.6 69% 40% 15.9 16% 44% 50% 7.9 50% 67% 8.9 33% 57% 43% 7.6 Retail | 93 RETAIL
Figure 51: Retail – Transaction volume 2014-2023
Investor Origin Volume (M DKK)* No. of transactions 1 Swiss Life CH 840 1 2 Salling Group DK 316 4 3 Blue Capital DK 298 9 4 Coop Danmark DK 240 7 5 A&M Sheikh DK 201 2 Source: ReData
Figure 52: Retail – Top 5 investors 2023
Investor Origin Volume (M DKK)* No. of transactions 1 ATP DK 7,080 3 2 Peek & Cloppenburg DE 4,053 1 3 Rema 1000 NO 3,482 27 4 Patrizia DE 2,909 6 5 Danske Shoppingcentre DK 2,788 3 Source: ReData * The stated volumes are for the retail part only, which is why any other uses in mixed properties are not included in the volume. ** After the preparation of data for this publication, several transactions from 2023 have been published - including DK Retail Invest’s acquisition of 64 Rema 1000 stores for approx. DKK 1.8 bn and Lidl’s acquisition of 11 Rema 1000 stores for approx. DKK 450 m. These transactions are not included in the data. HOTEL LOGISTICS RESIDENTIAL ANNUAL REVIEW OFFICE
Figure 53: Retail – Top 5 investors 2014-2023
COPENHAGEN 0.5 BN DKK 10% COPENHAGEN 0.5 BN DKK 10% 1.8 BN DKK 37% OTHER ZEALAND 0.2 BN DKK 5% AARHUS 4.9 BN DKK RETAIL VOLUME IN TOTAL GREATER COPENHAGEN Danish 98% Foreign 2% Danish 78% Foreign 22% Danish 87% Foreign 13% Danish 51% Foreign 49% Danish 100% Foreign 0% 1.9 BN DKK 38% OTHER JUTLAND AND FUNEN Danish 93% Foreign 7% 100% 0.5 BN DKK 10% COPENHAGEN 0.5 BN DKK 10% 1.8 BN DKK 37% OTHER ZEALAND 0.2 BN DKK 5% AARHUS 4.9 BN DKK RETAIL VOLUME IN TOTAL GREATER COPENHAGEN Danish 98% Foreign 2% Danish 78% Foreign 22% Danish 87% Foreign 13% Danish 51% Foreign 49% Danish 100% Foreign 0% 1.9 BN DKK 38% OTHER JUTLAND AND FUNEN Danish 93% Foreign 7% 100% 0.5 BN DKK 10% COPENHAGEN 0.5 BN DKK 10% 1.8 BN DKK 37% OTHER ZEALAND 0.2 BN DKK 5% AARHUS GREATER COPENHAGEN Danish 98% Foreign 2% Danish 87% Foreign 13% Danish 51% Foreign 49% Danish 100% Foreign 0% 0.5 BN DKK 10% COPENHAGEN 0.5 BN DKK 10% 1.8 BN DKK 37% OTHER ZEALAND 0.2 BN DKK 5% AARHUS GREATER COPENHAGEN Danish 98% Foreign 2% Danish 87% Foreign 13% Danish 51% Foreign 49% Danish 100% Foreign 0% 0.5 BN DKK 10% COPENHAGEN 0.5 BN DKK 10% 1.8 BN DKK 37% OTHER ZEALAND 0.2 BN DKK 5% AARHUS 4.9 BN RETAIL VOLUME GREATER COPENHAGEN Danish 98% Foreign 2% Danish 87% Foreign 13% Danish 51% Foreign 49% Danish 100% Foreign 0% 100% 0.5 BN DKK 10% COPENHAGEN 0.5 BN DKK 10% 1.8 BN DKK 37% OTHER ZEALAND 0.2 BN DKK 5% AARHUS 4.9 BN DKK RETAIL VOLUME IN TOTAL GREATER COPENHAGEN Danish 98% Foreign 2% Danish 78% Foreign 22% Danish 87% Foreign 13% Danish 51% Foreign 49% Danish 100% Foreign 0% 1.9 BN DKK 38% OTHER JUTLAND AND FUNEN Danish 93% Foreign 7% 100% 94 | RED Danish Investment Atlas 2024 Source: ReData RETAIL
DISTRIBUTION
GEOGRAPHICAL
RED assisted a private owner with the letting of 264 m² located on Amagertorv 18 to The Body Shop.
Retail | 95 RETAIL
FOR RETAIL 2023 AREA NO. OF PROPERTIES VOLUME (M DKK) AVR. VOLUME (M DKK) WEIGHTED PRICE PER M² 2023 Δ 2022-2023 Copenhagen 55 508 9.2 35,000 -10% Greater Copenhagen 31 504 16.2 20,200 -7% Other Zealand 174 1,804 10.4 13,000 -6% Aarhus 24 231 9.6 22,000* -7% Other Jutland & Funen 437 1,890 4.3 7,900 -30% Total 721 4,936 6.8 11.600 -24% * The price per m² is excl. the sale of City Vest, which was sold at a price of approx. DKK 2,400 per m².
KEY FIGURES
HOTEL LOGISTICS RESIDENTIAL ANNUAL REVIEW OFFICE
GEOGRAPHICAL DISTRIBUTION
DECREASE IN ALL GEOGRAPHICAL AREAS
In 2023, the investment activity in the retail segment only reached a quarter of the total retail volume seen in 2022. This decline in activity is also reflected in the investment volume for the different geographical areas. While the volume increased across all geographical areas in 2022, the situation was completely reversed in 2023, as the activity decreased in all areas ( figure 54).
THE TOP TRANSACTIONS DICTATE THE GEOGRAPHICAL DISTRIBUTION
As the investor interest in retail assets remained limited in 2023, the geographical distribution of the volume was once again driven by the location of the largest transactions, which together accounted for 36% of total retail volume.
While the geographical distribution of the volume in 2022 was driven by the sale of larger prime assets located in central Copenhagen (Magasin & Galleri K) as well as portfolios with grocery stores located across the country (in the “rest of Denmark”), the geographical distribution in 2023 was driven by the fact that the largest transactions of the year (destination centre, big box portfolio, local centre etc.) were located across Denmark and outside the country’s largest cities.
NO TRANSACTIONS WITH EXPENSIVE PROPERIES
The new interest rate level turned the investors’ attention towards the retail assets that could offer the highest returns. This is one of the reasons why, across the country, we observed a decline in square meter prices for retail properties from 2022 to 2023 (see table on p. 95). While it was particularly the asset types characterised by the lowest
yields (less cyclical convenience stores and best- located high street properties) that drove volume in 2022, the transaction volume in 2023 was merely driven by the sale of assets that are generally characterised by higher yields and lower square meter prices.
FOREIGN CAPITAL DISAPPEARED
Foreign investors dominated the retail segment across all geographical areas in 2022, but in 2023, the capital invested in Copenhagen, Greater Copenhagen, and Aarhus was almost solely Danish. The foreign investors were, however, active in the “rest of Denmark”, primarily driven by the Swiss investor, Swiss Life Asset Managers Nordics, acquisition of Næstved Storcenter, which accounted for three-fourths of the foreign capital in the segment.
0 2 4 6 8 10 BN DKK 52% 48% 51% 49% 98% 59% 41% 96% 27% 87% 75% 34% 27% 73% 66% 25% 73% 90% 2023 2022 2021 2023 2022 2021 2023 2022 2021 2023 2022 2021 COPENHAGEN GREATER COPENHAGEN AARHUS REST OF DENMARK
96 | RED Danish Investment Atlas 2024
Source: ReData Danish Foreign
RETAIL
Figure 54: Retail – Historic geographic breakdown 2021-2023

Retail | 97 RETAIL
HOTEL LOGISTICS RESIDENTIAL ANNUAL REVIEW OFFICE
RED assisted Ole Haslunds Hus with the letting of 514 m² located on Amagertorv 14 to Rains.
TOP 5 TRANSACTIONS 2023

NÆSTVED STORCENTER
The largest retail transaction of the year was completed when Blackrock, after six years of ownership, sold the shopping centre Næstved Storcenter to a fund owned by Swiss Life Asset Managers Nordic and a group of investors. As part of the transaction, the coinvestor, Scandinavian Shopping Center Partners, takes over the dayto-day operations and the ongoing development of the centre. Næstved Storcenter comprises approximately 43,000
and 70 stores.
BR PORTFOLIO
Salling Group took over a portfolio of ten retail properties located across the country from Abrdn in December 2023. The port folio includes eight standalone BR stores and two retail parks. In 2016, the portfolio was sold to Abrdn in a sale-and-leaseback transaction by the former owner of BR, but after the acquisition of the portfolio, Salling Group (which in 2019 acquired BR) has now acquired the properties back.
1 98 | RED Danish Investment Atlas 2024
2
m2
Price (DKK) 840,000,000 Investor Swiss Life Gross area (m²) 44,999 Vendor BlackRock (hereof basement 5,414) Est. price (DKK) 318,000,000 Investor Salling Group Gross area (m²) 29,393 Vendor Abrdn
RETAIL
Photo: CBRE
Photo: RED
ROTUNDEN
In April 2023, KFI Erhvervsdrivende Fond acquired Rotunden on Strandvejen in Hellerup from Dades. The property comprises approximately 5,000 m2 of commercial space, out of which 3,300 m2 are let to the grocery tenant Meny, who has been a tenant in the property since the building was constructed. In addition to the grocery store, Rotunden includes several restaurants/cafés, shops, and offices let to various clinics and a law firm.
GALLERIERNE
The company behind Gallerierne in Hillerød sold the shopping centre to A&M Sheikh in March 2023. For several years, Gallerierne has been challenged, and the former owner, therefore, tried to optimise the shopping centre through extensive renovations. KLK Momentum takes over the property with the intention of completing the development and renovation of the centre, which will include a wide range of restaurants and cafes, shops, and a new large cinema.
FAM-KRI PORTFOLIO
The fifth-largest retail transaction of the year was completed in April 2023 when Jansen Ejendomme acquired all the properties owned by FAM-KRI Holding. The portfolio comprises three retail properties located in Jutland (a small retail property in Frederikshavn and two bigbox properties in Aabenraa and Vejle). While the property in Aabenraa was vacant at the time of acquisition, the property in Vejle was let to several tenants, including several car dealerships and a paint shop.
The stated prices are for the transactions as a whole, which is why the prices may include uses other than retail.
Retail | 99 RETAIL
3 4 5
Est. price (DKK) 179,350,000 Investor Jansen Ejendomme Gross area (m²) 14,026 Vendor FAM-KRI Holding (hereof basement 252) Price (DKK) 199,000,000 Investor A&M Sheikh Gross area (m²) 17,805 Vendor Gallerierne Hillerød Price (DKK) 216,000,000 Investor KFI Erhvervsdrivende Fond Gross area (m²) 5,278 Vendor Dades
Photo: Dades
Photo: Skråfoto
HOTEL
RESIDENTIAL ANNUAL REVIEW OFFICE
Photo: All Remove
LOGISTICS
THE WINNERS WILL BE THOSE WHO PRIORITISE THE CUSTOMERS
The growth of e-commerce, the covid-19 pandemic, and a historically low consumer confidence have challenged players in the Danish retail industry for many years, leading to predictions about the death of the physical stores. However, despite challenges, we have seen that customers are returning to the physical stores, and at the same time, new retailers have entered the Danish market. As the largest owner of shopping centres in Denmark, Danske Shoppingcentre (DSC) has witnessed both ups and downs.
In the following interview, Jesper Faurholdt, CEO of Danske Shoppingcentre, sheds light on the recent trends and expectations for the future of the Danish shopping centre market.

100 | RED Danish Investment Atlas 2024
What trends have influenced the shopping centre market in recent years?
Post-covid pandemic, we observe a significant need for physical gatherings. Therefore, we see increasing visitor numbers in our centres, and this is reflected in our letting statistics. We are coming out of 2023 strongly with low and improved vacancy rates, and we have set an all-time high record on the number of lease agreements signed in 2023. I also think that it has become very clear that the future is not about either physical retail or e-commerce but both. Customers are present in both places, and it’s all about being where the customers are. I believe that the old prediction that physical retail will lose is definitively dead. Those who win are those who focus on the customers and not on the “platform” - and it has become very clear over the past few years that a good e-commerce solution cannot stand alone without physical stores.
Will you invest further in shopping centres in Denmark – and why/why not?
We are currently investing heavily in our centre portfolio - approximately DKK 1 bn in total. Our investments can be divided into three categories:
Commercial upgrades 25%
This is to enhance the customer experience. For example, we are investing in new

and comfortable seating, new lighting, modernised restroom facilities, etc. Essentially, everything that should entice customers to stay a little longer or come a little more often.
Building maintenance 25%
This is, for the most part, energy optimisations but also regular upgrades.
Development projects 50%
8,000 m2 expansion of Kolding Storcenter, which is already Jutland’s largest shopping centre. In the centre, there will now be a Leo’s Legeland (a play centre) and an ILVA furniture store – categories we didn’t have before, and which will now strengthen the centre further.
Expansion of Lyngby Storcenter with a new Comwell hotel, establishment of a rooftop restaurant on the 13th floor, development of a new large area on the 2nd floor, as well as a general modernisation of the entire centre.
Which factors do you expect to be crucial for the Danish shopping centre market in the coming year?
At DSC, we operate based on a mantra that says, “We develop the marketplaces of the future for shopping, inspiration, and
At DSC, we have, therefore, transitioned from solely thinking about leasing square meters to creating destinations where customers want to come and stay.”
Jesper Faurholdt CEO, Danske Shoppingcentre
experiences,” and for us, it’s again about looking at the customer needs. We have to consider a larger part of the customer journey than just having to buy a given product.
At DSC, we have, therefore, transitioned from solely thinking about leasing square meters to creating destinations where customers want to come and stay.
It still, of course, revolves around having the right mix of stores – a good combination of strong international and national brands, locally anchored shops, and good cafes and restaurants. But it’s also about giving customers inspiration and experiences in both the stores and in the common areas, as well as through our events. We aim to create a positive atmosphere and a staging that makes people feel comfortable and enjoy being there. I believe this will become even more important going forward – the boring and average will have a tough time.
JESPER FAURHOLDT
Jesper Faurholdt is CEO of Danske Shoppingcentre. Jesper has been with DSC since 2019 and came from a position as managing director in the French building materials conglomerate Saint-Gobain Distribution Denmark.
Danske Shoppingcentre was founded as a joint venture between ATP Ejendomme and Danica Ejendomme at the turn of the year 2017/18. Danske Shoppingcentre has a total portfolio of 17 shopping centres located across Denmark, making them the largest shopping centre owner in Denmark.
Retail | 101 RETAIL
HOTEL LOGISTICS RESIDENTIAL ANNUAL REVIEW OFFICE
THE HIGH STREETS OF
By the beginning of 2023, expectations for the high streets of Copenhagen were higher than they had been in many years, and although many things were not as the market players could have wanted, the market lived up to its expectations. Danish and international customers have returned, and the vacancy rate has been decreasing. However, a decisive factor for the future is where both customers and tenants are heading.
The
102 | RED Danish Investment Atlas 2024
COPENHAGEN IN 2023 3 4 5 6 7 2 8 9 10 1 Kultorvet Østergade Gammeltorv Vimmelskaftet Amagertorv Købmagergade Figure 55: Footfall count per hour Street 2023 Index* 1 Østergade/ Ny Østergade 4,619 148 2 Østergade/ Pilestræde 6,105 130 3 Amagertorv/ Købmagergade 5,217 127 4 Amagertorv/Niels Hemmingsens Gade 5,425 99 5 Vimmelskaftet/ Klosterstræde 5,328 97 6 Vimmelskaftet/ Nygade 4,757 98 7 Frederiksberggade 4,328 96 8 Købmagergade/ Valkendorfsgade 5,758 123 9 Rundetårn 5,610 133 10 Frederiksborggade/ Rosenborggade 4,725 117 * Index 100 = avg. for 2019-2022. METHODOLOGI RED carries out the footfall counts on Fridays at 4 pm with the purpose of registering the development and estimating the level of footfall at different locations on Strøget and Købmagergade. The footfall is counted manually from both directions. Source: Cushman & Wakefield | RED
size of the circle indicates the footfall count per hour.
larger the circle,
higher the footfall.
The
the

Vacancy rate
No. of vacant leases
RED’s expectations
Source: Cushman & Wakefield | RED
LUXURY RETAILERS ARE DISTANCED FROM THE MASS MARKET
For many years, we have emphasised that the tenants of retail leases tend to look for like-minded concepts and brands, which can shift the rent potential in different areas of a shopping street, as tenants from some industries are able to pay a higher rent than tenants from other industries. This imbalance has influenced rent levels in Copen hagen, where especially the rent for Amager torv on Strøget is distanced from the rent level on the other high streets. This is due to the area around Amagertorv facing a strong interest from international luxury retailers.
EVERYONE IS MOVING TOWARDS THE CENTRE
Fundamentally, we have observed that the outer parts of the high streets, in the east, west, and north, experience significantly lower (or no) rent growth compared to the central parts of the streets, where Amagertorv is considered the centre.
This trend can partly be explained by our footfall data, indicating that traffic follows suit. The centrally located areas of the high
streets experience a denser pedestrian flow (and thus increased customer flows) compared to the outer parts ( figure 55).
Despite the tenants’ strong focus on the neighbourhood dynamics, the best-performing tenants (and those with the greatest ability to pay) are constantly looking towards the areas that, at the same time, have the highest footfall counts. Therefore, we can conclude that the presence of customers remains crucial for retail tenants.
THE CUSTOMERS’ RETURN
In 2020 and 2021, the tourism industry faced strict travel restrictions due to the covid19 pandemic, naturally impacting the footfall on the high streets of Copenhagen. However, already by 2022, traffic had normalised, and this strong footfall development has been observed again in 2023. Thus, customers have returned to the city, engaging in the exchange of goods and consumption of experiences.
CAN VACANCY RATES CONTINUE TO DECLINE?
In 2023, we saw a large decrease in the vacancy rates. The letting of large retail
leases (such as Frederiksberggade 24 to the Museum of Illusions and Købmagergade 19 to Matas) contributed to the drop in the vacancy rates. More frequent lettings of smaller leases lowered the number of vacant leases.
Moreover, international brands occupy an increasingly large share of the leases on Købmagergade and Strøget. In 2023 alone, Chinese DJI, Italian Doppelgänger, British Dr. Martens, American Gant, Swiss Swatch, and Swedish J. Lindeberg have opened stores on one of the two primary high streets.
Thus, the return of consumers has had a spill-off effect on the occupier market of the high streets, where both the vacancy rate and the number of vacant leases have decreased since they peaked in 2021/2022 ( figure 56).
Despite the relatively flat development in the vacancy from the first to the fourth quarter of 2023, we expect the vacancy rates to decrease further and reach around 10% by the turn of 2024/2025. Simultaneously, we anticipate the number of vacant leases to follow the same trend.
25 30 35 40 45 50 55 60 8% 10% 12% 14% 16% 18% 20% 22% Q1 Q3 Q1 Q3 Q1 Q3 Q1 Q3 Q1 Q3 Q1 Q3 Q1 VACANCY RATE NO. OF VACANT LEASES 2019 2020 2021 2022 2023 2024 2025
Retail | 103 RETAIL
Figure 56: Vacancy in Copenhagen 2019-2025
HOTEL LOGISTICS RESIDENTIAL ANNUAL REVIEW OFFICE
EXPECTATIONS FOR 2024
Although the retail segment cannot be generalised in any way, the turnover potential of each individual store is crucial across retail types and locations. In the retail market, everything revolves around one thing – offering what customers demand. This defined the development in both the occupier and the investment market in 2023 and is expected to continue to do so in 2024.
THE OCCUPIER MARKET
AMAGERTORV BELONGS TO AN EXCLUSIVE CLUB
During the past years, we have witnessed an increased polarisation on the high streets of Copenhagen, resulting in record-high rent levels at the very best locations (Amagertorv). However, in 2024, we do not expect to see any changes in the rent levels for the Amagertorv area. This is solely due to the fact that (as of now) we do not expect to see any major relettings in the area. If, against expectations, one or more leases do become available, the tenant demand is likely to be very high, and the rent levels are expected to remain as high as for the recent lettings.
MID-MARKET BRANDS ARE RETURNING
On the other strong high streets (Købmagergade and Østergade), we expect to see stable rent levels. This will be driven by a strong demand from both Danish and international retailers, including both new retailers who are prioritising having a location on the high streets and a comeback of mid-market

brands, which have faced challenges in recent years but which historically have constituted the majority of the tenants on the high streets of Copenhagen.
Likewise, we anticipate stable rental levels on Copenhagen’s secondary high streets (e.g., Pilestræde and Grønnegade). This will be driven by the continued demand from the more unique brands seeking smaller leases. The fact that we do not expect to see rent increases is primarily due to these streets attracting smaller, less capital-intensive brands that can face liquidity challenges more quickly if customer footfall diminishes.
THE CHALLENGING TIMES ARE NOT OVER FOR EVERYONE
Finally, we expect to see pressure on the rent levels on Frederiksberggade and for the more secondary located stores - especially for the stores located outside the country’s largest cities. This expectation is driven by various factors, but primarily because it’s difficult
to attract tenants to the areas where attracting customers is a challenge. To enhance the attractiveness of these areas, we anticipate that landlords may need to “rip off the band” and lower the rents. This could attract strong, well-known tenants who, in the long run, may attract other strong tenants to the area.
SHOPPING CENTRES ARE AT A STANDSTILL
For shopping centres, it will be crucial for the tenant demand that the operator has managed to create the right mix of stores with a broad range of F&B units, experiences, and services. Despite having the right profile, we have seen that the centres, in general, have struggled to increase revenue (adjusted for inflation) in recent years. This is expected to have a negative impact on the tenant demand in the coming time, making it particularly challenging to attract new brands. This does not imply that the centres will face a crisis, but they will likely have to rely on the same tenants as they always have.
In recent years, the vacancy rate on Copenhagen’s high streets has been decreasing, and despite already reaching a low level and the less attractive parts of the main streets being expected to face challenges in the upcoming period, we expect that the overall vacancy rate on the high streets will decrease further in 2024.”
Kristian Vinggaard Partner, Retail, RED
104 | RED Danish Investment Atlas 2024 RETAIL
Similarly, for big box stores, we see that the tenants’ interest primarily comes from the well-known big box brands. These resilient tenants typically stay as tenants in the stores for many years, so it may not necessarily be a downside that the tenants will remain the same. The lack of significant demand from new retailers is primarily due to the hype about big box stores during the pandemic having somewhat subsided.
IMPROVING OPTIMISM
In recent years, the vacancy rate on Copenhagen’s high streets has been decreasing, and despite already reaching a low level and the less attractive parts of the main streets being expected to face challenges in the
upcoming period, we expect that the overall vacancy rate on the high streets will decrease further in 2024.
Thus, our expectations for the retail occupier market depend heavily on the location and the type of leases. However, generally, the positive trends from 2023 and our different expectations for 2024 have resulted in a more optimistic outlook for the market –although certain parts of the market are still expected to face challenges in 2024.
This expectation is supported by our investor survey from early 2024, which shows that the investors have become increasingly positive about the future. Currently, 58% of
the investors expect that the tenant demand in the retail market will remain stable in the first half of the year ( figure 57). However, at the same time, more than a third of the investors still expect a decrease in the tenant demand.
Continued on next page
During the coming six months, the demand
will:


The index monitors 115 of the most active investors’ expectations for the Danish commercial real estate market during the coming six months. The broad coverage ensures that the findings are representative reflections of the investors’ confidence in the Danish market. By conducting the survey on a biannual basis, we are also able to track changes in the confidence.


47% 44% 10% 41% 49% 58% 35% 35% 59% Q3 2022 Increase Remain stable Decrease Q1 2023 Q3 2023 Q1 2024 Retail | 105 RETAIL
Figure 57: Investor Confidence Index – Retail occupier demand
on the retail occupier market
The Cushman & Wakefield | RED Investor Confidence Index
HOTEL LOGISTICS RESIDENTIAL ANNUAL REVIEW OFFICE


Q3 2022 Q1 2023 Q3 2023 Q1 2024 62% 18% 20% 54% 33% 13% 49% 27% 24% 31% 51% 18% Increase Remain stable Decrease 106 | RED Danish Investment Atlas 2024
will:
Figure 58: Investor Confidence Index – Retail yields
During the coming six months, market yields for retail properties
Continued from previous page
For the high street properties in Copenhagen, the yield levels have increased by almost 200 basis points since the market peaked in 2017-2019. Consequently, these assets now offer attractive risk-adjusted returns again. Therefore, after several years with very limited activity, we expect to see an increased investment activity with high street properties in 2024.”
Lior Koren
Partner and Head of Capital Markets, RED
THE INVESTMENT MARKET
RETAIL YIELDS HAVE PEAKED
Although many tenants across the retail segment have performed well through the challenging conditions in recent years, there is still a general reluctance from the investors in regards to investing in retail assets. This has led to a significant upward pressure on yield levels for retail assets, bringing yields - for the majority of retail assets – to a level where even investors utilising leverage can make profitable business plans.
Therefore, we expect the yield levels to remain stable in the upcoming period. This expectation is supported by our investor survey, which shows that approximately half of the investors expect yields for prime retail properties to remain unchanged in the first half of 2024 ( figure 48).
SOME ASSETS WILL BE ILLIQUID
Despite our expectations of stable yield levels, we expect that the investor appetite for the different types of retail assets will remain highly differentiated in 2024.
For the high street properties in Copenhagen, the yield levels have increased by almost 200 basis points since the market peaked in 2017-2019. Consequently, these assets now offer attractive risk-adjusted returns again. Therefore, after several years with very limited activity, we expect to see an increased investment activity with high street properties in 2024.
The safe grocery stores and big box properties with long lease agreements are expected to remain attractive investment
assets. However, investors are facing challenging financing conditions for big box properties, which is why the financial institutions’ willingness to lend to this asset type will be crucial for the investment activity.
Throughout Europe, the investor demand for shopping centres has more or less vanished. Despite the high yield levels, the investor appetite is very limited, and there is no indication that this will change anytime soon. Therefore, we expect to see an extremely limited number of shopping centre transactions in the coming year.
Retail | 107 RETAIL
HOTEL LOGISTICS RESIDENTIAL ANNUAL REVIEW OFFICE
TRANSACTIONS & KEY FIGURES
108 | RED Danish Investment Atlas 2024 RETAIL – TOP 30 TRANSACTIONS 2023 PROPERTY CITY MONTH GROSS AREA PRICE (DKK) INVESTOR VENDOR 1 Næstved Storcenter Næstved December 44,999 m2 840,000,000 Swiss Life BlackRock 2 BR portfolio Across Nation December 29,393 m2 318,000,000* Salling Group Abrdn 3 Rotunden Hellerup April 5,278 m2 216,000,000 KFI Erhvervsdrivende Fond Dades 4 Gallerierne Hillerød March 17,805 m2 199,000,000 A&M Sheikh Gallerierne Hillerød 5 FAM-KRI portfolio Jutland April 14,026 m2 179,350,000* Jansen Ejendomme FAM-KRI Holding 6 City Vest Brabrand February 40,891 m2 99,587,000 A. Enggaard Danske Shoppingcentre 7 Thors Bakke 2 Randers C April 6,250 m2 89,000,000 Ejendomsselskabet Ravnsborg Private investor 8 Brogårdsvej 6 Holstebro July 10,365 m2 86,000,000 Coop Danmark A.P. Møller og Hustru Chastine Mckinney Møllers Fond Til Almene Formål 9 Helgeshøj Alle 32D Taastrup December 1,736 m2 65,000,000 JT Ross Helle Riis Holding 10 Sigrunsvej 39 Hillerød April 4,555 m2 55,000,000 Blue Capital Brian Reenberg Holding 11 Baunegårdsvej 7F Gentofte May 1,192 m2 44,161,000 Blue Capital Coop Danmark 12 Hammelstrupvej 2 Copenhagen SW June 1,389 m2 42,000,000 Coop Danmark Ejendomsselskabet Stub 13 Skibhusvej 53 Odense C June 1,501 m2 40,000,000 Coop Danmark Skibhusvej 53 - Odense C 14 Bymidten 39A Værløse March 2,088 m2 39,478,000 Blue Capital Coop Danmark 15 Skagensvej 100 Hjørring March 1,210 m2 37,211,500 Lidl Danmark ALDI 16 Færgevej 2 Rødby November 1,210 m2 34,937,500 Lidl Danmark AN 11 maj 2023 17 Sylows Alle 21 Frederiksberg November 1,280 m2 34,000,000 Ejendomsselskabet Industrivej 22, Næstved Private investor 18 Nykøbingvej 42 Stubbekøbing December 1,327 m2 33,715,000 Salling Group AN 11 maj 2023 19 Thulebakken 42 Aalborg March 1,525 m2 33,000,000 Coop Danmark Thulebakken I/S V/Kirsten Flyger M Fl 20 Bredballe Center 7 Vejle East February 1,637 m2 32,010,000 Blue Capital Coop Danmark 21 Vardevej 4C Bramming July 2,872 m2 31,000,000 Blue Capital Pro Developments 22 Nordkajen 4 Skagen February 1,596 m2 30,875,000 Ejendomsselskabet CAL SKAGEN HAVNEFRONT 23 Toftegade 50 Hurup Thy March 1,210 m2 29,939,000 Lidl Danmark ALDI 24 Stenbukken 1A Aalborg SV July 2,908 m2 28,900,000 B og W Ejendomme II Park Street 25 Store Gråbrødrestræde 13 Roskilde May 1,728 m2 27,000,000 Jesper Leen Jensen Invest EJENDOMSAKTIESELSKABET ALGADE 34 26 Borgergade 34 Silkeborg December 1,706 m2 26,200,000 Silkeborg IF Invest Henning Mortensen Ejendomme Silkeborg 27 Ormslevvej 269 Viby J June 1,067 m2 25,450,000 Coop Danmark Stavtrup - Aarhus Syd 28 Bjarkesvej 3 Allerød March 2,493 m2 24,700,000 INNODAPTER Zafe 29 Amager Strandvej 140B Copenahgen S September 887 m2 23,000,000 Windvestor ALFA Development 30 Kongevejen 18A Dragør December 1,612 m2 21,800,000 KV 18 A Coop Danmark * Estimated price Source: ReData RETAIL
*
Prime high street (best locations on Amagertorv, Købmagergade & Østergade)
High street (Vimmelskaftet, Nygade & Frederiksborggade as well as parts of Købmagergade and Østergade)
Secondary high street (Frederiksberggade)
High street area (Kronprinsensgade)
Østerbrogade
Gl. Kongevej
Nørrebrogade

- 4.75%
- 5.50%
- 5.75%
- 5.75%
- 6.00%
- 6.00%
- 6.25% Lyngby
Source: Cushman & Wakefield | RED
METHODOLOGI
- 6.00%
Zone A – Prime rent is estimated on the basis of ITZA guidelines and in this case indicates the value of the most expensive area in the model. However, properties in Denmark are rarely comparable 1:1, hence the depth of zone A (the area subject to generate the prime rent) may vary, but the value is typically determined to be between 6 m (20 ft) and 9 m (30 ft).
The vacancy rate is given by the observed number of vacant square metres on the ground floor of high street properties relative to the total amount of square metres on the ground floor of properties on the respective street. Hence, retail areas on any other levels are not included in this assessment.
Retail | 109 RETAIL
– PRIME YIELD LEVELS Q1 2024 STREET YIELD LEVEL
RETAIL
4.00
5.00
5.25
5.25
5.25
5.25
5.50
5.25
RETAIL – PRIME RENT AND VACANCY LEVELS Q1 2024 STREET BASE RENT ZONE A* VACANCY Q1 2024 CHANGE IN VACANCY 2023-2024 (%-POINTS) Amagertorv 46,000 2.84% -0.34% Østergade 28,000 7.47% 1.71% Købmagergade 25,000 23.61% -9.11% Vimmelskaftet 20,000 5.30% -0.46% Nygade 18,000 4.86% 0.00% Frederiksborggade 15,000 1.85% -13.37% Frederiksberggade 15,000 14.28% -3.75% Kronprinsensgade 11,500 N/A Berlingske 10,000 Grønnegade 6,000 Østerbrogade 3,750 Gammel Kongevej 3,250 Nørrebrogade 2,500 Lyngby 8,000
DKK per m²
service charges
per year excl.
HOTEL LOGISTICS RESIDENTIAL ANNUAL REVIEW OFFICE

110 | RED Danish Investment Atlas 2024
RED values Hotel Scandic Spectrum located at Kalvebod Brygge in Copenhagen on behalf of the owner, Havfonn.
Hotel | 111 HOTEL
Hotel
is Stronger
Ever Top 3 transactions 2023 112 116 RETAIL LOGISTICS RESIDENTIAL ANNUAL REVIEW OFFICE
HOTEL The
Market
Than

THE HOTEL MARKET IS STRONGER THAN EVER
PRIME PROPERTIES DRIVE THE MARKET
In recent years, we have experienced a very limited investment activity in the hotel segment, and with a transaction volume of DKK 1.2 bn, 2023 was no exception ( figure 59).
The low activity is due to a mismatch between sellers’ and buyers’ price expectations, as well as the relatively limited number of hotel properties offered for sale. Investors have primarily sought opportunistic deals with expectations of significant price discounts compared to the pre-covid-19 price levels, but sellers have not been willing to sell at these lower prices.
The fact that there has been a certain volume in the past years is primarily due to a continued investor demand for the best- located hotel properties. Thus, in recent years, the volume has been driven by the sale of a few well-located hotels and user properties, and in 2023, the sale of a single city hotel (Comfort Hotel Vesterbro) accounted for almost 60% of the total volume in the segment.
VISITOR RECORDS IN COPENHAGEN
The sellers’ reluctance to accept significant price reductions can partly be explained by a positive development in Copen hagen’s hotel market in recent years, which has significantly reduced the investors’ risks associated with future cash flows.
Since covid-19 hit Denmark and until the spring of 2022, the annual number of visitors decreased markedly, and at the same time, the success of previous years led to the planning of many new hotel openings. Consequently, the room capacity in Copenhagen increased by approx. 24% ( figure 60).
However, after some tough years for the hotel industry, the Copenhagen market has shown its strength again. While the number of visitors reached an all-time high in 2022, it can already be concluded that a visitor record was set again in 2023. As of now, we only have figures through November, but if the number of overnight stays in December 2023 reaches the level from December 2022, the number of overnight stays will exceed 9.5 m, representing an increase of nearly 1 m overnight stays (11%) in just one year. Continued on next page
112 | RED Danish Investment Atlas 2024
0 1 2 3 4 5 6 2023 2022 2021 2020 2019 2018 2017 2016 2015 2014 Danish BN DKK Foreign Source: ReData 75% 3.7 25% 62% 2.1 38% 34% 1.5 66% 1.2 94% 0.2 47% 3.3 53% 80% 5.4 20% 26% 2.5 74% 45% 1.5 55% 45% 55% 1.3 NO. OF OVERNIGHT STAYS NO. OF ROOMS 0 2 4 6 8 10 2023 2021 2019 2017 2015 2013 2011 2009 2007 2005 2003 2001
No.
0 5,000 10,000 15,000 20,000 25,000 Hotel | 113 HOTEL
Danish tourists Danish tourists (estimate) Foreign tourists Foreign tourists (estimate)
of rooms
Figure 59: Hotel – Transaction volume 2014-2023
RETAIL LOGISTICS RESIDENTIAL ANNUAL REVIEW OFFICE
Figure 60: Hotel – Development in number of overnight stays & hotel rooms in Copenhagen 2000-2023 Source: Statistics Denmark
Continued from previous page
THE DANES ARE FLOCKING TO COPENHAGEN
Historically, tourism in Copenhagen has primarily been driven by foreign tourists, who accounted for almost two out of three overnight stays in the period 2015-2019. However, in recent years, there has been a more equal distribution between Danish and foreign tourists. Thus, recent years’ visitor records have been driven by the fact that there has been a significant growth (+38% from 2019) in hotel stays by Danish tourists, and at the same time, the foreign tourists have returned to Copenhagen (+6% from 2019).
Despite the significant addition of new rooms, this positive trend in the number of visitors led to hotel occupancy rates in the summer months of both 2022 and 2023 reaching levels more or less equivalent to
the summer months before covid-19. At the same time, we once again observed a greater difference in the occupancy rates in Copenhagen compared to the rest of the country ( figure 61).
LIMITED PIPELINE OF NEW ROOMS
To see increased investment activity in the hotel segment again, investors need to believe that the market will remain balanced in the coming years, which depends on the supply of hotel rooms in relation to the number of visitors. In this regard, it is worth noting that the uncertainties in the market, the significant increases in construction costs, and, not least, the new higher interest rates have led to the cancellation, postponement, or conversion of several hotel projects.
Furthermore, we have recently seen that Copenhagen Municipality has become more reluctant to grant permission for new hotel
constructions, and there are limited opportunities to convert existing buildings into hotels in Copenhagen. Therefore, there is currently a more limited pipeline of projects with new hotel rooms.
LOW RISKS AND HIGH RETURNS
In addition to all of the above points, which testify to a strong underlying market, the investor activity also depends on whether they consider the risk-adjusted returns to be competitive compared to the returns in other segments. In this regard, we believe that investors should consider whether the many advantages of hotel properties do not outweigh the disadvantages (see the list on the following page) and whether hotel properties may, therefore, be an attractive alternative to office properties, which we have seen that many investors currently want to reduce their exposure to.
20% 0% 40% 60% 80% 100% 2023 2022 2021 2020 2019 2018 Copenhagen Rest of Denmark Source: Statistics Denmark 114 | RED Danish Investment Atlas 2024
Figure 61: Hotel – Occupancy rate 2018-2023
ADVANTAGES
YIELD REQUIREMENTS
There is still a premium on investing in prime hotel properties compared to other prime properties.
THE TENANTS
The number of tenants is limited to hotel operators, which are typically characterised by being large international players with strong creditworthiness.
CONTRACT PERIOD
The hotel operators’ decisions about opening new hotels are typically based on in-depth analyses of the market, which is why they are also typically willing to commit to long leases with non-termination periods of 15-25 years.
RELETTING
As a result of the long non-termination periods, there will usually be no change in the hotel operator during the investors’ investment period.
MAINTENANCE
Hotel operators typically cover the costs associated with both interior and exterior maintenance.
OPPORTUNITIES FOR CONVERSION
The design of hotel properties typically allows for relatively easy conversion to student housing.
DEPRECIATIONS
Hotel properties are eligible for depreciation.
DISADVANTAGES
FINANCING
Hotel properties are challenging to finance, which is reflected in a more limited willingness to lend, lower loan-to-value ratios, and instalment requirements.
POTENTIAL INVESTORS
The number of potential investors in the hotel segment is largely limited to specialised investors with insight and activities in the hotel industry, resulting in a lower liquidity compared to other segments.

Hotel | 115 HOTEL
RETAIL LOGISTICS RESIDENTIAL ANNUAL REVIEW OFFICE
TOP 3 TRANSACTIONS 2023
COMFORT HOTEL VESTERBRO
The largest hotel transaction of the year was completed when Starwood Capital sold the hotel Comfort Hotel Vesterbro to the Nordic property investor and developer NREP after only two years of ownership. Comfort Hotel Vesterbro is a 3-starred hotel with 399 rooms, a lounge and bar area, a gym, and other common areas. NREP sees large potential in making “brown-to-green” investments and plans to upgrade the hotel so it becomes self- sufficient with green energy.
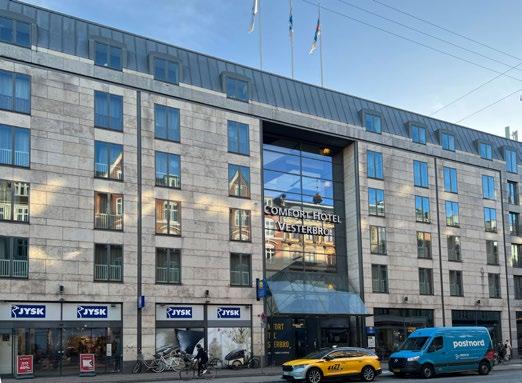
SCANDIC JACOB GADE
In February 2023, a larger group of investors sold the hotel Scandic Jacob Gade to the hotel investor K/S Atlantic. Scandic Jacob Gade is a modern 3-starred hotel located centrally in Vejle. In addition to 129 rooms, the hotel has a restaurant and 11 meeting rooms, making it possible to host events for up to 1,100 people.
HOTEL CHRISTIAN IV
A company owned by the Bestseller founder Troels Holch Povlsen (Nine United Properties Denmark) acquired Hotel Christian IV from the hotel chain Arp-Hansen Hotel Group in November 2023. Hotel Christian IV, which is located near Kongens Have in central Copenhagen, is a historic 3-starred hotel with 42 rooms and a breakfast restaurant.
3 2 1 116 | RED Danish Investment Atlas 2024
Photo: RED
Photo: Scandic
Photo: RED
Price (DKK) 100,000,000 Investor K/S Atlantic Gross area (m²) 6,675 Vendor K/S HJG, VEJLE Est. price (DKK) 700,000,000 Investor NREP Gross area (m²) 13,560 Vendor Starwood Capital Price (DKK) 60,000,000 Investor Nine United Properties Gross area (m²) 1,597 Vendor Arp-Hansen Hotel Group HOTEL
The stated prices are for the transactions as a whole, which is why the prices may include uses other than hotel.
RED continuously conducts valuations of Pandox’s Danish hotel properties, including Scandic Copenhagen located by the lakes in Copenhagen.

Hotel | 117 HOTEL
RETAIL LOGISTICS RESIDENTIAL ANNUAL REVIEW OFFICE
ABOUT RED
Cushman & Wakefield | RED provide advice within sales, leasing, tenant representation and valuation to the largest companies and players within real estate on the Danish real estate market. Our values in a complex and dynamic world consist of meticulousness, experience, and responsibility.
Our goal is to deliver value-creating services with the highest possible professional quality in relation to the task. As professional advisers, we will meet and exceed customer expectations. We can do this because our combined organisational competencies consist of a strong community of dedicated, satisfied, and competent employees and partners.
+45 33 13 13 99 | red@cw-red.dk | www.red.dk
