Non-Traditional Modes of Transportation
A market scan of aerial transit systems, bike share programs, autonomous shuttles, ferries and on-demand transit
January 19, 2024

Written by:
● Desmond Jaricha Social Scientist: Low Carbon Smart Mobility
● Titash Choudhury Manager of Business Development & Social Analytics
● Mahnoor Ayyaz Zero-Emission Bus Simulation GIS Technician
● Jessica Hanson Project Manager: Zero Emission Bus (ZEB) Initiatives
● Dr. Josipa Petrunic President and CEO
● Caren Moss Senior Program Coordinator
● Morgane Kuyl ZEB Consulting Services Project Coordinator


CUTRIC CRITUC
Canadian Urban Transit Research and Innovation Consortium (CUTRIC) Consortium de recherche et d’innovation en transport urbain au Canada (CRITUC)
CONFIDENTIALITY AND COPYRIGHT © 2024
The document contains proprietary and confidential information that shall not be reproduced in any manner, or disclosed to or discussed with any other parties, without the express written permission of CUTRIC. Information in this document is to be considered the intellectual property of CUTRIC in accordance with Canadian copyright law.
This report was prepared by CUTRIC. The material in it reflects CUTRIC’s best judgment, in light of the information available to it at the time of preparation. Any use which a third party makes of this report, or any reliance on or decisions to be made based on it, are the responsibility of such third parties. CUTRIC accepts no responsibility for any damages suffered by any third party as a result of decisions made or actions based on this report.
CUTRIC extends its thanks and sincere gratitude to The Canada Infrastructure Bank (CIB) for its financial support of this project.
Canadian Urban Transit Research and Innovation Consortium (CUTRIC)
Consortium de recherche et d’innovation en transport urbain au Canada (CRITUC)
18 King Street East, Suite 1400
Toronto, ON M5C 1C4
info@cutric-crituc.org
2
3 List of Figures • • 8 List of Tables • • 9 List of Acronyms • • 10 About CUTRIC • • 11 Executive Summary • • 12 CHAPTER 1 1 Introduction • • 16 CHAPTER 2 2 Objectives • • 17 CHAPTER 3 3 Methodology • • 19 CHAPTER 4 4 Aerial Transit Systems • • 20 4.1 Background • • 20 4.2 Use cases • • 23 4.3 Core themes for aerial transit system • • 24 4.3.1 Project models • • 25 4.3.2 Ridership • • 25 4.3.3 Initial investment costs • • 26 4.3.4 Land use • • 26 4.3.5 Land Use optimization • • 27 4.3.6 Health and safety requirements • • 28 4.4 Global overview • • 28 4.4.1 New York City, USA • • 28 4.4.2 Portland, USA • • 29 4.4.3 Medellín, Colombia • • 30
Table of Contents
4
of Contents 4.5 Emerging projects • • 31 4.5.1 Burnaby Mountain Gondola • • 31 4.5.2 Paris C1 • • 34 4.6 Conditions for success and limitations • • 35 CHAPTER 5 5 Shared micromobility: Bicycles and e-bikes • • 37 5.1 Background • • 37 5.2 Use Cases • • 38 5.3 Core themes of micromobility solutions • • 39 5.3.1 Program models • • 39 5.3.2 Ridership • • 40 5.3.3 Initial investment costs • • 40 5.4 Global overview • • 42 5.4.1 Amsterdam, Netherlands • • 42 5.4.2 Tokyo, Japan • • 44 5.4.3 Hangzhou, China • • 45 5.4.4 New York City, USA • • 45 5.4.5 Montreal, Canada • • 46 5.4.6 City of Vancouver, Canada • • 47 5.5 Conditions for success and limitations • • 49 CHAPTER 6 6 Ferries • • 51 6.1 Background • • 51 6.2 Use cases • • 51 6.3 Core themes of ferries • • 52 6.3.1 Frequency and density • • 52 6.3.2 Connectivity to other transit • • 52
Table
5
6.3.3 Route planning • • 53 6.3.4 Infrastructure planning of terminals • • 53 6.3.5 User experience • • 54 6.3.6 Costs • • 54 6.3.7 Vessel design • • 54 6.3.8 Global supply chain • • 56 6.3.9 Technological development • • 56 6.3.10 Labour requirements • • 57 6.4 Global overview • • 57 6.4.1 Hong Kong ferries • • 58 6.4.2 New York Staten Island Ferry • • 59 6.4.3 Brisbane’s ferries • • 60 6.4.4 Copenhagen ferries • • 61 6.4.5 Halifax Transit’s Ferry system • • 62 6.5 Conditions for Success and limitations • • 63
7 On-demand public transit solutions • • 65 7.1 Background • • 65 7.2 Use cases • • 66 7.3 Core themes of on-demand transit • • 66 7.3.1 Project and program models • • 66 7.3.2 Technological development • • 66 7.3.3 Accessibility and remote areas • • 67 7.3.4 Public-private partnerships • • 68 7.4 Global overview and case studies • • 68 7.4.1 Kutsuplus, Helsinki • • 68 7.4.2 Leduc, Alberta • • 69 7.4.3 York Region Transit, Ontario • • 70 7.4.4 Belleville, Ontario • • 71
Table of Contents
CHAPTER 7
6
of Contents 7.4.5 Durham Region Transit, Ontario • • 71 7.5 Conditions for success and limitations • • 72 CHAPTER 8 8 Autonomous vehicles • • 74 8.1 Background • • 74 8.2 Use cases • • 76 8.3 Core themes of autonomous shuttles • • 77 8.3.1 Technological challenges and future advancement • • 77 8.3.2 Market size and growth potential • • 78 8.3.3 Customer acceptance and perception • • 78 8.3.4 Infrastructure upgrades and total cost of ownership • • 79 8.3.5 Data security and privacy • • 79 8.4 Global overview • • 80 8.4.1 Paris, France • • 80 8.4.2 Oslo and Bodø, Norway • • 81 8.4.3 Monheim, Germany • • 82 8.4.4 San Francisco, USA • • 83 8.4.5 Montreal, Quebec, Canada • • 84 8.5 Conditions for success and limitations • • 84 CHAPTER 9 9 Other modes of transportation • • 86 9.1 Hovercraft • • 86 9.2 Maglev • • 87 9.3 E-scooters • • 88 9.4 eVTOL helicopters • • 88
Table
7
of Contents CHAPTER 10 10 Overall challenges and recommendations • • 90 10.1 Endorsement of non-traditional transportation solutions • • 90 10.2 Regulatory, land use and compliance requirements • • 92 10.3 Access to capital • • 93 10.4 Challenges of an integrated multi-modal transit system • • 94 10.5 Supply chain constraints • • 95 CHAPTER 11 11 Conclusion • • 96 References • • 97
Table
List of Figures
8
Figure 1: Types of aerial transit systems 21 Figure 2: Aerial view of Telecabine Lisboa gondola on the Tagus river in Lisbon, Portugal. 23 Figure 3: Teleférico La Paz-El Alto gondolas in La Paz, Bolivia. 23 Figure 4: Gondola system in Medellín, Columbia. 24 Figure 5: Roosevelt Island Tramway, New York City. 29 Figure 6: Portland Aerial Tram in Oregon, USA. 30 Figure 7: Monocable urban aerial gondola in Medellín, Colombia. 31 Figure 8: Gondola route for Burnaby Mountain project [15] 32 Figure 9: Route of the Paris C1 gondola project in Île-de-France [19] 34 Figure 10: The world’s largest bicycle parking at the Utrecht central station, Netherlands. 41 Figure 11: Rental Cargoroo in Utrecht, Netherlands. 42 Figure 12: Bike sharing in Amsterdam, Netherlands. 43 Figure 13: Minato City bicycle sharing in Tokyo, Japan. 44 Figure 14: Bike-sharing system in Hangzhou, China. 45 Figure 15: Citi Bike station in New York, USA. 46 Figure 16: A BIXI bike-sharing dock in Montreal, Canada. 47 Figure 17: The Viola Desmond ferry operated by Halifax Transit in Halifax, Canada. 51 Figure 18: The Viola Desmond ferry operated by Halifax Transit in Halifax, Canada. 54 Figure 19: Monohull hydrofoil ferry in Hong Kong. 55 Figure 20: Air Supported Vessel (ASV) hulls in Stockholm, Sweden. 56 Figure 21: Hong Kong Ferries. 59 Figure 22: Staten Island Ferry in New York, USA. 60 Figure 23: City Cat in Brisbane, Queensland, Australia. 61 Figure 24: Fully electric public water bus ferry in Copenhagen, Denmark. 62 Figure 25: Halifax Ferry in Halifax, Canada. 63 Figure 26: Gacha model autonomous shuttle designed by Muji, Finland. 77 Figure 27: Navya Autonomous bus in Oslo, Norway. 78 Figure 28: Passenger Hovercraft with a propeller in Samara, Russia. 88 Figure 29: The Shanghai Maglev in Shanghai, China. 89 Figure 30: eVTOL helicopter by Joby Aviation, Santa Cruz, California, USA. 90
List of Tables
9
Table 1: Gondola conditions for success and limitations 35 Table 2: Micromobility conditions for success and limitations 49 Table 3: Ferry conditions for success and limitations 63 Table 4: On-demand transit conditions for success and limitations 72 Table 5: Society of Automotive Engineers (SAE) classification of driver assistance technology advancements (SAE J3016) 75 Table 6: Autonomous vehicle conditions for success and limitations 85 Table 7: Endorsement of non-traditional transportation: Challenges and recommendations 90 Table 8: Regulatory, land use and compliance requirements: Challenges and recommendations 92 Table 9: Access to capital: Challenges and recommendations 93 Table 10: Integrated multi-modal transit systems: Challenges and recommendations 94
List of Acronyms
ATS Automated traffic systems
AV Autonomous vehicle
BRT Bus rapid transit
CAGR Compound annual growth rate
CIB The Canada Infrastructure Bank
CUTRIC Canadian Urban Transit Research & Innovation Consortium
DC Direct current
FGD Focus group discussion
GNSS Global navigation satellite system
GPRS General Packet Radio Service
GPS Global positioning system
LRT Light rail transit
OHSU Oregon Health & Science University
RDD&I Research, development, demonstration and integration
RFI
RFP
Request for information
Request for proposal
RIOC Roosevelt Island Operating Corporation
RTK Real-time kinematic
RTM Regional transportation model
RTS Rapid transit system
SAE Society of Automotive Engineers
SFU Simon Fraser University
V2I Vehicle to infrastructure
V2P Vehicle to passenger
V2V Vehicle to vehicle
V2X Vehicle to everything
YRT York Region Transit

10
About CUTRIC
The Canadian Urban Transit Research and Innovation Consortium (CUTRIC) is a membership based research consortium of transportation innovation leaders. CUTRIC’s vision is to make Canada a global leader in low-carbon smart mobility technology innovation across light-duty and heavy-duty platforms, including advanced transit, transportation and integrated mobility applications.
CUTRIC has built strong relationships with private companies and manufacturers to support the commercialization of new alternative technologies through industry-led collaborative research, development, demonstration and integration (RDD&I) projects that bring innovative design to Canada’s low-carbon smart-mobility ecosystem.
CUTRIC’s experience in non-traditional modes of transportation includes working with more than 60 transit agencies and municipalities on implementation plans for zero-emission on-demand vehicles. CUTRIC also designed and developed an autonomous smart vehicle demonstration and integration trial with Toronto-area transit agencies and has published a Knowledge Series on new transportation technologies.

11
Executive Summary
Canada is facing a growing demand for efficient and sustainable transportation systems. With increasing congestion in cities across the country, exploring alternative transit options from aerial transit to electric ferries will be critical to solving Canada’s transportation challenges. These nontraditional forms of transit can offer faster, cleaner and more accessible mobility solutions for urban and rural areas. By investing in innovative transit technologies, Canada can enhance its economic competitiveness, environmental performance and social inclusion. This report offers a comprehensive analysis of innovative transportation methods worldwide highlighting their potential applicability in Canada. It delves into industry trends, literature reviews and case studies across North America, South America, Asia and Europe, focusing on the use and potential benefits of non-traditional transit systems in Canada.
The report underscores the importance of developing innovative transit solutions that effectively address the rising demand for adaptable and resilient urban and rural infrastructure. While traditional modes of transit such as buses and trains remain indispensable, non-traditional transit technologies such as aerial systems, bike sharing, autonomous shuttles, ferries and ondemand services provide innovative and more sustainable solutions for specific transportation challenges.
Canada is a large country with diverse geographical features and climatic conditions. It faces many transportation challenges such as connecting remote and rural communities to urban centers and essential services, reducing congestion and greenhouse gas emissions in major cities, enhancing the efficiency and reliability of urban transport systems across long and short distances and adapting to the impacts of extreme weather events on transport infrastructure. To address these challenges, Canada must explore and invest in non-traditional transport modes suitable for local environments and needs. These innovative transportation solutions present cost effective alternatives for addressing first- and last-kilometre connectivity, uniting communities and catering to geographically isolated and challenging regions where conventional transit infrastructure may prove impractical.
Section One provides an introductory overview of the non-traditional transport landscape. It explains how non-traditional transit networks such as aerial systems, bike sharing, ferries, on demand services and autonomous shuttles can provide tailor-made solutions to specific transportation problems, such as bridging the first- and last-kilometre gap and other mobility challenges.
Section Two outlines the objectives of this report, which are to identify the benefits and challenges associated with various new mobility technologies outlining implementation considerations, including infrastructure, operational and maintenance requirements, funding, financing and revenue-generating models associated with those modes of mobility.
12
Section Three outlines the literature reviews, semi-structured focus groups and case study analysis methodologies utilized to gather data across the remaining analysis sections.
Sections Four to Nine review the global landscape, including opportunities and challenges, associated with five new mobility technologies, including aerial transit systems, shared micromobility, ferries, on-demand transit solutions and autonomous vehicles. These sections also showcase various use cases, technical features, success factors and ongoing barriers to their implementation.
Section Ten reviews the main challenges and recommendations for any organization or entity interested in adopting or deploying any of the alternative mobility modes discussed above, which includes gaining support for non-traditional transport solutions from transit agencies and passengers, complying with regulations, land use requirements, overcoming the difficulties of integrating non-traditional transport solutions into multi-modal transit systems and addressing supply chain limitations. The section also highlights the challenges non-traditional forms of transport face in accessing capital. Many of these solutions do not fit into the usual funding categories for transportation infrastructure and lack widespread market penetration and public acceptance, making it hard to estimate factors such as passenger demand, operational expenses and maintenance needs. The resulting uncertainty with regards to return on investment (ROI) creates obstacles to obtaining funding and/or financing for innovative solutions.
Key findings from this holistic overview include the following:
● Aerial transit systems (i.e., gondolas) use suspended vehicles to transport people in areas with difficult terrain and weather. They can carry 4,000 to 6,000 passengers per hour and can be integrated with other transit systems. Aerial transit systems may be able to provide speed, reliability, sustainability, accessibility and cost-effectiveness as a new mobility mode. Data show that urban aerial transit systems can efficiently reduce urban congestion and establish unique origin-destination connections that are otherwise difficult to develop, especially in geographically challenging locations. Aerial transit systems consume less energy, emit less greenhouse gases than other modes of transportation and can operate 30 per cent more efficiently from a cost perspective compared to buses. The cost of building aerial gondola infrastructure depends on the number of stations and cabin technology, but they are generally cheaper and more sustainable than other rapid transit options like buses, trains and subways. They also take up less space and have a strong safety record.
● Shared micromobility solutions such as bicycles and electric bicycles (e-bikes) have great potential as low-cost options for expanding mobility networks. The report focuses on bike sharing as a sustainable transport option that uses electric or traditional bikes to connect people to public transit. E-bikes have a motor that helps riders go faster and easier on hills. The bike-sharing market is showing growth globally. Various case studies of ebikes and bicycles demonstrate the benefits of micromobility, which include promoting community health, connecting first and last-kilometre gaps in transit systems and building
13
successful partnerships that secure funding/financing and expertise. The key strategy for implementing micromobility is to create safe, attractive, sustainable and connected infrastructure to promote active mobility. Bike sharing systems need well-placed stations and zones and bike-friendly streets with lanes, signs and traffic-calming features. The quality of the infrastructure affects the ridership as much as other factors such as the weather or landscape. Bike sharing systems are cheaper to build than other transit modes.
● Water-based transit options such as ferries connect places across the water. They can be faster, more efficient and more direct than bridges and tunnels and are highly effective when integrated with existing land-based transit systems, especially in regions with inland waterways. They can be used for occasional or regular trips in urban areas. Optimized vessel types can facilitate cost-effective ferry systems, connecting riders from remote areas to primary transit networks. A well-designed water-based transport system should be deployed in accordance with five key principles – attractiveness, cohesion, safety, directness and comfort. Ferries need high frequency, low costs and good business cases to be sustainable. They also need convenient land access and transit connections to attract demand. Ferry terminals should be well-placed, well-designed and integrated with public transit networks. Ferry systems have capital, operating and maintenance costs that depend on many factors such as the route, the demand, the speed, the vessel type and the marine conditions. Vessel design should consider stability, accessibility and low resistance to save fuel and emissions. The global supply chain is challenging for the ferry industry, as there are few manufacturers around the world for these vessels and Canada does not produce ferries or their parts. In addition, the ferry systems in Canada’s east and west coasts are different and hard to optimize
● On-demand services are a type of transportation that adapt to passenger demands and allows them to ride when and where needed. They offer flexibility, convenience and efficiency in transportation, especially in new communities or areas with lower population density and during off-peak hours. The mode uses smart technology to find the best routes to connect with other transit modes. This mode enhances accessibility, particularly for individuals with limited mobility, while achieving cost-effectiveness. Several public and private pilots and full deployments of on-demand systems have shown significant success in demonstrating ridership increases of over 200 per cent following the introduction of on demand services, including in remote areas.
● Autonomous shuttles use various technologies to drive without human intervention. They have the potential to improve public transit by using technology and Artificial Intelligence (AI) to connect people to their destinations. They also operate around the clock without human drivers, especially in areas where regular buses are impractical. However, autonomous shuttle technology is in its infancy and must overcome technical and commercial challenges before it can be widely adopted.
The final section of this report summarizes recommendations for the successful implementation of non-traditional transport modes. These include:
14
● Increasing public trust and awareness of non-traditional transport modes by promoting their operation, safety and reliability through positive marketing and education.
● Developing clear and consistent regulations for non-traditional transport modes by fostering collaboration among regulators, industry and communities.
● Securing support from government to develop policies, frameworks and financial support for non-traditional modes.
● Securing government and private support to launch, test and overcome barriers that hinder the progress of non-traditional modes. These tests and pilots teach valuable insights, which help to achieve the consistency and robustness required for technology maturity and mass adoption.
● Identifying and incorporating the expertise and resources of specialized private operators who can deliver and operate tailored solutions in more niche areas.
● Adopting financing models that align with delivery by creating opportunities to aggregate private capital and share risk.
● Optimizing urban space utilization by collaborating with urban planners, designers and land economists during the initial planning stages to design systems that use less land space.
● Addressing supply chain challenges and market limitations through a comprehensive approach that involves supplier collaboration, research, regulatory compliance and contingency planning.
This report underscores the potential for non-traditional transportation modes to provide innovative and adaptable solutions for Canada’s transportation needs. By implementing these innovative mobility modes, Canada could strengthen its transit network, mitigate congestion and improve the sustainability of its transportation ecosystem.
15
1 Introduction

As cities grow, their infrastructure must adapt to meet rising demand. It is estimated that by 2050, approximately 70 per cent of the world’s population will live in urban areas and the number of vehicles on the road will double every seven years [1]. There is a significant need to improve public transportation options.
While traditional modes of public mobility such as buses and trains remain critical to transportation networks, non-traditional transit networks such as aerial systems, bike sharing, autonomous shuttles, ferries and on-demand services offer unique solutions to address specific transit challenges including connecting the first and last-kilometre of a journey. Additionally, emerging technologies such as Artificial Intelligence (AI), wireless networks and advanced payment systems make these options more viable, especially in areas with varying ridership numbers, geographic obstacles or infrastructure limitations.
This report aims to identify the most effective non-traditional transit modes, outlining when and how they can be planned, built and financed as integral parts of a highly efficient transit network.
It includes an extensive global assessment of non-traditional transportation methods to assess their potential suitability in Canada’s urban areas. The report explores financing options such as blended financing in enhancing ridership, bridging regional gaps and addressing geographical challenges. It also examines successful international and Canadian deployment models and explores the impact of technology and urban planning on non-traditional transportation methods.
The report includes an in-depth analysis of industry trends, literature reviews and case studies drawn from North America, South America, Asia and Europe, offering insights into both emerging and established non-traditional transit modes.
16
CHAPTER 1
2 Objectives
This report aims to gather comprehensive knowledge to help develop effective strategies for infrastructure investments in non-traditional transportation systems. This report identifies the benefits and challenges associated with various new mobility technologies, outlining implementation considerations including infrastructure, operational and maintenance requirements, and funding and financing models associated with these modes of mobility.
This report aims to achieve the following goals:
1
Review the following non-traditional public and private transit and mobility solutions already deployed across North America, South America, Europe and Asia: 1.


17
Aerial transit (such as aerial gondolas)
Shared micromobility services (bike share programs)
Ferries
On-demand transit
Autonomous shuttles CHAPTER 2
2.
3.
4.
5.
2 Objectives
2 Analyze the technical characteristics related to each mode of transportation. These include the following variables of analysis:
1. Ridership
3. Labour requirements
5. Integration capability with other transportation systems
7. Supply chain and utility requirements
2. Initial investment and infrastructure requirements and costs
4. Health and safety requirements
6. Land use and planning considerations
8. Projected technology advancements
9. Blended financing, investment and revenue generation
3 Provide case studies from across Canada where non-traditional modes of transportation are deployed and operated within varying geographic, demographic and infrastructure environments to highlight which non-traditional modes maybe best suited for differing transit contexts.
4 Capture lessons learned, challenges and key regulatory requirements that shape nontraditional transportation modes across local, provincial and federal levels, and identify conflicting requirements that can impede the uptake and advancement of non-traditional transportation methods in Canada.
18
3 Methodology
Data collected for this report is generated based on a mixed methodological approach that integrates literature sources, semi-structured focus groups and case studies to help shed light on the current and future potential state of the five non-traditional modes of transit listed above. The literature reviews include peer-reviewed journal articles, white papers, workshop publications, case studies and news articles, providing a comprehensive market scan.
These market scans are supplemented with data from semi-structured focus group discussions with transit agencies, non-traditional transportation operators, non-profit organizations, municipalities and engineering firms to gain deeper insights. These discussions took place via Zoom, and participants provided qualitative responses to semi-structured queries. Follow-up questionnaires and requests for additional quantitative data, reports and brochures were emailed to participants. All participants verbally consented to using their data as a primary source for this report.

19
CHAPTER 3
Aerial Transit Systems 4
4.1 Background
Aerial transit systems are mass transit solutions that use suspended vehicles to provide fast, reliable, sustainable, accessible and cost-effective transportation in geographically challenging areas with diverse weather conditions. These solutions can efficiently transport people between two or more points through cables and cabins, reducing road congestion by creating air links within urban areas and complementing existing transportation networks. Two types of aerial transit systems, gondolas and aerial trams, have gained prominence recently as a promising and highly efficient modes of urban transportation, providing diverse travel options to passengers. These systems boast a high passenger capacity with the ability to carry between 4,000 and 6,000 passengers per hour per direction depending on the frequency and size of the cabins. Thus, they can compete with traditional modes of mobility, such as light rail transit (LRT) in ridership capacity [2]. On average, a single gondola system can transport as many people in an hour as can 2,000 cars or 100 buses [2].
Many people associate gondolas with mountainous terrains, ski resorts and leisure activities rather than considering them a feasible and efficient transit option. However, with the rising demand for sustainable, efficient and cost-effective urban transportation, aerial transit systems have garnered significant attention for their potential to transform how people commute within cities. They suit urban settings because they are less disruptive during construction, have minimum impact on the urban footprint and reduce users’ travel times [3]. In addition, aerial gondola capital costs are comparatively low compared to rapid transit, light-rail transit and subway systems. As outlined in Figure 1, various types of aerial transit systems exist. The three primary forms are gondolas, aerial trams and funitel lifts. Gondolas can consist of either monocable, bicable (2S) or tricable (3S) systems. Many gondolas have detachable grips and can be easily stored by taking the cabins off the cable and placing them in a safe garage. The cabins are designed to hang from the cable and move along its path in a continuous cable loop, while towers support the cable. Passengers board the cabin at one station and the cabin moves along the cable, reaching its destination station where passengers disembark.
20
CHAPTER 4
Description


The monocable detachable grip gondola (MDG) is the most common aerial gondola technology available. It utilizes one cable for both support and propulsion. 3S/TDG
The 3S/ TDG gondola is currently the fastest and highest capacity gondola technology available, it has a detachable grip and three cables - two for support and one for propulsion.
The funitel is a detachable grip system that looks like an aerial tram but acts like a gondola. The system utilizes one dual loop cable to carry short-armed cabins.
The aerial tram is a large cabin, fixed grip system consisting of one or two vehicles. The traditional aerial tram has two vehicles fixed to the same cable loop, shuttling back and forth in tandem.
Pulsed gondolas are fixed grip systems that bunch MDG/ BDG style cabins together into “pulses” (as opposed to spacing them out along the cable).
21 MDG BDG 3S/TDG FUNITEL AERIAL TEAM PULSED GONDOLA
Maximum Speed (kph) 22 FUNITEL 27 27 45 22 Maximum Capacity (pphpd) Up to 4000 AERIAL TEAM Above 6000 4000-5000 Up to 2000 Up to 2000 Maximum Wind Speed Operation (kph) Up to 70 PULSED GONDOLA 100+ 100+ 80+ Up to 70 Capital Cost (relative to other CPT technologies) Low Low-medium High Medium-high Medium-high Low Grip Detachable Detachable Detachable Detachable Fixed Fixed
Figure 1: Types of aerial transit systems
Due to data availability and suitability for urban environments, the analysis below focuses on aerial gondola lifts (MDG, BDG and 3S) and aerial trams. This report does not consider funitels and pulse gondolas due to their novelty and scarcity of examples for urban transit solutions.
Regarding safety, aerial gondolas and trams have consistently demonstrated their reliability compared to traditional rail, trolley buses or regular buses [2]. This is the case with enclosed urban aerial lifts, as opposed to the open-air chairlifts normally found in ski resorts. Research conducted in 2016 shows that fully enclosed aerial lifts in North America have safely operated without a fatality for almost 40 years [4].
Aerial gondolas and trams are also environmentally friendly because they use electricity and gravity to move, consuming approximately 0.1 kW/h of electricity per kilometre per passenger. They do not utilize combustion engines to move the cabins and only need one electric motor at the terminal to run all the cabins on the line. These systems produce few greenhouse gas (GHG) emissions, making them an environmentally sustainable choice compared to other combustion based modes of moving people, such as diesel combustion buses or trains. The gondola’s carbon footprint ultimately depends on the source of electricity that feeds the motor, noting that in Canada, most electricity grids are very clean [5]. In addition, gondolas are quick to build and require less land disruption during installation compared to other transit modes, reducing their environmental impact further [5]. Gondola technologies offer quick service, simplified integration with current transit systems and efficient travel by bypassing ground limitations in areas where conventional transport is challenging or costly [2].

¹ 3S stands for the German word dreiseil, which means tricable.
22
4.2 Use cases
Gondolas and aerial trams are a versatile mode of transportation that can provide connectivity within simple and complex environments, including those listed below:
● Crossing obstacles: Gondolas can create direct links between places with obstacles such as rivers, steep hills or highways, which would otherwise require long detours [1].
● Expanding transit networks: Gondola construction can provide a relatively quick and economical way to expand local public transit networks. This is especially useful where physical obstacles prevent the growth of the current transit system [1].
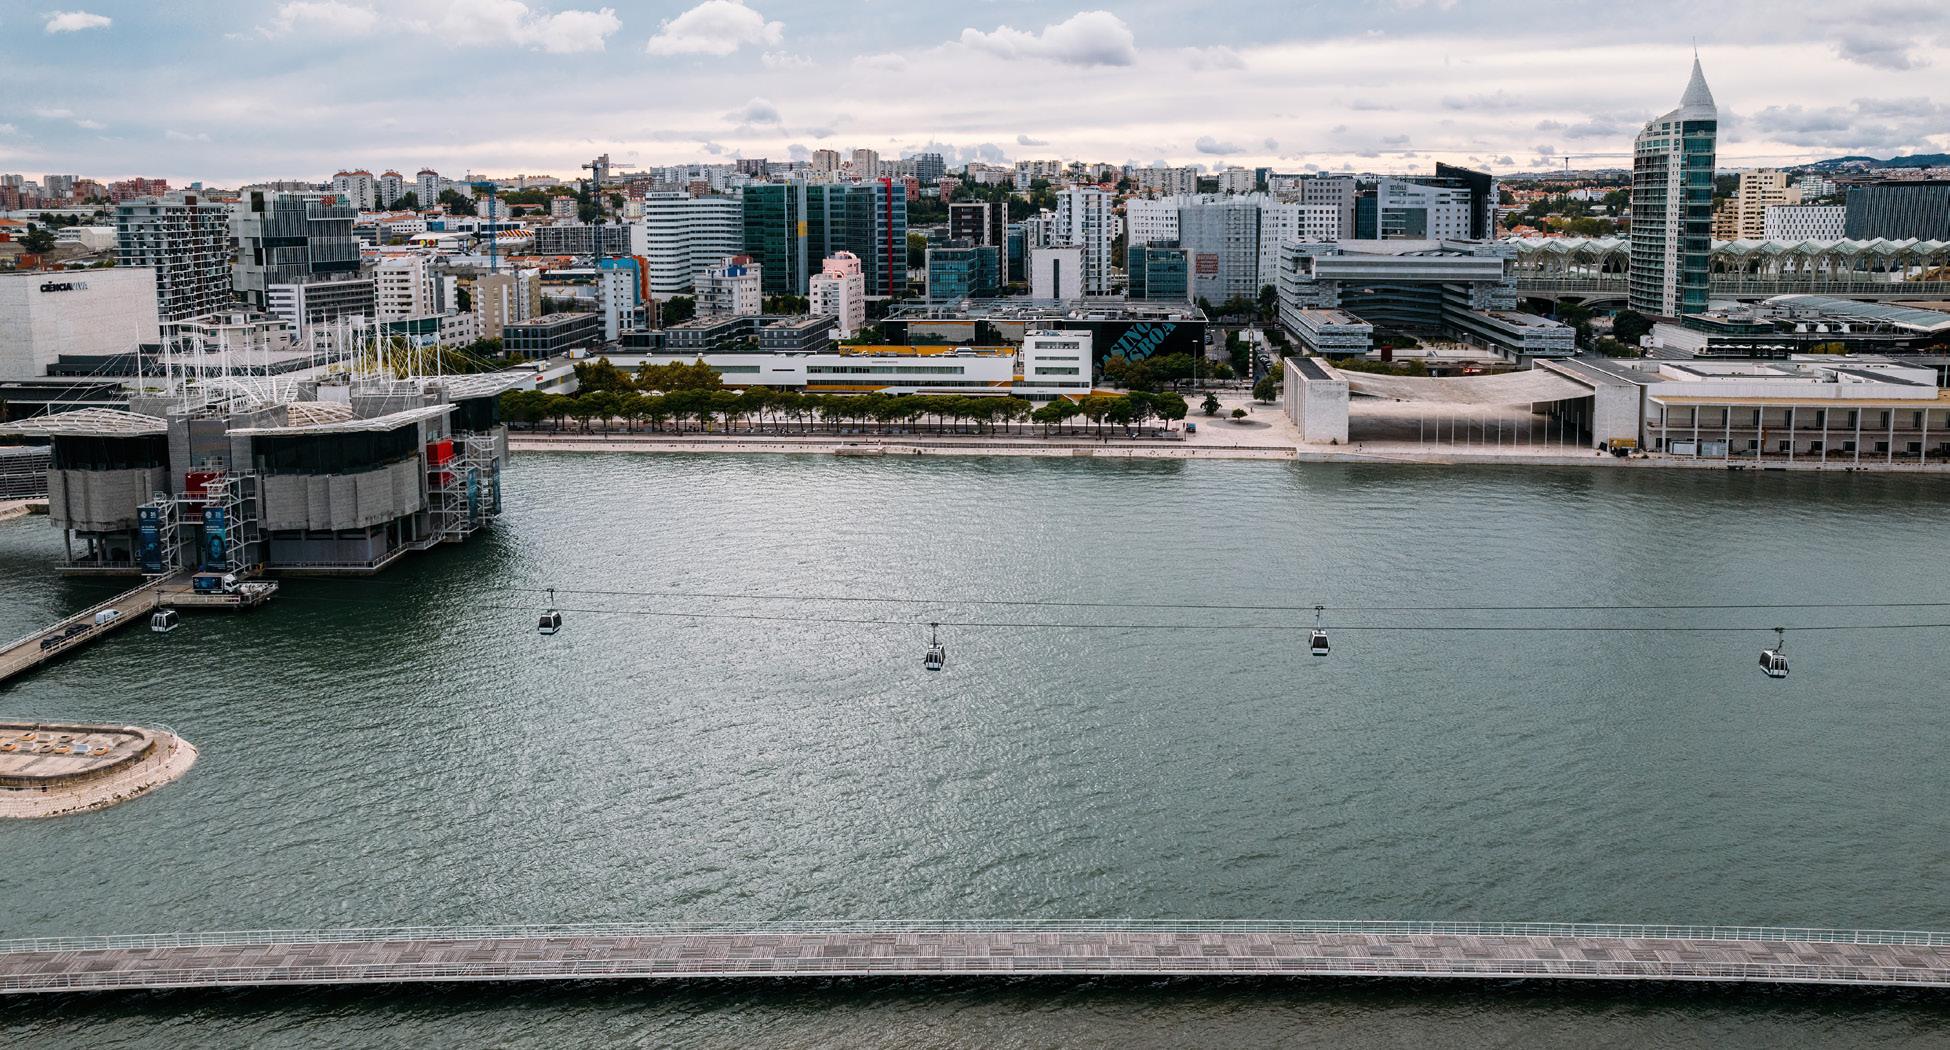
It is the world’s largest public transit aerial cable car network, with 11 lines spanning 32.7 kilometres and 39 stations. The system transports an average of 151,000 passengers per day. (Photo credit: Andy Sutherland/Shutterstock.com)
23
Figure 2: Aerial view of Telecabine Lisboa gondola on the Tagus river in Lisbon, Portugal. The gondola spans 1230 meters and features 40 cabins with seating for up to eight people each. (Photo credit: Alexandre Rotenberg/Shutterstock.com)
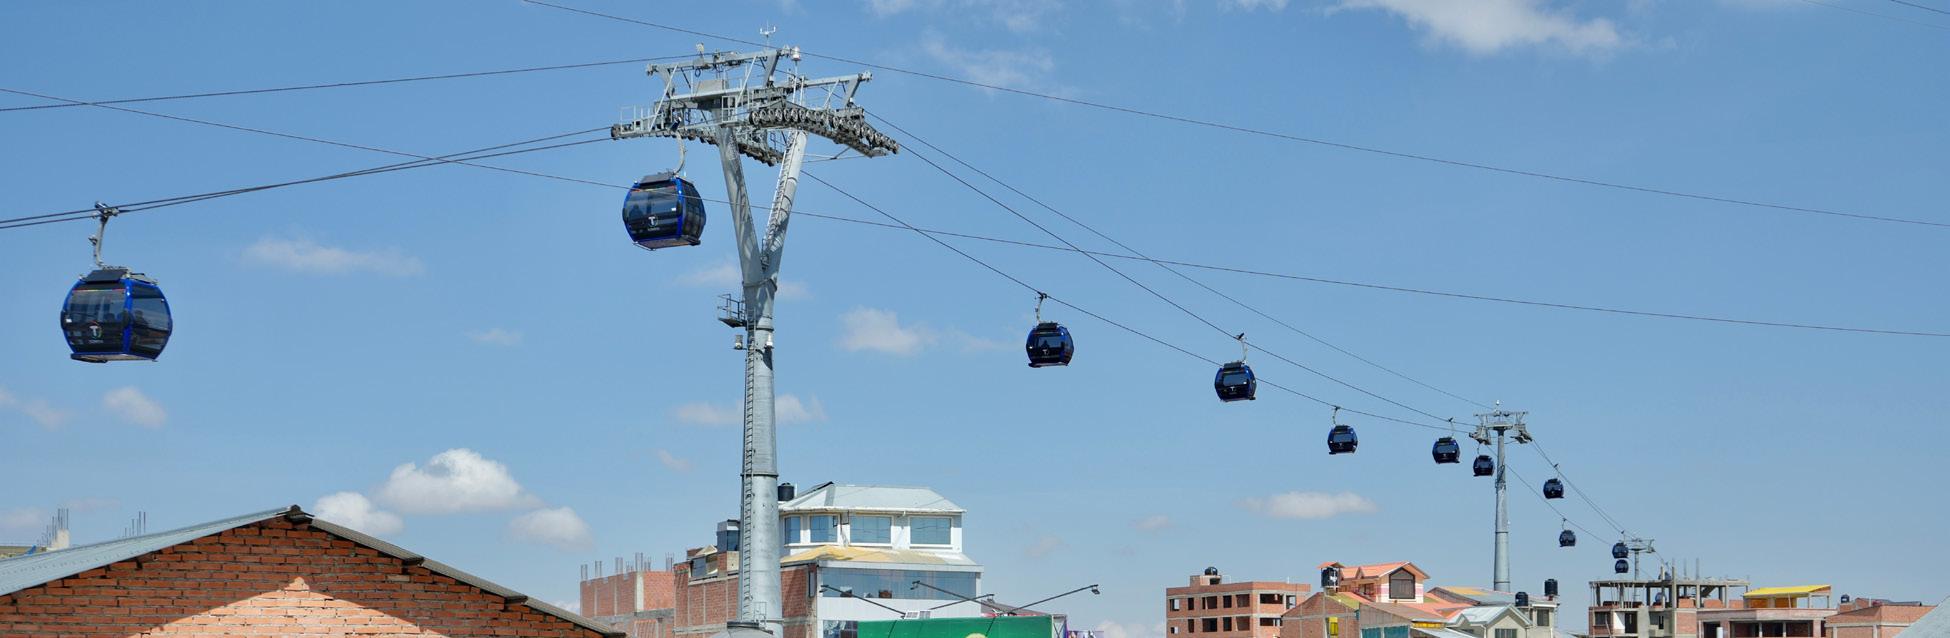
Figure 3: Teleférico La Paz-El Alto gondolas in La Paz, Bolivia.
● Congestion relief: Gondolas can serve as an additional transport system where the existing infrastructure reaches capacity. This is especially true in crowded urban settings with high traffic levels that often result in congestion [1].
● Linking high-ridership destinations: Gondolas can connect locations with high numbers of visitors or commuters, such as airports, universities, shopping malls and exhibition centres [1].
4.3 Core themes for aerial transit system
This study integrates data collected from semi-structured focus group discussions (FGDs) with the following key stakeholders in the fields of engineering, architecture, manufacturing and transit planning:
● Dialog Design: An engineering and architecture firm with expertise in designing rapid transit projects, such as LRT trains and aerial gondola lift systems.
● Leitner: A leading global aerial gondola manufacturer and operator known for its extensive experience in the industry.
● TransLink: Metro Vancouver’s regional transportation authority which is responsible for the transportation network of 21 municipalities, one electoral area, and one Treaty First Nation in British Columbia.
24
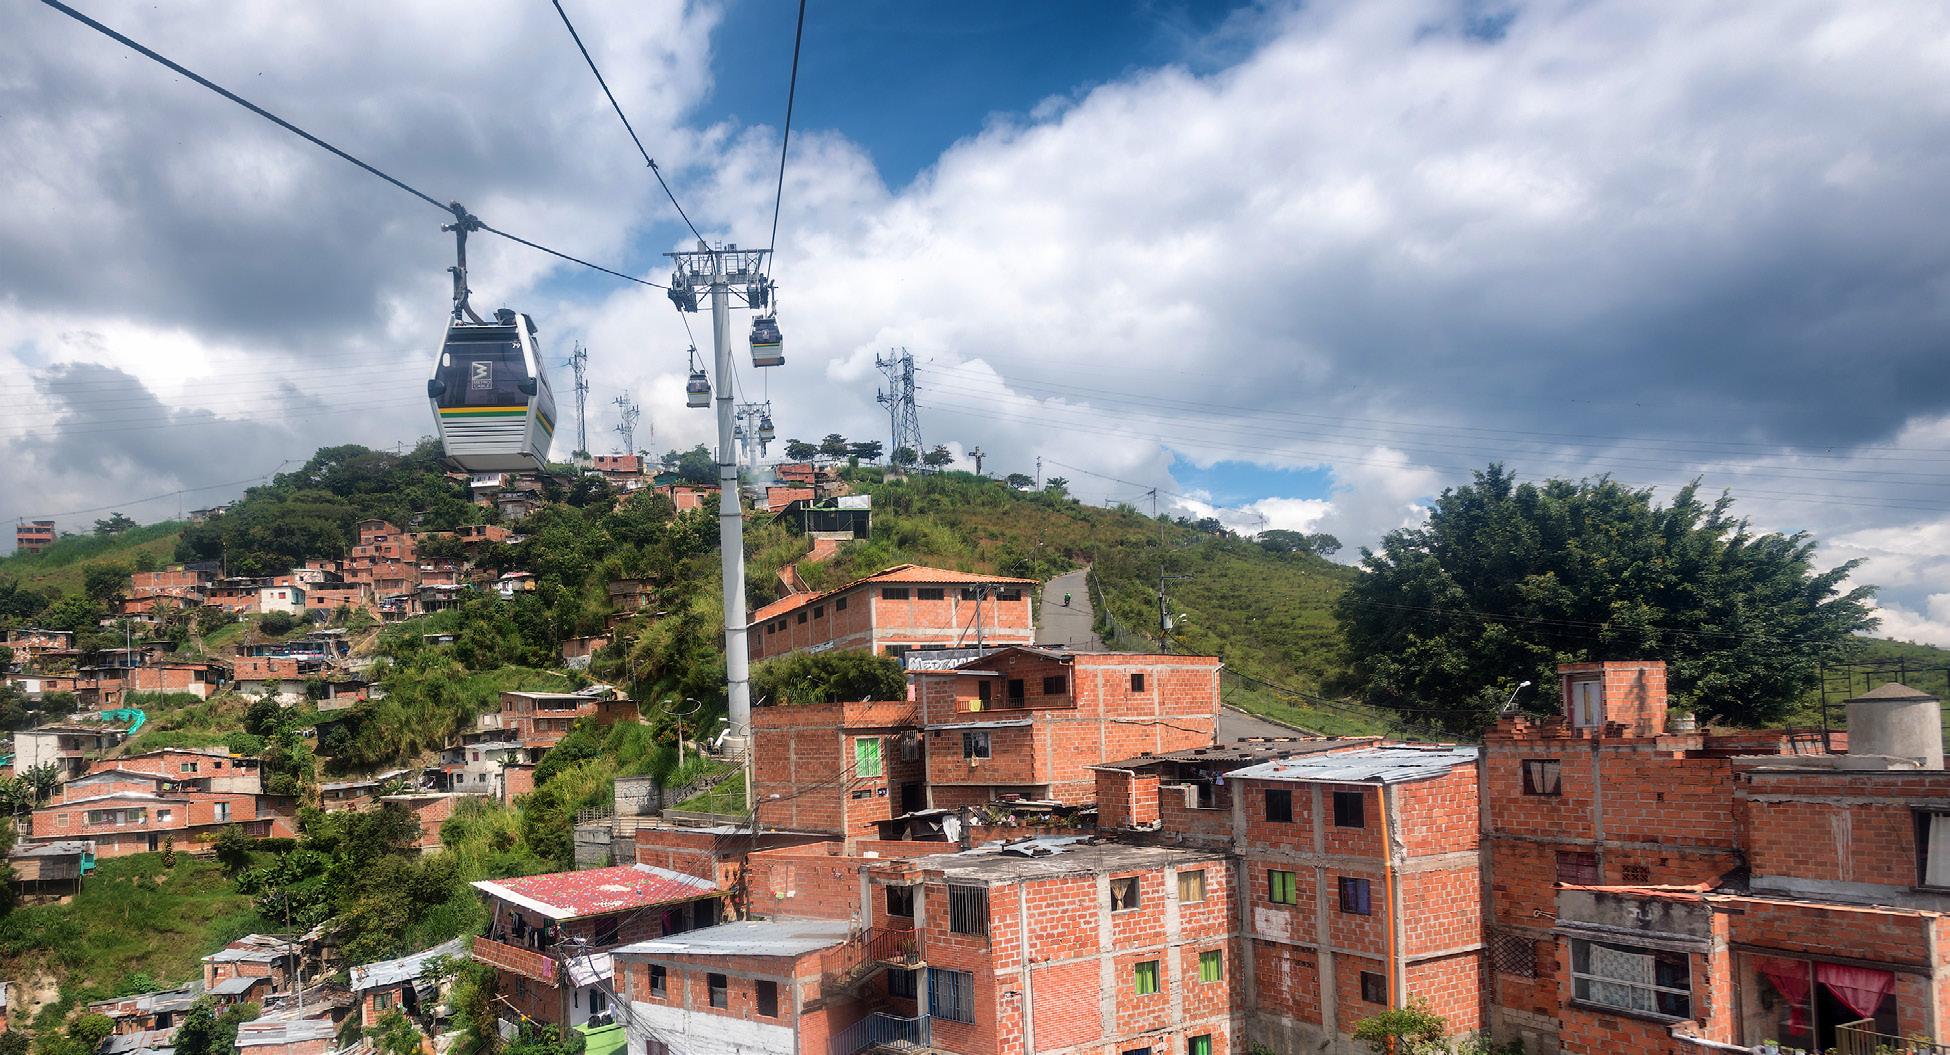
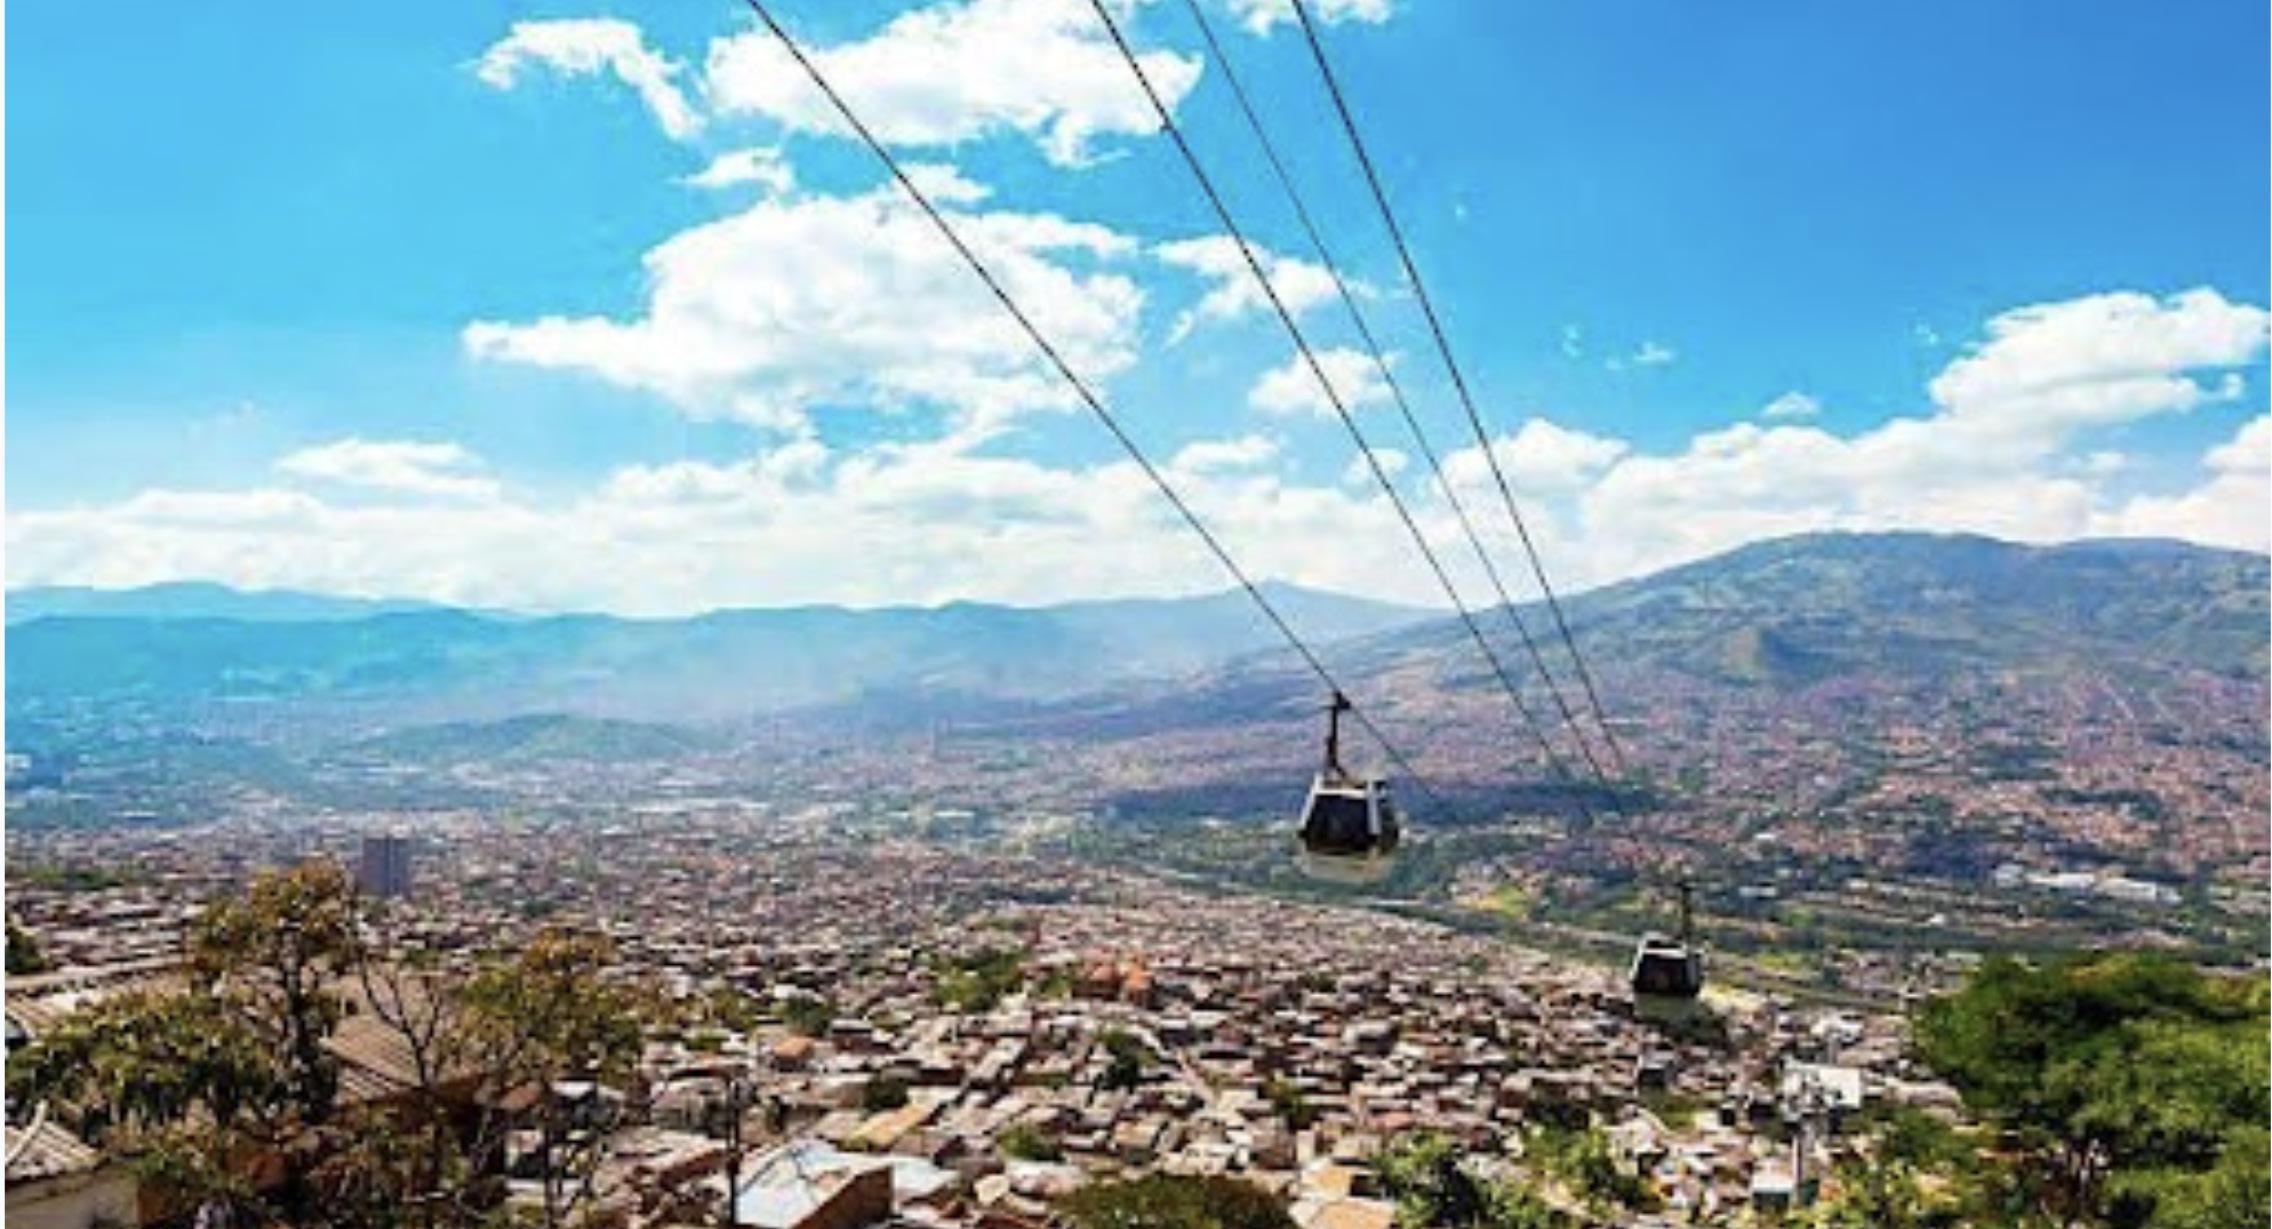
Figure 4: Gondola system in Medellín, Columbia.
The system benefits over 400,000 residents who live in some of the most disconnected, disadvantaged and violent neighbourhoods in Medellín (PhotoCredit: Allen.G/Shutterstock.com)
These FGDs serve as primary data sources for this report, contributing to an in-depth understanding of the subject matter, enriching the research with expert perspectives and real world experiences, and strengthening the reliability and credibility of the study’s analysis and findings.
4.3.1 Project models
Based on FGD data, gondola projects can be initiated by public authorities, the private sector or through public-private partnerships. Research data show that most urban aerial gondola projects are funded by governments and operated by private companies. Whether operated by public or private entities, the involvement of local communities and authorities plays a crucial role in selecting suitable routes and gaining acceptance for these projects.
Additional FGD data show that the optimal type of technology depends on the location and the country of deployment. Most aerial gondola lift system projects have been realized as monocable systems that can transport up to 4,000 people per hour. North America has a diverse range of gondola models in operation. Monocable gondolas include the Roosevelt Island Tramway in New York and the Portland Aerial Tramway in Oregon. Bicable gondolas include the Banff Gondola in Alberta and the Cape Smokey Gondola in Nova Scotia. Tricable gondolas are less common, with only the Peak 2 Peak gondola in British Columbia, Canada. However, the tricable system has attracted more attention in the region recently due to its advantages with higher capacity, greater ability to withstand high winds, and fewer towers. Several cities such as Burnaby (British Columbia), Albany (New York) and Los Angeles (California) are exploring the feasibility of building tricable gondolas in their urban areas.
Focus group participants also confirm that a gondola system would perform better if integrated into the broader public transit network with seamless transfers and fare integration with other modes of transportation, such as trains and buses. A well-integrated gondola system can increase ridership, secure government funding, and offer fares consistent with other transit options.
Collaboration with an experienced operator and maintenance expert is crucial as many transit agencies lack the expertise to operate and manage an urban gondola system. Outsourcing the operations of these systems to a specialized vendor can help public transit agencies overcome this challenge and focus on providing quality service to their passengers. This can also facilitate transit users’ and stakeholders’ adaptation to the new system.
4.3.2 Ridership
The ridership of urban aerial gondola systems varies according to several factors, such as urban population density, route lengths and network complexity, the gondola carrying capacity, alternative competitive transport modes, and service frequency. These factors also influence ridership comparisons between gondolas and other transport modes which differ in demand, length and density characteristics.
25
While conventional modes such as bus rapid transit (BRT), LRT and subways may have more ridership capacity than gondolas, their use in urban areas may not always be possible because of geographic or other barriers. The large infrastructure costs associated with overcoming these barriers may not allow for the implementation and growth of conventional public transportation systems in such areas. Success and ridership potential are greatly influenced by smooth integration with existing transit networks, prioritizing the gondola as a transit-first solution for daily commuters and the general public. Integrated gondola systems cater to diverse riders, from daily commuters to tourists. Gondola projects initiated by transit agencies or cities often emphasize boosting ridership through integration with existing transit systems [2]. The Burnaby Mountain Gondola project proposed by TransLink is a noteworthy case study. As discussed further in a subsequent section, this project seeks to integrate an aerial gondola with a train system [6].
4.3.3 Initial investment costs
Focus group discussion (FGD) data indicate the capital cost of aerial gondola infrastructure in urban areas is influenced by two main factors – the number of stations required and cabin technology. The construction of stations entails a significant portion of the procurement costs for gondola projects, which vary according to the station size. The selection of cabin technology also affects the initial investment cost, as the tricable gondola system has a much higher price compared to the monocable gondola system.
In North America, land for tower construction is one of the most costly portions of a gondola project investment, particularly in urban settings. Therefore, gondola systems that require fewer towers, such as the 3S system, are often preferred. According to FGD data, the average cost to build infrastructure for an urban aerial gondola is estimated at C$10 to C$15 million per kilometre. When compared to other rapid transportation systems, such as bus rapid transit (C$10 to C$20 million per kilometre), trains (C$150 to C$200 million per kilometre) and subway (C$400 to C$650 million), aerial gondola capital costs are comparatively low.
4.3.4 Land use
Aerial gondola lift systems present a swifter and more cost-efficient transit solution for areas facing geographical obstacles, such as significant changes in elevations, river crossings and dense urban environments, as opposed to constructing tunnels, bridges or roads. Typically, tunnel construction can take up to 10 years and incur exorbitant costs, amounting to billions of dollars [7]. In contrast, aerial gondolas can be built within two years and at a fraction of the price, as illustrated in the comparison of initial investment costs. This difference highlights the advantage of the aerial gondola as a quick and economical solution for transportation in difficult terrain.
In addition to benefiting dense urban centres and standalone destinations like campuses, residential communities and urban hubs, aerial gondolas also emerge as a practical solution for narrow corridors, highways and railways. Their slender tower design minimizes space
26
requirements, providing a three-dimensional transit alternative. According to FGD participants, while these systems are not yet widely adopted in heavily populated, high-density residential areas in North America, aerial gondolas have gained popularity in regions in South America where dense populations benefit from their ability to alleviate congestion.
The limited adoption of aerial gondolas across populated areas in North America and Europe is often attributed to the absence of clearly defined safety and privacy regulations. This challenge is observed in Rio de Janeiro where aerial gondolas have raised concerns about privacy infringement. Residents with aerial gondolas passing over their homes experience a loss of privacy by virtue of the line of sight that riders have into homes and private spaces. Addressing these issues is imperative to fostering acceptance and broad implementation of aerial gondola systems [2].
To summarize, aerial gondola systems provide quick, cost-effective transportation solutions for challenging terrain. Regarding construction time and investment costs, they are more economical and practical than building new roads and digging tunnels.
4.3.5 Land use optimization
In North America and Europe, especially in dense and popular cities, land costs are expensive and at a premium. FGD data show that stakeholders must carefully consider the placement of gondola towers to avoid unnecessary land acquisition costs, as land use regulations and development agreements can pose complexities.
Carefully considering tower placement and associated land agreements becomes crucial in managing the financial aspects of urban gondola infrastructure development. The goal is to position the stations and towers with perfect alignment to maximize their functionality and explore various mixed land-use possibilities in the remaining space. However, a critical challenge of implementing gondola technology is the requirement for gondolas to follow a straight route to minimize capital costs. If the route bends, a station or turning tower must be added, as the gondola’s weight could cause it to jump off a cable when navigating curves. This additional infrastructure increases the capital costs associated with these projects [8].
FGD data indicate that mixed-use developments are often considered when building gondola towers and stations. FGD data indicate that land use design prioritizes land and costs, where projects should maximize land use for residential cores and office spaces to boost revenue. Achieving this land-use optimization outcome requires partnering with urban land economists for in-depth market analysis and data-driven insights before designing gondola routes and pathways.
In summary, land cost is a significant consideration in assessing urban aerial gondola infrastructure as a sustainable and cost-effective mobility mode, especially in North America and Europe. Careful tower placement is crucial, as poor planning can be impacted by land use regulations and land costs. Precise station alignment allows for mixed-use development possibilities.
27
Collaboration with urban land economists is essential for data-driven decisionmaking for both private and public initiatives.
4.3.6 Health and safety requirements
Safety concerns constitute a major factor in planning and operating aerial gondola systems. These vary according to the system’s location, the type of aerial gondola system being installed and environmental factors such as weather conditions. In Canada, safety and operational standards are regulated at the provincial level. Each province has its own occupational health and safety regulations, such as the Technical Safety Standards Act of Ontario [9] and the Safety Standards Act for Elevating Devices Safety Regulation in British Columbia [10]. As previously mentioned, gondola systems have an impeccable safety record in North America, partly due to the standards regulating their installation and operation.
Gondola systems require maintenance regularly. The maintenance schedule is determined by either time intervals (e.g., daily, monthly, etc.) or specific metrics (e.g., grip cycles or operating hours) depending on the servicing task. The operating plan and operating hours of a certain cable car affect the frequency of some servicing tasks, such as lubricating the cables and checking the tension of the cables, while the configuration and condition of the cable car affect the frequency of others, such as cleaning the cabins and repairing wear and tear. Depending on the maintenance schedule adopted, services may be regularly halted for operational maintenance and transit agencies must arrange alternative transit during the interruption [8].
4.4 Global overview
Municipalities and regional authorities across South America, North America and Europe have increasingly adopted aerial gondolas as part of their integrated transit systems. This trend is observed through a case study analysis of gondola systems deployed since 2004 in South and North America and proposed projects in North America and Europe [11]. These cases highlight gondolas' evolution as urban aerial transit systems.
The success of aerial gondola lifts in South American jurisdictions demonstrates the potential for sustainable transportation solutions to support urban living. A global literature review reveals that most transit-integrated aerial gondola lift systems operate in South America.
North America is home to two popular urban aerial gondola lift systems that transport thousands of people daily – the Roosevelt Island Tramway and the Portland Aerial Tram. These case studies serve as examples of how aerial lift systems can be successfully integrated into urban transit systems in North America.
4.4.1 New York City, USA
The Roosevelt Island Tramway, or the Roosevelt Cable Car, is an aerial transportation system
28
that spans New York City’s East River, connecting Roosevelt Island to Manhattan. Built in 1976, the Roosevelt Island Tramway is one of two commuter cable cars in North America and the only aerial transportation system completely integrated with transit.
The Roosevelt Island Tramway was initially conceived as a temporary means to shuttle residents to and from Manhattan until the completion of the Roosevelt Island subway station in 1989. Due to its overwhelming popularity, the tramway continued its service permanently. It is operated by the Roosevelt Island Operating Corporation (RIOC), covers a distance of 3,140 feet at speeds of up to 26 km/h in under 4.5 minutes, and carries over two million passengers annually between Roosevelt Island and Manhattan [12].
4.4.2 Portland, USA
The Portland Aerial Tram has been in operation since January 2007 and is an example of an urban commuter lift in the United States. It links Oregon Health & Science University to the South Waterfront. With a C$76 million price tag, it carries 3,300 passengers daily, ascending 496 feet and spanning various obstacles. The tram boasts a bottom terminal housing the drive motor, while an 80,000-pound counterweight resides beneath the top station. Covering a distance of 3,437 feet in three minutes, it achieves a capacity of 1,014 passengers per hour. A unique design competition led to its distinctive aesthetic. Owned by the City of Portland and operated by Doppelmayr USA, it operates on an annual budget of C$2.3 million and runs 16 hours on weekdays, with a round trip costing C$6.80. Over the past decade, the tram has become an iconic symbol of Portland's transformation, connecting Marquam Hill to South Waterfront, contributing to the expansion of Oregon Health & Science University (OHSU) and the development of the South
29
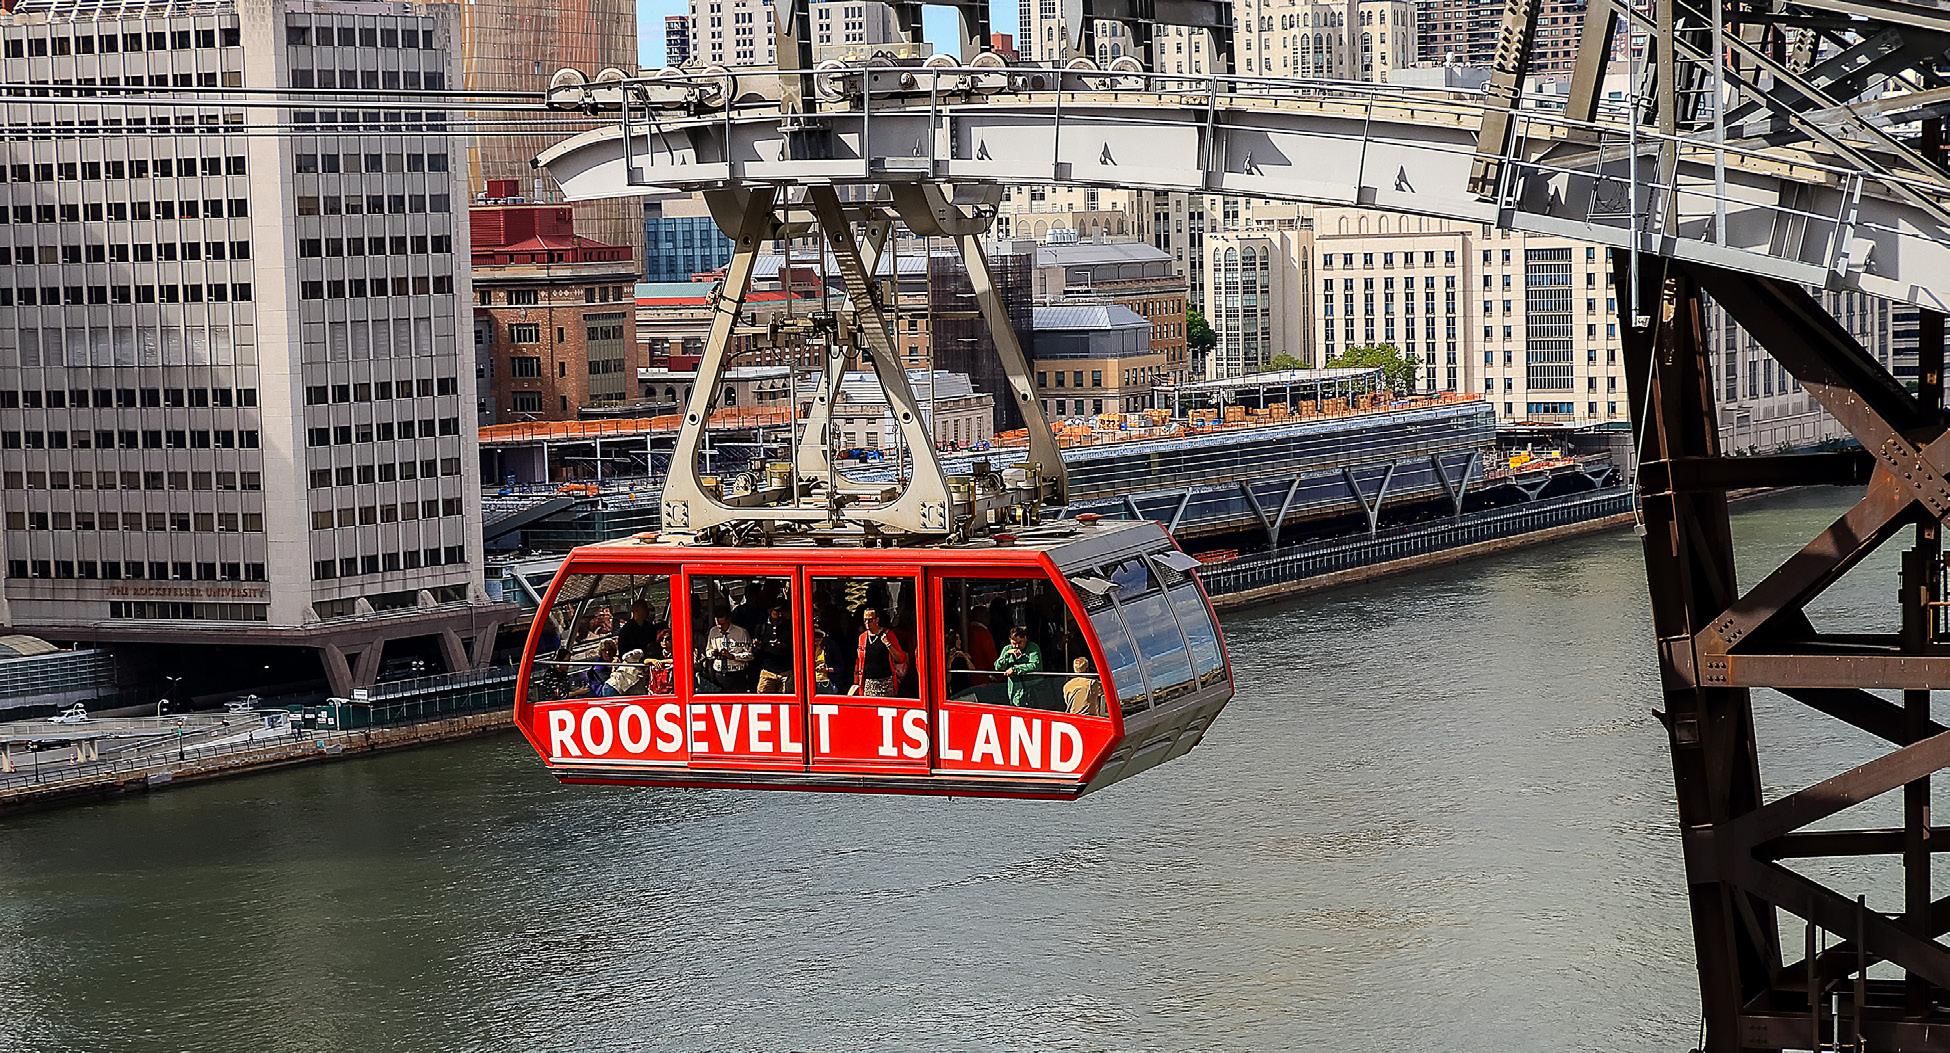
Figure 5: Roosevelt Island Tramway, New York City.
The Tram connects Manhattan and Roosevelt Island and carries a maximum of 109 passengers plus an attendant per cabin.
Waterfront neighbourhood [13].
4.4.3 Medellín, Colombia
In 2004, Medellín fully integrated aerial gondolas into its metro system [14]. The first line, Metrocable Line K, was established to reach the Santo Domingo Savio neighbourhood, benefiting around 230,000 residents across 12 localities and connecting northeastern Medellín to the city centre. Metrocable Route J was established to serve 315,000 inhabitants across 37 districts. The Metrocable has halved the average travel time from the barrios to the centre from roughly two hours to one. Its integration with Medellín's main public transport system has increased passengers' mobility, reducing the cost and duration of their journeys [14].
The aerial gondolas have been a catalyst for urban transformation in the city. By connecting the informal settlements to the urban core, it has facilitated the integration of the city’s most vulnerable populations into the economic and social fabric of the city. The Metrocable has also contributed to improving the physical environment, creating public spaces and promoting community participation in the informal settlements. Furthermore, the system has enhanced the mobility and accessibility of marginalized groups, providing them with more opportunities for education, employment and development. The Metrocable has achieved remarkable results in reducing travel times and serving residents who live in some of the most isolated, impoverished and violent neighbourhoods. [14].
Medellín has demonstrated that in less economically developed cities with topographic challenges that can not afford light railway systems, gondolas offer a faster and more comfortable
30
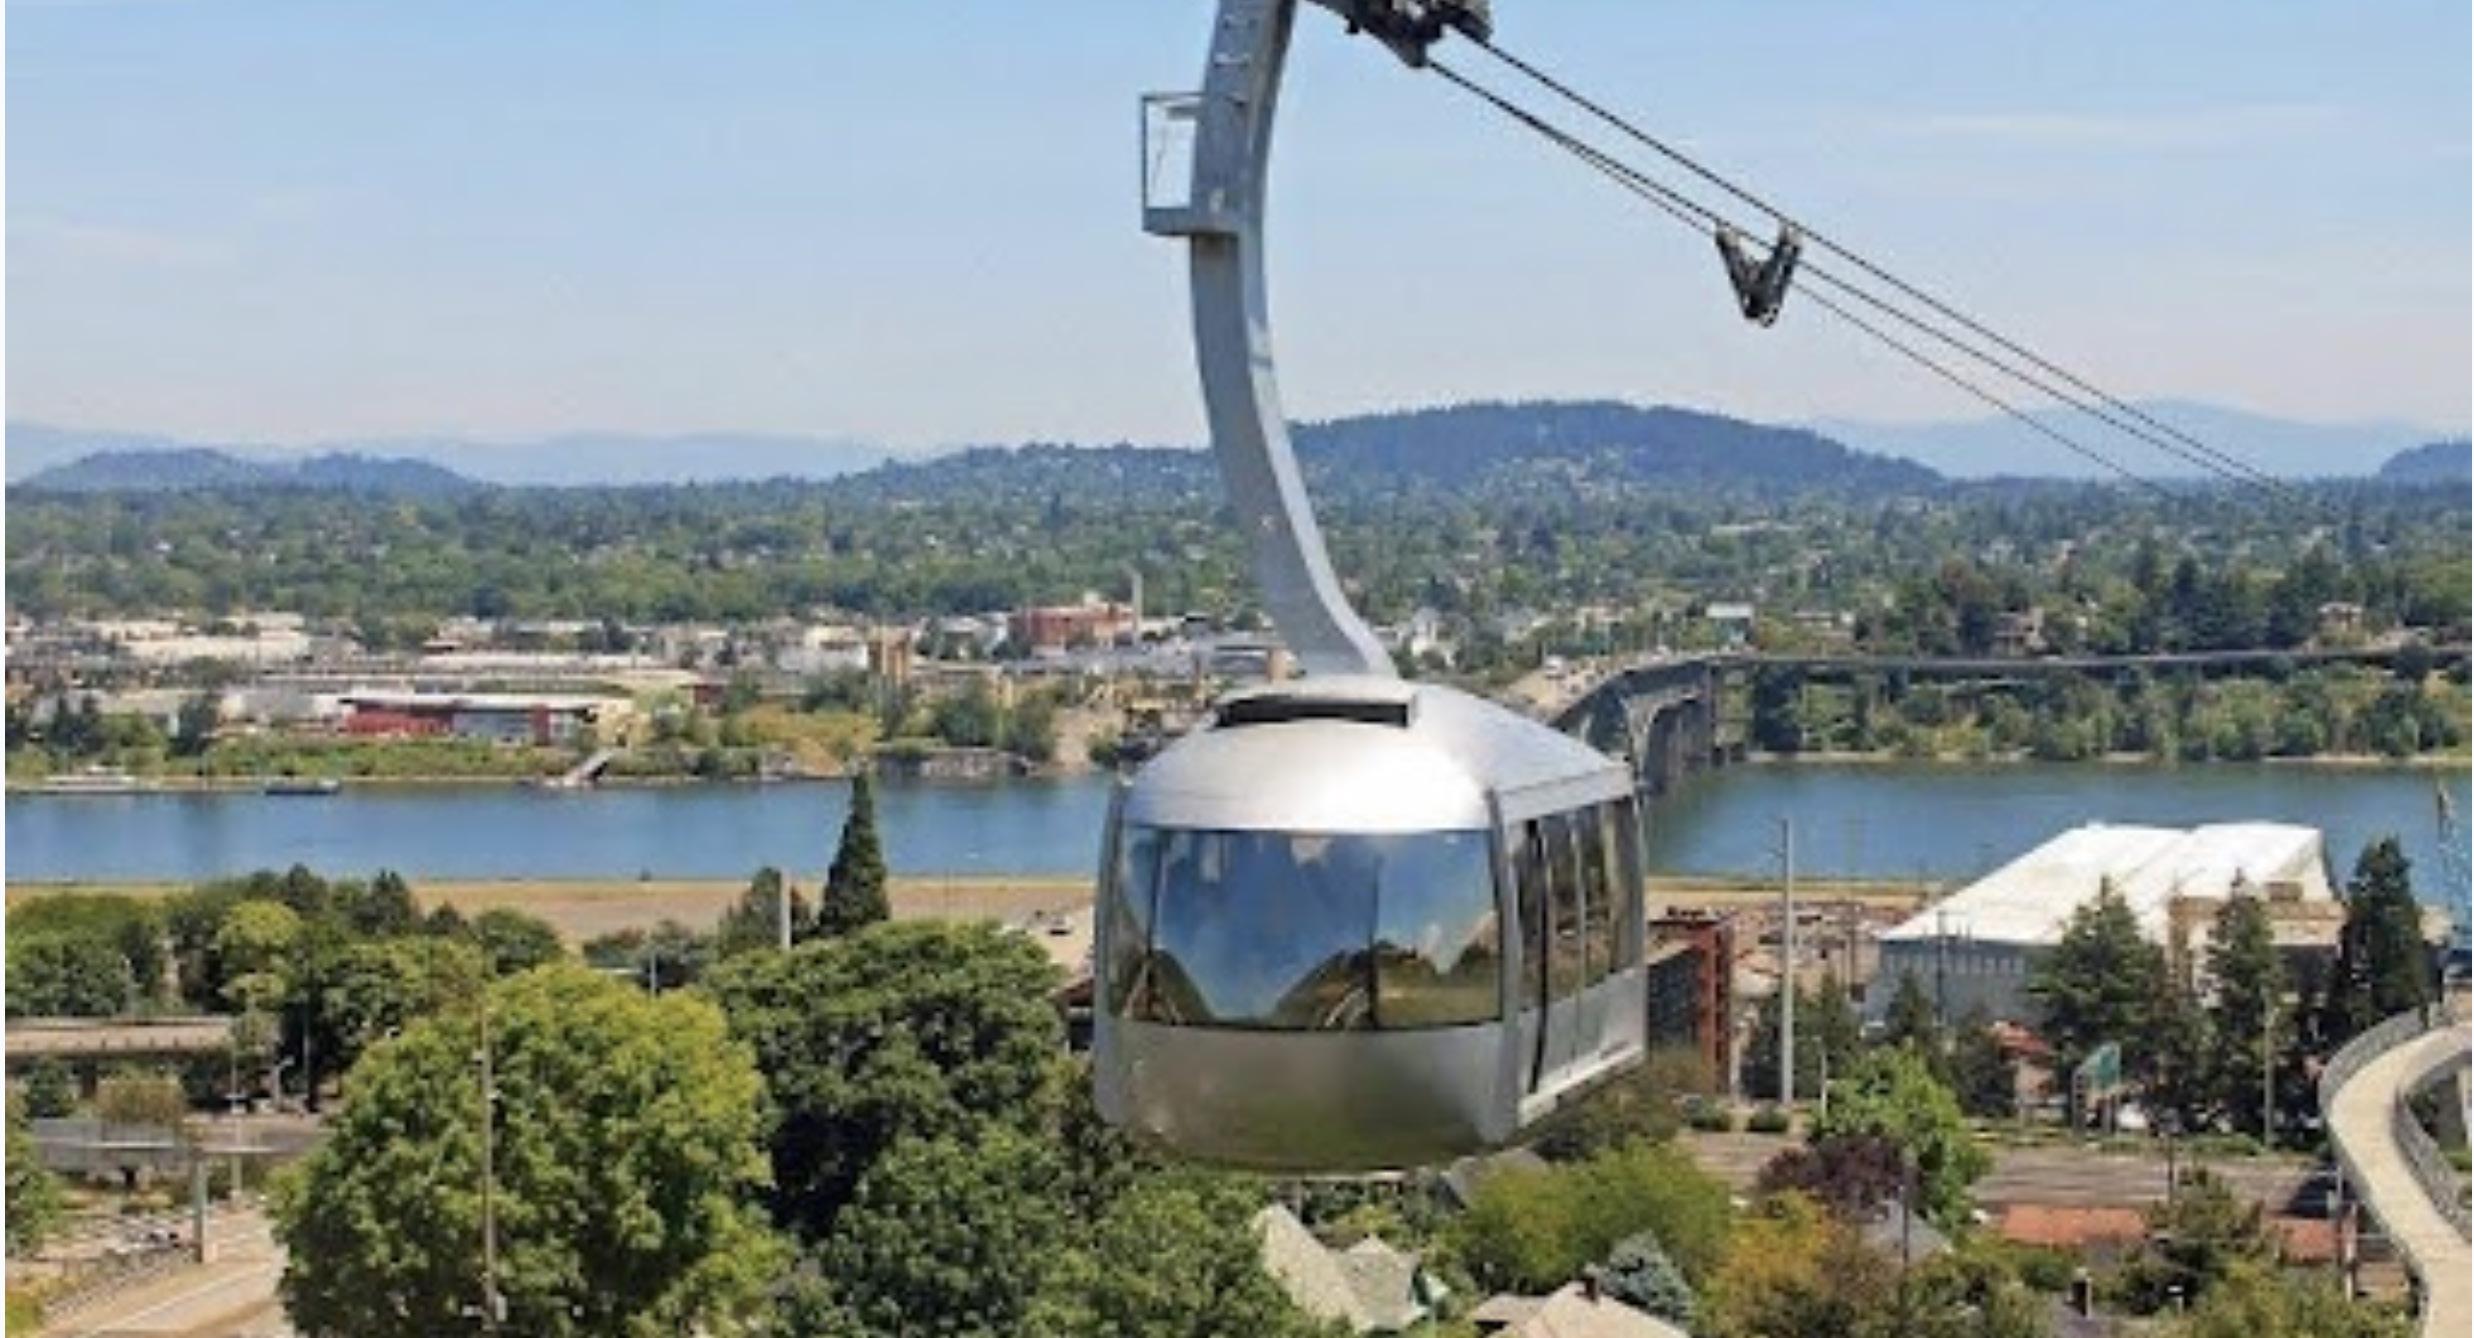
Figure 6: Portland Aerial Tram in Oregon, USA.
The tram carries 3,300 passengers daily, ascending 496 feet and spanning various obstacles.
way of commuting long distances than buses and can also help reduce congestion. Since Medellín’s success at implementing a gondola system, countries like Venezuela, Brazil, Singapore and France have embraced the aerial gondola as a transformative transportation solution applicable to their own contexts.
4.5 Emerging projects
The interest in aerial lift systems as viable transportation solutions is not confined to the above mentioned projects. It extends across other European and Canadian regions where projects are currently in different construction or planning stages.
Some noteworthy examples are listed below. These projects showcase the growing interest in aerial gondola lift systems as an efficient and innovative mode of transportation offering improved access to urban inhabitants
4.5.1 Burnaby Mountain Gondola
In 2011, TransLink identified aerial gondolas as a regional priority for the City of Vancouver and an effective transportation solution after conducting comprehensive mobility research [15].
In 2017, TransLink planned an aerial gondola system between the SkyTrain and Burnaby Mountain. The project supports TransLink's transportation and sustainability objectives and strongly emphasizes serving public transit needs by connecting riders from the SkyTrain to Burnaby Mountain where the Simon Fraser University campus and a newly developed residential
31
Figure 7: Monocable urban aerial gondola in Medellín, Colombia.
The gondola system helps to connect residents of the city's informal settlements to jobs and opportunities in the urban core.
area are located. The Burnaby Mountain is a 354-metre steep ascent that presents challenges for buses, particularly in the winter.
TransLink selected tricable technology due to its larger cabins, minimal ground impact and compatibility with SkyTrain's operating hours. This choice is ideal for difficult urban terrain and high passenger capacity, making it a sustainable transit solution. Unlike SkyTrain which relies on concrete for terminals and towers, the aerial gondola system uses lighter structures (pillars and terminals being the two major infrastructures), thus reducing its ecological footprint.
Costs
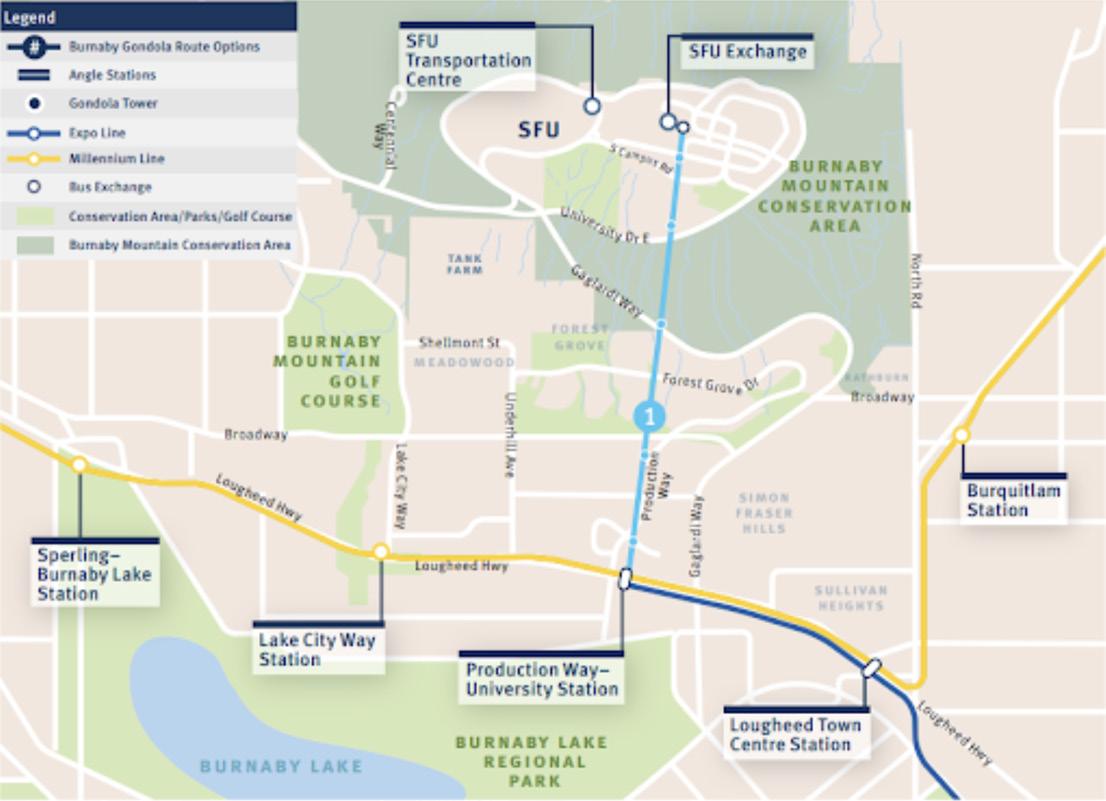
TransLink’s 2021 report shows that the annual operating cost of the aerial gondola would be around C$5.6 million (30 percent) less per year than its bus operations [6]. According to the project report shared by TransLink, the latest capital cost projection (made in 2021) for the tricable aerial gondola technology on the direct route estimates a price tag of C$210 million for a system that would span Production Way–University Station to the Simon Fraser University (SFU) town square and transit loop [76]. This dollar figure represents a near doubling in the projected cost of the system compared to earlier estimates of C$114 million in 2011 (or approximately C$131.4 million when adjusted for inflation to 2021-dollar equivalence) [6]. The route length would be 2.7 kilometres, meaning the cost per kilometre is estimated at C$77.78 million.
Project projections for annual operations and maintenance (O&M) expenses remain consistent with earlier 2011 business case estimates, ranging from C$3 million to C$3.5 million per year. However, current estimates for the direct route indicate a slight increase to C$4.1 million per year (2020-dollar equivalence). Despite the growing costs of the project's financial projections, the aerial gondola project emerges as a pivotal regional endeavour, offering substantial benefits to TransLink as a whole.
32
Figure 8: Gondola route for Burnaby Mountain project [15]
Integration with cycling
Beyond financial advantages, integrating the aerial gondola system also elevates the overall transportation network's activity and accessibility. One of TransLink’s goals is to consider the impact of the gondola system on cycling habits since aerial gondolas can easily accommodate bicycles. Understanding how cycling patterns may change with the introduction of gondolas will help to optimize a rider’s overall transportation experience and promote sustainable mobility options across the region. Currently, buses can carry only two bikes per ride, but with the gondola’s higher operational frequency, the capacity for transporting bikes is double that for buses per hour. To promote cycling, plans are underway to expand bicycle parking facilities at the lower gondola terminal, encouraging a multimodal experience for commuters.
Operation and maintenance
As TransLink is currently in the early stages of its project planning efforts, an operator for the gondola system is not yet identified. Possible candidates include TransLink’s operator, the Coast Mountain Bus Company, or the British Columbia Rapid Transit Corporation. TransLink has collaborated closely with key partners, such as Simon Fraser University and the City of Burnaby, to regularly update the stakeholders on the project’s progress and developments to ensure a successful project outcome.
One of the unique advantages of aerial gondola systems lies in their low maintenance costs. Unlike buses, these vehicles do not require separate or special facilities for maintenance overall. Aerial gondola cabins can remain on the line overnight or be stored in a designated boarding area during off-hours, similar to the SkyTrain facility. Routine maintenance is of paramount importance to guarantee the system’s reliability. During maintenance windows, an aerial gondola may be offline for up to four hours.
Land use
From a land use perspective, the project partnership agreement between TransLink and surrounding municipalities lays the foundation for a supportive environment for any rapid transit system. Both Burnaby and Simon Fraser University have incorporated designs for higher density development within an 800-metre radius around the project area in line with the Official Community Plan (OCP) adopted by the City of Burnaby in 1998. The OCP proposes a high density, mixed-use development on about 65 hectares of land near Simon Fraser University Campus [16]. The OCP’s goal is to establish a community that is environmentally and socially sustainable, as well as integrated with the rest of the city. The plan also incorporates elements of affordable housing, public spaces and transportation infrastructure. To address concerns about residential and environmental impacts, meticulous efforts have been made to refine the route alignment, ensuring minimal disturbance to the residential community.
Moreover, noise modelling indicates that the gondola system's operation has negligible noise impact. Complying with standards such as Technical Safety BC’s Elevating Devices Safety Regulation [17] and British Columbia’s Employment Standards Act [9], the project places paramount
33
importance on maintaining the highest safety standards. Regularly maintaining twoway radios and closed-circuit television (CCTV) surveillance ensures that all safety protocols are diligently upheld.
Revenue
The revenue success of the gondola project hinges on the overall ridership in the TransLink network. The revenue model will adapt accordingly, considering the gondola would be integrated with the existing public transit system and charge the same fare as buses and the SkyTrain. TransLink estimates that about 3,100 passengers per hour per direction would travel on the gondola by 2035 [6].
In summary, the Burnaby Mountain Gondola project's partnership agreement, approach to land use, commitment to safety compliance and focus on sustainable revenue generation positions it as a promising and transformative addition to the region's transportation landscape.
4.5.2 Paris C1
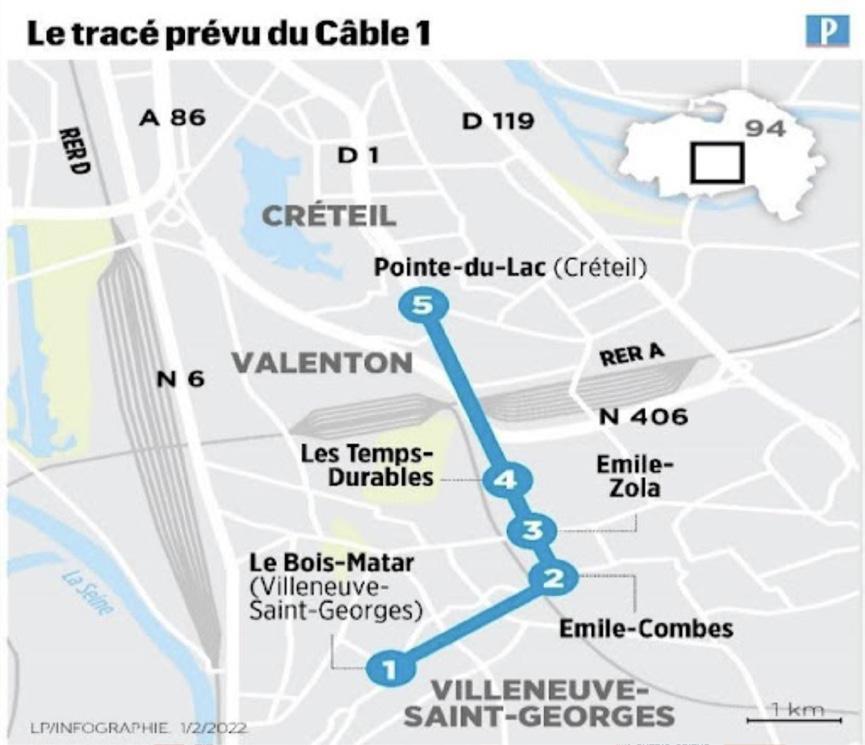
The Paris C1 project in Île-de-France is poised to become the region's first-ever aerial gondola system [18]. This case study exemplifies how such a system can provide connectivity for the first and last-kilometre of travel.
The gondola has been designed to address the daily travel difficulties faced by Val-de-Marne inhabitants on the outskirts of Paris, overcoming challenges such as a restricted public transit network and buses slowed down by traffic jams. The C1 gondola aims to link to facilities in the city's centre, including universities and hospitals.
Additionally, it will foster connections to the rest of the Île-de-France region, ensuring access to densely populated neighbourhoods and facilitating smooth transfers to the Métro system and bus stations. Specifically, the gondola will connect Créteil to Villeneuve-Saint-Georges via LimeilBrévannes and Valenton [18].
34
Figure 9: Route of the Paris C1 gondola project in Île-de-France [19]
4.6 Conditions for success and limitations
Gondolas are a unique and innovative cable-driven transportation system that offers speed, reliability, sustainability, accessibility and affordability in areas with complex geography and varying climates. They have several advantages and limitations that require consideration before implementation. By factoring in key considerations and conditions for success, aerial gondolas can be a valuable addition to a city’s public transit system. Table 1 illustrates the conditions for success and the limitations of adopting gondolas as an urban transit system.
Conditions for success Limitations
Topography:
Urban aerial transit excels in challenging geography such as hills or water where surface transit is impractical.
Short to medium distances:
Gondolas are well-suited for short-medium trips.
Cost-effective:
The capital, operating, and maintenance costs for aerial gondolas vary but are generally lower than other forms of transit.
Destination access:
Gondolas effectively reach specific places like remote areas or elevated destinations.
Congested areas:
In crowded cities, gondolas bypass traffic, making journey times and distances shorter.
Integration:
In crowded cities, gondolas bypass traffic, making journey times and distances shorter.
Integration vital:
Gondolas need to connect with broader transit networks for effective use.
Land and community issues:
In some cases, locating stations and towers in crowded urban areas can be challenging. Involving local stakeholders, especially in sensitive zones, is crucial.
Topography:
Thorough planning and alignment with transit needs are essential.
-
-
-
35
Table 1: Gondola conditions for success and limitations
In conclusion, aerial gondolas are transportation systems that offer many benefits for urban mobility, transit and environmental sustainability. They are fast, safe, reliable and cost-effective compared to other modes of transportation. They can also reduce traffic congestion and lower emissions. Aerial gondolas have been successfully implemented in many cities worldwide, such as Portland, Medellín and New York. They have the potential to transform the way people travel and experience their surroundings. Therefore, aerial gondolas are a viable and attractive option for future urban development.
36
Shared micromobility: Bicycles and e-bikes 5

5.1 Background
Shared micromobility has emerged as an alternative transport mode due to traffic congestion. Shared Electric bikes (e-bikes) and bicycles can address first and last-kilometre connection gaps for public transit, align with urban climate goals and promote human health. They are also cost effective and appealing to municipalities aiming to enhance transit affordably.
Traditional bicycles rely solely on the rider's pedalling effort, requiring more exertion on inclines. Electric bikes (e-bikes) feature a rechargeable motor that assists pedalling, enabling higher speeds and easier uphill travel. E-bikes contribute to emission reductions by promoting less personal vehicle usage and offering a user-friendly solution for challenging terrains. Docked and dockless bike sharing systems are two distinct ways to implement shared bicycles in urban settings.
Docked systems have designated stations where bicycles are stored securely. Users must start and end their rides exclusively at these points, using access methods like apps, cards, or passes to unlock and return bikes. This controlled framework suits new bike-sharing locales. However, physical docking infrastructure can create financial and connectivity challenges due to the fixed locations of the docking stations. Conversely, dockless systems provide user flexibility and convenience. In such systems, bicycles can be parked and secured at various public points within a designated service zone, freeing users from the constraints of predetermined docking stations [20].
Bike sharing systems require careful planning and consideration for effective operation. One of the main aspects of bike sharing systems is the location and design of docking stations and service zones [20]. Docking stations should be strategically placed in areas with high demand and connectivity, such as transit stations, commercial districts, parks and urban tourist locations. They should also be secure to prevent theft and vandalism. [20] For e-bikes, docking stations need access to power sources to charge the batteries. For service zones, bike sharing programs should be located in areas with existing cycling infrastructure to ensure the safety of riders.
37
CHAPTER 5
The integration of bike sharing systems with other modes of transportation is a factor that influences the placement and design of docking stations. The choice between docked and dockless bike-sharing methods depends on a city's specific requirements and urban layout, and the preferences of residents and transit users in surrounding communities.
The regulation of bike sharing systems can also create challenges and complexities. Regulation can shape e-bike usage patterns by determining the rules on parking, maintenance, speed limits and liability. Additionally, regulations should specify the standards and criteria for the types of e-bikes allowed to operate under bike sharing systems. In Canada, e-bikes are classified as “powerassisted bicycles” and are regulated to have a maximum power output of 500 watts and must not aid the rider beyond 32 kilometres per hour.
Finally, bike sharing systems depend on bike-friendly streets. Therefore, the success of e-bikes and similar shared mobility systems depends upon road infrastructure designed to accommodate and encourage bicycle and non-car travel. Bike-friendly streets include features such as dedicated bike lanes that are separated from traffic by physical barriers or painted lines, signage and pavement markings that indicate the presence and direction of bike and e-bike traffic, as well as traffic-calming measures such as speed bumps and roundabouts to limit carbased hazards for bike and e-bike users. Bike-friendly streets are essential for the safety and comfort of bike and ebike users and for the promotion and growth of bike sharing systems.
A comparative analysis of the literature exploring e-bikes and traditional bicycles demonstrates diverse deployment models available in the marketplace today. These include use cases for shared bikes and e-bikes in congested urban cores, flat terrains, and as a low-cost service bridging public transit services in medium-density communities where frequent bus service may not be cost-efficient for a public agency to deploy.
5.2 Use cases
Micromobility is a unique transit mode that can offer several solutions when applied to an urban setting. Several use cases for micromobility transit exist globally today, as identified below.
● Providing first- and last-kilometre connectivity: Micromobility can provide first- and lastkilometre connectivity by bridging the gap between a commuter’s origin and destination points and the nearest bus or train stations. This can address the challenge of providing adequate coverage and accessibility for public transit services in urban areas.
● Deployment in congested areas: Micromobility services such as bikes and e-bikes occupy less road space than cars. Therefore, they can be deployed to alleviate traffic congestion and improve the flow of vehicles in urban areas with limited road or transit capacity, particularly in places with higher concentrations of users (e.g., university campuses). This is further enhanced with dedicated infrastructure such as bike lanes and paths.
38
● Primary transit mode: In some cases, bikes and e-bikes can be deployed at scale to function as the primary transit where circumstances are favourable. This is the case for short trips where other transit modes are not feasible due to infrastructure limitations or the cost of implementing them, such as a university campus where buses cannot serve all necessary or relevant pick-up and drop-off points due to limited road infrastructure or limited demand.
5.3 Core themes of micromobility solutions
This study integrates data collected from semi-structured focus group discussions (FGDs) with the following key stakeholders to elicit core themes that shape micromobility today, and which will define it in the future:
● City of Vancouver: A major city in Canada that has a successful bike sharing service in operation.
● Mobi Bike Share: A private operator that works with cities and transit agencies to provide bike sharing services.
● Dutch Cycling Embassy: A public-private network facilitating bike-friendly cities.
● Vervoerregio Amsterdam: The transport authority for the Amsterdam region.
● BYCS: A not-for-profit that focuses on implementing educational bike-sharing initiatives.
● Green Communities Canada: A not-for-profit that focuses on bike-sharing initiatives.
● BIXI: A not-for-profit created by the city of Montreal to manage its bike-sharing system.
5.3.1 Program models
Throughout its evolution, the core concept of bike sharing has remained simple – it is defined as the ability to pick up a bike at one location and return it to another, enabling convenient, pointtopoint transportation. However, according to FGD data, bike-sharing programs have adopted various business models across global cities. These range from offering simple free bikes for community use to offering more secure systems driven by advanced technology.
Today, over 600 cities worldwide operate bike-sharing systems with new programs emerging annually. In North America, a prevalent approach to bike sharing involves a collaborative partnership between private and public entities. In this type of collaboration, operators and suppliers provide the bikes, handle operational and maintenance tasks and generate revenue through bike-sharing passes. Cities contribute initial funding and oversee the development and maintenance of necessary infrastructure over the long term.
In several European countries such as the United Kingdom and the Netherlands, rail companies have integrated bike-share parking areas into their operations, enabling them to collect revenue from these spaces, particularly those near train stations [21]. These parking zones act as catchment areas to ensure convenient access to train services for transit users.
39
Within this project framework, the involvement of sponsors plays a crucial role in generating revenue. As highlighted in a later section in this report, advertisement and sponsorships on vehicles and docking stations in Vancouver have played an important role in generating revenue for both the private operator and the city. This comprehensive approach demonstrates how sustainable funding can be secured to support and maintain these bike-share initiatives.
5.3.2 Ridership
FGD data highlight the diverse ridership experiences across countries and communities, revealing that weather and landscape are not the sole determinants of ridership. Instead, well-designed infrastructure deployed in accordance with five key principles – attractiveness, cohesion, safety, directness and comfort – play crucial roles. The Dutch Cycling Embassy² emphasizes that embracing these five principles leads to successful ridership growth. In Vancouver, postpandemic recovery led to an impressive rebound in ridership, surpassing pre-pandemic levels, notably aided by the introduction of e-bikes [22]. This upward trajectory illustrates the potential of wellexecuted micromobility initiatives to enhance global urban mobility and transit ridership.
5.3.3 Initial investment costs
Initial investment costs vary based on the program's scale. According to FGD data, establishing a bike station, including two docking spaces, equipment and communication tools, averages around C$6,700. Creating a network of 1,000 bikes would require a C$6.7 million investment, excluding on-road infrastructure such as bike lanes.
The initial investment costs of bike lanes vary depending on factors such as land value, climate, topography and design. Land value affects the costs of acquiring or leasing the land for a bike lane, especially in densely populated areas with high demand for land. In urban settings, the cost would be reconfiguring existing public roadways, including building bikeways like physically separated cycle tracks, bike lanes, neighbourhood routes and paved multi-use trails. Climate affects the cost of maintaining the bike lane in various weather conditions, including snow, ice, heat or rain. Topography affects the costs of constructing the bike lane in different terrain types, such as hills, mountains or plains. The design also affects the cost of implementing a bike lane, depending on various specifications such as separation, width or safety features.
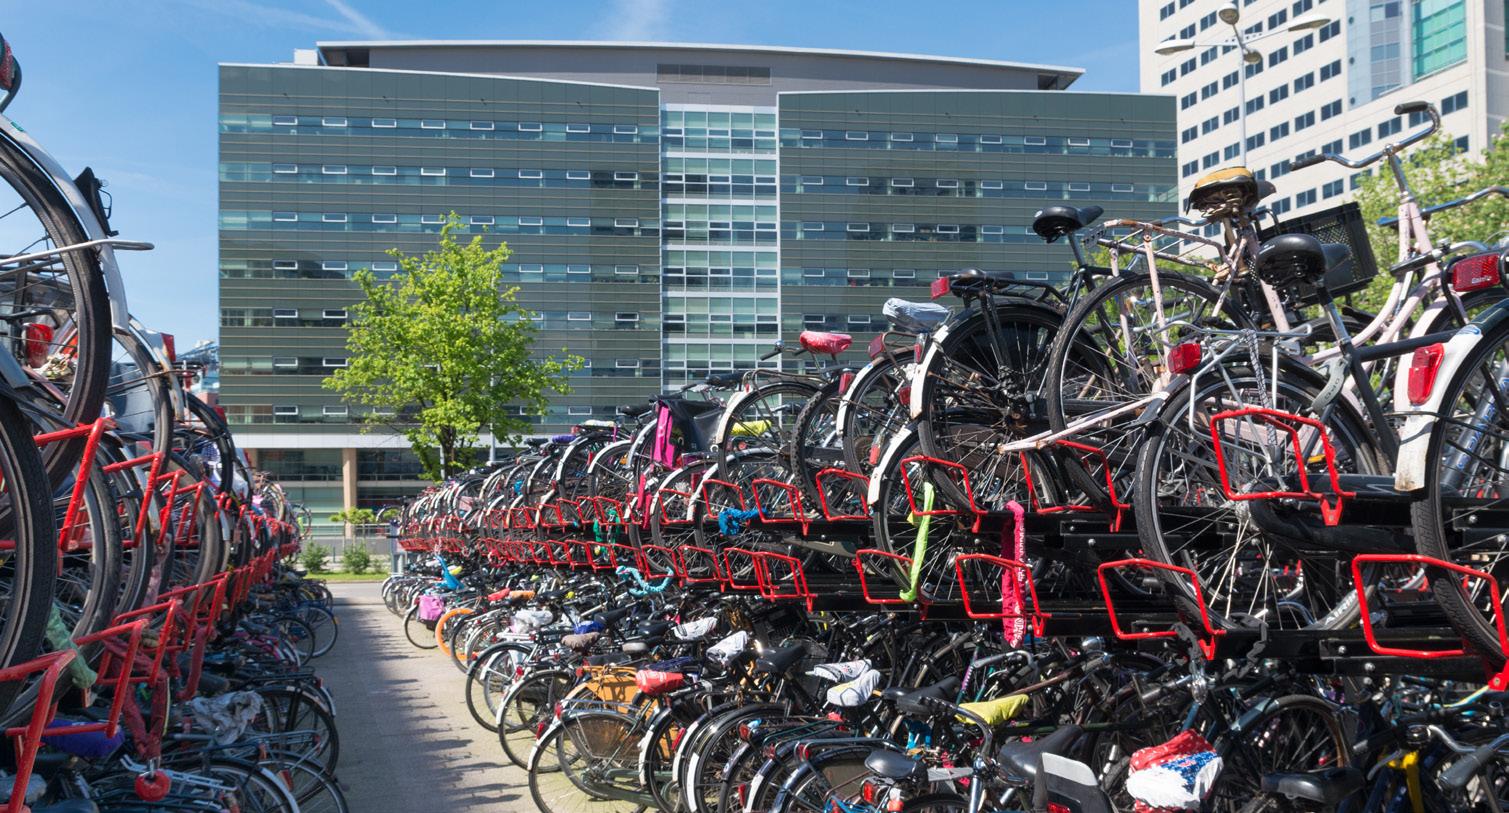
An example of large-scale investment in the micromobility sector is the Utrecht Central Station's bike facility with 12,500 parking spaces costing C$44 million. This collaborative initiative between the municipality, government and train station results in enhanced ridership, reduced congestion and improved air quality. Given the popularity of cycling in Dutch society, revenues from daily parking, yearly subscriptions and bike share rentals come close to covering the costs of operating the bike parking facility. The remainder of the costs are shared by the rail company and the municipality [23].
² https://dutchcycling.nl/
40
The rail company has invested in bicycle parking facilities to deter passengers from bringing bicycles onto crowded trains. Enhancing parking facilities has reduced the demand for passengers to carry bicycles on trains, leading to the significant adoption of multimodal travel. Rail passengers are now more than twice as likely to arrive by bike as two decades ago, and the number of train trips has also increased.
In several European countries, a comprehensive social cost-benefit analysis accompanies each infrastructure investment, considering public health, air quality and noise pollution. This approach allows for better articulation of return on taxpayer contributions. Organizations like the Dutch consulting firm Decisio³ that has expertise in bikenomics (the economic benefits of cycling) have developed tools to calculate the long-term savings and socioeconomic benefits of cycling investments [24]. Due to the high societal cost of cars and their infrastructure, the momentum for sustainable transportation solutions continues to grow.
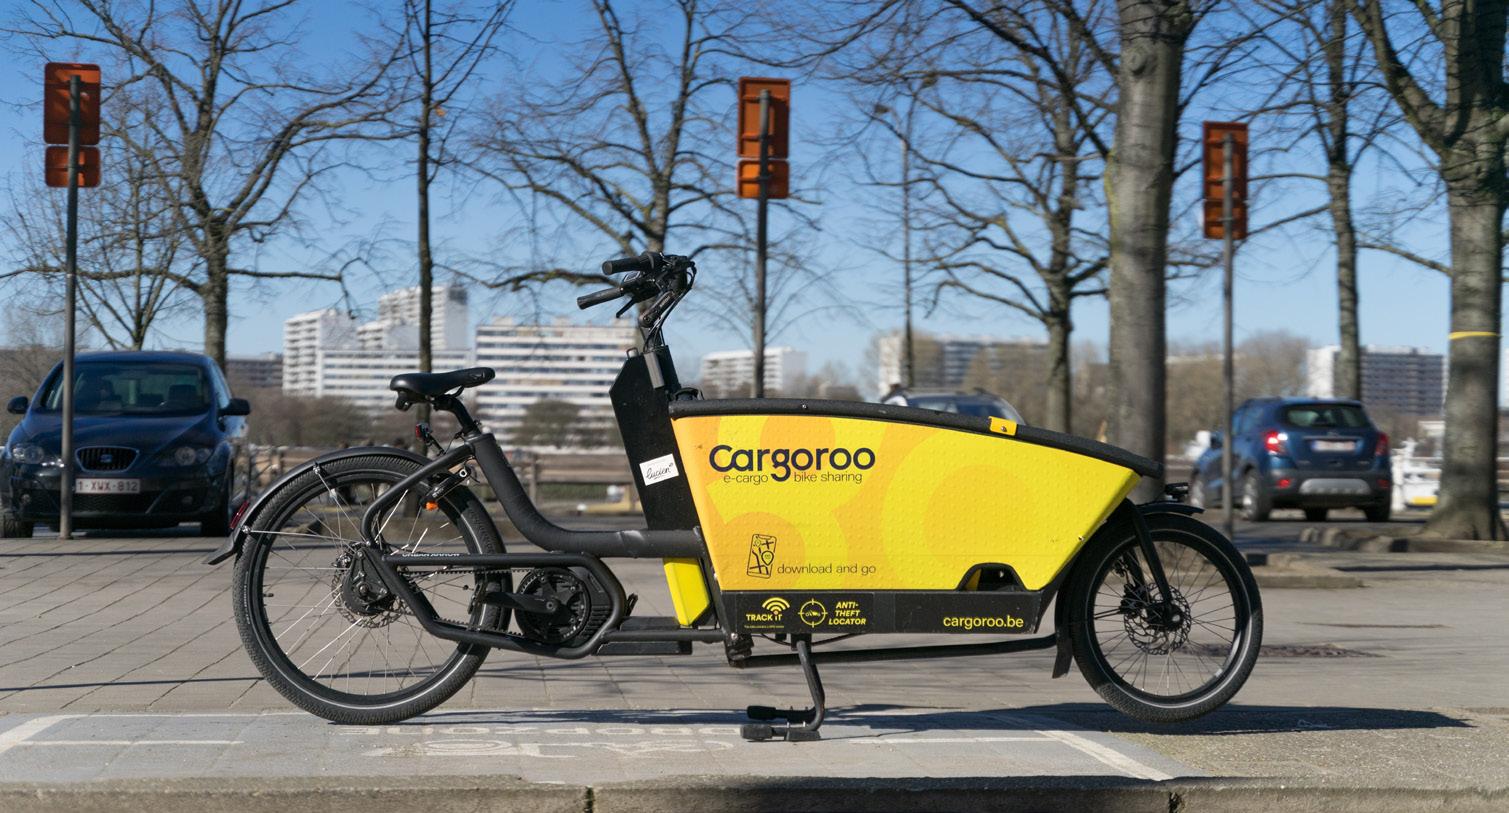
While commuter bikes are affordable and suitable for short-distance urban commutes, their limited capacity makes them unsuitable for carrying heavy loads or children or covering longer distances. Some alternatives, such as e-bikes and cargo bikes, come at a higher cost but address these limitations. In countries like the Netherlands, private companies like Cargoroo spearhead initiatives to fund and introduce these specialized bikes to provide practical transportation and accessibility solutions. These bikes find applications in delivery services and leasing, often complemented by the availability of charging infrastructure.
³ https://decisio.nl/en/
41
Figure 10: The world’s largest bicycle parking at the Utrecht Central Station, Netherlands.
(PhotoCredit: Hans Engbers/Shutterstock.com)
5.4 Global overview
This section presents a global overview of shared micromobility, which has gained significant popularity for addressing urban congestion and reducing carbon emissions.
Bicycle and e-bike systems complement urban and suburban transit systems using app-based rentals and enhance overall mobility options by connecting with buses, trains and subways. Bicycle and e-bike systems are the predominant micromobility choices for public and private transit sectors. Other micromobility modes such as scooters are also used in many urban areas, and research indicates these are predominantly privately owned and operated and are not integrated into shared transit settings. However, some publicly owned scooter companies in North America such as Bird, Helbiz and Niu Technologies have a sizeable market share
Globally, bike-sharing models exhibit diverse approaches. Amsterdam's model underscores the importance of a well-connected cycling network [23]. In Japan, cycling is deeply ingrained in the culture with 16 per cent mode share despite limited infrastructure [25]. Hangzhou, China, boasts the world's largest bike-sharing program with substantial investment [26]. Montreal's BIXI system has influenced commuting in over 40 cities through e-bikes [27]. New York City's Citi Bike reduces traffic and exemplifies a privately owned and operated model. Vancouver's bike-sharing model showcases an innovative public-private partnership [22].
For this market scan, the scope of secondary research is predominantly centred around Europe, Asia and North America. However, emerging themes from FGDs provide supplementary case studies related to bicycles and bike-sharing from South America.
5.4.1 Amsterdam, Netherlands
Amsterdam is renowned for its exceptional micromobility, boasting a staggering statistic of more
42
Figure 11: Rental Cargoroo in Utrecht, Netherlands.
The service is a cost-efficient and eco-friendly way to handle cargo needs. (PhotoCredit: PixelBliss/Shutterstock.com)
bicycles than residents. Of the 834,713 residents in Amsterdam, there are 881,000 bicycles. Cycling is not just a leisure-based activity in Amsterdam – it is the preferred daily mode of transportation for 63 per cent of the population. This cultural perspective sets it apart from countries where cycling is mainly recreational. Amsterdam is a city with a dense network of bicycle stations placed approximately 300 metres apart [23].
A secure design network is the basis for their robust micromobility system with specially designed commuter bicycles that discourage theft and resale. A streamlined and automated locking mechanism simplifies bike check-in and check-out, while wireless tracking through radiofrequency identification devices (RFIDs) pinpoints bicycle locations. Real-time monitoring of station occupancy rates through wireless communications, like General Packet Radio Service (GPRS), is essential. Providing real-time user information through web platforms, mobile phones, or on-site terminals enhances the user experience. Optimizing pricing encourages short trips, maximizing daily trips per bicycle [24].
Amsterdam’s experience highlights key factors crucial for cities looking to develop or improve sustainable transportation systems. The city has created valuable tools, conducted socioeconomic cost-benefit analyses and developed strategic documents that other jurisdictions can adopt. Yet, the fundamental message for implementing micromobility remains clear – create safe, attractive, sustainable and connected infrastructure to promote active mobility [23].
In the 1970s, the Dutch transitioned from car-focused to cycling-focused urban planning, building a fine-grained grid of high-quality cycling infrastructure. A pivotal moment occurred when the national government shifted focus to network-level integration. Consultations with residents helped to identify cycling route needs creating a network with routes just 300 to 500 metres apart [23]. This network effect is crucial for mass cycling adoption. The city is equipped with an elaborate network of cycle paths and lanes, so safe and comfortable that even toddlers and elderly people use bikes as the easiest mode of transport.
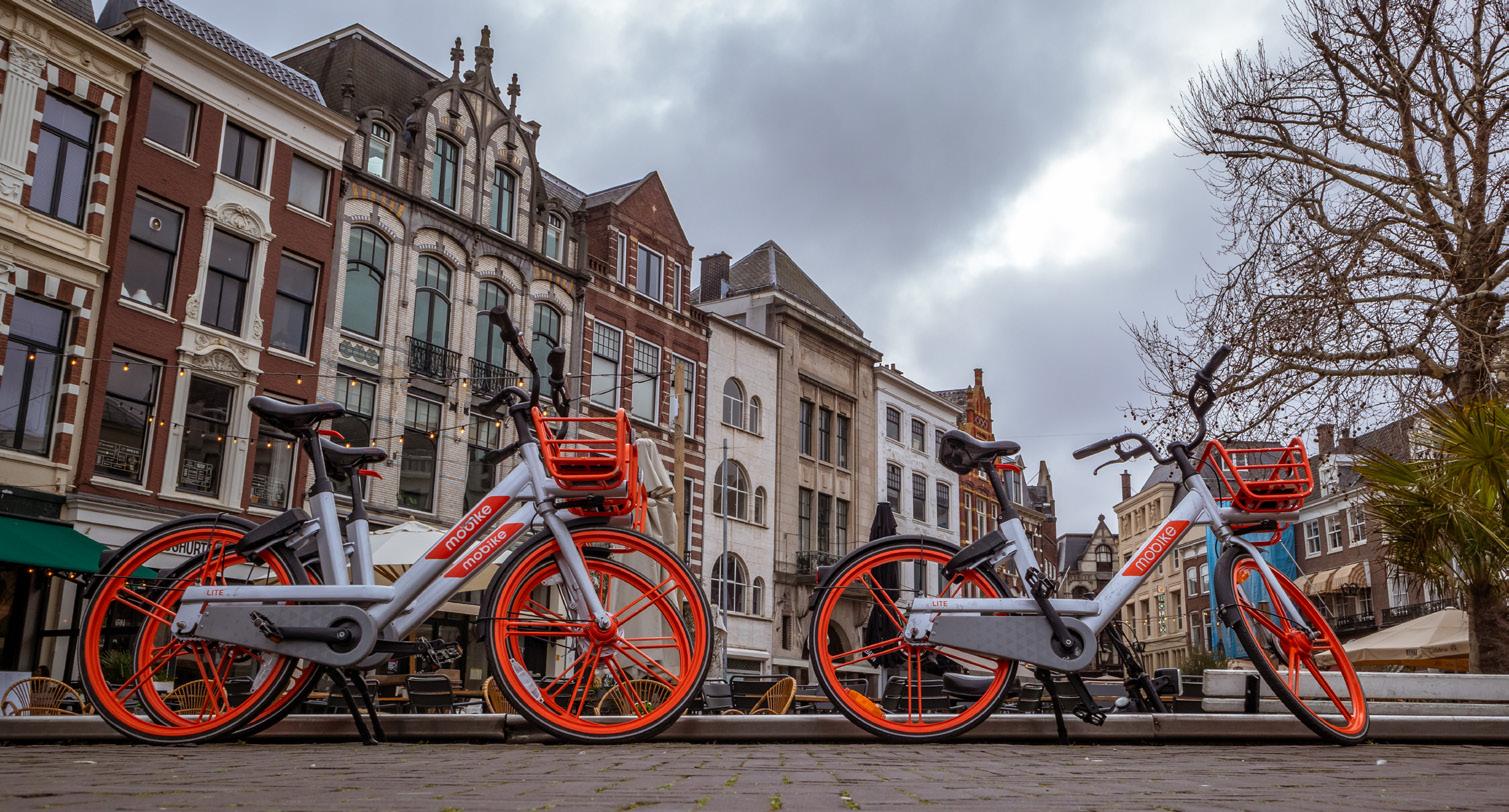
43
Figure 12: Bike sharing in Amsterdam, Netherlands.
The system is a sustainable, cost-effective and efficient way to reduce traffic congestion and improve air quality (Photo Credit: Emmanuel Nalli/Shutterstock.com)
Despite well-established and effective bike-sharing systems, it is important to highlight that in countries like the Netherlands and Denmark, a significant portion of cyclists use their own bicycles. FGD data emphasizes a clear preference for personal bike ownership rather than relying on government-operated bike-sharing programs [23].
In the Netherlands, most shared mobility fleets are owned and operated by private companies. Rail companies also manage some parking spaces and fleets. However, whether shared or privately owned, the Dutch government is committed to building and improving a robust infrastructure to support these transportation options [24].
5.4.2 Tokyo, Japan
Cycling is a popular and convenient mode of transportation in Japan, where about one in six trips are made by bike. According to the Institute for Transportation and Development Policy, Japan ranks second in the world in terms of cycling participation, only behind the Netherlands which has a 25 per cent cycling mode share [25]. The Nationwide Person-Trip Survey, conducted by the Japanese government, shows that most cyclists in Japan travel less than five kilometres per trip, making cycling an ideal option for short-distance mobility. The Japan Bicycle Promotion Institute also reports that the main purposes of cycling in Japan are shopping, socializing and commuting, reflecting the diverse and practical uses of bikes in everyday life.
Regarding cost, 65 per cent of bicycles in the country are acquired for less than C$400. This affordability has contributed to the widespread adoption of cycling. Moreover, 60 per cent of bikes are step-through cruisers. This design choice underscores the inclusivity and ease with which individuals of various demographics can engage in cycling as a part of their daily routine [25].
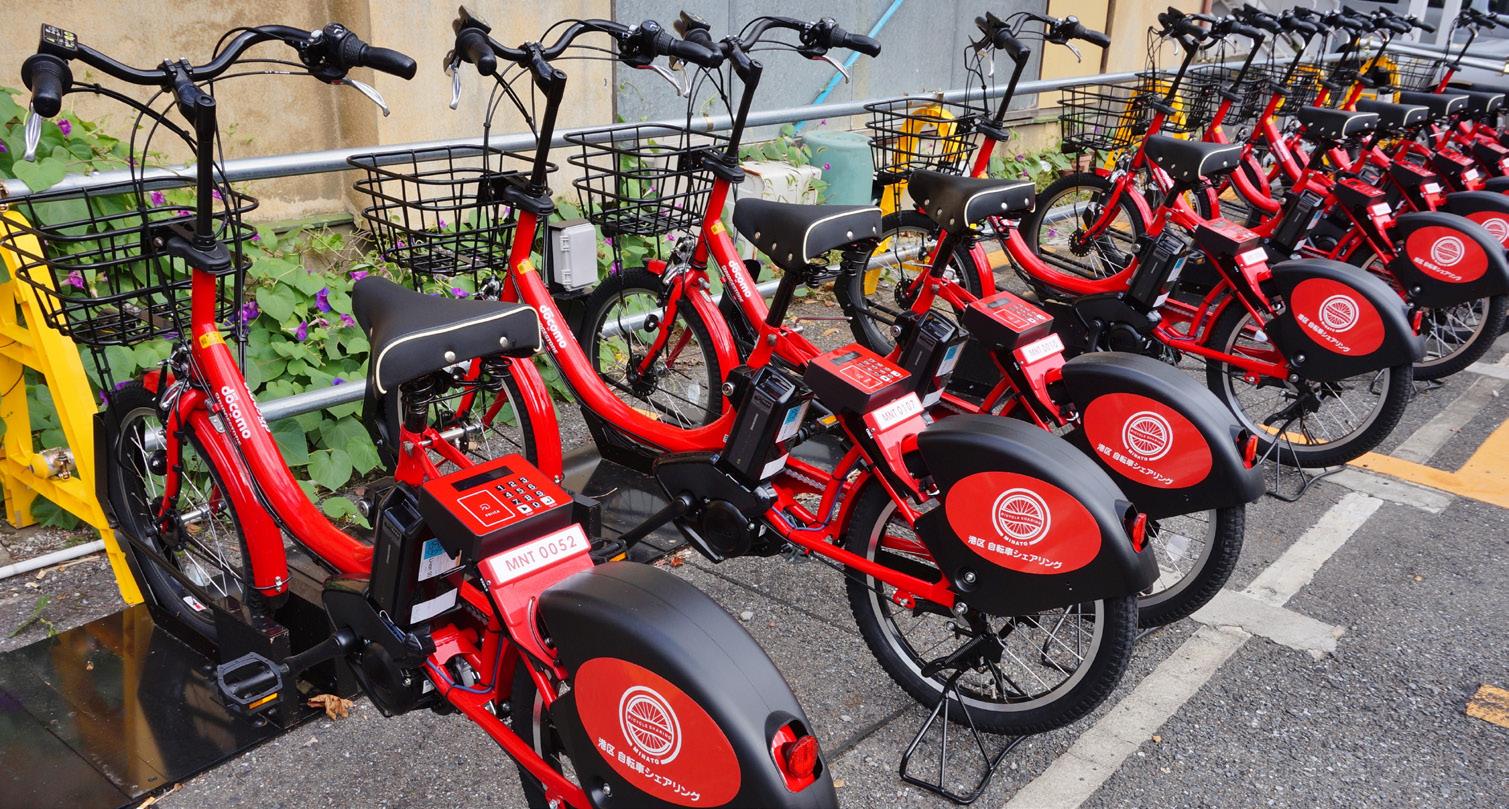
The service is available in Minato City as well as 10 other cities.
44
Figure 13: Minato City bicycle sharing in Tokyo, Japan.
(PhotoCredit:EQRoy/Shutterstock. com)
Affordability further bolsters cycling's appeal in stark contrast to the relatively high cost of car ownership, particularly in urban settings. The majority of roads cater to cars, but sidewalk cycling is permissible, contributing to the co-existence of cyclists and pedestrians. The Japanese model contrasts with the Dutch approach, which emphasizes the importance of a dedicated network of bike lanes and infrastructure.
5.4.3 Hangzhou, China
Hangzhou, a city with a population of around seven million, has the world's largest bike-share program. Started in 2008, Hangzhou Public Bicycle currently has a fleet of 116,000 public bicycles distributed across an extensive network of more than 3,000 stations, with average daily rentals of around 300,000 [26].
According to data from the C40 Cities Climate Leadership Group, from 2008 to 2020, Hangzhou's public bicycles were rented over 1.098 billion times, effectively reducing 549 million car trips and cutting 1.461 million tons of carbon emissions. This demonstrates the role of shared micromobility in reducing reliance on private car ownership [26].
The success of this program prompted local authorities to invest significantly, empowering the Hangzhou Public Transport Corporation to undertake an expansion effort. A substantial investment of approximately C$31.7 million has propelled the program’s growth resulting in plans to increase the city’s fleet of bicycles [26].
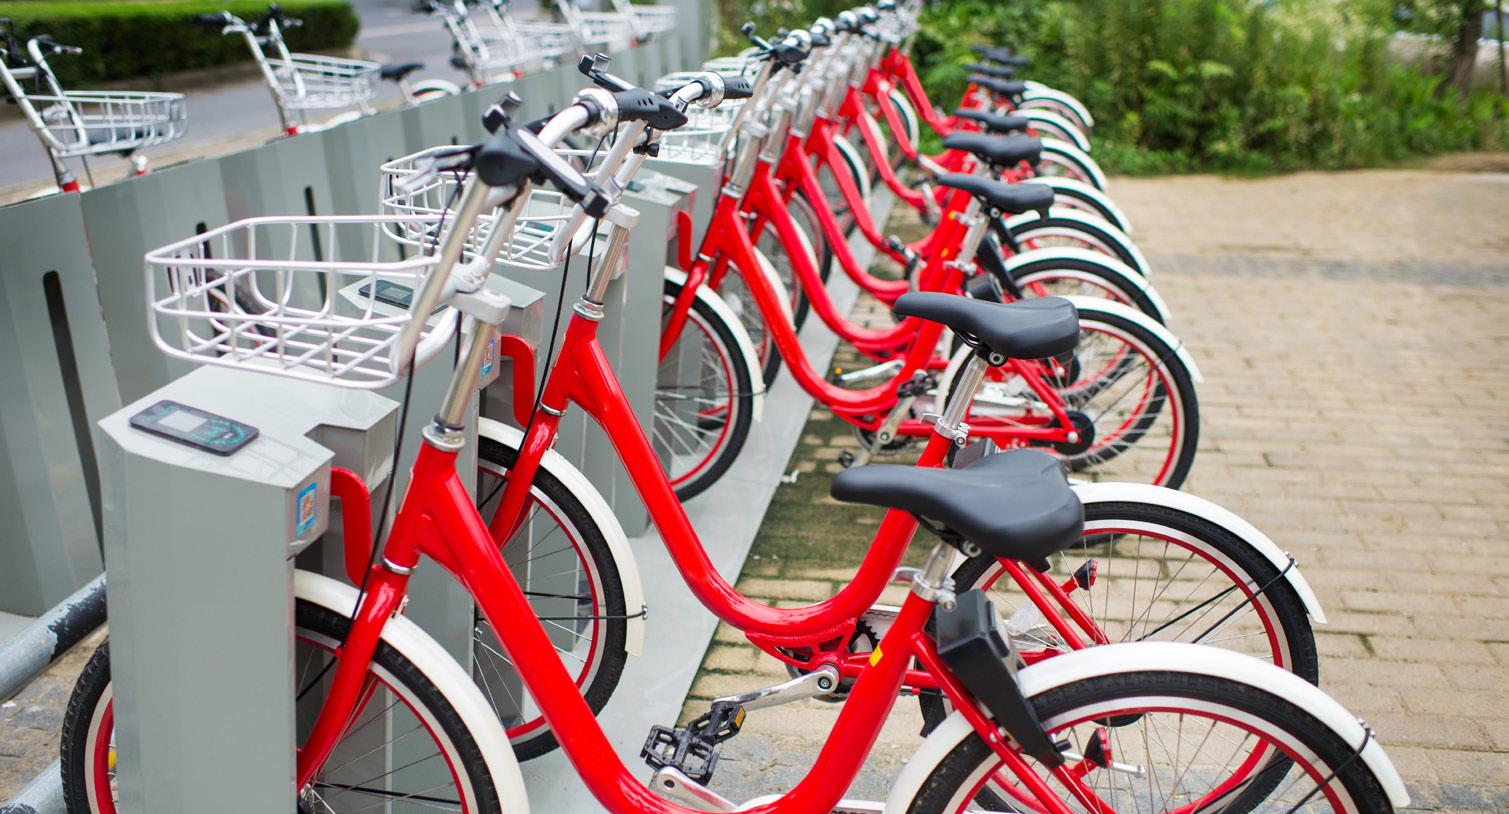
5.4.4 New York City, USA
New York City stands among the pioneers in the United States, embracing large-scale bike share programs. Launched in 2013, their original Citi Bike fleet was 6,000 bikes and 330 stations, ranking as the largest bike share in the United States. In 2017, Citi Bike expanded its bike count, surpassing London’s bike share with 25,000 bikes and 1,500 stations [28]. Taking inspiration
45
Figure 14: Bike-sharing system in Hangzhou, China.
Hanzhou has the largest bike-sharing system in the world. (PhotoCredit: Zhang Sheng/ Shutterstock.com)
from Montreal’s BIXI, the Citi Bike is an efficient mode of transport embraced by many New Yorkers. The system is widely popular due to Manhattan’s extensive network of bike paths, bike lanes and greenways spanning over 380 kilometres. This infrastructure promotes cycling as a mode of transportation in the city, while the widespread use of bike sharing programs helps to alleviate traffic congestion and improve air quality.
Citi Bike took a unique path, launching without government funding, unlike most bike-share programs, which rely on collaboration between businesses and public authorities. This approach was praised for maintaining a high quality of service, although it faced criticism for higher usage costs compared to global counterparts. Lyft, the American ride-hailing company, acquired Citi Bike’s New York operation for C$136 million and is currently operating the service [29].
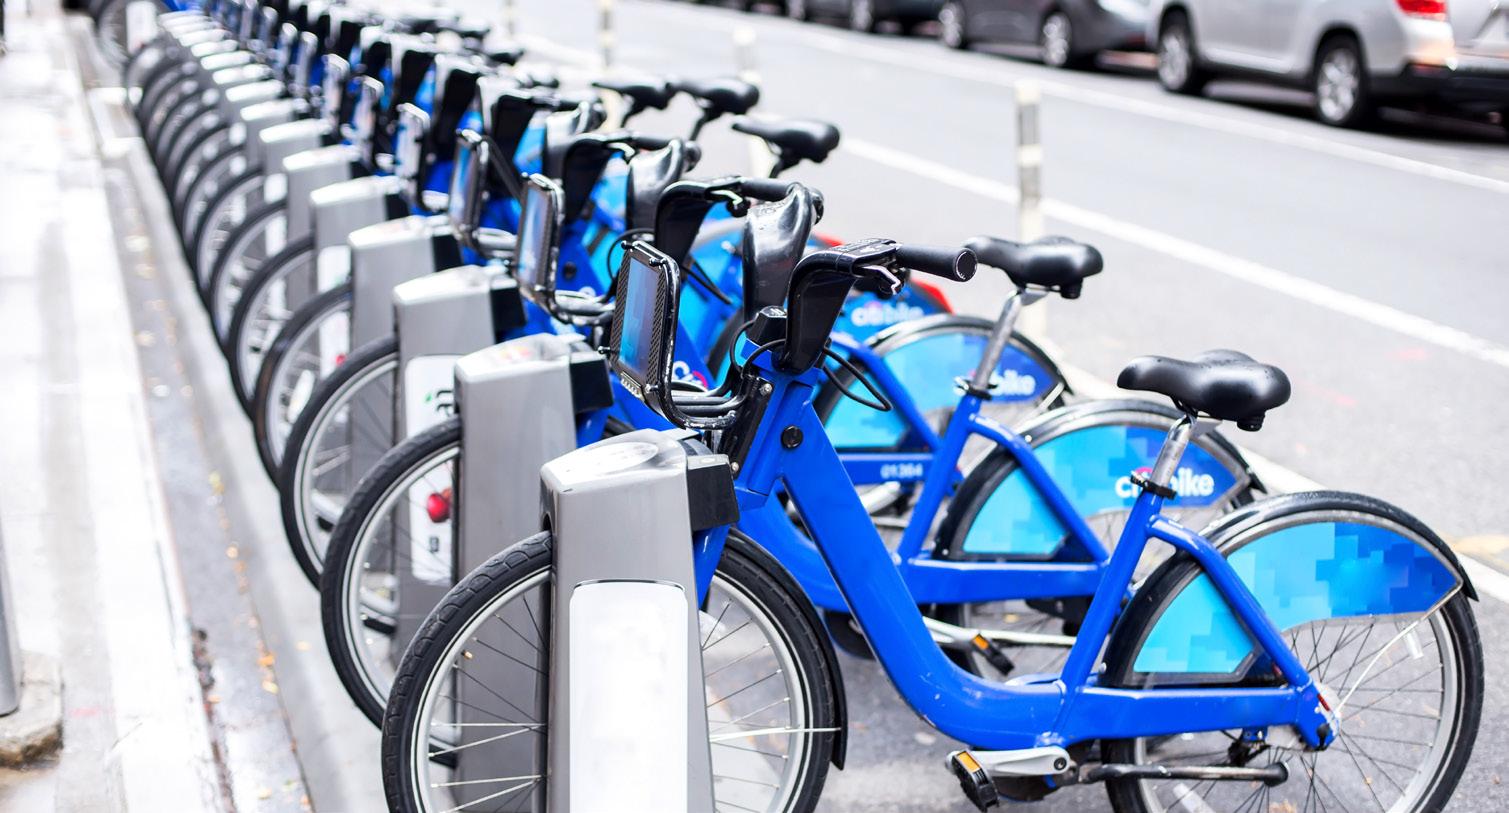
5.4.5 Montreal, Canada
Established in 2009, Montreal's BIXI bike sharing system pioneers successful bike sharing across North America [30].
BIXI currently boasts a fleet of over 10,000 bicycles and 830 docking stations. A vibrant community of 320,000 cyclists embarked on an impressive 5.8 million trips in 2019 alone. These figures highlight an 80 per cent surge in ridership and a 309 per cent increase in sales of tickets since 2014 [30]. Collaborating with urban planners, designers and partners such as Telus, Rio Tinto Alcan and Desjardins, Montreal's parking authority and PBSC Urban Solutions crafted a user-centric urban bicycle ecosystem. The popularity of this endeavour is evident as the program swiftly expanded to encompass over 3,000 bikes and 300 smart stations within a year of its launch – a trajectory of growth that continues to this day [31].
Globally, BIXI operates 37,000 bikes in 15 cities and on two university campuses, including Toronto,
46
Figure 15: Citi Bike station in New York, USA.
The all-time record for ridership in a single month occurred in August 2023, when the system had 4.07 million rides. (PhotoCredit:Stas Walenga/Shutterstock.com)
Melbourne, London and New York. Urban integration and user-centric design are pivotal to the success of Montreal’s BIXI shared micromobility. Strategically designed BIXI stations integrate with urban landscapes, sharing street space with cars. Both local BIXI members and tourists play a crucial role in sustaining the program, forming a significant revenue stream. Sponsors and user contributions, amounting to around 50 per cent of PBSC's revenue, underscore the financial foundation of the system [27]. BIXI has significantly influenced Montreal's commuting landscape, reshaping behaviours and choices. BIXi has witnessed a remarkable surge in its ridership since the pandemic. In 2021, BIXI experienced a record-breaking year with over 5.8 million trips taken by more than 200,000 users, marking a 74% increase from the previous year. In 2022, the number of individual users surged by 52% from the previous year, reaching almost half a million users (437,140). In May 2023, BIXI recorded a daily average of 51,176 trips, which is a 24% increase compared to 2022. During the same month, BIXI witnessed a record number of 67,000 trips taken in a single day [32].
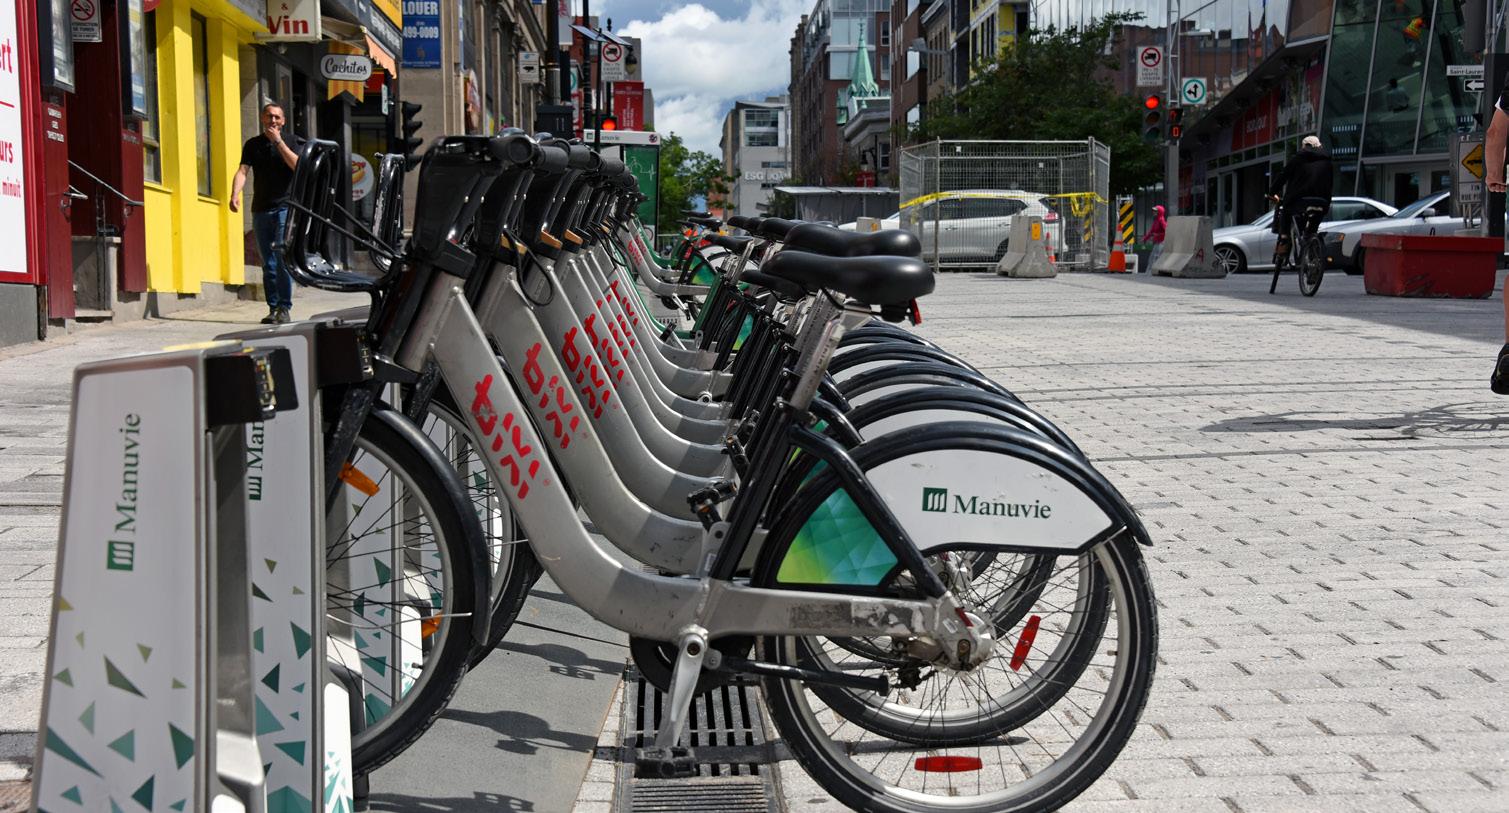
5.4.6 City of Vancouver, Canada
Vancouver's bike share system, Mobi, has seen a notable rise in users due to strategic expansion driven by user feedback and tailored surveys. In 2016, it started with 25 stations and 250 bicycles and has since expanded to 250 stations and 2,500 traditional bicycles, reaching across municipal boundaries and collaborating with various jurisdictions [22].
Recent additions of 500 e-bikes and expansion into crucial areas have boosted accessibility, as FGD data shows. Mobi's e-bikes provide multiple levels of e-assist and gear, accommodating various fitness levels. Safety remains paramount, with regular maintenance, safe battery handling and certified charging infrastructure.
Initially backed by the city's C$5 million investment, the Mobi bike share system’s revenue streams now include sponsorship, ticketing revenue and various stakeholders' involvement [22].
47
Figure 16: A BIXI bike-sharing dock in Montreal, Canada.
It is North America’s first large-scale bike-sharing system (PhotoCredit: Paul McKinnon/ Shutterstock.com)
The program model involves a transition where the city, an initial investor, has gradually reduced its role. Private operator Mobi has taken over operations, bicycle ownership and maintenance while the city maintains the infrastructure. This transition has significantly contributed to the program's success [22].
Simon Fraser University Department of Health Sciences conducted a study on the public bike share program, Mobi, in Vancouver in 2018, with over 1000 participants. The study aimed to measure the population-level effects of bike sharing on physical activity and transportation modes, to identify the characteristics and impacts of bike-share users on their health and travel choices, and to examine the barriers to bike-share adoption among different socio-demographic groups [33]. According to the 2018 survey results, the bike-share program was used as a substitution for 39 per cent of walking trips, 35 per cent of transit trips, 17 per cent of car trips and 7 per cent of personal bike trips. Most trips involved a combination of other travel modes such as bus or train. The main incentives for using bike sharing were health/exercise (45 per cent), accessibility of stations near home (45 per cent), proximity of destination (37 per cent) and lack of personal bicycle ownership (40 per cent). The main obstacles to using the bike share system were environmental factors such as bad weather (47 per cent), unavailability of docking stations at destination (29 per cent), challenging terrains such as steep hills (29 per cent), convenience of other transportation modes (24 per cent) and traffic safety concerns (22 per cent). [33]. The study provided valuable insights for the City of Vancouver on the needs, perceptions and trends of bike share users and potential users, and informed the development of strategies to increase bike share ridership.
While robust infrastructure remains vital, the practicality and user-friendliness of bicycles and e-bikes play a crucial role in engaging riders. A well-executed, integrated transit model is also pivotal. For example, ticketing-integration pilots and transit passes are underway in different municipalities of Metro Vancouver [22]. Incorporating bike parking and design becomes crucial during integration with existing transit systems. Forward-looking strategies for the Vancouver bike sharing program involve re-zone planning, targeted expanded sidewalk space, road development and essential power connections to support bike stations and electrical needs. These multifaceted initiatives aim to create a comprehensive urban mobility framework, shedding light on the complex factors that shape successful bike-sharing ventures [22].
Canada has a mixed record of success with bike-sharing services. Currently, only six cities in Canada have bike-sharing programs, with four of these being municipally led and two delivered by the private sector (Montreal, Vancouver, Toronto, Hamilton, Edmonton and Calgary). Montreal’s BIXI is the largest program with over 7,000 regular bikes and 1,905 e-bikes followed by Bike Share Toronto which has over 9,000 and 700 stations. Bike Share Vancover has over 2,500 bikes and 250 stations while Hamilton Bike Share has over 800 bikes and 100 stations. Edmonton and Calgary have bike-sharing initiatives which are privately owned. Edmonton’s current program is a two-year permit program with two operators, Bird Canada and Lime. Calgary has issued permits to two companies – Bird Canada and Neuron. Other bike-share programs in Ottawa, Kitchener and Victoria were discontinued due to cost and other operational issues.
48
5.5 Conditions for success and Limitations
E-bikes and bicycles are two micromobility transit modes with many advantages, disadvantages, conditions for success and limitations. E-bikes and bicycles can provide health benefits, reduce GHG emissions, save money and increase accessibility for users. However, they also have drawbacks such as safety risks, theft, vandalism, weather dependency and limited range.
The success of e-bikes and bicycles as transit modes depends on various factors, such as infrastructure, policies, incentives, culture and user preferences. E-bikes and bicycles also have some limitations, such as maintenance, battery charging, storage and integration with other modes. Human resources also pose a challenge in the industry, as security personnel, maintenance teams and cost-sharing agreements are required to manage a sustainable system.
There is also a shortage of urban planners and designers with micromobility experience. To mitigate this, various organizations experienced in urban and micromobility transit planning are taking steps to develop toolkits and educational resources to be shared at international level.
Therefore, e-bikes and bicycles can offer a viable and sustainable alternative to conventional modes of transportation but are unsuitable for every situation. Table 2 summarizes the conditions for success and limitations of bikes and e-bikes.
Table 2: Micromobility conditions for success and limitations
Conditions for success Limitations
Short to medium distances: E-bikes and bicycles suit short to medium distances.
Urban areas: E-bikes work well in cities with good infrastructure that includes bike lanes, flat terrain, docking stations and large central bike parking stations.
Integration:
E-bikes require integration with land use planning and transit services (routes, locations, fares) to develop a largescale network that can achieve critical mass.
Long distances:
E-bikes and bicycles may not be suitable for long distances.
Hilly terrain:
Riding regular bicycles on steep hills can be tough. E-bikes help but may still have limitations in very hilly areas.
Lack of infrastructure:
Using e-bikes and bicycles may be inconvenient and unsafe without bike lanes, racks or secure storage.
49
Conditions for success
Strategic partnerships:
E-bikes are effective when established under public-private partnerships that can leverage expertise and revenue streams to relieve demands on cities and taxpayers.
User experience:
Limitations
Cargo and passenger transport:
Carrying heavy loads or multiple passengers is challenging on bikes, but shared cargo bikes are available in some cities for grocery shopping or transporting children.
Ridership can be optimized through userfriendly apps and frequent charging stations that offer convenience and flexibility. -
In conclusion, bike sharing is a form of micromobility that can reduce traffic congestion, support public transit, advance urban climate goals and improve human health. However, bike-sharing systems must be designed and regulated to operate effectively in urban environments. This includes choosing between docked and dockless systems, determining the optimal locations and layouts of docking stations and service zones, setting the standards and criteria for e-bikes, and providing bike-friendly infrastructure such as lanes, signage, markings, speed humps and roundabouts. By considering these factors, cities and municipalities can implement costeffective bike-sharing systems that are appealing to users.
50
6 Ferries
6.1 Background
Waterways and coastlines have been essential factors for the development of many cities as they offer opportunities for economic growth in sectors such as trade and transport. Historically, ferry systems have been among the first forms of transportation shaping coastal and river-based cities. They lost their prominence with the growth of land-based transportation such as rail and cars, and the corresponding construction of bridges and tunnels [34].
In recent years, interest in water-based transit has been resurgent, driven by urban congestion and the desire for sustainability and supported by technological innovations that enable efficient, high-speed and eco-friendly ferry systems. This report presents the use cases, case studies and success factors of ferry systems and examines their practical applications.
6.2 Use cases
Waterborne transportation: Ferries are a suitable transportation option that can enable access to locations separated by water, especially when building bridges or tunnels for land-based transportation systems is not feasible. They can also provide a fast, efficient and more direct alternative to congested bridges and tunnels that are choke-points, bottlenecks and not well suited to transit buses, cycling or pedestrian traffic. They can be used in occasional crossings or on routes in urban areas for short crossings or trips as part of a transportation system.
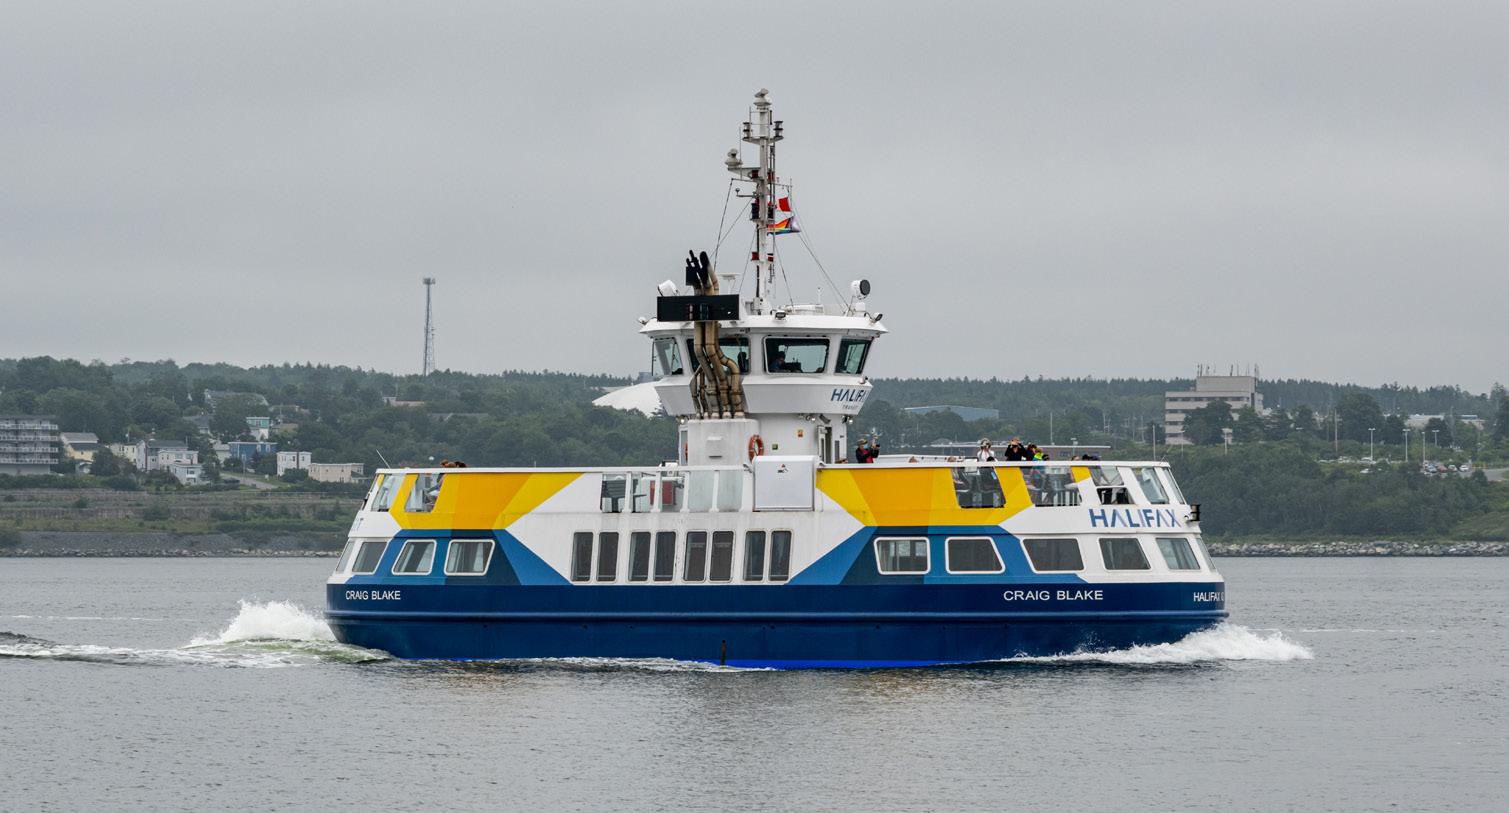
51
Figure 17: The Viola Desmond ferry operated by Halifax Transit in Halifax, Canada.
CHAPTER 6
(PhotoCredit: James Morehouse/MarineTraffic.com)
6.3 Core themes of ferries
Ferry services require careful analysis of core themes that will determine their feasibility. These themes are the foundation for evaluating the effectiveness of ferry systems. This section reviews ferry systems within the contexts of frequency and density, integration with other transit systems, route planning, infrastructural planning, user experience, costs, vessel design, global supply chain, technological development and labour requirements. Adopting ferry systems entails overcoming these challenges by fulfilling most if not all, essential conditions [35].
For this research, data has been collected through focus group discussions (FGDs) with the following stakeholders representing the transit industry:
● Halifax Transit: Halifax Transit in Canada has been operating a ferry system since 1994.
● Brisbane ferry system: Brisbane Ferries in Australia operates ferries via a private operator and has been operating the system since 2003.
6.3.1 Frequency and density
Maintaining a high frequency of ferry service is essential to maximize the value of the service to riders. High-frequency trips enable ferries to generate revenue to cover their operational costs. This must be combined with developing a business case that can achieve a viable service considering factors such as revenues (both fares and subsidies) and costs, such as labour, supplies, fuel, etc. Striking a balance between reduced onboard labour and maintaining lower operating costs is essential to achieve a ferry service's sustainability. For example, privately owned micro-ferries in Vancouver's False Creek or Brisbane’s water taxis are cost-effective because of their low operational costs and high-frequency services [36].
In dense urban locations, waterfront land is often valuable and scarce and may not be easily allocated for ferry purposes. Implementing park-and-ride options where commuters park their vehicles in designated parking spaces and then board the ferries can be challenging because waterfront land is often too expensive due to its value for transit agencies to use solely for parking purposes [35].
6.3.2 Connectivity to other transit
Ferries must be integrated into a multi-modal transit system that is well connected with (land) transit for a sustainable, viable, long-term transportation system. Ferry trips can involve multiple mode changes due to limited connectivity between ferry terminals and other services like buses, trains or subways. Convenient land access and frequently connected transit options are vital to ensure consistent demand throughout the day. These factors can act as substitutes for one another, but the most successful services demonstrate a combination of both features. Hong Kong offers its residents integrated ferries featuring a spacious ferry terminal that includes bus terminals. This is particularly noteworthy considering the premium on land and competing interests from developers seeking to construct residential and commercial properties. This
52
connected ferry system allows the city to provide a connected transit network for its users.
6.3.3 Route planning
Choosing a suitable routing system for contemporary urban ferries is essential. Three types of waterborne transit routes are available today – Type A, Type B and Type C [36].
Type A linear system ferries travel along rivers or water bodies and stop at multiple points of interest along waterfronts. This route type is increasingly favoured for its efficiency and waterfront development focus. The Älvsnabben service in Gothenburg, Sweden, uses it. However, Type A routes can lead to longer journey times due to terminal stops. Some cities such as Brisbane, Australia, employ split route configurations to minimize stopping times[36].
Type B ferry routes are characterized by shorter distances typically spanning only two or three stops and are often used for river crossings. An example is Copenhagen's inner-city cross-river services. These routes emphasize swift turnarounds and higher passenger capacity rather than focusing on providing on-board amenities. These routes are designed to efficiently transport passengers across relatively short distances, making quick trips essential. Additionally, since these routes are primarily used for short crossings, the need for onboard facilities is minimized, allowing reduced operational costs and more frequent and streamlined operations [36].
Type C routes link suburbs to the inner city and usually entail longer journeys. Achieving consistent demand outside peak hours is challenging for these routes due to their commutercentric nature and limited travel purposes. These routes are primarily designed to accommodate the needs of commuters travelling long distances and are associated with high operational costs [36].
6.3.4 Infrastructure planning of terminals
The strategic placement and design of ferry terminals are closely tied to their integration within the broader public transit network. Ferry infrastructure planning should avoid having many small terminals as it leads to insufficient frequency. Planning terminals to enable easy transfers between different modes of transport is essential. Terminal design should also optimize passenger loading and unloading times considering factors such as seating, ticketing machines, real-time information systems and accessibility for individuals with disabilities.
Some cities adopt double-ended vessels for swift turnaround times (Figure 19). Docks that allow side loading are common and efficient with a recommended embankment time of about 1.5 minutes at total capacity. Structural considerations come into play as well. While most cities have fixed wharves, the ports at Rotterdam in the Netherlands and Hamburg in Germany employ floating wharves that can be relocated for better integration with other transport. The debate continues whether temporary terminal facilities foster as much land use development as fixed terminals. Tidal conditions, like in Hamburg, require careful planning of terminal infrastructure and logistical operations due to tidal variations. Depending on local climate conditions, seasonal changes and potential flooding influence terminal design.
53
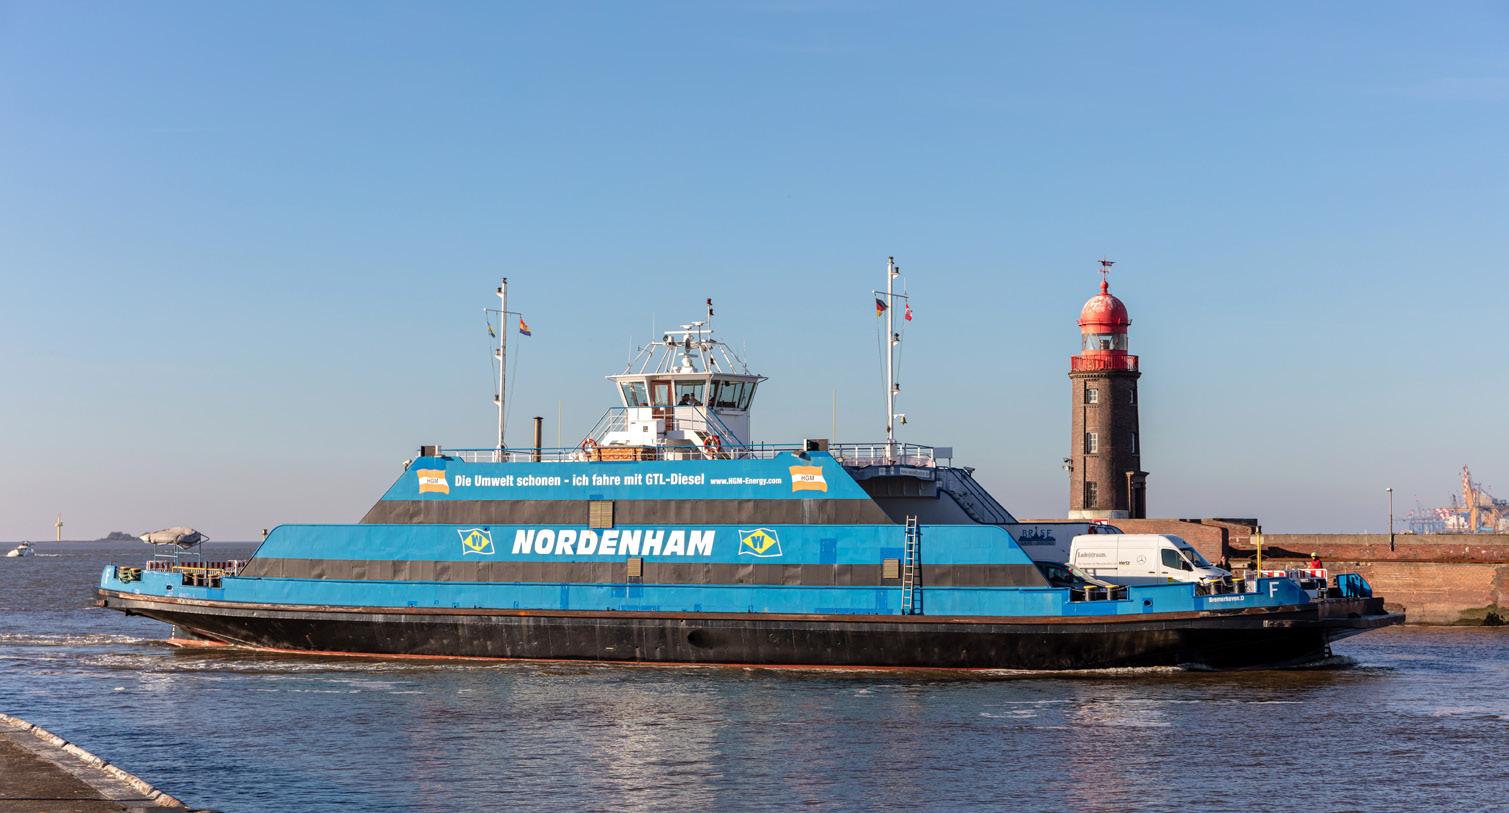
6.3.5 User experience
User experience and passenger accessibility are essential when planning terminal infrastructure. Terminal location and design are vital, especially in densely populated areas. Some cities such as Seattle with steep waterfronts and topographical variations face challenges with accessibility. Like successful land-based networks, the most reasonable solution for ferry infrastructure would be fewer stops with higher demand [36].
Fare cost is also critical when designing a ferry transportation system, especially if there is competition from land-based transport modes that use bridges and tunnels. The ferry must offer an affordable and complete journey including connections [35]. The mode share of waterborne transport could be higher even in cities with extensive public transportation networks. To increase ridership, cities employ strategies like high-speed express services (Sydney), onboard amenities (Rotterdam), and facilities catering to specific needs such as accessible access points (Auckland) and cyclist-friendly spaces (Gothenburg)[36].
Maintaining high ferry frequency is vital. User experience, accessibility, fare cost and strategies like amenities and targeted services boost ridership. Balancing travel time, capacity and amenities is complex yet crucial for satisfaction and competitiveness.
6.3.6 Costs
Like all other transportation modes, systems have different costs such as capital, operating and maintenance costs. Capital costs include purchasing or leasing vessels, docks, terminals and other infrastructure. Operating costs include fuel, wages, insurance, administration, marketing and other expenses related to running the service. Maintenance costs include repairing and maintaining vessels, docks, terminals and other infrastructure.
54
Figure 18: Nordenham double-ended ferry in Bremerhavn, Germany.
The ferry operates between Bremerhaven and Nordenham (PhotoCredit: Bjoern Wylezich/Shutterstock.com)
The cost of ferry systems depends on various factors, such as the route, passenger demand, season, speed, vessel type, amenities, marine conditions, docking facilities, regional context and operating model. The cost of ferry services may be higher for longer routes, higher demand, peak seasons, faster speeds, larger or more advanced vessels, more onboard amenities, rougher marine conditions, less available docking facilities or isolated regions. The cost of ferry service may also vary over time due to changes in these factors, as well as inflation, fuel prices, regulations and other external influences.
6.3.7 Vessel design
Various factors influence vessel design, including operating routes, traffic flow and climate conditions. Key considerations include stability during loading and motion against various wave directions, passenger accessibility and low resistance which is the ability of a ferry to move through water with minimal resistance, which results in lower fuel consumption and emissions. Globally, vessel designs encompass monohulls as found in Copenhagen, Gothenburg and Hamburg, as well as catamarans found in Brisbane, Amsterdam, London and Auckland. Certain cities like Rotterdam and Brisbane employ slender hulls to minimize wake impact and erosion, which is critical for urban waterways. Hull material selection is also crucial for consideration. Lighter hulls offer increased capacity, lower fuel costs and affordability, but at the expense of stability tied to the payload. Heavier hulls are favoured for year-round ice operations, while light hulls improve efficiency in non-ice conditions [36].
Material choices range from hardened steel to composite materials like aluminum and fibre. Vessels operating in icy conditions require robust designs for harsher environmental conditions. Ongoing projects, such as Waterway 365⁴ , explore innovative hull designs like the monohull design (Figure 19) and the air-cushioned hull (Figure 20).
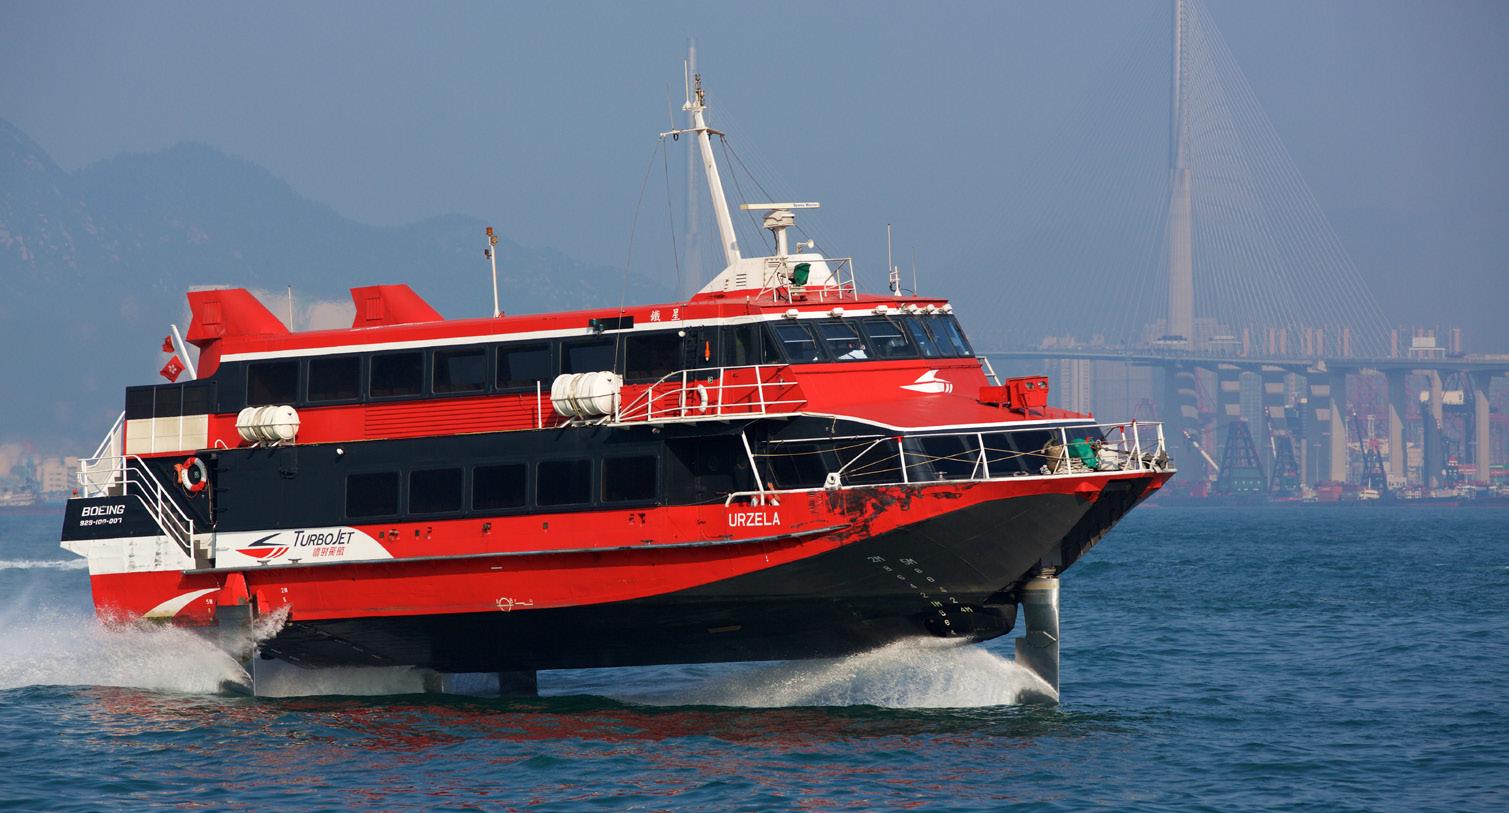
55
Figure 19: Monohull hydrofoil ferry in Hong Kong.
(PhotoCredit: David Peter Robinson/Shutter.com)
⁴ https://waterway365.com/
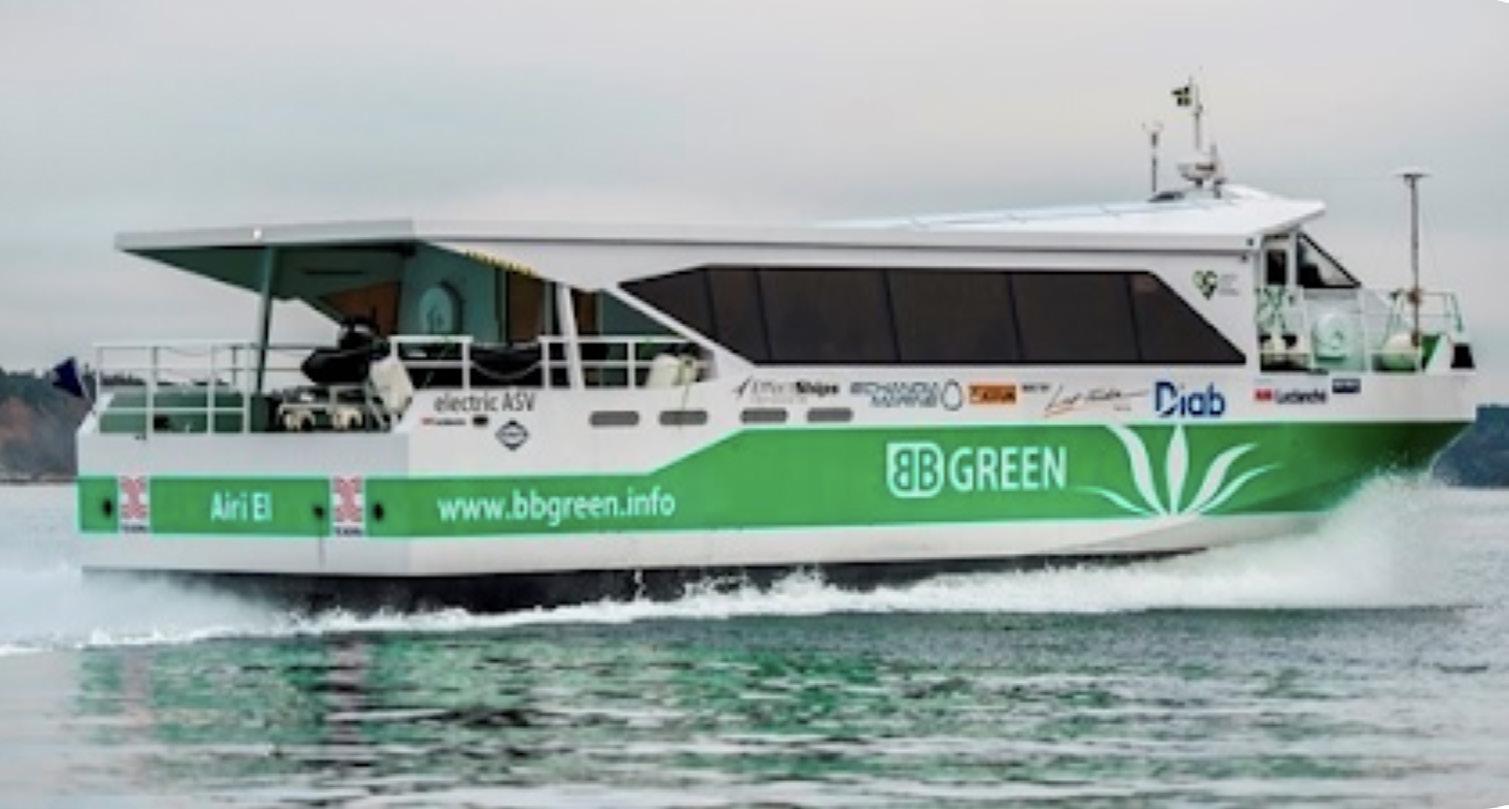
Internal passenger spaces play a vital role in design, such as accommodating seating, standing areas, bicycles, safety features, driver compartments, luggage storage and restrooms.
Sustainability dictates maintaining a high cabin ratio5 and passenger and bicycle capacity specifications to inform vessel dimensions. Such insights can facilitate modular design concepts for various route types, enabling customizations like foldable seats and collapsible cycle racks.
6.3.8 Global supply chain
The global supply chain is a substantial challenge for the ferry industry. Unlike other transit modes, such as buses, which benefit from a range of competing manufacturers and original equipment manufacturers (OEMs), the ferry sector faces a particular barrier. Only a handful of manufacturers specialize in designing ferries and vessels tailored to specific water systems and routes [36]. In addition, Canada does not manufacture ferries or parts for ferries domestically and relies on imports. As a result, this sector is highly dependent on global supply chains. This complicates the sourcing and acquisition of suitable vessels for ferry operations.
According to FGD data, differences between the ferry transit systems on Canada’s east and west coasts pose difficulty in optimizing the national ferry supply chain through joint procurement of vessels and components. The experiences and best practices from one coast are not applicable to the other due to varying characteristics of the ferries, the routes and the context.
Participants from the FGDs raised concerns about the potential electrification of ferry fleets. Close collaboration is imperative among OEMs, operators and regulatory bodies to successfully transition to electric propulsion. This collaboration is essential to navigate the complexities of the global supply chain, particularly in the context of integrating new technologies into existing
5 Whereby a ferry has a large portion of its interior dedicated to passenger cabins, lounges, seating and amenities, creating a pleasant onboard experience for passengers.
56
Figure 20: Air Supported Vessel (ASV) hulls in Stockholm, Sweden.
(PhotoCredit: Sandefjord/Shutterstock.com)
ferry systems. The relative lack of industry expertise in the nascent field of electrified ferry operations further underscores the need for coordinated efforts.
6.3.9 Technological development
Exploring zero emissions ferries is gaining momentum, as evidenced by interview data and research. Many transit agencies and cities actively engage in feasibility studies to convert their ferry fleets and associated infrastructure to emissions-free alternatives. One such prospect involves transitioning from conventional diesel fuel to hydrogenated vegetable oil (HVO), a strategy that echoes the success of Stockholm's bus fleet in emissions reduction. However, this shift is anticipated to substantially increase operational costs as HVO fuel can be 10 to 15 per cent more costly than regular diesel [37]. Another alternative is liquefied natural gas (LNG), as with BC Ferries. This has substantially reduced emissions and costs.
Advancements in propulsion technologies warrant exploration, and the maritime sector has witnessed several encouraging ventures. In Hamburg and Stockholm, aging vessels have been retrofitted to embrace hybrid electric propulsion. Similarly, hybrid vessels have harnessed solar power alongside conventional sources in Sydney and San Francisco. Noteworthy strides have been taken in Stavanger, Norway, where newly introduced hybrid electric boats integrate direct current (DC) grid systems, offering adaptability for future hybrid or all-electric conversion. Hamburg has introduced a ferry reliant on hydrogen fuel cells. Nevertheless, even as certain ferries now operate with minimal emissions, it is important to consider the holistic life cycle impact on the environment, including aspects such as battery production and disposal.
Exploring alternative propulsion methods, such as fuel cells and electric systems, is complex due to the interplay of infrastructural adjustments and fuel sourcing. In some cases, these factors can potentially render the transition economically unfeasible [37]. Existing technological limitations contribute to the design of heavy batteries and add much weight to the ship. While it is conceivable to counterbalance this heightened battery weight by expanding load capacity, this approach necessitates a thorough evaluation of factors like surface area and displacement. Although it is viable to maintain a higher payload alongside the battery's presence, this technology could inadvertently lead to increased resistance and higher energy consumption, underscoring the importance of a comprehensive assessment [37]. Some transit agencies have made progress in these technologies, such as Fjord1 and Boreal Sjø, which have commissioned electric ferries, as well as Norled, which commissioned the world’s first hydrogen-electric ferry in Norway.
Presently, many countries prioritize economic sustainability alongside environmental considerations. However, for certain countries, strategic climate goals or provincial directives coupled with subsidies drive the conversion of ferry fleets to zero emissions variants despite substantial initial investment and replacement costs. Such initiatives encompass vessel replacement and the overhaul of crucial infrastructure elements such as terminals, charging stations and connectivity networks. The transition towards zero-emission ferry solutions is marked by complexity and multifaceted considerations. The economic viability and technological
57
limitations intertwine to shape the trajectory of this transformation within the maritime sector. As ferry operators and transit agencies work to align environmental goals with economic sustainability, harmonizing these diverse elements remains pivotal to realizing a greener and more efficient maritime future.
6.3.10 Labour requirements
A key finding from interview data collected for this report is the complexity of finding qualified personnel with the skills and experience to operate the new-generation ferry systems. Integrating novel propulsion technologies requires a specialized skill-set that is not widely available – a hurdle to successfully implementing advanced ferry systems.
6.4 Global overview
This section provides a global overview of water transport, a non-traditional and innovative transportation option. Water transit systems like ferries use existing water bodies to provide travel experiences and address mobility challenges in various cities. Their ability to integrate into current environments and join broader transit networks adds value to urban mobility. In addition to promoting walking and cycling, water-based transit services can contribute to a more sustainable urban transportation landscape.
This report presents case studies from Europe, Asia and North America, drawing from reports, newspaper articles, peer-reviewed journals and government strategic plans.
In section 9, this report also briefly highlights other water-based transit alternatives, such as hovercrafts. Hovercrafts and ferries serve similar purposes but significantly differ in their contexts, implementation, applicability, costs and challenges. Therefore, they are not discussed here.
6.4.1 Hong Kong ferries
Running for the past 120 years, the Star Ferry is Hong Kong's oldest public transportation system. Supervised by the Hong Kong Government's Transport Department, the ferry system is crucial to access remote islands. Ferries constitute only five per cent of Hong Kong's transportation.
The Star Ferry network is one of the world's largest ferry systems, boasting 11 operators managing 18 licensed passenger routes connecting outlying islands and traversing the harbour. Ferry ticketing requires separate purchases and can easily be purchased online or at terminals. The Star Ferry network carries thousands of commuters between Hong Kong Island and Kowloon daily.
The vessel capacity of the Star Ferry ranges from 288 to 762 passengers, featuring amenities such as restrooms, cafés, bicycle racks and accessibility for persons with mobility challenges.
58
Operations run from 7:30 a.m. to 10:20 p.m., peaking at 7:30 a.m. to 9:30 a.m. and 4 p.m. to 6
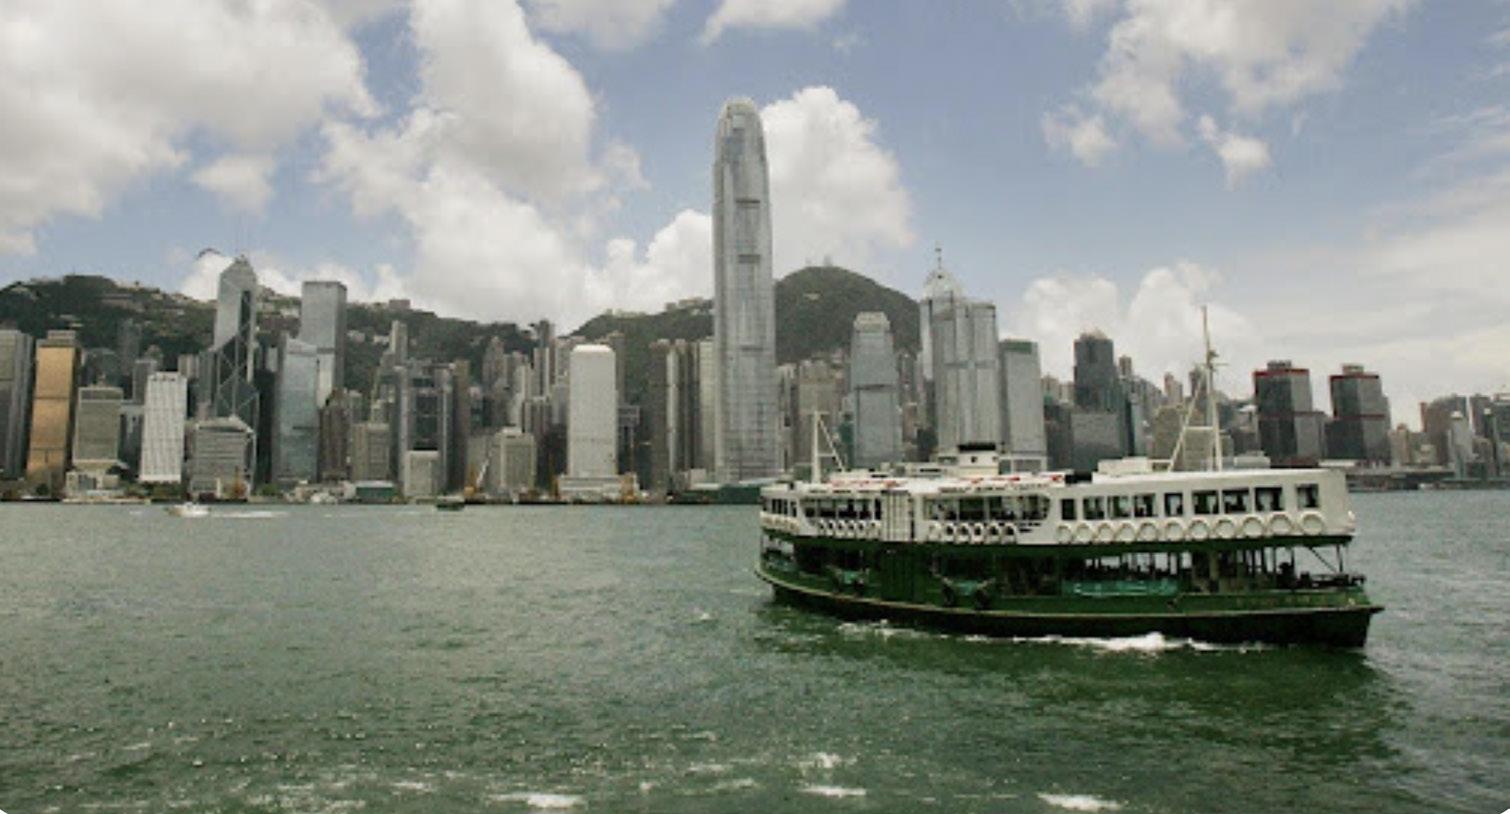
p.m., with ferries every eight minutes during peak and 20-minute intervals off-peak. Fares range from C$0.40 to C$0.67, with a C$2.16 bicycle transport fee [38].
The Star Ferry faces several challenges to its sustainability. Currently, the city limits vessel and terminal enhancements investments as it focuses on land-based transport modes. In addition, Hong Kong’s historical land reclamation policy through urbanization poses a significant challenge for ferry transportation as it may reshape waterways, alter terminal locations and affect waterfront access. These changes may impair the navigability, accessibility, convenience and attractiveness of ferry services as a transit system [39].
6.4.2 New York Staten Island Ferry
The Staten Island Ferry is a free passenger ferry service operated by the New York City Department of Transportation. It runs between the boroughs of Manhattan and Staten Island, covering a distance of 8.4 kilometres through New York Harbor. The ferry provides critical transportation links for underserved areas by transit and connects them to job centers, tech hubs and schools in and around New York City. The ferry boats make the trip in about 25 minutes. The service operates 24 hours a day, 7 days a week, with boats leaving every 15 to 20 minutes during peak hours and every 30 minutes at other times [40].
The ferry is the only non-automotive mode of transport between Staten Island and Manhattan. The service is used by almost 22 million people annually and transports almost 70,000 passengers daily between St. George on Staten Island and Whitehall Street in Manhattan. The New York City Department of Transportation is responsible for maintaining the ten-vessel fleet and numerous facilities, including the St. George and Whitehall terminals in Staten Island and Manhattan,
59
Figure 21: Hong Kong Ferries.
The Star Ferry network is one of the world's largest ferry systems
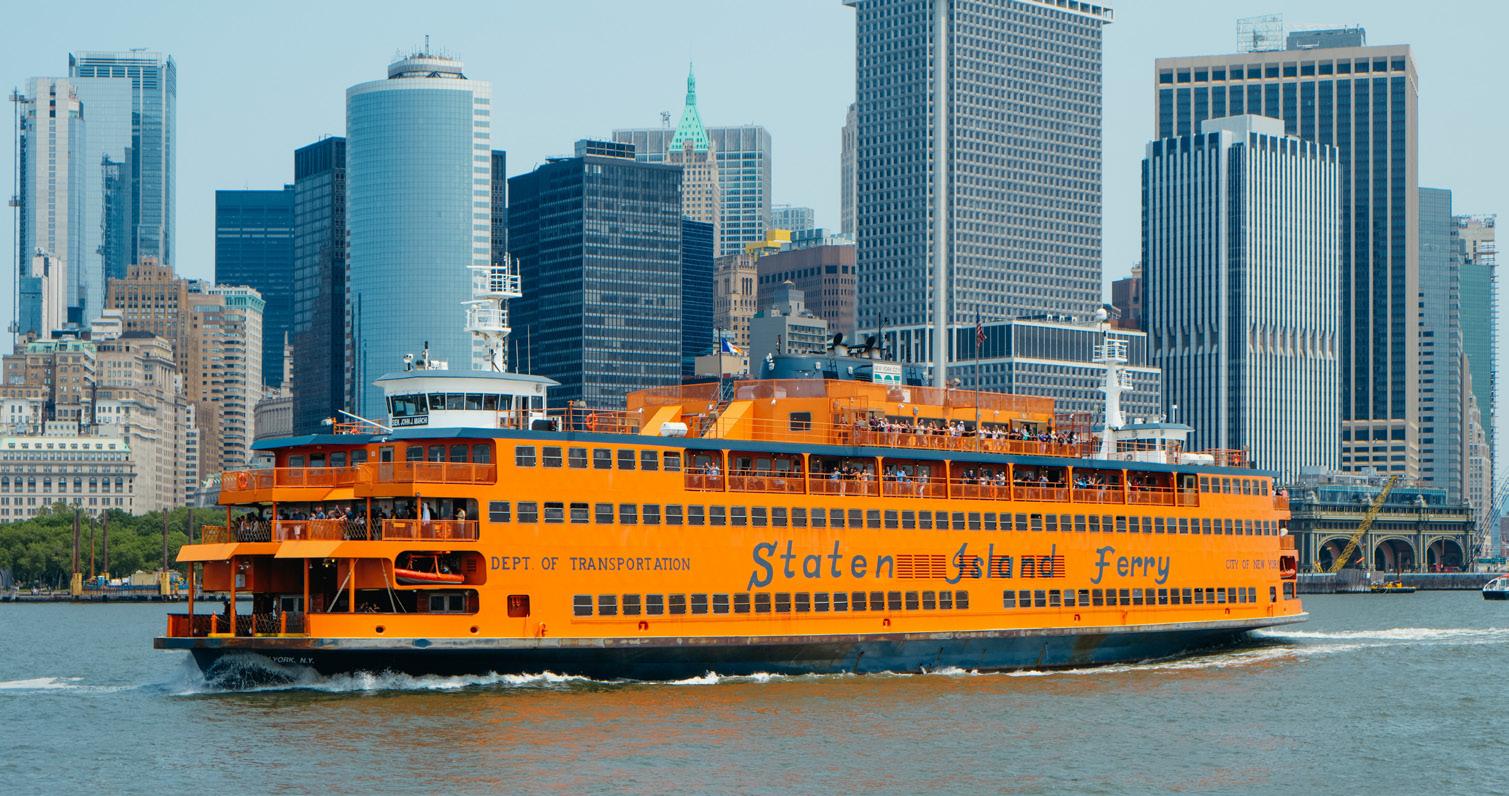
respectively [40].
6.4.3 Brisbane’s ferries
Operated by River City Ferries, a subsidiary of the SeaLink Travel Group6 – one of the largest ferry operators within the Australian transit system – this ferry service has established a prominent presence in Brisbane's transportation landscape. With a fleet of 30 vessels and an extensive network of 22 terminals along the meandering Brisbane River, the operation is a vital link between the City and Moreton Bay. The journey from one end of the route to the other spans 19 minutes, dictated by speed limits imposed on the river's waters. However, these limitations, while constraining, ensure safe and regulated operations. The management of this service follows a unique model, as River City Ferries takes on the dual role of both a transport provider for Brisbane and a self-funded entity responsible for infrastructure and vessel maintenance. While they receive an annual stipend from the state government – mandated by their legislative responsibilities to support public transport – River City Ferries outsources the day-to-day operation and maintenance of the service. This strategy aligns with focusing on efficient transportation rather than expertise in marine operations [41].
In their bid to offer a seamless travel experience, the company is upgrading their ticketing system, a transition necessitated by the shift away from cash payments due in-part to the lasting legacy of the COVID-19 pandemic. This integration reflects the broader trend of embracing e-mobility and interconnected transit options which have been integral to their success. Despite challenges stemming from the pandemic, including a significant drop in patronage – from five million trips before the pandemic to 70 percent capacity, or 3.5 million trips per year – the resurgence of international students and ridership, coupled with infrastructure improvements, has bolstered
6 SeaLink
60
Figure 22: Staten Island Ferry in New York, USA.
The ferry provides critical transportation links for areas currently underserved by transit (Photo Credit: Nito/Shutterstock.com)
the service’s recovery. The ferry system also faced a hiatus due to a flood in 2022, requiring
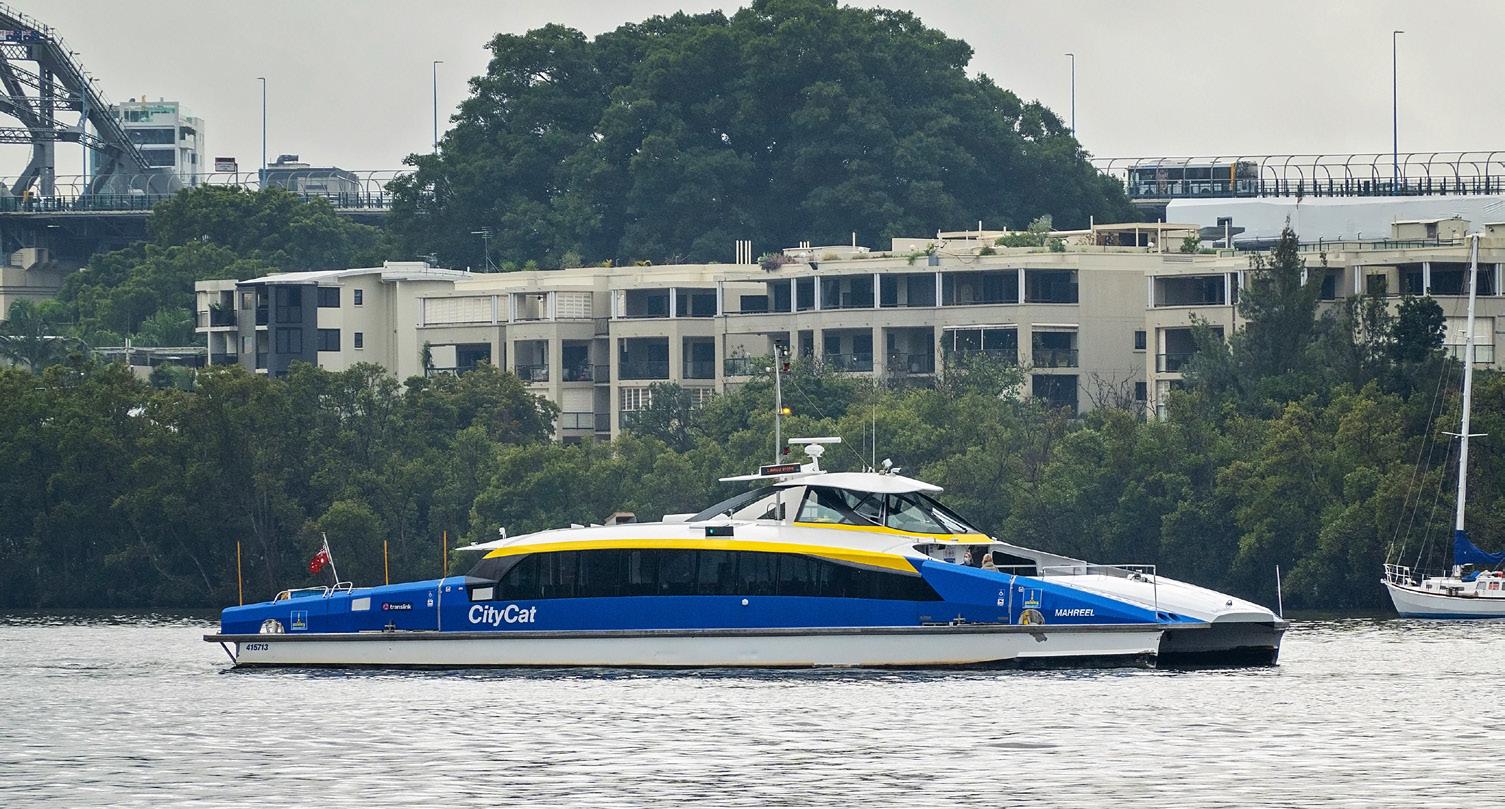
a year to restore full functionality. River City Ferries is integrating with the broader transport landscape to regain ridership and collaborating with private operators to introduce micromobility solutions, thereby fostering healthy competition and innovation within the transport ecosystem [41].
6.4.4 Copenhagen ferries
The public transport network in Copenhagen is efficiently managed by Movia, Denmark's largest public traffic authority. One of its notable components is the harbour buses integrated into the broader public transportation framework. These harbour buses, overseen by the local transportation department, operate alongside metro rail and bus services. The ticketing system facilitates smooth transfers between different modes of transportation.
The city's ferry system encompasses two distinct route types – A and B – connecting three ferry routes with 10 terminals. Three lines traverse 10 destinations across the harbour bus network, facilitated by a fleet of four vessels. These vessels accommodate between 64 to 80 passengers and 20 bicycle spaces and offer accessibility to passengers with disabilities.
Over time, the popularity of these boats has surged, amassing over half a million passengers yearly. This surge is particularly prominent during the summer months, with passenger numbers experiencing a growth of approximately 10,000 per month in the last few years. During the summer, Saturdays witness up to 3,500 passengers using the harbour buses. This reflects the importance of seasons and weather conditions for ridership in ferries. The terminal provides full accessibility to individuals with disabilities. Operating hours for the harbour buses extend from 7 a.m. to 11 p.m. with a consistent frequency of 40 minutes throughout the day. The fare for traversing the entire route is a fixed C$4.95. An additional cross-river line operates on an
61
Figure 23: City Cat in Brisbane, Queensland, Australia.
Over 21,000 passengers used the CityCats and ferries daily before the COVID-19 pandemic. (PhotoCredit: Jackson Stock Photography/Shutterstock.com) )
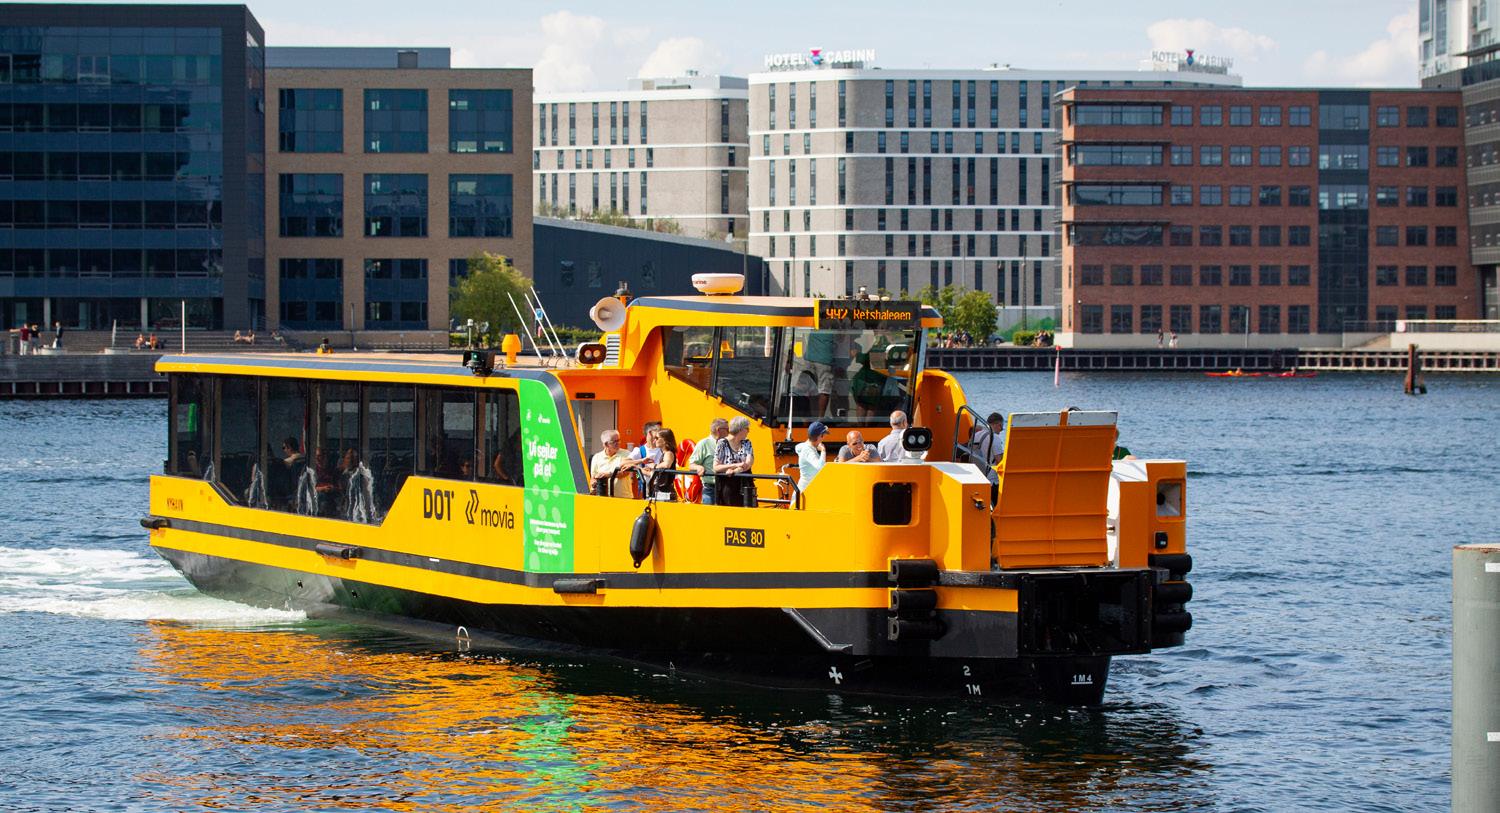
as needed basis, primarily catering to patrons of the waterfront opera house. This ferry system plays a pivotal role in supporting land development initiatives tied to the regions served by the boats, all while enjoying substantial popularity among tourists. The harbour buses which are also managed by Movia, are integrated into the city's transport network. Alongside metro and bus services, these buses facilitate direct transfers without extra charges.
6.4.5 Halifax Transit’s ferry system
This section presents a Canadian case study based on FDG data from Halifax Transit, a Canadian transit agency that has been running successful ocean ferries for many years. Halifax Transit's ferry system is one of the oldest in the world, with a history of 271 years of operation. Halifax Transit emphasizes its commitment to expanding its service and adopting eco friendly technologies. The strategic focus is on broadening ferry services and potentially introducing new routes while prioritizing environmental sustainability.
A distinctive aspect of Halifax Transit's ferry system is the fleet's diversity and design, which are purposed for short trips. Halifax Transit’s ferry services are emblematic of a holistic approach to public transportation, epitomizing a dedication to seamless mobility solutions. The ferry service is seamlessly woven into the city’s broader transit framework, providing vital connections across different regions within Halifax. The ferry trips extend to the Halifax ferry terminal which has been standing for 40 years. Although its original costs are unavailable, the agency is currently making funding appeals and grant applications for future maintenance, upgrades and service expansions.
For instance, the Alderney Ferry facilitates transit from Halifax to Alderney Landing in downtown Dartmouth, while the Woodside Ferry connects Halifax to the Woodside neighbourhood, home
62
Figure 24: Fully electric public water bus ferry in Copenhagen, Denmark.
The city relies heavily on its waterways as part of its public transportation system where ferries, known as harbour buses, transport pedestrians and tourists across 11 stops between the Royal Library, Nyhavn, Opera, the Little Mermaid Statue and Refshaleøen. (PhotoCredit: Oleschwander/ Shutterstock.com)
to middle-income families. This integration furnishes residents and visitors with efficient transportation alternatives, supported by integrated mapping for route planning that encompasses
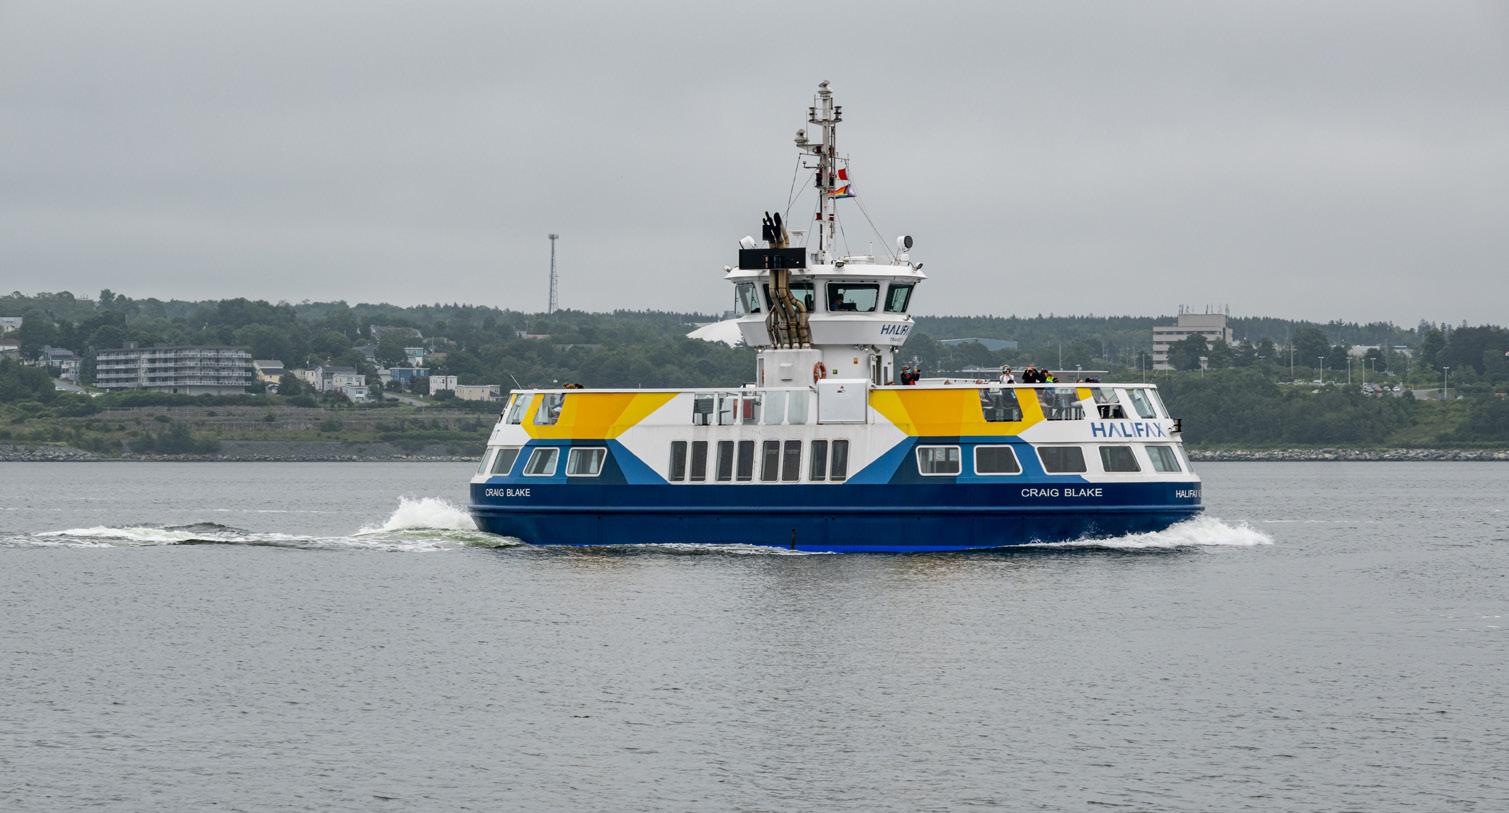
both ferry and bus routes. Transit hubs are strategically positioned to enable effortless transfers, complemented by multi-modal passes that enhance affordability. Service alerts are diligently issued to keep passengers notified of any operational changes. The ferry adheres to the same fare structure as buses, accepting universal payment options such as transit passes, reflecting Halifax’s commitment to a sustainable and inclusive transit network that addresses a spectrum of commuting requirements.
Halifax Transit employs data-centric methodologies to inform its strategic planning, ensuring alignment with the city’s ridership demands. Collaboration is a fundamental aspect of prospective partnerships and route expansions. Workforce development is also critical, with a national shortage of specialized skills impacting staffing. These challenges and rigorous safety standards highlight the distinctive nature of ferry operations.
In brief, Halifax Transit’s ferry system combines years of operational experience with progressive strategies. Motivated by innovation, empirical data and potential alliances, the objective is to cultivate a sustainable, integrated ferry service that responds to the community's transit needs and contributes to the city’s vitality.
6.5 Conditions for success and limitations
Ferries are a type of transit system that can serve specific contexts where they offer optimal benefits. However, they also have inherent limitations and require careful planning to ensure their successful operation. The factors that influence the success and limitations of ferry systems are summarized in Table 3.
63
Figure 25: Halifax Ferry in Halifax, Canada.
The ferry is the oldest salt-water passenger ferry service in North America (PhotoCredit: Marc Bruxelle/Shutterstock.com)
Conditions for success
High frequency:
Ferries should operate on routes that have high demand. This involves identifying the most popular destinations and the potential market for rush-hour commuting.
Accessibility:
A ferry system also requires establishing terminals in locations that are easily accessible, preferably without any steep slopes.
Distance:
Ferries are more suitable for short- to medium-distance journeys.
Integration:
Ferry systems need to be integrated with other transit systems to attract all-day demand. This means providing seamless connections and coordination with other modes of transportation, such as buses, trains or bikes.
Competing transit systems:
A competitive strategy for ferries is to focus on market segments where they have a clear edge over land-based transit modes, such as rail or bus. These segments are typically characterized by significantly shorter travel distances or times for ferries.
Limitations
Weather:
Extreme weather events, such as storms and floods, pose a major risk to ferry services. They can cause damage to the infrastructure, disrupt schedules, and affect the safety of the passengers and crew.
Costs:
Ferry systems may entail high costs when considering initial investment operating and maintenance costs, although this depends on factors such as location, distance, type of vessels, marine conditions and the availability of docking stations.
Supply chain:
Importing specific vessel parts can cause delays and increase costs. Maintaining the vessels can also be difficult and timeconsuming.
Ridership:
Ferry systems may struggle to attract and retain passengers, depending on the pricing, ridership and subsidies. Securing adequate funding can also be difficult, as the fare revenue may not cover the costs of the service.
64
Table 3: Ferry conditions for success and limitations
-
Ferry systems are a mode of transportation that can offer several advantages, such as reducing congestion, enhancing mobility and providing more direct service. However, they also face several challenges, such as sensitivity to extreme weather, high operating and maintenance costs and high dependence on global supply chains. Therefore, ferry systems require careful planning, design and operation to ensure their feasibility, reliability and sustainability. Ferry systems can be a valuable addition to the transportation network, but they also need to be integrated with other modes of transportation and adapted to the local context and needs.
65
7 On-demand public transit solutions
7.1 Background
Conventional transit services with fixed routes and schedules often fall short of meeting the travel preferences of potential riders. On-demand transit offers adaptable and personalized ride services based on passenger demands. Diverging from conventional fixed-route services, ondemand transit allows passengers to ride when needed, often through mobile apps, websites or phone calls. This approach offers flexibility, convenience and efficiency in transportation, especially in areas with lower population density and during off-peak hours. This is also important in urban settings because smart algorithm technology used for on-demand transit helps find the quickest ride routes based on what passengers need. Integrating with existing bus and rail networks enhances first-kilometre and last-kilometre rider connections.
On-demand transportation also has the potential to lower operational costs, boost ridership and revitalize traditional transit methods, as discussed in more detail below. On-demand transit encompasses a range of vehicle types, including buses, vans and private cars, all designed to bridge gaps in traditional public transportation systems [42]. The success of on-demand transit hinges on providing convenient, streamlined, secure and reliable mobility systems that benefit individual travellers and allow operators to deliver efficient services [43].
Privately run ride-hail sharing solutions, such as Uber and Lyft, are also a solution for meeting the travel preferences of potential riders. User demographics show that younger people from varied socioeconomic backgrounds are most likely to use these services for convenience. Transit emerges only sometimes as the first alternative for ride-hailing users, as personal vehicles often remain a primary choice of mobility [44]. However, there is potential for on-demand transit to compete with ride-hail systems. Riders could use on-demand transit when ride-hail services are at their peak, when ride-hail fares are higher, or when on-demand transit provides a more complete first/last kilometre transit service. This is because, when travellers do choose to substitute transit for other options in an urban setting, timesaving and convenience are often the key motivators.
66
CHAPTER 7
7.2 Use cases
● Complementing existing transit: On-demand transit can supplement existing transit services, providing coverage in areas when traditional fixed-route services are less efficient or unavailable.
● Serving communities and destinations without existing transit: On-demand transit can provide a valuable service in communities that have never had transit before, offering a new mode of transportation for residents.
7.3 Core themes of on-demand transit
For this research, data has been collected through a focus group discussion (FGDs) with the following stakeholder representing the transit industry:
● York Region Transit : is the regional public transportation service provider for the nine municipalities that comprise York Region, Ontario. It also offers inter-regional connections with the City of Toronto and the Regions of Peel and Durham.
7.3.1 Project and program models
Research indicates that many on-demand services have emerged due to declining ridership in traditional transit systems. This has prompted transit agencies to explore and implement on demand alternatives. An optimal operational setup for on-demand transit involves transit agencies owning the fleet while third-party operators oversee vehicle operation. This configuration is particularly relevant for agencies with a diverse vehicle roster, including vans, 18-foot vehicles and minibuses, with specific operators assigned based on bus size. Additionally, some agencies need more partial fleets, with third-party operators owning and managing the entire fleet.
The role of third-party private operators can be considered important for project efficiency in on demand services. The transit industry is built around features like standardized fleets and strict workforce schedules, maintenance schedules, scheduled and fixed services, predictable operating plans and routes designed to maximize coverage. Managing on-demand services in this context can be challenging. Private operators can play a vital role in enhancing project efficiency, as they have the flexibility to adapt to changing demands and complexities, such as engaging stakeholders (like software developers) to design on-demand platforms offering various service models.
7.3.2 Technological development
Until recently, on-demand transit services have been largely focused on those riders with accessibility needs through paratransit services. A feature of these services is that users are mostly required to make reservations days ahead of their trips through phone calls with
67
operators manually coordinating the schedules to access on-demand transit. The evolution of mobile technology and communications such as smartphone applications in the transit world has transformed usage potential in the area of on-demand transit [45]. Users can request and book rides online while keeping track of vehicle locations in real-time via smartphone applications. This technological advancement has also shifted vehicle dimensions, allowing more compact options for transporting smaller groups [46].
On-demand transit also improves accessibility by addressing the needs of individuals with disabilities or mobility aids. By adjusting vehicle sizes and routes based on user preferences, on demand transit blurs the line between conventional public transit and shared mobility services.
FGD data show that “on-demand” applications often integrate trip planning and booking across transportation modes. Advanced algorithms driven by real-time data, such as passenger demand and traffic conditions, optimize routing and scheduling and enhance efficiency and resource allocations. Data sharing through applications empowers third-party developers to create innovative software tools that promote better accessibility. RideCo, a company that provides on demand transit software and solutions for paratransit and micro-transit services, developed a Capacity Configuration Optimizer technology that integrates paratransit with on-demand services, adjusting seat configurations in real-time according to the needs of passengers [47]. A transit agency with paratransit passengers using wheelchairs or scooters can prioritize specific configurations to accommodate their ridership.
Across North America, transit agencies in Las Vegas, Antelope Valley (California), Loudoun County (Virginia), Cobourg (Ontario) and Porter County (Indiana) are adopting RideCo's on demand transit software for their paratransit services [48].
7.3.3 Accessibility and remote areas
Public transit systems excel at moving large groups of people to specific locations but often lack first-kilometre/last-kilometre connectivity. Meeting the public transit needs of smaller communities requires overcoming challenges associated with low population density, inadequate infrastructure, limited demand and driver shortages. The responsibility placed on passengers to find their way to and from transit stops is especially challenging for marginalized groups, such as people with disabilities and low-income individuals who don’t own vehicles [49].
Some agencies use on-demand transit to augment regular service or reach areas not served by transit. Some are replacing poorly performing bus routes with on-demand services, while others offer transit for the first time.
In Cochrane, Alberta, the local transit system adopted Cochrane On-demand Local Transit (COLT) after considering traditional fixed route options over several years. COLT is a system that is a fully on-demand, stop-to-stop transit service that offers affordable, accessible transportation to the community. It is one of Canada's first fully on-demand transit services and provides the community with eight buses and over 150 stops. Passengers can request stops via a mobile app,
68
website or phone call. COLT focuses on affordability, inclusion and accessibility by employing wheelchair-accessible buses and provides options for those without smartphones or computers to book rides by phone. With reasonable monthly pass prices and a flexible contract structure based on vehicle hours, COLT efficiently adjusts its services during the COVID-19 pandemic, maintaining operations despite decreased ridership [50]. Cochrane emphasizes proactive public consultation throughout the planning of COLT. The town ensures that the resulting system meets the community's needs by involving residents early in the design process [64].
Cochrane’s transit system is designed to scale alongside population growth with the potential for fixed routes or taxi services to enhance mobility-as-a-service offerings over time. COLT's positive impact on the community is evidenced by its improvements of seniors' and youth's access to social activities, work and education [50].
7.3.4 Public-private partnerships
Partnerships with private sector providers are vital for on-demand transit. Private firms provide funds, expertise and technology for quicker system development which is crucial when public funds fall short. Sharing technical, financial and operational lessons with private firms helps mitigate future risks. Advanced technology boosts on-demand transit efficiency. Private involvement streamlines operations, saves money and improves service quality. Transit agencies often outsource these services due to their complexity, especially in off-peak times and areas where traditional transit is unavailable. Private partners may also aid in revenue generation, reducing the burden on public funds. In summary, public-private partnerships can greatly benefit the community by helping to create more user-focused, on-demand transit.
7.4 Global overview and case studies
7.4.1 Kutsuplus, Helsinki
Helsinki's Kutsuplus was renowned for its innovative, technology-driven, on-demand transit. The Helsinki Regional Transport Service ran a technology-driven minibus service that used advanced algorithms to assign vehicles based on passenger demand on a real-time basis. The initiative entered active service in 2012 with a fleet of three dedicated minibuses. Kutsuplus allowed commuters to specify an origin and a destination point within a defined service area, and the algorithm would identify a minibus travelling in that direction and instruct its driver to pick up the new passenger [51].
Kutsuplus was launched to test the technological feasibility of computer-based routing and measure public support and willingness to pay for on-demand public transport. Not only did the service receive public support with positive feedback and continual growth in ridership, but passengers were willing to accept longer travel times overall during a journey, if the service was more readily available rather than waiting longer at the start of a journey. This finding helped operators to revise the algorithm used for bus routing to minimize wait times on pickup, resulting
69
in a considerable increase in the number of users.
However, Kutsuplus faced two significant challenges – financial strain to continue such a vastly subsidized service and scalability. To increase ridership, the system needed to provide a more appealing service covering a larger area, longer operating hours and shorter waiting times at pick up. While some improvements in service quality were achieved, large-scale service increases required the purchase of extra vehicles, which was not feasible. The project was discontinued at the end of 2015 [51].
7.4.2 Leduc, Alberta
Over the past decade, Leduc, Alberta, has experienced a population growth from 24,279 in 2011 to over 34,500 in 2021. This population change has strained the city's services, including its traditional transit system launched in 2014, which had limited coverage of 42 per cent of the city’s geography.
To address these gaps and meet the growing demand for transportation, Leduc Transit replaced four local fixed routes with an on-demand service in the summer of 2021. This change transformed the transit landscape for Leduc residents. They now benefit from 100 per cent coverage with 450 flexible stops across the city, as well as fixed stops at Leduc Business Park and Nisku Business Park [52]. Unlike its previous peak-hour-only service, Leduc’s transit is available from Monday to Friday between 5:00 AM and 7:00 PM. The transition to on-demand transit increased ridership with over 30,000 people transported to date. In the first year of the on-demand service (June 2020 to July 2021), there was a 252 per cent increase in ridership. Cost per passenger dropped by 47 per cent, decreasing from C$51.72 to C$27.60 [52].
On-demand transit has been particularly effective for smaller urban centres like Leduc. It simplifies the placement of stops since it uses flexible and virtual stops that can be adjusted as needed. This flexibility also aids businesses that have employees in need of transportation solutions. Virtual stops can be set up right by workplaces, ensuring reliable transportation five days a week. Additionally, on-demand transit offers significant operational cost savings due to the use of smaller, car-like shuttles, eliminating the need for large transit buses.
Leduc's on-demand transit system uses technology from Pacific Western Transportation and the Pick-Up On-Demand mobile app powered by RideCo. Passengers can book trips up to two weeks in advance or using the on-demand app, a web portal or phone services. The transition to on demand transit has been so successful that Leduc Transit is exploring options to expand the service to weekends in the future [53].
On-demand transit has proven to be a cost-effective, flexible and efficient solution for communities like Leduc. It can offer 100 per cent jurisdictional coverage and significantly boosted ridership while lowering costs per passenger. It has become a blueprint for municipalities looking to improve their transit services.
70
7.4.3 York Region Transit, Ontario
FGD data based on interviews with York Region Transit (YRT) highlight the origins of the region’s on-demand service, which was initiated as a strategic response to ridership decline experienced during the pandemic. In collaboration with a software company, YRT has developed a flexible on demand platform encompassing various service models. The service provides a crucial link for passengers needing to get to the nearest fixed route stops. Amidst the pandemic, YRT has also implemented a fixed-route replacement model to adapt to shifting transportation needs in the community. Beyond these innovations, YRT manages a GO train shuttle service and offers transportation to specific predetermined addresses within its service area. Importantly, all these services are harmonized with the larger fixed route network. Despite facing a staggering 91 per cent decrease in ridership from May 2019 to May 2023, YRT continues to meet the transportation needs of its commuters. A 2023 Transit Initiatives report released in September 2023 indicates that YRT’s ridership is recovering more rapidly than expected, with current levels approaching 90 percent of pre-pandemic figures [54].
Initially, YRT’s on-demand service encountered challenges and required substantial promotion to gain traction. It has since experienced increased usage but has not yet returned to pre-pandemic levels. YRT is dedicated to further developing its on-demand model, particularly serving transit passengers in rural regions. Notable collaborative projects include a pilot GO Transit service with the City of Vaughan and Metrolinx. YRT also faces obstacles in data collection to identify the most pertinent information but has made significant advancements in this area.
From a fleet perspective, YRT boasts an array of diesel, gas and electric buses in its current fleet. Electric vehicles are being pilot-tested for on-demand services, providing valuable insights into their operational range and capacity within YRT’s transit environment.
From a cost management perspective, integrating on-demand services with paratransit has also proven cost-effective, negating the need for a separate fleet. This strategic approach is consistent with YRT’s objective of upholding high standards of service across all vehicles. Performance based contracts with service providers ensure strict compliance with maintenance schedules and vehicle age regulations, fostering a commitment to exceptional service quality.
YRT has become essential in serving remote and sparsely populated areas with low transit demand, effectively augmenting fixed routes. YRT works closely with municipal planning and engineering departments to explore opportunities for expanding on-demand services.
Private sector participation has been instrumental in YRT’s transit initiatives. One of YRT’s contractors is actively involved in a partnership to pilot electric vehicles, demonstrating the system’s dedication to innovation and service enhancement. YRT also partners with private companies to provide shuttle services, primarily transporting individuals from subway stations to their workplaces.
Currently, YRT does not extend services to newly established businesses outside existing routes.
71
While YRT does not conduct specific marketing campaigns targeting businesses, it maintains a cooperative relationship with the regional economic development team. This partnership enables YRT to promote transit services when significant businesses enter the region effectively. When a new location is established, YRT evaluates the potential for service extension based on various factors, including demand and alignment with its strategic objectives.
7.4.4 Belleville, Ontario
Belleville’s on-demand transit is an innovative transportation system that leverages technology to provide flexible and responsive transit services. It showcases a successful partnership between public and private stakeholders that has supported the implementation of a transit program that meets the community's changing needs. This on-demand transit model has demonstrated resilience and adaptability in the face of pandemic challenges.
In 2018, Belleville Transit partnered with Toronto-based software company Pantonium to revolutionize bus systems by introducing the region's first-ever on-demand transit system. This innovative approach aimed to overcome fixed route limitations by optimizing bus deployment based on real-time passenger demand. This initiative gained popularity, and in 2020, Pantonium secured over C$2 million in grants from Sustainable Development Technology Canada to develop further and deploy Pantonium’s EverRun On-Demand Transit software [55].
As general ridership dropped during the initial lockdown period of the pandemic, Belleville Transit transitioned to a fully on-demand bus format. This adaptation enabled crucial trips to essential destinations and frontline jobs, offering free transit services to passengers. Although regular bus operations have resumed, a night-time on-demand bus service remains. Unlike prior routes that covered the entire circuit regardless of passengers, the Belleville On-Demand system now delivers precise, demand-driven service and is a model of efficient transit, especially for cities with scattered populations [56].
Belleville On-Demand Transit exemplifies collaboration between public and private sectors in establishing a technology-driven, on-demand transit adapted to the challenges brought on by the pandemic. This on-demand system optimizes bus deployment based on real-time passenger demand and has gained recognition from the Transport Research Board for its environmental benefits [56].
7.4.5 Durham Region Transit, Ontario
During the pandemic, Durham Region Transit (DRT) implemented a micro-transit strategy as part of its five-year plan. In September 2021, DRT expanded on-demand bus services, replacing 25 local routes with urban on-demand transit zones spanning 2,525 square kilometres.
This innovative solution enhanced travel times and rider convenience while adjusting to shifting commuting patterns [57]. This micro-transit model allows passengers to book rides through phone calls or dedicated apps, with options ranging from full-size buses to shared vans. Customers
72
can transfer between on demand services and other transit routes, including GO Transit. DRT's implementation of on-demand service also enables transit access in new residential and business areas before reaching minimum density targets, providing greater mobility flexibility and accessibility.
7.5 Conditions for Success and Limitations
On-demand service has its own set of challenges. On-demand systems may not serve all areas equally. Additionally, pricing structures can create accessibility issues for low-income individuals.
Conditions for success
Low-density areas:
On-demand transit services must offer a reliable and efficient public transportation option for low-density areas where fixed-route services are ineffective. These areas, such as suburban or rural areas, may have dispersed populations and low travel demand.
Flexible and adaptive service:
On-demand transit services must develop and deploy service models that are flexible and adaptive. These models should allow customers to customize, personalize, and optimize their trips based on real-time demand, traffic conditions, and customer feedback.
Increased accessibility:
On-demand transit services must integrate with the broader transit system to provide services to a wider range of customers. This may include customers who need to travel longer distances, who need to transfer between different modes of transportation, or who need to access specific destinations that are not covered by on-demand transit services alone.
Limitations
Base level of demand:
A minimum level of demand is required for on-demand transit systems to be viable and sustainable. This requires a critical mass of customers who use the service regularly and generate sufficient revenue to cover the operation costs.
Costs:
On-demand transit systems need to manage their costs effectively to provide affordable and competitive services to customers. This may include the costs of acquiring and maintaining vehicles, the costs of hiring and training drivers, the costs of developing and deploying software and hardware, and the costs of marketing and advertising the service.
Operating demands:
On-demand transit systems must manage their operating demands effectively to provide reliable and convenient customer service. This may include the demands of real-time routing and scheduling, the demands of customer service and support, the demands of driver management and training, and the demands of data analytics and reporting.
73
Table 4: On-demand transit conditions for success and limitations
Conditions for success
Affordable and transparent pricing:
On demand transit services should provide affordable and transparent pricing options that balance quality and affordability for customers.
Safe and reliable service:
Limitations
On-demand transit services should ensure the safety and reliability of their services by implementing appropriate measures for driver screening, vehicle inspection and emergency response. They should also inform customers promptly about service disruptions, delays and cancellations. -
User-friendly interface:
On-demand transit services should design user-friendly interfaces that allow customers to book, track, modify and cancel their trips.
-
-
74
8 Autonomous Vehicles
8.1 Background
This section of the report offers a comprehensive scan of the worldwide market for autonomous shuttles or autonomous vehicles (AVs) for urban transit.
AVs use sensory tools as well as localization and navigation technologies to operate on roads without direct human control. AVs employ technologies such as Light Detection and Ranging (LiDAR), Radio Detection and Ranging (RADAR), Dedicated Short Range Communications (DSRC), cameras, ultrasonic sensors, inertial measurement units, infrared sensors, and most recently, artificial intelligence to detect objects in real-time [58]. Multiple sensory technologies are used for redundancy and risk reduction. Data from these sensors are processed through "sensor fusion" in the central vehicle computer, which constantly develops due to the vast realtime data inputs [59].
AVs also rely on navigation and localization systems to position themselves and navigate established road networks. These include high-definition mapping, global positioning system (GPS), global navigation satellite system (GNSS), real-time kinematic (RTK) positioning, cameras and magnetic markers [59]. The integration of these technologies enables AVs to analyze their surroundings comprehensively, predict the movements of surrounding vehicles and pedestrians, and navigate to avoid obstacles. This gives AVs a significant advantage over human drivers, who often face situational and environmental awareness limitations.
Over the last decade, interest in AVs as a potential non-traditional public transit mode has grown. These self-driving vehicles can change urban mobility by offering safe, efficient and convenient transportation options. AVs also have the potential to significantly enhance urban transit systems by decreasing transportation emissions and optimizing traffic flow.
Safety is a critical focus in many parts of the world that AVs can help solve. In Canada, the number of deaths and injuries due to motor vehicle collisions in 2021 were 1,767 and 108,546 respectively. [60]. AVs promise to reduce these collisions, given that about 94 per cent of serious
75
CHAPTER 8
crashes result from human driving errors [61]. However, AV technology's full development and widespread adoption are still years away.
4 High automation
●
●
●
●
5 Full driving automation
● Possess environmental awareness and can make decisions, yet human override is required (e.g., Audi's A8L with Traffic Jam Pilot though its U.S. classification as Level 3 highlights regulatory challenges).
● Operates without human intervention in most situations, but manual override available.
● Often geofenced to specific areas and pertinent to ridesharing services.
● No human attention is required. The "dynamic driving task" is eliminated.
● No steering wheels or acceleration/braking pedals.
● Free from geofencing and able to go anywhere and do anything an experienced human driver can.
● Fully autonomous cars are being tested in several jurisdictions around the world, but no such vehicle systems are currently available to the public.
While technology has advanced to offer Level 3 automation in some vehicle platforms, integrating AVs into private and public urban transportation systems has yet to be achieved systematically in North America. Significant challenges persist in attaining fully automated buses and shuttles
76
Table 5: Society of Automotive Engineers (SAE) classification of driver assistance technology advancements (SAE J3016)
Level Steering Type Description
No driving automation
0
Requires complete human control. Although systems like emergency braking exist, they do not qualify as automation. 1 Driver assistance
Has one automated function, such as cruise control.
Human drivers oversee other aspects of driving. 2 Partial automation
Advanced
human presence remains vital (e.g., Tesla Autopilot and GM's Super Cruise).
Conditional driving automation
systems control steering and acceleration, but
3
for public transit operating at SAE Levels 4 and 5.
Achieving SAE Level 4 or 5 involves integrating state-of-the-art information communication technologies (ICT) into public transport and a broader transformation of urban infrastructure into a smart, interconnected ecosystem to embrace connected vehicles. However, manufacturers are making strides in developing Level 4 automated vehicles. Prominent manufacturers and operators such as NAVYA, Magna, and Volvo-Baidu are refining Level 4 AVs, which operate autonomously in some regions.
8.2 Use cases
● First-kilometre/last-kilometre connectivity: Autonomous shuttles can be deployed to provide flexible short-route services between heavily travelled fixed routes such as suburban neighbourhoods to transit hubs or from transit hubs to popular destinations.
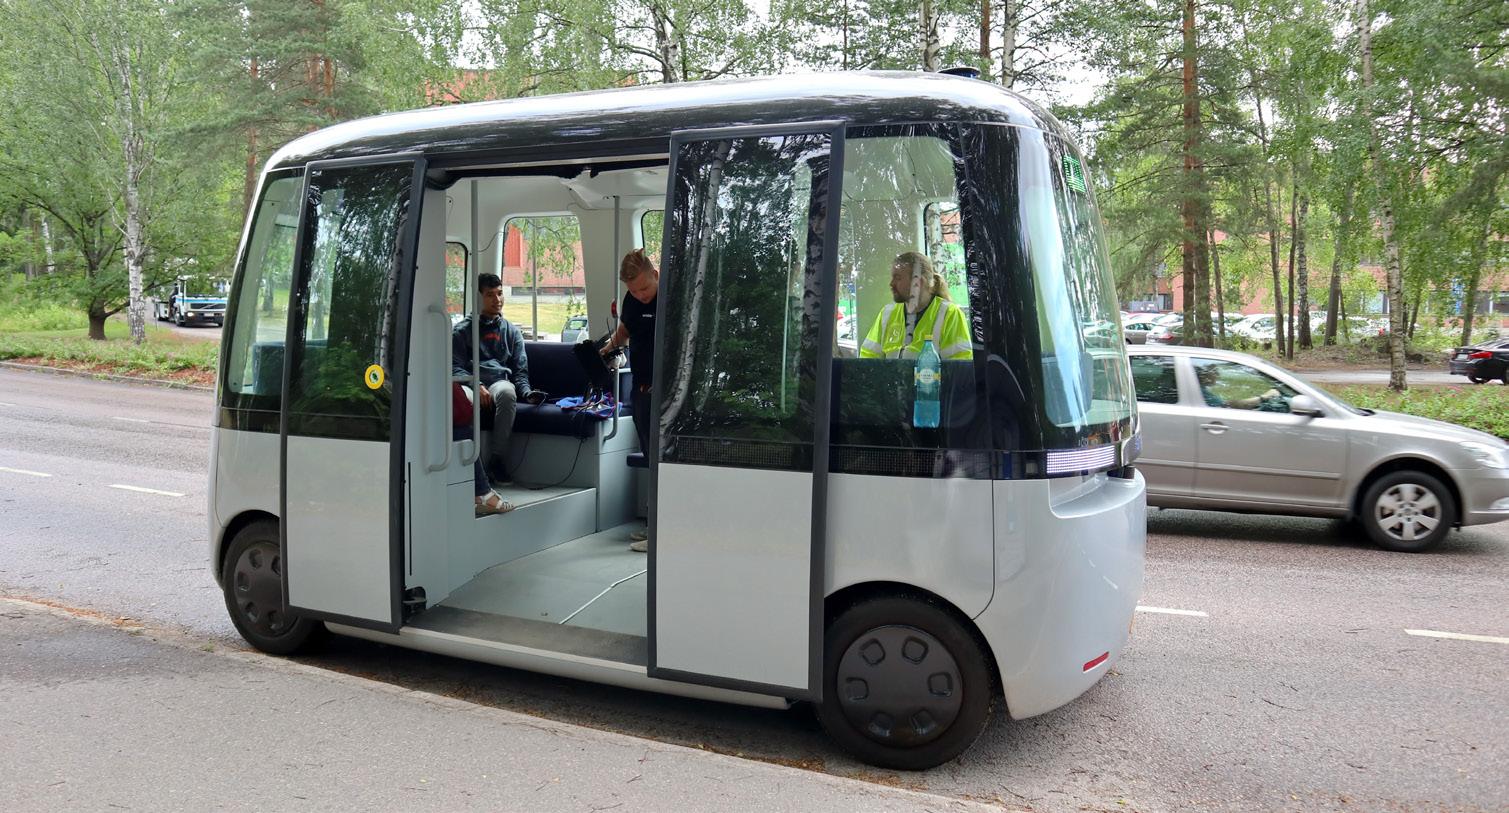
● Continuous service: Autonomous shuttles are suitable for providing service around the clock and throughout the week, as they do not require human drivers, particularly in low density neighbourhoods where traditional buses are not cost-effective.
77
Figure 26: Gacha model autonomous shuttle designed by Muji, Finland.
This vehicle can handle all weather conditions, and was awarded the 2019 Good Design gold award, which is evaluated for quality of effort in providing solutions for social issues and the potential for future development. (PhotoCredit: SariMe/Shutterstock.com)
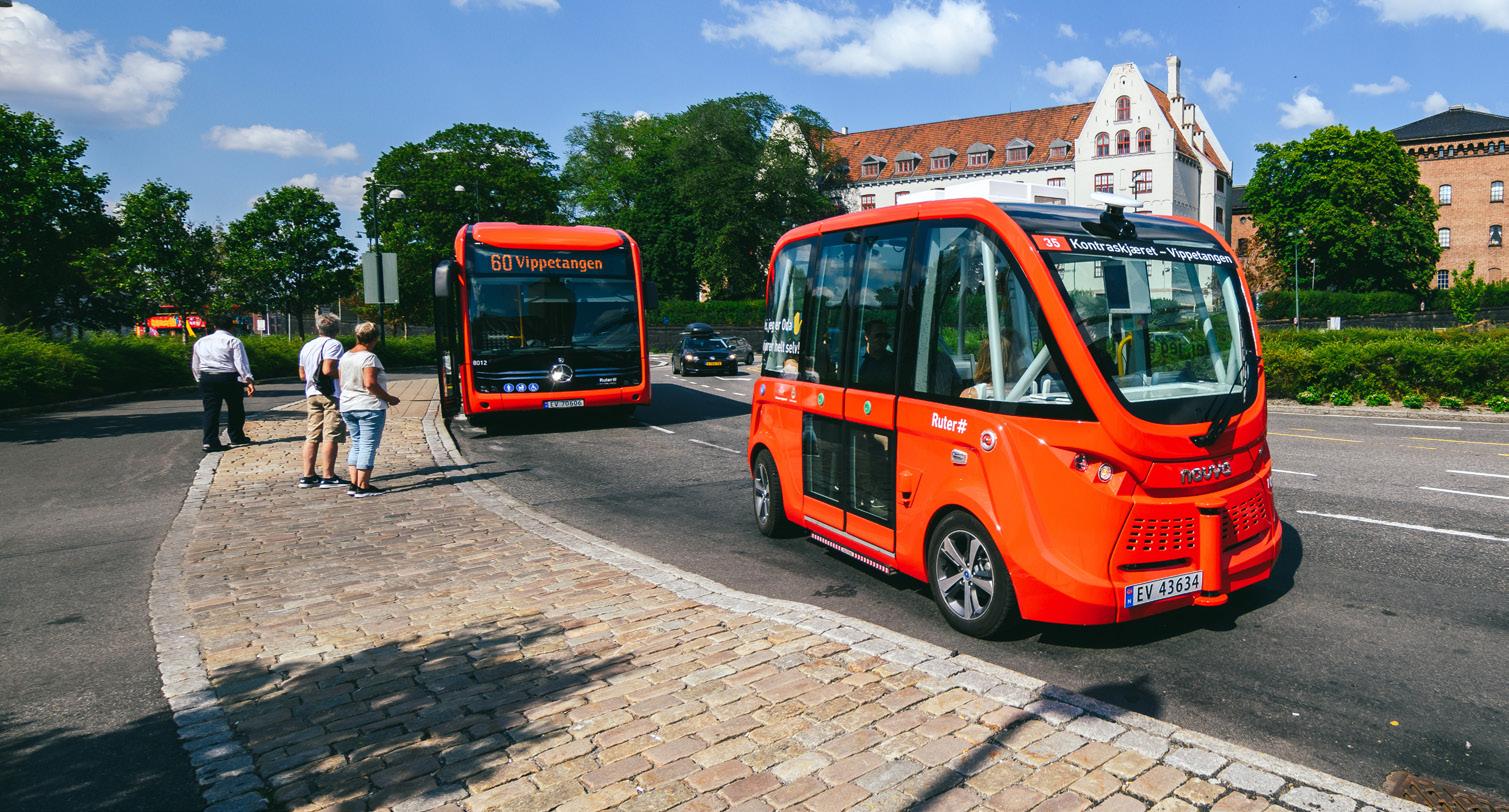
8.3 Core themes of autonomous shuttles
Despite significant progress that has been made in AV technology in recent years, these technologies are still in the early stages of technological development and widespread commercialization. There are challenges to be overcome before they become more widespread. Forecasts project the presence of approximately eight million autonomous or semi-autonomous vehicles on roads by 2025 [62]. The journey towards integration requires progressing through five levels of driver assistance technology advancements, defined by the Society of Automotive Engineers (SAE) as outlined in Table 5.
This section presents an analysis of data from FGDs conducted with two key stakeholders in the transit and municipal industries:
● Transdev: A renowned global autonomous shuttle operator.
● The City of Montreal: A city that piloted autonomous shuttles in Canada.
8.3.1 Technological challenges and future advancement
FDG data emphasize the crucial role of technological advancements in the success of autonomous shuttles. Operators actively collaborate with multiple manufacturers in this rapidly evolving industry, exploring multiple distinct technologies.
Recent research indicates that latency issues significantly disrupt communication in mixedtraffic environments due to the lack of uniform standards among manufacturers. Certain vehicles prioritize safety to an extent that causes navigation challenges such as frequent and abrupt stops, resulting in congestion and frustration for passengers, pedestrians and other drivers. Standardizing latency periods is crucial for successfully deploying autonomous vehicles (AVs) in Canada.
78
Figure 27: Navya Autonomous bus in Oslo, Norway.
Navya autonomous buses currently rank as the market’s most experienced AV mobility solution. (PhotoCredit: A. Aleksandravicius/ Shutterstock.com)
However, operational standardization poses a significant challenge, particularly in control rooms. Operators employ diverse operating models, and the nascent stage of this technology limits the sharing of information within the industry, which is necessary for collective advancement. The complexity of operations is further increased by introducing remote support, impacting operational efficiency. Data from semi-structured focus groups underscore the importance of developing strategic roadmaps for integrating remote support to ensure the success of AV projects. Addressing these challenges is imperative for securing and efficiently deploying AV shuttles. Operational standardization and developing advanced communication strategies are fundamental to demonstrating a commitment to an integrated autonomous mobility solution.
First Transit, an American transportation operator, has recently implemented optical character recognition (OCR) technology. OCR allows vehicles and automation systems to interpret textual information from images and videos captured by onboard cameras. This capability is essential for AVs to comprehend road signs, traffic signals, license plates and other textual data. For instance, OCR assists AVs in reading road signs and signals to understand traffic regulations and speed limits. This adoption of OCR technology illustrates how other modes of transportation, including on-demand services, buses and shuttles can leverage advancements from the AV sector to improve transit operations and efficiency.
8.3.2 Market size and growth potential
Data from FGDs indicate that technological maturity is critical in deploying AVs with successful pilots and trials contributing to market expansion. In the United States, cities like Phoenix and San Francisco have seen successful AV deployments, albeit with technological complexities. Despite current challenges, projections suggest these technological hurdles may be overcome within the next decade. However, integrating AVs into the public transit system remains challenging, particularly in North America, where most initiatives are privately tested and operated.
Government funding could be instrumental in bridging an investment gap in this segment of non traditional mobility and supporting substantial investments that facilitate the broader adoption of AV technology in public or private transit systems. Such funding could enable nationwide testing and foster data sharing among transit agencies and operators, thereby promoting collaborative learning and potentially leading to mass adoption of this transformative technology. In Europe, entities like the European Commission and the French government provide funding for acquiring autonomous vehicles and the infrastructure necessary for deployment, setting a precedent for governmental support in advancing AV technology. Public transit-based autonomous shuttles face a funding disparity compared to privately owned autonomous taxis, which impedes their adoption as a viable transit option. Significant investment is required to integrate these shuttles into the public transit framework in terms of infrastructure and technology.
8.3.3 Customer acceptance and perception
Anticipating the precise impact of autonomous vehicle systems (AVS) on public transit ridership is complex. The main objective is to boost public transit networks by attracting more passengers
79
and providing point-to-point transportation in locations not served by a public transit network. A communication plan for public awareness should be included in overall autonomous shuttle deployment plans. Whether transit agencies are introducing this new transportation technology to increase ridership, make cities more attractive for riders or connect communities better, public information about project intentions and goals will impact ridership over the long term. Transit agencies can publicize how AVS pilots will positively impact the commute for riders. Increasing awareness about autonomous shuttle technology plays a key role in communities when transit is a priority. The goal would be to get riders to see autonomous shuttles as reliable, safe, trusted, innovative and efficient for their commute.
8.3.4 Infrastructure upgrades and total cost of ownership
To successfully integrate autonomous vehicles (AVs) with existing transportation systems, these vehicles must operate seamlessly in mixed traffic conditions. AVs have traditionally depended on roadside and traffic units for navigation. However, recent advancements suggest a shift towards reduced reliance on extensive connected infrastructure with many AVs now equipped with centralized decision-making units onboard. While some AVs may still require additional infrastructure, such as traffic light communications, the industry emphasis today is on enhancing onboard intelligence.
A considerable expense associated with AVs is the supervision system, which includes operational control centre equipment, screens, laptops and data management to ensure smooth operations. As the industry transitions to autonomous services, integrating surveillance cameras – potentially up to 10 per vehicle – is recognized as essential for maintaining passenger experience and safety.
Data from FGDs with a shuttle operator indicates that implementing an AV shuttle service comprised of five vehicles can lead to a 20 to 30 per cent cost recovery from the initial investment within five years. The trajectory of technology development, particularly in areas such as LiDAR and RADAR, suggests the possibility of future cost reductions. Nevertheless, specific feasibility studies examining initial investment costs and total ownership expenses are recommended for a more comprehensive understanding.
Long-term trials are crucial for accurately assessing the total cost of ownership (TCO) for AV services. A viable business case is projected to emerge when a single supervisory operator can manage a fleet of five to six shuttles. These projections, however, are contingent upon various assumptions, including future data consumption costs and the evolution of vehicle prices. The objective is to achieve significant savings targeting a 20 to 80 per cent reduction in TCO compared to traditional vehicles. Realizing such savings is vital for the feasibility and sustainability of AV initiatives.
8.3.5 Data security and privacy
Autonomous shuttles necessitate meticulous attention regarding cybersecurity and safety.
80
A significant intersection exists between the cybersecurity and the operational safety of AVs, because enhanced automation and connectivity amplify security vulnerabilities. The public transportation industry confronts unique challenges without all-encompassing cybersecurity regulations. CUTRIC’s 2021 National Smart Vehicle Joint Procurement Initiative Report highlights the susceptibility of AVs and connected systems to cyberattacks, providing recommendations for standards to counteract such risks [61]. Transport Canada’s research delineates security protocols pertinent to the Canadian milieu [63]. International manufacturers entering the Canadian market must comply with UN-ECE No. 155, which mandates a cybersecurity management system [64].
Insights gained from semi-structured focus groups indicate that software maintenance represents a pivotal concern. Although AV providers typically oversee initial hardware and software maintenance, transit authorities have not yet established uniform software upkeep and data exchange procedures. It is imperative to collaborate with operators to develop a robust connectivity framework, especially in challenging environments. Internal protocols extensively document vehicle operation and passenger safety procedures. Technology vendors are instrumental in instituting stringent measures by recognized standards in cybersecurity.
Health and safety considerations demand active engagement from transit agencies. The authorization process for AV services includes submitting an Operational Safety Management Plan and customizing the generic system for local applications. Cooperative interactions with regulatory entities set the expectations for documentation [61]. The paradigm shift in data security encompasses transitioning software maintenance responsibilities, sustaining dependable connectivity, and adopting a comprehensive approach to safety management. This entails establishing data-sharing norms and fostering collaboration between transit agencies and technology providers.
8.4 Global overview
Europe and the United States have started to adopt connected autonomous shuttles and buses and test them as a significant contribution to their integrated transit system.
8.4.1 Paris, France
The Île-de-France region in and around Paris launched its first fully autonomous bus line in March 2021 [65]. This innovative bus route serves the Saint-Quentin-en-Yvelines–Montigny-le Bretonneux suburban train station and local business parks. The project is a collaboration with the Saint-Quentin-en-Yvelines intercommunal district. It is a significant step in autonomous shuttle development by Île-de-France Mobilités, the region's public transport authority.
Operated by Keolis, these autonomous shuttles integrate with regular traffic and are even featured in the Île-de-France Mobilité’s journey planner app. With €2.4 million (CAD 3,5 million) in funding from Île-de-France Mobilités, the service is free to riders operating on weekdays from 7:30 am to 8:00 pm. The Navya-supplied shuttles can carry 11 passengers each with a
81
safety operator onboard. Equipped with V2X technology, these shuttles navigate junctions and communicate with traffic lights, ensuring safe transit. The route spans 1.6 kilometres with three stops, operating every eight minutes during peak hours and every 17 minutes off-peak [65].
The collaboration involves technical expertise from Saint-Quentin-en-Yvelines intercommunal district, Montigny-le-Bretonneux, and support from local associations and banks. Keolis employs a fleet-management tool for real-time tracking and monitoring, while passenger information is available on mobile apps and websites. This autonomous bus line sets an example for future mobility solutions in the region [65].
8.4.2 Oslo and Bodø, Norway
Two case studies from Norway highlight the importance of multi-stakeholder collaboration and long-term trials for AV technology.
Oslo
Oslo's public transport authority, Ruter, aims to decrease private car use by encouraging more citizens to use AV services.
The Oslo Self-Driving Bus Project is Norway’s largest self-driving initiative, supported by the Oslo Municipality, Norwegian Public Roads Administration, autonomous shuttle operator, Holo and Ruter. The three-year trial sought to refine AV technology for future integration into Ruter's standard services by operating self-driving shuttles along vital routes, including subway stations, local hubs and hospitals.
The first route was tested in May 2019 covering a 1.3-kilometre route from Vippetangen to the town hall square. The shuttle navigated urban complexities, passing through the cruise terminal and harbour showcasing the viability of self-driving technology. Phase two introduced an autonomous shuttle on a second route, enhancing daily mobility for island residents. This phase, initiated in December 2019 improved accessibility by connecting residents to main public transportation. Phase three, commencing in May 2020, involved testing vehicle-to-everything (V2X) communication on Kongens Gate. This advancement enabled the shuttles to interact with traffic lights, reducing manual interventions at crossings [66].
The Oslo Self-Driving Bus Project signifies a significant leap toward sustainable urban transportation, demonstrating the real-world potential of autonomous technology [66]. The market analysis shows robust collaboration between Ruter, Holo, Toyota Motor Europe and Sensible 4, a technology company specializing in autonomous vehicle software. Toyota vehicles were retrofitted with Sensible 4's all-weather autonomous driving software for Ruter's self-driving trials to launch a new service in Nordre Follo municipality during autumn 2020. This partnership was critical in addressing Norway's challenging climate, enabling autonomous driving under various conditions [66].
82
Since 2020, Norway has also been testing autonomous vehicles in Ruter’s suburban public transport system to improve the accessibility and convenience of its passengers. Ruter relies on Holo’s experience in operating self-driving vehicles to run the trials smoothly. Holo envisions a future where people use mobility services instead of owning vehicles and pay per trip [66]. This partnership is a big step towards developing autonomous mobility and finding new ways to boost public transportation options [65]. The project is expected to finish in December 2025.
Bodø
In 2022, the world’s first automated driving service north of the Arctic Circle was carried out in Bodø, Norway [67]. The half-year pilot project was sponsored by Mobility Forus, Boreal, Nordland County Municipality, Bodø Municipality and Sensible 4 to gain insights into the performance of automated-driving technology in challenging weather conditions. Bodø presents unique challenges in that the city can experience all four seasons in a single day. The project employed two Sensible 4 automated Toyota Proace Verso EVs to connect the local harbour with the hospital along a 3.6-kilometre route. Operating at SAE Level 4 automation, these autonomous EVs showcased adaptability in snow, rain, wind and limited visibility covering 18,000 kilometres during the half-year initiative [67].
While autonomous vehicles are expected to become more common in Norway, long-term trials addressing technology, regulations and societal readiness are crucial before widespread adoption. Understanding this non-traditional transit system's technology and market fit requires testing the autonomous shuttle for various technological capacities like Vehicle-to-Vehicle (V2V), Vehicle-to-Infrastructure (V2I) and Vehicle-to-Everything (V2X) communication. This pilot project should be followed by a longer-term trial involving multiple stakeholders with defined roles to facilitate valuable lessons learned [68].
8.4.3 Monheim, Germany
Monheim, Germany is one of Germany's first “smart technology” cities. The city’s transit system has developed amenities and infrastructure such as the Monheim Pass which helps users access city services with cashless payment methods. The city has a robust fibre optic network provided by municipal subsidiary Monheimer Elektrizitäts- und Gasversorgung GmbH (MEGA), the local utility provider, which enables high-speed internet access. Wi-Fi hotspots are also strategically placed throughout the city.
A city designed to support AV navigation, Monheim has had autonomous electric buses operating between the bus station and the old town since February 2020. These buses are operated by EasyMile and are equipped with safety sensors. They follow a predefined route and are staffed with a human safety operator as required by German law. Monheim's innovative approach and the introduction of autonomous shuttles represent significant steps towards smarter mobility, setting an example for the future of public transport [69].
Additionally, the city offers free local public transport with an electric bus and train ticket to
83
encourage increased ridership. The shuttle route, Line A 01, efficiently navigates the city, serving residents and tourists7 alike. This initiative, supported by the Federal Ministry for Economic Affairs and Energy, contributes insights for future autonomous public transport solutions.
Other smart amenities include parking, lighting, digital display screens and car-sharing. Intelligent electricity meters offer real-time energy consumption data.
The Monheim Pass provides access to city services and partnerships with entities like MEGA, Mona Mare Leisure Complex, Kulturwerke events and Bahnen der Stadt Monheim (BSM) public transit. It coincides with the introduction of digital citizen accounts [70].
8.4.4 San Francisco, USA
San Francisco has piloted, tested and commercialized autonomous vehicles since 2022, when the California Public Utilities Commission (CPUC) allowed Cruise, a company majority-owned by General Motors, to operate driverless taxis and charge passenger fares. This was followed by Alphabet Inc.'s Waymo, another leading autonomous vehicle company, which was given similar approval in 2023. Referred to as robot taxi services, these autonomous vehicles are privately run taxi services that feature compact EVs navigating the city without human drivers. Most autonomous shuttles are bi-directional, with the front and rear mirror images of one another.
While San Francisco is the global hub for 24/7 driverless services, there are limitations in the areas where these vehicles are allowed to operate. In addition, autonomous vehicles may sometimes pose safety risks in some cases due to their erratic and overly cautious driving behaviour, affecting the traffic flow and other drivers’ performance. This happens when AVs are deployed in urban areas with a heavy pedestrian and vehicle presence [71]. Due to public safety concerns, Cruise’s permit for deploying and testing driverless vehicles on public roads was suspended in October 2023. The company was required to comply with certain conditions to regain its permit. In the meantime, Cruise can continue to test its vehicles with a safety driver [72].
Alphabet Inc.'s Waymo allows users of its test systems to request robo-taxi rides using Uber or Lyft. Waymo's app unlocks the vehicle upon arrival and passengers can initiate the ride. Waymo's fleet is around 200 vehicles and conducts 10,000 weekly trips. The business aims to increase its trips to 100,000 by the summer of 2024. As revenue generation is important for long-term viability, Waymo is shifting from research to business models for financial sustainability. Although autonomous vehicles can provide last-kilometre/first-kilometre connectivity, the objectives of the privately led initiative do not expressly include integration with the transit system [71]. This case study shows why partnerships between private and public entities are important for transit integration.
7Monheim is a new smart city that attracts many tourists.
84
8.4.5 Montreal, Quebec, Canada
In Canada, the City of Montreal conducted a short-term pilot of autonomous shuttles. The City’s autonomous transportation pilot project began in 2018 with an inaugural pilot taking place during the summer of 2019, spanning approximately six weeks. The core objective of this initiative is to showcase the potential of autonomous shuttles in addressing the crucial first- and lastkilometre urban transportation gap. Unfortunately, this initial pilot failed to provide sufficient data to identify potential riders or optimal routing.
Subsequently, a second pilot, conducted in late 2020, had two phases of 33 and 36 days, respectively. The chosen route for the shuttles spanned two kilometres threading through a commercial zone with shops lining both sides of the street. These shuttles served as a localized transit solution for the area and enticed visitors across Montreal and its neighbouring regions. The project's financial scope encompassed not just the leasing or procurement of the shuttles but also the establishment of requisite infrastructure, connectivity provisions and ongoing maintenance requirements.
While deemed successful, the pandemic disrupted the pilot, which required passenger capacity restrictions, adversely affecting ridership and the overall project's trajectory. Nevertheless, the primary takeaway from this endeavour is that low-speed autonomous shuttles work best in environments characterized by predictable, slow paced and simple traffic patterns. They thrive under specific conditions that ensure safe and efficient operation.
The project also faced operational challenges as connectivity issues and assorted hurdles emerged during its various phases impacting its timeline and budget. The intricate nature of urban driving environments posed obstacles to operating autonomous shuttles. FGD data also show that insurance emerged as a critical factor impeding the project with the operator mandated to possess private insurance to cover potential damage.
While the Montreal project showcases notable advancements in autonomous shuttle technology, it also underscores the technology's infancy in Canada. These vehicles are not yet equipped to navigate the complexities inherent in everyday urban driving scenarios. Future undertakings will need to address these technical limitations and ensure that autonomous shuttles can operate securely and reliably across diverse conditions, likely in dedicated laneway scenarios. Success in such projects holds the potential to attract increased funding and investment and stakeholder collaboration, demonstrating the worth of AVs through reduced costs and enhanced urban mobility.
8.5 Conditions for success and limitations
While operational details remain proprietary, FDG participants offered insights into the role of AV technology in public transit.
85
Electric autonomous shuttles use conventional electric charging methods, which can be controlled to enable unlimited 24/7 operations. The plan for developers of transit AV technology today is to have an in-house charging system that can manage different shuttle brands, but it has been challenging to harmonize various systems with different software and compatibility requirements.
European regulations require multiple approvals for AV deployments, such as vehicle specification approvals, vehicle supervision systems approvals and localized deployment plans. A universal supervision system for mixed fleets is not feasible in the near future due to the complexity of the interface approval process. However, there are opportunities to optimize AV shuttle operations, especially within depots, using a multi-brand supervision system.
The potential of AVs in transit depends on the technology's maturity and collaboration with transit agencies to identify service gaps this technology can fill. Current industry focus is on deploying AVs in settings where the technology is mature and provides first-kilometre/last-kilometre connections. Although the technology has advanced, achieving full automation still faces obstacles. The AV industry is still in the research, development, testing and early deployment stages for use of AVs on public roads and for robust transit services.
Conditions for success
Shared mobility:
AVs can be part of ride sharing and shuttle services.
First- and last-kilometre connectivity: AVs can connect people to public transit hubs.
Safety:
AVs can reduce accidents caused by human error through advanced sensors and technology.
-
Limitations
Complex urban environments:
Cities with crowded streets and busy intersections can be complex for AVs to navigate safely.
Regulatory and liability issues:
Figuring out rules and responsibility in the case of AV accidents is an ongoing challenge, requiring updated laws and regulations.
Infrastructure compatibility:
AVs need special infrastructure such as strong and secure Wi-Fi.
Knowledge sharing:
To make AVs work in cities, agencies must test them in real traffic, share data and set standard communication protocols.
86
Table 6: Autonomous vehicle conditions for success and limitations
9 Other modes of transportation
The following section focuses on additional transportation modes beyond those reviewed indepth above. These modes offer insight into emerging non-traditional transportation systems at various stages of adoption.
9.1 Hovercraft
A hovercraft is a type of vehicle that can travel over land, water, mud, ice and other surfaces by creating a cushion of air between the vehicle and the surface. It operates using the physics of a large fan or multiple fans that generate this cushion of air, allowing the vehicle to glide smoothly over various terrains without direct contact. Hovercrafts have been used for specific applications such as search and rescue operations, military missions, tourism and transport in areas with challenging terrain or where traditional vehicles are limited. In urban transit, hovercrafts could potentially offer some advantages.
Since hovercrafts do not require extensive road or track networks, they are suitable for areas with limited infrastructure. They can move between land and water surfaces, which could be advantageous in urban areas with rivers, lakes, or coastal regions where conventional road and waterway transportation modes might not be as efficient. In cities prone to flooding or with swampy terrains, hovercrafts can provide reliable transportation even during adverse weather conditions.
There are some challenges to consider. One of the issues with this non-traditional mode is that hovercrafts can be noisy and their operation may have environmental implications due to the air cushion generation, particularly in densely populated urban areas. Like ferries, establishing appropriate hovercraft terminals or stations in urban environments might require space and facilities different from traditional transit systems. Finally, hovercrafts generally have limited passenger and cargo capacity compared to other public transit modes, which might not be suitable for highly populated areas.
Hovercraft services are making an impact globally. In the Isle of Wight, UK, hover travel connects
87
CHAPTER 9
Southsea and Ryde, while Santander, Spain, offers bay crossings, and Perth, Australia, uses hovercrafts for tourism along the Swan River [73].
In Canada, a new hovercraft project by Ontario Hoverlink aims to connect Toronto and St. Catharines in 30 minutes, consequently reducing car travel [74]. Although its 2023 launch is postponed due to complexity, hovercrafts may offer quick, sustainable and weatherproof transport [75].
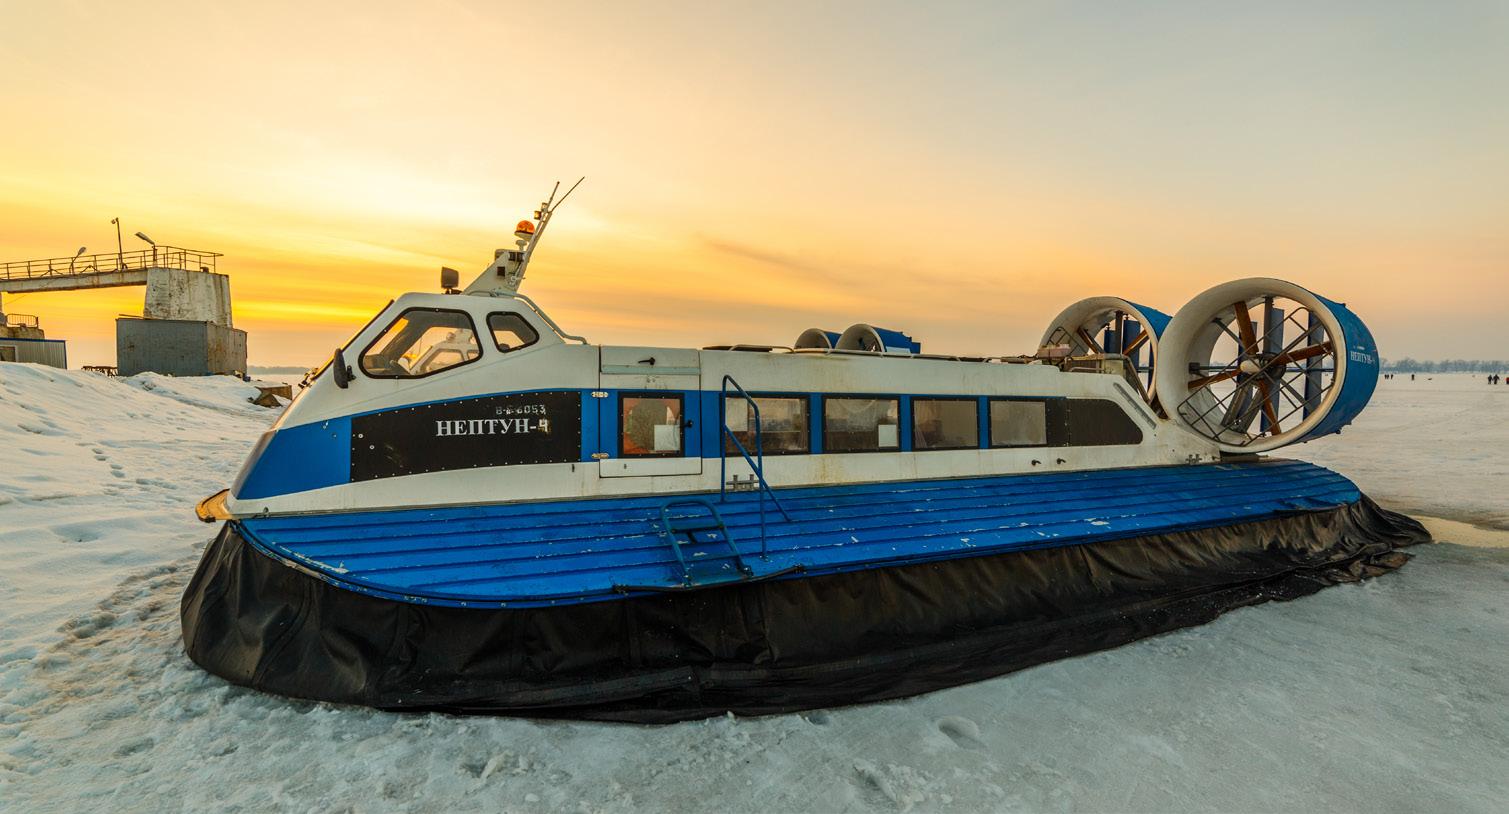
9.2 Maglev
Maglev, short for magnetic levitation, is a transportation technology that uses magnetic fields to lift and move vehicles such as trains above a track. Without physical contact, friction is eliminated, enabling higher speeds and a smoother ride compared to regular trains.
Maglev trains work through electromagnetic suspension. Strong magnets on the train repel magnets on the track, lifting the train just above the rails. Then, a linear motor propels it forward or backward. This allows Maglev trains to reach impressive speeds exceeding 480 km/h.
Because there is no physical contact, there is less noise, vibration and no bumps compared to regular trains, creating a more comfortable experience for riders. Since there is no friction, there is also less wear and tear leading to lower maintenance requirements. Maglevs are more energy efficient than regular trains due to less air resistance, especially at high speeds.
Implementing Maglevs in urban transit systems requires dedicated tracks with magnetic systems. Challenges include infrastructure costs, compatibility with existing systems, initial investment, regulation and safety and energy usage.
88
Figure 28: Passenger Hovercraft with a propeller in Samara, Russia.
(PhotoCredit: Tramp57/Shutterstock.com)
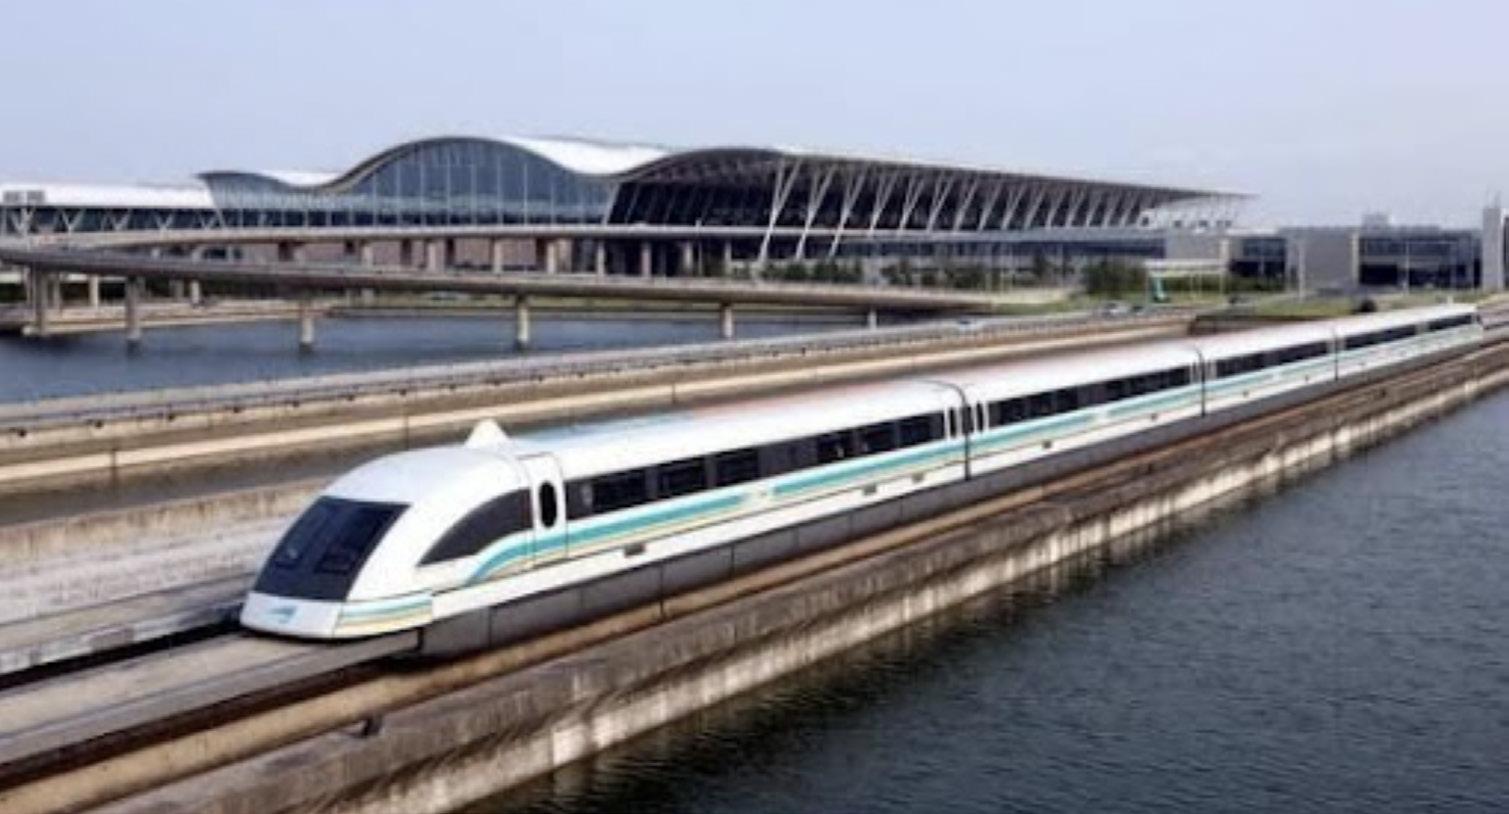
9.3 E-scooters
E-scooters are typically lightweight and have a platform for the rider to stand on along with handlebars for steering and controls. They are powered by an electric motor, allowing them to reach moderate speeds without needing pedalling or manual pushing.
E-scooters have gained popularity as a convenient and environmentally friendly mode of urban transportation. Users often rent them for short trips, offering a last-kilometre solution to bridge the gap between public transportation stops and final destinations.
E-scooter sharing services have become prevalent in many cities, where users can locate and unlock e-scooters using smartphone apps, ride them to their destination and then leave them for the next user. In most countries, e-scooters are privately owned and operated. However, some cities like Brisbane, Australia, have adopted e-scooters as part of their public transit system, which has been very successful.
9.4 eVTOL helicopters
Electric vertical takeoff and landing (eVTOL) technologies are similar to helicopters but are powered by electric propulsion systems. These aircraft are integral to future urban air mobility (UAM) systems that offer on-demand, short-range aerial travel within cities.
eVTOLs typically feature multiple electric motors and rotors enabling vertical takeoff, hovering and smooth transition to forward flight. Positioned as a remedy for urban traffic congestion, they promise quicker and more efficient commuting for short to medium distances. Many companies are actively innovating eVTOLs for diverse roles such as passenger transport, cargo delivery and emergency services, focusing on environmental sustainability and reduced noise compared to
89
Figure 29: The Shanghai Maglev in Shanghai, China.
The Shanghai Maglev system the longest commercial maglev system in China. It covers about 30 kms and runs from downtown Shanghai to Pudong International Airport. The line is the first highspeed commercial maglev, operating at a maximum speed of 430 km/h.
conventional engines.
Though at an early stage of technological development, Israel has showcased considerable innovation in eVTOL technology, exemplified by the Urban Aeronautics CityHawk aircraft. It is designed for urban settings with compact dimensions and vertical takeoff capabilities, serving passenger and emergency response roles [76].
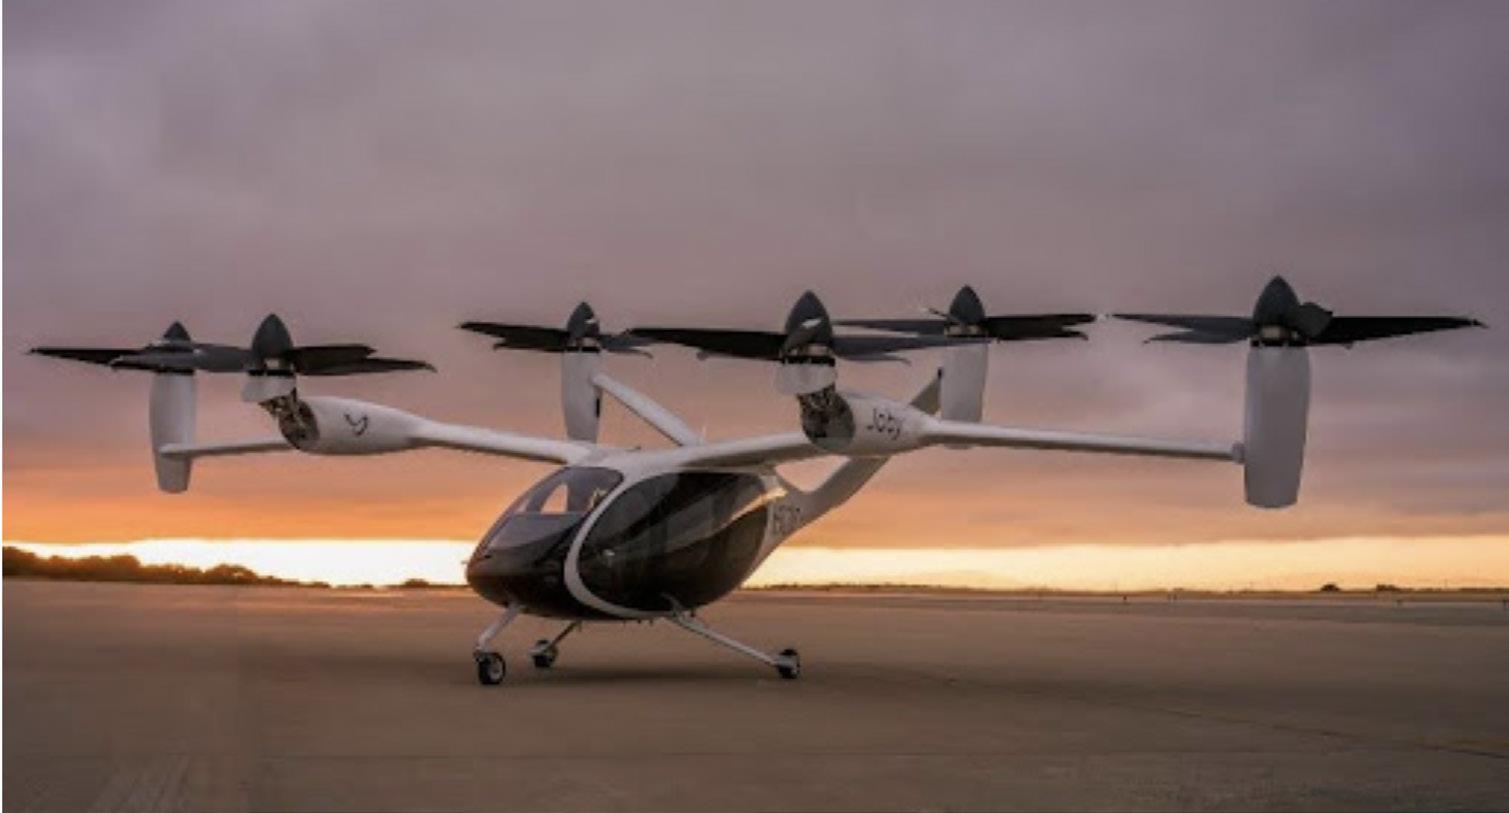
90
Figure 30: eVTOL helicopter by Joby Aviation, Santa Cruz, California, USA.
Joby Aviation’s eVTOL holds one pilot and four passengers and has ample room for luggage. The aircraft has a maximum cruise speed of 322 km/h and a range of 161 km, including energy reserves.[77]
10 Overall challenges and recommendations
This section focuses on the common challenges ahead and the trends defining non-traditional modes of transportation. It provides insights into these modes while drawing insights from international experiences adapted to the Canadian context. By identifying the opportunities and best-use cases for non-traditional modes, informed by real examples, the recommendations offered below aim to help transit and transportation decision-makers develop projects and initiatives that can better serve the needs of their riders and lead to stronger and more effective transit.
10.1 Endorsement of non-traditional transportation solutions
The lack of understanding and acceptance of non-traditional transportation solutions such as aerial transit, bicycles, on-demand services, autonomous shuttles and ferries can be a significant barrier to their successful endorsement and implementation. There are several factors contributing to this challenge.
Table 7: Endorsement of non-traditional transportation: Challenges and recommendations
Challenges
Educate:
Lack of familiarity with non traditional transportation modes causes public skepticism about non-traditional options.
Perception:
Modes are often associated with recreation, not daily commuting, leading to limited use.
Recommendations
Educate:
Awareness-building about the safety and reliability of new modes of transportation through positive marketing, education and data sharing.
Demonstrate:
Pilot project deployments which offer first-hand experiences that can change perceptions.
91
CHAPTER 10
Challenges Recommendations
Safety:
Misconceptions persist about the safety of non-traditional transport modes.
Weather limitations:
Micromobility is perceived as less suitable in colder Canadian regions.
Integrate:
Blends of non-traditional options with existing transit systems.
Engage communities:
Collaboration with residents to address specific concerns.
Emphasize safety:
Transparent community communication of regulations and safety measures.
Show and tell:
Organization of public demonstrations and test rides for confidence building.
Addressing the lack of public perception and understanding of non-traditional transportation solutions requires a multi-faceted approach. It involves educating the public about the benefits, safety and reliability of these options. Additionally, involving the community in the planning and decision-making can help address concerns and build trust. Pilot projects that help to demonstrate the success of alternative modes of transportation can also support a long-term change in public perception. Fostering a positive attitude toward these innovations is crucial for their successful integration into transportation and efficient mobility solutions [78].
92
10.2 Regulatory, land use and compliance requirements
The growth of non-traditional transportation modes like ferries, autonomous shuttles, aerial gondolas, on-demand services and micromobility faces regulatory hurdles that hinder widespread adoption.
Table 8: Regulatory, land use and compliance requirements: Challenges and recommendations
Challenges
Insurance and liability challenges:
Determining insurance requirements for accidents involving new modes can be challenging.
Lack of defined regulations:
There is concern about the lack of defined regulations for many non-traditional modes, causing delays to scale.
Safety and certification:
New transportation modes like autonomous shuttles must meet rigorous safety standards set by regulatory bodies.
Infrastructure and land use:
Compliance with zoning laws and land use plans is essential for installing stations or terminals for non-traditional modes.
Fare and pricing regulation:
Fare structures require integration with broader transit systems to promote their use.
Privacy, ownership and sharing regulations:
Some non-traditional modes, like AV shuttles and on-demand services are data-driven, raising concerns about privacy, ownership and sharing regulations.
Recommendations
Coordination and standardization:
There is a need for a coordinated and standardized approach to integrating nontraditional modes into existing transit systems.
Collaboration:
Collaboration should be fostered among regulators, industry and communities as this is vital to address challenges.
Safety:
Balancing innovation with safety and public welfare is crucial for successful urban mobility integration.
Interoperability:
Infrastructure compatibility is required for interoperability, mass adoption and scaling.
Planning:
Careful planning is needed to integrate new modes with existing infrastructure and minimize disruptions.
Privacy, ownership and sharing regulations:
Data privacy and ownership issues need standardization and regulation.
93
10.3 Access to capital
Access to capital challenges exist that impede non-traditional transit solutions from flourishing. Many of these solutions do not align with conventional transportation infrastructure funding categories. The absence of widespread commercialization or mass adoption of these technologies further hampers the accurate estimation of factors such as ridership, operational costs and maintenance requirements. The associated uncertainty with return on investment (ROI) and business cases poses barriers to securing funding and/or financing for innovative solutions.
Navigating intricate regulatory landscapes makes it even more difficult to launch these technologies efficiently and successfully in public transit contexts. Additionally, substantial upfront expenses tied to research, development, testing and infrastructure innovation discourage potential investors, particularly when faced with extended payback periods.
To effectively commercialize new technologies, government subsidies, grants, and private sector funding and partnerships will be imperative. The combined investments may help to initiate testing and pilot projects, and help to address the economic, structural, commercial or risk gaps that otherwise prevent a project from proceeding. These tests and pilots yield invaluable lessons, ultimately leading to the standardization and resilience needed for technology readiness and widespread adoption.
Challenges
Access to capital:
Non-traditional transit solutions face funding/financing challenges due to their unconventional nature and lack of mass adoption, making it hard to predict ridership, costs and ROI accurately.
High initial costs:
Substantial upfront expenses for research, development, testing and infrastructure can deter investors, especially when returns take time.
Recommendations
Funding complexity:
To address funding challenges, collaboration between public and private sectors to establish innovative financing models to address risk can help attract funders.
High initial costs:
PTo address high initial costs, industry, governments and investors should explore cost-sharing initiatives and prioritize costeffective R&D and pilot projects for long-term efficiencies.
94
Table 9: Access to capital: Challenges and recommendations
Challenges Recommendations
Government support:
Government subsidies or grants are vital for launching pilot projects, standardizing new technology and preparing for widespread adoption, offering valuable insights for refinement.
Government support:
Government support is vital through targeted subsidies, grants, and competitive programs rewarding scalable, innovative projects to resolve economic, structural, commercial, or risk issues.
10.4 Challenges of an integrated multi-modal transit system
Integrating non-traditional transportation modes into transit systems in North America comes with several challenges.
Challenges
Full implementation:
Non-traditional modes of transit require a commitment to implement the full suite of infrastructure to make the modes effective. Roadside or integrated lanes, signage, parking spaces/docks and recharging stations.
Urban space:
Constraints in urban space availability can complicate integration, particularly lack of waterfront land for new ferry terminals and parking spaces for integrating with larger transit systems.
Geographical barriers:
Challenging terrains can hinder integration.
Recommendations
Joint initiatives:
Optimization of land use may require joint initiatives.
Innovation:
Prioritize user-centered, innovative systems.
Collaboration:
Collaborative efforts are needed for an inclusive, efficient, multi-modal transit network. Working with urban planners, designers, user experience (UX) researchers and land economists to design an integrated system during the planning phase is crucial.
95
Table 10: Integrated multi-modal transit systems: Challenges and recommendations
Challenges
Access:
Ensuring equitable access adds complexity.
Recommendations
Fare integration
Lack of fare integration can impact transit integration.
10.5 Supply chain constraints
Supply chain challenges affect not only non-traditional systems but also traditional transit systems, such as buses. During the pandemic, procuring electric buses took over a year. Several agencies today report wait times of over 18 months presently. The complex features of non traditional systems may cause further delays. For example, some modes like ferries require specialized components with limited suppliers, resulting in higher costs and potential global supply chain delays.
In the case of micromobility, North America lacks an established bicycle market, making it expensive. This market can only develop with higher demand. Non-traditional solutions like autonomous vehicles face ongoing research and development delays, complex technology integration, regulatory uncertainties and a shortage of specialized workers. Addressing these challenges requires a comprehensive approach involving supplier collaboration, research, regulatory compliance and contingency planning. These areas require investment to help build the market. As non-traditional transit modes of transportation gain popularity, adaptable supply chain strategies may alleviate these issues over time.
96
Conclusion 11
This report has examined five non-traditional modes of transportation systems: aerial gondolas, bike-share programs, ferries, on-demand transit services and autonomous shuttles. It has explored the use case for each mode, with a specific emphasis on potential advantages and obstacles, project models, ridership, infrastructure, operational costs, challenges and recommendations.
These innovative transportation solutions present cost-effective alternatives for addressing firstand last-kilometre connectivity, uniting communities, and catering to geographically isolated and challenging regions where conventional transit infrastructure may prove impractical.
The report explores the potential of non-traditional transit modes to increase ridership and provide citizens with a responsive, multi-modal, interconnected transit system. The report also stresses the importance of assessing the applicability and suitability of each mode within its specific context and purpose. Furthermore, it describes the conditions for effective implementation, such as integrating these technologies with the broader transit system to enhance connectivity and ridership. It also highlights the infrastructural requirements for successful deployment, such as dedicated or integrated lanes, signage, parking spaces/docks and recharging stations. It acknowledges the challenges of raising public awareness, creating a conducive regulatory environment and building transit capacity to manage and market capacity to supply, as these modes are less common or still in development compared to conventional transit.
The report presents various case studies, shedding light on costs, revenue generation opportunities and investment possibilities. Drawing inspiration from innovative initiatives worldwide, Canada can explore and implement non-traditional transit modes while ensuring comprehensive cost estimation and analysis considering technological, social, environmental and economic perspectives. Furthermore, developing regulations and standards, particularly in cybersecurity, technology standardization and interoperability is essential for these innovative transit solutions to be successfully deployed.
There are many opportunities for private providers to partner with transit agencies to build effective non-traditional modes of transportation as local transit solutions. Private providers can offer their expertise, innovation and resources to help transit agencies overcome the barriers and leverage the potential of non-traditional modes of transport.
97
CHAPTER 11
References
[1] Leitner, "Report 2022," 2022, Available: https://www.leitner.com/en/company/annualreports/.
[2] A. Asquith, "Gondola is best transit option between downtown and Old Strathcona, advisory board says," in CBC News, ed. Edmonton: CBC News, 2018.
[3] SCJ Alliance. (2010, 2023/14/09). Aerial Trams vs Gondolas. Available: https://www. gondolaproject.com/2010/07/10/aerial-trams-vs-gondolas/
[4] SCJ Alliance. (2016, 2023/14/09). A Reminder on Cable Car Safety. Available: https:// www.gondolaproject.com/2016/01/19/a-reminder-on-cable-car-safety/#:~:text=In%20 short%2C%20when%20compared%20to,safest%20amongst%20the%20transit%20 technologies
[5] Canada Energy Regulator. (2019, 2023/08/14). Towards Net-Zero: Electricity Scenarios. Available: https://www.cer-rec.gc.ca/en/data-analysis/canada-energy-future/2021/ towards-net-zero.html# :~:text=The%20GHG%20emissions%20intensity%20of%20 Canada%E2%80%99s%20electricity%20generation,to%20120%20gCO%202%20 e%2FkWh%20in%202019.%2043
[6] Translink. (2022, 2023/10/08). What you need to know about the proposed Burnaby Mountain Gondola. Available: https://buzzer.translink.ca/2022/02/what-you-need-toknow-about-the-proposed-burnaby-mountain-gondola/
[7] J. Richer, "Quebec City-Lévis tunnel could cost more than $7B, take 10 years to build," in Montreal Gazette, ed. Quebec, 2021.
[8] CERTU, "Aerial cableways as urban transport systems," STRMTG - CETE 2011.
[9] "Safety Standards Act - Elevating Devices Safety Regulation," in B.C. Reg. 101/2004, ed. Canada, 2004.
[10] "Technical Standards & Safety Act (TSS Act)," in S.O. 2000 vol. c. 16, ed. Canada: Government of Ontario, 2000.
[11] L. Poma, "Urban Cable Transportation Sustainable Mobility Solution," 2022, Available: https://www.poma.net/wp-content/uploads/2023/02/Dossier-de-presse-POMA-Urbain2022-ENG.pdf.
[12] C. Moore. (2016). Roosevelt Island Tramway - New York. Available: http://travel-tips.
98
References
s3-website-eu-west-1.amazonaws.com/holiday-travel-tips-new-york-ny-usa-RooseveltIsland-Tramway.htm
[13] The Portland Bureau of Transportation. Available: https://www.portland.gov/ transportation/permitting/apply-special-event-permit
[14] Y. Gualdrón, "Línea K del metrocable disminuyó asesinatos en la comuna 1 de Medellín," in logo-eltiempo, ed, 2013.
[15] Translink, "Burnaby Mountain Gondola Route Selection Report," 2021.
[16] (1998). 10709, Official Community Plan. Available: https://www.burnaby.ca/sites/ default/files/acquiadam/2021-05/OCP%201998%20%28full%20version%29.pdf
[17] Employment Standards Act, 1996.
[18] France_Mobilities. (2023). Creteil - Villeneuve-Saint-Georges. Available: https://www. iledefrance-mobilites.fr/le-reseau/projets/cable-1-nouvelle-ligne-creteil-villeneuvesaint-georges
[19] C. Halpern, Buckingham, C., Maggioni, A, "Technical report for Stage 3 city: Paris and Ile-de-France," Congestion Reduction in Europe - Advancing Transport Efficiency, 2017.
[20] M. S. Bahadori, Gonçalves, A.B., Moura, F. A, "A Systematic Review of Station Location Techniques for Bicycle-Sharing Systems Planning and Operation," ISPRS Int. J. Geo-Inf, vol. 10, p. 554, 2021.
[21] D. Zipper, "How the Dutch Mastered Bike Parking at Train Stations," in Bloomberg, ed, 2023.
[22] Vancouver Bike Share Inc, "Vancouver's Public Bike Share Launches E-Bikes," ed, 2022.
[23] City of Amsterdam, "Long-term Bicycle Plan 2017-2022," 2017, Available: https:// bicycleinfrastructuremanuals.com/manuals4/GemeenteAmsterdam-long-term_bicycle_ plan_2017-2022_English.pdf.
[24] Institute of Transportation Study, "A Global High Shift Cycling Scenario: The Potential for Dramatically Increasing Bicycle and E-bike Use in Cities Around the World, with Estimated Energy, CO2, and Cost Impacts," Institute of Transportation and Development Policy, 2016.
99
References
[25] K. Miyata, "The Unique Safety of Cycling in Tokyo," Vision Zero Cities Journal, 2019.
[26] United Cities and Local Goverments Asia Pacifics. (2023). Hangzhou: Public bicycle sharing and green travel practice. Available: https://uclg-aspac.org/hangzhou-publicbicycle-sharing-and-green-travel-practice/
[27] N. Blain, "BIXI: Montreal's Bike-Sharing System," Tools of Change2013, Available: https://www.toolsofchange.com/userfiles/BIXI%20Case%20Study(1).pdf, Accessed on: 2023/11/05.
[28] Citi-bike. (2023/11/02). Get to know Citi bike. Available: https://citibikenyc.com/how-itworks
[29] New York City home, "Citigroup Renews NYC Bike-Share Sponsorship — Is It Time For Public Funding?," ed: Streetsblog New York City home, 2023.
[30] PNSC. Montreal Bike Share. Available: https://www.pbsc.com/cities/montreal-bike-share
[31] Nethris, "BIXI: Adapting during a pandemic," vol. 2023, ed.
[32] BIXI Montréal, "BIXI'S popularity continues to grow: Record-breaking ridership numbers in May," B. Thériault, Ed., ed. https://www.newswire.ca/: Cision, 2023.
[33] M. Winters, S. Therrien, J. McKeen, and K. Hosford, "Vancouver Bike-share 2018 Member Survey Results," in "Understanding a New Bike Share Program in Vancouver," Simon Fraser University - Faculty of Health Sicences2019, Available: https://cyclingincitiesspph.sites.olt.ubc.ca/files/2019/06/MobiMemberSurvey_2018Results.pdf, Accessed on: 2023/12/6.
[34] B. J. Cudahy, Over and Back- The History of FerryBoats in NewYork Harbour. Fordham University Press New York, 1990.
[35] J. Walker. (2016). Basics: Where Can Ferries Succeed? Available: https://humantransit. org/2016/12/ferries-opportunities-and-challenges.html
[36] H. Cheemakurthy, Tanko, M., Garme, K, "Urban waterborne public transport systems: An overview of existing operations in world cities," KTH Royal Institute of Technology2016, Available: https://www.diva-portal.org/smash/get/diva2:1168873/FULLTEXT01.pdf.
[37] M. Helgesson, "Feasibility Study of the Decarbonisation and Electrification of a Commuter
100
References
Ferry in Stockholm city," School of Engineering Sciences in Chemistry, Biotechnology and Health, KTH Royal Institute of Technology, 2020.
[38] Z. Jamshed, "The surprising history of Hong Kong’s 120-year-old Star Ferry," in CNN Travel, ed, 2018.
[39] J. NG. (2020, 10/19). The Importance of Land Reclamation in Hong Kong and Its Impacts. Available: https://earth.org/land-reclamation-hong-kong/#
[40] E. G. Fitzsimmons, "Operator for New York’s Growing Ferry Service Is Picked," in New York Times, ed, 2016.
[41] A. Nilsen. (2022, 10/16). Brisbane’s new ferry terminals — flood-resilient, practical and iconic. Available: https://www.aurecongroup.com/about/sustainability-aurecon/ sustainability-stories/brisbane-ferry-terminals
[42] J. J. O'Brien. (2020). What is On-Demand Transportation? Available: https://www.liftango. com/resources/what-is-on-demand-transportation
[43] S. Liyanage, Dia, H., Abduljabbar, R., Bagloee, S.A., "Flexible Mobility On-Demand: An Environmental Scan," Sustainable Public Transportation in the Digitalization Era, 2019.
[44] X. Dong, "Trade Uber for the Bus? An Investigation of Individual Willingness to Use RideHail Versus Transit," Journal of the American Planning Association, 2020.
[45] C. Mulley, Nelson, J.D., "Flexible transport services: A new market opportunity for public transport," Research in Transportation Economics, 2009.
[46] J. Brake, Mulley, C., Nelson, J.D., Wright, S., "Key lessons learned from recent experience with Flexible Transport Services," Transport Policy, vol. 14, no. 6, pp. Pages 458-466, 2007.
[47] J. Blenkarn. (2023, 2023/12/14). RideCo's Capacity Configuration Optimizer Automates Your Fleet for Higher Productivity. Available: https://www.rideco.com/post/capacityconfiguration-optimizer
[48] J. Blenkarn. (2023, 11/26). An In-Depth Analysis of On-Demand Transit Use Cases: Paratransit. Available: https://www.rideco.com/post/paratransit-use-case
[49] M. C. Lesh, "Innovative Concepts in First-Last Mile Connections to Public Transportation,"
101
References
Urban Public Transportation Systems, 2013.
[50] Green Municipal Fund. (2020). Case study: Innovative on-demand transit system gets Cochrane, AB, residents where they’re going. Available: https://greenmunicipalfund. ca/case-studies/case-study-innovative-demand-transit-system-gets-cochraneab-residents-where-theyre# :~:text=Theper%20cent%2020Cochraneper%20 cent%2020Onper%20cent%202Ddemandper%20cent%2020Localper%20cent%20 20Transitper%20cent%2020(COLT)per%20cent%2020systemper%20cent%20 20is,andper%20cent%2020moreper%20cent%2020thanper%20cent%2020150per%20 cent%2020stops.
[51] The International Transport Forum, "Shared Mobility Simulations for Helsinki," in "CaseSpecific Policy Analysis," OECD Publishing2017, Available: https://www.itf-oecd.org/ sites/default/files/docs/shared-mobility-simulations-helsinki.pdf.
[52] City of Leduc. (2021, 09/26). On-Demand Transit is now in service. Available: https:// www.leduc.ca/news/demand-transit-now-service
[53] City of Leduc, "2018 Transportation Master Plan," 2018, Available: https://www.leduc.ca/ sites/default/files/FINAL%20CoLeduc%20TMP%20-%20Oct%208%202018.pdf.
[54] York Region, "2023 Transit Initiatives," 2021-2025 Business Plan, 2023.
[55] L. Mellor. (2018, 12/14). Pantonium On-Demand Transit Project Begins In Belleville Ontario. Available: https://pantonium.com/pantonium-on-demand-transit-projectbegins-in-belleville-ontario/
[56] Y. Zhang, Farber, S., Young, M., "The Benefits Of On-Demand Transit In Belleville: Findings From A User Survey," Transport Research Board, 2020, Art. no. 01789767.
[57] Durham Region, "The Regional Municipality of Durham Report," in "2022 Annual Corporate Climate Change Action Plan Update," #2022-COW-3, 2022, Available: https://icreate7. esolutionsgroup.ca/11111068_DurhamRegion/en/regional-government/resources/ Documents/Council/Reports/2022-Committee-Reports/Committee-of-the-Whole/2022COW-03.pdf, Accessed on: March 23, 2023.
[58] Z. see.think.act. Clean Transportation with Autonomous Shuttles. Available: https://www. zf.com/mobile/en/technologies/autonomous_driving/stories/autonomous_shuttle.html
[59] R. Thakur, "Infrared Sensors for Autonomous Vehicles," Recent Development in
102
References
Optoelectronic Devices, R. Srivastava, Ed., 2017. [Online]. Available: https://www. intechopen.com/books/recent-development-in-optoelectronic-devices/infraredsensors-for-autonomous-vehicles.
[60] Transport Canada. (2021, 14/01). National Collision Database Online. Available: https:// wwwapps2.tc.gc.ca/saf-sec-sur/7/ncdb-bndc/p.aspx?i=32094&l=en&wk=33#o7
[61] CUTRIC, "CUTRIC "National Smart Vehicle Joint Procurement Initiative: RoutΣ.i™ predictive modelling of autonomous shuttle performance and passenger-carrying capacity of firstkm/last-km solutions”, CUTRIC-ACATS Project Final Report," 2020, Available: https:// cutric-crituc.org/research-resources/cutric-national-smart-vehicle-joint-procurementinitiative-rout%e2%88%91-i-predictive-modelling-of-autonomous-shuttle-performanceand-passenger-carrying-capacity-of-first-km-last-km-solution/, Accessed on: 2022-0226.
[62] J. Zmud, Goodin, G., Moran, M., Kalra, N., Thorn, E., Strategies to Advance Automated and Connected Vehicles. Washington, DC: The National Academies Press, 2017, p. 30.
[63] (2017). City of Calgary - Future of Transportation. Available: http://www.calgary.ca/ Transportation/TP/Documents/strategy/The-Future-of-Transportation-in-Calgary.pdf
[64] SmartCitiesWorld. (2022). Estonian company launches next-gen autonomous shuttle. Available: https://www.smartcitiesworld.net/connected-and-autonomous-vehicles/ connected-and-autonomous-vehicles/estonian-company-launches-next-genautonomous-shuttle-8278
[65] Editorial Staff, Paris Île-de-France: a first bus line entirely operated by autonomous shuttles, 2021. [Online]. Available: https://www.sustainable-bus.com/electric-bus/parisile-de-france-a-first-bus-line-entirely-operated-by-autonomous-shuttles/.
[66] Holo, "Oslo," ed, 2021.
[67] C. Choi, "World’s First Long-term Autonomous Driving Service North of the Arctic Circle Begins – Crucial Public Transport Link for Local Residents," ed. Inside Autonomous Vehicles, 2022.
[68] P. Brown, "Norway’s long-term autonomous vehicle project ends successfully," Electronics and Semiconductor, 2023.
[69] EasyMile, "Autonomous Shuttle Fleet on Public Roads in Monheim," ed, 2020.
103
References
[70] Monheim. (2020). Smart City. Available: https://www.monheim.de/homepage-english/ about-monheim/city-profile/smart-city
[71] E. Ludlow, "Waymo Cruise driverless cars are suddenly all over San Francisco," in Bloomberg, ed, 2023.
[72] State of California Department of Motor Vehicles. (2023, 10/18). DMV Statement on Cruise LLC suspension. Available: https://www.dmv.ca.gov/portal/news-and-media/ dmv-statement-on-cruise-llc-suspension/
[73] Isle of Wight. (2023). Isle of Wight Hovercraft (Hovertravel). Available: https:// www.visitisleofwight.co.uk/information/product-catch-all/isle-of-wight-hovercrafthovertravel-p146451
[74] A. O'Brian, "Ontario hovercraft company to launch 30-min transit from Toronto to Niagara region," in CTV News, ed. Toronto, 2022.
[75] D. Mitchell, "Hoverlink’s service between Niagara Region, Toronto delayed amid ‘complexities’ of project," in Global News, ed, 2023.
[76] J. Biba. (2023). What Are eVTOLs? Are They the Future of Aviation? Available: https:// builtin.com/transportation-tech/evtol-aircraft
[77] Vertical Flight Society. (2023, 15/01/2024). Joby Aviation S4 (production prototype). Available: https://evtol.news/joby-aviation-s4-production-prototype
[78] K. Othman, "Public acceptance and perception of autonomous vehicles: a comprehensive review," AI and Ethics, 2021.
104
