The Reverie Review
Q2 2024 | Market Report


Q2 2024 | Market Report
PRESENTED BY
DISCLAIMER: SOURCE: REALTRACS BASED ON DATA SUPPLIED BY THE GREATER NASHVILLE ASSOCIATION OF REALTORS MULTIPLE LISTING SERVICE. THE INFORMATION, DATA, AND FIGURES CONTAINED HEREIN ARE PROVIDED FOR GENERAL INFORMATIONAL PURPOSES ONLY. WHILE EVERY EFFORT HAS BEEN MADE TO ENSURE THE ACCURACY, COMPLETENESS, AND RELIABILITY OF THE INFORMATION, CORCORAN REVERIE MAKES NO REPRESENTATIONS OR WARRANTIES, EXPRESS OR IMPLIED, REGARDING THE ACCURACY, ADEQUACY, VALIDITY, RELIABILITY, AVAILABILITY, OR COMPLETENESS OF ANY INFORMATION PROVIDED.


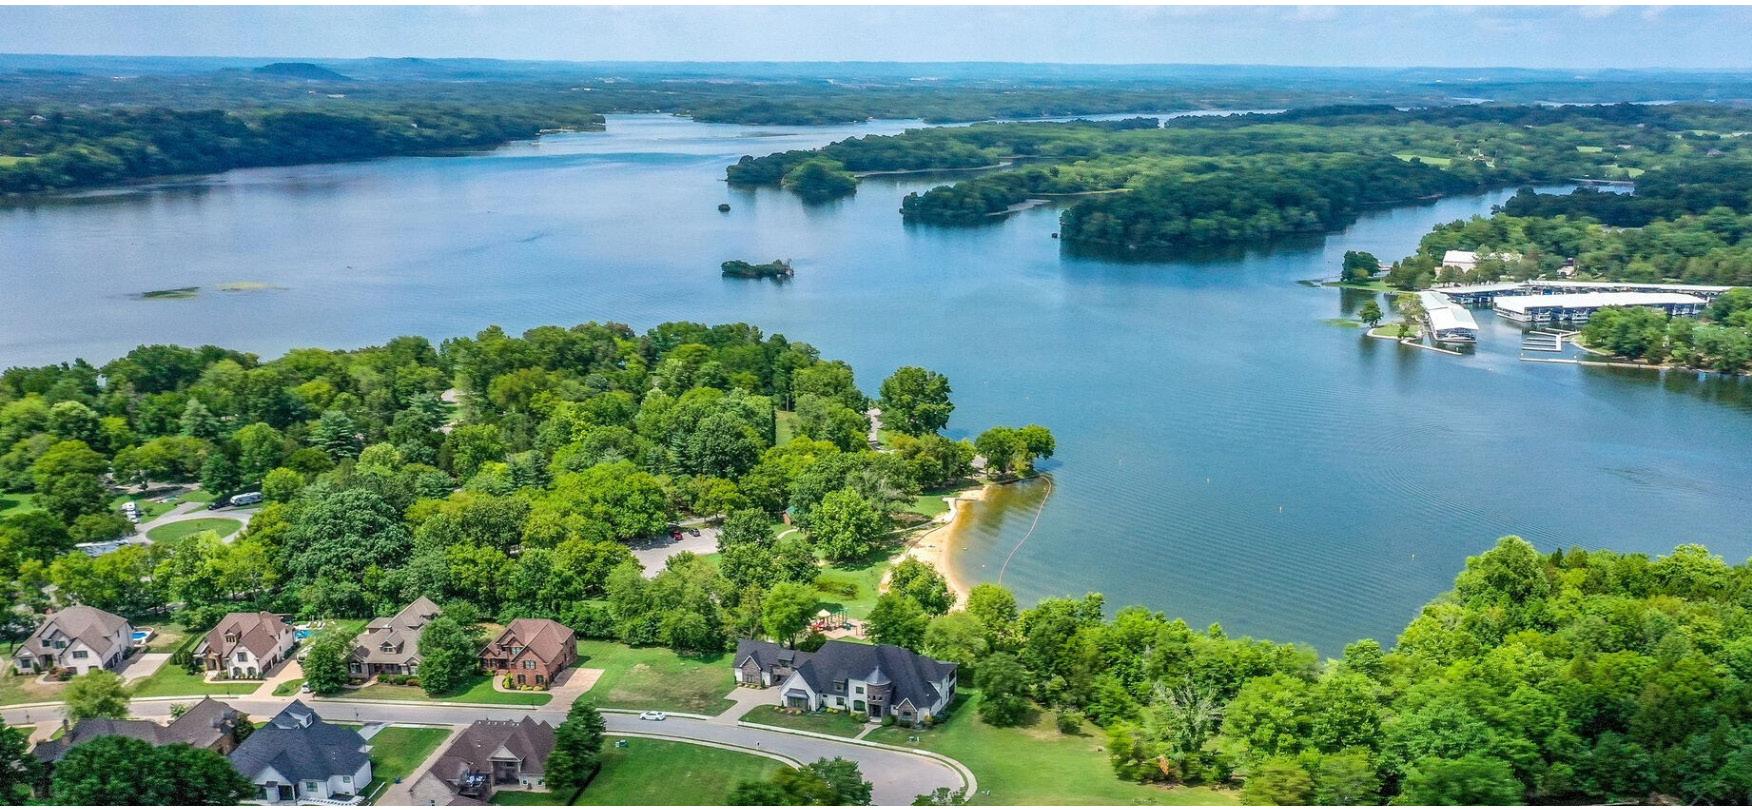
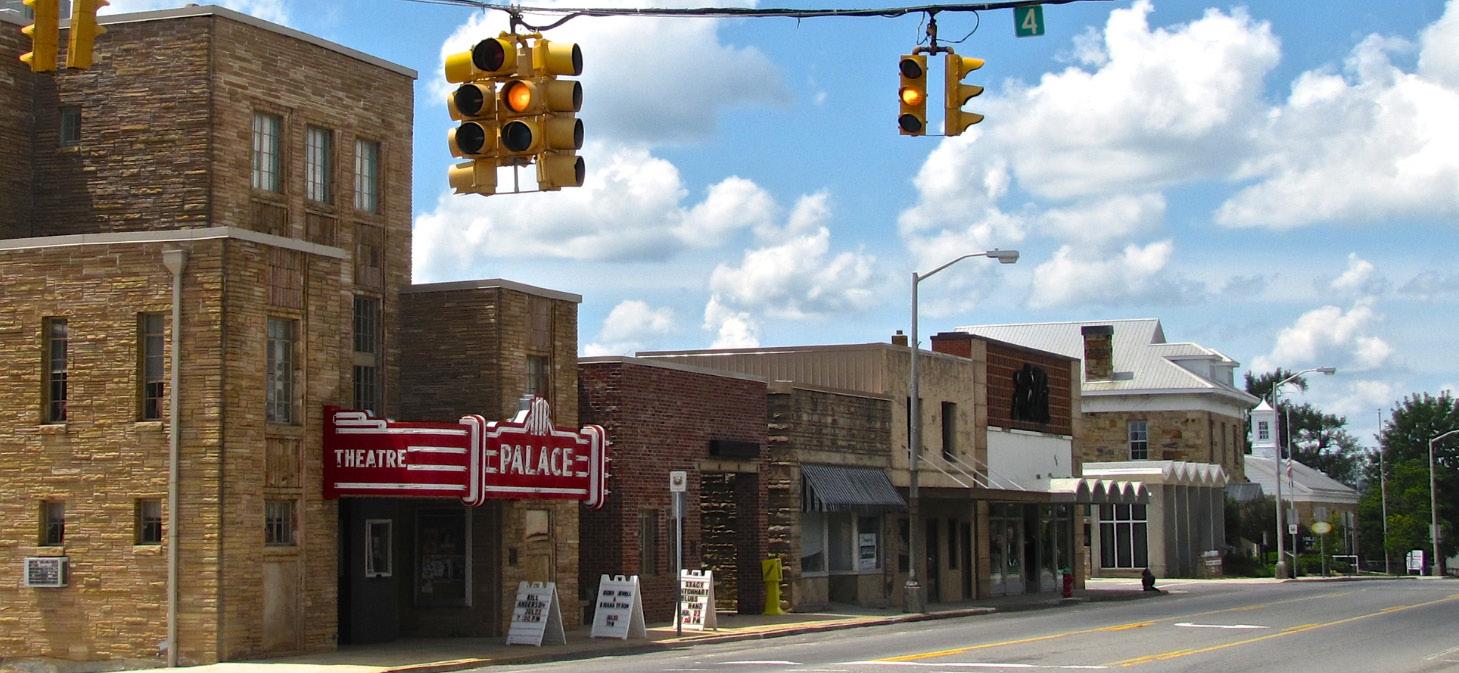
Now more than ever, Nashville is on the radar. Named one of the “Best Places to Travel” by Travel + Leisure, one of the “Top Places to Go” by The New York Times and one of the “Destinations You Don’t Want to Miss Out On” by Conde Nast Traveler, Nashville offers everything from an electrifying multigenre music scene, award-winning cuisine, historic homes, world-class art, a myriad of attractions, unique shopping, college and professional sports, and more.
A city with a backbeat and a twang that never forgets its roots. As the “Country Music Capital of the World,” Nashville is world-renowned for its music and honky-tonks. Although music influences virtually every aspect of modern life in the cosmopolitan city, Nashville has a diverse and storied history. While many people know that the city was founded on Christmas Eve in 1779, most do not know that President Roosevelt crafted the phrase “good to the last drop.”
Nashville is widely known as Music City–and for good reason. But music’s not the only thing that makes the city famous. Whether you’re a foodie, a history buff, or simply looking for a fun vacation destination, Nashville offers exciting and unique experiences for all ages and interests. If you appreciate art, Nashville’s got something for you, too. Whether it’s a walking tour of the city’s many murals or a day spent at a world-renowned museum, there’s
• Second Quarter 2024 Nashville sales increased by 43.8% from the First Quarter of 2024, reaching approximately 1,694 closings. Additionally, sales increased nearly 6% year-overyear from 2023. The high number of closed transactions is typical of the second quarter, as more closings take place during the busy summer months.
• Despite a two-year streak of decreases in the number of closed sales and contracts signed, the second quarter of 2024 saw the first year-over-year increase since 2021 for both categories. The City of Nashville had 1,703 contracts signed in the second quarter of 2024, a 5% increase from the second quarter of 2023 and an 18% increase from the first quarter of 2024.
• The average days on market for closed sales saw a 31% decline from the first quarter of 2024, a welcome break from the consistent three-quarter climb seen since the third quarter of 2023. The average time spent marketing properties for sale now sits at around 25 days, compared to last quarter’s 36-day average.
• Average and median price statistics rose across the board for the second consecutive quarter. In addition to more condo sales and a strengthening market in the $500K to $1M range, paired with an increase in sales over $1M, sellers continued to raise prices and were still able to attract interested buyers. This is evidenced by the increase in closed transactions and an approximately 9% rise in average prices year-over-year.
• The median price increased by approximately 3% year-over-year and is up by close to 7% from the first quarter of 2024. The median sales price rose to $608,300, influenced by the increase in transactions above $1M.
• Average price statistics rose by steeper amounts. The average price increased 9% annually to $848,019. Average price figures, while impacted by the same factors that drove median statistics higher, were especially affected this quarter by a 44% jump in sales.
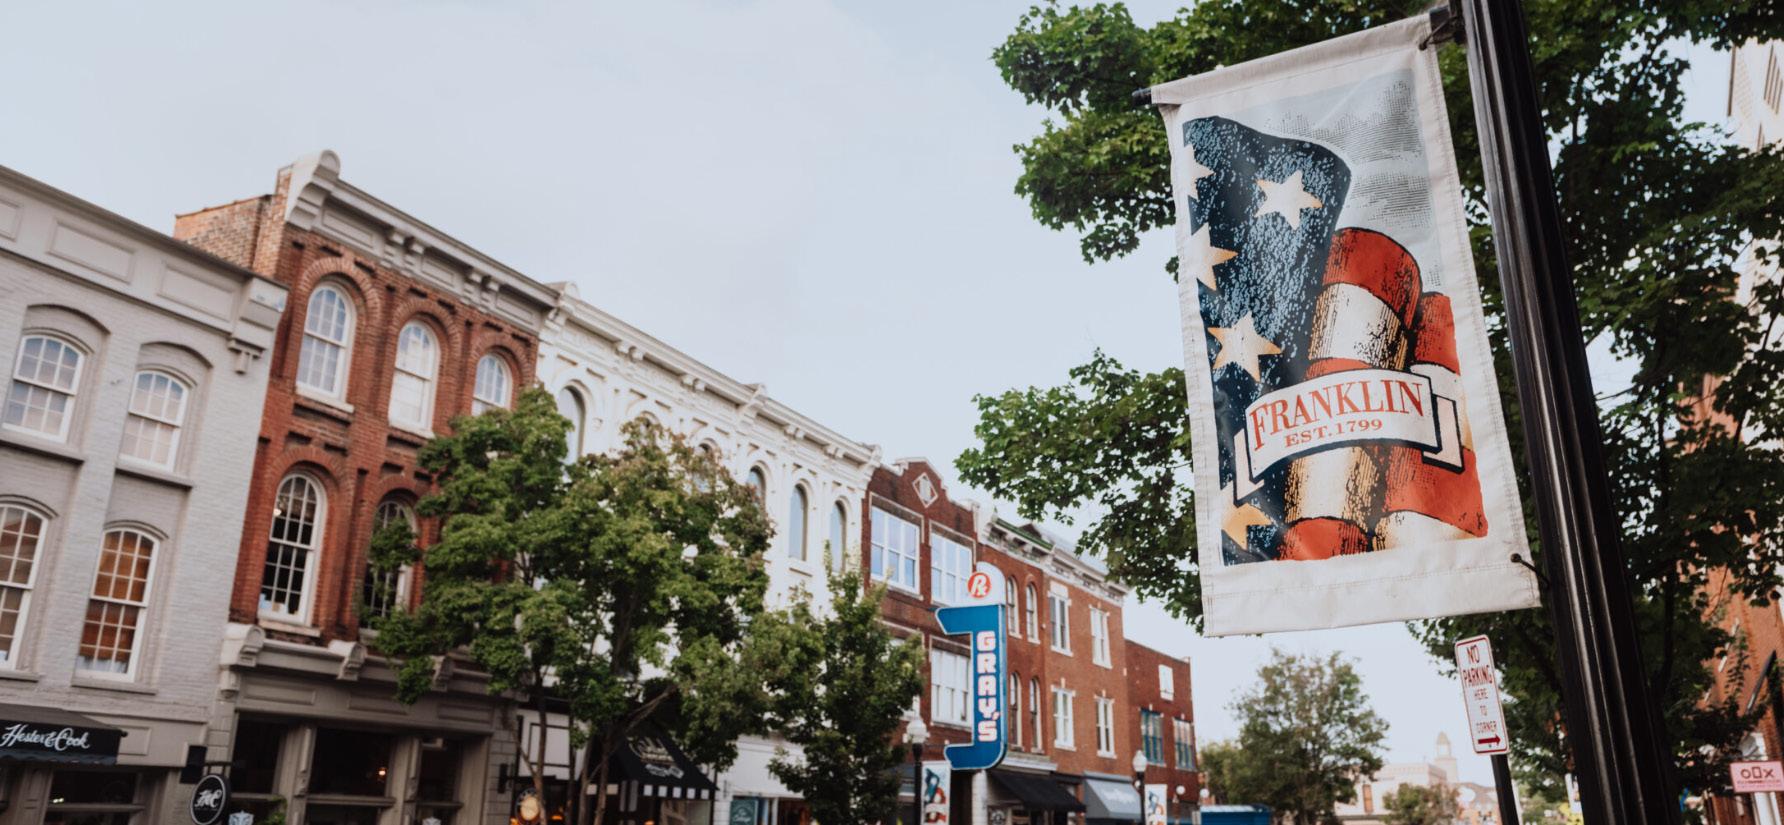
• Price statistics for the City of Franklin were the most stable of any product type, holding steady or declining by single digits compared to last year. The median price was essentially unchanged from last year at $975K. The average price declined by less than 1% to approximately $1.2M, driven by increased activity in comparable prime location luxury submarkets.
UNDER $500K
$500K TO $1M
$1M TO $3M
$3M TO $5M
$5M+
UNDER $500K
$500K TO $1M
$1M TO $3M
$3M TO $5M
$5M+
Days on market rose for every price range with the exception of the $3M to $5M categpry. Consistent with the ongoing trend of days on market rising most at the low-end, time spent marketing grew 240% to 34 days for $5M+ product. Residences that closed for $1M to $3M saw marketing time hold relatively steady.
Market share of sales shifted minimally for most price ranges versus last year; only the under $500K and $500K to $1M categories saw market share shift more than 2%. In the four years since inflation has been growing rapidly as a result of the global pandemic COVID-19, the market share of sales under $500K has decreased by over 20% while the market share of closings from $500K to $1M has increased to the largest market share at 46%, nearing the majority of all single family residence sales in Nashville, TN.
• In Second Quarter 2024, Nashville inventory rose nearly 30% year-over-year to 1,622 active listings, also up 20% compared to the first quarter of 2024.
• Coinciding with the year-over-year increase, Nashville still noted its typical seasonal rise in active listings versus the first quarter, as sellers tend to place their properties on the market prior to the busy summer months.
• Active listings increased in every price range this quarter except for the $3M to $5M price range. Listed inventory in the $500K to $1M and $1M to $3M ranges posted the biggest gains year-over-year, as those price ranges also saw the greatest year-over-year increase in sales during the second quarter of 2024. The $5M+ category saw a 56% increase year-over-year in active listings, the most notable increase in all price categories, coupled with a significant increase in the average number of days on market.

$500K TO $1M
$1M TO $3M
$3M TO $5M
$5M+
$500K TO $1M
$1M TO $3M
$3M TO $5M
$5M+


SINGLE FAMILY RESIDENTIAL SALES


BUYER REPRESENTED BY: AARON
LISTING REPRESENTED BY: AARON GOINS
BUYER REPRESENTED BY: CAROLINE COOK

CHLOE COURT
BUYER REPRESENTED BY: LAURA BAUGH
BUYER REPRESENTED BY: CAROLINE COOK
$2.1M
6068 PASQUO ROAD LOT 705
BUYER REPRESENTED BY: LAURA BAUGH
0 VAUGHN ROAD LOT 6 3122 BUTTERNUT DRIVE
LISTING REPRESENTED BY: AARON JOYCE & DELANEY CLINGER
RECOGNIZING THE OUTSTANDING EFFORTS OF WOMEN DRIVING THE ECONOMY FORWARD

AGENT BRINGS MUSIC AND MORTGAGE EXPERIENCE TO CORCORAN REVERIE
HOUSING WIRE REAL ESTATE NEWS

CORCORAN SCORES A TOUCHDOWN AS FORMER NFL STARS JOIN TEAMS IN NASHVILLE https://www.housingwire.com/articles/ https://www.realestatenews. https://www.rismedia.com/2024/06/17/ https://www.housingwire.com/articles/
HERE’S HOW NASHVILLE HOMEOWNERS CAN WIN AMID A ‘FLOOD OF CALIFORNIA PEOPLE’

CLIENTS SERVED
STATE SIDES RANK AVERAGE TRANSACTION PRICE 2023 SALES VOLUME STATE VOLUME NATIONAL VOLUME