The Reverie Review
Q2 2024 | Market Report


Q2 2024 | Market Report
DISCLAIMER: SOURCE: TRENDGRAPHIX BASED ON DATA SUPPLIED BY THE EMERALD COAST ASSOCIATION OF REALTORS MULTIPLE LISTING SERVICE AND CENTRAL PANHANDLE ASSOCIATION OF REALTORS MULTIPLE LISTING SERVICE. THE INFORMATION, DATA, AND FIGURES CONTAINED HEREIN ARE PROVIDED FOR GENERAL INFORMATIONAL PURPOSES ONLY. WHILE EVERY EFFORT HAS BEEN MADE TO ENSURE THE ACCURACY, COMPLETENESS, AND RELIABILITY OF THE INFORMATION, CORCORAN REVERIE MAKES NO REPRESENTATIONS OR WARRANTIES, EXPRESS OR IMPLIED, REGARDING THE ACCURACY, ADEQUACY, VALIDITY, RELIABILITY, AVAILABILITY, OR COMPLETENESS OF ANY INFORMATION PROVIDED.
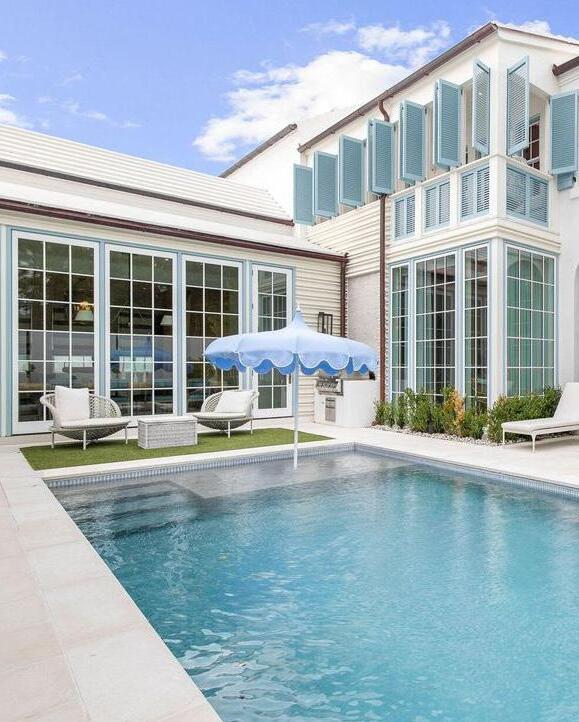


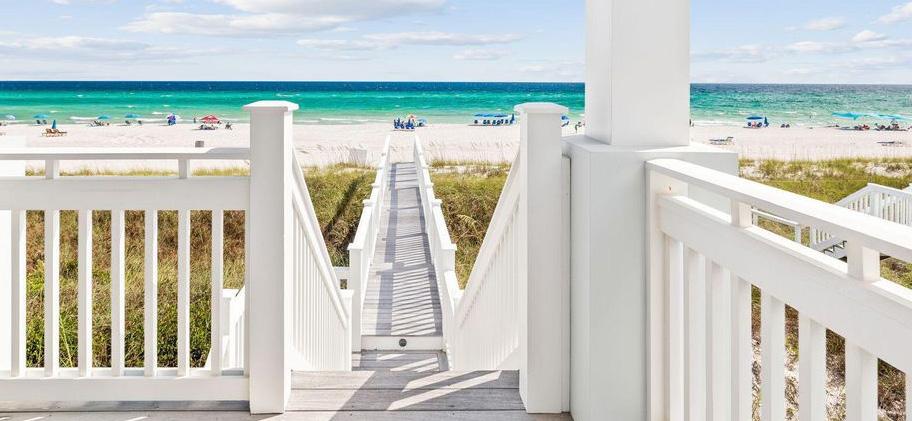
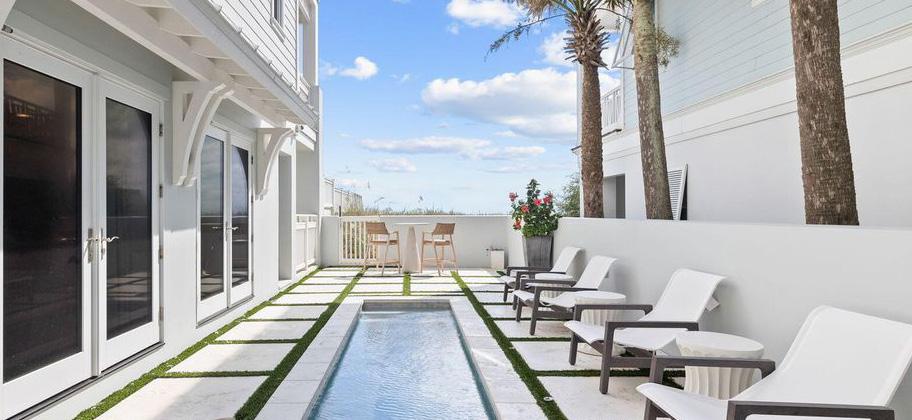
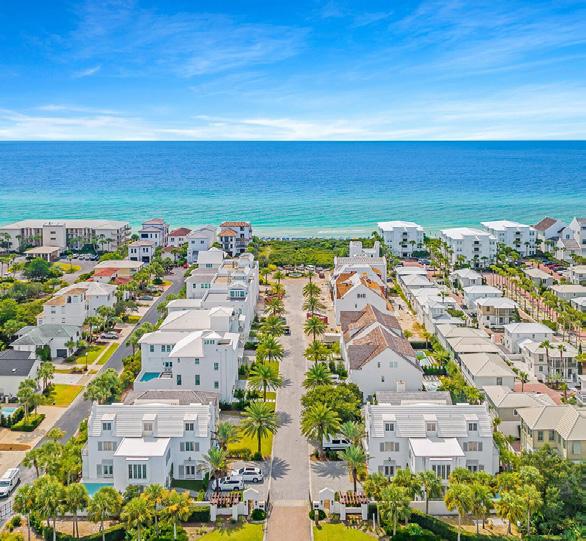
A place unluke anywhere else.
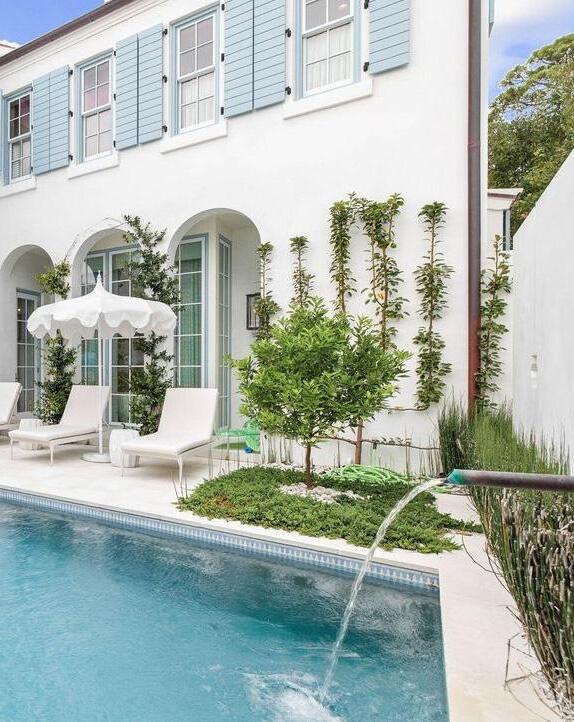
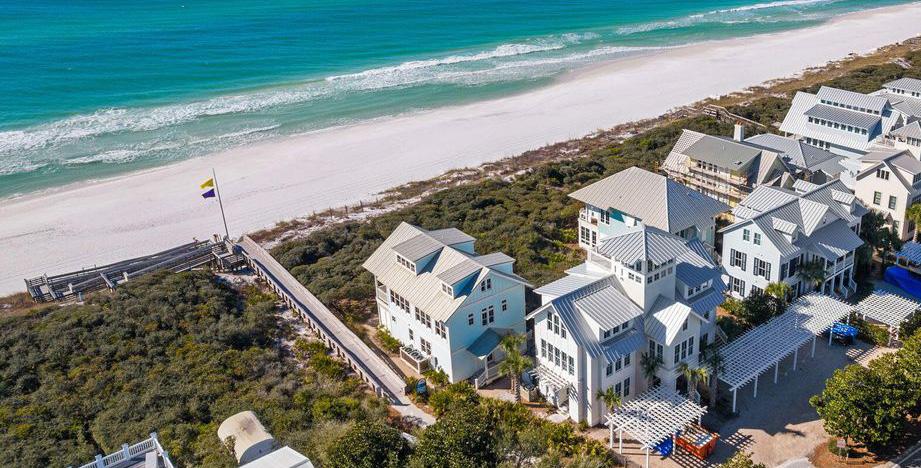
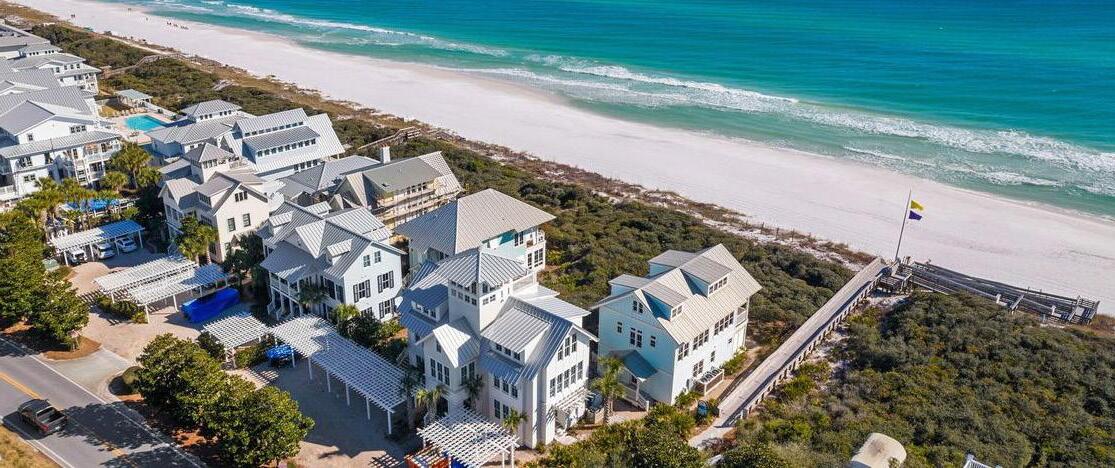
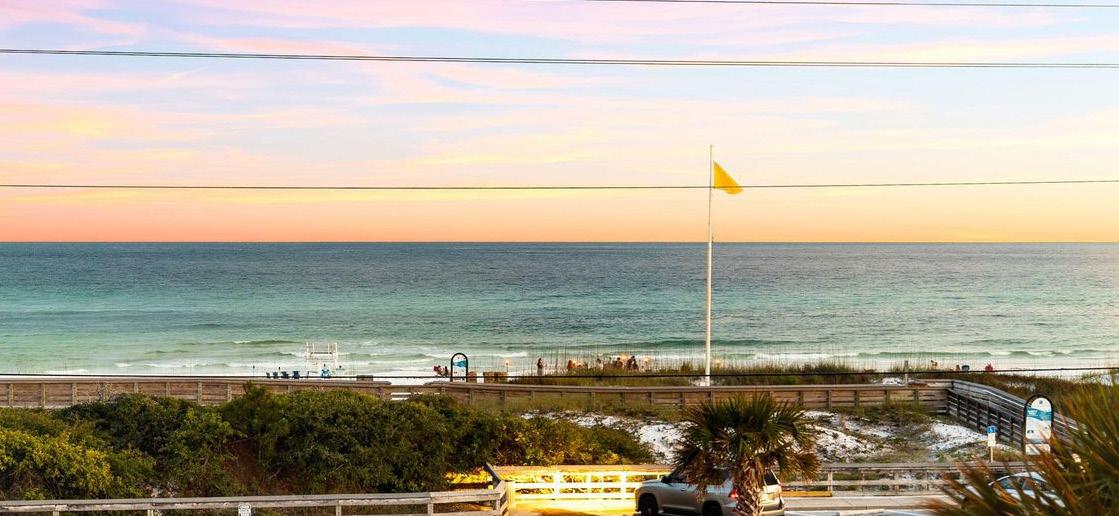
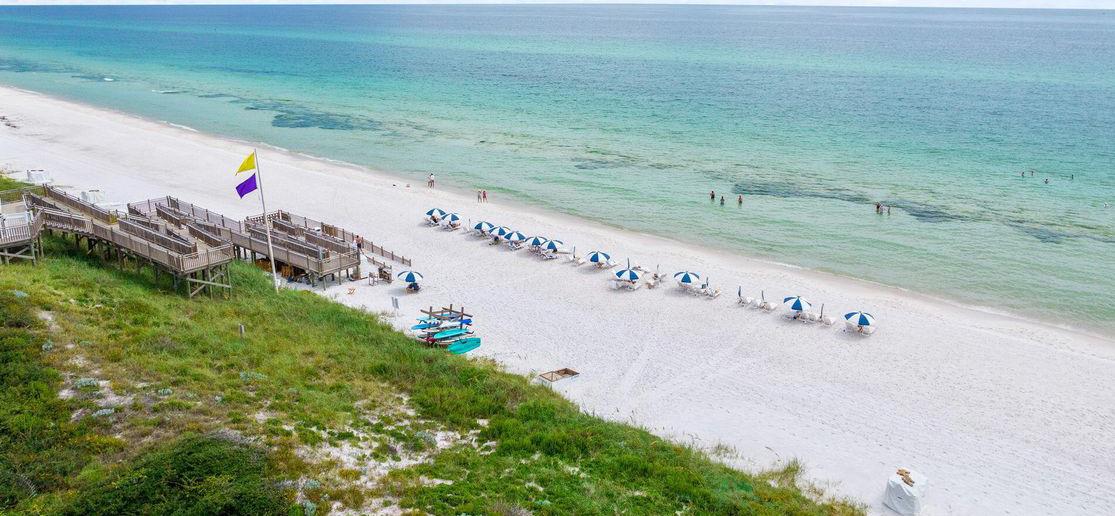
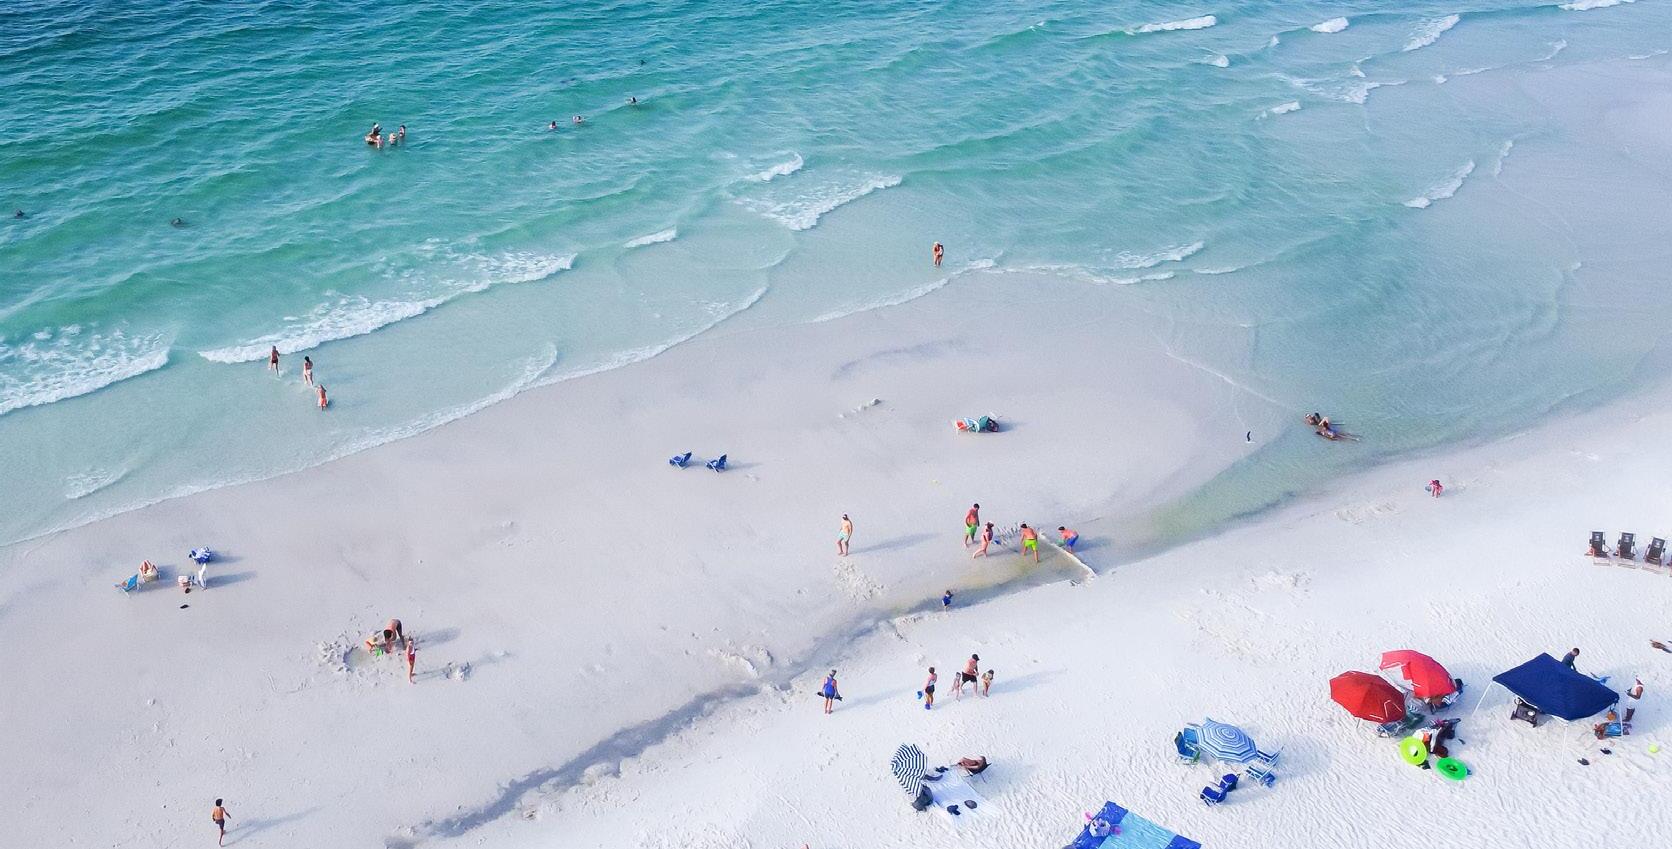
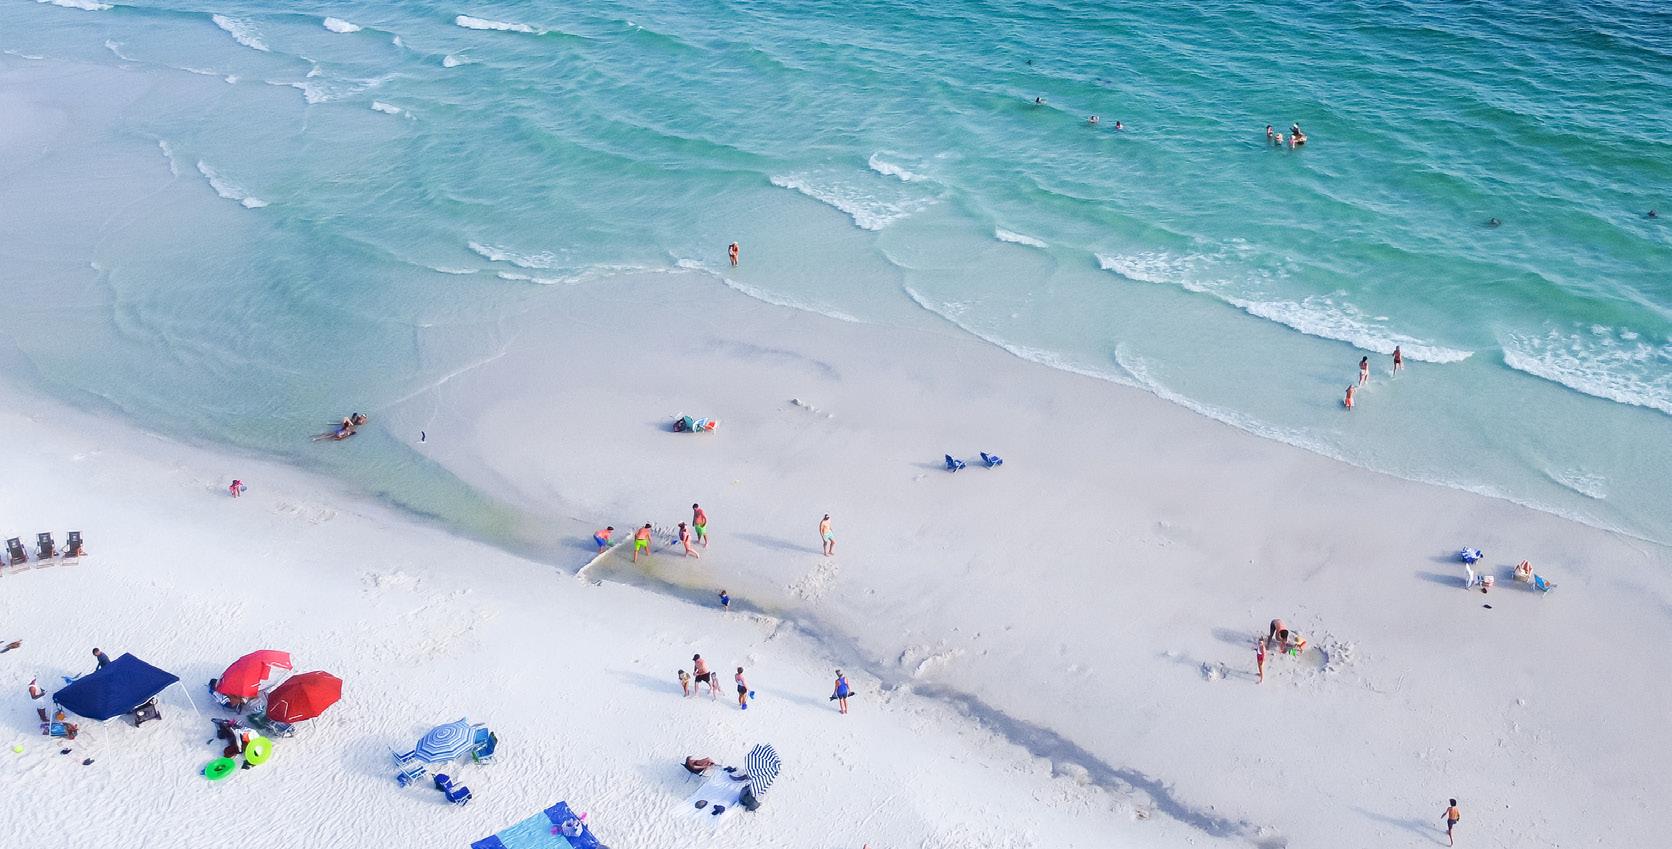
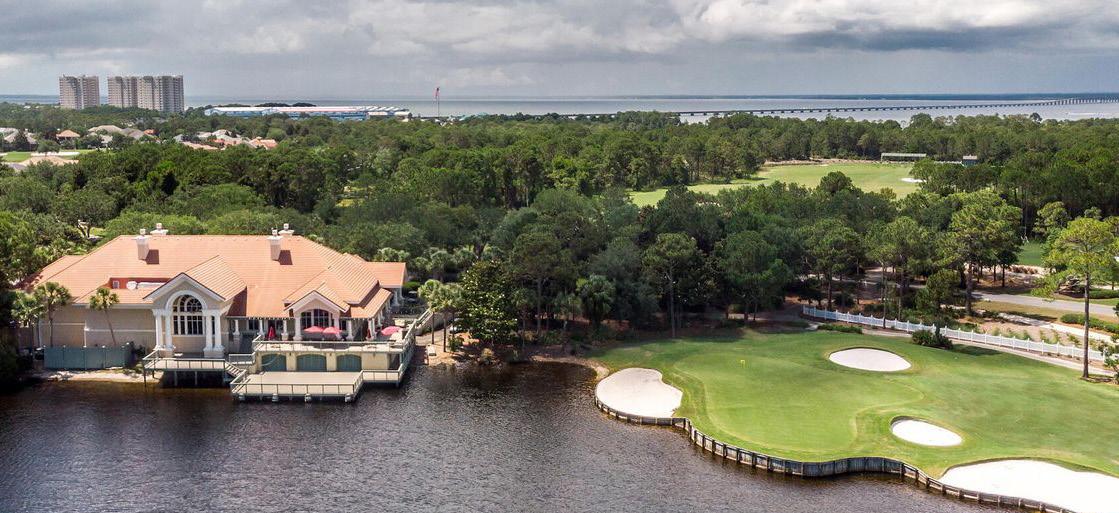
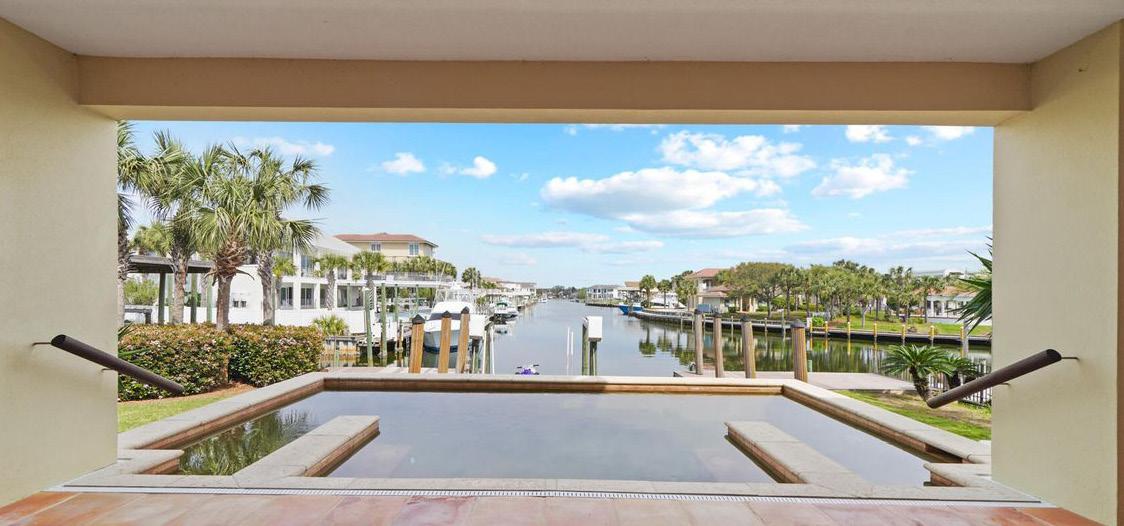
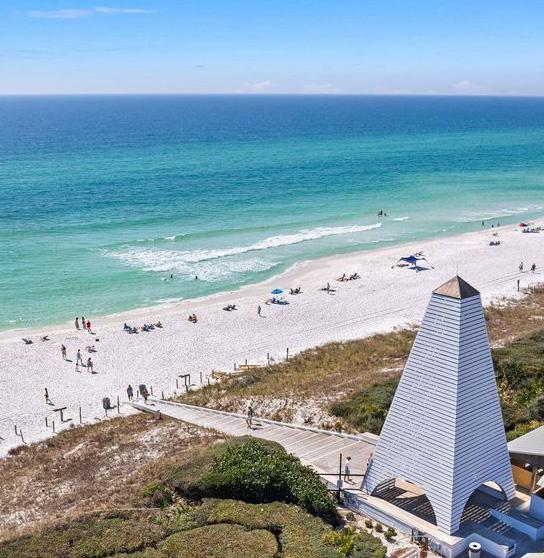
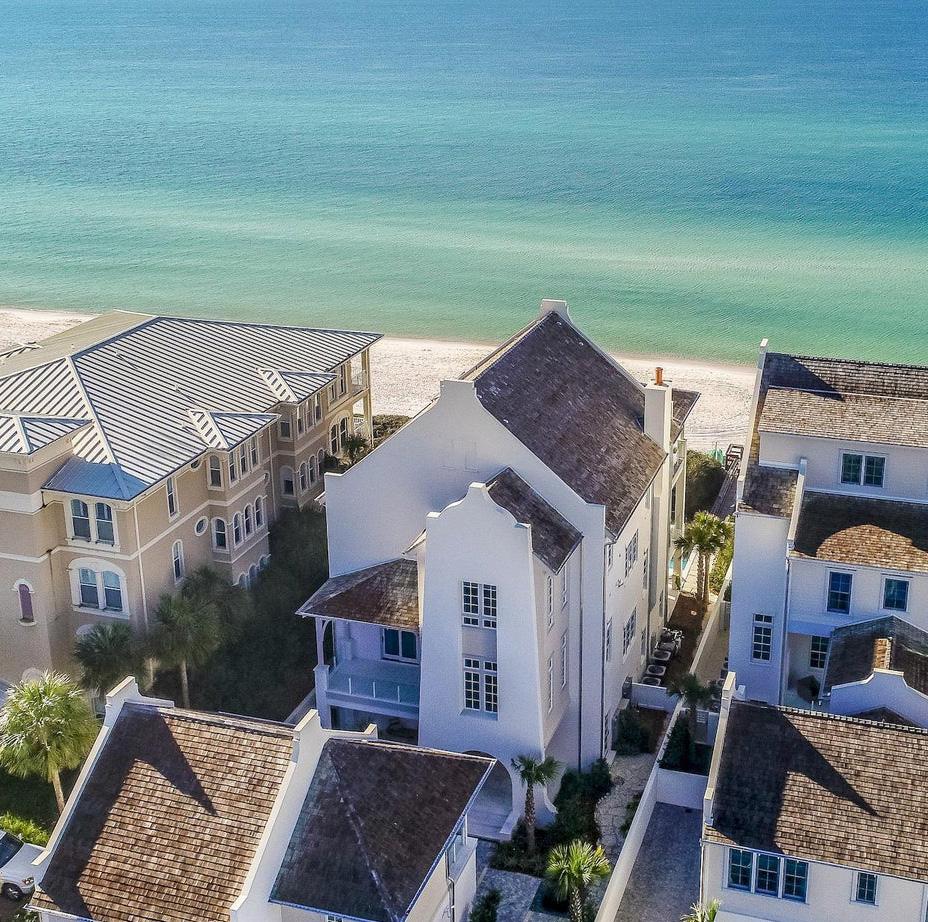
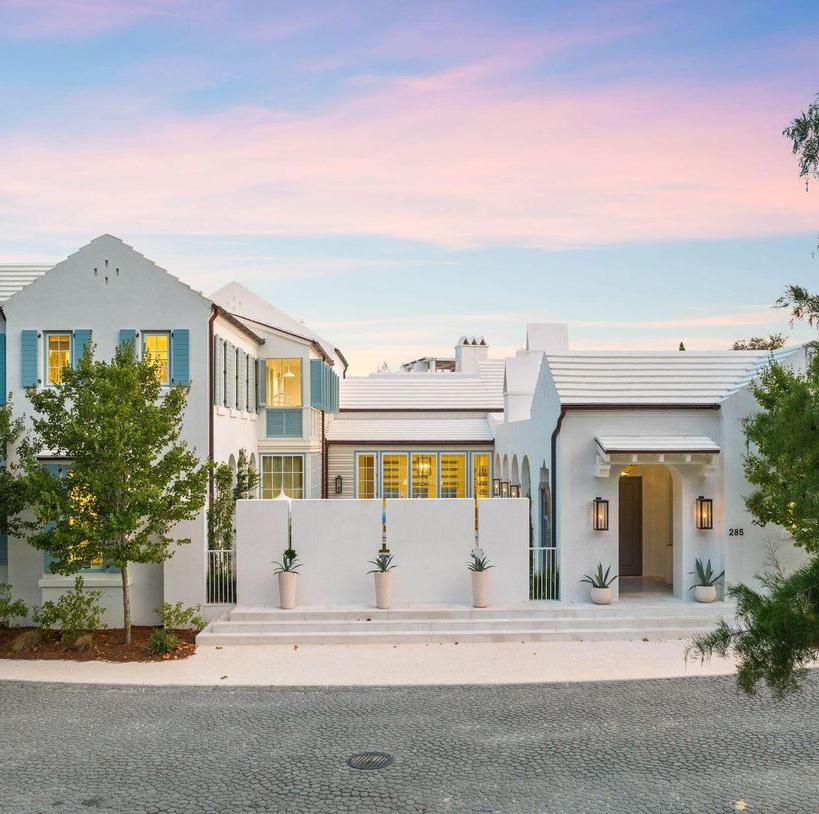
Scenic Highway 30A continues to captivate investors with its unparalleled beauty and exclusive charm. This 28.5-mile stretch along Florida’s Emerald Coast is renowned for its pristine white-sand beaches, crystal-clear turquoise waters, and rare coastal dune lakes. Envision waking up to the serene sounds of the Gulf, spending your days paddleboarding, kayaking, or biking through picturesque trails, and enjoying the quaint, upscale ambiance of communities like Rosemary Beach, Seaside, and Alys Beach. The area offers a unique blend of luxury living and small-town charm, making it a highly desirable destination for those seeking the finest in coastal living. The robust rental market, characterized by high occupancy rates and premium rental prices, continues to provide attractive income opportunities for investors.
Northwest Florida’s economic stability, bolstered by a thriving tourism sector and a favorable tax environment with no state income tax, enhances 30A’s appeal. The area’s continuous development, including new luxury projects and infrastructure improvements, promises to further elevate property values and investment potential. Scenic Highway 30A offers an exceptional blend of natural beauty, vibrant community life, and strong financial returns, solidifying its status as a premier location for both luxury living and investment.
• Sales declined by 4% year-over-year to approximately 272 closings, the lowest second-quarter figure since 2021 and the fourth year-over-year decrease in 14 quarters.
• The 32% increase in sales compared to First Quarter 2024 is typical of seasonality, as activity heats up with warmer weather and the holiday season, bringing an influx of visitors to 30A interested in relocating or purchasing a second home.
• Sales volume was $672.8 million, a slight decrease of 0.016% year-over-year, but considerably higher than First Quarter 2024. Despite the relatively minimal year-over-year decline in sales, the average price increased, meaning the lower number of closings barely impacted year-overyear sales volume.
• The 30A market had 244 contracts signed from March through June, down 9% from 2023. This is the third consecutive quarter that signed contracts have decreased on an annual basis, related to the post-pandemic cool-down in the number of people moving to 30A.
• Rising inventory and buyers patiently waiting for prices to fall further continue to push the average days on market higher. In Second Quarter 2024, days on market rose for the third straight quarter, up 24% annually to 87 days. This was the highest second-quarter average on 30A since 2020.
• Average price statistics climbed across the board, consistent with the stronger secondquarter performance seen over the past four years, while median pricing statistics fell. Despite a weakened market due to high leverage costs related to an uptick in interest rates, sellers were still capable of attracting buyers without sharply reducing prices, while others reduced prices to attract interest.
• The median price and price per square foot hit $1.56 million and $740 per square foot, respectively. The median sales price experienced a 10% drop year-over-year but was 10% higher than the First Quarter of 2024. A 2% drop in the number of closings over $3 million, partnered with a 1% rise in closings over $5 million, maintained the market share at the high-end sales this quarter.
• Average price statistics rose in contrast to median prices. The average price increased 3% annually to $2.461 million, while the average price per square foot rose 6% to $880. Average price figures, while impacted by the same factors that drove median statistics lower, were noticeably affected this quarter by a handful of $10 million+ sales, which drove average pricing up 16% compared to the last quarter.
• The $1 million to $3 million price statistics were the most stable of any product type, holding steady and increasing by double digits since the second quarter of 2022. The median price dropped from $1.74 million last year to $1.56 million, brought down by a larger gap in closed sales prices. Despite a very significant sale, the average price climbed 3% to $2.461 million as closings under $1 million fell 2% year-over-year, driven by flourishing activity in prime 30A East and 30A West luxury locations.
UNDER $500K
$500K TO $1M
$1M TO $3M
$3M TO $5M
$5M+ $10M+
UNDER $500K
$500K TO $1M
$1M TO $3M
$3M TO $5M
$5M+
$10M+
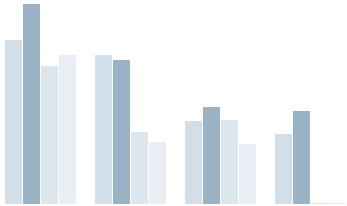
For the first time in a year, days on market increased across every price range, except for higher-end sales. Consistent with the ongoing trend, days on market rose most significantly at the lower end, with marketing time for properties under $500K nearly doubling. Residences that closed for $3 million to $5 million saw a steady increase in marketing time, while listings over $10 million reached a twoyear low, averaging just 13 days on market.
Market share of sales shifted for most price ranges compared to last year; only the sub-$500K and $5M+ categories saw market share shift around 1%. The $1 million to $3 million price range has maintained its position as the largest share of sales and has grown to take over the majority of all sales since the Second Quarter 2023. The $5M+ price range has seen the most significant increase in market share, rising from 4% in the Second Quarter 2021 to 11% in the Second Quarter 2024.
• In the Second Quarter of 2024, Scenic Highway 30A saw a significant 50% year-over-year increase in listed inventory, reaching 910 active listings. This was the highest number of active listings in a single quarter since before the pandemic.
• Alongside the year-over-year increase, 30A also experienced a more than typical seasonal rise in active listings compared to the first quarter, as sellers tend to place their homes on the market before the warmer summer months and the high season of visitors.
• Active listings increased across every price range this quarter, except for the under $500K range. The $1 million to $3 million price range posted the biggest gains year-over-year, as these price ranges also saw the greatest year-over-year increase in sales during the Second Quarter of 2024.
$500K TO $1M
$1M TO $3M
$3M TO $5M
$5M+
$10M+
$500K
$500K TO $1M
$1M TO $3M
$3M TO $5M


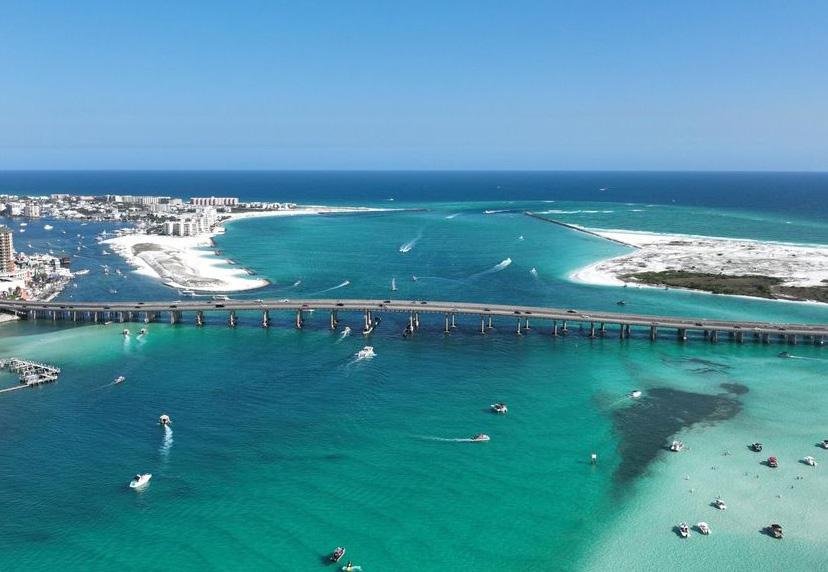
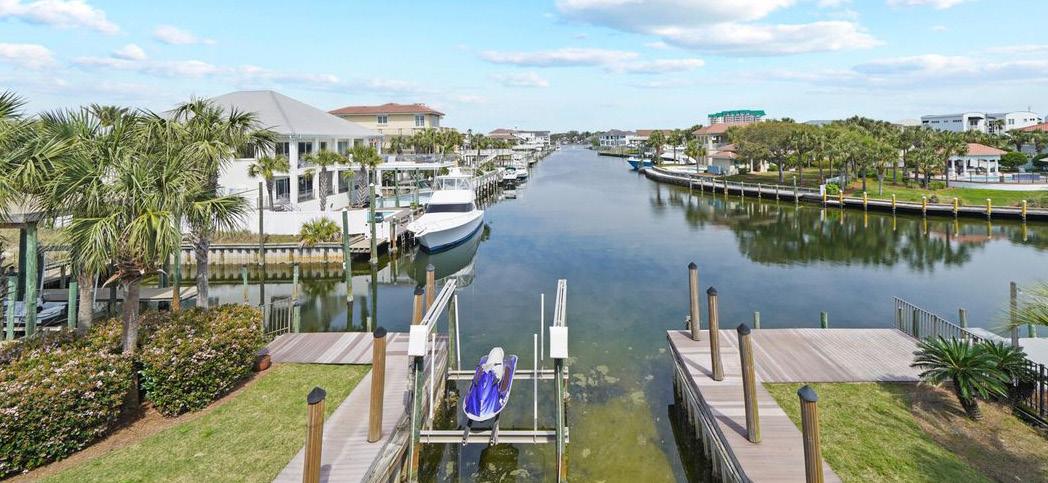
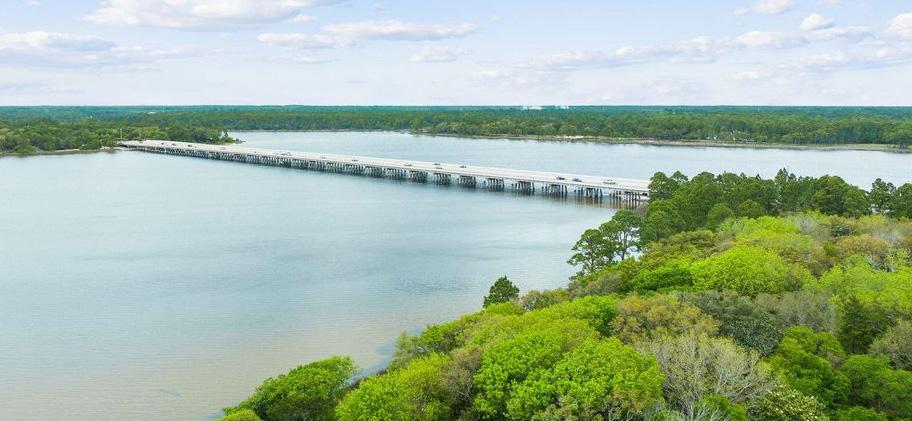
Nestled along the stunning Emerald Coast, Destin, Florida, offers a unique blend of natural beauty, upscale living, and robust financial returns, making it a premier destination for luxury real estate investment. Renowned for its pristine white-sand beaches and crystal-clear emerald waters, Destin provides a picturesque backdrop that attracts visitors and investors alike. The area’s scenic beauty, coupled with year-round sunshine, makes it an idyllic location for both vacationers and permanent residents seeking an upscale coastal lifestyle.
Destin is a vibrant and close-knit community, offering an array of exclusive amenities and activities. From world-class golf courses and deep-sea fishing to luxury shopping at Destin Commons and fine dining at award-winning restaurants, the lifestyle in Destin is nothing short of extraordinary. Destin boasts a lively harbor district with bustling nightlife, marinas, and a variety of entertainment options. This dynamic atmosphere, along with a rich calendar of events, ensures there’s always something to look forward to, enhancing the appeal and value of investing in this energetic coastal haven.
• In the Second Quarter of 2024, sales in Destin declined by 16% year-over-year, resulting in approximately 85 closings, the lowest second-quarter figure in four years. Despite this decline, sales rose by 16% compared to the First Quarter of 2024. This increase is typical of seasonality, as the warmer weather and summer season draw visitors interested in relocating or purchasing a second home.
• Sales volume was $91.86 million, down 20% year-over-year but only slightly lower than the First Quarter of 2024. The significant year-over-year decline in sales was accompanied by a doubledigit decrease in average price, which drove the volume lower.
• The Destin market had 86 contracts signed from March through June, down 14% from 2023. This is the second consecutive quarter that signed contracts decreased on an annual basis.
• In the Second Quarter of 2024, days on market fell for the first time in three quarters, decreasing by 4% year-over-year to 81 days. From the Second Quarter of 2021 to the First Quarter of 2023, the average days on market was significantly lower compared to previous years. However, following the postpandemic sales surge and increased interest rates, the average days on market has been trending upward since the Third Quarter of 2023.
• For the second consecutive quarter, both average and median price statistics experienced a decline across the board. The market weakened further due to high leverage costs stemming from a sharp rise in interest rates, resulting in fewer residential sales. Sellers, aiming to attract interest, continued to lower prices, while buyers, highly sensitive to value, were still heavily influenced by the elevated interest rates.
• Median and Average prices fell by 19% from the First Quater 2024, a significant drop when compared to the lesser drop in prices year-over-year. Median prices fell by 6% to 795K, while median PPSF experienced 3% drop from last year.
• The average price decreased by 4% annually to $1.095 million, while the average price per square foot fell 5% to $485. These average price figures, impacted by the same factors that drove median statistics lower, were particularly affected this quarter by a decrease in sales over $3 million.
• Single-family residences in Miramar Beach had the most stable price statistics of any product type, holding steady or declining by single digits compared to last year. The median price was essentially unchanged from last year at $1.128 million. The average price climbed 5% to $1.445 million as closings over $1 million rose 6% year-over-year, driven by a diminishing inventory of listings in the $500K-$1M range.
$500K
$500K TO $1M
$1M TO $3M
$3M TO $5M
Days on market fell significantly for properties in the $3 million to $5 million price range, while it rose noticeably for the $1 million to $3 million range. Consistent with the ongoing trend of longer marketing times at the lower end, the time spent marketing sub-$3 million properties grew by 30%, reaching 96 days. Conversely, residences that closed for $3 million to $5 million experienced a relative decline in marketing time.
Compared to last year, market share of sales shifted minimally across most price ranges, with only the $3 million to $5 million category experiencing a shift of more than 4%. Since the pandemic, the proportion of sales over $3 million has risen, while the share of transactions under $500K has diminished.
• In the Second Quarter of 2024, Destin’s listed inventory increased by 23% year-over-year, reaching 196 active listings. The market also experienced an 18% decline in new listings to 149, the lowest number of new listings in the second quarter since 2021.
• Despite the year-over-year decrease in new listings, Destin still experienced its typical seasonal rise in active listings compared to the first quarter, as sellers typically place their homes on the market before the warmer summer months and the high season when visitors are potentially interested in purchasing a second home at the beach.
• New listings decreased across all price ranges this quarter, except for the $5M+ range. Listed inventory in the $500K to $1M and $1M to $3M price ranges posted the biggest year-over-year gains, as these categories also saw the smallest year-over-year drops in sales during the Second Quarter of 2024. The $1M to $3M price category saw supply levels fall by 33% compared to last year.
$500K TO $1M
$1M TO $3M
$3M TO $5M
$5M+
$500K TO $1M
$1M TO $3M $3M TO $5M

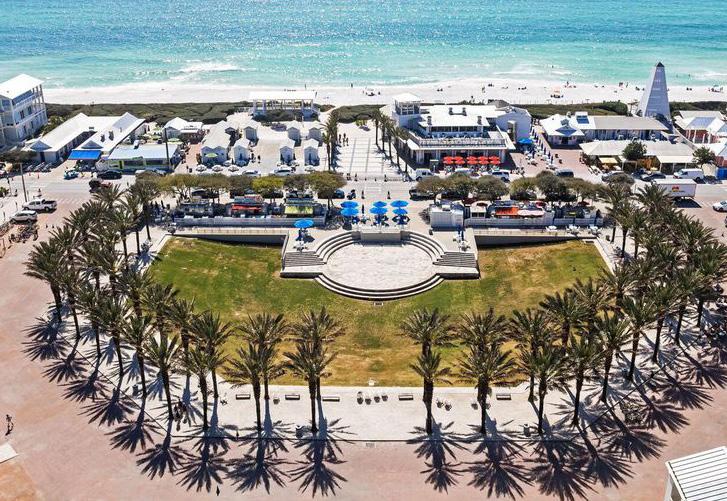
Where the sand meets the surf, you’ll find it all.
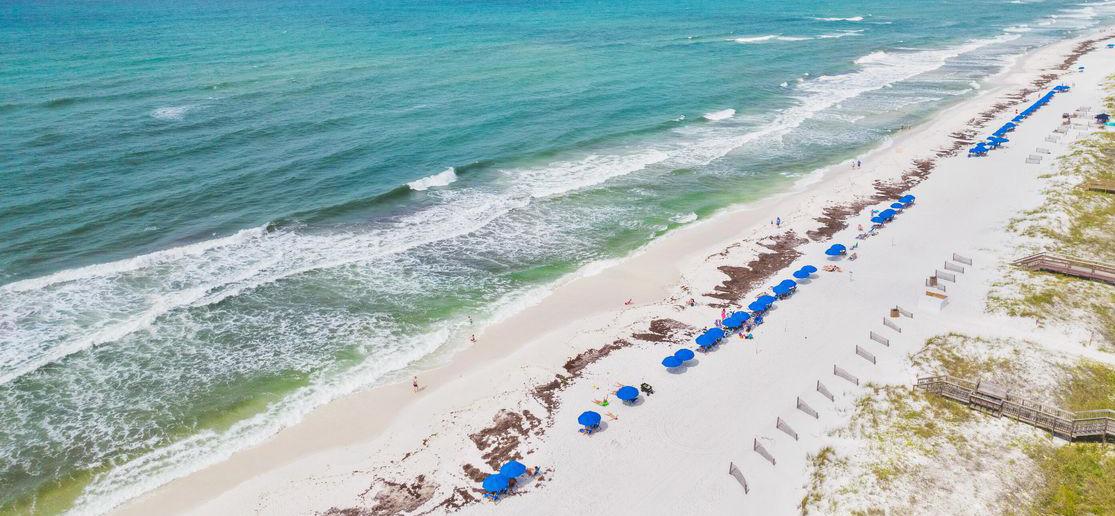
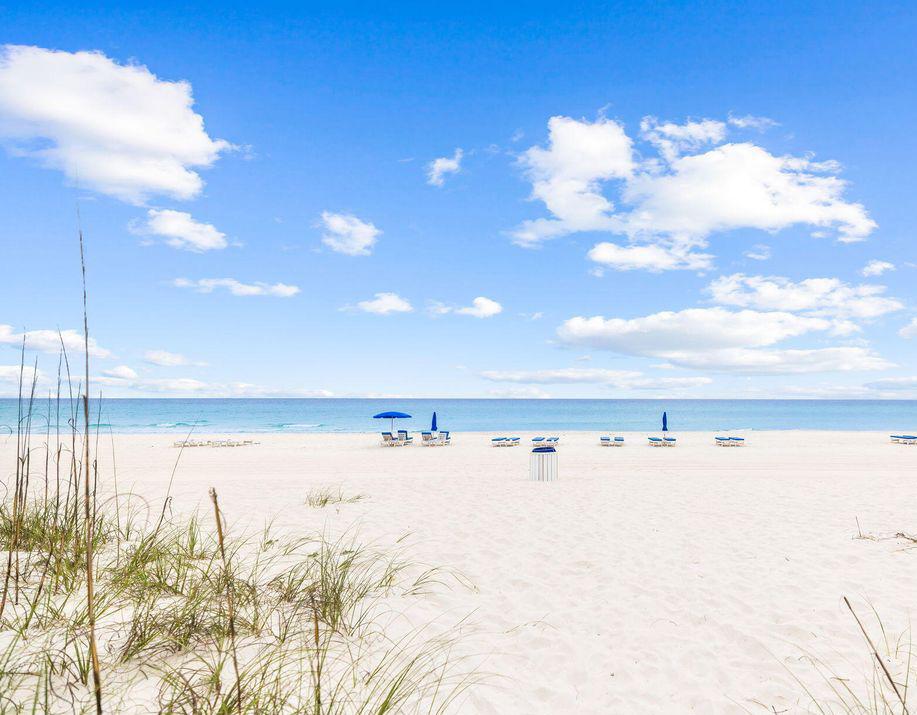
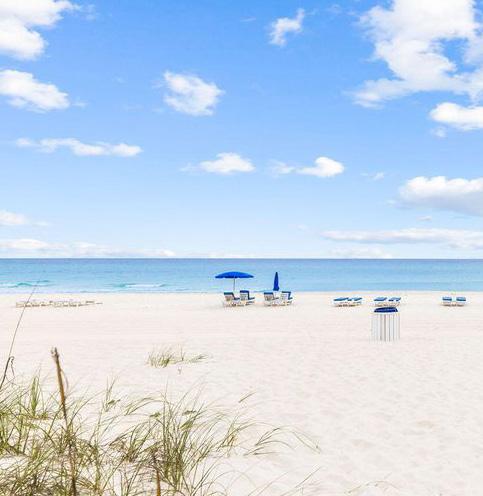
This coastal paradise is renowned for its 27 miles of pristine white-sand beaches, crystal-clear emerald waters, and stunning sunsets. Outdoor enthusiasts will appreciate the opportunities for water sports, fishing, and eco-tours through nearby state parks and conservation areas. The community is warm and welcoming, with a rich tapestry of events and activities year-round, including music festivals, art shows, farmers’ markets, and cultural celebrations.
Panama City Beach offers an array of attractions and renowned dining experiences. Pier Park is a premier shopping, dining, and entertainment complex, featuring over 120 stores, a variety of restaurants, an IMAX theater, and an amusement park. Nature lovers can explore St. Andrews State Park, known for its excellent snorkeling and scuba diving spots, and Shell Island, a secluded retreat accessible only by boat. Dining highlights include Firefly, an award-winning fine dining restaurant, Pineapple Willy’s, famous for its beachfront dining and seafood, and Runaway Island, popular for its fresh seafood with a Caribbean twist. Investing in Panama City Beach real estate promises robust financial returns, driven by the area’s popularity as a vacation destination and steadily growing property values.
• In the Second Quarter 2024, Panama City Beach sales declined by 3% year-over-year to approximately 225 closings, marking the lowest second-quarter figure since 2021 and the second year-over-year decrease in four quarters. However, sales increased by 7% compared to the First Quarter 2024, which is typical of seasonality as activity heats up with warmer weather and the holiday season, attracting visitors interested in relocating or purchasing a second home.
• Sales volume was $148 million, a 40% decrease year-over-year, and lower than the First Quarter 2024. Along with the significant year-over-year decline in sales, the average price also decreased by double digits, further driving the volume lower.
• The Panama City Beach market saw 241 contracts signed from March through June, down 13% from 2023. This marks the second consecutive quarter in which signed contracts have decreased on an annual basis.
• Price statistics declined across the board annually in all categories except for Median Price. The market weakened due to fewer residential sales and high leverage costs resulting from a sharp rise in interest rates. Sellers continued to reduce prices to attract interest, while buyers, particularly sensitive to value, remained influenced by the high interest rates.
• The median price and price per square foot remained steady compared to First Quarter 2024 at $520K and $262 per square foot, respectively.
• Average price statistics saw steeper declines. The average price fell 16% annually to $659K, while the average price per square foot decreased by 13% to $324. These average price figures, impacted by the same factors that affect median statistics, were particularly affected this quarter by a 28% drop in sales.
UNDER $500K
$500K TO $1M
$1M TO $3M
$3M TO $5M
For the first time in a year, days on market increased across every price range. Continuing the trend of longer marketing times at the high end, residences in the $1M to $3M range saw their marketing time hold relatively steady, while listings over $3M reached a nearly three-year high, averaging 257 days on the market.
Compared to last year, market share of sales shifted minimally across most price ranges, with only the $500K to $1M and $1M to $3M categories seeing a change of more than 1%. Over the four years since the pandemic, the market share of sales in the $500K to $1M range has increased, while the share of closings under $500K has declined.
• In the Second Quarter 2024, Panama City Beach’s listed inventory increased by 38% year-over-year, reaching 501 active listings. This marked the third consecutive quarter of annual increases in listings. The second-quarter inventory was last higher in the Second Quarter of 2022.
• Alongside the year-over-year increase, Panama City Beach still experienced its typical seasonal rise in active listings compared to the first quarter, as sellers typically place their homes on the market before the warmer summer months and the high season of visitors.
• New listings decreased in every price range this quarter.
$500K TO $1M
$1M TO $3M
$3M TO $5M
$500K TO $1M
$1M TO $3M
$3M TO $5M

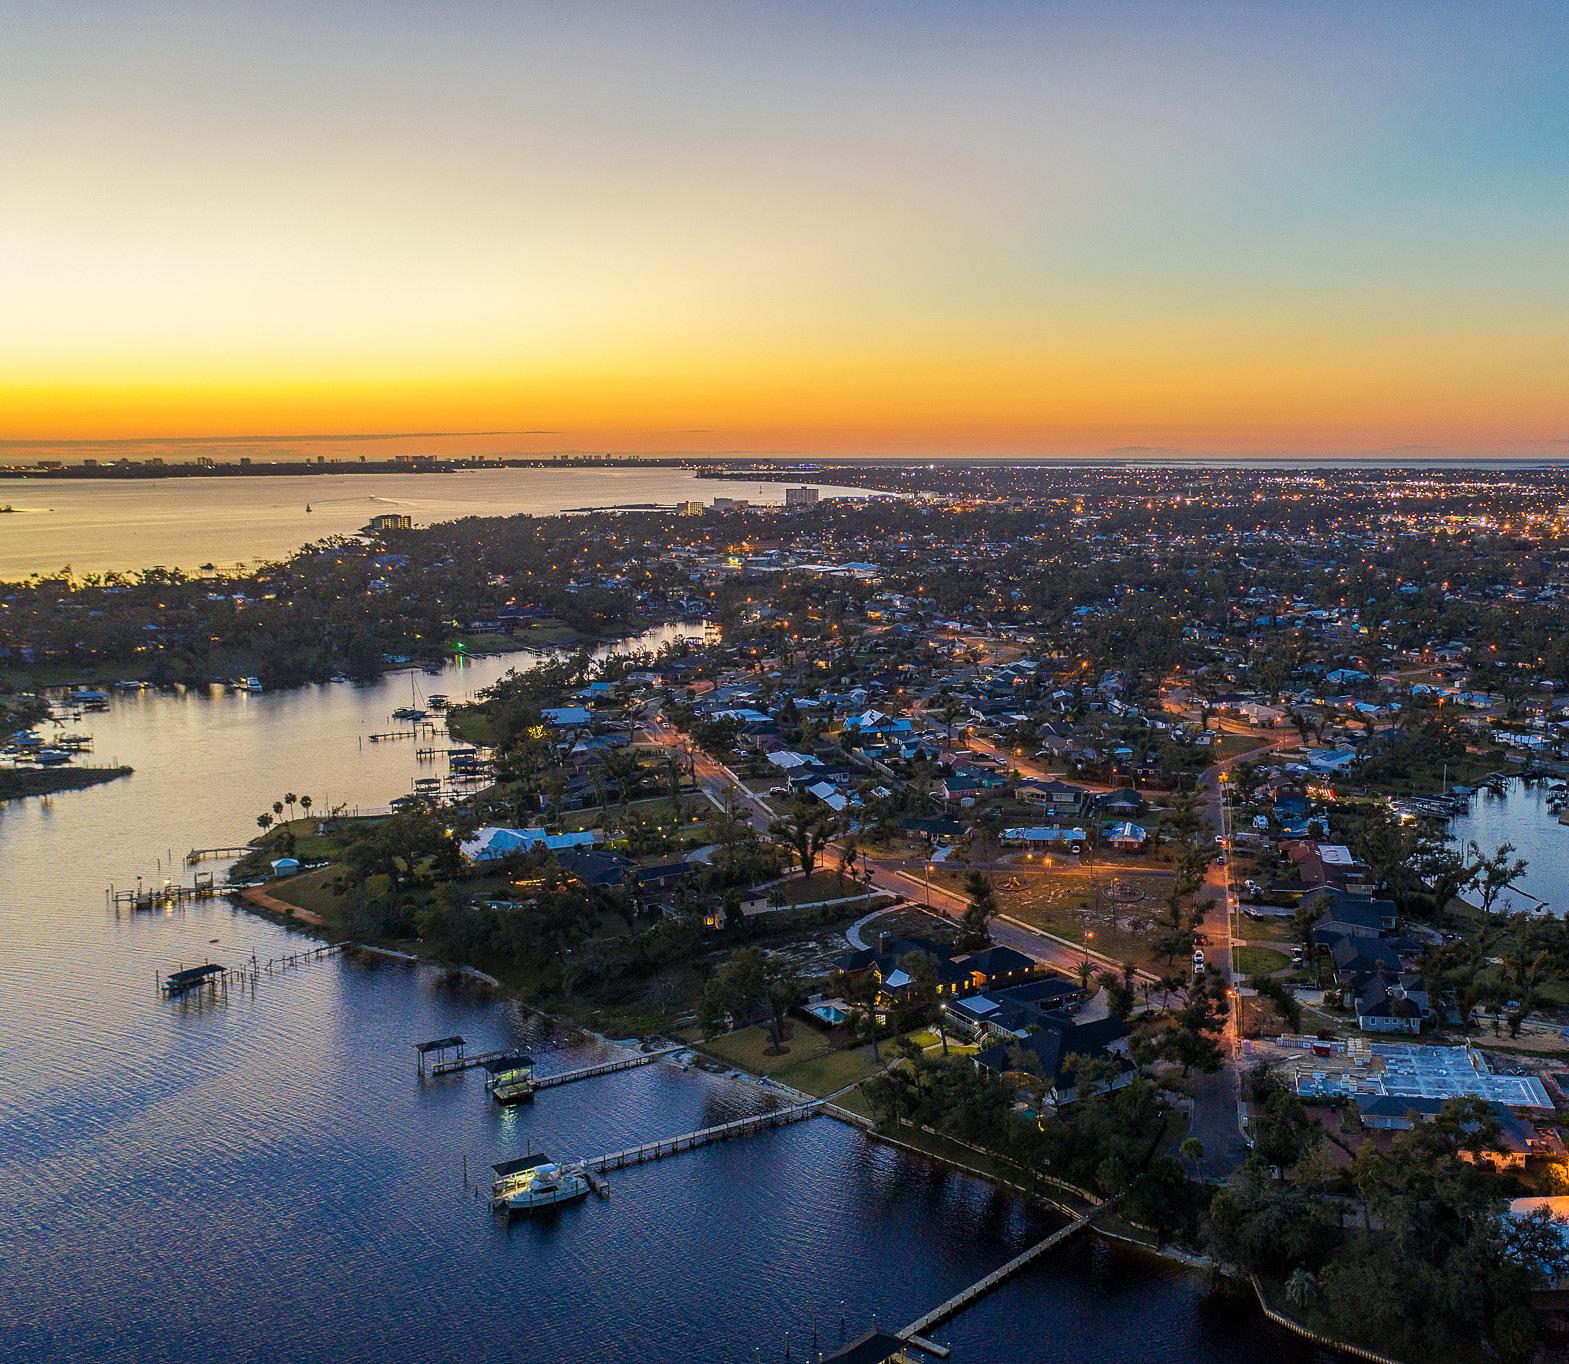
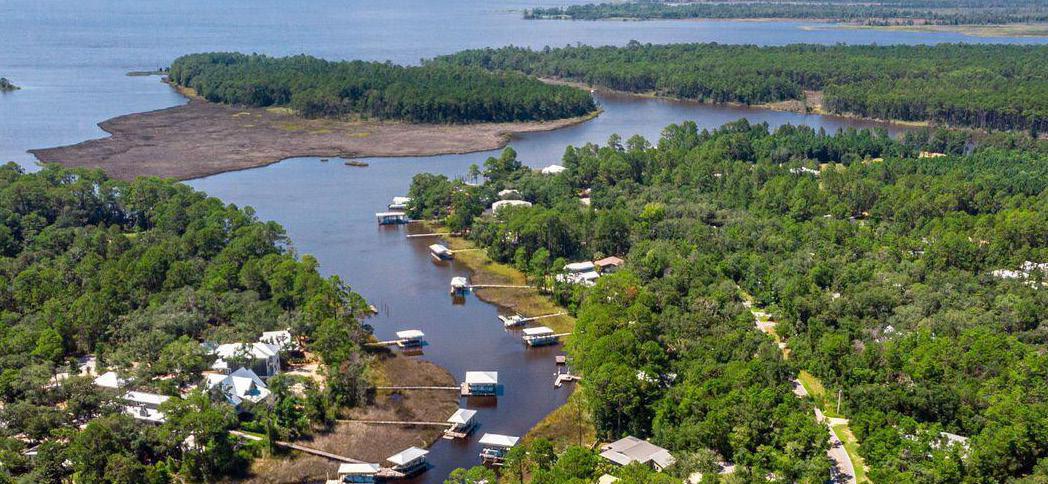
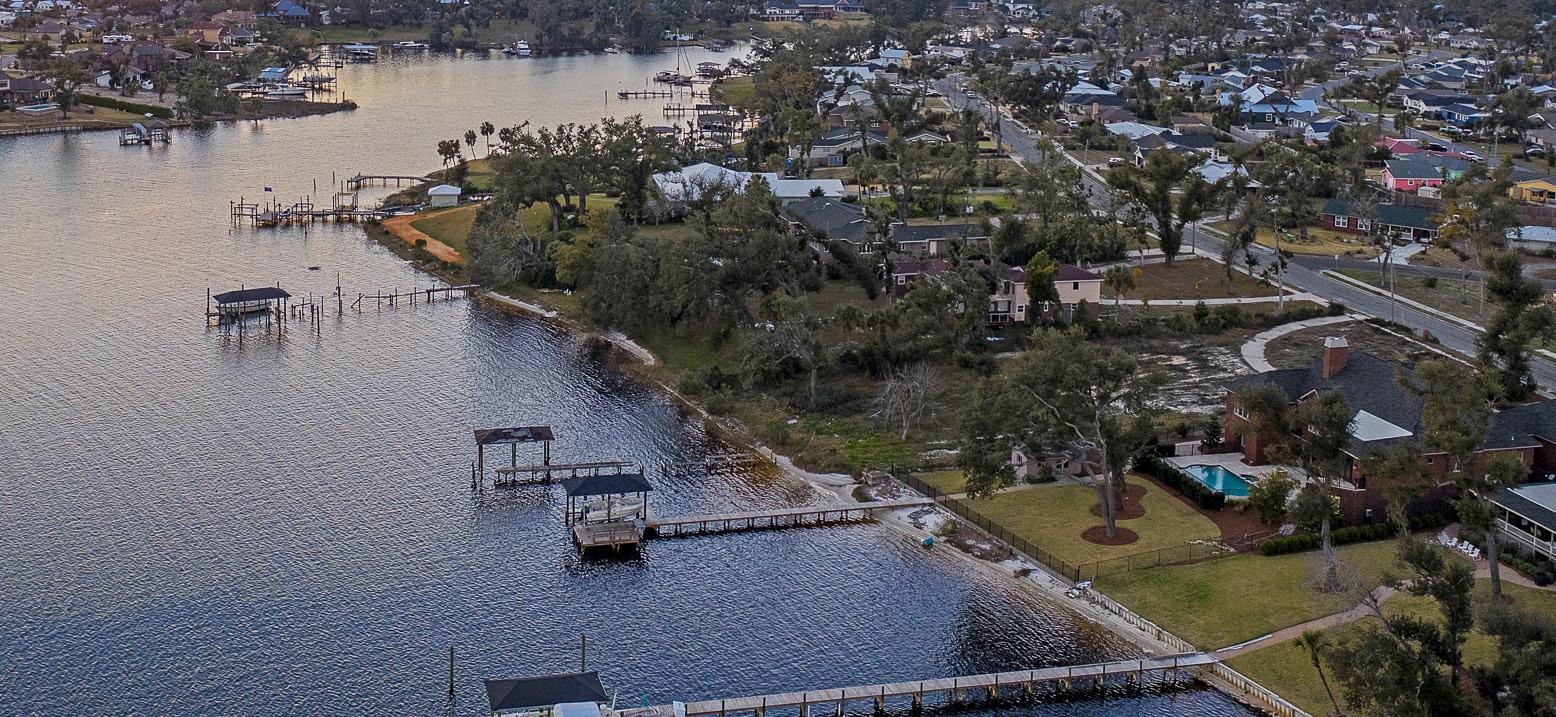
Known for its picturesque waterfront views and thriving marina culture, Panama City offers an inviting atmosphere for both residents and visitors. The city is a gateway to stunning natural landscapes, including the pristine beaches of the Gulf of Mexico and the serene beauty of St. Andrews Bay. Outdoor enthusiasts can indulge in boating, fishing, and various water sports, while enjoying the warm, sunny climate year-round.
Historic Downtown Panama City is a hub of activity, featuring charming boutiques, art galleries, and a variety of dining options. Key attractions include the Panama City Marina, which hosts numerous boating events and the Marina Civic Center, a venue for concerts and performances. Notable dining experiences include The Grand Marlin, renowned for its fresh seafood and waterfront dining, and Hunt’s Oyster Bar, a local favorite for casual, yet delectable, seafood dishes. With its appealing lifestyle, beautiful surroundings, and steady growth in property values, investing in Panama City real estate promises attractive financial returns and a high quality of life.
• In Second Quarter 2024, Panama City sales declined by 6% year-over-year to approximately 476 closings, the lowest second-quarter figure since 2022 and the sixth year-over-year decline in seven quarters. However, sales increased by 27% compared to First Quarter 2024, reflecting typical seasonal trends as activity picks up with warmer weather and the holiday season, drawing visitors to nearby beaches who are interested in relocating or purchasing a second home.
• Sales volume was $164 million, down 2% year-over-year but higher than First Quarter 2024. Despite the relatively small year-over-year decline in sales, the average price increased slightly, though not enough to drive volume higher.
• The Panama City Beach market saw 510 contracts signed from March through June, up 3% from 2023. This marks the first quarter that signed contracts have increased on an annual basis since the First Quarter 2022.
• Average and median price statistics climbed across the board. Despite fewer residential sales and a weakened market due to high leverage costs from a sharp rise in interest rates, inflation continues to impact the housing market, driving prices upwards. Buyers, especially sensitive to value, remained influenced by these high interest rates.
• The median price and price per square foot reached $309K and $148 per square foot, respectively.
• Average price statistics rose by similar amounts. The average price increased by 4% annually to $352K, while the average price per square foot rose by 7% to $184.
• These average price figures, influenced by the same factors driving median prices higher, were mildly affected this quarter by a 3% rise in sales over $500K.
$500K $500K TO $1M $1M TO $3M
Days on market dropped for listings over $500K. Contrary to the ongoing trend of longer marketing times at the high end, the time spent marketing properties in the $500K to $1M range shrunk by 50%, down to 37 days. Residences that closed for under $500K saw their marketing time hold relatively steady.
Market share of sales shifted minimally for most price ranges; only the under $500K and $500K-$1M categories saw market share shift more than 1%. In the four years since the pandemic, the market share of sales in the $500K to $1M range has increased, while the share of closings under $500K has declined.
• In the Second Quarter 2024, Panama City’s listed inventory increased by 55% year-over-year, reaching 508 active listings. This marked the first time in six quarters that listings exceeded 500. Inventory was last higher than 500 in the Third Quarter 2022.
• Alongside the year-over-year increase, Panama City also experienced its typical seasonal rise in active listings compared to the third quarter, as sellers tend to place their homes on the market before the warmer summer months.
• New listings increased in every price range this quarter, except for the $3M to $5M range. The $500K to $1M and $1M to $3M price ranges posted the biggest year-over-year gains.
$500K TO $1M
$1M TO $3M
$3M TO $5M
$500K TO $1M
$1M TO $3M
$3M TO $5M


30A SHORT-TERM RENTAL TRENDS Spring 2024
The percentage of nights booked for guests (Nights Sold), out of the number of Total Nights available to book for guests (Nights Available). By comparison, Occupancy Rate, the traditional hospitality KPI, calculates the percentage of Nights Sold out of the Total Nights in the period, without considering the Unavailable Nights. Because owner reservations and hold nights take up some of the nights typically, Available Occupancy is helpful to how well you’ve filled up the properties from the nights that were available for you to fill with guests. = Nights Sold / Nights Available
Revenue Per Available “Room” with hotels. A critical KPI for measuring revenue performance, RevPAR takes into account both the average rate at which you booked the property (ADR) and the number of nights it was booked (Occupancy). This provides a better indicator of overall performance when compared to looking at the ADR or the Occupany alone. = Occupancy x ADR (or) Total Unit Revenue / Nights Available in a given period

Spring 2024
The percentage of nights booked for guests (Nights Sold), out of the number of Total Nights available to book for guests (Nights Available). By comparison, Occupancy Rate, the traditional hospitality KPI, calculates the percentage of Nights Sold out of the Total Nights in the period, without considering the Unavailable Nights. Because owner reservations and hold nights take up some of the nights typically, Available Occupancy is helpful to how well you’ve filled up the properties from the nights that were available for you to fill with guests. = Nights Sold / Nights Available
Revenue Per Available “Room” with hotels. A critical KPI for measuring revenue performance, RevPAR takes into account both the average rate at which you booked the property (ADR) and the number of nights it was booked (Occupancy). This provides a better indicator of overall performance when compared to looking at the ADR or the Occupany alone. = Occupancy x ADR (or) Total Unit Revenue / Nights Available in a given period

RECORD BREAKING SALE IN SANDY SHORES COMMUNITY
LISTING REPRESENTED BY: HILARY & JACOB
BUYER REPRESENTED BY: COLGAN, SIMON, WRIGHT
LISTING REPRESENTED BY: COLGAN, SIMON, WRIGHT

86 ELYSEE COURT
BUYER REPRESENTED BY: LYNNE ANDREWS
BUYER REPRESENTED BY: ROBERT WATSON
LISTING REPRESENTED BY: HILARY & JACOB
217 FLATWOODS FOREST LOOP
RECORD BREAKING SALE IN NATUREWALK AT SEAGROVE
$4.2M $2.49M $1.92M
24 CLIMBING ROSE WAY 67 SAND OAKS CIRCLE
LISTING & BUYER REPRESENTED BY: SUSAN KADI
BUYER REPRESENTED BY: SYDNEY VOLKERT
LISTING REPRESENTED BY: JIM STECKEL & ROB AUGUSTINE

RECOGNIZING THE OUTSTANDING EFFORTS OF WOMEN DRIVING THE ECONOMY FORWARD
HOUSING WIRE
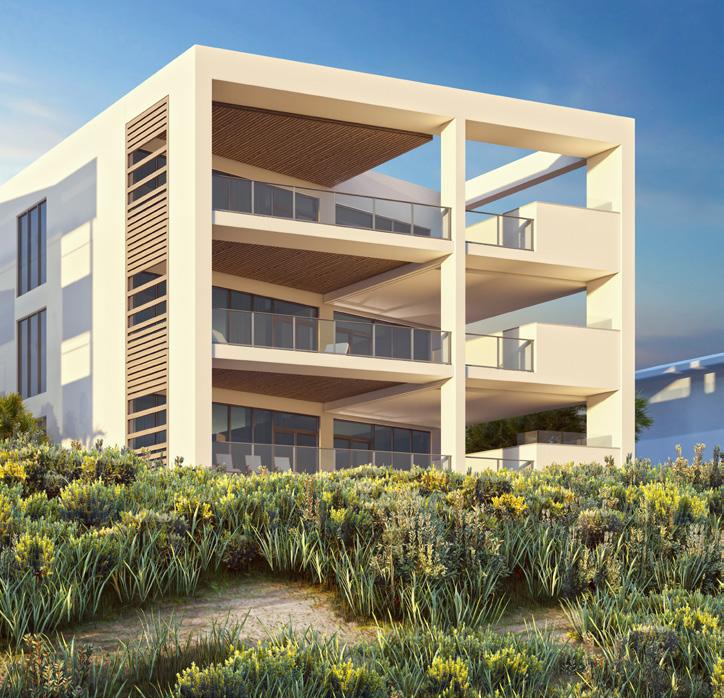
INTRODUCING COSTERA: THE ULTIMATE LUXURY COASTAL LIVING ON FLORIDA’S SCENIC HWY 30A
CORCORAN REVERIE BREAKS REAL ESTATE RECORDS WITH LANDMARK SALE ON 30A
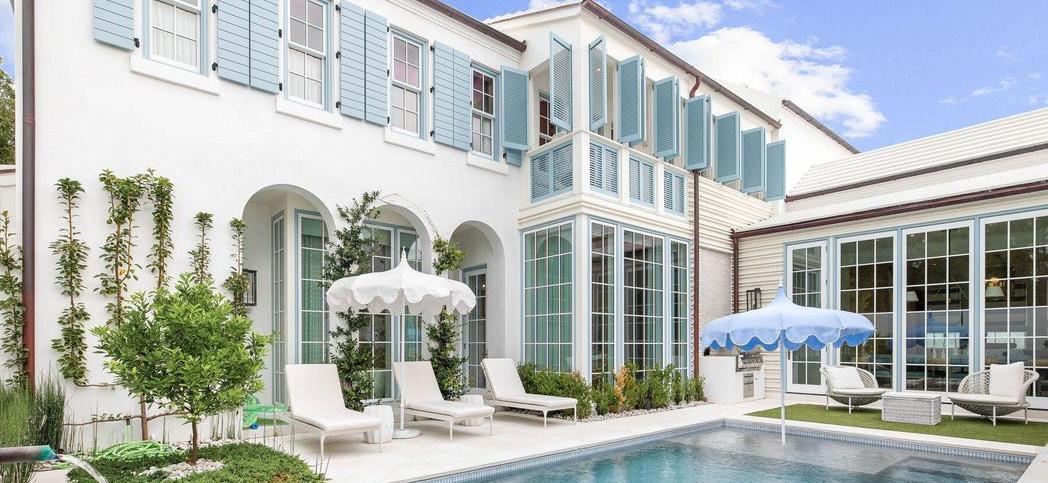
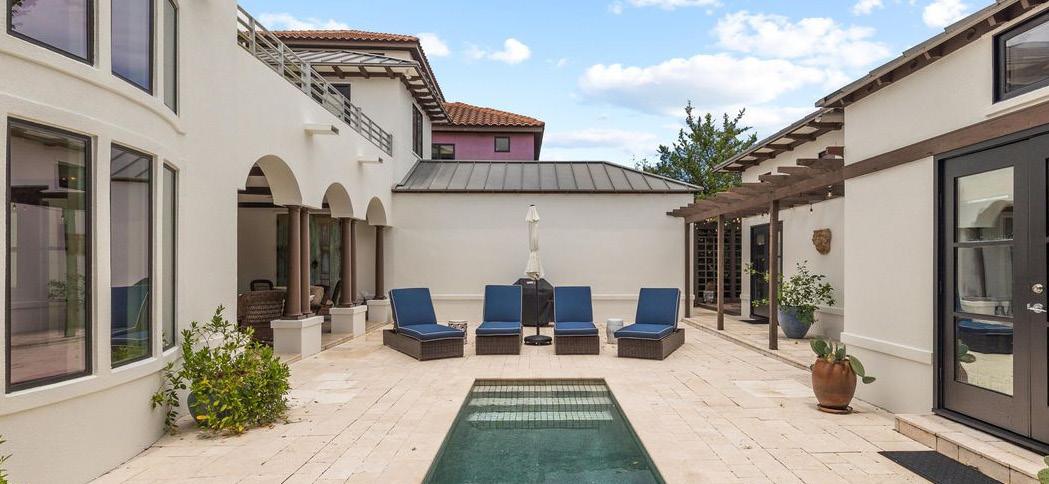
POWER TEAMS OF CORCORAN REVERIE PRESENT EXQUISITE ALYS BEACH RETREAT

CLIENTS SERVED
STATE SIDES RANK AVERAGE TRANSACTION PRICE 2023 SALES VOLUME STATE VOLUME NATIONAL VOLUME


(noun) a state of being pleasantly lost in one’s thoughts; a daydream
like buying the home of your dreams in the place that you love!