Richmond upon Thames Transport Strategy 2040

Richmond upon Thames Transport Strategy 2040


Provide Accessibility for People of All Ages and Abilities

Improve Physical Activity and Mental Health

Improve Air Quality

Increase Transport Quality and Connectivity
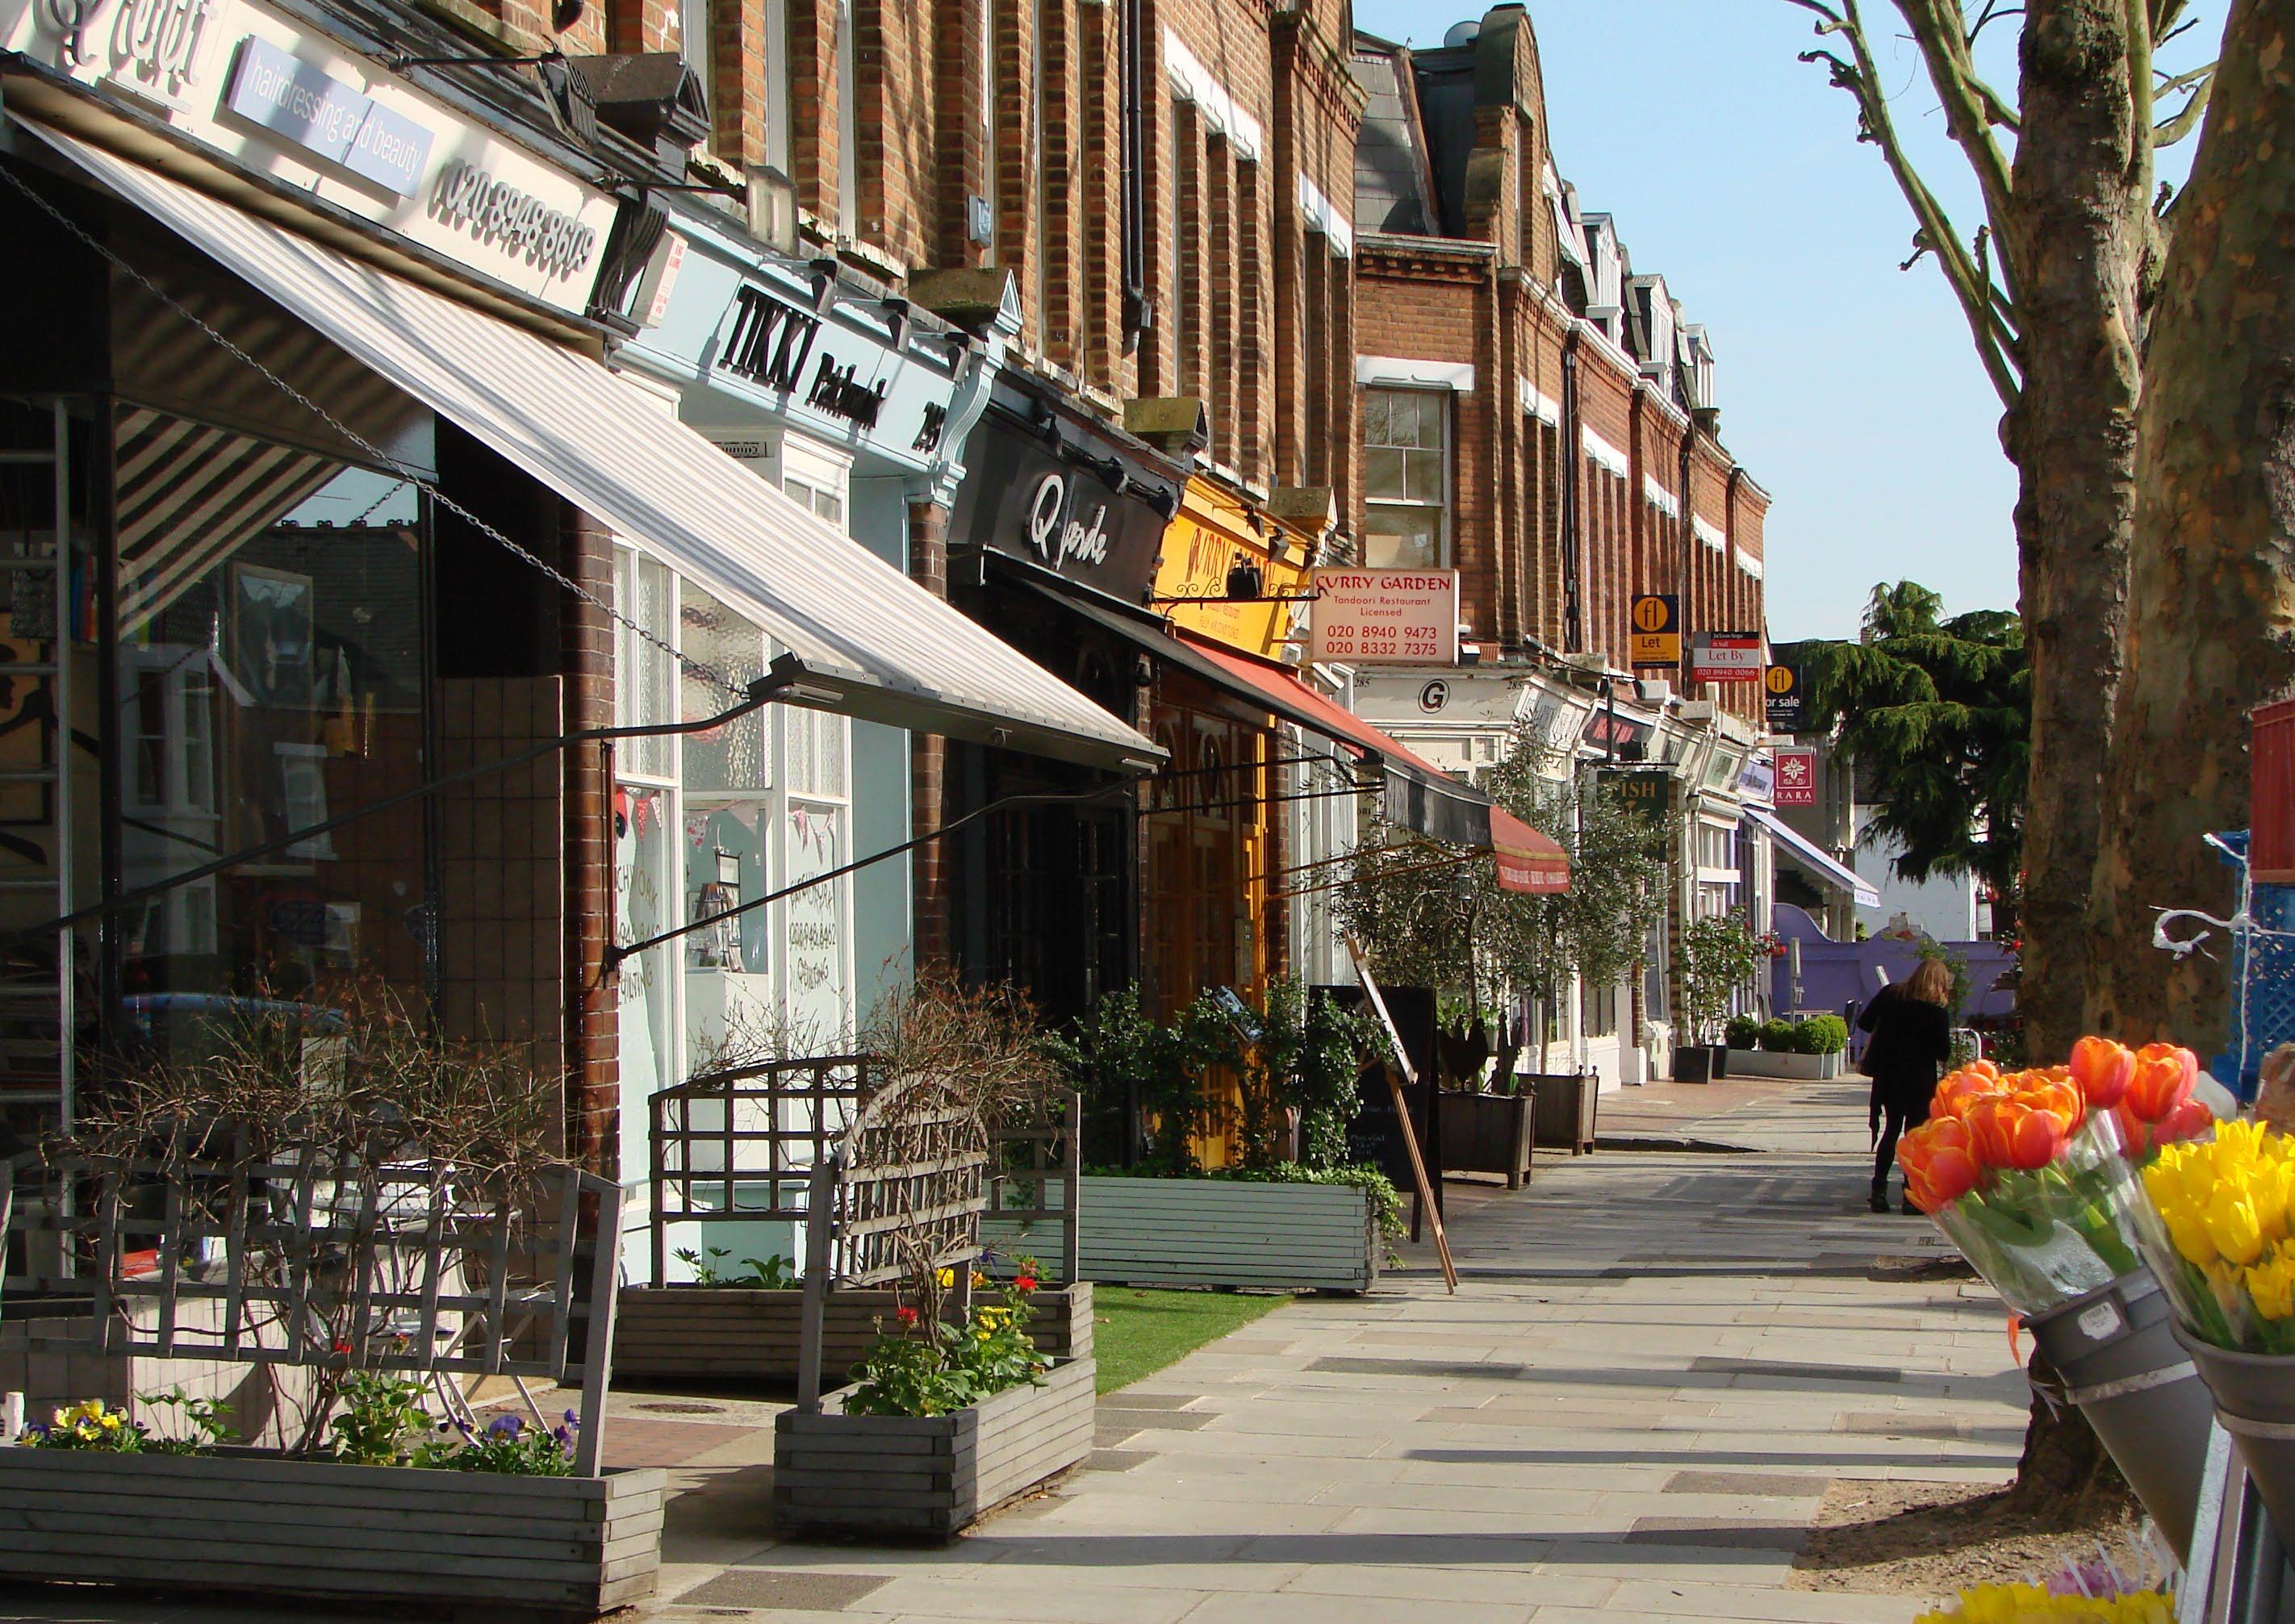
Enable Walking or Wheeling to Local Services

Ensure Affordable Transport
Richmond’s population is projected to increase by 5% between 2019 and 2041
The average outer London borough is expected to see a population increase of 19%
The London-wide population is expected to increase by 21%
Richmond residents have a life expectancy of about 2 years longer than the average London resident
Richmond is less ethnically diverse than other boroughs
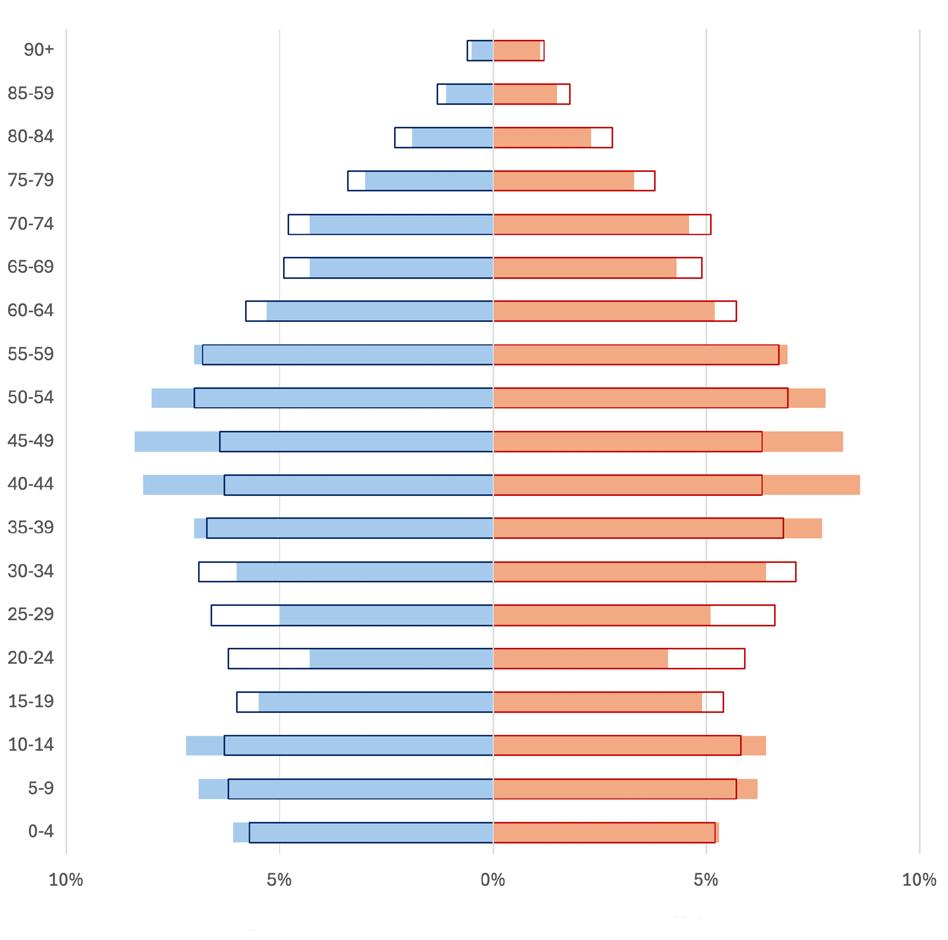
Compared with England as a whole, Richmond has a smaller percentage of residents in their 20s and 30s, and larger percentage of residents in their 40s and 50s
Given the aging population in the borough, the Transport Strategy aims to ensure people of all ages can utilise the transport system
Proportion of London’s Population by Ethnicity and Borough
Population by Age and Gender
More than 50% of the borough is greenspace
There are 72 conservation areas
There are 1,100 listed buildings
Richmond has more than 4.5m tourists every year
Generating £200m in income
Richmond’s Royal Botanic Gardens were London’s 11th most visited attraction in 2023 with over 1.6m visitors every year
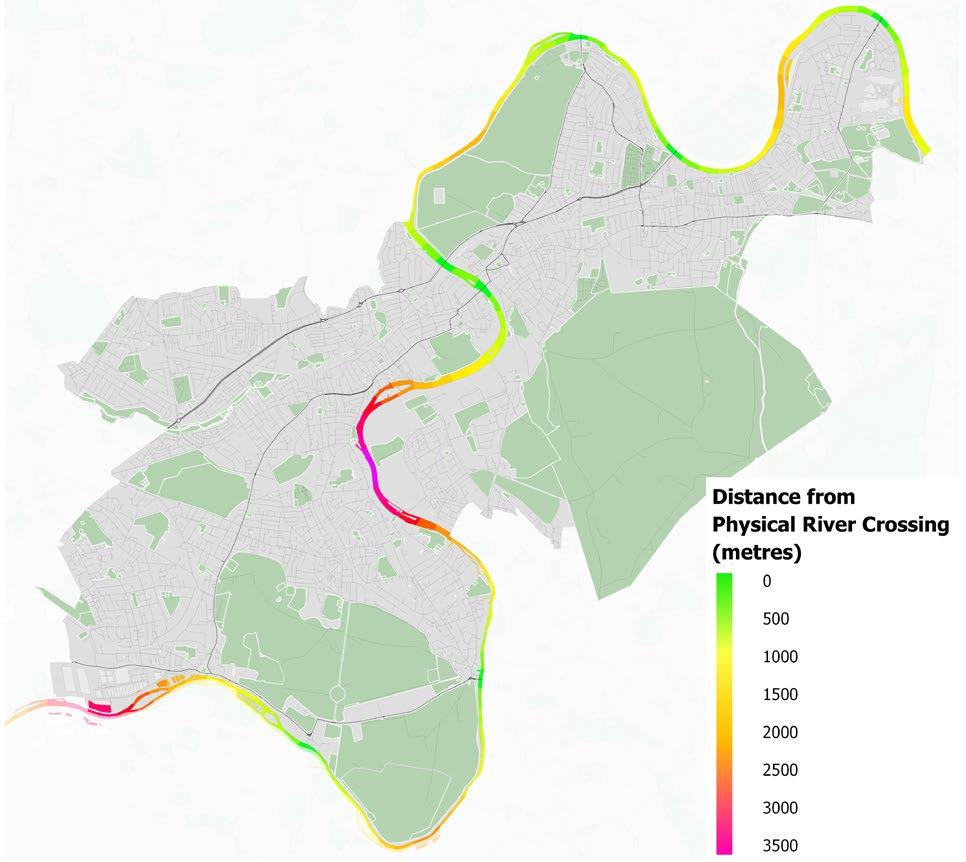
The borough is divided by the River Thames and railway lines, limits connectivity
Heritage Listed Buildings in Richmond
Distance from Physical River Crossing
Richmond has a projected 14% increase of households between 2019 and 2041
Outer London has a projected increase of 30%
64% of households in Richmond own their home
Source: www.statista.com/statistics/630146/ leading-london-visitor-attractions-uk
Richmond has a projected 23% increase in jobs between 2019 and 2041
Outer London has an average projected increase of 13%
The projected London-wide increase is 16%
Large proportion of jobs in the Richmond are highly skilled
Current median income in the borough is £53.5k, which is higher than other outer London boroughs
Compared with a London average of 5%, 2.4% of Richmond’s population aged 16-64 claimed unemployment benefits in 2024
Areas with a higher index of deprivation are concentrated in parts of Castelnau, Ham, Hampton, Heathfield, Mortlake and Whitton
In 2021, the proportion of Richmond residents working from home was nearly double the national rate and nearly 20% greater than the average of London
Commuting Richmond residents travel similar distances to those in London and England as a whole
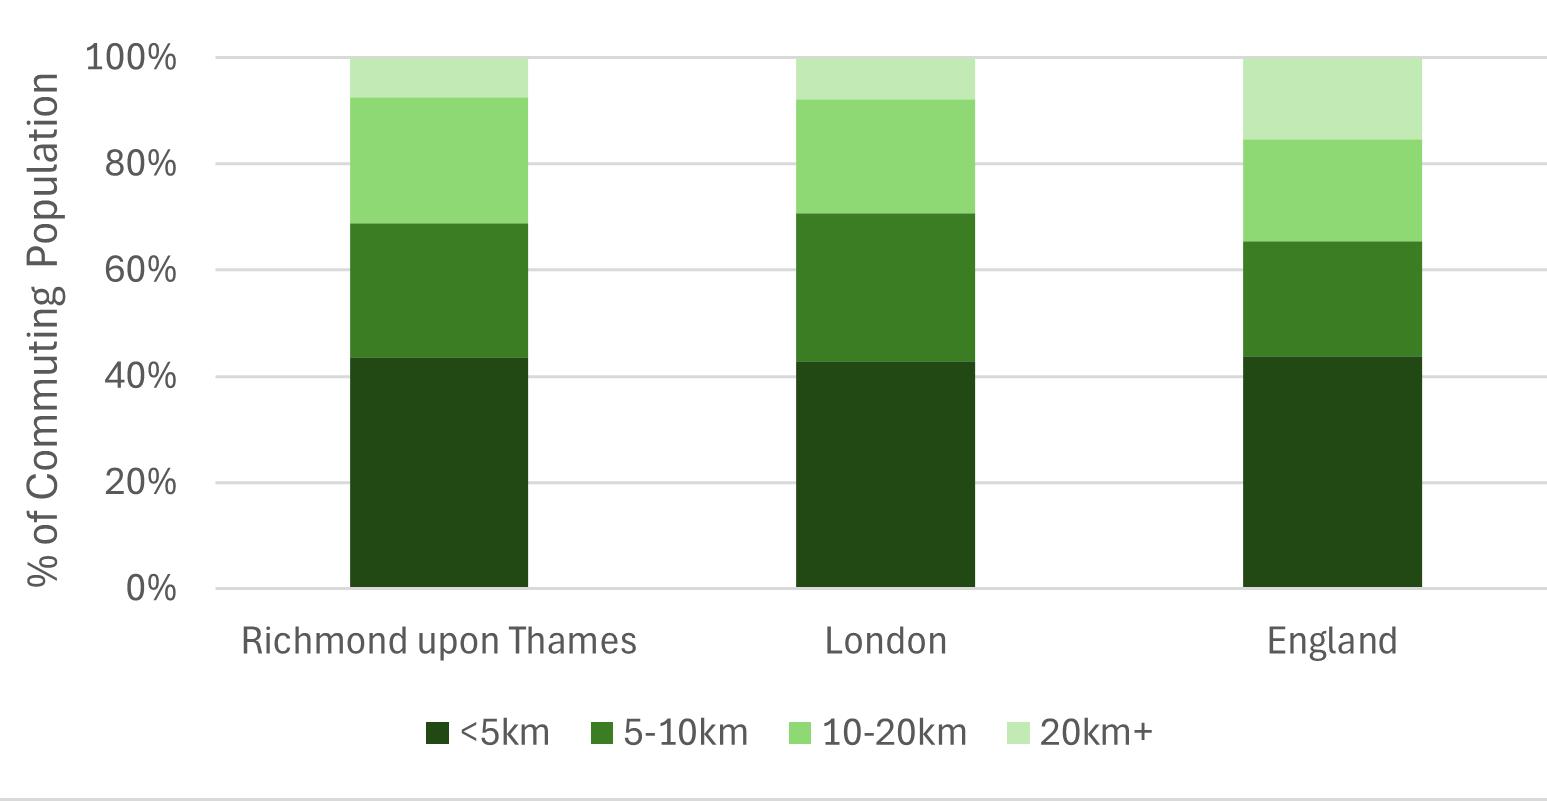
With nearly half of these residents travelling more than 5km, the Transport Strategy aims to give them as many safe options as possible for getting to their jobs
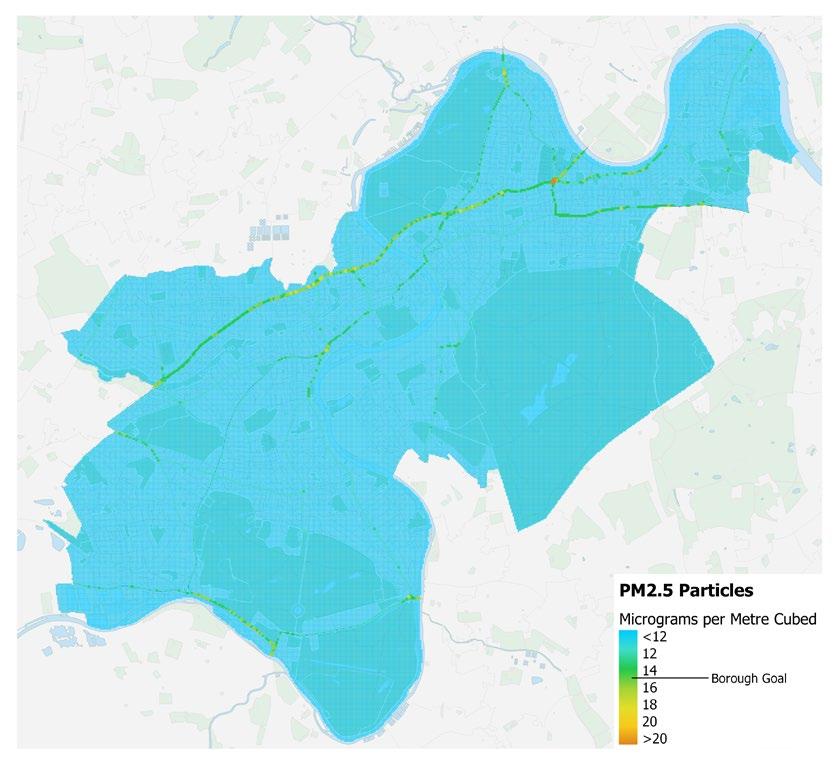
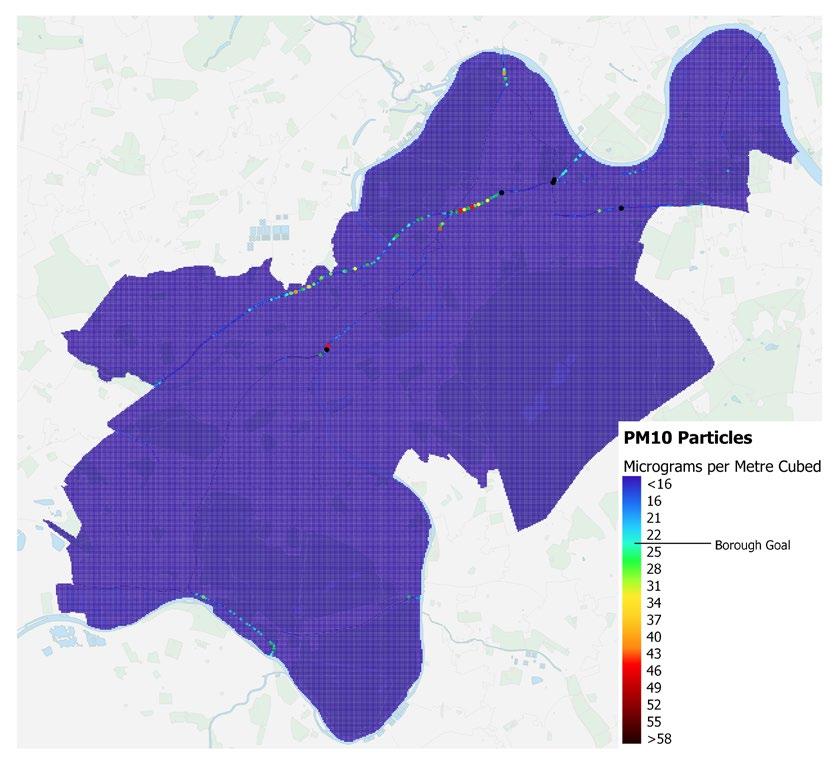
Poor air quality contributes to over 9,000 premature deaths in London every year
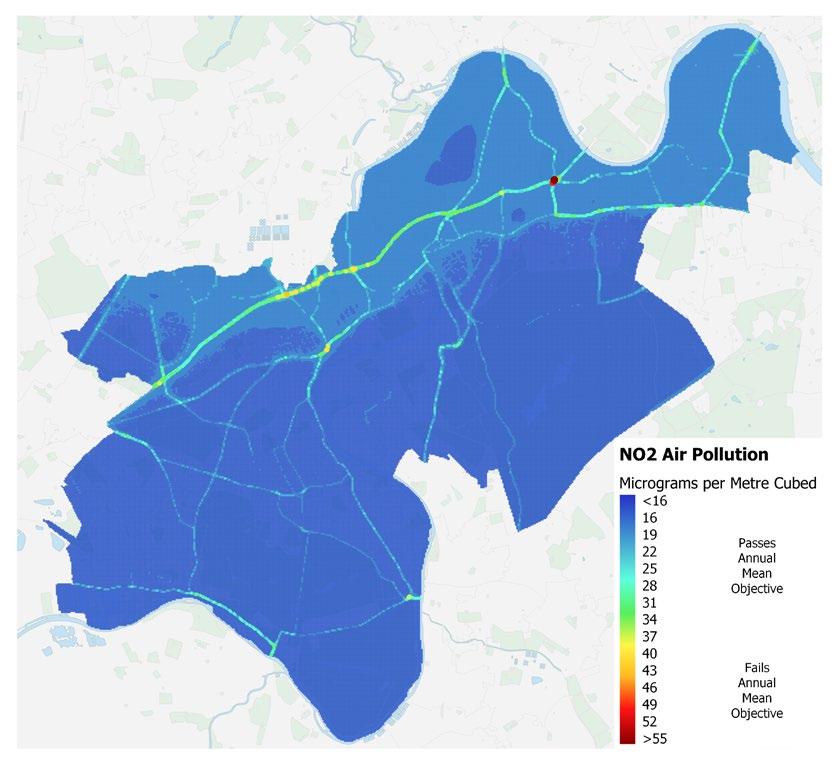
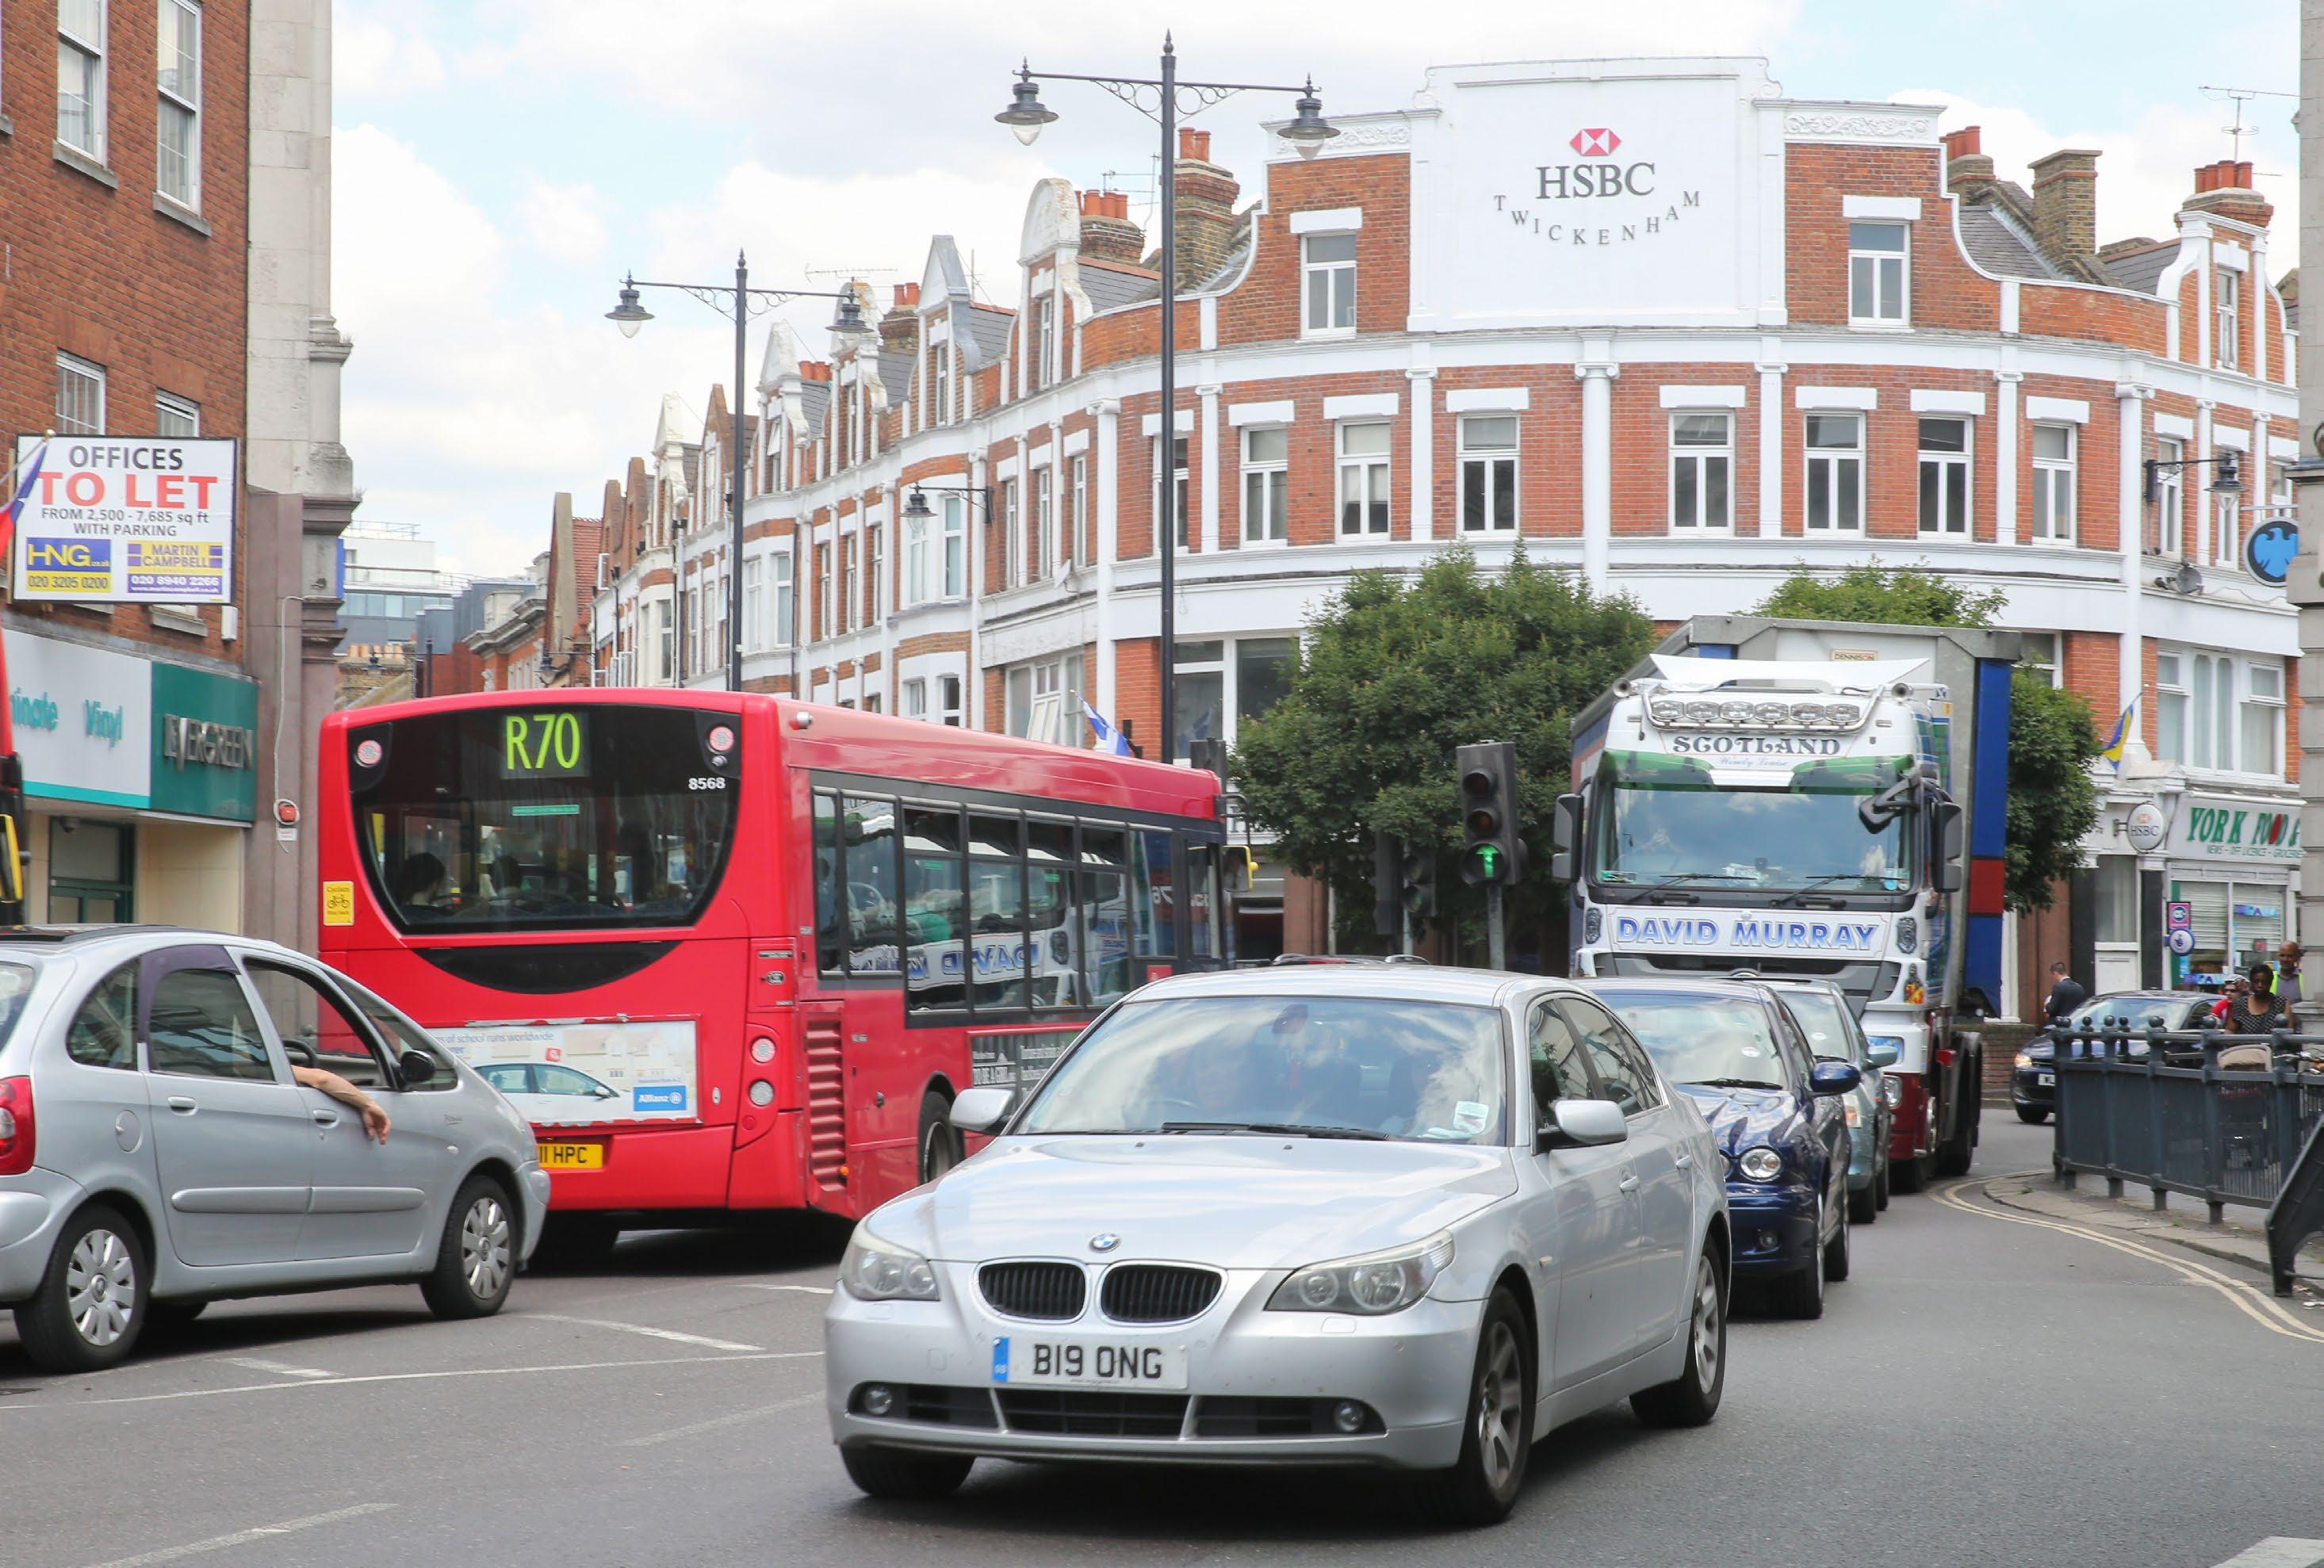
Most major roads in the borough experience pollution, with the A316 seeing some of the highest levels
The Existing Air Quality Action Plan for 2024-2029 adopts ambitious World Health Organisation targets
Other areas experiencing significant pollution include King Street in Twickenham Town Centre, Kingston Bridge, Hampton Court Road, and the A205
Building a long-term Transport Strategy will help move residents around the borough more efficiently and sustainably, ensuring healthy air for all
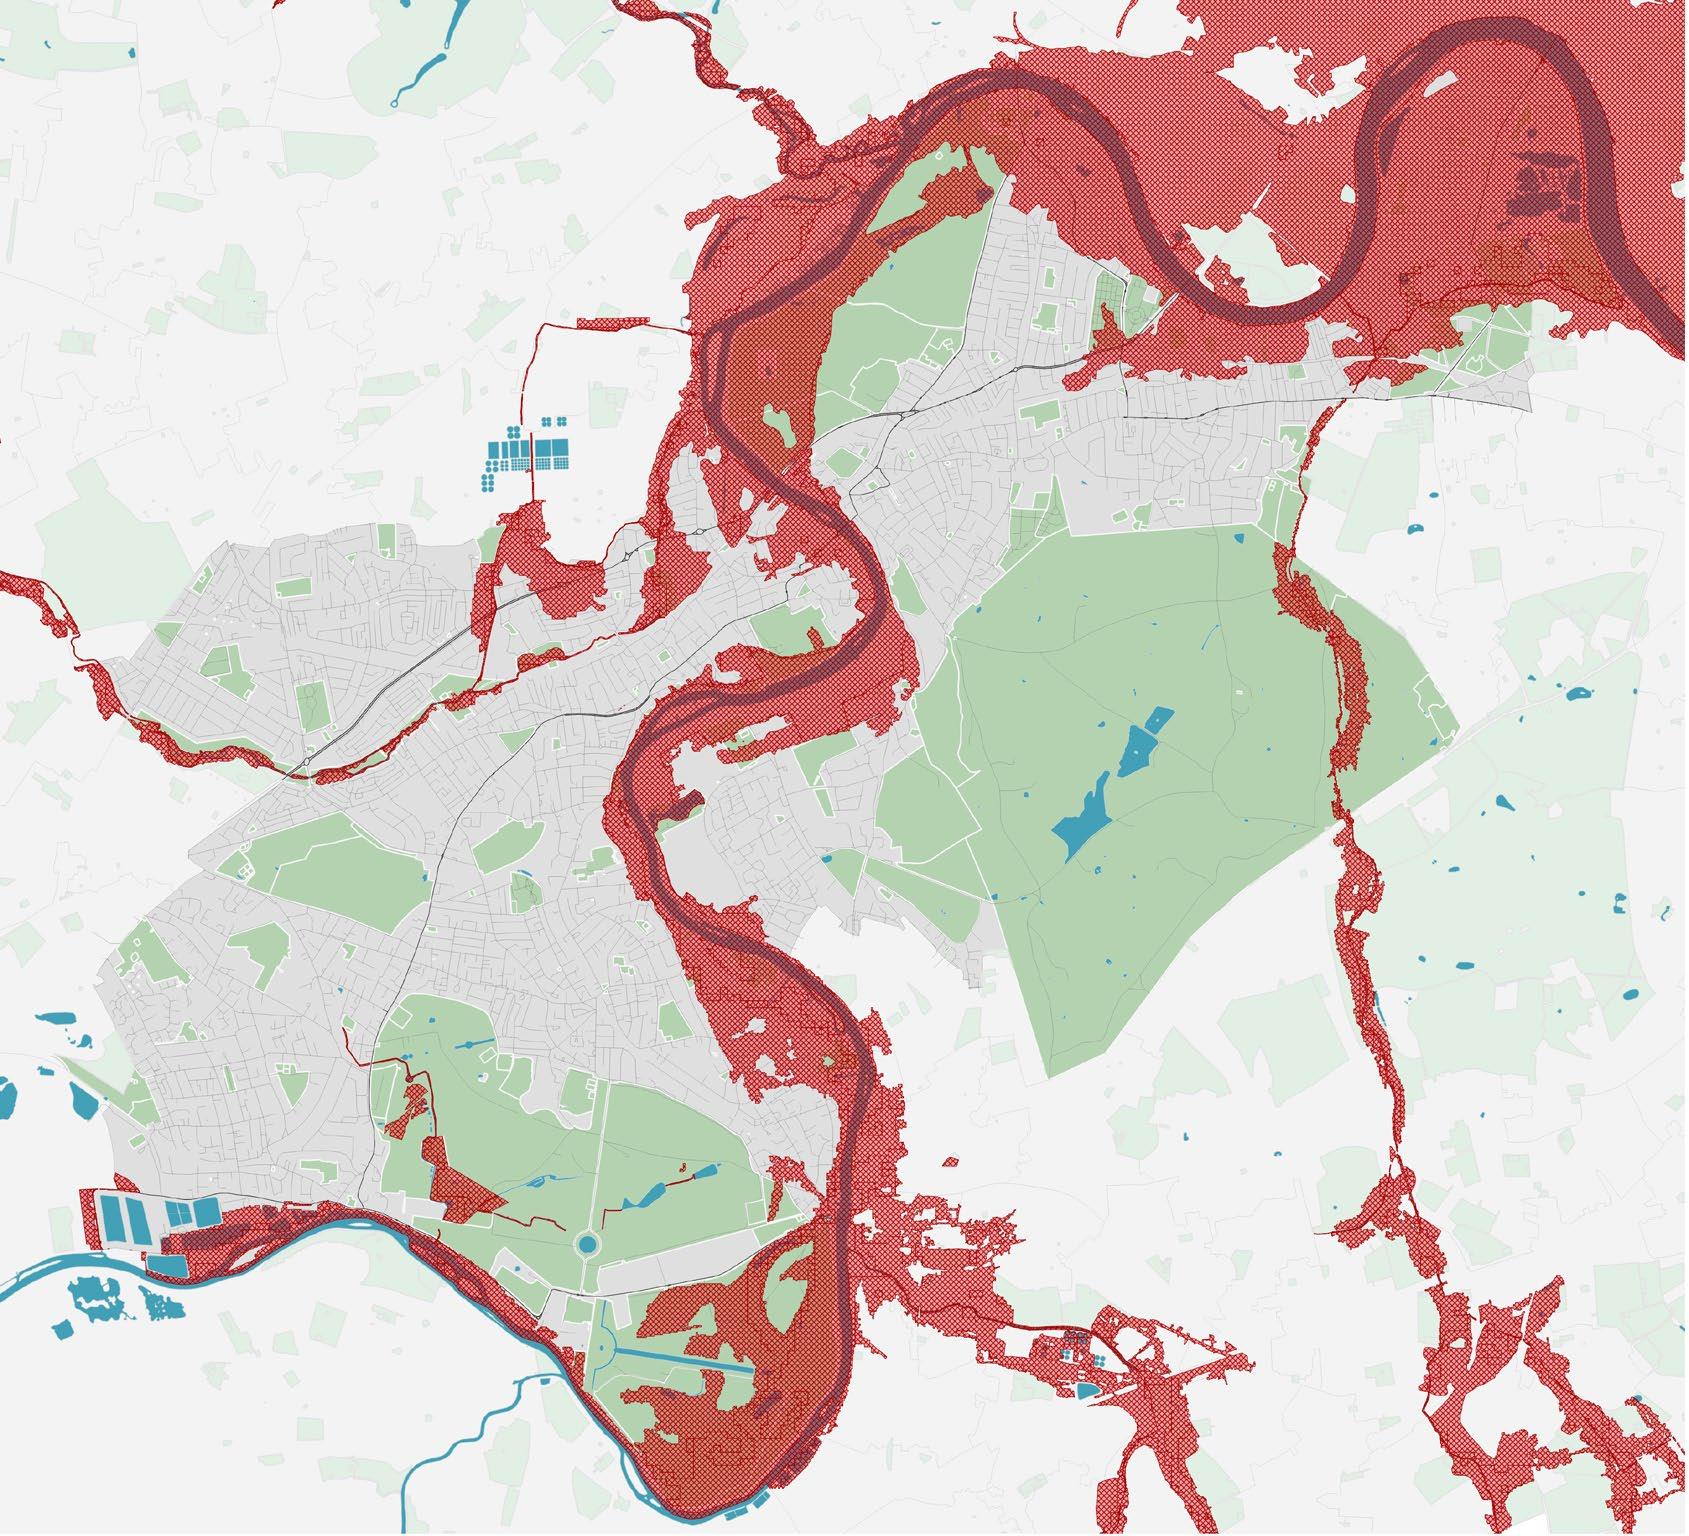
Nearly 30,000 residential properties in Richmond are at risk of surface water flooding greater than 0.03m depth, and about 100
residential properties are at risk for flooding greater than 0.5m
Entire bus fleet to emit zero exhaust emissions by 2037
Goal for 85% of double deck buses be hybrid, electric, or hydrogen by 2025
Of the 30 bus routes that service Richmond, 20 carry at least 1 million passengers every year
7 of the routes are fully electric, with that value increasing every year
Bus Fleet
Based on TfL’s strategic transport models Richmond has a projected 6% decrease in car ownership between 2019 and 2041
Outer London has an average projected decrease of 12%
75% of households in the borough have at least 1 car
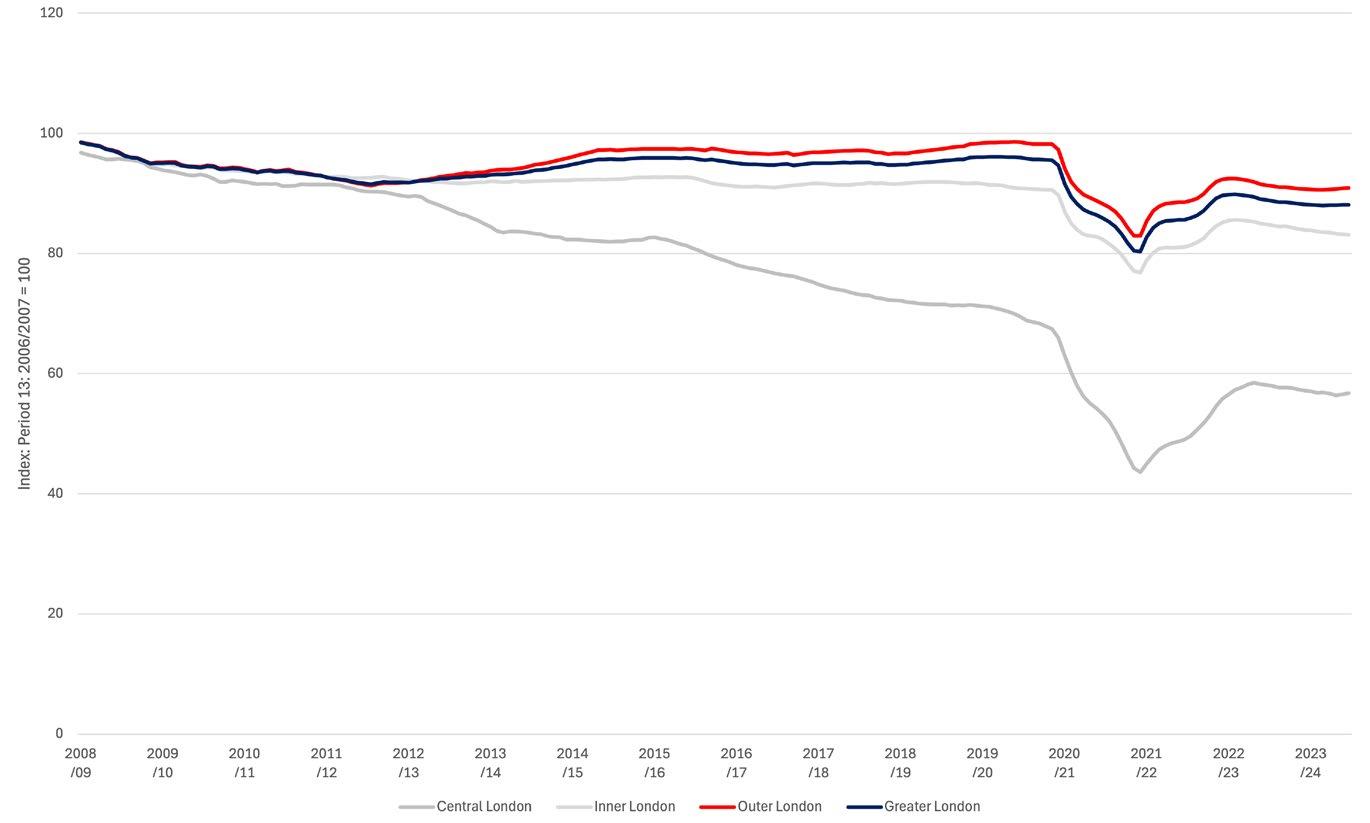
Outer London boroughs including Richmond have seen comparatively low reductions in motor vehicle traffic flows compared to central and Inner London
Between 2019 and 2041 Richmond has little change in car and motorcycle trips
Outer London has an average projected increase of 5%
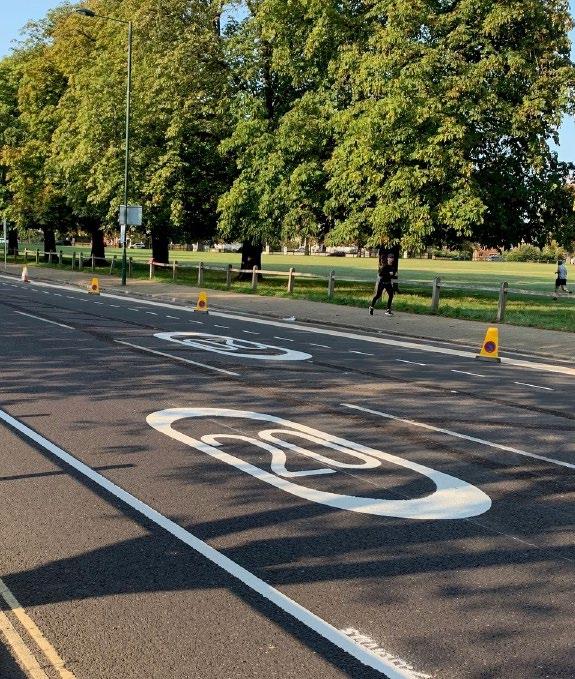
The borough’s goal is to decrease vehicle kilometres driven by 5-10%
Change in Motor Vehicle Traffic Flows by Area, 13-period Moving Average, 2008/09 - 2023/24
The borough aims to continue expanding Electric Vehicle (EV) charge coverage
Although car ownership rates have decreased, the number of cars purchased each year continues to rise as the population grows
Currently, about 35% of the borough’s roads are covered by Controlled Parking Zones (CPZ)
Richmond has the most EV chargers/100,000 people of any Outer London borough
Richmond: 460
Merton: 369
Brent: 317
Barnet: 114
UK Average: 96
Bromley: 50
The new Transport Strategy will strive to make life in the borough with either an electric car or no car at all as seamless as possible.
Cars Purchased in Richmond
Household Car Ownership
Source: Number of licensed vehicles, all PLG, Department of Transport
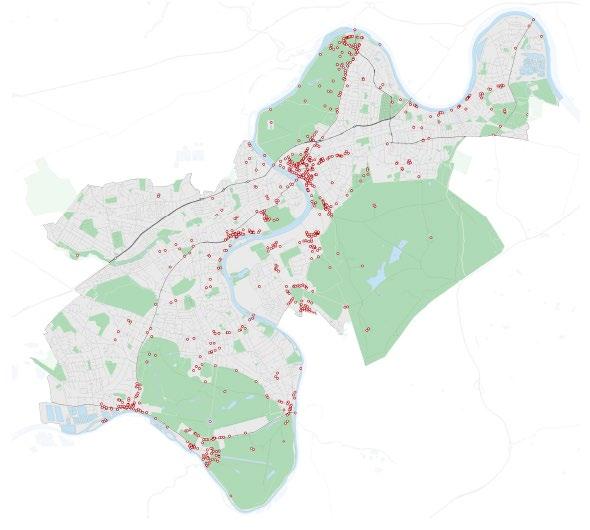
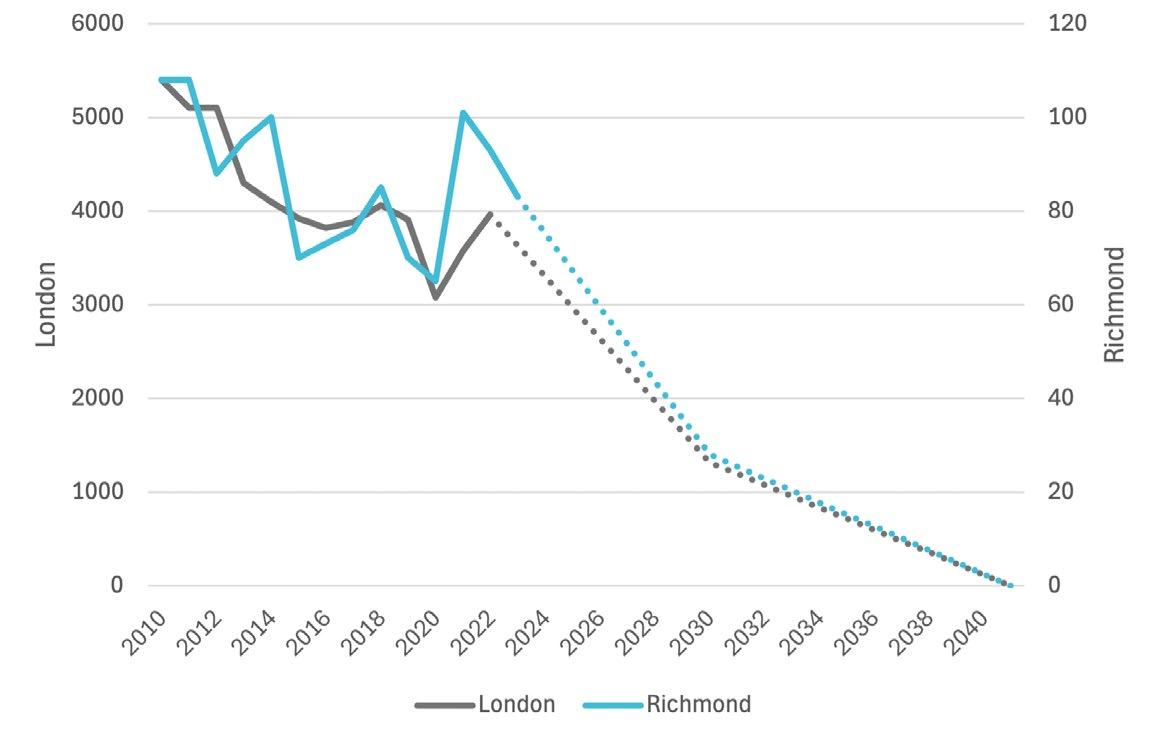
There were 93 serious collisions in Richmond in 2022, 2 of which were fatal
Of the serious and fatal collisions between 2016 and 2023, 49% involved injury of a cyclist
‘Vision Zero’ aims to have zero serious and fatal casualties by 2041
Serious & Fatal Collisions
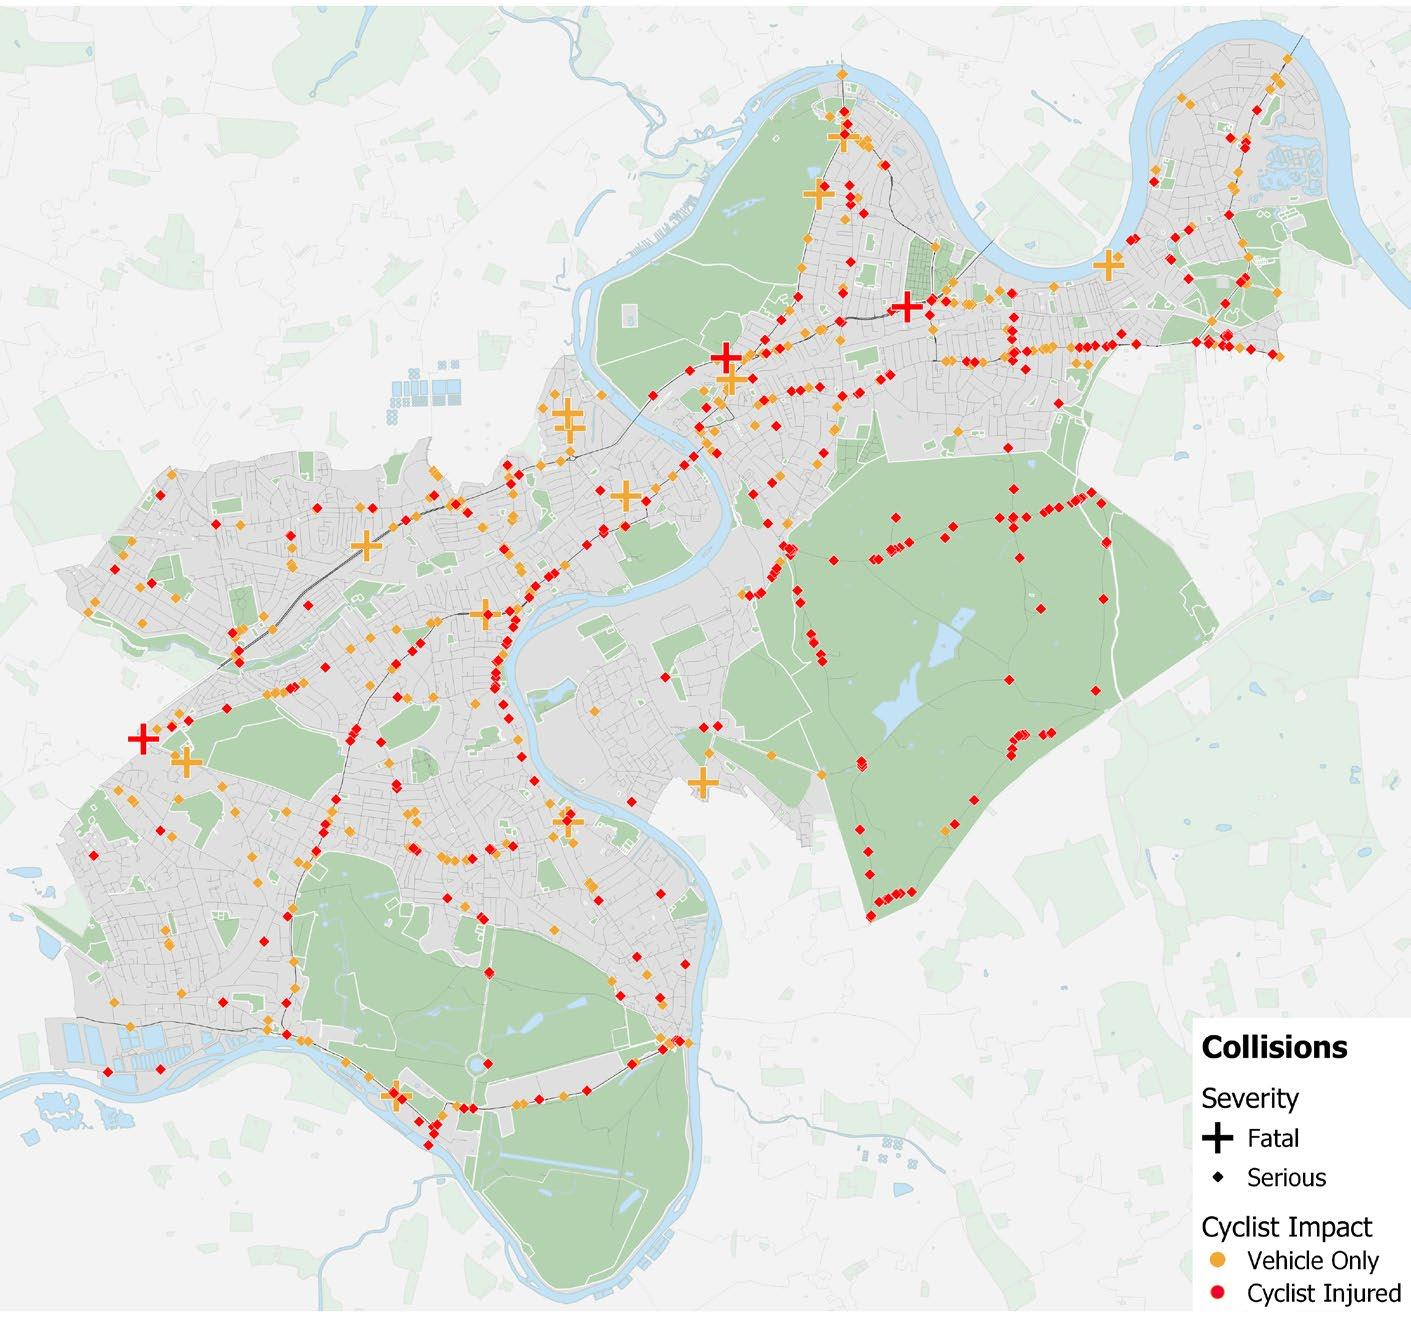
Collisions Locations 2016-2023
The Transport Strategy aims to make travelling around the borough as safe as possible so that all residents feel secure on roads, trains, buses, pavements, and paths.
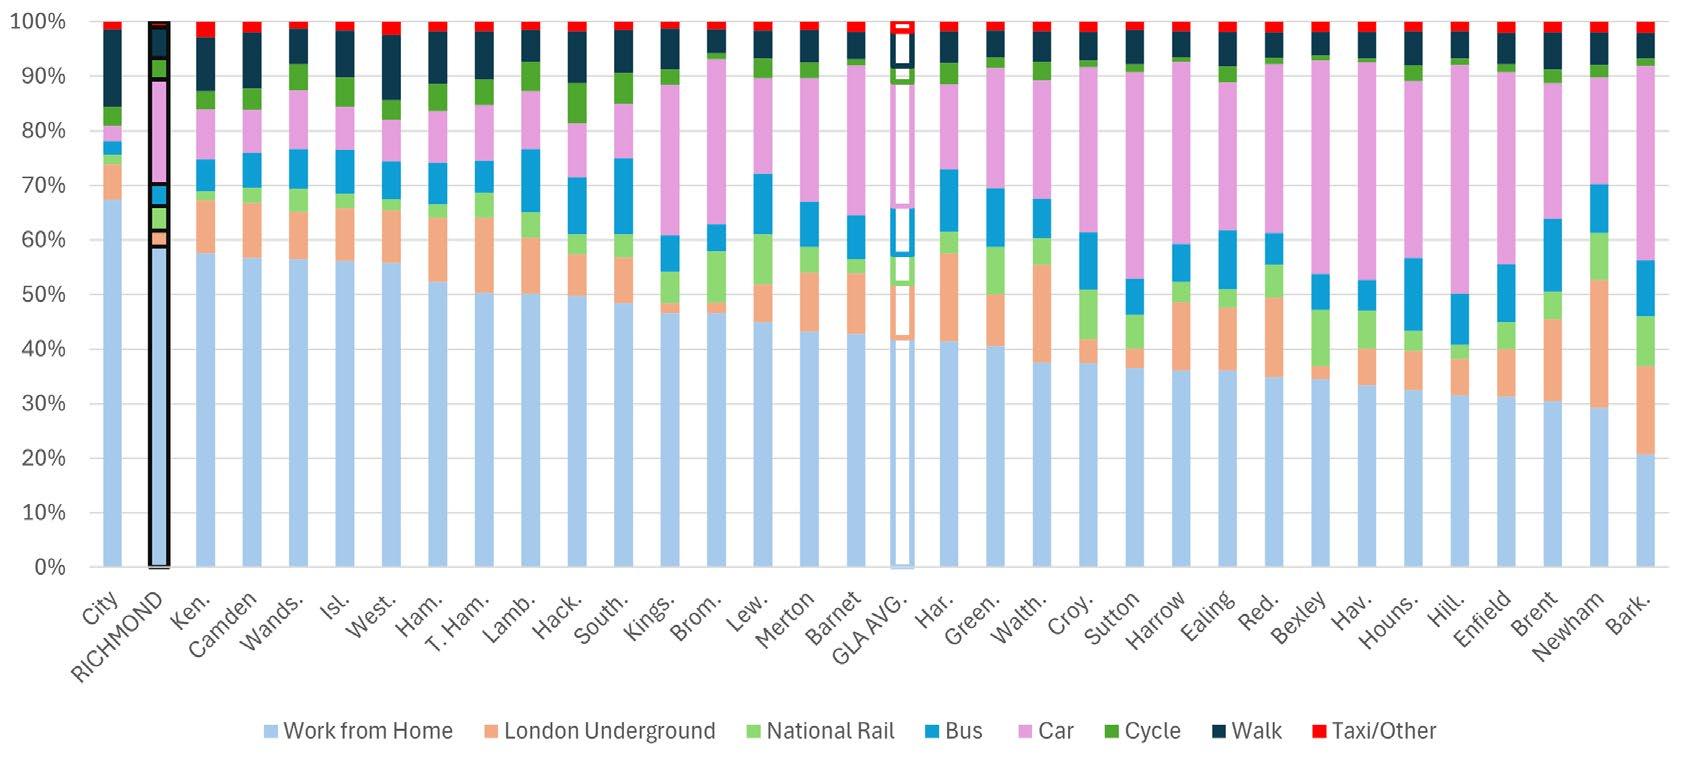
Other than the City of London, Richmond residents work from home more than any other borough
Nealy half of Richmond residents who commute do so by private car
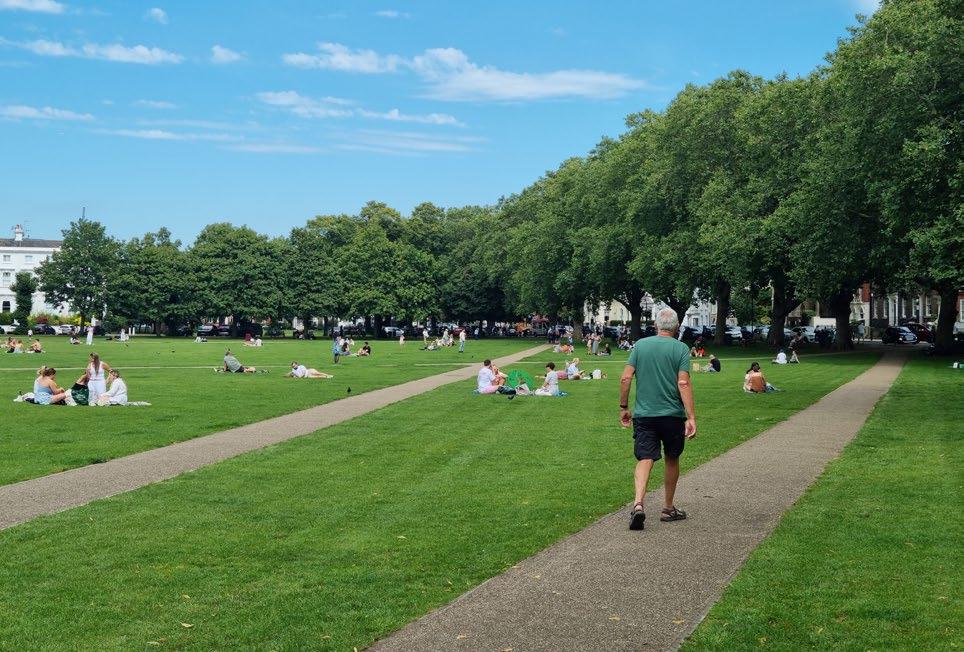
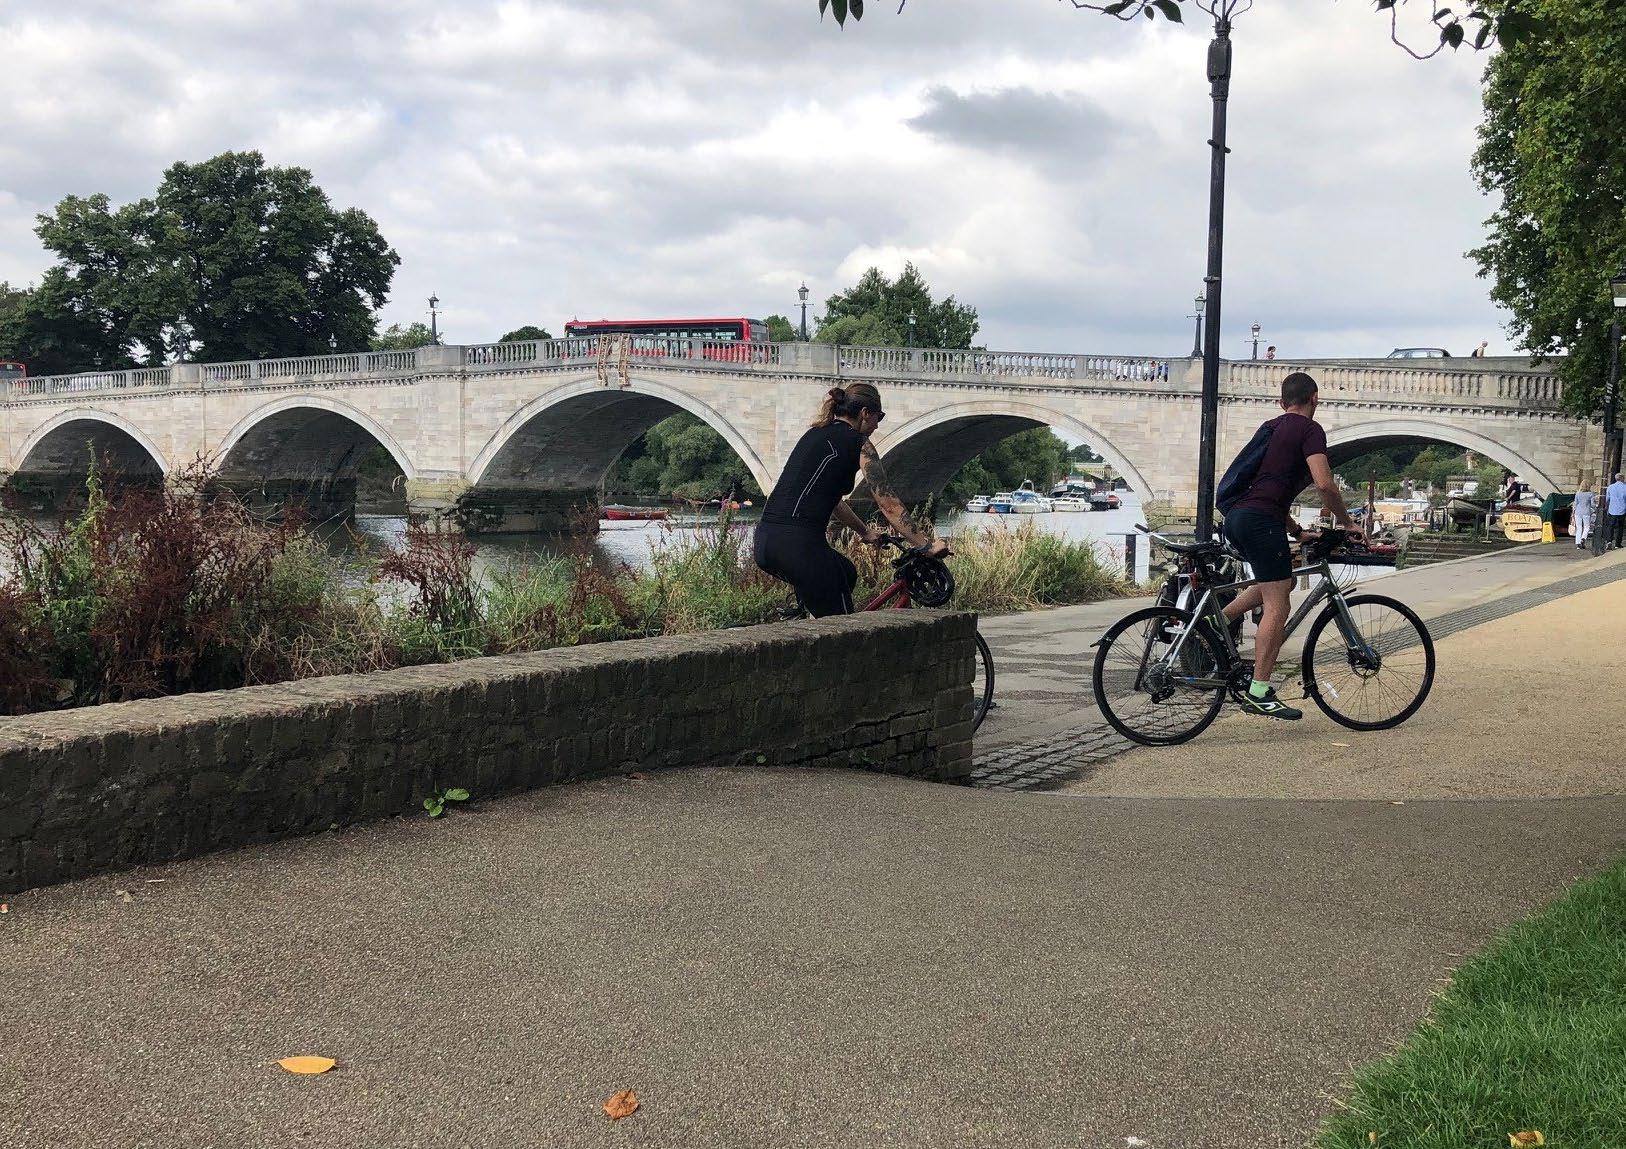
About half of adults in Richmond get substantial exercise from walking or cycling at least 5 times a week
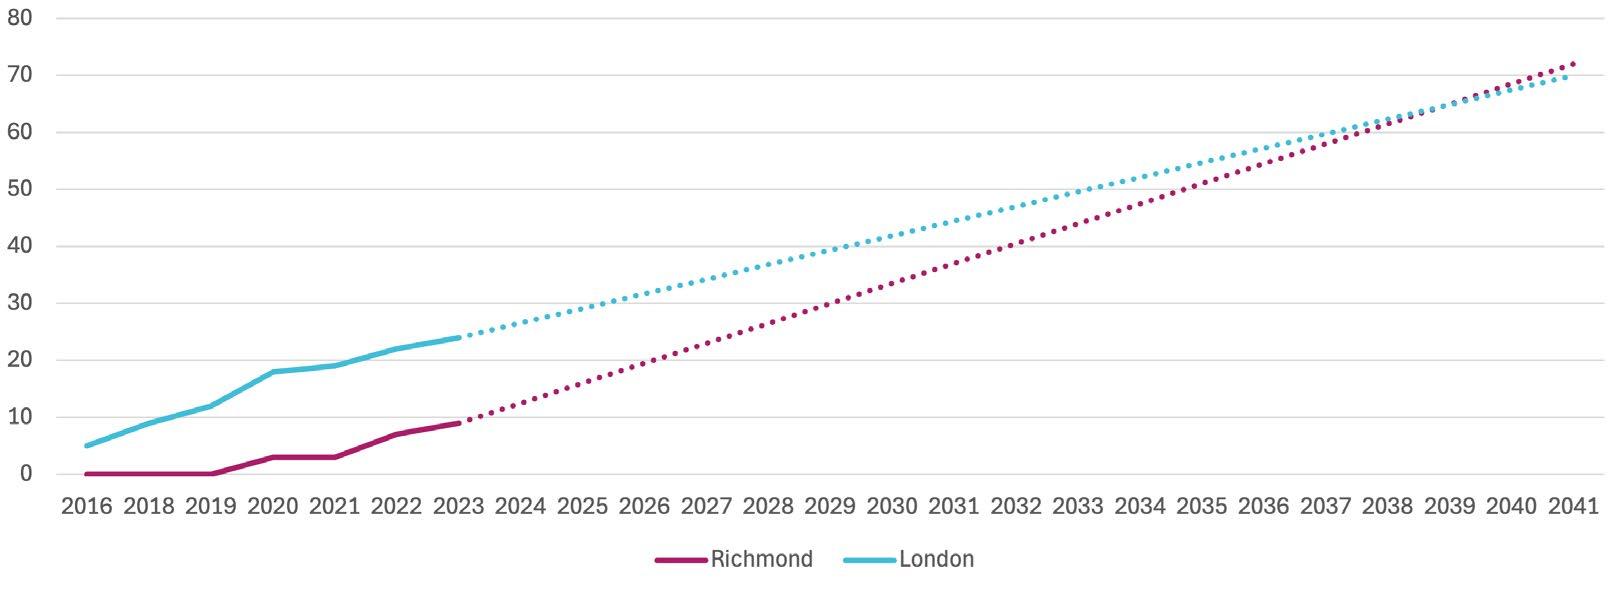
By 2040, about 70% of Richmond residents are projected to be living within 400m of the London-Wide Strategic Cycle Network
Mode share target for trips to be taken by walking, cycling, and public transport
% of Residents Living Within 400m of the London-Wide Strategic Cycle Network
Richmond residents are relatively active and healthy
In comparing Richmond with all Outer London boroughs, Richmond has the highest percentage of residents who achieve at least 20 min of active travel a day
An accessible and thriving public transport system directly helps to promote active travel
Percentage of Adults that Walk or Cycle at Least 5x a Week
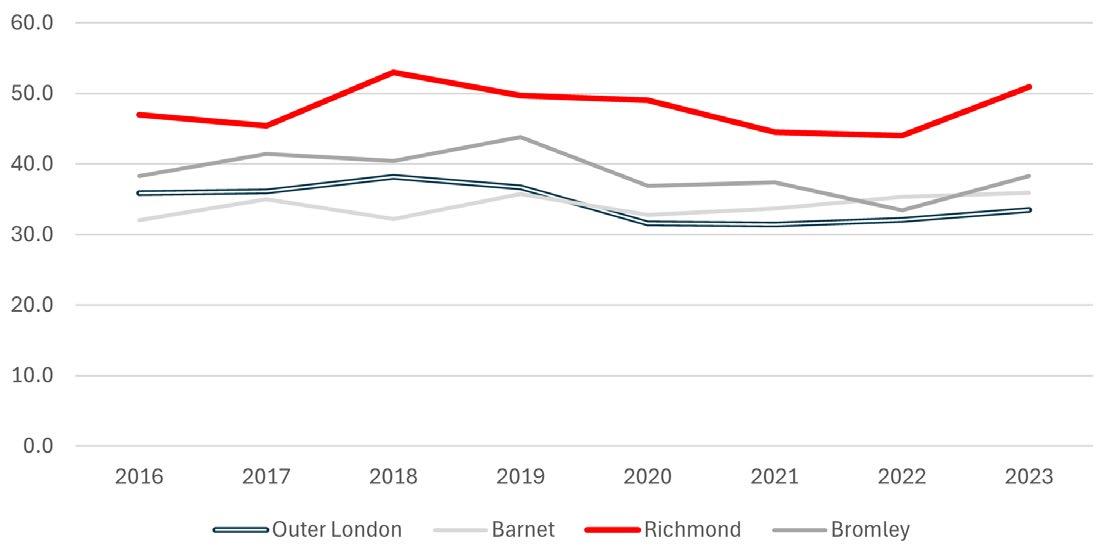
Percentage of Residents aged 20+ Achieving Over 20 min of Active Travel/Day
By ensuring active travel is accessible and safe to residents of all abilities and ages, the borough’s collective health and quality of life will improve
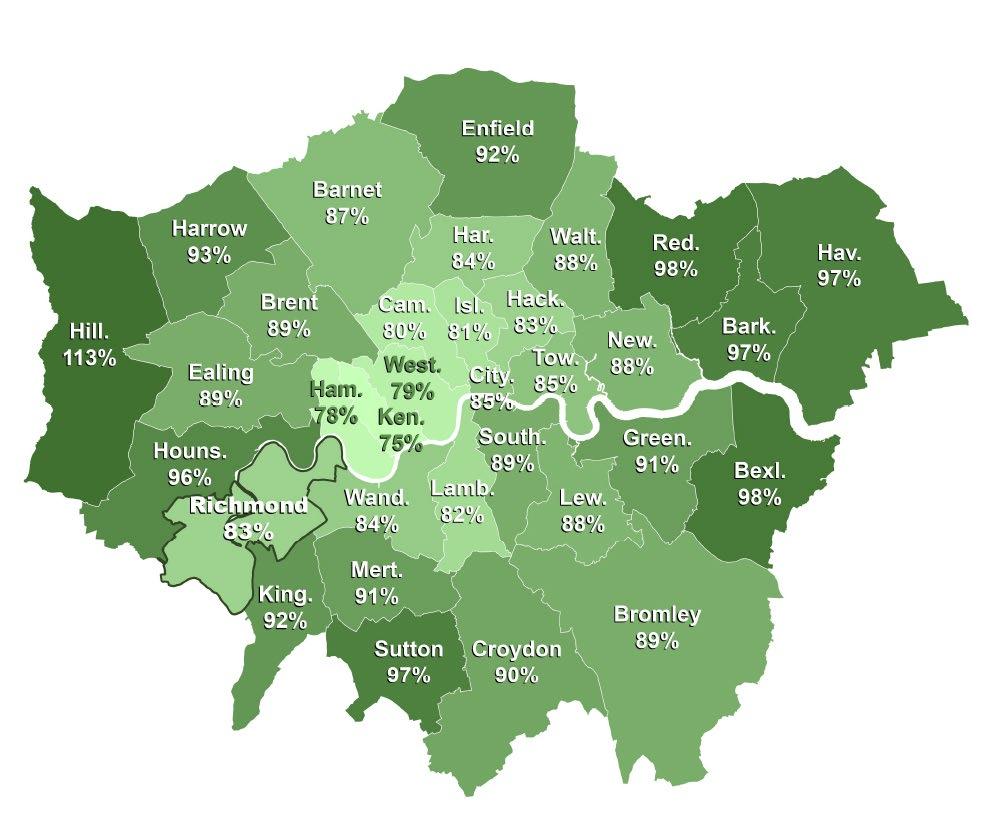
Richmond is expected to see a 7% increase in Public Transport trips between 2019 and 2041
Outer London projected increase is 21.7%
London-wide projected increase is 20.5%
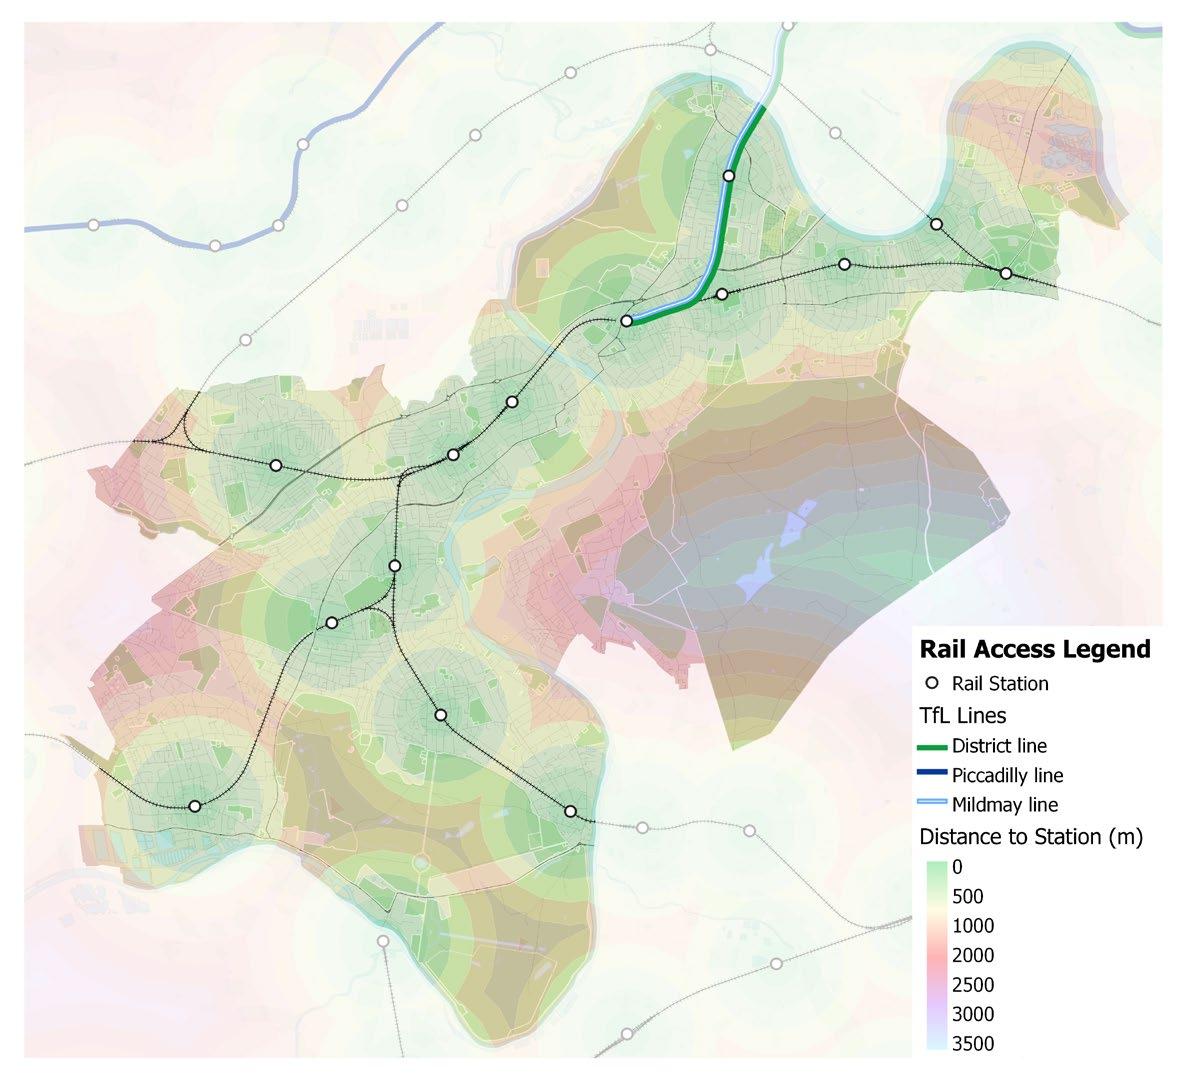
Distance from a rail station varies significantly across the borough
Areas such as Hampton Hill and north of Richmond Park are both distant from a rail link and have limited bus options
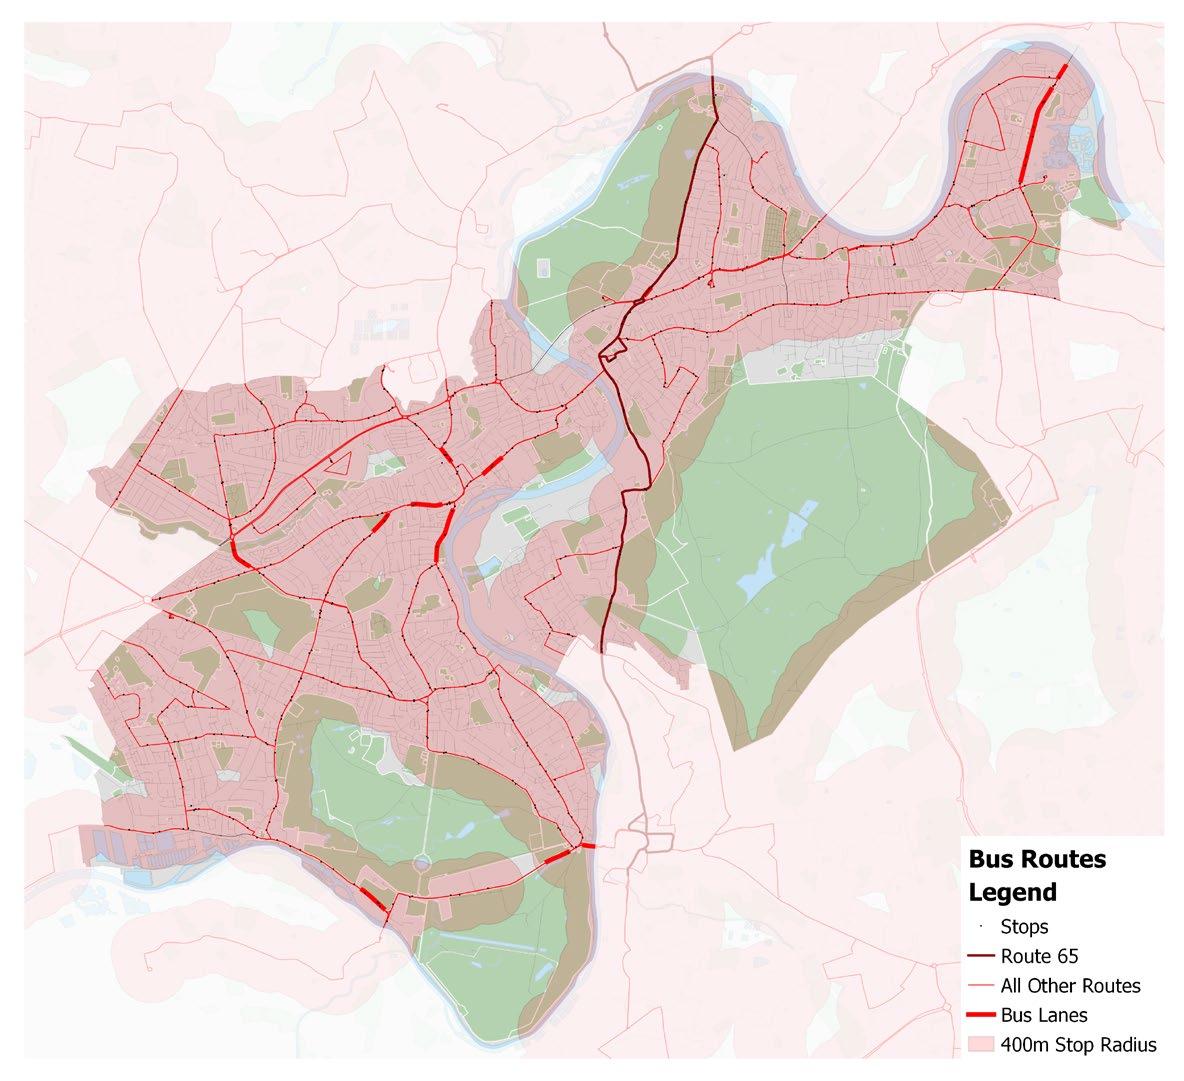
Access to Bus Network
Access to Rail Network
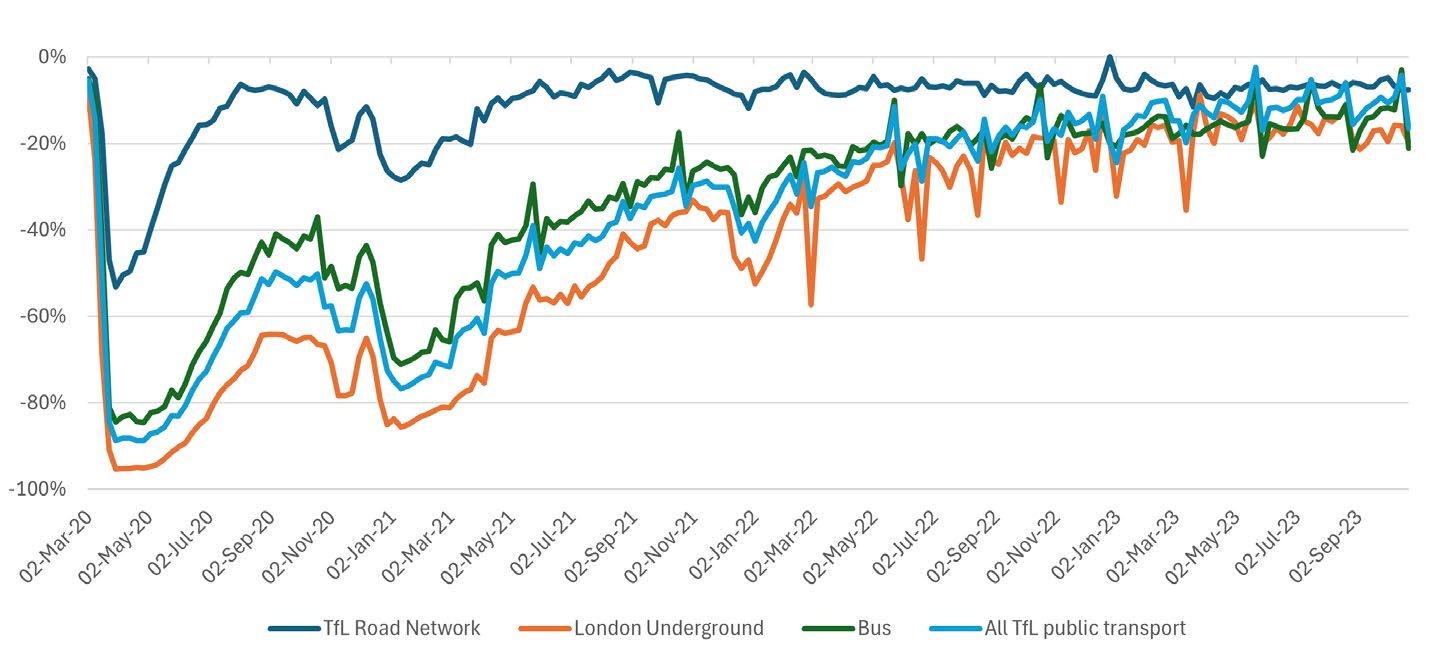
Across London, demand on the TfL road network has nearly returned to pre-pandemic levels
However, public transport usage remains 10-20% below pre-pandemic levels
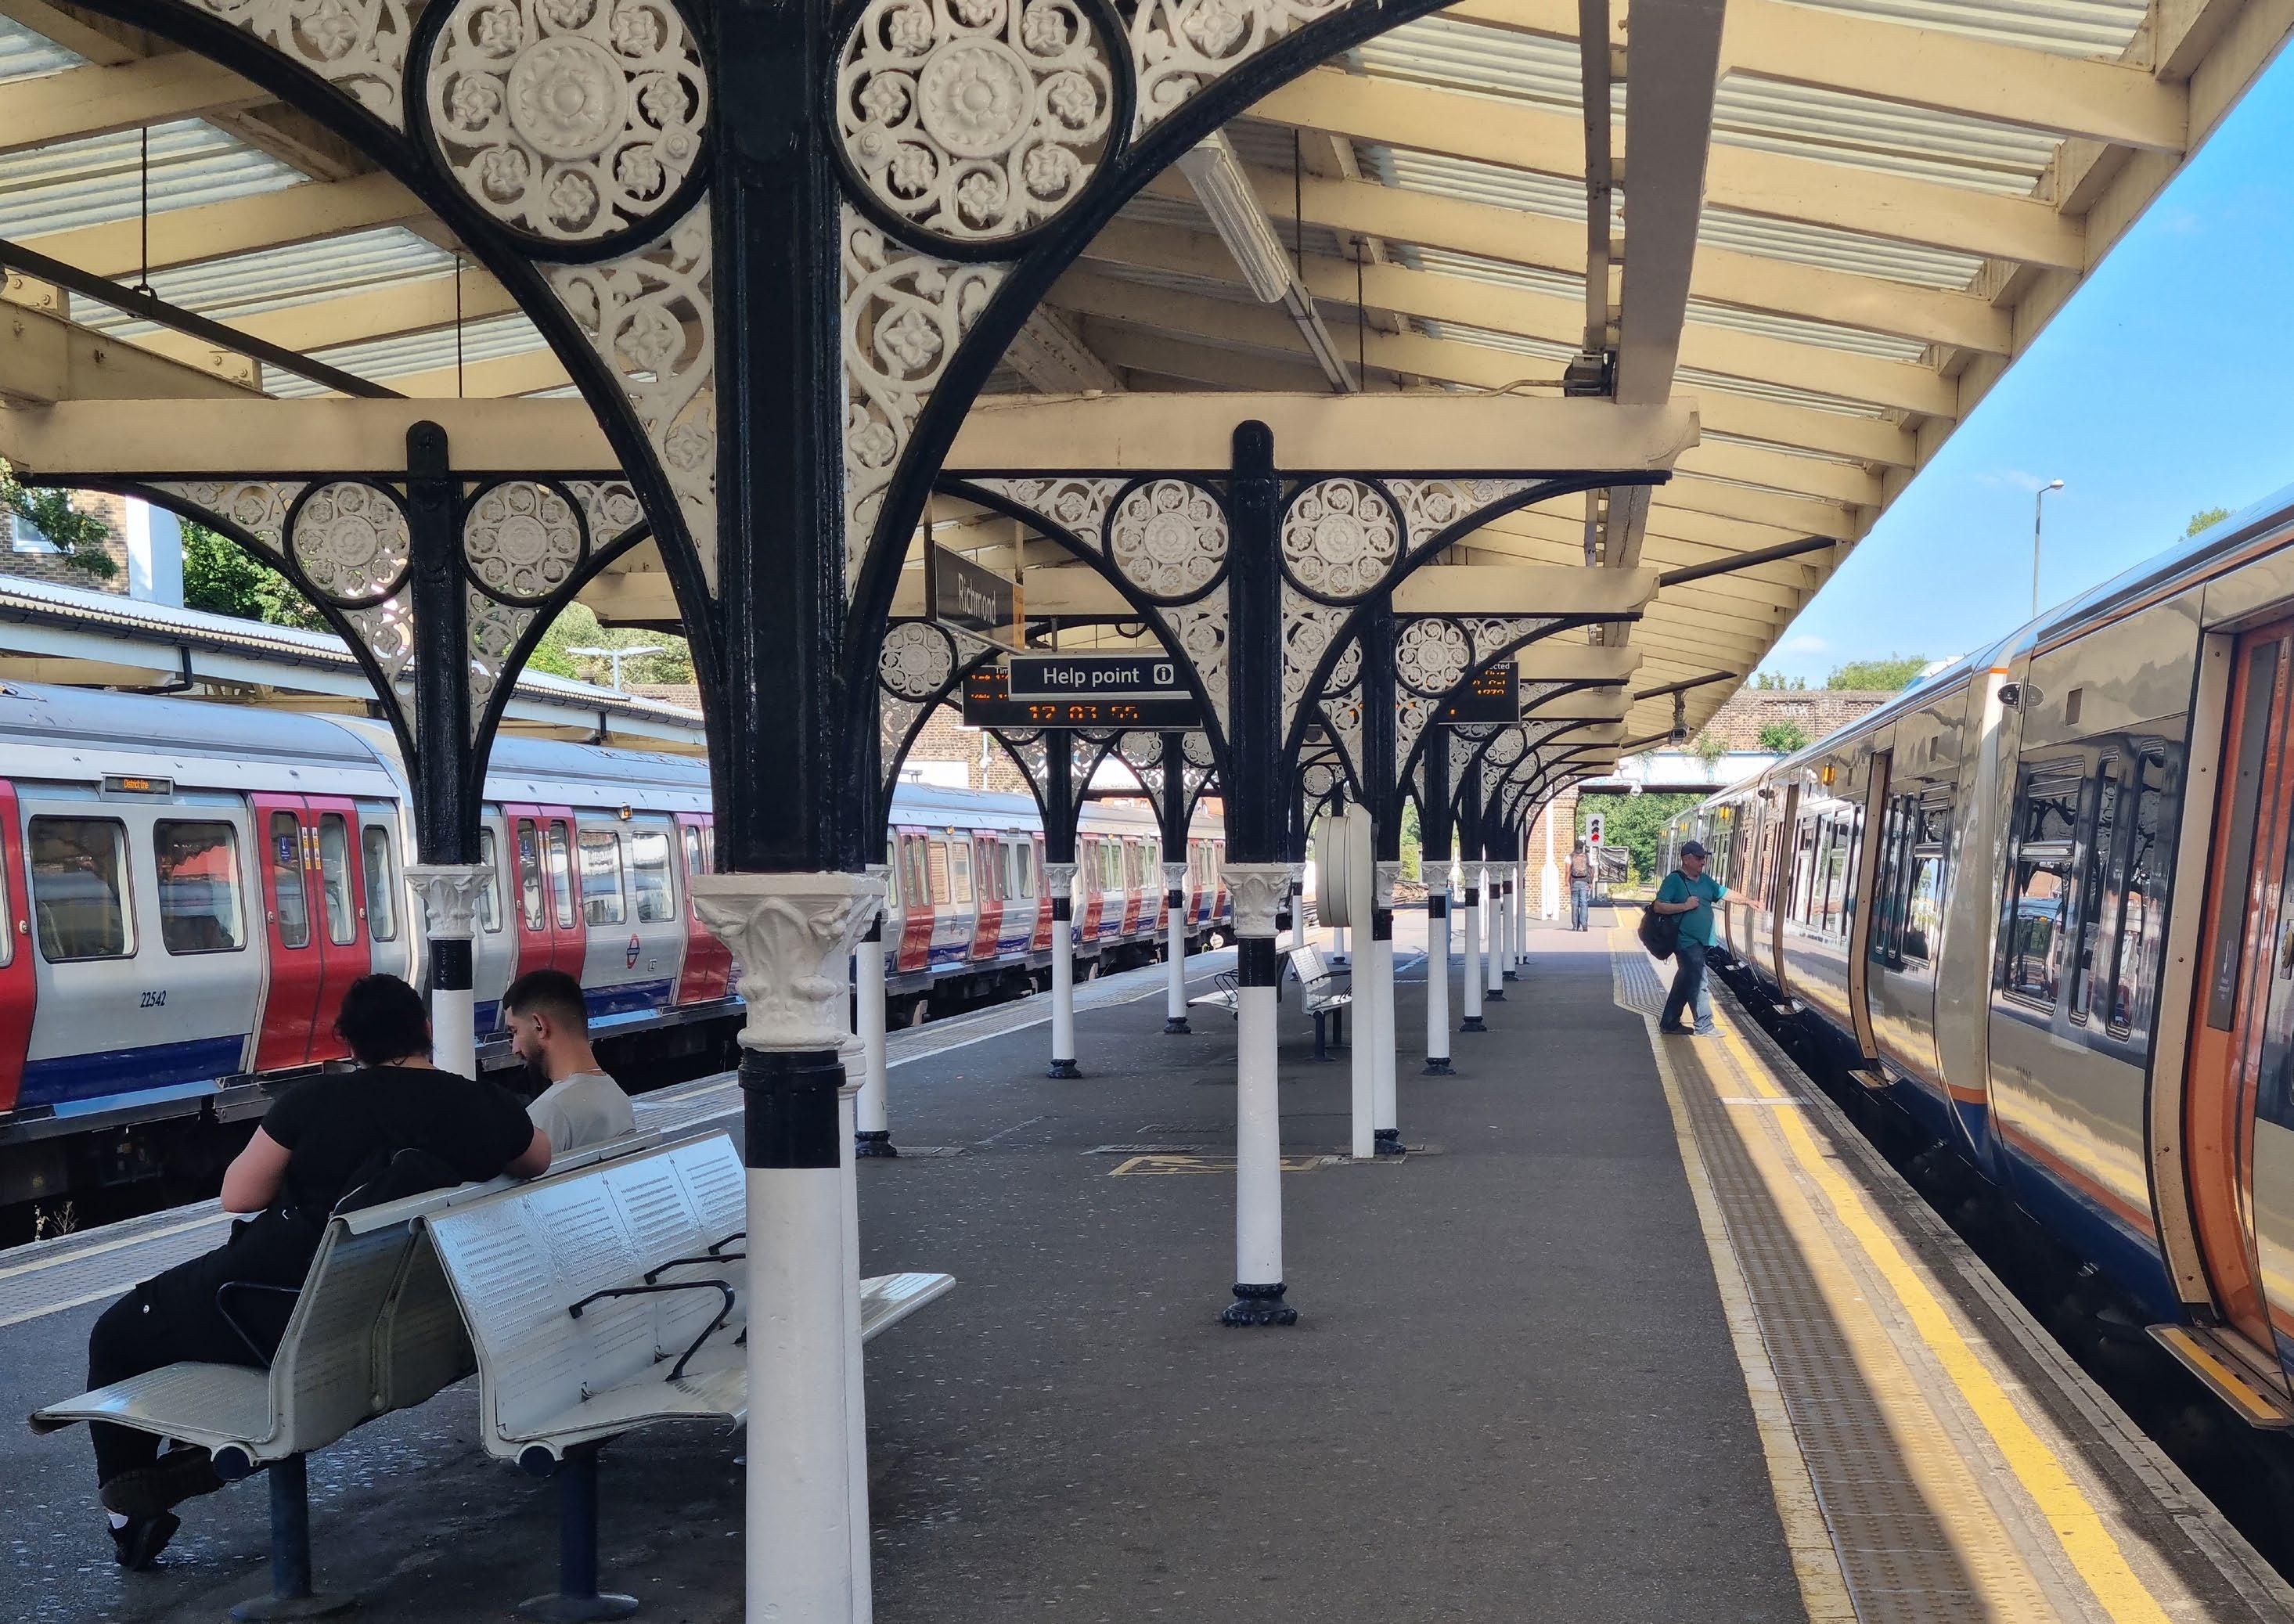
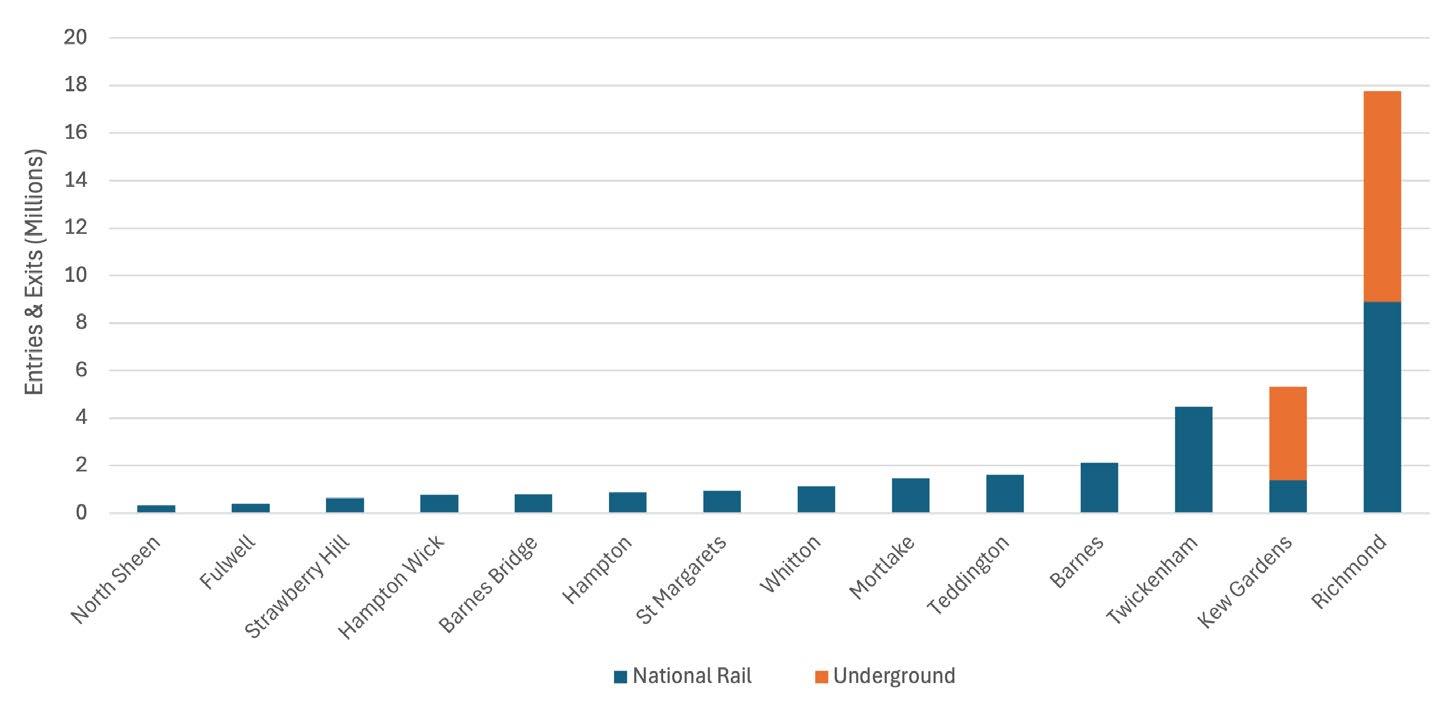
Richmond, Kew Gardens, and Twickenham stations are the busiest stations in the borough, seeing passenger numbers comparable to Inner London stations
Avg. Weekly Demand on the Main Transport Networks Compared to the Equivalent Week Before the Pandemic (March 2020 – October 2023)
Weekday (0-24h) Bus Boarders Compared with 2019, by Local Authority
Source: PTSP/TAPS
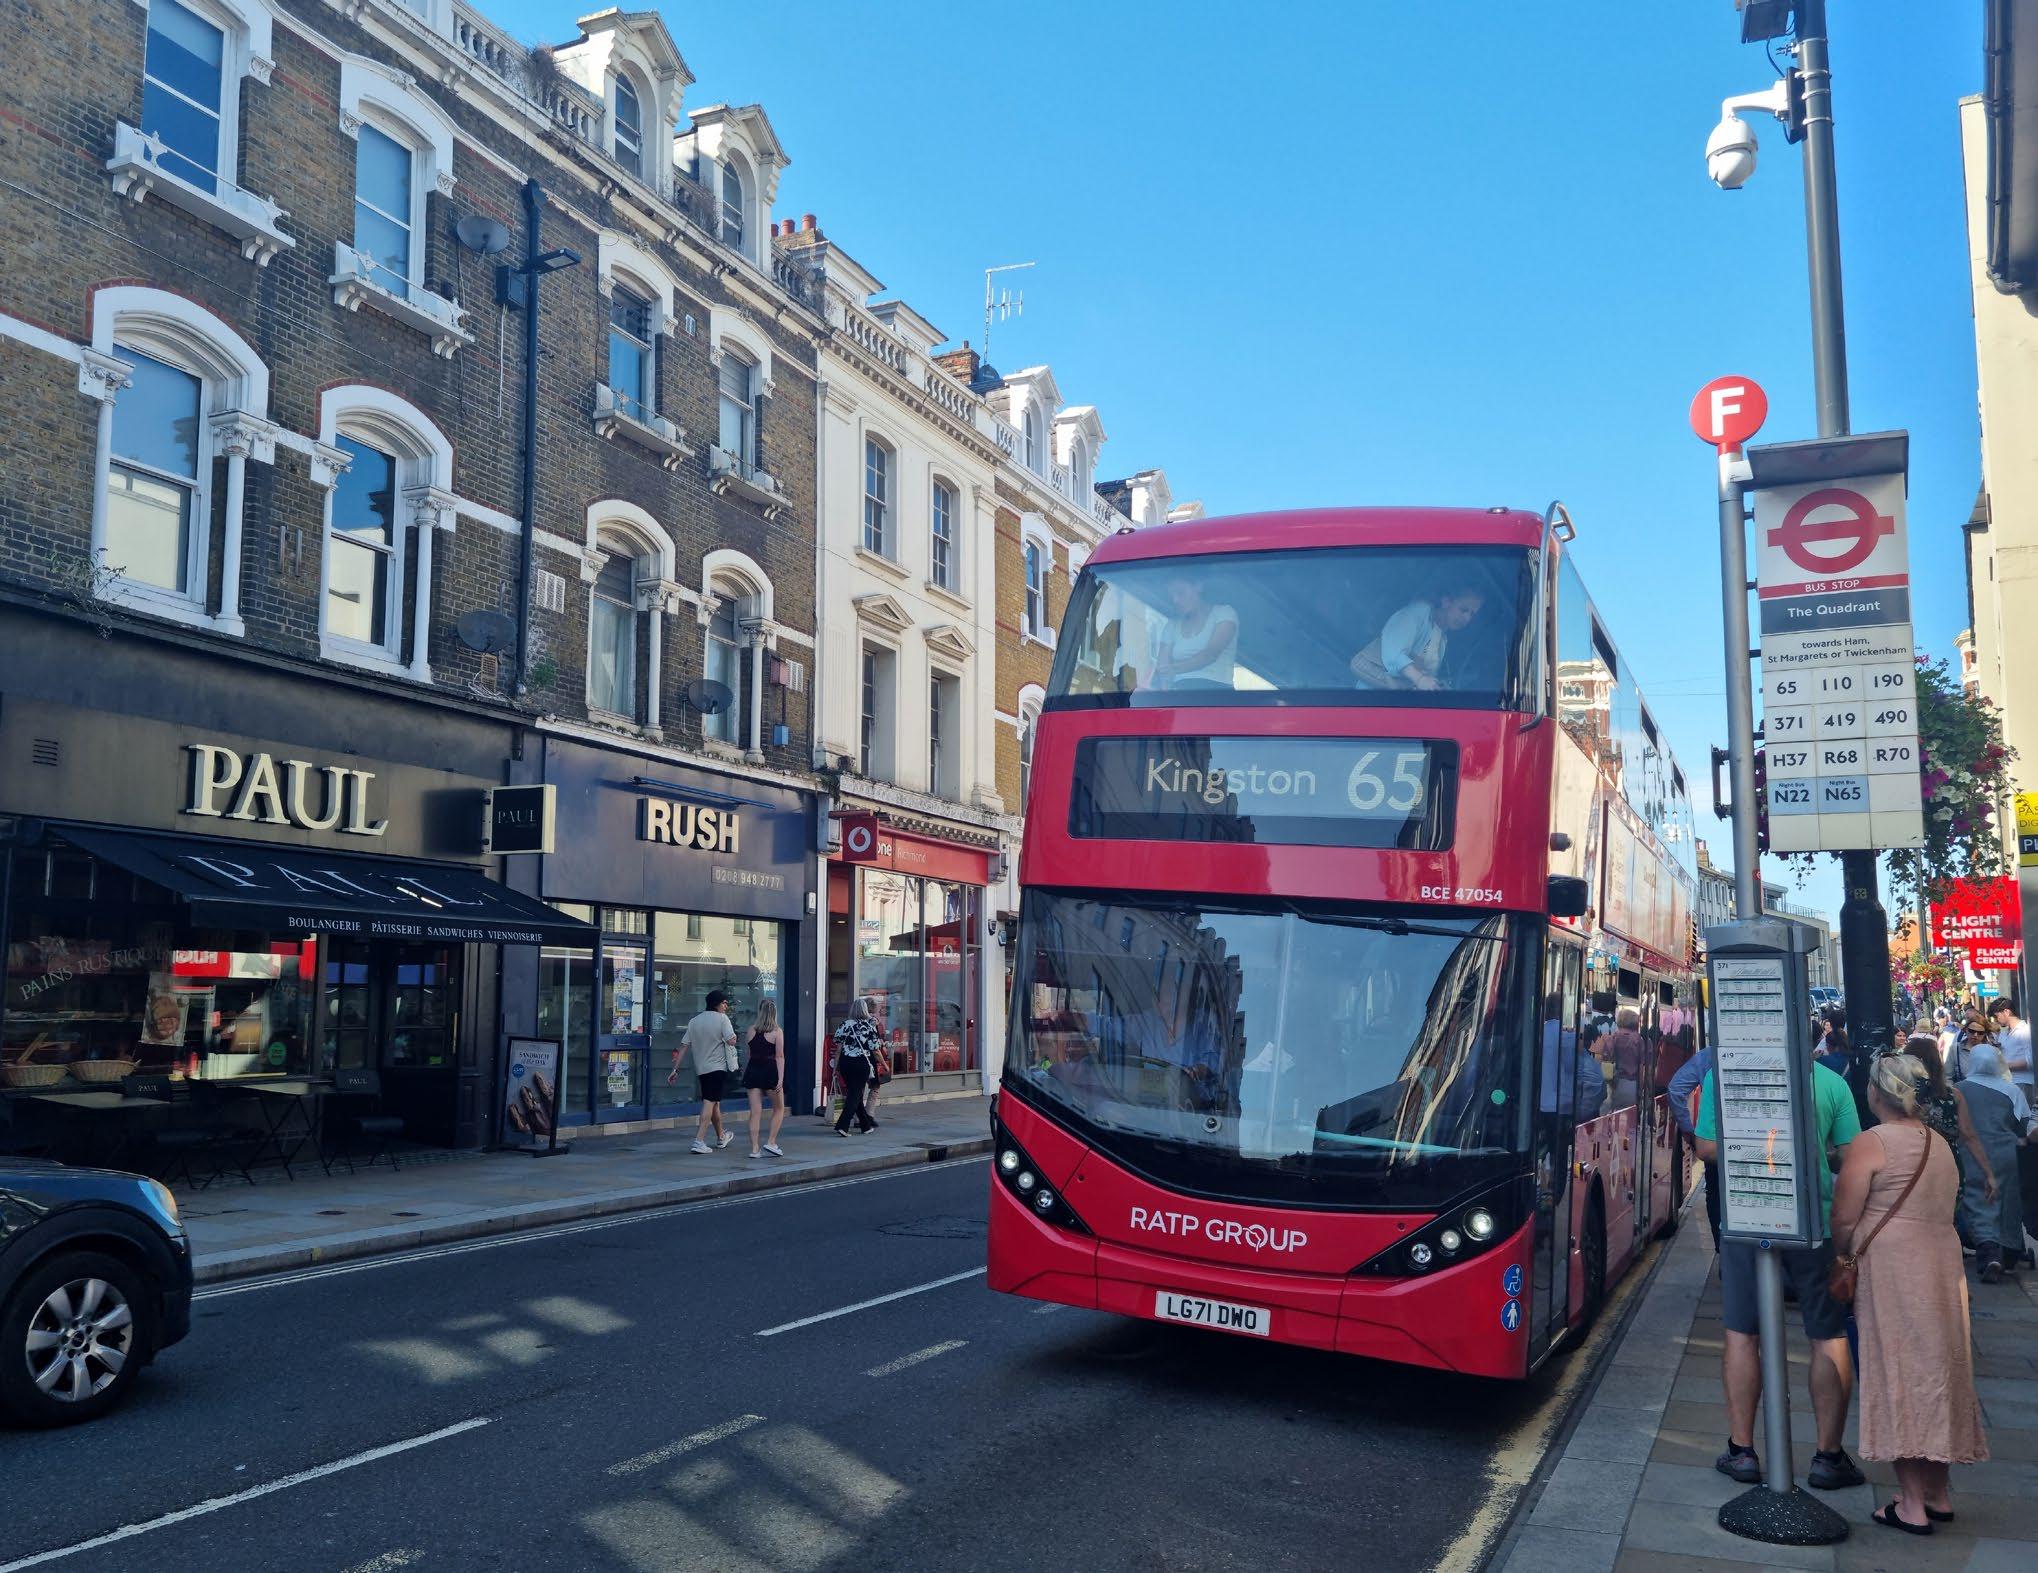
There are currently 30 bus routes in the borough
20 of these routes carry over 1 million passengers a year Richmond’s route 65 is one of London’s 25 busiest bus routes
The borough aims to improve bus speeds from 11.1mph to 11.6mph by 2041
An increase of about 5%
While many boroughs saw a decrease in bus capacity from the early to mid 2010s, Richmond saw an increase of 1%
In focusing on long-term public transport goals, the Transport Strategy will ensure more residents have better access to jobs, shops, social events, and public spaces