Behind the Image: The Imaging Chain and Resolution

FDD2
FDD1

We intuitively understand the power of X-rays to image fine details and find defects, for example for examining cracks and breaks in bones in a medical context. The same is true for non-destructive testing (NDT) using X-rays in an industrial context. From finding unwanted contaminants in rechargeable batteries to quality control of elec-
trical connections in advanced computer chips, images obtained with X-rays provide important and actionable insights. But what are the relevant factors required to produce an X-ray image, especially when “resolution” is an important topic? To produce an image, we need a light source, an object, and a detector, and together these make up the
“imaging chain”. In order to produce an image that can achieve a desired resolution it is necessary that all parts of the image chain are designed appropriately. In fact, “resolution” is a complete system level term and cannot be attributed to any one component of the image chain such as the detector or the source. Here we will outline the main concepts
within the imaging chain and how they contribute to produce an X-ray with particular emphasis on micro and nano scale imaging. In addition we will clarify the key concepts surrounding resolution.
In the case of X-ray imaging the light source is an X-ray generating tube, within which electrons are accelerated using high voltages onto a target material. The resulting collision of electrons with the target produces X-rays within an interaction region which is called the focal spot size of the X-ray tube. Focal spot size is one of the key elements of the imaging chain as it determines the lateral area from which X-rays are emitted i.e. the size of the X-ray source. The electron energy, the type of material and the interaction volume all contribute to the spot size. Why is the focal spot size so important?
A smaller source, in combination with the other factors discussed in the rest of the article, enables
sharper image edges and therefore higher resolution compared with a large source. This is because, with a smaller focal spot, there is a smaller range of source positions that contribute to the image. This is illustrated in Fig. 1. For a large focal spot, X-rays from different regions of the source contribute different intensity levels to the edge of the pinhole image, meaning the edges become spread out, or blurred. In such a case, the maximum achievable resolution is reduced. The opposite is true for a small source, where there is less variation in intensity across the edges due to there being less variation in the source position. However, focal spot is only one important factor in determining the overall system resolution.

Detector pixel pitch
With an X-ray source and an object that we want to inspect, the question is how do we capture an image? Our eyes are sensitive to the optical part of the electromagnetic spectrum, but X-rays are much higher in energy and our eyes cannot sense them directly. This means we need an X-ray detector. A variety of detectors are available on the market, with differing detection mechanisms and specifications. It is important to select a detector that corresponds to your specific requirements. Here we will focus on direct conversion flat panel detectors (FPDs) where an X-ray generates an electrical current in the detector pixels that is proportional to the X-ray intensity on each pixel. Since this image is digital, there is no information stored between the pixels. A critical parameter of the detector is therefore the distance between two adjacent pixels, called the pixel pitch. The distribution of X-ray intensity leaving the object is continuous, in contrast to the discrete pixels on the detector. The pixels are how we build a digital representation of the real analogue object, and the pixel pitch reflects how finely we sample the real object, meaning how well we can reproduce an image of the original object. A smaller pixel pitch gives a higher sampling rate, which helps to provide a more detailed representation of the real object. However, it must be remembered that small pixel pitch alone also does not guarantee high resolution. To resolve fine details, we also have to spread the image – or the part of the image that we want to see in detail – over as many pixels as possible.
Image magnification
This highlights the importance of an additional part of the imaging chain: image magnification. Imagine that you brought the detector so close to the source that only a single pixel was illuminated. This would not provide a suitable image of an object. In fact, it would produce only a single bright spot on the detector. Therefore, it is necessary to spread the image across multiple pixels to digitally capture it. In other words, we have to magnify the image. The magnification of an X-ray imaging system (in the absence of focussing elements) is given by the ratio of two distances: the focus to object distance (FOD) and the focus to detector distance (FDD). The magnification, M, is given by:
This relation can be understood intuitively. Consider first the FDD. When moving the detector far away from the source, the image is spread across more pixels than if it was very close to the source (Fig. 2). The result is that the magnification of the image is increased. A larger FDD enables a larger magnification. Of course, moving the detector away from the source has a downside: the inverse square law means that less signal will reach the detector the further it is from the source. In addition as the image information is spread over more pixels each individual pixel sees less signal, resulting in longer measurement times. Thus, a balance must be found allowing desired features to be visible while maintaining reasonable dose on the detector.
Now consider the FOD. By reducing the distance between the object and the X-ray source (Fig. 3) the projection of the image on the detector is spread across more pixels as it has more space to expand in the region between object and detector. Therefore, the magnification can be increased by reducing the FOD. A reduced FOD has the advantage that the magnification is increased while the signal that reaches the detector is not reduced, as it is possible to keep the FDD constant. The limitation is that one
cannot approach the X-ray source indefinitely. How close it is possible to approach the X-ray tube depends on the design of the X-ray inspection system, for example the range of the manipulator tray or production line belt, and the design of the X-ray tube. In practice, both the FOD and FDD must be chosen appropriately depending on the specific imaging task. Finding the optimal FOD and FDDs will depend on both the tube and system geometry, as well as the magnification required to visualise a specific feature.
Determining minimum magnification
Given the above discussion, we can expect that there must be a relation between magnification and pixel pitch. To resolve a feature clearly we need to have the feature magnified across some given number of pixels. What is the minimum magnification required to do this? It will depend on the size of the feature and the pixel pitch. Making an assumption about how many pixels a particular feature should cover allows a calculation of the required magnification. We can express this mathematically as:
Mmin = x F Pixel pitch Feature size
where F is a factor depending on the minimum required pixel area for a particular feature e.g. 3x3 or 5x5 pixels [Ref 1]. Once that is known, an appropriate FDD/FOD ratio can be chosen.
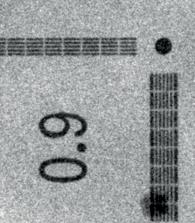
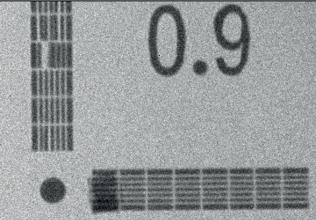
The two relations for magnification highlight that there is not a single answer to the question “what magnification is required to resolve a particular feature?”. Pixel size, FDD, FOD and the size of the desired feature all play a role and have to be considered together. As an example, in Fig. 4 we show two images of a 0.9 mm JIMA mask resolved using a Comet FXE-160 nano tube [2]. One can see that the 0.9 mm feature is well resolved using detectors with different pixel pitch (127 um and 55 um respectively), with the magnification changed accordingly.
Fig. 4 – JIMA masks at 0.9 um size obtained with two different imaging chains and an FXE-160 Nano tube.
From the above discussion of the imaging chain, it is clear that a number of system level factors are relevant to producing good resolution in an X-ray image. But what do we mean by “resolution”, and how do we determine if it is “good” or not?
Spatial resolution is a common parameter used in the evaluation of imaging systems. In a few words, it characterizes the imaging system’s ability to distinguish between two very small objects placed closely together. It is a system level property that requires an appropriate imaging chain. A wellknown example of a standard resolution measurement is the JIMA mask measurement. The JIMA mask is comprised of groups of gold lines etched on a silicon substrate spaced by set distances of a fixed value in each group, see Fig. 5. Gold absorbs X-rays much more readily than silicon, so a large contrast is available between the lines and the background, which is typically very uniform. The smaller the distance that can be resolved with a particular system, the higher the system resolution. The power of the JIMA mask and other similar masks, is that they are standardized samples that are expected to behave the same in every X-ray system, therefore allowing a comparison between the performance of one system against another in terms of spatial resolution. For completeness, it should be noted that spatial resolution is sometimes referred to as “high contrast resolution”.
This definition of resolution is still unsatisfactory, as it does not tell us when something is resolved or not. Our eyes can often judge when there are two objects close together or only one, but at what point are two lines “resolved”? A common way to solve this is to refer to the contrast that is achieved in the region between the two objects, and as an example we take two gold lines from a standard mask as our objects. In this case, contrast refers to the intensity level difference between the X-ray signal from the gold line compared with the region of the silicon substrate. In a perfect system, the substrate would let all the X-rays through and provide 100% transmission. In contrast, the gold would absorb 100% of the X-rays providing 0% transmission. So ideally going from one gold line to the next there is 100% contrast variation thanks to the silicon substrate. However, imagine the gold lines are brought closer and closer together until at some point they touch. Now there is no longer 100% contrast between the gold lines, and it becomes more difficult to visually separate them. Contrast of 0% would mean the two lines appear only as one line. So how does this help solve our resolution problem? Simple: we say that two lines are resolved if there is a certain minimum contrast between them in the image. The exact value chosen is not universally agreed upon but is typically defined in the range of 10% - 20% contrast for the maximum possible resolution. An example of different line measurements with different contrasts obtained using a Comet Xplorer 130 Cube (Ref. 3) is provided in Fig. 6.
Fig. 6 – Contrast examples. Left: JIMA mask images obtained with the Xplorer 130 Cube. Right: line cuts at the positions indicated for 3 um and 4 um line sets revealing the contrast at each resolution level.
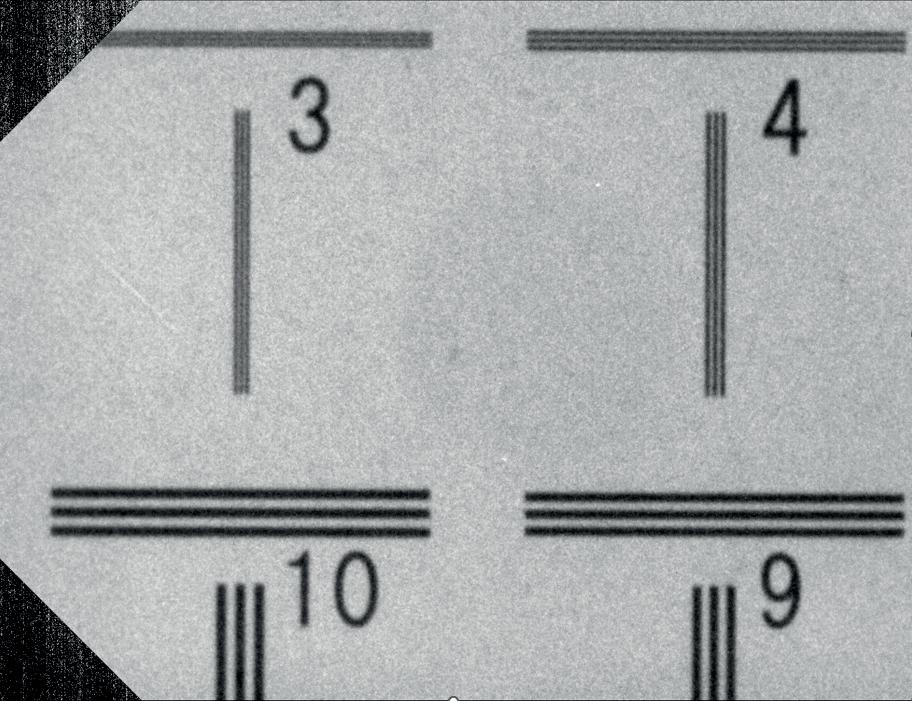
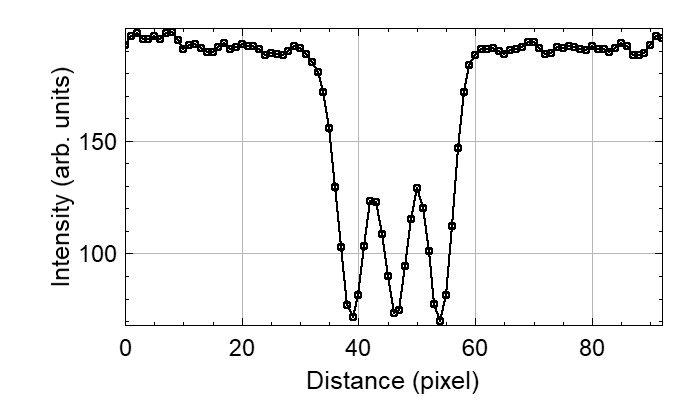
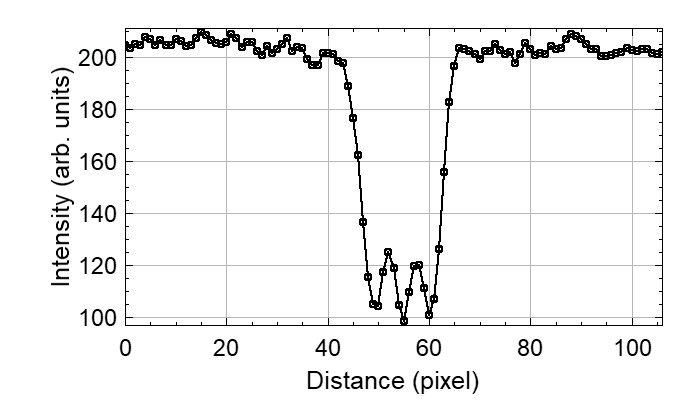
Fig. 7 – A schematic Modulation Transfer Function (MTF) showing contrast as a function of resolution (not actual data).
Contrast (%)
The contrast between neighboring lines is sometimes referred to as a “modulation” as when many lines are imaged the continual increase and decrease of intensity produces a sinusoidal curve (see the line cuts in Fig. 6). This helps explain another term that is commonly used when discussing resolution: the Modulation Transfer Function (MTF). This is a way of capturing the overall response of an imaging system. Essentially it tells us how much contrast is available for any line pair distance, in other words how much contrast is available for any resolution level. So for example we might have 100% contrast at 150 mm line spacing, but only 5% contrast at 2 mm line spacing. Both are still technically resolved, but it will take longer to produce a clear image of the two lines if the contrast is lower. A schematic MTF is shown in Fig. 7.
Another commonly used term is “contrast resolution”. This refers to the ability of any imaging system to distinguish between differences in image intensity. The intensity measured by the detector is governed by the X-ray attenuation properties of the material being inspected and the amount of material being penetrated by the X-ray beam. If the X-rays pass through thicker material, or if the material is very dense, less X-ray signal will reach the detector. Since we are using digital detectors made up of pixels, the intensity information has to be converted into digital information and stored in bits. Each pixel has a certain number of bits that it can use to store information. If a pixel has more bits, it is able to store a larger number of possible intensity values, known as the gray values (see Fig. 8). A larger number of possible values makes it easier to differentiate the intensity value on one pixel from the intensity value on the neighboring pixels. Therefore, the inherent contrast resolution of a digital image is given by the number of possible pixel gray values and is defined as the number of bits per pixel.
The factors that impact contrast resolution in an image include:
• Object contrast - The natural contrast of an object being imaged will impact the level of contrast resolution. If the object has no intrinsic variation there will be no contrast.
• Scatter reduction - Collimating or filtering the X-ray beam reduces scattered intensity, which improves contrast resolution.
• Image reconstruction – Reconstruction algorithms can help to improve contrast resolution.
• Noise - The level of noise in an image directly impacts the contrast resolution. Decreasing the noise in an image will improve the contrast resolution. Increasing the noise will worsen the contrast resolution.
The term “contrast resolution” is typically used in the world or medical radiology. In an industrial NDT setting, it is more common to refer to the “contrast-to-noise ratio” (CNR). An advantage of this approach is that it factors in the influence of image noise on the contrast, i.e. what subtle differences in intensity are detectable for a given noise level.
Fig. 8 – An illustration of the different value ranges possible within a pixel depending on the number of bits that pixel contains. More bits mean a larger range of possible gray values can be read out.
A number of factors contribute to the resolution of an X-ray imaging system and these are collectively referred to as the imaging chain. Producing images capable of resolving specific features requires a system level approach that considers the complete imaging chain appropriately. As a component manufacturer, Comet X-ray is involved deeply in specific areas of the imaging chain, namely the X-ray source. As a result, it is the focal spot size that we can most effectively control. This is a very important part of the imaging chain, and determines the ultimate resolution that can be achieved in a system, but it is only one part in determining the real maximum resolution of an imaging system.
It should be noted that image quality is somewhat subjective and will additionally depend on factors such as the required signal to noise ratio and therefore the total acquisition time. An image acquired for 0.5 s can look unrecognizable to an image acquired for 8 min. This of course plays into the considerations of FDD and intensity per pixel. Increased power from the X-ray tube may also be
available, but this has to be balanced with the focal spot size that may be limited at higher powers in order to avoid damage to the target material. Imaging software can go a long way to recognizing features even within noisy data, for example by using trained AI algorithms. However, a good imaging chain must already be in place to enable such algorithms to function.
Finally, in the micro and nano regime of imaging, it should not be forgotten that mechanical and thermal stability play an important role to the overall stability, and therefore the spatial resolution, of the imaging system.
Contrast resolution
CNR
The ability to distinguish between similar gray levels in an image. In an industrial NDT context, CNR: the contrast-to-noise ratio is more often used.
Contrast to noise ratio is a measure of the intensity variation that can be distinguished for a given noise level.
FDD Focus to Detector Distance
FOD Focus to Object Distance
JIMA masks
Magnification
MTF
Standardized samples used to determine resolution.
The ratio of FDD and FOD.
Modulation Transfer Function gives the relation between resolution and contrast for an imaging system.
Pixel pitch The distance between adjacent pixels in a detector.
Spatial resolution
The ability of an imaging system to allow two adjacent structures to be visualized as being separate, or the distinctness of an edge in the image (sharpness).
[1] Northstar imaging website
https://4nsi.com/how-do-you-determine-the-minimum-geometric-magnification-to-use-for-digital-radiography-imaging/ [2] Comet X-ray website
https://xray.comet.tech/en/products?category=50&subcategory=45&productseries=FXE [3] Comet X-ray website
Xplorer - once available
Switzerland (Head Office)
Comet AG Industrial X-ray modules
Herrengasse 10 3175, Flamatt
T +41 31 744 90 00
Denmark
Comet Technologies Denmark A/S Helgeshøj Alle 38 2630, Taastrup
T +45 72 40 77 00
United States
Comet Technologies USA Inc.
100 Trap Falls Road Extension Shelton, CT 06484
T +1 203 447 31 65
Comet X-ray
Herrengasse 10, 3175 Flamatt, Switzerland
T +41 31 744 90 00
Web: xray.comet.tech
Mail: info@comet-xray.com

China
Comet Mechanical Equipment Co. Ltd. 1201 Guiqiao Road
Building 10, 1st Floor
Pudong, Shanghai 201206
T+86 21 6879 9000
Japan
Comet Technologies Japan KK
New Stage Yokohama Bldg., 1st Floor 1-1-32 Shinurashima-cho Kanagawa-ku Yokohama, 221-0031
T +81 45 450 1730
South Korea
Comet Technologies Korea Co., Ltd.
Suwon Venture Plaza Bldg, Room 402
48 Samsung-ro, 168 beon-gil, Yeongtong-gu, Suwon-si Gyeonggi-do, 16676
T +82 (0)70 4337 1282
T +82 (0)70 4332 1580
Taiwan
Comet Mechanical Equipment Co. Ltd. 1201 Guiqiao Road
Building 10, 1st Floor
Pudong, Shanghai 201206
T +86 21 68799000