32 minute read
Documenting A High Speed, Rear End, Partial Overlap, Crash Test Of A Large Sedan & Stationary Commercial Trailer

Craig Proctor-Parker
Accident Specialist, Durban, South Africa
Abstract
Crash scenarios involving a rear end impact are common place internationally. Some of the most devastating are often where a sedan collides into the rear of a commercial trailer, partial overlap. This type of crash is almost always with serious or fatal consequences. With a high number of these identified in a recent high profile Major Crash Investigation (MCI) project, a real life high speed test of this scenario was undertaken. Obtaining data from such a crash in a controlled environment for future comparative analysis is rarely presented. This paper presents a brief overview of the setup and results of the high speed rear end, sedan to stationary commercial trailer.
Keywords & phrases - Rear-end crash; head-rear crash; Under- ride crash, Rear end accident, High speed rear end impact, Partial overlap impact.
Introduction:
This research is based on a practical crash test session undertaken by Accident Specialist as a combination of research and awareness. Three different crash scenarios were presented, two of these remote controlled1. This particular crash being one of the three and is available online at: https://www.youtube.com/watch?v=dsT1VCL18Uk
Internationally, rear end crash scenarios are well represented in crash statistics, this too is a statistic that is prevalent in South Africa. Such crash scenarios are typically as a direct result of major traffic congestion, vehicles broken down at hazardous locations and/or simply due to driver error in their negligence either as the vehicle being struck (Target), or the vehicle striking (Bullet). As with opposite direction head-on, type impacts, high speed rear end partial overlap impacts present an even greater risk for a number of reason, not least of all the reduced contact area and therefore reduction in available material to absorb and dissipate the energies. Such crash scenarios typically result in fatal or at least serious injuries and damages. The investigation of such a crash scenario almost always centres around certain interrelated key issues that are almost always raised in litigation 35, an issue that will be highlighted later in the paper, however in brief are typically:
• Where was the target vehicle
• Precise point of impact
• It`s lateral position in respect of the road layout
• Why was the Target vehicle at that position
• Mechanical issues?
• What was pre-crash visibility
• The line of sight of the Bullet vehicle
• What was the speed of the vehicles
• Usually the focus is on the Bullet vehicle, but may also be the Target vehicle.
The nature of a high speed, partial overlap rear end crash is such that massive destruction of the Bullet vehicle is typical. This is especially so where massive disparity between the general structure types, size and strengths are the case as where a sedan strikes a commercial vehicle. Such disparities are already well identified internationally 13,14,15. If not from the crash itself, the extent of decimation to the Bullet vehicle is typically aggravated by further rescue cutting and recovery process. These damages all too often contaminate the original damages and on occasion, telemetry that may have been available 12. On occasion, conflagration results and too, decimates vital evidential factors. There is no doubt that in time, with advancement in technology, detailed telemetry will be and is already to some extent available, be secure and easily downloadable from vehicles post-crash. It may be that such data is streamed live time and stored off-site of the vehicles 12,37a,37b. Nonetheless, there will almost always be some need to do a physical inspection and consideration of certain parameters of a crash.
The contributions of this paper are:
• Identify the characteristic correlation with the results of the vehicles after a crash of this manner
• Identify possible weaknesses on the Bullet and the Target that could be improved
• Identify common evidence after such a crash has occurred
• Determine to what extent resulting evidence can be used to answer some of the many questions that arise from this type of crash
• Provide documented record of the specific crash for further analysis if and when required
Literature review & research:
The subject matter of rear end impacts is a relatively well researched well documented one 3,4,6,8,17 et al.. Rear end crash scenarios in general are extremely prevalent and in the USA during 1999 they accounted for nearly one third of all crashes 7. During 2000 they once again accounted for as much as 29.7% of all crash cases 2
In South Africa, it is well documented that there is a serious problem in the recording of crash statistics 26, as such, it is impossible to given any reasonable indication of the level of the problem. This noted, Accident Specialist was one of the specialist service providers on the Major Crash Investigation (MCI) (Specific criteria guided the classification of the major crash classification) project undertaken by the Road Traffic Management Corporation (RTMC) between 2009 and 2016. All MCI cases nationally were attended to by the services providers, resulting in 726 cases attended to. Of these, some 66 (9%) were some type of rear end impact. Further, it is fair to assume that the percentage of rear end crash cases nationally, covering all cases not just MCI level crash cases, would not be vastly different to that of international norms and therefore presents a sizeable percentage of all crash cases.
Much of the current automotive media hype centres directly around the mitigation of such crash scenarios with the use of a range of technologically driven approaches. These include vehicle radar speed evaluation, already in use and available in the market place, however only currently on executive vehicles. These systems are typically referred to as Adaptive Cruise Control (ACC) or Collision (Crash) Warning Systems (CWS), in some iteration of the two 5,7 . Other technology such as vehicle to vehicle live reporting, GPS positioning and vehicle volume reporting are all technology driven mitigation aspects that are key items in reducing this type of crash.
It is often said that as far as reasonably possible, problems should be engineered away, this is not always possible, nor practical. A typical comment of prohibitively expensive 6,7 is often made. Interestingly, there is also much researched and written about the standards of driver training and driver awareness through media, assisting to mitigate these types of incidents 2,5,7 .
Many research papers 2,5 highlight the majority of rear end crash scenarios being at congested intersections, congested roads, urban areas and in the vicinity of traffic backup locations such as at off ramps and onramps. These scenarios can be serious, but in general statistics suggest moderate to minor injuries, as speeds are somewhat lower at these locations. It is not these scenarios that is primarily considered here, it is the somewhat higher speeds that is considered. Interestingly this exact consideration of the more serious crash is referenced to with the specific conclusion in one paper, more severe when commercial vehicles are involved 7; and another comment, Big trucks are not in any way crash-friendly 33
Parameters indicated in various research, both Automotive and Aeronautical, across the various directions of force, suggest G- Force tolerance levels between 20 – 45G at 0.1 second crash pulse for a restrained occupant being the guiding limits. This noted, there are various detailed factors that should be considered carefully when dealing with this type of crash as forces are typically very high due to the severe differences 9,10,11 .
All research indicates that the specific issue of rear end crash scenarios reflects the same high risk age group of 18 to 29 years of age being the high risk category 2,6, as is also evident with all crash types. This therefore supports the issue of driver training and/or education and general public awareness efforts being a key factor in mitigation.
Although this is by no means a legal analysis of this type of crash, understanding and appreciating the basic nuances of such a crash scenario from a legal perspective is important. Perhaps not so in general research, but particularly in crash investigation circumstances where there may be need to testify as a witness on some aspect.
As has already been alluded to, such crash scenarios inevitably reach some form of litigation, especially where the more serious crash occurs. This may be criminal, civil or perhaps interdepartmental. To this end, understanding both the legal requirements of vehicles in respect of the minimum standards of such items as taillights, indicators, chevrons, warning triangles, underride bars and headlights among many other items is important. Locally these would form part of the South African Bureau of Standards (SABS/SANS) specifications. Likewise appreciating that research may need to be undertaken on USA, European, Australian, Society of Automobile (SAE) or International Standards Organisation (ISO) specifications needs to be kept in mind.
Appreciating the laws of the land is important as these are interrelated to the requirements of vehicles, the roads and the drivers. As an example, The South African National Road Transport Act (NRTA) 36 dictates. Common references there from that would pertain to the scenarios of a rear end crash may be, Regulations, Rules of the road, 304–Stopping of vehicles; 319- Hindering or obstructing traffic, 298–Passing of vehicles (Overtaking); 214–Emergency warning signs (Triangles), these serve as guidance.
Appreciating the rulings that have arrived from court proceedings, referred to as Judgements 35, is another common avenue of research and literature review. There are many key judgements that are referenced in ligation cases, some perhaps only vaguely relevant and serving as a basic guide. Perhaps others may be of direct relevance to a particular rear end crash. By example, a rather detailed judgement (35b) concerning two heavy commercial vehicles that col- lided in a rear end type crash where one was stationary refers. The case considers many factors such as width of lanes, positions of vehicles, layout of the scene, approach path sighting distances, warning triangles, reflective chevrons, passing vehicle headlight glare, braking distances and others. The judgement provides some interesting insight to the intricacies of legal considerations in such crash cases.
Rather interestingly, it appears that there has been littleto-no specific research, nor actual crash testing examples located that deals directly with the issue of rear end, partial overlap, high speed impacts where sedans or similar passenger vehicles and commercial vehicle are involved.
Test parameters & methodology
The intention of the crash scenario was to document and consider all of the evidential results of a rear end, partial overlap type of crash orientation with a high speed impact.
The test parameters involved the positioning of a standard flat deck, double axle Swift trailer, 2006 model, as the Target vehicle. The trailer basic specifications of 9.0 meters in length, 2.4 meters wide and a mass of 6440 kilograms (Tare).
The rear axles being solid axles, 92 mm square, with a 9000 kg per axle maximum load rating, Swift manufactured axles. Tyres fitted at the right rear impact location were typical commercial Bridgestone, Radial, V-Steel MIX 857 11.00 R20 (Regroovable) 830 kpa, in fair to good condition.
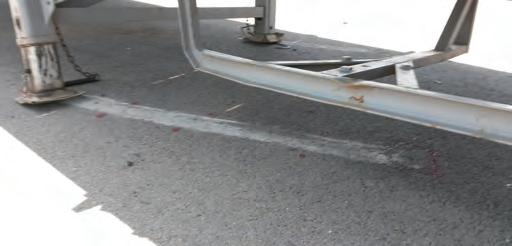
A rear bar / underride was fitted, mounted by means of two flat surfaced brackets welded to the underside of the rear cross member of the upper deck chassis. The underride bolted to this with two bolts per bracket (Figures 7; 10 & 16).
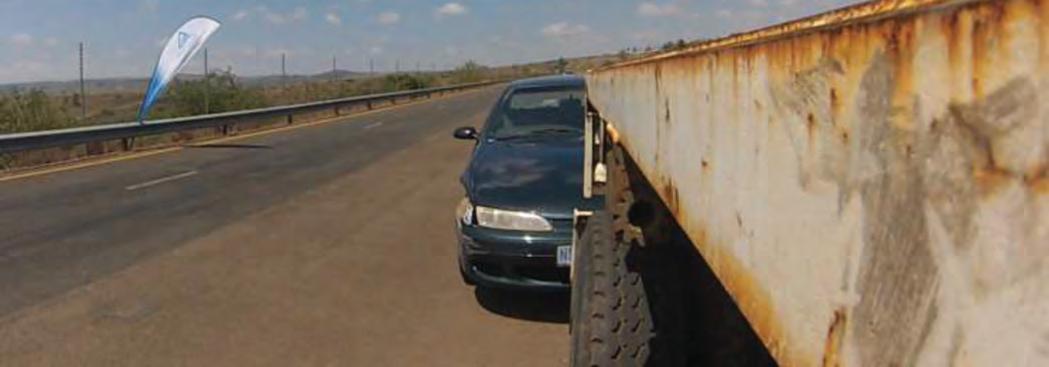
The Target setup at a position 50% across the width of a normal freeway lane, to represent a vehicle stationary and protruding partially into a lane. The Target was unladen and left standing on the trailer landing legs, brakes engaged.
The Bullet vehicle a good condition 1996 model Ford Falcon sedan, the basic specifications of 4.906 meters in length, 1.861 meters in width and a mass of 1457 kg (Tare). The Bullet vehicle was remote control driven, the remote control system designed & fitted in house 1 .
The target speed of 100 km/h was appointed as the majority of regional routes where the majority of such commercial vehicles operate between main freeways and urban areas are sign posted at a maximum of 100 km/h, National routes at 120 km/h as a maximum.
The testing facilities made use of were the Toyota South Africa, Eston test site, an outdoor testing facility. The specific section of the facilities being a high speed figure-ofeight, tar (Bitumous) road. The section between the two ends being a 1000 m straight, flat, good condition section. The specific area of positioning of the Target, at a section that has been further widened with an extra two lanes on one side, creating a 200 meter long layby area.
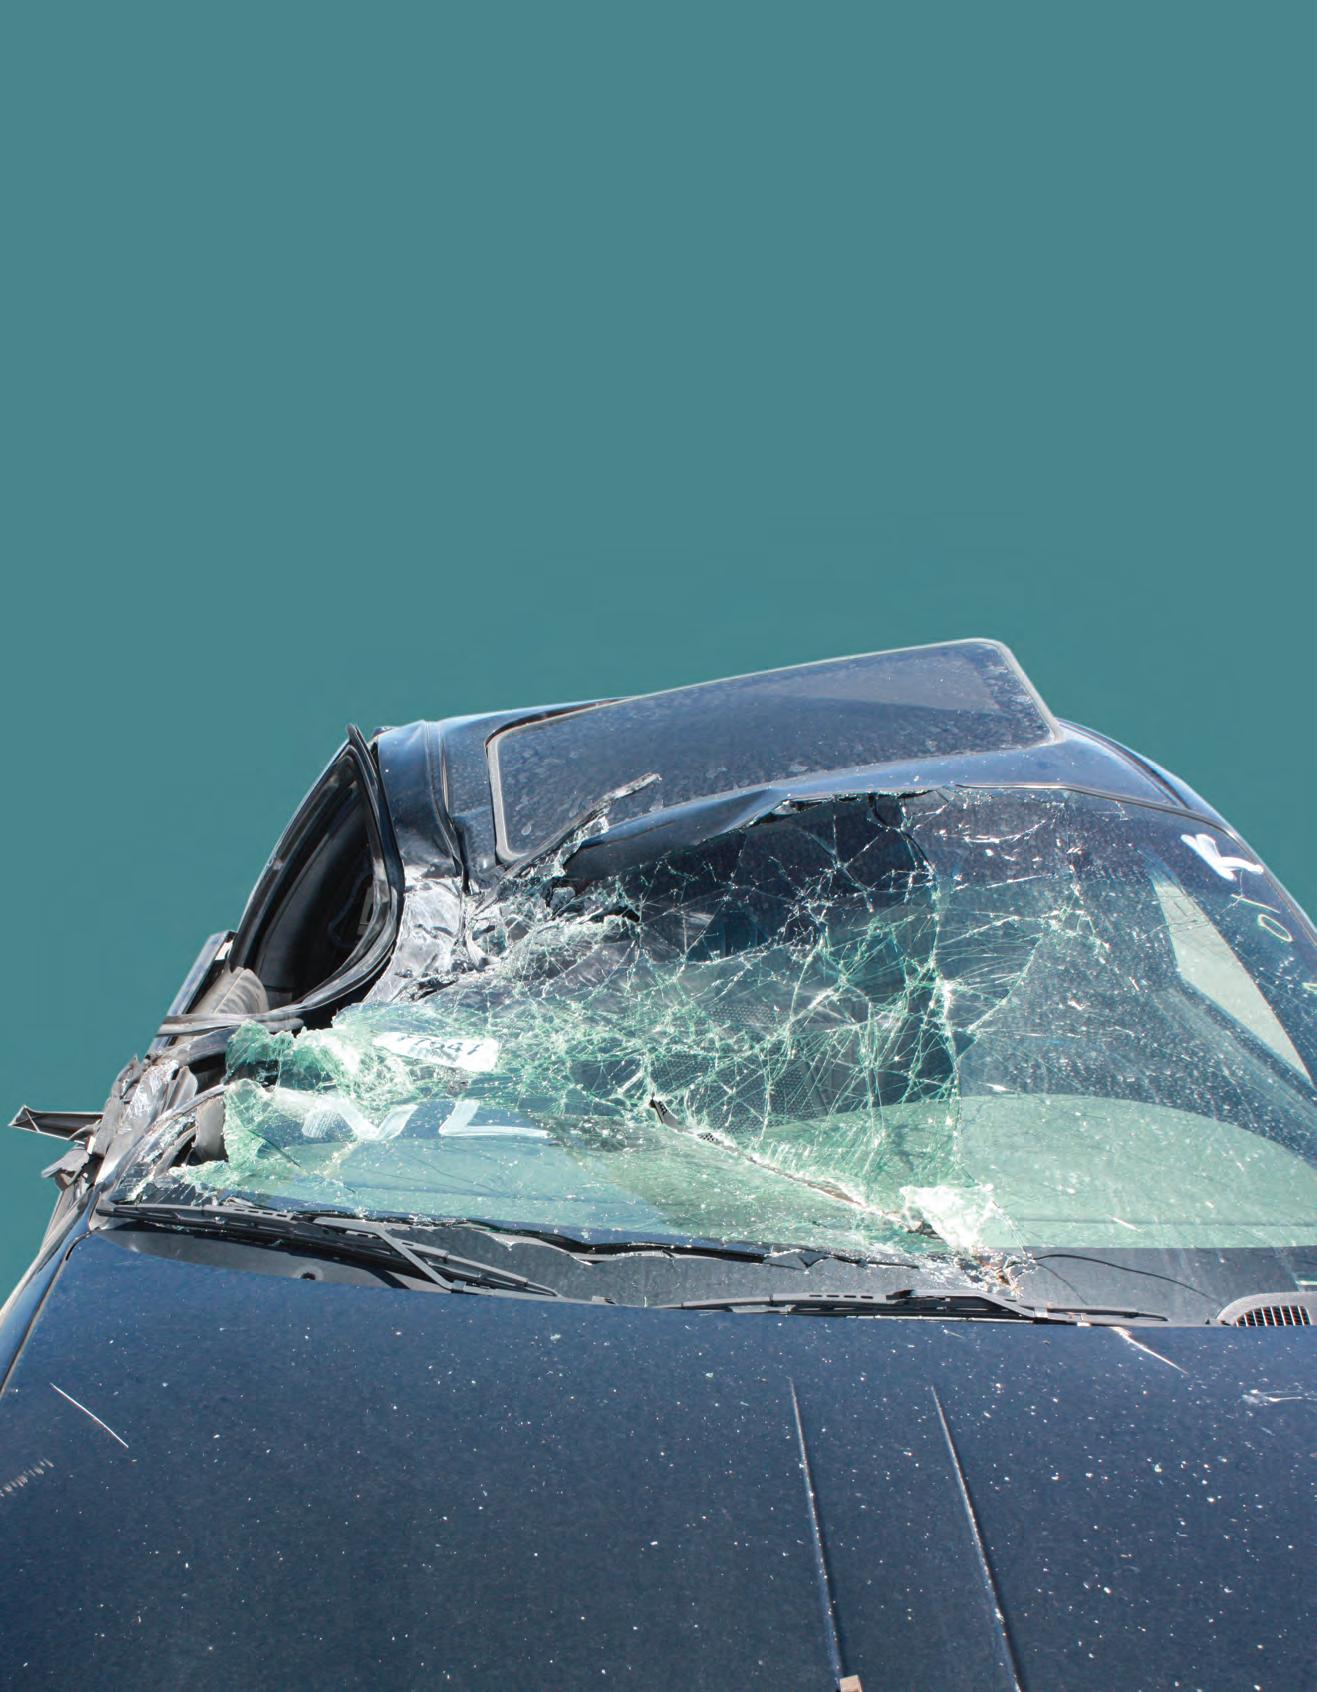
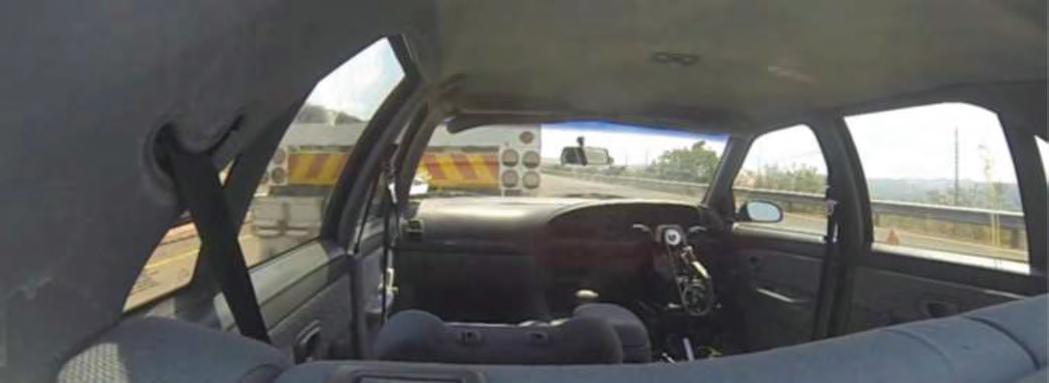
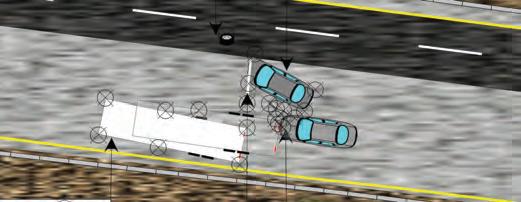
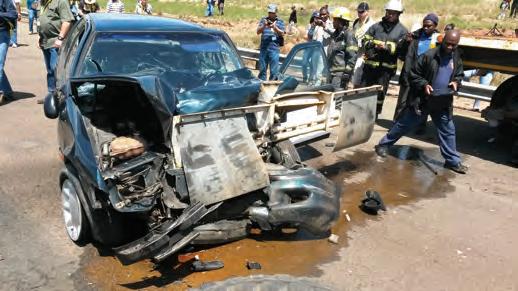
Extensive use of High Definition (HD), high speed cameras was made to allow detailed analysis. The Target vehicle fitted with a view down the right side, looking towards the rear and therefore directly at the impact (Figure 1). A view from the internal of the Bullet vehicle, from the rear parcel shelf, looking towards the front of the vehicle (Figure 2). A view at right angle to the overall crash, from the left side of the Target and bullet vehicle (Figure 3)
Axis orientation for the vehicles based on the SAE right hand coordinate system, X, fore aft through the longitudinal, Y, left right through and Z vertical through (24).
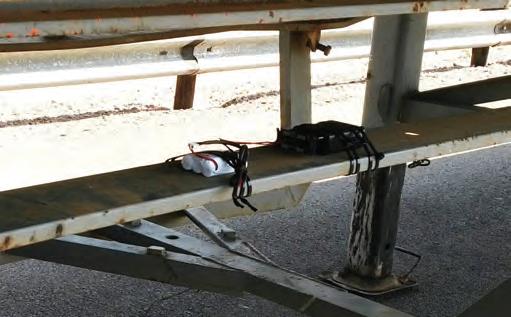
The Target vehicle was fitted with basic speed and force reading telemetry, being a Geotab GO6 product. The device secured to the target at the chassis members ahead of the axles (Figure 17) and self-powered. The bullet vehicle fitted with a Geotab GO6 product, providing both force readings and GPS position speed readings. The device internal at the rear foot well area, secured to the steel floor structure and self powered.
The Bullet vehicle was followed by a chase vehicle, the bullet vehicle remote control accelerated and steered. Impact was targeted at around a 50% overlap and target speed 100 km/h.
The test
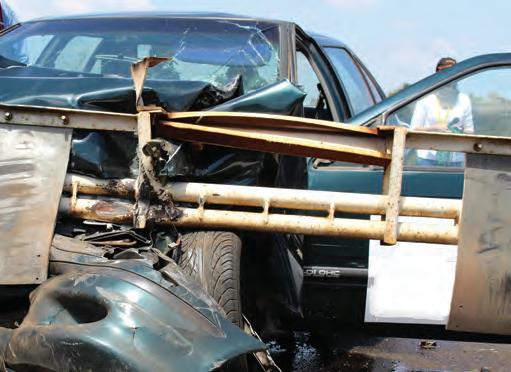
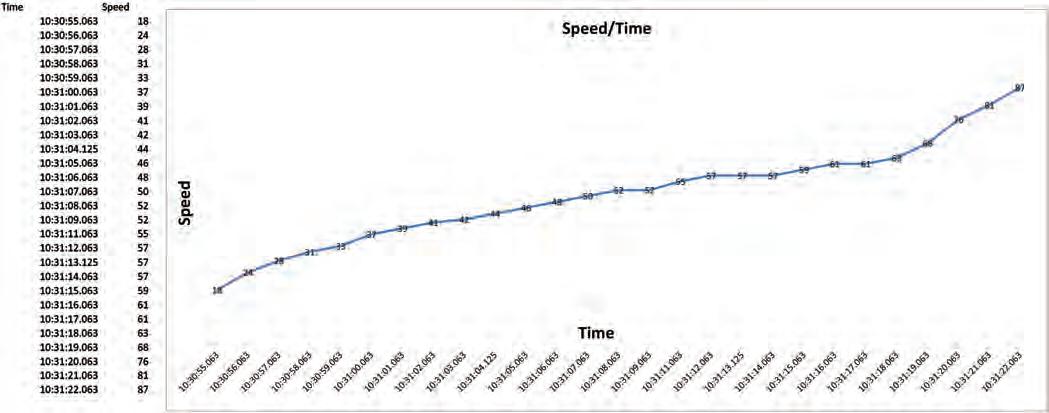
Although the target 100 km/h was not attained, the speed reached at 87 km/h (GPS speed) (Figure 18) was high enough to be considered high speed and result in a very serious crash scenario that would likely see a fatality and if not serious injuries and damages. An impact overlap of approximate 70% front end width of the Bullet vehicle (Figure 1 & 2). The front end, left side of the bullet vehicle colliding into the rear end right side of the target vehicle.
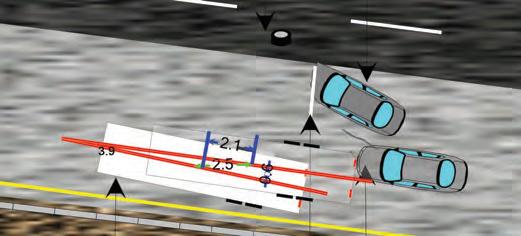
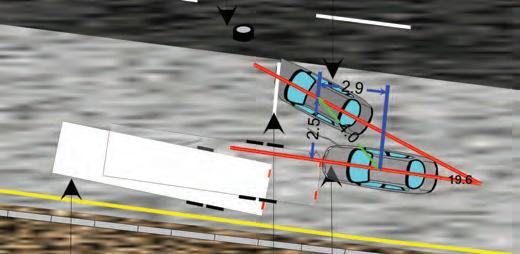
The Target vehicle was propelled forward a distance of some 2.5 meters along the direct centre of mass movement. A forward movement of some 2.1 m A lateral displacement towards the left side of some 0.6 meters. Some clockwise rotation of approximately 3.9 degrees. The rear wheels of the Bullet elevating to a height of 0.52 meters, determined through scaling from the right angle vide footage.
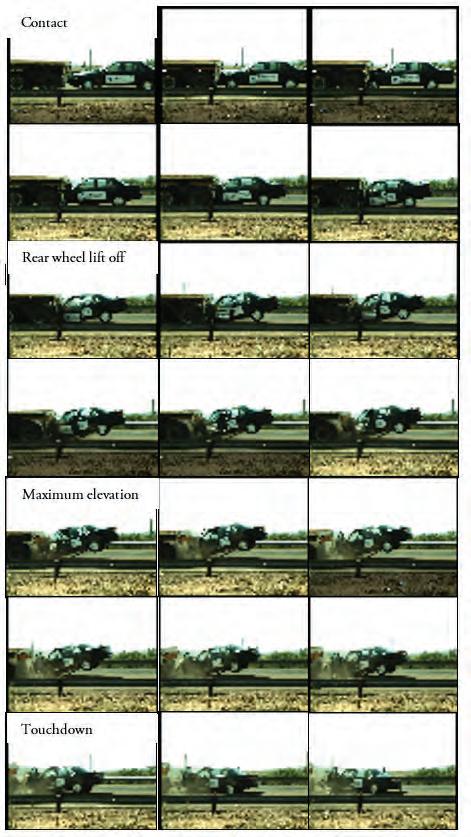
The Bullet vehicle moved forward a distance of some 4.0 meters along the direct centre of mass movement. A lateral displacement towards the right of some 2.5 meters. A forward movement of some 2.9 meters. Some clockwise rotation of 19.6 degrees. The visible forward movement of Target vehicle over the 2.5 meters occurred over a video footage time frame of 1.02 seconds, determined through time frames of the high speed video footage.
With or without the rear underride bar that has detached from the Target vehicle and remained attached to the front end of the Bullet vehicle, the overlap contact areas can be matched to a very fine level of accuracy, perhaps to within a few millimetres of orientation. This is an important consideration where the positioning of the Target and Bullet vehicles in respect of the layout of the road and specific pre impact positioning (Point Of Impact) is called to question.
Results & discussion on evidence Post impact positions
All positions, pre and post vehicle and other evidential factors were recorded with the use of a Nikon NPR352 (Figure 6). The post impact positions are somewhat expected, where, although there is an approximate 4.4:1 mass ratio difference (against the Bullet), some forward displacement, rotation and or lateral displacement of the vehicles would be expected where the mass of the Bullet at 1457 kg at 87 km/h (24.16 m/s) indicates a Kinetic Energy of some 425464J, massive energy.
Damage to the Bullet vehicle (evidence from the vehicle):
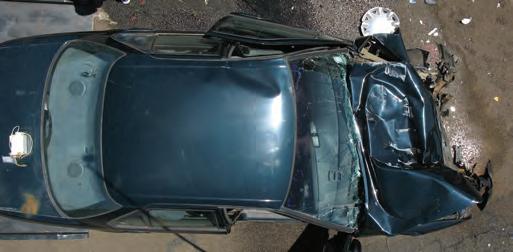
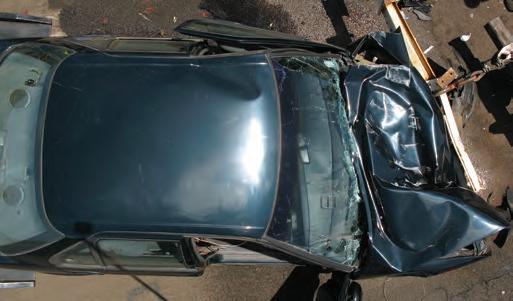
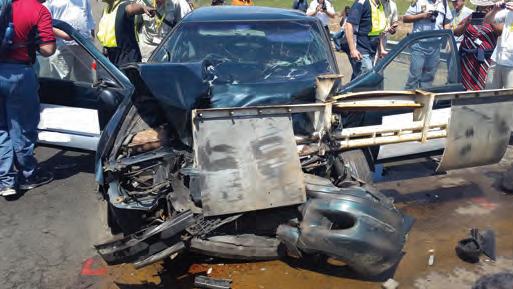
The damage to the Bullet vehicle is simply catastrophic and is expected given the parameters. Notably, modern vehicles are designed to absorb impacts and to collapse, however to maintain the general integrity of the occupant compartment, this appears to have occurred.
Damage to the target vehicle (evidence from the vehicle)
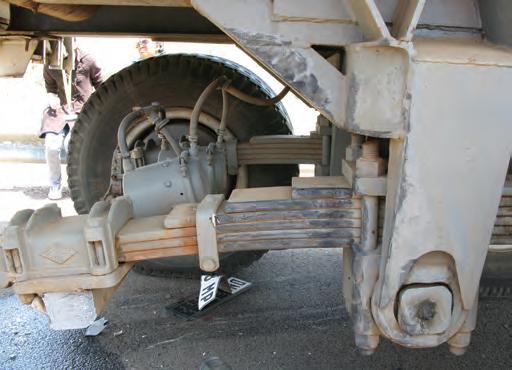
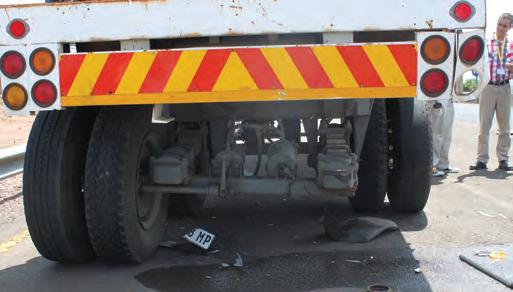
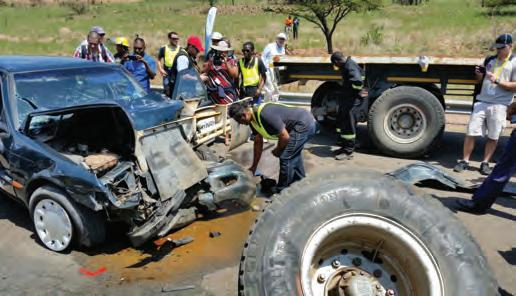
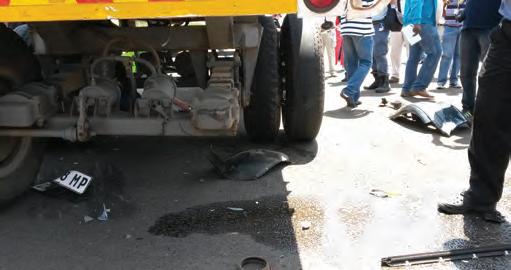
The damage to the Target vehicle is arguably minor to moderate and is somewhat expected given the parameters. Notably, the underride bar has totally separated. The left side two mounting bolts between the lower end of the chassis bracket and underride bar sheered. The right side chassis bracket sheered off at the mounting point between the main mounting bracket and chassis itself, at the point of the welded connection. The entire structure of the underride bar separating from the Target vehicle as a complete unit (Figure 7). The rear axle has sheered off at a position on the outer side (right side) of the spring mounting brackets (Figure 8), separating the complete right side dual wheel combination. Minor damage to the rear right taillight housing was incurred. Besides these damages, very little damage to the trailer appears evident.
Damages to the respective vehicles allows the primary analysis of the manner in which the two vehicles have collided, or phrased differently, the angle and overlap orientation of the vehicles relative to one another. This type of analysis is well document and pertains to the issue of the Principal Direction of Force (PDOF) 22,23. The particular relevance of this analysis is of understanding the positioning of the vehicles on the scene relative to one another and likewise allowing considerations of the movement of the vehicles through the phase of the crash and likewise the occupants.
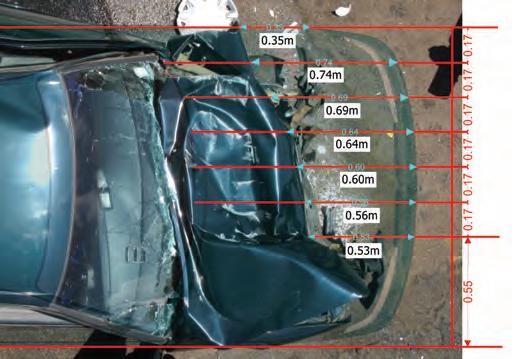
The consideration of the damages to the vehicles in respect of measuring the damages, could provide further insight into the speed of the vehicle. This noted, ”crush analysis“ is a sensitive subject matter of its own. More so on modern vehicles were multiple strength materials are used, glues and not welding and specifically designed to deform. Although crush is not dealt with herein, it is reminded that this is an avenue of consideration and should therefore see the Bullet vehicle carefully measured as is required 22,23 . The Bullet vehicle damages measured right to left at 0,55 m from ground level to bumper leading edge height, with measurements of; 1 – 0,53 m; 2 – 0,56 m; 3 – 0,60 m; 4 –0.64 m; 5 – 0,69 m; 6 – 0,74 m, Figure 9 guides.
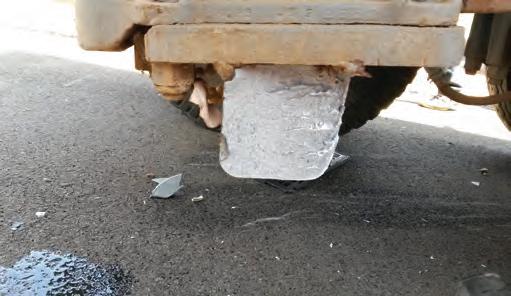
Liquid spill – spatter & soak
liquid spill, typically as a result of vessel damage, such as the radiator, sump, water bottle and gearbox or even CV joints almost always results from the Bullet vehicle. It is rare that liquid evidence will allow an accurate positioning of the Target or the Bullet vehicle as liquid is dynamic. Nonetheless its presence and position should be noted as it does provide indication of the immediate area of impact. Although not common practice, such liquid debris could also be used as a source of matching to determine from which vehicle it came.
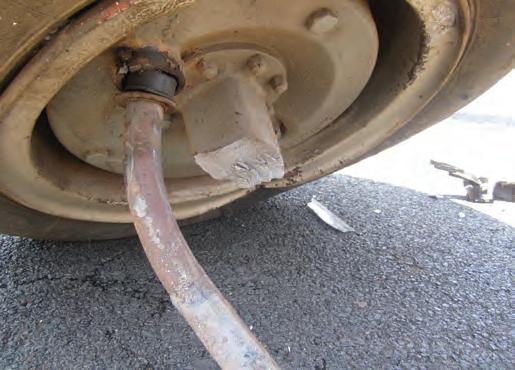
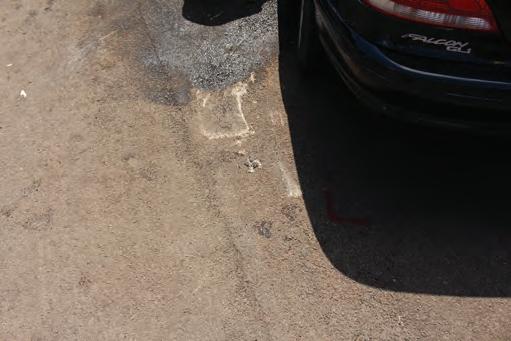
The initial impact of the sump with the road surface causing rupture of the vessel and therefore the initial liquid (oil) spill at the immediate area of the sump and road surface contact. The movement of the Bullet from impact to rest sees the continued deposit of the liquid debris along this path. The resting position allowing the further draining and development of the liquid soak patch at that point. All factors located and evident to a large extent at Figure 10.
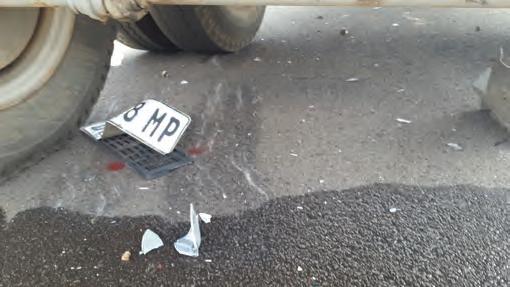
General debris
Some shards of glass, paint and small Bullet vehicle component pieces were noted as strewn around the general area. Although these may not be specifically recorded in each of their positions or specification, their presence is notable and should generally be recorded as this forms part of determining the general area of a crash. In certain cases these could serve to assist in determining what vehicles were involved if for example there was a colour matching or glass fragment matching undertaken.
Specific debris:
The total separation of the entire right side dual rear wheels to a position ahead of the bullet vehicle and to the right of both the target and bullet vehicle is notable. The wheels have separated as a result of the snapping of the axle, at a position on the outer side (right side) of the spring mounting brackets. Noting the orientation of the Bullet vehicle laterally (partial overlap) at impact and to the rear of the target, sees that the approximate centre line of the bullet vehicle and therefore the engine, would have been in the general centre line of the two rear right side wheels.
Although damages to the tyre and even the rim are not uncommon where impact occurs directly to the wheel, this does not appear to be the case here. The wheel combination has separated and essentially become a large section of vehicle debris from the target vehicle. However the wheel combination has largely remained unscathed, there were evident impact markings on the tyre, however the tyres remained inflated (Figure 12).
The position of the wheel is noted and recorded and serves as a general indication of some of the debris location in respect of the area of crash. Little specific information is gleaned from the location of the wheel as a piece of debris itself.
Scratches and scrapes
It is well documented that almost all crash scenarios will almost always result in some evidence on the road surface, scratches and scrapes often forming part thereof. Scratches and scrapes are on occasion overlooked, with emphasis placed on tyre mark evidence.
In cases where the scene may only be visited at some later stage, vehicles already removed, scratch and scrape marks may have greater longevity than that of other marks and therefore may be the only evidence notable.
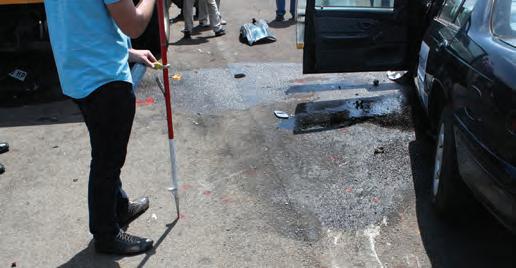
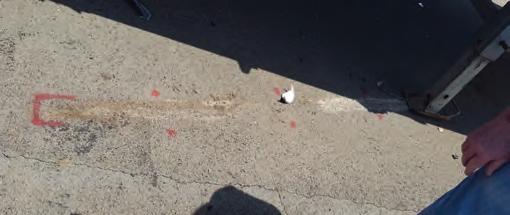
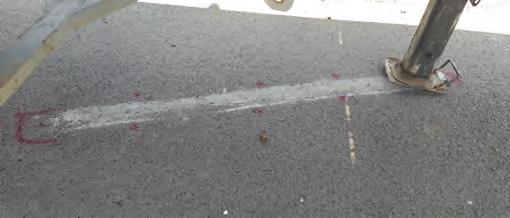
In this particular scenario, the trailer landing legs left very distinct marks highlighting their point of origin, their movement as the target was propelled and subsequently their position of rest (Figure 13). In this particular case, this evidence is extremely accurate evidence as to the exact distance moved and the angle the target moved. This may be crucial in determining the exact positioning of the target if there was some dispute as to the target having been impeding the normal path of travel of the bullet vehicle. This known would also form part of the distances required for possible calculative processes undertaken.
A relatively severe combination of scratch and scrape marks was created by the longitudinal orientation of the sump of the engine (Inline, six cylinder) of the Bullet. The sump engaging with the road surface as the vehicle bottomed out (Figure 10 & 14). The associated liquid spill of the engine oil is evident where the sump (Vessel) ruptured, liquids largely following the post impact path of the Bullet. This is a notable evidential factor that allows the extremely accurate positioning of the Bullet vehicle.
Tyre marks
As the Target vehicle has moved, so the engagement of the tyres with the road surface from their point of origin to rest have created impact scrub marks. This is not unusual in such severe crash cases. This type of evidence is important and is arguably one of the first pieces of evidence that most scene investigators will look for.
In the same process as the Scratch and Scrape marks, this may be crucial evidence in determining the exact positioning of the Target vehicle (The tyre positioning and therefore the entire vehicle); if there was some dispute as to the target having been impeding the normal path of travel of the bullet vehicle. Tyre marks would be more common as landing legs would not normally be employed. The detailing of the tyre marks would also form part of the distances required for possible calculative processes undertaken.
Perhaps somewhat surprisingly, no tyre marks at all were notable from the Bullet vehicle. Given the severity of the impact and the resulting deflated front right tyre (The left side remained inflated), it would reasonable have been assumed that severe impact loading tyre scrub marks would have been evident. Tyre scrub marks from both vehicles would normally be searched for. The lack of tyre marks in this particular scenario may be (among other factors) as a result of cold tyres, the particular type of tyre and the con- dition of the road surface, however this is not considered any further herein.
Specific evidence: Broken rear axle: Although not unseen, it is somewhat unusual to see the Axle having sustained such catastrophic damages (Figure 8 & 15). A more common result being the laceration and deflation of the tyre/s and perhaps even the damaging of the rims and even the damaging of the hub and various wheel mounting components. The Axle determined as a Swift, 92 mm square solid bar axle (9 ton).
Axle strength along with tyres are major factors considered during the design of a trailer, the axle and tyre combinations being the major factors in the permissible load mass of the trailer. The particular axle on this trailer being that of a now defunct axle manufacturer, Swift Axles, as such no specific detailing could be obtained for the particular model. Recording specific details of the axle could allow for calculative indications of sheer force and therefore the detailed photography, measuring and data plate specifications should be carefully noted.
Separation of underride bar
The total separation of the underride bar as a complete unit is somewhat unusual. It is perhaps more common that severe bending of these is incurred or part of it is deci- mated / separated. Closer inspection revealed the primary welding of the two main mounting brackets connected to the rear main structure cross member of the trailer (Target) was poor. Welding was only along one edge of each bracket interface to the chassis and likewise with poor penetration and overall concentration 38 .
The underride separated with the left side bracket remaining secure to the chassis at the primary mounting point (welded). The lower section of this left side bracket separating from the underride where the two mounting bolts sheered. The right side main mounting bracket sheering from the main chassis mooting point on the Target trailer chassis (Welded), the lower section of this left side bracket remained connected (two bolts) to the underride (Figure 16)
Underride bar & mounting bracket separation
Telemetry & data therefrom
The telemetry in the form of standard GPS based vehicle tracking systems (Geotab GO6)(37A)(37B) with on board crash sensing mounted to the Target and the Bullet vehicle was utilized. The detailed accuracy thereof not interrogated at this stage and accepted as being reasonably accurate in respect of the basic data. The Bullet vehicle telemetry selforientating as the vehicle travelled pre testing, therefore provided accurate and correct axis direction speed readings as the vehicle progressed. (Figure 17)
Unfortunately, impact caused a power loss and further force readings and specific crash telemetry readings to the unit from impact were not held.
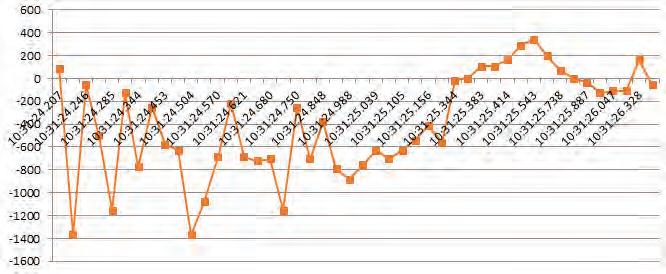
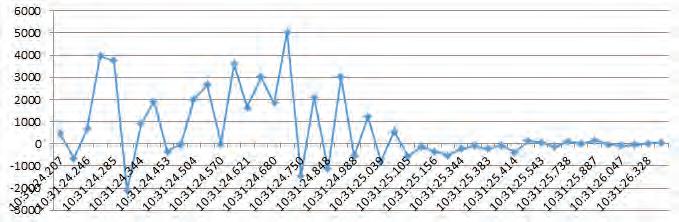
The positioning of the telemetry on the Target (Figure 18) did not allow for self-orientating as the device was not driven“ pre testing. As such the telemetry is read in the device standard orientation mode, effectively in reverse. Nonetheless, the Target vehicle readings (Figure 19) peaking at some 5 g (Series s1 - fore and aft). Such high reading not surprising given the high speed impact and largely direct inline impact and largely forward displacement of the Target. An approximate 1.4 g lateral (Series s2 - Side/side). Such reading not surprising given that there was lateral displacement of the Target. An approximate 3.0 g upward (Series s3 – Up/Down). Such reading not surprising given that the front end of the Bullet vehicle is relatively low and largely collided at a level at or just lower than the centre line of the rear tyres diameter and into the rear underride bars.
The recorded time frame specifications of the data indicate movement recorded from impact to rest of the Target over the distance of 2.5 meters at 2.1 seconds. This does however include residual movement of the Target where it may be stationary in its displacement, but with some residual movement still recorded by the device.
The known static position of the Target and the telemetry indicated speed of the Bullet vehicle (87 km/h – Figure 17) provides a reasonable basis against which norms can be considered.
Other evidence
Although easily available in a ”setup“ session of this nature, it is reminded that during actual crash scenes, noting the manufacturers details and the specifications of the Target and Bullet vehicle is crucial. Necessary details would typically be sourced from a combination of data plates, licence discs and registration number detailing. These allow, among other factors, details of weights, load limits, size, axle specifications and brake specifications. Recording details of tyres on both vehicles is also important.
Details of loads on the Target and Bullet vehicle should also be recorded, typically from load manifest, however visual and photographic inspection thereof is highly recommended. Similarly, detailing loads in the Bullet vehicle, such as number of occupants, any baggage/luggage and perhaps careful consideration of large aftermarket fitments like large sound system speaker boxes often placed in the boot, could add substantial overall weight.
It may be necessary in certain considerations to know specific weight distribution on the Target vehicle between the wheels and landing legs. Similarly, it may be necessary to know weight distribution on the Bullet vehicle. Such values may be needed in determining Centre Of Mass. This may not be possible in a real crash situation post-crash due to damage and or load movement. If not possible, it may be necessary to locate an exemplar vehicle and undertake necessary testing.
Gradients and super elevation, road surface coefficient, advanced warnings if any and sighting obstructions, either permanent or momentarily (weather / sunblind and the like) and medical conditions may be other factors to consider. None of these factors were of necessity in this particular session.
Conclusions:
The opportunity to undertake a full scale, controlled environment, crash test of this nature is far and few between. Although in time, improvements in technology will create modelling a crash and considering actual crash telemetry even more accurate, a real life crash test will always provide the ultimate results. The documenting of such scenarios is import in the preservation of the data, so that this may be considered in further development.
Even where there will no doubt be a time in the future where vehicles are largely fully automated and self-driving, where things may go wrong there will always need to be an understanding of what happened. This type of high speed crash will remain a demanding safety concern.
Likewise it is these historic understanding and parameters that provide for insight into the development and use of such systems and procedures in the future.
It is immediately noted that the session presented highlights the plethora of evidence that can be created and needs to be recorded for useful analysis to some extent or another. Although the majority of information needed can and usually is collated on scene, the appropriate removal and storage of the vehicles themselves can be a massive assistance in real cases.
Similarly, the careful identification of the evidence on scene and accurate recording thereof is crucial, keeping in mind that if not identified and recorded, this evidence is typically ephemeral.
Although there are many characteristics that will be similar in most rear end crash scenarios, the particular incident of a high speed partial overlap, sedan or similar vehicle into a commercial trailer, will present with characteristics that are distinct to and/or far more pronounced.
Presented with such a scenario to consider, where there is no doubt that an investigator would find themselves faced with just this at some stage, requires careful consideration and meticulous detailing. With the careful consideration and accurate recording of all the necessary data, any questions arising surrounding the crash could be answered in certainty, or at least to a very strong balance of probabilities.
All rear end crash scenarios are hazardous, however the particular scenario considered, suggest that had there been occupants, that there is a very high probability that fatalities, or at least very serious injuries would have been incurred. This therefore is in strong correlation to other research highlighting the dangers of vehicle incompatibilities and in particular research pertaining to human force limits.
The scenario presented certainly highlights and confirms the opinions already set out in many research papers and general commentary in articles, that incompatibility between vehicles is a major problem. The session supports the scope for further research and improvement in design of compatibilities between vehicles and arguably stronger regulation of designs to improve compatibility. This session also provides impetus for improvements in a range of safety aspects such as improved structural strength, improved impact absorbing qualities. Likewise, although already in use, further justification for research and improvements in technology driven safety mitigation products.
Further and once again an issue that has been highlighted in other research and commentary, this scenario again highlights the need for careful consideration of underride devices. The regulation there of in respect of the requirement to be fitted and to meet minimum standards and improvement thereof.
The identification of the many specific evidential characteristics between the vehicles themselves and evidence on the scene itself, however most notably those that allow the positioning of either vehicle on the road surface at pre impact position is almost always the crucial factor in such real life cases. The positioning or orientation of the vehicles relative to one another at impact are key to answering the likely question of ’where were the vehicles positioned at impact“ and therefore many other questions that cascade. All of the evidence carefully collected will either individually or as a whole provide the answers to questions raised. Tyre marks from the bullet vehicle may not necessarily be located, therefore other evidence as documented may be heavily relied upon.
Just as in the case here, the reliance on telemetry to provide answers should not be the case. The identification and collection of evidence should always serve to bolster or validate telemetry evidence.
Acknowledgement:
The authors would like to acknowledge the assistance and work that was undertaken by the staff of Accident Specialist as part of the development and setup of the test as well as post event. Likewise to those that volunteered to assist in the many pre event, event and post event tasks. The authors thank Klein Janse Van Rensburg for the extensive and persistent development work undertaken on the remote steering system developed and used for the test. Thank you to the various sponsors that provided funding, equipment or facilities, without which the testing would have been difficult to undertake.
Reference & bibliography:
1. Steer Induced Loss of control of a minibus on a wet surface: K Setty; C Proctor-Parker; R Stopforth; S Davraj / 19 May 2017
2. Driver attributes and rear-end crash involvement propensity: DOT HS 809 540 March 2003 – Technical Report - Published By: National Centre for Statistics and Analysis Advanced Research and Analysis
3. Underride in rear-end fatal truck crashes: Submitted to National Highway Traffic Safety Administrationprepared by - Daniel Blower / Kenneth L. Campbell - Centre for National Truck Statistics - The University of Michigan Transportation Research Institute -October 1999
4. Heavy-vehicle crash data collection and analysis to characterize rear and side underride and front override in fatal truck crashes: DOT HS 811 725 March 2013 - Blower, Daniel; John Woodrooffe
5. Optimization of Rear Signal Pattern for Reduction of rear-End Accidents during Emergency Braking manoeuvres: Federal Highway Research Institute - Dr. rer. nat. Jost Gail / Dipl.-Ing. Mechthild Lorig / Dr. phil. Christhard Gelau / Dipl.-Phys. Dirk Heuzeroth / Dr.-Ing. Wolfgang Sievert / Bergisch Gladbach, November 2001
6. Rear end crashes: Centre for automotive safety research / Te University of Adelaide – Australia – Mr J Baldock, AD Long, VL Lindsay, AJ McLean - CASR REPORT SERIES / CASR018 September 2005
7. Vehicle and infrastructure-based technology for the prevention of rear-end collisions: National Transportation Safety Board Washington, DC. 20594 special investigation report pb2001-917003 NTSB/sir-01/01
8. Commercial Motor Vehicle Crash Investigation: David Brill / Published by: Institute of Police Technology & Management – University of North Florida – USA
9. Kinematic behaviour of the human body during deceleration: 62-3 Federal aviation agency aviation medical service Aeromedical research division civil Aeromedical research institute protection and survival branch Oklahoma City, Oklahoma
10. Human tolerance to abrupt accelerations a literature review: Dynamic Science report 70-13.
11. Human Tolerance and Crash Survivability: Dennis F. Shanahan, M.D., M.P.H. Injury Analysis, LLC 2839 Via Conquistador Carlsbad, CA 92009-3020 USA
12. Analysis of Event Data Recorder Survivability in Crashes with Fire, Immersion, and High Delta-V: H. Tsoi / John Hinch / H Gabler
13. The crash compatibility of cars and light trucks: Hampton C. Gabler - Department of Mechanical Engineering Rowan University Glassboro, NJ 08028 gabler@rowan.edu / William T. Hollowell National Highway Traffic Safety Administration NRD-11 400 Seventh Street, S.W. Washington, DC 20590 thollowell@nhtsa.dot.gov
14. NHTSA’S Vehicle aggressivity and compatibility research program: Hampton C. Gabler / William T. Hollowell - U.S. National Highway Traffic Safety Administration United States Paper No. 98-S3-O-01
15. Vehicle Weight, Fatality Risk and Crash Compatibility of Model Year 1991-99 Passenger Cars and Light Trucks: DOT HS 809 662 October 2003 NH TS A Technical Report
16. Analysis of Four Staged Crashes of Passenger Vehicles into a Semi-Trailer: Jeremy Daily / Russell Strickland / Institute of Police Technology and Management Special Problems in Traffic Crash Reconstruction 25-29 April 2005
17. Crush Analysis with Under-rides and the coefficient of Restitution: Jeremy Daily, Russell Strickland, John Daily 27 April 2006
18. Heavy-Vehicle Crash Data Collection and analysis to Characterize Rear and Side Underride and front Override in Fatal Truck Crashes: DOT HS 811 725 March 2013 / Authors: Blower, Daniel; John Woodrooffe
19. Factors contributing to commercial vehicle rear-end conflicts in China - A study using on-board event data recorders: Journal of safety research Giulio Bianchi Piccinini, Johan Engström, Jonas Bärgman, XuesongWang
20. The crash compatibility of cars and light trucks Authors: Hampton C. Gabler Department of Mechanical Engineering Rowan University Glassboro, NJ 08028 gabler@rowan.edu William T. Hollowell National Highway Traffic Safety administration NRD11 400 Seventh Street, S.W. Washington, DC 20590 thollowell@nhtsa.dot.gov
21. Variation of crash severity and injury risk depending on collisions with different vehicle types and object Authors: Helena Stigson, Anders Ydenius, Anders
Kullgren - Karolinska Institutet, Sweden, Folksam Research, Sweden
22. Measuring protocol for quantifying vehicle damage from an energy basis point of view: Society of Automobile Engineers (SAE) International, 1988.
23. Surface vehicle standard - Collision Deformation Classification: (SAE J224), Socienty of Automobile Engineers International.
24. Surface vehicle information report – sign convention for vehicle crash testing: SAE J1733 / December 94
25. Rear Impact Guards, Rear Impact Protection; Proposed Rule: Department of Transportation National Highway Traffic Safety Administration 49 CFR Part 571 - Vol. 80 Wednesday, No. 241 December 16, 2015 Part III
26. Profiling the safety needs of the South African truck transportation sector: C Roberts
Key comments: “Upon examination of these results, it became clear that most legislation is old, strategies are not always executed and followed up, and very little effort is spent on research and development.
During 1996 the White Paper on National Transport Policy (SA, 1996:3) has been accepted by the Government and during 2007 a Road Safety Conference was held in Ghana, where a road safety strategy with some goals was discussed (see Par. 2.3). To date no significant progress has been made, thus there are concerns that the goals set by this sector, will not be met.
Labuschagne (2008:1) alludes to the fact that improved access to accident data by researchers greatly benefits general research and development in the field of road safety.
The human factor is by far the biggest reason for road accidents. Drowsiness, substance abuse or poor judgment, are just some of the reasons why there are so many accidents in South Africa (Radebe, 2010). For the purpose of this paper, the following three main categories will be discussed:
The human factor; indirect non-human factors; the effect of company policy and procedure on the occurrence of road accidents within the LHHV transportation sector. In a study done by the CSIR on driver fatigue on the N3 between Warden and Villiers, it has been highlighted that driver fatigue plays a major role in road accidents (Venter, 2013). According to Venter, the results of this decline in performance are reduced vigilance, reduced attention or awareness and an increase in drowsiness and fatigue.
Venter (2013) further alludes to the fact that the consequences of fatigue include slow reaction time, slow control of movements, decreased tolerance for other road users, poor judgement when overtaking, and loss of situational awareness. It is also considered an internal distraction for the driver that leads to poor decision making and cognitive impairment. In this study, specific reference has been made to fatigue related accidents. In order to compile the report, a total of 790 accidents that occurred from 2007 to 2010 have been analysed. Of these 790 accidents no less than 346 involved long haul heavy vehicles. The time of the day the accidents has occurred, is highlighted in the study. It has been found that during the period in question, there have been 213 head-to-tail accidents, 195 accidents in which a single vehicle was involved, and 142 vehicles left the road causing an accident, leaving no signs where brakes were applied. In other words, there was an absence of skid marks or other signs of harsh braking. Police reports also indicated that the driver, for a few seconds, could clearly see the road ahead. In the majority of accidents the weather was good, and in some cases witnesses reported the vehicle drifting from the one lane to the other, also called ‘lane drifting’, prior to the accident, indicating that fatigue might have had a causal relationship to the accident
27. The Traffic Accident Investigation Manual – At Scene Investigation and Technical Follow Up: Northwestern University, Traffic Institute / University North Florida, IPTM.
28. Traffic Accident Reconstruction: Northwestern University, Traffic Institute / University North Florida, IPTM.
29. https://www.consumerr eports.org/cro/2011/08/ crash-test-101/index.htm (Online - 2011)
IIHS rear-impact evaluations
Key comments: “Though common, not many rear-impact crashes are fatal. But they do cause many injuries, especially whiplash trauma to the neck. The IIHS evaluates rear impacts with physical inspections and crash testing. The crash test, which is conducted with the vehicle seat attached to a moving sled, simulates a rear-end crash about equivalent to a stationary vehicle being struck at 20 mph (32 km/H) by a vehicle of the same weight.
30. http://www.thetruthaboutcars.com/2011/02/has-thetime-come-for-rear-crash-testing/ (Online 2011)
Key comments: “No government requires rear-crash testing, but in the wake of several accidents, Germany’s AutoBild magazine decided to look into what exactly happens when a car is hit from behind at 64 km/h… and the results are not encouraging.”
31. https://trid.trb.org/view.aspx?id=673828
(National Academy Of Sciences – US / Society of Automotive Engineers)
High speed rear impact crash test
Key comments: “Produced for the Society of Automotive Engineers, this video demonstrates the impact of a heavy truck into the rear of a four-door, compact sedan. This video demonstrates the plans, photography, instrumentation, techniques and procedures used in a crash test. The supplemental notebook contains pre and post-crash test photos, time histories of accelerations and displacements and the test data analysis.
SUMMARY: This NPRM proposes to upgrade the Federal motor vehicle safety standards that address rear underride protection in crashes into trailers and semitrailers. NHTSA is proposing to adopt requirements of Transport Canada’s standard for underride guards, which require rear impact guards to provide sufficient strength and energy absorption to protect occupants of compact and subcompact passenger cars impacting the rear of trailers at 56 kilometres per hour (km/h) (35 miles per hour (mph).
NHTSA is issuing this NPRM in response to a petition for rulemaking from the Insurance Institute for Highway Safety (IIHS), and from Ms. Marianne Karth and the Truck Safety Coalition (TSC). This is the second of two documents issued in response to the Karth/TSC petition. Earlier, NHTSA published an advanced notice of proposed rulemaking requesting comment on strategies pertaining to underride protection afforded by single trucks.”
32. http://www.iihs.org/iihs/ne ws/desktopnews/underride-guards-on-big-rigs-often-fail-in-crashes-institutepetitions-government-for-new-standard
IIHS News | March 1, 2011
Key comments: Underride guards on big rigs often fail in crashes; Institute petitions government for new standard:
“Rear guards are the main countermeasure for reducing underride deaths and injuries when a passenger vehicle crashes into the back of a tractor-trailer. In 2009, 70 percent of the 3,163 people who died in all large truck crashes were occupants of cars or other passenger vehicles. Underride makes death or serious injury more likely since the upper part of the passenger vehicle's occupant com- partment typically crushes as the truck body intrudes into the vehicle safety cage.”
33. https://www.trucks.com/2016/05/06/traffic-expertsdebate-how-to-prevent-deadly-truck-crashes/
Key comments: Big trucks “are not in any way crashfriendly,” said Robert Molloy, director of highway safety at the National Transportation Safety Board.
34. http://www.nphm.com/wp-content/uploads/2014/10/Piercing-The-Passenger-Compartment1. pdf
Key comments: No matter how safe the car may actually be, the safety features are only effective if there is good structural interaction (Crash Compatibility) between collision partners. This means there is a geometric match up of the crush structure of both the striking vehicle and the vehicle being struck.
35. Judgements:
A. Paul Dumisani Dlamini v Road Accident Fund – Appeal No. A12/2012 - Free State High Court, Bloemfontein, Republic of South Africa. Judgement – Molefe, AJ
B. Ravenhill Transport LTD Vs Hultrans Ltd Case
No. 7179/89 – Supreme Court Of South Africa Coast Division 17th September 1989 (Bristowe, J.)
36. https://www.jp-sa.org/wp-content/uploads/2017/06/ National-Road-Traffic-Act-Regulations-20150725.pdf
37A. http://gpstrackingcanada.com/geotab-user-guidegeotab-go6-hardware-specifications.html
B. https://www.geotab.com/wp-content/themes/geotabtemplate/resources/doc/GO6-Support-Doc-Rev14.pdf
38. Welding standards / specifications: ASME – American Society Of Mechanical Engineers - section IX; AWS - American Welding Society D1.1; ISO – International Standards Organisation – ISO3834
