55 minute read
Motorcycle Accident Reconstruction: Applicable Error Rates for Struck Vehicle EDR-Reported Delta-V

Nathan Rose
William Bortles
Neal Carter
Introduction
A common motorcycle crash scenario occurs when a passenger vehicle equipped with an Event Data Recorder (EDR) turns left across the path of a motorcycle and is struck by the motorcycle. The EDR data on the passenger vehicle will often be accessible with either the Bosch Crash Data Retrieval (CDR) system or the Global Information Technology (GIT) system. In these instances, pre-crash EDR data can be useful for establishing the specific characteristics of the left turn that preceded the collision. This data may include speed, throttle or accelerator pedal percentage, brake applications, and steering angles for the struck vehicle. In addition to that, an EDR-reported change in velocity (∆V) from the struck vehicle can potentially be used to infer the ∆V and impact speed of the motorcycle. This article reviews and summarizes the literature related to error rates for EDR-reported ∆Vs under various impact conditions and assesses which of these error rates are most applicable when analyzing impacts between motorcycles and passenger vehicles. This lays the groundwork for the companion article [Rose, 2019], which illustrates the application of these error rates within the context of reconstructing real-world intersection collisions involving motorcycles and EDR-equipped passenger vehicles. The companion article also covers the accuracy and application of the pre-crash data from the struck vehicle to these collisions. This article focuses only on the ∆V.
There are potential problems that can arise when using the struck vehicle ∆V to infer the ∆V and impact speed of the motorcycle, particularly related to the large weight ratio that often exists between the motorcycle and the struck vehicle. Newton’s 2nd and 3rd laws together (conservation of momentum) dictate that, during a collision between two vehicles, the ratio of the mass of Vehicle #1 (m1) to the mass of Vehicle #2 (m2) is equal to the ratio of the change in velocity experienced by Vehicle #2 (∆V2) to the change in velocity experienced by Vehicle #1 (∆V1), as follows:

This equation can also be written with the vehicle weights, instead of the masses. As an example, the companion article covers a case study in which the ratio of the weight of the struck vehicle (including the driver) to the weight of the motorcycle (including the rider) was approximately 7.15. The EDR-reported resultant ∆V of the struck vehicle was 12.1 mph. Applying Equation (1) yields a ∆V for the motorcycle of 86.5 mph, as follows: cycle is likely to strike the passenger vehicle on the side, but to cause the vehicle to experience both a longitudinal and a lateral ∆V. The component of the collision force that causes the lateral ∆V could be oriented from left-to-right or right-to-left, depending on the intersection geometry and the specific maneuver the passenger vehicle was in the midst of before being struck. The component of the collision force that causes the longitudinal ∆V, on the other hand, will typically be oriented front-to-back on the vehicle and produce a negative direction ∆V. The specifics of the EDR-reported ∆V will vary from system-to-system. Some vehicles will report only the longitudinal ∆V experienced by the struck vehicle. Others will report both the longitudinal and lateral ∆Vs.
The following error sources can affect the accuracy of the EDR-reported speed change (∆V):
However, there is some level of error that could be present in the EDR-reported ∆V. Given the weight ratio, every 1 mph of potential error in the ∆V would produce 7.15 mph of uncertainty in the calculated ∆V for the motorcycle. Assume for the sake of illustration that the potential error within the ∆V could be ±3 mph. If this were the case, then the potential range on the ∆V for the motorcycle would be 65.1 to 108.0 mph, a 42.9 mph spread. This is such a large range, that it may have little practical value. On the other hand, if the potential error within the ∆V were ±1 mph, then the potential range on the ∆V for the motorcycle would be 78.6 to 92.9 mph, a 14.3 mph spread and a range more likely to be useful for assessing the cause of the crash. Of course, the error could also be asymmetric, and perhaps we could say that the EDR-reported ∆V is likely to be an under-estimate within some range. If this were the case, then the EDR-reported ∆V could be used as-is to obtain a conservative (low) estimate of the motorcycle’s ∆V and impact speed. At any rate, these calculations illustrate the sensitivity in conservation of momentum analysis caused by the weight ratio of the motorcycle to the passenger vehicle and emphasizes the need to understand what the potential error in an EDR-reported ∆V is likely to be in any given case.
The Accuracy of the Struck Vehicle EDR-Reported ∆V
For the scenario where an EDR-equipped passenger vehicle turns left across the path of a motorcycle, the motor-
Error Source #1: During an impact, there can be a ∆V that occurs prior to the accelerations exceeding the event-triggering threshold (algorithm enable or AE). This is an error source that contributes to underreporting of the ∆V.1 Prior studies have indicated that the triggering threshold for most passenger vehicle EDRs is in the 1 to 2g range.
Error Source #2: The recording window for the ∆V may be too short to capture the full ∆V. This error source contributes to under-reporting of the ∆V. This error source can be ruled out if the EDR-reported ∆V reaches a maximum and begins to decrease prior to the end of the recording window.
Error Source #3: The recording window for the ∆V may be too long and a ∆V experienced by the vehicle due to post-impact tire and dragging forces could be recorded. This error source could contribute to overreporting of the ∆V. This error source can be ruled out if the EDR-reported ∆V reaches a maximum prior to the end of the recording window and then decreases for the remainder of the recording window. This error source would be recognizable if the EDR-reported ∆V reached a local maximum, then began to decrease, but eventually began to increase again prior to the end of the recording window.
1 Error source #1 can be exacerbated for frontal impacts by the fact that many EDRs reportedly have a built-in positive offset in the accelerometers that can contribute to under-reporting for frontal impacts and over-reporting for rear impacts. Ruth notes that this offset can vary from vehicle to vehicle and EDR generation to generation [Ruth, SAE Course #1210, November 2018]. See also, Wilkinson [2013] and Ruth [2016]. Xing et al [2016] note that this acceleration bias is not a complete explanation for discrepancies between the actual and EDR-reported ∆Vs, observing that “a previous study of Toyota ACMs proposed a constant acceleration bias model to explain the observed differences between reference speed change and ACM recorded speed change. However, our full regression models suggest these differences are not constant across the range of speed changes we tested, but rather that they also depend on the peak acceleration and pulse duration.”
Error Source #4: The peak accelerations during a collision can exceed the capabilities of the accelerometer in the airbag control module (ACM) where the EDR resides, in which case the system will not capture the peak accelerations. This is referred to as clipping. This error source contributes to under-reporting of the ∆V. This error source will be recognizable through a flatline portion of either the EDR-reported ∆V curve or the EDR-reported acceleration curve.
Error Source #5: The ACM may reside some distance from the center of gravity (CG) of the vehicle. This is relevant because accident reconstruction calculations often calculate and utilize the CG ∆V. In instances where the collision induces significant rotation, the ∆V of the struck vehicle – which is measured at the ACM location – may need to be adjusted to accurately reflect the ∆V at the CG of the struck vehicle. Bundorf [1996], Marine and Werner [1998], Rose [2007], and Haight [2013a] describe methods for making this adjustment.
Error Source #6: Physical damage to or displacement of the ACM can affect the accuracy of the reported ∆V. A vehicle involved in a collision can be split into two regions – a deforming or crushing region and a non-deforming region [Emori, 1968]. The occupants would ideally be contained within the non-deforming region of the vehicle and it is the ∆V of this region of the vehicle that the accident reconstructionist would be calculating in their analysis. Varat and Husher [2000] have observed that “care must be exercised in the analysis of accelerometer data to ensure that the instrumentation output accurately represents the vehicle under study. Varying locations within the vehicle may have unique kinematic time histories. A significant factor for rigidly mounted accelerometers is whether the instrument is mounted in or out of the crush zone.” When a collision is severe enough that the ACM ends up being within the crushing region of the vehicle, the accelerations and ∆V reported by this module will not be representative of the accelerations and ∆V experienced by the non-deforming region of the vehicle. This error source can contribute to significant under-reporting or over-reporting of the ∆V. Under-reporting is an indication that deformation caused the ACM to become pitched relative to the longitudinal axis of the vehicle. Over-reporting is an indication that, due to the crush, the ACM experienced accelerations in excess of what the CG experienced.
Error Source #7: The EDR could lose power before the collision is complete and some of the data may not get recorded. When this occurs, the system would under-report the ∆V. Typically, the EDR report will indicate whether recording of a reported event was complete. If the report states that the recording was complete, then this error source can be ruled out.2
None of these are measurement errors, per se. The first is inherent to any event triggered system/algorithm. Error sources two through four are hardware limitations and their effects will often be detectable through analysis of the EDR report. A reconstructionist will sometimes be able to correct for them. The fifth error source is simply something that the reconstructionist will need to account for in cases where there would be a significant discrepancy between the ∆V experienced at the ACM and that experienced at the CG. This will typically be instances when there is significant post-impact rotation. The sixth and seventh error sources amount to physical damage occurring to the measuring device itself or the power source. Errors in the reported ∆V in instances where there is actual damage to the ACM are not surprising and the reported ∆V may not be useable in those instances. For reconstructing motorcycle collisions into EDR-equipped vehicles, it will be important to determine the extent to which these 7 error sources are detectable and can be corrected for since, given the large weight discrepancy typically present between the motorcycle and the struck vehicle, calculations of the motorcycle’s change in velocity will be sensitive to any errors in the struck vehicle ∆V. The reconstructionist can view this list as a checklist of error sources that would ideally be ruled out or accounted for through analysis. If these error sources can be ruled out through physical inspection of the struck vehicle and through analysis of the EDR report, then the potential error in the EDR-reported ∆V can be limited just to measurement error.
Some of these error sources are unlikely in collisions between motorcycles and passenger vehicles. For example, because of the typically large weight ratio between the vehicles in most motorcycle versus passenger vehicle collisions, the ∆V experienced by the passenger vehicle will often be less than 10 mph. At this level of severity, the ACM on the passenger vehicle is unlikely to be physically damaged or displaced (error source #6). Similarly, the ac- celerations experienced by the struck vehicle are unlikely to exceed the full-scale value of the accelerometer (error source #4). Error source #3 seems generally rare. On the other hand, in some motorcycle-to-passenger vehicle collisions, the passenger vehicle can experience significant rotation, which can cause the ACM to experience a different ∆V than the CG. This can cause errors (error source #5) if it is not accounted for in the analysis.
2 Other error sources could be added to this list. During the questions after my presentation of this material at the 2019 EDR Summit, Rick Ruth raised the issue of tire forces present during a collision that could potentially add to underestimation of the EDR-reported ∆V. We will address this and other potential error sources in a future article.
Error source #2 could be an issue for motorcycle collisions, but it will become less of an issue with time now that the Code of Federal Regulations (49 CFR 563) requires passenger vehicle EDRs to report cumulative ∆V over a duration of 250 milliseconds and to monitor and report the maximum ∆V over a period of 300 milliseconds. Part 563 also contains criteria under which the recording can be terminated short of these times, but these criteria are designed to ensure full capture of the collision. This requirement has been in place since September 1, 2012. Many EDRs manufactured prior to this requirement report the ∆V over a significantly shorter interval than this and this error source is most relevant to those older EDRs.
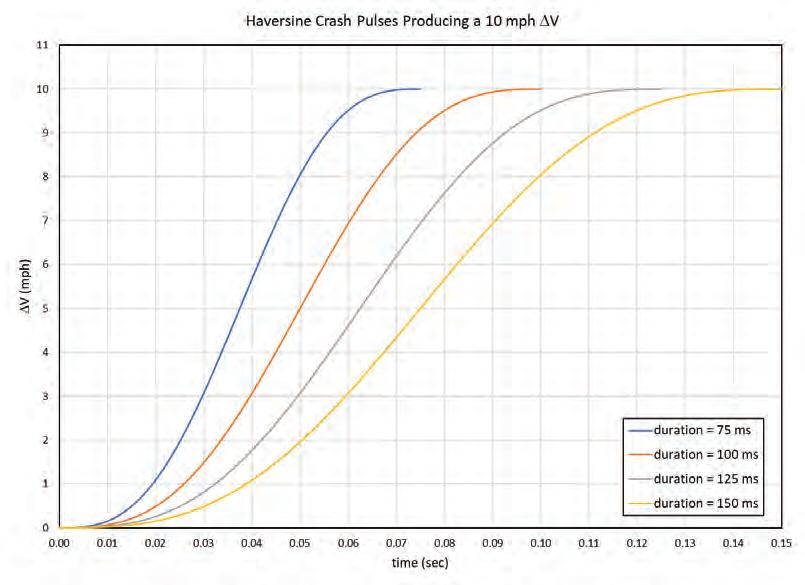
Error source #1 is likely to be present and a contributor to under-reporting for many EDRs, and this error source is likely to produce a higher percentage error in the EDRreported ∆V for motorcycle collisions where the struck vehicle ∆V is 10 mph or less. The acceleration level necessary to trigger an event will vary from EDR-to-EDR, but for the sake of illustration, consider an impact between a motorcycle and a passenger car that produces a 10 mph ∆V for the car. Producing this level of ∆V for the struck car will require a significant impact speed on the part of a motorcycle (perhaps around 70 mph). For the sake of this illustration, assume that the collision produces a haversine crash pulse, which can be described with the following equation [Varat and Husher, 2000]: the cumulative ∆V curves that result from each of these pulses.
For the purpose of this illustration, consider an EDR that has a triggering threshold of 2 g. For the 75-millisecond pulse, this level of acceleration is achieved 10 milliseconds into the collision at a time when the cumulative ∆V is 0.15 mph. Thus, for a 10-mph ∆V with this pulse, error source #1 would only account for a 1.5% under-reporting of the ∆V. For the 100-millisecond pulse, a 2 g acceleration is reached approximately 16 milliseconds into the collision at a time when the cumulative ∆V is 0.26 mph (2.6%). For the 125-millisecond pulse, a 2 g acceleration is reached approximately 22 milliseconds into the collision at a time when the cumulative ∆V is 0.34 mph (3.4%). For the 150-millisecond pulse, a 2 g acceleration is reached approximately 30 milliseconds into the collision at a time when the cumulative ∆V has reached 0.49 mph (4.9%).
This error source can become a larger percentage of the EDR-reported ∆V at lower severity levels. Consider for instance, a collision where the struck vehicle experiences a ∆V of 5 mph. With haversine collision pulses of 75, 100, 125, and 150 milliseconds that produce a 5 mph ∆V, the peak accelerations would be 6.07, 4.55, 3.64, and 3.04 g, respectively. Again, consider an event-triggering threshold of 2 g. For the 75-millisecond pulse, this level of acceleration is achieved approximately 15 milliseconds into the collision at a time when the cumulative ∆V is 0.24 mph (4.8%). For the 100-millisecond pulse, a 2 g acceleration is reached approximately 24 milliseconds into the collision at a time when the cumulative ∆V is 0.4 mph (8.0%). For the 125-millisecond pulse, a 2 g acceleration is reached approximately 34 milliseconds into the collision at a time when the cumulative ∆V is 0.57 mph (11.4%). For the 150-millisecond pulse, a 2 g acceleration is reached approximately 45 milliseconds into the collision at a time when the cumulative ∆V has reached 0.74 mph (14.8%).
In this equation, a is the acceleration at any instant during the collision, P is the peak acceleration, ∆t is the impact duration, and t is the time at any instant during the impact. The acceleration pulse defined with this equation can be integrated to calculate the cumulative ∆V over the duration of the pulse. For a given impact duration, a given ∆V will have a particular peak acceleration associated with it. Figure 1 is a graph showing 4 different haversine collision pulses of varying durations – 75, 100, 125, and 150 milliseconds. Each of these pulses produces a ∆V of 10 mph, and so they each have a different peak acceleration –12.15, 9.11, 7.29, and 6.07 g, respectively. Figure 2 shows
These two examples illustrate that the significance of error source #1 depends on the magnitude of the ∆V and on the impact duration. Assuming that the recording window of the EDR is adequate to capture the entire pulse, the impact duration is potentially something that can be quantified from the EDR data. Sometimes the peak acceleration will be reported as well. In such instances, the reconstructionist can use these to quantify the magnitude of this error source for the specific case being analyzed.
Full-Overlap Front and Rear Collisions
Now consider some of the literature related to the error rates of EDR-reported ∆Vs. Figure 3 plots the error in the EDR-reported ∆V for a number of instances reported in the literature.3 The error was quantified in the cited studies by comparing to the ∆V calculated from on-board, laboratory grade accelerometers with which the vehicles were instrumented. As long as the laboratory accelerometers are outside of the crushing region of the vehicle and the col- lision does not induce significant rotation, the accelerometers would not be subject to any of the 7 error sources listed for the EDR-reported ∆V. The data in Figure 3 is for full-overlap, front or rear impacts where the vehicles experienced insignificant yaw rotation following the col- lision. The ∆V calculated from the accelerometers on the test vehicle is plotted on the horizontal axis and the error in the EDR-reported ∆V is plotted on the vertical axis. A negative ∆V on the horizontal axis is a frontal impact and a positive ∆V is a rear impact. The errors reported on the vertical axis are calculated from the ∆V magnitudes, such that a negative error is always an under-reporting of the magnitude of the ∆V and a positive error is always an overreporting of the magnitude of the ∆V.4

The dashed black lines represent a window of ±10% error, the required accuracy per 49 CFR part 563.85 and the rule of thumb first found in the literature based on a study by Chidester’s examination of early General Motors Sensing and Diagnostic Modules [1999]. A significant number of the data points in Figure 3 are from the NHTSA’s New Car Assessment Program (NCAP) 35-mph frontal barrier crash tests, which yield ∆Vs around 40 mph. Figure 3 appears to show increasing absolute error in the EDR-reported ∆Vs with increasing ∆V, consistent with the underlying implication of the 10% error rule. Much of the data does lie with the 10% error band, but there are also a number of points that fall outside of this window. In particular, for the frontal collisions with ∆Vs around 40 mph there are a number of points with considerably higher error than 10%. Ideally, we would be able to identify the sources of these high errors and rule these sources out for motorcycle collisions into passenger vehicles. On the other end of the spectrum, for frontal collisions with ∆Vs lower than 10 mph, almost all of the points lie outside of the 10% error window. For these lower speed collisions, it may be more useful to think in terms of absolute error, rather than percentage error.
Exponent [2011]: The largest under-reported ∆V (-20.0 mph) in Figure 3 was published by Exponent [2011]. This data point is represented in the lower left corner of Figure 3. For their study, Exponent generated and evaluated 231 EDR records in 24 Toyota and Lexus vehicles. Seven of the EDR records were generated in full-scale frontal crash tests of sufficient severity to cause airbag deployment. The remaining 224 EDR records were non-deployment events generated by tapping the ACM from the rear. Three of the full-scale crash tests were severe enough to damage the attachment points of the ACM. The authors reported that the “EDRs accurately recorded accelerations within the +/50g limit of performance for which they were designed. In the three crashes where ACM mounts broke, the accelerations tracked well early in the [impact].”
The 20-mph under-reporting was from the EDR in a test of a 2007 Lexus ES-350. This vehicle impacted the barrier at a speed of approximately 50 mph, producing a ∆V of approximately 54 mph. During this test, the mounting flanges of the electronic control module were fractured due to deformation of the floor pan underneath the module. This led to inaccurate acceleration measurements within the ACM. In addition to that, other instrumentation on the test vehicle measured accelerations exceeding 50 g. Since the accelerometer in the ACM could only measure accelerations up to 50 g, the accelerations recorded by the module were clipped. Thus, the ∆V was under-reported due to the module being in the deforming region and reoriented off the longitudinal axis of the vehicle and from peak acceleration clipping at the hardware level (error sources #4 and #6).
Another one of the tests, with a ∆V just over 40 mph, resulted in an EDR-reported ∆V that was 5.8 mph low (14.3%). This was a test of a 2003 Toyota Camry. Exponent reported that “the rearmost of the three flanges used to bolt the airbag control module to the vehicle fractured…this was the result of deformation to the vehicle floor pan underneath the ACM and occurred after the vehicle had experienced significant crush and after the airbags had deployed.” In addition, “the accelerometers mounted near the vehicle CG also recorded accelerations in excess of 50 g’s for more than 10 ms, so it is probable that the accelerations recorded by the ACM’s accelerometers were truncated.” This data point is in the same severity range as many of the other tests in Figure 3 that exhibited significant under or over-reporting of the ∆V. The other five of the seven full-scale crash tests reported by Exponent had EDR-reported ∆Vs within 7% of those obtained from other instrumentation.
Tsoi [2013]: The next largest under-reported longitudinal ∆V (-11.7 mph) in Figure 3 was published by Tsoi, Hinch, Ruth, and Gabler [2013]. These authors evaluated the accuracy of 41 EDRs extracted from 2012 General Motors, Ford, Honda, Mazda, Toyota, and Volvo vehicles that had been tested in the NCAP 35 mph (56 km/h) full-overlap frontal collisions into a rigid, non-moving barrier. Tsoi noted that these tests “are very severe, demonstrated by the fact that they are representative of the 99th percentile of all frontal crashes.” They reported that “the average abso- lute error was 4.20 kph (6.6%) for final longitudinal ∆V and 4.32 kph (6.6%) for maximum longitudinal ∆V. Our results show that EDRs underreport the reference instrumentation ∆V in the vast majority of cases.” Unfortunately, Tsoi et al report several instances with EDR-reported ∆V errors significantly greater than 6.6%.
3 Bortles et al presented a prior version of Figure 3. This present article offers an updated version of this figure.
4 This is an intuitive, but inconsistent way of reporting the errors. This sign convention was a feature of the original version of Figure 3, and we have chosen to retain that feature here.
5 https://www.law.cornell.edu/cfr/text/49/563.8.
The specific test reported by Tsoi et al with the most significant under-reported ∆V (-11.7 mph) was an NCAP test of a 2012 Toyota Sienna (NHTSA Test #7615) with an impact speed of 35.0 mph (56.3 km/h). We examined the test and CDR reports for this test, along with four acceleration channels from the test instrumentation, all of which measured the longitudinal accelerations from the area of the rear seats (Channels 93, 94, 99, and 100), a position likely to be outside the crushing region of the vehicle. These signals were filtered, averaged, and then integrated to obtain the ∆V. The CDR report indicated that the ACM on this vehicle was an 06EDR (Generation 2) and the report listed a maximum ∆V of 28.8 mph. The actual maximum ∆V was 40.5 mph, so the EDR underreported the ∆V by 28.9%.
Consider each of the 7 potential error sources for this test. Error Source #1 – Xing et al [2016] reported that the triggering acceleration threshold for this generation of Toyota EDR was approximately 2 g. Based on the data from the on-board laboratory accelerometers, this acceleration threshold would have been met approximately 4 milliseconds into the collision, at a time when the vehicle had experienced only a 0.03 mph ∆V. Thus, the ACM missing this ∆V would be an insignificant contributor to the significant overall under-reporting of the ∆V. Ruth indicates that Toyota Generation 2 EDRs have a +0.39 g to +0.87 g [SAE Course #1210 and 2016-01-1496] offset in the accelerometers. He calculated that over 150 milliseconds the 0.39 g will contribute approximately 1.3 mph to underreporting of the ∆V. The +0.87 g offset would contribute about double this. Thus, while this error source could be a factor in this test, it does not explain the substantial underreporting. Error Source #2 – The recording window for the ∆V was 200 milliseconds and the maximum reported ∆V occurred at approximately 110 milliseconds. The decelerations obtained from the other on-board accelerom- eters show that the collision pulse had essentially ended by 90 milliseconds. Therefore, the recording window was long enough to capture the full ∆V. Error Source #3 – In the CDR report, the reported cumulative longitudinal ∆V decreased from the time it reached its maximum to the end of the recording window; therefore, external forces other than the collision forces do not appear to be increasing the reported ∆V, and so, the recording window was not too long. Error Source #4 – The CDR report did not contain any graphical or tabular reporting of the underlying accelerations experienced by the ACM. There was no evidence of acceleration clipping from examination of the CDR report and the accelerations reported by the on-board accelerometers did not exceed 50 g. Error Source #5 – Review of the test video did not reveal any significant yaw rotation of the vehicle during or following the collision. Error Source #7 – The CDR report indicated that recording of the event was complete. This leaves error source #6 – deformation of or around the ACM.

Error Source #6 – Figure 4 shows the cumulative ∆V for this test, both as reported by the EDR and as calculated from the other on-board accelerometers. This graph shows the timeframe up to 125 milliseconds, so it does not include all of the EDR data. It does include the full crash pulse, though. The EDR data has been time shifted by 9 milliseconds to visually align the initial portions of these curves. The two curves track reasonably well until approximately 60 milliseconds. At that point, the curves diverge. The EDR curve levels off while the cumulative ∆V from the on-board accelerometers continues to increase significantly above the other curve. This pattern is consistent with a change in alignment of the ACM relative to the vehicle due to localized deformation around the module such that the longitudinal accelerometer in the ACM stops capturing a significant portion of the collision accelerations. The ACM was not photographically documented either before or after this test, so this interpretation cannot be directly confirmed. However, the ACM on this vehicle was located underneath the center stack, and deformation to the ACM’s mounting location can be inferred from deformation to the center stack (the area behind/under the radio).
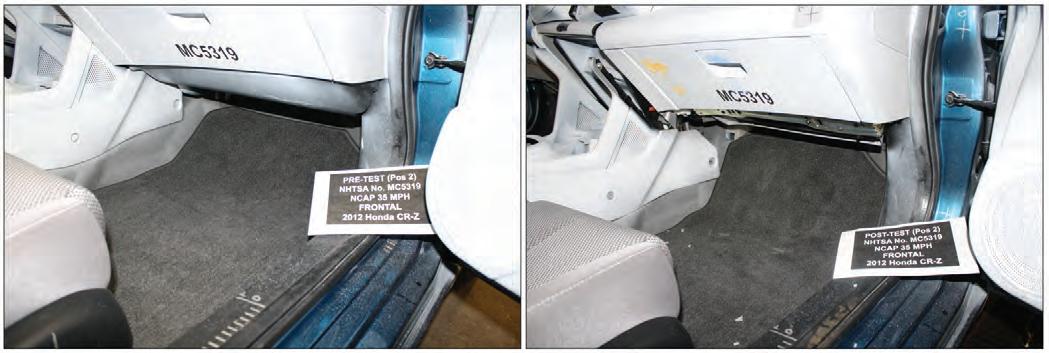
Examination of the photographs in Figure 5 reveal deformation of the vehicle floor in this area underneath the center stack. The photograph on the left is a pre-test photograph of the passenger’s side footwell and the photograph on the right is the same area post-test. In the post-test photograph, it is apparent that the space in the footwell has been significantly reduced due to the impact. The panels covering the lower portion of the center stack are displaced and deformed and their mounting clips have come out. The deformation evident in this area of the vehicle is confirming of the interpretation that the ACM was reoriented due to deformation during the collision. Thus, the inaccuracy in the EDR-reported ∆V can be attributed to error source #6. This is a detectable error source that a reconstructionist would be able to document for a vehicle involved in a real-world collision.
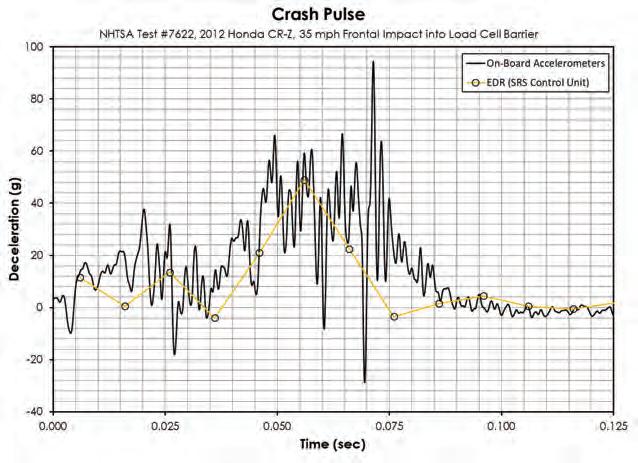
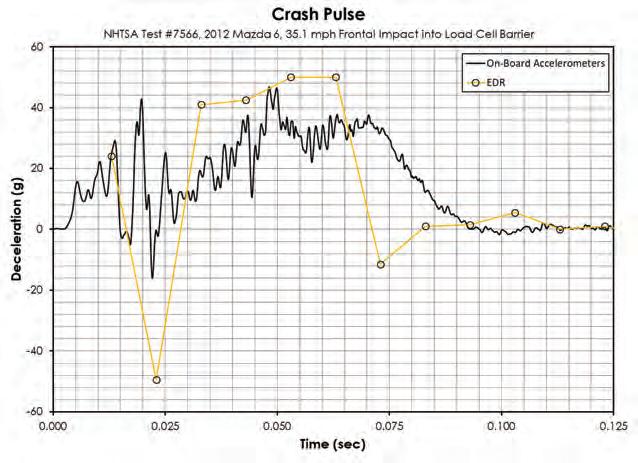
The magnitude of the error in the EDR-reported ∆V exceeded 9 mph in two additional tests examined by Tsoi et al. First, the CDR report for NHTSA Test #7622 – a 35 mph NCAP test of a 2012 Honda CR-Z – reported a maximum longitudinal ∆V of 30 mph. The actual maximum ∆V was 41.3 mph. Thus, the EDR under-reported the ∆V by 11.3 mph (27.4%). We examined the test and CDR reports for this test, along with four acceleration channels from the test instrumentation, all of which measured the longitudinal accelerations from the area of the rear seat (Channels 93, 94, 99, and 100). These signals were filtered with a Butterworth filter with a cutoff frequency of 400 Hz and then averaged. The resulting acceleration pulse is plotted in Figure 6. In this figure, time is plotted on the horizontal axis and deceleration on the vertical axis. Deceleration has been plotted with a positive sign and acceleration with a negative sign. This figure also contains the decelerations reported in the CDR report.
Several observations can be made from examination of Figure 6. First, the CDR report listed a peak deceleration of 49 g. The on-board accelerometers measured peak decelerations exceeding 50 g during portions of the impact. Even though the ACM accelerometer did not capture these higher accelerations, it is unlikely that this had a significant influence on the EDR ∆V calculation. In conducting our analysis, we also experimented with filtering the accelerations from the on-board accelerometers with a cutoff frequency of 60-Hz. This brought the peak deceleration down to 49 g and made little difference in the ∆V calculation. Second, the maximum recording window for this EDR was 250 milliseconds. The data limitations in the CDR report indicate that the recording of ∆V will terminate prior to 250 milliseconds if the change in longitudinal or lateral velocity equals or falls below 0.8 km/h (0.5 mph) over a 20-millisecond timeframe. During this crash test, the longitudinal ∆V leveled off around 100 milliseconds and the EDR stopped reporting the ∆V at 130 milliseconds. This makes sense with the decelerations reported by the on-board accelerometers (Figure 6), and so, it can be concluded that the under-reporting of the ∆V in this instance was not due to a recording window that was too short.
Finally, consider the accelerations reported by the EDR. The EDR-reported accelerations were aligned to the de- celerations from the other on-board instrumentation by plotting the cumulative ∆V calculated from the on-board instrumentation with the cumulative EDR-reported ∆V (see Figure 7 for this alignment). This resulted in a 6-millisecond shift of the EDR-reported accelerations. Overall, the area under the EDR deceleration curve is smaller than the area under the curve generated with the on-board accelerometers. This is consistent with the EDR-reported ∆V under-estimating the actual ∆V. In addition, the decelerations reported by the ACM begin dropping significantly in magnitude at approximately 56 milliseconds. The decelerations reported by the on-board accelerometers do not begin dropping significantly until perhaps 15 milliseconds later. This indicates that at this point in the collision, the ACM has started to measure different decelerations than the accelerometers further back on the vehicle. This has the look of localized deformation around the ACM that caused the ACM to become misaligned relative to the vehicle.


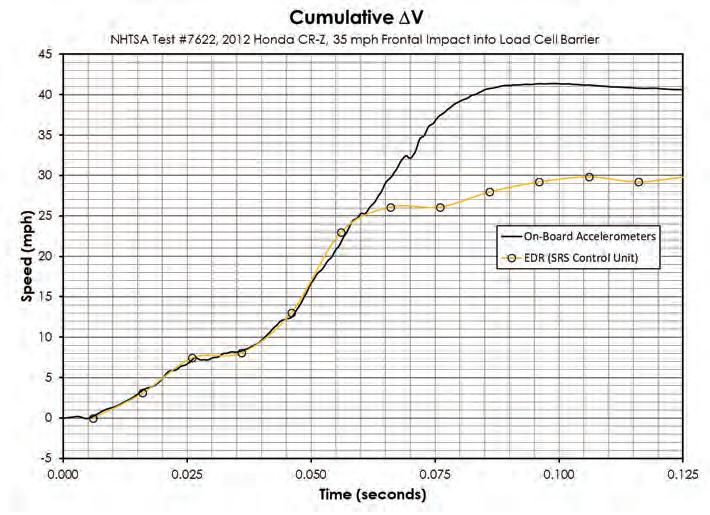
This interpretation is confirmed by examination of Figure 7, which shows the cumulative ∆V through the collision, both as reported by the EDR and as calculated from the other on-board accelerometers. The two curves track very closely until approximately 55 milliseconds into the collision. At that point, the curves begin diverging. The EDR curve levels off while the cumulative ∆V from the onboard accelerometers continues to increase, significantly above the other curve, a pattern similar to that observed for the Toyota Sienna test.
The ACM was not photographically documented either before or after this test, so this interpretation cannot be confirmed directly. However, the dynamic deformation that occurred during this test was of great enough magnitude that it could have deformed the area where the ACM was mounted (underneath the center stack). Figure 8 is one frame from the test video that shows the overall dynamic deformation during this test.
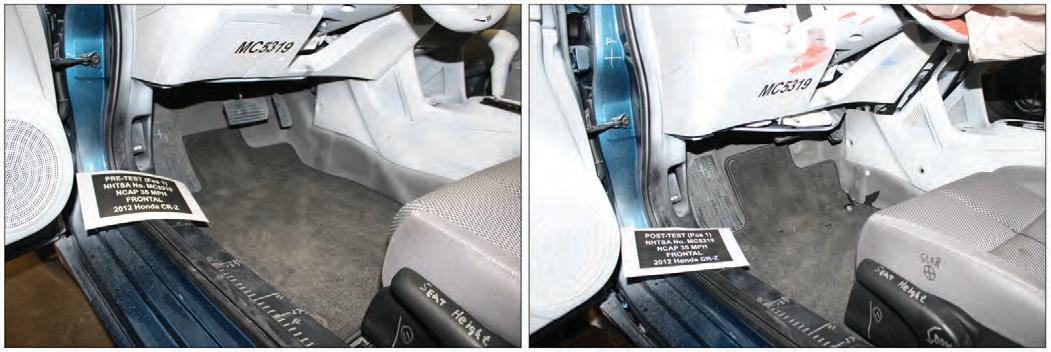
Deformation of the center stack can be confirmed indirectly by examining the photographs included in Figure 9 and Figure 10. The photographs in Figure 9 compare the driver’s side footwell pre and post-test. In the post-test photograph, some floor deformation is evident beneath the center stack. The panels covering the lower portion of the center stack are displaced and their mounting clips have come out. The photographs in Figure 10 compare the passenger’s side footwell pre and post-test. On the passenger side, there appears to be more significant floor deformation than what was present on the driver’s side, and again, the panels covering the lower portion of the center stack are displaced and one of the mounting clips has come out. These observations are confirming of the interpretation that the ACM was reoriented due to deformation during the collision. Thus, the inaccuracy in the EDR-reported ∆V can be attributed to error source #6.

As an additional example, the CDR report for NHTSA Test #7566 – a 35 mph NCAP test of a 2012 Mazda 6 –indicated a maximum longitudinal ∆V of 31.7 mph (51 km/h) occurring at 125 milliseconds. The actual maximum ∆V was 41.1 mph (66.2 km/h). Thus, the EDR under-reported the ∆V by 9.4 mph (15.2 km/h). As with the previous tests, we examined the test and CDR reports for this test, along with four acceleration channels from the test instrumentation, all of which measured the longitudinal accelerations from the area of the rear seats (Channels 93, 94, 99, and 100). These signals were filtered and then averaged. The resulting acceleration pulse is plotted in Fig- ure 11. This figure also contains the decelerations reported in the CDR report. As with the previous tests, the accelerations from the ACM and the on-board accelerometers were aligned by visually aligning the cumulative ∆V curves (see Figure 12).
In this case, the accelerations measured by the ACM do appear to reach the upper limit of the accelerometer and to get clipped at 50 g. However, the decelerations from the laboratory accelerometers do not ever reach 50 g. This is an indication that the ACM is in the deforming region of the vehicle and experiencing higher accelerations than what the non-deforming region of the vehicle experienced. Also, similar to the previous 2 tests, the decelerations begin dropping back to zero approximately 10 milliseconds too early, indicating likely misalignment of the ACM relative to the longitudinal axis of the vehicle due to deformation.
There are other indications in the Tsoi data that the larger reported errors are due to deformation around the area where the ACMs are mounted. For example, Tsoi et al presented the data in Table 1, which lists the average absolute error for EDR-reported ∆Vs, segregated by manufacturer.
This table shows significant differences from manufacturer to manufacturer. As an illustration, consider the difference between the average error for the 6 tests with Fords (1.88%) and that for the 5 tests with Hondas (10.47%). Table 2 compares these tests. The ACMs for the Fords are all located on the center tunnel, whereas the ACMs for the Hondas are further forward under the center stacks. The vehicles in these tests experience comparable length reductions due to the damage, so the further forward the ACM is, the more likely it is to be involved in the deforming region of the vehicle.
Ruth and Tsoi [2014]: The largest over-reported ∆V (+5.5 mph) in Figure 1 was published by Ruth and Tsoi [2014] and was from a 2012 Hyundai Accent (NHTSA Test #7504). The tests reported by Ruth consisted of Kia and Hyundai vehicles from model years (MY) 2010 to 2012. This was prior to Kia and Hyundai’s full compliance with CFR Part 563, and Ruth observed clearly anomalous data in some of the tests he examined for these model years. That said, for these full-overlap, frontal impacts, 19 out of 20 of the EDR-reported ∆Vs were within 10% of the ∆V determined from the other instrumentation on the vehicle (≅ ±4 mph).

NHTSA Test #7504 was an NCAP test of a 2012 Hyundai Accent with an impact speed of 34.9 mph (56.2 km/h). We examined the test and EDR reports for this test, along with four acceleration channels from the test instrumentation, all of which measured the longitudinal accelerations from the area of the rear seats (Channels 93, 94, 99, and 100). These signals were filtered, averaged, and then integrated to obtain the ∆V. Figure 13 shows the cumulative ∆V for this test, both as reported by the EDR and as calculated from the other on-board accelerometers.
The two curves track reasonably well until approximately 55 milliseconds. At that point, the curves diverge. The
EDR curve levels off while the cumulative ∆V from the on-board accelerometers continues to increase significantly above the other curve. This pattern is consistent with the ACM experiencing higher accelerations than the laboratory accelerometers due to localized deformation around the module. The ACM was not documented photographically either before or after this test, so this interpretation cannot be directly confirmed. However, the ACM on this vehicle was located underneath the center stack and deformation to the floor under the center stack was evident in the posttest photographs from this test.

Low Severity Tests: The previous discussion has confirmed, at least provisionally, that the higher errors for the higher severity tests in Figure 3 are likely related to the severity of these collisions and the proximity of the ACM to the crushing region of the vehicle. The more severe the collision and the closer the ACM is to the collision, the greater the likelihood that the ACM or surrounding structure will be damaged or deformed. If such deformation occurs, increased error in the EDR-reported ∆V will be the result. The highest errors occurred around a ∆V of 40 mph. Using the 7.15 weight ratio that was used in the example in the introduction, a motorcycle would have to be traveling about 286 mph to produce a 40 mph ∆V for the struck vehicle. This is obviously improbable, and so the high error rates exhibited by some of the higher severity collisions included in Figure 3 are unlikely to be applicable to motorcycle collisions with passenger vehicles. That said, high-speed motorcycle collisions can sometimes produce deformation patterns similar to pole (or other narrow object) impacts, and it is possible that the ACM could be damaged or displaced during a motorcycle collision, at least in rare instances. Assuming that the reconstructionist can rule this out, though, the error rates reported in studies of EDR accuracy in low-severity collisions are more likely to be applicable to what the struck vehicle experiences during a motorcycle collision.
Correia, Iliadis, and McCarron [2001] reported 12 lowseverity rear end vehicle-to-vehicle staged collisions using two different GM bullet vehicles – a 2000 Chevrolet Malibu and a 1997 Chevrolet Cavalier. These vehicles struck one of two target vehicles – a 1984 VW Rabbit or a 1994 Honda Accord. The SDM on the Malibu did not report ∆V, thus no comparison between EDR-reported ∆V and the actual ∆V could be made for the 5 Malibu tests. The SDM on the Cavalier did report ∆V data. Of the 7 tests run with this vehicle, 4 did not cause an event to be recorded. Of the remaining 3 tests where a non-deployment event was recorded, the EDR-reported ∆Vs were between 1.3 and 2.2 km/h low (0.8 to 1.4 mph). The authors attributed the under-reporting to a recording window that was too short to capture the full collisions. These three data points are included in Figure 3.
Lawrence, Wilkinson, King, and Heinrichs [2002] examined the accuracy of EDR-reported ∆Vs from the sensing and diagnostic modules (SDMs) on MY 1996-1999 General Motors vehicles for low-severity collisions. Two SDMequipped vehicles were subjected to 260 staged frontal collisions with speed changes below 11 km/h (6.8 mph). Of the 260 collisions, 105 of them were vehicle-to-barrier tests and 155 of them were vehicle-to-vehicles tests, with the front bumper of the SDM-equipped vehicle striking the rear bumper of a 1984 Volvo GL. Airbags did not deploy in any of the tests. The authors reported that “in all of the vehicle tests, the speed change reported by the SDM underestimated the actual speed change of the vehicle… The difference between the SDM-reported speed change and the actual speed change was as high as 4 km/h [2.5 mph] at low speed changes and decreased to a maximum of 2.6 km/h [1.6 mph] at a speed change of 10 km/h [6.2 mph].” They attributed this difference to the portion of the ∆V that occurred prior to the threshold acceleration necessary to wake-up the module. They determined that this threshold acceleration was between 1.2 and 1.4 g for the modules in their study. The authors also found that the error in the SDM-reported ∆V was sensitive to pulse shape and duration. For the same ∆V, shorter collisions pulses generated more accurate SDM-reported ∆Vs, since more of the pulse was above the threshold acceleration. The authors observed that “long duration and low peak acceleration pulses have larger areas excluded from the integration and will result in larger errors in the SDM-reported speed change than short duration or high peak acceleration pulses of the same general shape.” Finally, they found that “the highest speed change that did not generate a near-deployment event was 6.2 km/h [3.9 mph] and the lowest speed change that did generate a near-deployment was 4.9 km/h [3.0 mph].” These authors did not report tabular data for their tests, and so these tests are not included in Figure 3. However, the results of these tests are consistent with other low severity tests that are included in the figure.
Wilkinson, Lawrence, Heinrichs, and Siegmund [2004] examined the accuracy of the EDR-reported ∆Vs from Ford restraint control modules (RCMs) in low-severity collisions. They conducted 84 frontal barrier collisions with two RCM-equipped vehicles with actual speed changes as high as 13.5 km/h (8.4 mph). These authors reported that the accuracy of the EDR-reported ∆Vs ranged from an underestimate of 1.8 km/h (1.1 mph) to and overestimate of 0.3 km/h (0.2 mph). They attributed these errors both to the portion of the ∆V that occurred prior to the threshold acceleration necessary to wake-up the module and, in many instances, to a recording window that was too short to capture the full collision pulse. In a follow-up study in 2005, Lawrence and Wilkinson reanalyzed the Ford RCM data with an updated version of the CDR software. They found differences between the ∆Vs reported by the two versions of the software. When analyzed with the updated version, more accurate speed changes resulted for one of the vehicles, but less accurate for the other vehicle. Overall, the accuracy of the EDR-reported ∆Vs was between -1.3 km/h (-0.8 mph) and 0.4 km/h (0.2 mph). These authors did not report tabular data for their tests, and so these tests are not included in Figure 3. However, the results of these tests are consistent with other low severity tests that are included in the figure.
Wilkinson, Lawrence, Heinrichs, and King [2005] examined the accuracy of EDR-reported ∆Vs from the sensing and diagnostic modules (SDMs) on MY 2003 and 2004 General Motors vehicles for low-severity collisions. Three MY 2004 SDM-equipped vehicles (Chevrolet Cavalier, Impala, and Trailblazer) were subjected to 136 vehicle-tobarrier and vehicle-to-vehicle frontal collisions with speed changes up to 8 km/h (5 mph). Of these tests, 65 of them were vehicle-to-vehicle and 71 were vehicle-to-barrier. The SDMs were also tested on a linear sled that allowed for replicating the crash pulses from the vehicle tests and also for applying similar pulses of greater severity to the SDMs. The authors reported that “in all of the tests, the speed change reported by the SDM underestimated the actual speed change. The speed change underestimates ranged from 0.2 to 2.9 km/h [0.1 to 1.8 mph] except for several anomalous tests in which the underestimate was as high as 12.3 km/h [7.6 mph].” In comparing their results to their 2002 publication with earlier model year SDMs, the authors state that “the newer model GM SDMs, and in particular the 2004 Cavalier SDM, appear to be more accurate in reporting speed change than their predecessors. The improved accuracy is at least partially explained by the lower threshold acceleration in the new Cavalier SDM (1.1g versus 1.3g).” These authors did not report tabular data for their tests, and so these tests are not included in Figure 3. However, the results of these tests are consistent with other low severity tests that are included in the figure.
Wilkinson, Lawrence, Nelson and Bowler examined the accuracy of EDR-reported ∆Vs from MY 2005 to 2008 Toyota Corolla EDRs for low-severity collisions. They utilized vehicle-to-barrier tests and ACM sled tests for their evaluation. The frontal impact barrier tests ranged in speed from 2.0 to 5.2 km/h (1.2 to 3.2 mph) with ∆Vs between 3.5 and 9.0 km/h (2.2 and 5.6 mph). The lowest ∆V that produced a recorded event was 4.5 km/h (2.8 mph) with a peak acceleration of 2.1g. The authors reported that “in all in-vehicle tests, the speed change reported by the ACM underestimated the actual speed change for frontal collisions and overestimated the actual speed change for rearend collisions. The speed change underestimates ranged from 1.3 to 2.6 km/h [0.8 to 1.6 mph] and the speed change overestimates ranged from 0.6 to 2.2 km/h [0.4 to 1.4 mph] … Threshold accelerations required to initiate the recording of an event were found to be between 2.0 and 2.1g for all of the ACMs tested.” The authors also reported that “integrating the sled acceleration pulses after a 2g threshold was achieved and adding a constant bias of 0.4g reproduced the temporal shift in the cumulative speed change values reported by the ACM relative to the reference speed change…it also generated maximum speed change estimates (∆Vmodel) that were close to the ACM speed changes (∆VACM) especially for frontal crash pulses. These authors did not report tabular data for their tests, and so these tests are not included in Figure 3. However, the results of these tests are consistent with other low severity tests that are included in the figure.
Xing, Lee, Flynn, Wilkinson and Siegmund [2016] compared the response of 19 Generation 1, 2, and 3 Toyota EDRs from Toyota Corollas, Camrys, and Priuses for lowseverity collisions. They used a sled to subject the EDRs to frontal and rear haversine crash pulses of varying duration (80, 120, 160, and 200 ms), peak acceleration (0.17 to 4.59 g), and ∆V (0.9 to 13.0 km/h). They found that acceleration necessary to trigger an event was approximately 2 g for Generation 1 and 2 EDRs. The acceleration necessary to trigger an event for a Generation 3 EDR appeared to vary, but events were consistently triggered for ∆Vs around 8 km/h. Xing et al theorized that “this new and different behavior for the Gen3 ACMs could be the results of software changes that simply do not report events that fall below this 8 km/h threshold despite an internal trigger that remains at 2 g.” These authors further reported that “in most front impacts, the ACMs underestimated the reference speed change…” Xing et al presented regression equations for each EDR generation/vehicle combination that would related the EDR-reported ∆V to the actual ∆V. For individual cases involving Toyotas, a reconstructionist can apply these equations. For the purpose of our discussion here, it is sufficient to observe that for frontal impacts, the EDR-reported ∆V errors were between a 0.72 km/h (0.45 mph) over-estimate and a 3.81 km/h (2.37 mph) underestimate. The vast majority of the EDR-reported ∆Vs under-estimated the actual ∆Vs. Xing et al also noted that the magnitude of errors in the EDR-reported ∆Vs could be reduced to ±1 km/h with the use of their regression equations. This suggests that testing of individual ACMs could be useful for achieving high levels of accuracy on a specific case. Some cases will warrant such testing and others will not.
In a follow-up study in 2017, Lee, Xing, Yang, Lee, Wilkinson, and Siegmund expanded their examination of Toyota ACMs to include mid-severity crashes and to confirm that sled testing of ACMs could be applied to the analysis of vehicle-to-barrier and vehicle-to-vehicle crashes. These authors reported that “in the frontal vehicle-to-barrier tests, the ACM-reported speed changes consistently underestimated the reference speed change…the ACM-reported speed change consistently overestimated the reference speed change in rear-end vehicle-to-barrier collisions. In vehicle-to-vehicle collisions, the same pattern of underestimating in frontal collisions and overestimating in rear-end collisions was observed…Overall, the ACMs underestimated frontal speed change by 1.25 km/h and overestimated rear-end speed change by 0.79 km/h.” For the frontal impact vehicle tests, the range in the underreporting for the EDR-reported ∆Vs varied between 0.8 and 2.5 km/h (0.5 to 1.6 mph). These authors presented additional regression modeling with which the EDR-reported ∆V could be corrected and the accuracy improved. The vehicle tests from this study are included in Figure 3.
These studies related to the accuracy of EDR-reported ∆Vs in aligned, low-severity collisions consistently show the EDR-reported longitudinal ∆Vs under-reporting the actual longitudinal ∆V, generally by a magnitude of 2 mph or less – most of the time by a magnitude of 1.5 mph or less. Based on these studies, a reasonable range on the actual longitudinal ∆V for the struck vehicle would have a low-end of the longitudinal ∆V reported by the EDR and a high-end of 1.5 to 2 mph greater in magnitude than the longitudinal ∆V reported by the EDR. So, for example, if the EDR-reported longitudinal ∆V was -5 mph, the reconstructionist could apply a range for the actual longitudinal ∆V between -5 and -6.5 mph. Now, consider additional studies of the EDR-reported ∆V accuracy for other impact configurations.
Partial-Overlap Frontal Collisions
Haight [2013b] analyzed 12 high-severity, small overlap collisions involving MY 2013 vehicles, where 25% of the front of the vehicle was engaged in the collision with a barrier. These tests, which involved the vehicles impacting the barrier at a speed of approximately 40 mph (64 km/h), were conducted by the Insurance Institute for Highway Safety (IIHS). Each of the vehicles in these tests had available EDR data, accessible either with the Bosch Crash Data Retrieval (CDR) Tool or the GIT/Snap-On EDR tool, and Haight evaluated the accuracy of the EDR-reported ∆Vs. These EDRs reported both longitudinal and lateral ∆Vs. Haight found that all of the EDR-reported lateral ∆Vs, measured at the location of the ACM, under-reported the ∆Vs measured at the location of the accelerometer array installed on the vehicle for the test. The average difference was 8 mph (13 km/h). Haight attributed the difference to the difference in location between the ACM and the accelerometer array, along with the significant yaw rotation induced by the collisions (error source #5). He presented a method for adjusting the ∆V to reflect a different location in the vehicle than where it was initially measured, and he successfully employed this method to reasonably reconcile the EDR-reported ∆Vs with the ∆Vs obtained from the accelerometer array. Based on our review of the post-test photographs from these tests, there could also be some error in the EDR-reported ∆Vs for these tests due to deformation of or around the ACMs.
Other authors have examined the EDR-reported ∆Vs for partial-overlap frontal collisions, but they did not make corrections for yaw rotation experienced by the test vehicles and discrepancies in position between the ACMs and the laboratory accelerometers. Comeau [2004] examined 2 partial-overlap frontal collisions, one involving a 1998 Chevrolet Cavalier and the other a 2002 Chevrolet Impala, in which 40% of the front of the vehicle impacted a non-moving, deformable barrier face at approximately 40 km/h (25 mph). The EDRs on these vehicles only reported longitudinal ∆Vs. For the Cavalier, the EDR-reported ∆V was about 2 km/h (1.3 mph) different than that determined from laboratory instrumentation. For the Impala, the EDR under-reported the magnitude of the ∆V by about 14 km/h (8.7 mph). The authors attributed the error for this second test to limited recording capabilities of the EDR on the Cavalier. Yaw rotation of the vehicle did not appear to be a significant factor.
Niehoff et al [2005] reported analysis of 9 IIHS highseverity, moderate overlap (40%) collisions involving MY 2000-2004 vehicles. Most of the EDRs in their study only recorded longitudinal ∆V. Two of the vehicles did record lateral ∆Vs as well, and a comparison to the actual lateral ∆Vs were made in these two cases. The authors reported significant errors in the EDR-reported lateral ∆Vs for these two cases. However, no method was presented, and no analysis appears to have been done to correct for discrepancies between the location of the ACM and the laboratory accelerometers. The authors stated that “the EDR crash sensor and the crash test accelerometer were not positioned at the same locations in the car. This may complicate this comparison is some types of crashes. In full frontal barrier crash tests, there should be no difficulty as the EDR accelerometer and a crash test accelerometer located in the occupant compartment should experience the same acceleration. In other types of crash tests such as frontal offset or angled impacts, however, the impact may be characterized by significant vehicle rotation. In these cases, the EDR and crash test accelerometer may experience a different acceleration due to this rotation.” Since the authors did not account for this error source or make any attempt to isolate if from other error sources, the errors reported for the partial overlap collisions in their study cannot be considered an assessment of the measurement error. Instead, they are more representative of incomplete analysis and comparing apples (the ∆V at the EDR location) to oranges (the ∆V at the accelerometer array location).
The Niehoff et al study also included a single vehicle-to-vehicle crash test between a 2000 Cadillac Seville and a 1997 Honda Accord that involved the Cadillac impacting the Accord at an angle of 330 degrees. This collision primarily engaged the front of the Cadillac, although given the impact configuration, the vehicle likely experienced a lateral ∆V as well. The EDR on this vehicle reported longitudinal ∆Vs only. Also, the EDR had a limited recording window that was insufficient to capture the full crash pulse. Nonetheless, up to the time at which recording terminated, the EDR-reported cumulative ∆V tracked closely with the cumulative ∆V determined from the other instrumentation on the vehicle.
Wilkinson, Lawrence, and King [2007] reported on the accuracy of the maximum SDM-reported ∆Vs for General Motors vehicles involved in NHSTA frontal impact crash tests. They examined 23 tests, 21 of which were full-overlap, frontal impacts, 1 of which was an offset impact into a rigid barrier, and 1 of which was an offset and angled vehicle-to-vehicle collision. The offset impact into a rigid barrier was a 2003 Chevrolet Suburban, which impacted the barrier with 40% overlap at a speed of approximately 40 km/h (25 mph). The authors calculated the longitudinal ∆V for the test vehicle at the five locations in the vehicle (the front and rear sills on the left and right sides and the CG). There was a discrepancy between the left and right side ∆Vs that was consistent with the vehicle experiencing yaw rotation from the collision. The authors reported that the EDR-reported ∆V underestimated these ∆Vs by as much as 5.4 km/h and overestimated them by as much a 0.9 km/h. They report that lateral acceleration data was not available for this test. This would have precluded them from calculating the rotation rate from accelerometer data and resolving their calculated ∆V to the ACM location.
The offset and angled vehicle-to-vehicle collision involved the front of a 1997 Honda Accord traveling 56.6 km/h impacting the front of a 2000 Cadillac sedan traveling 55.9 km/h. The Cadillac was angled at 30 degrees relative to the Accord and there was approximately 50% overlap between the vehicles. For this test, both longitudinal and lateral accelerations were available and the total ∆V was calculated at 5 locations in the test vehicle (the front and rear sills on the left and right sides and the CG). The authors reported that the EDR-reported longitudinal ∆V under-reported the CG longitudinal ∆V determined from the accelerometers by 10.4 km/h (6.5 mph) and the CG resultant ∆V by 10.8 km/h (6.7 mph). This error was partially attributed to an EDR recording window that was too short. The authors also noted the effects of yaw rotation and a discrepancy in position between the CG and the ACM – the ACM was mounted under the right front seat of the Cadillac – but they did not correct for the effects of this in their comparison of the ∆Vs.
Gabler [2008] examined the accuracy of the EDR data downloaded from 48 crash-tested vehicles. Four of these were partial-overlap frontal impacts – three impacted a deformable barrier at approximately 40 mph with 40% overlap of the front end and the other impacted a pole at approximately 40 mph, with approximately 15% overlap. Gabler noted that for 14 out of the 48 tests that he examined, the recording window for the EDR was insufficient to capture the entire collision. The three test vehicles involved in the 40% overlap tests were among those with an insufficient recording window and this resulted in the EDRs significantly under-reporting the ∆Vs. In addition, these collisions induced significant yaw rotation of the test vehicles. Gabler did not account for discrepancies in position between the CG and the ACM, but in this instance, the short recording windows appeared to be a dominant factor that would not have been overcome through consideration of the yaw rotation. The EDR for the 15% overlap pole impact test had a sufficient recording window and the EDR-reported longitudinal ∆V in this test was within 6% of the actual.
These studies demonstrate that a discrepancy in position between the ACM and the vehicle CG, mixed with significant yaw rotation of the vehicle that results from the collision, can lead to significant errors (error source #5) if these factors are not incorporated into the analysis. This error source is likely to be encountered at times when reconstruction motorcycle collisions and the methods outlined in the following references should be utilized to account for them: Bundorf [1996], Marine and Werner [1998], Rose [2007], and Haight [2013a]. Since this error source can be accounted for in the analysis, it does not need to be included in the range on the ∆V for an uncertainty analysis. Thus, the presence of this error source does not necessitate any change to the proposed range on the ∆V.
Side Impacts
Haight, Gyorke, and Haight [2013b] reported analysis of a single side impact crash test of a 2013 Kia Rio, which was run by the IIHS. In this test, the stationary Kia was struck on the driver’s side at a 90-degree angle by a deformable barrier traveling 50 km/h (31.1 mph). Lateral accelerations were measured on the test vehicle, near the A and B pillars on the non-struck side of the vehicle. This impact did not induce significant yaw rotation of the Kia. The authors reported that “the lateral delta-V reported by the EDR Tool in this side impact test reasonably compares to the delta-V calculated using the IIHS accelerometer. The maximum delta-V calculated from the IIHS accelerometer is about 26.7 km/h (16.6 mph) while the maximum reported delta-V reported by the EDR tool is 25 km/h (15.5 mph).” This is an under-reporting by the EDR of 1.1 mph and an approximately 6.4% error. Thus, this is an instance where the test procedure does not induce significant rotation and the ∆V accuracy is well within 10%.
Tsoi, Johnson, and Gabler [2014] evaluated the accuracy of 75 EDRs from MY 2010 to 2012 Chrysler, Ford, General Motors, Honda, Mazda, and Toyota vehicles in side impacts. These vehicles were each subjected to side impacts with a moving deformable barrier (MDB) as a part of the NHTSA Side-Impact New Car Assessment Program (SINCAP). This test procedure involved the MDB impacting the stationary test vehicle at 62 kph (39 mph). The heading angle of the MDB is 90 degrees relative to the test vehicle, but the wheels are crabbed, such that the velocity of the MDB is angled 27 degrees relative to its heading. The reference ∆Vs were calculated at the vehicle CGs from the laboratory accelerometers on the vehicle. In describing this analysis, Tsoi et al noted that the vehicles in these tests experienced yaw rotation and they describe the equations they used to account for this rotation during calculation of the reference ∆Vs. Tsoi et al reported that the “EDRs underreported the reference lateral delta-v in the vast majority of cases, mimicking the errors and conclusions found in some longitudinal EDR accuracy studies. For maximum lateral delta-v, the average arithmetic error was -3.59 kph (-13.8%) and the average absolute error was 4.05 kph (15.9%).” Unfortunately, Tsoi et al do not appear to have used the laboratory accelerometer data to calculate the ∆Vs at the ACM positions for the vehicles, and so their reference ∆Vs are not directly comparable to the EDRreported ∆Vs. Tsoi et al acknowledged this as a possible error source in their study, but they believe the error would be small. However, given the results in Haight et al [2013a and 2013b], it seems to be an important error source to account for prior to reporting the “accuracy” of the EDRreported ∆Vs. For now, this study simply serves as another reminder to account for error source #5. Additional research could render additional insight and explanation for the results obtained by Tsoi et al.
The Ruth and Tsoi study from 2014, which examined the accuracy of EDR-reported ∆Vs for Kia and Hyundai vehicles from the model years (MY) 2010 to 2012, included 19 side impact tests. Again, this was prior to Kia and Hyundai’s full compliance with CFR 563. The side impact tests involved a moving deformable barrier impacting the vehicles at a speed of approximately 62 km/h (38.5 mph). The authors noted that “for the MDB tests, the center of gravity (CG), far side front and rear door sill, and rear floorpan sensors were reviewed. The values from these sensors varied as much as 20%. The CG sensor was chosen as the most comparable, but it should be noted that the principle direction of force (PDOF) vector does not pass through the CG in this test. The vehicle rotates counter clockwise during the test. An alternative measurement was evaluated, taking the momentum vector of the impacting cart, and the relative weights of the cart and test vehicle, and calculating the expected lateral Delta V. This correlated more closely with the EDR than the CG sensor.” The authors do not appear to have used the laboratory accelerometer data to calculate the ∆Vs at the ACM positions for the vehicles, and so their reference ∆Vs – whether from other sensors or from momentum analysis – are not directly comparable to the EDR-reported ∆Vs. Without such analysis being completed, not a lot of stock can be put on the differences between the EDR-reported and “actual” ∆Vs reported in this study. Instead, this study can be taken as another reminder of the importance of accounting for error source #5.
Carr, Rucoba, Barnes, Kent, and Osterhout tested passenger car EDRs on a HYGE crash simulation sled in various orientations designed to represent different principal directions of force (PDOF), not limited to those typical of standard crash test configurations [2015]. This is a useful study because it eliminated any error arising from yaw rotation, ACM location, deformation to or around the ACM, acceleration clipping, or an inadequate recording window. They performed direct comparison of the EDR-reported and actual longitudinal and lateral ∆Vs and also examined the possibility of accurately reconstructing the PDOF orientation from the combined longitudinal and lateral EDRreport ∆Vs. They reported that the maximum percentage error in the ∆V was less than 10%, with the average error magnitude for the various EDRs ranging between 0.3% to 4.3%. The magnitude of the errors was between 0 and 1 mph. They reported that the maximum PDOF angle error magnitude was 2.0 degrees.
The specific EDRs tested by Carr et al were from a 2012 Chevrolet Malibu, a 2012 Dodge Durango SXT, and a 2012 RAM 1500. Their test rig allowed the orientation of the EDRs to be swept through a range of yaw angles between -90 degrees (driver side leading) to +90 degrees (passenger side leading). The EDRs were tested throughout this range in angle increments of 22.5 degrees. They also tested the EDRs with pitch angles between 5 and 20 degrees in each direction. Each module was subjected to 13 simulated crash pulses with an actual ∆V of approximately 25 mph (40 km/h). This study appears to show that the magnitude of errors in the EDR-reported ∆Vs is not heavily dependent on direction of the collision force, at least for the modules in the study. One difference between the lateral and longitudinal ∆Vs for these tests was that the errors in the EDR-reported longitudinal ∆Vs were mostly in the direction of under-reporting, whereas the errors in the lateral ∆Vs appeared more distributed about zero, with both positive and negative errors occurring. This is consistent with these EDRs having a small positive acceleration bias along the longitudinal axis.
Collisions Involving Motorcycles
Beck [2006]: Beck, Casteel, Phillips, Eubanks, and English reported three staged collinear collisions involving an EDR-equipped passenger vehicle and a motorcycle. The passenger vehicle was a 2002 Chevrolet Cavalier weighing 2,650 lb. This vehicle was driven into a stationary, upright 1989 Kawasaki EX500 weighing 415 lbs and being “ridden” by a 160 lb dummy (a combined weight of 575 lb). The weight ratio between the Chevrolet and Kawasaki was approximately 4.6:1, including the weight of the dummy on the motorcycle. In the first test, the Chevrolet had an impact speed of approximately 12 mph. The peak longitudinal acceleration experienced by the Cavalier in this test was -1.7 g and the impact duration was approximately 186 ms. No event was recorded by the Cavalier’s EDR in this impact. In the second test, the Chevrolet had an impact speed of approximately 27 mph. The peak longitudinal acceleration experienced by the Cavalier in this test was -6.6 g and the impact duration was approximately 180 ms. A non-deployment event was recorded by the EDR. In the third test, the speed of the Chevrolet at impact was approximately 37 mph. The peak longitudinal acceleration experienced by the Cavalier in this test was -12.7 g and the impact duration was approximately 96 ms. A deployment event was recorded by the EDR. Comparing the ∆V from the EDR to that calculated from other instrumentation on the vehicle, Beck et al found that the EDR under-reported the actual magnitude of the ∆V by 0.86 mph and 0.53 mph for the second and third tests, respectively. These tests were setup in such a way that they focused on the longitudinal axis of the vehicle. The results of these two tests are consistent with the results for other low-severity tests (low-severity for the passenger vehicle, that is) in that the EDR-reported ∆Vs under-report the actual ∆Vs, but they are within the previously proposed potential error band of 1.5 to 2 mph. These two tests are included in Figure 3.
Conclusions
The studies related to the accuracy of EDR-reported ∆Vs in aligned, low-severity collisions are likely to be the most applicable to motorcycle-passenger vehicle collisions. These studies consistently show the EDRreported longitudinal ∆Vs under-reporting the actual longitudinal ∆V, generally by a magnitude of 2 mph or less – most of the time by a magnitude of 1.5 mph or less. This is confirmed by the results from Beck et al [2006], which were from motorcycle collisions with EDR-equipped vehicles. The results from Beck were within the same range of EDR-reported ∆V errors as the other low-severity studies. Based on these studies, a reasonable range on the actual longitudinal ∆V for the struck vehicle would have a lowend of the ∆V reported by the EDR and a high-end of 1.5 to 2 mph greater in magnitude than what is reported by the EDR. So, for example, if the EDR-reported longitudinal ∆V was -5 mph, the reconstructionist could apply a range for the actual ∆V between -5 and -6.5 mph. A reconstructionist could also use the EDR reported longitudinal ∆V as reported and this would result in a conservative (low) estimate of the motorcycle’s ∆V and impact speed. Based on the Carr et al study, a similar range could be applied to the EDR-reported lateral component of the ∆V, though perhaps the range should be centered on zero (±1 mph, for instance). When considering all of the error sources discussed in this article, the actual resultant ∆V can be higher or lower than the resultant EDR-reported ∆V. a. If there is no damage to the ACM or its attachment points and the surrounding structure is undeformed, then this can be ruled out as an error source in the EDR-reported ∆V (error source #6). b. If there is damage to the ACM or its attachment points, or if the surrounding structure is deformed, then there could be significant error in the EDRreported ∆V. While this error source is detectable, it is unlikely that the reconstructionist would be able to correct for it, and so, the EDR-reported ∆V will likely be unusable for the reconstruction. The precrash data can still be used in the reconstruction. a. Does the EDR report indicate that there was complete recording of the event? If so, then power loss prior to full recording can be ruled out (error source #7). b. If they are available in the EDR report, examine the graphical and tabular reporting of the longitudinal and lateral accelerations and cumulative ∆V. Do any of these exhibit flatlining at the peak acceleration? This may be an indication that the longitudinal or lateral accelerations exceeded the capabilities of the accelerometer in the ACM. If this flatlining is not present, then error source #4 can potentially be ruled out. c. Now, examine the recording window for the longitudinal and lateral accelerations and cumulative ∆V and the shape of the curves leading up to the end of this recording window. Error source #2 can be ruled out if the EDR-reported accelerations and ∆V reach a maximum and begins to decrease prior to the end of the recording window. If they continue to decrease through the end of the recording window, then error source #3 can be ruled out.
In addition, the analysis reported in this article has led us to the following considerations for incorporating struck vehicle EDR data into the reconstruction. These steps are specific to incorporation of the EDR data and are not all of the steps in a complete reconstruction. These steps will, of course, be interwoven with the rest of the investigation and reconstruction process. Not all of these steps will be necessary for every case.
1. If possible, during an inspection of the struck vehicle, physically examine the ACM and the surrounding structure (the floor or center tunnel, for instance) for damage or deformation. If the vehicle is not available, examine photographs and other information about the damage to the vehicle to determine if damage to or around the ACM is probable. Many motorcycle-to-car collisions will be of insufficient severity for the struck car to cause deformation or damage to or around the ACM.
2. Document the position of the ACM within the vehicle, if possible. Measure its position relative to an undamaged portion of the vehicle – the front or rear axle for instance. This measurement can be used in later analysis to determine the position of the ACM relative to the vehicle CG.
3. Examine the EDR report for the collision. Again, the steps listed below are not necessarily a comprehensive analysis of the EDR report, but just steps that specifically relate to the error sources discussed in this article.
4. Analysis could be performed to estimate the probable ∆V that occurred prior to AE. This analysis could potentially use an impact duration and peak acceleration from the EDR report. This analysis would allow the EDR-reported ∆V to be corrected for error source #1. That said, if a 1.5 to 2 mph range on the ∆V is a sufficiently tight range, then there is not a need to conduct this analysis. This range does not include the effects of yaw rotation of the vehicle and a discrepancy between the ACM position and the CG.
5. Incorporate a reasonable range for the struck vehicle ∆V with other analysis methods – conservation of momentum, analysis of the car and motorcycle deformation, and analysis of the struck vehicle’s post-impact translation and rotation. This more comprehensive ap- proach is described extensively in the companion paper to this one.
References
Beck, R., Casteel, D., Phillips, E., et al., “Motorcycle Collinear Collisions Involving Motor Vehicles Equipped with Event Data Recorders,” Collision Magazine 1(1): 82-96, 2006.
Bortles, W., Biever, W., Carter, N., and Smith, C., “A Compendium of Passenger Vehicle Event Data Recorder Literature and Analysis of Validation Studies,” SAE Technical Paper 2016-01-1497, 2016, https://doi. org/10.4271/2016-01-1497.
Bundorf, R.T., “Analysis and Calculation of Delta-V from Crash Test Data,” SAE Technical Paper 960899, 1996, https://doi.org/10.4271/960899.
Carr, L., Rucoba, R., Barnes, D., Kent, S., et al., “EDR Pulse Component Vector Analysis,” SAE Technical Paper 2015-01-1448, 2015, doi:10.4271/2015-01-1448.
Chidester, A., Hinch, J., Mercer, T., and Schultz, K., “Recording Automotive Crash Event Data,” Proceedings of the International Symposium on Transportation Recorders, Arlington, Virginia, 1999.
Code of Federal Regulations, 49 CFR 563 – Event Data Recorders, in effect as of September 1, 2012.
Comeau, Jean-Louis, German, Alan, Floyd, Donald, “Comparison of Crash Pulse Data from Motor Vehicle Event Data Recorders and Laboratory Instrumentation,” Proceedings of the Canadian Multidisciplinary Road Safety Conference XIV, Ottawa, Ontario, June 27-30, 2004.
Comeau, Jean-Louis, Dalmotas, Dainius, German, Alan, “Evaluation of the Accuracy of Event Data Recorders in Chrysler Vehicle in Frontal Crash Tests,” Proceedings of the 21st Canadian Multidisciplinary Road Safety Conference, Halifax, Nova Scotia, May 2011.
Comeau, Jean-Louis, Dalmotas, Dainius, German, Alan, “Event Data Recorders in Toyota Vehicles,” Proceedings of the 21st Canadian Multidisciplinary Road Safety Conference, Halifax, Nova Scotia, May 2011.
Correia, J., Iliadis, K., McCarron, E., et al., “Utilizing Data from Automotive Event Data Recorders,” presented at the Canadian Multidisciplinary Road Safety Conference XII, June 10-13, 2001.
Emori, R., “Analytical Approach to Automobile Collisions,” SAE Technical Paper 680016, 1968, https://doi. org/10.4271/680016.
Exponent Failure Analysis Associates, “Testing and Analysis of Toyota Event Data Recorders,” https://pressroom. toyota.com/article_download.cfm?article_id=3196, October 2011.
Gabler, H. Clay, Thor, Craig P., Hinch, John, “Preliminary Evaluation of Advanced Air Bag Field Performance Using Event Data Recorders,” DOT HS 811 015, August 2008.
German, Alan, Dalmotas, Dainius, Comeau, Jean-Louis, “Crash Pulse Data from Event Data Recorders in Rigid Barrier Tests,” Paper No. 11-0395, 22nd ESV Conference, Washington, D.C., June 2011.
[Haight, 2013a] Haight, S., Haight, R., “Analysis of Event Data Recorder Delta-V Reporting in the IIHS Small Overlap Crash Test,” Collision 8(2): 8-23, 2013.
[Haight, 2013b] Haight, R., Gyorke, S., Haight, S., “Hyundai and Kia Crash Data, The Indispensable Compendium: Section 2 – Crash Testing Involving Hyundai and Kia Vehicles,” Collision 8(2): 77-86, 2013.
Lawrence, J., Wilkinson, C., King, D., Heinrichs, B. et al., “The Accuracy and Sensitivity of Event Data Recorders in Low-Speed Collisions,” SAE Technical Paper 2002-010679, 2002, doi:10.4271/2002-01-0679.
Lawrence, J. and Wilkinson, C., “The Accuracy of Crash Data from Ford Restraint Control Modules Interpreted with Revised Vetronix Software,” SAE Technical Paper 2005-01-1206, 2005, doi:10.4271/2005-01-1206.
Lee, F., Xing, P., Yang, M., Lee, J., Wilkinson, C., Siegmund, G.P., “Behavior of Toyota Airbag Control Modules Exposed to Low and Mid-Severity Collision Pulses,” SAE Technical Paper 2017-01-1438, 2017, doi:10.4271/201701-1438.
Marine, M.C., Werner, S.M., “Delta-V Analysis from Crash Test Data for Vehicles with Post-Impact Yaw Motion,” SAE Technical Paper 980219, 1998, https://doi. org/10.4271/980219.
Niehoff, Peter, Gabler, Hampton C., Brophy, John, Chidester, Chip, Hinch, John, Ragland, Carl, “Evaluation of Event Data Recorders in Full System Crash Tests,” Paper No. 05-0271, 19th ESV Conference, Washington, D.C., June 2005.
Rose, Nathan A., Beauchamp, Gray, Bortles, Will, “Quantifying the Uncertainty in the Coefficient of Restitution Obtained with Accelerometer Data from a Crash Test,” SAE Technical Paper 2007-01-0730, 2007, https://doi. org/10.4271/2007-01-0730.
Rose, N., Bortles, W., Carter, N., Randolph, M., McDonough, S., “Motorcycle Accident Reconstruction: Incorporating EDR Data from the Struck Vehicle,” forthcoming from Collision, 2019.
Ruth, R. and Tsoi, A., “Accuracy of Translations Obtained by 2013 GIT Tool on 2010-2012 Kia and Hyundai EDR Speed and Delta V Data in NCAP Tests,” SAE Technical Paper 2014-01-0502, 2014, doi:10.4271/2014-01-0502.
Ruth, R. and Muir, B., “Longitudinal Delta V Offset between Front and Rear Crashes in 2007 Toyota Yaris Gen- eration 04 EDR,” SAE Technical Paper 2016-01-1496, 2016, doi:10.4271/2016-01-1496.
Ruth, R., “Applying Automotive EDR Data to Traffic Crash Reconstruction,” SAE Course #C1210, Course Slides.
Tsoi, A., Hinch, J., Ruth, R., and Gabler, H., “Validation of Event Data Recorders in High Severity FullFrontal Crash Tests,” SAE Int. J. Trans. Safety 1(1):2013, doi:10.4271/2013-01-1265.
Tsoi, A., Johnson, N., Gabler, H., “Validation of Event Data Recorders in Side-Impact Crash Tests,” SAE Technical Paper 2014-01-0503, 2014, https://doi.org/10.4271/201401-0503.
Vandiver, W., Anderson, R., Ikram, I., Randles, B., Furbish, C., “Analysis of Crash Data from a 2012 Kia Soul Event Data Recorder,” SAE Technical Paper 2015-011445, 2015, doi:10.4271/2015-01-1445.
Varat, M. and Husher, S., “Vehicle Impact Response Through the Use of Accelerometer Data,” SAE Technical Paper 2000-01-0850, 2000, https://doi.org/10.4271/200001-0850.
Wilkinson, C., Lawrence, J., Heinrichs, B., and Siegmund, G., “The Accuracy of Crash Data Saved by Ford Restraint Control Modules in Low-speed Collisions,” SAE Technical Paper 2004-01-1214, 2004, doi:10.4271/2004-01-1214.
Wilkinson, C., Lawrence, J., Heinrichs, B., and King, D., “The Accuracy and Sensitivity of 2003 and 2004 General Motors Event Data Recorders in Low-Speed Barrier and Vehicle Collisions,” SAE Technical Paper 2005-01-1190, 2005, doi:10.4271/2005-01-1190.
Wilkinson, Craig C., Lawrence, Jonathan M., King, David J., “The Accuracy of General Motors Event Data Recorders in NHTSA Crash Tests,” Collision Vol 2, Issue 1, 2007.
Wilkinson, C., Lawrence, J., Nelson, T., and Bowler, J., “The Accuracy and Sensitivity of 2005 to 2008 Toyota Corolla Event Data Recorders in Low-Speed Collisions,” SAE Int. J. Trans. Safety 1(2):420-429, 2013, doi:10.4271/2013-01-1268.
Xing, P., Lee, F., Flynn, T., Wilkinson, C., et al, “Comparison of the Accuracy and Sensitivity of Generation 1, 2 and 3 Toyota Event Data Recorders in Low-Speed Collisions,” SAE Int. J. Trans. Safety 4(1):172-186, 2016, doi:10.4271/2016-01-1494.


