
Called to SERVE
Book 2022-23
Budget
TYLER RANSFORMING
City of Tyler
FISCAL YEAR 2022 – 2023 BUDGET COVER PAGE
SEPTEMBER 14, 2022
This budget will raise more revenue from property taxes than last year’s budget by an amount of $2,038,668, which is a 7.54 percent increase from last year’s budget. The property tax revenue to be raised from new property added to the tax roll this year is $462,604.
The members of the governing body voted on the budget as follows:
Don Warren, Mayor Stuart Hene, District 1
Broderick McGee, District 2 Shirley McKellar, District 3
James Wynne, District 4
Bob Westbrook, District 5
Brad Curtis, District 6
The total amount of outstanding municipal debt obligations secured by property taxes is $0.
Debt service requirements for FY 2023, including principal and interest, are $0 for obligations paid by property taxes and $127,230,000 for obligations paid by utility charges, $8,840,000 for obligations paid by Hotel Occupancy Taxes, and $465,000 for obligations paid by customer facility charges. Additions detail for the City’s debt obligations, including future year’s payment requirements, is included later in the budget document.
Budget cover page
Tax Rate Comparison Property Tax Rate: $0.261850/100 $0.269000/100 No-New-Revenue Tax Rate $0.244811/100 $0.255752/100 No-New-Revenue Maintenance & Operations Tax Rate: $0.244811/100 $0.255752/100 Voter-Approval Tax Rate: $0.261850/100 $0.277539/100 Debt Rate: $0.000000/100 $0.000000/100 2022-2023 2021-2022
Property
For: Against: None Present and not voting: None Absent: None
GOVERNMENT FINANCE OFFICERS ASSOCIATION

Distinguished Budget Presentation Award
PRESENTED TO City of Tyler
Texas
For the Fiscal Year Beginning
October 01, 2021
Executive Director

Budget Award

Contents From Our Mayor 8 City Council 9 Tyler Profile 10 City Profile 11 Local Economy 12-13 Largest Area Employers 14 Long-term Financial Planning 14 Relevant Financial Policies 14 Major Initiatives 15-16 Awards and Acknowledgments 16 Manager's Message 17 From the City Manager 18 Executive Summary 19 Staffing, Compensation and Benefits 19 Strategic Tax Management 19 Funding for Outside Agencies 20 Debt Services Fund 20 General Projects Fund 20 Street Improvement Fund 20 Tourism and Convention Facilities Fund 20 Hotel/Motel Occupancy Tax Fund 21 Water Utilities Fund 21 Solid Waste Fund 21 Airport Fund 22 Fleet Maintenance Fund 22 Major Budget Revenues and Expenditures 22 Organizational Chart 23 Reader's Guide 24 Budget Process 25-29 Budget Calendars 30 Financial Policy 31-33 Investment Policy 34-42 Citywide Strategic Plan 43-46 Budget Summary All Funds 47 Combined Statement of Revenues and Expenditures - All Funds 48 Major Revenue Sources 49-54 Position Summary All Funds 55-57

Contents General Fund 58 General Fund (101) 59 Revenues, Expenditures and Changes in Fund Balance 59 General Fund Revenues 60-62 General Fund Expenditures 63 City Manager's Office 64-65 Finance Services 66-67 Legal Services 69 Communications Services 70-71 Human Resources Services 72-73 Police Department 74-78 Fire Department 79-80 Tyler Public Library 81-82 Parks and Recreation 83 Parks Administration and Maintenance 84 Indoor Recreation 85 Outdoor Recreation 86 Median Maintenance/Arborist 87 Engineering Services 88-89 Street Services 90-91 Traffic Engineering 92-93 Animal Services 94-95 Municipal Court 96-98 General Capital Project Funds 99 Revenues, Expenditures and Changes in Fund Balance (102) 100 Revenues, Expenditures and Changes in Fund Balance (103) 101 Development Services Fund 102 Development Services Fund (202) 103 Revenues, Expenditures and Changes in Fund Balance 103 Building/Development Services 104-105 Planning 106-107 Water Utilities Fund 108 Utilities Fund (502) 109 Revenues, Expenditures And Changes in Working Capital 109 Revenue Detail 110 Utilities Fund (503) 111 Revenues, Expenditures And Changes in Working Capital 111 Storm Water Management (575) 112 Revenues, Expenditures And Changes in Working Capital 112

Water Utilities 113-114 Water Administration 114-115 Water Office 115-116 Water Distribution 117-118 Water Plant 118 Waste Collection 119 Wastewater Collection 120 Waste Treatment 120-121 Lake Tyler 122 GIS 122-123 Purchasing 123 Consent Decree/Capacity, Management, Operations, and Maintenance 123 Fire Services 123 Storm Water 125 Solid Waste Fund 126 Solid Waste Fund (560) 127 Revenues, Expenditures and Changes in Working Capital 127 Detail Revenues 128 Solid Waste Capital Fund (562) 129 Revenues, Expenditures and Changes in Working Capital 129 Solid Waste & Code Enforcement 130-135 Solid Waste Administration 131 Solid Waste Residential Collection 132 Solid Waste Commercial Collection 133 Solid Waste Code Enforcement 133-134 Solid Waste Litter Control, Keep Tyler Beautiful 134-135 Airport Fund 136 Airport 137 Airport Operating Fund (524) 138 Revenue Detail 139 Customer Facility Charge 140 Hotel Tax Fund 141 Hotel/Motel Occupancy Tax Fund (211) 142-143 Other Funds 144 Cemeteries Operating Fund (204) 145-146 Cemeteries Trust Fund (713) 146 Police Forfeiture Fund (205) 147 Park Improvement Fund (206) 148 Contents

Contents Court Special Fee Fund (207) 148-149 Fiscal Year 2022-2023 148 Court Technology 149 Municipal Court Security 149 Partners for Youth 150 Jury 150 Court Efficiency Fund 150 Economic Development Fund (208) 151 TIF/TIRZ #4 (217) 152 TIF/TIRZ #3 (218) 152 Tourism and Convention Fund (219) 153-157 Airport Passenger Facility Fund (234) 158 Rainy Day Fund (235) 159 PEG Fee Fund (236) 160 Neighborhood Services 161 Home Ownership/Housing Fund (274) 162 Housing Assistance Payments Fund (276) 163-166 Community Development Grant Fund (294) 167-170 Home Grant Funds (295) 171-172 Metropolitan Planning Organization (MPO) Grant (285) 172-174 Tyler Transit 175 Tyler Transit System Fund (286) 176-178 Productivity Improvement Fund (639) 179-181 Vehicle Equipment Services 182 Fleet Maintenance and Replacement (640) 183-185 Risk Fund (650) 186-187 Employee Benefits Fund (661) 188-189 Retiree Benefits Fund (761) 190-191 Property and Facilities Management Fund (663) 192-194 Information Technology (671) 195-196 Combined Debt Services 197 Customer Facility Charge Revenue Bonds Series 2013 199 Hot Debt Service Fund (302) 199 Hotel Occupancy Tax Revenue Bond Series 2021 200 Utilities Debt Service Fund (504) 201 Revenues, Expenditures, and Changes in Working Capital 201 Utilities Debt Reserve Fund (505) 202 Revenues, Expenditures, and Changes in Working Capital 202 Water and Sewer Revenue Debt Retirement Data 203 Water and Sewer Revenue Bonds 204 Water and Sewer Revenue Refunding Bonds 204 Water and Sewer Revenue Bonds 205-209 Adopting Documents 209 Glossary 216
DON WARREN Mayor
Dear Friends & Neighbors,
I am proud of our City and excited about how we are building and investing in enhancements to services and infrastructure that will improve our quality of life for decades to come. Together, we are transforming Tyler into a nationally known community with a robust business environment, quality medical care, excellent educational institutions, and beautiful public spaces and neighborhoods.
The City’s progress and transformation are part of a larger plan, “Tyler 1st.” We focus on the outcomes for our future generations as we prioritize capital programs and activities.
Importantly, transforming Tyler requires us to focus on our facilities. After decades of hard work by many mayors, councilmembers and staff, the W. T. Brookshire Convention Center will open in the first quarter of 2023.
Improving our public spaces is important for residents and visitors alike. We renovated

the softball fields at Lindsey Park, redeveloped Pollard Park, and upgraded Winters Park. Transforming the parks is now possible with dedicated funds for maintenance and improvements collected from landfill fees. With collaboration between departments, we will also completely renovate neighborhood parks Noble E. Young and P.T. Cole.
Our community is enjoying tremendous growth, and with growth comes challenges with traffic. In 2021 we installed the Advanced Traffic Management System, a more reliable and safer traffic signal system for the residents of Tyler. This year we replaced 14 of the 149 existing traffic signal cabinets, including battery backups. The upgrades replaced equipment that was past its life span. We will also retime 19 traffic signals remotely for the first time, allowing for quicker implementation and less staff time in the field.
Finally, Tyler has a bright future and a rich history that is vital to
preserve as we transform our City for the future. I understand our historic brick streets tie to our character and sense of history. We developed a more extensive brick street repair program last fiscal year and continued this year to maintain them for future generations.
Transformation in taking place in our community. The Tyler of tomorrow will enhance what we see today. These changes are intentional, true to us and the Tyler spirit. What will never change is the feeling you have when you live here. The feeling that you are home.
I am proud to be your neighbor. I am proud to be your Mayor.
Don Warren Mayor | City of Tyler, Texas
From
mayor
our
8
DISTRICT 2 WEST
District 2 is located on the west side of Old Jacksonville Highway between Districts 1 and 3, and includes the annexed Tyler Pounds Regional Airport. It is home to Tyler’s burgeoning tech sector and our vibrant downtown entertainment district.
DISTRICT 1 CENTRAL
District 1 is located between Old Jacksonville Highway and South Broadway Avenue in the southern part of the city. It is home to several miles of hiking and biking trails, including those at Faulkner Park and the newly developed Legacy Trails trailhead.
DISTRICT 3 NORTHWEST
District 3 is located on the northwestern bounds of the city limits. Rich in history, it is home to the Texas College campus, the oldest institution of higher education in Tyler.
DISTRICT 4 NORTHEAST
District 4 is located on the northeastern side of Tyler between McDonald Road and East Gentry Parkway. It is home to Tyler’s historic Azalea District, Bergfeld Park and Amphitheater, Brick Street Village, and the newly renovated Hillside Park.
DISTRICT 5 EAST
District 5 is located south of McDonald Road and east of Paluxy Drive. It houses both The University of Texas at Tyler and Tyler Junior College, which bring more than 10,000 students to Tyler annually.
DISTRICT 6 SOUTH
District 6 is located between Paluxy Drive and South Broadway Avenue. It is home to the Village at Cumberland Park, Tyler’s newest restaurant and retail destination. It houses the popular Southside Park and Rose Rudman Recreational Trail, one of the most utilized trails in Tyler.
city council
COUNCIL
Distr ct 1 Central Stuart Hene District 6 South Brad Curtis District 4 Northeast James Wynne District 3 Northwest Shir ey McKellar Distr ct 5 East Bob Westbrook District 2 West Broder ck McGee TroupHwy Cha d er H y WGenryPkwy S Fa k on Hwy F S y Hwy 155N S G nw oo B vd FM 14 T o Hwy Hwy271 Hwy64E W Tol 49 P x E G de B d E G an B d SGenwood Bvd G Pk 1Hwy 55N S B ckh m A v E M S W E n S FM 50 N o 2 W F on S Hwy110 N FM 34 W 4 h S N G n w d B m E M K g B W M K g B Od Hendeson Hwy E Ma n Chu hA e G d vd H y 31 E E4thSt S G enwo d B d B o d a v FM850 S oa w y A Sp r124 B k A v S V ne Av G d B S o o 2 W M S H 31 W HMin wy N o w a A e S S u h a L p 3 3 ES uthe st Loop 323 S h L 323 S S h w e L o 2 3 W So h Lo 323 S S 3 M 56 Ea Camp y E Ge y Pkw E No h as oop 323 E p Pkw Hw 110 S E No h as oop 323 H y110N H y 64 W ETol49 Hw 9 S Hw 6 S a e 2 H y 3 W N w s L 3 N N o h o 3 2 Hwy271 Hwy 155S ESo thea tLoop323 FM848 WN thwe tLoop323 WNothwe tLo p323 Hwy69 N Hwy69 N N N e o p 3 FM 8 8 ETol 49 n e s e 20 W e s a W Hwy69N FM 27 7 µM p L g d C ty f Ty Council Districts M D 2 M S R D -C D
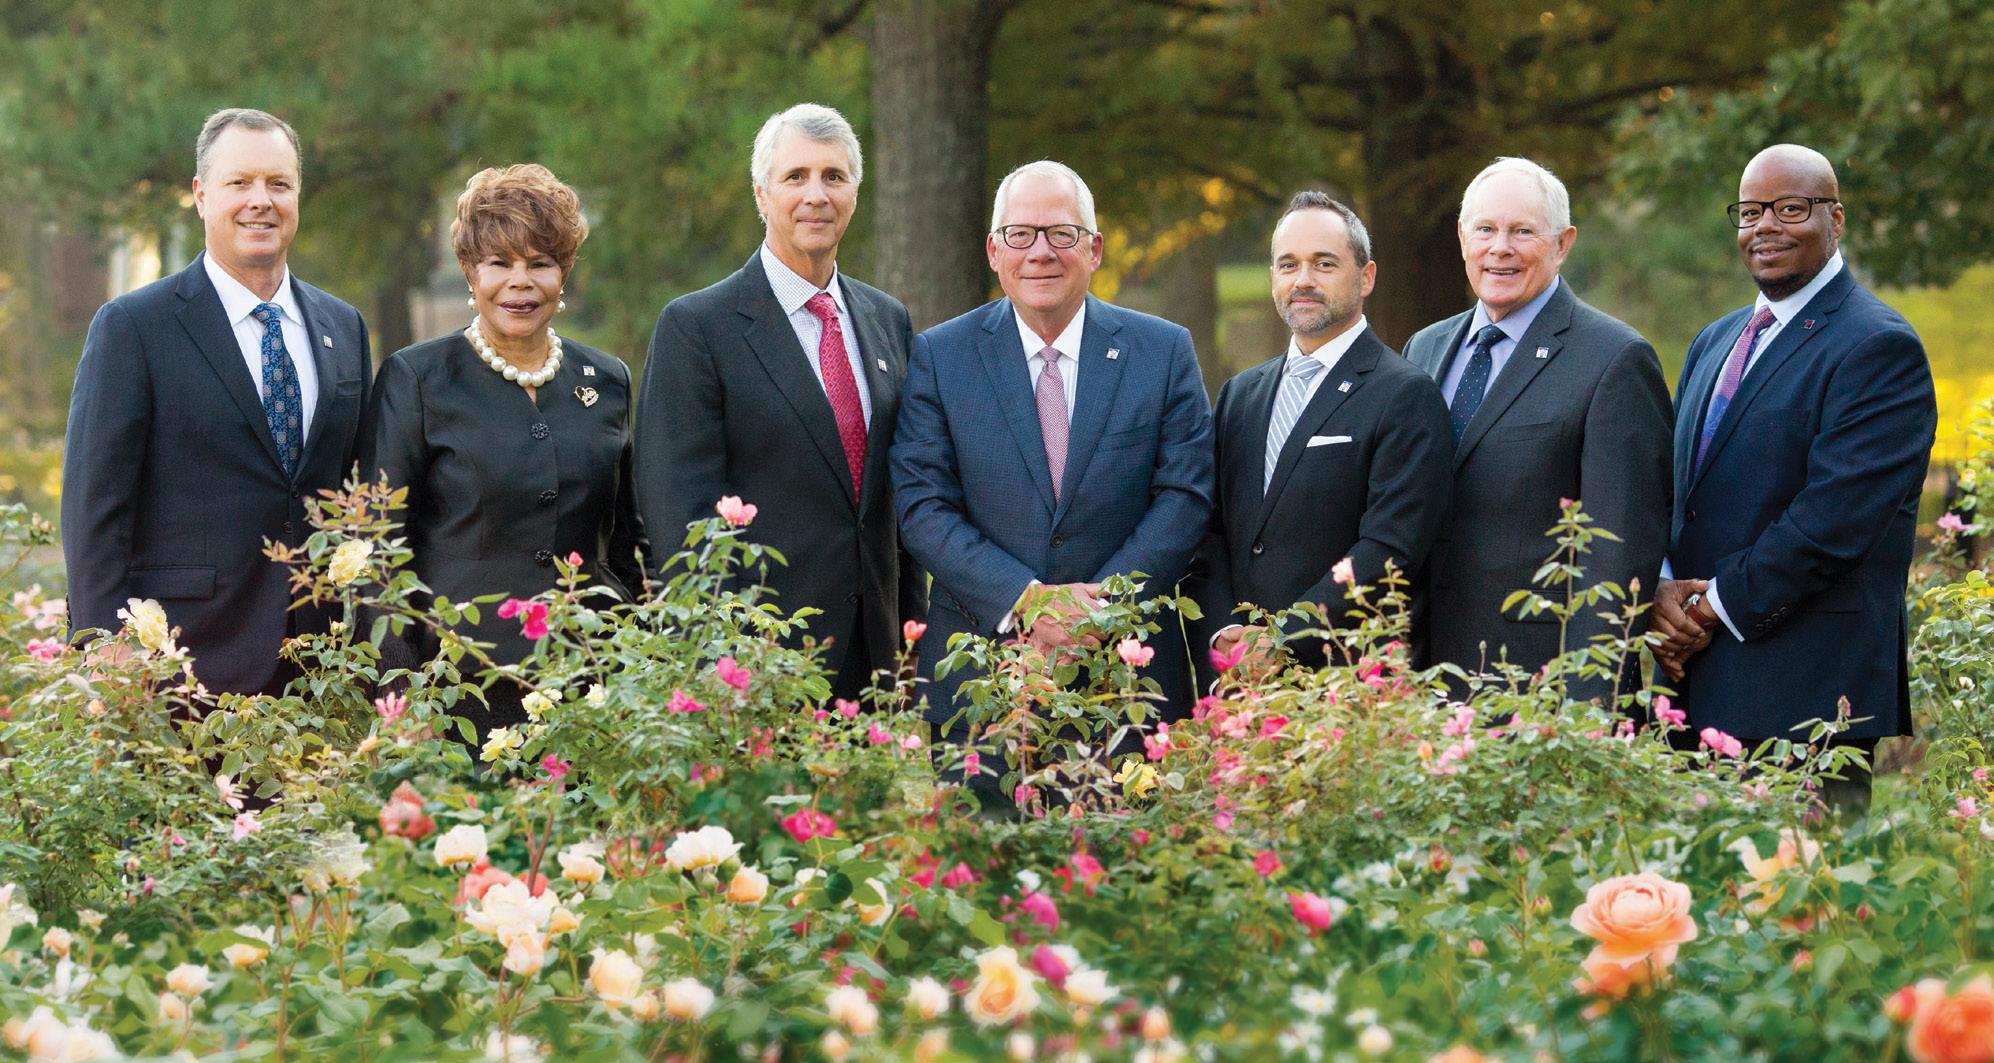
Left to Right: Brad Curtis, District 6; Shirley McKellar, District 3; James Wynne, District 4; Don Warren, Mayor; Stuart Hene, District 1; Bob Westbrook, District 5; and Broderick McGee, District 2
City
9
Profile TYLER

PROFILE City

The City of Tyler, Texas, the county seat of Smith County, is considered the advanced manufacturing, health care, educational and retail center of East Texas. Tyler is located on U.S. Highway 69 just south of Interstate 20 equal distance (approximately 90 miles) between the cities of Dallas, Texas and Shreveport, Louisiana. The City, encompassing approximately 53 square miles, had a 2020 census population of 105,995, which is a 9.38% increase from the 2010 census population of 96,900. Currently, the City’s population is estimated to be 104,798. The City is commonly referred to as the City of Roses.
The City, incorporated in 1850, is a home rule city operating under the Council-Manager form of government. The City Charter was adopted on February 9, 1937. The home rule corporation status is granted under the Constitution and Laws of the State of Texas. The City Council is comprised of the Mayor and six Council members who function as the policy-making body of the City’s government, determining the overall goals, objectives and direction for City services, and adopting the annual operating budgets for all City departments. The City Manager is appointed by the City Council and is responsible for the daily management and implementation of policy of the City including appointing the various key leaders and department heads. The Mayor and Council members serve twoyear terms, with general Council elections occurring each year based on district. The mayor is elected at large; the remaining Council members are elected by district.
The City is a full service municipality. Major services provided under general government and enterprise functions are: police and fire protection, water and sewer services, sanitation services, parks and recreational facilities, library
services, street improvements, capital projects administration, municipal court, animal services, code enforcement, development and planning services and general administrative services. The City also offers an airport and a convention center. Internal services of the City, accounted for on a cost reimbursement basis, are the fleet services operations; technology services; property and facility management services; productivity pool; risk management services and the active and retired employee health and dental coverage. The Basic Financial Statements of the City include all government activities, organizations and functions for which the City is financially accountable including blended component units as defined by the Governmental Accounting Standards Board (GASB).
The City Charter provides that the City Council shall adopt by ordinance an annual budget prepared by the City Manager. This budget is presented to the City Council and opportunities are provided for public comment during a series of public hearings before adoption. Budgetary control has been established at the individual fund level. The City Manager is authorized to transfer budgeted amounts between line items and departments within any fund; however, any revisions that alter the total revenues or expenditures of any fund must be approved by the City Council. Although the budget is adopted at a fund level, continued line item review and forecasting is done on a monthly and quarterly basis throughout the fiscal year to ensure compliance with the budget and completion of projects.
Tyler ProfilE 11
ECONOMY Local
The information presented in the budget document is perhaps best understood when it is considered from the broader perspective of the specific environment within which the City operates. The chief industries in and around Tyler include: health care and research; education; grocery distribution; retail and retail distribution; air conditioning unit manufacturing; cable, internet and phone services; government services; engineering services; banking services; meat packing and processing; cast iron pipes and fitting manufacturing; oil and gas refining; ready mix concrete production; tourism; and growing and shipping rose bushes. This diversification is evident in the fact that no single taxpayer represents more than 2.60% of assessed valuation in the City.
Four institutions of higher education are located in Tyler. They are The University of Texas at Tyler, The University of Texas Health Science Center, Texas College, and Tyler Junior College. Primary and secondary education is provided by several public school districts, three charter schools as well as ten private / parochial schools in the Tyler area.
Tyler is also the medical center of East Texas with three hospitals and numerous other supporting clinics, practices and specialty hospitals. Additionally, Tyler has many tourist attractions. The Texas Rose Festival includes the crowning of the Rose Queen attracting a large number of visitors each year. The Azalea Trails in the spring attracts additional tourism. Each September Tyler hosts the East Texas State Fair for one week providing midway, craft and 4H activities. Tyler State Park is located just north of Tyler and provides nature trails and camping in a scenic setting. Lake Tyler and Lake Tyler East, located twelve miles southeast of the City, are popular recreational and fishing sites.
The City actively works with the Tyler Economic Development Corporation and local industries to encourage expansions and relocations to our community. Two TIF/TIRZ zones were created in 2008, one in the downtown area and another in north Tyler in coordination with revitalization efforts. In fiscal year 2016, the downtown TIF/ TIRZ was dissolved due to value falling below the initial baseline. This was due to governmental agencies purchasing of properties and housing units receiving favorable tax exemptions. In October 2016, the city began the process for creating the new downtown TIRZ. In February 2018, the interlocal agreements were approved
by City Council creating zone 4. Land is available for development; the area has an abundant water supply and typically mild weather. The Tyler area cost of living index has consistently been 90-96% of the national average for the past five years. Economic incentives as well as historic preservation incentives are available to facilitate business expansions or relocations.
Because of its location in a region with a varied economic base, unemployment is relatively stable, and in the last five years while trending with the State of Texas has remained consistently below the national average. During the past ten years, the unemployment rate has ranged from a low of 3.2 percent (2019) to a previous decade high of 7.8 percent (2012), only to end at the current rate of 3.5 percent. This figure indicates a decrease of 0.1 % under the prior year while remaining in line with the State and National trends. The total workforce for the Tyler region has increased from 48,106 in 2010 to 50,674 in 2019.

Tyler ProfilE
12
WORKFORCE BREAKDOWN
Smith County/Tyler MSA
Population growth in the last five years has outpaced previous periods. The population grew 10 percent from 1990 to the year 2000. From the year 2000 to 2010 the population grew 16 percent. From 2010 to the current year, the growth has been an astounding 6 percent. Market and economic analysts estimate that as many as 270,000 people come to Tyler each day to work, attend school, seek medical services, or shop. Loop 49 Toll Project is complete from State Highway 110 to I-20 to the west of Tyler. Loop 49 Toll will create a horseshoe loop around Tyler connecting the City’s southern regions to I-20. The loop allows for increased traffic from I-20 into the City of Tyler for shopping and economic development purposes.
Along with the Loop 49 project, the Northeast Texas Regional Mobility Authority was authorized in 2004 to construct, operate and maintain turnpike projects in the state which includes the Tyler area. Including various other means of interstate access, the Tyler Pounds Regional Airport allows for secure and efficient air travel in and out of the region. Total flight enplanements have declined due to COVID-19 from 72,509 in 2011 to a current level of 40,179 in 2021. Tyler is the first Certified Retirement City in Texas. Tyler meets high standards for retiree living such as low cost of living, low crime rate, quality health care, abundant recreation and educational opportunities. Tyler is 16th in the nation for cost of living in Retirement Places Rated: Special Millennium Edition.
State Government 4% Local Government 9% Natural Resources, Construction and Mining 6% Manufacturing 6% Wholesale Trade 5% Retail Trade 13% Transportation and Warehousing 5% Information 1% Financial Activities 4% Professional and Business Services 10% Education and Health Services 22% Leisure and Hospitality 10% Other Services 4% Federal Government 1%
Tyler ProfilE 13
ECONOMY CONT. Local
LARGEST AREA Employers
FINANCIAL PLANNING Long-Term
Within the policy guidelines set by the Council for budgetary and planning purposes, the City of Tyler maintains an unassigned fund balance greater than 15 percent of total General Fund expenditures less transfers. In addition to the Capital Projects Fund, the City takes advantage of half cent sales tax (4B) dollars to pay for capital projects related to street improvements, drainage projects, park improvements and other projects as approved by the corporation board and the City Council. By paying cash for infrastructure projects, the City has attained its goal of eliminating general obligation debt as of February 2008.
The City has continued to maintain the lowest property tax rate for mid to large-sized cities in
Texas in an effort to balance citizen desire for lower property tax rates and the City’s need to match operating costs associated with future planning initiatives. Sales tax has played a large role in allowing the City to obtain this objective with a ten year average increase of 5.03 percent. However, such a large dependence has caused budgeting constraints and all other sources of revenues will need to be reviewed in order to stabilize the cities revenue stream in the future. By maintaining an adequate reserve and monitoring future economic conditions, the City plans to continue to provide for future citizen needs in a streamlined and cost effective manner.
FINANCIAL POLICIES Relevant
Multiyear forecasting is used as a part of the revenue and expenditure budgeting process in order to realize all potential budgetary gains during restricted budgetary cycles. An OPEB trust was created in fiscal year 2009 to separate and invest the dollars related to retiree benefits in order to realize a greater rate of return while maintaining fiduciary responsibility and security of principal.
Tyler ProfilE EMPLOYER PRODUCTS/SERVICE EMPLOYEES CHRISTUS Trinity Mother Frances * Medical Care 3,850 UT Health East Texas * Medical Care 3,550 Tyler Independent School District Education 2,550 Sanderson Farms USDA Meat Processing 1,850 Walmart Retail 1,500 Trane Technologies Air Conditioners 1,450 UT Health Science Center at Tyler Education 1,450 Brookshire Grocery Company Grocery Distribution 1,450 The University of Texas at Tyler Education 1,200 Altice USA Cable, Internet, Phone 1,150 Tyler Junior College Education 1,000 Target Distribution Center Retail Distribution 1,000 John Soules Foods USDA Meat Processing 900 Smith County Government 850 Source: Tyler Economic Development * Headquarters located in Tyler.
14
INITIATIVES Major
TYLER 1ST
Tyler’s rapid growth and potential for change make this the critical moment for a new comprehensive plan to guide and shape future development. The comprehensive plan, entitled Tyler 1st, was adopted in late 2007 and sets out a strategic framework for making decisions about the longterm physical development of Tyler. It defines a vision for the future linked to overall goals and policies, and it contains strategies and action items for achieving those goals. During the planning process, residents and others with a stake in Tyler’s future had the opportunity to articulate and review community values and goals through public discussion, create a vision for the kind of place they want Tyler to be for their children and grandchildren, and identify the key areas where the city must act -- both to preserve enduring character and to shape change so that their vision for Tyler’s future can be achieved.
Tyler 1st provides policy and strategic guidance on the physical development and redevelopment of the City; guides the City to actively seek positive change and deflect negative change, rather than simply react to change; provides predictability for developers, businesses and residents; helps the City save money because it plans for orderly investment in services, facilities and infrastructure; and helps Tyler preserve the sense of place and identity that make it unique.
UPGRADED BOND RATING
The City of Tyler received an upgrade to AAA for general obligation indebtedness by Standard and Poor during 2009. This rating increase was due in part to the current pay as you go environment and elimination of general obligation bond debt. Additional planning initiatives that the City began during 2009 include a Lean Sigma program for standardizing and reducing costs as well as continued multiyear planning which includes replacement funding for fleet acquisitions, HVAC replacement and roof replacements. This rating was reaffirmed in 2014.
INDUSTRY GROWTH INITIATIVE
In May 2010 an unprecedented joint meeting was held between the Tyler City Council and several community boards, the Tyler Industry Growth
Initiative (IGI) was formally adopted as a shared vision for Tyler’s strategic economic growth in the next 20 years.
Boards represented include the Tyler City Council, Smith County Commissioner’s Court, Tyler Independent School District Board of Trustees, Tyler Junior College Board of Trustees, the Tyler Metro Chamber of Commerce and the Tyler Area Chamber of Commerce. Also represented at the meeting were members of the Leadership Roundtable, including the University of Texas –Tyler, UT Health Science Center, Texas College, East Texas Medical Center Regional Healthcare System, the Tyler Economic Development Council, Trinity Mother Frances Hospitals and Clinics, and others.
In early 2009, Mayor Barbara Bass and Senator Kevin Eltife brought together a group of community leaders to discuss shared issues facing the city and region. The first item addressed by the Leadership Roundtable was the need to market Tyler and to determine the industries that made the most sense for Tyler to pursue given our unique characteristics. Consequently, the Leadership Roundtable began the development of the Industry Growth Initiative in mid-2009. The report recommends 10 primary building blocks that Tyler should develop to foster an Innovation Economy and take the Tyler region into the next 20 years of economic prosperity and growth. The 84 page report, which was commissioned and funded by members of the Leadership Roundtable, contains strategic tactics focused on achieving an Innovation Economy which brings higher paying jobs, economic growth, job creation and a higher standard of living.
The plan calls for the launch of a public private partnership that evolves from the Leadership Roundtable that will oversee the implementation of the strategies. Building blocks toward the Innovation Economy include strategies focused on Higher Education, Healthcare and Bio-Med, Tourism, Arts and Entertainment, 21st Century Energy, Retiree, Infrastructure, Graduate Education and 21st Century Transportation.
The draft plan was completed in December 2009 and vetted with community stakeholders. The plan was amended based upon that feedback adopted in May 2010 by boards representing the entire community.
Tyler ProfilE
15
VETERAN AND MILITARY GROWTH INITIATIVE
Tyler has a long history of strong support for our nation’s veterans. In 2011, to continue to grow this tradition and to serve as a model to other communities, the City appointed a Mayor’s Veterans’ Roundtable. The intent of the Roundtable was to develop and implement a Community Blueprint for supporting and enhancing veterans’ services in our community as well as positively impacting the local economy. The Roundtable focuses on employment, education, housing, medical care and mental health.
There is universal support for our warriors and families, and nonprofit services have grown and improved in Tyler and in communities across America. Still, there remain significant gaps that can only be filled by more focused planning and coordination. The Blueprint created by the Veterans’ Roundtable works to address these gaps in a way that is specific to the Tyler community. The goal is to provide a forum to learn and share best practices and to bring key stakeholders together to collaborate in assisting those who have served our country.
One of the outcomes of the Veterans’ Roundtable is the Veteran and Military Growth Initiative (VMGI). The VMGI outlines more than 40 strategies and tactics for veteran-focused
community growth, making a strong case for how implementation will bring fresh dollars into Tyler/Smith County and cement Tyler’s reputation as the “capital of East Texas,” but, most importantly, to demonstrate our neverending support of our veterans and our respect for the sacrifices they have made to serve this country.
We are proclaiming Tyler a Purple Heart City and honoring those who have been so brave in defending our freedoms.
JOINT FINANCIAL TASK FORCE
Smith County Judge Nathaniel Moran and Former Tyler Mayor Martin Heines proposed a task force that would meet quarterly to discuss ways that the county and city can work together to save money. That would mean looking critically at places where both governments are providing services to the same people. The county and city would each appoint three people to the task force. The members include the Mayor, the City Manager, and the Chief Financial Officer for the city. The Smith County Judge, the County Auditor, and the County Administrator will represent the county.
AND ACKNOWLEDGMENTS Awards
The Government Finance Officers Association (GFOA) awarded a Certificate of Achievement for Excellence in Financial Reporting to the City for its comprehensive annual financial report for the fiscal year ended September 30, 2020. This is the thirty-fifth consecutive year that the government has received this prestigious award. In order to be awarded a Certificate of Achievement, a governmental unit must publish an easily readable and efficiently organized comprehensive annual financial report whose contents conform to program standards. Such reports must satisfy both generally accepted accounting principles and applicable legal requirements. A Certificate of Achievement is valid for a period of one year only. In addition, the City has received the Government Treasurer’s Organization of Texas (GTOT) Investment Policy Certificate of Distinction for the
annually adopted investment policy of the City for six consecutive periods. The award is valid for a two year period. In order to qualify for the award, the City must demonstrate compliance with the State investment act and fiscal responsibility of their investments.
For sixteen years in a row, the City of Tyler has been presented with the Distinguished Budget Presentation Award from the Government Finance Officers Association of the United States and Canada. This award assures that state and local governments prepare budget documents of the very highest quality that reflect both the guidelines established by the National Advisory Council on State and Local Budgeting and the GFOA’s best practices on budgeting.
Tyler ProfilE
16
Message MANGER’S

EDWARD BROUSSARD City Manager


We continue to build a strong community focused on the quality of life for our residents, businesses and visitors.
Transforming Tyler for the future requires us to keep investing in our employees, services, programs, and partnerships that fulfill the needs of our vibrant community.
TEAM Executive
It is no secret that appraisal values in Texas and across the nation have soared. The change in taxable values Tyler experienced is the largest increase in more than a decade. This has allowed the City of Tyler to both decrease the property tax rate while raising the revenue necessary to continue the high standard of service delivery. Every dollar collected from property tax levies is used for operations for the public. Every penny paid by our residents is used toward maintenance and operations of vital public services- particularly public safety such as police and fire.
This year, we also adjusted the water rate structure to provide greater fairness and equity while more accurately capturing the cost to provide water services to our City. Tyler was one of the last cities in the state to have a water
rate structure not based on water conservation, which this new rate now promotes.

Transforming Tyler requires us to invest in our employees, improve efficiency, implement new initiatives, and provide our public servants the resources they need to build the future we want. This report is a testament to their dedication and commitment to enhance the quality of life for all residents of Tyler.
As always, we remain “Called to SERVE” our community,
Edward Broussard City Manager | City of Tyler, Texas


 Dear Honorable Mayor, City Council Members and Residents of Tyler,
INFORMATION
BENNY YAZDANPANAHI
CHIEF
OFFICER
JULIE GOODGAME DIRECTOR OF MARKETING AND COMMUNICATION
DEVELOPMENT
REGINA MOSS DIRECTOR OF ORGANIZATIONAL
LEROY SPARROW DIRECTOR OF SOLID WASTE, TRANSIT AND VES
LEANNE ROBINETTE DIRECTOR OF PARKS AND RECREATION
KATE DIETZ DIRECTOR OF UTILITIES
DEBORAH PULLUM CITY ATTORNEY
DAVID COBLE FIRE CHIEF
KEIDRIC TRIMBLE CHIEF FINANCIAL OFFICER
JIMMY TOLER POLICE CHIEF
Manager’s Message 18
HEATHER NICK ASSISTANT CITY MANAGER STEPHANIE FRANKLIN DEPUTY CITY MANAGER
SUMMARY Executive
STAFFING, COMPENSATION AND BENEFITS
In fiscal year 2022-2023 budget, the City added two fire recruits, one lab analyst, one transit manager, one transit assistant manager, and two full time positions for conference center grounds.
COMPENSATION
The City of Tyler continues to maintain a low employment turnover rate. We attribute the success of recruiting and retaining our highly skilled workforce to a progressive work environment with an emphasis on training, including programs such as City University and Leadership Academy, and our outstanding compensation and benefits package. The City continues to focus on preserving our greatest resource, our employees, by providing them with the tools they need to perform the job our citizens expect. Funding is included in the FY 2021-2022 Annual Operating Budget for:
• An increase in base pay of 5 percent for all civil service employees;
• An increase in base pay of 5 percent for all non-civil service employees based o n merit;
• A shock adjustment to base rates for each pay grade excluding civil service;
• Sick Leave Buy Back Program.
STRATEGIC TAX MANAGEMENT
BENEFITS
The City of Tyler has successfully funded the employees’ health insurance for many years with small or no programmed increases in health insurance premiums. In the 2023 Plan year there was not an increase to premiums on our Rose Health Plan or Azalea Plan; however, the City is increasing its employer contributions. The City will continue to offer a flex spending account (FSA) option for participants in the Rose or Azalea plans; and will add a third option high deductible health plan with a health savings account (HSA) option.
It is the City of Tyler’s desire to provide the best benefits to the employees, while balancing the cost and minimizing the financial impact on the City, citizens and employees. This balancing act has become difficult to maintain due to rising costs, increased utilization and accumulating retiree health insurance financial liabilities associated with the City’s employees’ and retirees’ health coverage. In an effort to mitigate the rising costs, the City has appointed an employee Health Insurance Task Force to identify areas for improvement and savings.
The FY 2021-2022 total property tax rate as adopted was $.269900 cents per $100 valuation. The property rate adopted for FY 2022-2023 will be decreased to $.261850 cents per $100 valuation. The property tax rate proposed for FY 2022-2023 maintenance and operations (M&O) is a rate of $.261850 per $100 of assessed property tax value.
Manager’s Message
FY2021-2022 FY2022-2023 Total Taxable Value 9,770,807,914 10,948,828,831 Total Tax Rate 0.269000 0.261850 Total Tax Levy 25,115,312 27,164,224 Estimated Collection 99.50% 99.50% Total Budget 24,989,735 27,028,403 19
OUTSIDE AGENCIES
The City has funding agreements with certain agencies that perform duties that would cost the City considerably more if the city had to fund these operations. The payments made to these agencies are listed below.
FUNDING FOR OTHER OUTSIDE AGENCIES
The fiscal year 2022-2023 General Fund operating budget includes funding for the outside agencies listed:
DEBT SERVICES FUND
The FY2022-2023 General Fund Operating Budget is supported by a total tax rate of $.261850 cents, of which $.000 cents is applied to fund General Obligation debt. The City of Tyler is pleased to report that, it has no General Obligation Debt.
GENERAL PROJECTS FUND
The City’s General Projects Fund serves as a supplemental resource to pay for one-time capital related expenditures on a pay-as-yougo basis. This fund was established from the General Fund annual operating surplus over and above the 15 percent reserve and it enables the purchase of a number of infrastructure improvements and one-time capital expenditures that could not be funded otherwise.
STREET IMPROVEMENT FUND
The City’s Street Improvement Fund was created in fiscal year 2017-2018 to ensure that the seal coat program can continue. Tyler City Council pledged to use one cent tax increase to help provide dollars for this fund. This pledge was done in a form of a City ordinance. During fiscal year 2019-2020 the City Council approved a one-cent increase to the pledge amount making the total amount pledged two-cents. The pledged amounts will generate $1,829.862 in fiscal year 2022-2023. It is the plan to grow this fund in the future through additional tax increases.
TOURISM AND CONVENTION FACILITIES FUND
The FY 2022-2023 Tourism and Convention Facilities Fund Operating Budget includes projected revenues of $967,900 and inter-fund transfers in of $2,500,000, expenditures of $3,166,096, inter-fund transfers out of $20,000. The fund projects an ending fund balance of $625,226.
Manager’s Message SUMMARY CONT. Executive FY2021-2022 FY2022-2023 Innovation Pipeline 80,000 80,000 East Texas Council of Governments 14,535 14,535 Center for Healthy Living 66,500 66,500 Northeast Texas Public Health District 200,000 200,000 Total Expenditures 361,035 361,035
20
HOTEL/MOTEL OCCUPANCY TAX FUND
The FY 2022-2023 Hotel/Motel Occupancy Tax Fund Operating Budget projects revenues of $7,553,062 including transfers, expenditures and transfers of $4,198,700 and an ending fund balance of $5,488,274. Projected FY 2022-2023 Hotel-Motel tax revenue will support the promotion of conventions, Main Street, visitors and tourism activity in Tyler through funding operating costs of the Rose Garden Center, Liberty Hall, and W.T. Brookshire Conference Center, as well as, providing appropriations for the following agencies:
An additional two percent (2%) Hotel-Motel tax was approved by the State Legislature and passed by Ordinance on July 13, 2011 to be used for the construction/ expansion of visitor facilities. Hotels began collecting these funds as of September 1, 2011 due on October 20, 2011.
During FY2020-2021, planning began on a new convention center facility for the City. The additional 2% Hotel Occupancy Tax aids in funding these costs. Expenditures for FY2021-2022 are mainly for convention center construction. The W.T. Brookshire Conference Center is expected to open in April 2023.
WATER UTILITIES FUND
The FY 2022-2023 Water Utilities Operating Budget projects revenues of $51,251,413, expenditures of $50,201,493 including capital transfers and an ending working capital $16,315,108.
SOLID WASTE FUND
The FY 2022-2023 Solid Waste Operating Budget projects revenues of $17,276,578, expenditures of $15,874,822 for residential and commercial Solid Waste collection services and operations, litter control, code enforcement, and including transfers of $1,175,653 and an ending working capital $2,537,481.
Manager’s Message SUMMARY CONT. Executive 2021-2022 2022-2023 Texas Rose Festival 10,000 10,000 Discovery Place 32,400 32,400 Symphony 50,000 50,000 Museum of Art 35,000 35,000 Historical Museum 13,500 13,500 Visitors and Convention Bureau 691,500 691,500 McClendon House 4,500 4,500 Historic Aviation Museum 13,500 13,500 Sport Tyler Award 25,000 25,000 Total Expenditures 875,400 875,400
21
AIRPORT FUND
The FY 2022-2023 Airport Fund Annual Operating Budget projects revenues of $1,979,222 (including transfers in), expenditures of $2,019,888 including transfers out, and an ending working capital of $899,233. During FY2018-2019, the airport re-opened runway 4/22 for use. The upgraded runway allows for bigger planes to service the Northeast Texas Region. Future projects include an instrument landing system and a parallel taxiway for runway 4/22. The projects are funded by FAA Grants, with 90% of the funding provided by the FAA and 10% provided by the City’s half-cent sales tax fund.
FLEET MAINTENANCE FUND
The FY 2022-2023 Fleet Maintenance Services Annual Operating and Replacement Budget projects revenues of $16,773,911, expenditures of $16,327,371 including transfers and an ending working capital of $5,314,038.
BUDGET REVENUES Major AND EXPENDITURES
The fiscal year 2022-2023 revenues, expenditures and changes in working capital for the major operating funds:
Manager’s Message SUMMARY CONT. Executive
FUND OPENING BALANCE REVENUES EXPENDITURES TRANSFERS IN / (TRANSFERS OUT) CLOSING BALANCE 101 General 18,237,434 86,810,085 83,408,918 (3,401,167) 18,237,434 202 Development Services 1,243,343 2,679,350 2,629,063 - 1,293,630 211 Hotel Occupancy Tax 2,133,912 4,303,062 1,080,900 132,200 5,488,274 502 Utilities Operations 15,265,188 51,251,413 39,217,358 (10,984,134) 16,315,109 524 Airport 939,099 1,907,222 1,949,613 2,525 899,233 560 Solid Waste 2,311,378 17,276,578 15,874,822 (1,175,653) 2,537,481 22
Organizational CHART
CITY COUNCIL
BOARDS & COMMISSIONS
COMMITTEES, ROUNDTABLES & TASK FORCES
CITY MANAGER
CITY CLERK
CITY ATTORNEY
DAVID COBLE Fire Chief
Strategic Planning Priorities: Public Safety and Emergency Management
Areas of Responsibility:
• Fire
• Emergency Management
• Emergency Medical Services Liaison
• Catalyst 100 Executive Committee
HEATHER NICK Assistant City Manager
Strategic Planning Priorities: Development and Growth
Areas of Responsibility:
• Planning and Development Services
• Metropolitan Planning Organization
• Geographic Information Systems
• Historic Preservation
• Tyler 1st Comprehensive Plan
• Permit Center
• Economic Development (TIRZ Liaison)
• Engineering
STEPHANIE FRANKLIN Deputy City Manager
Strategic Planning Priorities: Quality of Life and Places
Areas of Responsibility:
• Organizational Strategic Planning
• Visitor & Convention Facilities
• Library
• Main Street
• Liberty Hall
• Cultural Affairs Board
• Building Inspections
EXECUTIVE TEAM
MUNICIPAL JUDGES
STEPHANIE FRANKLIN (cont.)
Areas of Responsibility: (cont.)
• Facility Services
• Visit Tyler
• Innovations Pipeline Liaison
JIMMY TOLER Police Chief Strategic Planning Priorities: Public Safety and Emergency Management
Areas of Responsibility:
• Police
• Centralized Dispatch
• 911 Liaison
• Code Enforcement
• Animal Services
• Homeless Roundtable Liaison
• Human Needs Network Liaison
KEIDRIC TRIMBLE Chief Financial Officer
Strategic Planning Priorities: Fiscal, Tech and Human Resources
Areas of Responsibility:
• Finance
• Budget
• Purchasing
• Municipal Court
• Internal Audit Services
• Utility Billing
LEROY SPARROW Director of Solid Waste, Transit and VES
• Solid Waste
• Transit
• Vehicle Services
LEANNE ROBINETTE
Director of Parks & Recreation
• Parks and Recreation
• Tourism Facilities
• Cemeteries
• Keep Tyler Beautiful
REGINA MOSS
Director of Organizational Development
• Human Resources
• Volunteer Services
• City University
• Lean Six Sigma
JULIE GOODGAME
Director of Marketing & Communication
• Marketing
• Internal/External Communication
• Legislative Affairs
• Liberty Hall
• Film Friendly Program
KATE DIETZ
Director of Utilities
• Water Production
• Wastewater Treatment
• Water Service Center
• Utilities Engineering
BENNY YAZDANPANAHI
Chief Information Officer
• Information Technology
Manager’s Message
23
Guide READER’S

PROCESS Budget
BUDGET ADOPTION
The City’s fiscal year is from October 1 through September 30. The City Charter requires public hearings and adoption of the budget by fund to be completed by the final City Council meeting in September. The City Council adopts the budget by ordinance in accordance with state statutes and the City Charter. Estimated expenditures of any fund may not exceed proposed revenue plus prior year unencumbered balances. During a budget cycle, any unused appropriations may be transferred to any item required for the same general purpose within the same department and/or fund with City Manager approval. Any transfer of budget amounts between funds or base increases in appropriations must be approved by the City Council. Appropriations lapse at fiscal yearend, unless lawfully reappropriated in ensuing adopted budgets. Budgets of the governmental fund type are prepared on a modified accrual basis of accounting. The budgeted estimates are expected to be collected and expended in the same fiscal budget year. The financial records are maintained on the modified accrual basis. Obligations in these funds are recorded as expenditures, and revenues are recognized only when they are actually received. Budgets of the enterprise fund types are also prepared on a modified accrual basis, but financial records are maintained on the accrual basis of accounting. Not only are expenses recognized when a commitment is made but revenues are also recognized when they are obligated to the City. Developed on a program basis, the budget depicts all services provided by the City and resources allocated for the provision of these services. Program priorities for the organization are developed by City Council, City staff and citizen input; and are used as major guidelines in the development of funding recommendations.
BUDGET AMENDMENTS
Under emergency conditions which may arise and which could not reasonably have been foreseen in the normal process of planning the budget, the City Council may, by a majority vote of the full membership, amend or change the budget to provide for any additional expense in which the general welfare of the citizenry is involved. These amendments shall be by ordinance. Any budget amendment must adhere to the balanced budget requirement and
cannot change the property tax levy or in any manner alter a taxpayer’s liability. The City of Tyler budget is a program-based budget that is adopted by fund. Ordinances approved by City Council are required to increase or decrease appropriations in any fund. Although adopted by fund, budgets are prepared by line item and the City Manager approves budget adjustments within a fund between line items.
BASIS OF PRESENTATION
The accounts of the City of Tyler are organized and operated on the basis of funds or account groups. Each is considered to be a separate accounting entity with its own separate set of self -balancing accounts consisting of assets, liabilities, fund balances, net assets, revenues and expenditures or expenses. In accordance with Generally Accepted Accounting Principles (GAAP), the City’s funds can be classified into one of three broad classifications of funds and categorized into one of seven fund types as listed below.
GOVERNMENTAL FUNDS
Governmental funds are primarily used to account for tax-supported, externally mandated fee and grant activities. The measurement focus is toward determination of financial position and changes in financial position, rather than upon net income determination. These funds operate under the modified accrual basis of accounting. They recognize revenue as income only when it becomes measurable and available. The City recognizes expenditures when a liability has been incurred except for some long-term liabilities such as debt service, compensated absences, claims, and judgments, which are recognized when payment is due. The City utilizes the following governmental fund types: General – the City operates one general fund as the Chief Operating Fund for the City. It is used to account for all financial resources of the City that are not legally required to be accounted for in another fund. The City utilizes Internal Service Funds to account for some benefit, maintenance and equipment purchase requirements associated with the General Fund.
Debt Service – this fund is used to accumulate resources to meet the current and future principal and interest payments on the City’s general long-term debt. The City paid off all tax supported debt in fiscal year 2007-2008.
reader’s guide
25
PROCESS Budget
Capital Projects – the City operates three capital projects funds. The major fund associated with capital projects is the One-Half Cent Sales Tax Corporation, which is used for infrastructure improvements in an effort to eliminate taxsupported debt. This fund is not included in this document and has no formally adopted budget by the City Council, but is included in the annual financial audit. The second capital projects fund is the General Capital Projects Fund. This fund is used as a supplemental resource to pay for one-time related capital expenditures from the General Fund. The third capital projects fund is the Street Improvement Fund. In FY2017-2018 the Mayor and City Council created this fund to continue to fund street improvement projects to upgrade and then maintain the City’s streets to an acceptable level.
Permanent Funds – the City operates two permanent funds for the perpetual care and maintenance of the City’s cemeteries. One of these funds operates in a trust environment and the other is an operations fund for the City cemeteries.
Special Revenue – the City uses special revenue funds to account for proceeds from specific revenue sources that are legally restricted to expenditures for specific purposes other than debt service or capital projects. These restrictions may be imposed either by parties outside the government or by the local governing body. The City operates with the following Special Revenue Funds:
• Development Services – established to account for the receipt and disbursement of funds related to Building Inspections and Planning and Zoning.
• Police Forfeiture – established to account for the receipt and disbursement of funds seized by the Police Department and subsequently awarded to the City through court-ordered judgments, primarily cases involving illegal drugs.
• Court Special Fee – established to track the receipt of court fees restricted for court related purchases.
• TIF/TIRZ #2 – established to account for the receipt and disbursement of funds related to the Tax Increment Financing Zone established for the Downtown Tyler region. Was dissolved in fiscal year 2015-
2016, and re-established as TIF/TIRZ #4 in fiscal year 2018-2019
• TIF/TIRZ #3 – established to account for the receipt and disbursement of funds related to the Tax Increment Financing Zone established for the North Tyler region.
• Hotel-Motel Tax – established to account for the receipt and disbursement of funds generated by the Hotel-Motel Occupancy Tax.
• Donations – established to account for the receipt and disbursement of funds donated for specific projects. This fund is not included in this document and has no formally adopted budget by the City Council, but is included in the annual financial audit.
• Tourism – established to account for the operations of the Rose Garden, Rose Garden Center, Harvey Convention Center, Goodman Museum, Main Street and Liberty Hall.
• Airport Facility – established to account for the receipt and disbursement of passenger facility charges collected from ticketed passengers at Tyler Pounds Regional Airport as well as rental car charges collected to facilitate special projects.
• Oil and Natural Gas – established to track revenue received from lease royalties to be used for future onetime projects identified by the City Council.
• PEG Fee – established to track receipt and disbursement of funds related to the 1% Public, Educational and Government Access Channel Fee collected and remitted by local cable franchise operations.
• Fair Plaza – established to track the tenant rental and parking income associated with the Fair building donated to the City of Tyler and the associated operating expenses.
• Homeownership/Housing – established to account for the receipt and disbursement of the overhead allowances in excess of actual costs in the Section 8 Grant Program.
• Community Development Block Grant (CDBG) – established to account for the
reader’s guide
26
PROCESS Budget
receipt and disbursement of CDBG Grant monies allocated to the City.
• HOME – established to account for the receipt and disbursement of HOME Grant monies allocated to the City to provide affordable housing for low-income households.
• Housing Assistance Payment Program (HAPP) – established to account for the receipt and disbursement of Department of Housing and Urban Development –Housing Assistance Payments Program Funds.
• State and Federal Grants – created to account for the receipt and disbursement of Federal and State Grants related primarily to planning, transportation, library, public safety and human services. Only major grants with known awards are included in this document and have a formally adopted budget. All other budgets are adopted with the grant award documentation.
• Transit System – established to account for the receipt and disbursement of Federal and State Grant Funds received for the operation of the City’s Transit System.
PROPRIETARY FUNDS
Proprietary funds are used to account for business activities in which funding is provided by fees and charges for services. The measurement focus of proprietary funds is total economic resources. As such, these funds use the accrual basis of accounting, recognizing revenues when earned and expenses as the liability is incurred. For budgeting purposes, the proprietary fund types are budgeted on a modified accrual basis to better manage available working capital. The City utilizes the following proprietary fund types.
Enterprise – these funds cover the cost of their operations through fees charged to individual users.
• Utilities – accounts for the maintenance and operations of the infrastructure of the City’s Water and Sewer system including administration, billing, distribution, treatment, waste collection, waste treatment, Lake Tyler, and Geographical Information Systems (GIS).
• Utility Construction – established to track the costs of capital improvements to the utility system.
• Utility Debt Service – established to track the debt service costs related to revenue bond indebtedness.
• Utility Debt Reserve – established to track debt service reserve requirements related to the 2009 utility debt issue.
• Solid Waste – accounts for the maintenance and operations of the garbage collection and litter abatement programs operated by the City of Tyler. This includes administration, residential collection, commercial collection, litter control and complex maintenance.
• Solid Waste Construction – established to track the costs of capital purchases and improvements to the garbage collection operations.
• Airport – accounts for the operations of the Tyler Pounds Regional Airport and the Federal Aviation Administration tower activity.
• Storm Water – responsible for the maintenance, management, and regulatory compliance of the storm water system. Internal Service – these funds are used to report activities that provide services for other funds within the City. The full cost of providing these services is charged back to the using funds. The City utilizes the following internal service funds:
• Productivity – established to track performance pay of City employees as well as the cost of internal audit and City University.
• Fleet Maintenance/Replacement –accounts for the maintenance and repair work on vehicles for all City departments. The fund also acquires vehicles and equipment for use by all City departments on an amortization replacement schedule.
• Property and Liability Insurance – accounts for the City’s property, casualty, disability and worker’s compensation insurance programs.
• Active Employee Benefits – accounts for the City’s self insurance program for health and dental benefits for active employees
reader’s guide
27
PROCESS Budget
as well as life insurance benefits provided through traditional insurance.
• Property and Facility Management – established to account for facility maintenance and replacement costs associated with HVAC units, roofing and ADA requirements.
• Technology – established to account for the City’s investment in technology and office automation, as well as current maintenance and repair items.
• Retiree Employee Benefits – accounts for the City’s self insurance program for health and dental insurance benefits for retired employees as well as life insurance benefits provided through traditional insurance.
FIDUCIARY FUNDS
Fiduciary funds are used to account for activities that are held in trust by the City, with the funds themselves appropriated for other purposes or agencies. Because these funds are held by the City of Tyler for other agencies or individuals, there is no formally adopted budget for Fiduciary Funds and these funds are not included in the budget document. The City operates four Fiduciary funds including an Employee Benefit Trust – Section 125 Plan, Employee Benefits Trust - OPEB Trust, the Lindsey Private Purpose Trust and the Greenwood Landfill Private Purpose Trust. All funds are included in the annual financial audit. The City has an external audit completed each year. The external auditors prepare the City’s Comprehensive Annual Financial Report (CAFR) based on GAAP reflecting the City’s financial position at the end of its fiscal year. The CAFR reports expenditures and revenues on both a GAAP basis and budget basis for the purpose of comparison. The following audit adjustments are made to adjust the City’s financial records to GAAP:
• Enterprise and internal service funds budget for purchases of capital items as expenditures on a budget basis, but they are recorded as assets on a GAAP basis.
• Compensated absence liabilities are accrued as earned on a GAAP basis, but expensed when paid on a budget basis.
• Governmental funds record revenues when received and book expenditures as
encumbrances at the point of commitment during the budget year. Audit adjustments recognize all revenue that is measurable and available within 60 days of year-end on a GAAP basis.
• Enterprise and internal service funds record depreciation and amortization on a GAAP basis only.
• Principal payments are recorded as a reduction of current liability on a GAAP basis, while being accounted for as debt service expenses on a budget basis.
• Accrued debt service interest expense is recorded as a liability on a GAAP basis, but only current year interest expense is recorded on a budget basis.
BUDGET PHASES
The City of Tyler begins in January with the development of next year’s budget. The budget development process requires input from City staff, the City Council and citizens. In order for this input to be given appropriate consideration, the process begins approximately six-months before the budget is adopted. There are five distinct phases in the development of the City’s budget.
FISCAL ALIGNMENT (PHASE I)
Budget Goals – the process starts with the development of budget goals based on the City’s Strategic Plan and continuous feedback received from the City Council and citizens. After the goals are developed, meetings with the City’s administrative team set the stage for budget formation.
Forecast Schedule and Strategy Development
& Business Plan – the goal of this phase is to align the City’s strategic plan and business planning process with the budget development. This phase also provides strategic fiscal forecasting, financial assumptions, revenue and reserve information as well as management’s expectations about the development of departmental budgets. At these meetings, the budget calendar is discussed. The calendar includes internal and external deadlines. The calendar allows citizens and the City Council to be aware of the schedule and the official dates for public input. Also, supplemental request for the upcoming fiscal year are discussed, as well as future years.
reader’s guide
28
PROCESS Budget
DEPARTMENTAL HEARINGS (PHASE II AND III)
Budget Development – departments develop their budgets based on the financial expectations and the guidelines they have been provided. After departments have entered their budget in the City’s financial system, they are reviewed with the Budget Committee. This review meeting allows the departments to highlight changing trends in their service levels in addition to making proposals for new services or changes to existing services. Phase II involves the development of the internal service fund budgets. Also, Phase II includes the review of all capital operating and debt service budgets.
Capital Improvements Plan – the Capital Improvements Plan is developed during this process the Capital Improvements Plan is developed during this process as well. The City reviews all Capital Improvement projects on a monthly basis to ensure that they are staying on track with the annual plan. The City operates with a five-year plan where projects are added based on an objective scoring criteria established by the City Council. As the fund balances in each of the capital project funds are reviewed and analyzed for excess revenue, that revenue is considered for additional projects. Additional projects are prioritized and then placed on next year’s schedule when funding is available.
BUDGET PRESENTATION (PHASE IV)
Once all of the input is received, the budget is developed and the City Manager presents it to the City Council in August. The proposed budget will contain the proposed tax rate, water and wastewater rate, and sanitation rate as well as fee changes. The City Manager provides the City Council and the public with an overview of the budget and a summary of the major changes being recommended.
ADOPTION PROCESS (PHASE V)
The City Council then receive public input through public hearings and community dialogue before adoption. Any additional information needed to understand changes within the budget will be provided to City Council during this time. The City Council will adopt the budget by fund and adopt the new property tax rate before the start of the fiscal year on Oct. 1.
reader’s guide
29
CALENDARS Budget
City of Tyler


FY2022-23 Budget Preparation Calendar
Phase I Strategic/Fiscal Alignment
October 28 - 29, 2022
December 15, 2021
January 1, 2022
January 1-31, 2022
January 13 - 14, 2022
January 19, 2022
January 20, 2022
February 14-25, 2022
March 9, 2022
Phase II Budget Work Sessions
March 17, 2022
City Council Fall Retreat
Risk - check on 1st insurance rate projections, review claims history, review litigation costs, receive projections for short-term disability and unemployment.
Communications - Begin working with departments on advertising needs and budget requests
VES meet with departments to discuss replacement needs and develop schedule
Executive Team Retreat
Department Leader Meeting.
First Monthly Financial Forecast due on P:Drive
ISF Recommendation Review
ISF Recommendations due to Budget for upload
Department Leader Meeting. Budget kick-off. Budget file open for department entry
March 17th & March 24th Budget Training @ City U
March 31, 2022
March 17 - May 1, 2022
1st ISF update
Budget file open for department entry
Phase III Budget Hearings and Budget Preparation
April 30, 2022
May 19, 2022
June 14, 2022
June 30, 2022
July 18 - 27, 2022
July 28 - August 3, 2022
Phase IV Adoption
August 4 - August 9, 2022
August 9, 2022
August 10, 2022
August 14, 2022
August 15, 2022
August 24, 2022
September 4, 2022
September 14, 2022
September 14, 2022
Preliminary Tax Roll due from Chief Appraiser
City Council Spring Retreat
DL Meeting - State of the City/Budget Update
2nd ISF Update
Council 1-on-1 meetings
Communications meet with Budget Committee to discuss messaging for budget
Editorial Boards
City Manager's FY 2022-22 Proposed Budget Filed with the City Clerk and post on website. (Must be filed at least 15 days prior to public hearing and at least 30 days prior to tax rate adoption)
FY2022-23 Proposed Budget presented to City Council (Vote to schedule proposed public hearings for the budget and tax rate adoption).
City Clerk publishes the 1st "NOTICE OF PUBLIC HEARING ON TAX INCREASE AND PROPOSED BUDGET" (No later than 30 days prior to and no sooner than 10 days to the public hearings)
Department Leader Budget Presentation
1st Public Hearing on FY2022-23 Proposed Budget - Announce Meeting Date to Adopt Tax Rate and Budget. (May not be held before the 7th day after the date of the notice of public hearing is given.)
City Clerk publishes the 2nd "NOTICE OF PUBLIC HEARING ON TAX INCREASE AND PROPOSED BUDGET"
2nd Public Hearing on FY2022-23 Proposed Budget- Announce Meeting Date to Adopt Tax Rate and Budget*** (Must be at least 3 days after 1st public hearing).
City Council Adoption of FY2022-23 Budget and Property Tax Rate (City Charter requires adoption no later than the 25th and state statue requires no earlier than the 3rd and no greater than the 14th after the date of the second public hearing)
reader’s guide
30
Policy FINANCIAL

POLICY Financial
FINANCIAL MANAGEMENT PERFORMANCE CRITERIA
The City of Tyler’s Financial Management Performance Criteria (FMPC) serves as the basis for the overall fiscal management of the City’s resources. These policies guide the City Council and administration in making sound financial decisions and in maintaining Tyler’s fiscal stability. The policies outlined here are developed to address specific financial issues. These policies are reviewed annually and updated as needed. Listed below are financial policies, which are specifically related to the adoption and execution of the annual operating budget.
BUDGETING, ACCOUNTING, AUDITING AND FINANCIAL PLANNING CRITERIA
• Establish and maintain a central accounting system for all functions of accounting, financing, inventory and budgeting.
• Submit to the City Council quarterly revenue and expenditure reports to show the financial position of the City of Tyler. The reports include budgetary forecasts and year-to-date actual comparisons to show the financial condition of the major operating funds. In addition a quarterly investment report will be presented which meets / exceeds the requirements of the Public Funds Investment Act.
• File with the City Clerk for public review, a copy of the proposed ensuing fiscal year budget a minimum of 45 days prior to October 1st.
• City Council shall cause an independent audit to be made of the books of account, records and transactions of all the administrative departments of the City at least annually. The audit shall be conducted by a Certified Public Accountant. Auditors shall be selected for an initial one year period with an option for renewal up to five years. Mandatory rotation is required by City Council for external audit services every five years.
• The annual audit shall be conducted in accordance with the Generally Accepted Accounting Principles (GAAP).
• Long-range forecasts shall be made for major operating funds as necessary for financial planning.
• A system of internal controls shall be maintained to monitor revenues and expenses for municipal programs on a continuous basis. The internal auditor will perform periodic audits of departments to determine compliance with current controls and to make recommendations for change.
• It is the City’s goal to annually strive for certification of its audit and budget from the Government Finance Officers’ Association (GFOA).
OPERATING CRITERIA
• Estimated expenditures shall in no case exceed proposed revenue plus prior year undesignated balances.
• Unused appropriations may be transferred to any item required for the same general purpose within the same department and/or fund if approved by the City Manager. All other transfers between funds and base increases to appropriations must be approved by the City Council.
• All annual appropriations shall lapse at the end of the fiscal year to the extent that they shall not have been expended and lawfully re-appropriated in subsequent year’s adopted budgets.
• A fund balance shall be maintained at a level of 15 percent of estimated annual operating expenditures for the General Fund and at 15 percent of estimated annual operating expenses in the Utility Fund and Solid Waste Fund.
• Investments shall be managed in accordance with the current Investment Policy. Investments shall comply with Federal, State and local laws. Investments will consider protection of principal first, with the intent to diversify as well as provide for liquidity needs. Investments shall be made to maintain public trust and not speculate. Investment managers shall exercise prudence in managing the overall portfolio while trying to attain comparable rates of return.
Financial Policy
32
• Fixed assets shall be managed in accordance with the current Fixed Asset Policy in order to properly classify, make record of and safeguard the assets. An inventory of the assets is to be maintained and is to include the description, cost, date of acquisition, department, location and asset identification number. Periodic inventory inspections of fixed assets shall be conducted. Fixed assets include items meeting both the dollar minimum of $10,000 and having a useful life of two years or more. For constructed assets, the criteria apply to the completed project. Certain assets bought in bulk are capitalized as a group asset.
• The City Council shall designate a City depository in compliance with State statutes. The term of the bank depository shall be two years with three additional one year options for renewal.
CAPITAL IMPROVEMENT PROJECTS
• A comprehensive master plan will be developed to better plan and forecast future construction and capital improvements.
• Capital project forecasts shall be developed and shall identify the impact of implementing said projects on future annual operating budgets. Estimates of future revenues necessary for these expenditures shall be identified prior to the approval of such capital improvements.
• The life of a capital project fund shall correspond to the utilization of the resources in the fund.
• Expenditures shall not be incurred nor shall contracts be awarded without the appropriation of available funds.
DEBT MANAGEMENT
• Utility projects, financed through the issuance of bonds, shall be financed for a period not to exceed the expected weighted average useful life of the assets.
• Interest earnings on bond proceeds shall be credited to the debt service fund.
• The City of Tyler intends to pay for tax supported construction and capital improvements with cash.
• When appropriate, the City will consider the use of revenue debt to pay for utility system improvements if it is economically feasible.
• Revenue bond coverage requirements provide for financial stability in Enterprise Funds. Coverage requirements are defined as the amount of system net revenue available to pay average annual debt service. System net revenue equal to one and one half times average annual debt service is preferred. In no annual period shall the coverage fall below one and one tenth times based on current bond covenants.
• The City Council shall exhibit a willingness to raise the revenue necessary to fully fund the current debt obligations in order to implement the adopted capital improvement plan and to maintain the City’s bond rating at or above current levels.
Financial Policy
POLICY CONT. Financial 33
Policy INVESTMENT

POLICY Investment
ORDINANCE NO. O-2022-88
AN ORDINANCE OF THE CITY COUNCIL OF THE CITY OF TYLER, TEXAS, AMENDING CHAPTER 2, “FINANCE AND TAXATION”, ARTICLE V, “INVESTMENT POLICY”, OF THE CODE OF ORDINANCES OF THE CITY OF TYLER, TEXAS; PROVIDING A SEVERABILITY CLAUSE; AND ESTABLISHING AN EFFECTIVE DATE.
WHEREAS, the Public Funds Investment Act, (currently Chapter 2256 of the Texas Government Code, Section 2256.005), requires that the City Council review and adopt its Investment Policy and strategy at least annually;
NOW, THEREFORE, BE IT ORDAINED BY THE CITY COUNCIL OF THE CITY OF TYLER, TEXAS:
PART 1. That Tyler City Code Chapter 2, “Finance and Taxation”, Article V., “Investment Policy”, is hereby amended to read as follows:
ARTICLE V. INVESTMENT POLICY
Sec. 2-46. Introduction and Scope. The Public Funds Investment Act, Chapter 2256, Texas Government Code, (the “PFIA”) requires each city to adopt a written investment policy that includes a written investment strategy, quarterly reports to City Council with market values, an annual review of the policy by Council and an annual compliance audit among other requirements. This Policy shall apply to the investment and management of all City funds under its control, other than those expressly excluded within this document or by applicable law or valid agreement. The Fire Pension Fund is excluded from this Policy because it is separately organized and managed by contract with investment companies as directed by the Fire Pension Board, and the Lindsey Police and Firefighters’ Endowment Fund is also excluded from this Policy because it is separately organized and managed by contract with an investment company as directed by the Lindsey Police and Firefighters’ Fund Board. The Employees Deferred Compensation Agency Fund and the Retirees Health Benefits Trust Fund are also excluded. This Policy shall not supersede the restrictions on investment of specific funds because of legal limits, created by grants, bond covenants or similar regulations. In the event of conflict, the more restrictive policy
shall be followed. (Ord. No. 0-98-21; 3/18/98) (Ord. No. 0-2000-21; 3/22/00) (Ord. No. 0-2002-54, 11/13/2002) (0-2003-65, 11/26/03) (Ord. 0-2004-87, 11/10/04) (Ord. 0-2005-91, 11/9/05) (Ord. No. O-2006-93, 11/8/06) (Ord. No. 0-2007-130, 11/14/07) (Ord. No. 0-2008-37, 2/27/08) (Ord. No. 0-2008-143, 11/12/08) (Ord. No. 0-2009-84, 8/12/09) Ord. No. 0-2010-121, 11/10/10) (Ord. No. 0-2011-94, 11/9/11) (Ord. No. 0-2013-60, 7/24/13) (Ord. No. 0-2016-20; 02/24/16) (Ord. No. 0-2017-54; 07/12/17) (Ord. No. 0-2019-45; 06/12/19) (Ord. No. 0-2020-62; 7/8/20) (Ord. No. 0-2022-88; 9/14/22)
Sec. 2-47. Investment Strategy.
The City shall use a pooled cash and investment approach commingling money from various fund types for market efficiency to the extent that is practical and legal. The following investment strategy considerations recognize the unique advantages of a pooled cash and investment portfolio, including the reduction of cash flow uncertainty and the increased opportunity of yield curve extension. Funds included in the portfolio will include those from the operating funds, debt service and debt reserve funds, and special projects. The liquidity requirements of the pooled investment portfolio will be projected and matched with maturities.
Pooled Fund Group
Suitability - Any investment eligible in the Investment Policy is suitable for Pooled Fund Groups.
Safety of Principal - All investments shall be of high quality with no perceived default risk. Market price fluctuations will occur. However, managing the weighted average days to maturity to less than 270 days and restricting the maximum allowable maturity to two years using the final stated maturity dates of each investment will minimize the price volatility of the portfolio
Marketability - Securities with active and efficient secondary markets are necessary in the event of an unanticipated cash flow requirement. Historical market “spreads” between the bid and offer prices of a particular security-type of less than a quarter of a percentage point will define an efficient secondary market.
Investment Policy
35
Liquidity - Pooled Fund Groups require short-term liquidity to adequately fund any unanticipated cash outflow. Short-term financial institution deposits, investment pools and money market mutual funds will provide daily liquidity and may be utilized as a competitive yield alternative to fixed maturity investments.
Diversification - Investment maturities should be staggered throughout the budget cycle to provide cash flow based on the anticipated operating needs of the City. Diversifying the appropriate maturity structure up to the two-year maximum will reduce interest rate risk.
Yield - Attaining a competitive market yield for comparable security-types and portfolio restrictions is the desired objective. The yield of an equally weighted, rolling three-month Treasury Bill portfolio will be the minimum yield objective.
Special Project and Bond Proceeds Funds
At times special project and bond proceed funds may be better suited invested outside the Pooled Fund Group. In those cases, the following strategy shall be applicable:
Suitability - Any investment eligible in the Investment Policy is suitable for Special Project and Bond Proceeds Funds.
Safety of Principal - All investments will be of high quality with no perceived default risk. Market price fluctuations will occur. However, by managing Special Project and Bond Proceeds to not exceed the anticipated expenditure schedule the market risk of the overall portfolio will be minimized. Maximum maturity five years from date of purchase.
Marketability - Securities with active and efficient secondary markets are necessary in the event of an unanticipated cash flow requirement. Historical market “spreads” between the bid and offer prices of a particular security-type of less than a quarter of a percentage point will define an efficient secondary market.
Liquidity - Special Project and Bond Proceeds
Funds used for capital improvements programs have reasonably predictable draw down schedules. Therefore, investment maturities should generally follow the anticipated cash flow requirements. Short term financial institution deposits, investment pools and money market mutual funds will provide readily available funds generally equal to one month’s anticipated cash
flow needs, or a competitive yield alternative for short term fixed maturity investments. A singular repurchase agreement, or similarly structured investment vehicle, may be utilized if disbursements are allowed in the amount necessary to satisfy any expenditure request. This investment structure is commonly referred to as a flexible repurchase agreement.
Diversification - Market conditions and arbitrage regulations influence the attractiveness of staggering the maturity of fixed rate investments for Special Project and Bond Proceeds Funds. Generally, when investment rates exceed the applicable cost of borrowing, the City is best served by locking in most investments. If the cost of borrowing cannot be exceeded, then concurrent market conditions will determine the attractiveness of diversifying maturities or investing in shorter and larger amounts. At no time shall the anticipated expenditure schedule be exceeded in an attempt to bolster yield.
Yield - Achieving a positive spread to the cost of borrowing is the desired objective, within the limits of the Investment Policy’s risk constraints. The yield of an equally weighted, rolling sixmonth Treasury bill portfolio will be the minimum yield objective for non-borrowed funds. (Ord. No. 0-2000-21, 3/22/00) (Ord. No. 0-2001-51, 10/24/01) (Ord. No. 0-2002-54, 11/13/2002) (02003-65, 11/26/03) (Ord. 0-2004-87, 11/10/04) (Ord. 0-2005-91, 11/9/05) (Ord. No. O-2006-93, 11/8/06) (Ord. No. 0-2007-130, 11/14/07) (Ord. No. 0-2008-143, 11/12/08) (Ord. No. 0-2009-84, 8/12/09) Ord. No. 0-2010-121, 11/10/10) (Ord. No. 0-2011-94, 11/9/11) (0-2013-60, 7/24/13) (Ord. No. 0-2014-98, 10/22/14) (Ord. No. 0-201620; 02/24/16) (Ord. No. 0-2017-54; 07/12/17) (Ord. No. 0-2019-45; 06/12/19) (Ord. No. 0-202062; 7/8/20) (Ord. No. 0-2022-88; 9/14/22)
Sec. 2-48. Objectives.
Principle investment objectives in order of priority are:
a. Preservation of capital and the protection of investment principal. Maintenance of sufficient liquidity to meet anticipated disbursement and cash flows.
b. Maintenance of sufficient liquidity to meet anticipated disbursement and cash flows
Investment Policy POLICY CONT. Investment
36
c. Preservation of public trust by avoiding any transaction, which might impair public confidence in the City’s ability to manage public funds with which it is entrusted.
d. Conformance with all Federal statutes, State statutes, City Charter requirements, City ordinances, and other legal or policy requirements.
e. Diversification by investment type and maturity to avoid market risks and issuer defaults, where appropriate.
f. Attainment of a rate of return which is consistent with risk limitations and cash flow characteristics of the City’s investments. (Ord. No. 0-98-21; 3/18/98) (Ord. No. 0-2000-21, 3/22/00) (Ord. No. 0-2001-51, 10/24/01) (Ord. No. 0-2002-54, 11/13/2002) (Ord. 0-2004-87, 11/10/04) (Ord. 0-2005-91, 11/9/05) (Ord. No. O-200693, 11/8/06) (Ord. No. 0-2007-130, 11/14/07) (Ord. No. 0-2008-143, 11/12/08) (Ord. No. 0-2009-84, 8/12/09) Ord. No. 0-2010-121, 11/10/10) (Ord. No. 0-2011-94, 11/9/11) (0-2013-60, 7/24/13) (Ord. No. 0-2016-20; 02/24/16) (Ord. No. 0-2017-54; 07/12/17) (Ord. No. 0-2019-45; 06/12/19) (Ord. No. 0-2020-62; 7/8/20) (Ord. No. 0-2021-41; 05/12/21) (Ord. No. 0-2022-88; 9/14/22)
Sec. 2-49. Investment Officers.
The Chief Financial Officer, Accounting Manager, and Treasury Manager are appointed as Investment Officers. The Investment Officer’s authority will be limited by applicable laws, regulations and this Policy.
In order to ensure qualified and capable investment management, the City shall provide periodic training in investments for the investment personnel through courses and seminars offered by professional organizations and associations in compliance with the PFIA.
Investment Officers shall attend at least one training session, accumulating at least 10 hours of instruction, within twelve months of assuming their duties. An additional eight hours of training will be required not less than once in a two-year period that begins on the first day of the City’s fiscal year and consists of the two consecutive fiscal years after that date. Training will address investment topics in compliance with the PFIA. The City approves the GFOA, GFOAT, GTOT, NTCOG, TCMA, TML, and UNT as independent sources for training.
The City maintains the right to hire Investment Advisers to assist City staff in the investment of funds. Investment Advisers shall adhere to the spirit, philosophy and specific terms of this Policy and shall invest within the same objectives. The Investment Officers shall establish criteria to evaluate Investment Advisers, including:
1. Understanding of the inherent fiduciary responsibility of investing public funds;
2. Adherence to the City’s policies and strategies;
3. Investment strategy recommendations within accepted risk constraints;
4. Responsiveness to the City’s request for services and information; and
5. Similarity in philosophy and strategy with the City’s objectives.
Selected Investment Advisors must be registered under the Investment Advisers Act of 1940 or with the State Securities Board. A contract with an Investment Adviser may not be for a term longer than two years and any contract, renewal or extension is subject to approval by the City Council. (Ord. No. 0-98-21; 3/18/98) (Ord. No. 0-2000-21, 3/22/00) (Ord. No. 0-2001-51, 10/24/01) (Ord. No. 0-2002-54, 11/13/2002) (0-2003-65, 11/26/03) (Ord. 0-200487, 11/10/04) (Ord. 0-2005-91, 11/9/05) (Ord. No. O-2006-93, 11/8/06) (Ord. No. O-2006-93, 11/8/06) (Ord. No. 0-2007-130, 11/14/07) (Ord. No. 0-2008-143, 11/12/08) (Ord. No. 0-2009-84, 8/12/09) Ord. No. 0-2010-121, 11/10/10) (Ord. No. 0-2011-94, 11/9/11) (0-2013-60, 7/24/13) (Ord. No. 0-2016-20; 02/24/16) (Ord. No. 0-201754; 07/12/17) (Ord. No. 0-2019-45; 06/12/19) (Ord. No. 0-2020-62; 7/8/20) (Ord. No. 0-202288; 9/14/22)
Sec. 2-50. Standards of Care, Ethics and Conflicts of Interest.
As provided for in the PFIA, the standard of care for the City’s investments shall be the Prudent Person Rule, which states “investments shall be made with judgment and care, under prevailing circumstances, that a person of prudence, discretion and intelligence would exercise in the management of the person’s own affairs, not for speculation, but for investment, considering the probable safety of capital and the probable income to be derived.”
Investment Policy
Investment
POLICY CONT. 37
The overall investment program shall be designed and managed with a degree of care and professionalism that is worthy of the public trust. The Investment Officers shall recognize that the investment activities of the City are a matter of public record and public trust.
The Investment Officers, acting in accordance with written procedures and exercising the proper standard of care, shall be relieved of personal responsibility for an individual investment decision, provided that this Policy and the City’s procedures were followed. In determining whether an Investment Officer has exercised the proper standard of care, all investments over which the individual had responsibility will be considered rather than a single investment.
Investment Officers and employees of the City involved in the investment process shall refrain from personal business activity that could conflict with proper execution of the investment program, or which could impair their ability to make impartial investment decisions.
Investment Officers and employees of the City involved in the investment process shall not utilize investment advice concerning specific investments or classes of investments obtained in the transaction of the City’s business for personal investment decisions, shall in all respects subordinate their personal investment transaction to those of the City particularly with regard to the timing of purchases and sales, and shall keep confidential all investment advice obtained on behalf of the City and all transactions contemplated and completed by the City, except when disclosure is required by law.
All Investment Officers of the City shall file with the Texas Ethics Commission and the City Council a statement disclosing any personal business relationship with a business organization offering to engage in an investment transaction with the City or any relationship within the second degree by affinity or consanguinity to an individual seeking to sell investments to the City. (Ord. No. 0-98-21; 3/18/98) (Ord. No. 0-2000-21, 3/22/00) (Ord. No. 0-2001-51, 10/24/01) (Ord. No. 0-2002-54, 11/13/2002) (0-2003-65, 11/26/03) (Ord. 0-200487, 11/10/04) (Ord. 0-2005-91, 11/9/05) (Ord. No. O-2006-93, 11/8/06) (Ord. No. 0-2007-130, 11/14/07) (Ord. No. 0-2008-143, 11/12/08) (Ord. No. 0-2009-84, 8/12/09) Ord. No. 0-2010-121, 11/10/10) (Ord. No. 0-2011-94, 11/9/11) (0-2013-
60, 7/24/13) (Ord. No. 0-2016-20; 02/24/16) (Ord. No. 0-2017-54; 07/12/17) (Ord. No. 0-2019-45; 06/12/19) (Ord. No. 0-2020-62; 7/8/20) (Ord. No. 0-2022-88; 9/14/22)
Sec. 2-51. Authorized Investments. The Investment Officers shall use only investment options approved by City Council. Participation in any investment pool must also be approved by formal Council action. Subject to any limitations otherwise imposed by applicable law, regulations, bond indentures or other agreements, including but not limited to, the PFIA, the following are the only permitted investments for the City’s funds:
a. Direct obligations of the United States government; U.S. Treasury Bills, U.S. Treasury Notes, U.S. Treasury Bonds, and U.S. Treasury Strips (book entry U.S. Treasury securities whose coupon has been removed).
b. Debentures or discount notes issued by, guaranteed by, or for which the credit of any Federal Agencies and Instrumentalities, including the Federal Home Loan Banks, is pledged for payment. Principal-only and interest-only mortgage backed securities and collateralized mortgage obligations and real estate mortgage investment conduits are expressly prohibited.
c. Bonds or other interest bearing obligations of which the principal and interest are guaranteed by the full faith and credit of the United States government, including obligations that are fully guaranteed or insured by the Federal Deposit Insurance Corporation. Principal-only and interestonly mortgage backed securities and collateralized mortgage obligations and real estate mortgage investment conduits are expressly prohibited.
d. Certificates of Deposit and other evidences of deposit at a financial institution that, a) has its main office or a branch office in Texas and is guaranteed or insured by the Federal Deposit Insurance Corporation or its successor, b) is secured by obligations in a manner and amount provided by law for deposits of the City, or c) is placed through a broker or depository institution that has its main office or a branch office in Texas that meets the requirements of the PFIA. All deposits exceeding the FDIC insurance
Investment Policy
Investment
POLICY CONT. 38
Investment
limits shall be collateralized as required by Section 2-57 Selection of Depositories.
e. Local government investment pools organized under the Interlocal Cooperation Act that meet the requirements of the PFIA and have been specifically approved and authorized by the City Council.
f. Direct obligations of the State of Texas or its agencies, and obligations of agencies, counties, cities, and other political subdivisions of the State of Texas rated as to investment quality by a nationally recognized investment rating firm not less than A or its equivalent.
g. No load “government” money market mutual funds that meet the requirements of the PFIA. Money market mutual funds must maintain an AAAm, or equivalent rating from at least one nationally recognized rating agency; and be specifically approved by the City Council or purchased through the City’s primary depository as an overnight investment tool.
h. Repurchase agreements entered into in compliance with the PFIA.
NOTE: A security’s “average life” does not constitute a stated maturity.
No investment type approved by the PFIA for public investment will be authorized by the City without specific City Council approval and adoption in this Investment Policy. And investments authorized at the time of purchase, which become unauthorized, need not be liquidated immediately. The City shall monitor the rating of each issuer, as applicable, at least quarterly, and take all prudent measures to liquidate an investment that is downgraded to less than its required minimum rating by PFIA. The Investment Officer(s) will make specific suggestions as to the possible liquidation or retention in either situation. The City will provide a competitive environment for individual investment transactions, and financial institution, money market mutual fund, and local government investment pool selections.
This Policy does not apply to an investment donated to the City for a particular purpose or under terms of use specified by the donor
(Section 2256.004). (Ord. No. 0-98-21; 3/18/98)
(Ord. No. 0-2000-21, 3/22/00) (Ord. No. 0-200151, 10/24/01) (Ord. No. 0-2002-54, 11/13/2002)
(0-2003-65, 11/26/03) (Ord. 0-2004-87, 11/10/04) (Ord. 0-2005-91, 11/9/05) (Ord. No. O-2006-93, 11/8/06) (Ord. No. 0-2007-130, 11/14/07) (Ord. No. 0-2008-143, 11/12/08) (Ord. No. 0-2009-84, 8/12/09) Ord. No. 0-2010-121, 11/10/10) (Ord. No. 0-2011-94, 11/9/11) (0-201360, 7/24/13) (Ord.0-2014-98, 10/22/14) (Ord. No. 0-2017-54; 07/12/17) (Ord. No. 0-2019-45; 06/12/19) (Ord. No. 0-2020-62; 7/8/20) (Ord. No. 0-2022-88; 9/14/22)
Sec. 2-52. Investment Limits.
It is the City’s policy to diversify its investment portfolio. Invested funds shall be diversified to minimize risk or loss resulting from overconcentration of assets in a specific maturity, specific issuer, or specific class of investment, where appropriate. Cash flow projections shall be utilized to spread investment maturities, smooth market fluctuations, and reduce reinvestment risk.
The maturity of an investment largely dictates its price volatility. Therefore, the City shall concentrate its investment portfolio in shorterterm maturities to protect market valuation from unanticipated rate movements. The City will attempt to avoid over-investment in cash equivalent investments and match a portion of its investments with anticipated cash flow requirements. The asset allocation in the portfolio will vary depending upon those requirements and the outlook for the economy and the security markets. (Ord. No. 0-98-21; 3/18/98) (Ord. No. 0-2000-21, 3/22/00) (Ord. No. 0-2001-51, 10/24/01) (Ord. No. 0-2002-54, 11/13/2002) (0-2003-65, 11/26/03) (Ord. 0-200487, 11/10/04) (Ord. 0-2005-91, 11/9/05) (Ord. No. O-2006-93, 11/8/06) (Ord. No. 0-2007-130, 11/14/07) (Ord. No. 0-2008-143, 11/12/08) (Ord. No. 0-2009-84, 8/12/09) Ord. No. 0-2010-121, 11/10/10) (Ord. No. 0-2011-94, 11/9/11) (0-201360, 7/24/13) (Ord. No. 0-2014-98; 10/22/14) (Ord. No. 0-2016-20; 02/24/16) (Ord. No. 0-2017-54; 07/12/17) (Ord. No. 0-2019-45; 06/12/19) (Ord. No. 0-2020-62; 7/8/20) (Ord. No. 0-2022-88; 9/14/22)
Sec 2-53. Selection of Broker/Dealers.
The City may utilize the in-house brokerage services of the bank qualifying as City primary depository in the acquisition and disposition of authorized securities. Other broker/dealers meeting the qualifications of this Policy section and selected by the Investment Officers are reviewed and approved by the City Council.
Investment Policy
POLICY CONT. 39
Investment
The approved list of broker/dealers includes the following firms:
Duncan-Williams Securities
FHN Financial
MBS Securities
SAMCO
Wells Fargo Securities
For brokers and dealers of investment securities, the City shall select only dealers reporting to the Market Reports Division of the Federal Reserve Board of New York, also known as the “Primary Government Security Dealers,” unless analysis reveals that other firms are adequately experienced to conduct public business.
All financial institutions and broker/dealers who desire to become qualified bidders for investment transactions must supply the following as appropriate:
• Annual audited financial statements
• Proof of Texas State Securities Commission registration
• Proof of Financial Industry Regulatory Authority (FINRA) certification
Each entity from which the City purchases investments (brokers/banks/pools) shall be provided the City’s Investment Policy. Investment pools and discretionary investment management firms will be required to provide a written certification as described in the PFIA.
It is the policy of the City to create a competitive environment for all individual purchases and sales, financial institution deposits, money market mutual funds, and local government investment pools. (Ord. No. 0-98-21; 3/18/98)
(Ord. No. 0-2000-21, 3/22/00) (Ord. No. 0-200151, 10/24/01) (Ord. No. 0-2002-54, 11/13/2002)
(0-2003-65, 11/26/03) (Ord. 0-2004-87, 11/10/04)
(Ord. 0-2005-91, 11/9/05) (Ord. No. O-2006-93, 11/8/06) (Ord. No. 0-2007-130, 11/14/07) (Ord. No. 0-2008-143, 11/12/08) (Ord. No. 0-2009-84, 8/12/09) Ord. No. 0-2010-121, 11/10/10) (Ord. No. 0-2011-94, 11/9/11) (0-2013-60, 7/24/13)
(Ord. No. 0-2014-98; 10/22/14) (Ord. No. 0-201620; 02/24/16) (Ord. No. 0-2017-54; 07/12/17)
(Ord. No. 0-2019-45; 06/12/19) (Ord. No. 0-202062; 7/8/20) (Ord. No. 0-2021-41; 05/12/21) (Ord. No. 0-2022-88; 9/14/22)
Sec. 2-54. Safekeeping.
Eligible investment securities shall be purchased using the delivery versus payment method. That is, funds shall not be wired or paid until verification has been made that the security has been received by the City safekeeping/clearance agent. The security shall be held in the account of the City. The original copy of all safekeeping receipts shall be delivered to the City. An independent custodian will be used for securities safekeeping. (Ord. No. 0-98-21; 3/18/98) (Ord. No. 0-2000-28, 3/22/00) (Ord. No. 0-2001-51, 10/24/01) (Ord. No. 0-2002-54, 11/13/2002) (Ord. 0-2004-87, 11/10/04) (Ord. 0-2005-91, 11/9/05) (Ord. No. O-2006-93, 11/8/06) (Ord. No. 0-2007-130, 11/14/07) (Ord. No. 0-2008-143, 11/12/08) (Ord. No. 0-2009-84, 8/12/09) Ord. No. 0-2010-121, 11/10/10) (0-2013-60, 7/24/13) (Ord. No. 0-2016-20; 02/24/16) (Ord. No. 0-2017-54; 07/12/17) (Ord. No. 0-2019-45; 06/12/19) (Ord. No. 0-2020-62; 7/8/20) (Ord. No. 0-2022-88; 9/14/22)
Sec. 2-55. Reporting and Audits.
At least quarterly, the Investment Officer(s) shall submit a written report of all investments in compliance with the PFIA. The market valuations obtained by the City shall be from independent sources believed to be accurate and representative of the investments’ true values. The reports shall be submitted to City Council.
An annual compliance audit of management’s controls on investments and adherence to this Investment Policy shall be performed in conjunction with the annual financial audit and include a review of quarterly reports, with the result of the review reported to the City Council by that auditor.
The benchmark for the portfolio will be a rolling three-month Treasury Bill average yield for the reporting period. Reporting will include the benchmark as a gauge of the portfolio’s performance and a measure of risk. Weighted average yield to maturity shall be the measure of portfolio performance. (Ord. No. 0-98-21; 3/18/98) (Ord. No. 0-2000-21, 3/22/00) (Ord. No. 0-2001-51, 10/24/01) (Ord. No. 0-2002-54, 11/13/2002) (0-2003-65, 11/26/03) (Ord. 0-200487, 11/10/04) (Ord. 0-2005-91, 11/9/05) (Ord. No. O-2006-93, 11/8/06) (Ord. No. 0-2007-130, 11/14/07) (Ord. No. 0-2008-143, 11/12/08) (Ord. No. 0-2009-84, 8/12/09) Ord. No. 0-2010-121, 11/10/10) (Ord. No. 0-2011-94, 11/9/11) (0-2013-
Investment Policy
POLICY CONT. 40
Investment
60, 7/24/13) (Ord. No. 0-2016-20; 02/24/16) (Ord. No. 0-2017-54; 07/12/17) (Ord. No. 0-2019-45; 06/12/19) (Ord. No. 0-2020-62; 7/8/20) (Ord. No. 0-2021-41; 05/12/21) (Ord. No. 0-2022-88; 9/14/22)
Sec. 2-56. Review of Investment Policy. The City Council will review and adopt this Investment Policy and investment strategy at least annually, approving changes to policy or strategy. (Ord. No. 0-98-21; 3/18/98) (Ord. No. 0-2000-21, 3/22/00) (Ord. No. 0-2001-51, 10/24/01) (Ord. No. 0-2002-54, 11/13/2002) (02003-65, 11/26/03) (Ord. 0-2004-87, 11/10/04)
(Ord. 0-2005-91, 11/9/05) (Ord. No. O-2006-93, 11/8/06) (Ord. No. 0-2007-130, 11/14/07) (Ord. No. 0-2008-143, 11/12/08) (Ord. No. 0-2009-84, 8/12/09) Ord. No. 0-2010-121, 11/10/10) (Ord. No. 0-2011-94, 11/9/11) (0-2013-60, 7/24/13)
(Ord. No. 0-2016-20; 02/24/16) (Ord. No. 0-201754; 07/12/17) (Ord. No. 0-2019-45; 06/12/19)
(Ord. No. 0-2020-62; 7/8/20) (Ord. No. 0-202288; 9/14/22)
Sec. 2-57. Selection of Depositories. The primary depository shall be selected through the City’s banking services procurement process, which shall include a formal Request for Application (RFA) issued in compliance with applicable State law. A written contract shall be entered into and extended as per the RFA specifications. In selecting the primary depository, the credit worthiness of institution shall be considered, and the Investment Officers shall conduct a review of prospective depository’s credit characteristics and financial history.
The City may also utilize other financial institutions to maintain back-up checking or other transactional accounts, and to place interest bearing deposits.
All deposits placed with the City’s primary depository or other financial institution shall be insured or collateralized in compliance with applicable State law. The City reserves the right, in its sole discretion, to accept or reject any form of insurance or collateralization pledged towards deposits. The City shall receive original safekeeping receipts for securities pledged, copies of any pledged insurance policies or letters of credit, and all pledged securities shall be held by an unaffiliated custodian.
Written authorization by an Investment Officer is required prior to the release of any pledged collateral, insurance, or letter of credit.
The City requires market value of pledged securities in excess of 102% of all uninsured deposits plus accrued interest if any. All financial institutions pledging securities as collateral shall be required to sign a collateralization agreement with the City. The agreement shall define the City’s rights to the collateral in case of default, bankruptcy, or closing and shall establish a perfected security interest in compliance with Federal and State regulations, including:
• The agreement must be in writing;
• The agreement has to be executed by the financial institution and the City contemporaneously with the deposit;
• The agreement must be approved by the Board of Directors or designated committee of the financial institution and a copy of the meeting minutes must be delivered to the City; and
• The agreement must be part of the financial institution’s “official record” continuously since its execution.
The Investment Officers shall monitor deposit and collateral levels at least monthly to maintain adequate coverage. (0-2003-65, 11/26/03) (Ord. 0-2004-87, 11/10/04) (Ord. 0-2005-91, 11/9/05) (Ord. No. O-2006-93, 11/8/06) (Ord. No. 0-2007130, 11/14/07) (Ord. No. 0-2008-143, 11/12/08) (Ord. No. 0-2009-84, 8/12/09) Ord. No. 0-2010121, 11/10/10) (Ord. No. 0-2011-94, 11/9/11) (02013-60, 7/24/13) (Ord. No. 0-2016-20; 02/24/16) (Ord. No. 0-2017-54; 07/12/17) (Ord. No. 0-201945; 06/12/19) (Ord. No. 0-2020-62; 7/8/20) (Ord. No. 0-2021-41; 05/12/21) (Ord. No. 0-2022-88; 9/14/22)
Sec. 2-58. Authorized Collateral
The City shall accept only the following as collateral:
a. Bonds, certificates of indebtedness, or notes of the United States, its agencies or instrumentalities (including the Federal Home Loan Banks), or other evidence of indebtedness of the United States, its agencies or instrumentalities that is guaranteed as to principal and interest by the United States, its agencies or instrumentalities.
b. Obligations, the principal and interest on which, are unconditionally guaranteed or insured by the State of Texas.
Investment Policy
POLICY CONT. 41
c. Bonds of the State of Texas or a county, city or other political subdivision of the State of Texas having been rated no less than “A” or its equivalent by a nationally recognized rating agency with a remaining maturity of ten (10) years or less.
d. Letters of credit issued by the United States or its agencies and instrumentalities, including the Federal Home Loan Banks. (Ord. No. 0-2009-84, 8/12/09) Ord. No. 0-2010-121, 11/10/10) (Ord. No. 0-2011-94, 11/9/11) (0-2013-60, 7/24/13) (Ord. No. 0-2016-20; 02/24/16) (Ord. No. 0-2017-54; 07/12/17) (Ord. No. 0-2019-45; 06/12/19) (Ord. No. 0-2020-62; 7/8/20) (Ord. No. 0-2022-88; 9/14/22)


Sec. 2-59. Reserved.
PART 2: Should any section, subsection, sentence, provision, clause or phrase be held to be invalid for any reason, such holding shall not render invalid any other section, subsection, sentence, provision, clause or phrase of this ordinance and same are deemed severable for this purpose.


PART 3: That this ordinance shall be effective on and after its date of passage and approval by the City Council. PASSED AND APPROVED this 14th day of September, 2022.
ATTEST:
APPROVED:
Investment Policy
Investment
DON WARREN, MAYOR OF THE CITY OF TYLER, TEXAS
POLICY CONT. 42
CITY ATTORNEY
Strategic Plan CITYWIDE
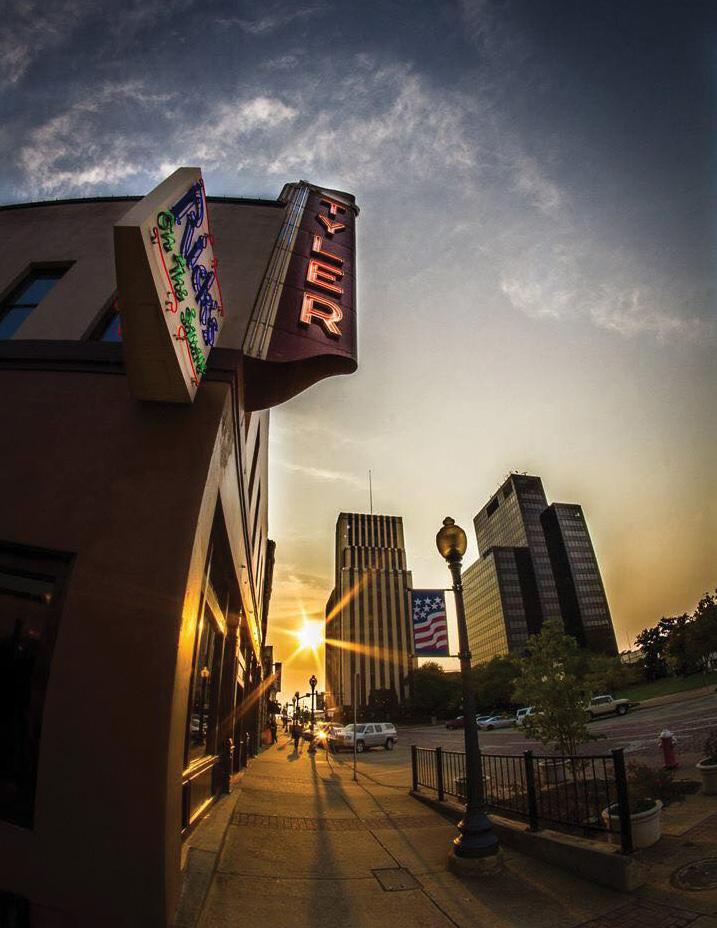
Strategic PLANNING
The City of Tyler’s Strategic Plan is a combination of the visions of our Community, our Mayor and City Council, and City Staff. We strive to align these visions throughout our operations.
TYLER 1ST
In 2007 the City Council voted to adopt the guiding principles of Tyler 1st (formerly known as Tyler 21). The planning process took over 18 months to complete and included a community visioning retreat (attended by over 300 citizens), six open houses, a survey, multiple focus groups, and interviews with community leaders. The process created the long-range vision below.
“The City of Tyler aspires to set the highest standards for an outstanding quality of life. By 2030, the City of Tyler will be nationally known for its sense of community, commitment to a robust business environment, quality medical care, excellent educational institutions and the beauty of its public places and neighborhoods. “
With this vision in mind, the following guiding principles of Tyler 1st were adopted
1. Connect people to one another and in community:
• Preserve and protect Tyler’s values of friendliness, family, faith and community connections, which will be the foundation for the success of Tyler 1st.
• Encourage multiple opportunities for face-to-face encounters for personal relationships to develop.
2. Promote balanced Growth:
• Promote growth and redevelopment in downtown and all sectors of the city.
• Revitalize North Tyler.
• Enhance links to I-20 and Toll 49.
• Enhance infrastructure in targeted growth areas/priority annexation areas.
• Allow market directed growth while respecting the right of private ownership.
3. Provide neighborhoods that are attractive centers of community:
• Encourage and promote appealing, safe, affordable, and stable places to live for people with a wide range of incomes.
• Encourage and promote a variety of housing types for families, singles, older persons, and other kinds of households. Enhance and create neighborhoods containing walkable centers with a mix of housing and shopping to serve residents.
• Promote affordable development costs for residential development.
• Encourage environmentally friendly development to support Tyler’s natural beauty.
4. Protect and enhance open spaces, parks, and trees in a connected network for recreation and a healthy environment:
• Create a network of greenways, parks and open spaces linking city and county destinations, such as the lakes and the state park.
• Encourage development of new neighborhood parks.
• Encourage the planting of trees along streets and in public and private places. Encourage amenities in older parks, including lighting and security.
5. Provide transportation options:
• Encourage continuous bicycle and pedestrian routes and trails that connect city destinations.
• Adopt land use strategies that create higher-density, mixed-use clusters of “transit-ready” development that can support expansion of the public transportation system.
• Plan for and preserve potential new transportation corridors and work with regional partners to support efficient transportation options throughout east Texas.
• Emphasize links within the city via multimodal connections with the airport, rail, and bus services.
• Accommodate regional traffic flow by proactively planning for future corridors and alternate routes and connectivity options.
• Identify and develop specific gateways.
citywide strategic plan
44
Strategic PLANNING
6. Reinvigorate the City Center to be the downtown of East Texas:
• Develop a major downtown neighborhood of new and rehabilitated housing to provide the foundation for shopping, restaurants, culture, arts and entertainment in the evenings and on the weekend.
• Bring focus to culture, arts, entertainment, and education through a concentration of cultural and entertainment venues downtown.
• Program events throughout the year to attract visitors from around the region.
• Develop a transportation hub downtown.
• Enlist Smith County, area churches and other entities to recruit downtown programs and investments.
7. Preserve, enhance, and communicate Tyler’s historic heritage:
• Protect the integrity of local and national historic districts, balancing strategies with private property rights.
• Conserve unique character through preservation of historic buildings throughout the city.
• Encourage infill development that, while expressing its own time, is respectful of historic character.
• Create heritage trails and historic markers to identify diverse aspects of Tyler’s history, such as African American heritage, the rose industry, the oil and gas industry, and the railroad industry.
Cultivate an environment that drives business and Tyler’s medical and educational institutions:
• Sustain policies that allow businesses to flourish.
• Continue to foster the city’s role as the retail hub of a broad region.
• Maintain support for the medical centers, colleges, and the university.
• Foster an innovation economy based on high quality jobs, enterprises and a high-quality public education system. preserving Tyler’s historic heritage will be one key to keeping its unique character.
• Continue to be the economic driver and leader in the east Texas region.
Maintain excellent municipal facilities and services:
• Continue city government’s focus on meeting the highest standards of responsiveness, service and efficiency.
• Provide excellent value for taxpayer dollars.
• Continue to recruit, retain, promote and develop high quality staff.
• Maintain existing infrastructure and provide for growth.
• Measure customer satisfaction frequently to ensure accountability in providing quality customer service.
Maintain and enhance our strong Community and regional partnerships:
• Building on a tradition of philanthropy and public-private partnerships, bring together the public, private, and nonprofit sectors to realize the Tyler 1st Next Generation vision.
• Expand participation throughout the Tyler community.
• Continue to reach out and enhance partnerships with school districts, neighboring cities, and county government.
Cultivate life-long learning through high quality education and skill development at every level:
• Develop Tyler as an educational destination.
• Champion, support and partner with K-12 public schools, colleges and universities for excellence in academic achievement.
• Encourage an environment of education and life-long learning in families.
• Collaborate with business entities to enhance educational efforts and skill development.
• Recognize that education directly impacts economic development and quality of life.
Progress towards the goals outlined in the Tyler 1st documents can be view by visiting the Tyler 1st website.
City of Tyler’s Strategic Planning
When creating the City’s strategic Plan, the vision and principles of Tyler 1st were heavily considered. In each of the goals listed in the chart below, there is direct alignment between the chapters of Tyler 1st and the goals of the City of Tyler.
citywide strategic plan
CONT.
45
Citywide STRATEGIC PLAN 2020-2022
CITY OF TYLER | TYLER 1ST GOALS
Our vision is to be the standard for performance excellence in local government
Our mission is to SERVE the community to make a positive difference.
Our values are SERVE: Streamline, Empower, Respond, Venture, Evaluate
Tyler 1st Chapters:
4. Downtown Master Plan (DMP)
5. North End Revitalization (NER)
6. Historic Preservation (HP)
7. Parks, Open Space, Recreation & Lakes (POSR&L)
8. Housing, Neighborhoods & Community Identity (HN&CI)
9. Business & Economy (B&E)
10. Transportation and Circulation (T&C)
11. Public Facilities & Services (PF&S)
12. Future Land Use & Annexation Guide (FLU&AG)
13. Education (E)
Goal 1: Public Safety & Unified Neighborhoods
• Preserve community security through policing (11. PF&S)
• Protect lives and property with fire and emergency services (11. PF&S)
• Sustain and maintain established neighborhoods (8. HN&CI)
• Expand housing options for low and moderate income families (8. HN&CI)
Goal 2: Quality of Life & Place
• Create full-service, mixed-use destination Downtown (4. DMP)
• Ensure Historic Preservation (6. HP)
• Enhance and promote culture, tourism and recreation (7. POSR&L)
Goal 3: Infrastructure Improvements and Investment
• Improve travel in Tyler (10. T&C)
• Prepare to become the regional water & wastewater provider by providing strategic focus and initiatives for TWU (11. PF)
• Address and control storm water (11. PF&S)
• Maintain and enhance city facilities and public services (11. PF&S)
Goal 4: Development & Growth
• Encourage growth and economic development through use of Public/Private Partnerships (PPP) (9. B&E)
• Develop an innovation economy (9. B&E)
• Focus on balanced and sustainable growth (9. B&E)
• Promote the Airport as a regional hub (9. B&E)
• Improve collaborative approaches through partnerships with schools, colleges, and county (11. PF&S)
Goal 5: Leverage Fiscal, Technological & Human Resources (Organizational Development & Resource Management)
• Practice sound financial management (11. PF&S)
• Build and maintain a talented and experienced workforce (11. PF&S)
• Maintain and enhance technology (9. B&E)
• Support the SERVE Culture (11. PF&S)
citywide strategic plan
46
All Funds BUDGET SUMMARY
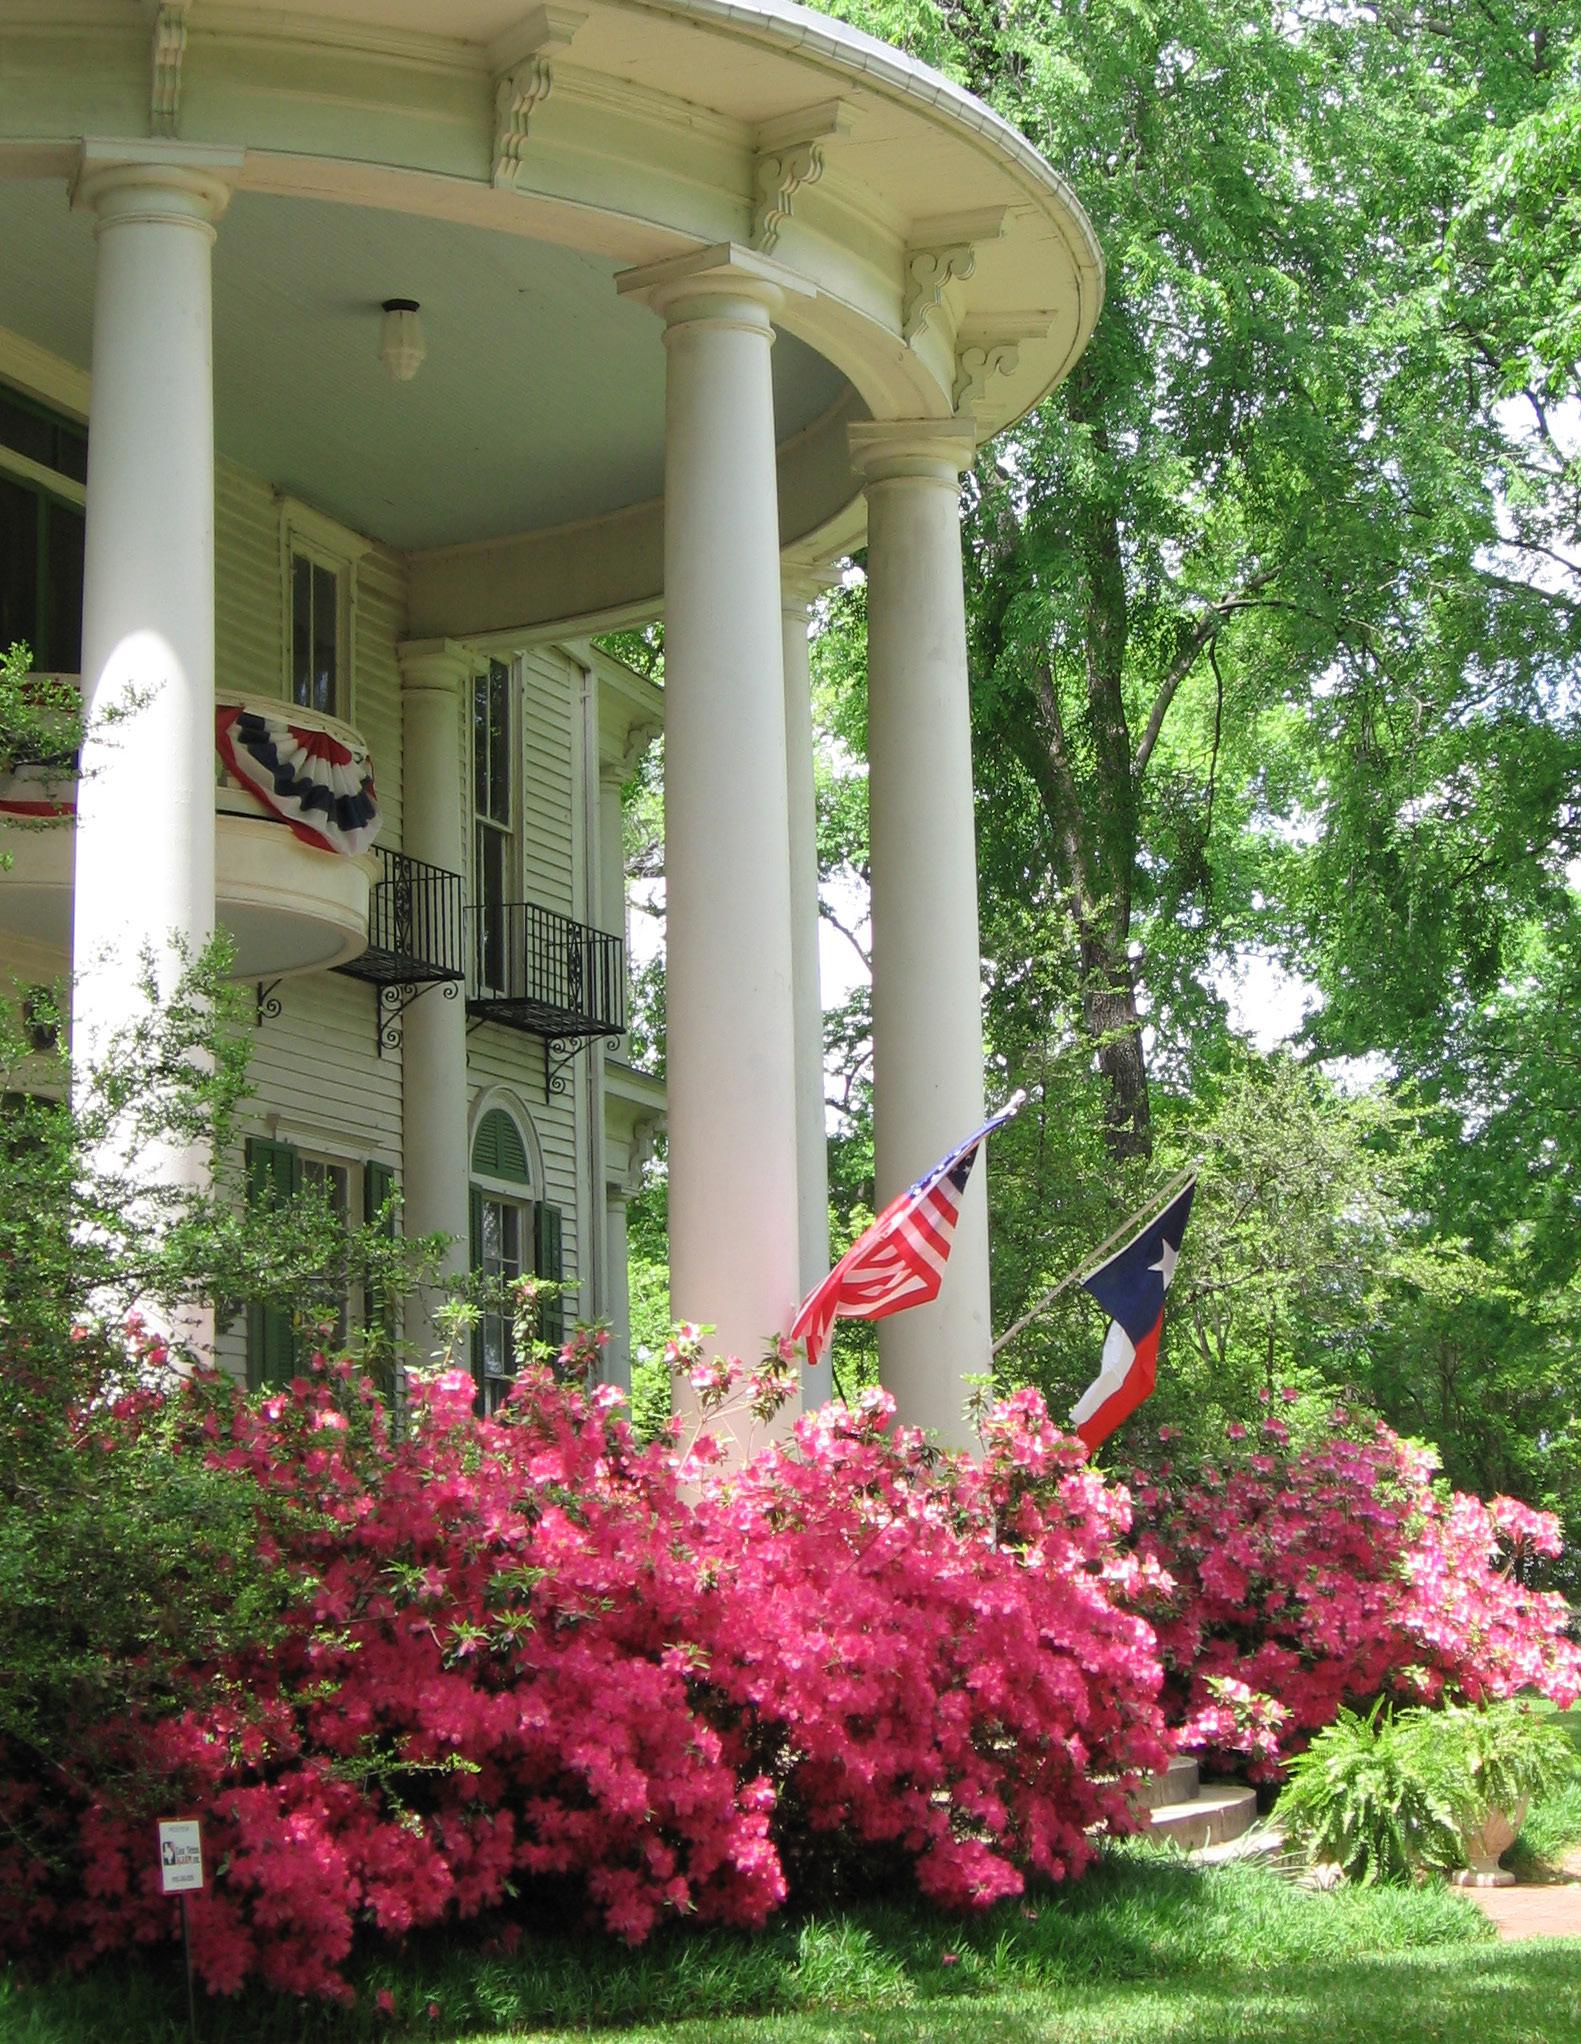
Combined Statement
OF REVENUES AND EXPENDITURES- ALL FUNDS
FISCAL YEAR 2022 – 2023
Budget Summary All Funds
FUND OPENING BALANCE REVENUES EXPENDITURES TRANSFERS IN / (TRANSFERS OUT) CLOSING BALANCE 101 General 18,237,434 86,810,085 83,408,918 (3,401,167) 18,237,434 102 General Capital Projects 2,656,728 9,000 2,386,161 93,811 373,378 103 Street Improvements 236,353 1,394 2,029,801 1,829,862 37,808 202 Development Services 1,243,343 2,679,350 2,629,063 - 1,293,630 204 Cemeteries Operating 18,108 185,869 470,870 315,000 48,107 205 Police Forfeitures 283,981 63,233 177,000 - 170,214 206 Park Improvement Fund 168,416 675,385 662,000 - 181,801 207 Court Special Fees 11,544 501,019 485,821 - 26,742 208 Economic Development Fund 359,253 1,500 208,750 275,000 427,003 211 Hotel Occupancy Tax 2,133,912 4,303,062 1,080,900 132,200 5,488,274 217 TIF/TIRZ # 4 67,991 102,666 - - 170,657 218 TIF/TIRZ # 3 741,960 128,371 5,000 - 865,331 219 Tourism and Convention 343,422 967,900 3,166,096 2,480,000 625,226 234 Passenger Facility 221,167 152,000 - (72,000) 301,167 235 Rainy Day Fund 8,290,145 115,000 100,000 - 8,305,145 236 PEG Fee 1,156,578 244,168 316,116 - 1,084,630 274 Homeownership and Housing 429 14 - - 443 276 Housing Assistance 866,209 9,688,763 10,156,974 - 397,998 285 MPO - 831,823 831,823 -286 Transit System 150,398 4,417,764 4,817,764 400,000 150,398 294 Community Development Grant 86,889 814,475 804,475 - 96,889 295 Home Grant 18,335 1,076,168 1,076,168 - 18,335 302 HOT Debt Service Fund 2,437 - 592,800 592,800 2,437 502 Utilities Operations 15,265,188 51,251,413 39,217,358 (10,984,134) 16,315,109 503 Utilities Construction 5,001,704 5,962,090 15,630,488 5,500,000 833,306 504 Utilities Debt Service 994,690 5,768,141 10,184,363 4,558,482 1,136,950 505 Utilities Debt Reserve 818,364 15,837 - - 834,201 524 Airport 939,099 1,907,222 1,949,613 2,525 899,233 560 Solid Waste 2,311,378 17,276,578 15,874,822 (1,175,653) 2,537,481 562 Solid Waste Capital 320,969 5,000 860,000 725,000 190,969 575 Storm Water 1,810,302 2,249,908 2,919,073 - 1,141,137 639 Productivity 2,448,253 45,428 1,389,910 550,000 1,653,771 640 Fleet Maintenance/ Replacement 5,484,548 16,773,911 16,844,421 (100,000) 5,314,038 650 Property and Liability 74,924 3,833,338 3,380,671 - 527,591 661 Active Employees Benefits 2,147,143 15,899,987 15,566,878 - 2,480,252 663 Facilities Maintenance 1,181,083 612,305 1,371,015 227,611 649,984 671 Technology 1,528,902 5,329,830 7,032,196 1,307,000 1,133,536 713 Cemeteries Trust 3,254,963 124,600 - (15,000) 3,364,563 761 Retired Employees Benefits 78,916 2,945,559 2,959,913 - 64,562 48
Major REVENUE SOURCES
GENERAL FUND
As indicated by the chart below, General Fund revenues for FY2022-2023 are projected at $86,810,085, which is an increase of 10.26 percent over the FY2022-2023 budget of $78,728,858. As indicated in the chart below the increase is primarily due to increases in projected increases in Sales tax and property tax revenue from new construction/growth in appraisal values.
Following is a summary of each major revenue category, explaining the basis for projections and reasons for changes.
SALES TAX
Sales tax is the largest of the General Fund’s revenue sources representing 45 percent of the fund’s total revenues. Actual collections for FY2021-2022 are projected to be higher than budgeted. The City is projecting a 1.5% increase in budget for FY2022-2023 compared to the current year projected collections.
Budget Summary All Funds
ACTUALS 2020-2021 AMENDED BUDGET 2021-2022 PROJECTED 2021-2022 BUDGET 2022-2023 REVENUES Property Taxes 23,377,890 25,238,387 25,198,767 27,223,265 Franchises 10,708,605 11,038,781 10,472,034 11,204,758 Sales & Use Taxes 34,854,058 34,305,369 38,956,592 39,568,835 Licenses & Permits 452,933 451,915 473,619 503,513 Fines & Penalties 3,766,491 3,791,590 4,005,485 3,961,000 Use of Money & Property 225,911 220,000 203,352 230,480 Current Services 2,466,694 2,635,739 2,550,151 2,817,593 Other Agencies 484,662 607,365 628,668 607,365 Miscellaneous 774,157 439,712 745,043 693,276 TOTAL REVENUES 77,111,401 78,728,858 83,233,711 86,810,085
40,000,000 FY2012-13 FY2013-14 FY2014-15 FY2015-16 FY2016-17 FY2017-18 FY2018-19 FY2019-20 FY2020-21 FY2021-22 FY2022-23 35,000,000 30,000,000 25,000,000 20,000,000 15,000,000 10,000,000 5,000,000 $24,463,179 $26,407,438 $26,917,614 $26,338,713 $26,775,850 $28,494,304 $30,257,590 $30,442,251 $34,258,127 $38,344,442 $38,919,609 49
Major REVENUE SOURCES CONT.
PROPERTY TAX
Property tax is the General Fund’s next largest single source of revenue at 31 percent. As indicated in the chart below, taxable values increased over the last 10 years. In order to fund a street improvement fund the City increased its current rate by one cent. The current tax rate at .261850 cents per $100 of valuation. Although the City continued the constrained spending philosophy demonstrated during the prior fiscal year budget and operating cycle, this proposed tax rate will ensure the City of Tyler is able to maintain current levels of service. The philosophy of City government has been to pay as you go for construction projects. The City paid off all remaining tax supported debt issues in FY2007-2008. This largely facilitated the City’s ability to lower its total property tax rate over the last 10 years.
FRANCHISES
Franchise taxes are 13 percent of the total General Fund revenues for FY2022-2023. Electric, gas and water franchises are based on usage and are influenced by the weather during the summer and winter months. The telephone franchise fees have slightly declined in recent years due to increases in the use of non-traditional phone services such as cell phones and VOIP. Cable franchise collections provide a consistent source of franchise revenue.
FINES AND PENALTIES
Fees and fines are 5 percent of the total General Fund. The City has historically reviewed the revenue collections for major categories and used these values to make future projections. Fines and Penalties is one such category. A more effective and publicized warrant sweep program has been in place for many years. The court has installed license plate recognition software in the marshal’s unit to help with the warrant process. A continued effort is being made to increase collections within the court and to encourage payment of fines.
Budget Summary All Funds
FISCAL YEAR TOTAL RATE CERTIFIED VALUES % CHANGE 2013-2014 0.2200000 7,012,396,334 2014-2015 0.2200000 7,191,673,279 2.56% 2015-2016 0.2200000 7,519,723,382 4.56% 2016-2017 0.2300000 7,807,290,136 3.82% 2017-2018 0.2400000 8,117,880,826 3.98% 2018-2019 0.2444520 8,675,367,458 6.87% 2019-2020 0.2599000 9,064,015,823 4.48% 2020-2021 0.2590000 9,397,648,602 3.68% 2021-2022 0.2699000 9,770,807,914 3.97% 2022-2023 0.2618500 10,948,828,831 12.06%
50
Major REVENUE SOURCES CONT.
DEVELOPMENT SERVICES
As indicated by the chart below, Development Services revenues for FY2022-2023 are projected at $2,679,350, which is an increase from the FY2021-2022 appropriated budget of $2,224,809. The Development Services revenue is determined using trend analysis. In an attempt to more accurately track the revenues and expenditures related to the developments services activities, the City created a separate fund in FY2005-2006. Continued review of the trend analysis will allow the City to adjust fees to match costs related to the service activities provided.
HOTEL/MOTEL TAX
Revenues in the Hotel/Motel Tax Fund are projected to increase 13 percent over FY20212022 projections. This increase is based on the collection of the seven percent occupancy tax as well as an additional two percent occupancy tax to be used for new or expanded visitor facilities which was approved by the State legislature in June 2011. Tyler continues to see the addition of new hotels and renovations of hotels within the city limits. Collections are expected to increase as the economy improves. Expenditures to outside agencies remained the same level as the previous year.
TOURISM AND CONVENTION FUND
Revenues in the Tourism and Conventions Fund are projected to remain relatively constant. Revenue for rentals and concessions are projected using trend analysis.
Budget Summary All Funds
ACTUALS 2020-2021 AMENDED BUDGET 2021-2022 PROJECTED 2021-2022 BUDGET 2022-2023 REVENUES Building Permits 1,208,071 1,308,764 1,539,767 1,616,755 Electrical Permits 172,218 160,000 199,673 185,000 Plumbing Permits 134,787 118,450 132,806 135,000 Zoning Permits 70,946 75,000 79,210 80,000 Mechanical Permits 59,526 90,000 89,045 90,000 Cert. of Occupancy Fees 24,550 30,000 30,000 30,000 Local TABC Fee 9,160 15,000 8,410 15,000 Billboard Registration 16,660 17,595 15,895 17,595 Sign Permits 19,132 40,000 36,819 60,000 Contractor License 22,065 50,000 35,450 50,000 House Moving Permits - - -Permit Fee - Clearing - - -Interest Earnings 12,571 30,000 9,069 10,000 Copying/Printing Fees - - -Platting Fees 100,584 70,000 82,174 80,000 Miscellaneous Income - - -Contractor Testing Fees 283,833 160,000 287,668 250,000 Subdivision Plan Review 50,000 60,000 60,000 60,000 TOTAL REVENUES 2,184,503 2,224,809 2,605,986 2,679,350 51
Major REVENUE SOURCES CONT.
HOUSING ASSISTANCE PAYMENTS FUND
The Housing Assistance Payments Program (HAPP), Section 8, is one of the largest sources of grant funding for the City of Tyler. The program shows a similar budget in FY2022-2023 compared to the prior fiscal year. This program provides housing assistance for low-income families. The Tyler program continues to seek additional funding opportunities such as the Family Self Sufficiency, Tenant Protection Program, and the VASH Program.
STATE AND FEDERAL GRANT FUND
All state and federal grants are budgeted based on the amount awarded by the outside agency. The major grants awarded in the following fiscal year include the Metropolitan Planning Organization (MPO) Planning Grant and the Transportation Authority (TSA) Grant. All grants in this fund are reimbursement type grants.
UTILITIES FUND
TRANSIT SYSTEM FUND
Tyler Transit is a fixed route public transportation system provided by the City of Tyler to its residents. The system is managed by the City of Tyler. Six routes are currently in place with buses operating five days a week. The transportation system also provides paratransit services for scheduled service utilizing a contractor. Funding for this service is provided through transit fares, matching funds from the City of Tyler, grant funding from the Federal Transportation Administration and the Texas Department of Transportation.
GENERAL DEBT SERVICE FUND
The City no longer supports any tax supported debt.
As indicated by the chart below, Utility Fund revenues for FY2022-2023 are projected at $51,251,413, which is an increase over the FY2021-2022 budget of $43,847,342. The major sources of revenue for the Utilities Fund are the Water and Sewer charges. Both revenues are determined through rate studies; a recently completed rate study indicated a need for increased sewer rates to be phased in over several fiscal years. In FY 2022-2023 there were no increases to water or sewer base rates. The City of Tyler is moving from a declining rate structure for water and sewer rates to a uniform volumetric rate. This will be phased in over a five-year period with the water and sewer rates being uniform in year 5.
UTILITIES DEBT SERVICE FUND
The Utilities Debt Service Fund accumulates funds for the semiannual principal and interest payments on all Utility revenue debt. Revenue bond debt as of Oct. 1, 2022 will total $127,230,000. The current debt service requirement for revenue debt is $10,169,363 including interest. The City continues to evaluate capital projects to determine funding sources on a yearly basis.
Budget Summary All Funds
ACTUALS 2020-2021 AMENDED BUDGET 2021-2022 PROJECTED 2021-2022 BUDGET 2022-2023 REVENUES Use of Money and Property 161,903 150,637 143,103 142,867 Charges for Current Services 43,739,030 43,653,990 44,785,514 51,058,796 Miscellaneous Income 62,754 42,715 45,222 49,750 TOTAL REVENUES 43,963,687 43,847,342 44,973,839 51,251,413 52
Major REVENUE SOURCES CONT.
AIRPORT OPERATING FUND
As indicated by the chart below, Airport Operating revenues for FY2022-2023 are projected at $986,817, which is a decrease from the FY2021-2022 budget. The major source of revenue for the Airport Operating Fund is the long-term parking and car-leasing rental. Other large sources of revenue include airline facilities rental and hanger leases. Both revenues are calculated using a similar trend analysis. The airport opened a new wash bay facility for the rental car companies in FY2013-2014. This has helped to add additional revenue. Transfers from the customer facility fund will provide funds for debt service.
Budget Summary All Funds
ACTUALS 2020-2021 AMENDED BUDGET 2021-2022 PROJECTED 2021-2022 BUDGET 2022-2023 USE OF MONEY AND PROPERTY Airline Facilities Rental 45,000 45,000 45,000 45,000 Airport Long-Term Parking 304,259 377,981 370,969 360,000 Interest Earnings 6,735 6,000 2,490 3,000 Landing Fees 38,517 42,133 45,776 45,000 Restaurant Concessions 12,084 9,600 8,643 9,500 FAA Building Rental 56,760 53,614 50,408 55,806 Car Leasing Rental 282,619 272,452 289,387 290,000 Agricultural Lease 418 1,868 2,111 1,693 Hangar Land Lease 106,419 121,367 111,931 129,791 HAMM 15,000 15,000 15,000 15,000 Common Use Fees 12,359 14,700 15,559 15,000 Wash Bay Fees 9,024 14,000 12,080 11,500 Non Aviation Land Lease 20,071 21,500 4,299 5,527 TOTAL USE OF MONEY AND PROPERTY 909,265 995,215 973,653 986,817 53
Major REVENUE SOURCES CONT.
SOLID WASTE FUND
The Solid Waste Fund provides for the administration, operation and maintenance of the City’s solid waste system that includes collection, recycling and litter control. Revenues for FY2022-2023 are projected at $17,276,578, which increased over the FY2021-2022 budget of $15,725,649. The major sources of revenue for the Solid Waste fund include the residential, commercial and roll-off charges for services. The increase in revenues are derived from an increase in the base collection rate for both residential and commercial customers based on an annual review of CPI.
STORM WATER FUND
The Storm Water Fund is responsible for the maintenance, management, and regulatory compliance of the storm water system. This revenue is collected as a percentage of water charges and is restricted for use for storm drainage improvements. The revenue increased from 6% to 7% for FY2022-2023.
Budget Summary All Funds
ACTUALS 2020-2021 AMENDED BUDGET 2021-2022 PROJECTED 2021-2022 BUDGET 2022-2023 USE OF MONEY AND PROPERTY Rent - Miscellaneous 10,418 6,189 4,925 6,084 Interest Earnings 3,638 3,969 2,385 2,281 TOTAL USE OF MONEY AND PROPERTY 14,056 10,158 7,310 8,365 CHARGES FOR CURRENT SERVICES Residential Sanitation Fees 7,455,695 8,365,860 8,370,094 8,961,000 Commercial Fees 4,582,604 4,568,412 4,604,086 4,803,359 Roll-Off Collection Fees 1,631,072 1,731,811 1,721,229 1,717,905 TOTAL CHARGES FOR CURRENT SERVICES 13,669,371 14,666,083 14,695,409 15,482,264 RECYCLE SALES Recycle Sales 100,021 85,000 114,885 128,140 TOTAL RECYCLE SALES 100,021 85,000 114,885 128,140 MISCELLANEOUS INCOME Landfill Royalty Fee 701,657 692,743 803,949 793,761 Miscellaneous Income 40,684 271,665 852,906 864,048 Landfill Tipping Fee 633,365 - -TOTAL MISCELLANEOUS INCOME 1,375,706 964,408 1,656,855 1,657,809 TOTAL REVENUES $15,159,154 $15,725,649 $16,474,459 $17,276,578 54
Positions Summary ALL FUNDS
FISCAL YEAR 2022 – 2023
Budget Summary All Funds
Full Time 2018-2019 2019-2020 2020-2021 2021-2022 2022-2023 GENERAL SERVICES Capital Projects City Manager 2.00 2.00 2.00 2.00 2.00 Communications 2.47 5.00 5.00 5.00 5.00 Engineering 4.85 5.00 5.00 5.00 5.00 Finance 9.75 9.75 9.75 9.75 9.75 Fire Department 162.00 164.00 164.00 166.00 168.00 Human Resources 6.60 6.60 7.00 8.00 8.00 Animal Services 15.00 15.00 15.00 15.00 15.00 Legal 8.00 8.00 8.00 8.00 8.00 Library 18.00 18.00 18.00 18.00 18.00 Municipal Court 15.00 15.00 15.00 15.00 15.00 Municipal Security 3.00 3.00 3.00 3.00 3.00 Municipal Partners for Youth 4.00 4.00 4.00 4.00 4.00 Court Special Fee 2.00 2.00 2.00 2.00 2.00 Parks and Recreation 17.50 17.30 17.30 17.30 17.30 Parks and Recreation - Indoor Recreation 7.00 7.00 8.00 8.00 8.00 Parks and Recreation - Median Maint. 5.00 5.00 5.00 5.00 5.00 Parks and Recreation - Outdoor Recreation 1.00 1.00 1.00 1.00 1.00 Police Department - Auto Theft Task Force 1.00 1.00 1.00 1.00 1.00 Police Department - DEA Task Force - - - -Police Department - COPPS Grant 4.00 4.00 6.00 6.00 6.00 Police Department - Operations 240.25 242.00 242.00 244.00 244.00 Street 28.00 28.00 28.00 28.00 28.00 Traffic Engineering 11.76 10.00 10.00 10.00 10.00 TOTAL 566.42 572.65 576.05 581.05 583.05 Full Time 2018-2019 2019-2020 2020-2021 2021-2022 2022-2023 DEVELOPMENT SERVICES FUND Building Inspections 12.00 13.00 13.00 13.00 13.00 Planning and Zoning 7.00 7.00 7.00 7.00 7.00 TOTAL 19.00 20.00 20.00 20.00 20.00 Full Time 2018-2019 2019-2020 2020-2021 2021-2022 2022-2023 WATER UTILITIES FUND Lake Tyler 10.00 10.00 10.00 10.00 10.00 Storm Water Management 13.22 13.00 13.00 13.00 13.00 Wastewater Collection 26.00 26.00 26.00 26.00 26.00 Wastewater Treatment 30.00 32.00 32.00 32.00 32.00 Water Administration 7.00 8.00 8.00 8.00 8.00 Water Purchasing 3.00 3.00 3.00 3.00 3.00 Water GIS 6.00 9.00 9.00 9.00 9.00 Water Business Office 19.00 19.00 19.00 19.00 19.00 Water Consent Decree 1.00 - - -Water Distribution 33.00 30.00 32.00 32.00 32.00 Water Plant 28.00 27.00 27.00 27.00 27.00 TOTAL 176.22 177.00 179.00 179.00 179.00 55
Positions Summary
FISCAL YEAR 2022 – 2023
Budget Summary All Funds
CONT.
ALL FUNDS
Full Time 2018-2019 2019-2020 2020-2021 2021-2022 2022-2023 OTHER FUNDS Cemeteries 3.00 4.00 4.00 4.00 4.00 Community Development 3.60 2.60 2.70 2.70 2.70 Fleet Maintenance 15.00 15.00 16.00 16.00 16.00 FSS Homeownership 1.00 1.00 1.00 1.00 1.00 HOME 0.30 0.30 0.20 0.20 0.20 Housing 10.10 11.10 11.10 11.10 11.10 MPO - - - -Productivity 3.75 1.00 2.00 2.00 2.00 Property and Facility Management 2.00 2.00 2.00 2.00 2.00 Property, Liability, Disability and Workers Compensation 1.40 1.40 1.00 1.00 1.00 Employee Benefits - - - -Retiree Benefits - - - -Technology Services 13.00 13.00 13.00 14.00 14.00 Tourism - Main Street 4.76 4.40 4.40 4.40 4.40 Tourism - Rose Garden Center 4.00 4.00 4.00 4.00 4.00 Tourism - Visitor's Facility 5.20 5.30 5.30 5.30 7.30 Tourism - Rose Garden Maintenance 7.00 7.00 7.00 7.00 7.00 Transit 25.25 25.25 27.25 27.25 29.25 TOTAL 99.36 97.35 100.95 101.95 105.95 GRAND TOTAL 937.00 943.00 952.00 958.00 964.00 Full Time 2018-2019 2019-2020 2020-2021 2021-2022 2022-2023 SOLID WASTE FUND Solid Waste Administration 7.00 7.00 7.00 7.00 7.00 Solid Waste Code Enforcement 11.00 11.00 11.00 11.00 11.00 Solid Waste Commercial 16.00 16.00 16.00 16.00 16.00 Solid Waste Keep Tyler Beautiful 1.00 1.00 1.00 1.00 1.00 Solid Waste Residential 32.00 30.00 30.00 30.00 30.00 TOTAL 65.00 65.00 65.00 65.00 65.00 Full Time 2018-2019 2019-2020 2020-2021 2021-2022 2022-2023 AIRPORT FUND Airport 11.00 11.00 11.00 11.00 11.00 TOTAL 11.00 11.00 11.00 11.00 11.00 56
Positions Summary ALL FUNDS
FISCAL YEAR 2022 – 2023
Budget Summary All Funds
CONT.
Part Time 2018-2019 2019-2020 2020-2021 2021-2022 2022-2023 GENERAL SERVICES Library 14.00 14.00 14.00 14.00 14.00 Parks and Recreation - Indoor Recreation 3.00 3.00 2.00 2.00 2.00 Parks and Recreation - Outdoor Recreation 1.00 1.00 1.00 1.00 1.00 Police Department - Operations 1.00 1.00 1.00 1.00 1.00 Traffic Engineering 2.00 2.00 2.00 2.00 2.00 TOTAL 21.00 21.00 20.00 20.00 20.00 Substitutes / Temporary Employees 2017-2018 2018-2019 2019-2020 2020-2021 2021-2022 GENERAL SERVICES Library 7 7 7 7 7 Parks and Recreation - Outdoor Recreation 31 31 31 31 31 Traffic Engineering 40 40 40 40 40 TOTAL 78.00 78.00 78.00 78.00 78.00 Substitutes / Temporary Employees 2017-2018 2018-2019 2019-2020 2020-2021 2021-2022 OTHER FUNDS Tourism - Visitor's Facility 1 1 - -Transit 6 6 6 6 6 TOTAL 7 7 6 6 6 GRAND TOTAL 85.00 85.00 84.00 84.00 84.00 Full Time 2017-2018 2018-2019 2019-2020 2020-2021 2021-2022 SOLID WASTE FUND Solid Waste Keep Tyler Beautiful - - 1.00 1.00 1.00 TOTAL - - 1.00 1.00 1.00 Part Time 2018-2019 2019-2020 2020-2021 2021-2022 2022-2023 OTHER FUNDS Property, Liability, Disability and Workers Compensation 1.00 1.00 1.00 1.00 1.00 Tourism - Visitor's Facility 2.00 3.00 3.00 3.00 3.00 Technology Services - - 1.00 -TOTAL 3.00 4.00 5.00 4.00 4.00 GRAND TOTAL 24.00 26.00 26.00 25.00 25.00 Substitutes / Temporary Employees 2018-2019 2019-2020 2020-2021 2021-2022 2022-2023 GENERAL SERVICES Library 7 7 7 7 7 Parks and Recreation - Outdoor Recreation 31 31 31 31 31 Traffic Engineering 40 40 40 40 40 TOTAL 78.00 78.00 78.00 78.00 78.00 Part Time 2018-2019 2019-2020 2020-2021 2021-2022 2022-2023 SOLID WASTE FUND Solid Waste Keep Tyler Beautiful - 1.00 1.00 1.00 1.00 TOTAL - 1.00 1.00 1.00 1.00 Substitutes / Temporary Employees 2018-2019 2019-2020 2020-2021 2021-2022 2022-2023 OTHER FUNDS Tourism - Visitor's Facility 1 - - -Transit 6 6 6 6 6 TOTAL 6 6 6 6 4.00 GRAND TOTAL 85.00 84.00 84.00 84.00 84.00 57
Fund GENERAL

General FUND (101)
STATEMENT OF REVENUES, EXPENDITURES, AND CHANGES IN WORKING CAPITAL
GENERAL FUND
ACTUALS 2020-2021 AMENDED BUDGET 2021-2022 PROJECTED 2021-2022 BUDGET 2022-2023 Unreserved Fund Balance $7,854,034 $4,720,172 $4,720,172 $7,044,104 Operating Reserve 10,274,240 10,642,464 10,642,464 11,193,330 BEGINNING FUND BALANCE / WORKING CAPITAL 18,128,274 15,362,636 15,362,636 18,237,434 REVENUES Property Taxes 23,377,890 25,238,387 25,198,767 27,223,265 Franchises 10,708,605 11,038,781 10,472,034 11,204,758 Sales & Use Taxes 34,854,058 34,305,369 38,956,592 39,568,835 Licenses & Permits 452,933 451,915 473,619 503,513 Fines & Penalties 3,766,491 3,791,590 4,005,485 3,961,000 Use of Money & Property 225,911 220,000 203,352 230,480 Current Services 2,466,694 2,635,739 2,550,151 2,817,593 Other Agencies 484,662 607,365 628,668 607,365 Miscellaneous 774,157 439,712 745,043 693,276 TOTAL REVENUES 77,111,401 78,728,858 83,233,711 86,810,085 EXPENDITURES General Government 7,784,210 8,135,158 8,027,355 8,794,711 Police 29,138,680 30,740,780 30,332,503 33,577,663 Police Grants 308,034 387,747 409,781 430,561 Fire 19,483,357 20,474,404 20,160,413 22,997,723 Public Services 6,726,243 7,895,189 7,598,815 8,681,684 Parks and Recreation 3,980,631 4,448,854 4,404,110 4,528,834 Library 1,635,411 1,887,670 1,702,972 2,014,641 Municipal Court 1,893,192 2,073,172 1,986,251 2,383,101 TOTAL EXPENDITURES 70,949,758 76,042,974 74,622,200 83,408,918 Transfer In - - -Fair Plaza Fund (240) - - -(Transfer Out) (8,927,281) (5,736,713) (5,736,713) (3,401,167) General Capital Projects (102) (3,125,000) (2,582,000) (2,582,000) (70,000) Quality Street Commitment Fund (103) (1,602,420) (1,953,408) (1,953,408) (1,829,862) Cemetery (204) - (200,000) (200,000) (300,000) TIF/ TIRZ #4 (217) - - -Transit (286) (94,122) (50,000) (50,000) (400,000) Property Facility (663) (101,304) (401,305) (401,305) (101,305) Productivity Fund (639) (250,000) (250,000) (250,000) (250,000) Technology Admin (671) (300,000) (300,000) (300,000) (450,000) Rainy Day Fund (235) (3,454,435) - -Unreserved Fund Balance 4,720,172 3,543,550 7,044,104 5,726,096 Operating Reserve 10,642,464 11,406,446 11,193,330 12,511,338 ENDING FUND BALANCE / WORKING CAPITAL $15,362,636 $12,311,807 $18,237,434 $18,237,434 59
Fiscal Year 2022-2023
General FUND (101)
STATEMENT OF REVENUES
Fiscal Year 2022-2023
GENERAL FUND
ACTUALS 2020-2021 AMENDED BUDGET 2021-2022 PROJECTED 2021-2022 BUDGET 2022-2023 PROPERTY TAXES Current $23,110,215 $24,923,714 $24,873,066 $26,914,322 Delinquent 81,962 159,474 146,088 138,693 Penalty and Interest 185,713 155,199 179,613 170,250 TOTAL PROPERTY TAXES 23,377,890 25,238,387 25,198,767 27,223,265 FRANCHISES Power and Light 4,478,212 4,635,627 4,505,044 4,505,044 Natural Gas 1,064,509 1,081,740 1,039,502 1,047,933 Telephone 599,851 595,082 545,561 599,852 Cable Television 1,171,237 1,157,839 1,115,349 1,115,349 Commercial Waste Hauler 1,001,707 1,096,561 1,044,462 1,096,561 Water and Sewer Franchise 2,393,088 2,471,932 2,222,116 2,840,019 TOTAL FRANCHISES 10,708,605 11,038,781 10,472,034 11,204,758 SALES AND USE TAXES Sales Taxes 34,258,123 33,837,660 38,344,442 38,919,609 Mixed Drink Taxes 549,484 432,413 566,480 602,911 Bingo Taxes 46,451 35,296 45,670 46,315 TOTAL SALES AND USE TAXES 34,854,058 34,305,369 38,956,592 39,568,835 LICENSES AND PERMITS Parking Meters 101,464 88,915 140,513 140,513 Wrecker Permits 3,327 4,000 3,600 4,000 Burglar Alarms 348,142 359,000 329,506 359,000 TOTAL LICENSES AND PERMITS 452,933 451,915 473,619 503,513 FINES & PENALTIES Moving Violations 1,978,973 1,969,370 2,035,340 2,000,000 Tax Fees 133,266 117,777 141,264 140,000 Arrest Fees 95,299 99,935 103,102 100,000 Administrative Fees 63,321 89,841 107,734 102,000 Warrant Fees 215,817 215,000 208,450 200,000 Child Safety 151,332 138,107 99,918 100,000 Court Security - - -Miscellaneous Court 44,819 55,000 37,974 40,000 Time Payment Fees - - -Special Court Fees 695,128 824,560 907,804 900,000 Collection Firm Fees 282,054 200,000 270,938 280,000 60
General FUND (101)
STATEMENT OF REVENUES
GENERAL FUND
CONT.
ACTUALS 2020-2021 AMENDED BUDGET 2021-2022 PROJECTED 2021-2022 BUDGET 2022-2023 Court Fee - Clearing 11,842 - -Partners for Youth - - -Omnibase Program 22,520 15,000 15,146 23,000 Parking Fines 50,798 50,000 56,741 55,000 Scofflaw 11,816 10,000 12,735 12,000 Animal Fines 9,506 7,000 8,339 9,000 TOTAL FINES AND PENALTIES 3,766,491 3,791,590 4,005,485 3,961,000 USE OF MONEY AND PROPERTY Glass Center Rental 16,776 30,000 22,813 30,000 Senior Citizen Rental 630 5,000 2,520 5,000 Miscellaneous Rent 41,499 31,000 49,720 35,000 Ballfield Concessions - 2,500 - 2,500 Glass Rec Concessions 647 1,500 744 1,500 Fair Plaza Non-Tenant Parking - - - 6,480 Interest Earnings 166,359 150,000 127,555 150,000 TOTAL USE OF MONEY AND PROPERTY 225,911 220,000 203,352 230,480 CURRENT SERVICES Swimming Pool 1,751 1,665 9,700 9,500 Fire Inspection 56,748 104,000 39,931 104,000 Lot Mowing 42,689 61,138 47,592 61,138 Glass Membership 45,966 50,000 51,853 50,000 Copying Fees 10,678 20,000 20,000 20,000 Utility Cuts 132,000 132,000 132,000 132,000 Library Non Resident Fees 20,182 22,222 23,985 22,222 Library Lost Books 2,696 2,400 3,071 2,400 Library Fines 18,526 32,200 23,675 32,200 Non Resident Internet Use 1,726 4,000 1,819 4,000 Open Records 28,246 33,000 33,000 33,000 Overhead ReimbursementFund 219 47,566 47,566 47,568 47,566 1/2 Cent Administration Costs 175,000 175,000 175,000 183,750 Overhead ReimbursementFund 502 1,332,641 1,332,641 1,332,640 1,399,273 Overhead ReimbursementFund 560 246,837 246,747 246,748 259,084 Volleyball Fees - 2,005 - 2,005 Tournament Fees - - - 8,500 Other Sports Fees 365 5,655 5,655 5,655 61
Fiscal Year 2022-2023
General FUND (101)
STATEMENT OF REVENUES
GENERAL FUND
CONT.
Year 2022-2023 ACTUALS 2020-2021 AMENDED BUDGET 2021-2022 PROJECTED 2021-2022 BUDGET 2022-2023 Field Maintenance 66,849 75,000 73,500 75,000 Recreation Classes/Events 10,713 50,000 35,129 50,000 Faulkner Tennis Center 519 - -Animal Adoption Fees 23,461 24,000 34,380 35,000 Animal Shelter Fees 17,447 13,200 18,397 15,000 Fire Cost Recovery Fees 184,088 201,300 194,508 266,300 TOTAL CURRENT SERVICES 2,466,694 2,635,739 2,550,151 2,817,593 OTHER AGENCIES State Government 12,722 20,000 38,953 20,000 Income from Restitution - - -Auto Theft Task Force 123,578 124,681 127,873 124,681 School Crossing Guards 220,130 258,342 258,342 258,342 Comprehensive Traffic 35,548 64,000 64,000 64,000 County Haz-Mat Service 2,500 6,000 2,500 6,000 FEMA Reimbursements - - -US Marshal - - -Fire TCLEOSE Allocation 988 1,000 - 1,000 State JAG Allocation - 18,000 27,500 18,000 COPS Grant 66,143 90,342 82,000 90,342 Federal JAG Allocation 23,053 25,000 27,500 25,000 Coronavirus Relief Funds - - -TOTAL OTHER AGENCIES 484,662 607,365 628,668 607,365 MISCELLANEOUS Miscellaneous 322,516 159,712 217,987 163,276 Unclaimed Property Revenue 16,740 15,000 30,378 15,000 Return Checks 235 - 125Sale of Equipment - 1,000 45 1,000 Junk Vehicle Revenue 635 - -Methane Gas Sales 422,431 250,000 482,508 500,000 Funeral Escorts 11,600 14,000 14,000 14,000 TOTAL MISCELLANEOUS 774,157 439,712 745,043 693,276 TOTAL GENERAL FUND REVENUES $77,111,401 $78,728,858 $83,233,711 $86,810,085 62
Fiscal
General FUND (101)
STATEMENT OF EXPENDITURES
Fiscal Year 2022-2023
GENERAL FUND
CONT.
ACTUALS 2020-2021 AMENDED BUDGET 2021-2022 PROJECTED 2021-2022 BUDGET 2022-2023 GENERAL GOVERNMENT General Government $683,493 $928,413 $904,454 $915,762 Outside Agencies 401,035 361,035 362,943 361,035 GF Non-Dept Exp 3,309,820 2,968,637 2,899,753 3,121,711 Innovation and Economic Development 7,697 6,220 7,755 8,481 Finance 1,409,253 1,534,935 1,566,166 1,656,654 Legal 1,073,665 1,264,398 1,222,939 1,473,172 Communications 424,999 493,061 541,457 609,567 Human Resources 474,248 578,459 521,888 648,329 TOTAL GENERAL GOVERNMENT 7,784,210 8,135,158 8,027,355 8,794,711 PUBLIC SAFETY Police Services 29,138,680 30,740,780 30,332,503 33,577,663 State JAG - 18,000 27,500 27,500 Federal JAG 22,789 34,000 34,000 34,000 COPS Grant 135,457 170,012 180,553 191,521 Auto Theft Task Force 137,066 145,735 147,728 157,540 L.E. Education Grant 12,722 20,000 20,000 20,000 Fire Services 19,483,357 20,474,404 20,160,413 22,997,723 TOTAL PUBLIC SAFETY 48,930,071 51,602,931 50,902,697 57,005,947 PUBLIC SERVICES Engineering Services 548,446 646,334 647,877 877,723 Streets 2,706,749 3,200,923 3,060,470 3,539,271 Traffic Operations 2,357,198 2,676,080 2,639,847 2,736,864 Parking Garage 11,800 30,550 32,221 27,520 Animal Services 1,102,050 1,341,302 1,218,400 1,500,306 TOTAL PUBLIC SERVICES 6,726,243 7,895,189 7,598,815 8,681,684 PARKS & RECREATION Administration 2,862,667 2,890,987 2,939,227 3,120,910 Indoor Recreation 551,016 778,520 756,888 642,030 Outdoor Recreation 203,725 264,191 238,362 290,921 Median Maint/Arborist 363,223 515,156 469,633 474,973 TOTAL PARKS & RECREATION 3,980,631 4,448,854 4,404,110 4,528,834 LIBRARY 1,635,411 1,887,670 1,702,972 2,014,641 MUNICIPAL COURT 1,893,192 2,073,172 1,986,251 2,383,101 TOTAL GENERAL FUND EXPENDITURES $70,949,758 $76,042,974 $74,622,200 $83,408,918 63
City Manager’s OFFICE
As the “nerve center” for the City of Tyler, the City Manager’s Office provides managerial oversight for daily operations and leadership management across all departments to sustain competitive improvements in both the quality and cost of all services delivered by the City of Tyler. This office is also responsible for internal auditing. City Manager Edward Broussard brings more than 20 years of managerial and leadership experience to Tyler’s government. He provides daily guidance to key leaders and department leaders in order to effectively ensure implementation of the best business practices and prudent use of taxpayer funds.
SERVICE POINT EXPENDITURES – GENERAL GOVERNMENT
SERVICE POINT EXPENDITURES – OUTSIDE AGENCIES
SERVICE POINT EXPENDITURES – NON-DEPARTMENT EXPENSES
GENERAL FUND
FY 2020-2021 ACTUAL EXPENDITURES FY 2021-2022 BUDGET APPROPRIATIONS FY 2021-2022 PROJECTED EXPENDITURES FY 2022-2023 BUDGET APPROPRIATIONS Salaries and Benefits 401,536 538,683 565,647 457,742 Supplies and Services 120,502 205,358 169,430 179,928 Sundry 71,259 87,104 85,668 177,810 Utilities 67,248 73,650 60,091 73,650 Maintenance 22,948 23,618 23,618 26,632 Capital Outlay - - -TOTAL 683,493 928,413 904,454 915,762 FY 2020-2021 ACTUAL EXPENDITURES FY 2021-2022 BUDGET APPROPRIATIONS FY 2021-2022 PROJECTED EXPENDITURES FY 2022-2023 BUDGET APPROPRIATIONS Salaries and Benefits - - -Supplies and Services - - -Sundry 401,035 361,035 362,943 361,035 Utilities - - -Maintenance - - -Capital Outlay - - -TOTAL 401,035 361,035 362,943 361,035 FY 2020-2021 ACTUAL EXPENDITURES FY 2021-2022 BUDGET APPROPRIATIONS FY 2021-2022 PROJECTED EXPENDITURES FY 2022-2023 BUDGET APPROPRIATIONS Salaries and Benefits 2,015,685 2,101,938 2,101,938 2,101,938 Supplies and Services 261,313 183,450 137,450 98,000 Sundry 1,032,822 658,249 660,365 921,773 Utilities - - -Maintenance - - -Capital Outlay - 25,000 -TOTAL 3,309,820 2,968,637 2,899,753 3,121,711 64
City Manager’s OFFICE CONT.
GENERAL FUND
POINT EXPENDITURES –INNOVATION & ECONOMIC DEVELOPMENT SERVICE POINT EMPLOYEES –CITY MANAGER’S OFFICE FY 2020-2021 ACTUAL EXPENDITURES FY 2021-2022 BUDGET APPROPRIATIONS FY 2021-2022 PROJECTED EXPENDITURES FY 2022-2023 BUDGET APPROPRIATIONS Salaries and Benefits - - -Supplies and Services 127 - -Sundry 3,306 3,400 3,360 3,717 Utilities 1,524 - 1,575 1,584 Maintenance 2,740 2,820 2,820 3,180 Capital Outlay - - -TOTAL 7,697 6,220 7,755 8,481 2018-2019 2019-2020 2020-2021 2021-2022 2022-2023 City Manager 1 1 1 1 1 15) Executive Assistant 1 1 1 1 1 TOTAL DEPARTMENT 2 2 2 2 2 65
SERVICE
Finance SERVICES
The Finance Department provides several critical support services including general accounting, processing all payments to vendors, debt service management, banking and investments, grant accounting, maintaining fixed asset records, and processing payroll.
Areas of service include:
• Processing and disbursement of all payments;
• Managing all investments;
• Monitoring and recording all revenues;
• Preparing and publishing financial reports;
• Developing and monitoring internal control processes;
• Providing assistance to internal and external auditors;
• Managing bonded indebtedness;
• Providing budget support to all departments;
• Preparing and maintaining fixed assets records;
• Grant accounting and financial analysis;
• Liaison to underwriters, investors, trustees, and other parties in the sale of bonds;
• Processing and disbursement of payroll and related liabilities; and,
• Benefit analysis and administration.
Accomplishments for 2021-2022
• Achieving 36th consecutive Certificate of Achievement for Excellence in Finance from the Government Finance Officers Association of the United States and Canada;
• Achieving 16th consecutive Distinguished Budget Presentation Award from the Government Finance Officers Association of the United States and Canada; Goals for fiscal year 2022-2023
• Review and implementation of all appropriate accounting standards
• Retain AAA bond rating for GO debt and improve Utility System Revenue bond rating from AA to AAA
SERVICE POINT EXPENDITURES – FINANCE
GENERAL FUND
FY 2020-2021 ACTUAL EXPENDITURES FY 2021-2022 BUDGET APPROPRIATIONS FY 2021-2022 PROJECTED EXPENDITURES FY 2022-2023 BUDGET APPROPRIATIONS Salaries and Benefits 824,698 918,240 880,275 1,003,293 Supplies and Services 179,366 201,504 187,318 233,567 Sundry 405,159 413,991 498,532 418,594 Utilities 30 200 41 200 Maintenance - 1,000 - 1,000 Capital Outlay - - -TOTAL 1,409,253 1,534,935 1,566,166 1,656,654
66
SERVICE POINT EMPLOYEES – FINANCE
Finance combined with City Clerk and Staff Services during FY 2006-2007 to form Administrative Services. These departments have split for FY 2008-2009.
1) Title change from Senior Staff Services Specialist to Senior Accounting Technician during FY 2007-2008.
2) Title change from Staff Services Specialist to Senior Benefit Specialist during FY 2007-2008 and transferred to Fund 661.
3) Upgraded one Accounting Technician to Accounting Manager during FY 2006-2007.
4) During FY 2009-2010 Temporary downgraded one Accountant position to Part-time Accountant to be reviewed in one year.
5) Accountant III downgraded to Accountant FY 2006-2007.
6) FY 2007-2008 Title change to CFO.
* Accountant I dropped from Budget Book because it has not been authorized since FY 2003-2004.
7) Reclassified Financial Analyst to Accountant FY 11-12.
8) Downgraded Accounting Manager to Accountant FY 11-12.
9) Laborer from Solid Waste Residential moved to Finance and reclassified to Accounting Manager during FY 13-14.
10) One accountant reclassified to Budget Officer during FY 13-14.
10) One accountant added FY 15-16. One account position 25% paid by Transit FY 15-16.
11) One Accounting Tech reclassified to Payroll Technician FY 15-16.
12) One Accountant reclassified to Treasury Manager FY 5-16; salary split 75% Finance 25% Transit FY 16/17.
13) One Senior Accounting Technician reclassified to Accounting Technician FY 18-19.
GENERAL FUND
CONT.
Finance SERVICES
REGULAR FULL TIME POSITIONS 2018-2019 2019-2020 2020-2021 2021-2022 2022-2023 6) Chief Financial Officer 1 1 1 1 1 8 & 9) Accounting Manager 1 1 1 1 1 4) & 5) & 7) & 8) & 9) & 10)Accountant 2 2 2 2 2 3) Accounting Technician 3 3 3 3 3 13) Senior Accounting Technician - - - -Payroll Technician 1 1 1 1 1 Accounts Payable Manager 1 1 1 1 1 Treasury Manager 0.75 0.75 0.75 0.75 0.75 TOTAL DEPARTMENT 9.75 9.75 9.75 9.75 9.75
67
Legal SERVICES
It is the mission of the City Attorney’s Office to provide quality legal services to the City of Tyler so that it can govern lawfully and efficiently with the highest level of integrity so that it may serve the citizens of Tyler more effectively. Legal and City Clerk staff members provide support services, including the following:
Areas of service include:
• Formal and informal legal opinions, including legal advice and counsel to Mayor, City Council, City Manager and City Departments;
• Oversee Municipal Court prosecution; and,
• Attend City Board meetings.
• Ensure compliance with State open meetings law;
• Review of public information requests and subpoenas;
• Document/Contract review;
• Document creation including policies, contracts, and code amendments;
• City Code review and maintenance;
• Prosecution of municipal issues;
• Defense and coordination of lawsuits;
• Permanent records management, preservation and storage; and,
• Municipal/joint elections coordination
Accomplishments for 2021-2022
• City Clerk received Texas Registered Municipal Clerk’s Certification
• FOG ordinance creation
• Smoking ordinance amendment Goals for fiscal year 2021-2022
• Continued collaboration with Municipal Court to improve service to citizens
• Continued collaboration with Water Administration to follow and complete Consent Decree requirements
• Bring Council Chambers to ADA compliance
• Redistrict following the 2020 Census
• Expand City Clerk functions and improve department organization.
SERVICE POINT EXPENDITURES – LEGAL
GENERAL FUND
FY 2020-2021 ACTUAL EXPENDITURES FY 2021-2022 BUDGET APPROPRIATIONS FY 2021-2022 PROJECTED EXPENDITURES FY 2022-2023 BUDGET APPROPRIATIONS Salaries and Benefits 926,781 1,038,769 1,041,194 1,252,256 Supplies and Services 90,087 168,027 124,221 164,432 Sundry 55,890 56,503 56,504 55,385 Utilities 19 260 260 260 Maintenance 888 839 760 839 Capital Outlay - - -TOTAL 1,073,665 1,264,398 1,222,939 1,473,172
68
SERVICE POINT EMPLOYEES – LEGAL
1) Title change from Risk Analyst to Legal/Risk/ City Clerk Secretary during FY 2008-2009.
2) Support Services Technician I moved to Risk Fund FY 2010-2011.
3) Assistant City Attorney moved from Risk Fund to Legal Fund for FY 11-12, 12-13.
4) Assistant City Attorney reclassified to Attorney of Counsel FY 12-13.
5) Attorney of Counsel reclassified to Assistant City Attorney during FY 13-14.
6) Legal Secretary reclassified to Assistant City Attorney during FY 15-16.
7) Added one Assistant City Attorney FY 15-16.
8) One Assistant City Attorney reclassified to Senior Assistant City Attorney FY 19-20.
GENERAL
CONT.
FUND Legal SERVICES
REGULAR FULL TIME POSITIONS 2018-2019 2019-2020 2020-2021 2021-2022 2022-2023 City Attorney 1 1 1 1 1 City Clerk 1 1 1 1 1 Deputy City Attorney 1 1 1 1 1 3, 4, 5, 7, 8) Assistant City Attorney 2 1 1 1 1 Assistant to City Attorney 1 1 1 1 1 Legal/Risk/City Clerk Secretary 1 1 1 1 1 Senior Assistant City Attorney 1 2 2 2 2 TOTAL DEPARTMENT 8 8 8 8 8
69
Communications SERVICES
Service Point Focus
The Communications Department works with all City departments and the City Council to provide current information to citizens about services and programs to enhance transparency in local government. The Communications Department keeps Tyler residents informed by utilizing media placements, the City of Tyler website, City of Tyler Government Access Channel (Suddenlink-Channel 3), various social networking sites, printed and electronic publications, advertisements and grassroots communications by placing the Mayor, City Council and City staff at a myriad of speaking engagements throughout the City. The Communications Department is also responsible for:
• Creating and implementing strategic communications plans;
• Developing and implementing action plans to promote the City brand;
• Submitting articles to local and statewide publications;
• Training staff in other City departments to maintain digital content;
• Maintaining and updating the programming for Tyler TV 3;
• Distributing press releases to all local media outlets;
• Acting as a liaison between media outlets and City staff;
• Coordinating with Mayor, City Council Members and City staff to have a City presence at community events;
• Updating the City’s news site and social networking sites;
• Producing and distributing an annual report to citizens of Tyler;
• Planning and marketing special events;
• Approving and editing City publications for all departments;
• Writing and distributing digital publications;
• Providing media training to City employees.
• ·Producing the annual State of the City event;
• Award writing for large City projects and initiatives.
Awards
The Department received the Texas Association Municipal Information Office Award of Excellence for the production of the FY 2020-2021 Annual Report: Called to Serve
The Department received two Hermes Platinum awards for the production of the Walking with Bob- Employee Safety video and the Walking with Bob- How to Pay a Parking Ticket video
The Department received a Hermes Gold Award for the FY 2020-2021 Annual Report: Called to Serve
The Department received a Hermes Honorable Mention for the FY 2021 State of the City event
SERVICE POINT EXPENDITURES – COMMUNICATIONS
GENERAL FUND
FY 2020-2021 ACTUAL EXPENDITURES FY 2021-2022 BUDGET APPROPRIATIONS FY 2021-2022 PROJECTED EXPENDITURES FY 2022-2023 BUDGET APPROPRIATIONS Salaries and Benefits 348,237 406,519 458,818 485,387 Supplies and Services 48,065 57,650 53,763 96,632 Sundry 28,448 28,677 28,676 27,283 Utilities - 15 - 15 Maintenance 249 200 200 250 Capital Outlay - - -TOTAL 424,999 493,061 541,457 609,567
70
SERVICE POINT EMPLOYEES – COMMUNICATIONS
1) Communications Director position transferred from City Manager for FY 2008-2009 with 7% paid by Stormwater
2) Marketing/PR Specialist position transferred from City Manager for FY 2008-2009
3) Capital Projects Coordinator Position Transferred From Engineering Department during FY 2008-2009
4) Capital Project Coordinator position transferred from Engineering to Communications and title change from Capital Project Coordinator to Lean Sigma Master Black Belt during FY 2008-2009
5) Lean Sigma Black Belt position transferred to Productivity Fund for FY 2009-2010 6) Graphics Technician position transferred from Library FY2010-2011 7) Graphics Technician Frozen for FY 2010-2011
9) Communications Director title change to Director of External Relations Organization Development FY 2010-2011
10) Director of External Relations Org Dev. Title change to Managing Director of External Relations FY 2011-2012
11) Managing Director of External Relations downgraded to Senior Public Relations Specialist FY 12-13
12) Assistant City Manger position 10% paid by Tourism-Visitors facility FY 2015-2016
13) Added one Unpaid Intern FY 15-16
14) One SR Public Relations Specialist/Grantwriter reclassified to Communications Manager FY 16-17
15) One IT Specialist II reclassified from IT and added as IT Specialist/Channel 3 Tech added FY 15-16
16) One IT Specialist/Channel 3 Tech reclassified to Multi-Media Specialist FY 16-17
17) Liberty Hall Manager reclassified to Downtown Operations Coordinator FY 16/17
18) SR Marketing/PR Specialist remaining frozen FY 17/18
19) Communications Manager reclassified to Director of Marketing and Communications FY 17/18 salary split 93% Communications, 7% Stormwater.
20) Downtown Operations Coordinator reclassified/transferred to Liberty Hall Operations Coordinator FY 18/19
21) Director of Marketing and Communications salary no longer split 100% Communications FY 19-20
22) Public Safety Public Information Officer transferred to Communications from Productivity/Grants 75% & PD 25% FY 19-20
23) Public Works Public Information Officer reclassified from Senior Secretary & transferred from PD FY 18-19
GENERAL FUND Communications SERVICES CONT.
REGULAR FULL TIME POSITIONS 2018-2019 2019-2020 2020-2021 2021-2022 2022-2023 14, 19) Communications Manager - - - -19, 21) Director of Marketing and Communications 0.47 1 1 1 1 20) Downtown Operations Coordinator - - - -2, 18) SR Marketing/PR Specialist 1 1 1 1 1 22) Public Safety Public Information Officer - 1 1 1 1 23) Public Works Public Information Officer - 1 1 1 1 16) Multi-Media Specialist 1 1 1 1 1 TOTAL REGULAR FULL-TIME 2.47 5 5 5 5
8) Part-time Graphics Technician position eliminated during FY 2011-2012
71
Human Resources SERVICES
The Human Resource Department supports the needs of the City by proposing, implementing and administering City policies and programs that support the City’s staffing and employmentrelated needs. The goal of the Human Resource department is to ensure each employee is employed in a work environment that treats them fairly and equally, without regard to race, sex, and/ or religion, while abiding by all guidelines and laws. The department is responsible for:
• Recruitment;
• New Employee Orientation;
• Civil Service and non-Civil Service human resource administration;
• Compensation, classification and leave of absence benefit administration;
• Employee Relations;
• Ensuring compliance with employment laws and regulations;
• Position Control;
• Ensuring compliance with all Department of Transportation regulations with regards to CDL
• Employees; and,
• Risk Management.
• Volunteer Tyler
SERVICE POINT EXPENDITURES – HUMAN RESOURCES
SERVICE POINT EMPLOYEES – HUMAN RESOURCES
GENERAL FUND
FY 2020-2021 ACTUAL EXPENDITURES FY 2021-2022 BUDGET APPROPRIATIONS FY 2021-2022 PROJECTED EXPENDITURES FY 2022-2023 BUDGET APPROPRIATIONS Salaries and Benefits 403,585 496,661 440,069 557,942 Supplies and Services 20,998 31,741 31,741 37,419 Sundry 49,565 49,932 49,952 52,843 Utilities 100 125 126 125 Maintenance - - -Capital Outlay - - -TOTAL 474,248 578,459 521,888 648,329
REGULAR FULL TIME POSITIONS 2018-2019 2019-2020 2020-2021 2021-2022 2022-2023 13,18) Managing Director of Administration 0.60 0.60 - -Director of Organizational Development - - 1 1 1 2) Human Resource Manager 1 1 1 1 1 10, 17) Human Resource Representative - - - -11) Human Resource Generalist 3 3 3 3 3 16) Human Resource Technician 1 1 1 1 1 12) Receptionist/Greeter - - - -9) Volunteer Coordinator 1 1 1 1 1 15), 19) Benefits Coordinator - - - 1 1 TOTAL REGULAR FULL-TIME 6.60 6.60 7.00 8.00 8.00 72
Human Resources SERVICES
SERVICE POINT EMPLOYEES – HUMAN RESOURCES
Human Resources combined with City Clerk and Finance during FY 2006-2007 to form Administrative Services. These departments have split for FY 2008-2009.
*This department was formerly known as Staff Services.
1) 75% moved from CMO for Human Resources Director for FY 2010-2011
2 & 3) Staff Services Director title changed to Human Resources Manager during FY 2007-2008
3) Title changed to Human Resource Representative during FY 2007-2008 and transferred from Fund 761 (Retiree Benefits) for FY 2008-2009
4) Part time Human Resource Representative reclassified as full time Human Resources Representative during FY 2008-2009
5) Title changed from Human Resource Manager to Civil Service/Employment Relations Officer FY 2010-2011
6) Senior Clerk Position Frozen for FY 2010-2011
7) Senior Clerk position moved to IT to create Advanced IT Technician III FY 2011-2012 for Launch of Share Point
8) Clerical Specialist moved from Productivity fund to Human Resources FY 2011-2012
9) Volunteer Coordinator moved from Police General Fund to HR FY 2010-2011
10 & 11) HR Representative reclassified to HR Generalist FY 2011-2012
12) Senior Clerk downgraded to Receptionist/ Greeter FY 2011-2012
13) Director of Human Resources renamed to Managing Director Of Administration in FY 11-12
Police DEPARTMENT
The Police Department is responsible for improving the quality of life by providing professional police service through a community partnership. The Tyler Police Department is committed to excellence and has been Nationally Certified as an Accredited Law Enforcement Agency (since 1995). The Tyler Police Department provides services across ten beats within the City through the following programs:
• Patrol operations, including motorcycle, bicycle, and canine units;
• Criminal investigations and analysis;
• Burglar alarm permitting;
• Community response team;
• Traffic operations;
• SWAT team;
• Gang Intervention Unit;
• Property and evidence maintenance;
• Communications;
13) Managing Director of Administration 40% paid by Risk FY 15-16
14) Senior Benefit Specialist in Finance reclassified to HR/Risk Specialist in HR for FY 12-13
15) HR/Risk Specialist reclassified to Benefits Coordinator during FY 13-14
16) Receptionist/Greeter reclassified to HR Technician FY 17-18
17) Three HR Representatives reclassified to HR Generalists FY 17-18
18) Managing Director of Administrative Services reclassified to Director of Organizational Development FY 20-21 salary split 60% HR & 40% Risk
19) Added Benefits Coordinator Position FY 21-22
• Crisis negotiations;
• Liaison to District Attorney’s office;
• Pawn shop liaison;
• Narcotics investigations;
• Intelligence investigations;
• Crime Stoppers investigations;
• Crime scene processing;
• Internal affairs investigations;
• Public Information/Citizens Police Academy;
• Public Service Officer (PSO) Program;
• Honor guard;
• Polygraph services;
• Fiscal and regulatory services;
• Volunteers in Policing; and,
• Law Enforcement Academy.
GENERAL FUND
CONT.
REGULAR PART TIME POSITIONS 2018-2019 2019-2020 2020-2021 2021-2022 2022-2023
Representative - - - -Staff Services Representative - - - -TOTAL REGULAR PART-TIME 0 0 0 0 0 GRAND TOTAL DEPARTMENT 6.60 6.60 7.00 8.00 8.00
4) Human Resource
73
Police DEPARTMENT CONT.
Accomplishments for 2021-2022
• Hired and Trained 11 Officers
• Renovations at 621 W. Ferguson
• Upgraded Crime Scene Equipment / Capabilities
• Purchase of 13 Patrol Vehicles
• (2) Additional Officers
• Renovation of Showers at 711 W. Ferguson
• Purchase of Golf Cart
• Improved Equipment
• -Radio System Upgrade
• Purchased 26 Gtac A140 Tablets for In-Car Use
• CALEA Reaccreditation
• Gun Range Repairs / Improvements
• Continued Purchase of Handguns
• Expansion of 40mm launcher program
• Established Priority Response Team
• Lake Tyler Boat Patrol-Created Homeless Liaison Officer
• Created 2nd Digital Forensic Investigator
Goals 2022-2023
• Axon Body Camera / In-Car Video / Taser implementation
• Obtain TCOLE Academy License
• Renovation of classroom for Academy
• Opening of new CSI Offices and Crime Lab
• Continued Purchase of Handguns
SERVICE POINT EXPENDITURES – POLICE SERVICES
SERVICE POINT EXPENDITURES – STATE JAG
GENERAL
FUND
FY 2020-2021 ACTUAL EXPENDITURES FY 2021-2022 BUDGET APPROPRIATIONS FY 2021-2022 PROJECTED EXPENDITURES FY 2022-2023 BUDGET APPROPRIATIONS Salaries and Benefits 24,910,601 25,888,245 25,559,944 28,380,022 Supplies and Services 960,403 1,054,468 994,408 1,514,004 Sundry 1,801,940 1,806,939 1,806,939 1,838,449 Utilities 114,843 131,960 125,533 143,260 Maintenance 1,304,711 1,640,722 1,629,244 1,701,928 Capital Outlay 46,182 218,446 216,435TOTAL 29,138,680 30,740,780 30,332,503 33,577,663 FY 2020-2021 ACTUAL EXPENDITURES FY 2021-2022 BUDGET APPROPRIATIONS FY 2021-2022 PROJECTED EXPENDITURES FY 2022-2023 BUDGET APPROPRIATIONS Salaries and Benefits - - -Supplies and Services - - -Sundry - - -Utilities - - -Maintenance - - -Capital Outlay - 18,000 27,500 27,500 TOTAL - 18,000 27,500 27,500 74
Police DEPARTMENT
SERVICE POINT EXPENDITURES – FEDERAL JAG
SERVICE POINT EXPENDITURES – COPS
SERVICE POINT EXPENDITURES –E TEXAS AUTO THEFT TASK FORCE
GENERAL FUND
CONT.
FY 2020-2021 ACTUAL EXPENDITURES FY 2021-2022 BUDGET APPROPRIATIONS FY 2021-2022 PROJECTED EXPENDITURES FY 2022-2023 BUDGET APPROPRIATIONS Salaries and Benefits - - -Supplies and Services 1,878 - -Sundry - - -Utilities - - -Maintenance - - -Capital Outlay 20,911 34,000 34,000 34,000 TOTAL 22,789 34,000 34,000 34,000 FY 2020-2021 ACTUAL EXPENDITURES FY 2021-2022 BUDGET APPROPRIATIONS FY 2021-2022 PROJECTED EXPENDITURES FY 2022-2023 BUDGET APPROPRIATIONS Salaries and Benefits 135,457 170,012 180,553 191,521 Supplies and Services - - -Sundry - - -Utilities - - -Maintenance - - -Capital Outlay - - -TOTAL 135,457 170,012 180,553 191,521
FY 2020-2021 ACTUAL EXPENDITURES FY 2021-2022 BUDGET APPROPRIATIONS FY 2021-2022 PROJECTED EXPENDITURES FY 2022-2023 BUDGET APPROPRIATIONS Salaries and Benefits 119,353 120,790 122,783 131,400 Supplies and Services 17,713 24,945 24,945 26,140 Sundry - - -Utilities - - -Maintenance - - -Capital Outlay - - -TOTAL 137,066 145,735 147,728 157,540 75
Police DEPARTMENT
GENERAL FUND
CONT. SERVICE POINT EMPLOYEES – COPS GRANT REGULAR FULL TIME POSITIONS 2018-2019 2019-2020 2020-2021 2021-2022 2022-2023 1) Police Officer (CS) 4 4 4 4 4 2) Police Recruit - - 2 2 2 TOTAL DEPARTMENT 4 4 6 6 6 CS) - Indicates Civil Service Position 1) 4 positions added FY 2010-2011 2) Two new Police Recruit positions added FY 20-21 SERVICE POINT EXPENDITURES
FY 2020-2021 ACTUAL EXPENDITURES FY 2021-2022 BUDGET APPROPRIATIONS FY 2021-2022 PROJECTED EXPENDITURES FY 2022-2023 BUDGET APPROPRIATIONS Salaries and Benefits - - -Supplies and Services 12,722 20,000 20,000 20,000 Sundry - - -Utilities - - -Maintenance - - -Capital Outlay - - -TOTAL 12,722 20,000 20,000 20,000 SERVICE POINT EMPLOYEES – EAST TEXAS AUTO THEFT TASK FORCE REGULAR FULL TIME POSITIONS 2018-2019 2019-2020 2020-2021 2021-2022 2022-2023 Police Officer (CS) 1 1 1 1 1 TOTAL DEPARTMENT 1 1 1 1 1 CS) - Indicates Civil Service Position 76
– EDU ACC
Police DEPARTMENT
SERVICE POINT EMPLOYEES – POLICE
GENERAL FUND
CONT.
REGULAR FULL TIME POSITIONS 2018-2019 2019-2020 2020-2021 2021-2022 2022-2023 Police Officer (CS) 1 1 1 1 1 Assistant Police Chief (CS) 3 3 3 3 3 21) Police Lieutenant (CS) 7 7 7 7 7 2) Police Sergeant (CS) 27 27 27 27 27 3) & 18, 27, 35) Police Officer (CS) 153 155 155 157 157 Administrative Secretary 2 2 2 2 2 Burglar Alarm Coordinator 1 1 1 1 1 Crime/Traffic Analyst 1 1 1 1 1 Crimestopper Coordinator 1 1 1 1 1 Data Management Supervisor 1 1 1 1 1 4) & 11) & 16) & 17) Data Management Specialist 4 4 4 4 4 Identification Technician 1 1 1 1 1 Property and Evidence Specialist 1 1 1 1 1 33) Property and Evidence Supervisor 1 1 1 1 1 Police Services Coordinator 1 1 1 1 1 PS Communications Supervisor 3 3 3 3 3 13) & 19) & 20, 25, 28,31, 32, 34) PS Telecommunicator II 14 13 12 12 12 20) PST Administrator 1 1 1 1 1 15, 26) Public Service Officer 8 8 8 8 8 Secretary 1 1 1 1 1 31) Senior PS Telecommunicator II 6 7 8 8 8 6, 24, 30)Senior Secretary 1 1 1 1 1 22) Police Technology Specialist 1 1 1 1 1 29) Public Safety PIO 0.25 - - -TOTAL DEPARTMENT 240.25 242 242 244 244 77
Police DEPARTMENT
SERVICE POINT EMPLOYEES – POLICE
(CS) - Indicates Civil Service Position
1) Title changed to City Volunteer Coordinator during FY 2009-2010
2) One additional position approved for FY 20082009
3) Two additional positions approved for FY 20082009
4) One position transferred to Risk and title changed to Loss Control Technician during FY 2008-2009. One position transferred to Parks and Recreation, frozen for the FY 2009-2010 and 2010-2011
5) Title changed to Director of Volunteer Services during FY 2007-2008
6) Two positions upgraded to Administrative Secretary during FY 2007-2008
7) One position upgraded to IT Specialist I during FY 2007-2008
8) Title changed back to VIP Coordinator FY 20082009
9) One position approved for FY 2007-2008 which was not in previous budget book
10) Position Eliminated During Budget Session for FY 2010-2011
11) Frozen position was subtracted from the total authorized positions in the FY 2009-2010 budget book by mistake. Position was left but not funded FY 2009-2010
12) Position converted to Assistant Police Chief during FY 2009-2010
13) Three of the 21 positions authorized but not funded. These are overfill positions only
14) Volunteer Coordinator moved to Human Resources FY 2010-2011
15) 1 Public Service Officer eliminated FY 20112012
16) Data Management Specialist I (#7) (marked as closed) Eliminated FY 2011-2012
17) 3 Data Management Specialists eliminated FY 2012-2013
18) 2 Motorcycle Officers added FY 2012-2013
19) PST I’s converted to PST II’s and upgraded to pay class 209 in FY 2011-2012
20) 1 PST II upgraded to PST Administrator in FY 2011-2012
21) Added 1 Lieutenant to offset Lieutenant working as full-time Lean Sigma Black Belt
22) IT Specialist I reclassified to Police Technology Specialist FY 12-13
23) Additional five (5) unbudgeted overfill PST II’s added FY 14-15, for a total of eight (8) unbudgeted overfill PST’s
24) Senior Secretary remaining frozen FY 17-18until further notice
25) One PST II frozen FY 17-18 - until further notice
26) One PSO frozen FY 17-18
27) Two Police Officers added FY 18-19
28) One PST I reclassified to PST II FY 18-19 (#11)
29) One Sr PR Marketing Specialist/Grantwriter transferred from Communications & reclassified to Public Safety Public Information Officer FY 18-19 salary split 75% Productivity 25% Police
30) One Senior Secretary reclassified to Public Works Public Information Officer and transferred to Communications FY 18-19
31) Two (2) PST II’s upgraded to Senior PST II’s FY 18-19
32) Three (3) PST II’s eliminated FY 18-19 to increase savings to support the PST II position salary increase during FY 18-19
33) One Property & Evidence Supervisor downgraded to Property & Evidence Specialist FY 18-19
34) One PST II reclassified to Senior PST II FY 19-20
35) Two Positions added FY 21-22
GENERAL FUND
CONT.
REGULAR PART TIME POSITIONS 2018-2019 2019-2020 2020-2021 2021-2022 2022-2023 Courier 1 1 1 1 1 TOTAL REGULAR PART-TIME 1 1 1 1 1 TOTAL DEPARTMENT 241.25 243 243 245 245
78
Fire DEPARTMENT
Service Point Focus
The Tyler Fire Department became a full-time paid professional firefighting organization in 1908. Over the past 109 years, the department has grown to 10 fire stations serving over one hundred thousand people and has an ISO rating of 2. The department is organized into Operations, Fire Prevention, Emergency Management, and Administrative Divisions that support the delivery of critical fire suppression services and emergency medical care. The department’s prehospital care relies on a public/ private partnership with the ETMC mobile medical system. Firefighters trained as emergency medical technicians provide basic life support (BLS) while advanced life support (ALS) and transport is provided by ETMC. Maintaining or improving emergency response times is the core of Tyler Fire Department Operations. The department’s other vital emergency and nonemergency services include:
• Technical teams. This includes technical and heavy rescue, swift water response, confined space, and hazardous materials (HazMat) response.
• Fire prevention and public education.
• Fire Investigation.
• Fire Code Enforcement
• Aircraft (ARFF) Response
Accomplishments for 2021-2022
• First internal fire academy in 33 years based at Station #4
• 100% pass rate for both Fire Academy and EMT certification
• New Fire Administration building
• Several fighters completed the TEEX HAZMAT school
• 3 officers attended HazMat Incident Command
• Firefighters completed ARFF live burns
• Firefighters received additional Technical Rescue
• 90% of department is now equipped with two complete sets of PPE (Personal Protective Equipment/Cancer Reduction Program)
Goals for 2022-2023
• Develop spec and order Fire Engine per Apparatus Replacement Plan
• Receive Ladder Tower ordered in FY 2021-2022
• Fire Firefighters awarded from the SAFER grant
• Implement new hydrant testing software and pre-fire planning process
• Annual testing of hose, ladders, SCBA face pieces, hydrants, etc. with in-house resources
• Study implementing a fire-based dispatch console
SERVICE POINT EXPENDITURES – FIRE SERVICES
GENERAL FUND
FY 2020-2021 ACTUAL EXPENDITURES FY 2021-2022 BUDGET APPROPRIATIONS FY 2021-2022 PROJECTED EXPENDITURES FY 2022-2023 BUDGET APPROPRIATIONS Salaries and Benefits 17,508,019 18,203,867 18,387,511 20,374,504 Supplies and Services 601,593 808,491 663,208 956,327 Sundry 515,571 547,084 494,616 608,248 Utilities 161,026 154,625 140,319 154,625 Maintenance 697,148 760,337 474,759 904,019 Capital Outlay - - -TOTAL 19,483,357 20,474,404 20,160,413 22,997,723 79
Fire DEPARTMENT
SERVICE POINT EMPLOYEES – FIRE
(CS) Indicates Civil Service Position
1) Two positions were upgraded to District Chief during FY 2007-2008; Four positions were downgraded to Fire Captain during FY 2007-2008
2) One position was downgraded to Senior Secretary during FY 2007-2008
3) Six positions were upgraded to Fire Captain during FY 2007-2008; Three positions were upgraded to Fire Driver/Engineer during FY 2007-2008; Six additional positions approved for FY 2008-2009; Six positions added during FY 2009-2010
4) One position was upgraded to Administrative Assistant during FY 2007-2008
5) One position was upgraded to Administrative Secretary during FY 2007-2008
6) Positions title changed to Assistant and Deputy Fire Marshal (eliminated 1 position) 2009-2010
7) & 8) Created from Fire Inspector/Investigator positions 2009-2010
9) Title change FY 2010-2011 from Emergency Management Assistant to Emergency Management Asst/Administrative Secretary
10) Fire Training Chief upgraded to Assistant Fire Chief FY 2010-2011
11) 1 Fire Captain created from elimination of AC Mechanic FY 2011-2012. * 1 Fire Captain acting as Full-Time Lean Sigma Black Belt.
12) Two Assistant Fire Marshals reclassified to Fire Captain FY 2015-2016
13) Three Deputy Fire Marshal reclassified to Driver/Engineer FY 2015-2016
14) Emergency Mgmt Asst/Admin Secretary remaining frozen FY 17-18
15) Two Firefighters added FY 18-19
16) Three Firefighter Recruit positions frozen FY 20-21
17) Two Firefighter Recruit positions added FY 21-22
GENERAL FUND
CONT.
REGULAR FULL TIME POSITIONS 2018-2019 2019-2020 2020-2021 2021-2022 2022-2023 Fire Chief 1 1 1 1 1 10) Assistant Fire Chief (CS) 2 2 2 2 2 District Chief (CS) 6 6 6 6 6 11) Fire Captain (CS) * 41 41 41 41 41 Fire Driver/Engineer (CS) 39 39 39 39 39 3, 15, 17) Firefighter (CS) 68 70 70 72 74 Administrative Assistant 1 1 1 1 1 4, 14) Administrative Secretary 2 2 2 2 2 Fire Apparatus Technician 1 1 1 1 1 Fire Marshal 1 1 1 1 1 9) Emergency Mgmt Asst/ Admin Secretary - - - -TOTAL DEPARTMENT 162 164 164 166 168
80
Tyler PUBLIC LIBRARY
The Tyler Public Library helps meet the information, education and recreation needs of a diverse and growing community by providing a full range of print, audiovisual and digital resources along with assistance and programming to promote the use of those resources. Staff members are responsible for
• Selecting, acquiring, preparing, housing and distributing materials in fiction, non-fiction, children’s, young adult and audio-visual collections;
• Providing a reference collection and assistance in using it;
• Providing a Genealogy and Local History collection;
• Maintaining an online catalog of holdings;
• Providing public Internet-access workstations;
• Providing Early Literacy story times and other events for children;
• Providing a schedule of entertaining and informative programs for adults;
• Providing access to public information; and,
• Providing access to statewide information databases.
SERVICE POINT EXPENDITURES – LIBRARY
GENERAL FUND
FY 2020-2021 ACTUAL EXPENDITURES FY 2021-2022 BUDGET APPROPRIATIONS FY 2021-2022 PROJECTED EXPENDITURES FY 2022-2023 BUDGET APPROPRIATIONS Salaries and Benefits 1,117,482 1,387,503 1,209,274 1,492,962 Supplies and Services 178,557 179,704 187,139 185,528 Sundry 223,792 219,459 213,740 224,040 Utilities 53,673 45,575 46,755 50,785 Maintenance 61,907 54,069 44,741 59,966 Capital Outlay - 1,360 1,323 1,360 TOTAL 1,635,411 1,887,670 1,702,972 2,014,641 SERVICE POINT EMPLOYEES
LIBRARY REGULAR FULL TIME POSITIONS 2018-2019 2019-2020 2020-2021 2021-2022 2022-2023 City Librarian 1 1 1 1 1 17, 21) Access Librarian - - - -Reference Librarian 1 1 1 1 1 Resource Librarian 1 1 1 1 1 Circulation Supervisor 1 1 1 1 1 1, 6, 20) Access Associate 2 2 2 2 2 25)Administrative Assistant - - - -Library Operations Specialist 1 1 1 1 1 26) Cataloging Specialist 2 1 1 1 1 2, 22) Circulation Technician 2 2 2 2 2 Circulation Assistant 1 1 1 1 1 Collection Associate 1 1 1 1 1 4) Custodian 1 1 1 1 1 15) Library Assistant 2 2 2 2 2 81
–
Tyler PUBLIC LIBRARY
SERVICE POINT EMPLOYEES – LIBRARY
Full-Time Library Assistant reclassified to One Part-Time Library Assistant FY 12-13
16) Programming Associate reclassified to Youth Services Librarian FY 12-13
17) Youth services librarian reclassified to Access Librarian FY 15-16
18) One Circulation Tech Sub transferred to Risk and reclassified to Risk Technician FY 14-15
19) Three Circulation Techs PT (#3, #6 & #9) reclassified to three (3) Library Page positions (#1, #2, & #3) FY 17/18
20) Three (3) Access Associate PT (#1, #2 & #4) positions reclassified into one (1) Access Associate FT position FY 17-18 (lose 2 positions)
21) Access Librarian reclassified to Reference Librarian FY 17-18
22) One FT Circulation Tech (#2) reclassified into one FT Circulation Assistant (#2) FY 17-18
23) One Outreach Tech Sub added FY 17-18; Budget Presentation shows it was added in FY 18-19, but the approval from Finance was given in FY 17-18 & the position was filled in FY 17-18 (9-10-18)
24) Two Part Time Custodians (auth. #1, & #3) reclassified into One FT Custodian FY 18-19
25) One Administration Assistant reclassified to Library Operations Specialist
FY 18-19
26) One Cataloging Specialist reclassified to Youth Services Assistant FY 19-20
GENERAL FUND
CONT. REGULAR PART TIME POSITIONS 2018-2019 2019-2020 2020-2021 2021-2022 2022-2023 7) & 14) Access Associate 3 3 3 3 3 2, 11, 13,19) Circulation Technician 6 6 6 6 6 5, 10, 12, 24) Custodian 1 1 1 1 1 Library Page 3 3 3 3 3 Project Specialist 1 1 1 1 1 TOTAL REGULAR PART TIME 14 14 14 14 14 SUBSITUTE POSITIONS 2018-2019 2019-2020 2020-2021 2021-2022 2022-2023 Access Associate 3 3 3 3 3 13) Circulation Technician 3 3 3 3 3 23)Outreach Technician 1 1 1 1 1 TOTAL SUBSITUTES 7 7 7 7 7 GRAND TOTAL DEPARTMENT 39 39 39 39 39
REGULAR FULL TIME POSITIONS 2018-2019 2019-2020 2020-2021 2021-2022 2022-2023 Outreach Technician 1 1 1 1 1 16) and 17) Youth Services Librarian 1 1 1 1 1 Youth Services Assistant - 1 1 1 1 TOTAL REGULAR FULL TIME 18 18 18 18 18 1) One full-time position split into two part-time positions for FY 2008-2009 2) One full-time position split into two part-time positions for FY 2008-2009 3) One position was eliminated for FY 2008-2009 4) & 5) Two Full-time custodians converted to 4 part-time custodians during FY 2009-2010 6) & 7) One access associate converted to 2 part-time access associates during FY 2009-2010 8) Graphics Technician Position moved to the Communications Department FY 2010-2011 9) Graphics Technician Substitute Position Eliminated FY 2010-2011 10) Two Part-time custodians frozen FY 2010-2011 11) Four Part-time circulation technicians frozen FY 2010-2011 12) Two part-time custodians Eliminated FY 2011-2012 13) Four Part-time Circulation technicians eliminated FY 2011-2012 14) Two Part-Time Access Associates eliminated FY 2012-2013 15) One
82
Parks & RECREATION
Service Point Focus
Streamline the recreational resources currently available within the City, to recognize the need for replacement or additional resources to meet the current and future generations’ pastime needs. Empower the public to participate in new ideas and enhancements affecting their recreational resources. Respond to the citizens’ needs and expectations to make a safe, enjoyable atmosphere for all to enjoy. Venture into identifying new trends, activities, equipment, and other resources to provide safe, fun, educational, interesting pastimes for all ages and interests. Evaluate the current facility structures for needed repairs, replacements, removals for better operations and use of the recreational resources in a safe, ethical, economical manner.
Mission: To improve the quality of life for our citizens and guests by providing superior parks, cemeteries, recreational and tourism opportunities.
Vision: To provide our citizens with attractive outdoor spaces that are well maintained while continuing to be fiscally responsible.
Accomplishments for 2021-2022
• Parks and Recreation Facebook Page Glass Recreation Center
- Outdoor Adventure Series
• Emett J. Scott Park
- Playground equipment, restroom mural, picnic tables, walking trail, basketball court
• Faulkner Park
- Lower Restroom Renovations, Faulkner Park Skate Park Phase II Completed
• Fun Forest Pool
- Completed new pool and splash pad area, rentable spaces including picnic areas and pavilion for special events
• Hillside Park - 2020 Texas Municipal League Excellence Award for Park Renovation
• Lindsey Park - Restroom Renovations
• Woldert Park - Splash pad, restroom renovations
Goals for 2022-2023
• Operations
- Increase programming awareness and promote revenue generation through website build-out and updates.
- Implement Amortization Plan approved by Parks board and City Council.
- Complete and submit monthly financial forecasts that accurately reflect revenues and expenditures.
- Cross train all outdoor parks employees using training matrix.
- Continue to utilize work order system to track maintenance orders and analyze staffing and maintenance needs by Park.
• Parks
- Bring all park restrooms to working order. Implement 10-year MP schedule.
- Update mowing contract to include new construction and some medians.
- Implement Standard Park Amenities design plan.
- Review fees and contracts for permits and rentals.
- Reduce water usage by tying in well at Lindsey Park and identifying and fixing water leaks.
- Full renovation of PT Cole Park and partial renovation of Pollard Park
• Athletic Programs
- Increase programming to reach all demographics by evaluating past years programming and participation and building 3-5 programs this year to target new groups.
- Prepare for and oversee basketball league/ tournaments at Glass. Increase awareness and try to build 10% YOY participation increase.
- Prepare for and oversee kickball fall season league. Increase awareness and try to build 10% YOY participation increase.
- Continue Corporate Challenge and increase YOY participation and awareness by 15 percent, with goal of creating fee-funded program by 2023 rather than having to rely on donors and sponsors.
- Review fee structure for field rentals.
- Glass Recreation Center
- Increase programming to reach all demographics by evaluating past years’ programming and participation. Building 3-5 programs this year to target new groups.
- Enhance and increase of Summer Playground Program and market to build increased community awareness.”
GENERAL FUND
83
Parks & RECREATION
GENERAL FUND
CONT. SERVICE POINT EXPENDITURES –PARKS MAINTENANCE & ADMINISTRATION FY 2020-2021 ACTUAL EXPENDITURES FY 2021-2022 BUDGET APPROPRIATIONS FY 2021-2022 PROJECTED EXPENDITURES FY 2022-2023 BUDGET APPROPRIATIONS Salaries and Benefits 837,005 1,025,550 998,322 1,242,874 Supplies and Services 734,199 685,722 715,629 648,589 Sundry 124,597 118,773 122,297 124,573 Utilities 580,160 552,850 595,732 602,850 Maintenance 586,706 508,092 507,215 502,024 Capital Outlay - - 32TOTAL 2,862,667 2,890,987 2,939,227 3,120,910 SERVICE POINT EMPLOYEES – PARKS ADMINISTRATION REGULAR FULL TIME POSITIONS 2018-2019 2019-2020 2020-2021 2021-2022 2022-2023 9, 13,17) Managing Director Parks/Recreation Operations 0.2 - - -7, 10) Parks & Recreation Services Coordinator 1 1 1 1 1 12) Crew Leader 3 3 3 3 3 Grounds Technician 1 1 1 1 1 Groundskeeper 6 6 6 6 6 Parks Manager 0.7 0.7 0.7 0.7 0.7 5, 6 & 8) Laborer 3 3 3 3 3 Administrative Secretary 1 1 1 1 1 14) Budget Administrator/ Cemeterian 0.05 - - -18) Budget Analyst & Internal Auditor - 0.05 0.05 0.05 0.05 15, 16) Manager of Tourism Facilities Community Beautification - - - -Senior Manager of Parks, Recreation & Tourism 0.55 0.55 0.55 0.55 0.55 8) Parks Superintendent 1 1 1 1 1 TOTAL REGULAR FULL TIME 17.5 17.3 17.3 17.3 17.3 1) Position transferred from City Manager’s Office and title changed during FY 2009-2010. 2) One position upgraded to Senior Secretary during FY 2007-2008. One Senior Secretary reclassified to Administrative Secretary FY 16-17 3) 50% of Parks and Recreation Director position charged to Tourism Visitor’s Facility 4) Parks and Recreation Operation and Service Manager 30% charged to Tourism Visitors Facility. 5) 1 Laborer frozen for FY 2010-2011 6) Eliminated 1 of 8 Laborers FY 2011-2012 7) Parks Maintenance Supervisor converted to Parks & Recreation Services Coordinator in FY 11-12 8) One Laborer reclassified to Parks Superintendent during FY 13-14 9) Parks&Rec Director reclassified to Managing Director of Parks/Recreation Operation salary charged to50%Parks, 50%Parks Visitor Facilities 16/17 10) Parks & Rec Services Coordinator remaining frozen FY 17-18. 11) Hardscape Technician reclassified to Crew Leader FY 16-17. 12) One Crew Leader position transferred to Rose Garden FY 14-15. 3) MD Parks/Recreation Op salary charged 20%Parks Admin, 50% Visitor Facilities & 30%Liberty Hall FY 17-18. 14) Budget Administrator/Cemeterian salary split 95% Visitor Tourism/ 5% Parks Admin FY 17-18 15) Manager of Tourism Facilities & Community Beautification salary split 77% Visitor Facilities/ 23% Parks Admin FY 17-18. 84
Parks & RECREATION
SERVICE POINT EMPLOYEES – INDOOR RECREATION
GENERAL FUND
CONT. 16) Manager of Tourism Facilities & Community Beautification reclassified to Senior Manager Parks, Recreation & Tourism FY 18-19 salary split 55% Parks/45% Tourism. 17) Managing Director Parks & Recreation salary split 60% Visitor Facilities 40% Liberty hall 18) Budget Administrator/Cemeterian retitled to Budget Analyst & Internal Auditor FY 19-20, salary split 95% Tourism/5% Parks Admin. SERVICE POINT EXPENDITURES – INDOOR RECREATION FY 2020-2021 ACTUAL EXPENDITURES FY 2021-2022 BUDGET APPROPRIATIONS FY 2021-2022 PROJECTED EXPENDITURES FY 2022-2023 BUDGET APPROPRIATIONS Salaries and Benefits 380,372 506,404 483,478 482,615 Supplies and Services 91,199 69,385 69,292 72,883 Sundry 22,684 23,165 24,682 28,324 Utilities 18 100 25 100 Maintenance 56,743 179,466 179,411 58,108 Capital Outlay - - -TOTAL 551,016 778,520 756,888 642,030 1 & 2) Title change from Special Events/Recreation Supervisor to Special Events/ Recreation Manager during FY 2008-2009 3) 1 Recreation Specialist position frozen for FY 2010-2011 & 2011-2012 & 20122013 4) Typo on title was listed as Recreation Operation Supervisor, corrected to Recreation Program Supervisor 5) 1 Recreation Specialist moved to Productivity Fund as Grants Specialist FY 13-14 6) One Part-Time Custodian converted into one Full-Time Building Maintenance Worker FY 19-20 7) One Special Events/Recreation Manager reclassified to Recreation Manager FY 19-20 8) One PT Custodian reclassified to one FT Custodian FY 20-21
REGULAR FULL TIME POSITIONS 2018-2019 2019-2020 2020-2021 2021-2022 2022-2023 2, 7) Special Events/Recreation Manager 1 - - -Recreation Manager - 1 1 1 1 Recreation Center Supervisor 1 1 1 1 1 4) Recreation Program Supervisor 1 1 1 1 1 Building Maintenance Worker - 1 1 1 1 Custodian 2 1 2 2 2 3, 5) Recreation Specialist 2 2 2 2 2 TOTAL REGULAR FULL TIME 7 7 8 8 8 REGULAR PART TIME POSITIONS 2018-2019 2019-2020 2020-2021 2021-2022 2022-2023 Clerk 2 2 2 2 2 6,8) Custodian 1 1 - -TOTAL REGULAR PART TIME 3 3 2 2 2 GRAND TOTAL DEPARTMENT 10 10 10 10 10 85
Parks & RECREATION
GENERAL FUND
CONT.
POINT EXPENDITURES – OUTDOOR RECREATION FY 2020-2021 ACTUAL EXPENDITURES FY 2021-2022 BUDGET APPROPRIATIONS FY 2021-2022 PROJECTED EXPENDITURES FY 2022-2023 BUDGET APPROPRIATIONS Salaries and Benefits 108,357 175,423 149,625 193,670 Supplies and Services 95,039 88,268 88,737 96,751 Sundry - - -Utilities - - -Maintenance 329 500 - 500 Capital Outlay - - -TOTAL 203,725 264,191 238,362 290,921 1) Data Management Position transferred to the Parks Department to create a part time Recreation Specialist position during FY 2009-2010 2) 1 PT Custodian and 1 PT Recreation Specialist combined to form 1 FT Recreation Specialist, then reversed back in FY 2011-2012 3) Activities Specialist frozen FY 16-17; FY 17-18 4) 4 Lifeguard positions frozen FY 16-17; FY 17-18 5) 2 Lifeguard Sub positions frozen FY16-17; FY 17-18 6) 1 Pool Manager positions reclassified to Lead Pool Manager FY 16-17 7) One Playground Coordinator #1 reclassified to Playground Leader #6 FY 16-17 SERVICE POINT EMPLOYEES – OUTDOOR RECREATION REGULAR FULL TIME POSITIONS 2018-2019 2019-2020 2020-2021 2021-2022 2022-2023 3)Activity Specialist 1 1 1 1 1 TOTAL REGULAR FULL TIME 1 1 1 1 1 REGULAR PART TIME POSITIONS 2018-2019 2019-2020 2020-2021 2021-2022 2022-2023 1) & 2) Recreation Specialist 1 1 1 1 1 TOTAL REGULAR PART TIME 1 1 1 1 1 TEMPORARY POSITIONS 2018-2019 2019-2020 2020-2021 2021-2022 2022-2023 6)Pool Manager 2 2 2 2 2 Lead Pool Manager 1 1 1 1 1 4)Lifeguard 14 14 14 14 14 7)Playground Coordinator - - - -Playground Aid/Leader 12 12 12 12 12 TOTAL TEMPORARY POSITIONS 29 29 29 29 29 SUBSITUTE POSITIONS 2018-2019 2019-2020 2020-2021 2021-2022 2022-2023 5)Lifeguard 2 2 2 2 2 TOTAL SUBSITUTES 2 2 2 2 2 GRAND TOTAL DEPARTMENT 33 33 33 33 33 86
SERVICE
Parks & RECREATION
GENERAL FUND
CONT.
–MEDIAN MAINTENANCE & ARBORIST FY 2020-2021 ACTUAL EXPENDITURES FY 2021-2022 BUDGET APPROPRIATIONS FY 2021-2022 PROJECTED EXPENDITURES FY 2022-2023 BUDGET APPROPRIATIONS Salaries and Benefits 151,491 271,043 224,617 309,670 Supplies and Services 158,747 189,608 195,708 115,578 Sundry 3,825 3,000 3,999 4,000 Utilities - - -Maintenance 49,160 51,505 45,309 45,725 Capital Outlay - - -TOTAL 363,223 515,156 469,633 474,973
MEDIAN MAINTENANCE & ARBORIST REGULAR FULL TIME POSITIONS 2018-2019 2019-2020 2020-2021 2021-2022 2022-2023 Arborist/Urban Forester 1 1 1 1 1 Crew Leader 1 1 1 1 1 Laborer 3 3 3 3 3 TOTAL REGULAR FULL TIME 5 5 5 5 5 87
SERVICE POINT EXPENDITURES
SERVICE POINT EMPLOYEES –
Engineering SERVICES
Service Point Focus
Engineering Services is comprised of Engineering, Half-Cent Sales Tax Fund Administration, and Stormwater Utility capital project oversight. Engineering Services staff administers/coordinates all legal, financial, operational and regulatory activities of the engineering department and the Half Cent Sales Tax Program. Engineering personnel manage Half Cent Sales Tax and the Storm Water Drainage Utility capital projects under design and in construction; in addition to oversight of other capital infrastructure projects as needed.
Engineering
Engineering is responsible for capital improvement projects to ensure effective and efficient implementation of Half-Cent Sales Tax program. Engineering staff provides civil engineering design and construction oversight as well as providing design and construction oversight of maintenance and emergency repair projects of city streets and some drainage structures. This department provides infrastructure development support services through:
• The administration of Half-Cent Sales Tax Fund
• Half-Cent Sales Tax Capital Projects design oversight
• Half-Cent Sales Tax Capital Projects construction oversight
• Administration of the pavement enhancement program
• Pavement condition rating and grading
• Stormwater Utility Projects oversight
• Capital Project Sidewalk / ADA design and construction oversight
• CDBG Program design and project management
• Miscellaneous engineering design and construction administration services for other city departments
Half-Cent Sales Tax
The Engineering staff provides maintenance management of City-owned facilities and administers the Half-Cent Sales Tax Program, which provides approximately $13 million annually for numerous infrastructure projects including drainage, streets, public safety, parks, facilities, and airport improvements. The Half-Cent Sales Tax Program is directed by the Half-Cent Sales Tax Board who, along with the City Council, governs the priority scheduling of the extensive list of Capital Improvement Projects.
Accomplishments 2021-2022
• Completed thirteen CIP Projects
• Currently Managing 32 CIP Projects
Projects 2022
• Shiloh Rd. Bridge Reconstruction
• College Ave. at 4th St. Storm Sewer Repair
• Briarwood Channel Repair
• MLK Jr Blvd Improvements
• 2020 Asphalt Enhancement Program
• 2021 Asphalt Enhancement Program
• Connect School Beacon System
• Arbor Oaks Drainage Improvements
• College Ave (Locust to Dead End)
Drainage Improvements
• Pabst/Bow Drainage Improvements
• Flat Rock Drainage Improvements
• Holly Park Drainage Improvements
• CSWMP Completed
Goals 2022-2023
• Implement CIP through initiation of CIP project priorities for the fiscal year and manage projects in progress.
• Work inter-departmentally to ensure Citywide project management follows City Policies.
• Continue to improve project management and work toward identifying other forms of funding for capital projects.
•Completion of ongoing projects.
GENERAL FUND
88
GENERAL FUND Engineering
CONT. SERVICE POINT EXPENDITURES – ENGINEERING SERVICES FY 2020-2021 ACTUAL EXPENDITURES FY 2021-2022 BUDGET APPROPRIATIONS FY 2021-2022 PROJECTED EXPENDITURES FY 2022-2023 BUDGET APPROPRIATIONS Salaries and Benefits 416,108 580,757 582,092 807,149 Supplies and Services 91,857 13,773 14,401 30,219 Sundry 35,889 46,279 46,276 35,052 Utilities 16 50 30 50 Maintenance 4,576 5,475 5,078 5,253 Capital Outlay - - -TOTAL 548,446 646,334 647,877 877,723 SERVICE POINT EMPLOYEES – ENGINEERING REGULAR FULL TIME POSITIONS 2018-2019 2019-2020 2020-2021 2021-2022 2022-2023 16, 20) City Engineer 1 1 1 1 1 1, 21) Administrative Assistant 1 1 1 1 1 2, 18) Capital Budget Analyst - - - -12, 15) Associate Engineer - - - -5, 14) Project Engineer 1.85 2 2 2 2 22) Traffic Engineer 1 1 1 1 1 TOTAL REGULAR FULL TIME 4.85 5 5 5 5 *The Engineering and Street departments were combined in FY 2006-2007 to form the Engineering Services department. 1) One position reclassified to Capital Budget Analyst during FY 2007-2008 2) Capital Budget Analyst one position with 14% paid by Storm Water Management 3) Engineering Technician two positions, one with 40% paid by Storm Water Management 4) Position transferred to Communications and title changed to Lean Sigma Master Black Belt FY 2008-2009 5) Project Engineer Position frozen for the FY 2009-2010 and FY 2010-2011 6) Survey crew Chief position frozen for the FY 2009-2010 and FY 2010-2011 7) Position moved to Property and Facility during FY 2009-2010 8) Position reclassified and title changed to City Courier during FY 2009-2010 9) Four Utilities Construction Inspector positions transferred to Development Services during FY 2007-2008 10) Eliminated Survey Crew Chief position Fy 2011-2012 11) Eliminated Survey Crew Member FY 2011-2012 12) 1 Engineering Technician converted to 1 Associate Engineer in FY 2011-2012 13) Engineering Technician reclassified to Project Engineer in FY 12-13 14) Project Engineer payroll split added 85/15 Engineering/Stormwater FY 14-15 14) Two Project Engineer positions. One position payroll 15% paid by Stormwater FY 15-16 15) Associate Engineer payroll split added 60/40 Engineering/Stormwater FY 14-15 & FY 15-16 16) City engineer 25% paid by Property & Facility maintenance FY 15-16
City Engineer reclassified to Capital Improvement Projects Manager FY 17/18 salary split 75/25 (GGS - Other Prop& Fac Mgmt) 18) Capital Budget Analyst position closed FY 15/16
ENTRY MOVED - SEE WUF- CONSENT DECREE TAB 20) Capital Improvement Project Manager reclassified to City Engineer FY 17/18 100% salary paid from Engineering 21) One Administrative Assistant transferred to Engineering from Traffic and Stormwater 100% FY 18-19
One Traffic Engineer transferred to the Engineering department from Traffic department FY 19-20 89
SERVICES
17)
19)
22)
Street SERVICES
The Street Department is responsible for coordinating efforts with Engineering Services to set-up and manage the Micro Paver Pavement Maintenance Management System. This software program allows the departments to accurately rate road conditions and track their life span. Additionally, the Street Department is responsible for:
• Monitoring and establishing City Street Conditional Ratings to ensure the best quality streets for the City;
• Repair pot holes; utility cuts, concrete valleys, general street repairs, concrete curbs and gutters.
• Monitoring and evaluating the City’s infrastructure drainage system to better provide an optimal drainage system;
• Establishing a Right-of-Way mowing cycle that optimizes aesthetics and cost effectiveness with an emphasis
• On eliminating visual obstructions, mitigating rubbish accumulations and promoting the City’s natural beauty; and,
• Establishing a street sweeping cycle utilizing cost effective methods. Our emphasis is on eliminating unsightly trash and highlight the City’s rustic ambiance.
Accomplishments 2021-2022
• Responded within 2 hours to all emergency calls.
• 1,307 Pothole Repairs
• 388 Utility Cut Repairs
• 171 Street Base Repairs
• Handled 240 Tree Complaints
• Trimmed 22,912 Tree Footage
• Resolved 48 Right-of-Way Complaints
• 58 Brick Street Repairs
• 37.6 Lane Miles Crack Seal Completed
• Staffed and trained internal brick street crew
• Completed Brick Street Utility Cut Program –Worked with contractor to repair 686 sq yards of utility cuts
• Developed Brick Street Reconstruction Plan for Vine Street. Plan under review for possible water/sewer line replacement under half cent program
• Sourced vendors for historic brick
• Worked with Engineering on Thompson/Barger Street brick reclamation
• Developed Succession Planning & Cross Training Program for all staff members
• Worked on Implementation of Cityworks Public Asset Management System.
• Worked with Contractor to rate all public alleys. Report expected end of May Goals for 2022-2023
• ROW Mowing
• Cityworks Software Implementation
• Develop Employee Cross Training and Succession Planning Program
• Become Fully Staffed
• Annual Alley Maintenance Program
• Develop proactive process to ensure contractors work product meets City specifications
• Work with engineering to create annual street maintenance work plan
• Brick Street maintenance program
GENERAL FUND
90
GENERAL FUND Street SERVICES CONT. SERVICE POINT EXPENDITURES – STREETS FY 2020-2021 ACTUAL EXPENDITURES FY 2021-2022 BUDGET APPROPRIATIONS FY 2021-2022 PROJECTED EXPENDITURES FY 2022-2023 BUDGET APPROPRIATIONS Salaries and Benefits 1,326,632 1,784,746 1,501,057 2,121,014 Supplies and Services 235,853 159,885 296,559 277,500 Sundry 75,831 76,313 76,311 101,250 Utilities 2,186 2,750 2,729 2,750 Maintenance 1,066,247 1,077,229 1,083,814 1,036,757 Capital Outlay - 100,000 100,000TOTAL 2,706,749 3,200,923 3,060,470 3,539,271 SERVICE POINT EMPLOYEES – STREET DEPARTMENT REGULAR FULL TIME POSITIONS 2018-2019 2019-2020 2020-2021 2021-2022 2022-2023 Street Operations Superivsor 0.5 0.5 0.5 0.5 0.5 Crew Leader 4 4 4 4 4 1, 4, 8) Equipment Operator I 5 5 5 5 5 9)Equipment Operator II 7 7 7 7 7 Foreman II 1 1 1 1 1 Laborer 4 4 4 4 4 Semi-Skilled Laborer 3 3 3 3 3 6) Administrative Secretary 0.5 0.5 0.5 0.5 0.5 10)Truck Driver 3 3 3 3 3 TOTAL REGULAR FULL TIME 28 28 28 28 28 1) Four positions transferred to Environmental Services during FY 2007-2008 then the four positions were transferred back 2) Position transferred to Code Enforcement during FY 2007-2008 3) Eliminated Street Surface Technician Fy 2011-2012 4) One of five Equipment Operator I positions frozen FY 2010-2011 and FY 20112012 and FY 2012-2013 5 & 6) Senior Secretary reclassified to Administrative Secretary during FY 15-16. Administrative Secretary payroll 50 % paid by Stormwater 7) Street Manager payroll 50% paid by Stormwater FY 15-16 8) One Equipment Operator I remaining frozen FY 17-18 9) One Equipment Operator II remaining frozen FY 17-18 - until further notice 10) One Truck Driver remaining frozen FY 17-18 91
Traffic ENGINEERING
Traffic Engineering is charged with the responsibility of roadway safety. Staff members promote the safe, convenient and efficient movement of people, goods and services throughout the City by planning, designing, installing, maintaining and repairing all traffic control devices on City streets. The Department provides service support in the areas of:
• Manufacturing, installation, and maintenance of City street signs;
• Installation and maintenance of City street pavement markings;
• Maintenance and repair of traffic signals;
• Analysis and implementation of signal timing plans;
• Planning for current and future traffic control needs;
• Mitigating traffic congestion;
• Conducting speed studies, traffic signal studies, and stop sign warrant studies;
• Ensuring street lights are efficiently placed and installed and maintained in a timely manner; and
• Oversight of the public school crossing guard program
SERVICE POINT EXPENDITURES – TRAFFIC OPERATIONS
– STREET DEPARTMENT
GENERAL FUND
FY 2020-2021 ACTUAL EXPENDITURES FY 2021-2022 BUDGET APPROPRIATIONS FY 2021-2022 PROJECTED EXPENDITURES FY 2022-2023 BUDGET APPROPRIATIONS Salaries and Benefits 662,211 920,593 836,995 895,129 Supplies and Services 45,483 38,857 61,288 65,360 Sundry 50,001 93,597 93,596 112,829 Utilities 1,263,684 1,267,725 1,267,663 1,263,952 Maintenance 335,819 355,308 380,305 399,594 Capital Outlay - - -TOTAL 2,357,198 2,676,080 2,639,847 2,736,864 SERVICE POINT EMPLOYEES
REGULAR FULL TIME POSITIONS 2018-2019 2019-2020 2020-2021 2021-2022 2022-2023 Street Operations Superivsor 0.5 0.5 0.5 0.5 0.5 Crew Leader 4 4 4 4 4 1, 4, 8) Equipment Operator I 5 5 5 5 5 9)Equipment Operator II 7 7 7 7 7 Foreman II 1 1 1 1 1 Laborer 4 4 4 4 4 Semi-Skilled Laborer 3 3 3 3 3 6) Administrative Secretary 0.5 0.5 0.5 0.5 0.5 10)Truck Driver 3 3 3 3 3 TOTAL DEPARTMENT 28 28 28 28 28 1) Four positions transferred to Environmental Services during FY 2007-2008 then the four positions were transferred back 2) Position transferred to Code Enforcement during FY 2007-2008 3) Eliminated Street Surface Technician FY 2011-2012 4) One of five Equipment Operator I positions frozen FY 2010-2011 and FY 2011-2012 and FY 2012-2013 5) and 6) Senior Secretary reclassified to Administrative Secretary during FY 15-16. Administrative Secretary payroll 50% paid by Stormwater 7) Street Manager payroll 50% paid by Stormwater FY 15-16 8) One Equipment Operator I remaining frozen FY 17-18 9) One Equipment Operator II remaining frozen FY 17-18 - until further notice 10) One Truck Driver remaining frozen FY 17-18 92
POINT EMPLOYEES – TRAFFIC DEPARTMENT
SERVICE POINT EXPENDITURES – FAIR PARKING GARAGE
GENERAL FUND Traffic ENGINEERING CONT. 1) One position with 15% paid by Storm Water Management 2) One position with 24% paid by Storm Water Management 3) Title changed from Traffic Sign Crew Leader to Traffic Sign Supervisor during FY 2007-2008 4) Position upgraded to Transportation Project Engineer FY 2010-2011, with 15% paid by Storm Water Management 5) 1Transportation Project Engineer downgraded to Traffic Services Supervisor in FY 2011-2012 6) One Traffic Marker converted to two Part-Time college internships in FY 12-13 7) Traffic Operations Supervisor reclassified to Associate Traffic Engineer FY 12-13 8) Senior Secretary reclassified to Administrative Assistant FY 12-13 9) One Traffic Marker added FY 14-15 10) One Traffic Signal Tech added FY 14-15 11) Administrative Assistant payroll split changed from 76/24 to 85/15 Traffic/Stormwater FY 14-15 12) Traffic Services Supervisor payroll split eliminated, 100% paid from Traffic FY 14-15 13) Parking Patrol positions reclassified to Downtown Ambassadors and paid from Liberty Hall/Main Street FY 15/16 14) One Traffic Engineer transferred to the Engineering department FY 18-19 15) One Administrative Assistant 100% transferred to Engineering FY 18-19 16) One Traffic Services Supervisor reclassified to Traffic Operations Supervisor FY 19-20 TEMPORARY POSITIONS 2018-2019 2019-2020 2020-2021 2021-2022 2022-2023 School Crossing Guard 40 40 40 40 40 TOTAL TEMPORARY POSITIONS 40 40 40 40 40 GRAND TOTAL DEPARTMENT 52 52 52 52 52
FY 2020-2021 ACTUAL EXPENDITURES FY 2021-2022 BUDGET APPROPRIATIONS FY 2021-2022 PROJECTED EXPENDITURES FY 2022-2023 BUDGET APPROPRIATIONS Salaries and Benefits - - -Supplies and Services 1,787 4,000 8,759 6,500 Sundry - - -Utilities 2,090 14,900 17,462 14,900 Maintenance 7,923 11,650 6,000 6,120 Capital Outlay - - -TOTAL 11,800 30,550 32,221 27,520 SERVICE
REGULAR FULL TIME POSITIONS 2018-2019 2019-2020 2020-2021 2021-2022 2022-2023 14)Traffic Engineer - - - -1, 4, &7) Associate Traffic Engineer 1 1 1 1 1 5) & 12, 16) Traffic Services Supervisor 1 - - -6, 9) Traffic Marker 3 3 3 3 3 7) Traffic Operations Supervisor - 1 1 1 1 Traffic Sign Supervisor 1 1 1 1 1 8,15) Administrative Assistant - - -10) Traffic Signal Technician 4 4 4 4 4 TOTAL REGULAR FULL TIME 10 10 10 10 10 REGULAR PART TIME POSITIONS 2018-2019 2019-2020 2020-2021 2021-2022 2022-2023 6) Intern 2 2 2 2 2 TOTAL REGULAR PART TIME 2 2 2 2 2 93
Animal SERVICES
Areas of Service
• Capture stray animals;
• Respond to calls related to nuisance wildlife animals;
• Rabies surveillance of bite animals;
• Support Police Department on calls for service;
• Checking welfare on pet animals;
• Education on companion animal ownership;
• Dead animal removal;
• Disease surveillance and control measures through mosquito abatement;
• Care and welfare of stray, surrendered, and protective custody animals;
• Processing owner reclaims of strays;
• Processing adoptions of unclaimed pets;
• Participating in adoption events;
• Liaising with, and transferring animals to, rescue organizations; and,
• Euthanasia of surplus, injured, and diseased animals.
Accomplishments for 2021-2022
• Moved in to new 18,000 sq ft facility
• Owner reclaims up 30%
• Transfers to guaranteed adoption agencies up 98%
• Adoptions up 23%
• Vaccination and microchip clinic served over 200 people
• 1167 microchips registered in one year
• 4,543 lbs of food given through Pet Food Bank Project
• Continued collaboration with Tyler Junior College
• Veterinary Technology program
• 110 partners in rescue network.
Goals for 2022-2023
• Begin offering low cost/high volume spay/neuter resources
• Register 5000 microchipped pets.
SERVICE POINT EXPENDITURES – ANIMAL SERVICES
GENERAL
FUND
FY 2020-2021 ACTUAL EXPENDITURES FY 2021-2022 BUDGET APPROPRIATIONS FY 2021-2022 PROJECTED EXPENDITURES FY 2022-2023 BUDGET APPROPRIATIONS Salaries and Benefits 757,525 915,876 859,090 1,028,359 Supplies and Services 92,242 117,305 109,497 142,346 Sundry 118,084 135,838 116,317 167,516 Utilities 24,819 28,850 24,013 28,850 Maintenance 109,380 108,933 101,497 111,235 Capital Outlay - 34,500 7,986 22,000 TOTAL 1,102,050 1,341,302 1,218,400 1,500,306 94
SERVICE POINT EMPLOYEES – ANIMAL SERVICES
GENERAL FUND Animal
CONT. General Fund-Animal Services tab added FY 17-18 1) Two Animal Shelter Technicians added FY 15-16
SERVICES
REGULAR FULL TIME POSITIONS 2018-2019 2019-2020 2020-2021 2021-2022 2022-2023 Animal Shelter Manager 1 1 1 1 1 Animal Shelter Adoption Counselor 1 1 1 1 1 Administrative Secretary 1 1 1 1 1 Animal Control Officer 5 5 5 5 5 Animal Shelter Supervisor 1 1 1 1 1 1) Animal Shelter Technician 6 6 6 6 6 TOTAL REGULAR FULL TIME 15 15 15 15 15 REGULAR PART TIME POSITIONS 2018-2019 2019-2020 2020-2021 2021-2022 2022-2023 TOTAL REGULAR PART TIME 0 0 0 0 0 GRAND TOTAL DEPARTMENT 15.00 15.00 15.00 15.00 15.00 95
Municipal COURT
The Municipal Court functions to administer fair and impartial justice in accordance with applicable statutes, ordinances, and City regulations by conducting trials and hearings to dispose of traffic, misdemeanor and parking violations. The Municipal Court through the use of up to date technology is to provide a forum for justice for all citizens while abiding by the City’s overall mission. Staff members of the Court are responsible for:
• Scheduling, hearing, and disposing of all cases brought for trial;
• Establishing and administering court procedures as required by State law;
• Maintaining all records and dockets;
• Accounting for payment of fines; and,
• Serving warrants.
Accomplishments for 2021-2022
• Expanded community service options to include additional agencies and students.
• Created additional virtual hearing dockets to better serve the defendants.
• 100% of staff trained through TMCEC.
• Introduced a newsletter publication containing helpful court information.
• Created a Court video through communications with the Judges to discuss court processes.
• Implemented an online records search for attorneys and defendants who are needing information regarding pending cases.
• Utilized software to text/email defendant’s information regarding their court cases.
Goals for 2022-2023
• Continue to identify and implement safety procedures and facility improvements.
• Re-establish the teen court program to educate youth who have received citations in the Court.
• City Marshal office will work with PD to increase community outreach.
• Continue presentations at local colleges, junior and high schools.
• Streamline veteran docket to include presentations from local agencies.
• Create a job posting board of employers/ employees to assist defendants who may be seeking employment.
• Create an educational video through the Communications department regarding the municipal court to be aired on Channel 3
• Continue cross-training with other city departments including Finance and Water.
• Continue to work with the Information Technology department to automate processes to move the Court toward paperless operations.
• Seek a partnership with local agencies to better educate and assist defendants with obtaining their driver license
• Complete the second year of the Citizens’ Roundtable Committee of local leaders to increase transparency of Court procedures, including other city departments and entities associated with the court’s proceedings.
GENERAL FUND
96
SERVICE POINT EXPENDITURES – MUNICIPAL COURT
COURT
GENERAL FUND Municipal
CONT.
REGULAR FULL TIME POSITIONS 2018-2019 2019-2020 2020-2021 2021-2022 2022-2023 Municipal Court Administrator 1 1 1 1 1 4, 15) Deputy Court Administrator 1 1 1 1 1 Court Clerical Supervisor 1 1 1 1 1 City Marshal 1 1 1 1 1 Court Technician 1 1 1 1 1 1, 10, 17) Deputy City Marshal II 2 2 2 2 2 2, 5, 6, 11, 12, 16) Deputy Court Clerk 6 6 6 6 6 8) Senior Deputy Court Clerk 2 2 2 2 2 TOTAL REGULAR FULL TIME 15 15 15 15 15
COURT
SERVICE POINT EMPLOYEES – MUNICIPAL
FY 2020-2021 ACTUAL EXPENDITURES FY 2021-2022 BUDGET APPROPRIATIONS FY 2021-2022 PROJECTED EXPENDITURES FY 2022-2023 BUDGET APPROPRIATIONS Salaries and Benefits 982,945 1,233,965 1,049,665 1,369,366 Supplies and Services 553,752 494,256 592,431 673,112 Sundry 287,538 286,942 287,042 285,652 Utilities 8,248 8,700 8,142 8,700 Maintenance 60,709 49,309 48,971 46,271 Capital Outlay - - -TOTAL 1,893,192 2,073,172 1,986,251 2,383,101 1) One Position frozen for FY 2009-2010 2) One additional position approved for FY 2008-2009 3) One position added for FY 2008-2009 4) Administrative Assistant position converted to Deputy Court Administrator during FY 2009-2010 5) One Deputy Court Clerk Transferred to Main Street during FY 2009-2010 6) One Deputy Court Clerk Upgraded to a Senior Deputy Court Clerk during FY 2009-2010 7) Teen Court Coordinator downgraded to deputy court clerk during FY 20092010 8) One Senior Deputy Court Clerk upgraded to Court Clerical Supervisor during FY 2009-2010 9) Deputy Marshal I moved to Liberty Theater to create Liberty Theater Manager position FY 2010-2011 10) Eliminated 1 of 3 Deputy City Marshall II positions FY 2011-2012 11) 1 Deputy Court Clerk, Juvenile Case Coordinator and Juvenile Program Coordinator moved to Partners of Youth Fund FY 2010-2011 12) During FY 09-10, refer to 7, 5, 6 during process the downgraded Deputy Court Clerk was not added to the number, this is a corrected entry, should be 8 positions 13) 3 Deputy City Marshal I positions moved to Municipal Court Security Fund FY 2010-2011 14) One Deputy City Marshal I reclassified to Deputy City Marshal II FY 15-16 15) Deputy Court Administrator remaining frozen FY 17-18 16) One Deputy Court Clerk Frozen FY 20-21 17) One Deputy City Marshal II Frozen FY 20-21 97
SERVICE POINT EMPLOYEES – MUNICIPAL COURT SECURITY
1) Three Deputy City Marshal I positions moved to Municipal Security from Municipal Court Administration FY 2010-2011
3) One Deputy Court Clerk reclassified back to Deputy City Marshal I during FY 13-14
5) Deputy City Marshal I reclassified to Deputy City Marshal II FY 2015-2016
2) One Deputy City Marshal I reclassified to Deputy Court Clerk FY 13-14
SERVICE POINT EMPLOYEES – DEPUTY MARSHAL
6)1) Two Deputy City Marshal II positions moved to Court Special Fee Fund FY 2019-2020 Court Special Fee Fund created FY 19-20
4) Deputy City Marshal I reclassified to Deputy City Marshal II during FY 13-14
1) Two Deputy City Marshal II positions moved from Municipal Security FY 2019-2020
REGULAR FULL TIME POSITIONS 2018-2019 2019-2020 2020-2021 2021-2022 2022-2023 1, 2, 3, 4) Deputy City Marshal I 1 1 1 1 1 4, 6) Deputy Marshal II 2 2 2 2 2 TOTAL REGULAR FULL TIME 3 3 3 3 3 REGULAR FULL TIME POSITIONS 2018-2019 2019-2020 2020-2021 2021-2022 2022-2023 4) Deputy Marshal II 2 2 2 2 2 TOTAL REGULAR FULL TIME 2 2 2 2 2 GENERAL
FUND Municipal COURT CONT.
98
Project Funds GENERAL CAPITAL

General Capital PROJECT FUND (102)
STATEMENT OF REVENUES, EXPENDITURES, AND CHANGES IN WORKING CAPITAL
Fiscal Year 2022-2023
General Capital Project Funds
ACTUALS 2020-2021 AMENDED BUDGET 2021-2022 PROJECTED 2021-2022 BUDGET 2022-2023 BEGINNING FUND BALANCE 405,173 2,094,362 2,094,362 2,656,728 REVENUES Interest Earnings 2,767 1,000 6,366 1,000 Miscellaneous Income 36,412 8,000 2,810 8,000 Capital Lease Proceeds - 1,858,749 1,858,749TOTAL REVENUES 39,179 1,867,749 1,867,925 9,000 EXPENDITURES Library Bldg. Imprv - 37,831 37,811Parks Improvements Projects 151,010 12,063 12,001City Building Improvements 429,937 466,007 226,802 1,198,907 Substandard Structure Program - - - 200,000 Capital Lease Purchase - 1,858,749 1,858,749 545,000 Fire Equipment/Facilities 794,554 1,608,934 1,608,934 62,254 Downtown 99,489 - -Parking Lot Improvements - 56,194 -NBS Remodel - 143,262 143,262Tree Removal - - - 100,000 Streets Misc Equipment - - - 39,000 Contingency - - - 241,000 TOTAL EXPENDITURES 1,474,990 4,183,040 3,887,559 2,386,161 Transfer in 3,125,000 2,582,000 2,582,000 93,811 General Fund (101) 3,125,000 343,811 2,582,000 93,811 Water Utilities Fund (502) - - -ENDING FUND BALANCE 2,094,362 122,882 2,656,728 373,378 100
Quality Street COMMITMENT FUND (103)
STATEMENT OF REVENUES, EXPENDITURES, AND CHANGES IN WORKING CAPITAL
Fiscal Year 2022-2023
General Capital Project Funds
FY 2020-2021 ACTUAL EXPENDITURES FY 2021-2022 BUDGET APPROPRIATIONS FY 2021-2022 PROJECTED EXPENDITURES FY 2022-2023 BUDGET APPROPRIATIONS BEGINNING FUND BALANCE 266,758 463,920 463,920 236,353 REVENUES Interest Earnings 6,549 1,394 5,092 1,394 Miscellaneous Income - - -TOTAL REVENUES 6,549 1,394 5,092 1,394 EXPENDITURES Street Improvement Program 1,312,813 1,456,135 1,456,135 1,279,801 Public Alley Improvements - 150,000 135,465 165,000 Brick Street Improvements 98,994 614,672 594,466 585,000 TOTAL EXPENDITURES 1,411,807 2,220,807 2,186,066 2,029,801 Transfer In 1,602,420 1,953,407 1,953,407 1,829,862 General Fund (101) 1,602,420 1,953,407 1,953,407 1,829,862 ENDING FUND BALANCE 463,920 197,914 236,353 37,808 101
Services Fund DEVELOPMENT

Development Services FUND (202)
STATEMENT OF REVENUES, EXPENDITURES, AND CHANGES IN WORKING CAPITAL
DEVELOPMENT SERVICES FUND
Fiscal
ACTUALS 2020-2021 AMENDED BUDGET 2021-2022 PROJECTED 2021-2022 BUDGET 2022-2023 BEGINNING FUND BALANCE 557,258 852,543 852,543 1,243,343 REVENUES Building Permits 1,208,071 1,308,764 1,539,767 1,616,755 Electrical Permits 172,218 160,000 199,673 185,000 Plumbing Permits 134,787 118,450 132,806 135,000 Zoning Permits 70,946 75,000 79,210 80,000 Mechanical Permits 59,526 90,000 89,045 90,000 Cert. of Occupancy Fees 24,550 30,000 30,000 30,000 Local TABC Fee 9,160 15,000 8,410 15,000 Billboard Registration 16,660 17,595 15,895 17,595 Sign Permits 19,132 40,000 36,819 60,000 Contractor License 22,065 50,000 35,450 50,000 House Moving Permits - - -Permit Fee - Clearing - - -Interest Earnings 12,571 30,000 9,069 10,000 Copying/Printing Fees - - -Platting Fees 100,584 70,000 82,174 80,000 Miscellaneous Income - - -Contractor Testing Fees 283,833 160,000 287,668 250,000 Historic Preservation 400 - -Subdivision Plan Review 50,000 60,000 60,000 60,000 TOTAL REVENUES 2,184,503 2,224,809 2,605,986 2,679,350 EXPENDITURES Planning and Zoning 699,762 880,055 801,778 1,076,981 Building Services 1,189,456 1,552,012 1,413,408 1,552,082 TOTAL EXPENDITURES 1,889,218 2,432,067 2,215,186 2,629,063 Transfer Out - - -Productivity Fund (639) - - -ENDING FUND BALANCE 852,543 645,285 1,243,343 1,293,630 103
Year 2022-2023
Building/Development SERVICES
Building services is responsible for carrying out the community’s vision by:
• Promoting and assisting the contractors and the public to use eTRAIiT online;
• Providing opportunities for inspectors and technicians to meet or exceed requirements or certifications;
• Encouraging employees to attend City University classes so they enhance their job skills and performance;
• Posting new commercial and residential project permit releases on department website;
• Posting CO’s issued on the website;
• Attending quarterly lunch & learn meetings with Tyler Area Builders Association;
• Streamlining of the permitting process.
• Streamlining of the plan review process.
• Streamlining of the inspection process.
• Cross training building inspectors so they can all do Combo inspections.
• Streamlining of the complaint enforcement process.
Accomplishments for 2021-2022
• 341 New Single Family Homes
• 92 New Duplexes and Townhomes
• 34 New Commercial Permits
• 8 New Office Permits
• 150 New Sign Permits
• 18,094 inspections
• 1,036 Electrical
• 1,295 Plumbing
• 1,043 Building Final Goals for 2022-2023
• Ensure public safety through permitting and building inspections process
• Ensure property protection
• Provide quality customer service
• Provide customer/public education
• Ensure employee safety, education and morale
• Conduct special projects as assigned or needed in a expedient fashion
SERVICE POINT EMPLOYEES – DEVELOPMENT SERVICES
DEVELOPMENT SERVICES FUND
FY 2020-2021 ACTUAL EXPENDITURES FY 2021-2022 BUDGET APPROPRIATIONS FY 2021-2022 PROJECTED EXPENDITURES FY 2022-2023 BUDGET APPROPRIATIONS Salaries and Benefits 819,447 1,145,005 967,631 1,138,962 Supplies and Services 220,176 234,539 263,965 117,912 Sundry 118,719 137,716 154,324 258,944 Utilities 49 400 53 400 Maintenance 31,065 34,352 27,435 35,864 Capital Outlay - - -TOTAL 1,189,456 1,552,012 1,413,408 1,552,082
SERVICE POINT EXPENDITURES – BUILDING SERVICES
REGULAR FULL TIME POSITIONS 2018-2019 2019-2020 2020-2021 2021-2022 2022-2023 Chief Building Official 1 1 1 1 1 Chief Electrical Inspector 1 1 1 1 1 1,7, 8, 13, 14, 15, 16,19) Building Inspector 2 2 2 2 2 Senior Building Inspector 1 1 1 1 1 Plumbing Inspector 1 1 1 1 1 104
Building/Development SERVICES
SERVICE POINT EMPLOYEES – DEVELOPMENT SERVICES CONT.
1) One position frozen for FY 2009-2010, FY 2010-2011 and FY 2011-2012
2) Position transferred to Water Distribution during FY 2009-2010 transferred back same year position frozen for FY 2010-2011
3) One position frozen for FY 2009-2010 CORRECTION: One Project Engineer never frozen, researched, one position ever authorized not two. Budget book never reflected two positions.
4) Four positions transferred to Storm Water FY 2009-2010
5) One position frozen for FY 2010-2011
6) Senior Utilities Specialist position transferred to Water Business Office during FY 2009-2010
7) One Building Inspector position upgrade to Combination Inspector II during FY 2008-2009
16) One Building Inspector added FY 14-15. One Building Inspector added FY 15-16
17) One Permit Tech reclassified to Customer Service Supervisor FY 16-17
18) Development Services Specialist closed FY17-18 (CORRECTION: position was reclassified to Residential Building Services Specialist FY 15-16) error located FY 19-20
19) One Building Inspector reclassified to Senior Building Inspector FY 18-19
20) One Residential Building Services Specialist reclassified to Senior Plans Examiner FY 20-21 (Residential Building Services Specialist position not reflected in budget book until FY 19-20; but has been an authorized position since 2015 due to a title change from Dev Services Spec)
DEVELOPMENT SERVICES FUND
CONT.
8)
9)
13)
13-14
1 of 2 Building Inspectors eliminated FY 2011-2012
Permit Clerk eliminated FY 2011-2012 10) Chief Plumbing Inspector/ Mechanical Inspector eliminated FY 2011-2012 11) 1 Building Inspector frozen FY 2011-2012 and 2012-2013 12) Senior Permit Technician downgraded to Permit Technician FY 13-14. One Permit Technician added FY 15-16
One Building Inspector reclassified to ACM in CMO FY 12-13 14) One Building Inspector added from reclassification of Code Enforcement Officer (NBS) FY
15) One Comination Inspector II downgraded to Building Inspector FY 13-14
REGULAR PART TIME POSITIONS 2018-2019 2019-2020 2020-2021 2021-2022 2022-2023 Permit Clerk - - - -TOTAL REGULAR PART TIME - - - -GRAND TOTAL DEPARTMENT 12 13 13 13 13 REGULAR FULL TIME POSITIONS 2018-2019 2019-2020 2020-2021 2021-2022 2022-2023 17) Customer Service Supervisor 1 1 1 1 1 Development Services Engineer 1 1 1 1 1 18) Development Services Specialist - - - -20)Residential Building Services Specialist - 1 - -12, 17) Permit Technician 1 1 1 1 1 Plans Examiner 1 1 1 1 1 20) Senior Plans Examiner - - 1 1 1 3) Project Engineer 1 1 1 1 1 12) Senior Permit Technician 1 1 1 1 1 TOTAL REGULAR FULL TIME 12 13 13 13 13 105
Planning DEPARTMENT
The Planning Department’s strategic directive is to help our customers make informed land based decisions using the community’s adopted vision in order to anticipate and maintain a healthy, organized and prosperous business and residential environment. The Planning Department is also charged with providing professional oversight and support to the Planning and Zoning Commission, the Zoning Board of Adjustment and the Historical Preservation Board. The Planning Department is responsible for carrying out the community’s vision by:
• General zoning administration;
• Zoning/Special Use Permit application processing;
• Implementing key sections of Tyler 1st;
• Subdivision regulation;
• Annexation/Extra Territorial Jurisdiction (ETJ) issues oversight;
• Comprehensive Plan (Tyler 1st) administration;
• Unified Development Code (UDC) administration;
• Sign and landscape regulation;
• Historic preservation and education;
• TABC permit application processing and annual registration;
• Tax abatement;
• Economic development;
• Tax increment financing;
• Sexually oriented business regulation;
• Small Cell Network Node application and annual registration; and
• Special studies management.
Accomplishments for 2021-2022
• Received APA Texas Chapter Planning Excellence Award (fourth consecutive year)
• Implemented transition to ProjectDox electronic permitting and project management software;
• Four new voluntary Local Landmark designations
• Completed a Lean Six Sigma Project;
• Hosted Tyler’s P.A.S.T – Tax Credit Programs;
• Held fourth Annual Local Historic Landmark Appreciation Event;
• Assessed the code’s effectiveness biannually;
• Hosted Historic Preservation Heart Bomb Events; and
• Conducted the 10-year update process for the Tyler 1st Comprehensive Plan;
Goals for 2022-2023
• Implement and monitor Tyler 1st Comprehensive Plan
• Timely review of land development proposals
• Preserve Tyler’s historical resources
• Administer the Billboard Registration Program.
• Administer TABC local fee renewal program.
• Audit landscaping Certificate of Completion for new developments
• Review applications for improvement, including Spanish language accessibility
• Develop career ladders
• Seek out training opportunities for staff
SERVICE POINT EXPENDITURES – PLANNING & ZONING
DEVELOPMENT SERVICES FUND
FY 2020-2021 ACTUAL EXPENDITURES FY 2021-2022 BUDGET APPROPRIATIONS FY 2021-2022 PROJECTED EXPENDITURES FY 2022-2023 BUDGET APPROPRIATIONS Salaries and Benefits 604,183 762,198 684,254 958,083 Supplies and Services 32,497 44,975 45,034 44,975 Sundry 62,510 70,132 69,740 71,173 Utilities 36 750 750 750 Maintenance - - -Capital Outlay - 2,000 2,000 2,000 TOTAL 699,226 880,055 801,778 1,076,981 106
SERVICE POINT EMPLOYEES – PLANNING
during FY 13-14
17) One Planner reclassified to Senior Planner during FY 13-14
18) One Planner added FY 14-15
19) Principal Planner reclassified to Planning Manager FY 15-16
20) One Administrative Assistant reclassified to Executive Operations Coordinator/ Planning Tech FY 15-16
21) One Executive Operations Coordinator reclassified to Administrative Assistant FY 16-17
22) One MPO Planner reclassified and transfer to Senior Planner P/Z FY 16-17
23) One Historic Preservation Officer reclassified to Planner FY 17-18
24) One Planning Manager reclassified to Director of Planning FY 19-20
CONT. DEVELOPMENT SERVICES FUND
Planning DEPARTMENT
REGULAR FULL TIME POSITIONS 2018-2019 2019-2020 2020-2021 2021-2022 2022-2023 1) & 11) Director of Planning - 1 1 1 1 19, 24) Planning Manager 1 - - -4, 18) Planner 2 2 2 2 2 5, 6, 13) Planning Technician 1 1 1 1 1 7, 8, 16,19) Principal Planner 1 1 1 1 1 3, 4, 7, 9, 16,17, 22) Senior Planner 1 1 1 1 1 12) Historic Preservation Officer - - - -20, 21) Administrative Assistant - - - -15) Planning Director/MPO Executive Director 1 1 1 1 1 TOTAL REGULAR FULL TIME 7.00 7.00 7.00 7.00 7.00 1) Director of Planning position with 30% paid by MPO 2) GIS/Planner/Developer position transferred to MPO during FY 2007-2008 3) Two Senior Planner positions, one with 15% paid by MPO 4) One position frozen for FY 20092010 and FY 2010-2011- Note was incorrectly input on Senior Planner, should be for Planner 5) Converted one full-time Planning Technician position into 2 parttime positions 2010-2011 6) Converted two part-time Planning Technicians to one full-time position FY 2010-2011 7) During FY 2010-2011 One Senior Planner moved to Principal Planner 8) Principal Planner downgraded to Senior Secretary FY 2011-2012 9) Senior Planner Frozen FY 20112012 10) Planner unfrozen FY 2011-2012 11) Director of Planning reclassified to City Planner in FY 2011-2012 12) Senior Secretary reclassified to Historic Preservation Officer in FY 12-13 13) Planning Technician reclassified to Administrative Assistant during FY 13-14 14) One Planning Intern added during FY 13-14 15) City Planner reclassified to Planning Director/MPO Executive Director during FY 13-14 16) One Senior Planner reclassified to Principal Planner
REGULAR PART TIME POSITIONS 2018-2019 2019-2020 2020-2021 2021-2022 2022-2023 6) Planning Technician - - - -TOTAL REGULAR PART TIME 0 0 0 0 0 GRAND TOTAL DEPARTMENT 7.00 7.00 7.00 7.00 7.00 107
Utilities Fund WATER
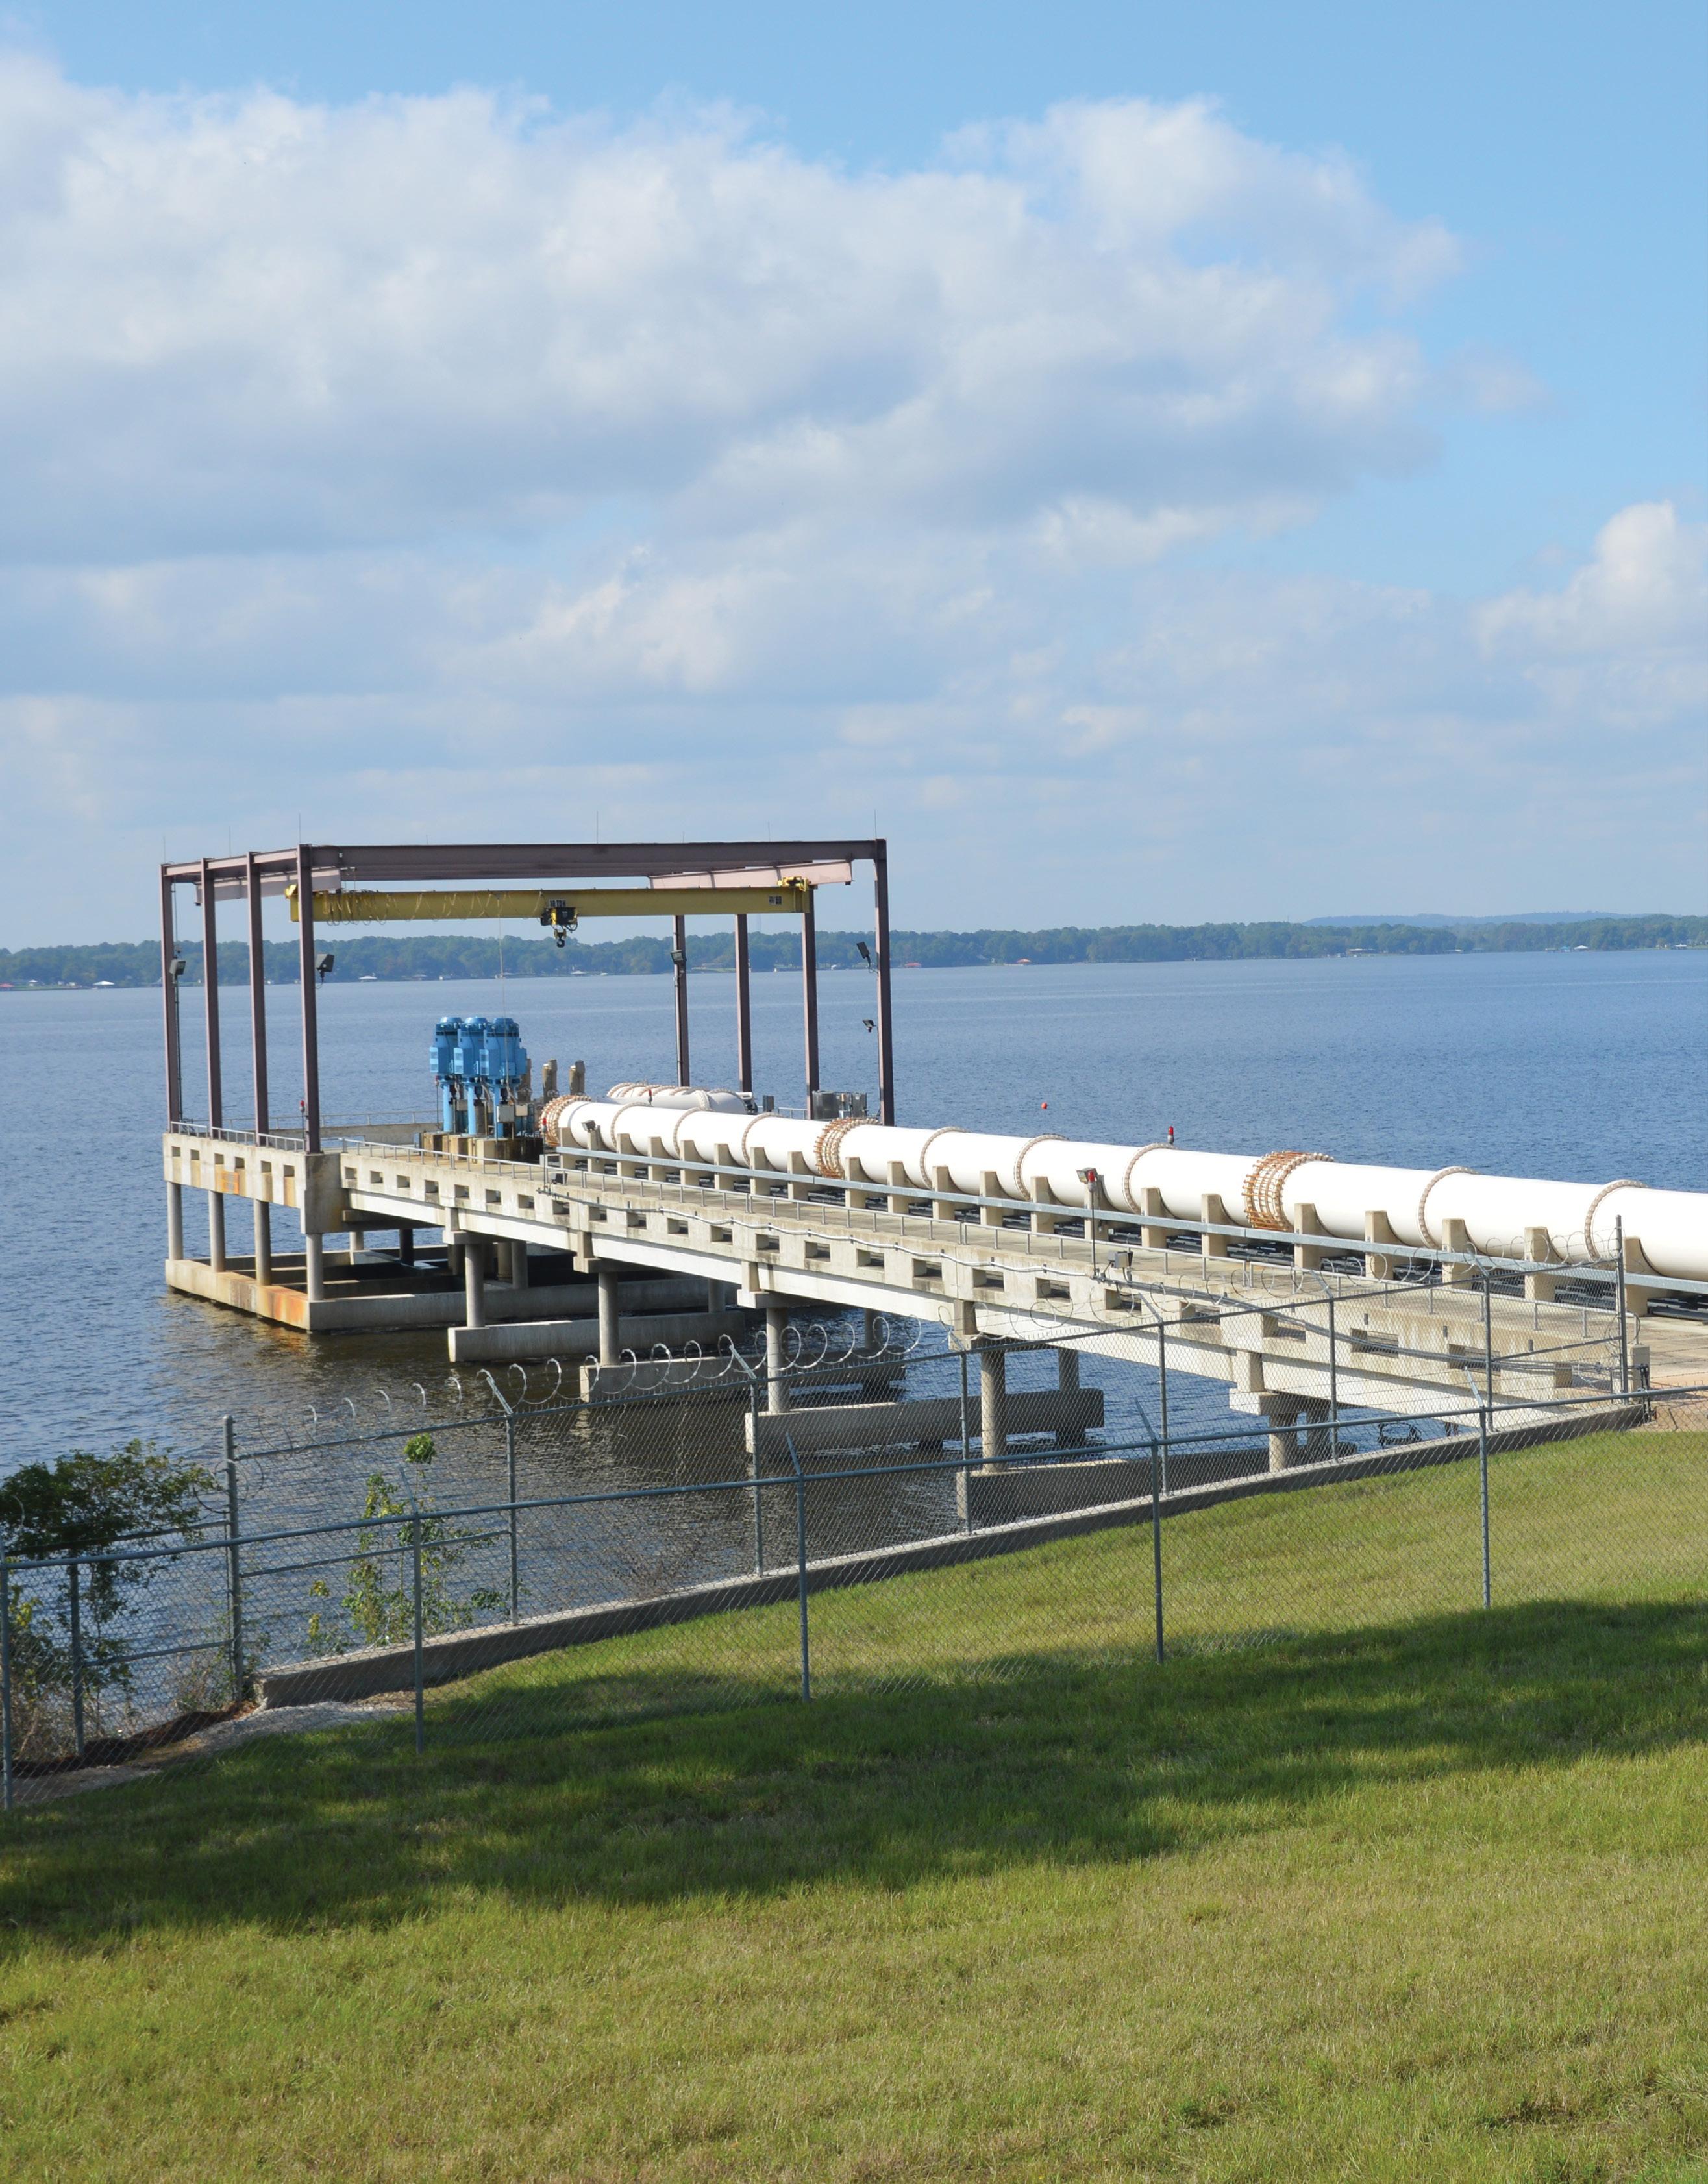
Water Utilities FUND (502)
STATEMENT OF REVENUES, EXPENDITURES, AND CHANGES IN WORKING CAPITAL
Fiscal Year 2022-2023
WATER
UTILITIES FUND
ACTUALS 2020-2021 AMENDED BUDGET 2021-2022 PROJECTED 2021-2022 BUDGET 2022-2023 Unreserved Fund Balance $8,611,058 $10,084,013 $10,084,013 $10,238,935 Operating Reserve 4,359,081 4,619,342 4,619,342 5,026,253 BEGINNING FUND BALANCE / WORKING CAPITAL 12,970,139 14,703,355 14,703,355 15,265,188 REVENUES Use of Money and Property 161,903 150,637 143,103 142,867 Charges for Current Services 43,739,030 43,653,990 44,785,514 51,058,796 Miscellaneous Income 62,754 42,715 45,222 49,750 TOTAL REVENUES 43,963,687 43,847,342 44,973,839 51,251,413 EXPENDITURES 741 Administration 4,159,254 5,446,495 4,701,232 5,928,180 742 Water Office 2,244,457 2,421,767 2,354,513 2,551,035 743 Water Distribution 4,225,472 4,185,875 4,294,950 4,458,772 744 Water Plant 6,107,076 8,332,360 7,272,035 9,411,895 745 Waste Collection 2,970,201 3,096,954 3,263,970 3,317,618 746 Waste Treatment 4,597,726 5,255,376 4,876,705 5,480,973 747 Lake Tyler 1,095,304 1,410,346 1,139,108 1,616,913 749 GIS 1,070,408 1,174,854 1,145,280 1,232,286 1741 Purchasing 224,876 290,200 275,073 312,152 1745 CD/CMOM ( Regulatory Monitoring) 2,968,454 3,560,694 2,966,948 3,570,977 1746 Sludge Disposal 1,132,385 1,141,386 1,218,542 1,336,557 TOTAL EXPENDITURES 30,795,613 36,316,307 33,508,356 39,217,358 Transfer In 3,654 - -(Transfer Out) (11,438,512) (10,893,084) (10,903,650) (10,984,135) Economic Development Fund (208) (174,996) (175,000) (175,000) (175,000) Utilities Capital Fund (503) (6,607,692) (5,500,000) (5,500,000) (5,500,000) Productivity Fund (639) (420,000) (250,000) (250,000) (250,000) Property and Facility Fund (663) (50,652) (50,653) (50,653) (50,653) Debt Service Fund (504) (3,885,172) (4,517,431) (4,527,997) (4,558,482) Technology Fund (671) (300,000) (400,000) (400,000) (450,000) General Capital Fund (102) - - -Unreserved Fund Balance 10,084,013 5,893,860 10,238,935 10,432,504 Operating Reserve 4,619,342 5,447,446 5,026,253 5,882,604 ENDING FUND BALANCE / WORKING CAPITAL $14,703,355 $11,341,306 $15,265,188 $16,315,108 109
Water Utilities FUND (502) CONT.
STATEMENT OF REVENUES
Fiscal Year 2022-2023
WATER
UTILITIES FUND
ACTUALS 2020-2021 AMENDED BUDGET 2021-2022 PROJECTED 2021-2022 BUDGET 2022-2023 USE OF MONEY AND PROPERTY Lake Tyler Lot Rental $62,782 $63,637 $62,670 $66,867 Lake Tyler Marina 3,767 - 11,777 14,000 Barge Concession 15,844 12,000 17,471 14,000 Interest Earnings 79,510 75,000 51,185 48,000 TOTAL USE OF MONEY AND PROPERTY 161,903 150,637 143,103 142,867 CHARGES FOR CURRENT SERVICES Meter Activation 385,564 305,300 408,138 310,000 Water Service 211,031 153,400 243,070 176,000 Sewer Service 190,785 129,300 204,565 150,000 Sewer Activation 22,050 16,200 13,954 16,200 EMS Billing Fees 7,953 7,953 7,954 7,953 Water System Fee 118,010 117,288 119,263 118,522 Meter Set & Test Fees 16,607 16,000 16,000 16,000 Plug Fee 5,500 3,500 7,100 4,500 After Hrs./Additional Trip Fees 27,698 22,000 37,900 29,000 Water Quality Fee 143,436 142,800 144,473 142,000 Current Water Sales 21,350,261 21,735,055 21,865,386 25,939,709 Miscellaneous Water Sales 52,394 9,500 19,137 20,000 Old Account Collection Fees - - -Reconnect Fees 295,575 312,000 344,050 312,000 Overhead Reimbursment from Solid Waste Fund 294,735 313,710 313,710 301,546 Sewer Charges 18,039,549 17,796,924 17,993,071 20,800,940 Labor & Equipment 22,889 50,000 109,320 50,000 Water Connect Fees 281,650 272,500 262,325 272,500 Septic Tank Dumping Fees 467,597 479,500 572,197 594,482 Wholesale Water Sales 1,176,199 1,100,000 1,382,597 1,100,000 Late Notice Fees 384,981 450,000 473,680 450,000 Fire Line Charges 204,273 177,000 203,564 204,000 Overhead Reimbursment from Storm Water Fund 40,293 44,060 44,060 43,444 TOTAL CHARGES FOR CURRENT SERVICES 43,739,030 43,653,990 44,785,514 51,058,796 MISCELLANEOUS Miscellaneous Income 40,454 25,900 21,917 29,950 Lake Tyler East Registration 2,700 2,815 2,800 2,800 Returned Check Fees 19,600 14,000 20,505 17,000 TOTAL MISCELLANEOUS 62,754 42,715 45,222 49,750 TOTAL REVENUES $43,963,687 $43,847,342 $44,973,839 $51,251,413 110
UTILITIES
Utilities Construction FUND (503)
STATEMENT OF REVENUES, EXPENDITURES, AND CHANGES IN WORKING CAPITAL
Fiscal Year 2022-2023
WATER
ACTUALS 2020-2021 AMENDED BUDGET 2021-2022 PROJECTED 2021-2022 BUDGET 2022-2023 BEGINNING FUND BALANCE 8,076,135 6,529,102 6,529,102 5,001,704 REVENUES ARPA Funds - - - 5,912,090 Interest Earnings 59,623 70,000 34,860 50,000 TOTAL REVENUES 59,623 70,000 34,860 5,962,090 EXPENDITURES Special Services/Water Business Office Upgrades - - -Water System Improvements 2,078,584 1,850,000 1,000,357 1,850,000 Water Treatment Plant 2,120,878 2,957,800 2,520,378 6,251,930 Waste System Improvements 530,508 900,000 610,977 550,000 Waste Treatment Plant 3,484,378 4,463,300 2,930,546 6,478,558 Lake Tyler Improvements - - - 500,000 TOTAL EXPENDITURES 8,214,348 10,171,100 7,062,258 15,630,488 Transfer In 6,607,692 5,500,000 5,500,000 5,500,000 Water Utilities Fund (502) 6,607,692 5,500,000 5,500,000 5,500,000 Water Utilities Debt Reserve Fund (505) - - -Transfer Out - - -Water Utilities Fund (502) - - -ENDING FUND BALANCE 6,529,102 1,928,002 5,001,704 833,306 111
FUND
Storm Water FUND (575)
STATEMENT OF REVENUES, EXPENDITURES, AND CHANGES IN WORKING CAPITAL
Fiscal Year 2022-2023
WATER
FUND
UTILITIES
ACTUALS 2020-2021 AMENDED BUDGET 2021-2022 PROJECTED 2021-2022 BUDGET 2022-2023 BEGINNING FUND BALANCE 1,426,143 1,913,919 1,913,919 1,810,302 REVENUES Interest Earnings 11,414 15,000 8,233 15,000 Storm Water Management 1,965,268 1,985,480 1,985,480 2,234,908 Miscellaneous Income 64 - -TOTAL REVENUES 1,976,746 2,000,480 1,993,713 2,249,908 EXPENDITURES Hazardous Material Operations 82,924 109,038 68,198 109,038 Storm Water Operations and Maint. 1,329,773 1,557,803 1,442,714 1,810,035 Storm Water Capital Projects 76,273 586,972 586,418 1,000,000 TOTAL EXPENDITURES 1,488,970 2,253,813 2,097,330 2,919,073 Transfer Out - - -Productivity Fund (639) - - -ENDING FUND BALANCE 1,913,919 1,660,586 1,810,302 1,141,137 112
Water UTILITIES
Service Point Focus
Tyler Water Utilities consists of the Administration, Business Office, Water Distribution, Water Production, Wastewater Collection, Wastewater Treatment, Lake Tyler, Geographic Information Systems (GIS), Purchasing, CMOM Administration and Sludge Treatment divisions. All staff members are dedicated to providing citizens with the safest drinking water and sanitary sewer services possible while maintaining strict environmental and safety protocols.
Water Administration staff provides executive oversight and administrative support to all eleven departments within the Utility so that the utility functions as a single, cohesive operation. They provide personnel administration and development, records management, project management and contract administration for all major water and sewer infrastructure needs including maintenance, new construction and/or replacement activities, as well as planning for the most efficient funding. Administration also acts as the liaison with other City departments and with Federal, State and local organizations regarding water and sewer matters. The Water Business Office provides services to two distinct customer bases: Internal Customers and External Customers. Internally, the Water Business Office provides meter reading, billing and payment collection services to Tyler Water Utilities and Tyler Solid Waste for approximately 35,000 water customers and 31,500 solid waste customers. This consists of over 420,000 meter readings annually and processing nearly $3.75 million in monthly receipts. Externally, the Water Business Office serves the citizens of Tyler by providing new service connections, service transfers, disconnections and responses to billing inquiries and payment options. This requires responding to over 5,000 phone calls monthly and connecting or disconnecting over 14,500 service points annually. The office staff also provides assistance to other City departments with emergency situations as necessary.
Water Distribution safely and efficiently distributes potable drinking water to over 110,000 permanent residents through the operation and maintenance of 734 miles of distribution mains, as well as the operation and maintenance of fire hydrants, meters, valves, pressure regulators, and other components throughout the water distribution system. In addition, Water Distribution staff provides construction services through the installation of new water service connections, construction of new water distribution mains and by making repairs to water main breaks.
Water Production currently treats an average of 23.5 million gallons of water per day for use by commercial, residential and wholesale customers. This division includes operation and maintenance of two water treatment plants, laboratory operations, twelve deep water wells, twelve elevated and ground storage tanks and six booster pump stations. In addition, staff operates and maintains the raw water pump stations located at Lake Tyler and at Lake Palestine.
The function of Wastewater Collection is to safely and efficiently collect and transport wastewater from residences, businesses and industries to the point of treatment utilizing over 694 miles of collection lines. Wastewater Collection staff provides construction services through the installation of new sewer service connections, construction of new sewer collection lines and by making repairs to wastewater lines and manholes. In addition, they provide system cleaning and inspection services as part of their preventative maintenance program and work to reduce the amount of inflow and infiltration entering the collection system, which reduces treatment costs and increases plant efficiency.
Wastewater Treatment currently treats an average of 17.7 million gallons of wastewater per day through the operation of two waste treatment plants: a trickling filter/solids contact aeration plant and an activated sludge plant. In addition to the treatment plants, staff members also have responsibility for 24 sewer lift stations, two laboratories used for analysis and control, liquid waste disposal, industrial pretreatment and a water pollution control and abatement program.
The Lake Tyler division oversees operations and maintenance for Lake Tyler, Lake Tyler East and Bellwood Lake. Lake Tyler, Lake Tyler East and Lake Palestine provide up to 64 million gallons of surface water for the City’s public drinking water supply, while all lakes, including Bellwood Lake, are used for recreational purposes for residents of the City of Tyler and surrounding areas. Staff members are responsible for maintenance of dams and spillways, outlet works and associated appurtenances, as well as monitoring of the watershed for active or potential sources of pollution. This division also provides park and grounds maintenance, road and drainage maintenance, and facility construction and maintenance.
GIS provides mapping and analysis on 415 different layers for virtually every department in the City. Mapping and information services of these products
WATER UTILITIES FUND
113
are provided to the public through GIS mapping web sites. GIS performs analysis on data to aid in the decision making process of other departments. GIS participates in the local GIS consortium providing mapping products in a much lower cost environment than consortium partners could achieve on their own while maximizing the use of data and information from multiple governmental entities. The department is also responsible for addressing parcels inside the City limits.
City of Tyler Purchasing staff members are responsible for oversight of the competitive bid processes, maintaining bidder lists, bid notices, purchase orders and ensuring the purchasing process complies with generally accepted purchasing policy standards and practices, not only for Tyler Water Utilities, but for the City of Tyler as a whole. These procedures help to provide for the best use of public fund expenditures.
CMOM Administration is responsible for administering TWU’s Capacity, Management,
Operations and Maintenance (CMOM) Program, which provides a framework for TWU to perform a comprehensive review of the wastewater collection system and enhance current operation and maintenance practices. The Program provides for better management, operation and maintenance of the wastewater collection system, better identification of areas in the collection system with potential capacity constraints and better response to unauthorized discharges.
Sludge Treatment staff is responsible for the treatment and disposal of sewage sludge at both of the City’s wastewater treatment facilities. Sludge treatment at the Southside Wastewater Treatment Plant is accomplished by both aerobic and anaerobic sludge digesters and a belt filter press with a polymer feed system. Sludge treatment at the Westside Wastewater Treatment Plant is accomplished by anaerobic sludge digesters, a sludge holding reservoir and a belt filter press with a polymer feed system. Between the two plants approximately 23,000 cubic yards of sludge is disposed of annually.
SERVICE POINT EXPENDITURES – WATER ADMINISTRATION
WATER UTILITIES FUND
Water UTILITIES CONT.
FY 2020-2021 ACTUAL EXPENDITURES FY 2021-2022 BUDGET APPROPRIATIONS FY 2021-2022 PROJECTED EXPENDITURES FY 2022-2023 BUDGET APPROPRIATIONS Salaries and Benefits 1,052,608 1,487,780 1,426,389 1,670,721 Supplies and Services 797,101 1,170,822 818,425 1,198,597 Sundry 2,259,363 2,722,265 2,404,705 2,989,204 Utilities 10,527 13,250 10,038 14,350 Maintenance 39,655 52,378 41,675 55,308 Capital Outlay - - -TOTAL 4,159,254 5,446,495 4,701,232 5,928,180 114
Water UTILITIES
SERVICE POINT EMPLOYEES – WATER ADMINISTRATION
1) This position is being filled as an Accounting Technician but is budgeted as an Accountant I
2) This position is being filled as an Advanced IT Specialist II but is budgeted as a GIS Developer/Database Administrator
3) Title changed to Director of Utilities and Public Works FY 2010-2011
4) GIS Analyst upgraded to Senior GIS Analyst FY 2007-2008 and moved to MPO and Solid Waste Admini
5) GIS Developer moved to WUF - GIS FY 2011-2012
6) GIS Technician II moved to WUF - GIS FY 2011-2012
7) Four Utilities Construction Inspectors transferred from Stormwater in FY 09-10
8) One Utilities Construction Inspector reclassified to Environmental Compliance Engineer FY 12-13
9) Account Technician (budgeted as Accountant I) reclassified to Accountant FY 2016-2017
10) Director of Utilities reclassified from Assistant City Manager FY 16-17
11) One Account transferred to Water Business Office FY 16-17
12) Utilities Engineer position closed reflected in FY 18-19; exact year it was closed is unknown
13) (Managing)Director of Utilities & MD Public Works position frozen FY 19-20
14) Engineering Technician moved from Consent Decree FY 19-20
SERVICE POINT EXPENDITURES – WATER OFFICE
WATER UTILITIES FUND
CONT.
FY 2020-2021 ACTUAL EXPENDITURES FY 2021-2022 BUDGET APPROPRIATIONS FY 2021-2022 PROJECTED EXPENDITURES FY 2022-2023 BUDGET APPROPRIATIONS Salaries and Benefits 1,137,782 1,190,549 1,115,526 1,250,211 Supplies and Services 573,878 596,018 586,566 608,708 Sundry 485,827 580,501 596,068 636,327 Utilities 51 250 192 250 Maintenance 46,919 54,449 56,161 55,539 Capital Outlay - - -TOTAL 2,244,457 2,421,767 2,354,513 2,551,035
REGULAR FULL TIME POSITIONS 2018-2019 2019-2020 2020-2021 2021-2022 2022-2023 13) Director of Utilities and MD Public Works 1 1 1 1 1 Director of Utilities 1 1 1 1 1 14) Engineering Technician - 1 1 1 1 Senior Utilities Specialist 1 1 1 1 1 12) Utilities Engineer - - - -7 & 8) Utilities Construction Inspector 3 3 3 3 3 8) Environmental Compliance Engineer 1 1 1 1 1 TOTAL REGULAR FULL TIME 7 8 8 8 8 115
SERVICE POINT EMPLOYEES – WATER BUSINESS OFFICE
WATER
1) Correction of job title to Training Coordinator 2) Position transferred from Development Services during FY 2009-2010 3) Water Treatment Superintendent transferred to Water Business Office from Water plant and converted to Water Utilities Financial Manager FY 2010-2011 4) Title change from Customer Service Supervisor to Senior Customer Services Representative 2010-2011 5) Title change from Water Utility Bus Off. Manager to Water Utility Business Office Supervisor FY 2010-2011 6) Water Utilities Financial Manager moved from Water Plant (744) to Water Office (742) FY 2012-2013 7) One Customer Service Representative reclassified to WBO Team Lead during FY 13-14 8) One Billing Specialist reclassified to Customer Service Representative during FY 13-14 9) Account Specialists retitled to Customer Service Specialists during FY 13-14 10) Senior CSR reclassified to WBO Team Lead during FY 13-14 11) Customer Service Rep reclassified to Billing Specialist FY 15-16 * Position serves as Full-Time Lean Sigma Black Belt 12) 1 WBO Team Lead reclassified to Customer Service Supervisor FY 16-17 13) Water Utility Business Office Supervisor reclassified to Billing Supervisor FY 16-17 14) One Accountant transferred from Water Administration FY 16-17 15) One Utility Account Servicer added FY 17-18
UTILITIES FUND Water UTILITIES CONT.
REGULAR FULL TIME POSITIONS 2018-2019 2019-2020 2020-2021 2021-2022 2022-2023 3) Water Utilities Financial Manger 1 1 1 1 1 14) Accountant 1 1 1 1 1 8,11) Billing Specialist 2 2 2 2 2 13) Billing Supervisor 1 1 1 1 1 4) Customer Service Supervisor 1 1 1 1 1 7) Customer Service Representative 4 4 4 4 4 2) Senior Utilities Specialist 1 1 1 1 1 Training Coordinator* 1 1 1 1 1 Utility Account Servicer 4 4 4 4 4 7) WBO Team Lead 1 1 1 1 1 9) Customer Service Specialist 2 2 2 2 2 TOTAL REGULAR FULL TIME 19 19 19 19 19 116
Water UTILITIES CONT.
SERVICE POINT EXPENDITURES – WATER DISTRIBUTION
WATER
FUND
UTILITIES
1) Water System Construction Supervisor upgraded to Utilities Operations Manager during FY 2007-2008
2) One Laborer position upgraded to GIS Addressing Technician during FY 20072008 and downgraded back to Laborer for FY 2008-2009
3) GIS Addressing Technician transferred to Solid Waste Administration for FY 2008-2009
4) Permit Clerk transferred from Development Services during FY 2009-2010 and transferred back during same year
5) One Meter Repairer downgraded to Semi-Skilled Laborer during FY 20102011. One Semi-skilled laborer added FY 15-16.
5) One temp laborer upgraded to full time semi-skilled laborer FY 15-16
6) One Equipment Operator II reclassified to Truck Driver FY 2010-2011. One temp truck driver upgraded to Full time truck driver FY 15-16
FY 2020-2021 ACTUAL EXPENDITURES FY 2021-2022 BUDGET APPROPRIATIONS FY 2021-2022 PROJECTED EXPENDITURES FY 2022-2023 BUDGET APPROPRIATIONS Salaries and Benefits 2,386,398 2,490,000 2,549,003 2,638,835 Supplies and Services 214,657 171,291 194,894 263,428 Sundry 166,588 169,077 168,955 174,017 Utilities 14,834 16,524 13,576 22,764 Maintenance 949,959 927,408 946,993 1,010,353 Capital Outlay 493,036 411,575 421,529 349,375 TOTAL 4,225,472 4,185,875 4,294,950 4,458,772 SERVICE
REGULAR FULL TIME POSITIONS 2018-2019 2019-2020 2020-2021 2021-2022 2022-2023 1, 18) Utilities Operations Manager - - - -Manager, Water Resources Lakes - - - -Crew Leader 2 2 2 2 2 6, 12) Equipment Operator II 3 3 3 3 3 2) & 5) & 7,14, 23,26) Laborer 6 6 8 8 8 5, 13) Meter Repairer 4 4 4 4 4 Meter Repair Supervisor 1 1 1 1 1 5, 7, 16) Semi-Skilled Laborer 6 6 6 6 6 20) Senior Clerk - - - -Senior Utilities Operations Specialist 2 2 2 2 2 9, 19) Senior Secretary - - - -24)Asset Technician 1 - - -22)Asset Analyst 1 - - -25)Senior Utilities Maintenance Repairer 1 - - -6, 17) Truck Driver 3 3 3 3 3 Utility Locator 1 1 1 1 1 Water Distribution Superintendent 1 1 1 1 1 Utilities Maintenance Repairer/W 1 1 1 1 1 TOTAL REGULAR FULL TIME 33 30 32 32 32 117
POINT EMPLOYEES – WATER DISTRIBUTION
Water UTILITIES CONT.
7) Two Laborers upgraded to Semi-Skilled Laborers during FY 2007-2008 Error located during FY 2010-2011 will not reflect in prior budget books
8) One Purchasing Agent temporarily reassigned to full-time Lean Sigma Black Belt
9) One Senior Secretary temporarily reassigned to full-time Purchasing Agent 10) Inventory Technician reclassified to Purchasing Manager and moved to new Purchasing department during FY 13-14
11) Purchasing Agent moved to Purchasing during FY 13-14
12) Error located during FY 15/16 for One Equipment Operator II added FY 14-15 will not reflect in prior budget books & for a Laborer added in FY 14/15 (below)
13) Two Meter Repairer added FY 14-15; not reflected in budget book until FY 15-16
One Meter Repairer (#5) reclassified to Meter Repair Supervisor FY 14-15; not reflected in budget book until FY 17-18
14) One Laborer added FY 14-15
16) One Semi-Skilled Laborer added FY 16/17
17) One Truck Driver added FY 17/18 and reclassified to Equipment Operator II FY 17-18
18) Utilities Operations Manager reclassified to Manager, Water Resources Lakes FY 17-18 and transferred to Lake Tyler FY 18-19
19) One Senior Secretary reclassified to Asset Technician FY 17-18
20) One Senior Clerk reclassified to Senior Utilities Operations Specialist FY 17-18
21) One Water System Maint. Superintendent reclassified to Water Distribution Superintendent FY 17-18
22) One Asset Analyst transferred to GIS FY 19-20 position not reflected in previous budget books
23) One Laborer reclassified to Senior Utilities Operations Specialist FY 18-19
24) One Asset Technician transferred to GIS FY 19-20
25) One Senior Utility Maintenance Repairer transferred to WWC FY 19-20; not reflected in previous years
26) Two Laborer positions added FY 20-21
SERVICE POINT EXPENDITURES – WATER PLANT
SERVICE POINT EMPLOYEES – WATER PLANT
WATER
UTILITIES FUND
FY 2020-2021 ACTUAL EXPENDITURES FY 2021-2022 BUDGET APPROPRIATIONS FY 2021-2022 PROJECTED EXPENDITURES FY 2022-2023 BUDGET APPROPRIATIONS Salaries and Benefits 1,946,023 2,097,266 1,944,039 2,342,729 Supplies and Services 2,034,388 3,907,415 3,242,181 4,708,654 Sundry 86,904 96,379 96,380 94,045 Utilities 1,515,673 1,655,061 1,461,887 1,655,061 Maintenance 479,161 511,239 509,848 516,406 Capital Outlay 44,927 65,000 17,700 95,000 TOTAL 6,107,076 8,332,360 7,272,035 9,411,895
REGULAR FULL TIME POSITIONS 2018-2019 2019-2020 2020-2021 2021-2022 2022-2023 1,8) Water Treatment Superintendent 1 1 1 1 1 7)Manager, Water Production - - - -Manager, Water Utilities Systems 1 1 1 1 1 Chief Treatment Plant Operator 2 1 1 1 1 Instrument Technician 1 1 1 1 1 4) Laborer 2 2 2 2 2 Plant Mechanic I/W 1 1 1 1 1 Plant Mechanic II/W 1 1 1 1 1 4)Plant Operator I/W 4 4 4 4 4 2) Plant Operator II/W 12 12 12 12 12 2) Plant Operator III/W 2 2 2 2 2 Utilities Lab Analyst 1 1 1 1 1 TOTAL REGULAR FULL TIME 28 27 27 27 27 118
Water UTILITIES CONT.
1) Water Treatment Superintendent transferred to Water Business Office and Converted to Water Utilities Financial Manager FY 2010-2011 position is closed, error located FY 17/18 will not reflect in prior budget books
2) 1 Plant Operator II W upgraded to Plant Operator III W FY 2010-2011
3) Water Quality Chemist reclassified to Water Systems Superintendent in Water Plant (744) in FY 2011-2012
4) One Plant Operator I added FY 15-16
5) One Plant Operator II added FY 15-16
6) Water Systems Superintendent reclassified to Manager, Water Production FY 15-16
7) One Manager, Water Production reclassified to Manager, Water Utilities Systems FY 17-18
8) One Chief Treatment Plant Operator reclassified to Water Treatment Superintendent FY 17-18; updated and reflected in Personnel Schedule FY 19-20
SERVICE POINT EXPENDITURES – WASTE COLLECTION
WATER
UTILITIES FUND
FY 2020-2021 ACTUAL EXPENDITURES FY 2021-2022 BUDGET APPROPRIATIONS FY 2021-2022 PROJECTED EXPENDITURES FY 2022-2023 BUDGET APPROPRIATIONS Salaries and Benefits 1,855,369 1,801,335 1,922,217 1,815,416 Supplies and Services 173,568 198,340 233,590 354,659 Sundry 1,463 2,850 2,475 2,850 Utilities 2 275 69 275 Maintenance 927,872 969,154 1,004,283 999,418 Capital Outlay 11,927 125,000 101,336 145,000 TOTAL 2,970,201 3,096,954 3,263,970 3,317,618 119
SERVICE POINT EMPLOYEES – WASTEWATER COLLECTION
SERVICE POINT EXPENDITURES – WASTE TREATMENT
WATER UTILITIES FUND
CONT. 1) 1 Laborer upgraded to Truck Driver FY 20102011 2) 2 Laborers upgraded to Semi-skilled Laborers FY 2010-2011 3) Four Frozen Laborers moved from Parks FY 1314 as 1 crew leader, 1 truck driver, 1 semi-skilled and 1 laborer 2) & 3) One semi-skilled laborer added FY 15-16 4) One Utility Maintenance Repairer position added FY 15-16 5) One Laborer moved to 743 FY 15-16 6) One Semi-Skilled Laborer added FY 16/17 7) One Laborer added FY 16/17 8) One Equipment Operator II added FY 17/18 9) Wastewater Superintendent -Construction/ Rep retitled to Wastewater Collection Superintendent FY 17-18 10) One Laborer transferred from 743 FY 16/17 11) One Semi-Skilled Laborer reclassified to Asset Technician FY 17-18 12) One Asset Technician transferred to GIS FY 19-20 13) Wastewater Collection Superintendent reclassified to Manager, Water Utilities Systems, Operation & Maintenance FY 19-20 14) One Sr Utility Maintenance Repairer transferred from Water Distribution; not reflected in previous years.
Water UTILITIES
REGULAR FULL TIME POSITIONS 2018-2019 2019-2020 2020-2021 2021-2022 2022-2023 9) Wastewater Superintendent/ Construction - - - -Wastewater Collection Superintendent 1 - - -13) Manager, Water Utilities Systems, Operation & Maintenance - 1 1 1 1 3) Crew Leader 2 2 2 2 2 1, 2, 3, 10) Laborer 8 8 8 8 8 2, 3, 6, 11) Semi-Skilled Laborer 4 4 4 4 4 12) Asset Technician 1 - - -1, 3) Truck Driver 2 2 2 2 2 8) Equipment Operator II 1 1 1 1 1 14) Sr Utility Maintenance Repairer - 1 1 1 1 4) Utilities Maintenance Repairer/W 7 7 7 7 7 TOTAL REGULAR FULL TIME 26 26 26 26 26
FY 2020-2021 ACTUAL EXPENDITURES FY 2021-2022 BUDGET APPROPRIATIONS FY 2021-2022 PROJECTED EXPENDITURES FY 2022-2023 BUDGET APPROPRIATIONS Salaries and Benefits 1,882,475 2,092,858 1,999,916 2,300,813 Supplies and Services 1,219,445 1,652,084 1,424,411 1,604,963 Sundry 65,356 75,227 67,830 74,178 Utilities 698,671 690,300 708,767 718,140 Maintenance 731,779 744,907 675,781 782,879 Capital Outlay - - -TOTAL 4,597,726 5,255,376 4,876,705 5,480,973 120
SERVICE POINT EMPLOYEES – WASTE TREATMENT
1) For recruitment purposes Plant Operator II positions are posted as I or II in order to widen the range of qualified candidates. However all positions are budgeted at the Plant Operator II rate
2) Water Quality Chemist reclassified to Water Systems Superintendent in Water Plant (744) in FY 2011-2012
3) Biosolids Truck Driver added FY 12-13
4) Biosolids Plant Operator I added FY 12-13
5) Six Plant Operator II’s reclassified to Westside Plant Operator II’s FY 12-13
6) Plant Mechanic I/WW added from Project Planner (NBS) FY 13-14. Two Plant laborers added FY 15-16
7) Three Plant Operator II’s reclassified to Plant Operator II SSWTP during FY 13-14
8) Biosolids Truck Driver moved to new Biosolids account during FY 13-14
9) Biosolids Plant Operator I moved to new Biosolids account during FY 13-14
10) Wastewater Treatment Superintendent reclassified to Manager, Water Quality FY 15-16
11) One Manager, Water Quality reclassified to Manager, Manager Waste Water Utilities System FY 17-18
12) One Chief Treatment Plant Operator reclassified to Wastewater Treatment Superintendent FY 17-18
13) Plant Operator I position not located - many positions have converted back and forth between Plant Operator I and II, depending experience. Plant Op I added to Plant Op II row FY 19-20 column updated to reflect the Plant Operator I and II positions under job title codes 2851, 2852 & 2853- previous years not updated as of 3/27/20 (job title codes) 2851 - 2 position; 2852 - 1 position; 2853 - 3 positions.
WATER UTILITIES FUND
CONT.
Water UTILITIES
REGULAR FULL TIME POSITIONS 2018-2019 2019-2020 2020-2021 2021-2022 2022-2023 10) Wastewater Treatment Superintendent 1 1 1 1 1 11) Manager, Water Quality - - - -Manager, Waste Water Utilities Systems 1 1 1 1 1 12) Chief Treatment Plant Operator 1 1 1 1 1 Industrial Pretreatment Inspector 1 1 1 1 1 Industrial Pretreatment Technician 1 1 1 1 1 6) Laborer 4 4 4 4 4 6) Plant Mechanic I/WW 2 2 2 2 2 Plant Mechanic II/WW 1 1 1 1 1 1, 5, 7, 13) Plant Operator I / II (2851 & 2852) 2 3 3 3 3 Plant Operator III 2 2 2 2 2 Utilities Lab Analyst 2 2 2 2 2 3, 8) Biosolids Truck Driver 2 2 2 2 2 4, 9) Biosolids Plant Operator I 2 2 2 2 2 5) Westside Plant Operator II (3768) 6 6 6 6 6 7, 13) Plant Operator II SSWTP (2853) 2 3 3 3 3 TOTAL REGULAR FULL TIME 30 32 32 32 32 121
SERVICE POINT EXPENDITURES – LAKE TYLER
SERVICE POINT EXPENDITURES – GIS
WATER UTILITIES FUND
CONT.
Water UTILITIES
FY 2020-2021 ACTUAL EXPENDITURES FY 2021-2022 BUDGET APPROPRIATIONS FY 2021-2022 PROJECTED EXPENDITURES FY 2022-2023 BUDGET APPROPRIATIONS Salaries and Benefits 407,471 519,144 391,454 730,064 Supplies and Services 232,363 307,644 179,260 333,719 Sundry 48,513 49,029 49,031 49,065 Utilities 9,607 10,800 9,549 10,800 Maintenance 397,350 523,729 509,814 493,265 Capital Outlay - - -TOTAL 1,095,304 1,410,346 1,139,108 1,616,913 FY 2020-2021 ACTUAL EXPENDITURES FY 2021-2022 BUDGET APPROPRIATIONS FY 2021-2022 PROJECTED EXPENDITURES FY 2022-2023 BUDGET APPROPRIATIONS Salaries and Benefits 746,737 759,363 699,580 808,373 Supplies and Services 86,177 182,262 212,426 144,462 Sundry 237,494 233,229 233,274 279,451 Utilities - - -Maintenance - - -Capital Outlay - - -TOTAL 1,070,408 1,174,854 1,145,280 1,232,286 SERVICE POINT EMPLOYEES
LAKE
REGULAR FULL TIME POSITIONS 2018-2019 2019-2020 2020-2021 2021-2022 2022-2023 3) Manager, Water Resources Lakes 1 1 1 1 1 Equipment Operator I 2 2 2 2 2 Foreman I 1 1 1 1 1 1) Laborer 3 3 3 3 3 Lake Supervisor I 1 1 1 1 1 Lake Supervisor II 1 1 1 1 1 Senior Utilities Specialist 1 1 1 1 1 TOTAL DEPARTMENT 10 10 10 10 10 1) One laborer added FY 15-16 2) Mrg/Wtr Production and Quality reclassified to Director of Utilities FY 16-17 3) One Manager, Water Resources Lakes transferred from Water Distribution FY 18-19 122
–
TYLER
SERVICE POINT EMPLOYEES – GIS
1) Moved from SW-Administration FY 2011-2012
2) Moved from Other- MPO FY 2011-2012
3) GIS Developer moved from Water Administration to WUF -GIS FY 2011-2012
4) GIS Technician II moved from Water Administration to WUF - GIS FY 2011-2012
5) Moved funding to Other-MPO during FY 2011-2012
6) GIS Developer moved from MPO to GIS FY 13-14
7) GIS Coordinator reclassified to GPA Manager during FY 13-14
8) Informatics Data Analyst added but not listed FY 14-15 error located FY 17-18 will not reflect in previous years
9) GIS Tech II reclassified to GIS Analyst FY 18-19
10) GIS Addressing Tech reclassified to GIS Administrative Tech FY 18-19
11) One Asset Analyst (#1 )transferred to GIS from Water Distribution FY 19-20; position not reflected in previous budget books
12) One Asset Technician transferred from Water Distribution (position originally reclassified from Senior Secretary #1) FY 19-20
SERVICE POINT EXPENDITURES – PURCHASING
WATER UTILITIES FUND
CONT.
Water UTILITIES
REGULAR FULL TIME POSITIONS 2018-2019 2019-2020 2020-2021 2021-2022 2022-2023 1, 10) GIS Addressing Technician - - - -GIS Administrative Technician 1 1 1 1 1 1, 2,) Senior GIS Analyst 1 1 1 1 1 3,5, 6) GIS Developer 1 1 1 1 1 4, 9) GIS Technician II - - - -GIS Analyst 1 1 1 1 1 11) Asset Analyst - 1 1 1 1 12) Asset Technician - 2 2 2 2 7) GIS Manager 1 1 1 1 1 8) Informatics Data Analyst 1 1 1 1 1 TOTAL DEPARTMENT 6 9 9 9 9
FY 2020-2021 ACTUAL EXPENDITURES FY 2021-2022 BUDGET APPROPRIATIONS FY 2021-2022 PROJECTED EXPENDITURES FY 2022-2023 BUDGET APPROPRIATIONS Salaries and Benefits 202,337 266,491 255,135 286,521 Supplies and Services 5,075 7,851 4,187 11,631 Sundry 4,862 5,149 5,081 5,167 Utilities 9 150 48 150 Maintenance 12,593 10,559 10,622 8,683 Capital Outlay - - -TOTAL 224,876 290,200 275,073 312,152 123
WATER UTILITIES FUND Water UTILITIES CONT. SERVICE POINT EMPLOYEES – PURCHASING REGULAR FULL TIME POSITIONS 2018-2019 2019-2020 2020-2021 2021-2022 2022-2023 Purchasing Manager 1 1 1 1 1 Purchaser 2 2 2 2 2 TOTAL DEPARTMENT 3 3 3 3 3 SERVICE POINT EXPENDITURES – CD/CMOM SERVICE POINT EXPENDITURES – WASTE TREATMENT SERVICE POINT EXPENDITURES – STORM WATER FIRE SERVICES FY 2020-2021 ACTUAL EXPENDITURES FY 2021-2022 BUDGET APPROPRIATIONS FY 2021-2022 PROJECTED EXPENDITURES FY 2022-2023 BUDGET APPROPRIATIONS Salaries and Benefits 12,173 55,116 64,865 65,329 Supplies and Services 2,950,703 3,500,000 2,896,505 3,500,000 Sundry 5,578 5,578 5,578 5,648 Utilities - - -Maintenance - - -Capital Outlay - - -TOTAL 2,968,454 3,560,694 2,966,948 3,570,977 FY 2020-2021 ACTUAL EXPENDITURES FY 2021-2022 BUDGET APPROPRIATIONS FY 2021-2022 PROJECTED EXPENDITURES FY 2022-2023 BUDGET APPROPRIATIONS Salaries and Benefits 333,732 332,032 290,517 318,669 Supplies and Services 592,628 564,698 649,341 758,508 Sundry 200 200 200 200 Utilities 20,136 18,000 16,566 16,200 Maintenance 185,689 226,456 261,918 242,980 Capital Outlay - - -TOTAL 1,132,385 1,141,386 1,218,542 1,336,557 FY 2020-2021 ACTUAL EXPENDITURES FY 2021-2022 BUDGET APPROPRIATIONS FY 2021-2022 PROJECTED EXPENDITURES FY 2022-2023 BUDGET APPROPRIATIONS Salaries and Benefits 26,839 28,800 28,397 28,800 Supplies and Services 55,955 75,838 37,701 75,838 Sundry - - -Utilities - - -Maintenance 130 4,400 2,100 4,400 Capital Outlay - - -TOTAL 82,924 109,038 68,198 109,038 124
SERVICE POINT EXPENDITURES – STORM WATER
SERVICE POINT EMPLOYEES – STORM WATER MANAGEMENT
25) Communications Manager reclassified to Director of Marketing and Communications FY 17/18 salary split 93% Communication, 7% Stormwater. 26) One Administrative Assistant 100% transferred to Engineering
WATER UTILITIES FUND
CONT.
Water UTILITIES
FY 2020-2021 ACTUAL EXPENDITURES FY 2021-2022 BUDGET APPROPRIATIONS FY 2021-2022 PROJECTED EXPENDITURES FY 2022-2023 BUDGET APPROPRIATIONS Salaries and Benefits 716,024 891,378 757,965 973,312 Supplies and Services 87,470 72,834 93,001 130,836 Sundry 46,750 52,260 52,243 78,676 Utilities 7,472 8,900 8,834 9,892 Maintenance 472,057 532,431 530,671 617,319 Capital Outlay 76,273 586,972 586,418 1,000,000 TOTAL 1,406,046 2,144,775 2,029,132 2,810,035 1) One position upgraded to Capital Budget Analyst during FY 20072008 2) Associate Traffic Engineer position with 85% paid by Traffic Engineering 3) Capital Budget Analyst position with 86% paid by Engineering 4) Communications Director position with 93% paid by Communications 5) Engineering Technician position with 60% paid by Engineering 6) Senior Secretary Two positions one with 76% paid by Traffic Engineering 7) Four positions transferred from Development Services Fund during FY 2009-2010 8) 1 of 2 Truck driver positions frozen for FY 2011-2012 and 2012-2013 9) Title Change from Communication Director to Managing Director of External Relations FY 2011-2012 10) Title Change from Associate Traffic Engineer to Transportation Project Engineer FY 2010-2011 11) Transportation Project Engineer downgraded to Traffic Services Supervisor in FY 2011-2012 12) Four Utilities Construction Inspectors moved to Water Admin in FY 2009-2010 13) Engineering Technician reclassified to Project Engineer, moved to Engineering FY 12-13 14) Senior Secretary reclassified to Administrative Secretary FY 12-13 15) Managing Director of External Relations downgraded to Senior Public Relations Specialist in Communications FY 12-13. 16) Administrative Assistant payroll split changed from 76/24 to 85/15 Traffic/Stormwater FY 14-15 17) Traffic Services Supervisor payroll split eliminated FY 14-15 18) Project Engineer payroll split added 85/15 Engineering/ Stormwater FY 14-15 & 15-16 19) Associate Engineer payroll split added 60/40 Engineering/ Stormwater FY 14-15 & 15-16 20) Senior Public Relations Specialist 93% paid by communications FY 15-16 21) Administrative Secretary payroll 50% paid by Streets FY 15-16 22) Street Operations manager payroll 50 % paid by Streets FY 15-16 23) Capital Budget Analyst closed FY 16/17 24) Sr. PR Specialist/Grantwriter reclassified to Communications Manager FY 16/17
FY 18-19
REGULAR FULL TIME POSITIONS 2018-2019 2019-2020 2020-2021 2021-2022 2022-2023 22) Street Operations Manager 0.5 0.5 0.5 0.5 0.5 3, 23) Capital Budget Analyst - - - -25)Communications Manager - - - -Director of Marketing and Communications 0.07 - - -Crew Leader 2 2 2 2 2 Equipment Operator II 4 4 4 4 4 Foreman II 1 1 1 1 1 Laborer 1 1 1 1 1 18) Project Engineer 0.15 - - -Semi-Skilled Laborer 2 2 2 2 2 21) Administrative secretary 0.5 0.5 0.5 0.5 0.5 8) Truck Driver 2 2 2 2 2 14, 16,26) Administrative Assistant - - - -19) Associate Engineer - - - -TOTAL REGULAR FULL TIME 13.22 13 13 13 13 125
Fund SOLID WASTE

Solid Waste FUND (560)
STATEMENT OF REVENUES, EXPENDITURES, AND CHANGES IN WORKING CAPITAL
solid waste fund
Fiscal Year 2022-2023 ACTUALS 2020-2021 AMENDED BUDGET 2021-2022 PROJECTED 2021-2022 BUDGET 2022-2023 Operating Reserve 1,975,140 1,999,484 1,999,484 2,277,336 Unreserved Fund Balance 48,365 70,331 70,331 34,042 BEGINNING FUND BALANCE / WORKING CAPITAL 2,023,505 2,069,815 2,069,815 2,311,378 REVENUES Interest and Rental Income 14,056 10,158 7,310 8,365 Charges for Residential Serv. 7,455,695 8,365,860 8,370,094 8,961,000 Charges for Commercial Serv. 4,582,604 4,568,412 4,604,086 4,803,359 Recycle Sales 100,021 85,000 114,885 128,140 Roll-Off 1,631,072 1,731,811 1,721,229 1,717,905 Miscellaneous 1,375,706 964,408 1,656,855 1,657,809 TOTAL REVENUES 15,159,154 15,725,649 16,474,459 17,276,578 EXPENDITURES Administration 1,893,043 1,926,925 1,921,936 1,984,209 Residential Collection 6,307,238 6,965,577 7,457,824 8,025,155 Commercial Collection 4,129,452 4,305,814 4,691,950 4,623,125 Keep Tyler Beautiful 184,254 203,969 199,483 212,501 Code Enforcement 815,905 1,001,567 911,050 1,029,832 TOTAL EXPENDITURES 13,329,892 14,403,852 15,182,243 15,874,822 (Transfer Out) (1,782,952) (1,250,653) (1,050,653) (1,175,653) Economic Development Fund (208) (174,996) (150,000) - (100,000) SW Capital Fund (562) (1,032,304) (800,000) (800,000) (725,000) Productivity Fund (639) (250,000) (50,000) - (50,000) Property and Facility Fund (663) (50,652) (50,653) (50,653) (50,653) Technology Fund (671) (275,000) (200,000) (200,000) (250,000) Operating Reserve 1,999,484 2,160,578 2,277,336 2,381,223 Unreserved Fund Balance 70,331 (19,619) 34,042 156,258 ENDING FUND BALANCE / WORKING CAPITAL 2,069,815 2,140,959 2,311,378 2,537,481 127
Solid Waste FUND (560) CONT.
STATEMENT OF REVENUES
Fiscal Year 2022-2023
solid waste fund
ACTUALS 2020-2021 AMENDED BUDGET 2021-2022 PROJECTED 2021-2022 BUDGET 2022-2023 USE OF MONEY AND PROPERTY Rent - Miscellaneous $10,418 $6,189 $4,925 $6,084 Interest Earnings 3,638 3,969 2,385 2,281 TOTAL USE OF MONEY AND PROPERTY 14,056 10,158 7,310 8,365 CHARGES FOR CURRENT SERVICES Residential Sanitation Fees 7,455,695 8,365,860 8,370,094 8,961,000 Commercial Fees 4,582,604 4,568,412 4,604,086 4,803,359 Roll-Off Collection Fees 1,631,072 1,731,811 1,721,229 1,717,905 TOTAL CHARGES FOR CURRENT SERVICES 13,669,371 14,666,083 14,695,409 15,482,264 RECYCLE SALES Recycle Sales 100,021 85,000 114,885 128,140 TOTAL RECYLCE SALES 100,021 85,000 114,885 128,140 MISCELLANEOUS INCOME Landfill Royalty Fee 701,657 692,743 803,949 793,761 Miscellaneous Income 40,684 271,665 852,906 864,048 Landfill Tipping Fee 633,365 - -TOTAL MISCELLANEOUS 1,375,706 964,408 1,656,855 1,657,809 TOTAL REVENUES $15,159,154 $15,725,649 $16,474,459 $17,276,578 128
Solid Waste FUND (562)
STATEMENT OF REVENUES, EXPENDITURES, AND CHANGES IN WORKING CAPITAL
Fiscal Year 2022-2023
solid waste fund
ACTUALS 2020-2021 AMENDED BUDGET 2021-2022 PROJECTED 2021-2022 BUDGET 2022-2023 Unreserved Fund Balance 178,878 32,834 32,834 320,969 BEGINNING FUND BALANCE 178,878 32,834 32,834 320,969 REVENUES Interest Earnings 537 10,000 576 5,000 Miscellaneous Income - - -TOTAL REVENUES 537 10,000 576 5,000 EXPENDITURES Sanitation Containers 230,565 310,000 310,000 300,000 New Commercial Trucks 321,096 320,000 117,822 485,000 Keep Tyler Beautiful Projects 627,224 84,619 84,619Contingency - 15,000 - 75,000 TOTAL EXPENDITURES 1,178,885 729,619 512,441 860,000 Transfer In 1,032,304 800,000 800,000 725,000 Solid Waste Fund (560) 1,032,304 800,000 800,000 725,000 Unreserved Fund Balance 32,834 113,215 320,969 190,969 ENDING FUND BALANCE 32,834 113,215 320,969 190,969 129
Solid WASTE
The Solid Waste Department provides service support for residential and commercial solid waste collection, disposal services, and recycling operations. Our mission is to provide exceptional service that is both economically and environmentally responsible and meets the needs of our citizens.:
• Residential garbage collection;
• Residential garbage container disbursement program;
• Residential curbside recycling collection;
• Commercial garbage collection;
• Commercial roll-off rentals;
• Oversee Greenwood Farms Landfill operations;
• Hazardous materials disposal;
• Tyler Recycling Collection Center and,
• Sponsors: Spring and Fall Cleanup Weeks with free bulky item pickup, Adopt a Street, Adopt a Spot, Adopt a Park, Christmas tree recycling, and events like Tyler Recycles Day, Earth Day, Paint Recycle Day, and Litter Cleanups.
Code ENFORCEMENT
Accomplishments for 2021-2022
• Achieved a 100% conviction rate on illegal dumping cases
• Worked 16 substandard structure cases
• Voluntary Compliance rate of 98%
• Mowers cleaned over 356 sites
• Created new internal reports to better track response times on new and open cases
Accomplishments for 2021-2022
• Provided Excellent Service to 31,022 residential customers.
• Provided Excellent Service to 2,280 commercial customers.
• Received Locals Love Us Award.
• Increased Landfill Access Fee from $10 to $15 to help with Keep Tyler Beautiful and Parks Projects
• Downtown Recycle Center generated $100,021 in revenue.
Goals for 2022-2023
• Continue to evaluate new software and technology that can optimize service and reduce labor cost.
• Engage and encourage all employees to participate in City U trainings.
• Continue to deliver excellent customer service to all customers.
• Update commercial container inventory.
• Evaluate Future Landfill Operations.
Goals for 2022-2023
• Reduce illegal dumping
• Focus on reducing citizen’s top five complaints:
- High weeds
- Sign violations
- Trash complaints
- Junked Vehicles
- Unimproved parking surface violations
solid waste fund
130
solid
CONT. SERVICE POINT EXPENDITURES – ADMINISTRATION FY 2020-2021 ACTUAL EXPENDITURES FY 2021-2022 BUDGET APPROPRIATIONS FY 2021-2022 PROJECTED EXPENDITURES FY 2022-2023 BUDGET APPROPRIATIONS Salaries and Benefits 946,697 896,466 886,314 909,258 Supplies and Services 190,888 135,339 112,875 151,891 Sundry 855,020 894,430 922,232 922,370 Utilities 438 690 515 690 Maintenance - - -Capital Outlay - - -TOTAL 1,893,043 1,926,925 1,921,936 1,984,209 SERVICE POINT EMPLOYEES – SOLID WASTE ADMINISTRATION REGULAR FULL TIME POSITIONS 2018-2019 2019-2020 2020-2021 2021-2022 2022-2023 6 & 7) Director of Solid Waste* 1 1 1 1 1 12, 13, 14)Solid Waste/VES Manager - - - -Director of Solid Waste, Transit, & VES 1 1 1 1 1 8, 11) Account Specialist 1 1 1 1 1 Customer Service Supervisor 1 1 1 1 1 Senior Utilities Specialist 1 1 1 1 1 6 & 8) Account Speicalist Auditor* 1 1 1 1 1 10) Administrative Secretary 1 1 1 1 1 TOTAL REGULAR FULL TIME 7 7 7 7 7 1) 96% of position funded through MPO beginning FY 2008-2009 2) Solid Waste Supervisor eliminated FY 2011-2012 3) Senior GIS Analyst position moved to WUF - GIS FY 2011-2012 4) GIS Addressing Technician moved to WUF - GIS FY 2011-2012 5) GIS Coordinator position moved to WUF - GIS FY 2011-2012 6) Director of Solid Waste downgraded to Account Specialist/Auditor FY 12-13 7) SW/VES Manager upgraded to Director of Solid Waste FY 13-14 8) One Account Specialist upgraded to Account Specialist/Auditor FY 12-13 *One Account Specialist/Auditor serving as full time Lean Sigma Black Belt 9) Special Projects Coordinator moved to SW Keep Tyler Beautiful Fund FY 13-14 10) Account Specialist reclassified to Administrative Secretary during FY 13-14 11) One Account Specialist added FY 16-17 12) One Solid Waste Manager position added; reclassified from Fleet Services Coord. (VES) FY 16-17 13) SW Manager position paid 100% from SW Admin, no longer split 50/50 with Transit FY 17-18 14) One SW Manager reclassified to Director of SW/Transit/VES FY 17-18 131
waste fund Solid WASTE
solid waste fund
POINT EXPENDITURES
RESIDENTIAL COLLECTION FY 2020-2021 ACTUAL EXPENDITURES FY 2021-2022 BUDGET APPROPRIATIONS FY 2021-2022 PROJECTED EXPENDITURES FY 2022-2023 BUDGET APPROPRIATIONS Salaries and Benefits 1,807,829 2,042,569 2,217,263 2,396,586 Supplies and Services 2,219,855 2,115,239 2,554,784 2,643,068 Sundry 113,038 114,752 114,752 137,735 Utilities 1,813 2,020 1,815 2,020 Maintenance 2,164,703 2,690,997 2,569,210 2,845,746 Capital Outlay - - -TOTAL 6,307,238 6,965,577 7,457,824 8,025,155 SERVICE POINT EMPLOYEES –SOLID WASTE RESIDENTIAL COLLECTION REGULAR FULL TIME POSITIONS 2018-2019 2019-2020 2020-2021 2021-2022 2022-2023 15, 16)Commercial Equipment Operator - - - -2, 4, 7, 8, &11) Foreman II 3 3 3 3 3 9) Laborer 4 4 4 4 4 13, 14)Residential Equipment Operator 22 22 22 22 22 7) Residential Superintendent 1 1 1 1 1 TOTAL REGULAR FULL TIME 30 30 30 30 30 1) 2 Positions added during FY 2007-2008 2) Title change of Commercial Sales Representative to Foreman II during FY 20072008 3) Position transferred to SW Code Enforcement 4) One Foreman I upgraded to Foreman II during FY 2009-2010 5) One Foreman I eliminated FY 2011-2012 6) Recycling Technician eliminated FY 2011-2012 *Commercial Superintendent serving as FullTime Lean Sigma Black Belt 7) One Foreman II reclassified to Residential Superintendent 8) One Foreman II reclassified to Commercial Superintendent 9) One Laborer moved to Finance and reclassified to Accounting Manager FY 13-14 11) One Residential Equipment Operator reclassified to Foreman II FY 2015-2016 12) One Residential Crew Leader reclassified to Commercial Equipment Operator FY 2015-2016 13) Four Residential Equip. Operators added FY 15-16 14) One Residential Equipment Operator reclassified to Vehicle Services Manager FY 16-17 15) One Commercial Equipment Operator transferred from 753 FY 16 -17 16) One Commercial Equipment Operator transferred to 753 FY 17-18 TEMPORARY POSITIONS 2018-2019 2019-2020 2020-2021 2021-2022 2022-2023 2) Commercial Sales Representative - - - -TOTAL TEMPORARY POSITIONS 0 0 0 0 0 GRAND TOTAL DEPARTMENT 30 30 30 30 30 132
Solid WASTE CONT. SERVICE
–
solid waste fund
SERVICE POINT EXPENDITURES – COMMERCIAL COLLECTION FY 2020-2021 ACTUAL EXPENDITURES FY 2021-2022 BUDGET APPROPRIATIONS FY 2021-2022 PROJECTED EXPENDITURES FY 2022-2023 BUDGET APPROPRIATIONS Salaries and Benefits 1,243,042 1,404,095 1,454,498 1,366,544 Supplies and Services 1,984,572 2,034,303 2,212,479 2,254,534 Sundry 117,670 121,485 121,485 146,062 Utilities 5,279 4,175 4,700 4,175 Maintenance 778,889 741,756 898,788 851,810 Capital Outlay - - -TOTAL 4,129,452 4,305,814 4,691,950 4,623,125 SERVICE POINT EMPLOYEES –SOLID WASTE COMMERCIAL COLLECTION REGULAR FULL TIME POSITIONS 2018-2019 2019-2020 2020-2021 2021-2022 2022-2023 2, 3, 4) Commercial Equipment Operator 11 11 11 11 11 1) Welder I 2 2 2 2 2 1) Welder II 1 1 1 1 1 8) Commercial Superintendent 1 1 1 1 1 Commercial Sales Representative 1 1 1 1 1 TOTAL REGULAR FULL TIME 16 16 16 16 16 1) Two Welder positions I & II added FY 15-16 2) One Commercial Equipment Operator transferred to 752 FY 16-17 3) One Commercial Equipment Operator transferred from 752 FY 17-18 4) Two Commercial Equipment Operators transferred from 752 FY 18-19
FY 2020-2021 ACTUAL EXPENDITURES FY 2021-2022 BUDGET APPROPRIATIONS FY 2021-2022 PROJECTED EXPENDITURES FY 2022-2023 BUDGET APPROPRIATIONS Salaries and Benefits 644,540 804,332 723,671 812,564 Supplies and Services 50,968 69,648 56,703 80,698 Sundry 50,989 51,633 51,632 52,061 Utilities 3,445 5,447 3,912 4,347 Maintenance 65,963 70,507 75,132 80,162 Capital Outlay - - -TOTAL 815,905 1,001,567 911,050 1,029,832 133
Solid WASTE CONT.
SERVICE POINT EXPENDITURES – CODE ENFORCEMENT
SERVICE POINT EMPLOYEES – CODE ENFORCEMENT
1) Title change from Environmental Coordinator to Code Enforcement Manager during FY 20072008
2) One position upgraded to Chief Code Enforcement Officer for FY 2008-2009
3) Four positions transferred to Streets during FY 2007-2008
4) One position transferred to Streets during FY 2007-2008
5) One position upgraded to Code Services Officer for FY 2008-2009
6) Position transferred from Streets during FY 2007-2008
7) Position transferred from SW Residential for FY2010-2011
8) Title change from Chief Code Enforcement Officer to Field Supervisor FY 2010-2011
9) Code Services Officer upgraded to Code Enforcement Officer I FY 2010-2011 10) Eliminated 2 Code Service Officer I - no FY indicated, updated FY 19-20
SERVICE POINT EXPENDITURES –LITTER CONTROL / KEEP TYLER BEAUTIFUL
11) Senior Clerk reclassified to Administrative Secretary FY 13-14. *This department was formerly known as Environmental Services.
12) One Code Services Officer added FY 16-17
13) Two Code Services Officers added FY 18-19; positions transferred from Neighborhood Services/Housing (Rehab Project Specialist #1 and Code Enforcement Officer I #1)
14) One Laborer added in FY14-15 but not reflected in prior years- updated FY 19-20
solid waste fund
Solid WASTE CONT.
REGULAR FULL TIME POSITIONS 2018-2019 2019-2020 2020-2021 2021-2022 2022-2023 Code Enforcement Manager 1 1 1 1 1 8) Field Supervisor 1 1 1 1 1 7, 9, 10 ) Code Enforcement Officer I 2 - - -2, 9, 12, 13) Code Services Officer 5 6 6 6 6 4) Equipment Operator II 1 1 1 1 1 5, 14) Laborer - 1 1 1 1 11) Administrative Secretary 1 1 1 1 1 TOTAL REGULAR FULL TIME 11 11 11 11 11
FY 2020-2021 ACTUAL EXPENDITURES FY 2021-2022 BUDGET APPROPRIATIONS FY 2021-2022 PROJECTED EXPENDITURES FY 2022-2023 BUDGET APPROPRIATIONS Salaries and Benefits 68,320 88,444 81,514 96,976 Supplies and Services 115,003 114,725 117,152 114,725 Sundry - - -Utilities 931 800 817 800 Maintenance - - -Capital Outlay - - -TOTAL 184,254 203,969 199,483 212,501 134
Solid WASTE CONT.
SERVICE POINT EMPLOYEES – KEEP TYLER BEAUTIFUL
solid waste fund
REGULAR FULL TIME POSITIONS 2018-2019 2019-2020 2020-2021 2021-2022 2022-2023 2) Keep Tyler Beautiful Comm. Coord. 1 1 1 1 1 TOTAL REGULAR FULL TIME 1 1 1 1 1
1) Special Projects Coordinator moved to Keep Tyler Beautiful fund FY 13-14
2) Special Projects Coordinator reclassified to Keep Tyler Beautiful Community Coordinator FY 15-16
REGULAR PART TIME POSITIONS 2018-2019 2019-2020 2020-2021 2021-2022 2022-2023 3) PT Keep Tyler Beautiful Technician - 1 1 1 1 TOTAL REGULAR PART TIME - 1 1 1 1 GRAND TOTAL DEPARTMENT 1 2 2 2 2 135
3) One PT KTB Technician added FY 19-20
Fund AIRPORT
Tyler Pounds REGIONAL AIRPORT
Tyler Pounds Regional Airport provides facilities and services for the safe and efficient operation of commercial and private aviation activities. In 2017/18 Tyler recorded 134 privately owned based aircraft. Presently, one commercial airline services Tyler providing regional jet service to Dallas, allowing passengers to connect to most airports in the world. Airport staff members are responsible for:
• Promoting and marketing airport services;
• Developing public education programs to teach citizens and customers about aviation;
• Coordinating and managing airport security and emergency response programs;
• Terminal building maintenance;
• Airport Landside Facilities inspection and maintenance;
• Managing airport vendor and concession contracts;
• Grounds maintenance including irrigation, landscaping and contracts management;
• Storm water pollution prevention program;
• Airside Land lease contract management;
• Airfield lighting and navigational aid maintenance;
• Rental Car Concessions management;
• Coordination and planning of airport development;
• Airport operations area maintenance and inspection;
• Disadvantaged Business Enterprise Program (DBE) reporting;
• Passenger facility charge program reporting and administration;
• TXDOT Grant acquisition and management;
• Federal Aviation Administration (FAA) grants administration.
Accomplishments for 2021-2022
• Orchestrated planning between multiple City and County agencies to prepare for the Rose City Air Fest
• Secured a new restaurant for terminal building
• Initiated development of new hangars for Tract 7
• Facilitated purchase of Aircraft Rescue & Fire Fighting foam testing trailer with FAA grant funding
• Unified the TYR aviation community to finalize our Master Plan Update
• Collaborated with University of Texas at Tyler Art Department to create art displays in Terminal Lobby Goals for 2022-2023
• Create an Aviation Center of Excellence
• Equip employees with proper tools and training for response to all contingencies
• Create a collaborative work environment to maximize employee engagement
airport fund
137
Airport OPERATING FUND (524)
STATEMENT OF REVENUES, EXPENDITURES, AND CHANGES IN WORKING CAPITAL
Fiscal Year 2022-2023
airport fund
ACTUALS 2020-2021 AMENDED BUDGET 2021-2022 PROJECTED 2021-2022 BUDGET 2022-2023 Reserve for Construction $300 $300 $300 $300 Reserve for Customer Facility 448,836 448,718 448,718 438,111 Unreserve Working Capital 480,455 484,826 484,826 500,688 BEGINNING FUND BALANCE 929,591 933,844 933,844 939,099 REVENUES Use of Money and Property 909,265 995,215 973,653 986,817 Current Service Charges 78,175 101,600 95,271 100,600 Customer Facility Service Charges 109,794 110,000 103,046 104,000 Miscellaneous Income 40,145 29,196 21,451 14,176 Other Agencies 365,764 450,000 668,412 701,629 TOTAL REVENUES 1,503,143 1,686,011 1,861,833 1,907,222 EXPENDITURES AIRPORT Operations 1,399,318 1,679,604 1,573,500 1,683,933 Capital 52,668 25,000 25,000Contingency - 78,850 129,425 150,000 AIRPORT TOTAL 1,451,986 1,783,454 1,727,925 1,833,933 CUSTOMER FACILITY Wash Bay Maintenance 3,216 10,000 9,965 10,000 Wash Bay Debt Service 106,696 103,688 103,688 105,680 CUSTOMER FACILITY TOTAL 109,912 113,688 113,653 115,680 TOTAL EXPENDITURES 1,561,898 1,897,142 1,841,578 1,949,613 Transfer In 150,000 72,000 72,000 72,000 PFC (234) 150,000 72,000 72,000 72,000 Transfer Out (86,992) (87,000) (87,000) (69,475) Airport Grant Fund (525) (49,992) (50,000) (50,000) (50,000) Technology Fund (671) (37,000) (37,000) (37,000) (19,475) Productivity Fund (639) - - -Reserve for Construction 300 300 300 300 Reserve for Customer Facility 448,718 445,030 438,111 426,431 Unreserve Working Capital 484,826 262,383 500,688 472,502 ENDING FUND BALANCE $933,844 $707,713 $939,099 $899,233 138
Airport OPERATING FUND (524)
REVENUE DETAIL
Fiscal Year 2022-2023
airport fund
ACTUALS 2020-2021 AMENDED BUDGET 2021-2022 PROJECTED 2021-2022 BUDGET 2022-2023 USE OF MONEY AND PROPERTY Airline Facilities Rental 45,000 45,000 45,000 45,000 Airport Long-Term Parking 304,259 377,981 370,969 360,000 Interest Earnings 6,735 6,000 2,490 3,000 Landing Fees 38,517 42,133 45,776 45,000 Restaurant Concessions 12,084 9,600 8,643 9,500 FAA Building Rental 56,760 53,614 50,408 55,806 Car Leasing Rental 282,619 272,452 289,387 290,000 Agricultural Lease 418 1,868 2,111 1,693 Hangar Land Lease 106,419 121,367 111,931 129,791 HAMM 15,000 15,000 15,000 15,000 Common Use Fees 12,359 14,700 15,559 15,000 Wash Bay Fees 9,024 14,000 12,080 11,500 Non Aviation Land Lease 20,071 21,500 4,299 5,527 TOTAL USE OF MONEY AND PROPERTY 909,265 995,215 973,653 986,817 CHARGES FOR CURRENT SERVICES Airport Fuel Flowage 62,574 79,000 78,321 78,000 Customer Facility Charge 109,794 110,000 103,046 104,000 Advertising Space Fees 15,601 22,600 16,950 22,600 TOTAL CHARGES FOR CURRENT SERVICES 187,969 211,600 198,317 204,600 MISCELLANEOUS INCOME Miscellaneous Income 701,657 692,743 803,949 793,761 Miscellaneous Income 40,684 271,665 852,906 864,048 TOTAL MISCELLANEOUS 40,145 29,196 21,451 14,176 OTHER AGENCIES CARES Act 314,720 - - 450,000 CRSSA Grant 51,044 450,000 668,156 251,629 CRSSA Concession - - 256TOTAL OTHER AGENCIES 365,764 450,000 668,412 701,629 TOTAL REVENUES 1,503,143 1,686,011 1,861,833 1,907,222 139
CONT.
Airport OPERATING FUND (524)
SERVICE POINT EXPENDITURES - AIRPORT
SERVICE POINT EMPLOYEES – AIRPORT
SERVICE POINT EXPENDITURES - CUSTOMER FACILITY CHARGE
airport fund
CONT. FY 2020-2021 ACTUAL EXPENDITURES FY 2021-2022 BUDGET APPROPRIATIONS FY 2021-2022 PROJECTED EXPENDITURES FY 2022-2023 BUDGET APPROPRIATIONS Salaries and Benefits 573,140 807,780 775,821 871,786 Supplies and Services 248,682 208,367 203,521 227,702 Sundry 176,633 264,520 315,425 353,285 Utilities 156,021 160,930 148,233 155,510 Maintenance 244,842 316,857 259,925 225,650 Capital Outlay 52,668 25,000 25,000TOTAL 1,451,986 1,783,454 1,727,925 1,833,933 FY 2020-2021 ACTUAL EXPENDITURES FY 2021-2022 BUDGET APPROPRIATIONS FY 2021-2022 PROJECTED EXPENDITURES FY 2022-2023 BUDGET APPROPRIATIONS Salaries and Benefits - - -Supplies and Services - - -Sundry 106,696 103,688 103,688 105,680 Utilities - - -Maintenance 3,216 10,000 9,965 10,000 Capital Outlay - - -TOTAL 109,912 113,688 113,653 115,680
REGULAR FULL TIME POSITIONS 2018-2019 2019-2020 2020-2021 2021-2022 2022-2023 5) & 7) Airport Manager 1 1 1 1 1 Airport Operations Supervisor 1 1 1 1 1 Administrative Assistant 1 1 1 1 1 8)Airport Projects Coordinator 1 1 1 1 1 1) & 4) Airport Technician I 2 2 2 2 2 Airport Technician II 1 1 1 1 1 Airport Technician III 2 2 2 2 2 9) Airport Technician IV 2 2 2 2 2 TOTAL REGULAR FULL TIME 11 11 11 11 11 1) One Airport Technician position frozen for FY 2009-2010 2) One Secretary position upgraded to Senior Secretary during FY 2007-2008 3) One Part-time Airport Technician eliminated during FY 2010-2011 budget 4) One Airport Technician eliminated FY 2011-2012 5) Airport Manager promoted to Director of Airport and Transit FY 2007-2008 6) Title change from Director of Airport and Transit to Airport Director FY 2010-2011 7) Title change from Airport Director to Airport Manager FY 2011-2012 8) Administrative Secretary downgraded to Senior Secretary FYI 2011-2012 9) Added one Airport Technician IV FY 14-15 140
Tax Fund HOTEL
Hotel TAX FUND (211)
STATEMENT OF REVENUES, EXPENDITURES, AND CHANGES IN WORKING CAPITAL
Fiscal Year 2022-2023
hotel tax FUND
ACTUALS 2020-2021 AMENDED BUDGET 2021-2022 PROJECTED 2021-2022 BUDGET 2022-2023 Unreserved Fund Balance $1,653,267 $1,436,728 $1,436,728 $889,533 Reserve (2% Tax) 4,238,736 4,715,689 4,715,689 1,244,379 BEGINNING FUND BALANCE / WORKING CAPITAL 5,892,003 6,152,417 6,152,417 2,133,912 REVENUES 7 % Occupancy Tax 2,988,990 2,878,446 3,310,967 3,323,177 2 % Occupancy Tax 854,381 822,651 946,742 949,885 Interest Earnings 39,820 75,497 27,225 30,000 Donations Liberty Hall 10,000 10,000 -TOTAL REVENUES 3,893,191 3,786,594 4,284,934 4,303,062 EXPENDITURES Texas Rose Festival - 10,000 10,000 10,000 Discovery Place 32,400 32,400 32,400 32,400 Symphony 50,000 50,000 50,000 50,000 Museum of Art 35,000 35,000 35,000 35,000 Historical Museum 13,500 13,500 13,500 13,500 Visitors and Convention Bureau 666,500 691,500 691,500 691,500 Tyler Civic Theatre - - -McClendon House - 4,500 4,500 4,500 Historic Aviation Museum 13,500 13,500 13,500 13,500 Texas Hotel & Lodging Dues 18,585 20,500 16,924 20,500 2% Convention Center Facility 377,428 11,321,892 10,668,052Sport Tyler Award 25,000 25,000 25,000 25,000 Special Services 12,368 31,000 9,688 35,000 Parking Lot Improvement - 42,000 39,287Tournament Expenses - 5,000 -Contingencies - 72,000 - 150,000 TOTAL EXPENDITURES 1,244,281 12,367,792 11,609,351 1,080,900 Transfers In - 6,250,000 6,250,000 3,250,000 Half-Cent Fund (231) - 3,250,000 3,250,000 3,250,000 Rainy Day Fund (235) - 3,000,000 3,000,000(Transfers Out) (2,388,496) (2,944,088) (2,944,088) (3,117,800) Tourism Fund (219) (2,363,500) (2,325,000) (2,325,000) (2,500,000) HOT Debt Service (302) - (594,088) (594,088) (592,800) Property and Facility Management (663) (24,996) (25,000) (25,000) (25,000) (Roof Replacement Tourism) Unreserved Fund Balance 1,436,728 410,683 889,533 44,010 Reserve (2% Tax) 4,715,689 466,448 1,244,379 5,444,264 ENDING FUND BALANCE / WORKING CAPITAL $6,152,417 $877,131 $2,133,912 $5,488,274 142
Hotel TAX FUND (211) CONT.
SERVICE POINT EXPENDITURES7% HOTEL/MOTEL OCCUPANCY TAX
SERVICE POINT EXPENDITURES2% HOTEL/MOTEL OCCUPANCY TAX
hotel tax
FUND
FY 2020-2021 ACTUAL EXPENDITURES FY 2021-2022 BUDGET APPROPRIATIONS FY 2021-2022 PROJECTED EXPENDITURES FY 2022-2023 BUDGET APPROPRIATIONS Salaries and Benefits - - -Supplies and Services 30,953 56,500 26,612 55,500 Sundry 835,900 947,400 875,400 1,025,400 Utilities - - -Maintenance - - -Capital Outlay - 42,000 39,287TOTAL 866,853 1,045,900 941,299 1,080,900 FY 2020-2021 ACTUAL EXPENDITURES FY 2021-2022 BUDGET APPROPRIATIONS FY 2021-2022 PROJECTED EXPENDITURES FY 2022-2023 BUDGET APPROPRIATIONS Salaries and Benefits - - -Supplies and Services 377,428 905,752 267,923Sundry - - -Utilities - - -Maintenance - - -Capital Outlay - 10,416,140 10,400,129TOTAL 377,428 11,321,892 10,668,052143
Funds OTHER
Cemeteries OPERATING FUND (204)
STATEMENT OF REVENUES, EXPENDITURES, AND CHANGES IN WORKING CAPITAL
Fiscal Year 2022-2023
SERVICE POINT EXPENDITURES - CEMETERIES
other funds
ACTUALS 2020-2021 AMENDED BUDGET 2021-2022 PROJECTED 2021-2022 BUDGET 2022-2023 BEGINNING FUND BALANCE 142,425 15,854 15,854 18,108 REVENUES Permits 7,150 13,450 4,650 8,000 Interest Earnings 847 3,369 (4) 3,369 Current Service Charges 107,003 110,400 81,865 174,500 TOTAL REVENUES 115,000 127,219 86,511 185,869 EXPENDITURES Cemetery 264,307 280,400 297,750 470,870 TOTAL EXPENDITURES 264,307 280,400 297,750 470,870 Transfer In 22,736 219,277 213,493 315,000 Cemetery Trust Fund (713) 22,736 19,277 13,493 15,000 General Fund (101) - 200,000 200,000 300,000 Transfer Out - - -Productivity Fund (639) - - -ENDING FUND BALANCE 15,854 81,950 18,108 48,107
FY 2020-2021 ACTUAL EXPENDITURES FY 2021-2022 BUDGET APPROPRIATIONS FY 2021-2022 PROJECTED EXPENDITURES FY 2022-2023 BUDGET APPROPRIATIONS Salaries and Benefits 143,057 162,180 169,397 173,379 Supplies and Services 24,154 20,336 24,917 198,121 Sundry 13,239 12,605 12,605 12,493 Utilities 31,546 49,000 42,493 49,000 Maintenance 52,311 36,279 48,338 37,877 Capital Outlay - - -TOTAL 264,307 280,400 297,750 470,870 145
Cemeteries OPERATING FUND (204)
Cemetery TRUST FUND (713)
STATEMENT OF REVENUES, EXPENDITURES, AND CHANGES IN WORKING CAPITAL
Fiscal Year 2022-2023
other funds
CONT.
EMPLOYEES
CEMETERIES REGULAR FULL TIME POSITIONS 2018-2019 2019-2020 2020-2021 2021-2022 2022-2023 Cemeterian 1 1 1 1 1 Groundskeeper 1 1 1 1 1 2)Crew Leader - 1 1 1 1 Laborer 1 1 1 1 1 TOTAL REGULAR FULL TIME 3 4 4 4 4 1) Cemeterian position frozen FY 17-18 - until further notice 2) One Crew Leader added - not a new position, but not reflected in previous years
SERVICE POINT
–
ACTUALS 2020-2021 AMENDED BUDGET 2021-2022 PROJECTED 2021-2022 BUDGET 2022-2023 BEGINNING FUND BALANCE 3,104,957 3,182,287 3,182,287 3,254,963 REVENUES Interest Earnings 23,569 19,277 13,493 15,000 Sales 76,497 96,600 71,610 109,600 TOTAL REVENUES 100,066 115,877 85,103 124,600 Transfer In - - -Transfer Out (22,736) (19,277) (12,427) (15,000) Cemetery Operating Fund (204) (22,736) (19,277) (12,427) (15,000) ENDING FUND BALANCE 3,182,287 3,278,887 3,254,963 3,364,563 146
Police FORFEITURE FUND (205)
STATEMENT OF REVENUES, EXPENDITURES, AND CHANGES IN WORKING CAPITAL
Fiscal Year 2022-2023
SERVICE POINT EXPENDITURES - STATE FORFEITURE
SERVICE POINT EXPENDITURES - FEDERAL FORFEITURE
other funds
ACTUALS 2020-2021 AMENDED BUDGET 2021-2022 PROJECTED 2021-2022 BUDGET 2022-2023 BEGINNING FUND BALANCE 466,269 464,900 464,900 283,981 REVENUES Judgement of Forfeitures - State 98,959 41,000 - 41,000 Judgement of Forfeitures - Federal 9,469 - -Training Registration 50,700 20,000 10,000 20,000 Interest Earnings 4,268 2,233 2,081 2,233 TOTAL REVENUES 163,396 63,233 12,081 63,233 EXPENDITURES Federal Forfeiture 113,712 119,800 70,000 70,000 State Forfeiture 51,053 82,000 75,000 82,000 Training/Range Upgrades - 65,700 48,000 25,000 TOTAL EXPENDITURES 164,765 267,500 193,000 177,000 ENDING FUND BALANCE 464,900 260,633 283,981 170,214
FY 2020-2021 ACTUAL EXPENDITURES FY 2021-2022 BUDGET APPROPRIATIONS FY 2021-2022 PROJECTED EXPENDITURES FY 2022-2023 BUDGET APPROPRIATIONS Salaries and Benefits - - -Supplies and Services 33,583 - -Sundry - - -Utilities - - -Maintenance - - -Capital Outlay 80,129 119,800 70,000 70,000 TOTAL 113,712 119,800 70,000 70,000 FY 2020-2021 ACTUAL EXPENDITURES FY 2021-2022 BUDGET APPROPRIATIONS FY 2021-2022 PROJECTED EXPENDITURES FY 2022-2023 BUDGET APPROPRIATIONS Salaries and Benefits - - -Supplies and Services 20,931 7,000 - 7,000 Sundry 663 - -Utilities - - -Maintenance - - -Capital Outlay 29,459 75,000 75,000 75,000 TOTAL 51,053 82,000 75,000 82,000 147
Park Improvement FUND (206)
STATEMENT OF REVENUES, EXPENDITURES, AND CHANGES IN WORKING CAPITAL
Court Special FEE FUND (207)
STATEMENT OF REVENUES, EXPENDITURES, AND CHANGES IN WORKING CAPITAL
Fiscal Year 2022-2023 other funds
ACTUALS 2020-2021 AMENDED BUDGET 2021-2022 PROJECTED 2021-2022 BUDGET 2022-2023 BEGINNING FUND BALANCE - - - 168,416 REVENUES Landfill Access Fee - 642,525 682,436 675,000 Interest Earnings - 385 - 385 TOTAL REVENUES - 642,910 682,436 675,385 EXPENDITURES Park Capital Improvements - 514,020 514,020 662,000 TOTAL EXPENDITURES - 514,020 514,020 662,000 Transfer In - - -Transfer Out - - -ENDING FUND BALANCE - 128,890 168,416 181,801
Fiscal Year 2022-2023
ACTUALS 2020-2021 AMENDED BUDGET 2021-2022 PROJECTED 2021-2022 BUDGET 2022-2023 Reserve for Technology $74,482 $10,874 $10,874 $(47,061) Reserve for Efficiency (4,931) 29,499 29,499 50,064 Reserve for Partners for Youth 76,334 31,637 31,637 (50,229) Reserve for Jury 706 2,277 2,277 4,070 Reserve for Security (117,779) (28,844) (28,844) 54,700 BEGINNING FUND BALANCE / WORKING CAPITAL 28,812 45,443 45,443 11,544 REVENUES Technology Fees 102,593 101,623 106,874 104,000 Security Fees 88,935 84,000 96,544 94,000 Partners for Youth Fees 93,396 86,204 100,172 100,000 Juvenile Class Fees 127,042 145,911 116,312 130,000 Efficiency Fees 62,458 77,009 59,903 65,000 Jury Fees 1,571 810 1,793 2,000 Truancy Prevention 2,848 6,600 2,086 2,000 Interest Earnings 366 4,019 195 4,019 TOTAL REVENUES 479,209 506,176 483,879 501,019 148
Court Special FEE FUND (207) CONT.
STATEMENT OF REVENUES, EXPENDITURES, AND CHANGES IN WORKING
SERVICE POINT EXPENDITURES - COURT TECHNOLOGY
SERVICE POINT EXPENDITURES - MUNICIPAL COURT SECURITY
other funds
FY 2020-2021 ACTUAL EXPENDITURES FY 2021-2022 BUDGET APPROPRIATIONS FY 2021-2022 PROJECTED EXPENDITURES FY 2022-2023 BUDGET APPROPRIATIONS Salaries and Benefits - - -Supplies and Services - - -Sundry 97,401 80,000 95,838 72,000 Utilities - - -Maintenance 69,166 71,866 69,166 30,866 Capital Outlay - - -TOTAL 166,567 151,866 165,004 102,866 FY 2020-2021 ACTUAL EXPENDITURES FY 2021-2022 BUDGET APPROPRIATIONS FY 2021-2022 PROJECTED EXPENDITURES FY 2022-2023 BUDGET APPROPRIATIONS Salaries and Benefits - - -Supplies and Services - 11,000 11,000 12,050 Sundry - - -Utilities - - -Maintenance - 2,000 2,000 2,000 Capital Outlay - - -TOTAL - 13,000 13,000 14,050
CAPITAL CONT. ACTUALS 2020-2021 AMENDED BUDGET 2021-2022 PROJECTED 2021-2022 BUDGET 2022-2023 EXPENDITURES Expenditures for Technology 166,567 151,866 165,004 102,866 Expenditures for Security - 13,000 13,000 14,050 Expenditures for Partners for Youth 267,983 303,230 300,436 308,605 Expenditures for Jury - 900 -Expenditures for Efficiency 28,028 57,700 39,338 60,300 TOTAL EXPENDITURES 462,578 526,696 517,778 485,821 (Transfer Out) - - -Productivity Fund (639) - - -Reserve for Technology 10,874 (35,350) (47,061) (41,908) Reserve for Efficiency 29,499 48,808 50,064 54,764 Reserve for Partners for Youth 31,637 (32,878) (50,229) (126,834) Reserve for Jury 2,277 2,187 4,070 6,070 Reserve for Security (28,844) 42,156 54,700 134,650 ENDING FUND BALANCE $45,443 $24,923 $11,544 $26,742 149
Court Special FEE FUND (207)
SERVICE POINT EXPENDITURESPARTNERS FOR YOUTH PROGRAM
SERVICE POINT EMPLOYEES –PARTNERS FOR YOUTH PROGRAM
other funds
CONT.
FY 2020-2021 ACTUAL EXPENDITURES FY 2021-2022 BUDGET APPROPRIATIONS FY 2021-2022 PROJECTED EXPENDITURES FY 2022-2023 BUDGET APPROPRIATIONS Salaries and Benefits 173,716 205,830 208,315 231,855 Supplies and Services 94,267 97,400 92,121 76,750 Sundry - - -Utilities - - -Maintenance - - -Capital Outlay - - -TOTAL 267,983 303,230 300,436 308,605
REGULAR FULL TIME POSITIONS 2018-2019 2019-2020 2020-2021 2021-2022 2022-2023 1) Deputy Court Clerk 2 2 2 2 2 1) Juvenile Case Coordinator 1 1 1 1 1 1) Juvenile Program Coordinator 1 1 1 1 1 TOTAL REGULAR FULL TIME 4 4 4 4 4 1) These positions moved to Partners for Youth Fund from Municipal Court FY 2010-2011 SERVICE POINT EXPENDITURES - JURY SERVICE POINT EXPENDITURES - COURT EFFICIENCY FY 2020-2021 ACTUAL EXPENDITURES FY 2021-2022 BUDGET APPROPRIATIONS FY 2021-2022 PROJECTED EXPENDITURES FY 2022-2023 BUDGET APPROPRIATIONS Salaries and Benefits - - -Supplies and Services - 900 -Sundry - - -Utilities - - -Maintenance - - -Capital Outlay - - -TOTAL - 900 -FY 2020-2021 ACTUAL EXPENDITURES FY 2021-2022 BUDGET APPROPRIATIONS FY 2021-2022 PROJECTED EXPENDITURES FY 2022-2023 BUDGET APPROPRIATIONS Salaries and Benefits - - -Supplies and Services 28,028 57,700 39,338 60,300 Sundry - - -Utilities - - -Maintenance - - -Capital Outlay - - -TOTAL 28,028 57,700 39,338 60,300 150
Economic Development FUND (208)
STATEMENT OF REVENUES, EXPENDITURES, AND CHANGES IN WORKING CAPITAL
Fiscal Year 2022-2023
TIF TIRZ #4 (217)
STATEMENT OF REVENUES, EXPENDITURES, AND CHANGES IN WORKING CAPITAL
Fiscal Year 2022-2023
other funds
ACTUALS 2020-2021 AMENDED BUDGET 2021-2022 PROJECTED 2021-2022 BUDGET 2022-2023 BEGINNING FUND BALANCE 161,354 347,885 347,885 359,253 REVENUES Interest Earnings 1,539 1,921 1,368 1,500 TOTAL REVENUES 1,539 1,921 1,368 1,500 EXPENDITURES Economic Development 165,000 330,400 165,000 208,750 TOTAL EXPENDITURES 165,000 330,400 165,000 208,750 Transfer In 349,992 325,000 175,000 275,000 Water Utilities Fund (502) 174,996 175,000 175,000 175,000 Solid Waste Fund (560) 174,996 150,000 - 100,000 Airport Operations Fund (524) - - -Transfer Out - - -ENDING FUND BALANCE 347,885 344,406 359,253 427,003 ACTUALS 2020-2021 AMENDED BUDGET 2021-2022 PROJECTED 2021-2022 BUDGET 2022-2023 BEGINNING FUND BALANCE 6,223 15,114 15,114 67,991 REVENUES Property Tax 8,837 75,719 52,711 102,516 Interest Earnings 54 - 166 150 TOTAL REVENUES 8,891 75,719 52,877 102,666 EXPENDITURES TIRZ - - -TOTAL EXPENDITURES - - -Transfer In - - -General Fund (101) - - -Transfer Out - - -ENDING FUND BALANCE 15,114 90,833 67,991 170,657
151
TIF TIRZ #3 (218)
STATEMENT OF REVENUES, EXPENDITURES, AND CHANGES IN WORKING CAPITAL
Fiscal Year 2022-2023
other funds ACTUALS 2020-2021 AMENDED BUDGET 2021-2022 PROJECTED 2021-2022 BUDGET 2022-2023 BEGINNING FUND BALANCE 521,207 623,218 623,218 741,960 REVENUES Property Tax 99,182 104,222 117,412 125,371 Interest Earnings 4,304 6,508 2,830 3,000 TOTAL REVENUES 103,486 110,730 120,242 128,371 EXPENDITURES TIRZ 1,475 5,000 1,500 5,000 TOTAL EXPENDITURES 1,475 5,000 1,500 5,000 Transfer In - - -TIF / TIRZ #2 (209) - - -Transfer Out - - -ENDING FUND BALANCE 623,218 728,948 741,960 865,331
152
Tourism & Convention FUND (219)
STATEMENT OF REVENUES, EXPENDITURES, AND CHANGES IN WORKING CAPITAL
Fiscal Year 2022-2023
SERVICE POINT EXPENDITURES - ROSE GARDEN CENTER
other funds ACTUALS 2020-2021 AMENDED BUDGET 2021-2022 PROJECTED 2021-2022 BUDGET 2022-2023 BEGINNING FUND BALANCE 127,411 287,003 287,003 343,422 REVENUES Rose Garden 66,233 59,000 86,885 232,000 Convention Center (9,909) - 4,402 595,000 Main Street Revenue 2,006 9,900 9,394 10,000 Liberty Hall Revenue 14,773 123,900 77,612 128,400 Interest Earnings 53,526 18,710 1,052 2,500 TOTAL REVENUES 126,629 211,510 179,345 967,900 EXPENDITURES Rose Garden Center 258,752 288,967 291,713 495,501 Rose Garden Maint. 630,143 617,105 558,942 645,091 Convention Center & Goodman 831,391 881,057 909,517 1,190,574 Liberty Hall 209,563 256,761 188,701 328,473 Main Street 380,688 512,289 479,053 506,457 Contingencies - - - 150,000 TOTAL EXPENDITURES 2,310,537 2,556,179 2,427,926 3,166,096 Transfer In 2,363,500 2,325,000 2,325,000 2,500,000 Hotel Tax Fund (211) 2,363,500 2,325,000 2,325,000 2,500,000 Transfer Out (20,000) (20,000) (20,000) (20,000) Technology Fund (671) (20,000) (20,000) (20,000) (20,000) Productivity Fund (639) - - -ENDING FUND BALANCE 287,003 247,334 343,422 625,226
FY 2020-2021 ACTUAL EXPENDITURES FY 2021-2022 BUDGET APPROPRIATIONS FY 2021-2022 PROJECTED EXPENDITURES FY 2022-2023 BUDGET APPROPRIATIONS Salaries and Benefits 164,901 174,569 190,249 227,010 Supplies and Services 21,403 22,455 26,677 22,455 Sundry 4,619 5,381 4,857 12,048 Utilities 29,925 50,000 33,529 50,000 Maintenance 37,904 36,562 36,401 71,988 Capital Outlay - - - 112,000 TOTAL 258,752 288,967 291,713 495,501 153
Tourism & Convention FUND (219)
SERVICE POINT EMPLOYEES – ROSE GARDEN CENTER
SERVICE POINT EXPENDITURESROSE GARDEN CENTER MAINTENANCE
other funds
CONT.
REGULAR FULL TIME POSITIONS 2018-2019 2019-2020 2020-2021 2021-2022 2022-2023 2 & 3) Building Maintenance Worker 1 1 1 1 1 7)Custodian 1 - - -Venue Attendant - 1 1 1 1 Tourism Facility Custodial Supervisor 1 1 1 1 1 5)Receptionist/Greeter 1 1 1 1 1 TOTAL REGULAR FULL TIME 4 4 4 4 4 Positions moved to Rose Garden Center from Visitor’s Facility FY 2011-2012 1) One clerk reclassified to Visitor Facilities Coordinator during FY 11-12 2) One Building Maintenance Worker reclassified to Visitor Facilities Supervisor during FY 13-14 3) Visitor Facilities Coordinator reclassified to Building Maintenance Worker during FY 13-14 4) Visitor Facilities Supervisor reclassified to Manager of Tourism and Community Facilities Beautification FY 15/16 5) Receptionist/Greeter added FY 15-16 not reflected in report, error located FY 17-18 6) Reservation Specialist reclassified to Tourism Facility Custodial Supervisor FY 18-19 7) One Custodian retitled to Venue Attendant FY 19-20
FY 2020-2021 ACTUAL EXPENDITURES FY 2021-2022 BUDGET APPROPRIATIONS FY 2021-2022 PROJECTED EXPENDITURES FY 2022-2023 BUDGET APPROPRIATIONS Salaries and Benefits 301,278 381,999 304,404 337,611 Supplies and Services 135,999 55,272 83,834 92,959 Sundry 46,701 47,434 47,388 46,798 Utilities 25,539 45,650 30,759 45,650 Maintenance 85,491 79,733 85,540 87,073 Capital Outlay 35,135 7,017 7,017 35,000 TOTAL 630,143 617,105 558,942 645,091 154
Tourism & Convention FUND (219)
SERVICE POINT EMPLOYEES –ROSE GARDEN CENTER MAINTENANCE
SERVICE POINT EXPENDITURES - VISITOR FACILITIES
other funds
CONT.
1) One position frozen for FY 2009-2010
2) One Laborer position frozen for FY 2011-2012
3) Rose Garden Supervisor reclassified to Parks Superintendent during FY 13-14
REGULAR FULL TIME POSITIONS 2018-2019 2019-2020 2020-2021 2021-2022 2022-2023 Crew Leader 1 1 1 1 1 Groundskeeper 2 2 2 2 2 1, 2) Laborer 3 3 3 3 3 3) Parks Superintendent 1 1 1 1 1 TOTAL REGULAR FULL TIME 7 7 7 7 7
FY 2020-2021 ACTUAL EXPENDITURES FY 2021-2022 BUDGET APPROPRIATIONS FY 2021-2022 PROJECTED EXPENDITURES FY 2022-2023 BUDGET APPROPRIATIONS Salaries and Benefits 538,319 704,195 718,619 834,674 Supplies and Services 51,202 22,586 30,960 53,485 Sundry 122,652 121,345 120,945 138,796 Utilities 59,383 5,175 11,258 114,075 Maintenance 59,835 2,756 2,735 24,544 Capital Outlay - 25,000 25,000 25,000 TOTAL 831,391 881,057 909,517 1,190,574 155
SERVICE POINT EMPLOYEES – VISITOR FACILITIES
retitled to Venue Attendant (PT) FY 19-20
21) Custodians for Conference Center Grounds FY 22-23
other funds
Convention
CONT. 1) Museum Curator moved to parttime during FY 2009-2010 2) Moved 1 Clerk, 1 Custodian, and 1 Building Maintenance Worker to Other Tourism RGC FY 2011-2012 3) Parks and Recreation Director 50% paid General Fund Parks and Rec 4) Parks Manager 70% paid General Fund Parks and Rec 5) 1 Laborer frozen FY 2011-2012 and 2012-2013 6) 1 PT Curator and 1 PT Custodian combined to form 1 FT Curator in FY 2011-2012 7) Assistant city manager 90% paid by communications FY 15-16 8) Parks&Rec Director reclassified to Managing Director of Parks/ Recreation Operations salary charged to50%Parks, 50%Parks Visitor Facilities 16/17 9) Building Maintenance Worker reclassified to Tourism Facility Custodial Supervisor FY 17-18 10) Visitor Facilities Supervisor reclassified to Manager of Tourism and Community Facilities Beautification FY 15/16 11) MD Parks/Recreation Op salary charged 20%Parks Admin, 50% Visitor Facilities & 30%Liberty Hall FY 17-18 12) Budget Administrator/ Cemeterian salary split 95% Visitor Tourism/ 5% Parks Admin FY 17-18 13) Manager of Tourism Facilities & Community Beautification salary split 77% Visitor Tourism/ 23% Parks Admin FY 17-18 14) Manager of Tourism Facilities & Community Beautification reclassified to Senior Manager Parks, Recreation & Tourism FY 18-19 salary split 55% Parks/45% Tourism 15) MD Parks/Recreation salary split 60% visitor facilities 40% liberty hall 16) One Museum Curator reclassified to Goodman & Special Event Supervisor FY 19-20 17) Budget Administrator/ Cemeterian retitled to Budget Analyst & Internal Auditor FY 1920, salary split 95% Tourism/5% Parks Admin 18) One temporary Custodian upgraded to one part time Custodian FY 17/18; updated for FY 19-20 19) One Custodian (FT) retitled to Venue Attendant (FT) FY 19-20 20) One Custodian (PT)
Tourism &
FUND (219)
REGULAR FULL TIME POSITIONS 2018-2019 2019-2020 2020-2021 2021-2022 2022-2023 8, 11) Managing Director Parks/ Recreation Operations 0.5 0.6 0.6 0.6 0.6 4) Parks Manager 0.3 0.3 0.3 0.3 0.3 16) Goodman & Special Events Supervisor - 1 1 1 1 2, 9) Building Maintenance Worker - - - -12) Budget Administrator/ Cemeterian 0.95 - - -17) Budget Analyst & Internal Auditor - 0.95 0.95 0.95 0.95 Tourism Facilities Supervisor 1 1 1 1 1 2, 19, 21) Custodian 1 - - - 2 Venue Attendant - 1 1 1 1 1, 16) Museum Curator 1 - - -10, 13) Manager of Tourism Facilities & Community Beautification - - - -14) SR Manager of Parks, Recreation & Tourism 0.45 0.45 0.45 0.45 0.45 TOTAL REGULAR FULL TIME 5.2 5.3 5.3 5.3 7.3 REGULAR PART TIME POSITIONS 2018-2019 2019-2020 2020-2021 2021-2022 2022-2023 18, 20) Custodian 2 2 2 2 2 Venue Attendant - 1 1 1 1 16) Goodman & Special Events Supervisor - 1 1 1 1 TOTAL PART FULL TIME 2 3 3 3 3 TEMPORARY POSITIONS 2018-2019 2019-2020 2020-2021 2021-2022 2022-2023 18)Custodian 1 - - -TOTAL TEMPORARY 1 0 0 0 0 GRAND TOTAL DEPARTMENT 8.2 8.3 8.3 8.3 10.3 156
Tourism & Convention FUND (219)
SERVICE POINT EMPLOYEES – MAIN STREET & LIBERTY HALL
other funds
CONT.
POINT EXPENDITURES
LIBERTY
SERVICE POINT EXPENDITURES - MAIN STREET FY 2020-2021 ACTUAL EXPENDITURES FY 2021-2022 BUDGET APPROPRIATIONS FY 2021-2022 PROJECTED EXPENDITURES FY 2022-2023 BUDGET APPROPRIATIONS Salaries and Benefits 140,462 66,744 72,166 84,024 Supplies and Services 23,336 139,686 72,416 170,456 Sundry 15,747 16,550 17,719 30,617 Utilities 11,311 16,841 7,999 17,681 Maintenance 18,707 16,940 18,401 25,695 Capital Outlay - - -TOTAL 209,563 256,761 188,701 328,473 FY 2020-2021 ACTUAL EXPENDITURES FY 2021-2022 BUDGET APPROPRIATIONS FY 2021-2022 PROJECTED EXPENDITURES FY 2022-2023 BUDGET APPROPRIATIONS Salaries and Benefits 192,285 270,170 261,503 284,771 Supplies and Services 163,860 211,857 184,332 188,255 Sundry 19,992 20,206 25,334 21,325 Utilities 1,742 3,355 1,404 3,355 Maintenance 2,809 6,701 6,480 8,751 Capital Outlay - - -TOTAL 380,688 512,289 479,053 506,457
SERVICE
-
HALL
3) One
Administrative Assistant FY 16-17 4) Parking Patrol
Traffic
Downtown Ambassadors FY 15/16 5) MD Parks/Recreation Op
charged 20%Parks Admin, 50% Visitor Facilities & 30%Liberty Hall FY 17-18 6) Communications Manager
to Director of Marketing and Communications FY 17/18 salary split 93%Communication, 7%Stormwater; 7) MD Parks/Recreation
split 60% visitor facilities 40% liberty hall 8) Downtown Ambassadors
to Main Street from
Hall
1) One Deputy Court Clerk Transferred to Main Street and converted into Gallery Curator during FY 2009-2010 2)
Gallery Curator retitled to Gallery Operations Support for FY 13-14
Gallery Operations Support reclassified to
positions transferred from
and reclassified to
salary
reclassified
salary
transferred
Liberty
REGULAR FULL TIME POSITIONS 2018-2019 2019-2020 2020-2021 2021-2022 2022-2023 Main Street Program Director 1 1 1 1 1 8) Downtown Ambassador 2 2 2 2 2 Administrative Assistant 1 1 1 1 1 5, 7) Managing Director Parks/ Recreation Operations 0.3 0.4 0.4 0.4 0.4 6) Director of Marketing and Communications 0.46 - - -TOTAL REGULAR FULL TIME 4.76 4.4 4.4 4.4 4.4 157
Airport Passenger FACILITY FUND (234)
STATEMENT OF REVENUES, EXPENDITURES, AND CHANGES IN WORKING CAPITAL
Fiscal Year 2022-2023
other funds ACTUALS 2020-2021 AMENDED BUDGET 2021-2022 PROJECTED 2021-2022 BUDGET 2022-2023 BEGINNING FUND BALANCE 127,193 123,750 123,750 221,167 REVENUES Passenger Facility Charge 145,641 144,000 168,616 150,000 Interest Earnings 916 2,000 801 2,000 TOTAL REVENUES 146,557 146,000 169,417 152,000 EXPENDITURES TOTAL EXPENDITURES - - -Transfer In - - -Transfer Out (150,000) (72,000) (72,000) (72,000) Half-Cent Sales Tax (NonBudgetary Fund) - - -Airport Operations Fund (524) (150,000) (72,000) (72,000) (72,000) ENDING FUND BALANCE 123,750 197,750 221,167 301,167
158
Rainy Day FUND (235)
STATEMENT OF REVENUES, EXPENDITURES, AND CHANGES IN WORKING CAPITAL
Fiscal Year 2022-2023
other funds ACTUALS 2020-2021 AMENDED BUDGET 2021-2022 PROJECTED 2021-2022 BUDGET 2022-2023 BEGINNING FUND BALANCE \ WORKING CAPITAL $7,161,407 $11,175,690 $11,175,690 $8,290,145 REVENUES Oil Leases and Royalties 41,248 60,000 69,940 60,000 Sale of Property 766,917 - -Interest Earnings 60,160 126,790 44,515 55,000 TOTAL REVENUES 868,325 186,790 114,455 115,000 EXPENDITURES Downtown Property Maintenance - - -Special Services 20,049 - -Building Improvements - - -Purchase of Land 288,428 - -Contingencies - 100,000 - 100,000 TOTAL EXPENDITURES 308,477 100,000 - 100,000 Transfers In 3,454,435 - -General Fund (101) 3,454,435 - -(Transfers Out) - (3,000,000) (3,000,000)HOT Fund (211) - (3,000,000) (3,000,000)ENDING FUND BALANCE $11,175,690 $8,262,480 $8,290,145 $8,305,145
159
PEG Fee FUND (236)
STATEMENT OF REVENUES, EXPENDITURES, AND CHANGES IN WORKING CAPITAL
Fiscal Year 2022-2023
other funds ACTUALS 2020-2021 AMENDED BUDGET 2021-2022 PROJECTED 2021-2022 BUDGET 2022-2023 BEGINNING FUND BALANCE 896,085 1,043,892 1,043,892 1,156,578 REVENUES PEG Fee 230,581 236,293 224,470 236,293 Interest Earnings 6,925 7,875 4,446 7,875 TOTAL REVENUES 237,506 244,168 228,916 244,168 EXPENDITURES Technology Costs 60,208 60,230 60,230 53,116 Technology Updates 29,491 213,000 56,000 213,000 Studio Renovations - - -Contingency - 50,000 - 50,000 TOTAL EXPENDITURES 89,699 323,230 116,230 316,116 Transfer In - - -Transfer Out - - -Productivity Fund (639) - - -ENDING FUND BALANCE 1,043,892 964,830 1,156,578 1,084,630
160
Neighborhood SERVICES
Accomplishments for 2021-2022
• Acquired Property through Eminent Domain to complete TJ Austin Sidewalk extension project Phase I
• Completed TJ Austin Sidewalk extension project Phase I
• Completed TJ Austin Sidewalk extension project Phase II
• Prepared RFP for Nobel E. Young Park project
• 90% Complete on 7 homes in the Hidden Palace Subdivision
• 5 homes pending demo as of 4/27/2022
• Served all remaining families from its 2019 waiting list,
• Opened the waiting list/ application process for new applicants/ families in May 2021 and placed 1,126 families on its new/ current waiting list,
• Increased its payment standard from 100% to 110% to decrease rental burdens on families,
• Applied for additional VASH vouchers to increase its allocation to support the need of veteran housing assistance
• Partnered with CDBG and other financial institutions to market Homeownership opportunities for low-income participants
• Received a SEMAP score of 100%, resulting in Tyler’s Housing Agency being classified as a High Performer (carryover from previous performance year)
• Partnered and collaborated with Workforce Solutions East Texas to assist participants with employment opportunities and job readiness training, BCFS Community Action Network (CAN) to provide medical and health care services to participating families, and continued to serve on the Housing Panel of the East Texas Human Needs Network Council that addresses community barriers such as affordable housing, homelessness, transportation, health, and safety, etc.
• Began construction of public reception and restroom areas to respond, prepare and prevent the spread of COVID-19
• Expanded its use of technology and selfserve options through the use of an onsite kiosk machine for participating HCV and FSS participants
• Conducted outreach efforts for new owners in order to increase assisted HCV properties as well as conducted three workshops for owners and their designated maintenance and management personnel.
Major Budget Items
• Homebuyer Assistance and Credit Counseling Program;
• First-Time Homebuyer Program - $220,000
• New Construction projects - $755,127
• Public Facilities including Street Infrastructure$643,580
• Housing Choice Voucher Assistance Program; and -Family Self-Sufficiency Program
Goals for 2022-2023
• Covid Funds Allocated for P.T. Cole Park improvements
• Complete Phase II of Hidden Palace
• Assist with Street Improvement in the Eastern District
• Economic Development at Loop and Gentry Parkway
• Assist 7 Families with Down Payment Assistance
• 10 Substandard Homes Demolished
• Become 100% staffed and position personnel in appropriate role
• Increase /maintain an average of 75% VASH lease-ups
• Maintain monthly average HAP expenditure of =>98%
• Maintain lease-ups with a 98% monthly average
• Host three or more inspection Q&A seminars for landlords and increase landlord participation
• Reduce tenant fraud repayments
• Exhaust 2021 waiting list and re-open application process
• Continue business operations virtually while re-opening department (by scheduled appointment)
other funds
161
Homeownership/Housing FUND (274)
STATEMENT OF REVENUES, EXPENDITURES, AND CHANGES IN WORKING CAPITAL
Fiscal Year 2022-2023
other funds
ACTUALS 2020-2021 AMENDED BUDGET 2021-2022 PROJECTED 2021-2022 BUDGET 2022-2023 BEGINNING FUND BALANCE 424 427 427 429 TOTAL REVENUES 3 14 2 14 TOTAL EXPENDITURES - - -ENDING FUND BALANCE 427 441 429 443
162
Housing Assistance PAYMENTS FUND (276)
STATEMENT OF REVENUES, EXPENDITURES, AND CHANGES IN WORKING CAPITAL
Fiscal Year 2022-2023
other funds
ACTUALS 2020-2021 AMENDED BUDGET 2021-2022 PROJECTED 2021-2022 BUDGET 2022-2023 Reserve for Voucher Program 347,798 112,169 112,169 184,484 Reserve for Administration 812,156 644,877 644,877 681,725 BEGINNING FUND BALANCE 1,159,954 757,046 757,046 866,209 REVENUES HUD Voucher 7,018,409 7,583,598 8,605,386 8,500,000 HUD Administration 694,672 670,000 702,590 780,000 Portability Voucher 185,838 225,000 225,714 250,000 Portability Administration 10,505 20,250 14,246 16,200 FSS Administration 57,510 69,579 69,579 58,563 Vash Voucher - - -Fraud Reimbursement - Voucher 36,964 15,000 26,898 30,000 Fraud ReimbursementAdministration 36,963 15,000 27,003 30,000 CARES Act - 827 -Rental Income 12,000 12,000 12,000 12,000 Interest Earnings 8,207 16,000 2,145 12,000 TOTAL REVENUES 8,061,068 8,627,254 9,685,561 9,688,763 EXPENDITURES HAP Voucher 7,096,759 6,703,874 8,331,135 8,547,500 HAP Administration 649,097 1,332,579 715,705 1,038,226 Portability Voucher 196,716 250,000 235,855 200,000 Portability Administration - 17,000 - 19,000 FSS Administration 60,776 79,299 75,010 79,748 Tenant Protection Voucher 23,448 39,000 29,018 32,500 Tenant Protection Administration - 16,300 - 10,000 Vash Voucher 170,795 217,320 189,675 230,000 CARES Act 266,385 827 692TOTAL EXPENDITURES 8,463,976 8,656,199 9,577,090 10,156,974 Reserve for Voucher Program 112,169 725,573 184,484 (45,516) Reserve for Administration 644,877 2,528 681,725 443,514 ENDING FUND BALANCE 757,046 728,101 866,209 397,998 163
Housing Assistance PAYMENTS FUND (276)
SERVICE POINT EXPENDITURESHOUSING ASSISTANCE PAYMENT PROGRAM
SERVICE POINT EMPLOYEES – HOUSING
Position upgrade to Code Enforcement/Housing Inspector Supervisor
9) During FY 2010-2011 Certified Housing Specialist downgraded to Developmental Certified Housing Specialist, then upgraded to back to Certified Housing Specialist within same year
13) Financial Analyst transferred to Finance FY 12-13
11) One position 30% paid by Community development and 10% by Home FY 15-16
14)
other funds
FY 2020-2021 ACTUAL EXPENDITURES FY 2021-2022 BUDGET APPROPRIATIONS FY 2021-2022 PROJECTED EXPENDITURES FY 2022-2023 BUDGET APPROPRIATIONS Salaries and Benefits 480,508 565,609 516,740 793,717 Supplies and Services 76,714 147,174 98,788 146,177 Sundry 7,162,375 7,273,390 8,399,919 8,602,132 Utilities 11,500 15,000 13,271 16,200 Maintenance 14,759 35,280 18,122 27,500 Capital Outlay - - -TOTAL 7,745,856 8,036,453 9,046,840 9,585,726 1) One position downgraded from Accountant to Financial Analyst during FY 2007-2008 2) One position with 45% paid by Community Development, 25% paid by Transit and 7%paid by HOME 3) Position transferred to the City Manager’s Office and title changed to Project Manager FY 2008-2009 4) Position transferred from the City Manager’s Office during FY 2008-2009 5) Position title change to Housing Eligibility Supervisor FY 2009-2010 6) Title changed to Certified Housing Specialist during FY 2009-2010 7) One Certified Housing Specialist position upgraded to Senior Certified Housing Specialist during FY 2009-2010 8)
10) Title change from Director of Neighborhood Services to Neighborhood Services Manager FY 2011-2012
11) One position with 50% paid by Community Development and 25% Home
12) One Code Enforcement/Housing Inspector transferred to Development Services Building Inspector FY 13-14
5
20%?
17-18 17) One Code Enforcement Officer I
Code Enforcement FY 18-19
One Code Enforcement/Housing Inspector reclassified to Sec 8/Housing Inspector FY 15-16 15) Senior Cert. Housing Spec. reclassified to Lead Certified Housing Spec. FY 14-15 16) One Rehab Project Specialist (#3) reclassified to Community Development Manager salary split between
NBS accounts
FY
(#1) transferred to
REGULAR FULL TIME POSITIONS 2018-2019 2019-2020 2020-2021 2021-2022 2022-2023 12) NBS Operations manager - - - -Housing Manager 1 1 1 1 1 10, 11) Neighborhood Services Manager 0.1 0.1 0.1 0.1 0.1 Housing Services Manager 1 1 1 1 1 Clerk 1 1 1 1 1 12,14, 17) Code Enforcement/ Housing Inspector - - - -Section 8/Housing Inspector 1 1 1 1 1 6, 22) Eligibility Analyst - 2 2 2 2 23)Senior Clerk 1 - - -Housing Eligibility Supervisor 1 1 1 1 1 7, 9, 21) Certified Housing Specialist 2 3 3 3 3 Lead Certified Housing Specialist 1 - - -Code Enforcement/Housing Inspector Supervisor 1 1 1 1 1 TOTAL REGULAR FULL TIME 10.1 11.1 11.1 11.1 11.1 164
Housing Assistance PAYMENTS FUND (276)
other funds
18) NBS Operations Manager reclassified to Housing Manager FY 18-19 salary no longer split 19) Community Development Manager downgraded to Housing Project Coordinator FY 18-19 (Other - HOME tab) 20) Housing Project Coordinator reclassified back to Community Development Manager FY 18-19 (Other - CDBG tab) 21) One Lead Certified Housing Specialist downgraded to Certified Housing Specialist (this change was noticed in FY 19-20) 22) One Homebuyer Specialist position (CDBG) reclassified to Eligibility Analyst FY 19-20 23) One Senior Clerk reclassified to Eligibility Analyst FY 19-20 SERVICE POINT EXPENDITURES - HOUSING PORTABILITY SERVICE POINT EXPENDITURESFSS HOMEOWNERSHIP PROGRAM FY 2020-2021 ACTUAL EXPENDITURES FY 2021-2022 BUDGET APPROPRIATIONS FY 2021-2022 PROJECTED EXPENDITURES FY 2022-2023 BUDGET APPROPRIATIONS Salaries and Benefits - - -Supplies and Services - 17,000 - 19,000 Sundry 196,716 250,000 235,855 200,000 Utilities - - -Maintenance - - -Capital Outlay - - -TOTAL 196,716 267,000 235,855 219,000 FY 2020-2021 ACTUAL EXPENDITURES FY 2021-2022 BUDGET APPROPRIATIONS FY 2021-2022 PROJECTED EXPENDITURES FY 2022-2023 BUDGET APPROPRIATIONS Salaries and Benefits 60,776 79,299 75,010 79,748 Supplies and Services - - -Sundry - - -Utilities - - -Maintenance - - -Capital Outlay - - -TOTAL 60,776 79,299 75,010 79,748 165
other funds
1) New Position FSS Homeownership Coordinator added FY 2010-2011 (Grant funded position for 1 year); renewed for FY 21-22 SERVICE POINT EMPLOYEES –FSS HOME OWNERSHIP REGULAR FULL TIME POSITIONS 2018-2019 2019-2020 2020-2021 2021-2022 2022-2023 1) FSS Homeownership Coordinator 1 1 1 1 1 TOTAL REGULAR FULL TIME 1 1 1 1 1 SERVICE POINT EXPENDITURESTENANT PROTECTION PROGRAM SERVICE POINT EXPENDITURES - HUD - VASH SERVICE POINT EXPENDITURES - CARES ACT FY 2020-2021 ACTUAL EXPENDITURES FY 2021-2022 BUDGET APPROPRIATIONS FY 2021-2022 PROJECTED EXPENDITURES FY 2022-2023 BUDGET APPROPRIATIONS Salaries and Benefits - - -Supplies and Services - 16,300 - 10,000 Sundry 23,448 39,000 29,018 32,500 Utilities - - -Maintenance - - -Capital Outlay - - -TOTAL 23,448 55,300 29,018 42,500 FY 2020-2021 ACTUAL EXPENDITURES FY 2021-2022 BUDGET APPROPRIATIONS FY 2021-2022 PROJECTED EXPENDITURES FY 2022-2023 BUDGET APPROPRIATIONS Salaries and Benefits - - -Supplies and Services - - -Sundry 170,795 217,320 189,675 230,000 Utilities - - -Maintenance - - -Capital Outlay - - -TOTAL 170,795 217,320 189,675 230,000 FY 2020-2021 ACTUAL EXPENDITURES FY 2021-2022 BUDGET APPROPRIATIONS FY 2021-2022 PROJECTED EXPENDITURES FY 2022-2023 BUDGET APPROPRIATIONS Salaries and Benefits - - -Supplies and Services 266,385 827 692Sundry - - -Utilities - - -Maintenance - - -Capital Outlay - - -TOTAL 266,385 827 692166
Housing Assistance PAYMENTS FUND (276)
Community Development GRANTS FUND (294)
STATEMENT OF REVENUES, EXPENDITURES, AND CHANGES IN WORKING CAPITAL
Fiscal Year 2022-2023
other funds
ACTUALS 2020-2021 AMENDED BUDGET 2021-2022 PROJECTED 2021-2022 BUDGET 2022-2023 BEGINNING FUND BALANCE 62,768 86,889 86,889 86,889 REVENUES CDBG Grant Income 455,150 1,623,132 1,220,251 804,475 HIP Income 350 - -CARES Act - 1,158,411 -Miscellaneous Income 24,443 10,000 10,000 10,000 TOTAL REVENUES 479,943 2,791,543 1,230,251 814,475 ADMINISTRATIVE EXPENDITURES Administration 146,229 184,462 167,499 160,895 Rehab Administration - - -Homebuyers Administration - - 302Demolition Administration 5,174 - 2Code Enforcement Administration 33,124 - 4,391Public Facilities Administration - - 178CARES Act Administration 5,100 - -Miscellaneous Expense (not covered by grant) 668 12,000 -TOTAL ADMINISTRATIVE EXPENDITURES 8,463,976 8,656,199 9,577,090 10,156,974 PROJECT EXPENDITURES Administration - - -Rehab Administration 37,648 - -Homebuyers Administration - 132,178 50,000Demolition Administration 112,238 50,000 - 50,000 Code Enforcement Administration - 126,278 -Public Facilities Administration 109,651 1,137,563 1,007,879 593,580 CARES Act Projects 5,990 1,158,411 -Miscellaneous Expense (not covered by grant) - - -TOTAL PROJECT EXPENDITURES 265,527 2,604,430 1,057,879 643,580 TOTAL EXPENDITURES 455,822 2,800,892 1,230,251 804,475 ENDING FUND BALANCE 86,889 77,540 86,889 96,889 167
Community Development GRANTS FUND (294)
other funds
SERVICE POINT EXPENDITURES - CDBG ADMIN SERVICE POINT EXPENDITURES - CDBG REHAB SERVICE POINT EXPENDITURES - CDBG HOMEBUYERS SERVICE POINT EXPENDITURES - CDBG DEMOLITION FY 2020-2021 ACTUAL EXPENDITURES FY 2021-2022 BUDGET APPROPRIATIONS FY 2021-2022 PROJECTED EXPENDITURES FY 2022-2023 BUDGET APPROPRIATIONS Salaries and Benefits 66,463 84,967 85,087 136,747 Supplies and Services 42,905 75,111 58,028 22,523 Sundry 36,051 22,809 22,809 50 Utilities 70 75 75 75 Maintenance 740 1,500 1,500 1,500 Capital Outlay - - -TOTAL 146,229 184,462 167,499 160,895 FY 2020-2021 ACTUAL EXPENDITURES FY 2021-2022 BUDGET APPROPRIATIONS FY 2021-2022 PROJECTED EXPENDITURES FY 2022-2023 BUDGET APPROPRIATIONS Salaries and Benefits - - 302Supplies and Services - - -Sundry - - -Utilities - - -Maintenance - - -Capital Outlay - 132,178 50,000TOTAL - 132,178 50,302FY 2020-2021 ACTUAL EXPENDITURES FY 2021-2022 BUDGET APPROPRIATIONS FY 2021-2022 PROJECTED EXPENDITURES FY 2022-2023 BUDGET APPROPRIATIONS Salaries and Benefits 3,657 - -Supplies and Services 1,517 - 2Sundry - - -Utilities - - -Maintenance - - -Capital Outlay 112,238 50,000 - 50,000 TOTAL 117,412 50,000 2 50,000 FY 2020-2021 ACTUAL EXPENDITURES FY 2021-2022 BUDGET APPROPRIATIONS FY 2021-2022 PROJECTED EXPENDITURES FY 2022-2023 BUDGET APPROPRIATIONS Salaries and Benefits - - -Supplies and Services - - -Sundry - - -Utilities - - -Maintenance - - -Capital Outlay 37,648 - -TOTAL 37,648 - -168
Community Development GRANTS FUND (294)
other funds
CDBG
SERVICE POINT EXPENDITURES - CARES ACT FY 2020-2021 ACTUAL EXPENDITURES FY 2021-2022 BUDGET APPROPRIATIONS FY 2021-2022 PROJECTED EXPENDITURES FY 2022-2023 BUDGET APPROPRIATIONS Salaries and Benefits 10,552 - 244Supplies and Services 16,144 - 4,147Sundry 6,428 - -Utilities - - -Maintenance - - -Capital Outlay - 126,278 -TOTAL 33,124 126,278 4,391FY 2020-2021 ACTUAL EXPENDITURES FY 2021-2022 BUDGET APPROPRIATIONS FY 2021-2022 PROJECTED EXPENDITURES FY 2022-2023 BUDGET APPROPRIATIONS Salaries and Benefits - - -Supplies and Services 350 - -Sundry 318 12,000 -Utilities - - -Maintenance - - -Capital Outlay - - -TOTAL 668 12,000 -FY 2020-2021 ACTUAL EXPENDITURES FY 2021-2022 BUDGET APPROPRIATIONS FY 2021-2022 PROJECTED EXPENDITURES FY 2022-2023 BUDGET APPROPRIATIONS Salaries and Benefits 4,438 - -Supplies and Services 662 - -Sundry - - -Utilities - - -Maintenance - - -Capital Outlay 5,990 1,158,411 -TOTAL 11,090 1,158,411 -FY 2020-2021 ACTUAL EXPENDITURES FY 2021-2022 BUDGET APPROPRIATIONS FY 2021-2022 PROJECTED EXPENDITURES FY 2022-2023 BUDGET APPROPRIATIONS Salaries and Benefits - - 178Supplies and Services - - -Sundry - - -Utilities - - -Maintenance - - -Capital Outlay 109,651 1,137,563 1,007,879 593,580 TOTAL 109,651 1,137,563 1,008,057 593,580 169
SERVICE POINT EXPENDITURES - CDBG CODE ENFORCEMENT SERVICE POINT EXPENDITURES - PUBLIC FACILITIES SERVICE POINT EXPENDITURES -
MATCH/MISCELLANEOUS
Community Development GRANTS FUND (294)
SERVICE POINT EMPLOYEES – CDBG
1) One position downgraded from Accountant to Financial Analyst during FY 2007-2008
2) One position with 25% paid by Transit, 23% paid by Housing and 7% paid by HOME
3) One position added for FY 2008-2009
4) One position with 20% paid by HOME
5) Two positions, one with 10% paid by HOME and one with 20% paid by HOME
6) Housing Projects Coordinator title changed to Community Development Manager During FY 08-09
7) Title change from Director of Neighborhood Services to Neighborhood Services Manager
8) One position with 25% paid by Housing and 25% paid by HOME
9) One position with 20% paid by HOME 10) One Senior Secretary position with 10% paid by HOME
11) One Project Planner transferred to Wastewater Treatment as Equipment Mechanic I FY 13-14
12) Financial Analyst moved to Finance FY 12-13
8) One position with 60% paid by Housing and 10% paid by HOME FY 15-16
9) Neighborhood services operations manager 20%paid by HOME and 10% by HOUSING FY 15-16
13) One Rehab Project Specialist (#3) reclassified to Community Development Manager salary split between 5 NBS accounts 20%? FY 17-18 14) One Rehab Project Specialist (#1) transferred to Code Enforcement FY 18-19
15) NBS Operations Manager reclassified to Housing Manager 100%paid from Housing FY 18-19
16) Housing Project Coordinator reclassified back to Community Development Manager FY 18-19
17) One Homebuyer Specialist position reclassified to Eligibility Analyst under Housing FY 19-20
18) One Senior Secretary position reclassified to Housing Projects Coordinator salary 100% paid by CDBG FY 20-21
19) One Housing Projects Coordinator reclassified to Community Development Specialist FY 20-21
20) One CDBG Manager reclassified to Community Development Specialist FY 20-21
other funds
REGULAR FULL TIME POSITIONS 2018-2019 2019-2020 2020-2021 2021-2022 2022-2023 7, 8) Neighborhood Services Manager 0.7 0.7 0.7 0.7 0.7 6, 9, 16, 20) Community Development Manager 1 1 - -15) NBS Operations Manager - - - -3,17) Homebuyers Specialist 1 - - -13, 14)Rehab Project Specialist - - - -10, 18) Senior Secretary 0.9 0.9 - -Community Development Specialist - - 2 2 2 TOTAL REGULAR FULL TIME 3.6 2.6 2.7 2.7 2.7 170
Home Grant FUNDS (295)
STATEMENT OF REVENUES, EXPENDITURES, AND CHANGES IN WORKING CAPITAL
Fiscal Year 2022-2023
SERVICE POINT EXPENDITURES - HOME
other funds
ACTUALS 2020-2021 AMENDED BUDGET 2021-2022 PROJECTED 2021-2022 BUDGET 2022-2023 BEGINNING FUND BALANCE 249,869 18,335 18,335 18,335 REVENUES HOME Grant Income 10,085 1,928,473 1,635,833 404,168 Program Income - - 75,918 672,000 Miscellaneous Income - 39,062 -TOTAL REVENUES 479,943 2,791,543 1,230,251 814,475 EXPENDITURES Administration 6,388 366,160 31,751 40,417 Homebuyers - - - 200,000 CHDO - 49,473 - 48,919 New Construction / Reconstruction 3,698 1,513,180 1,176,000 786,832 Local Match 231,533 39,062 504,000Public Facilities Administration - - 178CARES Act Administration 5,100 - -Miscellaneous Expense (not covered by grant) 668 12,000 -TOTAL EXPENDITURES 241,619 1,967,875 1,711,751 1,076,168 ENDING FUND BALANCE 18,335 17,995 18,335 18,335
FY 2020-2021 ACTUAL EXPENDITURES FY 2021-2022 BUDGET APPROPRIATIONS FY 2021-2022 PROJECTED EXPENDITURES FY 2022-2023 BUDGET APPROPRIATIONS Salaries and Benefits 3,715 5,628 5,736 10,112 Supplies and Services 2,673 11,033 7,100 30,305 Sundry - 349,499 18,915Utilities - - -Maintenance - - -Capital Outlay 235,231 1,601,715 1,680,000 1,035,751 TOTAL 241,619 1,967,875 1,711,751 1,076,168 171
Home Grant FUNDS (295)
SERVICE POINT EMPLOYEES – HOME
1) One position downgraded from Accountant to Financial Analyst during FY 2007-2008
2) One position with 45% paid by Community Development, 25% paid by Transit and 23% paid by Housing
3) One position with 80% paid by Community Development
4) Two positions, one with 90% paid by Community Development 10% HOME and one with 80% paid by Community Development 20% HOME
5) Housing Projects Coordinator title changed to Community Development Manager During FY 08-09
6) Title change from Director of Neighborhood Services to Neighborhood Services Manager
7) One position with 25% paid by Housing and 50% paid by Community Development
8) One position with 70% paid by Community Development and 10% by HOUSING FY 15-16
9) One Senior Secretary position with 90% paid by Community Development
10) Financial Analyst moved to Finance FY 12-13
7) One position with 60% paid by Housing and 30% paid by Community Development FY 15-16
8) One Rehab Project SpecialistCommunity Development division (#3) reclassified to Community Development Manager salary split between 5 NBS accounts 20%? FY 17-18
9) NBS Operations Manager reclassified to Housing Manager 100%paid from Housing FY 18-19
10) Community Development Manager downgraded to Housing Project Coordinator FY 18-19
11) Housing Project Coordinator reclassified back to Community Development Manager FY 18-19
12) One Senior Secretary position reclassified to Housing Projects Coordinator salary paid by CDBG FY 20-21
other funds
CONT.
REGULAR FULL TIME POSITIONS 2018-2019 2019-2020 2020-2021 2021-2022 2022-2023 6, 7) Neighborhood Services Manager 0.20 0.20 0.20 0.20 0.20 5, 8,11) Community Development Manager - - - -9) NBS Operations Manager - - - -9, 12) Senior Secretary 0.10 0.10 - -TOTAL REGULAR FULL TIME 0.3 0.3 0.2 0.2 0.2 172
Metropolitan Planning ORGANIZATION
Service Point Focus
The MPO is responsible for the “3-C” planning process (cooperative, continuous, comprehensive) to conduct basic planning activities. Transportation planning is a process of projecting future transportation needs, investigating and evaluating alternative actions for meeting those needs, assessing the financial ability of the community to implement those actions, and recommending reasonable strategies based on needs and available resources. The MPO is also charged with providing professional oversight and support to the Technical Advisory Committee and the Transportation Policy Committee. The MPO is responsible for:
• Developing a Unified Planning Work Program (UPWP);
• Developing a Metropolitan Transportation Plan (MTP);
• Updating and maintaining the MPO TransCAD traffic model;
• Developing a Transportation Improvement Program (TIP);
• Updating the State’s electronic Transportation Improvement Program (eSTIP);
• Submitting monthly billings to TxDOT for reimbursement;
• Submitting Annual Performance & Expenditure Report (APER) for State and Federal approval;
• Submitting Annual Project Listing (APL) for State and Federal approval;
• Providing notice and holding open houses to receive input on regional transportation projects in accordance with the Public Participation Plan (Triple P);
• Updating Title VI plans and maintaining compliance in accordance with Federal regulations;
• Participate in regional and State transportation planning committees and initiatives;
• Coordinating special studies as directed by the Transportation Policy Committee.
Accomplishments for 2021-2022
• Hired consultant to create Active Transportation Plan for region;
• Hired consultant to begin the five year update to the Metropolitan Transportation Plan (MTP);
• Submitted FY 2019 Annual Performance & Expenditure Report;
• Kicked-off Active Transportation plan;
• Kicked-off Metropolitan Transportation Plan (MTP) update;
• Adopted Transportation Improvement Program (TIP) for FY2018-2021.
Goals for 2022-2023
• Monitor Air Quality for region for possible nonattainment status;
• Work closely within 14 county East Texas Council of Government’s region to advance public transportation;
• Continue support of Toll 49.
other funds
173
MPO GRANT (285)
STATEMENT OF REVENUES, EXPENDITURES, AND CHANGES IN WORKING CAPITAL
SERVICE POINT EXPENDITURES - 104F TRANSPORT PLANNING
other funds
ACTUALS 2020-2021 AMENDED BUDGET 2021-2022 PROJECTED 2021-2022 BUDGET 2022-2023 BEGINNING FUND BALANCE - - -TOTAL REVENUES 356,660 579,113 179,958 831,823 TOTAL EXPENDITURES 356,660 579,113 179,958 831,823 ENDING FUND BALANCE - - - -
FY 2020-2021 ACTUAL EXPENDITURES FY 2021-2022 BUDGET APPROPRIATIONS FY 2021-2022 PROJECTED EXPENDITURES FY 2022-2023 BUDGET APPROPRIATIONS Salaries and Benefits 114,383 107,314 118,329 250,237 Supplies and Services 204,699 144,500 55,270 318,500 Sundry 37,573 327,249 6,357 263,036 Utilities 5 50 2 50 Maintenance - - -Capital Outlay - - -TOTAL 356,660 579,113 179,958 831,823 174
Tyler TRANSIT
Service Point Focus
Tyler Transit provides public transportation services to the citizens of Tyler that is safe, dependable and cost effective. Tyler Transit operates a fixed route bus system throughout the city on five fixed routes, as well as providing complementary ADA Paratransit services to individuals that are eligible. Through the Tyler Transit system, we connect citizens to employers, medical facilities and educational institutions throughout the city. Transit employees are responsible for the following:
• Providing safe, dependable and efficient public transportation services.
• Administering awarded Federal and State grant funds.
• Operating and Maintaining all transit vehicles to conform to Federal Transit Authority (FTA) guidelines.
• Promoting and increasing ridership.
• Coordination of efforts to streamline route schedules for customer convenience with additional technologies.
• Continuation of employee training that promotes and reinforces safe and efficient processes in providing public transportation.
Accomplishments for 2021-2022
• Purchased 2nd Gillig 30 foot bus
• Approved Purchase 4 ARBOC buses
• Increased overall advertisement revenue on buses
• Continued Campus Connect program with UT Tyler and TJC
• Evaluated Transit Route Study for improvements
• Removed old Transit Stops
• Increased ridership above last year’s operations
• Improved management of Transit and saved money by taking it back in house
Goals for 2022-2023
• With current Genfare cash handling system becoming obsolete December 31, 2022, evaluation of Cashless fare systems to be evaluated for implementation
• Promote free travel training for all riders
• Maintain and enhance existing contracts and partnerships
• Improve security with better maned security during specific time operations
• Improve outside security with exterior gating of main Transit Depot
• Evaluate and improve Route Study findings
• Evaluate Fixed Route Software for better management and customer utilization
• Evaluate MPO plan for Intermodal Facility for land purchase needs
• Add Transit Assistant Manager position
• Add Transit Operations Coordinator position
other funds
175
Transit System FUND (286)
STATEMENT OF REVENUES, EXPENDITURES, AND CHANGES IN WORKING CAPITAL
Fiscal Year 2022-2023
SERVICE
POINT
EXPENDITURES - TYLER TRANSIT
SERVICE POINT EXPENDITURES - ADA
other funds
ACTUALS 2020-2021 AMENDED BUDGET 2021-2022 PROJECTED 2021-2022 BUDGET 2022-2023 BEGINNING FUND BALANCE 50,669 55,196 55,196 150,398 REVENUES Transit Fees 118,619 179,000 165,171 179,000 Advertising 10,860 10,000 25,325 25,000 Bus Sales and Other Income 5,706 10,000 4,074 10,000 State Grant 604,775 749,751 264,640 648,019 Federal Grant 2,691,726 3,699,401 3,505,567 3,555,745 TOTAL REVENUES 3,431,686 4,648,152 3,964,777 4,417,764 EXPENDITURES Transit Operations 3,521,281 4,709,777 3,919,575 4,817,764 TOTAL EXPENDITURES 3,521,281 4,709,777 3,919,575 4,817,764 Transfer In 94,122 50,000 50,000 400,000 General Fund (101) 94,122 50,000 50,000 400,000 Transfer Out - - -ENDING FUND BALANCE 55,196 43,571 150,398 150,398
FY 2020-2021 ACTUAL EXPENDITURES FY 2021-2022 BUDGET APPROPRIATIONS FY 2021-2022 PROJECTED EXPENDITURES FY 2022-2023 BUDGET APPROPRIATIONS Salaries and Benefits 1,012,970 1,077,000 1,017,307 1,805,664 Supplies and Services 209,571 238,081 231,958 317,140 Sundry 26,669 24,816 24,813 87,187 Utilities 5,747 3,126 2,973 2,976 Maintenance 246,558 264,500 264,493 264,500 Capital Outlay - - -TOTAL 1,501,515 1,607,523 1,541,544 2,477,467 FY 2020-2021 ACTUAL EXPENDITURES FY 2021-2022 BUDGET APPROPRIATIONS FY 2021-2022 PROJECTED EXPENDITURES FY 2022-2023 BUDGET APPROPRIATIONS Salaries and Benefits 303,172 554,821 345,221 107,553 Supplies and Services 577,626 579,448 572,505 631,656 Sundry 33,526 33,835 32,551 28,820 Utilities 5,680 3,125 2,910 2,975 Maintenance 142,646 165,000 98,798 165,000 Capital Outlay - - -TOTAL 1,062,650 1,336,229 1,051,985 936,004 176
Transit System FUND (286)
other funds
POINT EXPENDITURES - TRANSIT ARRA
SERVICE POINT EXPENDITURES - GRANTS SERVICE POINT EXPENDITURES - TRANSIT PLANNING FY 2020-2021 ACTUAL EXPENDITURES FY 2021-2022 BUDGET APPROPRIATIONS FY 2021-2022 PROJECTED EXPENDITURES FY 2022-2023 BUDGET APPROPRIATIONS Salaries and Benefits - - -Supplies and Services - - -Sundry - - -Utilities - - -Maintenance - - -Capital Outlay 641,435 1,424,250 1,020,382 1,118,445 TOTAL 641,435 1,424,250 1,020,382 1,118,445 FY 2020-2021 ACTUAL EXPENDITURES FY 2021-2022 BUDGET APPROPRIATIONS FY 2021-2022 PROJECTED EXPENDITURES FY 2022-2023 BUDGET APPROPRIATIONS Salaries and Benefits 37,223 38,281 35,649 91,165 Supplies and Services 72,854 81,516 75,233 10,590 Sundry 51,517 - -Utilities 701 3,125 2,910 2,975 Maintenance - - -Capital Outlay - - -TOTAL 162,295 122,922 113,792 104,730 FY 2020-2021 ACTUAL EXPENDITURES FY 2021-2022 BUDGET APPROPRIATIONS FY 2021-2022 PROJECTED EXPENDITURES FY 2022-2023 BUDGET APPROPRIATIONS Salaries and Benefits 75,192 84,004 66,493 140,262 Supplies and Services 72,669 79,986 73,642 9,060 Sundry - 51,737 51,737 28,820 Utilities 5,525 3,126 - 2,976 Maintenance - - -Capital Outlay - - -TOTAL 153,386 218,853 191,872 181,118 177
CONT. SERVICE
FUNDS
Transit System FUND (286)
SERVICE POINT EMPLOYEES – TRANSIT
years
26) Transit Manager was eliminated due to contract management services with MCDT.
27) Transit Compliance Officer was eliminated due to contract management services with MCDT.
28) One Transit Development Specialist position added FY 20-21
29) Transit Compliance Officer added back FY 20-21, per Personnel Changes from Budget (requisition to add position to position control has not been sent in by the department as of February 2021)
30) Contract with MCDT, Transit Manager added back to budget FY 23
other funds
CONT. 1) Title changed from Transportations Operation Manager to Transportation Operations Coordinator during FY 2008-2009 2) One position reclassified to Dispatcher/Scheduler during FY 2007-2008 3) One position with 45% paid by Community Development, 23% paid by Housing and 7% paid by HOME 4) One position reclassified to Bus Driver during FY 2007-2008 5) Position frozen for FY 2009-2010 6) Administrative Assistant eliminated for FY 2011-2012 7) Five of 12 Full-time Bus Driver positions frozen for FY 2011-2012 and 2012-2013 7) & 9) Converted six PT SUB bus driver positions to 3 FT bus driver positions during FY 15-16 8) Senior Clerk position upgraded to Transit Manager FY 2010-2011 9) Added four additional Bus Driver positions during FY 2010-2011 10) Converted one FT custodian to two PT custodians FY 2011-2012 11) Transit Manager reclassified to Executive Director of MPO FY 2011-2012 12) Administrative Assistant unfrozen for FY 2012-2013, Scheduler/Dispatcher frozen for FY 2012-2013 13) One PT Custodian reclassified to PT Bus Driver FY 12-13 14) Financial Analyst moved to Finance FY 12-13 15) Two substitute drivers added during FY 13-14 16) Special Projects Manager reclassified to Transit Manager during FY 13-14 17) Executive Director of MPO moved to Planning and combined with Planning Director during FY 13-14 18) One Transit Dispatcher/ Scheduler unfrozen FY 14-15 19) Five Full-Time Bus Drivers unfrozen FY 14-15 20) One Treasury Manager position 75% paid by Finance FY 15-16 21) One Senior Bus Driver reclassified to Bus Driver FY 15-16 22) Treasury Manager salary split 75% Finance 25% Transit FY 16-17 23) Solid Waste Manager salary split 50%Transit 50%SW Administration FY 16-17 24) SW Manager salary no longer split 50/50, 100% paid by SW Admin FY 17-18 25) Administrative Assistant reclassified to Administrative Secretary FY 13-14 error located FY 17-18, not reflected in previous
REGULAR FULL TIME POSITIONS 2018-2019 2019-2020 2020-2021 2021-2022 2022-2023 8, 11, 16, 26, 30 ) Transit Manager - - - - 1 Transportation Operations Coordinator 1 1 1 1 1 31) Transit Assistant Manager - - - - 1 25) Administrative Secretary 1 1 1 1 1 7, 19) Bus Driver 16 16 16 16 16 12, 18) Transit Dispatcher/ Scheduler 1 1 1 1 1 Transit Supervisor 2 2 2 2 2 27) Transit Compliance Officer - - 1 1 1 28)Transit Development Specialist - - 1 1 1 21)Senior Bus Driver 4 4 4 4 4 23, 24)Solid Waste Manager - - - -22)Treasury Manager 0.25 0.25 0.25 0.25 0.25 TOTAL REGULAR FULL TIME 25.25 25.25 27.25 27.25 29.25 REGULAR PART TIME POSITIONS 2018-2019 2019-2020 2020-2021 2021-2022 2022-2023 10 & 13) Custodian 1 1 1 1 1 13) Bus Driver 1 1 1 1 1 TOTAL REGULAR PART TIME 2 2 2 2 2 SUBSTITUE POSITIONS 2018-2019 2019-2020 2020-2021 2021-2022 2022-2023 9,15) Bus Driver 6 6 6 6 6 TOTAL REGULAR PART TIME 6 6 6 6 6 GRAND TOTAL DEPARTMENT 33.25 33.25 35.25 35.25 37.25 178
Productivity Improvement FUND (639)
STATEMENT OF REVENUES, EXPENDITURES, AND CHANGES IN WORKING CAPITAL
Fiscal Year 2022-2023
other funds
ACTUALS 2020-2021 AMENDED BUDGET 2021-2022 PROJECTED 2021-2022 BUDGET 2022-2023 BEGINNING FUND BALANCE 2,101,646 2,562,120 2,562,120 2,448,253 TOTAL REVENUES 21,297 45,428 12,376 45,428 EXPENDITURES Services 53,128 2,500 46,313 202,500 Productivity Pay & Severance 56,496 950,551 50,000 500,000 Internal Audit 26,909 60,300 60,000 85,300 Strategic Planning 115,080 123,471 119,610 132,926 Lean Six Sigma/City U 229,210 456,649 350,320 469,184 TOTAL EXPENDITURES 480,823 1,593,471 626,243 1,389,910 Transfer In 920,000 550,000 500,000 550,000 General Fund (101) 250,000 250,000 250,000 250,000 Rainy Day Fund (235) - - -Utilities Fund (502) 420,000 250,000 250,000 250,000 Solid Waste Fund (560) 250,000 50,000 - 50,000 Airport Fund (524) - - -Storm Water (575) - - -Special Revenue Funds - - -Internal Service Funds - - -Transfer Out - - -ENDING FUND BALANCE 2,562,120 1,564,077 2,448,253 1,653,771 179
Productivity Improvement FUND (639)
other funds
SERVICE POINT EXPENDITURES - PRODUCTIVITY SERVICE POINT EXPENDITURES - INTERNAL AUDIT SERVICE POINT EXPENDITURES - STRATEGIC PLANNING SERVICE POINT EXPENDITURES - CITY UNIVERSITY FY 2020-2021 ACTUAL EXPENDITURES FY 2021-2022 BUDGET APPROPRIATIONS FY 2021-2022 PROJECTED EXPENDITURES FY 2022-2023 BUDGET APPROPRIATIONS Salaries and Benefits 1,461 - -Supplies and Services 53,128 65,675 46,313 202,500 Sundry 55,035 887,376 50,000 500,000 Utilities - - -Maintenance - - -Capital Outlay - - -TOTAL 109,624 953,051 96,313 702,500 FY 2020-2021 ACTUAL EXPENDITURES FY 2021-2022 BUDGET APPROPRIATIONS FY 2021-2022 PROJECTED EXPENDITURES FY 2022-2023 BUDGET APPROPRIATIONS Salaries and Benefits - - -Supplies and Services 26,909 60,300 60,000 85,300 Sundry - - -Utilities - - -Maintenance - - -Capital Outlay - - -TOTAL 26,909 60,300 60,000 85,300 FY 2020-2021 ACTUAL EXPENDITURES FY 2021-2022 BUDGET APPROPRIATIONS FY 2021-2022 PROJECTED EXPENDITURES FY 2022-2023 BUDGET APPROPRIATIONS Salaries and Benefits 94,534 92,485 92,709 102,969 Supplies and Services 893 11,280 7,195 13,050 Sundry 19,653 19,706 19,706 16,907 Utilities - - -Maintenance - - -Capital Outlay - - -TOTAL 115,080 123,471 119,610 132,926 FY 2020-2021 ACTUAL EXPENDITURES FY 2021-2022 BUDGET APPROPRIATIONS FY 2021-2022 PROJECTED EXPENDITURES FY 2022-2023 BUDGET APPROPRIATIONS Salaries and Benefits 63,481 143,465 128,100 162,710 Supplies and Services 27,777 124,558 91,602 121,494 Sundry 137,952 188,626 130,618 184,980 Utilities - - -Maintenance - - -Capital Outlay - - -TOTAL 229,210 456,649 350,320 469,184 180
Productivity Improvement FUND (639)
SERVICE POINT EMPLOYEES – PRODUCTIVITY
1) One position upgraded to Administrative Secretary during FY 2007-2008. Administrative Secretary transferred from Productivity Fund to General Fund during FY 2007-2008
2) Internal Auditor transferred from CMO FY 2010-2011
3) Clerical Specialist Moved to Human Resource FY 2011-2012
4) Grant Officer added FY 13-14 from FT Recreation Specialist (Parks)
5) Lean Sigma Master Black Belt reclassified to Director for Innovation during FY 13-14
6) Internal Auditor reclassified to Innovation Pipeline Manager FY 15-16
7) Grant Officer reclassified to Sr PR Marketing Specialist/Grantwriter FY 14-15
8) Sr PR Marketing Specialist/Grantwriter reclassified to Public Safety Public Information Officer FY 18-19 salary split 75% Productivity 25% Police
9) One Senior Secretary transferred from the PD & reclassified to Public Works Public Information Officer FY 18-19
10) Innovation Pipeline no longer a City department/position, eliminated FY 19-20
11) Manager for Innovation reclassified to Strategic Planning Coordinator FY 19-20
12) One Learning and Development Manager position created FY 20-21 (City University department)
other funds
REGULAR FULL TIME POSITIONS 2018-2019 2019-2020 2020-2021 2021-2022 2022-2023 12)Learning and Development Manager - - 1 1 1 10)Innovation Pipeline Manager 1 - - -8) SR PR Marketing Specialist/ Grantwriter - - - -Public Safety PIO 0.75 - - -9)Public Works PIO 1 - - -11)Strategic Planning Coordinator - 1 1 1 1 Manager for Innovation 1 - - -TOTAL REGULAR FULL TIME 3.75 1 2 2 2 181
Vehicle Equipment SERVICES
Service Point Focus
The Vehicle Services Department is charged with providing high quality, low cost vehicle maintenance services and asset management activities for all vehicles in the City’s fleet. This department is committed to quality and excellence in professional fleet management services and staff members are responsible for the following to meet the City’s needs:
• General maintenance for more than 600 fleet vehicles including police cars, fire trucks, service trucks and sedans;
• Maintaining an efficient equipment maintenance scheduling and tracking system;
• Auto parts inventory control management and services;
• Maintaining best practice policies and procedures to meet service goals;
• Maintaining a preventive maintenance program for service and inspections;
• Providing fleet utilization support to all departments;
• Maintaining vehicle records;
• Adhering to general safety regulations and environmental policies;
• Maintaining a diligent and proactive replacement and procurement program;
• Performing fleet facilities maintenance and upgrades as needed; Using computer systems technology;
• Pursuing staff continuing education and training goals;
• Pursuing vendor contracts when efficient;
• Applying alternative fuel programs;
• Maintaining hazardous material management; and, Fuel management program.
Accomplishments for 2020-2021
• Oakwood Complex Parking lot Phase one complete
• New City owned 8000-gallon fuel tanks installed and completed with fuel master dispenser
• All bulk Diesel and Unleaded tanks , including fuel tanks for generators are being electronically monitored and are automatically refilled
• New camera system is installed, and all cameras are operational.
Goals for 2022-2023
• Bid and build a fuel station in south Tyler to support the fleet growth in south Tyler. This will reduce fuel consumption and reduce fuel cost for offsite locations. It will also enable staff in south Tyler to be more efficient.
• Maintain all City of Tyler fleet vehicles and equipment to ensure safety of staff and the citizens of Tyler. This will also improve the efficiency of the employees of the City of Tyler by reducing downtime.
• By increasing the use of fleet telematics, Vehicle Services can reduce over all fuel consumption, maintenance cost, parts inventory and fleet inventory.
• By improving current computer technologies and getting a Fleet oriented software, Vehicle services can increase mechanic efficiencies by issuing tablets for each mechanic to use during their shift. This will allow for more efficient labor hours to be tracked and allow for diagnostic software to be utilized car side during a repair. Fleet software will also allow more accurate inventory usage and stock levels to be tracked.
• All of the above goals will help Vehicle Services to support a talented , experienced and highly engaged workforce.
• Install bulk oil dispensers in the light duty and the heavy side shops.
• Install another crane in the heavy shop to enable the shop to work on 2 units at a time where heavy lift support is needed.
other funds
182
Fleet Maintenance & Replacement FUND (640)
STATEMENT OF REVENUES, EXPENDITURES, AND CHANGES IN WORKING CAPITAL
SERVICE POINT EXPENDITURES - FLEET REPLACEMENT
other funds
Fiscal
ACTUALS 2020-2021 AMENDED BUDGET 2021-2022 PROJECTED 2021-2022 BUDGET 2022-2023 BEGINNING FUND BALANCE 6,913,828 6,654,485 6,654,485 5,484,548 REVENUES Interest Earnings 53,288 40,000 30,696 40,000 Amortization Charges 4,251,112 5,113,162 5,500,380 5,847,623 Service Fees 930,038 920,308 910,597 1,504,100 Fuel Revenue 1,879,793 2,286,640 2,854,793 4,308,095 Parts Revenue 3,379,666 3,427,089 3,324,755 4,700,655 Compressed Natural Gas 76,340 50,200 14,970 50,200 Miscellaneous Income 644 1,000 - 1,000 Sale of Equipment 160,800 300,000 640,946 300,000 Sale of Salvage 3,949 8,000 2,250 8,000 Health District 9,973 14,238 2,905 14,238 TOTAL REVENUES 480,823 1,593,471 626,243 1,389,910 EXPENDITURES Replacement 3,931,116 8,480,025 6,977,849 7,189,899 Maintenance 2,215,843 2,386,999 1,779,937 2,621,321 Health 10,099 14,261 12,926 12,705 Fuel, Parts and Contractual Services 4,782,541 5,301,239 5,616,169 6,820,496 Contingency - 79,500 - 200,000 TOTAL EXPENDITURES 10,939,599 16,262,024 14,386,881 16,844,421 Transfer Out (65,347) (65,347) (65,348) (100,000) Technology Fund (671) (65,347) (65,347) (65,348) (100,000) Productivity Fund (639) - - -ENDING FUND BALANCE 6,654,485 2,487,751 5,484,548 5,314,038
Year 2022-2023
FY 2020-2021 ACTUAL EXPENDITURES FY 2021-2022 BUDGET APPROPRIATIONS FY 2021-2022 PROJECTED EXPENDITURES FY 2022-2023 BUDGET APPROPRIATIONS Salaries and Benefits - - -Supplies and Services 2,391 - -Sundry - 79,500 - 200,000 Utilities - - -Maintenance - - -Capital Outlay 3,928,725 8,480,025 6,977,849 7,189,899 TOTAL 3,931,116 8,559,525 6,977,849 7,389,899 183
Fleet Maintenance & Replacement FUND (640) CONT.
SERVICE POINT EXPENDITURES - FLEET MAINTENANCE
SERVICE POINT EXPENDITURES - HEALTH DISTRICT
SERVICE POINT EXPENDITURES - COST OF GOODS SOLD
other funds
FY 2020-2021 ACTUAL EXPENDITURES FY 2021-2022 BUDGET APPROPRIATIONS FY 2021-2022 PROJECTED EXPENDITURES FY 2022-2023 BUDGET APPROPRIATIONS Salaries and Benefits 1,143,577 1,275,383 1,224,762 1,416,369 Supplies and Services 212,125 124,716 136,800 159,640 Sundry 99,297 37,516 102,651 40,760 Utilities 60,709 66,382 51,867 66,382 Maintenance 174,333 343,002 254,357 338,170 Capital Outlay 525,802 540,000 9,500 600,000 TOTAL 2,215,843 2,386,999 1,779,937 2,621,321 FY 2020-2021 ACTUAL EXPENDITURES FY 2021-2022 BUDGET APPROPRIATIONS FY 2021-2022 PROJECTED EXPENDITURES FY 2022-2023 BUDGET APPROPRIATIONS Salaries and Benefits - - -Supplies and Services 7,838 12,000 9,535 12,000 Sundry 2,261 2,261 3,391 705 Utilities - - -Maintenance - - -Capital Outlay - - -TOTAL 10,099 14,261 12,926 12,705 FY 2020-2021 ACTUAL EXPENDITURES FY 2021-2022 BUDGET APPROPRIATIONS FY 2021-2022 PROJECTED EXPENDITURES FY 2022-2023 BUDGET APPROPRIATIONS Salaries and Benefits - - -Supplies and Services 1,709 5,000 6,712 5,000 Sundry 4,780,832 5,296,239 5,609,457 6,815,496 Utilities - - -Maintenance - - -Capital Outlay - - -TOTAL 4,782,541 5,301,239 5,616,169 6,820,496 184
Fleet Maintenance & Replacement FUND (640) CONT.
SERVICE POINT EMPLOYEES – FLEET MAINTENANCE
12)
14)
16)
17) One Equipment Mechanic I added FY 20-21; position was originally an Equipment Servicer temp only position
other funds
1)
FY
to Mechanic Supervisor
one
to Mechanic Supervisor 4) When Pay Plan Adjustments were
Job title was
from Fleet Administrator to Vehicle Equipment Services manager Jan 2010 5) 1 Equipment Mechanic II
FY 12-1. *Employees in Equipment Mechanic I, Equipment Mechanic II, Equipment Servicer and Master Mechanic positions are on a Career Ladder program and may advance depending on their skill level. Note: prior budget book numbers off due to step system 6) One Equipment Mechanic II reclassified to Mechanic Supervisor FY 12-13 7) Senior Secretary reclassified to Purchasing Agent FY 12-13 8) Inventory Technician reclassified to Senior Secretary FY 13-14 9) Two Equipment Mechanic (I &II) positions added FY 14-15 10) Fleet Auditor reclassified to Fleet Services Coordinator FY2011 11) 1 Vehicle Services Manager added, reclassified from SW Residential Equip. Op #22 FY 16-17
One Inventory Technician reclassified to Fleet Auditor during
2007-2008 2) Changed title
3) Changed
position
made
changed
eliminated
One Equipment Mechanic II reclassified to Master Mechanic FY 17/18
13) Purchasing Technician reclassified to Fleet Auditor FY 17-18
One Equipment Mechanic I reclassified to Master Automotive Electrician FY 17-18
15) One Mechanic Supervisor reclassified to a Purchasing Technician FY 18-19
One Senior Secretary reclassified to Purchasing Tech FY 20-21
REGULAR FULL TIME POSITIONS 2018-2019 2019-2020 2020-2021 2021-2022 2022-2023 11) Vehicle Services Manager 1 1 1 1 1 15) Mechanic Supervisor 2 2 2 2 2 9, 14, 17) Equipment Mechanic I 1 1 2 2 2 6, 12) Equipment Mechanic II 1 1 1 1 1 10)Fleet Auditor 1 1 1 1 1 3) Master Mechanic 5 5 5 5 5 Master Automotive Electrician 1 1 1 1 1 13) Purchasing Technician 1 1 2 2 2 8, 16) Senior Secretary 1 1 - -7) Purchasing Agent 1 1 1 1 1 TOTAL REGULAR FULL TIME 15 15 16 16 16 185
Risk FUND (650)
STATEMENT OF REVENUES, EXPENDITURES, AND CHANGES IN WORKING CAPITAL
Fiscal Year 2022-2023
SERVICE POINT EXPENDITURES - CLAIMS
other funds
ACTUALS 2020-2021 AMENDED BUDGET 2021-2022 PROJECTED 2021-2022 BUDGET 2022-2023 Reserved for Workers Comp. $498,506 $333,305 $333,305 $56,193 Reserved Property/Liability 166,169 111,102 111,102 18,731 BEGINNING FUND BALANCE / WORKING CAPITAL 664,675 444,407 444,407 74,924 REVENUES Distributed Interest 13,618 35,642 6,768 20,000 Special Event Policy 700 7,600 1,500 12,500 Unemployment / Disability Premiums 109,830 109,744 113,621 109,744 Property and Liability Premiums 1,605,432 1,574,063 1,576,950 1,789,040 Workers Comp Premiums 739,933 773,291 773,292 1,902,054 ARPA Reimbursement - - 121,624TOTAL REVENUES 2,469,513 2,500,340 2,593,755 3,833,338 EXPENDITURES Employee Cost 255,947 287,566 288,559 152,461 Unemployment / Disability 178,591 322,457 205,100 224,486 Property and Liability 1,196,760 1,464,035 1,287,113 1,586,286 Workers Comp 1,058,483 708,059 1,182,466 1,167,438 Contingency - 197,564 - 250,000 TOTAL EXPENDITURES 2,689,781 2,979,681 2,963,238 3,380,671 Transfer Out - - -Productivity Fund (639) - - -Reserved for Workers Comp. 333,305 (26,201) 56,193 395,693 Reserved Property/Liability 111,102 (8,734) 18,731 131,898 ENDING FUND BALANCE / WORKING CAPITAL $444,407 $(34,934) $74,924 $527,591
FY 2020-2021 ACTUAL EXPENDITURES FY 2021-2022 BUDGET APPROPRIATIONS FY 2021-2022 PROJECTED EXPENDITURES FY 2022-2023 BUDGET APPROPRIATIONS Salaries and Benefits 240,362 265,852 277,691 130,591 Supplies and Services 2,440,111 2,506,786 2,686,916 2,990,645 Sundry 9,308 207,043 9,480 259,435 Utilities - - -Maintenance - - -Capital Outlay - - -TOTAL 2,689,781 2,979,681 2,974,087 3,380,671 186
Risk FUND (650)
SERVICE POINT EMPLOYEES – RISK
1) Data Management position transferred from Police Department to Risk and title changed to Loss Control Technician during FY 2009-2010
2) 25% of HR Director moved from CMO FY 2010/2011
3) Risk Analyst downgraded to Legal/Risk/City Clerk Secretary FY 2009-2010
4) Legal/Risk/City Clerk Secretary moved to Legal FY 2010-2011
5) Support Services Technician I moved from Legal to Risk FY 2010-2011
6) Assistant City Attorney moved from Risk to Legal FY 2011-2012 & 2012-2013
7) Human Resource Director reclassified to Managing Director of Administration FY 2011-2012
7) Managing Director of Administration 60% paid by HR FY 15-16
8) HR/Risk Specialist transferred to HR/Risk from Finance as Senior Benefit Specialist FY 12-13
9) Risk Analyst PT (Loss Tech) reclassified to Risk Manager FY 14-15
10) Risk Tech added FY 14-15 (position transferred from Library to HR/Risk)
11) Managing Director of Administrative Services reclassified to Director of Organizational Development FY 20-21 salary split 60% HR & 40% Risk
other funds
CONT.
REGULAR FULL TIME POSITIONS 2018-2019 2019-2020 2020-2021 2021-2022 2022-2023 7,11) Managing Director of Administration 0.4 0.4 - -Risk Tech 1 1 1 1 1 TOTAL REGULAR FULL TIME 1.4 1.4 1 1 1 REGULAR PART TIME POSITIONS 2018-2019 2019-2020 2020-2021 2021-2022 2022-2023 9)Risk Manager 1 1 1 1 1 TOTAL REGULAR PART TIME 1 1 1 1 1 GRAND TOTAL DEPARTMENT 2.4 2.4 2 2 2 187
Employee Benefits FUND (661)
STATEMENT OF REVENUES, EXPENDITURES, AND CHANGES IN WORKING CAPITAL
Fiscal Year 2022-2023
other funds
ACTUALS 2020-2021 AMENDED BUDGET 2021-2022 PROJECTED 2021-2022 BUDGET 2022-2023 BEGINNING FUND BALANCE $5,616,656 $3,820,104 $3,820,104 $2,147,143 REVENUES Health Benefits 8,603,978 10,889,396 11,084,774 14,455,504 Dental Benefits 405,415 418,167 411,838 409,568 Life Insurance 169,726 163,380 188,065 181,172 Other Benefits 575,598 505,949 881,497 824,949 Interest Earnings 36,152 36,617 11,131 28,794 ARPA Funds - - 1,102,802TOTAL REVENUES 9,790,869 12,013,509 13,680,107 15,899,987 EXPENDITURES Health Benefits 10,768,572 11,085,408 14,037,871 14,554,046 Dental Benefits 402,517 422,316 454,164 486,227 Life Insurance 187,802 175,287 155,303 175,287 Other Benefits 23,932 24,225 442,989 24,949 Affordable Care Act 3,639 5,299 5,298 5,683 Special Services 54,397 70,000 69,998 70,000 Travel and Training - 964 963 1,260 Benefit Analyst 78,847 230,009 102,770 158,698 Vision Insurance 67,715 - 83,712 90,728 TOTAL EXPENDITURES 11,587,421 12,013,508 15,353,068 15,566,878 Transfer In - - -(Transfer Out) - - -ENDING FUND BALANCE $3,820,104 $3,820,105 $2,147,143 $2,480,252 188
Employee Benefits FUND (661)
STATEMENT OF REVENUES
STATEMENT OF EXPENDITURES
other funds
CONT.
ACTUALS 2020-2021 AMENDED BUDGET 2021-2022 PROJECTED 2021-2022 BUDGET 2022-2023 Interest Earnings $36,152 $36,617 $11,131 $28,794 Employee Assistance Program 5,949 5,949 5,949 24,949 Section 125 Forfeiture - - -Health Benefits Paid by City 6,552,968 8,775,533 8,775,534 12,078,354 Health Benefits paid by employee 2,051,010 2,113,863 2,309,240 2,377,150 COBRA Premiums 6,926 - 547Dental Benefits paid by employees 273,220 281,321 274,990 275,048 Dental Benefits paid by City 132,195 136,846 136,848 134,520 Life Insurance Premiums paid by City 15,955 16,491 16,492 7,672 Life Insurance Premiums paid by employees 153,771 146,889 171,573 173,500 Miscellaneous IncomeRebates 399,725 350,000 400,000 600,000 Stop loss Reimbursement 162,998 150,000 475,001 200,000 ARPA Funds - - 1,102,802TOTAL REVENUES $9,790,869 $12,013,509 $13,680,107 $15,899,987 ACTUALS 2020-2021 AMENDED BUDGET 2021-2022 PROJECTED 2021-2022 BUDGET 2022-2023 Benefit Analyst $78,847 $230,009 $102,770 $158,698 Life Insurance Premiums 187,802 175,287 155,303 175,287 Affordable Care Act 3,639 5,299 5,298 5,683 Special Services 54,397 70,000 69,998 70,000 Travel and Training - 964 963 1,260 Employee Assistance Program Fees 23,932 24,225 18,168 24,949 HSA Contribution - - - 75,000 Health Claim Payments 7,334,553 7,412,533 10,105,291 10,320,877 Rx Claims 2,562,222 2,645,307 2,973,571 3,061,249 Dental Administrative Fees 19,038 21,087 20,522 21,087 Dental Claim 383,479 401,229 433,642 465,140 Health Admin Fees 496,472 391,227 367,960 391,227 Health Stop loss 375,325 636,341 591,049 705,693 Vision Insurance 67,715 - 83,712 90,728 Premium Rebate - - 424,821TOTAL EXPENDITURES $11,587,421 $12,013,508 $15,353,068 $15,566,878
Fiscal Year 2022-2023
Fiscal Year 2022-2023 189
Retiree Benefits BENEFIT FUND (761)
STATEMENT OF REVENUES, EXPENDITURES, AND CHANGES IN WORKING CAPITAL
STATEMENT OF REVENUES
other funds
Fiscal Year 2022-2023 ACTUALS 2020-2021 AMENDED BUDGET 2021-2022 PROJECTED 2021-2022 BUDGET 2022-2023 BEGINNING FUND BALANCE/RESERVED FOR COMMITMENTS $78,915 $78,916 $78,916 $78,916 REVENUES Health Benefits 2,459,993 2,863,178 2,637,978 2,871,923 Dental Benefits 84,956 87,426 65,716 71,150 Interest Earnings - 2,442 - 2,486 TOTAL REVENUES 2,544,949 2,953,046 2,703,694 2,945,559 EXPENDITURES Health Benefits 2,273,958 2,752,903 2,404,301 2,645,291 Dental Benefits 160,608 171,253 178,194 179,479 Life Insurance 34,159 46,170 26,605 36,571 Special Services 40,451 44,308 44,308 30,000 Benefit Analyst 34,216 101,851 49,818 68,014 Affordable Care Act 1,556 469 468 558 TOTAL EXPENDITURES 2,544,948 3,116,954 2,703,694 2,959,913 Transfer In - - -(Transfer Out) - - -ENDING FUND BALANCE $78,916 $(84,992) $78,916 $64,562
Fiscal Year 2022-2023 ACTUALS 2020-2021 AMENDED BUDGET 2021-2022 PROJECTED 2021-2022 BUDGET 2022-2023 Interest Earnings $- $2,442 $- $2,486 Retiree Health Premium 325,014 248,842 265,635 285,098 Retiree Medicare Supplemental Ins Premiums 431,659 419,167 357,878 397,397 Retiree Dental Premium 84,956 87,426 65,716 71,150 PARS Trust Fund Reimbursement 1,703,320 2,195,169 2,014,465 2,189,428 TOTAL REVENUES $2,544,949 $2,953,046 $2,703,694 $2,945,559 190
Retiree Benefits BENEFIT FUND (761)
STATEMENT OF EXPENDITURES
Fiscal Year 2022-2023
Property & Facilities MANAGEMENT
Provide reliable and cost effective repair and maintenance services to all City Departments as scheduled or requested. Facilities management functions include HVAC (heating, ventilation, and airconditioning), roof maintenance, and many various repair, maintenance or contract items as required and mail/ courier services City Wide. The Property & Facility Supervisor provides oversight for facilities, personnel, vendors, and contractors who provide these services and support for building projects.
Accomplishments for 2021-2022
• Renewed City Wide ADA Door Maintenance Contract
• Successful Annual City Wide HVAC Maintenance Program
• Successful Annual City Wide Roof Maintenance Program
Goals for 2022-2023
• Renew Downtown Campus Janitorial Contract
• Renew City Wide Pest Control Contract
• Renew City Wide HVAC Closed Loop Water Treatment Contract
• Implement Annual City Wide HVAC Maintenance Program
• Implement Annual City Wide Roof Maintenance Program
• Install new roof on Library Building.
other funds
CONT. ACTUALS 2020-2021 AMENDED BUDGET 2021-2022 PROJECTED 2021-2022 BUDGET 2022-2023 Life Insurance $34,159 $46,170 $26,605 $36,571 Benefit Analyst 34,216 101,851 49,818 68,014 Special Services 40,451 44,308 44,308 30,000 Medicare Supplement 869,423 934,912 948,783 963,959 Health Claim Payments 956,604 1,293,694 926,672 944,609 Rx Claims 331,531 364,093 389,971 439,537 Dental Administrative Fees 10,318 10,329 10,452 10,329 Dental Claim 150,290 160,924 167,742 169,150 Health Admin Fees 79,544 91,740 71,759 91,740 Health Stop loss 36,856 68,464 67,116 205,446 Affordable Care Act 1,556 469 468 558 TOTAL EXPENDITURES $2,544,948 $3,116,954 $2,703,694 $2,959,913
191
Property & Facilities MANAGEMENT FUND
(663)
STATEMENT OF REVENUES, EXPENDITURES, AND CHANGES IN WORKING CAPITAL
other funds
Fiscal Year 2022-2023 ACTUALS 2020-2021 AMENDED BUDGET 2021-2022 PROJECTED 2021-2022 BUDGET 2022-2023 Roof Replacement Reserve $351,876 $433,565 $433,565 $304,905 Tourism Roof Replacement & HVAC 542,026 567,022 567,022 592,022 Unreserved Fund Balance 273,973 171,166 171,166 299,156 BEGINNING FUND BALANCE / WORKING CAPITAL 1,167,875 1,171,753 1,171,753 1,196,083 REVENUES Miscellaneous Rental Income 18,000 18,000 18,000 18,000 Miscellaneous Income 93,849 - -Interest Earnings 8,976 6,000 6,757 6,000 Roof Maintenance 67,844 63,914 78,914 78,065 Roof Replacement 174,150 179,285 179,285 205,834 HVAC Maintenance 279,143 239,690 239,690 304,406 TOTAL REVENUES 641,962 506,889 522,646 612,305 EXPENDITURES Employee Costs 217,085 172,185 169,084 189,068 Property and Facility Maintenance 164,745 185,103 182,965 205,599 Health District 5,254 9,200 5,988 9,200 HVAC Maintenance 195,198 209,015 216,915 304,406 HVAC Replacement 123,101 265,975 64,114 75,000 Roof Maintenance 88,216 110,014 62,866 78,065 Roof Replacement 72,089 323,577 323,993 509,677 TOTAL EXPENDITURES 865,688 1,275,069 1,025,925 1,371,015 Transfer In 227,604 527,611 527,609 227,611 General Fund (101) 101,304 401,305 401,305 101,305 Hotel Tax Fund (211) 24,996 25,000 25,000 25,000 Water Utilities Fund (502) 50,652 50,653 50,652 50,653 Solid Waste Fund (560) 50,652 50,653 50,652 50,653 PEG Fund (236) - - -(Transfer Out) - - -Productivity Fund (639) - - -Roof Replacement Reserve 433,565 385,366 304,905 1,062 Tourism Roof Replacement & HVAC 567,022 592,022 592,022 617,022 Unreserved Fund Balance 171,166 (46,204) 299,156 46,900 ENDING FUND BALANCE / WORKING CAPITAL $1,171,753 $931,184 $1,196,083 $664,984 192
Property & Facilities MANAGEMENT FUND (663)
other funds
SERVICE POINT EXPENDITURES - GENERAL SERVICES SERVICE POINT EXPENDITURES - HEALTH DISTRICT SERVICE POINT EXPENDITURESHVAC MAINTENANCE & REPLACEMENT FY 2020-2021 ACTUAL EXPENDITURES FY 2021-2022 BUDGET APPROPRIATIONS FY 2021-2022 PROJECTED EXPENDITURES FY 2022-2023 BUDGET APPROPRIATIONS Salaries and Benefits 216,414 172,185 169,084 188,668 Supplies and Services 56,930 64,701 55,824 80,025 Sundry 17,496 18,118 18,118 38,750 Utilities - - -Maintenance 90,319 102,284 109,023 86,824 Capital Outlay - - -TOTAL 381,159 357,288 352,049 394,267 FY 2020-2021 ACTUAL EXPENDITURES FY 2021-2022 BUDGET APPROPRIATIONS FY 2021-2022 PROJECTED EXPENDITURES FY 2022-2023 BUDGET APPROPRIATIONS Salaries and Benefits - - -Supplies and Services - - -Sundry - - -Utilities - - -Maintenance 5,254 9,200 5,988 9,200 Capital Outlay - - -TOTAL 5,254 9,200 5,988 9,200 FY 2020-2021 ACTUAL EXPENDITURES FY 2021-2022 BUDGET APPROPRIATIONS FY 2021-2022 PROJECTED EXPENDITURES FY 2022-2023 BUDGET APPROPRIATIONS Salaries and Benefits - - -Supplies and Services - - -Sundry - - -Utilities - - -Maintenance 250,020 209,015 216,915 304,406 Capital Outlay 123,101 265,975 64,114 75,000 TOTAL 373,121 474,990 281,029 379,406 193
CONT.
Property & Facilities MANAGEMENT FUND
other funds
SERVICE POINT EXPENDITURES - ROOF MAINTENANCE FY 2020-2021 ACTUAL EXPENDITURES FY 2021-2022 BUDGET APPROPRIATIONS FY 2021-2022 PROJECTED EXPENDITURES FY 2022-2023 BUDGET APPROPRIATIONS Salaries and Benefits - - -Supplies and Services - - -Sundry - - -Utilities - - -Maintenance - - -Capital Outlay 106,154 433,591 386,859 588,142 TOTAL 106,154 433,591 386,859 588,142 SERVICE POINT EMPLOYEES – FACILITIES REGULAR FULL TIME POSITIONS 2018-2019 2019-2020 2020-2021 2021-2022 2022-2023 6) City Engineer - - - -Building Services Technician 1 1 1 1 1 Building Service Supervisor 1 1 1 1 1 TOTAL REGULAR FULL TIME 2 2 2 2 2 1) Position transferred from Engineering during FY 2008-2009 2) Title changed from Survey Crew Member to City Courier during FY 2009-2010 3) Position upgraded to Building Service Supervisor 4) A/C Mechanic frozen FY 2010-2011 and 20112012 (unfunded) 5) A/C Mechanic transferred to Fire in FY 20112012 for Full-Time Lean Sigma Black Belt 6) City Engineer 75% paid by Engineering FY 2015-2016 7) Capital Improvements Project Manager reclassified to City Engineer FY 17-18; 100% of salary paid by Engineering 194
(663) CONT.
Technology FUND (671)
STATEMENT OF REVENUES, EXPENDITURES, AND CHANGES IN WORKING CAPITAL
Fiscal Year 2022-2023
SERVICE POINT EXPENDITURES - IT ADMINISTRATION
other funds
ACTUALS 2020-2021 AMENDED BUDGET 2021-2022 PROJECTED 2021-2022 BUDGET 2022-2023 BEGINNING FUND BALANCE 1,078,634 1,684,455 1,684,455 1,528,902 REVENUES Rental Income 30,275 30,275 30,275 30,275 Interest Earning 11,856 12,000 7,617 6,000 Technology Charges 4,957,827 4,984,388 4,984,298 5,105,787 Miscellaneous Income 221,000 215,000 216,728 187,768 TOTAL REVENUES 5,220,958 5,241,663 5,238,918 5,329,830 EXPENDITURES Administration 1,321,958 1,663,802 1,613,788 1,718,757 Technology Costs 4,290,526 5,095,796 4,803,030 5,313,439 Contingency - - -TOTAL EXPENDITURES 5,612,484 6,759,598 6,416,818 7,032,196 Transfer In 997,347 1,022,347 1,022,347 1,307,000 General Fund (101) 300,000 300,000 300,000 450,000 Water Utilities Fund (502) 300,000 400,000 400,000 450,000 Solid Waste Fund (560) 275,000 200,000 200,000 250,000 Tourism & Convention Fund (219) 20,000 20,000 20,000 20,000 Airport Operating Fund (524) 37,000 37,000 37,000 37,000 Fleet Maintenance & Replacement Fund (640) 65,347 65,347 65,347 100,000 Transfer Out - - -Productivity Fund (639) - - -ENDING FUND BALANCE 1,684,455 1,188,867 1,528,902 1,133,536
FY 2020-2021 ACTUAL EXPENDITURES FY 2021-2022 BUDGET APPROPRIATIONS FY 2021-2022 PROJECTED EXPENDITURES FY 2022-2023 BUDGET APPROPRIATIONS Salaries and Benefits 1,282,870 1,614,041 1,564,762 1,666,728 Supplies and Services 27,937 40,122 39,387 42,485 Sundry 450 450 450 450 Utilities 159 150 150 150 Maintenance 10,542 9,039 9,039 8,944 Capital Outlay - - -TOTAL 1,321,958 1,663,802 1,613,788 1,718,757 195
Technology FUND (671)
other funds
CONT.
POINT EXPENDITURES
FY 2020-2021 ACTUAL EXPENDITURES FY 2021-2022 BUDGET APPROPRIATIONS FY 2021-2022 PROJECTED EXPENDITURES FY 2022-2023 BUDGET APPROPRIATIONS Salaries and Benefits - - -Supplies and Services 1,694,049 1,942,189 1,865,000 2,147,593 Sundry - - -Utilities 118,069 202,616 190,000 202,616 Maintenance 2,478,408 2,950,991 2,748,030 2,963,230 Capital Outlay - - -TOTAL 4,290,526 5,095,796 4,803,030 5,313,439 SERVICE POINT EMPLOYEES – IT REGULAR FULL TIME POSITIONS 2018-2019 2019-2020 2020-2021 2021-2022 2022-2023 Chief Information Officer 1 1 1 1 1 4)Administrative Assistant - - - -10) IT Specialist I - - - 1 1 5)IT Specialist II 1 1 1 1 1 7)Advanced IT Specialist II 3 3 3 3 3 IT Specialist III - - - -IT Support Specialist I 1 1 1 1 1 1, 2, 3, 6) Advanced IT Specialist III 3 3 3 3 3 2, 8) IT Specialist IV 3 3 2 2 2 3, 6) Advanced IT Specialist III Supervisor* - - - -IT Specialist IV Supervisor 1 1 2 2 2 TOTAL REGULAR FULL TIME 13 13 13 14 14 REGULAR PART TIME POSITIONS 2018-2019 2019-2020 2020-2021 2021-2022 2022-2023 9) IT Help Desk Technician - - 1 -TOTAL REGULAR PART TIME - - 1 -GRAND TOTAL DEPARTMENT 0 0 14 14 15 *Employees
Specialist
2007-2008 1) Senior Clerk position transferred from Human Resource to create Advanced IT Specialist III for launch of Share Point 2) 1 Advanced IT Specialist III upgraded to IT Specialist IV during FY 2010-2011 * 1 Advanced IT Specialist III Supervisor acting as full-time Lean Sigma Black Belt 3) 2 Advanced IT Specialist III’s changed to Advanced IT Specialist III Supervisor FY 12-13 4) Administrative Assistant reclassified to IT Support Specialist I FY 15-16 5) IT Specialist II reclassified to IT Specialist IV FY 14-15 6) Advanced IT Specialist III Supervisor reclassified to Advanced IT Specialist III FY 14-15 7) One new Advanced IT Specialist II added FY 17/18 Error located FY 17-18 IT Specialist IV Supervisor not reflected from FY14-15 8) One IT Specialist IV added FY 18-19 9) One IT Help Desk Technician added FY 20-21 10) One IT Help Desk Technician converted from part-time to full time FY 21-22 196
SERVICE
- COMPUTER SERVICES
in IT
I through Advanced IT Specialist III positions are on a Career Ladder program and may advance depending on their skill level. Career Ladder implemented during FY
Debt Service COMBINED
Combined DEBT SERVICES
GO Bond Program Summary
As of Oct. 1, 2022 the City has no outstanding general obligation tax supported debt.
Maximum Debt Limit
The City of Tyler Charter limits the bonded debt to 10 percent of assessed value. Accordingly, the City’s tax margin for the year ended Sept. 30, 2022 was:
Bond Rating for Tax Debt
The following is the City’s Bond rating for the current tax supported debt.
Revenue Bond Program Summary
As of October 1, 2021, the City of Tyler had a total bonded debt of $142,680,000 comprised of bonds secured by water and sewer revenues $133,060,000, airport customer facility revenue $550,000, and hotel bond revenue $9,070,000.
Bond Rating for Revenue Debt
The following is the City’s bond rating for the current revenue supported debt for water and sewer.
combined debt service
Total Assessed Value $10,948,828,831 Debit Limit 1,094,882,883 Amount of debt
General Obligation
Less:
Net Bonded Debt:Moody’s Aa2 Standard and Poor’s AAA Moody’s Aa2 Standard and Poor’s AAA Standard and Poor’s (Senior lien debt) AAA2 198
Applicable to Debit Limit:
bonded Debt
Debit Service Fund Balance
Customer Facility Charge REVENUE
HOT Debt Service FUND (302)
STATEMENT OF REVENUES, EXPENDITURES, AND CHANGES IN WORKING CAPITAL
combined debt service
BONDS
SERIES 2013 Fiscal Year 2022-2023 YEAR ENDING SEPT. 30 INTEREST MAR. 1 INTEREST SEPT. 1 PRINCIPAL SEPT. 1 TOTAL PRIN.& INT. BOND BALANCE 2023 10,340 10,340 85,000 105,680 $465,000 2024 8,742 8,742 85,000 102,484 380,000 2025 7,144 7,144 90,000 104,288 290,000 2026 5,452 5,452 95,000 105,904 195,000 2027 3,666 3,666 95,000 102,332 100,000 2028 1,880 1,880 100,000 103,760TOTAL $37,224 $37,224 $550,000 $624,448
Fiscal Year 2022-2023 ACTUALS 2020-2021 AMENDED BUDGET 2021-2022 PROJECTED 2021-2022 BUDGET 2022-2023 BEGINNING FUND BALANCE - 2,437 2,437 2,437 REVENUES Interest Earnings 1 - -TOTAL REVENUES 1 - -EXPENDITURES Interest Payments - - 464,088 362,800 Principal Payments - - 130,000 230,000 TOTAL EXPENDITURES - - 594,088 592,800 Transfer In 2,436 594,088 594,088 592,800 HOT Series 2021 Fund (402) 2,436 - -Hotel Tax Fund (211) - 594,088 594,088 592,800 ENDING FUND BALANCE 2,437 596,525 2,437 2,437 199
Hotel Occupancy Tax REVENUE BONDS
SERIES 2021
Fiscal Year 2022-2023
combined debt service
YEAR ENDING SEPT. 30 INTEREST MAR. 1 INTEREST SEPT. 1 PRINCIPAL SEPT. 1 TOTAL PRIN.& INT. BOND BALANCE 2023 181,400 181,400 230,000 592,800 8,840,000 2024 176,800 176,800 240,000 593,600 8,600,000 2025 172,000 172,000 250,000 594,000 8,350,000 2026 167,000 167,000 260,000 594,000 8,090,000 2027 161,800 161,800 270,000 593,600 7,820,000 2028 156,400 156,400 285,000 597,800 7,535,000 2029 150,700 150,700 295,000 596,400 7,240,000 2030 144,800 144,800 305,000 594,600 6,935,000 2031 138,700 138,700 320,000 597,400 6,615,000 2032 132,300 132,300 330,000 594,600 6,285,000 2033 125,700 125,700 345,000 596,400 5,940,000 2034 118,800 118,800 360,000 597,600 5,580,000 2035 111,600 111,600 370,000 593,200 5,210,000 2036 104,200 104,200 385,000 593,400 4,825,000 2037 96,500 96,500 400,000 593,000 4,425,000 2038 88,500 88,500 420,000 597,000 4,005,000 2039 80,100 80,100 435,000 595,200 3,570,000 2040 71,400 71,400 450,000 592,800 3,120,000 2041 62,400 62,400 470,000 594,800 2,650,000 2042 53,000 53,000 490,000 596,000 2,160,000 2043 43,200 43,200 510,000 596,400 1,650,000 2044 33,000 33,000 530,000 596,000 1,120,000 2045 22,400 22,400 550,000 594,800 570,000 2046 11,400 11,400 570,000 592,800TOTAL $2,604,100 $2,604,100 $9,070,000 $14,278,200 200
Utilities Debt Service FUND (504)
STATEMENT OF REVENUES, EXPENDITURES, AND CHANGES IN WORKING CAPITAL
combined debt service
Fiscal Year 2022-2023 ACTUALS 2020-2021 AMENDED BUDGET 2021-2022 PROJECTED 2021-2022 BUDGET 2022-2023 BEGINNING FUND BALANCE 1,057,300 1,536,263 1,536,263 994,690 REVENUES Interest Earnings 23,574 25,000 16,228 25,000 Miscellaneous Income 1,427 - -Regulatory Compliance Fee 2,627,452 3,552,840 3,605,850 5,743,141 TOTAL REVENUES 2,652,453 3,577,840 3,622,078 5,768,141 EXPENDITURES Series 2012 Interest 20,606 18,206 18,206 15,806 Series 2012 Principal 120,000 120,000 120,000 125,000 Series 2015 A Interest 270,250 263,200 263,200 255,850 Series 2015 A Principal 235,000 245,000 245,000 255,000 Series 2015 B Interest 601,300 564,450 564,450 509,250 Series 2015 B Principal 1,340,000 1,380,000 1,380,000 1,435,000 Series 2017A Interest 109,250 101,750 101,750 94,100 Series 2017A Principal 250,000 255,000 255,000 265,000 Series 2017B Interest 250,925 250,925 250,925 250,925 Series 2017B Principal - - -Series 2018A Interest 302,600 292,700 292,700 282,500 Series 2018A Principal 330,000 340,000 340,000 350,000 Series 2018B Interest 223,200 198,150 198,150 172,350 Series 2018B Principal 835,000 860,000 860,000 885,000 Series 2019 Interest 645,569 642,403 626,069 605,569 Series 2019 Principal 390,000 490,000 410,000 430,000 Series 2020 Interest 128,082 123,950 123,950 111,050 Series 2020 Principal - 645,000 645,000 695,000 Series 2021 Interest - 916,654 916,654 712,663 Series 2021 Principal - 355,000 355,000 560,000 Series 2022 Interest - - 716,345 1,329,300 Series 2022 Principal - - - 830,000 Fiscal Agent Fees/Special Services 6,880 15,000 9,250 15,000 TOTAL EXPENDITURES 6,058,662 8,077,388 8,691,649 10,184,363 Transfer In 3,885,172 4,517,431 4,527,998 4,558,482 Water Utilities Fund (502) 3,885,172 4,517,431 4,527,998 4,558,482 Transfer In - - -Water Utilities Fund (502) - - -ENDING FUND BALANCE 1,536,263 1,554,146 994,690 1,136,950 201
Utilities Debt Reserve FUND (505)
STATEMENT OF REVENUES, EXPENDITURES, AND CHANGES IN WORKING CAPITAL
combined debt service
Fiscal Year 2022-2023 ACTUALS 2020-2021 AMENDED BUDGET 2021-2022 PROJECTED 2021-2022 BUDGET 2022-2023 Debt Service Reserve 786,725 786,725 786,725 786,725 Unreserved Fund Balance 24,655 28,188 28,188 31,639 BEGINNING FUND BALANCE 811,380 814,913 814,913 818,364 REVENUES Interest Earnings 7,187 15,837 3,451 15,837 TOTAL REVENUES 7,187 15,837 3,451 15,837 EXPENDITURES Special Services - - -TOTAL EXPENDITURES - - -Transfer In - - -Transfer Out (3,654) - -Water Utilities Fund (502) - - -Utilities Capital Fund (503) (3,654) - -Debt Service Reserve 786,725 786,725 786,725 786,725 Unreserved Fund Balance 28,188 44,025 31,639 47,476 ENDING FUND BALANCE 814,913 830,750 818,364 834,201 202
Water & Sewer Revenue DEBT RETIREMENT DATA
FY 2023 - 2052 ALL SERIES
combined debt service
All Series YEAR ENDING SEPT. 30 INTEREST MAR. 1 INTEREST SEPT. 1 PRINCIPAL SEPT. 1 TOTAL PRIN.& INT. BOND BALANCE 2023 2,169,681 2,169,681 5,830,000 10,169,363 127,230,000 2024 2,063,756 2,063,756 6,030,000 10,157,513 121,200,000 2025 1,953,156 1,953,156 6,260,000 10,166,313 114,940,000 2026 1,832,866 1,832,866 6,500,000 10,165,731 108,440,000 2027 1,694,628 1,694,628 6,760,000 10,149,256 101,680,000 2028 1,559,703 1,559,703 6,890,000 10,009,406 94,790,000 2029 1,417,303 1,417,303 6,525,000 9,359,606 88,265,000 2030 1,278,203 1,278,203 6,840,000 9,396,406 81,425,000 2031 1,148,341 1,148,341 5,010,000 7,306,681 76,415,000 2032 1,058,391 1,058,391 5,195,000 7,311,781 71,220,000 2033 974,466 974,466 4,980,000 6,928,931 66,240,000 2034 906,216 906,216 5,085,000 6,897,431 61,155,000 2035 836,491 836,491 3,750,000 5,422,981 57,405,000 2036 780,266 780,266 3,465,000 5,025,531 53,940,000 2037 730,241 730,241 3,565,000 5,025,481 50,375,000 2038 678,666 678,666 3,675,000 5,032,331 46,700,000 2039 625,416 625,416 3,180,000 4,430,831 43,520,000 2040 584,403 584,403 3,265,000 4,433,806 40,255,000 2041 541,794 541,794 3,285,000 4,368,588 36,970,000 2042 497,569 497,569 3,290,000 4,285,138 33,680,000 2043 454,869 454,869 3,370,000 4,279,738 30,310,000 2044 411,106 411,106 3,455,000 4,277,213 26,855,000 2045 363,963 363,963 3,555,000 4,282,925 23,300,000 2046 315,428 315,428 3,645,000 4,275,856 19,655,000 2047 265,631 265,631 3,750,000 4,281,263 15,905,000 2048 213,656 213,656 3,850,000 4,277,313 12,055,000 2049 160,275 160,275 3,940,000 4,260,550 8,115,000 2050 105,544 105,544 3,045,000 3,256,088 5,070,000 2051 66,663 66,663 3,120,000 3,253,325 1,950,000 2052 26,813 26,813 1,950,000 2,003,625TOTAL $25,715,500 $25,715,500 $133,060,000 $184,491,000 203
Water & Sewer Revenue BONDS
SERIES 2012
Water & Sewer Revenue REFUNDING BONDS
SERIES 2015A
SERIES 2015B
combined debt service
YEAR ENDING SEPT. 30 INTEREST MAR. 1 INTEREST SEPT. 1 PRINCIPAL SEPT. 1 TOTAL PRIN.& INT. BOND BALANCE 2023 7,903 7,903 125,000 140,806 545,000 2024 6,653 6,653 130,000 143,306 415,000 2025 5,191 5,191 135,000 145,381 280,000 2026 3,588 3,588 140,000 147,175 140,000 2027 1,838 1,838 140,000 143,675TOTAL $25,172 $25,172 $670,000 $720,344 YEAR ENDING SEPT. 30 INTEREST MAR. 1 INTEREST SEPT. 1 PRINCIPAL SEPT. 1 TOTAL PRIN.& INT. BOND BALANCE 2023 127,925 127,925 255,000 510,850 6,340,000 2024 124,100 124,100 255,000 503,200 6,085,000 2025 119,638 119,638 265,000 504,275 5,820,000 2026 115,000 115,000 275,000 505,000 5,545,000 2027 110,188 110,188 285,000 505,375 5,260,000 2028 105,200 105,200 295,000 505,400 4,965,000 2029 99,300 99,300 850,000 1,048,600 4,115,000 2030 82,300 82,300 2,325,000 2,489,600 1,790,000 2031 35,800 35,800 330,000 401,600 1,460,000 2032 29,200 29,200 345,000 403,400 1,115,000 2033 22,300 22,300 360,000 404,600 755,000 2034 15,100 15,100 370,000 400,200 385,000 2035 7,700 7,700 385,000 400,400TOTAL $993,750 $993,750 $6,595,000 $8,582,500 YEAR ENDING SEPT. 30 INTEREST MAR. 1 INTEREST SEPT. 1 PRINCIPAL SEPT. 1 TOTAL PRIN.& INT. BOND BALANCE 2023 254,625 254,625 1,435,000 1,944,250 9,505,000 2024 225,925 225,925 1,490,000 1,941,850 8,015,000 2025 196,125 196,125 1,555,000 1,947,250 6,460,000 2026 157,250 157,250 1,630,000 1,944,500 4,830,000 2027 116,500 116,500 1,710,000 1,943,000 3,120,000 2028 78,000 78,000 1,790,000 1,946,000 1,330,000 2029 33,250 33,250 1,330,000 1,396,500TOTAL $1,061,675 $1,061,675 $10,940,000 $13,063,350 204
Water & Sewer REVENUE BONDS
SERIES 2017A
SERIES 2017B
combined debt service
YEAR ENDING SEPT. 30 INTEREST MAR. 1 INTEREST SEPT. 1 PRINCIPAL SEPT. 1 TOTAL PRIN.& INT. BOND BALANCE 2023 47,050 47,050 265,000 359,100 2,680,000 2024 43,075 43,075 270,000 356,150 2,410,000 2025 39,025 39,025 275,000 353,050 2,135,000 2026 34,900 34,900 285,000 354,800 1,850,000 2027 29,200 29,200 290,000 348,400 1,560,000 2028 23,400 23,400 295,000 341,800 1,265,000 2029 18,975 18,975 305,000 342,950 960,000 2030 14,400 14,400 310,000 338,800 650,000 2031 9,750 9,750 320,000 339,500 330,000 2032 4,950 4,950 330,000 339,900TOTAL $264,725 $264,725 $2,945,000 $3,474,450 YEAR ENDING SEPT. 30 INTEREST MAR. 1 INTEREST SEPT. 1 PRINCIPAL SEPT. 1 TOTAL PRIN.& INT. BOND BALANCE 2023 125,463 125,463 - 250,925 7,950,000 2024 125,463 125,463 - 250,925 7,950,000 2025 125,463 125,463 - 250,925 7,950,000 2026 125,463 125,463 - 250,925 7,950,000 2027 125,463 125,463 - 250,925 7,950,000 2028 125,463 125,463 - 250,925 7,950,000 2029 125,463 125,463 1,220,000 1,470,925 6,730,000 2030 104,113 104,113 1,265,000 1,473,225 5,465,000 2031 81,975 81,975 1,305,000 1,468,950 4,160,000 2032 62,400 62,400 1,345,000 1,469,800 2,815,000 2033 42,225 42,225 1,385,000 1,469,450 1,430,000 2034 21,450 21,450 1,430,000 1,472,900TOTAL $1,190,400 $1,190,400 $7,950,000 $10,330,800 205
Water & Sewer REVENUE BONDS CONT.
SERIES 2018A
SERIES 2018B
combined debt service
YEAR ENDING SEPT. 30 INTEREST MAR. 1 INTEREST SEPT. 1 PRINCIPAL SEPT. 1 TOTAL PRIN.& INT. BOND BALANCE 2023 141,250 141,250 350,000 632,500 6,890,000 2024 136,000 136,000 360,000 632,000 6,530,000 2025 130,600 130,600 370,000 631,200 6,160,000 2026 123,200 123,200 385,000 631,400 5,775,000 2027 115,500 115,500 400,000 631,000 5,375,000 2028 107,500 107,500 420,000 635,000 4,955,000 2029 99,100 99,100 435,000 633,200 4,520,000 2030 90,400 90,400 450,000 630,800 4,070,000 2031 81,400 81,400 470,000 632,800 3,600,000 2032 72,000 72,000 490,000 634,000 3,110,000 2033 62,200 62,200 470,000 594,400 2,640,000 2034 52,800 52,800 485,000 590,600 2,155,000 2035 43,100 43,100 505,000 591,200 1,650,000 2036 33,000 33,000 525,000 591,000 1,125,000 2037 22,500 22,500 550,000 595,000 575,000 2038 11,500 11,500 575,000 598,000TOTAL $1,322,050 $1,322,050 $7,240,000 $9,286,100 YEAR ENDING SEPT. 30 INTEREST MAR. 1 INTEREST SEPT. 1 PRINCIPAL SEPT. 1 TOTAL PRIN.& INT. BOND BALANCE 2023 86,175 86,175 885,000 1,057,350 4,860,000 2024 72,900 72,900 915,000 1,060,800 3,945,000 2025 59,175 59,175 945,000 1,063,350 3,000,000 2026 45,000 45,000 970,000 1,060,000 2,030,000 2027 30,450 30,450 1,000,000 1,060,900 1,030,000 2028 15,450 15,450 1,030,000 1,060,900TOTAL $309,150 $309,150 $5,745,000 $6,363,300 206
Water & Sewer REVENUE BONDS CONT.
SERIES 2019
SERIES 2020
combined debt service
YEAR ENDING SEPT. 30 INTEREST MAR. 1 INTEREST SEPT. 1 PRINCIPAL SEPT. 1 TOTAL PRIN.& INT. BOND BALANCE 2023 302,784 302,784 430,000 1,035,569 18,255,000 2024 292,034 292,034 450,000 1,034,069 17,805,000 2025 280,784 280,784 475,000 1,036,569 17,330,000 2026 268,909 268,909 495,000 1,032,819 16,835,000 2027 256,534 256,534 520,000 1,033,069 16,315,000 2028 243,534 243,534 545,000 1,032,069 15,770,000 2029 229,909 229,909 575,000 1,034,819 15,195,000 2030 215,534 215,534 605,000 1,036,069 14,590,000 2031 209,484 209,484 615,000 1,033,969 13,975,000 2032 203,334 203,334 630,000 1,036,669 13,345,000 2033 193,884 193,884 645,000 1,032,769 12,700,000 2034 184,209 184,209 635,000 1,003,419 12,065,000 2035 174,684 174,684 655,000 1,004,369 11,410,000 2036 164,859 164,859 675,000 1,004,719 10,735,000 2037 154,734 154,734 695,000 1,004,469 10,040,000 2038 144,309 144,309 715,000 1,003,619 9,325,000 2039 133,584 133,584 735,000 1,002,169 8,590,000 2040 124,397 124,397 755,000 1,003,794 7,835,000 2041 114,488 114,488 775,000 1,003,975 7,060,000 2042 102,863 102,863 800,000 1,005,725 6,260,000 2043 92,363 92,363 820,000 1,004,725 5,440,000 2044 81,600 81,600 840,000 1,003,200 4,600,000 2045 69,000 69,000 865,000 1,003,000 3,735,000 2046 56,025 56,025 890,000 1,002,050 2,845,000 2047 42,675 42,675 920,000 1,005,350 1,925,000 2048 28,875 28,875 945,000 1,002,750 980,000 2049 14,700 14,700 980,000 1,009,400TOTAL $4,380,094 $4,380,094 $18,685,000 $27,445,188
YEAR ENDING SEPT. 30 INTEREST MAR. 1 INTEREST SEPT. 1 PRINCIPAL SEPT. 1 TOTAL PRIN.& INT. BOND BALANCE 2023 55,525 55,525 695,000 806,050 3,715,000 2024 48,575 48,575 710,000 807,150 3,005,000 2025 41,475 41,475 720,000 802,950 2,285,000 2026 34,275 34,275 740,000 808,550 1,545,000 2027 23,175 23,175 760,000 806,350 785,000 2028 11,775 11,775 785,000 808,550TOTAL $214,800 $214,800 $4,410,000 $4,839,600 207
Water & Sewer REVENUE BONDS CONT.
SERIES 2021
combined debt service
YEAR ENDING SEPT. 30 INTEREST MAR. 1 INTEREST SEPT. 1 PRINCIPAL SEPT. 1 TOTAL PRIN.& INT. BOND BALANCE 2023 356,331 356,331 560,000 1,272,663 25,960,000 2024 345,131 345,131 580,000 1,270,263 25,380,000 2025 333,531 333,531 605,000 1,272,063 24,775,000 2026 321,431 321,431 630,000 1,272,863 24,145,000 2027 305,681 305,681 660,000 1,271,363 23,485,000 2028 289,181 289,181 695,000 1,273,363 22,790,000 2029 271,806 271,806 730,000 1,273,613 22,060,000 2030 253,556 253,556 765,000 1,272,113 21,295,000 2031 234,431 234,431 805,000 1,273,863 20,490,000 2032 214,306 214,306 845,000 1,273,613 19,645,000 2033 205,856 205,856 860,000 1,271,713 18,785,000 2034 197,256 197,256 880,000 1,274,513 17,905,000 2035 188,456 188,456 895,000 1,271,913 17,010,000 2036 179,506 179,506 915,000 1,274,013 16,095,000 2037 170,356 170,356 930,000 1,270,713 15,165,000 2038 161,056 161,056 950,000 1,272,113 14,215,000 2039 151,556 151,556 970,000 1,273,113 13,245,000 2040 141,856 141,856 990,000 1,273,713 12,255,000 2041 131,956 131,956 1,010,000 1,273,913 11,245,000 2042 121,856 121,856 1,030,000 1,273,713 10,215,000 2043 111,556 111,556 1,050,000 1,273,113 9,165,000 2044 101,056 101,056 1,070,000 1,272,113 8,095,000 2045 89,688 89,688 1,095,000 1,274,375 7,000,000 2046 78,053 78,053 1,115,000 1,271,106 5,885,000 2047 66,206 66,206 1,140,000 1,272,413 4,745,000 2048 53,381 53,381 1,165,000 1,271,763 3,580,000 2049 40,275 40,275 1,165,000 1,245,550 2,415,000 2050 27,169 27,169 1,195,000 1,249,338 1,220,000 2051 13,725 13,725 1,220,000 1,247,450TOTAL $5,156,209 $5,156,209 $26,520,000 $36,832,419 208
Water & Sewer REVENUE BONDS CONT.
SERIES 2022
combined debt service
YEAR ENDING SEPT. 30 INTEREST MAR. 1 INTEREST SEPT. 1 PRINCIPAL SEPT. 1 TOTAL PRIN.& INT. BOND BALANCE 2023 664,650 664,650 830,000 2,159,300 40,530,000 2024 643,900 643,900 870,000 2,157,800 39,660,000 2025 622,150 622,150 915,000 2,159,300 38,745,000 2026 603,850 603,850 950,000 2,157,700 37,795,000 2027 580,100 580,100 995,000 2,155,200 36,800,000 2028 560,200 560,200 1,035,000 2,155,400 35,765,000 2029 539,500 539,500 1,080,000 2,159,000 34,685,000 2030 517,900 517,900 1,120,000 2,155,800 33,565,000 2031 495,500 495,500 1,165,000 2,156,000 32,400,000 2032 472,200 472,200 1,210,000 2,154,400 31,190,000 2033 448,000 448,000 1,260,000 2,156,000 29,930,000 2034 435,400 435,400 1,285,000 2,155,800 28,645,000 2035 422,550 422,550 1,310,000 2,155,100 27,335,000 2036 402,900 402,900 1,350,000 2,155,800 25,985,000 2037 382,650 382,650 1,390,000 2,155,300 24,595,000 2038 361,800 361,800 1,435,000 2,158,600 23,160,000 2039 340,275 340,275 1,475,000 2,155,550 21,685,000 2040 318,150 318,150 1,520,000 2,156,300 20,165,000 2041 295,350 295,350 1,500,000 2,090,700 18,665,000 2042 272,850 272,850 1,460,000 2,005,700 17,205,000 2043 250,950 250,950 1,500,000 2,001,900 15,705,000 2044 228,450 228,450 1,545,000 2,001,900 14,160,000 2045 205,275 205,275 1,595,000 2,005,550 12,565,000 2046 181,350 181,350 1,640,000 2,002,700 10,925,000 2047 156,750 156,750 1,690,000 2,003,500 9,235,000 2048 131,400 131,400 1,740,000 2,002,800 7,495,000 2049 105,300 105,300 1,795,000 2,005,600 5,700,000 2050 78,375 78,375 1,850,000 2,006,750 3,850,000 2051 52,938 52,938 1,900,000 2,005,875 1,950,000 2052 26,813 26,813 1,950,000 2,003,625TOTAL $10,797,475 $10,797,475 $41,360,000 $60,951,325 209
Documents ADOPTING

Adopting ORDINANCES
ORDINANCE NO. O-2022-85
AN ORDINANCE OF THE CITY COUNCIL OF THE CITY OF TYLER, TEXAS, ADOPTING THE BUDGET FOR THE CITY OF TYLER, TEXAS, FOR THE FISCAL YEAR BEGINNING OCTOBER 1, 2022, AND ENDING SEPTEMBER 30, 2023; AMENDING THE FISCAL YEAR 2021-2022 BUDGET; AND AUTHORIZING THE CITY MANAGER TO EXECUTE OUTSIDE CONTRACTS FOR FISCAL YEAR 2022-2023; PROVIDING A SEVERABILITY CLAUSE; AND ESTABLISHING AN EFFECTIVE DATE.
WHEREAS, pursuant to the laws of the State of Texas and the Charter and City Code of the City of Tyler, the City Manager of Tyler prepared a budget covering proposed expenditures for the next fiscal year and caused the same to be published as required by law; and
WHEREAS, the 2022-2023 budget will raise more total property taxes than last year’s budget by $2,038,668.00 which is a 7.54% increase from last year’s budget, and of that amount $462,604.00 is tax revenue to be raised from new property added to the tax roll this year; and
WHEREAS, a public hearing was held by the City Council of the City of Tyler, Texas, on said
COMBINED STATEMENT
proposed budget and tax rate on August 24,2022 and September 14, 2022 after compliance with all notice requirements and at which time said budget was fully considered, and interested taxpayers were heard; and
WHEREAS, City Council affirms its policy of seeking to maintain a minimum operating reserve (net of transfers and capital expenditures) equal to 15% of the budgeted expenditures for the General Operating Fund, Water Utilities Operating Fund, and the Solid Waste Operating Fund; and
WHEREAS, City Council affirms the budget and financial policies that have been approved by ordinances and administrative actions;
NOW, THEREFORE, BE IT ORDAINED BY THE CITY COUNCIL OF THE CITY OF TYLER, TEXAS:
PART 1. That the budget summary below originally proposed by the City Manager is hereby approved and appropriated as the Official Annual Budget(s) covering the City of Tyler for and during the fiscal year beginning October 1, 2022 and ending September 30, 2023, and expenditures by said City for and during such time shall be on the basis of said budget.
adopting documents
FUND BALANCE REVENUES EXPENDITURES (TRANSFERS OUT) BALANCE 101 General 18,237,434 86,810,085 83,408,918 (3,401,167) 18,237,434 102 General Capital Projects 2,656,728 9,000 2,386,161 93,811 373,378 103 Street Improvements 236,353 1,394 2,029,801 1,829,862 37,808 202 Development Services 1,243,343 2,679,350 2,629,063 - 1,293,630 204 Cemeteries Operating 18,108 185,869 470,870 315,000 48,107 205 Police Forfeitures 283,981 63,233 177,000 - 170,214 206 Park Improvement Fund 168,416 675,385 662,000 - 181,801 207 Court Special Fees 11,544 501,019 485,821 - 26,742 208 Economic Development Fund 359,253 1,500 208,750 275,000 427,003 211 Hotel Occupancy Tax 2,133,912 4,303,062 1,080,900 132,200 5,488,274 217 TIF/TIRZ # 4 67,991 102,666 - - 170,657 218 TIF/TIRZ # 3 741,960 128,371 5,000 - 865,331 219 Tourism and Convention 343,422 967,900 3,166,096 2,480,000 625,226 234 Passenger Facility 221,167 152,000 - (72,000) 301,167 235 Rainy Day Fund 8,290,145 115,000 100,000 - 8,305,145 236 PEG Fee 1,156,578 244,168 316,116 - 1,084,630 211
Adopting ORDINANCES
COMBINED STATEMENT CONT.
adopting documents
FUND BALANCE REVENUES EXPENDITURES (TRANSFERS OUT) BALANCE 274 Homeownership and Housing 429 14 - - 443 276 Housing Assistance 866,209 9,688,763 10,156,974 - 397,998 285 MPO - 831,823 831,823 -286 Transit System 150,398 4,417,764 4,817,764 400,000 150,398 294 Community Development Grant 86,889 814,475 804,475 - 96,889 295 Home Grant 18,335 1,076,168 1,076,168 - 18,335 302 HOT Debt Service Fund 2,437 - 592,800 592,800 2,437 502 Utilities Operations 15,265,188 51,251,413 39,217,358 (10,984,134) 16,315,109 503 Utilities Construction 5,001,704 5,962,090 15,630,488 5,500,000 833,306 504 Utilities Debt Service 994,690 5,768,141 10,184,363 4,558,482 1,136,950 505 Utilities Debt Reserve 818,364 15,837 - - 834,201 524 Airport 939,099 1,907,222 1,949,613 2,525 899,233 560 Solid Waste 2,311,378 17,276,578 15,874,822 (1,175,653) 2,537,481 562 Solid Waste Capital 320,969 5,000 860,000 725,000 190,969 575 Storm Water 1,810,302 2,249,908 2,919,073 - 1,141,137 639 Productivity 2,448,253 45,428 1,389,910 550,000 1,653,771 640 Fleet Maintenance/ Replacement 5,484,548 16,773,911 16,844,421 (100,000) 5,314,038 650 Property and Liability 74,924 3,833,338 3,380,671 - 527,591 661 Active Employees Benefits 2,147,143 15,899,987 15,566,878 - 2,480,252 663 Facilities Maintenance 1,181,083 612,305 1,371,015 227,611 649,984 671 Technology 1,528,902 5,329,830 7,032,196 1,307,000 1,133,536 713 Cemeteries Trust 3,254,963 124,600 - (15,000) 3,364,563 761 Retired Employees Benefits 78,916 2,945,559 2,959,913 - 64,562
CONT.
212
Adopting ORDINANCES
ORDINANCE NO. O-2022-85 CONT.
PART 2. The City Manager is authorized to execute contracts and make payments to the following list of entities in the amounts shown; subject to final contract negotiation regarding terms and conditions:
PART 3. That the fiscal year 2020-2021 budgets for General, General Capital, Tourism, Airport, Solid Waste, Solid Waste Capital, and Property and Facilities funds will be amended to include the following budget changes:
adopting documents
CONT.
ACCOUNT AGENCY FUNDING AMOUNT 101-0112-412.05-20 East Texas Council of Governments $14,535 101-0112-412.05-37 Center for Healthy Living $66,500 101-0112-412.05-82 Innovation Pipeline $80,000 101-0112-412.06-52 NETPHD (Health District) $200,000 208-0110-412.06-49 TEDC $100,000 208-0110-412.06-49 Tyler Metro Chamber $25,000 208-0110-412.06-49 Hispanic Business Alliance $25,000 208-0110-412.06-49 Business Education Council $15,000 211-0180-419.05-30 Sport Tyler $25,000 211-0180-419.06-18 Texas Rose Festival $10,000 211-0180-419.06-38 Discovery Place $32,400 211-0180-419.06-44 East Texas Symphony Orchestra $50,000 211-0180-419.06-45 Tyler Museum of Art $35,000 211-0180-419.06-46 County Historical Museum $13,500 211-0180-419.06-49 Visitors & Convention Bureau $691,500 211-0180-419.06-68 McClendon House $4,500 ACCOUNT NUMBER FUND ACCOUNT NAME CURRENT BUDGET CHANGE REVISED BUDGET 101-0118-412.81-02 101 Transfer to Fund 102 343.811 2,238,189 2,582,000 101-0118-421.82-04 101 Transfer to Fund 204 100,000 100,000 200,000 101-0118-421.86-63 101 Transfer to Fund 663 101,305 300,000 401,305 102-0000-399.91-01 102 Transfer from Fund 101 343,811 2,238,189 2,582,000 202-0515-463.04-08 202 Special Services 54,900 140,000 194,900 204-0000-399.91-01 204 Transfer from Fund 101 100,000 100,000 200,000 663-0000-399.91-01 663 Transfer from Fund 101 101,305 300,000 401,305 213
ORDINANCE NO. O-2022-85 CONT.
PART 4. That any ordinance, resolution, policy or any provision or section of the Code of the City of Tyler, Texas, as amended, and in conflict herewith, be and the same is hereby repealed to the extent of any conflict.
PART 5: Should any section, subsection, sentence, provision, clause or phrase be held to be invalid for any reason, such holding shall not render invalid any other section, subsection, sentence, provision, clause or phrase of this ordinance and same are deemed severable for this purpose.
PART 6: This ordinance shall become effective upon approval.
PASSED AND APPROVED this the 14th day of September, A.D., 2022.
DON WARREN, MAYOR OF THE CITY OF TYLER, TEXAS
ATTEST: APPROVED:
CASSANDRA BRAGER, CITY CLERK
DEBORAH G. PULLUM, CITY ATTORNEY
adopting documents
Adopting ORDINANCES CONT.
214
Adopting ORDINANCES
ORDINANCE NO. O-2022-86
THE ASSESSMENT ROLL AND FIXING THE AD VALOREM TAX RATE FOR THE CITY OF TYLER, TEXAS, FOR FISCAL YEAR 2022-2023, AND PROVIDING FOR THE ASSESSMENT AND COLLECTION THERE OF AND FOR A LIEN ON REAL AND PERSONAL PROPERTY TO SECURE PAYMENT OF AD VALOREM TAXES; PROVIDING FOR EXEMPTIONS; PROVIDING A SEVERABILITY CLAUSE; AND ESTABLISHING AN EFFECTIVE DATE.
BE IT ORDAINED BY THE CITY COUNCIL OF THE CITY OF TYLER, TEXAS:
PART 1. The assessment roll for 2022 for the City of Tyler as compiled by Smith County Appraisal District and as amended by the Appraisal Review Board is hereby approved and adopted.
PART 2: That there be and there is hereby levied and ordered collected the sum of $0.269900 ad valorem tax on each One Hundred Dollar ($100) valuation of all taxable property, real, personal and mixed, within the corporate limits of the City of Tyler, Texas, on January 1st of this year, for the following purposes and the following amounts:
- GENERAL FUND MAINTENANCE AND OPERATIONS $ 0.261850
- TOTAL TAX RATE PER $100.00
- VALUATIONS FOR ALL PURPOSES
PART 3: That there be, and are hereby again set out, authorized exemptions as follows:
1. Homestead exemption under 65 - Ten percent (10%) or no less than $5,000.
2. Homestead exemption over 65 - $6,000.
3. Historical Preservation exemptions as set out in Tyler City Code Sections 10-793 and 10-794.
PART 4: Said ad valorem taxes shall be due and payable at the time and in the manner provided by the Tyler City Code, Chapter 2, relating to the payment of ad valorem taxes which said ordinances provide for penalties and interest on delinquent taxes.
PART 5: That notice for the public hearings on the proposed budget, property tax rate, and tax revenue increase, on the 24th day of August 2022 and on the 14th day of September 2022, were given by publication on the 13th day of August, 2022 and the 3rd day of September 2022.
PART 6: THIS TAX RATE WILL RAISE MORE TAXES FOR MAINTENANCE AND OPERATIONS THAN LAST YEAR’S TAX RATE. THE TAX RATE WILL EFFECTIVELY BE RAISED BY 6.96% PERCENT AND WILL RAISE TAXES FOR MAINTENANCE AND OPERATIONS ON A $100,000 HOME BY APPROXIMATELY $17.04.
PART 7: That any ordinance, resolution, policy or any provision or section of the Code of the City of Tyler, Texas, as amended, and in conflict herewith, be and the same is hereby repealed to the extent of any conflict.
PART 8: Should any section, subsection, sentence, provision, clause or phrase be held to be invalid for any reason, such holding shall not render invalid any other section, subsection, sentence, provision, clause or phrase of this ordinance and same are deemed severable for this purpose.
PART 9: This ordinance shall become effective upon its approval.
PASSED AND APPROVED this the 14th day of September, A.D., 2022.
adopting documents
CONT.
215
DON WARREN, MAYOR OF THE CITY OF TYLER, TEXAS ATTEST: APPROVED: CASSANDRA
BRAGER, CITY CLERK DEBORAH G. PULLUM, CITY ATTORNEY
Glossary

City of Tyler GLOSSARY
AAccounts Payable – A liability account reflecting amount of open accounts owing to private persons or organizations for goods and services received by a government (but not including amounts due to other funds of the same government or to other governments).
Accounts Receivable – An asset account reflecting amounts owing to open accounts from private persons or organizations for goods or services furnished by a government.
Accrual Accounting –
Recognition of the financial effects of transactions, events and circumstances in the period(s) when they occur regardless of when the cash is received or paid.
Ad Valorem – Latin for “value of.” Refers to the tax assessed against real (land and building) and personal (equipment and furniture) property.
ADA – Americans with Disability Act
Amortization – Payment of principal plus interest over a fixed period of time.
Appropriation – A legal authorization granted by a legislative body (City Council) to make expenditures and incur obligation for designated purposes.
ARFF – Airport Rescue Firefighters
Assessed Valuation – A valuation set upon real estate or other property by a government as a basis for levying taxes.
BBalance Sheet – The basic financial statement, which discloses the assets, liabilities and equities of an entity at a specific date in conformity with Generally Accepted Accounting Principles (GAAP).
Balanced Budget – Annual financial plan in which expenses do not exceed revenues and carry-over fund balance.
BAS – Boundary and Annexation Survey
Bond – A written promise to pay a specified sum of money, called the face value or principal amount, at a specified date or dates in the future, called the maturity date(s).
Budget – A plan of financial operation embodying an estimate of proposed expenditures for any given period and the proposed means of financing them.
CCapital Outlays – Expenditures which result in the acquisition of or addition to fixed assets which are individually priced at more than $3,000 and have an expected life longer than two years.
CAFR – City’s Comprehensive Annual Financial Report
CCNS – Certificates of Convenience and Necessity
CDARS – Certificate of Deposit Account Registry Service
CDBG – Community Development Block Grant
CHDO – Community Housing Development Organizations
CIP – Construction in Progress
COBRA – Consolidated Omnibus Budget Reconciliation Act
COPS – Community Oriented Policing Services
Cost – The amount of money or other consideration exchanged for property or services. Costs may be incurred even before the money is paid; that is, as soon as liability is incurred. Ultimately, however, money or other consideration must be given in exchange.
Current Assets – Those assets which are available or can be made readily available to finance current operations or to pay current liabilities. Those assets which will be used up or converted into cash within one year. Some examples are cash, temporary investments and taxes receivable which will be collected within one year.
Current Liabilities – Debt or other legal obligations arising out of transactions in the past which must be liquidated, renewed, or refunded within one year.
DDADS – Texas Department of Aging and Disability Services
DEA – Drug Enforcement Administration Debt Service/Lease – A cost category which typically reflects the repayment of short-term (less than five years) debt associated with the acquisition of capital equipment. This category also includes department contribution to the Capital Replacement Fund.
glossary
217
City of Tyler GLOSSARY
Delinquent Taxes – Taxes remaining unpaid on or after the date on which a penalty for nonpayment is attached.
Depreciation – Change in the value of assets (equipment, buildings, etc. with a useful life of two years or more) due to use of the assets with the exception of land and intangible assets.
DFIRM – Digital Flood Insurance Rate Map
Encumbrances –Commitments related to unperformed contracts for goods and services used in budgeting. Encumbrances are not expenditures or liabilities, but represent the estimated amount of expenditures ultimately to result if unperformed contracts in process are completed. Encumbrances lapse at year end unless the associated budget is re-appropriated by Council in the following fiscal year.
EPA – Environmental Protection Agency.
ETATTF – East Texas Auto Theft Task Force
ETJ – Extra Territorial Jurisdiction
Exempt – Personnel not eligible to receive overtime pay and who are expected to put in whatever hours are necessary to complete their job assignments. Compensatory time-off, as partial compensation for overtime hours worked, may be allowed by the respective department head.
Expenditures – Decreases in net financial resources.
Expenditures include current
operating expenses which require the current or future use of net current assets, debt service, and capital outlays.
FAA – Federal Aviation Administration
FDIC – Federal Deposit Insurance Corporation
FINRA – Proof of Financial Industry Regulatory Authority
Fiscal Year – A 12-month period to which the annual operating budget applies and at the end of which the government determines its financial position and the results of its operations. The City of Tyler’s fiscal year begins October 1 and the ends the following September 30.
FMPC – Financial Management Performance Criteria
FTE – Acronym for Full-Time Equivalent, a measurement of staffing. One FTE is a 40-hours per week position. A part-time position working 20 hours per week or a temporary full-time position working six months would be one-half a FTE.
Fixed Assets – Assets of a long-term character, which are intended to continue to be held or used, such as land, buildings, improvements other than buildings, machinery and equipment and assets of an intangible nature such as water rights.
Franchise – A special privilege granted by a government permitting the continuing use of public property, such as City streets, and usually involving the elements of monopoly and regulation.
FSS – Family Self Sufficiency
Fund – A fiscal and accounting entity with a selfbalancing set of accounts recording cash and other financial resources, together with all related liabilities and residual equities of balances, and charges therein, which are segregated for the purpose of carrying on specific activities or attaining certain objectives in accordance with special regulations, restrictions or limitations.
Fund Balance – The difference between governmental fund assets and liabilities, also referred to as fund equity.
G
GAAP – Generally Accepted Accounting Principles
GASB – Acronym for Government Accounting Standards Board, an independent, non-profit agency responsible for the promulgation of accounting and financial reporting procedures for governmental entities. General Obligation Bonds
– Bonds for the payment of which the full faith and credit of the issuing government is pledged. In issuing its general obligation bonds, the City of Tyler pledges to levy whatever property tax is needed to repay the bonds for a particular year. Bonds cannot be issued without voter approval and are usually issued with maturities of between 15 and 30 years.
GFOA – Government Finance Officers Association
GFOAT – Governmental Finance Officers Association of Texas
E
F
glossary 218
City of Tyler GLOSSARY
GIS – Geographical Information System
Governmental Funds – Those funds through which most governmental functions typically are financed. The acquisition, use, and financial resources and the related current liabilities of the governmental functions are accounted for through governmental funds (General, Special Revenue, Capital Projects, Permanent and Debt Service Funds).
GTOT – Government Treasurer’s Organization of Texas
HIP – Housing Infill Program
HAPP – Housing Assistance Payments Program
HQS – Housing Quality Standards
HVAC – Heating Ventilation and Air Conditioning
IGI – Industry Growth Initiative
IVR – Interactive Voice Response
M&O – Maintenance and Operations
Maintenance – The upkeep of physical properties in condition for use of occupancy. Examples are the inspection of equipment to detect defects and the making of repairs.
Maintenance Item – A request for additional funding to maintain the upkeep of a physical property.
MPO – Metropolitan Planning
Organization
MUD – Municipal Utility Districts
Modified Accrual Accounting – Accounting system in which revenues are recognized and recorded in the accounts when they are measurable, available and collectible in the fiscal year.
NEW – Neighborhood Empowerment Works
Non-Exempt – Personnel eligible to receive overtime pay when overtime work has been authorized or requested by the supervisor.
NTCOG – North Central Texas Council of Governments
Ordinance – A formal legislative enactment by the governing body of a municipality. If it is not in conflict with any higher form of law, such as a state statute or constitutional provision, it has the full force and effect of law within the boundaries of the municipality to which it applies. The difference between an ordinance and a resolution is that the latter requires less legal formality and has a lower legal status. Revenue raising measures, such as the imposition of taxes, special assessments and service charges, usually require ordinances.
PFIA – Police and Firemen’s Insurance Association
PFIA – Public Funds Investment Act
PPE – Personal Protective Equipment
PSO – Public Service Officer
Revenues – Funds received for services rendered, fines assessed, taxes levied and interest/rental income earned from private and public sources.
RFP – Request for Proposal
SCBA – Self Contained Breathing Apparatus
Special Revenue Fund – A fund used to account for the proceeds of specific revenue sources that are legally restricted to expenditures for specified purposes.
Supplies – A cost category for minor items (individually priced at less than $3,000) required by departments to conduct their operations.
SWAT – Special Weapons and Tactics
PEG – Public Education and Government Access Channel
Personnel Services – The costs associated with compensating employees for their labor.
Taxes – Compulsory charges levied by a government for the purpose of financing services performed for the common benefit. This term does not include specific charges made against particular persons or property for current or permanent benefits such as special assessment. Neither does the term include charges for services rendered only to those paying such charges as, for example, sewer service charges.
H
I
M
N
O
P
R
S
T
glossary 219
City of Tyler GLOSSARY
TBRA – Tenant Based Rental Assistance
TCEQ – Acronym for Texas Commission on Environmental Quality. A State agency for enforcing federal and state environmental laws.
TCMA – Texas City Management Association
TIF/TIRZ – Tax Increment Financing Zone
TML – Texas Municipal League
TxDOT – Acronym for Texas Department of Transportation, a State agency responsible for administering City of Tyler transportation related grants.
UNT – The University Of North Texas
WWorking Capital – The amount of current assets which exceeds current liabilities less inventory and special reserves in particular funds.
U
glossary 220
