Mayor
John P. Gettys, Jr.
Councilmembers
Derrick Lindsay,
Mayor Pro Tem
John A. Black III
Brent Faulkenberry
Derrick Lindsay
Jim Reno
Kevin Sutton

Mayor
John P. Gettys, Jr.
Councilmembers
Derrick Lindsay,
Mayor Pro Tem
John A. Black III
Brent Faulkenberry
Derrick Lindsay
Jim Reno
Kevin Sutton
Management
David B. Vehaun, City Manager
Jimmy Bagley, Deputy City Manager
Steven Gibson, Deputy City Manager
Mike Blackmon Fire
Melanie Brandon Neighborhood Services
Lisa Brown Economic Development Strategy Management
Heather Lawson Water/Sewer
Anne Harty Finance
Cindi Howard General Services
Mike Jolly Electric
Deana Keever Human Resources
Terrence Nealy Public Works
John Taylor Parks, Recreation & Tourism
Chris Watts Police
Jeremy Winkler Governmental Affairs
Leah Youngblood Planning & Development
Strategic planning is the primary method by which the City plans and prioritizes its goals in a transparent and accountable manner. A strategic plan enables the City to efficiently move the community forward. The process of decision making in government services combines consideration of needs, balancing available resources, and utilizing best practices to provide for current obligations and support for our long term success.
The strategic plan is an active document, referred to regularly by staff at all levels within the organization, and at the heart of each day’s work. It serves as a roadmap to guide us from vision to reality. We use this plan to align limited resources with prioritized initiatives tied to a broader vision for the future of our community. Our strategic plan also is a promise to our stakeholders we are committed to live up to our motto of being ‘Always On’ in our pursuit of making Rock Hill a preferred place to live, do business, and visit. Our three core strategic initiatives are:
Rock Hill’s strategic plan regularly guides our decisions and the City is committed to providing ongoing updates on progress. This year-end performance report provides an evaluation of the City’s progress on performance goals due within Fiscal Year 2024, ending June 30, 2024.
A complete listing of all goals can be found in the Strategic Plan FY 2022-2024 which is available on the City’s transparency website, Strategic Plan | Rock Hill, SC.
The City of Rock Hill’s Strategic Plan determines the work and goals of the City. Contained in this report are the City’s achievements and challenges for Fiscal Year 2024.
Knowing both what objectives have been met and where there may be opportunities for improvement enables the City to refocus efforts to achieve its strategic goals and shape Rock Hill into a preferred place to live, do business, and visit.

The City of Rock Hill is proud of its strong financial management. Over the last 15 years, the City has been able to keep property tax rates low. There are a few reasons for our ability to keep tax rates low an emphasis on efficiency and innovation, as well as leveraging the growth of the York County area.
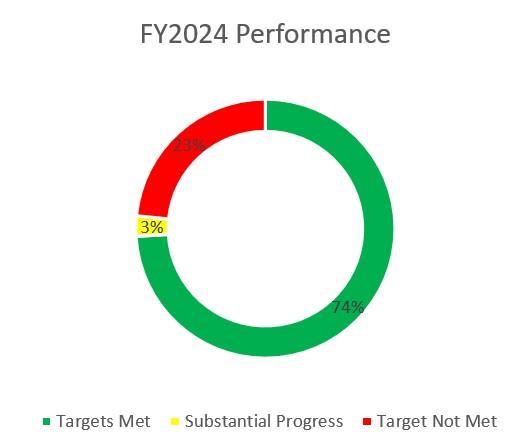
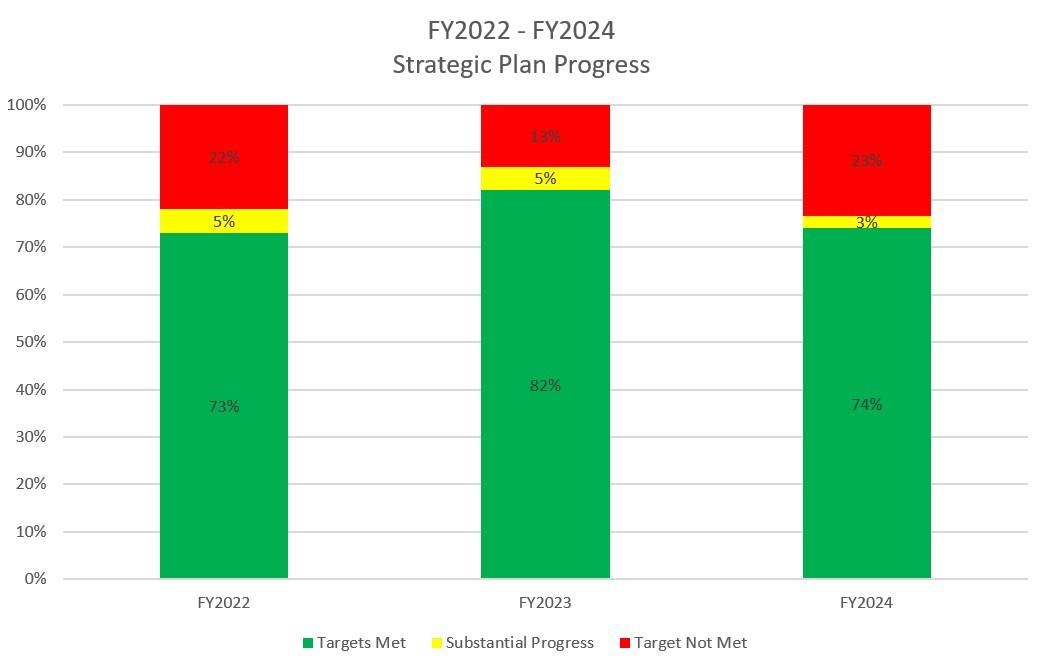
As this is the final report on the Strategic Plan period of FY22-FY24, it is important to recognize and track the progress the City has made over the course of three years. Overall, the City has accomplished over three-quarters of its measures. Measures had been adjusted or introduced during the course of the Strategic Plan time period; when the environment or conditions changes , the City changes as well and works to meet new challenges. The City is always staying flexible to meet the needs and expectations of the community. Targets being met show where the City is on track and the City uses targets not achieved as opportunities to focus efforts and resources in the future. Although some individual tasks were not completed, the City continues to remain committed to its goals, values, and direction in Serving the Community, Engaging Residents, and Growing Rock Hill.
The heart of our community is the residents who work, live, and recreate here. Serving highlights our dedication to local efforts safe neighborhoods, local recreational opportunities, reliable utility infrastructure, and customer service. People choose to live in Rock Hill because of what our community offers residents welcoming neighborhoods, stable employment, and a community rallied around a common purpose cultivating the best community in America.
Performance reports provide the City a formal opportunity to evaluate and communicate its performance to the Mayor and City Council, City staff, Rock Hill residents, and all those interested in the well-being of Rock Hill.
339 Community Event attended by Police
12,315 Work Orders completed by Utilities 2,319 Code Enforcement cased closed in FY2024
The City met 73% of all measures related to Serving our Community. Great strides have been made in our neighborhoods, customer service efforts, and core infrastructure needs. Some tasks are not yet fully accomplished or were not met due to changes in priorities, the timeliness of results, or not fulfilling all of the benchmark
*This report focuses on the big picture, strategic measures that show overall city progress. There are hundreds of measures tracked on a regular basis. Percentages included are for all these measures not just the measures included in this report.
The City’s operational departments embody the City’s “Always On” motto.
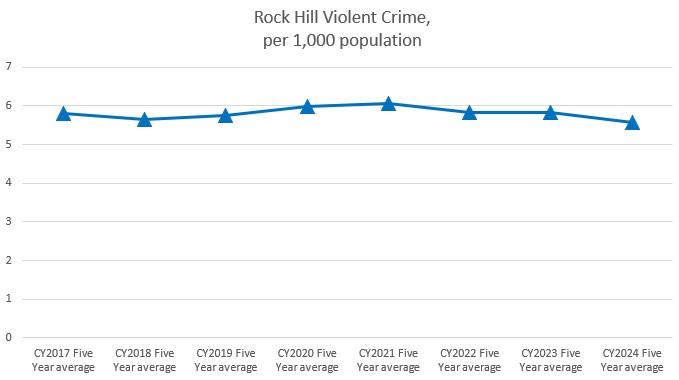
In FY2024, the local rate of violent crime remained flat. RHPD’s continued investment in community engagement and crime prevention strategies to steadily decrease the violent crime rate has been working to make the community safer.
1. Foster thriving neighborhoods throughout the City and a safe, familyfriendly community
2. Ensure exceptional customer service and proactive communication through courteous, responsive, and knowledgeable employees
3. Provide important core services and invest in infrastructure needs to become more reliable and predictive
Respond to all Priority One public safety calls below the UNC School of Government (SOG) benchmark average of 6.4 minutes*
Increase the percentage of residents who fee very or somewhat safe, as indicated in the 2023 Community Survey
Reduce citywide property crime by at least 2% annually (based on a five-year average)
Reduce citywide violent crime by at least 1% annually (based on a five-year average)
Average response time for Priority 1 calls during CY2023 was 6.25 minutes.
64% of surveyed residents felt very or somewhat safe.
In CY2023 there were 31 property crimes per 1,000 residents. This represents a overall decrease compared to the five year average of 38 property crimes per 1,000. residents.
In CY2022 there were 4.9 violent crimes per 1,000 residents. This represents an overall decrease (five year average was 5.8 violent crimes per 1,000).
Police engage in community programming of at least 300 events/neighborhood meetings per year
Maintain the Fire ISO 1 rating
Contain at least 75% of residential fires to the room of origin

339 community events/neighborhood meetings were attended by Police.
The Fire Department has maintained its ISO 1 rating.
9 of 15 residential fires (60%) were contained to the room of origin.
*The UNC School of Government (SOG) benchmark used is the latest available, from the “Final Report on City Services for Fiscal Year 2020-2021”
Maintain a voluntary compliance rate citywide of at least 85% 3,107 of 3,410 code issues (91%) voluntarily abated.
Increase rental vacancy rates by at least 1% annually
Increase homeownership rates by at least 2% annually
Host interview skill session for the community at least one session at each of the four recreation centers annually
Institute stormwater mitigation techniques in at least two neighborhoods annually
2022 ACS survey showed a 4.2% vacancy rate vs. 5.6% the prior year.
2022 ACS survey showed a 51.8% homeownership rate vs. 51.4% the prior year.
Human Resources and the Housing Authority recorded classes and posted them online in FY2024.
Staff completed a project in Winthrop Commons and worked on a number of neighborhood efforts including pipe upgrades on Stonewall and Izard St.
Reduce residential refuse tonnage per capita by at least 1% annually
Residential tonnage remained flat at 0.26 tons per capita.
Residents who are satisfied with code enforcement, as indicated in the 2023 Community Survey
2023 survey had 32% satisfaction, previous survey was 25%.
Track number of neighborhood meetings assisted by Neighborhood Services each month 146 neighborhood meetings.
Reduce the property crime rates in REDI neighborhoods by at least 10% annually
Reduce the violent crime rates in REDI neighborhoods by at least 10% annually
Property crime in the REDI neighborhoods remained level, 46 incidents in CY2023 to 46 in CY2024.
Violent crime in the REDI neighborhoods increased from 28 incidents in CY2023 to 30 in CY2024.
Maintain a voluntary compliance rate in REDI neighborhoods of at least 85%
96% of property owners abated compliance issues.
Deploy the REC-in-a-Box program throughout the community at least 100 times per year
Increase recreation center participation by at least 10% annually
Track total users of park/rec facilities and compare to prior years
Report on neighborhood park improvements as done on at least one project per year
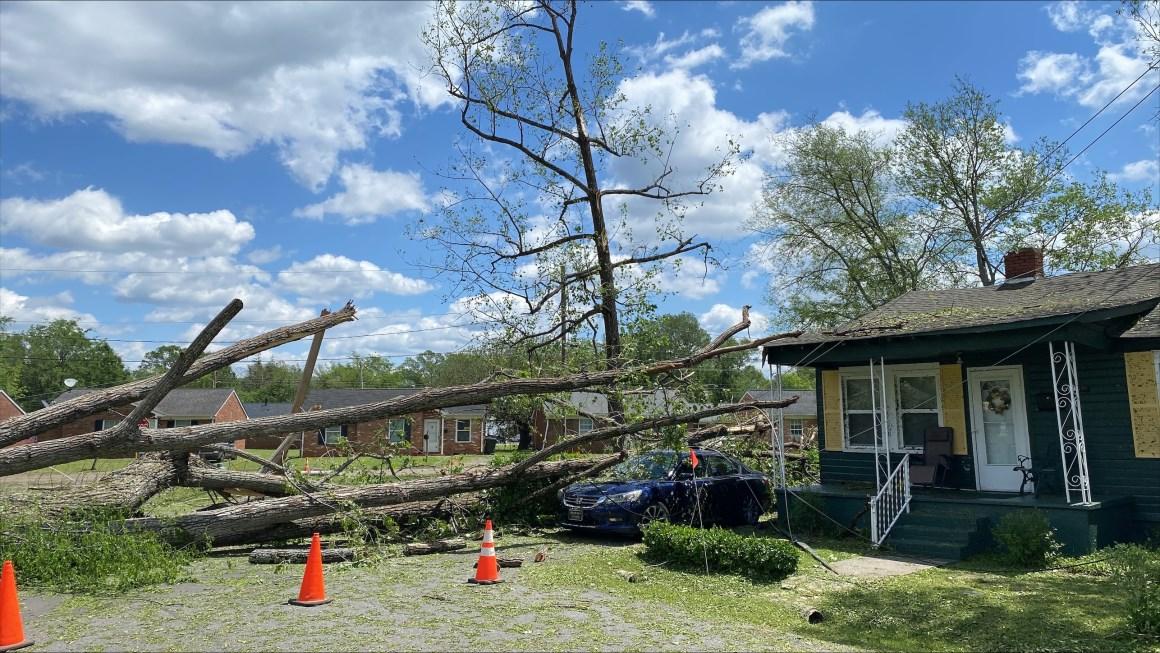
In April 2024, a sudden and violent hail storm erupted over Rock Hill. A soon as the storm ended, the City of Rock Hill Neighborhood Services team mobilized. Neighborhood Services pivoted from their regular duties to focus on providing resources for impacted residents. While the operational departments cleared roads and ensured utilities were working properly; Neighborhood Services connected non-profit partners, grants opportunities, and other resources to simplify recovery effort for individual households.
REC-in-a-Box was deployed 169 times with over 6,937 participants.
Recreation center estimates show a 11.8% decrease in participation from 200k in FY2023 to 176k in FY2024.
Total of 1M users in FY2024, a slight decrease from FY2023.
Final phase of Carroll Park ADA improvements continue to include last leg of sidewalk and bottle fill station. McGirt Auditorium renovations continue. Armory Park refresh is in the design phase. Oakwood Acres Park refresh continues.
Increase paperless billing customers by at least 5% annually
Increase the number of auto-pay customers by 5% annually
Attain call wait times below 90 seconds
Resident satisfaction with customer service provided by City employees, as indicated in the 2023 Community Survey
Maintain a safe work environment through establishing a baseline and tracking the Total Case Incident Rate (TCIR)
14% increase in paperless billing from 14,143 accounts in FY2023 to 16,152 in FY2024.
23% increase in auto-pay from 10,539 customers in FY2023 to 12,921 customers in FY2024.
48 second average wait time.
63$ of surveyed residents were satisfcied with City customer service, previous survey was 72%.
TCIR baseline is 6.4%. Risk Management will continue to monitor the TCIR and make adjustments as necessary.
Continue to train all new staff in customer service expectations and escalated situation staff annually
Provide updates on additional training opportunities for City staff
Monitor employee turnover rates through biannual reporting on voluntary resignations
As of June 30, 141 new hires received Customer Service Training this fiscal year. Escalated Customer Service Training is now by request or as needed.
In FY2024, HR created escalated customer service training and specific Transit Team training is under development.
The rolling 12 month average for turnover is 14.1% in FY2024, slightly lower than 14.9% in FY2023.
Maintain electronic newsletter engagement above 60%
Increase social media engagement on CORH Facebook above 2% median
Create and distribute at least 2 external video messages per month
Implement a targeted ad strategy for a specific audience at least four per year
Track social media posts/impressions/ engagement on all platforms for all ancillary City social media efforts
The City’s e-newsletter monthly average engagement was 65.5%.
The City’s social media engagement was 25%.
The City has distributed 20+ external videos in FY2024 including Mayor conversations, Rock Hill Update, and BMX event videos.
Staff have utilized targeted ad strategies focusing on BMX Worlds.
The City continually monitors the City, Police, Fire, and PRT social media accounts for followers/posts/impressions.
Follow along with the City’s updates on these main social media channels:
Facebook: cityofrockhill
Youtube: rockhillSCgov
Complete construction of the 6th elevated water storage tank by 6/30/2024
Complete the next phase of the wastewater treatment plant (clarifier and headworks) by 6/30/2024
Maintain 100% regulatory compliance for water/ sewer utilities
Evaluate at least one major traffic corridor per quarter
Update current progress on capital improvement projects for electric
The Water Department continues the search for an appropriate location for the next water tank.
The clarifier project is 97% complete and the headworks project is 93% complete.
The Water/Sewer utilities had one notice of violation at water plant; no issues at the wastewater plant.
Herlong Avenue, two sections of Cherry Road, and Celanese Road were all evaluated this year.
Electric overhead service to underground electric throughout the City and complete loop feed for Bayshore/Celanese to maintain reliability.
Update current progress on capital improvement projects for water
Update current progress on capital improvement projects for sewer
Work continues on alum sludge/solids handling, small diameter water main replacements, and lead copper rule compliance.
Wastewater made significant progress on the treatment plant upgrades and related projects.
Maintain a system average interruption duration index (SAIDI) less than 145.87 minutes
Maintain a system average interruption frequency index (SAIFI) less than 1.67 interruptions per customer per year
Reduce non-metered loss of water by at least 0.5% annually
Minimize high-serving pumping pressures at the water filter plant by not exceeding 90 PSI
Monitor hydraulic loads at the wastewater treatment plant
Complete 75% of customer-driven, utility related work orders within 7 business days
Complete 100% of pothole work orders within 2 business days
Average SAIDI was 263.78 minutes. This number was greatly impacted by a severe hail storm in April 2024.
Average SAIFI for FY2024 is 1.47 which is a 116% increase in interruptions per customer per year. This number was greatly impacted by a severe hail storm.
Loss of water decreased slightly from 25% in FY2023 to 21% in FY2024.
The water plant highest pressures averaged between 95 and 105 The target will be revisited with the expansion of the plant.
Hydraulic loads are continually monitored at the plant with monthly average flows of 378 million gallons a day.
78.8% of all electric, water, and sewer work orders were completed within 7 business days.
99.7% of all potholes were filled within 2 business days.
The success of our community is closely intertwined with our ability to engage residents in the future of Rock Hill. Engaging highlights our civic responsibility to involve all relevant stakeholders through outreach efforts, placemaking, and partnerships. The City is committed to excel in efforts supporting inclusivity, creating a positive sense of place, and connecting the community around inviting public spaces.
Performance reports provide the City a formal opportunity to evaluate and communicate its performance to the Mayor and City Council, City staff, Rock Hill residents, and all those interested in the well-being of Rock Hill.
176,202 Participants (recreation programs) 40% Tree canopy In the City 17 Days average Vacancy for boards
The City met 81% of all measures related to Engaging Residents. Great strides have been made in enhancing public trust, inclusive efforts, and partnerships. Some tasks were not fully accomplished or were not met due to changes in priorities, the timeliness of results, or not fulfilling all of the benchmark
*This report focuses on the big picture, strategic measures that show overall city progress. There are hundreds of measures tracked on a regular basis. Percentages included are for all of these measures not just the measures included in this report.
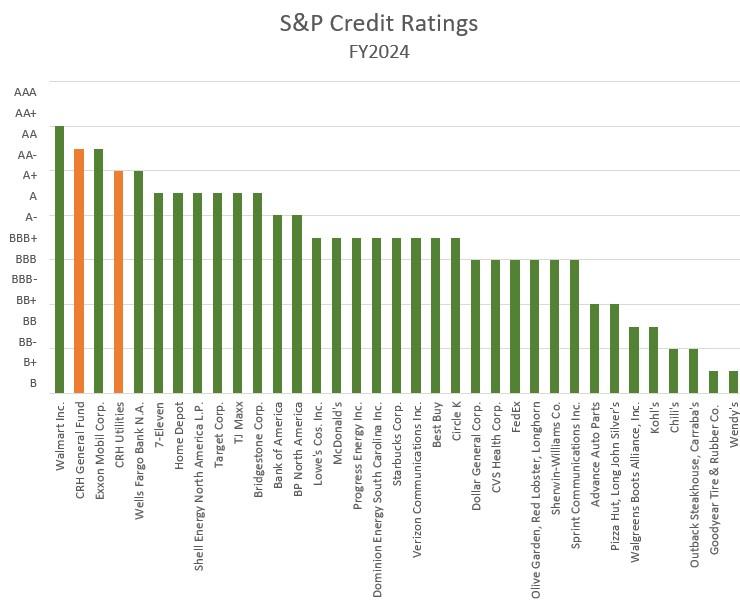
The City’s Utility funds maintained a bond rating of A+ in FY2024 for “good operational and management assessment, strong service participation, and a good liquidity position.”
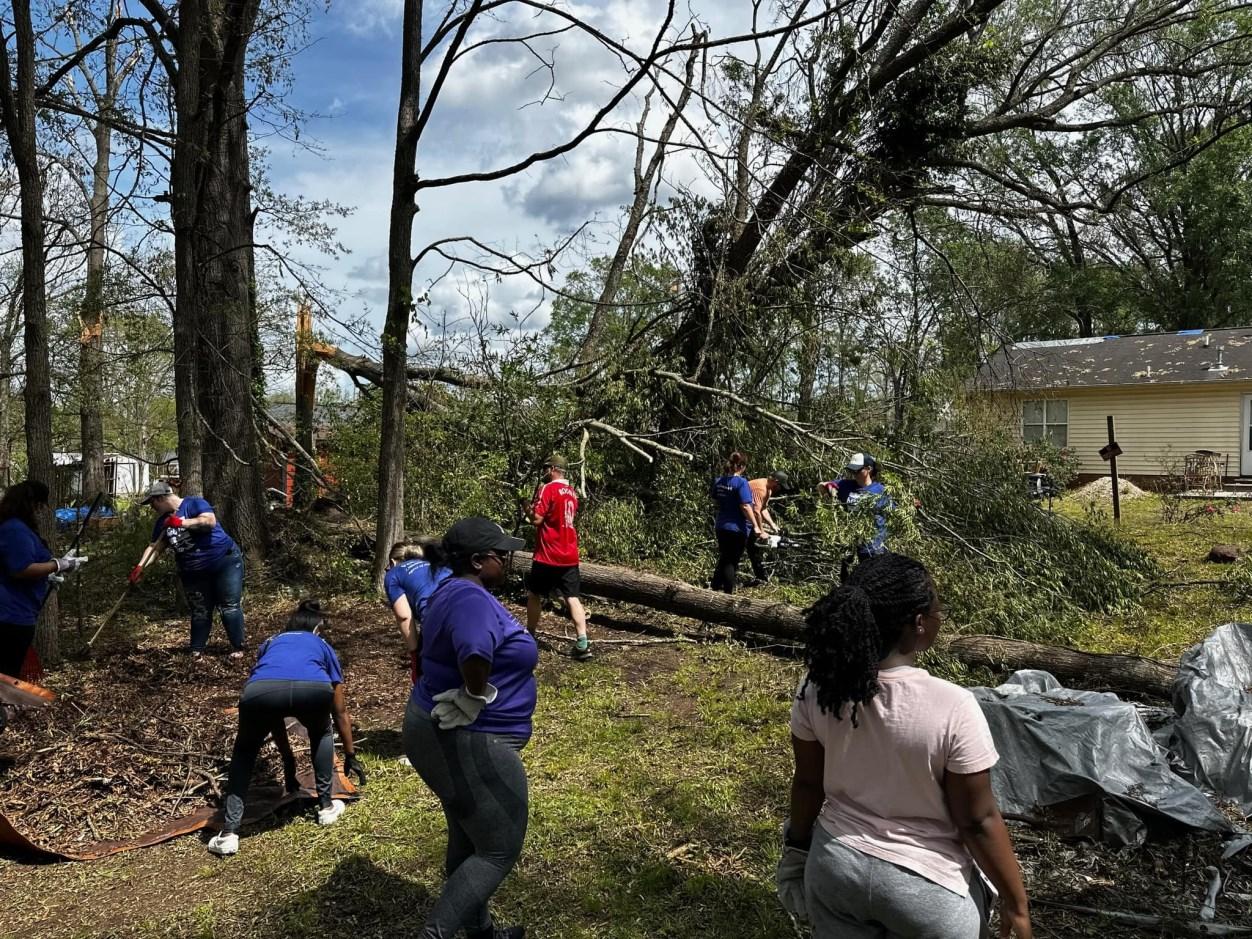
The Rock Hill community came together in the wake of a significant localized hail storm in April 2024. People helping people is what our community is about.
4. Enhance public trust and encourage civic pride
5. Foster community building, placemaking, and inclusive efforts
6. Facilitate partnerships that encourage a wide range of cultural, community, and educational activities for all ages
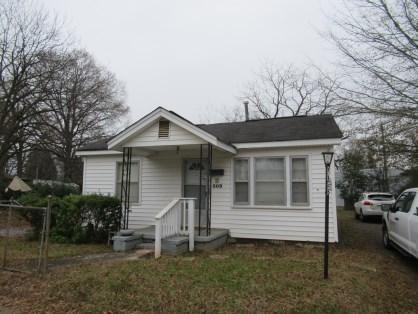
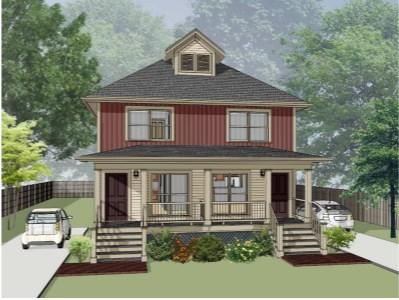
Complete construction of all 28 units at the Osceola workforce housing project by 6/30/2024
Decrease the percentage of renters who are cost burdened to below 50%
Provide annual updates on the implementation of the Housing Development Corporation strategic plan
Construct at least four additional units for homeownership annually
Maintain safe housing for renters through the expansion of the rental ordinance
Value Engineering completed on Osceola development. Project being phased to promote feasibility.
Latest ACS 5-year estimate has 51.8% of rental households being cost burdened.
Strategic plan implementation underway and on schedule.
Received proper zoning, plans and getting bid package ready for next two builds.
797 units inspected with 97.7% eligible for occupancy following the 1st or 2nd inspection.
Maintain or increase the City’s bond ratings
Compare costs per capita related to the latest UNC School of Government’s benchmark average:
Police services per capita
Fire services per capita
Building services per capita
Provide biannual updates on the development and deployment of an asset management system
Maintain a positive return on investment related to City grants

Bond ratings of AA- for the general fund and A+ for the Utility fund were affirmed in January 2024.
Police services per capita UNC SOG average: $289; Rock Hill: $310
Fire services per capita UNC SOG average: $204; Rock Hill: $192
Building services per capita UNC SOG average: $20; Rock Hill: $20.09
Asset management guidelines developed, which will facilitate a comprehensive approach to asset management.
Grants received were 53 times the Grants division operating budget.
Maintain 100% compliance with all regulatory requirements annually
Maintain active participation on City Council appointed boards and commissions with vacancies not exceeding an average of 45 days
Host at least three general community meetings to increase stakeholder participation annually
See at least two local leaders representing the city on statewide boards or commissions
See at least 75% satisfaction with neighborhood groups for support services provided
Water, Sewer, Electric, Police, and General Services all remain in compliance with all regulatory requirements.
Average time of vacancies was average 17.5 days.
Multiple community meetings held on hail storm recovery, after April 2024 storm.
Richard Lee (SC Board of Health & Environmental Control); Melvin Poole (Veterans Affairs)
94% of respondents rated their customer service experience as good or excellent.
The Housing Development Corporation updated sponsors and the community on Housing initiatives in October 2023.
Increase the direct economic impact of tourism to exceed $70 million annually by FY2024
Increase the hospitality tax revenue generated by 4% annually
Begin construction on the next major regional park site by 6/30/2024
Participation numbers by recreation facility
Track and establish baseline for indoor facility usage during the week (Monday to Thursday)
$125M million direct economic impact in FY2024. A substantial contributor to this economic impact was the BMX World Championship event in May 2024.
In FY2024, hospitality and accommodations tax revenues are 2.6% above projections.
Initial design developed for public input process. Continue to work with stakeholders on plans.
In FY2024, 150,900 people used recreation facilities.
In FY2024, Monday to Thursday usage was 235,828.
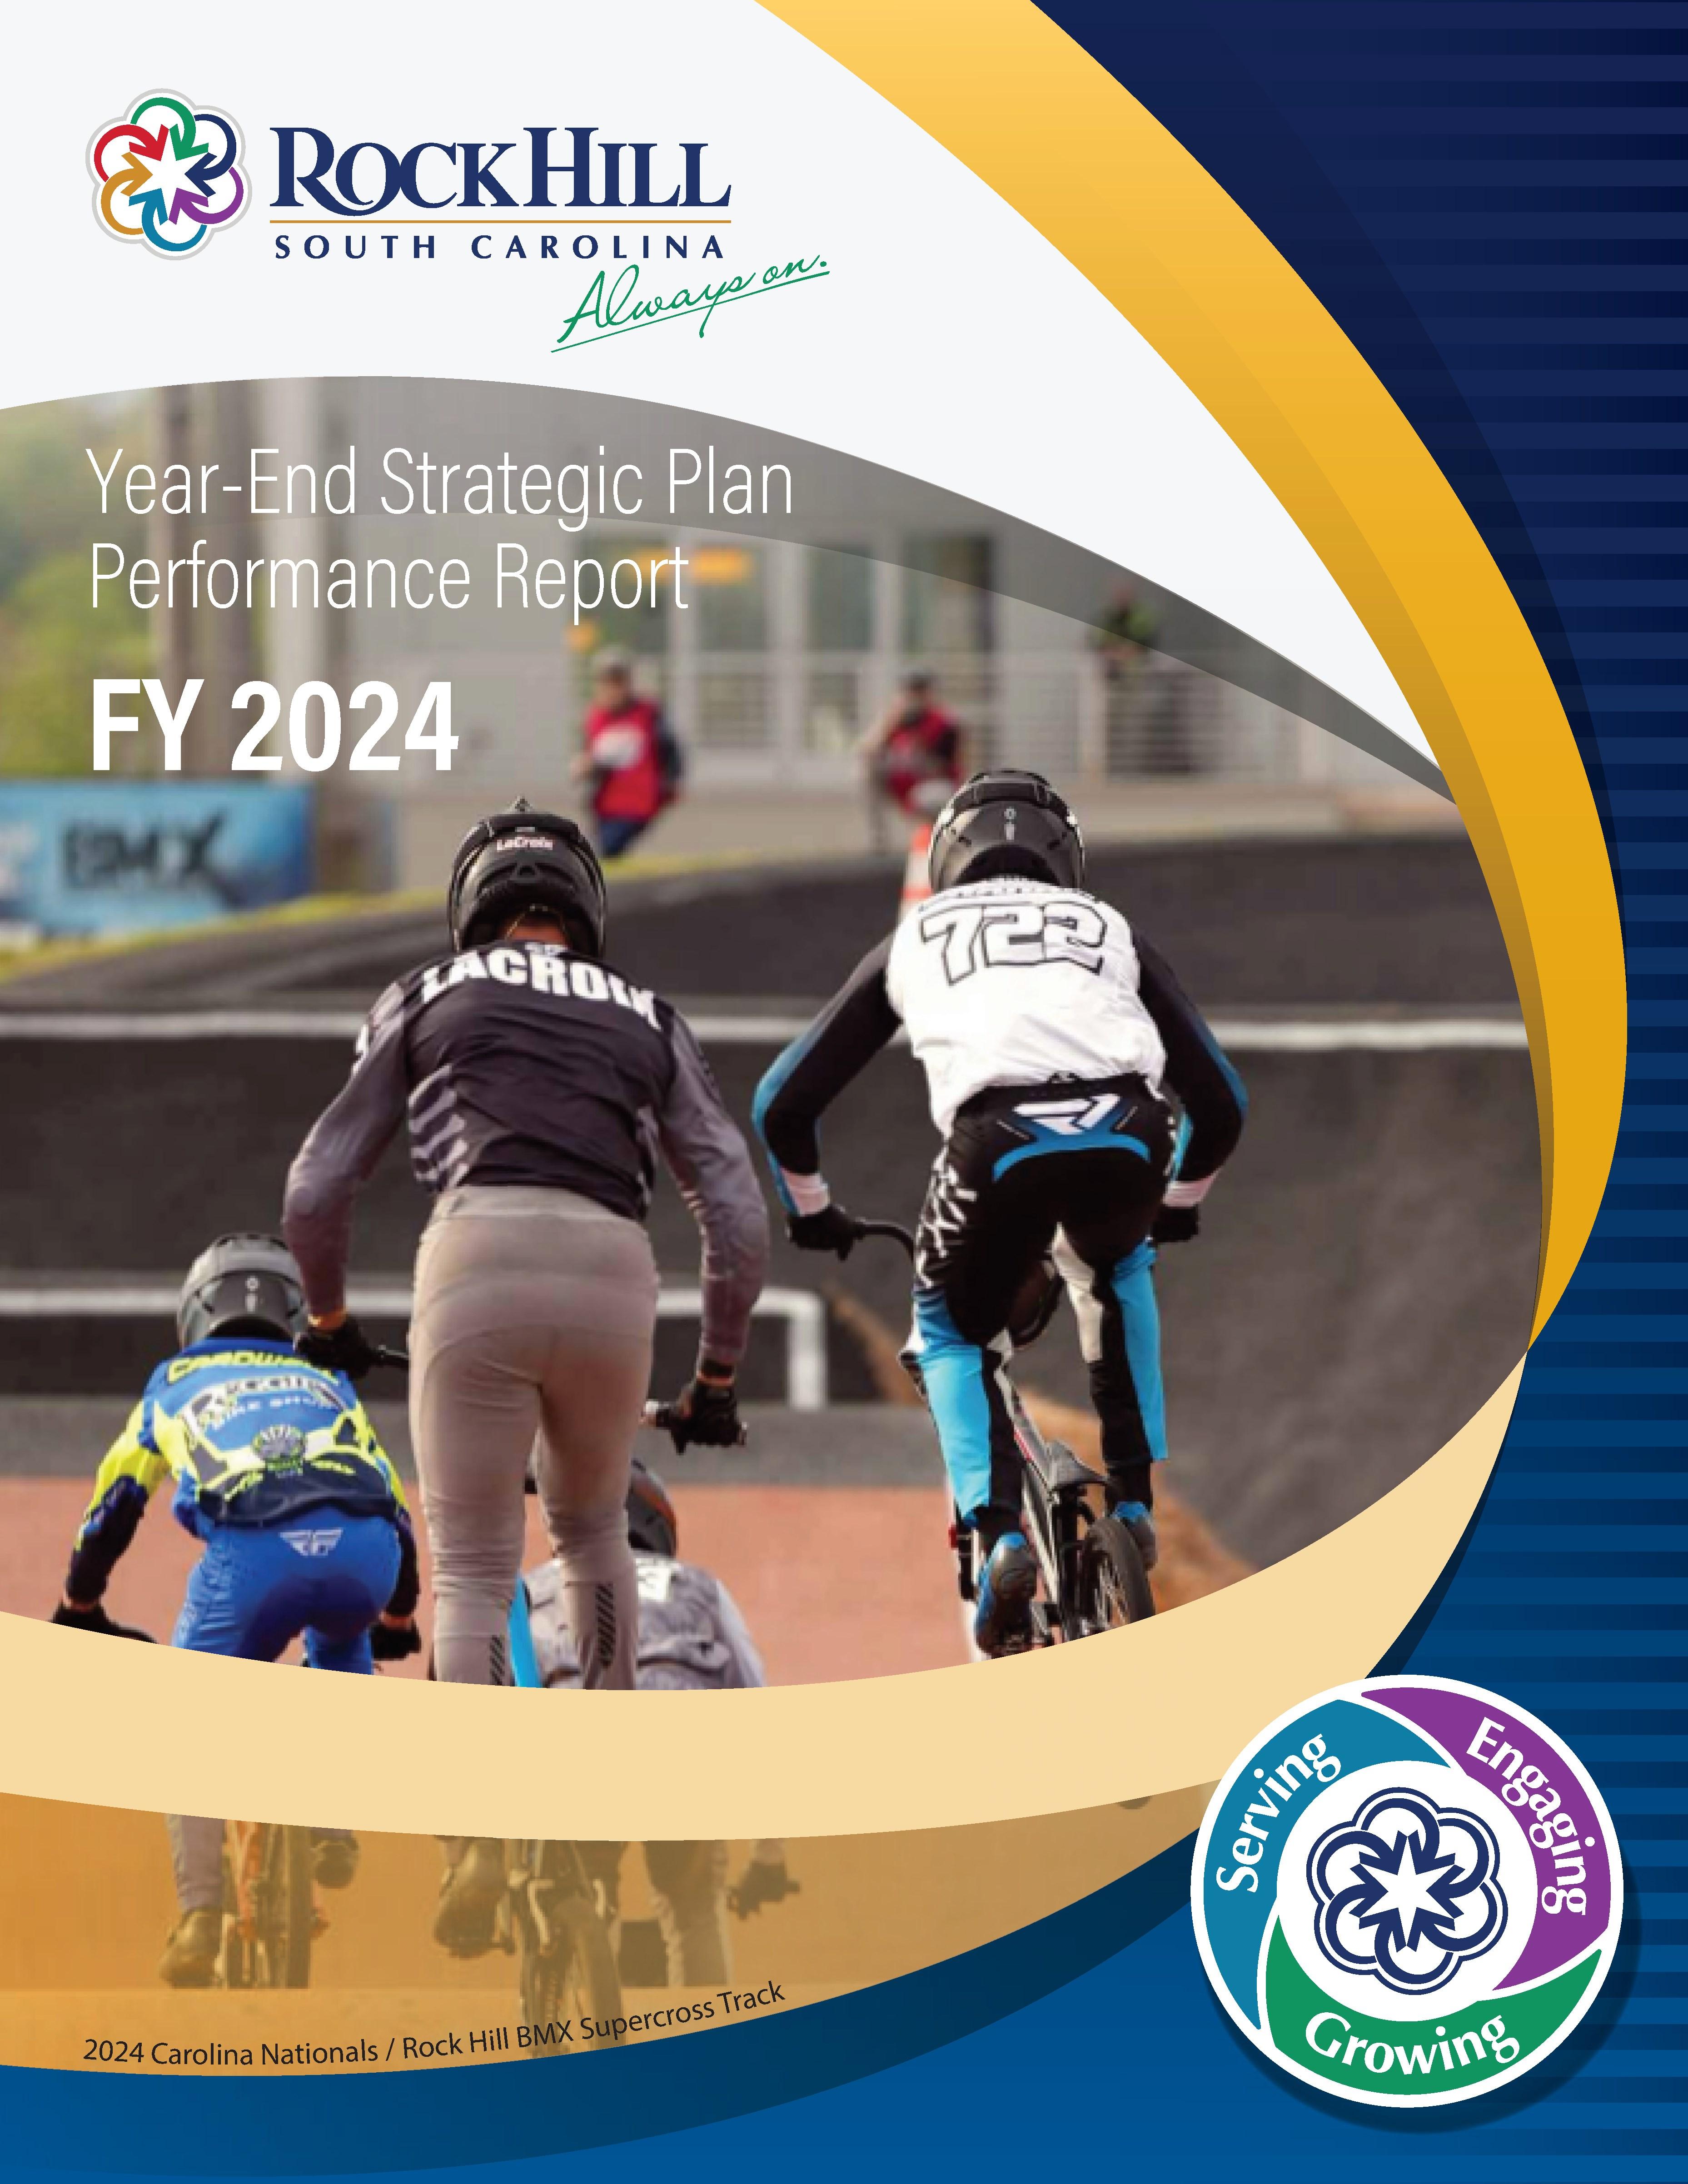
Provide biannual updates on preparations for the 2024 BMX Worlds
Event held May 2024 boasted participation from 43 countries, 3,314 riders, overall attendance of 57,000, and estimated economic impact of $30.1 Million.
Provide quarterly updates on developing strategies/baseline metrics for the implementation of the Clinton ConNEXTion Action Plan
Provide biannual updates on the creation of the African American Cultural Center
Provide biannual updates on the work of the Community Relations Council (CRC)
Provide biannual updates on the work of the Youth Council + Youth Service League
Staff is currently updating the October 2022 implementation plan with progress.
The feasibility study is being finalized.
A hybrid listening session was held on Tuesday, June 25 to continue gathering input from residents.
30 youth volunteered for 2,205 hours. Six grants have been given totaling $3,000.
Maintain a tree canopy across the City of at least 45%
Complete the trail connection from the Catawba River to Manchester Meadows by 6/30/2024
Provide biannual updates on the development of an Urban Forestry Master Plan
Tree canopy is 40%. This study was conducted using National Agricultural Imagery Program (NAIP) data.
No work completed in FY2024. Awaiting funding.
UFMP adopted. Execution of implementation plan underway.
Provide quarterly updates on the creation of trail/greenway connections across the City Initiative in design and review phase.
that encourage a wide range of cultural, community, and educational activities for all
Offer or co-sponsor community events or festivals at least twice per month
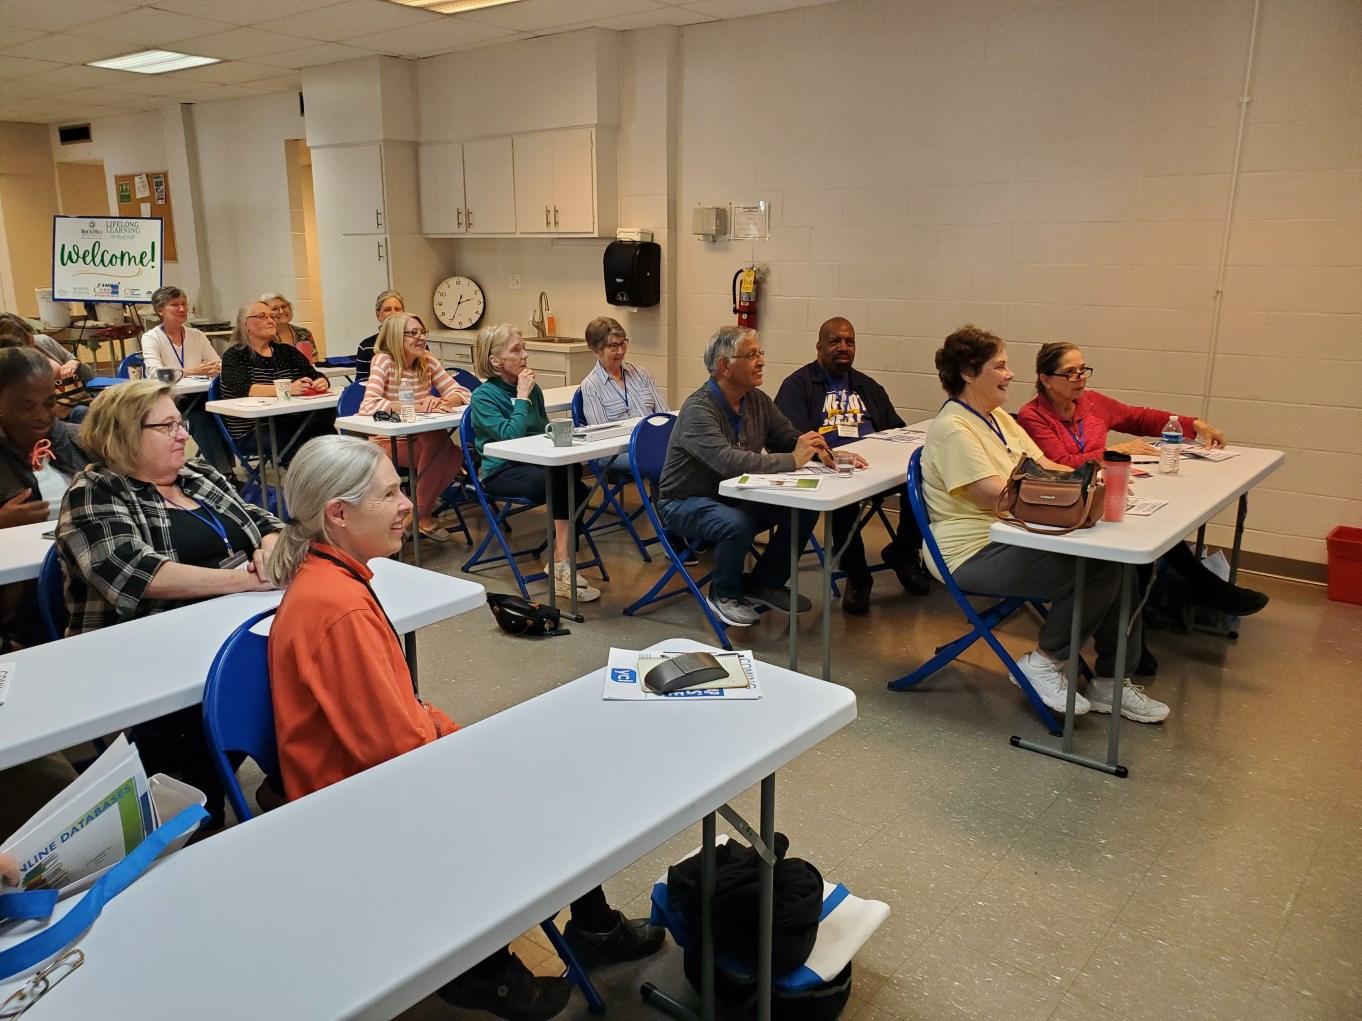
Enhance lifelong learning by seeing at least 60 students complete at least one course
See at least two new community placemaking projects annually
Provide biannual updates on efforts related to children with the #1 Question/Commission for Children and Youth
Engage Winthrop in developing strategies to keep students here after graduation
30 events were offered over the course of the year.
Unique participation at the end of the 2024 Spring semester increased by an additional 10.6%.
Corner Oasis mural completed; Alleyways Reimagined marketing piece completed.
Commissioners worked on goals and plans, while hearing from partner organizations.
City staff has worked with WU on their new masterplan.
Deploy at least three new programs at Miracle Park by 12/31/2022
Increase participation in PRT special therapeutic recreation programs by 5% annually
Maintain at least the same participation in Camp Arc compared to the prior year
Support Miracle Park with at least three fundraisers annually
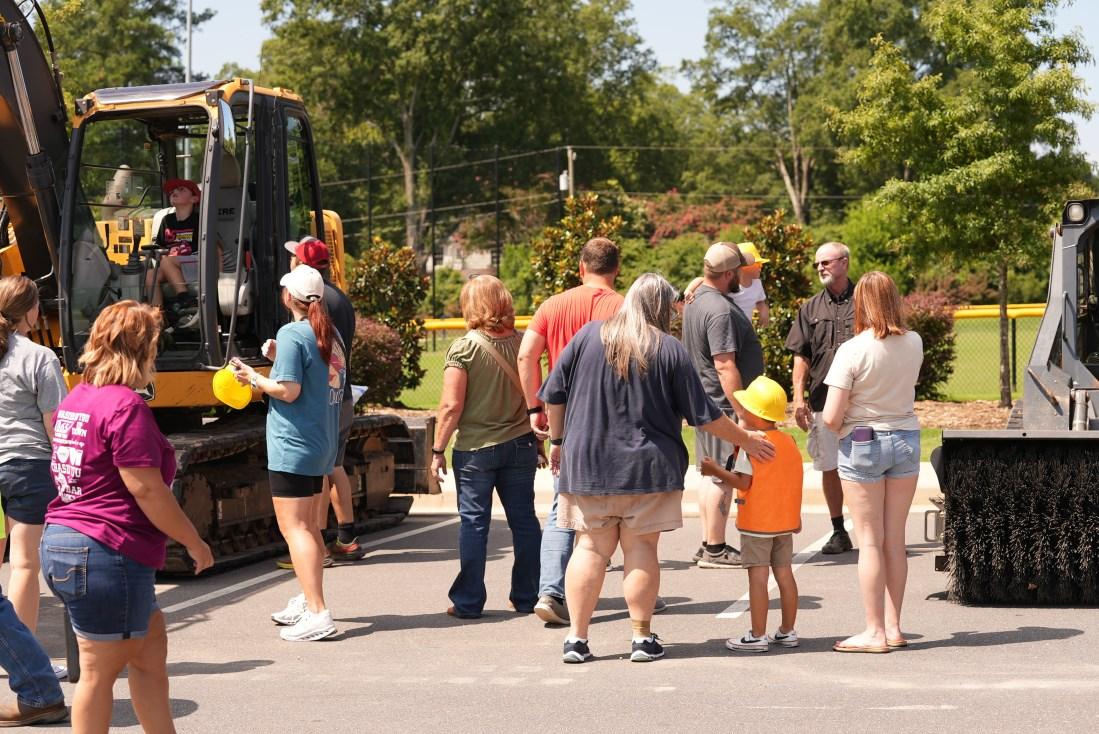
Three new programs were held including Eclipse Day, Bugs, Books and Crafts and a volleyball program.
Program participation decreased from 951 in FY2023 to 809 in FY2024.
Camp Arc saw a significant decrease in participation from 400 in FY2023 to 176 FY2024.
PRT supported Wiffleball tournament fundraiser June 1 with staff and field assistance.
Working in unison with local businesses, individual entrepreneurs, and local educational institutions, the City sees the future of Rock Hill’s success in balanced growth. Growing demonstrates the City’s commitment to providing conditions to enable people and businesses to excel. Our emphasis on Business Recruitment and Expansion (BRE) has included a focus on creation/retention of quality jobs and investments throughout the community. Several large-scale projects have announced in the last fiscal year including Poettker Construction’s Southeast.HQ ($15 million investment with 30 jobs), STIWA ($30 million investment with 48 jobs), CL&D Graphics ($11 million investment with 26 jobs), CAT Resources expansion ($17 million investment), and Summit Stairs expansion ($9 million investment). Many of these projects are in Rock Hill’s Southside and part of the South Carolina Commerce Corridor.
Performance reports provide the City a formal opportunity to evaluate and communicate its performance to the Mayor and City Council, City staff, Rock Hill residents, and all those interested in the well-being of Rock Hill.
The City met 69% of all measures related to Growing Rock Hill. Great strides have been made in Knowledge Park, development, business, and public transit. Some tasks are not yet fully accomplished or were not met due to changes in priorities, the timeliness of results, or not fulfilling all of the benchmark
*This report focuses on the big picture, strategic measures that show overall city progress. There are hundreds of measures tracked on a regular basis. Percentages included are for all of these measures not just the measures included in this report.
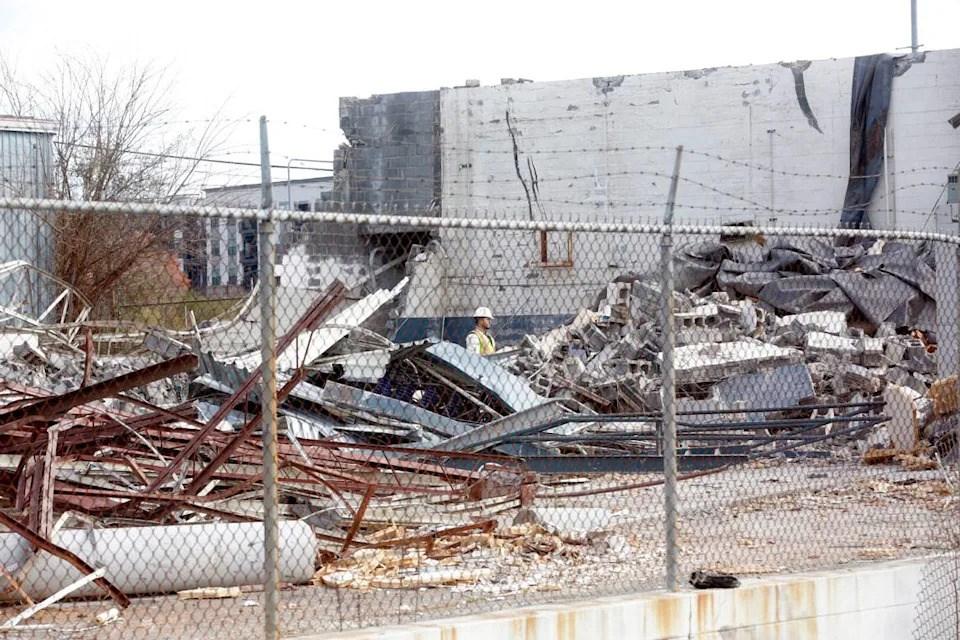
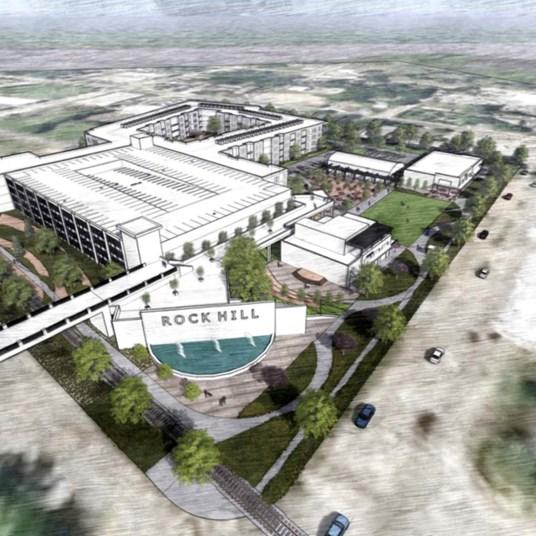
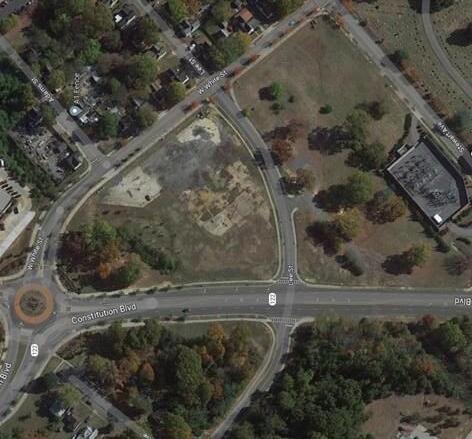
Herald Site

7. Make Knowledge Park a vibrant, active, and connected urban destination
8. Promote a strong and diverse local economy to promote business prosperity and business park success
9. Improve connectivity to reliable and sustainable transportation modes
Goal: Make Knowledge Park a vibrant, active, and connected urban destination Goal: Make Knowledge Park a vibrant, active, and connected urban destination
Provide foundational infrastructure needs to facilitate continued growth in the city’s core
Complete City infrastructure on the University Center site by 6/30/2024
Maintain a commercial vacancy rate in Knowledge Park below 30%
Increase the value of assessed property in the Downtown and Textile Corridor TIF districts therefore maintaining coverage of at least 1.2x debt service annually
Enter into a development contract on at least one underused site in Knowledge Park annually
All infrastructure has been completed on the site except for landscaping that will be planted Fall 2024.
The commercial vacancy rate in Knowledge Park is currently 16%.
Coverage was 1.0X the debt service, an increase since FY2023 due to the demolition of buildings in preparation for redevelopment.
Development agreement approved in February 2024 for Lee St to include the Annex Arena.


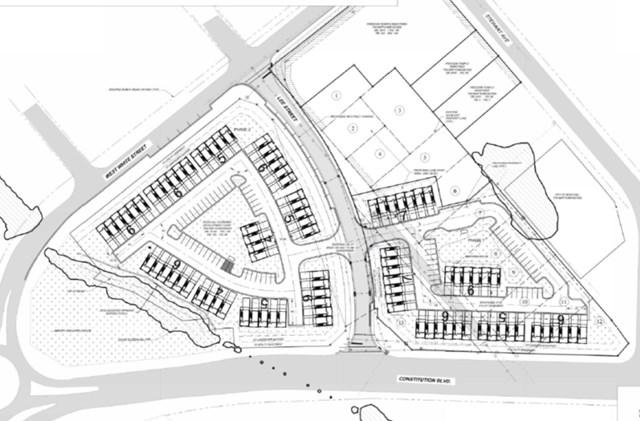
Development agreement at Lee Street and the Annex Site will set the course to take this property from vacant to 88 townhouse units.
Promote continued new and redeveloped residential efforts in and around the Knowledge Park Area
Permit at least 100 new workforce units through projects subject to the affordable housing policy by 6/30/2024
Permit at least 500 new market-rate units by 6/30/2024
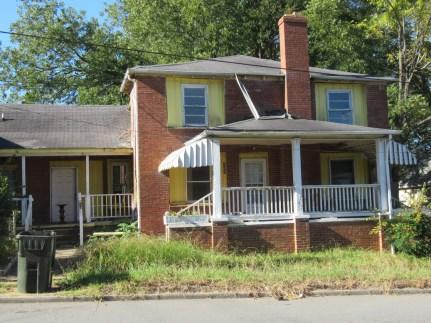
See voluntary compliance less than 30 days for exterior property and nuisance violations in neighborhoods surrounding Knowledge Park
Provide biannual updates on ways to mitigate the impact of gentrification on neighborhoods surrounding Knowledge Park
Work on development agreements that include affordable housing units continues.
During the three-year strategic plan cycle, this goal was met with units in The Nest, The Exchange and other developments.
24.5 days average compliance.
After a hailstorm City inspectors code enforcement assessed damage and disseminated information in an effort to match up needs with resources for homeowners.
Increase the Walk Score Downtown to above 62 or “somewhat walkable” or better
Begin construction on a bike/ped route between Winthrop and Downtown by 6/30/2024
Walk Score is currently 82 “ very walkable”.
Planning for the storyline trail is underway and a portion of it is being incorporated into the Lee Street Sports Complex Project.
Provide biannual updates on connectivity efforts Downtown Pedestrian bridge grant and various agreements with partners are well underway.
Provide biannual updates on the Downtown parking management program
Parking modified to provide free parking in decks at University Center.
Goal: Promote a strong and diverse local economy to promote business prosperity and business park success

Encourage a business-friendly environment in Rock Hill that creates new jobs and private development
Support small businesses through the Open for Business program by assisting more small businesses than the prior year
Support the creation of at least 500 new jobs across the City annually
Support private development in the Albright/ Saluda Corridor by seeing at least $1 million annually in new investment
Increase in Open for Business usage from 1,833 in FY2023 to 2,251 in FY2024.
Job creation exceeded the goal of 500 with over 3,000 jobs self-reported through the Open for Business program.
$63k worth of investment in the Albright/Saluda Corridor.
Track investment in key corridors including Galleria, Cherry, and Anderson Galleria $3 million; Cherry Rd. $35 million; Anderson $1.4 million.
Track permits and valuation for non-residential buildings compared to prior years
Provide biannual updates on the development of City business parks
Provide biannual updates on the effort to recruit a grocery store to the Saluda Corridor
Provide quarterly updates on prospective commercial development
117 non-residential permits were issued at $94 million in valuation.
Continuing to engage with commercial brokers, prospects, etc. on business parks. Much work on the informal 77 Commerce Corridor business park effort.
Continuing to work with existing development efforts on the Southside to include 3 Points and Albright Commons to hopefully secure a grocery store.
Development agreement approved in February 2024 for Lee St to include the Annex Arena. Continuing to work with White Point partners on the Herald Site. Reengaged with York Tech on the Wilson St. truck school to explore redevelopment.
Provide hands-on learning opportunities to at least 50 students annually through the Works
See a financial return on investment of at least 1.2x related to the Gravity Center programs
Provide biannual updates on the Gravity Center’s efforts to incubate, launch, attract, and grow new businesses
Place at least 10 students into the Talent Pipeline
The Works! hosted 74 students.
Due to incomplete data, staff was unable to validate ROI.
Service Agreement for VMS effectively ended 6/30/24.
Talent Pipeline program relaunching Fall 2024 after loss of funding.
Maintain competitive commercial cost to serve rates for all City services by being within 5% of the benchmark cities average
Complete average initial plan reviews for new commercial buildings and civil constructions in less than 10 business days
Compare the average number of building inspections completed by building inspector to the UNC SOG average
Maintain fire safety through commercial inspections compared to the benchmark cities averages for inspections completed per fire inspector
Audit 5% of all commercial accounts annually + all new commercial accounts within three months
Commercial rates are 4.4% lower than the average of the 29 Cities surveyed.
Average over ten days for civil + nonresidential plan review completion.
CORH inspectors are completing 22 inspections per inspector per day compared to the latest UNC SOG average of 12.8 inspections per day.
FY2023 Rock Hill average monthly fire inspections per inspector –1,587 UNC SOG latest average monthly inspections per inspector 920.
9.5% of commercial accounts were audited.
Invest in road, sidewalk, and airport infrastructure to provide connections and future growth
Begin the installation of an instrument landing system by 6/30/2024
Maintain a pavement condition index (PCI) average of at least 75% by 6/30/2024
Provide biannual updates on low-cost traffic safety efforts
Provide biannual updates on neighborhood sidewalk improvements
No current update.
PCI is 69%.
Projects in process on Springdale Rd, S. Spruce St., Lige St., Carolina Ave., and Chestnut St.
Replaced 3419 linear feet of sidewalk, including 330 linear feet on Community St. and 4 wheelchair ramps on Izard/Stonewall.
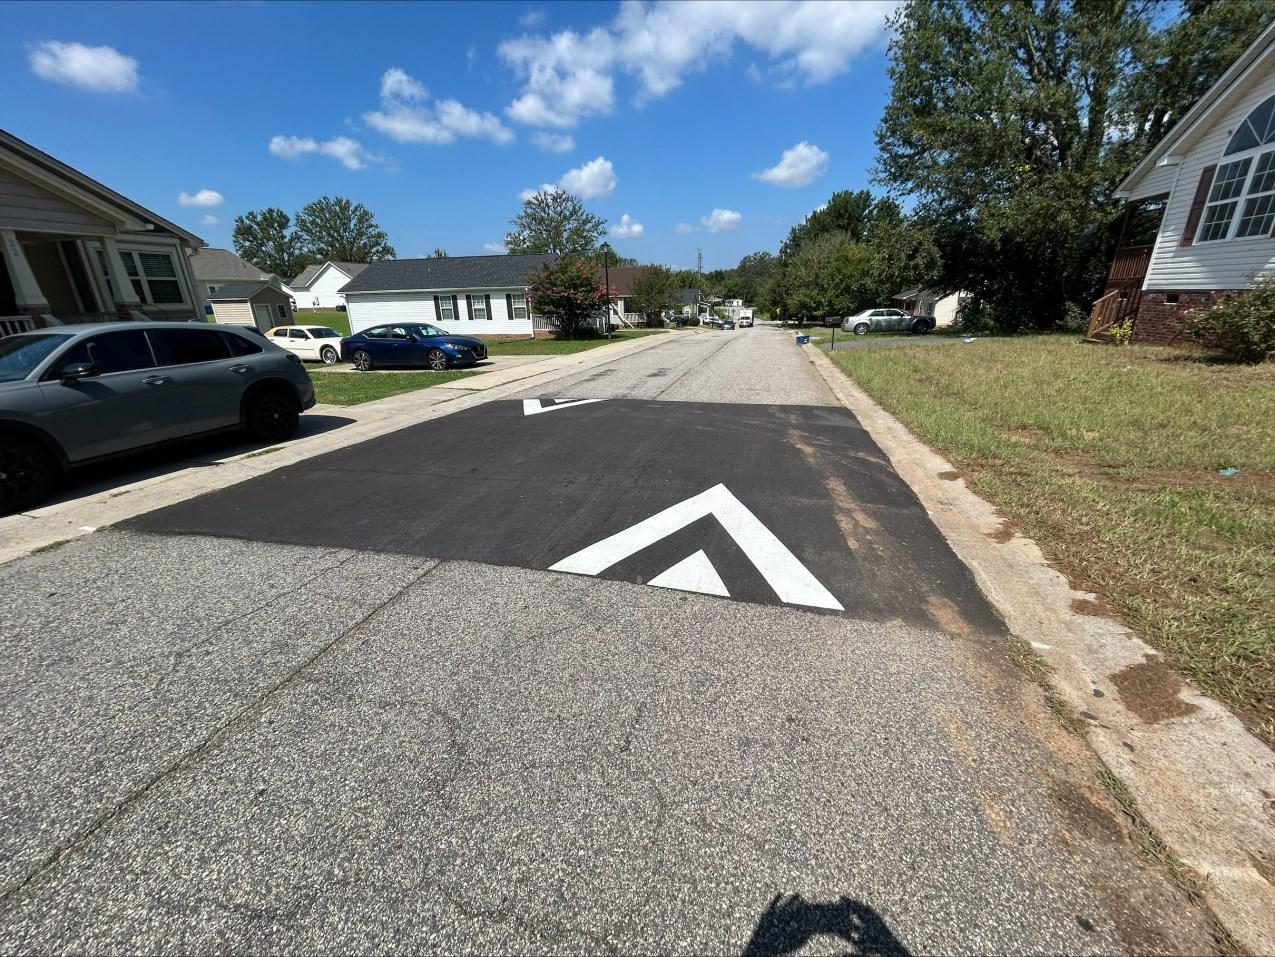
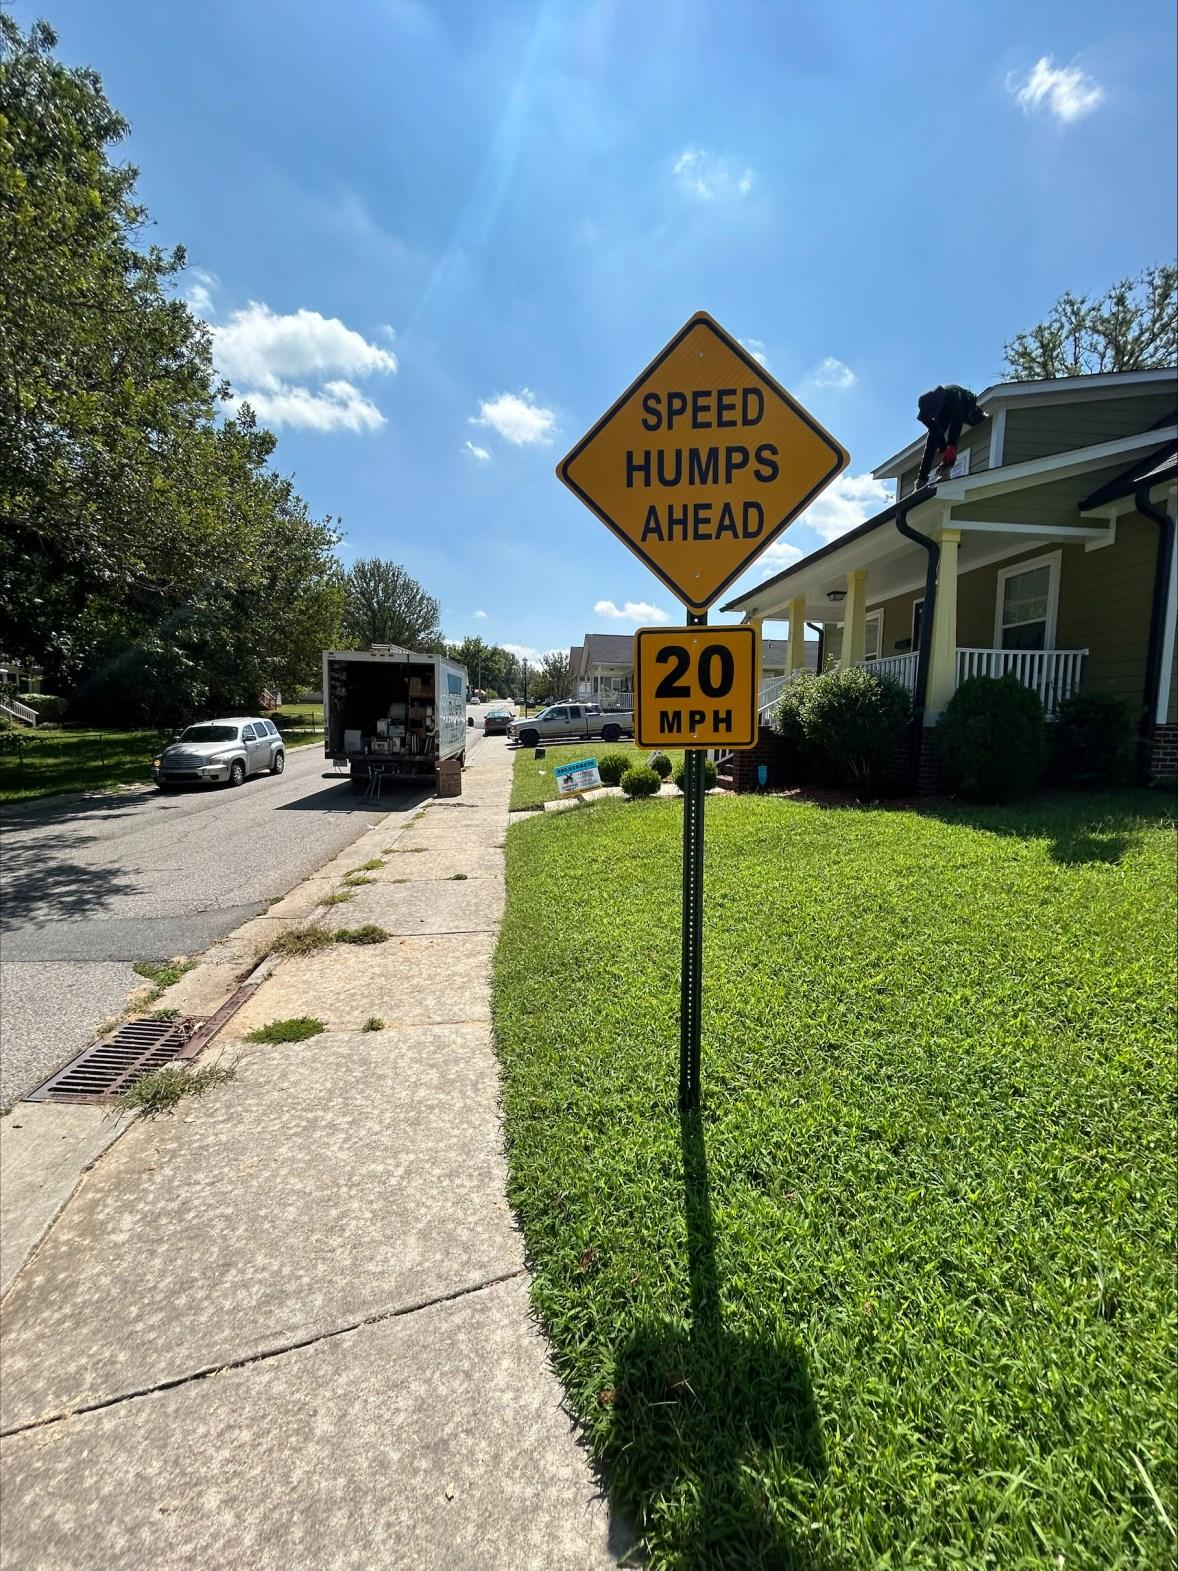
The Traffic Commission's revitalized Traffic Calming Application Process moved from pilot to a City-wide established program. In FY2024 an application was Traffic Calming was received for Hagins Street. This application was approved by both Traffic Commission and City Council and the project was completed in June 2024. Other neighborhoods have expressed interest in traffic calming solutions, and staff are working on future projects.
Develop a public transit system to support mobility amongst residents and visitors
Achieve an on-time goal for all City bus routes of at least 90%
Ensure exceptional customer service with City bus routes by seeing less than 1 complaint per 50 passenger trips
Maintain a fare-free bus system by having at least 40% of the City’s contribution covered by partners
Maintain an average of 16,400 passenger trips per month
Provide biannual updates on the next phase of the bus system
Bus routes ran on-time 67% of the time for all routes.
Complaint tracking process under development.
The City has sponsorship commitments of $350K
Averaged 24,032 passenger trips per month.
Route changes out for public comment, target for implementation of changes on September 30, 2024.
Learn more about the City of Rock Hill’s efforts in transparency and accountability at: www.cityofrockhill.com/transparency