CITY OF ROCK HILL COMPREHENSIVE PLAN
VOLUME 1 - EXISTING CONDITIONS REPORT [2025 FIVE YEAR REVIEW]
CITY OF ROCK HILL COMPREHENSIVE PLAN
VOLUME 1 - EXISTING CONDITIONS REPORT [2025 FIVE YEAR REVIEW]
Adopted December 8, 2025

VOLUME 1 - EXISTING CONDITIONS REPORT [2025 FIVE YEAR REVIEW]
VOLUME 1 - EXISTING CONDITIONS REPORT [2025 FIVE YEAR REVIEW]
Adopted December 8, 2025
John Gettys, Mayor
Derrick Lindsay, Ward 1
Brent Faulkenberry, Ward 2
Kevin Sutton, Ward 3
John A. Black III, Ward 4
Perry Sutton, Ward 5
Jim Reno, Ward 6
Randy Graham, Chair
Duane Christopher, Vice Chair
Shelly Goodner
Stephanie Haselrig
Jonathan Nazeer
Darrell Watts
Jarrunis Yates
PREPARED BY
Amy Jo Denton, AICP, Long Range Planner, Project Manager
Alex Boyce, AICP, Long Range Planner
Shelby Sweet, Long Range Planner
Leah Youngblood, AICP, Planning & Development Director
SPECIAL THANKS TO Rock Hill focus group participants, citizens, and business owners for their continuous engagement and support!

In order to plan for the City of Rock Hill's future growth and prosperity, an assessment is conducted to understand current conditions. This assessment is typically the first step in the Comprehensive Plan planning process. This Existing Conditions Report provides the details and findings of this assessment organized by plan element. Ten of the plan elements are dictated by S.C. State Statute, S.C. Code § 6-29-510(D), and the eleventh, Public Health, was added by the City during the Focus 2020 Comprehensive Plan process. Plan elements -
• Population
• Housing
• Economic Development
• Transportation
• Community Facilities
• Cultural Resources
• Natural Resources
• Land Use
• Resiliency
• Priority Investment
• Public Health
Volume 1 - Existing Conditions Report is a snapshot in time of 'where we are today'. Thus, the report serves as a baseline for the Comprehensive Plan. The examination of existing conditions is primarily facts and figures, but also includes references to pertinent regulations, plans, policies, organizations, maps and studies. Whereas Volume II - The Vision Plan encapsulates 'where we want to go'.
By law, the City is required to review its Comprehensive Plan every five years and update it every ten. Adopted in 2020 and amended in 2021, the Comprehensive Plan Update - Rock Hill 2030 was the ten-year planning milestone. This version, Comprehensive Plan Review - Rock Hill 2030 is the five-year review.
A Steering Committee made up of the City's Planning Commission members, as noted in the Acknowledgments, guides the comprehensive planning process.
The Existing Conditions Report is collaboratively developed by City Staff, the Steering Committee, and key stakeholders including -
• Housing and Neighborhood Representatives
• Grants Division Representatives
• Utilities and Infrastructure Providers
• Economic and Urban Development Community
• Commercial Development Community
• Residential Development Community
• Recreation & Tourism Providers
• Transportation Providers
• Arts & Culture Representatives
• Education Providers
• Community Wellness Providers
• City of Rock Hill Staff
• County & Regional Planning Staff
Comprehensive planning, and in particular visioning for the future of Rock Hill, is a deep tradition. This plan builds on those past activities and determination for Rock Hill to preserve its distinct identity while ensuring preparedness for a bright future.
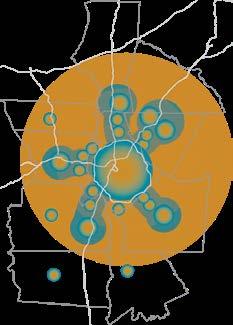
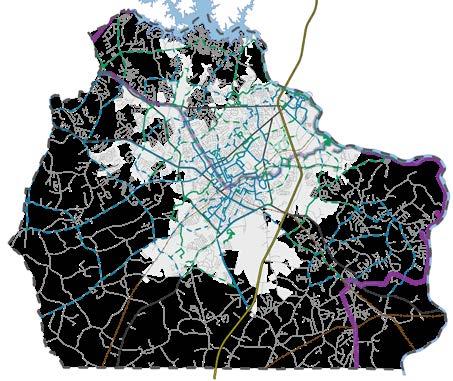
Rock Hill is part of the Charlotte Metropolitian Statistical Area (MSA) which is made up of seven North Carolina counties and three South Carolina counties, Maps 1.1 and 1.2. This is the largest MSA in the Carolinas and one of the fastest growing metropolitan areas in the nation. Rock Hill is one of the six ring cities within the MSA. The concept of the ring cities dates back to a late 1980s visioning campaign, Empowering the Vision (ETV), that focused on becoming the premier ring city. This concept has carried over to subsequent City planning and visioning activities because it is a good approach for assessing Rock Hill's position within the region and specifically among sister cities that are approximately 25 miles outside of Charlotte, Map 1.2.
MAP 1.1 CAROLINA REGIONAL CONTEXT
Source: City of Rock Hill, Planning and Development Department
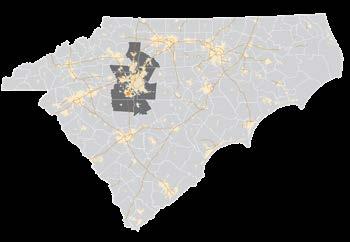

Rock Hill
Major Interstates Urbanized Areas
Charlotte MSA Counties
North & South Carolina Counties
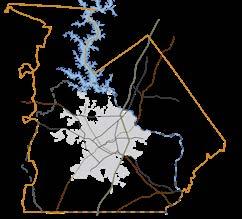
MAP 1.2
MSA & RING CITIES
Source: City of Rock Hill, Planning and Development Department
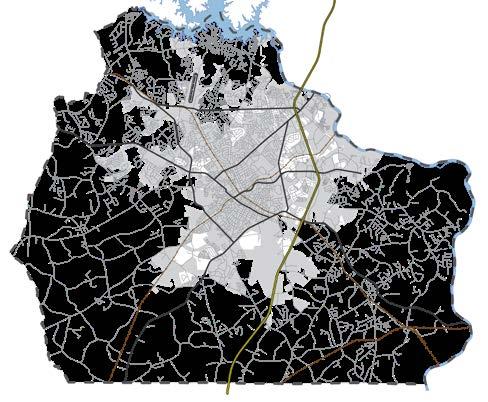
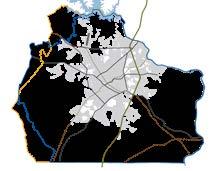
For the purposes of the City's Comprehensive Plan, the planning area boundary is the outer most boundary of the Rock Hill School District #3 and the City’s Water & Sewer Service boundaries, Map 1.3. The following existing conditions information is provided for both the planning area and/or the City limits as appropriate based on the topic or element.
Source: City of Rock Hill, Planning and Development Department

Since the 2010 adoption of the Focus 2020 Comprehensive Plan, Rock Hill’s population has risen steadily to 75,641 as of 2023, Table 2.1. This is a slightly stronger rate than what the Focus 2020 Plan had projected - 73,000 by 2020. This growth trend is expected to continue throughout the planning horizon. Of the ring cities between 2000 and 2020, Rock Hill is third in terms of size and percentage change in population.
TABLE 2.1 HISTORIC POPULATION DATA COMPARISON
Source: US Census Bureau 2000, 2010, 2020, and American Community Survey 2022, 2023 1-Yr Estimate
The Charlotte-Concord-Gastonia MSA was ranked sixth among the largest-gaining metro areas in the nation between July of 2022 and July of 2023, adding 50,458 people. The prior year the MSA was ranked nineth.
Source: U.S. Census Bureau, Vintage 2023 Population Estimates, https://www.census.gov/library/ stories/2024/03/florida-and-fast-growing-metros.html
Source: U.S. Census Bureau, 2000, 2010
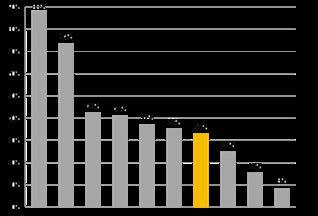
Incorporated in 1870, the area in and around Rock Hill has a deep history including native American tribes and early Colonial settlers. Thus as a more mature and larger city of the Charlotte MSA, Rock Hill has experienced more temperate growth rates compared to neighboring communities along the Carolina border like Tega Cay and Fort Mill, Figure 2.1. Rock Hill has and will continue to be an integral part of the Charlotte economic engine.
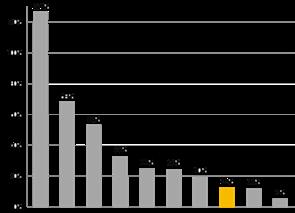
Dating back to the 1950s, Rock Hill’s population growth has been increasing with periods of faster growth than other as indicated by Figure 2.2. However, the past decade, 2010 to 2020, the city's growth rate slowed relative to the sister ring cities (Mooresville, Kannapolis, Concord, Monroe, and Gastonia). This historic growth trend and Rock Hill’s relationship within the Charlotte MSA is taken into consideration when projecting future population growth. The South Carolina Revenue & Fiscal Affairs Office provides population projects for the State and its counties. Figure 2.2 illustrates the York County population projections as well as Rock Hill's. Rock Hill's projections are calculated based on the Rock Hill-Fort Mill Area Transportation Study (RFATS) modeling projections. It is anticipated that as neighboring communities such as Tega Cay and Fort Mill reach higher build out levels, that Rock Hill will experience greater impacts of regional growth within the Charlotte MSA.
Source: U.S. Census Bureau, ACS 2023 1-Year Estimate, & South Carolina Revenue & Fiscal Affairs Office. York County projections provided by the SC Office of Revenue & Fiscal Affairs. Rock Hill projections are calculated using the annualized rate of growth from RFATS projections for the TAZs related to the City's boundary. FIGURE 2.2 ROCK
Despite an aging demographic, Rock Hill continues to have one of the youngest populations among the ring cities. With a median age of 34.5 years, Rock Hill is more representative of the City of Charlotte (34.5 years) than York County (39.2 years) or the State (40 years), Figure 2.3. Rock Hill’s distribution of age groups is well balanced between those under 18, the workforce (18-65 years) and those 65+ years of age. Other than Charlotte, Rock Hill has the
FIGURE 2.3 MEDIAN AGE COMPARISONS [2022]
Source: American Community Survey 2022 5-Year Estimate
TABLE 2.2 DISTRIBUTION OF AGE GROUPS, % [2022]
Source: American Community Survey 2022 5-Year Estimate
largest percentage of its population in the workforce age group, Table 2.2. Compared to the other jurisdictions, Rock Hill’s child dependency ratio is one of the lowest, Figure 2.4. This indicates that the burden on the workforce
portion of the population (18-65 years of age) as compared to children (under 18 years of age) is less than in neighboring communities like Fort Mill, Tega Cay, and Kannapolis.
FIGURE 2.4 DISTRIBUTION OF AGE GROUPS, % AND DEPENDENCY RATIOS [2022]
Source: American Community Survey 2022 5-Year Estimate
Like most communities across the United States, Rock Hill’s population is becoming more diverse, experiencing about a 5% decrease in the white population since 2000, Table 2.3. Of the ring cities, Rock Hill has the smallest percentage of white population (54%) and the largest percentage of African Americans (39%). In terms of racial diversity, Rock Hill is more like Charlotte than any other ring city, Table 2.4.
Source: American Community Survey 2022 5-Year Estimate
Source: US Census Bureau 2000, American Community Survey 2022 5-Year Estimate
Again, similar to national trends, Rock Hill is experiencing growth in its Hispanic population (4% net change), Figure 2.7. However, Rock Hill’s existing Hispanic population (6%) is the lowest compared to other ring cities and to
Charlotte. In terms of ethnicity, Rock Hill is more like the County and the State both compositionally and the percentage change since 2000, Table 2.4 and Figure 2.6.
TABLE 2.4 ETHNICITY COMPOSITION COMPARISONS, % OF POPULATION [2022]
Source: American Community Survey 2022 5-Year Estimate
FIGURE 2.6 TREND OF HISPANIC COMPOSITION COMPARISONS, [NET CHANGE 2000 - 2022]
Source: US Census Bureau 2000, American Community Survey 2022 5-Year Estimate
Education attainment is one of the strongest means of ensuring future prosperity. In 2022, 91% of the Rock Hill population had a high school degree or higher, Table 2.7. This is slightly below that of York County (92%), but
TABLE 2.5 EDUCATION COMPARISONS, % OF 25 YRS.+ POPULATION [2022]
Source: American Community Survey 2022 5-Year Estimate
slightly above that of the State (89%). While most communities across the nation are experiencing a decrease in the population without high school degrees, Rock Hill’s decrease since 2000 is on par with this trend in the region,
Source: American Community Survey 2022 5-Year Estimate
Table 2.6. Rock Hill’s strong public and private grade schools as well as higher education facilities support the needs of the City’s growing population and will continue to support this trend toward higher education attainment. Education levels directly correlate to higher rates of household incomes and wages as well as other improved social characteristics like better health.


The Census Bureau defines disability as a lasting physical, mental, or emotional condition that makes it difficult for a person to conduct daily activities of living or impedes him/her from being able to go outside the home alone or to work. A total of 12% of Rock Hill’s 2022 population is classified as disabled, Table
2.7, which is an increase in the past 5 years (1.2%), but about the same from 10 years ago. Rock Hill's 2022 percentage is above the average for the region, which is about 10%. Some communities like Fort Mill saw a decrease over the past ten years, Figure 2.9.
Source: American Community Survey 2012 and 2022 5-Year Estimate
FIGURE 2.9 TREND OF POPULATION WITH DISABILITY, [NET CHANGE 2012- 2022]
Source: American Community Surveys 2012 and 2022 5-Year Estimate
Note: Those jurisdictions with no significant change not shown below.
Similar to population growth trends, Rock Hill has experienced substantial housing growth since 2000, Table 3.1. Most of the growth occurred between 2000 and 2010 which is likely due to the housing boom prior to the recession. Since that time, growth momentum has recovered as the economy has strengthened even through fluctuations. Overall, Rock Hill's housing unit growth from 2000 to 2023 as compared to the region is moderate, slightly slower than Charlotte. The City continues to grow faster than the Planning Area and the State of South Carolina.
TABLE 3.1 HOUSING UNIT COMPARISONS [2000 - 2023]
Source: US Census Bureau 2000, 2010, 2020, and American Community Survey 2023 5-Year Estimate
Since 1970, there has been a substantial increase in the number of housing units in Rock Hill as well as the population. Between 2000 and 2010, when the City had the largest increase in housing units, population grew by 33%. Since housing unit growth has leveled-off since 2010, the population growth rate has slowed down to 2%.
Source: US Census Bureau 1970-2020, and American Community Survey 2023 5-Year Estimate FIGURE 3.1 ROCK HILL HISTORIC NET CHANGE IN POPULATION & HOUSING UNITS
Rock Hill has the lowest number of married family households and has one of the highest number of non-family households. Rock Hill is on the higher end of jurisdictions in the region with single parent households, particularly single parent female households, Table 3.2.
Rock Hill has a smaller average household size than the nation, South Carolina, and York County. It experienced a rather steep decrease between 1990 and 2010, and then another decrease between 2020 to 2023, Figure 3.2.
Source: American Community Survey 2023 5-Year Estimate
* Non-Family households includes households with a single occupant or households with non-related occupants such as roommates.
FIGURE 3.2 AVERAGE HOUSEHOLD SIZE [1990 - 2023] South
Source: US Census Bureau 1990-2020, American Community Survey 2023 5-Year Estimate
Generally, the percent of occupied units has increased and the percent of vacant units has decreased since 2010. This is likely due to the improvements in the economy between 2010 and 2020. Rock Hill continues to be in the middle of the ring cities, the County, and State in terms of both occupied and vacant units, Figure 3.3. Rock Hill’s homeowner and renter vacancy rates have also decreased since 2010. However, since 2020 the City has vacancy rates more like York County and the United States than the State, Table 3.3.
FIGURE 3.3 COMPARISON OF CHANGES IN HOUSING VACANCY RATES, [NET CHANGE 2000 - 2023]
Source: US Census Bureau 2000-2020, American Community Survey 2023 5-Year Estimate
United States
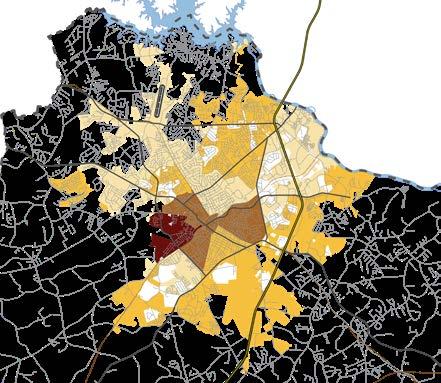
Census tracts with the highest percentage of vacancies are located in and around downtown, with a higher concentration along the west side, Map
3.1. Census tracts with the lowest vacancies are generally located along the Catawba River, I-77, and east of Celanese Road.
MAP 3.1 VACANT HOUSING BY CENSUS TRACT, [PERCENTAGE, 2023]
Source: American Community Survey 2023 5-Year Estimate
Rock Hill is split almost evenly between owner-occupied and renter-occupied units, and has the lowest percentage of owner-occupied units and highest percentage of rental units in the region. It is most comparable to Charlotte and Gastonia. York County and all other municipalities are predominately owner-occupied.
While Rock Hill stayed constant, other neighboring jurisdictions have seen increases and decreases in their renter-occupied units, Figure 3.4. Nationally, there has been an increase of approximately 1% in renter-occupied units which is comparable to the City’s zero net change from 2000 to 2023.
Source: US Census Bureau 2000-2020, American Community Survey 2023 5-Year Estimate
Source: US Census Bureau 2000, American Community Survey 2023 5-Year Estimate
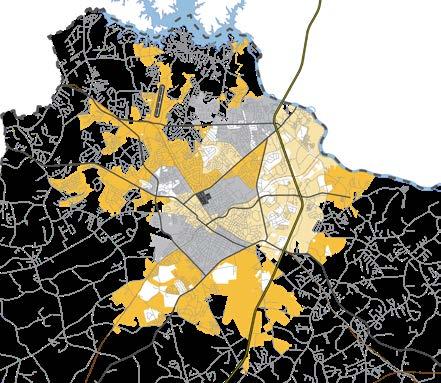
The highest rates of owner-occupied units are generally located on the periphery of the Rock Hill City limits while renteroccupied units are concentrated in and near the downtown, along Cherry Road, near the Galleria Mall, and along the Catawba River.
The U.S. Department of Housing and Urban Development (HUD) determines that an area demonstrates a disproportionate share of owner-occupied or renter-occupied units if it is comprised of 10 percentage points more than the City average of either owner-occupied or renter-occupied units. Thus for Rock Hill, a disproportionate share of owner-occupied units is 63% or higher and the disproportionate share of renter-occupied units is 57% or higher. Data was unavailable for a small Census tract located on Winthrop University’s campus.
Source: American Community Survey 2023 5-Year Estimate
While Rock Hill is comprised of mostly single-family homes, about a third are multi-family, which is higher than all ring cities, but is comparable to Charlotte. The City also has a low number of mobile homes when compared to the ring cities.
Rock Hill is a less mature ring city with 67% of houses built after 1980. This breakdown is similar to Charlotte and other ring cities like Concord and Monroe. Both Gastonia and Kannapolis have a relatively older housing stock with 52% and 46% of houses built before 1980, respectively.
FIGURE 3.6 HOUSING TYPES, [2023]
Source: American Community Survey 2023 5-Year Estimate
FIGURE 3.7 HOUSING STOCK AGE [2023]
Source: American Community Survey 2023 5-Year Estimate
Rock Hill has relatively affordable housing compared to York County and the Nation, Figure 3.8. Factors such as inflation, high interest rates, and supplychain issues have caused several housing demographics to be impacted for all jurisdictions, including median home value, household income, and cost of living. When compared to the ring cities, Rock Hill still has the third-lowest
median home value, behind only Kannapolis and Gastonia. In 2019, more than 70% of homes were less than $200,000. In 2024, only 30% are less than $200,000 and the majority of homes in Rock Hill are within the $200,000$500,000 range, Figure 3.9. This trend is common across the nation, but is particularly more significant in growth areas like the Charlotte region.
Source: American Community Survey 2023 5-Year Estimate


Source: American Community Survey 2010-2023 5-Year
Rock Hill has the second-lowest median household income when compared to the MSA, York County, North and South Carolina and almost all surrounding ring cities. Only Gastonia has a lower median household income. Rock Hill’s median household income is $64,770 (about $5,400 per month) compared to Mooresville, which is the highest at $88,592 ($7,380 per month).
The majority of both homeowners and renters pay less than $2,000 per month for housing. In Rock Hill, homeowners pay a median amount of $1,479 per month, which is lower than the national ($1,902) and County ($1,686) medians. Renters also have a slightly lower median monthly cost ($1,279) than the national ($1,348) and County ($1,304) medians.
FIGURE 3.10 MEDIAN HOUSEHOLD INCOME [2023]
Source: American Community Survey 2023 5-Year Estimate
Click Here to Learn About Living Wages
3.11 DISTRIBUTION OF OWNER HOUSING COSTS, [2023]
Source: American Community Survey 2023 5-Year Estimate
$
1,479
MEDIAN MORTGAGE
While housing payments in Rock Hill are lower than the national and County medians, over a quarter of homeowners and over 53% of renters are considered cost-burdened, Figure 3.13. A homeowner or renter is considered cost-burdened when their housing costs exceed 30% of their income.
The City of Rock Hill identifies barriers to affordable housing in its Consolidated Plan. Barriers include lack of money for down payments and closing costs, lack of education and job skills, lack of a dedicated public transportation network, zoning impediments, and availability and location of affordable housing stock.
The City began a free public transit system in June of 2019.
FIGURE 3.12 DISTRIBUTION OF RENTER HOUSING COSTS, [2023]
Source: American Community Survey 2023 5-Year Estimate
FIGURE 3.13 COST-BURDENED HOUSING, [2023]
Source: American Community Survey 2023 5-Year Estimate
Since 2014, the City has issued more than 2,555 permits for new residential development, both single-family and multi-family. Much of the new singlefamily development is concentrated in Riverwalk, Sweetwater Plantation,
Timberwood, Roddey Park, Norwood Ridge, The Parks, and Stoneridge. Several multi-family developments have been built in Riverwalk, University Center, and Downtown, with more in the planning phases.
Source: City of Rock Hill, Planning and Development Department
There are 169 neighborhood associations known to the City, illustrated in the Neighborhood Associations map in the City's Map Gallery. Of these associations, 127 (75%) are active and 42 (25%) are inactive. Active neighborhood associations maintain communications with city staff. The Council of Neighborhoods is the umbrella group for recognized neighborhood organizations. More information on the Council of Neighborhoods can be found on its website, www.rockhillcon.org.
Rock Hill addresses external housing conditions through the administration of the International Property Maintenance Code (IPMC). The code outlines requirements for exterior building issues such as missing, damaged, or rotted boards, sagging roofs, blistered or peeling paint, porch steps and handrails. This includes outbuildings as well as the main residence, both for multi-family and single-family dwellings. The City also has a Rental Registration Ordinance that encourages landlords and tenants to maintain habitable housing and establishes lines of communication between the City, property owners and managers.
Code violations for substandard housing are monitored by Rock Hill’s Neighborhood Services Department (NS) – Neighborhood Inspections Division. Violations can result in fines or demolition of the structure in cases where violations cannot or will not be corrected by the property owner. In 2024, 2,900 cases were created and 3,159 were cases closed. Open code enforcement cases can be referenced through the City's website, map here. The majority of the violations were for overgrown yards and exterior storm damage.
Since 2014, 280 residences have been demolished. 2015 saw a high of 61, with the number steadily decreasing to 17 this past fiscal year. For a list of the current fiscal year, reference the online report here. This decrease has been a result of the Proactive Code Enforcement (PACE) program that the City implemented in 2005. The Neighborhood Inspections Division is now focused on preservation efforts to ensure properties do not get to the point where they need to be demolished.
Neighborhood Services helps form partnerships between neighborhood residents, the business community, and local government to create a safer, healthier, and friendlier environment. NS is comprised of three divisions: Neighborhood Development, Neighborhood Empowerment, and Neighborhood Inspections. More information can be found here.
The Housing Development Corporation of Rock Hill (HDCRH) is a vessel through which the City of Rock Hill and community leaders help low to moderate income residents with their housing needs. The nonprofit organization provides financial assistance as well as helpful guidance on the home buying process. It also helps build and rehabilitate homes and rental units.
The housing programs are federally funded through the Community Development Block Grant (CDBG) Program, HOME Investment Partnerships Program, and the State’s Housing Trust Program. More information can be found here.
The Rock Hill Housing Authority manages the City’s Public Housing Program and Section 8 rent subsidy program. More information can be found here.
A host of national organizations provide housing assistance in Rock Hill, including the United Way, Salvation Army, American Red Cross, Habitat for Humanity, and March of Dimes.
Started by a group of businesses, churches, governments, and community leaders, PATHWAYS is a one-stop service center for food, clothing, shelter and housing options, counseling, spiritual guidance, governmental assistance, skills and job training, employment placement, health care, and more. More information can be found here.
The RHDC is a nonprofit organization that helps people through discipleship. The RHDC provides a sewing training program, runs a new and gently used clothing store, administers a Dream Homes Program where people can work with a mentor and coach on life skills, and offers academic tutoring for children in grades K through 12. More information can be found here.
Currently, the City has five age-restricted developments. There are also three subsidized complexes, one retirement community, and several nursing homes/ assisted living facilities in the City. The City does not have a group home for the elderly. In total, there are just over 1,300 units for the elderly community.
A coalition of community organizations, CACH seeks to address homelessness. The following organizations provide shelter for the City’s homeless:
• Bethel United Methodist Church
• Salvation Army (Women and Children’s Emergency Winter Shelter) Children’s Attention Home
• Family Promise of York County
• Pilgrims’ Inn
• Safe Passage
• The Haven Men’s Shelter
The Dorothy Day Soup Kitchen (Oakland Avenue Presbyterian Church) provides lunch for the homeless Monday through Saturday. More information on Rock Hill services can be found here.
Maxabilities, also known as the York County Board of Disabilities and Special Needs, operates 27 residential programs for individuals with intellectual disabilities, autism, and head and spinal cord injuries in York County. Maxabilities offers four residential programs that range from periodic staff supervision and support to 24-hour support. They also operate two Work Activity Centers that provide day services to consumers. More information can be found here.
The Catawba Community Mental Health Center offers outpatient or partial hospitalization care for people ages 18 and over with serious mental illness, mental health and substance abuse disorders, post-traumatic stress disorder, and forensic clients. More information can be found here.
Holly Ridge Apartments, a privately-owned complex that provides some lowincome apartments for seniors in addition to families, has 14 units for mentally ill residents.
Substance abuse services in Rock Hill are provided by the Keystone rehabilitation center. More information can be found here.
Safe Passage offers supportive services to families living in abuse in York, Lancaster, and Chester counties. Program services include emergency shelter for domestic violence victims and their children. More information can be found here.
The Children’s Attention Home Inc. provides emergency shelter and nurturing services to abused, abandoned, and neglected children in South Carolina. More information can be found here.
Rock Hill’s Affinity Health Center provides services and housing coordination for people living with HIV/AIDS in the Rock Hill and York County area. More information can be found here.
Housing Opportunities for Persons with AIDS (HOPA) is a federal program to provide housing assistance for people living with HIV/AIDS. More information on this program can be found here.
The City of Rock Hill has one freestanding hospice house, Hospice & Community Care, which features 16 private suites for terminally ill patients.
The City of Rock Hill has many housing programs to assist residents. Programs are administered through theNeighborhood Services Department, Rock Hill Housing Authority, and the Federal and state government.
The Resource & Education Development Initiative (REDI) program is a targeted revitalization strategy focused on outreach and education by identifying and fostering relationships with neighborhood leaders and engaging local faithbased organizations and schools. Using local knowledge, the City will be able to better target resources to help each community. The Catawba Terrace Neighborhood was the pilot neighborhood for the program in 2018 and Sunset Park was added in 2020.
Other programs managed or run by Neighborhood Services include:
• Neighborhood Stabilization Program
• Neighborhood Initiative Program (NIP)
• Rolling in Rock Hill
• Demolition Program
• Pro-Active Code Enforcement
• Community Tool Shed
• National Night Out
More information on these programs can be found here.
Qualified renters can rent lower-rent housing units which are owned and operated by the Housing Authority. The Housing Authority currently owns and operates 425 units in nine complexes around the City, 56 units of which are dedicated to the elderly and disabled. More information on this program can be found here.
The Section 8 Rent Subsidy Program is designed to assist very low income families in paying rent for private housing units that are not owned by a local housing authority. This assistance comes in the form of housing choice
vouchers through the U.S. Department of Housing and Urban Development (HUD) Section 8 Program.
The Low Income Housing Tax Credit (LIHTC) Program is a federal program designed to incentivize the private market to invest in affordable rental housing. Developers of qualified projects receive federal housing tax credits, which can be sold to investors to raise capital (or equity) for their project, which reduces debt so they can provide more affordable rents.
The federal government allocates the money to the state, which then awards housing tax credits to projects. Housing developments that have been built with housing tax credits in Rock Hill include Riverstone Apartments, Market Place Apartments, Cherry Laurel, Innsbrook Commons, Rock Pointe, Wildwood Springs, and Cotton Mill Village.
Rock Hill is updating its Consolidated Plan in FY24/25 which is needed to receive federal funding from HUD. The Consolidated Plan includes a fiveyear strategy and one-year action plan to address housing and community development issues in Rock Hill. More plan information is available here.
Rock Hill is updating the Analysis of Impediments to Fair Housing Choice as part of its requirement to receive Community Development Block Grant (CDBG) money. The Plan’s goal is to certify that the City will affirmatively
further fair housing for all citizens, particularly those of low and moderate income. More information on this plan can be found here.
The HDC is developing a strategic plan to help define goals and tasks to support their mission. The HDC is also improving its website and social media campaign to reach more people and streamline their processes. More information on HDC and to view their plan once its been adopted can be found here.
This element provides key findings related to the existing economic conditions and needs for Rock Hill and the planning area. Employment and real estate market trends were analyzed by planners and economic development professionals to develop residential, retail, office, and industrial development forecasts. These forecasts help to shape Rock Hill’s Future Land Use Map.
Rock Hill’s economic climate is influenced by larger economic trends at a national and regional level.
The U.S. has generally been experiencing an economic rebound after the COVID-19 pandemic. The recession that many economists previously feared has yet to arrive even though there were five bank failures in 2023 and two in 2024. Growth has slowed but has remained resilient, despite rising interest rates and inflation. Unemployment rates have generally returned to pre-pandemic levels and American's spending has fueled growth. While forecasters predict a cooler economic climate in the years to come, fears of a steep recession have dwindled. However, uncertainty exists as new 2025 White House policy changes are put in place particularly policies pertaining to: stricter immigration, higher tariffs, and addressing government budget deficits.
The Charlotte MSA ranked eighth in 2023 population growth of U.S. large metropolitan areas, and its growth of a skilled labor force is projected to continue. Future growth projections are reinforced by evidence such as job commitments of now ten Fortune 500 and eighteen Fortune 1000 companies
in the region, including announcements of Dentsply Sirona, RXO, Domtar, and Albemarle Corporation.
York County has continued to experience strong growth, attracting a labor force seeking quality schools and amenities. While job growth is strong in several sectors, the light industrial, warehouse and logistics sector has experienced rapid growth along the I-77 interstate. The I-77 interchanges and roadway improvements for Rock Hill will further drive development and growth along this corridor. These infrastructure improvements benefit other industry sectors, like tourism (that has gained back momentum after the pandemic).
As noted, the County and Rock Hill’s location within the MSA and proximity to major trade routes are key economic advantages. This coupled with the following competitive advantages will support future economic development:
• Connectivity - airport, interstates, ports, rail
• Business friendly environment - tax policies, incentives, & lower costs of doing business
• Good infrastructure including utilities as well as recreational and cultural amenities based on sound financial investments
• Strong quality of life & schools
• Low cost of living
The following analysis includes insights into employment, commuting patterns, industry and wage trends.
Rock Hill and York County have experienced steady growth in terms of both employment or job growth (demand) and labor force (supply), Figure 4.1 and Tables 4.1-4.2. This growth has outpaced the State and the nation as well as the Charlotte MSA since 2000. In comparison, Charlotte and Concord’s job
growth realized a 72% and a 75% net change increase respectively during this same time period; Concord had the most growth of the ring cities from 2000 - 2023, Figures 4.2-4.3.
Source: U.S. Bureau of Labor Statistics FIGURE 4.1
Note: Mooresville not included below; labor statistics not available. FIGURE 4.2 JOB GROWTH OF RING CITIES, NET CHANGE 2000 - 2023
Source: U.S. Bureau of Labor Statistics
TABLE 4.1 JOB GROWTH, ANNUAL AVERAGE, 2000 - 2023
Source: U.S. Bureau of Labor Statistics
Both Rock Hill and York County have generally followed the State and national trends in terms of unemployment rates decreasing since 2009 with the exception of the 2020 pandemic that caused a rise in unemployment across the nation, Figure 4.4. Since that time, most areas, including Rock Hill,
have seen rates lower to pre-pandemic levels. Historically, Rock Hill has had slightly higher unemployment rates than the County and State, but lower rates than the Nation, and similar rates to the Charlotte MSA.
FIGURE 4.3 LABOR FORCE GROWTH OF RING CITIES, NET CHANGE 2000 - 2023
Source: U.S. Bureau of Labor Statistics
FIGURE 4.4 UNEMPLOYMENT RATES, ANNUAL AVERAGES 2009 - 2023
Source: U.S. Bureau of Labor Statistics
TABLE 4.2 LABOR FORCE, ANNUAL AVERAGE, 2000 - 2023
Source: U.S. Bureau of Labor Statistics
Source: MIT Living Wage Calculator, 2019, 2024
The living wage is the hourly rate that an individual must earn to support their family (if he/she is the sole provider and working full-time) covering basic costs of food, shelter, transportation, health care, and taxes. The MIT Living Wage Calculator estimated in 2019 that for one adult, the hourly rate was $12.56 in York County and was $12.37 in the Charlotte MSA. In 2024, the hourly rates are $23.38 and $23.26 respectively, an 86% and an 88% increase.
As mentioned in the Housing section, Figure 3.10, Rock Hill has the secondlowest median household income ($64,770 in 2023) when compared to the MSA, County, North and South Carolina and almost all surrounding ring cities. Even further, this is a trend for Rock Hill, Figure 4.5. Wage increases have generally not kept a similar pace to other ring cities or surrounding jurisdictions. While several factors can contribute, higher numbers of those on disability and higher numbers of low education attainment likely impact the low household income trend.
FIGURE 4.5 TREND IN MEDIAN HOUSEHOLD INCOME, [NET CHANGE 2010 - 2023]
Source: US Census Bureau 2010, American Community Survey 2023 5-Year Estimate
While Rock Hill does have many similarities to Charlotte, (for example as noted in the population section regarding diversity), Rock Hill is more like South Carolina when it comes to the topic of poverty. With 13% of the population living below the poverty level, Rock Hill has slightly less than the State’s 14% poverty level, Figure 4.6. Similar to other ring cities like Kannapolis and Gastonia, Rock Hill has shifted from the industrial economy to a service economy and is transitioning to a knowledge economy. While local schools, colleges, and universities have helped to retrain the workforce, these shifts have occurred more slowly in some areas than others.
A rich, robust, well-resourced public education is one of the best routes out of poverty and a pathway to prosperity.
– Randi Weingarten, President American Federation of Teachers
“
Source: American Community Survey 2024 FAMILY HOUSEHOLDS 2 ADULTS, 2 CHILDREN
The US Census Bureau uses a set of income thresholds that vary by family size and composition to determine who is in poverty. If the total income for a family or unrelated individual falls below the relevant poverty threshold, as noted below, then the family (and every individual in it) or unrelated individual is considered in poverty.
31,812
$ ANNUAL INCOME
16,320 INDIVIDUAL HOUSEHOLDS POVERTY LEVEL
Source: American Community Survey 2023, 5-Year Estimate
Many factors can influence an individual’s or household’s wealth such as gender, age, race, and education attainment to name just a few. Several of these characteristics were considered when analyzing the population in Rock Hill living below the poverty level. Those that stood out are race and household status.

62% of those living below poverty level in Rock Hill are African American almost 2 out of 3


76% of those families living below poverty level in Rock Hill are single mothers with children under the age of 18 about 3out of 4
Source: American Community Survey 2023 5-Year Estimate FIGURE 4.6 PERCENTAGE OF POPULATION LIVING BELOW POVERTY LEVEL [2023]
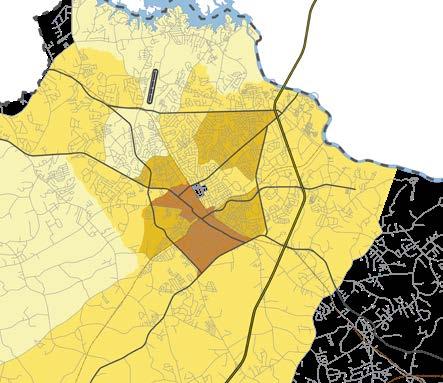
Based on 2023 ACS data for the past 12 months, the average poverty rate per Census Tract is 13% with the ranges shown in Map 4.1. The disproportionate share threshold is 15 percentage points greater than the study area average.
This occurs in the area west and southwest of downtown primarily between Main Street - Black Street (Hwy 5), Heckle Boulevard (Hwy 901), and Albright Road (Hwy 121).
Source: American Community Survey 2023 5-Year Estimate
Between 2017 and 2023, York County's job growth rose 19% while Rock Hill's growth rose 10%, Table 4.3. York County and the City both saw manufacturing job losses during this period. Rock Hill also experienced job losses in the leisure and hospitality industry, likely an impact of the pandemic.
Rock Hill saw significant job growth in the education and health services industries. York County, unlike Rock Hill, saw an increase in financial and real estate related jobs as well as in professional and business services jobs.
TABLE 4.3 EMPLOYMENT GROWTH BY INDUSTRY, 2012, 2017, 2023
Source: American Community Survey 2012, 2017, 2023 5-Year Estimate
The location quotient is a measure of an economy’s diversity and strength. In this analysis when the quotient is above one, the sector is stronger than the comparison area. Several sectors above one indicate an economy with a robust, diverse economy. These include Trade, Logistics & Utilities, Education & Health Services, and Leisure & Hospitality for Rock Hill, Figure 4.7.
FIGURE 4.7 LOCATION QUOTIENT, 2023
Source: American Community Survey 2023 5-Year Estimate
Rock Hill LQ Relative to Charlotte MSA
Rock Hill LQ Relative to York Co.
York Co. LQ Relative to Charlotte MSA
About 86% of Rock Hill residents drive to work (including 8% of which carpool), traveling about 25 minutes, Figure 4.9. Likely attributable to the pandemic, the percentage of those traveling to work has decreased while those who work from home has increased. According to ACS 2023 Community Survey results, 68% of Rock Hill residents travel within York
County for work while about 25% travel outside South Carolina for work. This is higher than the County; about 66% of those living in the County work within the County, Figure 4.8. Compared to the ring cities, Rock Hill has the highest percentage of residents living and working in the county of residence, Figure 4.10.
FIGURE 4.8 YORK COUNTY COMMUTING PATTERNS, 2020
Source: American Community Survey 2020 5-Year Estimate
2,731 WORK IN OTHER STATES & COUNTIES
2,502
WORK IN OTHER S.C. COUNTIES
48,816
WORK IN MSA COUNTIES
80,261
34,559
TOTAL WORKFORCE LIVING IN YORK COUNTY FROM OUTSIDE YORK COUNTY
134,310
WORK IN COUNTY OF RESIDENCE
FIGURE 4.9 MEAN TRAVEL TIME TO WORK, 2023
Source: American Community Survey 2023 5-Year Estimate


FIGURE 4.10 COMMUTING PATTERN COMPARISONS, 2023
Source: American Community Survey 2023, 5-Year Estimate
Of the 9 counties in the MSA (excluding Mecklenburg County), York County is third in the jobs-to-households ranking. Those counties with a ratio less than .75 tend be serving as bedroom communities.
American Community Survey 2022
S. C. TOURISM INDUSTRY SUPPORTS

BILLION S.C. TOURISM INDUSTRY
Source: S.C. Department of Parks, Recreation & Tourism & City of Rock Hill PRT *Note: 2024 BMX Racing World Championship generated an estimated $30M.
For decades, the City of Rock Hill has leveraged its natural and cultural assets to create a draw for visitors and locals. Tourism and specifically sports tourism took a leap forward in the 1980s with the opening of Cherry Park. The Park’s success encouraged future investments, such as the more recent -
• Rock Hill Velodrome, BMX Supercross Track & Criterium Course
• Rock Hill Sports & Event Center
• McGirt Auditorium
• Bleachery Fieldhouse
A comprehensive list of Park, Recreation & Tourism (PRT) facilities are provided in the Community Facilities Element. While these projects come with a price tag of millions of dollars, the City contributes budget successes by avoiding the practice of rollover projections. Instead, the City relies on counting ‘direct economic impact’. PRT partners with Visit York County to utilize Destinations International Event Impact Calculator (EIC). This cityspecific software is the global industry standard for measuring an event's economic value in our community. It is estimated that sports tourism over the past 10 years
million
*Note: the Sports & Event Center opened in 2019 and McGirt Auditorium at the Emmett Scott Recreation Center started hosting tourism events in 2021.
South Carolina has historically been successful in recruiting businesses because of its aggressive incentive programs and tax breaks. Major incentive programs offered by the state include Jobs Tax Credits, Jobs Development Credits, and Sales Tax Abatements. The state also has several probusiness policies including elimination of corporate income taxes, sales tax exemptions, property tax incentives, and special discretionary incentives.
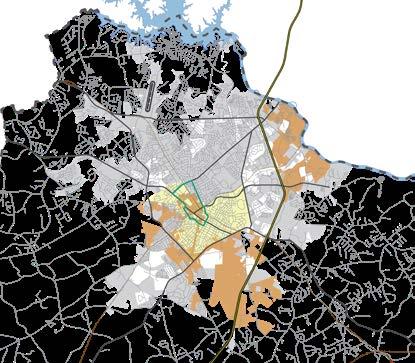
York County and the City of Rock Hill offer local incentives to support state programs and policies. County/City incentives include local property tax and tax abatements. Rock Hill also offers several incentives including a Facade Rehabilitation Grant Program, Economic Development Incentive Program (EDIP), and the coordination of various federal/state tax credits. The City has four Census tracts designated as Opportunity Zones. The City has also established tax-increment financing (TIF) districts in Downtown, Textile Corridor, Red River, and Southside, Map 4.2. To learn more about these incentives, consult the Rock Hill Economic Development site here.
In general, the City is shifting its focus from incentives for businesses to incentives for workforce development. The City, the Rock Hill Economic Development Corporation (RHEDC) and others are partnering with educational institutions and businesses to build the quantity and quality of the talent pool through talent development assistance programs.
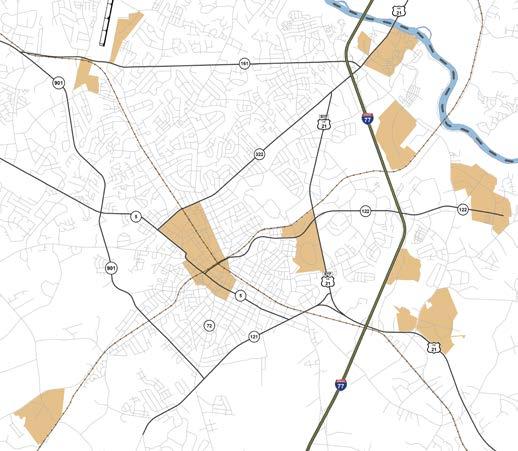
For the purposes of this plan document, employment centers are defined as areas where certain types of businesses are concentrated. In order to achieve synergistic land uses and appropriate densities, these centers can include business and industrial parks as well as mixed-use employment centers.
As mills closed in the 1980s and 1990s and unemployment rose, economic development became the leading priority. This is when the RHEDC obtained a grant from the Federal Economic Development Administration to fund the infrastructure for an industrial park on the southeastern side of the city airport. Revenues from the Airport Industrial Park were then reinvested into the next business park - TechPark. With convenience to I-77 and Charlotte, TechPark appeals to manufacturers, distributors, warehouses and logistics companies. Southway Industrial Park followed and helped to widen the array of offerings with characteristics to support heavy industrial including some sites with rail access. Waterford (1997) and Antrim Business Parks (early 2000) were then designed for big box warehouses, logistics and higher-end, light manufacturing. Since then Southcross Corporate Center, Aspen Business Park, Riverwalk Business Park, and Legacy Parks West and East have been added to the offerings.
This economic development has contributed to Rock Hill’s strength in the trade and logistics sector as noted in the above economic growth by industry section. To learn more about these Employment Centers and other site offerings visit here.
Knowledge Park is a walkable, multi-faceted district that lays a foundation for a modern knowledge economy, reinventing the original heart of Rock Hill, Map 4.3. It includes the areas of Winthrop University, University Center, and downtown. Additionally, there are a number of development projects recently completed and in progress that build on the City’s infrastructure investments in the heart of Rock Hill and contribute to the continued revitalization of downtown. Some of these projects are listed here, however for the latest information click here. • University Center • The Thread
Cotton Warehouse
The Herald Site
The Exchange
Riverwalk is a phased, master planned community located along the Catawba River. There are multiple mixed-use nodes within Riverwalk including the Town Center and the River District. The River District includes office and apartments above retail and restaurants with single-family homes within easy walking distance. While full build out is not yet complete as of this Plan, the Town Center is modeled after the urban Main Street and includes a grocer, YMCA, medical offices, and a banking institution.
Source: City of Rock Hill, Planning and Development Department
Numerous agencies are involved in economic development in York County and Rock Hill. The following overview briefly describes these major agencies and provides links to further details.
The Rock Hill Economic Development Corporation (RHEDC) is a non-profit organization that represents the business, educational, and community interests of the City while promoting jobs and supporting growth. The RHEDC is managed by a 15-member Board of Directors comprised of representatives from local businesses, educational institutions, City Management, and City Council. The activities of RHEDC include the development, management and marketing of business park properties, construction of speculative industrial buildings, partnerships with educational institutions in support of workforce/ talent development, and marketing and recruitment of jobs and businesses to the area. RHEDC’s purpose is to support the economic development goals of the City of Rock Hill.
The Rock Hill Economic and Urban Development (EUD) Department supports York County Economic Development’s efforts to retain and grow business and industry by making sure there are attractive sites and facilities for York County to market in Rock Hill. Current areas of focus include Knowledge Park, downtown, and City industrial and business parks. The City also takes a lead role in marketing and recruiting businesses on City owned property. EUD staff also serves on the RHEDC.
Additional organizations at the County, regional and state levels support and integrate with these Rock Hill economic development groups. The list below includes links to their respective websites for further details about their current goals and strategies.
York County Economic Development (YCED) is the primary organization responsible for retaining and growing business and industry in York County.
Two of the major YCED plans include:
• Strategic Economic Development Plan
• Target Industry Analysis
The Rock Hill/York County Convention & Visitors Bureau (CVB) promotes York County as a tourist destination and is a one-stop shop for planning a visit to the region with information about restaurants, hotels, events and things to do. For the latest information reference, visityorkcounty.com
The York County Regional Chamber of Commerce (YCRC) is a private, nonprofit organization made up of nearly 700 member businesses in the Fort Mill, Rock Hill, and Tega Cay areas.
The Catawba Regional Development Corporation is a nonprofit corporation through the Catawba Regional Council of Governments (CRCOG) that helps finance new or expanding businesses through loan and brownfield programs.
The CRCOG, with the alliance of the federal Economic Development Administration (EDA), supports growth and expansion of the local economy by providing financial assistance through loan programs including the SBA 504 program, the Revolving Loan Fund Program, and the Intermediary Relending Program.
The Charlotte Regional Business Alliance is a nonprofit, public/private economic development organization representing 14 counties in the Charlotte Region, including York County.
The South Carolina I-77 Alliance is a nonprofit economic development coalition of York, Chester, Fairfield, and Richland Counties, formed in 2013 to promote the I-77 business corridor in South Carolina.
The South Carolina Department of Commerce promotes economic opportunity for individuals and businesses in South Carolina. The City partners with Department representatives to meet regional and state economic development goals.
An effective transportation network is crucial to the movement of goods, services, and people. Increased stresses will continue to be placed on the network as the region continues to grow. With limited resources available, addressing these issues will become more challenging. Smart planning and coordination will be important in making the best decisions for the region. This element discusses --
the existing roadway, air, and multi-modal networks what the Planning Organizations, Committees, and Commissions that are involved in the planning process who how projects are funded, and transportation plans and studies that identify projects how
and concludes with how the “What”, “Who”, and “How” work together to improve our overall transportation network.
“ ...other things being equal, that town or city which has smooth, substantial highways leading into it will far outstrip the one which is difficult to reach because of rough and neglected roads.
– W.J. Cherry
“
Rock Hill Businessman circa 1895
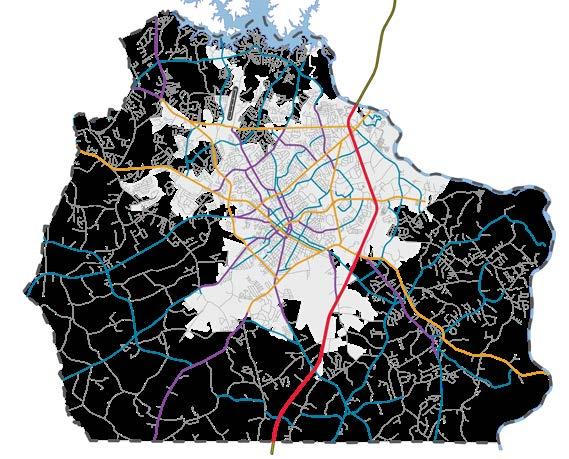
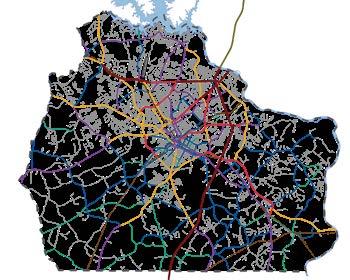
Functional classification is the process by which highways, roads, and streets are grouped according to the character of traffic and the amount of access they provide to varying land uses. There are five classifications within the Planning Area, which are highway, principal arterials, minor arterials, collectors, and locals, Map 5.1.
Interstate 77 runs north/south along the eastern side of the Planning Area. It is the primary connection to both Charlotte and Columbia, and serves as a connector to the Charleston Port.
Principal arterials provide the highest level of service at higher speeds for long uninterrupted distances. They carry traffic into and out of the region, and typically provide access from an Interstate to large-scale developments like malls, major shopping centers, and regional parks.
Principal arterials in the Planning Area include:
• US -21/SC-322 (Cherry Road)
• SC-161 (Celanese Road)
• SC-5 (Main Street)
• SC-122 (Dave Lyle Boulevard)
• SC-901 (Heckle Boulevard)
• SC-72 (Albright Road)
• US-21 Bypass (Anderson Road)
Minor arterials connect collector roads and local roads with principal arterials and provide access between smaller communities within the urban area.
Minor arterials in the Planning Area include:
• Ebenezer Road
• India Hook Road / Herlong Avenue
• Mt. Gallant Road
• Ebinport Road
• Saluda Street
• Constitution Boulevard
• Charlotte Avenue
• Oakland Avenue
Collector roads gather traffic from local roads and funnel them into the arterial network. Collectors in the Planning Area include:
• Cel-River Road / Red River Road
• Eden Terrace
• McConnells Highway
• McDow Drive
• Crawford Road
• White Street
• Oakland Avenue
Local roads provide the most access and least amount of mobility. These roads generally connect to one another or to collector roads. They serve short-distance travel and have low posted speed limits. Neighborhood roads within residential developments are an example. Local roadways are the most common roadway type in the Planning Area.
Source: City of Rock Hill GIS Department
Roadways in the Planning Area are owned and maintained by either the South Carolina Department of Transportation (SCDOT), the City, the County, Catawba Indian Nation, privately, or jointly.
South Carolina has the 4th largest state highway system and 36th lowest gas tax. This low tax and high mileage of highway leads to limited funding for maintenance. In 2017, the State passed a 2 cent tax hike for six years to increase funding for maintenance. The gas tax increase ended on July 1, 2022, ending the six-year period of consecutive increases.
SCDOT started the Turnback Program in 2018 to lessen future maintenance costs of SCDOT roadways. Once ownership is turned over to the municipality, it is responsible for all future maintenance costs.
1,109
Source: City of Rock Hill GIS Department
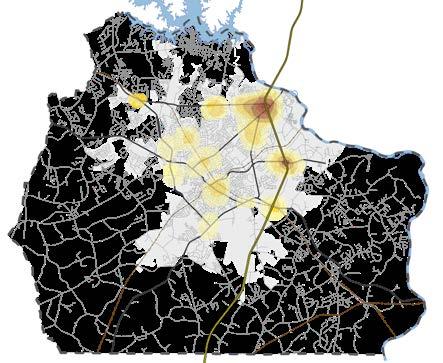
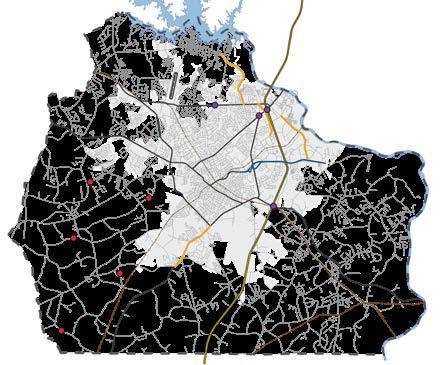
Traffic has continued to increase along most roadways in the City and Planning Area. The highest AADT volumes in the City are located along the interstate on Celanese Road (49,800), Cherry Road (43,300), and Dave Lyle Boulevard (38,300). Other roads with high volumes are Herlong Avenue, Anderson Road, and India Hook Road. AADT is not a good metric of congestion because it does not take into account functional classifications and roadway capacity. Volume to capacity is a ratio that compares the average daily traffic count to how many daily trips the road was designed to accommodate. In general, the roads with the most sections at, above, or near capacity are Celanese Road, Cherry Road, and Mt. Gallant Road.
MAP 5.3 AVERAGE DAILY TRAFFIC COUNTS, 2023
Source: SCDOT
MAP 5.4 VOLUME TO CAPACITY RATIO, 2022
Source: RFATS
Area Boundary

Between 2020 and 2024, there were more than 34,538 collisions in York County and approximately 13,000 within the City limits. 172 fatalities occurred from these collisions in the County, 36 of which were in the City. The highest concentration of collisions are located around the four I-77 interchanges within the City limits. Other areas with an increased prevalence of collisions are located at major roadway intersections like Celanese Road (SC-161) and Heckle Boulevard (SC901), Cherry Road and Oakland Avenue, Cherry Road and Charlotte Avenue, and India Hook Road and Celanese Road.
MAP 5.5 COLLISION HOT SPOTS, 2020-2024
Source: SCDOT Collision Data
The City operates a fare-free public transit service in partnership with Family Trust Federal Credit Union, Comporium, York Technical College, and Piedmont Medical Center called My Ride. The City operates a fleet of all-electric buses that run along four key corridors, Map 5.6. Service operates Monday-Saturday 7 AM to 7 PM with a ridership approaching 20,000 riders per month.
ADA-compliant buses have free wi-fi, mobile charging ports, infotainment screens and bike racks. The transit hub is located at Parking Deck B in University Center.
The CATS 82X offers service from Rock Hill to Charlotte during morning and afternoon peak hours. Pick up locations are at park-n-ride lots in Downtown on White Street and at Manchester Meadows.
York County Access is a more personalized public transportation service. It has two rider options during weekdays, which must be scheduled 24-hours in advance. The Essential Services option takes riders to medical appointments, the pharmacy, and stores. The Peak Period option is used to get riders to and from their workplaces.
MAP 5.6 PUBLIC TRANSIT ROUTES
Source: City of Rock Hill Planning and Development
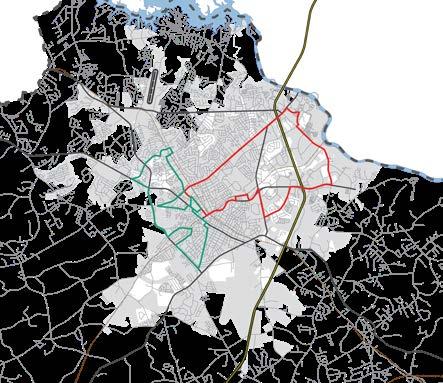
Cherry / Dave Lyle Loop
Saluda/Heckle Loop
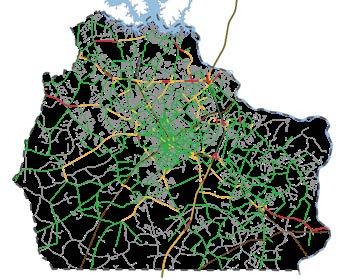
The City has a robust network of bicycle facilities, shared use paths, and sidewalks. The center of the City is laid out in a grid network and is wellconnected and walkable.
Many of the new bike, shared use path, and pedestrian facilities are funded and built by new development projects and the one-cent sales tax program (Pennies for Progress). Per the City’s Zoning Ordinance, new developments are required to build roadways with bicycle and pedestrian infrastructure. The City advocates for the inclusion of bicycle and pedestrian facilities in the Pennies for Progress project list, before the list is voted on by residents throughout the County.
More detailed information on the bike and pedestrian network can be found in the Connect Rock Hill Bicycle and Pedestrian Master Plan.
EXIT 77
A project at Exit 77 (I-77 and South Anderson Road) is being planned by RFATS to improve the safety and efficiency of this interchange area. High level planning efforts are currently underway, with design anticipated to begin in about five years.
EXIT 81
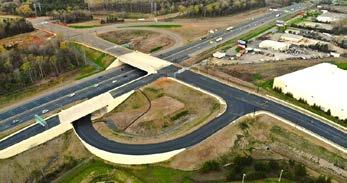
The new Exit 81 Interchange opened at the Overlook site in 2024.
FIGURE 5.3 I-77 INTERCHANGE, EXIT 81 PROJECT
Source: City of Rock Hill
The reconfiguration of Exit 82 will improve the safety and efficiency of the City’s busiest interchange. This is one of multiple interchange projects in York County that are funded by a partnership between the South Carolina Transportation Infrastructure Bank, York County, and RFATS. Design for
FIGURE 5.2 I-77 INTERCHANGE, EXIT 82 PROJECT, PROPOSED DESIGN
Source: SCDOT
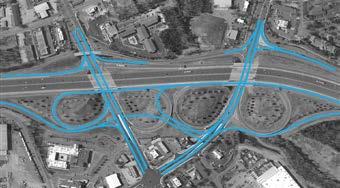
this interchange project is currently underway, with total project cost being finalized. This project is currently anticipated to start construction in about five years.
The Rock Hill-York County airport (UZA) is operated by the City of Rock Hill and thus is included in the Community Facilities Element, here.
Charlotte Douglas International Airport is located only 20 miles from Rock Hill. The airport has been undergoing renovations and expansions to handle the increase in passengers, which increased by nearly 2.8 million passengers between 2022 and 2023 according to the Federal Aviation Administration (FAA). Projects include expanding concourses and the terminal lobby, and adding a fourth runway.
The multi-modal freight network moves goods in and out of the City and throughout the region. It is comprised of roadways, rails, and ports.
Interstate 77 ranges between 124,700 and 57,700 AADT volumes. It has heavy truck traffic as these trucks pick-up and drop-off goods to businesses in the area and travel through Rock Hill and other areas in the region and beyond.
Two main rail lines owned by Norfolk Southern and CSX serve a number of industrial customers in the City and County. Fifteen intersections are located within the Planning Area where the trains regularly block traffic. The City of Rock Hill has made safety improvements to the crossings in Downtown which has led to the area becoming a “whistle quiet zone”. A pedestrian bridge will reconnect downtown to University Center, allowing pedestrians to easily traverse over Dave Lyle Boulevard and the railroad tracks.
Rock Hill is located near several ports. The closest port is the Inland Port in Greer, S.C., which is located 80 miles from Rock Hill and was opened in 2013. In 2018, another Inland Port was opened in Dillon, S.C. Both are served by rail and roadway, and connect directly to the Charleston Harbor, which is less than 200 miles from Rock Hill. The harbor won congressional approval in 2016 to be deepened to accommodate larger ships and is awaiting funding.
Transportation planning is handled by multiple organizations:
• City of Rock Hill
• South Carolina Department of Transportation (SCDOT)
• Rock Hill-Fort Mill Area Transportation Study (RFATS)
• York County
• Pennies for Progress
These organizations work together to ensure projects target the needs of the citizens in the City, County, and region.
The City's Transportation Planner is responsible for reviewing site plans and traffic analyses to ensure new developments will not adversely impact the transportation network. The Transportation Planner is the principal contact for identifying and tracking transportation needs.
The Transportation Planner coordinates with the City’s My Ride Transit Administrator on maintaining the City’s Fixed Route Transit System and implementing any necessary changes. Further, the Transportation Planner serves as the staff liaison for the City’s Traffic Commission, is a member of the RFATS Technical Team, and represents the City on various SCDOT bodies.
The Long Range Planning staff conducts corridor studies, small area plans, and functional plans that identify needed transportation improvements. Most recently, it worked on the South Carolina Commerce Corridor Study and identified transportation upgrades that are needed to support development.
The Airport Director oversees day-to-day operations at the airport and the Airport Layout Plan and Airport Master Plan.
South Carolina Department of Transportation plays a large role in transportation planning since more than 50% of roads in the Planning Area are SCDOT-owned and maintained. All improvements require SCDOT approval and are generally fully or partially funded by SCDOT. SCDOT representatives hold positions on the City’s Traffic Commission, and the RFATS Technical Team and Policy Committee. SCDOT and the City’s Transportation Planner coordinate regularly regarding proposed developments and roadway changes.
SCDOT allocates funding through both federal and state programs to jurisdictions to address transportation needs. Notable programs include:
• Congestion, Mitigation, & Air Quality Improvement Program (CMAQ)
• Transportation Alternative Program (TAP)
• State Mass Transit Funds Program (SMTF)
• Guideshare
The Rock Hill-Fort Mill Area Transportation Study is the Metropolitan Planning Organization (MPO) for eastern York County and the panhandle of Lancaster County, and is one of more than 400 nationally. MPOs carry out the transportation planning process for urbanized areas with populations greater than 50,000. RFATS is responsible for long- and short-range transportation planning, and programming of all federal transportation funds in its boundary, Map 5.9.
One of RFATS primary responsibilities includes the maintenance and 5-year update of the Long Range Transportation Plan (LRTP) which covers a 20 to 25year planning horizon. Below are the top federally funded projects identified in the LRTP. There are three in Rock Hill which are highlighted below.
Another primary responsibility of RFATS is maintaining a short-term planning document called the Transportation Improvement Program (TIP) which identifies projects that will be implemented over the next four to six years within the RFATS boundary.
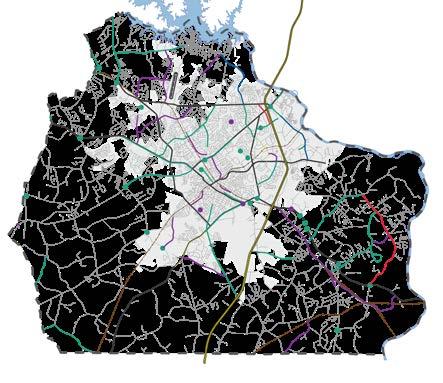
Several TIP projects are located within the Planning Area which also include some Pennies for Progress projects that receive RFATS funding, Map 5.10. These projects are funded through the York County’s Pennies for Progress Program or through federal programs such as Transportation Alternative Program (TAP), Congestion Mitigation & Air Quality Improvement Program (CMAQ), and Federal Bridge programs.
The LRTP and TIP documents, as well as other RFATS plans and information, can be found here.
Source: RFATS Transportation Improvement Program
Widening Bike/Ped Improvement
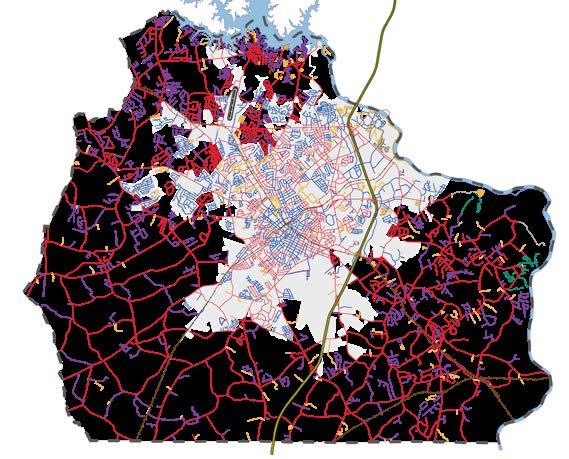
The County manages the Pennies for Progress Program. The program has provided funding for transportation projects for nearly three decades. The fifth referendum was approved by York County residents in late 2024. Projects include road widenings, resurfacing, bicycle and pedestrian improvements, interchange and intersection improvements, and safety improvements. More detailed information about Pennies for Progress projects can be found here.
The York County Planning and Development Department conducts transportation reviews for subdivisions and commercial development plans and reviews transportation impact analysis (TIA) studies. The York County Planning and Development Department and the City Planning and Development Department often coordinate regarding developments within or in close proximity to City limits.
MAP 5.10 PENNIES FOR PROGRESS PROGRAM PROJECTS [1997 - 2024]
Source: York County GIS Department
Several committees within the City, RFATS region, and State review and make recommendations to elected officials, or guide policy decisions and transportation planning processes. Some local committees also advocate for and promote bicycle and pedestrian facilities.
The Rock Hill Traffic Commission reviews and makes recommendations to the City Council on ways to better manage local traffic issues, such as policy and ordinance changes, changes in speed limits, improvements of signage and pavement markings, and placement of traffic calming devices. The Traffic Commission is made up of a City Council member and City staff. A representative from the SCDOT also attends the meeting to coordinate on issues involving state roads.
The Parks and Recreation Committee creates policies and assists in the administration of the parks and recreation program. It is comprised of nine members appointed by City Council. One subcommittee called the Trails & Greenways Advisory Committee is charged with reviewing issues related to trails and greenways throughout the City.
The Rock Hill Outdoor Center Advisory Committee is a 13-member cycling advisory group dedicated to raising private funds and sponsorships for the construction of the cycling amenities at the Rock Hill Outdoor Center. Members of the group are appointed by the Parks and Recreation Commission. Additional responsibilities include recruitment of volunteers,
making recommendations on future programs and special events as well as assisting with outreach programs that benefit the community and the Rock Hill Outdoor Center.
The joint City/County Airport Commission advises the City Council on operational matters, and advises both the City and County Councils on planning and capital improvements.
The City has at least one member on RFATS committees/teams that influence local transportation policy and programs.
The RFATS Policy Committee guides the RFATS planning process. The committee is made up of 15 voting members, and one non-voting member (SCDOT Commissioner); four voting members are Rock Hill City Council members. They are responsible for debating and making policy decisions on key MPO actions and issues, including adoption of the LRTP, TIP, annual planning work programs, budget, and other policies.
The RFATS Technical Team provides guidance to the Policy Committee on operational, technical and other relevant policy requirements associated with the metropolitan transportation planning process. The team includes staff from Rock Hill, Fort Mill, Tega Cay, York County, and Lancaster County. The team also includes representatives from federal and state agencies like the Federal Highway Administration (FHWA), Federal Transit Administration (FTA), Catawba Regional Council of Governments (CRCOG), and SCDOT.
Many governmental and nongovernmental create transportation plans and studies to a guide transportation-related decisions in the region. Click on the plan or study name to learn more.
CITY OF ROCK HILL
Strategic Plan
Defines measurable goals for increasing connectivity, safety, pavement conditions, and walkability
RFATS 2050 Long Range Transportation Plan
A multi-modal plan, covering highways, public transportation, freight, bicycle and pedestrian travel, and aviation
Collector Road Study
Analyzes collector road network and identifies new future links
Regional Bicycle and Pedestrian Connectivity Plan
Strategies to develop a more complete bicycle and pedestrian network
YORK COUNTY
York County Thoroughfare Plan
Long-range plan for major transportation facilities
I-77 South Corridor Small Area Plan
Addresses potential land use conflicts between future development and existing low-density and rural residential communities
CAROLINA THREAD TRAIL
Master Plan for York County Communities
Long-term coordination of greenway and trail development
Trail Benefit Study
Long-term coordination of greenway and trail development
In 2007, the RFATS Policy Committee created a Citizens Advisory Committee to provide input and review the RFATS’ transportation planning process and activities. Members include representation from the six RFATS communities and at-large members representing underserved populations. The RFATS Land Use & Policy Subcommittee provides review and recommendations related to land use for the Policy Committee.
The SCDOT Commission is the administrative and governing authority of SCDOT. There are nine members, one member from each Congressional District and two at-large members, who are appointed by the Governor and subject to legislative approval.
Several local groups enable residents to advocate for bicycle and pedestrian facilities as well as promote their usage. Below is a list of groups with links to their respective websites where applicable.
• Wholespire York County
• Bike/Ped Coalition of York County
• Rock Hill Bicycle Club
• Riverwalk Cycling Club
• Rock Hill Mountain Bike Club
Transportation projects are expensive and funding is generally limited. Additionally, needs are always greater than funding so projects must be prioritized.
Federal funds are distributed to the State, which are allocated to the 11 MPOs based on the proportion of the MPOs population to the state’s urban population determined by the U.S. Census. RFATS receives $12.4 million and uses the funds to implement projects in the LRTP.
This program aims to increase transportation choices and improve the transportation experience. The program is managed by RFATS, which receives $729,900. Funds can be used for bicycle and pedestrian facilities, and streetscape improvements. The application is competitive due to the limited funding.
CMAQ funds are used to reduce congestion and improve air quality in areas that do not meet federal standards. RFATS receives $3,661,000 million annually to address this issue. CMAQ funding can be used towards public transit, improving traffic flow, bicycle and pedestrian facilities, and more.
Since 2002, the City of Rock Hill utilizes over $2,000,000 per year of federal 5307 funding to support various public transportation services like My Ride,
CATS 82x, and York County Access. The federal funding provided through the 5307 program requires a percentage of local funding to match the available federal funding.
These funds are a grant source managed by SCDOT that help municipalities fund local matches for federal transit funds. Eligible assistance categories include capital, administration, operations, and some contracted services. In recent years, the City has received nearly $1.4 million to help fund the demand response bus service, the CATS 82x, and operations.
Since 2010, the City has been awarded $500,000 in South Carolina RTP grants ($100,000 in 2010, 2012, 2015, 2017, and 2023). The program is designed to help states provide and maintain recreational trails for motorized and nonmotorized recreational uses such as hiking, biking, equestrian use, off-road motorcycling, and four-wheel driving.
The City has also received several other federal grants These included:
• In 2021, more than $2.8 million from the Federal Transit Administration through the competitive Bus and Bus Facilities Grant Program for electric chargers and more buses.
• In 2023, more than $10 million through the US Department of Transportation’s competitive Neighborhood Access and Equity Grant Program for a pedestrian bridge over Dave Lyle Boulevard and the Norfolk Southern rail line to improve connectivity and pedestrian safety downtown.


Pennies for Progress has budgeted approximately $1 billion dollars in the five referendums for transportation projects and improvements.
Pennies for Progress is one of the largest funding sources for new transportation projects. The program levies a 1% sales tax on goods and services purchased in York County. The program has seen a total of five referendums passed by York County residents in 1997, 2003, 2011, 2017, and 2024.
Funded through the gas tax, C-Fund is a partnership between SCDOT and counties to fund roadway improvement projects on any jurisdictional road. The City received nearly $920,000 in FY24/25. Funding varies from year to year, and the City has seen no funding in some years. Each year, York County solicits requests from the jurisdictions, evaluates and prioritizes them, and the projects are approved by County Council.
The City allocated $1.235 million to repaving projects in FY24/25. About $50,000 is also allocated for emergency sidewalk repairs and installation of ADA-compliant curb ramps. The City also allocates general funds to the construction of capital projects identified in City plans. The Traffic Commission is allocated $45,000 a year to implement traffic calming projects, safety improvements, and necessary evaluations.
As mentioned in the Economic Development Element, the City has several TIF districts. This financing tool can be used for public improvements such as streets, sidewalks, and transit facilities within these districts.
A 2% local hospitality tax is levied on consumers purchasing prepared foods and beverages from vendors located within the City of Rock Hill. About $50,000 from Hospitality Tax revenues is allocated to trail construction and about $50,000 is allocated to trail maintenance annually.
My Ride is funded through federal and state grant funding along with local contributions from the City of Rock Hill and its partners. As mentioned on the previous page, the City of Rock Hill utilizes federal 5307 funding to support
My Ride. The City's partners together graciously provide $350,000 per year, which helps satisfy a portion of the local funding needed each year.
the transportation planning process

Time - 7Years


Identify & Prioritize Needs
[study, community engagement, etc.]
Sponsorship
Funding [dollars]
Design & Review
[project type dictates organizations involved ]
Implementation
Potential Organization(s)
S.C. DOT
RFATS
York County
Rock Hill Other
Potential Funding Sources
RFATS
Guideshare
TAP
CMAQ
S.C. / Rock Hill
RTP
Mass Transit
York County
C-Fund
Pennies For Progress
Rock Hill
General Fund
TIF
Hospitality Tax
Other
Public-Private Partnerships
The intent of the Community Facilities Element is to provide general information about the community facilities and services currently offered within Rock Hill and the larger Planning Area, with the exception of transportationrelated facilities, which are addressed in a separate element of this Plan (see Transportation Element). Some community facilities and services are needed to provide basic levels of health and safety, while others help to maintain a high quality of life, promote job creation and create a more sustainable economy. Because these facilities and services are provided and maintained by a variety of organizations, this element assesses both public- and private- sector utilities and community facilities in order to show the need for cooperation and a shared vision. This element presents an inventory and analysis of existing conditions and needs for capital facilities and utilities, community safety, education, and other government facilities. As the City’s population grows, it may be necessary to build more facilities or consider providing new services. Rock Hill will be challenged to meet the additional demand while maintaining levels of service for current constituents. Through this element, Rock Hill and its partner agencies can better ensure that the current and future infrastructure needs of the community are met as the population continues to grow.
The Community Facilities Element is directly related to many of the elements in the Plan as follows:
LAND USE ELEMENT Land development patterns are largely determined by available infrastructure and services, such as water, sewer, electric, fire protection, and school locations. The land use and community facilities
elements must be coordinated to reduce sprawl and minimize strain on infrastructure systems and community services.
HOUSING ELEMENT Impact fees collected from new housing developments help fund capital infrastructure improvement projects while the availability of facilities and services affect peoples’ housing decisions.
TRANSPORTATION ELEMENT The availability or lack of transportation affects people's ability to participate in or benefit from the provision of certain community facilities and services.
CULTURAL RESOURCES ELEMENT Cultural resources such as schools and libraries are important community facilities that offer programs and services to enrich lives and enhance quality of life.
ECONOMIC DEVELOPMENT ELEMENT The City’s economic growth and ability to attract and retain employers is largely dependent on the infrastructure, services and amenities available.
PRIORITY INVESTMENT ELEMENT Through this element, planned public infrastructure and facilities’ projects are prioritized and coordinated with adjacent and relevant jurisdictions and agencies.
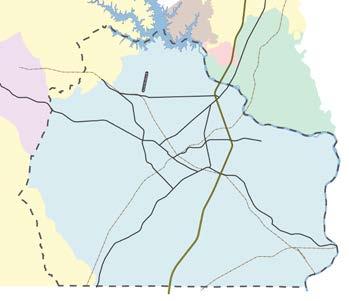
The City of Rock Hill has owned, operated, and maintained its own Water Filter Plant (WFP) and distribution system since 1911. Through these facilities, the City provides potable water service to the majority of residential, retail/ commercial, and industrial facilities and/or structures within the City limits. The City also serves as the regional provider for potable water, servicing select properties in the City’s Water and Sewer Service Territory that extends outside the Planning Area as well as wholesale customers (i.e., York County, City of York, Town of Fort Mill, and The Catawba Nation), Map 6.1. These wholesale customers serve other unincorporated areas of the County, the Lake Wylie community including River Hills, the City of York and outlying areas, and the majority of Fort Mill Township including the City of Tega Cay and Town of Fort Mill.
The City has two sources of water; the primary source withdraws water from Lake Wylie and the Catawba River provides a secondary source. The City is currently permitted to withdraw up to 60 million gallons per day (MGD) from Lake Wylie and is exploring options to accommodate future water system growth. To provide adequate capacity, the City upgraded its intake facility’s pumping capacity in 2013 from 30 MGD to 48 MGD to accommodate the planned 36- to 48-MGD expansion to the City’s WFP.
Raw water from the Lake Wylie Intake Facility is transported through a 54inch pipe to the WFP.
In 2008, the City updated the Catawba River Raw Water Intake Facility to provide additional raw water pumping capacity (up to 6 MGD) for peak
usage times and emergency purposes. Raw water from the Catawba River Raw Water Intake Facility is transported through a 20-inch pipe to the WFP. The locations of these two intake facilities are shown on Map 6.2.
Originally built in 1949, the City’s WFP is shown on Map 6.2. It was recently expanded to increase its treatment capacity from 36 MGD to 48 MGD to accommodate growth demands. The WFP operates a laboratory to monitor water quality according to national drinking water standards as required by the Safe Drinking Water Act (SDWA). The South Carolina Department of Environmental Services (SCDES) serves as a coordinating agency for the State’s Source Water Assessment and Protection Program (SWAP), providing assessments and implementing safeguard measures to further protect the health of public water system consumers.
The City completed construction of a new high-service pump station at its WFP to accommodate the 36- to 48-MGD expansion in 2016. This pump station has adequate pumping capacity to push the needed finished water from the WFP and into the distribution system.
SCDES recommends that public water systems have storage equal to or in excess of one-half of its maximum day demand. This added storage volume allows the pumps to rest at periods throughout the day, to provide water during prolonged service interruptions, and to provide water for fire emergencies.
The City currently has three underground storage tanks located at the WFP.
These three tanks have a total storage capacity of 3 million gallons. The City also has five elevated water storage tanks on its distribution system with a total capacity of 4.75 million gallons. With this volume, the City needs additional storage on its system to meet SCDES recommendations, and is currently evaluating sites for a new elevated water storage tank.
York County currently has four emergency water connections in place with Charlotte Water. Three of these connections are located in the Carowinds area. The fourth connection is located near River Hills at Buster Boyd Bridge in the Lake Wylie community. In case of a major emergency, temporary booster stations can be installed to backfeed the water systems in York County. However, the system has not been modeled, and therefore it is not known how much the City of Rock Hill can receive through this avenue if needed.
Emergency connections to the surrounding water systems owned and operated by Chester Metropolitan District (Chester Metro) and Lancaster County Water and Sewer District (LCWSD) are not possible due to incompatibilities in the disinfectants used in their systems. (The City of Rock Hill and Charlotte Water use chlorine as a disinfectant while Chester Metro and LCWSD use chloramines.)
Figure 6.1 shows the average daily demands (ADDs), number of water customers, and water sales over the past 10 years. Although the ADD increased over the past several years due to the increase in new development and the number of irrigation systems installed, the 48 MGD expansion enables continued service and additional growth into the future.
Source: City of Rock Hill Planning & Development
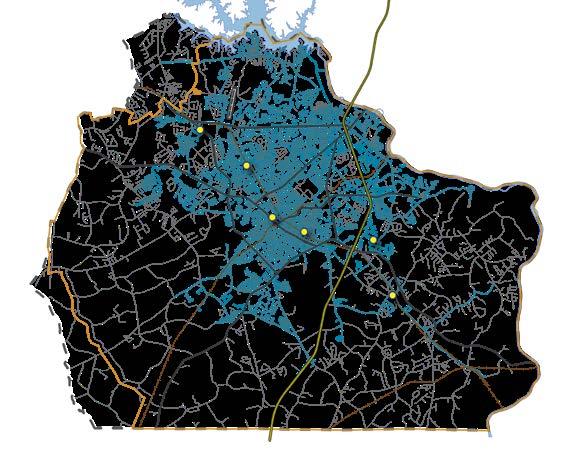
Customer Base More than 34,000 customers located within the Rock Hill Water and Sewer Utility Service Territory are served by the City’s water system - a 13 percent increase between 2014 and 2023 (see Figure 6.1). The Water Department reports that about 86 percent of the City’s water system customers reside within the Rock Hill City limits.
Additionally, tens of thousands of customers are served outside the Rock Hill Water and Sewer Utility Service Territory by the City’s wholesale customers - York County, the City of York, the Town of Fort Mill, the City of Tega Cay, (which receives its water from the Town of Fort Mill), and The Catawba Nation. The majority of these wholesale customers have experienced substantial customer growth over the past 10 years as well, and customer growth is anticipated to continue throughout the planning horizon.
Water Demand To help project water demand, the City of Rock Hill requires its wholesale customers to submit projections each year of their anticipated water demands five years into the future. The City also performs an analysis on its system demand, and these projections are combined and compared to the WFP capacity. Review of the water demand as depicted in Figure 6.1 shows a slight decrease in water demands between 2017 and 2020 with a subsequent rise between 2020 and 2022. Staff believes that this is likely due to development impacts and usage changes during the pandemic.

2 Intake
1 Water Filter Plant
Source: City of Rock Hill Finance Department
Average Daily Demand (ADD) Revenue Customers
Water Sales/Revenue Water Fund revenues primarily consist of revenue generated from the sale of water, collection of meter base fees, and collection of impact fees. A small portion of the revenue is generated through penalties.
During 2023 and 2024, all wholesale customer meters were replaced and updated, which provides more accurate billing results and corresponding increases in revenues. As indicated in Figure 6.1, water sales grew steadily from 2016 to 2023. The FY2025 water budget is more than $28.5 million, making water sales the third-largest source of utility revenues for the City of Rock Hill. The three largest users of the City’s water system included York County, the Town of Fort Mill, and the City of York (FY23).
The City began implementing a water impact fee in FY04 to help offset utility revenue bonds issued to fund needed improvements. Approximately $6.9 million in water impact fees have been collected since the impact fee was initiated. The amount of impact fees collected varies greatly from year to year with the rise and fall of new construction, and as a result are viewed as a supplemental revenue source.
Rock Hill established a wastewater system in 1911. The City’s system includes a wastewater treatment plant (WWTP) and collection system. Through these facilities and subsequent extensions and new construction, the City provides sanitary sewer service to the majority of residential, retail/commercial, and industrial facilities and/or structures within the City limits. It also serves select portions of the City’s Water and Sewer Service Territory that extends beyond the Planning Area as shown on Map 6.1, 6.3. Sewage is also received by the City from its wholesale customers that serve customers outside the City’s Water and Sewer Service Territory. The wholesale customers include York County, City of Tega Cay, and The Catawba Nation. These wholesale customers serve others located in the unincorporated areas of the County including the Lake Wylie community and the properties located outside the area served by the Town of Fort Mill.
The Manchester Creek WWTP was built in 1970. The plant was expanded in 1991, 1996, and 2001. The City is in the planning stages for the next expansion, which will allow an increase from 20 MGD to 30 MGD. Construction is scheduled to begin in 2025. Recent construction projects replaced equipment and processes beyond their useful life and provided improved efficiency needed for future upgrades. Effluent from the plant is discharged to the Catawba River. The location of the plant is shown on Map 6.3.
SCDES tracks capacity of the WWTP based on the Base Flow Tracking Value (BFTV), which is the average of the highest three months over the last three years, and also by the City’s commitments for granting wastewater treatment capacity once the highest annual average daily demands exceed 80 percent of
Source: City of Rock Hill Planning & Development
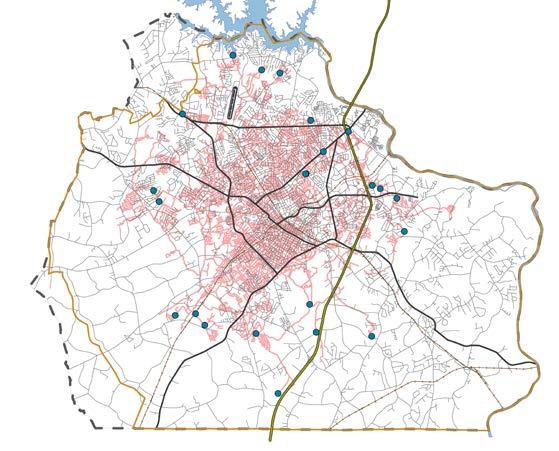

30 MGD permitted water withdrawal
37K+ Customers
3 Wholesale Customers
12.2 MGD 2023 ADD
1 Wastewater Treatment Plant
21 Lift Stations
Source: City of Rock Hill Finance Department
the plant capacity. Based on the last three years, the BFTV is 14.85 MGD, Figure 6.2. The City of Rock Hill has made the commitment to be the regional provider for wastewater treatment.
Construction is in the finishing stages on a new Headworks for the WWTP. This work includes a new influent pump station with course screening, new fine screening and grit removal, two new flow equalization basins, odor control, new electrical systems, and a new SCADA (supervisory control and data acquisition system). The City plans to increase the capacity of the WWTP. Construction is slated to begin in 2025.
The average age of the City’s collection system piping is approximately 41 years. The Utilities Department is continually improving and/or updating the collection system by replacing older, inefficient piping as part of its Water and Sewer Utilities Capital Improvement Plan. Piping replacement projects are planned to increase capacity to accommodate new development, reduce the amount of inflow and infiltration into the system, and to remove some of the City’s maintenance-intensive pump stations from service. Collection system piping is also being extended by developers to serve new projects.
Customer Base In 2023, more than 37,000 customers were served by the City’s wastewater system - a 17 percent increase since 2014, Figure 6.2. The Sewer Department reports that nearly 91 percent of the City’s wastewater system customers reside within the Rock Hill City limits.
Hydraulic Loadings Although the number of customers has risen every year, wastewater hydraulic loadings have fluctuated over the past 12 years. This fluctuation is believed to be the result of variations in drought conditions and wet weather events, water conservation, increased development, and reduction of inflows and infiltration due to piping upgrades.
Wastewater Revenue Wastewater Fund revenues primarily consist of revenues from sewer charges and base fees, although other sources include various surcharges, fees, and penalties.
The City began implementing a wastewater impact fee in FY04 to help offset utility revenue bonds issued to fund needed improvements. More than $11.7 million in wastewater impact fees have been collected since the Wastewater Impact Fee Fund was initiated. The amount of impact fees collected varies greatly from year to year with the rise and fall of new construction, and as a result are viewed as a supplemental revenue source.
As shown in Figure 6.2, revenues from wastewater fees have increased 67 percent over the last 10 years. With a budget of more than $35 million in FY2025, wastewater fees currently represent the second-largest source of utility revenues for the City of Rock Hill. The three principal wastewater customers based on revenues include York County, City of Tega Cay, and Rock Hill Schools (FY23).
The City has operated the electric system since 1911. The system provides electric service to more than 38,000 residential, commercial, and industrial customers within the City limits. This is a thirteen percent increase since 2014 of about 30,000 customers. Map 6.4 shows the Rock Hill Electric service area and electric providers' territories in the Planning Area.
Source: City of Rock Hill, Planning and Development Department
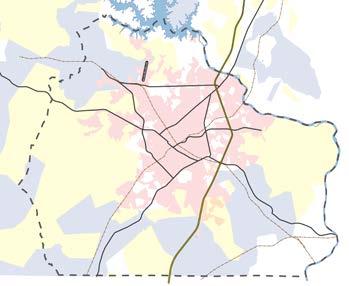

38K+
Source: City of Rock Hill Finance Department
The City purchases the majority of its electric power, about 85 percent, from Piedmont Municipal Power Agency (PMPA). The City purchases an additional four to six percent of its power from Southeastern Power Administration and the remaining electricity needs are met through supplemental sources. The number of residential and non-residential electric customers grew 13 percent and 10 percent respectively from 2014 to 2023, Figure 6.3.
With a budget of more than $114 million in FY25, electric sales currently represent the largest source of utility revenues for the City of Rock Hill, Figure 6.3. A rate decrease of 4% was approved by City Council in FY 2021. The City operates numerous emergency standby/load management generation units in various City facilities that provide power during outages.
The City is continuously expanding and upgrading its electric infrastructure. Recently upgrades have been completed in the blocks encompassed by Oakland Avenue, Peoples Place, Charlotte Avenue, and Dave Lyle Boulevard overpasses. The City is also strategically burying overhead utility lines as roadway projects occur, and upgrading the performance and efficiency of street lighting throughout the City with LED technology and controls. Infrastructure has been buried/relocated to facilitate new growth projects such as The Exchange apartments and Hoppin' bar. Additionally, powerlines and fiber optics lines have been buried along Charlotte Ave as part of a streetscape improvement project. The City is also working to extend electric infrastructure in the southside areas of Rock Hill. This includes two major projects that extend underground, main-line power out Mt. Holly Road from Oakdale Road to I-77, and on Porter Road from Hawkfield Road to Long Meadow Road.
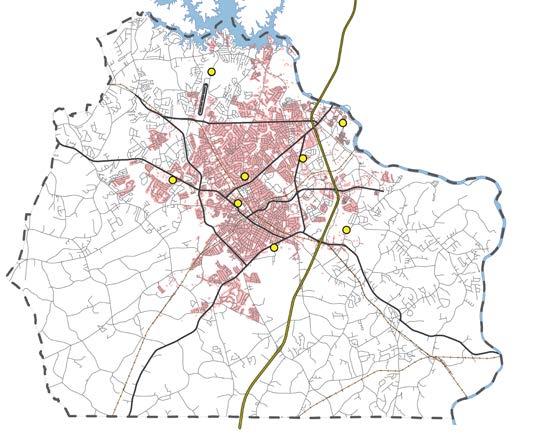
York County Natural Gas Authority provides residential, commercial, and industrial gas service to customers throughout York County and the northeast portion of Cherokee County, Map 6.6. While not every area has service, most residential subdivisions have service as well as all industrial parks. The Authority’s Customer Center is located at 965 West Main Street in Rock Hill. York County Natural Gas Authority, which renovated the original Pepsi-Cola

Bottling Plant at the corner of Cherry Road and West Main Street in 1986, completed a major renovation in 2020. This location now includes a larger appliance showroom that highlights many different residential and commercial uses of natural gas. The new showroom is located at 979 West Main Street.
In 2003, the gas authorities in York, Chester and Lancaster counties officially formed a joint action agency called Patriots Energy Group (PEG) to work in partnership to more effectively manage natural gas pipeline capacity and supply. In 2011, PEG completed construction of a 39.4-miles natural gas pipeline which is connected to the Williams Transco pipeline in Blacksburg, SC. Today, York County Natural Gas Authority, as the pipeline operator, manages over 69 miles of transmission pipeline and 16.6 miles of distribution pipeline. The
customers of the three gas authorities have saved millions of dollars in pipeline capacity charges since the pipeline was put into service. The Authority and PEG continue to enhance capacity for future growth through the addition of lateral pipelines on the system.
In 2018, the gas authorities in York, Chester and Lancaster counties formed a joint action agency called Patriots Energy Group Financing Agency (PEGFA) to allow for the issuance of prepaid gas debt. In September of 2023, PEGFA completed its second prepay transaction with Goldman Sachs, securing discounted gas supply for the next 30 years. This arrangement builds on the 2018 RBC prepay issuance, ensuring that a substantial portion of PEG’s natural gas supply will be financed at discounted rates.
Source: YCNGA
The Comporium Group provides telephone, long distance, wireless, cable TV, Internet, security, data services and directory publishing to more than 95,000 residential and commercial customers in the greater Rock Hill area. Comporium has a franchise agreement with the City to provide cable television service. Comporium provides Zipstream services, a state-of-the-art fiber-optic network, to Knowledge Park and many of the industrial and business parks in Rock Hill including Waterford Business Park, Airport Industrial Park, Rock Hill Industrial Park, Riverwalk Business Park, and Southcross Corporate Center.
Lumen / CenturyLink has also entered into the Rock Hill market as a business Internet Service Provider (ISP), providing Gigabit technologies and internet security services to area businesses. This tier one provider is continuing to expand its services and capabilities to the Rock Hill region.
For decades, the City has been a technology leader and continues to make significant investments into technologies that are integral to efficient and viable government services. The City owns a fiber-optic network that inter-connects all its facilities and provides the services necessary to operate the City's data centers, communication and transportation systems, general city services, and Wi-Fi systems. Fiber optic technologies are the core to connecting the 50-plus City facilities along with the Advanced Metering Infrastructure (AMI) utility metering controls that enables all of the City’s utility customer services and other related services like traffic controls. The City’s reputation as a technology leader in the sports tourism industry continues to receive acclaim as the City hosts world and national events yearly.
Mobility and real-time communications are essential for most City operations today, and as such, the City relies heavily on both cellular and Wi-Fi services.
The advancements in cellular technologies coupled with Wi-Fi infrastructure gives City operations a "work from any location" capability. The Wi-Fi infrastructure communicates through various direct fiber interconnections or localized service mesh topologies to provide necessary strategically-located services and process connectivity throughout the city. Any City vehicle can be equipped with cellular mobile connectivity and enhanced Wi-Fi uplink capabilities. This means all City services are available to employees regardless of their location, even when vehicles or persons are in full motion; as such, this greatly enhances services for public safety, utility, and operational fleet vehicles. The wireless communications system is today fully matured and is utilized by all City departments. The City continues to use aspects of the Wi-Fi system to address communication needs and backhaul services of the Utility’s AMI.
The City's communications systems are continuously being maintained and improved to keep up with changes and technology advancements. High Availability (HA) and Disaster Recovery (DR) technologies are woven into every City core and network service. To manage this extensive system properly, the City has begun incremental yearly upgrades to critical infrastructure, such upgrading to the latest technologies and adjusting overall coverage areas. As the wireless technologies have changed and matured, the City has adapted and moved away from obsolete Wi-Fi mesh architectures, in lieu of fully targeted and hybridized wireless and cellular technologies.
The Rock Hill Public Works Department provides residential and commercial sanitation services. The department ensures that garbage, recyclables, yard waste, and bulky items are collected and disposed of in compliance with regulatory standards.
23K+ Customers

41,630 Tons of Garbage (annual average)
3,500 Tons of Recyclables (annual average)
6 City Collection & Recycle Centers
10 County Collection & Recycle Centers
The City provides weekly curbside waste collection to all residential households in the City (more than 23,000 customers), Map 6.9. Electronic items are not picked up curbside, but residents can take them to the Rock Hill Operations Center. Residents can also take electronics, as well as garbage and paint, to any of the 16 York County Collection and Recycling Centers – six of which are located in Rock Hill. The City also provides commercial garbage and Dial-ADumpster services to just under 1,500 customers.
Solid waste generated in Rock Hill is transported to the York County Solid Waste Transfer Station, where it is processed and loaded onto trailers for transport and disposal to a landfill facility in Richland County, SC. York County is currently in third year of a five-year contract with Waste Management for
disposal at its Richland County facility; the contract will expire in October 2027. The 2023 SCDES Solid Waste Management Annual Report provides a comprehensive view of solid waste management for the State and the County.
Construction, demolition, land clearing debris, and certain household hazardous materials are received at the York County landfill. York County secured a Construction & Demolition (C&D) permit to cap over the closed municipal solid waste (MSW) cells. This permit enables the C&D landfill an estimated 240-year lifespan. A second permitted (C&D) landfill is open to the public in York County - Coltharp Landfill in Fort Mill.
The City also offers weekly curbside recycling services to all residential households. Currently all residential households are provided recycling bins. Residents may also take recycling to any of the York County Collection and Recycling Centers. Recycling services are available by contract to commercial, industrial, educational, and multi-family residential uses. The City has a recycling contract with Rock Hill School District Three. Recyclable cardboard is taken to the Pratt Industries Plant on Cel-River Road. Residential recycling and mixed commercial recycling are taken to the York County Recycling Center.
Between FY19/20 and FY21/22, the City saw a 6% increase in the amount of commercial garbage generated and a four percent increase between FY21/22 and FY23/24. Residential garbage experienced a similar trend with a 7% increase, but then saw a 1% decrease over the same respective timeframes, Figure 6.4. Curbside bulky trash saw decreases of 29 percent from FY19/20
to FY21/22 and 28% from FY21/22 to FY23/24. While cardboard recycling declined from FY19/20 to FY21/22 by 1%t, it rose by 2% from FY21/22 to FY23/24. Mixed recycling saw decreases of 27% from FY19/20 to FY21/22 and 17% from FY21/22 to FY23/24. Residential recycling also experienced decreases including a decrease of 28% from FY19/20 to FY21/22 and 6% from FY21/22 to FY23/24, Figure 6.4.
Source: City of Rock Hill Public Works
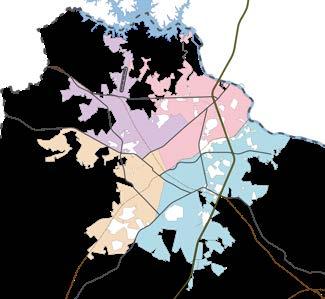
In the early 1990s, City Council recognized the need to address the City’s failing and undersized stormwater systems. The City appointed a citizen task force in 1995 and established a Stormwater Division in 1996, as well as a Stormwater Advisory Board. Rock Hill became a federally designated National Pollutant Discharge Elimination System (NPDES) Phase II community in 2004. The federal regulations establish six categories of Best Management Practices (BMPs) that must be implemented including public education, public involvement, illicit discharge detection and elimination, construction site stormwater runoff management, post construction stormwater management, and good housekeeping and pollution prevention. For details on the programs and policies initiated by the City, see the Stormwater Management section of the Natural Resources Element.

Stormwater Programs & Policies here
Stormwater Management Design Manual here
Neighborhood Stormwater Project List here
Master Plan Study projects here
398 miles of stormwater pipe
437 detention ponds
The City began implementing a stormwater fee in 1996 to fund maintenance, repairs, and improvements to the drainage system. Fees have increased over time as needs continue to grow; the most recent increase was approved in FY23. Fees are used to help fund replacement and upgrade projects.
In 2013, the Stormwater Division developed a Neighborhood Stormwater Project List of needed neighborhood stormwater projects. The project list, which was developed through a variety of means including the mapping of storm drains and citizen reporting via the City’s stormwater hotline, is continuously updated as new needs arise. As of December 2024, more than $36 million in replacement and upgrade projects have been identified. Projects on the Neighborhood Stormwater Project List are funded through operating funds.
Between 2010 and 2012, the Stormwater Division also performed a master plan study to identify potential flood-prone areas outside of the Federal Emergency Management Agency (FEMA) flood zones. The Stormwater Division used this information to develop a Stormwater Master Plan Capital Improvement Program list. Projects are prioritized based on the number of residents affected, system condition, and whether the structure is located on a City street. This list is also continuously updated as new needs are identified. The corresponding map of stormwater projects is also .
Currently about 112 projects are identified on this CIP list. Depending on the area impacted, road ownership, and type of issue(s), the projects can involve a number of entities including private parties, engineers/consultants, and representatives of the City, SCDOT, and/or FEMA. The City has completed the first 11 identified projects. As of 2024, investment by the City is at about $14.8M. Project 13 on the list, Bryant Boulevard, is slated for 2025. Projects 15 and 16 on the list are anticipated to complete in 2026 or 2027.
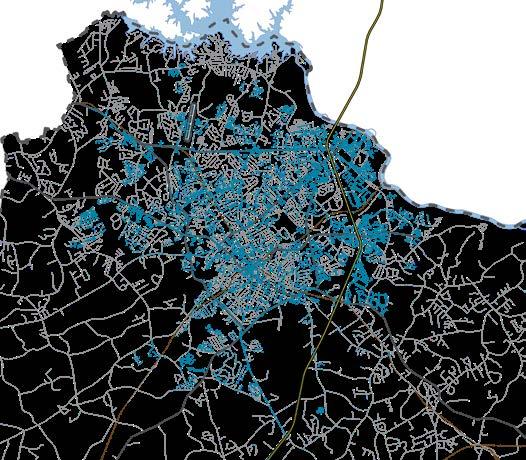
The Rock Hill Police Department (RHPD) provides police services within the City’s jurisdiction. The Department has advanced metoris accreditation through the Commission on Accreditation for Law Enforcement Agencies (CALEA), meaning that the department complies with state-of-the-art standards of excellence in law enforcement services that meet national standards.
RHPD operates three facilities including the Law Center, Hagins Street Substation and Fargo Street Substation, as well as has a facility for training, referred to as the Training Annex. RHPD employs 163 sworn officers and 50 civilian personnel. Police patrol services cover 10 geographic zones, Map 6.9.
The Law Center, located at 120 East Black Street, houses all formal police business including patrol, the Communications Center, records, a training room, an 16-bed holding facility, administration functions, and the Rock Hill Municipal Court, which renders judicial decisions on all traffic violations and certain criminal offenses that occur within City limits.
The Hagins Street Substation is located at 46 Sunset Drive in the Hagins/Fewell Neighborhood. In coordination with the City’s Neighborhood Empowerment Office, the RHPD Community Services Unit hosts crime prevention activities and encourages neighborhood engagement. The Substation is the location for monthly meetings, as well as periodic events such as National Night Out.
The Fargo Street station is located at 313 Fargo Street in Rock Hill and is owned by the Housing Authority. The City is the only tenant of this facility, which houses the RHPD's Street Crimes and Traffic units. Although not manned 24-hours a day, this station serves as place for officers to conduct roll calls, have meetings and work on special projects.
The Training Annex is located at the Worthy Boys and Girls Camp at 2352 Worthy Boys Road outside the City limits. This facility supports training needs and contains full video and computer capabilities.
The RHPD is responsible for preliminary and follow-up criminal investigation of all reported serious crimes against persons and/or property. Detectives are assigned to the unit work in varying specialties like the Drug Enforcement Unit, Violent Crimes Unit, and Forensic Services Unit. The Investigative Unit also partners with local, state and federal agencies to serve in areas of investigation. Some of these areas include: Domestic Violence Fatality Review Committee, Child Death Investigation Task Force, Internet Crimes Against Children Task Force, and the Electronic Crimes Task Force. The City also employs a civilian Law Enforcement Victim Advocate (LEVA) to provide support to the victims and eyewitnesses of crimes.
Rock Hill's crime analysts track crime patterns and trends in the City and respond to requests for crime data from the citizens and media. The Department utilizes the COMPSTAT strategy, a monthly, data-driven, and
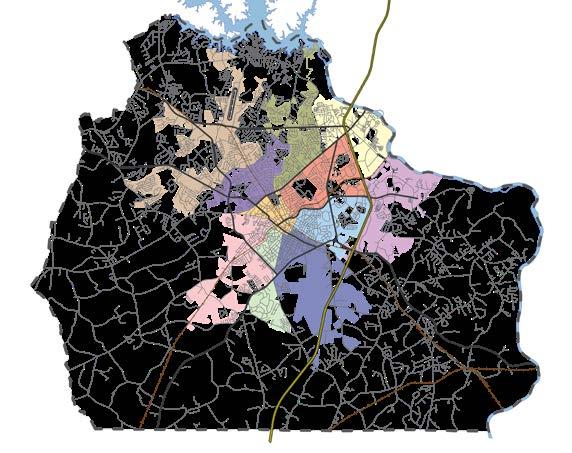
FIGURE 6.5
Source: City of Rock Hill Police Department
task-oriented meeting that addresses crime by type and location. Discussions involve the type of crimes being committed, how to solve the crimes that have already occurred, and how to prevent further crimes of the same type from re-occurring.
Individual offenses for the majority of crimes have fluctuated year to year from 2019 to 2024. The number of violent crimes from 2020 to 2024 decreased, while the number of property crimes decreased in 2021, rose in 2022, but has been decreasing since, Figure 6.5. The number of auto thefts has generally risen over the 5-year period.
Crime rate, the number of Index Crimes (based on official FBI’s Uniform Crime Report numbers) divided by the population, may be a better indicator of crime and safety than changes in the actual number of reported crimes each year. Figure 6.5 was derived using this methodology and shows that the crime rate for violent crimes decreased from 7.0 in 2020 to 4.3 in 2024. Property crimes generally decreased from 36.8 in 2020 to 26.4 in 2024. Rock Hill’s violent crime and property crime rates are higher than the national average, but are comparable to other similar sized cities in the Southeast. The 2019 National Crime Rate per 1,000 population totaled 3.6 for violent crimes and 21.1 for property crimes. The 2019 Crime Rate per 1,000 population for cities with 50,000 to 99,999 population totaled 3.2 for violent crimes and 21.8 for property crimes (source: Federal Bureau of Investigation, Crime in the United States, 2019). Even though this comparison with the nation or other jurisdictions is of interest, crime is inherently local, often concentrated within specific geographic areas where social, economic, and environmental factors converge. No two communities are the same.
One measure of police efficiency and safety of residents is the response time to life threatening, or Priority One, calls. Response time in law enforcement includes both queuing time, the length of time from receipt of the request for service to the actual dispatch of an officer, and travel time. The Police Department has a goal to respond to 70 percent of Priority One calls within 5 minutes and is exceeding this goal - meeting 82 percent of Priority One calls within 4.7 minutes and 85 percent under 5 minutes.
The Rock Hill Police Department provides a variety of crime prevention programs ranging from safety/crime prevention talks, site assessments, community visits and tours of the police department. In order to promote neighborhood spirit and police-community partnerships, officers participate in National Night Out, Cool Table Lunch Buddies, and Safety Patrol in addition to operating the Worthy Boys and Girls Camp—a week-long summer camp for boys and girls ages 9-12, providing the opportunity to experience the outdoors, learn new skills, develop interpersonal skills and build self-esteem. The department participates in other community events such as Coffee with a Cop, Plentiful Harvest kitchen, neighborhood meetings, and events specifically designed to build relationships with children such as Nerf Wars, RHPD Got Game, Chess Club and Angler’s Club.
The Rock Hill Police Department continues to foster a community that is a safe and desirable place to live and maintains a proactive approach to working closely with residents, community groups and youth to address problems and concerns.

163 sworn officers
50 civilian personnel
11 patrol zones
85% Priority One Calls under 5 minutes
Worthy Boys & Girls Camp Community Crime Map
The Rock Hill Fire Department (RHFD) is made up of three divisions –Administration, Suppression, and Fire Prevention/Inspections. The RHFD provides services to the City of Rock Hill and certain water district customers located in areas outside the City limits. The City also provides supplemental service to some areas served by the county fire department. Areas outside of the City limits, but within the Planning Area, are served by the county fire department.
The RHFD operates six fire stations, as well as the headquarters station that houses administration, logistics, training, and the new children’s museum about fire fighting. The City built a Fire Training Center, consisting of an administration building, a four-story training tower, and a two-story burn building. The Fire Training Center houses the department’s Training Division. The RHFD is also working to identify land for a new fire station, with plans to begin construction on the station within the next five years. Map 6.10 depicts the location of the existing fire stations and their service areas.
The City of Rock Hill is the only fully-paid career fire department in York County. As of October 2024, the RHFD is staffed with 126 fire suppression personnel and 16 administrative personnel, consisting of a command staff firetraining division, a fire prevention and investigation division, and a logistics division. Specialized services are provided for fire suppression, trench rescue, emergency medical services, confined space, vehicle extrication, high-angle rescue, low-angle rescue, water rescue, and hazardous materials/weapons of mass destruction (WMD). Fire prevention is implemented through educational programs on fire safety and involvement with community groups. The RHFD
is also responsible for fire code enforcement and fire investigations to determine the cause of various fires including those of suspicious, incendiary, or undetermined nature, and all fires involving loss of life or large-dollar property losses.
The six fire stations support six front-line engine apparatus, three aerial apparatus, one tanker, one grass unit, two Battalion Chief command vehicles, and 15 administration support vehicles. The Department operates a fire mobile package to enhance real-time access to information and communication to firefighters in the field. All fire apparatus are equipped with diagnostic heart monitors and several apparatus are equipped with thermal imaging cameras for search and rescue.
The key benchmark for fire department response time is set by the National Fire Protection Association (NFPA). The NFPA’s response time standard is five minutes. The Rock Hill Fire Department’s average response time is more than 90 percent of the NFPA Standard Response Time. Figure 6.6 summarizes the Rock Hill Fire Department calls for service from 2019 to 2024. Call volumes for both fire and medical fluctuate from year to year, but steadily increase.
The National Insurance Services Office, Inc. (ISO) supplies statistical, actuarial, underwriting, and claims data to the property and casualty insurance industry. The ISO uses a uniform set of criteria known as the Fire Suppression Rating Schedule (FSRS) to review and evaluate the fire-fighting capabilities of individual communities. The FSRS has three main parts and is based on nationally recognized standards developed by the National Fire Protection Association
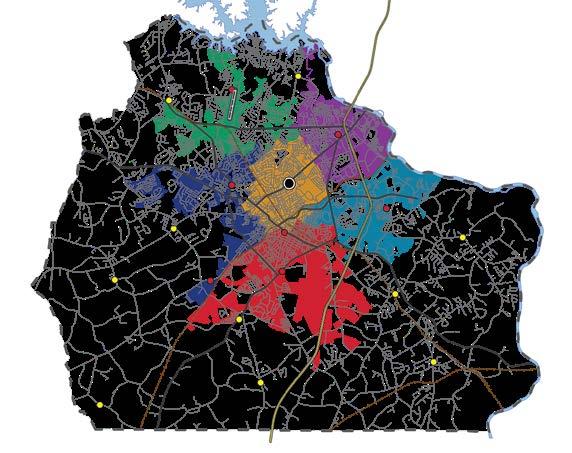

and the American Water Works Association. Ten percent of the overall grade is based on how well the fire department receives calls and dispatches its fire-fighting resources. Fifty percent of the overall score is based on the equipment, training, and personnel. Forty percent of the grade is based on the community’s water supply, including whether a community has sufficient water supply for fire suppression beyond daily maximum consumption, the condition of all components of the water supply system, and the distribution of hydrants. Once evaluated, a community is then assigned a Public Protection Classification (PPC™) from 1 to 10. Class 1 represents superior property fire protection, and Class 10 indicates that the area’s fire-suppression program does not meet ISO minimum criteria. Insurance companies base property premiums on a community’s ISO rating; ISO ratings of 1 through 3 receive a lower insurance premium. The City currently has an ISO rating of 1.
The City began implementing a fire impact fee in FY04 based on development type. About $11.4 million has been collected since the fee was initiated. Revenues collected from the program are used to help fund construction of new fire stations.
The RHFD is involved in many types of community service including offering free blood pressure checks as well as free installation and smoke detector battery replacements for elderly citizens and low-income households. Fire prevention personnel perform safety inspections and assist with preparing emergency evacuation plans. The Fire Department participates in City programs such as Inside Rock Hill, a citizen academy, and The Works, a oneday program for high-school students to introduce them to technical careers. Finally, staff conducts the Camp Can Do (a camp for burned children).
Both the County and the City have personnel and facilities to support emergency preparedness and management. A facilities and operations overview is provided below, with further details provided in the Resiliency Element.
York County maintains an Emergency Operation and Public Safety Communications Center at 149 West Black Street. The Center is maintained 24 hours a day and has a direct link with the City of Rock Hill Emergency Operations Center (EOC). The Communications Center utilizes an enhanced 911 system for all fire and EMS-related emergencies and for transferring law enforcement calls to the agency that has jurisdiction.
The York County Office of Emergency Management (OEM) oversees emergency and disaster operations planning, disaster consequence reduction programs, coordination of emergency response, the rescue/EMS system, hazardous materials, Catawba Nuclear Station emergency planning, SARA Title III regulation and reporting (requirements for planning around hazardous chemicals), and emergency public education.
Likewise, the City has an Office of Emergency Management that works closely with the County's OEM, City public safety departments, and other community organizations. Depending on the particular emergency event, the City would activate its EOC at the Operations Center and/or City Hall. The City has a single radio system network that provides a single channel of communication for emergency responders. Additionally, City emergency management operations has redundancy of radio and data communication systems. Rock Hill has various mutual aid agreements (state and municipal) to assist others in the event of a disaster and to ensure that the City obtains assistance as well.
The Rock Hill/York County Airport (UZA, the FAA identifier code), located at 550 Airport Road, is one of the South Carolina’s 14th Corporate/Business (category SCII) airports. The Rock Hill/York County Airport is located four miles northwest of downtown and less than 30 minutes from Charlotte-Douglas International Airport. Because of its location, the airport plays an essential role in serving as a designated reliever to Charlotte-Douglas International Airport and providing access and capacity to general aviation and business in the Rock Hill/York County area.
The airport is owned by the City of Rock Hill. Although the City is the official sponsor, the City and County split local funding costs (5 percent total). The Federal Aviation Administration (FAA) provided 90% of the funding and the state provides the remaining funding. The Airport Commission, comprised of seven members appointed by the City and County Councils, is responsible for making recommendations to the City Council on policies, operations, and general activities regarding the airport.
Aircraft operations are estimated at about 49,000 for 2024. The airport is about 491 acres and includes a 8,400 square-foot terminal building designed for the business user, a conference room, a pilot lounge, Wi-Fi services, and flight planning facilities. Currently, 186 aircraft are based at the airport, including 161 single-engine planes, 16 multi-engine planes, three jets and four helicopters. A total of 146 hangars are located at the airport, most of which are privately owned. The airport contains one grooved pavement runway that can be used in two directions. It measures 5,500 x 100 feet with a full parallel taxiway.
Operations include general aviation local aircraft operations, general aviation itinerant operations, and a small number of military operations. Ground transportation includes rental car agencies and taxi service. A new flight school, ACES Flight School, has 13 aircraft at the airport and flies an average of 500 flight hours per month. Aviation-related services at the airport are provided by a private contractor, SkyTech Fixed Base Operator (FBO). The City has an agreement with Skytech through 2030. Skytech offers aircraft maintenance, full avionics repair and installations, fuel and oil service, sales as well as hangar and tie-down rentals.
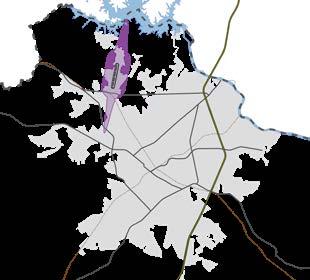
The Airport works with local residents, realtors, and pilots to raise awareness about aircraft noise through the Flying Friendly Initiative including: A Resident's Guide to Aircraft Noise and a Pilot's Guide to Noise Abatement. A 24-hour airport hotline helps identify typical noise events or concerns, Map 6.11. Additionally, the City and County jointly adopted an Airport Overlay District to discourage the siting of incompatible land uses that may impair the future development and operation of the airport, to protect navigable airspace from obstructions, and to reduce hazards that may endanger the lives and property of the public and aviation users.
The Rock Hill-York County Airport Layout Plan (ALP) is the 2016 master plan with a 20-year horizon to 2035 and includes a three-phased development plan. The runway and taxiway extension is the primary facility improvement planned for Phase I. Airports are an integral component to South Carolina’s transportation infrastructure and economy. The South Carolina Aeronautics Commission (SCAC) completed updates to its Statewide Aviation System Plan and Economic Impact Study. A Summary includes an overview of the findings and the airport's contribution to the statewide economic impact.
The FAA provides $150,000 in entitlement funds annually. The FAA determines any additional discretionary funds after weighing the needs of all other airports within the region under the FAA's Atlanta Airports District Office. Airport staff submit annually an updated capital improvement program (CIP) to the FAA. Current CIP projects are related to pavement repairs, apron expansion, instrument landing system replacement, and an update to the ALP.
Several public transportation services are available for residents in the City of Rock Hill and the planning area.
York County Access provides public transportation for residents of the County and the City of Rock Hill and is operated by the York County Council on Aging. Two types of service are offered including Essential Service and Ride-to-Work Service. The Essential Service is county-wide for people who need a ride to the doctor, pharmacy, grocery, or medical facilities. Ride-to-Work is offered to Rock Hill citizens who need a ride to work within city limits.
The City of Rock Hill provides a free, fixed-route bus system with full service and has been in service since July 2019. The My Ride fleet is comprised of all-electric buses that were assembled in Greenville, SC. Specifically, the fleet includes 35-foot Proterra Catalyst® buses. The buses are outfitted with free Wi-Fi, mobile charging ports, infotainment screens and bike racks. Buses are ADA compliant, with features such as wheelchair ramps, automatic voice annunciation system, destination and route signs, and priority seating with wheelchair securement system.
Free fares were made possible by funding from Comporium, Family Trust Federal Credit Union, Piedmont Medical Center, York Technical College, the City, and federal grant funding.
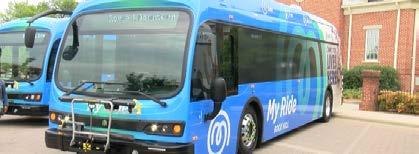
20,000 riders on average per month 4 routes 109 Bus Stops 7AM - 7PM Monday through Saturday operations
FIGURE 6.7 My Ride ANNUAL RIDERSHIP
Source: City of Rock Hill Transit Department
The City of Rock Hill has a Parks, Recreation & Tourism (PRT) Department that provides leisure, recreational, tourism, and cultural opportunities to Rock Hill residents and visitors through an array facilities, events, and programs.
In addition to the parks and recreation centers owned and operated by PRT, Figure 6.8 and Map 6.12, the City has also executed joint-use agreements with Winthrop University, the Rock Hill schools, Duke Power, Visit York County, and master developers. PRT also maintains the City's major gateways and corresponding streetscapes as noted in the Transportation Element maps.
Every year PRT produces a Facilities Report that summarizes the improvements that were made over the past year and documents required park improvements and associated costs. PRT has an established process for recommending capital project priorities via the nine-member Public Parks and Recreation Commission, which recommends capital projects to City Council for funding consideration. Directions is the PRT strategic plan that guides PRT planning, improvements, and uses.
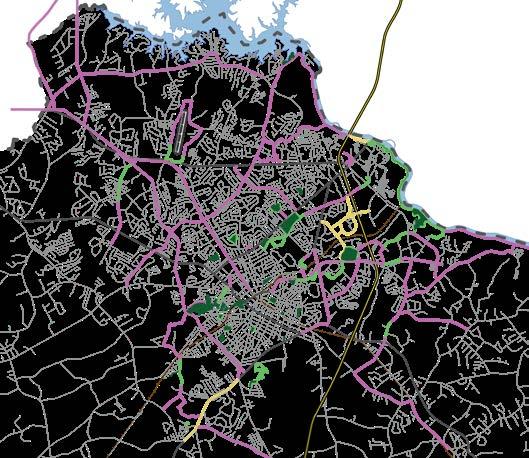

Rock Hill has a variety of educational facilities including public schools, charter schools, private schools, a public two-year college (York Technical College), a private college (Clinton College), and a university (Winthrop University). Map 6.15 shows the location of all of these schools in the Planning Area.
Rock Hill and nearly all of the unincorporated portions within the Planning Area are served by Rock Hill School District Three. Rock Hill School District Three is the second largest of four school districts in York County and is the fifteenthlargest school district in South Carolina. The District owns more than 3.5 million square feet of buildings on more than 1,200 acres of land.
Nearly 16,600 students were enrolled in Rock Hill’s public school system during the 2023-2024 school year. The Rock Hill Schools system consists of 14 elementary schools, five middle schools, three high schools, and seven buildings for various programming, Map 6.15.
Many of the schools offer special programs for students called Program Options, noted in Figure 6.9. Parents apply for their children to participate and an online lottery is used to grant approval. The number of students participating in a Program Option is constantly fluctuating. Rock Hill Schools also offers other unique resources to the community including a Central Child Development Center, a Flexible Learning Center, the Carroll School Education Museum, and the Sylvia Circle Family Learning Center.
The overall capacity of the District is around 23,000 students. Ultimately each school’s enrollment is based on a compromise among competing objectives
and factors including area population density, existing school sizes, natural geographic barriers, road patterns, transportation times and distances, curriculum choice and student achievement objectives, student and staff safety, effective and efficient use of fiscal resources, and local preferences.
Rock Hill District Three Schools is anticipating another strategic planning initiative in the upcoming years to re-assess existing facilities and plan for future enrollments. Similar to past planning exercises, this will include population analysis, enrollment forecasting, facility utilization, master planning and budgeting.
Legion Collegiate Academy
Legion Collegiate Academy is a comprehensive, four-year public charter high school enrolling 640 students in grades 9–12. The school opened in the fall of 2019 and focuses on elite academics through dual enrollment with USCLancaster, York Technical College, and Winthrop University. Students can take up to 60 credit hours of dual enrollment coursework during their high school years. LCA's split-day schedule allows students the opportunity to develop their skills in athletics or other life experiences while pursuing college credit. Last year, 53% of the senior class committed to play a sport at the collegiate level. LCA's graduation rate is 99.4%. LCA has repeatedly earned Excellence Awards given by the State's Education Oversight Committee. LCA was also awarded “Charlotte’s Best” Charter school in 2023.
York Preparatory Academy
York Preparatory Academy is a National Blue Ribbon award-winning public charter school serving almost 1,700 students in kindergarten through 12th
grades. It is located on a 43-acre campus within the city limits off of Eastview Road. The school offers students the opportunity to discover individual strengths and interests and to provide tools like dual enrollment, college credit, internships, work-based learning, and industry credentials that create paths for their future pursuits.
Riverwalk Academy is a public charter school offering a project-based learning curriculum to students in kindergarten through 12th grades. Founded in 2014, the school currently serves 750 students. At full capacity, it will accommodate more than 875 students. The school is opening a permanent middle and high school building at its Mount Gallant location in 2025.
Providence Classical School
Accredited by the Classical Latin School Association, Providence is a Christian grade school. Established in 2014, enrollment for the 2024-2025 school year included 234 students. The main campus serves students kindergarten through 12th grades and meets at Eastside Baptist Church. Thirteen additional students are part of a related school for special needs students called Simply Providence at Hope Fellowship. Providence is planning for a permanent campus.
Saint Anne Catholic School is a private/parochial preschool through high school (K3-12) serving Fort Mill, Rock Hill and surrounding areas since 1951. The school is located in Rock Hill off of North Anderson Road. SAS is an accredited Cognia school. Approximately 215 students were enrolled at SAS during the 2024-2025 school year.
Westminster Catawba Christian School
Westminster Catawba Christian School is the largest private school in Rock Hill and is accredited by the Association of Christian Schools International and by Cognia. The school capacity is 825 students and the 2024-2025 school year enrollment was about 790 children. WCCS provides Christian and traditional education for children from infants through 12th grade. The Lower School Campus (infant to 5th grade) meets at the former Rosewood Elementary School and the Upper School Campus (6th to 12th grade) is within one mile of India Hook Road. The school’s long-range plan includes exploring the possibility of combining the campuses.
FIGURE 6.9 EDUCATION FACILITIES CONTINUED
Finley Road ES* (temporarily closed)
Independence ES
India Hook ES
Lesslie ES*
Mount Gallant ES
Mount Holly ES
Northside ES* #
Oakdale ES* #
Old Pointe ES*
Richmond Drive ES*
Sunset Park ES* #
York Road ES*
FIGURE 6.9 EDUCATION FACILITIES
* Facilities having a Joint Use Agreement with PRT
** Facilities with a Joint Use Agreement & PRT assists with maintenance
# Indicates a facility that offers a Choice School program
ID NAME
Belleview ** (various education programs) Cherry Park ES#
Castle Heights MS**
Dutchman Creek MS**
Rawlinson Road MS**
Saluda Trail MS** #
Sullivan MS** #
Northwestern HS*
Rock Hill HS*
South Pointe HS* #
Legion Collegiate Academy (Charter School)
Riverwalk Academy (Charter School)
York Preparatory Academy (Charter School)
Providence Classical School of Rock Hill (Private School)
Saint Anne Catholic School (Private School)
Westminster Catawba Christian School (Private School)
Lower School Campus (formerly Rosewood ES)
Upper School Campus
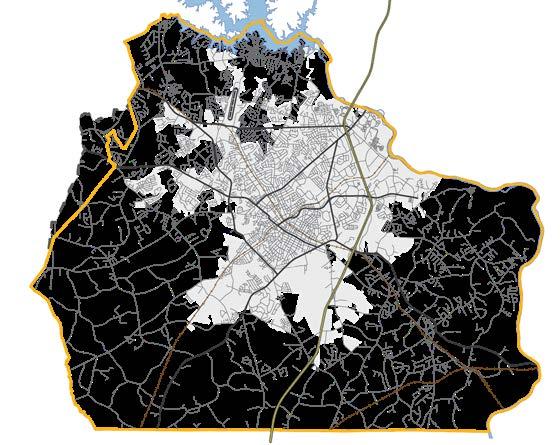
Founded in 1964, York Technical College (YTC) has grown to serve more than 5,000 students across two campuses—its main campus in Rock Hill and the Chester Center in Chester County. For 60 years, the college has played a significant role in workforce and economic development. Offering more than 100 programs, YTC provides flexible education options through in-person, online, and hybrid classes. With a 93% job placement rate, the college prepares students for careers in various industries, supporting both those starting new career paths and those advancing in their current professions.
The main campus is 126 acres with 15 buildings while off-campus facilities include 57.4 acres and 6 buildings. YTC is a commuter college, so it does not offer student housing. YTC's annual budget is $44.9 million and the college is estimated to have an economic impact of $222 million, underscoring its significant contribution to the regional economy.
Founded in 1894 by the African Methodist Episcopal Zion Church, Clinton College is a four-year liberal arts Historically Black College or University (HBCU) that was established during reconstruction years to help eradicate illiteracy among freedmen. Clinton College is the oldest institution of higher education in Rock Hill, operating continuously for 130 years. About 250 students are enrolled at the College during the FY25 school year. The College offers associate and bachelor degree programs. New bachelor programs include: Nursing, Cybersecurity, Education, Music, Healthcare Management and Interdisciplinary Studies, in addition to Biology, Business, Early Childhood Education, and Religious Studies. The College has several sports programs,
including men's and women's basketball, women's volleyball, men's golf, eSports, cheerleading, and cross country track. Clinton College's designation as a HBCU makes it eligible for several federal grants. The College has received or currently receives Department of Education grants (including Title 3), US Department of Energy (DOE) grants, and grants from the State of South Carolina.
The campus consists of 12 administrative, academic, athletic, and residential buildings on a 24-acre site. The new Academic Center for Excellence houses the new nursing simulation laboratory, and the Digital Library and Learning Commons houses the new cyber-security laboratory.
Winthrop University was founded in 1886 in Columbia, South Carolina, and then moved in 1895 to Rock Hill. The University currently offers 45 undergraduate and 22 graduate programs and certificates, with more than 100 programs of study offered through the 5 colleges and various concentrations including 100% online programs. Approximately 4,894 students are enrolled at the university.
Facilities for Winthrop University are located at both the 109-acre Main Campus on Oakland Avenue and at the Winthrop Athletics, Recreation, and Research Area, known as “The Farm,” a 317-acre site located off Eden Terrace. The Main Campus is situated in a historic district near downtown Rock Hill and houses the academic buildings, administrative offices, residence halls, library, wellness center and student center. The Winthrop Athletics, Recreation, and Research Area features recreational amenities including: the Founders Field
baseball park, the Winthrop Coliseum, a softball complex, soccer facilities, a disc golf course, a ropes course, an outdoor track, and recreational sports fields. The area also houses the 1.1-acre Piedmont Wetlands Project, which was created in partnership with Rock Hill Schools.
The York County Library System consists of a main library, headquartered in downtown Rock Hill, and branches in Clover, Fort Mill, Lake Wylie, and York. The library system also provides a Bookmobile, which visits nursing homes, daycares, and other locations throughout the York County community.
The State of South Carolina mandates that counties provide library services, but does not provide full funding for the services. The library, which had a FY19 budget of $6.54 million, is funded through a combination of sources: State, County, donations, and library fines and fees. The library system has more than 1.2 million materials in circulation as well as numerous electronic resources. The York County Library system has the best library programs across the State; these programs and services are for residents of all ages. All York County Library locations have a meeting room for use free-of-charge by non-profit organizations and community groups. The main library in Rock Hill features a Technology Center that provides users with public access to 25 computer workstations for internet access, software for adults and children, online research databases, and free computer classes. The library is home to the Nan Weller Carson Local History Room, which contains a collection of local history resources about York County and the Catawba Indians.
Friends of the York County Library is a non-profit organization that supports the York County Library system. Through membership dues, book sales, and special fund-raising activities, Friends of the York County Library secures funding for non-budgeted library projects and programs. The group also partners with other agencies to sponsor various library events including children’s programs and summer reading programs. With advances in technology and the ease of data access, the role of the community library has changed. It has become a "third" place for people to gather and thus the demands for having flex space at libraries has risen. Despite this trend and the population growth of the County, the library system has not built a new library for more than 17 years. More specifically, the County has been working to identify a new space for the Rock Hill library for many years. Despite several County attempts, studies, and joint efforts with potential partners, no site has been committed to this function. The County continues to explore partnership opportunities such as a joint library in University Center with Winthrop University. Regardless of the location, construction of a new facility will likely require a partnership between the County, the City, and the private sector. In addition to a new headquarters, additional library branches are needed in Rock Hill and other areas of the County. Library services have not kept pace with growth and the County is behind when comparing number of libraries, number of library staff, and library budget to areas of comparable size.
Piedmont Medical Center (PMC), located at 222 South Herlong Avenue in Rock Hill, is the largest healthcare provider in York County. It offers a broad range of services, including trauma, open heart surgery, specialized women’s services, neurosurgery, and orthopedics.
PMC is anchored by a 288-bed acute care hospital. The facility is more than 520,000 square feet. Additional PMC facilities are located throughout York County and include off-site outpatient services, diagnostic imaging, a pain center, physician practices, urgent care centers, wound care and the Gold Hill Emergency Department in Fort Mill, SC.
As of 2025, PMC has more than 650 physicians on staff, approximately 1,866 employees on its payroll, and more than 150 volunteers. The number of volunteers swells substantially in the summer through the hospital’s teen volunteer program. PMC offers some of the most advanced medical technologies and services in the area. Piedmont’s primary service lines include cardiovascular services (open heart, interventional cardiology, and electrophysiology), general and vascular surgery, orthopedics, women’s services and emergency medicine. Some of the other services PMC offers are robotic surgery, 3-D mammography, CT scanning, imaging and diagnostics, outpatient services, and wound care. PMC Rock Hill is an American College of Surgeons (ACS) Verified Level III Trauma Center. During the 2024 calendar year, 12,069 patients were admitted to the hospital, down from 12,145 during the prior year, and it saw 60,252 emergency room visits, down from 64,553 during the prior year. The EMS system responded in 2024 to 32,710 emergency medical service calls, up from 31,945 calls in 2023.
PMC conducts an annual community needs assessment to determine the need for additional physician manpower by specialty and to guide facility improvements and equipment investments over the coming year. The State of South Carolina also updates the State Health Plan every two years, which details where new facilities are needed.
PMC provides financial support to more than 30 organizations in York County, primarily organizations focused on health, youth, and people with special needs. In addition to financial support, PMC also provides in-kind services to local agencies and free flu shots to those who volunteer at these agencies as well as their clients. Many PMC employees also volunteer in the community and serve in leadership roles on various committees and boards.
In September 2022, PMC opened a hospital in Fort Mill. This medical center includes 100 beds and state-of-the art technology and equipment. The hospital features a 24/7 Emergency Department, Intensive Care Unit, Medical/Surgical Unit, and a wide array of Surgical Services and Women's Services.
Many of the City’s government facilities are located in downtown Rock Hill, including City Hall, the Neighborhood Services Department building, the Law Center, and the Municipal Court. The following City Departments are housed at these locations including City Management, Planning & Development, Police Departmenet, Parks, Recreation & Tourism, Economic and Urban Development, Neighborhood Services, Finance, and Human Resources. The majority of remaining City Departments (Utilities, Public Works, and Information Technology) are housed in the City’s Operations Center located at 757 South Anderson Road.
York County government currently has offices established in more than 30 buildings throughout the County; however, five primary concentrations of buildings serve as the primary focus of County government services. These are listed here. Details for each facility can be found on the County's website here -
• Government Center Building in Downtown York
• Moss Justice Center and York County Prison
• Public Works Complex
• Cherry Road Offices (Family Court facility)
• Heckle Boulevard Complex
• Emergency Operations Center
After conducting a comprehensive assessment in 2014, the County developed a Facility Master Plan that focuses on improving the efficiency of existing buildings and getting York County out of leased space. The capital facility
projects were estimated at $115 million and a bond referendum was approved for $89 million. The top priority projects included additions and renovations to the Moss Justice Center, a new Family Court facility, renovations of the Heckle Boulevard Complex, additions and renovations to the Public Works Complex, and construction of a new Government Center.
Several State offices are located throughout the County. In downtown York, State offices include the SC Department of Public Health (DPH) and the SC Department of Social Services (DSS). The Moss Center includes offices for South Carolina Probation and Parole. Also, offices for the South Carolina Department of Motor Vehicles, South Carolina Probation and Parole, South Carolina Department of Juvenile Justice, South Carolina Vocational Rehabilitation Department, SC DPH and SC DSS are located in the County’s Heckle Boulevard Complex. SC Department of Transportation (DOT) District 4 offices for construction and maintenance of roadways are located on Camden Avenue and Robertson Road in Rock Hill. The South Carolina Employment Security Commission is located on Fincher Road in Rock Hill.
Federal offices in the Rock Hill 2020 Planning Area include U.S. Post Offices, the offices of federal legislators, the Social Security Administration, and military recruiting offices.
The Cultural Resources Element is intended to showcase the presence of institutions, religious facilities, historic districts and buildings, and other assets that help create a community's identity. These resources help us learn about and remember the past, understand and celebrate different cultures, and appreciate art and architecture. Rock Hill contains both private- and publicly-owned culturally significant facilities that provide substantial social and economic benefits enhancing the livability of the community. Rock Hill's considerable awareness of its historical and cultural roots is made evident by being a 'Preserve America Community." Preserve America is a federal program meant to recognize and support community efforts to preserve the country's heritage.
Rock Hill has six historic districts and a myriad of individual historic properties, Map 6.1 A, B, & C. All historic districts and individual properties are required to follow the City's historic preservation ordinance, with the exemption of the Winthrop Historic District. This district is subject to design standard regulations established by the State of South Carolina.
The City has regulations and guidelines in the Zoning Ordinance to help identify, recognize, preserve, maintain, protect and enhance old, historic and architecturally valuable structures, properties, districts and/or neighborhoods in Rock Hill. The City encourages historic property maintenance that is consistent with the Secretary of Interior's Standards for Rehabilitation.
Property owners interested in local designation must apply for Historic Overlay District zoning Applications are reviewed and recommended for approval by both the Board of Historic Review (BHR) and the Planning Commission, and then considered by City Council for approval. Following approval, property owners must obtain a Certificate of Appropriateness (COA) or Certificate of Hardship (COH) from the BHR or zoning staff prior to undertaking exterior renovations (new construction, additions, or alterations) or demolition of these properties. This process is detailed here.
The City has a Historic Design Guidelines to guide the BHR and zoning staff when making their determinations. The Guidelines recommend appropriate rehabilitation procedures and types of new construction within the historic district.
Several federal, state, and local organizations assist the City in historic and cultural resource preservation.
• National Park Service
• South Carolina Department of Archives and History
• State Historic Preservation Office
• York County Forever Commission
• Culture & Heritage Commission
• Board Of Historic Review (BHR)
• Historic Rock Hill
To be eligible for historic designation, structures must be at least 50 years old and have significance in a local, state and national context or architectural period style.
Afro-American Insurance Building**
Anderson-Gill House**
Avery-Williams-Bishop House*
Bleachery Water Treatment Plant**
Dr. William W. Fennell House*
Ebenezer Academy**
Ebenezer-Manse House*
First Presbyterian Church**
Gilbert Lazenby House*
Harper-Holler House*
Hermon Presbyterian Church**
Highland Park Manufacturing Plant and Cotton Oil Complex**
Ketchin-Neely-Long/Longwood Hall*
Laurelwood Cemetery**
McCallum House*
McCorkle-Fewell-Long House**
McCosh House*
Mt. Prospect Baptist Church
New Mt. Olivet AME Zion*
People's National Bank**
Richards House*
Rock Hill Body Company**
Rock Hill Cotton Factory**
Shurley Mickle House*
Smith-Matthews House*
Springsteen Plantation Site*
Stokes-Mayfield House**
Sturgis House**
Tillman Hall
U.S. Post Office and Courthouse
White Home**
Williams Bynum Cotton Warehouse*
Williams Gulf Station*
Charlotte Avenue/Aiken Avenue Historic District**
Marion Street Area Historic District**
Oakland Avenue Historic District*
Reid Street/North Confederate Avenue Area Historic District**
Rock Hill Downtown Historic District**
Winthrop Historic District**
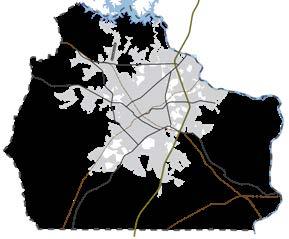
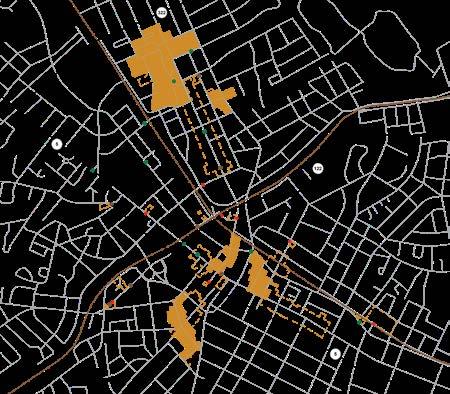
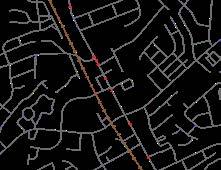
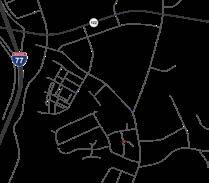
A Historic Resource Survey is a snapshot, documenting historic architectural resources in Rock Hill that are 50 years and older. The general surveys include:
1988 Architectural and Historical Inventory Survey Report
1988 Architectural and Historical Inventory Survey Report Mill Supplement
2004 Historic Resources Survey Update
2015 Arcade Mill Village Historic District Survey Report
2023 Southside Rock Hill Historic Resource Survey
Individual property surveys and historic preservation related information is provided on the City website here.
Several types of programs and incentives are available to historic properties at the State, regional, and local levels. Click on links below to learn more.
Federal Historic Preservation Grants
South Carolina Historic Rehabilitation Tax Incentives
South Carolina Historic Mark Program
South Carolina Archaeology Resources
York County Preservation Tax Incentives
City of Rock Hill Preservation Tax Incentives
Facade Rehabilitation Grant Program
The recognition and support of cultural assets in Rock Hill is critical to its development. These assets provide insight on pressing social and political issues that have shaped the City's environment and contribute to the community’s creativity, knowledge, traditions, culture, meaning, and vitality.
While culture can be expressed in many art forms, the following categories are used here to provide a sense for the types and depth of those cultural assets -
Visual Arts
Literary Arts
Performing Arts
Multidisciplinary Arts
Even though grade schools, parks and recreational facilities have various art programs and events, due to the number of these facilities, they are not included on the following Cultural Assets maps, 7.2 and 7.3. Reference Map 6.15 in the Community Facilities Element for the education facilities and Map 6.14 in the same element for the parks and recreational facilities. If a park has a cultural asset, such as an installment or sculpture, then the art is called out and the park location is referenced. Fountain Park and the downtown Amphitheater are included in the Cultural District map due to the number, scale of events and infrastructure specifically incorporated into the sites to support events. The higher education facilities include libraries as well as a
gamut of art and cultural events. Thus, the title references literary arts and multidisciplinary arts. Note that the York County Library is the only facility of this type located in the Cultural District. The term Cultural Center is used here to describe places with collections, galleries, exhibits, programs, events and more.
Cultural assets are experienced! While the planning area has a number of host organizations, a concentration is located in the Rock Hill Cultural District. Map 7.2 illustrates the location of key sites within the Planning Area and Map 7.3 illustrates those within the Cultural District. When available, hyperlinks provide access to further online details.
In 2015, the South Carolina Arts Commission named downtown Rock Hill as the first state-recognized cultural district in South Carolina. A cultural district is an area that is easily identifiable to visitors and residents and serves as a cultural and economic center for the community. Over time the City has detached itself from the notion of definitive boundaries for its cultural district but continues to support initiatives that promote cultural assets in the downtown area. Rock Hill's cultural downtown contains museums, art centers, unique and creative businesses, and much more, Map 7.3.
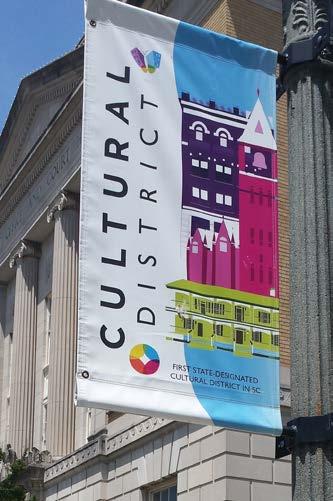
the economic impact of non-profit art & cultural organizations in York County
$40+ MILLION INDUSTRY
$2.4 MILLION IN TAX REVENUE [local & state]
$38 AVERAGE DOLLARS spent per person attending an event
665 JOBS [full-time equivalent]
Source: Arts & Economic Prosperity 6: The Economic Impact of Nonprofit Arts & Cultural Organizations and Their Audiences in York County, 2023, yorkcountyarts.org
Performing arts and events offer a dynamic component to experiencing the arts and culture. Tables 7.1 provides some of the major organizations that conduct and/or sponsor performances and events. The City of Rock Hill has a deep tradition of sponsoring events and festivals such as the downtown Amphitheatre Concert Series, Come See Me festival, Juneteenth and Christmasville to name just a few. Programming of such performances and events are constantly changing and events can occur at multiple locations, thus links to these organizations and sponsors are provided to reference current schedules.
Rock Hill recognizes and promotes the contributions of the diverse cultural heritages and ancestries of its people.
A significant cultural aspect of Rock Hill is its long history with the Catawba Nation, African-American, and Hispanic cultures. The Catawba Cultural Preservation Project (CCPP) was formed in 1990 as a nonprofit organization within the Catawba Cultural Center located on the Catawba Reservation. Its mission is to preserve, promote and protect the rich cultural heritage of the Catawba Nation.
Several groups and organizations that African-American heritage in Rock Hill. Two of these include the African-American Cultural Resources Advisory Committee and the Juneteenth, Rock Hill Council. In 2015, the AfricanAmerican Cultural Resources Committee unveiled a monument at the corner of Black Street and Dave Lyle Boulevard to pay tribute to the City’s historic African-American Business District that was demolished in the early 1970s. The Juneteenth Rock Hill Council currently organizes events celebrating black history in Rock Hill.
TABLE 7.1 EXPERIENCE IT - EVENTS
SPONSORS
Events [festivals, parades, performances, programs & more]
Only in Old Town Old Town Association
Visit Rock Hill SC City of Rock Hill
Winthrop University Cultural Events Winthrop University
Arts Council of York County Events Arts Council of York County
Visit York County, Rock Hill York County Convention & Visitor's Bureau
Some of the biggest changes that the Hispanic population has brought to Rock Hill include the growing number of Latino-owned businesses, particularly firsttime small business owners, offering specialty products and services. Also, many churches have begun adding services specifically for Spanish-speaking members. Grupo Latino de Rock Hill is a group of children, youth and adults from different nationalities and backgrounds who perform at special events in the area to preserve ethnic traditions of Latino song and dance.
Source: City of Rock Hill Planning & Development
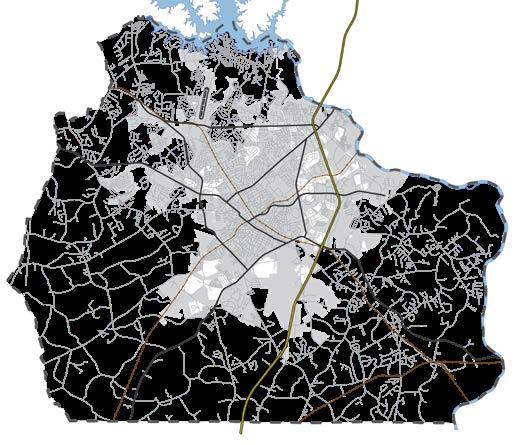
Catawba Cultural Center Museum of York County (MYCO) 2 1
PLACES OF LEARNING
[Winthrop University]
Ida Jane Dacus Library
Pettus Archives
Tour (by various artists) Sweet Dreams (by Doug McAbee)
Cultural Events
Theatre & Dance Hall
Music Conservatory Galleries
[Clinton College] Dalton Gallery Library [York Technical College] Anne Springs Close Library Events
Rock Hill Community Theatre York County Choral Society 11 PUBLIC ART
[Glencairn Garden] Wall of Whimsey, Children at Play & Veterans Garden
Civitas (by Audrey Flack) & Gateway Columns
[Cherry Park]
Casey
[Celriver Legacy Project]
Planning Area Boundary PERFORMING ARTS
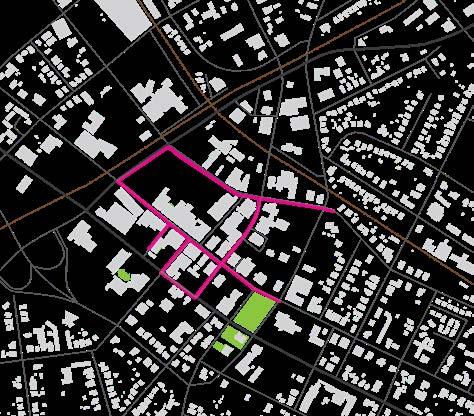

The Arts Council was formed in 2001 through the merging of two mainstay arts organizations - the Rock Hill Arts Council (chartered in 1978) and ARTS etc. (formerly the Fine Arts Association, which was founded in 1975). Several years later the Arts Council grew to serve the county and is now known as the Arts Council of York County. The mission is to create arts programming that encourages education, economic development, and arts advocacy through unique art experiences that engage the community to make York County a regional arts destination.
Although Rock Hill has not experienced the same type of Hispanic population growth as some areas in the Charlotte region, the growth has brought the need to assist the non-English speaking population. Churches, non-profit organizations, and government agencies offer outreach efforts to address these cultural issues. Specifically, the International Center of York County (ICYC) was established in 2003 to better assist with these needs.
The Old Town Association is a citizen’s group committed to the sustained redevelopment of Rock Hill’s downtown area. This non-profit organization coordinates festivals and events in downtown Rock Hill among other activities.
In 2014, City Council consolidated the Committee on Human Relations, the No Room for Racism Committee, and the Martin Luther King Committee into the Rock Hill Community Relations Council. The purpose of the Council
is to promote respect, appreciation, and understanding of diversity among all people in the community by promoting positive human relations and reducing discrimination, assessing and responding to the human relations needs of our community. The Council sponsors many events throughout the year including Race Equality Week, an Martin Luther King Day breakfast, and various Black History Month events.
The RHEDC's Quality of Life Committee, works to improve quality of life by supporting economic development efforts that improve infrastructure, transportation, and the environment. The Committee has always pushed for the integration of arts, history, and cultural components in the community, but recent initiatives have especially focused on promotion of the arts.
Rock Hill has many organizations, groups and programs that support various related art and culture goals, including, but not limited toWomen's Art Initiative
Friday Arts Project
Rock Hill Poet Laureate program
Historic Rock Hill
Natural resources provide numerous environmental benefits and improve our quality of life. It is important to protect these natural resources as our region and City grows. This element discusses the three main areas that make up our natural environment --


soils, environmentally sensitive areas, trees, plants & animals
water bodies, floodplains, stormwater, water
The Environmental Protection Agency (EPA) regulates air quality standards through the Clean Air Act. Areas that do not meet these standards are considered "nonattainment areas." Eastern York County is not considered a nonattainment area and has a maintenance plan in place to ensure it remains an attainment area.
As discussed in the Transportation Element, RFATS receives Congestion, Mitigation, & Air Quality Improvement Program (CMAQ) funding of approximately $3,661,000 million spend on projects that improve air quality and reduce emissions. Projects generally include intersection improvements aimed at improving efficiency and reducing the time cars spend idling to reduce emissions. The City has also implemented improvements such as expanding the bicycle and pedestrian network, implementing a zero-emission transit-system, retrofitting its vehicle fleet and more.
Passed by Congress in 1970
Major revisions in 1977 & 1990
Purpose: Regulate Air Pollution
Sets standards for six common pollutants:

The U.S. Department of Agriculture's Natural Resource Conservation Service published the Soil Survey of York County in 1965 to aid farmers and foresters in the location and details of soil in the County. It is also used by engineers and developers with site selection.
Soils are often mapped by association due to the uniformity of adjacent soils and for convenience - there are more than 30 soil types and five soil associations in the Planning Area, Map 8.1. These soils are generally good for agriculture and development, but not good for septic tanks. In some areas, primarily in the southern portion of the Planning Area, a lot of Iredell soil exists, commonly referred to as Blackjack soil. The soil is sandy and rocky and can be financially prohibitive to develop.
The City adopted its Urban Forest Master Plan in November of 2023, fulfilling a recommendation from the Comprehensive Plan Update - Rock Hill 2030. The Plan aims to minimize canopy loss due to new development by increasing the amount of tree save areas and increasing replanting ratios. The City worked with the Green Infrastructure Center through a U.S. Department of Agriculture Forest Service to map our current canopy and where potential plantable locations are throughout the Planning Area. The City received another grant from the U.S. Department of Agriculture Forest Service to fund plantings, additional canopy mapping to see how its changed, and more. The City's Urban Forest Master Plan can be found here.
Source: City of Rock Hill Planning & Development
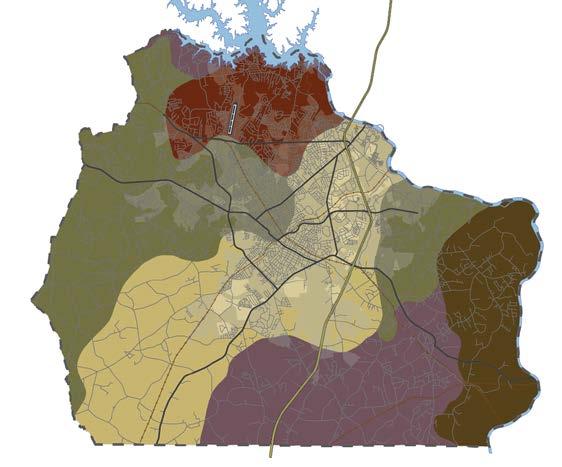
Tatum-Nason-Manteo
Cecil-Lloyd-Appling
Lloyd-Cecil-Enon
Enon-Mecklenburg
Iredell-Mecklenburg-Davidson Water Bodies
Planning Area Boundary
3 Miles
Environmentally sensitive areas provide many benefits including stormwater management, improving water quality, and preserving plant and animal habitat. Mismanagement of these areas can lead to costly infrastructure improvements and impacts such as flooding, slope failures, and degradation of air and water quality. Environmentally sensitive areas in the Planning Area include:
Floodplains are low-lying areas adjacent to a river, stream, or creek that are vulnerable to flooding or stormwater impacts. Floodplains in the study area are typically located along the Catawba River and major streams and creeks feeding into the river.
Wetlands are low-lying areas saturated with water for an extended period of time or even permanently. More than 2,150 acres of wetlands are located in the Planning Area, 210 acres of which are in the City.
Any development impacting a regulatory wetland requires a permit from the U.S. Army Corps of Engineers prior to construction.


Riparian buffers are vegetated areas next to rivers, streams, and creeks that protect them from pollution, provide bank stabilization, and support aquatic life and wildlife habitat. The City has riparian buffer requirements in place to protect the river, streams, and creeks from disturbance and encroachment impacts associated with land development. Buffer widths vary from 50 feet to 150 feet based on the water body type. The County also has overlay zones that require 50 to 100 foot buffers depending on the water body type.
These areas are environmental or historical areas that are protected from future development. They are generally purchased by a governmental agency or conservation group.
In December of 2018, York County purchased 1,900 acres along the Catawba River to preserve as a recreational area. In 1995, the South Carolina Department of Natural Resources (SCDNR) acquired two tracts of land and established the Blackjacks Heritage Preserve which is home to the endangered Schweinitz's Sunflower. The City established River Park in 1995 to protect 70 acres of wetlands and woodlands along the Catawba River.
York County's York County Forever Commission was formed in 1998 with the goal of promoting and protecting the County's significant natural, cultural, historic, and environmental resources. More information on the Commission can be found here. Additionally, the Nation Ford Land Trust is a private, non-profit, tax-exempt organization that seeks to preserve open space, scenic heritage, and undeveloped land throughout the unincorporated York County. More information on the Nation Ford Land Trust can be found here.
Source: City of Rock Hill Planning & Development, FEMA, National Wetland Inventory
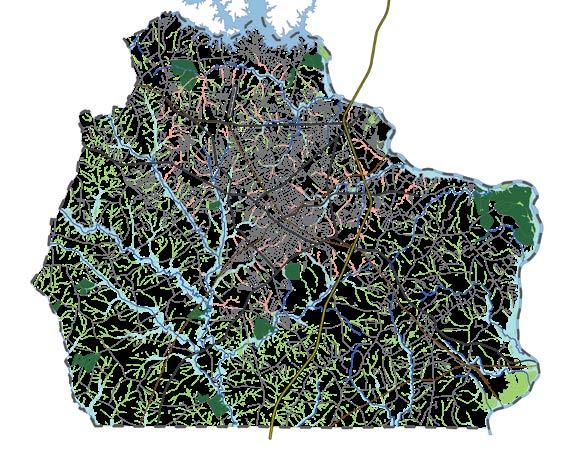
Perennial Stream Wetlands Conservation Areas
100-Year Floodplain
500-Year Floodplain
Floodprone Areas
Water Bodies
Planning Area Boundary
Both the City and County have open space requirements for all new development. In the City, developers must set aside 20% of residential developments and 15% of mixed-use or non-residential developments for open space, except in Downtown and Mixed-Use zoning districts, where 10% is required for all types of development. The County requires between 10% and 25% of open space to be preserved depending on the development type. The County also has a conservation subdivision option in its Zoning Ordinance where open space is determined by a sliding scale.
The City of Rock Hill defines steep slopes as lands with natural slopes of 15% or greater. The City does not have many areas where steep slopes are a concern. Most areas with greater slopes are located along water bodies and are protected through the City’s riparian buffer ordinance. The City has a steep slope ordinance that regulates grading, tree removal, and other site disturbance activities in remaining steep slope areas.
More than 800 acres of park land esists in 32 parks and five recreation centers in the City, as well as over 23 miles of shared use paths. More information on these facilities can be found in the Parks and Recreation section of the Community Facilities Element and the Bicycle and Pedestrian Network section of the Transportation Element.
A robust tree canopy improves air quality, reduces stormwater runoff, improves water and soil quality, and improves physical and mental health. The City forester is responsible for maintaining and monitoring tree canopy, determining when trees are to be cut down, and leading tree planting projects.
Since 1987, Rock Hill has been recognized as a Tree City USA by the Arbor Foundation. The designation was received through the efforts of enacting a tree ordinance and creating the Rock Hill Tree Commission. Additionally, the City has the A.W. Huckle Beautification Committee, which administers the proceeds of a $25,000 gift Mr. Huckle gave to the City in 1960 to plant trees and shrubs along streets and other public spaces.

The City has a Community Forestry Management Plan that guides tree management, a Memorial Tree Program, and various tree education programs. More information can be found on the Community Forestry website found here . The City's Zoning Ordinance establishes standards for tree canopy retention. Standards vary on the type of development and can be found here .
Growth and development threatens plant and animal habitat. According to the South Carolina Department of Natural Resources (SCDNR), 78 species have various levels of concern in York County. Eight species have a heightened level of concern, which ranges from at-risk, threatened, and endangered, Figure 8.1.
Rooted in textile manufacturing, the City of Rock Hill has a vibrant brownfields program. More than 90 acres of brownfields are located near or in downtown. Rock Hill’s brownfields program is a collaboration between city departments, non-profits, State and federal agencies, developers and the community. Since 2003, the City’s brownfields program has received more than $3 million in grants and loans from the Environmental Protection Agency. These grants and loans have resulted in more than $100 million leveraged in the Knowledge Park area alone. The City brownfields program has more than 10 active projects in which they are identifying environmental contaminants and coordinating redevelopment with stakeholders.
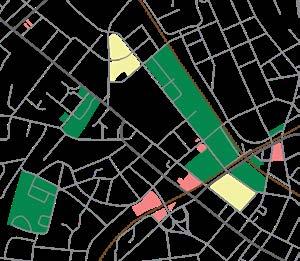
Source: South Carolina Department of Natural Resources


Why: Conserve and protect land
How: Annex enclaves and extend utilities at the correct time
Example: City investment of more than $30 million to support redevelopment of Knowledge Park
Water provides of variety of uses such as consumption, wastewater treatment, flood risk reduction, recreation, and habitat. Mismanagement of water resources can lead to flooding, drought, degradation of water quality, and other economic and environmental impacts.
The Catawba-Wateree River basin originates in North Carolina and flows into South Carolina. The basin is roughly 225 miles long and contains 5,000 miles of waterways. It supplies two million people with drinking water in 24 counties.
Although the Catawba-Wateree River Basin is relatively undeveloped, it is one of the fastest growing areas in the United States.
The Catawba River, Map 8.1, flows for about 320 miles from the Blue Ridge Mountains of western North Carolina into Lake Wateree in South Carolina.
Most of the Catawba River is dammed, but there is a large “free flowing” section from the base of the Lake Wylie dam downstream to the South Carolina Highway #9 Bridge that was designated as a South Carolina Scenic River in June 2008. The river is used for power production, industry, agriculture, drinking water, wastewater treatment, and recreation.
Population growth has put severe strains on the river. Water quality is impaired at many locations and droughts have caused water shortages and fostered transfers of water out of the basin. The Catawba Riverkeeper is a non-profit citizens group that educates and advocates for the health, protection, and enjoyment of the Catawba River watershed. The focus of its program is on improving water quality through monitoring and conservation advocacy, and on increasing public awareness through education and partnerships. More information on the Catawba Riverkeeper can be found here.
The City offers many opportunities for ecotourism along the river. In 1995, the City opened River Park, which includes a kayak/canoe launch. In 2012, the City opened another kayak/canoe launch in Riverwalk. Additionally, a trail connects Riverwalk to River Park. People recreating on the river can use the six-mile blueway that begins at the Fort Mill Dam and ends at River Park, or they can continue another 18 miles to the Lansford Canal State Park.
Lake Wylie is a 12,455-acre man-made lake with 325 miles of shoreline that was first created by a dam in 1904. The dam which was rebuilt in 1925. It is located at the northern extent of the Planning area, Map 8.1, and is managed by Duke Energy. The company manages lake levels, water use restrictions during droughts, and regulates facility types and how they are built and maintained through its Shoreline Management Plan.
The Lake Wylie Marine Commission is a governing board that oversees the health and safety concerns on Lake Wylie. More information about the Commission can be found here.

Several major streams and creeks flow through the study area and ultimately into the Catawba River, including Big Dutchmen Creek, Manchester Creek, Burgis Creek, Wildcat Creek, Taylors Creek and Hidden Creek. In total, 185 miles of perennial streams are located in the Planning Area, 34 miles of which are in the City. If you would like to care for a stream by tracking and monitoring its water quality, visit the SC Adopt-a-Stream website here.
The Federal Emergency Management Agency (FEMA) produces a Flood Insurance Rate Map that identifies areas of flood risks in the City. The City participates in FEMA’s National Flood Insurance Program so that flood insurance is available to residents. The City has adopted and enforces a flood damage prevention ordinance that allows for regulation of new development within the 100-year floodplain or Special Flood Hazard Areas (SFHAs). The Stormwater Division identified flood-prone areas outside the FEMA flood zones as part of its Stormwater Master Plan, which helped to identify problem areas and prioritize improvement projects.
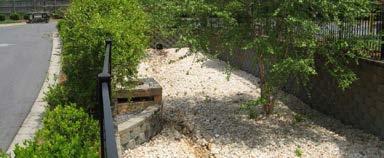
1,847
acres of 100-year floodplain in the City
275 567 10% acres of 500-year floodplain in the City acres of flood-prone areas in the City savings on flood insurance premiums for City participation in the FEMA Community Rating System
As an operator of a "municipal separate stormwater sewer system" (MS4) with a population of less than 100,000, the Environmental Protection Agency (EPA) requires the City to participate in its Phase I and II Stormwater Program. Phase I aims to control stormwater runoff using best management practices (BMPs) in six areas:
• Public Involvement
• Illicit Discharge Detention and Elimination
• Construction Site
Runoff Management
• Good Housekeeping and Pollution Prevention
• Public Education
• Post Construction
Stormwater Management
Phase II expands on Phase I by requiring MS4s and small construction sides to implement programs and practices to control polluted stormwater through National Pollutant Discharge Elimination Systems permits. More information on the programs can be found here.
Property owners can receive a stormwater fee credit of up to 25% for adequately installed and maintained stormwater mitigation facilities.

The City manages stormwater runoff from new development through its Stormwater Management Ordinance, found here. Developers are required to submit a stormwater management and sediment control plan prior to building plans being approved. Review of the plans is guided by the Zoning Ordinance and Stormwater
Management Design Manual. The Zoning Ordinance can be found here and the Stormwater Management Design Manual can be found here.
In 2013, the Stormwater Division developed a Neighborhood Stormwater Project List of neighborhood stormwater issues that need addressing. The highest priority projects are put into their Capital Improvement Program List. Both lists are continually updated as new needs arise. Information on projects, project amounts, and privatization can be found on the City's stormwater page located here.
A well-maintained collection and treatment system for wastewater is important to the quality of water available for consumption. The City's wastewater is treated and released into the Catawba River at the Manchester Creek Wastewater Treatment Plant. Leaks due to age, backups, and excessive stormwater into sewer lines during heavy rainfall impact quality. To prevent these overflows, the Utility Department routinely cleans main sewer lines, monitors outflows, and identifies and fixes leaks in the system before they become an issue.
Septic system failures in unserved areas can greatly impact water quality.
A permit is required to build a septic system through the South Carolina Department of Environmental Services. Many older septic tanks were installed based on outdated soil testing methods that would not pass today. Also, lack of maintenance; missing, broken, or worn fittings; incorrect installation; and increased use can contribute to septic failures.
The Catawba-Wateree River Basin has experienced varied degrees of drought conditions over the last few decades. Between August 2006 and December 2009, the State of South Carolina declared a statewide drought, including the worst drought in recorded history in 2007. The drought damaged aquatic habitat, caused structural damage to major infrastructure and boat ramp closures, and threatened public water supply. These conditions led to the implementation and enforcement of mandatory water conservation measures by all water providers, including the City. Measures taken to manage drought conditions in our area are:
CATAWBA-WATEREE DROUGHT MANAGEMENT ADVISORY GROUP
Created to develop protocol and procedures for reductions in water usage during periods of low inflow. Find out more here.
Developed a basin-wide water supply master plan in 2014 to ensure the water supply will support the growing needs in the region for the next century. Find out more here.
Provides guidance on actions the City should take to conserve water during different stages of a drought. Find out more here.
Since 2009, the City has used reclaimed water to irrigate Manchester Meadows, Manchester Village Shops, and Galleria Mall area to reduce water withdrawal from Lake Wylie and decrease the amount of potable water used for irrigation.
The City's public water system is regulated by the Safe Drinking Water Act which require it to meet national drinking water standards. The City must publish an annual Consumer Confidence Report with:
- What's in the water
- Where it comes from
- How standards are achieved.
According to the 2023 report, the City performed more than 4,000 tests at 164 sites and found no violations in the City's drinking water.
- Residential customers are billed on a tiered rate structure. The more you use, the higher the rate.
- Commercial and industrial customers are charged a higher consumption rate during peak usage months - May through October.
By the end of 2019, the City had a fully operating system where water meters can be read remotely. This allows the City to detect problems, such as water leaks, more quickly and prevent theft of water, which will keep costs down.
York County Soil & Water Conservation District
Promote wise and responsible land use of natural resources through education, demonstration projects, and technical services to primarily schools and farmers.
Visit its website here.
City of Rock Hill
Clean & Green Board - Provides leadership, education and coordination of community programs for beautification, litter prevention, recycling education and outreach and other sustainability issues.
Cycling & Outdoor Center Supervisor - Runs student programming like hiking and kayaking trips, bike rides, family programs, school trips, etc.
for a greener tomorrow, today Reduce Reuse Recycle


Alternative Fuel
Charging stations, electric buses, alternative fuel City vehicles
Energy Reduction Campaign
Reduce energy usage
In-House Recycling Initiative
How to improve recycling efforts
Lighting
LED signals and street lights, motion sensors, energy efficient lights
Purchasing Policy
Encouraging buying greener products
School Recycling
Revenue share program
Renewable Energy
Zoning ordinance addresses solar energy
Health and the built environment are inextricably linked. Decisions about land use, transportation, community facilities, housing, and parks and open space have implications for physical activity, mental health, air and water quality, and accessibility. The content of each plan element is informed by the connection between health and the built environment, since health is also largely influenced by our individual behavior such as our diet and exercise. Although not required by South Carolina statute as a plan element, the City has developed this Public Health element to share health-related data and efforts underway in support of resident quality and longevity of life.
Health data is primarily collected by federal and state agencies, foundations, and health institutes and is most often available at the national, state, and county levels. Very little health data is available at the local level. Thus the following sections indicate how South Carolina fares relative to the nation and when available York County and Rock Hill data is included.
Health and wellness are influenced by many factors including our genetics, behaviors, environment and social dimensions such as education and income level. It is difficult to sort through correlation verses causation. What is considered "healthy" one day may be deemed "unhealthy" the next. Even further, what affects one person often does not affect another in the same way. Most would agree, though, that wellness is paramount. While our health care system has historically been focused on the treatment of chronic disease and illness, more emphasis is being made on prevention and better daily behavior choices.
prevention is better than a cure
While there are many aspects that influence and impact our health and wellness, the majority of illness and poor health are systemic of poor behavioral choices. Shifting the focus to prevention is the most effective way to obtain good health and wellness.
wellness poor health
EXERCISE
ROUTINE CHECK-UPS WORK-LIFE BALANCE
CHRONIC FATIGUE
FOOD DESERTS POOR WATER & AIR QUALITY NUTRITIONAL DEFICIENCIES
behavior genetics environment social
HEALTH INFLUENCERS
Figure 9.1 highlights the 2022 top eight causes of death in the United States as compared to South Carolina, York County and Rock Hill. Cancer and heart disease continue to be the leading causes. Obesity is one of the key commonalities among the leading causes of death. It is associated with four of the top eight causes of death including some types of cancer, heart disease, stroke, and diabetes. Additionally those with other life-threatening diseases find that extra weight can exacerbate their condition.
FIGURE 9.1 LEADING CAUSES OF DEATH, PERCENTAGE OF POPULATION, 2022
Source: Centers for Disease Control and Prevention and S.C. DPH. https://www.cdc.gov/nchs/nvss/mortality/lcwk5_hr.htm https://dph.sc.gov/professionals/public-health-data/biostatistics-publications
ACCIDENTS
“ “
The doctor of the future will no longer treat the human frame with drugs, but rather will cure and prevent disease with nutrition. – Thomas Edison
COVID-19
CHRONIC LOWER RESPIRATORY DISEASE
DISEASES OF HEART CEREBROVASULAR DISEASE (STROKE)
ALZHEIMER'S DISEASE
DIABETES MELLITUS
While the number of obese adults (BMI of greater than 30) in the United States and South Carolina has been rising, the number of obese youth is also rising, Figure 9.2. Similarly, those who have an overweight classification (BMI of 25 - 30) has also risen. South Carolina continues to have more people who are overweight or obese than the nation. This trend is considerably troubling since there is a higher risk that youth who are overweight or obese are more likely to be adults with weight-related health issues. The increase in health-related costs is reflective of these rising trends.
FIGURE 9.2 PERCENTAGE OF OBESE ADULTS & YOUTH COMPARISON, 2013 - 2023
Source: CDC. Behavioral Risk Factor Surveillance System (BRFSS) and Youth Risk Behavior Surveillance System (YRBSS)
U.S. Adults (18+ yrs of age) U.S. Youth (9-12 yrs of age)
S. C. Adults (18+ yrs of age) S.C. Youth (9-12 yrs of age)
The Body Mass Index (BMI) is used as an initial screening tool. For adults, these ranges are defined asKnow your BMI? Use the calculators here for adults & youth!

Source: Center for Disease Control and Prevention, https://www.cdc.gov/obesity/adult/defining.html


Source: Journal of General Internal Medicine, April 2017, Volume 32, pp6-8, https://link.springer.com/article/10.1007%2Fs11606-016-3968-8
U.S. MEDICAL COSTS OF OBESITY (2019 DOLLARS) BILLION $173 S.C.
68% AMERICANS OVERWEIGHT OR OBESE HIGHEST OBESITY NATIONAL RANK IN 2023 MORE ANNUALLY ON AVERAGE IN MEDICAL COSTS / S.C. OBESE PERSON

12TH $1,861


2 of 3 S.C. adults overweight or obese
1 of 3 S.C. youth overweight or obese

Sources: Centers for Disease Control and Prevention, BRFSS & YRBSS https://nccd.cdc.gov/dnpao_dtm/rdPage.aspx?rdReport=DNPAO_DTM. ExploreByTopic&islClass=OWS&islTopic=OWS1&islYear=20232023
S.C. Dept. of Health & Environmental Control https://www.scdhec.gov/health/nutrition-obesity-physical-health
The State of Obesity, a Robert Wood Johnson Foundation. https://www.stateofobesity.org/childhood/, fast facts.
The United States has seen a considerable rise in the number of overweight and obese population particularly since the 1970s. The majority of Americans today are overweight or obese. Obesity is serious; it is linked to chronic diseases and causes of death. Obesity is complex; it does not impact everyone in the same way. Obesity is costly; it is estimated to cost Americans more than $173 billion annually (in 2023 dollars). Unlike other serious health issues that are genetic, being overweight or obese is largely preventable and controllable through good nutrition and physical activity. For this reason, the following sections focus on a better understanding of the implications of obesity and what resources are available to improve our health.
While obesity can impact anyone, some are at more risk than others. According to the 2023 Behavioral Risk Factor Surveillance System (BRFSS) data, those adults with a greater prevalence of obesity include -
• middle-aged adults
• various racial and ethnic groups, particularly AfricanAmericans and American Indians
• adults living in rural areas
• adults with lower education attainment
• lower-income adults
• adults who were overweight or obese as children
FIGURE 9.3 PERCENTAGE OF ADULTS AND YOUTH CONSUMING FRUITS AND VEGETABLES LESS THAN ONCE A DAY, 2011 - 2021
Source: CDC. Behavioral Risk Factor Surveillance System (BRFSS) and Youth Risk Behavior Surveillance System (YRBSS)
U.S. Adults (18+ yrs of age) U.S. Youth (9-12 yrs of age)
S. C. Adults (18+ yrs of age) S.C. Youth (9-12 yrs of age)
Good nutrition is the best single way to support a long and healthy life. Yet according to the BRFSS, there are more South Carolina adults than the national average consuming fruits less than once a day, Figure 9.3.; whereas South Carolina adults compared to the national average, are better or about the same in terms of consuming vegetables less than once a day. Likewise, according to the Youth Risk Behavioral Surveillance System (YRBSS), there are more South Carolina youth than the national average consuming fruits and vegetables less than once a day, Figure 9.3. Both are rising trends.
The average American eats 17 teaspoons of added sugar a day according to the American Health Association. That is almost twice the recommended amount for men (9 teaspoons) and three times the recommended amount for women and children (6 teaspoons). The story is similar for sodium and oils/fats.
9 teaspoons
1/3 teaspoon
8 teaspoons
6 teaspoons recommended guideline for men women
6 teaspoons
1/4 teaspoon
Source: U.S. Department of Health and Human Services and the U.S. Department of Agriculture, Dietary Guidelines 2015 - 2020. Guidelines vary by age and health conditions; learn more here
Combining regular physical activity with a good diet is the ideal for achieving overall fitness. Similarly to diet, the majority of Americans do not meet the recommended physical activity objectives. The BRFSS reported a rise in the percentage of adults living in South Carolina meeting the aerobic physical activity (150 minutes per week of moderate activity or 75 minutes of vigorous activity) and muscle strengthening objectives as compared to the nation (two or more times a week) in 2019 and 2021, Figure 9.4.
Even though the physical objectives are different for youth than adults (60 minutes or more per day of moderate to vigorous activity for youth), a similar disparity had existed for youth until 2021 when the percentage of South Carolina youth is about that of the nation, Figure 9.4.
FIGURE 9.4 PERCENTAGE OF ADULTS AND YOUTH MEETING PHYSICAL ACTIVITY OBJECTIVES 2011 - 2021
Source: CDC. Behavioral Risk Factor Surveillance System (BRFSS) and Youth Risk Behavior Surveillance System (YRBSS)
A food desert is a geographic area where a grocery store or similar food source is limited. More specifically, the food environment index equally weighs the proportion of the population who are low income and do not live close to a grocery store and the percentage of the population who did not have access to a reliable source of food. The 2021 County Health Rankings & Roadmaps indicates York County has a food environment index of 9.0 compared to the State index of 7.0 (zero is worst and 10 is best). This is an improvement over the 2014 York County index of 7.2, while the State has remained the same an index of 7.0 in 2014.
According to the USDA Food Access Research Atlas (based on 2019 Census tract polygons), Rock Hill has six Census tracts where more than 100 housing units do not have a vehicle and are more than ½ mile from the nearest supermarket. These census tracts are concentrated in downtown and south of downtown, Map 9.1. Additionally, Map 9.2 shows where the highest concentrations of fast food establishments are located within the City. The majority are concentrated near I-77 exits and at major intersections like Heckle Boulevard/Herlong Avenue and Albright Road/East Black Street/East Main Street/East White Street.
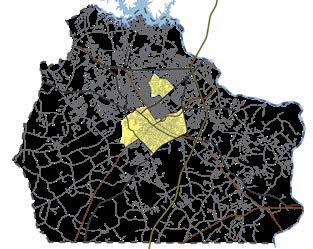
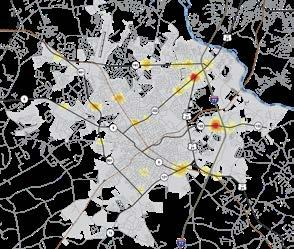
Many efforts related to improving overall health take place at various levels of government as well as non-government organizations. The following section is not intended to be a comprehensive inventory of these efforts, but rather a launching point from which further details can be gleaned about major efforts, programs, advocacy groups, and resources, Tables 9.1 - 9.4.
TABLE 9.1 STATE INITIATIVES
Live Healthy SC
Healthier Generation
SC New and Beginning Farmer Program
Carolina Farm Stewardship Association
Palmetto Cycling Coalition
Quit Now Campaign
Smokefree SC
Creating 100 Percent Tobacco-Free Schools
ORGANIZATION / SPONSORS AREA OF FOCUS PROGRAMS & ONLINE RESOURCES
Alliance for a Healthier SC, SC
Department of Public Health (DPH) & SC Office of Rural Health
Alliance For A Healthier Generation, SC DPH, American Heart Association & Clinton Foundation
Clemson Cooperative Extension
Non-profit member organization
SC Livable Communities Alliance, AHA & and more
SC DPH, CDC
SC Department of Alcohol and Other Drug Abuse Services
SC DPH
Diet & Exercise
State Health Assessment
State Health Improvement Plan
Diet & Exercise Resources and SC program information
Food Access Program information
Food Access Farm Services Impact Report, 2017
Exercise
Cycling advocacy & multimodal related policy information
SC Livable Communities Alliance
Tobacco Use SC program-related information
Tobacco Use Support and Program information
Tobacco Use SC DPH School Administrator Guide
TABLE 9.2 REGIONAL INITIATIVES
Catawba Regional Ag + Art Tour
CONNECT Our Future
Tri County SC Girls on the Run
TABLE 9.3 YORK COUNTY INITIATIVES
ORGANIZATION / SPONSORS AREA OF FOCUS PROGRAMS & ONLINE RESOURCES
Clemson Cooperative Extension, SC Agritourism Association & more Diet & Food Access Event information and more
Consortium of regional members Diet & Exercise
Resources on Farm to School, community gardens, healthy food access, public health and more
Non-profit organization Exercise Programs, events and more
Wholespire
Tobacco Free York County
York County Cooperative Extension
ORGANIZATION / SPONSORS AREA OF FOCUS PROGRAMS & ONLINE RESOURCES
Non-profit organization Diet & Exercise
Options For Action Advocacy, programs, events, resources
Non-profit organization Tobacco Use Resources, awareness and support
Clemson Cooperative Extension Food Access Program information
TABLE 9.4
Rock Hill School District 3
Rock Hill Schools Education Foundation
Parks, Recreation & Tourism
Old Town Farmers Market
ORGANIZATION / SPONSORS AREA OF FOCUS
Public school system
Diet & Exercise
Wellness Policy - See each school website for respective Health & Wellness Committees to get involved
Non-profit organization, community + Rock Hill Schools alliance Diet & Exercise Back the Pack Programs and initiatives
Recreational Programs - for all ages & interests
A.L.L. Outdoors Facilities
City of Rock Hill Exercise
Only in Old Town Diet
Trails & Greenways Map
Bike Rock Hill & Map cycling awareness and advocacy campaign
Schedule & application details
Piedmont Medical Center (PMC) offers alternate funding and payment plan options including a Medical Eligibility Program, a Charity Care Program, and an Uninsured Discount Program.
Palmetto Community Health Care is a free medical clinic located on Oakland Avenue in Rock Hill that provides primary care, dental care, eye care, treatment of minor acute illnesses, management of chronic health conditions, nutritional counseling for diabetes and obesity, mammography screening, and routine lab and radiology services.
Community Medicine Foundation also operates both a main office (North Central Family Medical Center) on Saluda Street, and a satellite site (North Central Pediatric and Adolescent Center) on Herlong Avenue that provides affordable health care services to residents.
York Technical College has a Dental Clinic associated with its Dental Technologies Program that provides oral health services including oral exams, teeth cleaning, fluoride treatments and x-rays.
Affinity Health Center provides medical care and support services for people living with HIV/AIDS.
The City of Rock Hill, along with community agencies, nonprofit groups, and other organizations, support a myriad of community efforts to heighten public health and wellness into the future. These efforts can be in the form of policy, plans, grants, and other initiatives to fulfill community needs, Table 9.5.
BlueCross BlueShield of S.C. Foundation
Rock Hill Educational Community Garden
Garden Fresh Vegetables Project
various jurisdictional plans
PROGRAMS & ONLINE RESOURCES
Health Priority Grants
Catalyst Grants WISE grant program
various jurisdictional policies & ordinances
Chapter 4 & Community Design Standards, Chapter 6 TABLE 9.5 OTHER LOCAL SUPPORT INITIATIVES
Winthrop University, City of Rock Hill, Clemson Master Gardeners, and more
City of Rock Hill employees donate fresh fruits and vegetables to non-profits like Pilgrim's Inn & Project Hope
2055 Long Range Transportation Plan Update (RFATS) RFATS TIP progress report
Connect Rock Hill - Bicycle and Pedestrian Master Plan
Trails and Greenways Master Plan Update
Carolina Thread Trail Master Plan
Complete Streets Advocacy Manual
SCDOT Pedestrian & Bicycle Safety Action Plan
City of Rock Hill Zoning Ordinance, Primary Uses,
This element provides an overview of the existing land use, which is important to identify and characterize different areas within the planning area. The existing land use map is a critical component in generating the Future Land Use Map (FLUM) which will be discussed in Volume II, the Vision document. Additionally, this element will provide a parcel density analysis and basic analysis for both infill and greenfield development.
Each parcel in the Planning Area has been classified into 12 different land uses, which are described on the following page. As parcels change use, the Existing Land Use Map, Map 10.1 and Existing Land Use Table, Table 10.1 will be updated. The most common land use type in the planning area is undeveloped land and the most common in the City is single-family.
TABLE 10.1 EXISTING LAND USE
Source: Rock Hill Planning & Development Department


Wooded, agriculture, infill-ready, deteriorated buildings, or no structure
PARKS AND OPEN SPACE
Environmentally sensitive, recreational, or Homeowners' Association managed
RURAL RESIDENTIAL
Single-family home located in rural areas that lack formal/modern subdivision layouts


SINGLE-FAMILY DETACHED
Single-family home located in subdivisions or in a more urban setting

SINGLE-FAMILY ATTACHED
Single structure occupied by two or more families (for example duplexes or townhomes)


PUBLIC AND INSTITUTIONAL
Governmental entity, utility provider, religious institutions, hospital, education, or elderly care
OFFICE
Space for employees such as medical, financial, legal, or similar professionals
COMMERCIAL
Retail or provision of services
MIXED-USE
Combination of residential, commercial, office, employment, or recreation
INDUSTRIAL
Manufacturing or logistics


MULTI-FAMILY
Single parcel occupied by multiple families

CATAWBA INDIAN NATION
Catawba Indian Nation-owned land
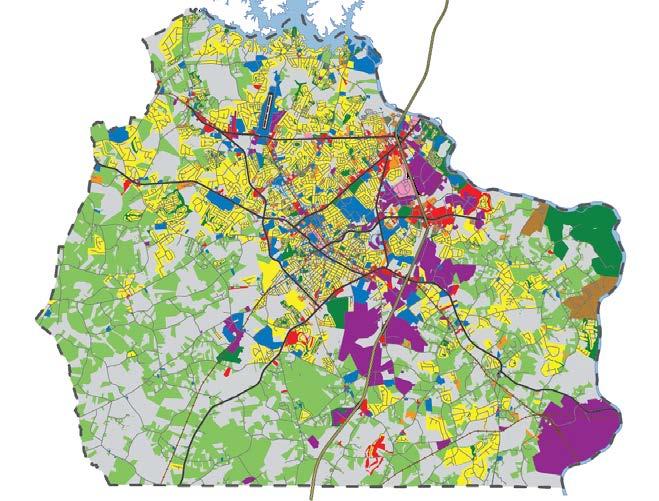
The majority of parcels less than one acre are located within the City limits and within subdivisions in the Planning Area, Map 10.4. Some large tracts of land still exist within the City limits, but they are primarily parks and campuses. The majority of large, undeveloped, privately-owned tracts are located in the County. These lands could be developed as greenfield developments in the future if the land is sold.
Nearly 1,250 undeveloped parcels are located within the City between 0.25 and 20 acres that could be used for infill development (redevelopment of land) depending on zoning, environmental constraints, and other factors.
Source: City of Rock Hill Planning & Development
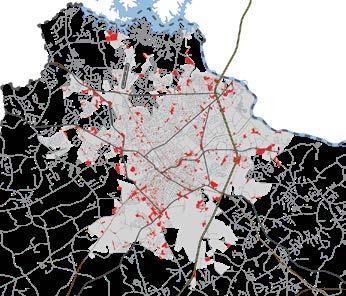
Nearly 450 parcels over 20 acres within the Planning Area could be used for greenfield development (construction on undeveloped land) depending on zoning, environmental constraints, and other factors.
Source: City of Rock Hill Planning & Development
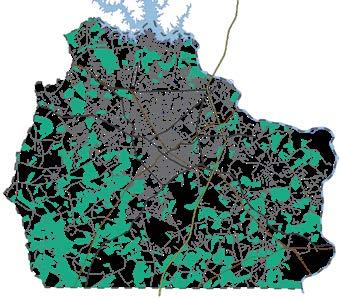
Source: City of Rock Hill Planning & Development
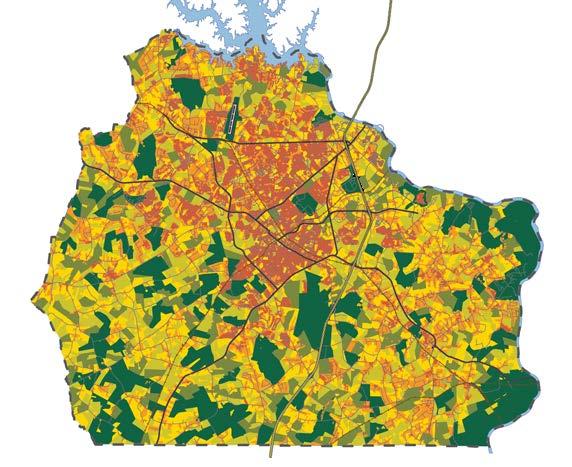
Land use patterns have created areas with different character throughout the Planning Area. The heart of the City, downtown, reflects the historic urban core of the City. This area contains a mix of uses and higher densities and street connectivity than other areas. Downtown is surrounded by Suburban Neighborhoods, which make up the majority of the City. Suburban Neighborhoods are primarily comprised of single-family detached residential subdivisions that are dependent on the automobile and are largely isolated from other developments and land uses. The City has three mixed-use centers, in Riverwalk, University Center, and The Thread, that emphasizes active living in a mixed-use environment. There are also two planned mixed-use developments, one at the former Herald site and one at the intersection of Celanese Road and Ebinport Road. Commercial uses are located along major roads and at key intersections, and are also largely disconnected from adjacent businesses and surrounding neighborhoods. On the edges of Suburban Neighborhoods are Edge Management areas that are more rural in nature, but are experiencing the greatest growth pressures. These areas also primarily contain single-family detached homes, but often at lower densities, based on the availability of utilities. Existing and emerging employment areas are located primarily around the interstate.
Zoning is a tool to help implement land use policies. Therefore, the Zoning Map and regulations should reflect the land use policies contained in the Comprehensive Plan as much as practicable and feasible. However, zoning is a legal implementing tool at a parcel specific level, while the Land Use Element of the Comprehensive Plan is a broader policy guide. Further, both land use policy and zoning regulations operate amid ever changing land use patterns and development dynamics. As a result, there are instances where zoning does not specifically reflect the existing land use patterns or policies.
Map 10.5 is a generalized zoning map. For instance, where single-family is shown, there are four single-family zoning districts (SF-2, SF-3, SF-4, and SF-5). These districts vary on intensity with SF-2 being the least intense, and SF-5 being the most intense. The Zoning Ordinance can be viewed here.
Source: City of Rock Hill Planning & Development
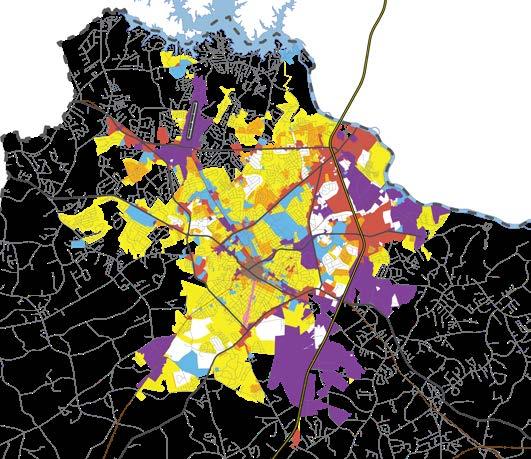
After five years of unprecedented flood events, the South Carolina General Assembly passed the Disaster Relief and Resilience Act in 2020. This Act was adopted to support efforts that minimize the impact of severe flood events and that facilitate recovery. Severe flood events, often associated with hurricanes, are most likely to occur in South Carolina's Lowcountry communities. Located in the higher elevation region of the Piedmont and about 160 miles west of the coast, the City of Rock Hill is less likely to experience the level of devastation related to hurricanes that Lowcountry areas have historically faced. Yet the risk is not zero, as many area residents recall from having lived through Hurricane Hugo in 1989. Even though rising sea levels and climate change are anticipated to cause greater future risk, Rock Hill's level of risk is anticipated to remain relatively low in comparison to other eastern, South Carolina communities. For purposes of comparison, the projected flood risk in 30 years is 77% for Mount Pleasant, 8.1% for Summerville, and 5.7% for Rock Hill (FloodFactor - https://floodfactor.com/city/rock-hill-southcarolina/4561405_fsid). Rock Hill has other types of flood risks being located below the Lake Wylie dam. Additionally, as a major utility provider in the region, Rock Hill must be prepared for this risk and related types of disasters, even if the risk is considered low, like with a dam breach.
Moreover, recent events (like the COVID-19 pandemic, Rock Hill's April 2024 Microburst, or Hurricane Helene in fall of 2024) have further raised the importance of a community's resiliency. Emergency preparedness and continuity planning by local governments is necessary to ensure the provision of essential services to citizens after the disaster. The City's motto, "Always On," is supported by leadership, staff, and allied agencies committed to serving the Rock Hill community. The City has a strong history of planning and programs to enable emergency response, hazard mitigation, and continuity of operations, all tied closely to community communications and neighborhood engagement.
The Disaster Relief and Resilience Act requires the Resiliency Element to -
• include an inventory of existing resiliency conditions,
• promote resilient planning, design and development, and
• be coordinated with adjacent and relevant jurisdictions and agencies.
The City's Resiliency Element not only addresses these requirements, but it also takes a broad view of what resiliency means for Rock Hill - beyond weather-related challenges, Rock Hill will consider and integrate resiliency across all Plan Elements and Core Values. Rock Hill is taking an "All-Hazards" approach to preparedness.
“
“ Resiliency is the ability of our community to respond, recover, and thrive despite life's challenges.
Crisis, disaster or stress can impact any one, or all, of our environments - natural, built, social, and economic. It is through hazard mitigation planning practices, Figure 11.1, that the impact of disasters on our environments can be minimized. When a crisis occurs, the impacts are typically experienced on multiple fronts.
As with other Plan Elements that are inter-related, resiliency must be considered across all Elements in order to make each of our environments more resilient.
This is a multi-faceted endeavor. Historically, mitigation has been the most effective activity to minimize the risk and magnitude of disasters.
FIGURE 11.1 RELATIONSHIPS OF ELEMENTS AND ENVIRONMENTS
Source: City of Rock Hill Planning & Development
Our natural environment's existing conditions are detailed in the Natural Resources Element and includes our watersheds, basins, floodplains and wetlands. Detailed existing conditions about our built environment are included in the Land Use, Housing, Economic Development, Transportation, Community Facilities, and Cultural Resources Elements. Existing conditions about our economic environment are primarily detailed in the Economic Development Element, but can also be found in the Population and Priority Investment Elements. The social environment is described in a number of elements including Population, Housing, Community Facilities, Cultural Resources, and Public Health.
For purposes of this Plan, types of disasters are categorized into three major groups - natural, technological failure or human-caused accident, and human-caused assaults or attacks. This categorization purposefully separates incidents that are accidental versus intentional in order to raise the level of risk analysis, the level of preparedness, and ultimately mitigation strategies. In reality there are often hybrids; what may begin as a natural phenomenon can become tragic because of technological and/or human failures. Table 11.1 lists the major types of disasters that could occur in York County and the planning area. With the exception of disease-related disasters, the Federal Emergency Management Agency (FEMA) reviews plans for natural hazards. Hazards related to human causes typically involve law enforcement officers and emergency management personnel.
TABLE 11.1 MAJOR TYPES OF DISASTERS PROBABLE IN THE PLANNING AREA
*Note: Any of the items listed under the technological failure or human-caused accidents could be used as a means of an assault or attack.
Natural Disasters
Severe Thunderstorm
Winter Weather
Flood
Drought
Wildfire
Tornado
Hurricane/Tropical Storm
Earthquake
Disease / Pandemic
Technological Failure or Human-caused Accident
Dam Failure
Airport Hazards
Train Derailment
Nuclear Plant Hazards
Human-caused Assault / Attack*
Terrorism & Civil Disturbance
Cyber-Attacks (data & infrastructure)
Active Violence or Active Assailant
Contaminating Drinking Water
Transportation & Infrastructure Accidents Arson
Utility (including pipeline & waterline ) Disruptions
Industrial Site Hazards
Hazardous Material Incidents
Biological, Chemical & Radiological Incidents
Fire
Supply-Chain Disruptions
The City has or is part of a number of plans, policies, and other existing protective measures that prescribe how to prepare, respond, recover, and mitigate various types of emergencies and hazards. Some of these are more focused on natural disasters, while others are focused on human-caused incidents. Most are updated on a periodic basis and some of these plans are online and/or available through the identified agency/jurisdiction (hyperlinks included if available). Some of these plans are not public documents due to their sensitive nature. Many of these plans are written for personnel who have a role and/or job duty pertaining to public health, community safety, environmental health, or a strong economy. Table 11.2 provides a visual reference to quickly identify the plans (summarized on the following pages) that apply to a type of incident verses the phases of hazard mitigation.
TABLE 11.2 CROSS REFERENCE MAJOR TYPES OF PLANS & EXISTING PROTECTIVE MEASURES
*Note: Definition of infrastructure here is general to the built environment.
PREPAREDNESS RESPONSE RECOVERY MITIGATION
MITIGATION
Natural Disasters
Severe Thunderstorm, Winter Weather, Flood, Drought, Wildfire, Tornado, Hurricane/Tropical Storm, Earthquake
Disease / Pandemic
Technological Failure or Human-caused Accident
Dam Failure & Nuclear Plant Hazards
Airport Hazards
Train Derailment
Transportation & Infrastructure* Accidents, Utility Disruptions, Industrial Site Hazards, Hazardous Material Incidents, Biological, Chemical & Radiological Incidents, Fire, Supply-Chain Disruptions
Human-caused Assault / Attack
Terrorism & Civil Disturbance
Cyber-Attacks (data & infrastructure)
Active Violence or Active Assailant
Contaminating Drinking Water
Arson
York County Emergency Operations Plan, 2024
York County leads the initiative to periodically review and update this multi-jurisdiction plan. Participation and feedback are solicited from public and private agencies across the County. The York County Office of Emergency Management (OEM) is charged with implementing the Emergency Operations Plan through coordination with all County departments, agencies, hospitals, utilities, school districts, special purpose districts, the Catawba Nation, municipalities and other public and/or private entities. The OEM works closely with federal and state agencies including the North Carolina Department of Public Safety (NCDPS) and the South Carolina Emergency Management Division (SCEMD). This Plan includes procedures and policies to address natural and human-caused incidents. The following plans are appendices -
Radiological Emergency Plan
Multi-Jurisdictional Hazard Mitigation Plan
Debris Management Plan
Mass Casualty Plan
Mass Fatality Plan
Animal Response Plan
The Multi-Jurisdictional Hazard Mitigation Plan includes specific City of Rock Hill goals and objectives, to protect public health and safety, promote a sustainable economy, protect the environment, and increase public preparedness for disasters. The Mitigation Planning Committee identified, analyzed, and prioritized all goals and objectives based on hazard vulnerability, historical occurrence of the hazard, cost effectiveness and compliance with National Flood Insurance Program (NFIP). Like the EOP, this Plan is periodically reviewed, updated and approved.
The City's Office of Emergency Management works closely with the County's OEM. The York County Emergency Operations and Public Safety Communications Center is equipped with state-of-the-art technology to assist in information gathering, assessment, and public notification. Sirens are activated in emergency situations, such as a tornado warning or an incident at the Catawba Nuclear Station (see letter I), and are activated for a three-minute-test the second Wednesday of each quarter to ensure they work properly across the county. Emergency information is broadcast on local television and radio stations.
The City has created an EOP that complements that of the County's EOP. The draft EOP is under review and adoption is targeted for early 2026. This umbrella plan will include the City's procedures and policies to address emergency incidents from mitigation and preparedness through to response and recovery.
The COOP details the key activities that each City Department must continue to function during and after a disaster. This plan is currently under review and revision with adoption targeted for 2026 - 2027.
The City's Strategic Plan is structured around three core strategic initiatives - serving, engaging, and growing. Thus it considers the current and future state of the City in each of these initiatives. The goals and objectives are based on community involvement, and in part help address our community's resiliency and sustainability.
Both the City's Code of Ordinances and Zoning Ordinance include regulations that safeguard public health, safety, and general welfare of the community, and as such, they encompass many topics related to our community's resiliency. Some of these regulations are directed at preparedness, response and recovery, but most are focused on prevention and mitigation. For example, riparian buffers are required around bodies of water and wetlands, and the land surrounding the airport has a designated overlay district to limit incompatible development. A crossreference list of major topics related to resiliency includes the following. This is not intended to be a comprehensive list.
Airport Protection Measures
Code of Ordinances, Chapter 4, Article III Hazard Protection
Code of Ordinances, Chapter 4, Article IV Regulations
Zoning Ordinance, Section 3.6, Airport Overlay District
Emergency Services & Preparedness
Code of Ordinances, Chapter 15
Fire Prevention and Protection
Code of Ordinances, Chapter 16
Public Safety
Code of Ordinances, Chapter 24
Railroads
Code of Ordinances, Chapter 25
Zoning
Code of Ordinances, Chapter 31
Zoning Ordinance, Sections 3 - 5, Districts and Permitted Uses
Building Regulations & Standards
Code of Ordinances, Chapter 10
Zoning Ordinance, Sections 6 - 9, Community Design, Construction, Development, Site and Building Standards
Flood Damage Prevention, Flood Hazard Areas & Stormwater Management
Code of Ordinances, Chapter 10, Article VII, Flood Damage Prevention
Zoning Ordinance, Section 7.2.2 Flood Hazard Areas
Zoning Ordinance, Section 8.4 Riparian Buffer Standards
Code of Ordinances, Chapter 29, Article V, Stormwater Management
Zoning Ordinance, Section 7.2.1. Stormwater Management
Utilities
Code of Ordinances, Chapter 29, Article IV, Drought Response
The Stormwater Management & Erosion Control Design Manual provides details for new development to curb erosion and provides engineering guidance for stormwater management.
The Stormwater Master Plan Study was performed within the Manchester, Dutchman, Hidden, Wildcat, and Taylors Creek basins to identify potential flood-prone areas outside of the FEMA flood zones. As a result of this Study, a number of both major projects and neighborhood projects were identified and are included in the City's Capital Improvement Plan (CIP). Additionally, the City modified its approach to riparian buffers, and treats these flood-prone areas the same as FEMA floodplains.
Source: City of Rock Hill Planning & Development, FEMA
If you own property within the 100-year floodplain and are in the City limits, do you have flood insurance? The City's Community Rating System (CRS) is a Class 7, which may mean up to a 30% discount for citizens with flood insurance. Check with your insurance provider. Learn more here.
3 Miles 100-Year Floodplain Impacted Parcels Water Bodies Planning Area Boundary
Rock Hill has adopted by ordinance the State-approved versions of the International Building Code series. This currently includes the 2021 International Building Code, International Residential Code, Fire Code, Fuel Gas Code, Mechanical Code, Existing Building Code, and Property Maintenance Code; the 2020 National Electrical Code, and the 2009 International Energy Conservation Code. This series includes regulations to protect the public health, safety, and general welfare by regulating and controlling the design, construction, quality of materials, and maintenance of all buildings, structures, and certain equipment.
Duke Energy operates the Catawba Nuclear Station and is responsible for safety and preparedness. Duke provides several communications to residents and other stakeholders regarding nuclear emergency preparedness, as well as high water and dam safety tips. More specifically, in the event of a major incident at the Catawba Nuclear Station and/or high water conditions, Duke Energy would immediately notify federal, state, and local authorities of a problem at the station. York County would coordinate communication between the Catawba Nuclear Station and the South Carolina State Warning Point about any emergency that would affect the County, and would activate the emergency outdoor warning sirens if necessary. Citizens living in the Emergency Planning Zone (within 10 miles of the power plant) are mailed guides annually
- 2024 Catawba Nuclear Station Emergency Preparedness Information & Guide.
The airport's plan is a comprehensive plan to guide officials and personnel to respond and address an emergency or disaster situation. This plan was developed using best practices as provided by FEMA and the South Carolina Aviation Association. Sections of the plan directly align with each of the four hazard mitigation phases - preparedness, response, recovery, and mitigation. Various types of hazards are assessed as well as the capability to cope with potential issues. The plan identifies the necessary action and fiscal requirements needed to attain these capabilities.
Similar to the Nuclear Station, Norfolk Southern is charged with safety programs related to rail operations. Norfolk Southern works with community first responders to prepare and safely address potential rail incidents. As part of this training program, Norfolk Southern provides an app for first responders, and provides an Emergency Response Planning Guide.
Two major trends are expected to make resiliency more challenging in the future - continued population growth and development pressures (as noted in the Population Element), and climate change. The 2023 National Climate Assessment predicts more severe weather, temperature increases, and more frequent wildfire and drought incidents in the southeast. The following highlights the implications that these trends will have on our community.
Communication lines, utilities, roads, and bridges are vital to our everyday activities. Our ability to access and to be accessible is paramount at all times, but when disaster strikes, it is critical. As noted in the Housing, Transportation, and Community Facilities Elements, many of our built structures are aging, and older structures are more susceptible to disasters. As weather patterns become more extreme, the risk of infrastructure failures rises. Infrastructure failures can impact police and first responders services, and can cause economic hardship.
Compared to other areas across the nation, our milder climate makes our community a very pleasant and desirable place to live. Unfortunately, that is true for insects too, particularly mosquitoes that transmit diseases. More people, warmer temperatures, and longer active seasons add up to a higher risk of disease and illness. Additionally, heat-related illnesses, such as heat stroke, can increase demands on medical facilities and impact work-related productivity.
COMMUNITY RESILIENCY IN ACTION
Led by the City of Rock Hill and with the support of the South Carolina Department of Health and Environmental Control (DHEC) and a partnership with Piedmont Medical Center and several other local agencies and groups, the Rock Hill - Piedmont Medical Vaccination Center was established in 2021 to administer the COVID-19 Vaccine. Staffed by mostly volunteers (1,600 people), the clinic averaged more than 900 visitors a day, and administered more than 50,000 vaccines between February and October 2021.
The Climate Assessment asserts that the southeast will experience the highest costs in the country resulting from increased electricity demands as temperatures rise. The relative low cost of utilities, such as electricity, gas, and water often make conservation practices and cultivating alternative energy sources a low priority. While solar energy has grown in the southeast, green building standards and conservation practices tend to lag behind other parts of the country.
THE HEAT Even if you are not a Duke Energy customer, Duke offers energy saving tips for air conditioning usage - typically the highest portion of household utility costs during summer months. Check it out here.


OF THE FOOD CONSUMED IS IMPORTED 90%
BUY LOCAL South Carolinians buy $11 billion of food annually, with more than 90% sourced outside the state. Buying local could increase SC producers’ revenue to $1.2 billion annually.
Source: SC Department of Agriculture, Certified SC Grown
As highlighted in the Public Health Element, a good diet is essential to quality of life. If resources, including water, labor, and nutrient-rich soils, are more scarce and/or more costly, then agricultural yields can be lower and/or more costly to produce. Climate change may also cause a shift in the types of crops and/or livestock that have been historically cultivated in the area.
All of the above resiliency challenges can impact our local economy. For example, COVID-19 put stress on private companies and public organizations, locally and nationwide. Adapting to these disruptions through a continued effort towards steady growth is key to maintaining economic resilience.
"If businesses are able to recover, the local economy is able to come back. It's so critical."
- Bill Munro, Owner of Munro, Inc.
Bill Munro, a small business owner, was surprised that his company's emergency plan was outdated and did not hold-up when Hurricane Rita hit his Texas community. Bill attests to the importance of maintaining a plan and utilizing the Ready.gov/business site. This online repository provides free access to tools, guides, and resources specifically for businesses owners and managers. Click here.
Like many of the Elements of the Existing Conditions Report, numerous plans, guides, tools, and other resources exist on the topic of resiliency and hazard mitigation planning. The following is not intended to be a comprehensive list, but rather a starting point from which additional support and tools can be obtained.
TABLE 11.3 FEDERAL INITIATIVES
TOPIC / ORGANIZATION
FEMA Continuity Resource Toolkit
FEMA Resilience Analysis & Planning Tool (RAPT)
FEMA Planning Guides
National Preparedness
Planning Guides
Supply Chain Resilience Guide
USGS Water Alerts
FEMA Flood Map Service Center
FEMA National Flood Insurance Program
Cybersecurity & Infrastructure Security Agency
CDC's Center for Preparedness & Response
TABLE 11.4 STATE & REGIONAL INITIATIVES
South Carolina Emergency Management Division (SCEMD)
South Carolina Department of Environmental Services (SCDES)
South Carolina State Climatology Office
ONLINE RESOURCES
https://www.fema.gov/emergency-managers/national-preparedness/continuity/toolkit
https://www.fema.gov/emergency-managers/practitioners/resilience-analysis-and-planning-tool
https://www.fema.gov/emergency-managers/national-preparedness/plan
https://www.ready.gov/
https://www.fema.gov/emergency-managers/national-preparedness/plan#cpg
https://www.fema.gov/sites/default/files/2020-07/supply-chain-resilience-guide.pdf
https://dashboard.waterdata.usgs.gov/app/nwd/en/?aoi=default
https://msc.fema.gov/portal/home
https://www.floodsmart.gov/
https://www.cisa.gov/topics/critical-infrastructure-security-and-resilience/critical-infrastructuresectors
https://www.cdc.gov/prepare-your-health/take-action/practical-skills.html
https://www.scemd.org/prepare/your-emergency-plan/ Mitigation - https://scemd.org/recover/mitigation/ including topics: Family Disaster Planning Family Emergency Kit Preparing Your Pets for Emergencies Citizens with Functional Needs Emergency Preparedness for Kids Report a Power Outage
https://des.sc.gov/community/disaster-preparedness-relief
https://www.dnr.sc.gov/climate/sco/ClimateData/countyData/county_york.php
York County Floodplain Management
Floodplain Management FAQs
Flood Map Viewer
Floodplain Information for Homeowners & other related information
https://www.yorkcountygov.com/458/Floodplain-Management
https://www.yorkcountygov.com/faq.aspx?qid=410
https://maps.yorkcountygov.com/v/index.html?viewer=flood
https://www.cityofrockhill.com/home/showpublisheddocument/24993/637140088071300000
https://www.cityofrockhill.com/departments/planning-and-development/development-plan-review/planreview-steps
In order to preserve and enhance the quality of life throughout South Carolina through better planning and coordination of public infrastructure decisions, the General Assembly passed the Priority Investment Act (PIA) in 2007. The PIA added the Priority Investment Element to the Comprehensive Plan and requires the following:
• an inventory and analysis of funding sources for public infrastructure and facilities,
• a 10-year forecast of infrastructure and facility projects for which the funds will be used,
• a basic level of inter-agency coordination and collaboration, and
• consistency among allied planning documents.
The City of Rock Hill has a well-defined and transparent budget process described in full detail in the City's annual Budget document. The Budget document includes the Capital Improvement Plan (CIP) and the Strategic Plan. The first two PIA requirements mentioned above are detailed in the City's CIP. Since the Budget and CIP are ever-changing, it is recommended to reference these source documents for details and the most current information. The following pages provide a summary of the funding sources and the project forecast information per the CIP for FY2026 - FY2030, the most current at the time of this report. The vision portion of the Comprehensive Plan includes how this project forecast aligns with the City's Core Values and recommends a path forward. Other allied plans include:
• RFATS Long-Range Transportation Plan (LRTP)
• RFATS Transportation Improvement Plan (TIP)
• City department master plans
The City of Rock Hill uses a performance-based budgeting approach and a two-year budgeting process to clearly demonstrate how financial decisions in one year affect the future.
Budget Workshop
Depart's draft expenditure requests Finance drafts estimated revenues
Evaluation & assessment
Draft budget presented to Council
Formulate draft budget
Adoption process
How are we currently tracking? Check it out here!
A brief summary of the various types of revenue sources are provided in Table 12.1; for additional details reference the Budget document. Table 12.2 is a summary by focus area of the forecast of revenue sources per the CIP FY2026 - FY2030. The CIP provides the funding source details by focus area per the CIP page number cross reference. Utility Revenue bonds are the largest funding source for capital projects, followed by State Revolving Fund loans and Tax Increment Financing bonds. These three sources make up nearly 70% of the City's funding for capital projects.
Non-Enterprise Funds
General Fund
Economic Development Fund
Local Transit Fund
Local Accommodations & Hospitality Tax
Tax Increment Financing (TIF)
Parking Fund
Enterprise Funds
Electric Fund
Stormwater Fund
Water Fund
Wastewater Fund
Impact Fees
Fire Impact Fee Fund
Water Impact Fee Fund
Wastewater Impact Fee Fund
Revenue predominately from property taxes, charges for services, licenses and permits.
Proceeds from land sales used to support economic development.
Sources from federal transit grants, private partnerships and City contributions fund the operations of My Ride.
Revenue from 3% local accommodations tax on lodging and 2% local hospitality tax on food and beverage.
Revenue from taxes used to pay for capital improvements in the two TIF districts. See the Economic Development Element for details.
Revenues collected from deck & on-street parking sales to operate and maintain the parking system.
Bonds
Utility Revenue Bonds
TIF Bonds
General Obligation Bonds
Bond Anticipation Notes (BANs)
Assessment Bonds
Other Sources
State Revolving Fund Loans
Capital Lease
Grants
Funds used to operate and maintain the City's utility systems any remaining funds are typically used to pay debt service on existing utility bonds.
Financial payments made by a developer to pay for all or a portion of cost to provide services to new development.
Debt obligation for the expansion of utility facilities.
Debt obligation for funding capital improvement projects within the district.
Debt obligation backed by the City's "full faith and credit" and taxing power to fund capital improvement projects for the general public.
Smaller, short-term financing for capital projects.
Debt obligation for funding capital projects to be repaid by assessments in municipal improvement districts.
Managed by SCDES, this fund program provides low-interest rate loans for clean water, drinking water and stormwater capital projects.
Fixed-term lease similar to a loan agreement for purchasing a capital asset on installment.
Lump-sum funding secured for specific one-time projects. The City secures grants from public agencies and private organizations.
Public-Private Partnerships Agreements to finance, build and/or operate capital projects.
Transportation Revenue Sources
C-Funds
RFATS Guideshare
Transportation Alternatives Program (TAP)
Congestion Management & Air Quality (CMAQ) Improvement Funds
Pennies For Progress
See the Transportation Element for definitions and details.
TABLE 12.2 REVENUE SUMMARY BY FOCUS AREA
Source: City of Rock Hill Capital Improvement Plan

The City continues to strengthen coordination among departments as well as between the City and outside agencies and jurisdictions. Under the PIA, the City must coordinate with adjacent and relevant jurisdictions and agencies before recommending projects for public expenditure. Below is a list of those jurisdictions and agencies provided the opportunity to be involved in the development of the Rock Hill Comprehensive Plan
• York County
• Rock Hill School District Three
• Rock Hill-Fort Mill Area Transportation Study (RFATS)
• Catawba Regional Council of Governments
• S.C. Department of Environmental Services
• S.C. Department of Transportation
After projecting how much money will be available each fiscal year for capital projects from each of the revenue sources, the City identifies and prioritizes its capital needs. These needs are ever-changing due to shifting priorities, unexpected events, changes in technology, and deviations from projected revenue. For this reason, the CIP is updated on an annual basis and it is best to reference it directly here. At the time of writing this Plan, the FY2025-2026 Budget document includes a five-year schedule of capital improvements (ten-year where applicable) as summarized here in Tables 12.3. For details about specific projects associated with each focus area, cross reference the CIP FY2026-FY2030 by the page number provided in Table 12.3.
TABLE 12.3 PROJECT ALLOCATIONS BY FOCUS AREA
Source: City of Rock Hill Capital Improvement Plan
Source: City of Rock Hill Capital Improvement Plan
General Services General Fund & County-Funded Paving; Sidewalk Improvements TABLE 12.4 SUMMARY OF SIGNIFICANT GENERAL GOVERNMENT PROJECTS
Airport Terminal Expansion; Taxiway J Rehab; South Apron Expansion
Knowledge Park Dave Lyle Boulevard Pedestrian Bridge; Traffic Management; Parking Decks PRT Bleachery Fieldhouse; Southside Regional Park Phase I
Every year during the development of the CIP and annual budget, the City has the difficult task of prioritizing all of the proposed projects and determining which projects get funded based on available revenues. Since there are always more projects than there is available revenue, the City must differentiate between projects that are essential and projects that would be “nice to have." Citizen and customer input, as well as anticipated economic development growth projections, play a large role in project prioritization.
If a funding gap still exists after the City finalizes its list of essential projects, then the City must find ways to increase its funding levels. Options that the City may pursue to accomplish this include:
• Allocating a greater portion of a revenue source to capital projects
• Tapping into available, yet not currently utilized funding sources (see right sidebar)
• Increasing taxes
• Increasing rates and fees
• Obtaining voter-approved bond referendums to increase debt capacity

Additional revenue sources are available to the City for funding large-scale planning initiatives or capital improvements. Some of these sources require action by City Council in accordance with State law. Such funds sources may include the following:
• Real Estate Transfer Fees
• State Infrastructure Bank
• Developer In-Kind Contributions
• Impact Fees (for other public facilities)
TABLE 12.5 SUMMARY OF SIGNIFICANT UNFUNDED GENERAL GOVERNMENT PROJECTS
Source: City of Rock Hill Capital Improvement Plan
Focus
Airport Stormwater Design & Construction Improvements
Fire New Fire Station
Police New Police Headquarters
PRT Southside Regional Park Phase II
General Services Paving Funds; Sidewalk Improvements
• Other Local Sales Tax Options
Each of these options would need further review for limitations and conditions.