MEMO
Date: August 2022
To: Audit Finance Committee From: Finance
JUNE CITY‐WIDE TAX REVENUE Real Estate Tax
The City collects property tax in the General Fund and the Health, Parks and Recreation Funds. The City receives real estate taxes in November. Taxes decreased from 2020-21 by $129,417 due the prior year recoupments issued by Jackson County that reduced the City’s assessed property valuation. Recoupments are the settlements by the residents that appeal their property valuations
Budgeted split was set with 68% to General Fund with the remaining 32% to Health Levy Fund and Recreation Prop Fund. The 32% is then split with 32% to Health Levy Fund and 68% to Recreation Prop Fund
Sales Tax


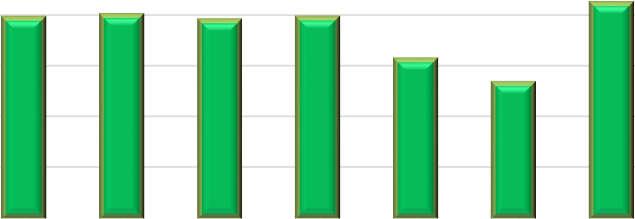
As shown with the red dot on the Sales Tax revenue graph below, June sales tax collections are trending higher than the last two year’s collections.

500,000 1,000,000 1,500,000 2,000,000 2,500,000 SALES TAX REVENUE BY MONTH‐GENERAL FUND 002 2019-20 2020-21 2021-22 15,000,000 16,000,000 17,533,711 17,745,438 18,295,167 19,880,054 0 5,000,000 10,000,000 15,000,000 20,000,000 25,000,000 2016-17 2017-18 2018-19 2019-20 2020-21 2021-22 Annual Sales Tax Revenue General Fund 002 June
2022
30,
Use Tax
The cap for Animal Shelter (Fund 010) is $762,750
Per Ordinance 19251 dated 08/16/21 and the passage of the special election held on November 2, 2021, the cap for Police Use Tax (Fund 018) has increase from $3,032,000 to $4,000,000 and allows for the police portion of the use tax to be utilized for all sworn police personnel and equipment.
The funds received after the caps have been met are then prorated based on the sales tax rate for each of the funds receiving sales tax. Distribution for the amount is as follows:
Use Tax Monthly for 2021‐2022
Use Tax Annual Comparison For Years Ending 2020‐2022
June 2022 Year to Date Fund Collections Collections Animal Services Use $ - $ 762,750 Police Use $ - $ 4,000,000 General $ 177,334 $ 390,899 Street Sales $ 88,666 $ 195,448 Parks Sales $ 44,333 $ 97,724 Stormwater sales $ 44,333 $ 97,724 Police Sales $ 22,167 $ 48,862 Fire Sales $ 88,666 $ 195,488 $ 465,499 $ 5,788,855100,000 200,000 300,000 400,000 500,000 600,000 Jul Aug Sep Oct Nov Dec Jan Feb Mar Apr May Jun
2020 2021 2022 217,198 258,488 263,056 24,008 - - - - - -217,198 258,488 263,056 3 98,995 470,046 407,328 468,973 553,856 522,277 439,783---- 20,203 540,403 465,499100,000 200,000 300,000 400,000 500,000 600,000 Jul Aug Sep Oct Nov Dec Jan Feb Mar Apr May Jun
010 Animal 018 Police Other-Over Cap
TRANSIENT GUEST TAX
The City receives taxes from the gross daily rent due from or paid by transient guests of all hotels and motels, bed and breakfast inns and campgrounds. Each operator will, on or before the twentieth day of the month following the close of each month, make a return of taxes collected for transient occupancy.
Use of funds are used for Historic site maintenance and Tourism sales and services. The June collections are trending higher than collections for June in 2020 and 2021
Guest Tax By Month
Fiscal Years 2020, 2021 & YTD 2022
Guest
Receipts Fiscal Years
$0 $50,000 $100,000 $150,000 $200,000 $250,000
2019-2020 2020-2021 2021-2022 1,963,550 1,991,864 1,938,962 1,967,003 1,554,582 1,321,757 2,111,306 $0 $500,000 $1,000,000 $1,500,000 $2,000,000 $2,500,000 2016 2017 2018 2019 2020 2021 2022
Tax Annual
2016 ‐ YTD 2022
FUND BALANCE
The City’s policy for minimum fund balances are as follows:
o General Fund – 16% of annual operating revenues.
o Special Revenue Funds designated for capital purposes – 5% of annual operating revenues.
o Special Revenue Funds supporting personnel and ongoing operations – 16% of annual operating revenues.
The following page shows the fund balance calculation for June 30, 2022.
o The General Fund and Power and Light funds are below their targets.
o City Policy is that a plan needs to be developed to replenish the fund balances to target within five years.
Some funds show surplus over the target. These surpluses need to be balanced with capital spending plans showing the use of those surpluses. NOTE: Street Improvement unassigned fund balance is negative for June due to new purchase order for 4.89 million Overlay Project 112201 which increased current year expense. However, the Total Fund Balance is positive.
Power and Light, Water, and Water Pollution Control cash reserve have been updated and are based on the June 30,2021 audited financials.
Fund June 30 Balance Policy Basis of Calculation Actual % 5% Policy 16% Policy Over (Under) General 6,362,520 16% of operating expenditures 78,017,743 8% - 12,482,839 (6,120,319) $ Street Sales Tax (638,385) Between 5% and 16% of Revenues 9,035,391 -7% - 1,445,663 (2,084,048) Park Improvement 3,056,985 Between 5% and 16% of Revenues 5,037,657 61% - 806,025 2,250,960 Storm Water 9,583,166 Between 5% and 16% of Revenues 4,637,032 207% - 741,925 8,841,241 Police Public Safety Sales Tax 2,435,627 5% of Annual Revenues 2,459,201 99% 122,960 - 2,312,667 Fire Protection Sales Tax 1,855,097 Between 5% and 16% of Revenues 2,271,486 82% - 363,438 1,491,659 Animal Shelter Use Tax 207,703 Between 5% and 16% of Revenues 762,750 27% - 122,040 85,663 Police Use Tax 4,586,138 Between 5% and 16% of Revenues 3,039,000 151% - 486,240.00 4,099,898 Health Property Tax 164,159 Between 5% and 16% of Revenues 1,386,432 12% - 221,829.12 (57,670) Parks and Rec Property Tax 582,018 Between 5% and 16% of Revenues 2,146,831 27% - 343,493 238,525 Tourism 1,256,080 Between 5% and 16% of Revenues 1,683,926 75% - 269,428.16 986,652 Power and Light 40,226,055 Risk Based Calculation 52,500,000 - - - (12,273,945) Water 42,991,235 Risk Based Calculation 14,400,000 0% - - 28,591,235 Water Pollution Control 34,852,725 Risk Based Calculation 12,700,000 - - - 22,152,725
For the period ended June 30, 2022
CITY OF INDEPENDENCE, MISSOURI Reserve Balance per Policy
This is the adopted six-year CIP showing capital expenditures for each fund.
Capital Improvement Program 2022‐2027
Total 6‐year Fund 2022 2023 2024 2025 2026 2027 CIP General - - - - - -Street Sales 6,499,336 6,473,836 6,415,899 6,176,579 6,395,871 7,250,256 39,211,777 Park Improvement - - - - - -Storm Water 1,772,500 2,822,500 2,892,500 1,720,000 1,780,000 1,760,000 12,747,500 Police Public Safety Sales 2,573,508 1,834,663 1,898,917 550,000 - - 6,857,088 Fire Protection Sales Tax - - - - - -Animal Shelter Use - - - - - -Police Use Health Property Tax------Parks and Rec Property Tax - - - - - -Tourism 275,000 75,000 75,000 75,000 75,000 75,000 650,000 Power and Light 6,003,956 4,560,000 3,540,000 2,000,000 950,000 960,000 18,013,956 Water 6,420,000 7,200,000 3,025,000 9,600,000 9,325,000 1,275,000 36,845,000 Water Pollution Control 3,937,500 3,878,900 3,978,750 4,008,000 3,977,000 4,000,000 23,780,150 27,483,822 26,846,922 21,828,090 24,131,604 22,504,897 15,322,283 138,105,471
ITEMS OF NOTE for JUNE 2022
General Fund
The actual year-to-date General Fund revenues and other financing sources, through June 30th, compared to the amended budget are 106.91%, and actual expenditures and other financing uses are 100.08%. These percentages are in line with the cumulative total trend of 100% (June is month 12 and 12 divided by 12 = 100%). The attached summary reports reflect the June year-to-date actual revenues and expenditures compared to total budget.
There are a couple of revenue streams that are significantly below the 100%.
Cigarette Tax is at 84.41%.
Fines and Forfeitures are at 57.04%
Investment Income is at 83.32%.
The American Rescue Plan (ARP) funds of $3,122,000 have been transferred to the General Fund for loss of revenue. Without the ARP funds the revenues and other financing sources would be at 102.76%.
There are a couple of departments where expenditures above the 100%.
City Council is at 122.54% - this is due to an open encumbrance for the On-A-Roll Working Group.
Fire is at 106.77% - this is mainly due to over-time and minimum staffing expenditures.
UTILITY FUND NOTES Power and Light
The actual year-to-date Power and Light operating revenues, through June 30th, compared to the amended budget are 99.95%. Operating expenditures are 96.11%. This percentage is compared to the cumulative total trend of 100% (June is month 12 and 12 divided by 12 = 100%). Total Transfers are at 103.93% which includes Payments in Lieu of taxes for the month of June. The attached summary reports reflect the June 2022 year-todate actual revenues and expenditures compared to total budget.
Water
The actual year-to-date Water operating revenues, through June 30th, compared to the amended budget are 99.32%. Operating expenditures are 59.54%. This percentage is compared to the cumulative total trend of 100% (June is month 12 and 12 divided by 12 = 100%). Total Transfers are at 98.47% which includes Payments in Lieu of taxes for the month of June. The attached summary reports reflect the June 2022 year-todate actual revenues and expenditures compared to total budget.
Sanitary Sewer
The actual year-to-date Sanitary Sewer operating revenues, through June 30th, compared to the amended budget are 104.89%. Operating expenditures are 57.42%. This percentage is compared to the cumulative total trend of 100% (June is month 12 and 12 divided by 12 = 100%). Total Transfers are at 101.24% which includes Payments in Lieu of taxes for the month of April. The attached summary reports reflect the June 2022 year-todate actual revenues and expenditures compared to total budget.

PRELIMINARY Monthly Financial and Operating Report June 2022
PRELIMINARY Table of Contents General Fund 1 Sales Tax Funds Street Improvements Sales Tax Fund 2 Park Improvements Sales Tax Fund 3 Storm Water Sales Tax Fund 4 Police Public Safety Sales Tax Fund 5 Fire Protection Sales Tax Fund 6 Use Tax Funds Animal Shelter 7 Police 8 Property Tax Levy Funds Health Property Tax Levy 9 Parks and Recreation Property Tax Levy 10 Special Revenue Funds Tourism Fund 11 Independence Square Benefit District 12 Community Development Block Grant Fund 13 Rental Rehabilitation 14 License Surcharge 15 Grants 16 American Rescue Plan (ARP) 17 Enterprise Funds Power and Light 18 - 19 Water 20 - 21 Water Pollution Control 22 - 23 Events Center Debt Service 24 Internal Service Funds Central Garage 25 Staywell Health Care 26 Worker's Compensation 27 Risk Management 28 Enterprise Resource Planning 29 Debt Service Fund Debt Service - Neighborhood Improvement Districts 30 Capital Improvement Funds Street Improvements Capital Project Fund 31 Revolving Public Improvements Capital Project Fund 32 Building and Other Improvements Capital Project Fund 33 Storm Drainage Capital Project Fund 34 Park Improvements Capital Project Fund 35 Private Purpose Expendable Trust Fund - Vaile Mansion 36 Independence Events Center CID 37 Crackerneck Creek TDD 38 Tax Increment Financing Summary 39 Mid-Town Truman Rd TIF 40 Santa Fe TIF 41 Hartman Heritage TIF 42 Drumm Farm TIF 43 Eastland TIF 44 North Independence TIF 45 Mt Washington TIF 46 Crackerneck Creek TIF 47 Old Landfill TIF 48 Trinity TIF 49 HCA TIF 50 Cinema East TIF 51 23rd & Noland Project 1 TIF 52 23rd & Noland Project 2 TIF 53 23rd & Noland Project 3 TIF 54 23th & Noland Project 4 TIF 55 Independence Square TIF 56 I-70 & Little Blue Parkway Project 1 TIF 57 I-70 & Little Blue Parkway Project 3 TIF 58 Marketplace Project 1 TIF 59 Marketplace Project 2 TIF 60 TIF Application Fees 61 TIF Supplemental Appropriation Fund 62
CITY OF INDEPENDENCE, MISSOURI Budgetary Comparison Schedule General Fund
For the period ended June 30, 2022
Actual Variance Percent Percent Budgeted Amounts Amounts with Final Actual From Original Amended (Budget Basis) Budget 100.00% of Year Budget Revenues: Real Estate Tax $ 5,732,000 5,732,000 5,731,008 (992) 99.98% -0.02% Sales Tax 18,617,431 18,617,431 19,926,036 1,308,605 107.03% 7.03% Use Tax 448,000 277,000 395,847 118,847 142.91% 42.91% Cigarette Tax 420,000 420,000 354,525 (65,475) 84.41% -15.59% Franchise Tax 8,171,990 8,171,990 8,193,195 21,205 100.26% 0.26% Licenses and Permits 4,043,350 3,991,500 5,216,437 1,224,937 130.69% 30.69% Intergovernmental 5,330,000 5,330,000 5,874,305 544,305 110.21% 10.21% Charges for Current Services 1,915,000 1,908,000 2,558,066 650,066 134.07% 34.07% Interfund Charges for Support Services 5,035,500 5,035,500 5,035,500 100.00% 0.00% Fines and Forfeitures 3,710,000 3,710,000 2,116,279 (1,593,721) 57.04% -42.96% Investment Income (Loss) 194,000 194,000 161,642 (32,358) 83.32% -16.68% Other Revenue 541,894 677,963 1,016,454 338,491 149.93% 49.93% Total Revenues 54,159,165 54,065,384 56,579,294 2,513,910 104.65% 4.65% Other Financing Sources: Payments In Lieu of Taxes 20,696,578 20,696,578 20,254,010 (442,568) 97.86% -2.14% Transfers In 407,000 407,000 100.00% 0.00% Operating Transfers In - American Rescue Plan 3,122,000 3,122,000 0.00% -100.00% Total Other Financing Sources 20,696,578 21,103,578 23,783,010 2,679,432 112.70% 12.70% Total Revenues and Other Financing Sources 74,855,743 75,168,962 80,362,304 5,193,342 106.91% 6.91% Expenditures: City Council 711,350 711,350 871,679 (160,329) 122.54% 22.54% City Clerk 325,744 642,943 641,500 1,443 99.78% -0.22% City Manager 1,185,232 1,185,232 1,093,196 92,036 92.23% -7.77% Municipal Court 1,264,139 1,225,139 1,099,278 125,861 89.73% -10.27% Law 611,371 771,371 706,211 65,160 91.55% -8.45% Finance 6,264,935 6,303,935 6,227,434 76,501 98.79% -1.21% Community Development 4,576,184 4,777,484 3,872,273 905,211 81.05% -18.95% Police 33,155,226 33,685,579 33,136,053 549,526 98.37% -1.63% Fire 23,852,022 23,884,422 25,500,832 (1,616,410) 106.77% 6.77% Health 2,941 (2,941) 0.00% -100.00% Municipal Services (Public Works) 5,995,281 5,929,071 5,493,809 435,262 92.66% -7.34% Parks and Recreation 225,810 212,351 13,459 94.04% -5.96% Contingencies 17,028 17,028 17,028 0.00% -100.00% Debt service 59,231 0.00% -100.00% Total Expenditures 78,017,743 79,359,364 78,857,557 501,807 99.37% -0.63% Other Financing Uses: Transfers Out 10,000 317,257 883,286 (566,029) 278.41% 178.41% Total Expenditures and Other Financing Uses 78,027,743 79,676,621 79,740,843 (64,222) 100.08% 0.08% Excess of Revenue and Other Financing Sources Over (Under) Expenditures and Other Financing Uses, Budget Basis $ (3,172,000) (4,507,659) 621,461 5,129,120 Unassigned Fund Balance at Beginning of Year 5,708,549 Cancellation of prior year encumbrances 155,391 Change in other fund balance components during the year 39,291 Year-end investment market value adjustment (162,172) Ending Unassigned Fund Balance, 06/30/22 6,362,520 Restricted 93,848 Committed 17,144 Assigned 546,931 Total Fund Balance $ 7,020,443
PRELIMINARY
1
CITY OF INDEPENDENCE, MISSOURI Budgetary Comparison Schedule Street
For
Actual Variance Percent Percent Budgeted Amounts Amounts with Final Actual From Original Amended (Budget Basis) Budget 100.00% of Year Budget Revenues: Sales Taxes $ 8,770,391 8,770,391 9,358,341 587,950 106.70% 6.70% Use Tax 224,000 138,000 197,924 59,924 143.42% 43.42% Charges for Services 0.00% -100.00% Intergovernmental Revenue 135,456 135,456 0.00% -100.00% Investment Income (Loss) 41,000 77,000 88,675 11,675 115.16% 15.16% Other Revenue 868 868 0.00% -100.00% Total Revenues 9,035,391 8,985,391 9,781,264 795,873 108.86% 8.86% Other Financing Sources: Transfers in 429,210 429,210 0.00% -100.00% Total other financing sources 429,210 429,210 0.00% -100.00% Total revenues and other financing sources 9,035,391 8,985,391 10,210,474 1,225,083 113.63% 13.63% Expenditures: General Government 0.00% -100.00% Street Maintenance 1,166,177 1,166,177 943,279 222,898 80.89% -19.11% Capital Outlay 6,486,836 22,952,225 13,267,124 9,685,101 57.80% -42.20% Debt Service 474,576 474,576 691,649 (217,073) 145.74% 45.74% Total Expenditures 8,127,589 24,592,978 14,902,052 9,690,926 60.59% -39.41% Other Financing Uses: Transfers Out 400 (400) 0.00% -100.00% Total Other Financing Uses 400 (400) 0.00% -100.00% Total Expenditures and Other Financing Uses 8,127,589 24,592,978 14,902,452 9,690,526 60.60% -39.40% Excess of Revenues Over (Under) Expenditures and Other Financing Uses $ 907,802 (15,607,587) (4,691,978) 10,915,609 Unassigned Fund Balance at Beginning of Year 1,885,478 Cancellation of Prior Year Encumbrances 64,205 Change in Other Fund Balance Components During the Year 2,419,274 Year-end investment market value adjustment (315,364) Ending Unassigned Fund Balance, 06/30/22 (638,385) Fund Balance Components: Restricted - Current Year Encumbrances 9,402,195 Restricted - Prior Year Encumbrances 1,784,302 Restricted - Debt Reserve Project Accounts - Capital Projects 11,420,319 Total Fund Balance $ 21,968,431
PRELIMINARY
Improvements Sales Tax Fund
the period ended June 30, 2022 2
CITY OF INDEPENDENCE, MISSOURI Budgetary Comparison Schedule Park Improvements Sales Tax Fund For the period ended June 30, 2022
Actual Variance Percent Percent Budgeted Amounts Amounts with Final Actual From Original Amended (Budget Basis) Budget 100.00% of Year Budget Revenues: Sales Taxes $ 4,385,212 4,385,212 4,679,176 293,964 106.70% 6.70% Use Tax 112,000 69,000 98,939 29,939 143.39% 43.39% Charges for services 519,752 519,752 531,156 11,404 102.19% 2.19% Intergovernmental 0.00% -100.00% Investment Income (Loss) 18,180 40,000 35,779 (4,221) 89.45% -10.55% Other Revenue 2,513 2,513 27,606 25,093 1098.53% 998.53% Total Revenues 5,037,657 5,016,477 5,372,656 356,179 107.10% 7.10% Other Financing Sources: Transfers In 240,092 240,092 (240,092) 0.00% -100.00% Transfers In - American Rescue Plan 1,617,285 1,617,285 0.00% -100.00% Proceeds from Bond Issuance/Capital Lease 0.00% -100.00% Total Other Financing Sources 240,092 240,092 1,617,285 1,377,193 673.61% 573.61% Total Revenues and Other Financing Sources 5,277,749 5,256,569 6,989,941 1,733,372 132.98% 32.98% Expenditures: Culture and Recreation 4,373,935 4,373,936 3,865,761 508,175 88.38% -11.62% Capital Outlay 506,000 1,394,608 513,955 880,653 36.85% -63.15% Debt Service 207,215 221,374 67,299 154,075 30.40% -69.60% Total Expenditures 5,087,150 5,989,918 4,447,015 1,542,903 74.24% -25.76% Other Financing Uses: Transfers Out 50,900 (50,900) 0.00% -100.00% Total Other Financing Uses 50,900 (50,900) 0.00% -100.00% Total Expenditures and Other Financing Uses 5,087,150 5,989,918 4,497,915 1,492,003 75.09% -24.91% Excess of Revenues Over (Under) Expenditures and Other Financing Uses $ 190,599 (733,349) 2,492,026 3,225,375 Unassigned Fund Balance at Beginning of Year 599,247 Cancellation of Prior Year Encumbrances 50,521 Change in Other Fund Balance Components During the Year Year-end investment market value adjustment (84,809) Ending Unassigned Fund Balance, 06/30/22 3,056,985 Other Fund Balance Components: Restricted - Current Year Encumbrances 161,728 Restricted - Prior Year Encumbrances Total Fund Balance $ 3,218,713
PRELIMINARY
3
CITY OF INDEPENDENCE, MISSOURI Budgetary Comparison Schedule
Storm Water Sales Tax Fund For the period ended June 30, 2022
Actual Variance Percent Percent Budgeted Amounts Amounts with Final Actual From Original Amended (Budget Basis) Budget 100.00% of Year Budget Revenues: Sales Taxes $ 4,385,212 4,385,212 4,679,176 293,964 106.70% 6.70% Use Tax 112,000 69,000 98,939 29,939 143.39% 43.39% Intergovernmental 246,654 246,654 0.00% -100.00% Investment Income (loss) 132,000 164,000 141,696 (22,304) 86.40% -13.60% Other Revenue 7,820 7,820 159,083 151,263 2034.31% 1934.31% Total revenues 4,637,032 4,626,032 5,325,548 699,516 115.12% 15.12% Expenditures: Storm water Administration 272,856 272,856 202,057 70,799 74.05% -25.95% Maintenance 2,381,657 2,517,657 2,264,944 252,713 89.96% -10.04% Permit completion 318,000 318,000 300,100 17,900 94.37% -5.63% Capital outlay 1,760,000 5,260,306 2,213,619 3,046,687 42.08% -57.92% Total Expenditures 4,732,513 8,368,819 4,980,720 3,388,099 59.52% -40.48% Other financing uses: Transfers out 44,036 (44,036) 0.00% -100.00% Total other financing uses 44,036 (44,036) 0.00% -100.00% Total Ependitures and Other Financing Uses 4,732,513 8,368,819 5,024,756 3,344,063 60.04% -39.96% Excess of Revenues Over (Under) Expenditures and Other Financing Uses $ (95,481) (3,742,787) 300,792 4,043,579 Unassigned Fund Balance at Beginning of Year 9,476,507 Cancellation of Prior Year Encumbrances 259,163 Change in Other Fund Balance Components During the Year (120,609) Year-end investment market value adjustment (332,687) Ending Unassigned Fund Balance, 06/30/22 9,583,166 Other Fund Balance Components: Restricted - Current Year Encumbrances 845,153 Restricted - Prior Year Encumbrances 14,510 Restricted - Regional Detention Construction 120,524 Restricted - Regional Detention Maintenance 59,159 Restricted - Emergency Response Relief 500,000 Total Fund Balance $ 11,122,512
PRELIMINARY
4
Actual Variance Percent Percent Budgeted Amounts Amounts with Final Actual From Original Amended (Budget Basis) Budget 100.00% of Year Budget Revenues: Sales Taxes $ 2,358,694 2,358,694 2,513,756 155,062 106.57% 6.57% Use Tax 56,000 35,000 49,282 14,282 140.81% 40.81% Investment Income (Loss) 37,000 37,000 31,070 (5,930) 83.97% -16.03% Other Revenue 7,507 7,507 83,542 76,035 1112.85% 1012.85% Total Revenues 2,459,201 2,438,201 2,677,650 239,449 109.82% 9.82% Expenditures: Public Safety Communications 675,922 675,922 656,607 19,315 97.14% -2.86% Facilities 104,500 104,500 95,209 9,291 91.11% -8.89% Equipment 1,924,697 1,924,697 1,690,461 234,236 87.83% -12.17% Debt Service 981 (981) 0.00% -100.00% Total Expenditures 2,705,119 2,705,119 2,443,258 261,861 90.32% -9.68% Other Financing Uses: Transfers Out/Capital Outlay 3,440 (3,440) 0.00% -100.00% Total Other Financing Uses 3,440 (3,440) 0.00% -100.00% Total Expenditures and Other Financing Uses 2,705,119 2,705,119 2,446,698 258,421 90.45% -9.55% Excess of Revenues Over (Under) Expenditures and Other Financing Uses $ (245,918) (266,918) 230,952 497,870 Unassigned Fund Balance at Beginning of Year 2,277,473 Cancellation of Prior Year Encumbrances 3,989 Change in Other Fund Balance Components During the Year Year-end investment market value adjustment (76,787) Ending Unassigned Fund Balance, 06/30/22 2,435,627 Other Fund Balance Components: Restricted - Current Year Encumbrances 341,010 Restricted - Prior Year Encumbrances 16,787 Total Fund Balance $ 2,793,424
PRELIMINARY
Budgetary Comparison Schedule Police Public Safety Sales Tax Fund For the period ended June 30, 2022 5
CITY OF INDEPENDENCE, MISSOURI
CITY OF INDEPENDENCE, MISSOURI Budgetary Comparison Schedule Fire
Fund For
PRELIMINARY
Actual Variance Percent Percent Budgeted Amounts Amounts with Final Actual From Original Amended (Budget Basis) Budget 100.00% of Year Budget Revenues: Sales Taxes $ 2,192,486 2,192,486 3,459,833 1,267,347 157.80% 57.80% Use Tax 56,000 35,000 260,173 225,173 743.35% 643.35% Investment Income (Loss) 17,000 29,000 22,756 (6,244) 78.47% -21.53% Other Revenue 6,000 28,605 54,006 25,401 188.80% 88.80% Total Revenues 2,271,486 2,285,091 3,796,768 1,511,677 166.15% 66.15% Expenditures: Public Safety 2,763,693 2,786,298 2,720,858 65,440 97.65% -2.35% Debt Service 73,236 73,236 73,235 1 100.00% 0.00% Total Expenditures 2,836,929 2,859,534 2,794,093 65,441 97.71% -2.29% Other Financing Uses: Transfers Out/Capital Outlay 0.00% -100.00% Total Other Financing Uses 0.00% -100.00% Total Expenditures and Other Financing Uses 2,836,929 2,859,534 2,794,093 65,441 97.71% -2.29% Excess of Revenues Over (Under) Expenditures and Other Financing Uses $ (565,443) (574,443) 1,002,675 1,577,118 Unassigned Fund Balance at Beginning of Year 678,965 Cancellation of Prior Year Encumbrances 206,774 Change in Other Fund Balance Components During the Year Year-end investment market value adjustment (33,317) Ending Unassigned Fund Balance, 06/30/22 1,855,097 Other Fund Balance Components: Restricted - Current Year Encumbrances 268,520 Restricted - Prior Year Encumbrances 728 Total Fund Balance $ 2,124,345
Protection
Tax
the period ended June 30, 2022 6
Sales
Actual Variance Percent Percent Budgeted Amounts Amounts with Final Actual From Original Amended (Budget Basis) Budget 100.00% of Year Budget Revenues: Use Tax $ 762,750 762,750 762,750 100.00% 0.00% Intergovernmental Revenue 0.00% -100.00% Investment Income (Loss) 3,000 2,804 (196) 93.47% -6.53% Other Revenue 0.00% -100.00% Total Revenues 762,750 765,750 765,554 (196) 99.97% -0.03% Expenditures: General Government -100.00% Animal Services 728,545 728,545 704,377 24,168 96.68% -3.32% Capital Outlay 0.00% -100.00% Debt Service 0.00% -100.00% Total Expenditures 728,545 728,545 704,377 24,168 96.68% -3.32% Other Financing Uses: Transfers In 0.00% -100.00% Transfers Out 0.00% -100.00% Total Other Financing Uses 0.00% -100.00% Total Expenditures and Other Financing Uses 728,545 728,545 704,377 24,168 96.68% -3.32% Excess of Revenues Over (Under) Expenditures and Other Financing Uses $ 34,205 37,205 61,177 23,972 Unassigned Fund Balance at Beginning of Year 153,123 Cancellation of Prior Year Encumbrances 1,437 Change in Other Fund Balance Components During the Year (8,034) Ending Unassigned Fund Balance, 06/30/22 207,703 Fund Balance Components: Restricted - Current Year Encumbrances Restricted - Prior Year Encumbrances Total Fund Balance $ 207,703
OF INDEPENDENCE, MISSOURI Budgetary Comparison Schedule Animal Shelter Use Tax For the period ended June 30, 2022 7
PRELIMINARY
CITY
CITY OF INDEPENDENCE, MISSOURI Budgetary Comparison Schedule
PRELIMINARY
Actual Variance Percent Percent Budgeted Amounts Amounts with Final Actual From Original Amended (Budget Basis) Budget 100.00% of Year Budget Revenues: Use Tax $ 3,032,000 4,000,000 4,000,000 100.00% 0.00% Investment Income (Loss) 7,000 59,000 57,096 (1,904) 96.77% -3.23% Other Revenue 0.00% -100.00% Total Revenues 3,039,000 4,059,000 4,057,096 (1,904) 99.95% -0.05% Expenditures: Public Safety 2,258,155 2,819,155 2,433,014 386,141 86.30% -13.70% Debt Service 0.00% -100.00% Total Expenditures 2,258,155 2,819,155 2,433,014 386,141 86.30% -13.70% Other Financing Uses: Transfers Out/Capital Outlay 407,000 407,000 100.00% 0.00% Total Other Financing Uses 407,000 407,000 100.00% 0.00% Total Expenditures and Other Financing Uses 2,258,155 3,226,155 2,840,014 386,141 88.03% -11.97% Excess of Revenues Over (Under) Expenditures and Other Financing Uses $ 780,845 832,845 1,217,082 384,237 Unassigned Fund Balance at Beginning of Year 3,546,492 Cancellation of Prior Year Encumbrances Change in Other Fund Balance Components During the Year Year-end investment market value adjustment (177,436) Ending Unassigned Fund Balance, 06/30/22 4,586,138 Other Fund Balance Components: Restricted - Current Year Encumbrances 757,305 Restricted - Prior Year Encumbrances Total Fund Balance $ 5,343,443
Use Tax
the period ended June 30, 2022 8
Police
For
CITY OF INDEPENDENCE, MISSOURI
Budgetary Comparison Schedule Health Property Tax Levy For the period ended June 30, 2022 Actual Variance Percent Percent Budgeted Amounts Amounts with Final Actual From Original Amended (Budget Basis) Budget 100.00% of Year Budget Revenues: Taxes $ 870,000 870,000 851,582 (18,418) 97.88% -2.12% Charges for Services 150,000 165,835 138,115 (27,720) 83.28% -16.72% Licenses & Permits 366,432 418,282 379,707 (38,575) 90.78% -9.22% Investment Income (Loss) 5,705 5,705 0.00% -100.00% Other Revenue 21,587 21,587 0.00% -100.00% Total Revenues 1,386,432 1,454,117 1,396,696 (57,421) 96.05% -3.95% Other Financing Sources: Transfers In 25,000 25,000 100.00% 0.00% Transfers In - American Rescue Plan 300,000 300,000 0.00% -100.00% Total Other Financing Uses 25,000 325,000 300,000 1300.00% 1200.00% Total Revenues and Other Sources 1,386,432 1,479,117 1,721,696 242,579 116.40% 16.40% Expenditures: Animal Services 884,518 893,353 908,907 (15,554) 101.74% 1.74% Health Services 778,674 803,674 697,758 105,916 86.82% -13.18% Total Expenditures 1,663,192 1,697,027 1,606,665 90,362 94.68% -5.32% Other Financing Uses: Transfers Out 0.00% -100.00% Total Other Financing Uses 0.00% -100.00% Total Expenditures and Other Uses 1,663,192 1,697,027 1,606,665 90,362 94.68% -5.32% Excess of Revenues Over (Under) Expenditures and Other Financing Uses $ (276,760) (242,910) 115,031 357,941 Unassigned Fund Balance at Beginning of Year 52,841 Cancellation of Prior Year Encumbrances 841 Change in Other Fund Balance Components During the Year (4,554) Ending Unassigned Fund Balance, 06/30/22 164,159 Other Fund Balance Components: Restricted - Current Year Encumbrances 446 Restricted - Prior Year Encumbrances 79 Total Fund Balance $ 164,684
PRELIMINARY
9
CITY OF INDEPENDENCE, MISSOURI
PRELIMINARY
Budgetary Comparison Schedule Parks and Recreation Property Tax Levy For the period ended June 30, 2022 Actual Variance Percent Percent Budgeted Amounts Amounts with Final Actual From Original Amended (Budget Basis) Budget 100.00% of Year Budget Revenues: Taxes $ 1,850,000 1,850,000 1,809,613 (40,387) 97.82% -2.18% Intergovernmental 65,985 65,985 52,511 (13,474) 79.58% -20.42% Charges for Services 230,746 230,746 180,822 (49,924) 78.36% -21.64% Investment Income (Loss) 100 9,000 16,629 7,629 184.77% 84.77% Other Revenue 46,214 46,214 0.00% -100.00% Total Revenues 2,146,831 2,155,731 2,105,789 (49,942) 97.68% -2.32% Expenditures: Parks and Recreation 2,099,104 2,223,679 1,919,765 303,914 86.33% -13.67% Total Expenditures 2,099,104 2,223,679 1,919,765 303,914 86.33% -13.67% Other Financing Uses – Transfers Out 0.00% -100.00% Total Other Financing Uses 0.00% -100.00% Total Expenditures and Other Uses 2,099,104 2,223,679 1,919,765 303,914 86.33% -13.67% Excess of Revenues Over (Under) Expenditures and Other Financing Uses $ 47,727 (67,948) 186,024 253,972 Unassigned Fund Balance at Beginning of Year 410,588 Cancellation of Prior Year Encumbrances 6,156 Change in Other Fund Balance Components During the Year (20,750) Ending Unassigned Fund Balance, 06/30/22 582,018 Other Fund Balance Components: Restricted - Current Year Encumbrances 445 Restricted - Prior Year Encumbrances Total Fund Balance $ 582,463 10
CITY OF INDEPENDENCE, MISSOURI
Budgetary Comparison Schedule Tourism Fund For the period ended June 30, 2022 Actual Variance Percent Percent Budgeted Amounts Amounts with Final Actual From Original Amended (Budget Basis) Budget 100.00% of Year Budget Revenues: Transient Guest Taxes $ 1,652,283 1,652,283 2,116,326 464,043 128.08% 28.08% Charges for Services 30,000 17,797 (12,203) 59.32% -40.68% Investment Income (Loss) 26,593 26,593 19,707 (6,886) 74.11% -25.89% Other Revenue 5,050 5,050 8,102 3,052 160.44% 60.44% Total Revenues 1,683,926 1,713,926 2,161,932 448,006 126.14% 26.14% Other Financing Sources: Transfers In - American Resuce Plan 0.00% -100.00% Total Other Financing Uses 0.00% -100.00% Total Revenues and Other Sources 1,683,926 1,713,926 2,161,932 448,006 126.14% 26.14% Expenditures: Tourism 2,550,789 2,617,529 1,572,750 1,044,779 60.09% -39.91% Total Expenditures 2,550,789 2,617,529 1,572,750 1,044,779 60.09% -39.91% Other Financing Uses – Transfers Out 240,092 240,092 50,900 189,192 21.20% -78.80% Total Other Financing Uses 240,092 240,092 50,900 189,192 21.20% -78.80% Total Expenditures and Other Uses 2,790,881 2,857,621 1,623,650 1,233,971 56.82% -43.18% Excess of Revenues Over (Under) Expenditures and Other Financing Uses $ (1,106,955) (1,143,695) 538,282 1,681,977 Unassigned Fund Balance at Beginning of Year 752,469 Cancellation of Prior Year Encumbrances 19,820 Change in Other Fund Balance Components During the Year Year-end investment market value adjustment (54,491) Ending Unassigned Fund Balance, 06/30/22 1,256,080 Other Fund Balance Components: Restricted - Current Year Encumbrances 186,627 Restricted - Prior Year Encumbrances Restricted - Operating Reserve 376,368 Total Fund Balance $ 1,819,075
PRELIMINARY
11
CITY OF INDEPENDENCE, MISSOURI
PRELIMINARY
Budgetary Comparison Schedule Independence Square Benefit District For the period ended June 30, 2022 Actual Variance Percent Percent Budgeted Amounts Amounts with Final Actual From Original Amended (Budget Basis) Budget 100.00% of Year Budget Revenues: Taxes $ 26,375 26,375 0.00% -100.00% Investment Income (Loss) 1,099 1,099 0.00% -100.00% Other Revenue 0.00% -100.00% Total Revenues 27,474 27,474 0.00% -100.00% Expenditures: Capital Outlay 422 (422) 0.00% -100.00% Total Expenditures 422 (422) 0.00% -100.00% Other Financing Uses – Transfers Out 0.00% -100.00% Total Other Financing Uses 0.00% -100.00% Total Expenditures and Other Uses 422 (422) 0.00% -100.00% Excess of Revenues Over (Under) Expenditures and Other Financing Uses $ 27,052 27,052 Unassigned Fund Balance at Beginning of Year 7,663 Cancellation of Prior Year Encumbrances Change in Other Fund Balance Components During the Year Ending Unassigned Fund Balance, 06/30/22 34,715 Other Fund Balance Components: Restricted - Current Year Encumbrances Restricted - Prior Year Encumbrances Total Fund Balance $ 34,715 12
CITY OF INDEPENDENCE, MISSOURI Budgetary
Actual Variance Percent Percent Budgeted Amounts Amounts with Final Actual From Original Amended (Budget Basis) Budget 100.00% of Year Budget Revenues: Federal Grant - CDBG $ 1,605,692 1,603,827 1,756,166 152,339 109.50% 9.50% Other Revenue -100.00% Total Revenues 1,605,692 1,603,827 1,756,166 152,339 109.50% 9.50% Expenditures: CDBG Administration 166,173 164,308 169,287 (4,979) 103.03% 3.03% CDBG Expenditures 1,455,527 1,454,259 1,609,614 (155,355) 110.68% 10.68% Total Expenditures 1,621,700 1,618,567 1,778,901 (160,334) 109.91% 9.91% Other Financing Uses: Transfers Out 300,000 (300,000) 0.00% -100.00% Total Other Financing Uses 300,000 (300,000) 0.00% -100.00% Total Expenditures and Other Uses 1,621,700 1,618,567 2,078,901 (460,334) 128.44% 28.44% Excess of Revenues Over (Under) Expenditures and Other Financing Uses $ (16,008) (14,740) (322,735) (307,995) Unassigned Fund Balance at Beginning of Year (96,680) Cancellation of Prior Year Encumbrances 28,467 Change in Other Fund Balance Components During the Year Ending Unassigned Fund Balance, 06/30/22 (390,948) Other Fund Balance Components: Restricted - Current Year Encumbrances 366,503 Restricted - Prior Year Encumbrances 23,731 Total Fund Balance $ (714)
PRELIMINARY
Schedule Community Development Block Grant Fund For the period ended June 30, 2022 13
Comparison
CITY OF INDEPENDENCE, MISSOURI Budgetary Comparison Schedule Rental Rehabilitation For the period ended June 30, 2022
PRELIMINARY
Actual Variance Percent Percent Budgeted Amounts Amounts with Final Actual From Original Amended (Budget Basis) Budget 100.00% of Year Budget Revenues: HOME Program Grant $ 482,477 438,727 338,623 (100,104) 77.18% -22.82% Total Revenues 482,477 438,727 338,623 (100,104) 77.18% -22.82% Expenditures: HOME Administration 63,607 46,533 63,157 (16,624) 135.73% 35.73% Multi Family Housing 359,759 325,730 144,118 181,612 44.24% -55.76% Community Housing Development 102,788 93,067 93,067 0.00% -100.00% Total Expenditures 526,154 465,330 207,275 258,055 44.54% -55.46% Excess of Revenues Over (Under) Expenditures and Other Financing Uses $ (43,677) (26,603) 131,348 157,951 Unassigned Fund Balance at Beginning of Year (401,485) Cancellation of Prior Year Encumbrances Change in Other Fund Balance Components During the Year Ending Unassigned Fund Balance, 06/30/22 (270,137) Other Fund Balance Components: Restricted - Current Year Encumbrances 111,451 Restricted - Prior Year Encumbrances 158,691 Total Fund Balance $ 5
14
Actual Variance Percent Percent Budgeted Amounts Amounts with Final Actual From Original Amended (Budget Basis) Budget 100.00% of Year Budget Revenues: Licenses and Permits $ (12,324) (12,324) 0.00% -100.00% Investment Income (Loss) 17,000 21,000 17,231 (3,769) 82.05% -17.95% Other Revenue 0.00% -100.00% Total Revenues 17,000 21,000 4,907 (16,093) 23.37% -76.63% Expenditures: General Government 482 (482) 0.00% -100.00% Total expenditures 482 (482) 0.00% -100.00% Other Financing Uses: Transfers Out/Capital Outlay 48,047 (48,047) 0.00% -100.00% Total Other Financing Uses 48,047 (48,047) 0.00% -100.00% Total Expenditures and Other Financing Uses 48,529 (48,529) 0.00% -100.00% Excess of Revenues Over (Under) Expenditures and Other Financing Uses $ 17,000 21,000 (43,622) (64,622) Unassigned Fund Balance at Beginning of Year 1,251,500 Cancellation of Prior Year Encumbrances Change in Other Fund Balance Components During the Year Year-end investment market value adjustment (37,731) Ending Unassigned Fund Balance, 06/30/22 1,170,147 Other Fund Balance Components: Restricted - Current Year Encumbrances Restricted - Prior Year Encumbrances Total Fund Balance $ 1,170,147
PRELIMINARY
Schedule License Surcharge For the period ended June 30, 2022 15
CITY OF INDEPENDENCE, MISSOURI Budgetary Comparison
CITY OF INDEPENDENCE, MISSOURI Budgetary Comparison Schedule Grants
For the period ended June 30, 2022
PRELIMINARY Actual Variance Percent Percent Budgeted Amounts Amounts with Final Actual From Original Amended (Budget Basis) Budget 100.00% of Year Budget Revenues: Intergovernmental $ 1,343,409 7,551,955 3,310,547 (4,241,408) 43.84% -56.16% Charges for Services 105,103 214,126 222,761 8,635 104.03% 4.03% Other Revenue 130,711 653 (130,058) 0.50% -99.50% Total Revenues 1,448,512 7,896,792 3,533,961 (4,362,831) 44.75% -55.25% Other financing sources: Transfers In 0.00% -100.00% Total other financing sources 0.00% -100.00% Total revenues and other financing sources 1,448,512 7,896,792 3,533,961 (4,362,831) 44.75% -55.25% Expenditures: Public Safety 422,758 3,254,862 1,945,366 1,309,496 59.77% -40.23% General Government 138,063 247,282 28,398 218,884 11.48% -88.52% Culture and Recreation 227,569 84,435 143,134 37.10% -62.90% Community Development 500,000 2,491,187 982,925 1,508,262 39.46% -60.54% Animal Services 8,506 937 7,569 11.02% -88.98% Health Services 375,721 1,458,743 417,255 1,041,488 28.60% -71.40% Total Expenditures 1,436,542 7,688,149 3,459,316 4,228,833 45.00% -55.00% Other Financing Uses: Transfers Out/Capital Outlay 0.00% -100.00% Total Other Financing Uses 0.00% -100.00% Total Expenditures and Other Financing Uses 1,436,542 7,688,149 3,459,316 4,228,833 45.00% -55.00% Excess of Revenues Over (Under) Expenditures and Other Financing Uses $ 11,970 208,643 74,645 (133,998) Unassigned Fund Balance at Beginning of Year (338,049) Cancellation of Prior Year Encumbrances 41,157 Change in Other Fund Balance Components During the Year Ending Unassigned Fund Balance, 06/30/22 (222,247) Other Fund Balance Components: Restricted - Current Year Encumbrances 56,999 Restricted - Prior Year Encumbrances 164,986 Total Fund Balance $ (262)
16
CITY OF INDEPENDENCE, MISSOURI Budgetary Comparison Schedule American Rescue Plan (ARP) For the period ended June 30, 2022
PRELIMINARY
Actual Variance Percent Percent Budgeted Amounts Amounts with Final Actual From Original Amended (Budget Basis) Budget 100.00% of Year Budget Revenues: Intergovernmental $ 9,471,837 9,471,837 0.00% -100.00% Charges for Services 0.00% -100.00% Other Revenue 0.00% -100.00% Total Revenues 9,471,837 9,471,837 0.00% -100.00% Other financing sources: Transfers in 0.00% -100.00% Total other financing sources 0.00% -100.00% Total revenues and other financing sources 9,471,837 9,471,837 0.00% -100.00% Expenditures: Personnel Services 1,492,030 (1,492,030) 0.00% -100.00% Other Services 289,155 (289,155) 0.00% -100.00% Supplies 241,564 (241,564) 0.00% -100.00% Capital Outlay 287,816 (287,816) 0.00% -100.00% Total Expenditures 2,310,565 (2,310,565) 0.00% -100.00% Other Financing Uses: Transfers Out - American Rescue Plan 7,389,285 (7,389,285) 0.00% -100.00% Total Other Financing Uses 7,389,285 (7,389,285) 0.00% -100.00% Total Expenditures and Other Financing Uses 9,699,850 (9,699,850) 0.00% -100.00% Excess of Revenues Over (Under) Expenditures and Other Financing Uses $ (228,013) (228,013) Unassigned Fund Balance at Beginning of Year Cancellation of Prior Year Encumbrances Change in Other Fund Balance Components During the Year Ending Unassigned Fund Balance, 06/30/22 (228,013) Other Fund Balance Components: Restricted - Current Year Encumbrances 228,013 Restricted - Prior Year Encumbrances Total Fund Balance $
17
CITY OF INDEPENDENCE, MISSOURI Budgetary Comparison Schedule Power and Light For the period ended June 30, 2022
Actual Variance Percent Percent Budgeted Amounts Amounts with Amended Actual From Original Amended (Budget Basis) Budget 100.00% of Year Budget Operating Revenues: Charges for Services $ 130,609,070 130,609,070 129,800,157 (808,913) 99.38% -0.62% Penalties 1,106,786 1,106,786 1,141,182 34,396 103.11% 3.11% Connection Charges 280,151 280,151 28,800 (251,351) 10.28% -89.72% Miscellaneous 46,242 46,242 0.00% -100.00% Temporary Service 2,200 2,200 0.00% -100.00% Rental Income 340,239 340,239 363,887 23,648 106.95% 6.95% Transmission Wheeling 5,000,000 5,000,000 5,891,143 891,143 117.82% 17.82% Total Operating Revenues 137,336,246 137,336,246 137,273,611 (62,635) 99.95% -0.05% Operating Expenses: Personnel Services 29,687,152 29,669,152 29,561,206 107,946 99.64% -0.36% Other Services 27,329,604 27,741,815 27,079,379 662,436 97.61% -2.39% Supplies 60,402,130 60,406,531 62,928,653 (2,522,122) 104.18% 4.18% Capital Projects 6,003,956 11,609,690 6,862,733 4,746,957 59.11% -40.89% Capital Operating 1,617,600 1,622,199 1,096,031 526,168 67.56% -32.44% Debt Service 9,992,712 9,992,712 8,297,306 1,695,406 83.03% -16.97% Other Expenses 275,000 275,000 275,000 0.00% -100.00% Total Operating Expenses 135,308,154 141,317,099 135,825,308 5,491,791 96.11% -3.89% Nonoperating Revenues (Expenses): Investment Income 202,902 120,902 306,662 185,760 253.65% 153.65% Interfund Charges for Support Services 1,828,147 1,828,147 1,548,179 (279,968) 84.69% -15.31% Miscellaneous Revenue (Expense) 715,639 715,639 780,303 64,664 109.04% 9.04% Total Nonoperating Revenue (Expenses) 2,746,688 2,664,688 2,635,144 (29,544) 98.89% -1.11% 4,774,780 (1,316,165) 4,083,447 5,399,612 -310.25% -410.25% Capital Contributions 0.00% -100.00% Transfers Out – Utility Payments In Lieu of Taxes (13,000,000) (13,000,000) (13,510,714) 510,714 103.93% 3.93% Transfers In 0.00% -100.00% Transfers Out 0.00% -100.00% Total Transfers (13,000,000) (13,000,000) (13,510,714) 510,714 103.93% 3.93% Excess of Revenue and Other Financing Sources Over (Under) Expenditures and Other Financing Uses, Budget Basis $ (8,225,220) (14,316,165) (9,427,267) 4,888,898 Beginning Available Resources 49,849,263 Prior Period Adjustment 1,495,495 Year-End Investment Market Value Adjustment (1,691,436) Ending Available Resources 40,226,055 Revenue Risk 5,300,000 Capital Reserve 3,000,000 Expense Risk 18,700,000 Working Capital 25,500,000 Targeted Reserve Level 52,500,000 Total Non-Restricted Resources Available $ (12,273,945) Income (Loss) Before Transfers
PRELIMINARY
18
Power and Light - Open Capital Projects
As of June 30, 2022
PROJECT PROJECT TITLE ORIGINAL BUDGET NET BUDGET AMENDMENTS REVISED BUDGET ENCUMBRANCES ACTUALS AVAILABLE BUDGET 200815 T&D Sys IMPROVEMENTS $ 250,000.00 641,382.58 891,382.58 921.36 307,443.10 583,018.12 200824 Prod Plt MISC PROJECTS - 68,257.76 68,257.76 - - 68,257.76 200828 FIBER OPTIC PROGRAM 105,956.00 93,394.03 199,350.03 38,923.75 125,350.31 35,075.97 201106 69 KV SUBSTATION FACILITIES 300,000.00 48,222.55 348,222.55 82,857.16 27,144.05 238,221.34 201405 SUBSTATION SECURITY PROJECT - 259,644.39 259,644.39 30,534.00 24,494.75 204,615.64 201509 NEW BILLING Sys - 22,047.36 22,047.36 - - 22,047.36 201510 Sys OpS / DISPATCH - 44,634.77 44,634.77 35,030.50 - 9,604.27 201603 69 KV Trans LINE REBUIL 800,000.00 1,685,663.48 2,485,663.48 27,687.27 2,329,298.01 128,678.20 201604 Sys OpS / UPS UPGRAD - 45,493.59 45,493.59 - - 45,493.59 201605 Sys OpS WORK AREA - 619,842.18 619,842.18 - - 619,842.18 201606 NEW FINANCIAL MANAGEMENT SYS - 200,000.00 200,000.00 - - 200,000.00 201702 Prod FACILITIES IMPROVE - 586,830.00 586,830.00 171,647.00 111,353.00 303,830.00 201703 BV GROUND WATER - 445,491.07 445,491.07 82,063.96 75,842.09 287,585.02 201706 SUBSTATION K SWITCHGEAR & - 1,996,982.31 1,996,982.31 963,021.20 1,033,770.64 190.47 201707 MASTER PLAN-FUTURE GENERATIO - 32,500.00 32,500.00 - - 32,500.00 201710 Mo CITY DIVESTITURE - 530,640.70 530,640.70 450,680.76 79,959.44 0.50 201804 SUBSTATION E SWITCHGEAR REPLACEMENT 950,000.00 4,703,619.42 5,653,619.42 3,068,219.24 494,420.51 2,090,979.67 202004 Above Ground Fuel Storage Tanks - 41,800.00 41,800.00 - - 41,800.00 202101 Substation Fiber Optic Network 750,000.00 125,000.00 875,000.00 81,505.80 36,736.38 756,757.82 202102 Traffic Controller Upgrades 60,000.00 (4,000.00) 56,000.00 - - 56,000.00 202103 Traffic Camera System Upgrades 20,000.00 11,837.00 31,837.00 - - 31,837.00 202107 Motorola APX Radio Purchase Phase 2 70,000.00 1,706.82 71,706.82 - 3,989.93 67,716.89 202109 Substation Modeling 100,000.00 (100,000.00) - - -202110 20MVAR Capacitor Bank Sub A - 656,456.02 656,456.02 366,525.78 135,729.45 154,200.79 202111 Transmission Pole Replacement Prog 300,000.00 53,656.94 353,656.94 321,858.64 15,169.80 16,628.50 202201 Substation A Transformer T-9 Mtce 180,000.00 - 180,000.00 - - 180,000.00 202204 Relay Test Set 80,000.00 103.50 80,103.50 80,103.50 -202205 Desert Storm Switchgear Cabinets 250,000.00 - 250,000.00 - - 250,000.00 202208 Traffic Signal Detection Systems 50,000.00 - 50,000.00 - 48,765.00 1,235.00 202210 IPL Service Center PBX Upgrade to I 70,000.00 - 70,000.00 - - 70,000.00 202211 H-5 Hot Gas Path Inspection 1,518,000.00 - 1,518,000.00 1,244,478.91 347,365.09 (73,844.00) 9669 SERVICE CTR FACILITY IMPROVE. 150,000.00 220,084.17 370,084.17 7,174.50 - 362,909.67 $ 6,003,956.00 13,031,290.64 19,035,246.64 7,053,233.33 5,196,831.55 6,785,181.76 Current Year Prior Year Budget Budget (Enc Roll) Total Budget 11,609,689.70 $ 7,425,556.94 19,035,246.64 Less Expenditures 1,156,653.94 4,040,177.61 5,196,831.55 Less Encumbrances 5,706,078.76 1,347,154.57 7,053,233.33 Total Available 4,746,957.00 $ 2,038,224.76 6,785,181.76
PRELIMINARY
19
CITY OF INDEPENDENCE, MISSOURI Budgetary Comparison Schedule Water
For the period ended June 30, 2022
Actual Variance Percent Percent Budgeted Amounts Amounts with Amended Actual From Original Amended (Budget Basis) Budget 100.00% of Year Budget Operating Revenues: Charges for Services $ 32,720,000 32,720,000 32,326,560 (393,440) 98.80% -1.20% Penalties 120,000 120,000 235,768 115,768 196.47% 96.47% Connection/Disconnection Charges 12,000 12,000 17,966 5,966 149.72% 49.72% Miscellaneous 1,000 1,000 16,602 15,602 1660.20% 1560.20% Returned Check Charges 23,000 23,000 26,175 3,175 113.80% 13.80% Rental Income 85,000 85,000 79,285 (5,715) 93.28% -6.72% Meter Repairs 0.00% -100.00% Merchandising Jobbing 33,302 33,302 0.00% -100.00% Total Operating Revenues 32,961,000 32,961,000 32,735,658 (225,342) 99.32% -0.68% Operating expenses: Personnel Services 9,507,888 9,561,542 8,719,966 841,576 91.20% -8.80% Other Services 13,356,698 13,342,867 9,006,654 4,336,213 67.50% -32.50% Supplies 2,466,330 2,466,330 2,797,654 (331,324) 113.43% 13.43% Capital Projects 6,420,000 20,075,896 5,432,131 14,643,765 27.06% -72.94% Capital Operating 1,072,318 1,162,646 868,644 294,002 74.71% -25.29% Debt Service 2,523,363 2,523,363 2,503,237 20,126 99.20% -0.80% Other Expenses 125,000 125,000 999 124,001 0.80% -99.20% Total Operating Expenses 35,471,597 49,257,644 29,329,285 19,928,359 59.54% -40.46% Nonoperating Revenues (Expenses): Investment Income 539,138 553,138 636,418 83,280 115.06% 15.06% Interfund Charges for Support Services 1,392,092 1,392,092 1,392,092 100.00% 0.00% Miscellaneous Revenue (Expense) 1,000 1,000 58,864 57,864 5886.40% 5786.40% Total Nonoperating Revenue (Expenses) 1,932,230 1,946,230 2,087,374 141,144 107.25% 7.25% (578,367) (14,350,414) 5,493,747 19,844,161 -38.28% -138.28% Transfers Out – Utility Payments In Lieu of Taxes (3,200,000) (3,200,000) (3,151,180) (48,820) 98.47% -1.53% Transfers In 0.00% -100.00% Transfers Out 0.00% -100.00% Total Transfers (3,200,000) (3,200,000) (3,151,180) (48,820) 98.47% -1.53% Excess of Revenue and Other Financing Sources Over (Under) Expenditures and Other Financing Uses, Budget Basis $ (3,778,367) (17,550,414) 2,342,567 19,892,981 Beginning Available Resources 42,313,512 Year-End Investment Market Value Adjustment (1,664,844) Ending Available Resources 42,991,235 Revenue Risk 2,000,000 Capital Reserve 6,100,000 Expense Risk 700,000 Working Capital 5,600,000 Targeted Reserve Level 14,400,000 Total Non-Restricted Resources Available $ 28,591,235 Income (Loss) Before Transfers
PRELIMINARY
20
Water - Open Capital Projects
PROJECT PROJECT TITLE ORIGINAL BUDGET NET BUDGET AMENDMENTS REVISED BUDGET ENCUMBRANCES ACTUALS AVAILABLE BUDGET 400708 TREATMENT Plt DISCHARGE $ - 300,000.00 300,000.00 - - 300,000.00 400904 EAST INDEPENDENCE INDUST PARK - 674,000.00 674,000.00 - - 674,000.00 401003 FUTURE Prod WELLS - 965,326.00 965,326.00 270.00 2,730.00 962,326.00 401301 23RD ST MAIN REPLACEMENT 150,000.00 177,230.57 327,230.57 2,811.00 15,558.00 308,861.57 401402 LAGOON CLEANOUT - 302,560.00 302,560.00 49,059.00 278,001.00 (24,500.00) 401505 Dist Sys IMPROVE - 258,054.00 258,054.00 - 13,273.00 244,781.00 401506 TRUMAN ROAD BOOSTER STATION - 106,569.52 106,569.52 - - 106,569.52 401601 FILTER BACKWASH OUTFALL - 190,325.00 190,325.00 - - 190,325.00 401602 Plt DISCHARGE OUTFALL - 459,824.48 459,824.48 - - 459,824.48 401605 COURTNEY BEND BASIN CATWALK - 10,020.00 10,020.00 - - 10,020.00 401608 LIME SILO 1,300,000.00 291,070.12 1,591,070.12 122,333.84 341,813.88 1,126,922.40 401703 Maint BUILDING AT CBP - 200,000.00 200,000.00 - - 200,000.00 401704 VAN HORN RESERVOIR IMPROVE - 500,204.23 500,204.23 - 549,903.81 (49,699.58) 401802 6" Main Replacement James Downey Rd - 250,087.60 250,087.60 - - 250,087.60 401804 Filter Valve House Roof Improvement 75,000.00 22,292.00 97,292.00 - - 97,292.00 401808 VFD Drive Replacements HSP 2 & 4 - 227,728.00 227,728.00 - (3,239.00) 230,967.00 401818 30" Steel Transmission Main Assess - 156,300.00 156,300.00 - - 156,300.00 401821 Main Replacement-32nd/Hunter/Bird - 91,000.00 91,000.00 - - 91,000.00 401822 Main Replacement-24Hwy/Northern/RR - 240,166.00 240,166.00 - - 240,166.00 402002 39th Street Reservoir - 2,200,000.00 2,200,000.00 1,098,004.30 29,787.70 1,072,208.00 402004 Main Replace Walnut/Leslie/LeesSumm - 143,152.66 143,152.66 - 61,933.93 81,218.73 402007 Courtney Bend Emergency Generator 1,000,000.00 150,000.00 1,150,000.00 - - 1,150,000.00 402008 Wellfield Overhead Electrical Imp 800,000.00 200,000.00 1,000,000.00 - - 1,000,000.00 402009 Main Replace Sheley/Claremont/Norw - 191,032.00 191,032.00 - 2,242.00 188,790.00 402010 Main Replace Gudgell/Dodgion/KingsH - 1,282,050.00 1,282,050.00 583,185.77 584,879.23 113,985.00 402011 Main Replace Salisbury/Peck/Geospac - 1,095,830.00 1,095,830.00 1,050,000.00 1,000.00 44,830.00 402012 College Avenue Improvements - 250,000.00 250,000.00 - - 250,000.00 402101 Main Replacement Ralston 31st/29th - 350,000.00 350,000.00 13,261.50 6,961.50 329,777.00 402102 Main Replacement 3rd St & Jennings - 460,000.00 460,000.00 4,785.00 19,202.00 436,013.00 402103 Main Replacement Truman Road 50,000.00 490,502.00 540,502.00 498,340.00 - 42,162.00 402104 Lime Slaker No 5 - 350,000.00 350,000.00 - - 350,000.00 402105 Main Replacement Sheley - 100,000.00 100,000.00 9,335.50 1,435.00 89,229.50 402106 Main Replacement Sheley & Northern - 1,035,000.00 1,035,000.00 52,635.00 17,233.50 965,131.50 402107 Facility Improvements/Const/Maint - 250,000.00 250,000.00 99,995.00 - 150,005.00 402108 Basin Drive Improvements 250,000.00 250,000.00 500,000.00 - 159,477.00 340,523.00 402201 Roof Improvements 250,000.00 - 250,000.00 269,500.00 - (19,500.00) 402203 Lime Slaker No 1 350,000.00 - 350,000.00 - - 350,000.00 402207 CB Electrical Switchgear Improvemen 200,000.00 - 200,000.00 - - 200,000.00 9749 MAIN REPLACEMENT PROGRAM 1,745,000.00 249,977.19 1,994,977.19 402,248.40 83,725.02 1,509,003.77 9952 SECURITY UPGRADES 250,000.00 267,590.82 517,590.82 51,286.46 - 466,304.36 $ 6,420,000.00 14,737,892.19 21,157,892.19 4,307,050.77 2,165,917.57 14,684,923.85 Current Year Prior Year Budget Budget (Enc Roll) Total Budget 20,075,895.46 $ 1,081,996.73 21,157,892.19 Less Expenditures 1,302,804.53 863,113.04 2,165,917.57 Less Encumbrances 4,129,325.93 177,724.84 4,307,050.77 Total Available 14,643,765.00 $ 41,158.85 14,684,923.85
PRELIMINARY
of June 30, 2022 21
As
Actual Variance Percent Percent Budgeted Amounts Amounts with Amended Actual From Original Amended (Budget Basis) Budget 100.00% of Year Budget Operating revenues: Charges for Services $ 35,151,285 35,151,285 36,696,117 1,544,832 104.39% 4.39% Penalties 200,000 200,000 384,064 184,064 192.03% 92.03% Total operating revenues 35,351,285 35,351,285 37,080,181 1,728,896 104.89% 4.89% Operating expenses: Personnel Services 6,672,780 6,672,780 5,696,248 976,532 85.37% -14.63% Other Services 13,843,955 13,613,955 12,651,709 962,246 92.93% -7.07% Supplies 1,222,200 1,454,808 832,699 622,109 57.24% -42.76% Capital Projects 3,925,000 14,201,209 2,361,319 11,839,890 16.63% -83.37% Capital Operating 424,500 421,891 373,712 48,179 88.58% -11.42% Debt Service 6,288,332 6,288,332 2,575,211 3,713,121 40.95% -59.05% Other Expenses 0.00% -100.00% Total Operating Expenses 32,376,767 42,652,975 24,490,898 18,162,077 57.42% -42.58% Nonoperating Revenues (Expenses): Investment Income 104,000 250,000 315,325 65,325 126.13% 26.13% Miscellaneous Revenue (Expense) 7,820 7,820 390,657 382,837 4995.61% 4895.61% Total Nonoperating Revenue (Expenses) 111,820 257,820 705,982 448,162 273.83% 173.83% 3,086,338 (7,043,870) 13,295,265 20,339,135 -188.75% -288.75% Transfers Out – Utility Payments In Lieu of Taxes (3,596,612) (3,596,612) (3,592,116) (4,496) 99.87% -0.13% Transfers In 10,000 10,000 10,000 100.00% 0.00% Transfers Out (48,929) 48,929 0.00% -100.00% Total Transfers (3,586,612) (3,586,612) (3,631,045) 44,433 101.24% 1.24% Excess of Revenue and Other Financing Sources Over (Under) Expenditures and Other Financing Uses, Budget Basis $ (500,274) (10,630,482) 9,664,220 20,294,702 Beginning Available Resources 26,265,638 Year-End Investment Market Value Adjustment (1,077,133) Ending Available Resources 34,852,725 Revenue Risk 1,200,000 Capital Reserve 4,000,000 Expense Risk 700,000 Working Capital 6,800,000 Targeted Reserve Level 12,700,000 Total Non-Restricted Resources Available $ 22,152,725 Income (Loss) Before Transfers
PRELIMINARY
Sewer
the period ended
22
CITY OF INDEPENDENCE, MISSOURI Budgetary Comparison Schedule Sanitary
For
June 30, 2022
Sanitary Sewer - Open Capital Projects
As of June 30, 2022
PROJECT PROJECT TITLE ORIGINAL BUDGET NET BUDGET AMENDMENTS REVISED BUDGET ENCUMBRANCES ACTUALS AVAILABLE BUDGET 300801 NEIGHBORHOOD PROJECTS $ - 574,405.94 574,405.94 - 97,939.46 476,466.48 301201 BURR OAK EAST - 1,035,327.15 1,035,327.15 - - 1,035,327.15 301202 CRACKERNECK-VAN HOOK SEWER - 529,163.59 529,163.59 - - 529,163.59 301603 RCTP FACILITIES ROOF, CEILING - 170,925.00 170,925.00 - - 170,925.00 301701 SCADA UPGRADE - 238,301.15 238,301.15 60,549.33 98,558.07 79,193.75 301703 ARROWHEAD CENTER - 551,675.62 551,675.62 - 381,847.56 169,828.06 301705 16TH/SCOTT - 357,780.55 357,780.55 5,390.10 418.26 351,972.19 301706 TREATMENT FACILITY IMPROVEMENT - 593,007.00 593,007.00 61,753.20 223,467.16 307,786.64 301804 ROCK CREEK EFFLUENT STRUCTURE - 361,673.21 361,673.21 11,056.27 28,896.27 321,720.67 301806 Neighborhood Improvements 2018-19 - 513,781.95 513,781.95 - - 513,781.95 302001 Fairmount Highlands - 170,000.00 170,000.00 - - 170,000.00 302002 Arlington Improvements - 100,000.00 100,000.00 - - 100,000.00 302003 Bison Park - 424,907.85 424,907.85 69,420.22 317,828.01 37,659.62 302004 Neighborhood Projects 2019-20 - 580,000.00 580,000.00 - - 580,000.00 302005 Biosolids Handling - 2,919,676.59 2,919,676.59 1,562,857.78 522,142.78 834,676.03 302006 Raw Pumps & Screening - 900,000.00 900,000.00 314,466.00 - 585,534.00 302007 Electrical Substation Rehab - 158,690.00 158,690.00 - - 158,690.00 302008 RCTP Fence - 450,000.00 450,000.00 - 416,049.76 33,950.24 302009 Truman & Harris - 50,000.00 50,000.00 - - 50,000.00 302101 Sanitation Sewer Evaluation Survey - 199,303.60 199,303.60 21,301.63 92,320.77 85,681.20 302102 Raymond Harkless Mills San Imp - 200,000.00 200,000.00 - - 200,000.00 302103 Pump Station Imp & Maintenance 100,000.00 394,045.55 494,045.55 - 75,804.57 418,240.98 302104 Polymer System Relocation - 100,000.00 100,000.00 - - 100,000.00 302105 Piping Rehabilitation 200,000.00 200,000.00 400,000.00 14,332.50 14,066.31 371,601.19 302201 Upper Adair Interceptor 800,000.00 - 800,000.00 - - 800,000.00 302202 Crackerneck Creek Slope Rehab 1,100,000.00 - 1,100,000.00 77,328.75 22,723.10 999,948.15 302203 Sanitary Sewer Main Reloc from Stre 300,000.00 - 300,000.00 - - 300,000.00 302204 RCTP - Septic Pumper 300,000.00 - 300,000.00 - - 300,000.00 302205 Clarifier Rehabilitation 800,000.00 605,823.97 1,405,823.97 230,000.00 - 1,175,823.97 302206 Railing Safety RCPS & SCPS 325,000.00 - 325,000.00 - - 325,000.00 9757 TRENCHLESS TECHNOLOGY - 1,555,740.96 1,555,740.96 191,263.40 560,335.56 804,142.00 $ 3,925,000.00 13,934,229.68 17,859,229.68 2,619,719.18 2,852,397.64 12,387,112.86 Current Year Prior Year Budget Budget (Enc Roll) Total Budget 14,201,208.53 $ 3,658,021.15 17,859,229.68 Less Expenditures 1,419,878.21 1,432,519.43 2,852,397.64 Less Encumbrances 941,441.02 1,678,278.16 2,619,719.18 Total Available 11,839,889.30 $ 547,223.56 12,387,112.86
PRELIMINARY
23
CITY OF INDEPENDENCE, MISSOURI Budgetary Comparison Schedule Events Center Debt Service
For the period ended June 30, 2022
PRELIMINARY Actual Variance Percent Percent Budgeted Amounts Amounts with Amended Actual From Original Amended (Budget Basis) Budget 100.00% of Year Budget Operating revenues: Charges for Services $ 0.00% -100.00% Miscellaneous 0.00% -100.00% Total operating revenues 0.00% -100.00% Operating Expenses: Personnel Services 0.00% -100.00% Other Services 1,000 1,000 59,413 (58,413) 5941.30% 5841.30% Supplies 0.00% -100.00% Capital Outlay 3,120,150 4,525,245 4,181,496 343,749 92.40% -7.60% Debt Service 5,292,906 5,292,906 5,791,459 (498,553) 109.42% 9.42% Other Expenses 0.00% -100.00% Total Operating Expenses 8,414,056 9,819,151 10,032,368 (213,217) 102.17% 2.17% Nonoperating Revenues (Expenses): Investment Income 71,000 71,000 7,266 (63,734) 10.23% -89.77% Miscellaneous Revenue (Expense) 267 267 0.00% -100.00% Sales Tax 5,173,844 5,173,844 5,265,160 91,316 101.76% 1.76% Total Nonoperating Revenue (Expenses) 5,244,844 5,244,844 5,272,693 27,849 100.53% 0.53% (3,169,212) (4,574,307) (4,759,675) (185,368) 104.05% 4.05% Transfers Out – Utility Payments In Lieu of Taxes 0.00% -100.00% Transfers In 75,000 75,000 2,036,029 (1,961,029) 2714.71% 2614.71% Transfers Out 0.00% -100.00% Total Transfers 75,000 75,000 2,036,029 (1,961,029) 2714.71% 2614.71% Excess of Revenue and Other Financing Sources Over (Under) Expenditures and Other Financing Uses, Budget Basis $ (3,094,212) (4,499,307) (2,723,646) 1,775,661 Beginning Available Resources (1,116,862) Less Prior Year Expenses (24,607) Year-End Investment Market Value Adjustment (39,083) Ending Available Resources $ (3,904,198) Income (Loss) Before Transfers
24
CITY OF INDEPENDENCE, MISSOURI
Actual Variance Percent Percent Budgeted Amounts Amounts with Amended Actual From Original Amended (Budget Basis) Budget 100.00% of Year Budget Operating revenues: Charges for Services $ 2,206,668 2,435,868 2,629,874 194,006 107.96% 7.96% Miscellaneous 8,513 8,513 0.00% -100.00% Total Operating Revenues 2,206,668 2,435,868 2,638,387 202,519 108.31% 8.31% Operating Expenses: Personnel Services 852,345 852,345 737,434 114,911 86.52% -13.48% Other Services 538,628 771,928 939,544 (167,616) 121.71% 21.71% Supplies 787,055 787,055 1,047,365 (260,310) 133.07% 33.07% Capital Outlay 39,000 40,000 39,119 881 97.80% -2.20% Other Expenses 0.00% -100.00% Total Operating Expenses 2,217,028 2,451,328 2,763,462 (312,134) 112.73% 12.73% Nonoperating Revenues (Expenses): Investment Income 8,000 8,000 5,416 (2,584) 67.70% -32.30% Miscellaneous Revenue (Expense) 5,100 10,360 5,260 203.14% 103.14% Total Nonoperating Revenue (Expenses) 8,000 13,100 15,776 2,676 120.43% 20.43% (2,360) (2,360) (109,299) (106,939) 4631.31% 4531.31% Transfers Out – Utility Payments In Lieu of Taxes 0.00% -100.00% Transfers In 0.00% -100.00% Transfers Out 0.00% -100.00% Total Transfers 0.00% -100.00% Change In Net Position (Budget Basis) $ (2,360) (2,360) (109,299) (106,939) Unassigned Fund Balance at Beginning of Year (1,334,153) Cancellation of Prior Year Encumbrances 102,101 Change in Other Fund Balance Components During the Year (68,071) GAAP Components - OPEB and LAGERS 1,755,311 Year-end investment market value adjustment (10,688) Ending Unassigned Fund Balance Non-GAAP Basis, 06/30/22 335,201 Other Net Position Components: Assigned - Current Year Encumbrances 40,235 Assigned - Prior Year Encumbrances Total Fund Balance $ 375,436 Income (Loss) Before Transfers
PRELIMINARY
Budgetary Comparison Schedule Central Garage For the period ended June 30, 2022 25
CITY OF INDEPENDENCE, MISSOURI
Budgetary Comparison Schedule
Staywell Health Care
For the period ended June 30, 2022
Actual Variance Percent Percent Budgeted Amounts Amounts with Amended Actual From Original Amended (Budget Basis) Budget 100.00% of Year Budget Operating revenues: Charges for Services $ 15,500,000 15,500,000 21,353,377 5,853,377 137.76% 37.76% Miscellaneous 0.00% -100.00% Total Operating Revenues 15,500,000 15,500,000 21,353,377 5,853,377 137.76% 37.76% Operating Expenses: Personnel Services 187,200 187,200 389,540 (202,340) 208.09% 108.09% Other Services 19,166,120 19,166,120 23,985,122 (4,819,002) 125.14% 25.14% Supplies 0.00% -100.00% Capital Outlay 0.00% -100.00% Other Expenses 0.00% -100.00% Total Operating Expenses 19,353,320 19,353,320 24,374,662 (5,021,342) 125.95% 25.95% Nonoperating Revenues (Expenses): Investment Income 4,000 4,000 9,129 5,129 228.23% 128.23% Miscellaneous Revenue (Expense) 1,320,392 1,320,392 0.00% -100.00% Total Nonoperating Revenue (Expenses) 4,000 4,000 1,329,521 1,325,521 33238.03% 33138.03% (3,849,320) (3,849,320) (1,691,764) 2,157,556 43.95% -56.05% Transfers In - American Rescue Plan 2,350,000 (2,350,000) 0.00% -100.00% Transfers Out 0.00% -100.00% Total Transfers 2,350,000 (2,350,000) 0.00% -100.00% Change In Net Position (Budget Basis) $ (3,849,320) (3,849,320) 658,236 4,507,556 Unassigned Fund Balance at Beginning of Year 289,505 Cancellation of Prior Year Encumbrances Change in Other Fund Balance Components During the Year 181,470 Ending Unassigned Fund Balance Non-GAAP Basis, 06/30/22 1,129,211 Other Net Position Components: Assigned - Current Year Encumbrances Assigned - Prior Year Encumbrances Total Fund Balance $ 1,129,211 Income (Loss) Before Transfers
PRELIMINARY
26
CITY OF INDEPENDENCE, MISSOURI Budgetary
Actual Variance Percent Percent Budgeted Amounts Amounts with Amended Actual From Original Amended (Budget Basis) Budget 100.00% of Year Budget Operating revenues: Charges for Services $ 4,625,000 4,625,000 4,625,000 100.00% 0.00% Miscellaneous 129,049 129,049 0.00% -100.00% Total Operating Revenues 4,625,000 4,625,000 4,754,049 129,049 102.79% 2.79% Operating Expenses: Personnel Services 13,778 13,778 12,840 938 93.19% -6.81% Other Services 4,599,000 4,599,000 4,358,998 240,002 94.78% -5.22% Supplies 3,000 3,000 3,000 0.00% -100.00% Capital Outlay 2,000 2,000 2,000 0.00% -100.00% Other Expenses 0.00% -100.00% Total Operating Expenses 4,617,778 4,617,778 4,371,838 245,940 94.67% -5.33% Nonoperating Revenues (Expenses): Investment Income 6,000 8,784 2,784 146.40% 46.40% Miscellaneous Revenue (Expense) 26,639 26,639 0.00% -100.00% Total Nonoperating Revenue (Expenses) 6,000 35,423 29,423 590.38% 490.38% 7,222 13,222 417,634 404,412 3158.63% 3058.63% Transfers In 0.00% -100.00% Transfers Out 0.00% -100.00% Total Transfers 0.00% -100.00% Change In Net Position (Budget Basis) $ 7,222 13,222 417,634 404,412 Unassigned Fund Balance at Beginning of Year (8,356,420) Cancellation of Prior Year Encumbrances 10,675 Change in Other Fund Balance Components During the Year 707,980 Year-end investment market value adjustment (36,925) Ending Unassigned Fund Balance Non-GAAP Basis, 06/30/22 (7,257,056) Other Net Position Components: Restricted - Work Comp Escrow Assigned - Current Year Encumbrances 12,500 Assigned - Prior Year Encumbrances Total Fund Balance $ (7,244,556) Income (Loss) Before Transfers
PRELIMINARY
Workers' Compensation For the period ended June 30, 2022 27
Comparison Schedule
CITY OF INDEPENDENCE, MISSOURI
Budgetary Comparison Schedule
Risk Management
For the period ended June 30, 2022
Actual Variance Percent Percent Budgeted Amounts Amounts with Amended Actual From Original Amended (Budget Basis) Budget 100.00% of Year Budget Operating revenues: Charges for Services $ 2,995,000 2,995,000 2,975,100 (19,900) 99.34% -0.66% Miscellaneous 0.00% -100.00% Total Operating Revenues 2,995,000 2,995,000 2,975,100 (19,900) 99.34% -0.66% Operating Expenses: Personnel Services 13,778 13,778 12,840 938 93.19% -6.81% Other Services 2,977,000 2,977,000 2,367,932 609,068 79.54% -20.46% Supplies 3,000 3,000 3,000 0.00% -100.00% Capital Outlay 0.00% -100.00% Other Expenses 0.00% -100.00% Total Operating Expenses 2,993,778 2,993,778 2,380,772 613,006 79.52% -20.48% Nonoperating Revenues (Expenses): Investment Income 23,000 21,027 (1,973) 91.42% -8.58% Miscellaneous Revenue (Expense) 5 5 0.00% -100.00% Total Nonoperating Revenue (Expenses) 23,000 21,032 (1,968) 91.44% -8.56% 1,222 24,222 615,360 591,138 2540.50% 2440.50% Transfers Out – Utility Payments In Lieu of Taxes 0.00% -100.00% Transfers In 0.00% -100.00% Transfers Out 0.00% -100.00% Total Transfers 0.00% -100.00% Change In Net Position (Budget Basis) $ 1,222 24,222 615,360 591,138 Unassigned Fund Balance at Beginning of Year 1,345,764 Cancellation of Prior Year Encumbrances 7,382 Change in Other Fund Balance Components During the Year Year-end investment market value adjustment (62,815) Ending Unassigned Fund Balance Non-GAAP Basis, 06/30/22 1,905,691 Other Net Position Components: Assigned - Current Year Encumbrances Assigned - Prior Year Encumbrances Total Fund Balance $ 1,905,691 Income (Loss) Before Transfers
PRELIMINARY
28
CITY
INDEPENDENCE, MISSOURI
Actual Variance Percent Percent Budgeted Amounts Amounts with Amended Actual From Original Amended (Budget Basis) Budget 100.00% of Year Budget Operating revenues: Charges for Services $ 2,200,000 2,200,000 2,200,000 100.00% 0.00% Miscellaneous 0.00% -100.00% Total Operating Revenues 2,200,000 2,200,000 2,200,000 100.00% 0.00% Operating Expenses: Personnel Services 655,218 655,218 598,845 56,373 91.40% -8.60% Other Services 1,147,200 1,147,200 723,355 423,845 63.05% -36.95% Supplies 0.00% -100.00% Capital Outlay 50,000 50,000 5,946 44,054 11.89% -88.11% Other Expenses 0.00% -100.00% Total Operating Expenses 1,852,418 1,852,418 1,328,146 524,272 71.70% -28.30% Nonoperating Revenues (Expenses): Investment Income 0.00% -100.00% Miscellaneous Revenue (Expense) 0.00% -100.00% Total Nonoperating Revenue (Expenses) 0.00% -100.00% 347,582 347,582 871,854 524,272 250.83% 150.83% Transfers Out – Utility Payments In Lieu of Taxes 0.00% -100.00% Transfers In – CARES Act 0.00% -100.00% Transfers Out 0.00% -100.00% Total Transfers 0.00% -100.00% Change In Net Position (Budget Basis) $ 347,582 347,582 871,854 524,272 Unassigned Fund Balance at Beginning of Year 1,350,925 Cancellation of Prior Year Encumbrances 101,405 Change in Other Fund Balance Components During the Year GAAP Components - OPEB and LAGERS (45,193) Ending Unassigned Fund Balance Non-GAAP Basis, 06/30/22 2,278,991 Other Net Position Components: Assigned - Current Year Encumbrances 17,651 Assigned - Prior Year Encumbrances Total Fund Balance $ 2,296,642 Income (Loss) Before Transfers
PRELIMINARY
29
OF
Budgetary Comparison Schedule Enterprise Resource Planning For the period ended June 30, 2022
Actual Variance Percent Percent Budgeted Amounts Amounts with Final Actual From Original Amended (Budget Basis) Budget 100.00% of Year Budget Revenues: Charges for Services $ 9,289 9,289 6,193 (3,096) 66.67% -33.33% Investment Income (Loss) 200 200 336 136 168.00% 68.00% Other Revenue 0.00% -100.00% Total Revenues 9,489 9,489 6,529 (2,960) 68.81% -31.19% Expenditures: General Government 66 (66) 0.00% -100.00% Debt Service 9,586 9,586 8,878 708 92.61% -7.39% Total Expenditures 9,586 9,586 8,944 642 93.30% -6.70% Other Financing Uses: Transfers Out/Capital Outlay 0.00% -100.00% Total Other Financing Uses 0.00% -100.00% Total expenditures and other financing uses 9,586 9,586 8,944 642 93.30% -6.70% Excess of Revenues Over (Under) Expenditures and Other Financing Uses, Budget Basis $ (97) (97) (2,415) (2,318) Unassigned Fund Balance at Beginning of Year 106,985 Cancellation of Prior Year Encumbrances Change in Other Fund Balance Components During the Year Year-End Investment Market Value Adjustment (335) Ending Unassigned Fund Balance, 06/30/22 104,235 Other Fund Balance Components: Restricted - Current Year Encumbrances Restricted - Prior Year Encumbrances Total Fund Balance $ 104,235
PRELIMINARY
Comparison Schedule Debt Service - Neighborhood Improvement Districts For the period ended June 30, 2022 30
CITY OF INDEPENDENCE, MISSOURI Budgetary
PRELIMINARY Actual Variance Percent Percent Budgeted Amounts Amounts with Final Actual From Original Amended (Budget Basis) Budget 100.00% of Year Budget Revenues: Charges for Services $ 10,498 10,498 0.00% -100.00% Investment Income 2,000 2,000 724 (1,276) 36.20% -63.80% Intergovernmental 0.00% -100.00% Other Revenue 0.00% -100.00% Total Revenues 2,000 2,000 11,222 9,222 561.10% 461.10% Other Financing Sources: Transfers In 65,771 150,248 84,477 228.44% 128.44% Total Other Financing Sources 65,771 150,248 84,477 228.44% 128.44% Total Revenues and Other Financing Sources 2,000 67,771 161,470 93,699 238.26% 138.26% Expenditures: Public Works 32 (32) 0.00% -100.00% Culture and Recreation 0.00% -100.00% Capital Outlay 220,797 (24,514) 245,311 -11.10% -111.10% Total Expenditures 220,797 (24,482) 245,279 -11.09% -111.09% Other Financing Uses: Transfers Out/Capital Outlay 84,818 (84,818) 0.00% -100.00% Total Other Financing Uses 84,818 (84,818) 0.00% -100.00% Total Expenditures and Other Financing Uses 220,797 60,336 160,461 27.33% -72.67% Excess of Revenues Over (Under) Expenditures and Other Financing Uses, Budget Basis $ 2,000 (153,026) 101,134 254,160 Unassigned Fund Balance at Beginning of Year (137,026) Cancellation of Prior Year Encumbrances 9,123 Change to Prior Year Expenditure 9,510 Year-End Investment Market Value Adjustment (2,538) Ending Unassigned Fund Balance, 06/30/22 (19,797) Other Fund Balance Components: Committed - Current Year Encumbrances Committed - Prior Year Encumbrances 97,116 Total Fund Balance $ 77,319 Budgetary Comparison Schedule CITY OF INDEPENDENCE, MISSOURI Street Improvements Capital Project Fund For the period ended June 30, 2022 31
CITY OF INDEPENDENCE, MISSOURI Budgetary Comparison Schedule Revolving Public Improvements Capital Project Fund For the period ended June 30, 2022
PRELIMINARY
Actual Variance Percent Percent Budgeted Amounts Amounts with Final Actual From Original Amended (Budget Basis) Budget 100.00% of Year Budget Revenues: Charges for Services $ 0.00% -100.00% Investment Income (Loss) 305 305 0.00% -100.00% Other Revenue 0.00% -100.00% Total Revenues 305 305 0.00% -100.00% Expenditures: Public Works 9 (9) 0.00% -100.00% Culture and Recreation 0.00% -100.00% Capital Outlay 0.00% -100.00% Total Expenditures 9 (9) 0.00% -100.00% Other Financing Uses: Transfers Out/Capital Outlay 0.00% -100.00% Total Other Financing Uses 0.00% -100.00% Total Expenditures and Other Financing Uses 9 (9) 0.00% -100.00% Excess of Revenues Over (Under) Expenditures and Other Financing Uses, Budget Basis $ 296 296 Unassigned Fund Balance at Beginning of Year 21,613 Cancellation of Prior Year Encumbrances Change in Other Fund Balance Components During the Year Year-End Investment Market Value Adjustment (696) Ending Unassigned Fund Balance, 06/30/22 21,213 Other Fund Balance Components: Committed - Current Year Encumbrances Committed - Prior Year Encumbrances Total Fund Balance $ 21,213
32
Actual Variance Percent Percent Budgeted Amounts Amounts with Final Actual From Original Amended (Budget Basis) Budget 100.00% of Year Budget Revenues: Charges for Services $ 0.00% -100.00% Intergovernmental 9,512 9,512 0.00% -100.00% Investment Income 5,000 3,634 (1,366) 72.68% -27.32% Other Revenue 100,800 100,800 100,800 100.00% 0.00% Total revenues 100,800 105,800 113,946 8,146 107.70% 7.70% Other Financing Sources: Transfers In 307,257 944,692 637,435 307.46% 207.46% Total Other Financing Sources 307,257 944,692 637,435 307.46% 207.46% Total Revenues and Other Financing Sources 100,800 413,057 1,058,638 645,581 256.29% 156.29% Expenditures: Public Works 129 (129) 0.00% -100.00% Culture and Recreation 0.00% -100.00% Capital Outlay 506,900 783,998 467,835 316,163 59.67% -40.33% Total Expenditures 506,900 783,998 467,964 316,034 59.69% -40.31% Other Financing Uses: Transfers Out/Capital Outlay 44,393 (44,393) 0.00% -100.00% Total Other Financing Uses 44,393 (44,393) 0.00% -100.00% Total expenditures and other financing uses 506,900 783,998 512,357 271,641 65.35% -34.65% Excess of Revenues Over (Under) Expenditures and Other Financing Uses, Budget Basis $ (406,100) (370,941) 546,281 917,222 Unassigned Fund Balance at Beginning of Year (701,084) Cancellation of Prior Year Encumbrances Change in Other Fund Balance Components During the Year Year-End Investment Market Value Adjustment (10,083) Ending Unassigned Fund Balance, 06/30/22 (164,886) Other Fund Balance Components: Committed - Current Year Encumbrances 149,642 Committed - Prior Year Encumbrances 12,000 Total Fund Balance $ (3,244)
Budgetary Comparison Schedule Buildings and Other Improvements Capital Project Fund For the period ended June 30, 2022 33
PRELIMINARY
CITY OF INDEPENDENCE, MISSOURI
Actual Variance Percent Percent Budgeted Amounts Amounts with Final Actual From Original Amended (Budget Basis) Budget 100.00% of Year Budget Revenues: Charges for Services $ 0.00% -100.00% Investment Income 0.00% -100.00% Other Revenue 0.00% -100.00% Total revenues 0.00% -100.00% Expenditures: Public Works 0.00% -100.00% Culture and Recreation 0.00% -100.00% Capital Outlay 0.00% -100.00% Total Expenditures 0.00% -100.00% Other Financing Uses: Transfers Out/Capital Outlay 0.00% -100.00% Total Other Financing Uses 0.00% -100.00% Total expenditures and other financing uses 0.00% -100.00% Excess of Revenues Over (Under) Expenditures and Other Financing Uses, Budget Basis $ Unassigned Fund Balance at Beginning of Year (16,155) Cancellation of Prior Year Encumbrances Change in Other Fund Balance Components During the Year Ending Unassigned Fund Balance, 06/30/22 (16,155) Fund Balance Components: Committed - Current Year Encumbrances Committed - Prior Year Encumbrances Total Fund Balance $ (16,155) CITY OF INDEPENDENCE, MISSOURI Budgetary Comparison Schedule Storm Drainage Capital Project Fund For the period ended June 30, 2022 34
PRELIMINARY
CITY OF INDEPENDENCE, MISSOURI Budgetary Comparison Schedule Park Improvements Capital Project Fund For the period ended June 30, 2022
PRELIMINARY
Actual Variance Percent Percent Budgeted Amounts Amounts with Final Actual From Original Amended (Budget Basis) Budget 100.00% of Year Budget Revenues: Charges for Services $ 0.00% -100.00% Investment Income (Loss) 456 456 0.00% -100.00% Other Revenue 0.00% -100.00% Total revenues 456 456 0.00% -100.00% Expenditures: Public Works 0.00% -100.00% Culture and Recreation 13 (13) 0.00% -100.00% Capital Outlay 0.00% -100.00% Total Expenditures 13 (13) 0.00% -100.00% Other Financing Uses: Transfers Out/Capital Outlay 0.00% -100.00% Total Other Financing Uses 0.00% -100.00% Total expenditures and other financing uses 13 (13) 0.00% -100.00% Excess of Revenues Over (Under) Expenditures and Other Financing Uses, Budget Basis $ 443 443 Unassigned Fund Balance at Beginning of Year 31,479 Cancellation of Prior Year Encumbrances Change in Other Fund Balance Components During the Year Year-End Investment Market Value Adjustment (1,041) Ending Unassigned Fund Balance, 06/30/22 30,881 Fund Balance Components: Committed - Current Year Encumbrances Committed - Prior Year Encumbrances Total Fund Balance $ 30,881
35
Actual Variance Percent Percent Budgeted Amounts Amounts with Final Actual From Original Amended (Budget Basis) Budget 100.00% of Year Budget Revenues: Charges for Services $ 10,500 10,500 (10,500) 0.00% -100.00% Investment Income 59 59 0.00% -100.00% Other Revenue 3,750 3,750 0.00% -100.00% Total Revenues 10,500 10,500 3,809 (6,691) 36.28% -63.72% Expenditures: Public Works 0.00% -100.00% Culture and Recreation 10,310 10,310 4,712 5,598 45.70% -54.30% Capital Outlay 0.00% -100.00% Total Expenditures 10,310 10,310 4,712 5,598 45.70% -54.30% Other Financing Uses: Transfers Out/Capital Outlay 0.00% -100.00% Total Other Financing Uses 0.00% -100.00% Total Expenditures and Other Financing Uses 10,310 10,310 4,712 5,598 45.70% -54.30% Excess of revenues over (under) expenditures and Other Financing Uses, Budget Basis $ 190 190 (903) (1,093) Unassigned Net Position at Beginning of Year 903 Cancellation of Prior Year Encumbrances Change in Other Fund Balance Components During the Year Year-End Investment Market Value Adjustment Unassigned Net Position, 06/30/22 Other Net Position Components: Committed - Current Year Encumbrances Committed - Prior Year Encumbrances Total Net Position $
PRELIMINARY
Comparison Schedule Private Purpose Expendable Trust Fund - Vaile Mansion For the period ended June 30, 2022 36
CITY OF INDEPENDENCE, MISSOURI Budgetary
CITY OF INDEPENDENCE, MISSOURI Budgetary Comparison
Actual Variance Percent Percent Budgeted Amounts Amounts with Final Actual From Original Amended (Budget Basis) Budget 100.00% of Year Budget Revenues: Sales Taxes $ 8,106,070 8,106,070 8,876,336 770,266 109.50% 9.50% Investment Income 75,000 75,000 37,863 (37,137) 50.48% -49.52% Total Revenues 8,181,070 8,181,070 8,914,199 733,129 108.96% 8.96% Expenditures: Administrative Fee 162,121 162,121 177,527 (15,406) 109.50% 9.50% Insurance 2,150 2,150 4,423 (2,273) 205.72% 105.72% Legal 55,300 55,300 55,300 0.00% -100.00% Audit 5,500 5,500 5,300 200 96.36% -3.64% Banking 6,500 6,500 9,796 (3,296) 150.71% 50.71% Professional Services 20,550 (20,550) 0.00% -100.00% Capital Outlay 0.00% -100.00% Other 0.00% -100.00% Total Expenditures 231,571 231,571 217,596 13,975 93.97% -6.03% Other Financing Uses: Transfers Out - EATS (1,175,000) (1,175,000) (1,183,938) 8,938 100.76% 0.76% Transfers Out - Debt Service (City) (4,205,456) (4,205,456) (4,081,222) (124,234) 97.05% -2.95% Transfers Out - Captial Projects (3,120,150) (3,120,150) (2,036,029) (1,084,121) 65.25% -34.75% Total Other Financing Uses (8,500,606) (8,500,606) (7,301,189) (1,199,417) 85.89% -14.11% Excess of Revenue and Other Financing Sources Over (Under) Expenditures and Other Financing Uses, Budget Basis $ (551,107) (551,107) 1,395,414 1,946,521 Unassigned Fund Balance at Beginning of Year 9,171,998 Cancellation of Prior Year Encumbrances 117,346 Change in Other Fund Balance Components During the Year Unassigned Ending Fund Balance, 06/30/22 10,684,758 Other Fund Balance Components: Restricted - current year encumbrances 5,795 Restricted - prior year encumbrances Total Fund Balance $ 10,690,553
PRELIMINARY
Independence Events Center CID For the period ended June 30, 2022 37
Schedule
CITY OF INDEPENDENCE, MISSOURI Budgetary Comparison Schedule
PRELIMINARY
Actual Variance Percent Percent Budgeted Amounts Amounts with Final Actual From Original Amended (Budget Basis) Budget 100.00% of Year Budget Revenues: Sales taxes $ 467,996 467,996 578,758 110,762 123.67% 23.67% Investment income 300 300 529 229 176.33% 76.33% Total revenues 468,296 468,296 579,287 110,991 123.70% 23.70% Expenditures: Administrative fee 9,360 9,360 11,575 (2,215) 123.66% 23.66% Insurance 2,150 2,150 4,395 (2,245) 204.42% 104.42% Legal 0.00% -100.00% Audit 5,500 5,500 5,300 200 96.36% -3.64% Banking 350 350 402 (52) 114.86% 14.86% Contract services 850 850 850 0.00% -100.00% Capital outlay 0.00% -100.00% Other 0.00% -100.00% Total expenditures 18,210 18,210 21,672 (3,462) 119.01% 19.01% Other financing uses: Transfers out - EATS (233,998) (233,998) (289,379) 55,381 123.67% 23.67% Transfers out - Debt Service (City) (215,000) (215,000) (215,000) 100.00% 0.00% Total other financing uses (448,998) (448,998) (504,379) 55,381 112.33% 12.33% Excess of Revenue and Other Financing Sources Over (Under) Expenditures and Other Financing Uses, Budget Basis $ 1,088 1,088 53,236 52,148 Unassigned Fund Balance at Beginning of Year 137,827 Cancellation of Prior Year Encumbrances Change in Other Fund Balance Components During the Year (724) Unassigned Ending Fund Balance, 06/30/22 190,339 Other Fund Balance Components: Restricted - Current Year Encumbrances Restricted - Prior Year Encumbrances Restricted - City Transportation 7,177 Total Fund Balance $ 197,516
Crackerneck Creek TDD For the period ended June 30, 2022 38
Actual Variance Percent Percent Budgeted Amounts Amounts with Final Actual From Original Amended (Budget Basis) Budget 100.00% of Year Budget Revenues: Taxes $ 15,970,917 15,970,917 14,457,933 (1,512,984) 90.53% -9.47% Investment Income (Loss) 294,000 294,000 216,795 (82,034) 73.74% -26.26% Other revenue 1,310,958 1,310,958 1,301,405 (9,553) 99.27% -0.73% Total Revenues 17,575,875 17,575,875 15,976,133 (1,604,571) 90.90% -9.10% Other Financing Sources: Transfers In 1,327,471 1,327,471 3,341,437 2,013,966 251.71% 151.71% Total Other Financing Sources 1,327,471 1,327,471 3,341,437 2,013,966 251.71% 151.71% Total Revenues and Other Financing Sources 18,903,346 18,903,346 19,317,570 409,395 102.19% 2.19% Expenditures: Tax Increment Financing 2,171,231 2,171,231 2,331,818 (160,587) 107.40% 7.40% Debt Service Principal 9,423,109 9,423,109 9,430,745 (7,636) 100.08% 0.08% Interest and Fiscal Agent Fees 5,082,094 5,082,094 4,918,262 163,832 96.78% -3.22% Debt Issuance Costs 0.00% -100.00% Total Expenditures 16,676,434 16,676,434 16,680,825 (4,391) 100.03% 0.03% Other Financing Uses: Issuance of Debt 0.00% -100.00% Reoffering Premium/Original Issue Discount 0.00% -100.00% Payment to Refund Loans Escrow Agent 0.00% -100.00% Transfers Out 3,341,437 (3,341,437) 0.00% -100.00% Total Other Financing Uses 3,341,437 (3,341,437) 0.00% -100.00% Total Expenditures and Other Financing Uses 16,676,434 16,676,434 20,022,262 (3,345,828) 120.06% 20.06% Excess of Revenues Over (Under) Expenditures and other financing uses $ 2,226,912 2,226,912 (704,692) (2,931,604) Unassigned Fund Balance at Beginning of Year 4,435,457 Cancellation of Prior Year Encumbrances Change in Other Fund Balance Components During the Year 15,881,942 Year-End Investment Market Value Adjustment (499,266) Unassigned Ending Fund Balance, 06/30/22 19,113,441 Other Fund Balance Components: Restricted - Current Year Encumbrances Restricted - Prior Year Encumbrances 15,226 Restricted - Trust Debt Service 10,524,842 Total Fund Balance $ 29,653,509
OF INDEPENDENCE, MISSOURI Budgetary Comparison Schedule Tax Increment Financing Summary For the Period Ended June 30, 2022 39
PRELIMINARY
CITY
CITY
Actual Variance Percent Percent Budgeted Amounts Amounts with Final Actual From Original Amended (Budget Basis) Budget 100.00% of Year Budget Revenues: Taxes $ (1,353) (1,353) 0.00% -100.00% Investment Income (Loss) (221) (221) 0.00% -100.00% Other Revenue 0.00% -100.00% Total Revenues (1,574) (1,574) 0.00% -100.00% Expenditures: Tax Increment Financing 0.00% -100.00% Debt Service Principal 0.00% -100.00% Interest and Fiscal Agent Fees 0.00% -100.00% Debt Issuance Costs 0.00% -100.00% Total Expenditures 0.00% -100.00% Other Financing Uses: Issuance of Debt 0.00% -100.00% Reoffering Premium/Original Issue Discount 0.00% -100.00% Payment to Refund Loans Escrow Agent 0.00% -100.00% Transfers Out 0.00% -100.00% Total Other Financing Uses 0.00% -100.00% Total Expenditures and Other Financing Uses 0.00% -100.00% Excess of Revenues Over (Under) Expenditures and Other Financing Uses $ (1,574) (1,574) Unassigned Fund Balance at Beginning of Year 1,574 Cancellation of Prior Year Encumbrances Change in Other Fund Balance Components During the Year Year-End Investment Market Value Adjustment Unassigned Ending Fund Balance, 06/30/22 Other Fund Balance Components: Restricted - Current Year Encumbrances Restricted - Prior Year Encumbrances Restricted - Trust Debt Service Total Fund Balance $
PRELIMINARY
OF INDEPENDENCE, MISSOURI Budgetary Comparison Schedule
Mid-Town Truman Rd TIF
40
For the Period Ended June 30, 2022
PRELIMINARY Actual Variance Percent Percent Budgeted Amounts Amounts with Final Actual From Original Amended (Budget Basis) Budget 100.00% of Year Budget Revenues: Taxes $ 26,271 26,271 31,389 5,118 119.48% 19.48% Investment Income (Loss) 1,294 1,294 0.00% -100.00% Other Revenue 102,958 102,958 97,606 (5,352) 94.80% -5.20% Total Revenues 129,229 129,229 130,289 1,060 100.82% 0.82% Other Financing Sources: Transfers In 187,942 187,942 579,500 391,558 308.34% 208.34% Total Other Financing Sources 187,942 187,942 579,500 391,558 308.34% 208.34% Total Revenues and Other Financing Sources 317,171 317,171 709,789 392,618 223.79% 123.79% Expenditures: Tax Increment Financing 7,801 7,801 7,677 124 98.41% -1.59% Debt Service Principal 205,000 205,000 205,000 100.00% 0.00% Interest and Fiscal Agent Fees 327,938 327,938 327,938 100.00% 0.00% Debt Issuance Costs 0.00% -100.00% Total Expenditures 540,739 540,739 540,615 124 99.98% -0.02% Other Financing Uses: Issuance of Debt 0.00% -100.00% Reoffering Premium/Original Issue Discount 0.00% -100.00% Payment to Refund Loans Escrow Agent 0.00% -100.00% Transfers Out 0.00% -100.00% Total Other Financing Uses 0.00% -100.00% Total Expenditures and Other Financing Uses 540,739 540,739 540,615 124 99.98% -0.02% Excess of Revenues Over (Under) Expenditures and Other Financing Uses $ (223,568) (223,568) 169,174 392,742 Unassigned Fund Balance at Beginning of Year (1,115,449) Cancellation of Prior Year Encumbrances Change in Other Fund Balance Components During the Year 74,080 Year-End Investment Market Value Adjustment (53,790) Unassigned Ending Fund Balance, 06/30/22 (925,985) Other Fund Balance Components: Restricted - Current Year Encumbrances Restricted - Prior Year Encumbrances Restricted - Trust Debt Service 483,752 Total Fund Balance $ (442,233)
Budgetary Comparison Schedule Santa Fe TIF For the Period Ended June 30, 2022 41
CITY OF INDEPENDENCE, MISSOURI
CITY OF INDEPENDENCE, MISSOURI Budgetary Comparison Schedule Hartman Heritage TIF For the Period Ended June 30, 2022
PRELIMINARY Actual Variance Percent Percent Budgeted Amounts Amounts with Final Actual From Original Amended (Budget Basis) Budget 100.00% of Year Budget Revenues: Taxes $ 1,446,920 1,446,920 308,768 (1,138,152) 21.34% -78.66% Investment Income (Loss) 0.00% -100.00% Other Revenue 0.00% -100.00% Total Revenues 1,446,920 1,446,920 308,768 (1,138,152) 21.34% -78.66% Other Financing Sources: Transfers In 118,097 118,097 (118,097) 0.00% -100.00% Total Other Financing Sources 118,097 118,097 (118,097) 0.00% -100.00% Total Revenues and Other Financing Sources 1,565,017 1,565,017 308,768 (1,256,249) 19.73% -80.27% Expenditures: Tax Increment Financing 121,261 121,261 3,083 118,178 2.54% -97.46% Debt Service Principal 0.00% -100.00% Interest and Fiscal Agent Fees 0.00% -100.00% Debt Issuance Costs 0.00% -100.00% Total Expenditures 121,261 121,261 3,083 118,178 2.54% -97.46% Other Financing Uses: Issuance of Debt 0.00% -100.00% Reoffering Premium/Original Issue Discount 0.00% -100.00% Payment to Refund Loans Escrow Agent 0.00% -100.00% Transfers Out 0.00% -100.00% Total Other Financing Uses 0.00% -100.00% Total Expenditures and Other Financing Uses 121,261 121,261 3,083 118,178 2.54% -97.46% Excess of Revenues Over (Under) Expenditures and Other Financing Uses $ 1,443,756 1,443,756 305,685 (1,138,071) Unassigned Fund Balance at Beginning of Year (2,999,627) Cancellation of Prior Year Encumbrances Change in Other Fund Balance Components During the Year Unassigned Ending Fund Balance, 06/30/22 (2,693,942) Other Fund Balance Components: Restricted - Current Year Encumbrances Restricted - Prior Year Encumbrances Restricted - Trust Debt Service Total Fund Balance $ (2,693,942)
42
CITY OF INDEPENDENCE, MISSOURI Budgetary Comparison Schedule
Actual Variance Percent Percent Budgeted Amounts Amounts with Final Actual From Original Amended (Budget Basis) Budget 100.00% of Year Budget Revenues: Taxes $ 568,730 568,730 (3,022,181) (3,590,911) -531.39% -631.39% Investment Income (Loss) 25,000 25,000 (110,853) (135,853) -443.41% -543.41% Other Revenue 0.00% -100.00% Total Revenues 593,730 593,730 (3,133,034) (3,726,764) -527.69% -627.69% Expenditures: Tax Increment Financing 15,338 15,338 5,028 10,310 32.78% -67.22% Debt Service Principal 415,000 415,000 415,000 0.00% -100.00% Interest and Fiscal Agent Fees 12,450 12,450 12,450 0.00% -100.00% Debt Issuance Costs 0.00% -100.00% Total Expenditures 442,788 442,788 5,028 437,760 1.14% -98.86% Other Financing Uses: Issuance of Debt 0.00% -100.00% Reoffering Premium/Original Issue Discount 0.00% -100.00% Payment to Refund Loans Escrow Agent 0.00% -100.00% Transfers Out 0.00% -100.00% Total Other Financing Uses 0.00% -100.00% Total Expenditures and Other Financing Uses 442,788 442,788 5,028 437,760 1.14% -98.86% Excess of Revenues Over (Under) Expenditures and Other Financing Uses $ 150,942 150,942 (3,138,062) (3,289,004) Unassigned Fund Balance at Beginning of Year 1,579,935 Cancellation of Prior Year Encumbrances Change in Other Fund Balance Components During the Year Year-End Investment Market Value Adjustment Unassigned Ending Fund Balance, 06/30/22 (1,558,127) Other Fund Balance Components: Restricted - Current Year Encumbrances Restricted - Prior Year Encumbrances Restricted - Trust Debt Service Total Fund Balance $ (1,558,127)
PRELIMINARY
Drumm Farm TIF For the Period Ended June 30, 2022 43
CITY OF INDEPENDENCE, MISSOURI Budgetary Comparison Schedule
Eastland TIF
For the Period Ended June 30, 2022
Actual Variance Percent Percent Budgeted Amounts Amounts with Final Actual From Original Amended (Budget Basis) Budget 100.00% of Year Budget Revenues: Taxes $ 5,053,492 5,053,492 6,202,183 1,148,691 122.73% 22.73% Investment Income (Loss) 165,000 165,000 216,750 51,750 131.36% 31.36% Other Revenue 0.00% -100.00% Total Revenues 5,218,492 5,218,492 6,418,933 1,200,441 123.00% 23.00% Other Financing Sources: Transfers In 664,783 664,783 1,130,622 465,839 170.07% 70.07% Total Other Financing Sources 664,783 664,783 1,130,622 465,839 170.07% 70.07% Total Revenues and Other Financing Sources 5,883,275 5,883,275 7,549,555 1,666,280 128.32% 28.32% Expenditures: Tax Increment Financing 457,612 457,612 336,494 121,118 73.53% -26.47% Debt Service Principal 3,980,000 3,980,000 3,980,000 100.00% 0.00% Interest and Fiscal Agent Fees 57,000 57,000 161,000 (104,000) 282.46% 182.46% Debt Issuance Costs 0.00% -100.00% Total Expenditures 4,494,612 4,494,612 4,477,494 17,118 99.62% -0.38% Other Financing Uses: Issuance of Debt 0.00% -100.00% Reoffering Premium/Original Issue Discount 0.00% -100.00% Payment to Refund Loans Escrow Agent 0.00% -100.00% Transfers Out 1,130,622 (1,130,622) 0.00% -100.00% Total Other Financing Uses 1,130,622 (1,130,622) 0.00% -100.00% Total Expenditures and Other Financing Uses 4,494,612 4,494,612 5,608,116 (1,113,504) 124.77% 24.77% Excess of Revenues Over (Under) Expenditures and Other Financing Uses $ 1,388,663 1,388,663 1,941,439 552,776 Unassigned Fund Balance at Beginning of Year 15,004,007 Cancellation of Prior Year Encumbrances Change in Other Fund Balance Components During the Year 505,556 Year-End Investment Market Value Adjustment (192,270) Unassigned Ending Fund Balance, 06/30/22 17,258,732 Other Fund Balance Components: Restricted - Current Year Encumbrances Restricted - Prior Year Encumbrances Restricted - Trust Debt Service 392,126 Total Fund Balance $ 17,650,858
PRELIMINARY
44
CITY
Actual Variance Percent Percent Budgeted Amounts Amounts with Final Actual From Original Amended (Budget Basis) Budget 100.00% of Year Budget Revenues: Taxes $ 57,965 57,965 23,301 (34,664) 40.20% -59.80% Investment Income (Loss) 29 29 0.00% -100.00% Other Revenue 0.00% -100.00% Total Revenues 57,965 57,965 23,330 (34,635) 40.25% -59.75% Expenditures: Tax Increment Financing 1,645 1,645 454 1,191 27.60% -72.40% Debt Service Principal 10,000 10,000 10,000 0.00% -100.00% Interest and Fiscal Agent Fees 45,530 45,530 24,700 20,830 54.25% -45.75% Debt Issuance Costs 0.00% -100.00% Total Expenditures 57,175 57,175 25,154 32,021 43.99% -56.01% Other Financing Uses: Issuance of Debt 0.00% -100.00% Reoffering Premium/Original Issue Discount 0.00% -100.00% Payment to Refund Loans Escrow Agent 0.00% -100.00% Transfers Out 0.00% -100.00% 0.00% -100.00% Total Other Financing Uses 0.00% -100.00% Total Expenditures and Other Financing Uses 57,175 57,175 25,154 32,021 43.99% -56.01% Excess of Revenues Over (Under) Expenditures and Other Financing Uses $ 790 790 (1,824) (2,614) Unassigned Fund Balance at Beginning of Year 11,934 Cancellation of Prior Year Encumbrances Change in Other Fund Balance Components During the Year Unassigned Ending Fund Balance, 06/30/22 10,110 Other Fund Balance Components: Restricted - Current Year Encumbrances Restricted - Prior Year Encumbrances Restricted - Trust Debt Service Total Fund Balance $ 10,110
PRELIMINARY
Independence TIF
the Period Ended June 30, 2022 45
OF INDEPENDENCE, MISSOURI Budgetary Comparison Schedule North
For
CITY OF INDEPENDENCE, MISSOURI Budgetary Comparison Schedule
Mt Washington TIF
For the Period Ended June 30, 2022
PRELIMINARY Actual Variance Percent Percent Budgeted Amounts Amounts with Final Actual From Original Amended (Budget Basis) Budget 100.00% of Year Budget Revenues: Taxes $ 2,179 2,179 (40,714) (42,893) -1868.47% -1968.47% Investment Income (Loss) 1,000 1,000 (8,585) (9,585) -858.50% -958.50% Other Revenue 0.00% -100.00% Total Revenues 3,179 3,179 (49,299) (52,478) -1550.77% -1650.77% Other Financing Sources: Transfers In 0.00% -100.00% Capital lease proceeds 0.00% Total Other Financing Sources 0.00% -100.00% Total Revenues and Other Financing Sources 3,179 3,179 (49,299) (52,478) -1550.77% -1650.77% Expenditures: Tax Increment Financing 63 63 138 (75) 219.05% 119.05% Debt Service Principal 0.00% -100.00% Interest and Fiscal Agent Fees 0.00% -100.00% Debt Issuance Costs 0.00% -100.00% Total Expenditures 63 63 138 (75) 219.05% 119.05% Other Financing Uses: Issuance of Debt 0.00% -100.00% Reoffering Premium/Original Issue Discount 0.00% -100.00% Payment to Refund Loans Escrow Agent 0.00% -100.00% Transfers Out 0.00% -100.00% Total Other Financing Uses 0.00% -100.00% Total Expenditures and Other Financing Uses 63 63 138 (75) 219.05% 119.05% Excess of Revenues Over (Under) Expenditures and Other Financing Uses $ 3,116 3,116 (49,437) (52,553) Unassigned Fund Balance at Beginning of Year 49,447 Cancellation of Prior Year Encumbrances Change in Other Fund Balance Components During the Year Year-End Investment Market Value Adjustment Unassigned Ending Fund Balance, 06/30/22 10 Other Fund Balance Components: Restricted - Current Year Encumbrances Restricted - Prior Year Encumbrances Restricted - Trust Debt Service Total Fund Balance $ 10
46
CITY OF INDEPENDENCE, MISSOURI Budgetary Comparison Schedule
Crackerneck Creek TIF
For the Period Ended June 30, 2022
Actual Variance Percent Percent Budgeted Amounts Amounts with Final Actual From Original Amended (Budget Basis) Budget 100.00% of Year Budget Revenues: Taxes $ 1,589,201 1,589,201 1,933,013 343,812 121.63% 21.63% Investment Income (Loss) 77,000 77,000 35,288 (41,712) 45.83% -54.17% Other Revenue 1,208,000 1,208,000 1,203,799 (4,201) 99.65% -0.35% Total Revenues 2,874,201 2,874,201 3,172,100 297,899 110.36% 10.36% Other Financing Sources: Transfers In 315,000 315,000 1,578,000 1,263,000 500.95% 400.95% Total Other Financing Sources 315,000 315,000 1,578,000 1,263,000 500.95% 400.95% Total Revenues and Other Financing Sources 3,189,201 3,189,201 4,750,100 1,560,899 148.94% 48.94% Expenditures: Tax Increment Financing 48,817 48,817 46,819 1,998 95.91% -4.09% Debt Service Principal 50,000 50,000 1,735,000 (1,685,000) 3470.00% 3370.00% Interest and Fiscal Agent Fees 3,775,226 3,775,226 2,939,800 835,426 77.87% -22.13% Debt Issuance Costs 0.00% -100.00% Total Expenditures 3,874,043 3,874,043 4,721,619 (847,576) 121.88% 21.88% Other Financing Uses: Issuance of Debt 0.00% -100.00% Reoffering Premium/Original Issue Discount 0.00% -100.00% Payment to Refund Loans Escrow Agent 0.00% -100.00% Transfers Out 0.00% -100.00% Total Other Financing Uses 0.00% -100.00% Total Expenditures and Other Financing Uses 3,874,043 3,874,043 4,721,619 (847,576) 121.88% 21.88% Excess of Revenues Over (Under) Expenditures and Other Financing Uses $ (684,842) (684,842) 28,481 713,323 Unassigned Fund Balance at Beginning of Year (10,710,147) Cancellation of Prior Year Encumbrances Change in Other Fund Balance Components During the Year 15,272,635 Year-End Investment Market Value Adjustment (108,890) Unassigned Ending Fund Balance, 06/30/22 4,482,079 Other Fund Balance Components: Restricted - Current Year Encumbrances Restricted - Prior Year Encumbrances 15,226 Restricted - Trust Debt Service 6,300,070 Total Fund Balance $ 10,797,375
PRELIMINARY
47
Actual Variance Percent Percent Budgeted Amounts Amounts with Final Actual From Original Amended (Budget Basis) Budget 100.00% of Year Budget Revenues: Taxes $ 496,239 496,239 699,430 203,191 140.95% 40.95% Investment Income (Loss) 143 143 0.00% -100.00% Other Revenue 0.00% -100.00% Total Revenues 496,239 496,239 699,573 203,334 140.98% 40.98% Expenditures: Tax Increment Financing 9,590 9,590 13,916 (4,326) 145.11% 45.11% Debt Service Principal 486,349 486,349 651,952 (165,603) 134.05% 34.05% Interest and Fiscal Agent Fees 34,098 (34,098) 0.00% -100.00% Debt Issuance Costs 0.00% -100.00% Total Expenditures 495,939 495,939 699,966 (204,027) 141.14% 41.14% Other Financing Uses: Issuance of Debt 0.00% -100.00% Reoffering Premium/Original Issue Discount 0.00% -100.00% Payment to Refund Loans Escrow Agent 0.00% -100.00% Transfers Out 0.00% -100.00% Total Other Financing Uses 0.00% -100.00% Total Expenditures and Other Financing Uses 495,939 495,939 699,966 (204,027) 141.14% 41.14% Excess of Revenues Over (Under) Expenditures and Other Financing Uses $ 300 300 (393) (693) Unassigned Fund Balance at Beginning of Year 9,853 Cancellation of Prior Year Encumbrances Change in Other Fund Balance Components During the Year Unassigned Ending Fund Balance, 06/30/22 9,460 Other Fund Balance Components: Restricted - Current Year Encumbrances Restricted - Prior Year Encumbrances Restricted - Trust Debt Service Total Fund Balance $ 9,460
OF INDEPENDENCE, MISSOURI Budgetary Comparison Schedule Old Landfill TIF For the Period Ended June 30, 2022 48
PRELIMINARY
CITY
CITY OF INDEPENDENCE, MISSOURI Budgetary Comparison Schedule Trinity
For the Period Ended June 30, 2022
PRELIMINARY Actual Variance Percent Percent Budgeted Amounts Amounts with Final Actual From Original Amended (Budget Basis) Budget 100.00% of Year Budget Revenues: Taxes $ 489,107 489,107 455,048 (34,059) 93.04% -6.96% Investment Income (Loss) 79 79 0.00% -100.00% Other Revenue 0.00% -100.00% Total Revenues 489,107 489,107 455,127 (33,980) 93.05% -6.95% Other Financing Sources: Transfers In 32,466 32,466 44,047 11,581 135.67% 35.67% Total Other Financing Sources 32,466 32,466 44,047 11,581 135.67% 35.67% Total Revenues and Other Financing Sources 521,573 521,573 499,174 (22,399) 95.71% -4.29% Expenditures: Tax Increment Financing 11,267 11,267 9,272 1,995 82.29% -17.71% Debt Service Principal 510,360 510,360 328,084 182,276 64.28% -35.72% Interest and Fiscal Agent Fees 132,516 (132,516) 0.00% -100.00% Debt Issuance Costs 0.00% -100.00% Total Expenditures 521,627 521,627 469,872 51,755 90.08% -9.92% Other Financing Uses: Issuance of Debt 0.00% -100.00% Reoffering Premium/Original Issue Discount 0.00% -100.00% Payment to Refund Loans Escrow Agent 0.00% -100.00% Transfers Out 44,047 (44,047) 0.00% -100.00% Total Other Financing Uses 44,047 (44,047) 0.00% -100.00% Total Expenditures and Other Financing Uses 521,627 521,627 513,919 7,708 98.52% -1.48% Excess of Revenues Over (Under) Expenditures and Other Financing Uses $ (54) (54) (14,745) (14,691) Unassigned Fund Balance at Beginning of Year 69,361 Cancellation of Prior Year Encumbrances Change in Other Fund Balance Components During the Year Unassigned Ending Fund Balance, 06/30/22 54,616 Other Fund Balance Components: Restricted - Current Year Encumbrances Restricted - Prior Year Encumbrances Restricted - Trust Debt Service Total Fund Balance $ 54,616
TIF
49
For the Period Ended June 30, 2022
Actual Variance Percent Percent Budgeted Amounts Amounts with Final Actual From Original Amended (Budget Basis) Budget 100.00% of Year Budget Revenues: Taxes $ 3,589,345 3,589,345 4,531,917 942,572 126.26% 26.26% Investment Income (Loss) 17,000 17,000 19,621 2,621 115.42% 15.42% Other Revenue 0.00% -100.00% Total Revenues 3,606,345 3,606,345 4,551,538 945,193 126.21% 26.21% Other Financing Sources: Transfers In 9,183 9,183 9,268 85 100.93% 0.93% Total Other Financing Sources 9,183 9,183 9,268 85 100.93% 0.93% Total Revenues and Other Financing Sources 3,615,528 3,615,528 4,560,806 945,278 126.14% 26.14% Expenditures: Tax Increment Financing 550,170 550,170 1,699,686 (1,149,516) 308.94% 208.94% Debt Service Principal 2,200,000 2,200,000 2,200,000 100.00% 0.00% Interest and Fiscal Agent Fees 863,950 863,950 863,950 100.00% 0.00% Debt Issuance Costs 0.00% -100.00% Total Expenditures 3,614,120 3,614,120 4,763,636 (1,149,516) 131.81% 31.81% Other Financing Uses: Issuance of Debt 0.00% -100.00% Reoffering Premium/Original Issue Discount 0.00% -100.00% Payment to Refund Loans Escrow Agent 0.00% -100.00% Transfers Out 9,268 (9,268) 0.00% -100.00% Total Other Financing Uses 9,268 (9,268) 0.00% -100.00% Total Expenditures and Other Financing Uses 3,614,120 3,614,120 4,772,904 (1,158,784) 132.06% 32.06% Excess of Revenues Over (Under) Expenditures and Other Financing Uses $ 1,408 1,408 (212,098) (213,506) Unassigned Fund Balance at Beginning of Year 1,165,892 Cancellation of Prior Year Encumbrances Change in Other Fund Balance Components During the Year 29,671 Year-End Investment Market Value Adjustment (43,087) Unassigned Ending Fund Balance, 06/30/22 940,378 Other Fund Balance Components: Restricted - Current Year Encumbrances Restricted - Prior Year Encumbrances Restricted - Trust Debt Service 3,348,894 Total Fund Balance $ 4,289,272
PRELIMINARY
CITY OF INDEPENDENCE, MISSOURI Budgetary Comparison Schedule HCA TIF
50
MISSOURI
Actual Variance Percent Percent Budgeted Amounts Amounts with Final Actual From Original Amended (Budget Basis) Budget 100.00% of Year Budget Revenues: Taxes $ 257,861 257,861 275,340 17,479 106.78% 6.78% Investment Income (Loss) 47 47 0.00% -100.00% Other Revenue 0.00% -100.00% Total Revenues 257,861 257,861 275,387 17,526 106.80% 6.80% Expenditures: Tax Increment Financing 5,139 5,139 5,660 (521) 110.14% 10.14% Debt Service Principal 252,902 252,902 119,490 133,412 47.25% -52.75% Interest and Fiscal Agent Fees 177,310 (177,310) 0.00% -100.00% Debt Issuance Costs 0.00% -100.00% Total Expenditures 258,041 258,041 302,460 (44,419) 117.21% 17.21% Other Financing Uses: Issuance of Debt 0.00% -100.00% Reoffering Premium/Original Issue Discount 0.00% -100.00% Payment to Refund Loans Escrow Agent 0.00% -100.00% Transfers Out 0.00% -100.00% Total Other Financing Uses 0.00% -100.00% Total Expenditures and Other Financing Uses 258,041 258,041 302,460 (44,419) 117.21% 17.21% Excess of Revenues Over (Under) Expenditures and Other Financing Uses $ (180) (180) (27,073) (26,893) Unassigned Fund Balance at Beginning of Year 80,315 Cancellation of Prior Year Encumbrances Change in Other Fund Balance Components During the Year Unassigned Ending Fund Balance, 06/30/22 53,242 Other Fund Balance Components: Restricted - Current Year Encumbrances Restricted - Prior Year Encumbrances Restricted - Trust Debt Service Total Fund Balance $ 53,242
PRELIMINARY
TIF
51
CITY OF INDEPENDENCE,
Budgetary Comparison Schedule Cinema East
For the Period Ended June 30, 2022
CITY
Actual Variance Percent Percent Budgeted Amounts Amounts with Final Actual From Original Amended (Budget Basis) Budget 100.00% of Year Budget Revenues: Taxes $ 82,194 82,194 86,136 3,942 104.80% 4.80% Investment Income (Loss) 226 226 0.00% -100.00% Other Revenue 0.00% -100.00% Total Revenues 82,194 82,194 86,362 4,168 105.07% 5.07% Expenditures: Tax Increment Financing 2,063 2,063 1,840 223 89.19% -10.81% Debt Service Principal 80,131 80,131 80,131 0.00% -100.00% Interest and Fiscal Agent Fees 0.00% -100.00% Debt Issuance Costs 0.00% -100.00% Total Expenditures 82,194 82,194 1,840 80,354 2.24% -97.76% Other Financing Uses: Issuance of Debt 0.00% -100.00% Reoffering Premium/Original Issue Discount 0.00% -100.00% Payment to Refund Loans Escrow Agent 0.00% -100.00% Transfers Out 0.00% -100.00% Total Other Financing Uses 0.00% -100.00% Total Expenditures and Other Financing Uses 82,194 82,194 1,840 80,354 2.24% -97.76% Excess of Revenues Over (Under) Expenditures and Other Financing Uses $ 84,522 84,522 Unassigned Fund Balance at Beginning of Year 72,840 Cancellation of Prior Year Encumbrances Change in Other Fund Balance Components During the Year Unassigned Ending Fund Balance, 06/30/22 157,362 Other Fund Balance Components: Restricted - Current Year Encumbrances Restricted - Prior Year Encumbrances Restricted - Trust Debt Service Total Fund Balance $ 157,362
PRELIMINARY
Noland
TIF
the Period
52
OF INDEPENDENCE, MISSOURI Budgetary Comparison Schedule 23rd &
Project 1
For
Ended June 30, 2022
CITY OF INDEPENDENCE, MISSOURI Budgetary Comparison Schedule 23rd & Noland Project 2 TIF For the Period Ended June 30, 2022
PRELIMINARY
Actual Variance Percent Percent Budgeted Amounts Amounts with Final Actual From Original Amended (Budget Basis) Budget 100.00% of Year Budget Revenues: Taxes $ 11,729 11,729 18,109 6,380 154.40% 54.40% Investment Income (Loss) 247 247 0.00% -100.00% Other Revenue 0.00% -100.00% Total Revenues 11,729 11,729 18,356 6,627 156.50% 56.50% Expenditures: Tax Increment Financing 246 246 574 (328) 233.33% 133.33% Debt Service Principal 11,483 11,483 33,000 (21,517) 287.38% 187.38% Interest and Fiscal Agent Fees 0.00% -100.00% Debt Issuance Costs 0.00% -100.00% Total Expenditures 11,729 11,729 33,574 (21,845) 286.25% 186.25% Other Financing Uses: Issuance of Debt 0.00% -100.00% Reoffering Premium/Original Issue Discount 0.00% -100.00% Payment to Refund Loans Escrow Agent 0.00% -100.00% Transfers Out 0.00% -100.00% Total Other Financing Uses 0.00% -100.00% Total Expenditures and Other Financing Uses 11,729 11,729 33,574 (21,845) 286.25% 186.25% Excess of Revenues Over (Under) Expenditures and Other Financing Uses $ (15,218) (15,218) Unassigned Fund Balance at Beginning of Year 23,261 Cancellation of Prior Year Encumbrances Change in Other Fund Balance Components During the Year Year-End Investment Market Value Adjustment Unassigned Ending Fund Balance, 06/30/22 8,043 Other Fund Balance Components: Restricted - Current Year Encumbrances Restricted - Prior Year Encumbrances Restricted - Trust Debt Service Total Fund Balance $ 8,043
53
Actual Variance Percent Percent Budgeted Amounts Amounts with Final Actual From Original Amended (Budget Basis) Budget 100.00% of Year Budget Revenues: Taxes $ 24,348 24,348 34,483 10,135 141.63% 41.63% Investment Income (Loss) 553 553 0.00% -100.00% Other Revenue 0.00% -100.00% Total Revenues 24,348 24,348 35,036 10,688 143.90% 43.90% Expenditures: Tax Increment Financing 24,438 24,438 810 23,628 3.31% -96.69% Debt Service Principal 0.00% -100.00% Interest and Fiscal Agent Fees 0.00% -100.00% Debt Issuance Costs 0.00% -100.00% Total Expenditures 24,438 24,438 810 23,628 3.31% -96.69% Other Financing Uses: Issuance of Debt 0.00% -100.00% Reoffering Premium/Original Issue Discount 0.00% -100.00% Payment to Refund Loans Escrow Agent 0.00% -100.00% Transfers Out 32,000 (32,000) 0.00% -100.00% Total Other Financing Uses 32,000 (32,000) 0.00% -100.00% Total Expenditures and Other Financing Uses 24,438 24,438 32,810 (8,372) 134.26% 34.26% Excess of Revenues Over (Under) Expenditures and Other Financing Uses $ (90) (90) 2,226 2,316 Unassigned Fund Balance at Beginning of Year 6,738 Cancellation of Prior Year Encumbrances Change in Other Fund Balance Components During the Year Year-End Investment Market Value Adjustment (1,074) Unassigned Ending Fund Balance, 06/30/22 7,890 Other Fund Balance Components: Restricted - Current Year Encumbrances Restricted - Prior Year Encumbrances Restricted - Trust Debt Service Total Fund Balance $ 7,890
PRELIMINARY
Noland
TIF
54
CITY OF INDEPENDENCE, MISSOURI Budgetary Comparison Schedule 23rd &
Project 3
For the Period Ended June 30, 2022
CITY
Actual Variance Percent Percent Budgeted Amounts Amounts with Final Actual From Original Amended (Budget Basis) Budget 100.00% of Year Budget Revenues: Taxes $ 462,503 462,503 587,482 124,979 127.02% 27.02% Investment Income (Loss) 6,193 6,193 0.00% -100.00% Other Revenue 0.00% -100.00% Total Revenues 462,503 462,503 593,675 131,172 128.36% 28.36% Expenditures: Tax Increment Financing 462,503 462,503 11,814 450,689 2.55% -97.45% Debt Service Principal 0.00% -100.00% Interest and Fiscal Agent Fees 0.00% -100.00% Debt Issuance Costs 0.00% -100.00% Total Expenditures 462,503 462,503 11,814 450,689 2.55% -97.45% Other Financing Uses: Issuance of Debt 0.00% -100.00% Reoffering Premium/Original Issue Discount 0.00% -100.00% Payment to Refund Loans Escrow Agent 0.00% -100.00% Transfers Out 547,500 (547,500) 0.00% -100.00% Total Other Financing Uses 547,500 (547,500) 0.00% -100.00% Total Expenditures and Other Financing Uses 462,503 462,503 559,314 (96,811) 120.93% 20.93% Excess of Revenues Over (Under) Expenditures and Other Financing Uses $ 34,361 34,361 Unassigned Fund Balance at Beginning of Year 73,562 Cancellation of Prior Year Encumbrances Change in Other Fund Balance Components During the Year Year-End Investment Market Value Adjustment (18,027) Unassigned Ending Fund Balance, 06/30/22 89,896 Other Fund Balance Components: Restricted - Current Year Encumbrances Restricted - Prior Year Encumbrances Restricted - Trust Debt Service Total Fund Balance $ 89,896
PRELIMINARY
OF
Budgetary Comparison Schedule 23rd & Noland Project 4 TIF For the Period Ended June 30, 2022 55
INDEPENDENCE, MISSOURI
Actual Variance Percent Percent Budgeted Amounts Amounts with Final Actual From Original Amended (Budget Basis) Budget 100.00% of Year Budget Revenues: Taxes $ 145,470 145,470 271,091 125,621 186.36% 86.36% Investment Income (Loss) 8,000 8,000 21,907 13,907 273.84% 173.84% Other Revenue 0.00% -100.00% Total Revenues 153,470 153,470 292,998 139,528 190.92% 90.92% Expenditures: Tax Increment Financing 7,799 7,799 147,730 (139,931) 1894.22% 1794.22% Debt Service Principal 0.00% -100.00% Interest and Fiscal Agent Fees 0.00% -100.00% Debt Issuance Costs 0.00% -100.00% Total Expenditures 7,799 7,799 147,730 (139,931) 1894.22% 1794.22% Other Financing Uses: Issuance of Debt 0.00% -100.00% Reoffering Premium/Original Issue Discount 0.00% -100.00% Payment to Refund Loans Escrow Agent 0.00% -100.00% Transfers Out 0.00% -100.00% Total Other Financing Uses 0.00% -100.00% Total Expenditures and Other Financing Uses 7,799 7,799 147,730 (139,931) 1894.22% 1794.22% Excess of Revenues Over (Under) Expenditures and Other Financing Uses $ 145,671 145,671 145,268 (403) Unassigned Fund Balance at Beginning of Year 648,571 Cancellation of Prior Year Encumbrances Change in Other Fund Balance Components During the Year Year-End Investment Market Value Adjustment (25,178) Unassigned Ending Fund Balance, 06/30/22 768,661 Other Fund Balance Components: Restricted - Current Year Encumbrances Restricted - Prior Year Encumbrances Restricted - Trust Debt Service Total Fund Balance $ 768,661
PRELIMINARY
Independence Square TIF For the Period Ended June 30, 2022 56
CITY OF INDEPENDENCE, MISSOURI Budgetary
Comparison Schedule
CITY OF INDEPENDENCE, MISSOURI Budgetary Comparison Schedule
I-70 & Little Blue Parkway Project 1 TIF
For the Period Ended June 30, 2022
Actual Variance Percent Percent Budgeted Amounts Amounts with Final Actual From Original Amended (Budget Basis) Budget 100.00% of Year Budget Revenues: Taxes $ 1,152,029 1,152,029 1,431,689 279,660 124.28% 24.28% Investment Income (Loss) 1,000 1,000 24,236 23,236 2423.60% 2323.60% Other Revenue 0.00% -100.00% Total Revenues 1,153,029 1,153,029 1,455,925 302,896 126.27% 26.27% Expenditures: Tax Increment Financing 23,927 23,927 28,161 (4,234) 117.70% 17.70% Debt Service Principal 1,128,102 1,128,102 178,219 949,883 15.80% -84.20% Interest and Fiscal Agent Fees 0.00% -100.00% Debt Issuance Costs 0.00% -100.00% Total Expenditures 1,152,029 1,152,029 206,380 945,649 17.91% -82.09% Other Financing Uses: Issuance of Debt 0.00% -100.00% Reoffering Premium/Original Issue Discount 0.00% -100.00% Payment to Refund Loans Escrow Agent 0.00% -100.00% Transfers Out 1,269,000 (1,269,000) 0.00% -100.00% Total Other Financing Uses 1,269,000 (1,269,000) 0.00% -100.00% Total Expenditures and Other Financing Uses 1,152,029 1,152,029 1,475,380 (323,351) 128.07% 28.07% Excess of Revenues Over (Under) Expenditures and Other Financing Uses $ 1,000 1,000 (19,455) (20,455) Unassigned Fund Balance at Beginning of Year 258,617 Cancellation of Prior Year Encumbrances Change in Other Fund Balance Components During the Year Year-End Investment Market Value Adjustment (43,181) Unassigned Ending Fund Balance, 06/30/22 195,981 Other Fund Balance Components: Restricted - Current Year Encumbrances Restricted - Prior Year Encumbrances Restricted - Trust Debt Service Total Fund Balance $ 195,981
PRELIMINARY
57
CITY OF INDEPENDENCE, MISSOURI
Actual Variance Percent Percent Budgeted Amounts Amounts with Final Actual From Original Amended (Budget Basis) Budget 100.00% of Year Budget Revenues: Taxes $ 382,156 382,156 342,418 (39,738) 89.60% -10.40% Investment Income (Loss) 4,965 4,965 0.00% -100.00% Other Revenue 0.00% -100.00% Total Revenues 382,156 382,156 347,383 (34,773) 90.90% -9.10% Expenditures: Tax Increment Financing 382,156 382,156 6,729 375,427 1.76% -98.24% Debt Service Principal 0.00% -100.00% Interest and Fiscal Agent Fees 0.00% -100.00% Debt Issuance Costs 0.00% -100.00% Total Expenditures 382,156 382,156 6,729 375,427 1.76% -98.24% Other Financing Uses: Issuance of Debt 0.00% -100.00% Reoffering Premium/Original Issue Discount 0.00% -100.00% Payment to Refund Loans Escrow Agent 0.00% -100.00% Transfers Out 309,000 (309,000) 0.00% -100.00% Total Other Financing Uses 309,000 (309,000) 0.00% -100.00% Total Expenditures and Other Financing Uses 382,156 382,156 315,729 66,427 82.62% -17.38% Excess of Revenues Over (Under) Expenditures and Other Financing Uses $ 31,654 31,654 Unassigned Fund Balance at Beginning of Year 107,526 Cancellation of Prior Year Encumbrances Change in Other Fund Balance Components During the Year Year-End Investment Market Value Adjustment (13,769) Unassigned Ending Fund Balance, 06/30/22 125,411 Other Fund Balance Components: Restricted - Current Year Encumbrances Restricted - Prior Year Encumbrances Restricted - Trust Debt Service Total Fund Balance $ 125,411
PRELIMINARY
Comparison Schedule
& Little Blue Parkway Project 3 TIF
the Period Ended June 30, 2022 58
Budgetary
I-70
For
CITY
MISSOURI
PRELIMINARY
Actual Variance Percent Percent Budgeted Amounts Amounts with Final Actual From Original Amended (Budget Basis) Budget 100.00% of Year Budget Revenues: Taxes $ 97,731 97,731 155,126 57,395 158.73% 58.73% Investment Income (Loss) 22 22 0.00% -100.00% Other Revenue 0.00% -100.00% Total Revenues 97,731 97,731 155,148 57,417 158.75% 58.75% Expenditures: Tax Increment Financing 3,949 3,949 2,878 1,071 72.88% -27.12% Debt Service Principal 93,782 93,782 93,782 0.00% -100.00% Interest and Fiscal Agent Fees 122,950 (122,950) 0.00% -100.00% Debt Issuance Costs 0.00% -100.00% Total Expenditures 97,731 97,731 125,828 (28,097) 128.75% 28.75% Other Financing Uses: Issuance of Debt 0.00% -100.00% Reoffering Premium/Original Issue Discount 0.00% -100.00% Payment to Refund Loans Escrow Agent 0.00% -100.00% Transfers Out 0.00% -100.00% Total Other Financing Uses 0.00% -100.00% Total Expenditures and Other Financing Uses 97,731 97,731 125,828 (28,097) 128.75% 28.75% Excess of Revenues Over (Under) Expenditures and Other Financing Uses $ 29,320 29,320 Unassigned Fund Balance at Beginning of Year 62,802 Cancellation of Prior Year Encumbrances Change in Other Fund Balance Components During the Year Unassigned Ending Fund Balance, 06/30/22 92,122 Other Fund Balance Components: Restricted - Current Year Encumbrances Restricted - Prior Year Encumbrances Restricted - Trust Debt Service Total Fund Balance $ 92,122
TIF
59
OF INDEPENDENCE,
Budgetary Comparison Schedule Marketplace Project 1
For the Period Ended June 30, 2022
CITY OF INDEPENDENCE, MISSOURI Budgetary Comparison Schedule
Marketplace Project 2 TIF For the Period Ended June 30, 2022
PRELIMINARY
Actual Variance Percent Percent Budgeted Amounts Amounts with Final Actual From Original Amended (Budget Basis) Budget 100.00% of Year Budget Revenues: Taxes $ 35,447 35,447 135,258 99,811 381.58% 281.58% Investment Income (Loss) 25 25 0.00% -100.00% Other Revenue 0.00% -100.00% Total Revenues 35,447 35,447 135,283 99,836 381.65% 281.65% Expenditures: Tax Increment Financing 35,447 35,447 3,055 32,392 8.62% -91.38% Debt Service Principal 0.00% -100.00% Interest and Fiscal Agent Fees 134,000 (134,000) 0.00% -100.00% Debt Issuance Costs 0.00% -100.00% Total Expenditures 35,447 35,447 137,055 (101,608) 386.65% 286.65% Other Financing Uses: Issuance of Debt 0.00% -100.00% Reoffering Premium/Original Issue Discount 0.00% -100.00% Payment to Refund Loans Escrow Agent 0.00% -100.00% Transfers Out 0.00% -100.00% Total Other Financing Uses 0.00% -100.00% Total Expenditures and Other Financing Uses 35,447 35,447 137,055 (101,608) 386.65% 286.65% Excess of Revenues Over (Under) Expenditures and Other Financing Uses $ (1,772) (1,772) Unassigned Fund Balance at Beginning of Year 34,445 Cancellation of Prior Year Encumbrances Change in Other Fund Balance Components During the Year Unassigned Ending Fund Balance, 06/30/22 32,673 Other Fund Balance Components: Restricted - Current Year Encumbrances Restricted - Prior Year Encumbrances Restricted - Trust Debt Service Total Fund Balance $ 32,673
60
Actual Variance Percent Percent Budgeted Amounts Amounts with Final Actual From Original Amended (Budget Basis) Budget 100.00% of Year Budget Revenues: Taxes $ 0.00% -100.00% Investment Income (Loss) 0.00% -100.00% Other Revenue 0.00% -100.00% Total Revenues 0.00% -100.00% Expenditures: Tax Increment Financing 0.00% -100.00% Debt Service Principal 0.00% -100.00% Interest and Fiscal Agent Fees 0.00% -100.00% Debt Issuance Costs 0.00% -100.00% Total Expenditures 0.00% -100.00% Other Financing Uses: Issuance of Debt 0.00% -100.00% Reoffering Premium/Original Issue Discount 0.00% -100.00% Payment to Refund Loans Escrow Agent 0.00% -100.00% Transfers Out 0.00% -100.00% Total Other Financing Uses 0.00% -100.00% Total Expenditures and Other Financing Uses 0.00% -100.00% Excess of Revenues Over (Under) Expenditures and Other Financing Uses $ Unassigned Fund Balance at Beginning of Year Cancellation of Prior Year Encumbrances Change in Other Fund Balance Components During the Year Unassigned Ending Fund Balance, 06/30/22 Other Fund Balance Components: Restricted - Current Year Encumbrances Restricted - Prior Year Encumbrances Restricted - Trust Debt Service Total Fund Balance $
OF INDEPENDENCE, MISSOURI Budgetary Comparison Schedule TIF Application Fees For the Period Ended June 30, 2022 61
PRELIMINARY
CITY
CITY OF INDEPENDENCE, MISSOURI
Budgetary Comparison Schedule
TIF Supplemental Appropriation Fund
For the Period Ended June 30, 2022
Actual Variance Percent Percent Budgeted Amounts Amounts with Final Actual From Original Amended (Budget Basis) Budget 100.00% of Year Budget Revenues: Taxes $ Property tax RSO - Cargo Largo 3,455 3,455 0.00% -100.00% Drumm Farm 54,968 54,968 0.00% -100.00% Sales tax RSO - Cargo Largo 205,504 205,504 0.00% -100.00% Drumm Farm 52,703 52,703 0.00% -100.00% Mt Washington 13,177 Investment Income (Loss) 4,829 4,829 0.00% -100.00% Other Revenue 0.00% -100.00% Total Revenues 334,636 321,459 0.00% -100.00% Expenditures: Tax Increment Financing 0.00% -100.00% Debt Service Principal 0.00% -100.00% Interest and Fiscal Agent Fees 0.00% -100.00% Debt Issuance Costs 0.00% -100.00% Total Expenditures 0.00% -100.00% Other Financing Uses: Issuance of Debt 0.00% -100.00% Reoffering Premium/Original Issue Discount 0.00% -100.00% Payment to Refund Loans Escrow Agent 0.00% -100.00% Transfers Out 0.00% -100.00% Total Other Financing Uses 0.00% -100.00% Total Expenditures and Other Financing Uses 0.00% -100.00% Excess of Revenues Over (Under) Expenditures and Other Financing Uses $ 334,636 334,636 Unassigned Fund Balance at Beginning of Year Cancellation of Prior Year Encumbrances Change in Other Fund Balance Components During the Year Unassigned Ending Fund Balance, 06/30/22 334,636 Other Fund Balance Components: Restricted - Current Year Encumbrances Restricted - Prior Year Encumbrances Restricted - Trust Debt Service Total Fund Balance $ 334,636
PRELIMINARY
62
TRAVEL REPORT City of Independence, Missouri
ACCOUNT DESCRIPTION 2022 BUDGET 2022 ACTUAL VARIANCE % USED 4002 City Council 1,000 523 477 52.30 4004 Mayors Office 10,000 3,707 6,293 37.10 4012 City Clerk 3,000 3,695 -695 123.20 4021 City Manager 3,500 11,806 -8,306 337.30 4022 Communications 0 848 -848 100.00 4090 Municipal Court 3,500 3,129 371 89.40 4100 Law 2,065 0 2,065 0.00 4201 Finance Administration 4,250 7,674 -3,424 180.60 4205 City Memberships 1,000 0 1,000 0.00 4220 Technology Services 0 1,243 -1,243 100.00 4230 Human Resources 1,000 276 724 27.60 4401 Community Development Adm 200 0 200 0.00 4420 CD Historic Preservation 500 0 500 0.00 4431 CD Building Inspection 200 0 200 0.00 4513 PD Training & Equipment 108,313 114,029 -5,716 105.30 4538 PD Drug Abuse Resistance 0 3,301 -3,301 100.00 4544 PD Records 0 1,437 -1,437 100.00 4611 Fire Administration 0 -254 254 100.00 4621 FD Operations 0 353 -353 100.00 4631 FD Fire Prevention 0 394 -394 100.00 4651 FD Training & Professiona 0 244 -244 100.00 4661 FD Emergency Preparedness 0 335 -335 100.00 5001 Public Works Administrati 5,000 1,772 3,228 35.40 5011 Public Works Engineering 7,800 2,137 5,663 27.40 5111 Public Works Street Maint 3,000 2,554 446 85.10 002 General Fund 154,328 159,204 -4,876 103.20 6061 Tourism Marketing 6,000 -1,167 7,167 -19.40 6064 Tourism Sales & Services 3,500 489 3,011 14.00 004 Tourism Fund 9,500 -678 10,178 -7.10 4705 Animal Shelter - Property 500 0 500 0.00 4745 Health Services - Propert 1,500 0 1,500 0.00 005 Health Property Tax Levy 2,000 0 2,000 0.00 6601 CDBG Administration 2,000 0 2,000 0.00 008 Community Dev Block Grant 2,000 0 2,000 0.00 6041 Parks Maint Security & In 0 661 -661 100.00 6043 Parks Palmer Senior Adult 100 0 100 0.00 012 Parks Improv Sales Tax Fun 100 661 -561 661.30 5262 Storm Water Tax Maintenan 1,000 1,278 -278 127.80 013 Storm Water Sales Tax Fund 1,000 1,278 -278 127.80 4150 Law Grants 5,000 0 5,000 0.00 4550 Police Dept Grants 18,025 5,462 12,563 30.30
Budget
Actual
Vs.
YTD June 2022
ACCOUNT DESCRIPTION 2022 BUDGET 2022 ACTUAL VARIANCE % USED TRAVEL REPORT City of Independence, Missouri Budget Vs. Actual YTD June 2022 4755 Health Services - Grants 40,396 5,710 34,686 14.10 015 Grant Fund 63,421 11,172 52,249 17.60 4671 Fire Sales Tax 0 7,139 -7,139 100.00 017 Fire Protection Sales Tax 0 7,139 -7,139 100.00 6110 IPL Administration 30,000 6,248 23,752 20.80 6111 Environmental Health & Sa 6,000 0 6,000 0.00 6112 Finance Accounting 6,000 0 6,000 0.00 6122 IPL Warehouse & Stores 6,000 0 6,000 0.00 6123 IPL Vehicle Maintenance 5,000 91 4,909 1.80 6126 IPL Meter Reading 600 0 600 0.00 6130 IPL Support Services 6,000 1,952 4,048 32.50 6140 IPL Production 5,000 0 5,000 0.00 6150 IPL Transmission & Distri 6,500 4,257 2,243 65.50 6160 IPL Engineering 31,300 2,111 29,189 6.70 6170 IPL System Operations 47,000 9,320 37,680 19.80 6175 IPL Communications 23,500 0 23,500 0.00 6180 Security NERC Compliance 20,603 1,068 19,535 5.20 6520 IPL Non Departmental 0 350 -350 100.00 020 Power and Light Fund 193,503 25,398 168,105 13.10 5201 WPC Administration 16,900 1,058 15,842 6.30 5215 WPC Facilities 6,500 3,647 2,853 56.10 5220 WPC Treatment Facilities 5,300 1,441 3,859 27.20 5230 WPC Collection System Mai 7,000 404 6,596 5.80 5240 WPC Environmental Service 7,400 4,267 3,133 57.70 6530 WPC Non Departmental 0 350 -350 100.00 030 Sanitary Sewer Fund 43,100 11,167 31,933 25.90 4810 Water Administration 4,500 1,427 3,073 31.70 4822 Water Customer Service 9,000 2,255 6,745 25.10 4830 Water Production 5,500 3,139 2,361 57.10 4840 Water Transmission & Dist 2,000 1,602 398 80.10 6540 Water Non Departmental 0 350 -350 100.00 040 Water Fund 21,000 8,773 12,227 41.80 5121 Public Works Fleet Manage 1,800 1,835 -35 101.90 090 Central Garage Fund 1,800 1,835 -35 101.90 Grand Total 491,752 225,949 265,803 45.90
City of Independence, Missouri American Recovery Plan Funding
As of June 30, 2022
Costs to respond to the public health emergency with respect to the COVID-19 negative economic impacts
The provision of government services to the extent of the reduction in revenue of the entity due to th COVID-19 public health emergency relative to revenues collected in the most recent full fiscal year
Department Line ITEM GL Account Original Approved Spending Plan Modified Spending PlanApproved 9/20/21 July 1,2021 July1,2022 Total Estimated Amount to be Received Total Actual Expenditures as of 6/30/22 Total Estimated Available of 06/30/22 1 Reduce Blight in commerial coridors, entryways and neighborhoods a Abandoned Vehicle enforcement program Comm Dev 1a 160,000 $ b Illegal dumping mitigation (cameras, LPR) Animal, Police, Water 1b 0614710-5405, 0614511-5405 250,000 $ 250,000 $ 150,000 $ 100,000 $ 250,000 $ 1,310 $ 248,690 $ c ROW trash removal Mun Srvs 1c 0615111-5226 800,000 $ 700,000 $ 207,962 $ 492,038 $ 700,000 $ - $ 700,000 $ d Dangerous Building Program Comm Dev 1d 0614401-5226 820,000 $ 820,000 $ 200,000 $ 620,000 $ 820,000 $ 61,160 $ 758,840 $ 2 Improve visual appearance of major commercial corridors & historic sites a Highway 24 enhancements (Phase I, II, Fairmount) Mun Srvs 2a 0615001-5406 2,400,000 $ 2,400,000 $ - $ 2,400,000 $ 2,400,000 $ - $ 2,400,000 $ b Square Streetscaping Mun Srvs 2b 0615001-5406 1,435,000 $ 150,000 $ 1,285,000 $ 1,435,000 $ - $ 1,435,000 $ 3 Improve public infrastructure and facilities a Park Infrastructure/Maintenance Park & Rec 3a 061-6600-012 2,134,500 $ 1,617,285 $ 1,617,285 $ - $ 1,617,285 $ 1,617,285 $ - $ 4 Stablize and revitalize neighborhoods a Housing Study Comm Dev 4a 0614401-5226 90,000 $ 90,000 $ 90,000 $ - $ 90,000 $ 61,000 $ 29,000 $ b Sidewalk installation and replacement (sidewalks to schools, connectivity) Mun Srvces 4b 249,500 $ c CDB 5-Year Consolidated Plan and Analysis of Impediments to Fair Housing Comm Dev 4c 0614401-5226 - $ 20,000 $ 20,000 $ - $ 20,000 $ 18,215 $ 1,785 $ 5 Reduce crime and disorder a Police Hiring Incentive Police 5a 0614511-5100:5115 600,000 $ 315,000 $ 315,000 $ - $ 315,000 $ 18,600 $ 296,400 $ b Ballistic Helmets & Protective Equipment Police 5b 0614511-5313 100,715 $ 100,715 $ 100,715 $ - $ 100,715 $ 100,715 $ - $ c Shot Spotter Pilot Police 5c 0614511-5313 820,000 $ - $ - $ - $ d Police Officer Retention Payment Police 5d 0614511-5100/5110 - $ 1,475,000 $ 1,475,000 $ - $ 1,475,000 $ 1,438,614 $ 36,386 $ e 10.18.21 Council Amended - Sniper Rifles Police 5e 0614511-5313 33,612 $ 33,612 $ - $ 33,612 $ 25,009 $ 8,603 $ f 10.18.21 Council Amended - K-9 Police 5f 0614511-5313 14,000 $ 14,000 $ - $ 14,000 $ 14,000 $ - $ g 10.18.21 Council Amended - Detention Unit Cameras Police 5g 0614511-5313 74,720 $ 74,720 $ - $ 74,720 $ 58,120 $ 16,600 $ h 10.18.21 Council Amended - Radio Tower Camera System Police 5h 0614511-5313 33,980 $ 33,980 $ - $ 33,980 $ 29,014 $ 4,966 $ 6 Enhance Public Health a Public Health Capital Improvements Health Levy 6a b Costs Associated with Start-Up of Health Department Health Levy 6b 061-6600-005 600,000 $ 600,000 $ 300,000 $ 300,000 $ 600,000 $ 300,000 $ 300,000 $ c First Year Grant writer for emergency service grants Fire 6c 0614611-5100 85,000 $ 85,000 $ 35,000 $ 50,000 $ 85,000 $ 28,031 $ 56,969 $ d Co-Responder Pilot Program Health Levy 6d 0614611-5100:5115 - $ 120,000 $ 60,000 $ 60,000 $ 120,000 $ 11,436 $ 108,564 $ e 10.18.21 Council-Fire for one time replacment of current aerial apparatus Fire 6e 0614611-5404 - $ 193,769 $ 193,769 $ - $ 193,769 $ 193,769 $ - $ 7 Attract and retain quality employers a Transit Subsidy Comm Dev 7a 750,000 $ b Job Training Program Comm Dev 7b 310,000 $ 8 Improve long-range financial planning and decision-making a Negative Impact to Staywell Fund HR 8a 061-6600-091 1,850,000 $ 1,850,000 $ 850,000 $ 1,000,000 $ 1,850,000 $ 850,000 $ 1,000,000 $ b Pay Off General Fund Loan to Electric Fund Comm Dev 8b 56,000 $ - $ - $ - $ c Multi-Year Employee Health Subsidy HR 8c 061-6600-091 4,400,000 $ 4,400,000 $ 1,500,000 $ 2,900,000 $ 4,400,000 $ 1,500,000 $ 2,900,000 $ 9 Communicate more effectively internally & externally a Phone System Upgrade Tech Service 9a 0614220-5402 333,000 $ 400,000 $ 50,000 $ 350,000 $ 400,000 $ - $ 400,000 $ b City Hall Security and Citizen Interaction Improvements MS 9b 0614021-5226 94,285 $ 24,919 $ 24,919 $ - $ 24,919 $ 23,560 $ 1,359 $ *Council 10.18.21 Res 6739 reallocate $350,080.60 to the following: Police for one time equip: Sniper Rifles 33,611.70; K-9 14,000; Detention Unit Cameras 74,720; Radio Tower Camera System 33,980 c Replace Content Management System City Mgr 9c 0614022-5402 125,000 $ 125,000 $ 125,000 $ - $ 125,000 $ - $ 125,000 $ 15 Optimize Resources a Loss of Revenue in General Fund Fin & Admin 15a 061-6600 3,122,000 $ 3,122,000 $ 3,122,000 $ - $ 3,122,000 $ 3,122,000 $ - $ b Loss of Revenue in Tourism Fund Tourism 15b 150,000 $ 20,300,000 $ 20,300,000 $ 10,742,962 $ 9,557,038 $ 20,300,000 $ 9,471,837 $ 10,828,163 $
Distribution Cash Flow Spending Plan
