CITY OF FORNEY, TEXAS
ANNUAL COMPREHENSIVE FINANCIAL REPORT
FISCAL YEAR ENDED SEPTEMBER 30, 2022
Prepared by: Deborah Woodham Director of Finance
ANNUAL COMPREHENSIVE FINANCIAL REPORT SEPTEMBER 30, 2022 TABLE OF CONTENTS Page Number INTRODUCTORY SECTION Letter of Transmittal ........................................................................................................... i – iii GFOA Certificate of Achievement iv Organization Chart .............................................................................................................. v Elected Offices and Administrative Officials .............................................................................. vi FINANCIAL SECTION Independent Auditor’s Report ............................................................................................... 1 – 3 Management’s Discussion and Analysis 4 – 11 Basic Financial Statements Government-wide Financial Statements Statement of Net Position .................................................................................................... 12 Statement of Activities ........................................................................................................ 13 – 14 Fund Financial Statements Balance Sheet – Governmental Funds ................................................................................... 15 – 16 Reconciliation of the Balance Sheet of Governmental Funds to the Statement of Net Position 17 Statement of Revenues, Expenditures and Changes in Fund Balances – Governmental Funds ................................................................................ 18 – 19 Reconciliation of the Statement of Revenues, Expenditures and Changes in Fund Balances of Governmental Funds to the Statement of Activities ..................................................................................................... 20 Proprietary Fund Financial Statements Statement of Net Position – Proprietary Funds 21 Statement of Revenues, Expenses and Changes in Net Position – Proprietary Funds ........................................................................................ 22 Statement of Cash Flows – Proprietary Funds 23 Notes to Financial Statements .............................................................................................. 24 – 49
CITY OF FORNEY, TEXAS
Required Supplementary Information Schedule of Revenues, Expenditures, and Changes in Fund Balance Budget and Actual – General Fund .................................................................... 50 Schedule of Revenues, Expenditures and Changes in Fund Balance – Budget and Actual – Roadway Impact Funds 51 Schedule of Change in Net Pension Liability and Related Ratios ................................................ 52 – 53 Schedule of Contributions 54 – 55 Schedule of Changes in Total OPEB Liability and Related Ratios –Texas Municipal Retirement System –Supplemental Death Benefit Funds..................................................................................... 56 – 57 Combining and Individual Fund Statements and Schedules Nonmajor Governmental Funds Combining Balance Sheet 58 Combining Statement of Revenues, Expenditures and Changes in Fund Balances ................................................................................................. 59 Combining Statement of Revenues, Expenditures and Changes in Fund Balances – Debt Service Funds 60 Schedule of Revenues, Expenditures and Changes in Fund Balance – Budget and Actual – Capital Projects Fund .................................................... 61 Schedule of Revenues, Expenditures and Changes in Fund Balance – Budget and Actual – Hotel/Motel Fund 62 Table STATISTICAL SECTION (Unaudited) Net Position by Component ........................................................................ 1 63 – 64 Changes in Net Position ............................................................................. 2 65 – 68 Governmental Activities Tax Revenues by Source 3 69 Fund Balances of Governmental Funds ........................................................ 4 70 – 71 Changes in Fund Balances of Governmental Funds 5 72 – 73 Assessed Value and Estimated Actual Value of Taxable Property ................................................................................ 6 74 – 75 Direct and Overlapping Property Tax Rates 7 76 Principal Taxpayers ................................................................................... 8 77 – 78 Property Tax Levies and Collections ............................................................ 9 79 Ratios of Outstanding Debt by Type 10 80 – 81 Ratios of General Bonded Debt Outstanding ................................................. 11 82 Direct and Overlapping Governmental Activities Debt 12 83
Legal Debt Margin Information 13 84 Demographic and Economic Statistics.......................................................... 14 85 Principal Employers ................................................................................... 15 86 Fulltime Equivalent City Government Employees by Function/Program .............................................................................. 16 87 – 88 Operating Indicators by Function/Program ................................................... 17 89 – 90 Capital Asset Statistics by Function/Program 18 91 – 92 COMPLIANCE SECTION Independent Auditor’s Report on Internal Control over Financial Reporting and on Compliance and Other Matters Based on an Audit of Financial Statements Performed in Accordance with Government Auditing Standards................................................................. 93 – 94 Schedule of Findings and Responses 95
THIS PAGE LEFT BLANK INTENTIONALLY
INTRODUCTORY SECTION
THIS PAGE LEFT BLANK INTENTIONALLY
February 17, 2023
Honorable Mayor and City Council City of Forney Forney, Texas
Dear Mayor and Council Members,
The Annual Comprehensive Financial Report (“ACFR”) of the City of Forney, Texas, for the year ended September 30, 2022, is submitted herewith.
Management assumes full responsibility for the completeness and reliability of the information contained in this report, based upon a comprehensive framework of internal control that is established for this purpose. Because the cost of internal control should not exceed anticipated benefits, the objective is to provide reasonable, rather than absolute, assurance that the financial statements are free of any material misstatements.
Pattillo, Brown & Hill, LLP., have issued an unqualified (“clean”) opinion on the City of Forney’s financial statements for the year ended September 30, 2022. The independent auditor’s report is in the beginning of the financial section of the ACFR.
This letter of transmittal is designed to complement Management’s Discussion and Analysis (“MD&A”) and should be read in conjunction with it. The City’s MD&A can be found immediately following the independent auditors’ report and provides a narrative introduction, overview, and analysis of the basic financial statements.
General Information – City of Forney
The City of Forney (“City”) was incorporated in 1910 and currently has an estimated population of 27,040 The City operates as a Home Rule City, under a Council-Manager form of government with the Mayor and six Council members elected at large.
The City’s major operations include police and fire protection, planning, building inspections, finance, parks and recreation, public works, and general administrative services. In addition, the City owns and operates a water and sewer system.
Economic Conditions and Outlook
Forney, Texas is one of the fastest growing communities in the DFW area. Strategically located between Highway 80 and Interstate 20, population has increased 70% in the last decade. Despite the increasing population, the City has managed to maintain a vibrant, family-centered lifestyle and community leaders carefully weigh growth opportunities against quality-of-life issues and sustainability. The City continues to work with developers to expand and diversify available retail opportunities with the Forney Marketplace and Gateway developments.
C I T Y O F F O R N E Y 101 E. Main Street. P.O. Box 826 Forney, Texas 75126 972.564.7300 forneytx.gov i
Economic conditions continue to present challenges in budget development and forecasting. However, moderate growth continues in several key indicators. Sales tax continues to trend upward and ended the year with a 23.56% increase over the previous year’s collections. New construction remains very active. These factors coupled with planned projects scheduled to begin soon, cause us to remain optimistic regarding Forney’s future opportunities.
Major Initiatives
Major initiatives for 2022 focused on reconstructing or repairing streets, improving parks and recreation opportunities, and expanding City office space and parking for additional personnel Additionally, sewer infrastructure was expanded to encourage commercial growth.
Accounting Procedures and Budgetary Controls
The City’s accounting records for general government are maintained on a modified accrual basis, with revenues being recorded when available and measurable, and expenditures being recorded when the services or goods are received, and the liabilities are incurred. Accounting records for the City’s water and sewer utility and other proprietary activities are maintained on the accrual basis.
The budgetary process begins each year with the preparation of both current and proposed year revenue estimates by the City Manager’s Office, and expenditure estimates by each City department. Budgets are reviewed by the City Manager who makes final decisions and submits a recommended budget to the City Council.
As part of each year’s budget development process, departments are required to update expenditure estimates for the current fiscal year. These estimates are reviewed by the City Manager’s Office and the City Council concurrent with review of the proposed budget. The re-estimated budget may require a supplemental appropriation and, if so, such supplemental appropriation is approved by ordinance adopted by the City Council prior to the end of the current fiscal year.
To stay within budget, the Budget Analyst reviews expenses weekly and provides each department director their departments expense report. Each department director reviews their report and directs any questions to the Budget Analyst for further review. The Budget Analyst also provides the City Manager’s Office and City Council with a monthly summary budget report.
C I T Y O F F O R N E Y 101 E. Main Street. P.O. Box 826 Forney, Texas 75126 972.564.7300 forneytx.gov ii
General Government Functions
Tax Rates: All eligible property within the City is subject to assessment, levy, and collection by the City of a continuing, direct ad valorem tax sufficient to provide for the payment of principal and interest on outstanding bonds within the limits prescribed by law, and the payment of operation and maintenance costs as approved by the City Council. The City’s tax rate history as adopted by the City Council is shown below:
Other Information
Certificate of Achievement for Excellence in Financial Reporting
The Government Finance Officers Association of the United States and Canada (“GFOA”) awarded Certificate of Achievement for Excellence in Financial Reporting to the City of Forney for its annual comprehensive financial report for the fiscal year ended September 30, 2021. To be awarded a Certificate of Achievement, a government must publish an easily readable and efficiently organized annual comprehensive financial report. This report must satisfy both generally accepted accounting principles and applicable legal requirements.
A Certificate of Achievement is valid for a period of one year only. We believe that our current annual comprehensive financial report continues to meet the Certificate of Achievement Program’s requirements and we are submitting it the GFOA to determine eligibility of another certificate.
Acknowledgements
Many persons are responsible for the preparation of this report, and for the maintenance of records upon which it is based. Appreciation is expressed to the City employees throughout the organization, especially those employees of the Finance Department who were instrumental in the successful completion of this report.
Our appreciation is also extended to the Mayor and City Council for providing the resources necessary to maintain the integrity of the City’s financial affairs.
Respectfully submitted,
 Deborah Woodham Director of Finance
C I T Y O F F O R N E Y 101 E. Main Street. P.O. Box 826 Forney, Texas 75126 972.564.7300 forneytx.gov iii
Fiscal Year Tax Rate 2018-2019 0.621111 2019-2020 0.580000 2020-2021 0.538710 2021-2022 0.501069
Presented to City of Forney Texas
For its Annual Comprehensive Financial Report for the Fiscal Year Ended

September 30, 2021

iv
Government Finance Officers Association
Certificate of Achievement for Excellence in Financial Reporting
Citizens of Forney
City Council
Municipal Judge City Attorney City Secretary City Manager
Assistant City Manager
Community Development
Information Technology Public Works
Parks & Recreation Engineering
Police Fire Communications Finance
Human Resources
Streets
Planning
Building Inspections
Neighborhood Services
Water Sewer
Facilities
Fleet
Municipal Court
Utility Billing


v
CITY OF FORNEY, TEXAS
ANNUAL COMPREHENSIVE FINANCIAL REPORT
FOR THE FISCAL YEAR ENDED SEPTEMBER 30, 2022
List of Principal Officials
Amanda Lewis MAYOR CITY COUNCIL
James Traylor Place 1
Cecil Chambers Place 2
Cassandra Primous Place 3
Sarah Salgado Place 4
Zahnd Schlensker Place 5
Jason Roberson Place 6
vi
Charles Daniels CITY MANAGER
Deborah Woodham DIRECTOR OF FINANCE
FINANCIAL SECTION
THIS PAGE LEFT BLANK INTENTIONALLY
Honorable Mayor and Members of the City Council City of Forney, Texas
Report on the Audit of the Financial Statements
Opinions
We have audited the accompanying financial statements of the governmental activities, the businesstype activities, the discretely presented component unit, each major fund, and the aggregate remaining fund information of the City of Forney, Texas (the “City) as of and for the year ended September 30, 2022, and the related notes to the financial statements, which collectively comprise the City’s basic financial statements as listed in the table of contents.
In our opinion, the accompanying financial statements present fairly, in all material respects, the respective financial position of the governmental activities, the business-type activities, the discretely presented component unit, each major fund, and the aggregate remaining fund information of the City of Forney, Texas, as of September 30, 2022, and the respective changes in financial position, and, where applicable, cash flows thereof, for the year then ended in accordance with accounting principles generally accepted in the United States of America.
Basis for Opinions
We conducted our audit in accordance with auditing standards generally accepted in the United States of America (GAAS) and the standards applicable to financial audits contained in Government Auditing Standards, issued by the Comptroller General of the United States. Our responsibilities under those standards are further described in the Auditor’s Responsibilities for the Audit of the Financial Statements section of our report. We are required to be independent of the City and to meet our other ethical responsibilities, in accordance with the relevant ethical requirements relating to our audit. We believe that the audit evidence we have obtained is sufficient and appropriate to provide a basis for our audit opinions.
Responsibilities of Management for the Financial Statements
Management is responsible for the preparation and fair presentation of the financial statements in accordance with accounting principles generally accepted in the United States of America, and for the design, implementation, and maintenance of internal control relevant to the preparation and fair presentation of financial statements that are free from material misstatement, whether due to fraud or error.
In preparing the financial statements, management is required to evaluate whether there are conditions or events, considered in the aggregate, that raise substantial doubt about the City’s ability to continue as a going concern for twelve months beyond the financial statement due date, including any currently know information that may raise substantial doubt shortly thereafter.
INDEPENDENT
AUDITOR’S REPORT
1
Auditor’s Responsibilities for the Audit of the Financial Statements
Our objectives are to obtain reasonable assurance about whether the financial statements as a whole are free from material misstatement, whether due to fraud or error, and to issue an auditor’s report that includes our opinions. Reasonable assurance is a high level of assurance but is not absolute assurance and therefore is not a guarantee that an audit conducted in accordance with GAAS and Government Auditing Standards will always detect a material misstatement when it exists. The risk of not detecting a material misstatement resulting from fraud is higher than for one resulting from error, as fraud may involve collusion, forgery, intentional omissions, misrepresentations, or the override of internal control. Misstatements are considered material if there is a substantial likelihood that, individually or in the aggregate, they would influence the judgment made by a reasonable user based on the financial statements.
In performing an audit in accordance with GAAS and Government Auditing Standards, we:
• Exercise professional judgment and maintain professional skepticism throughout the audit.
• Identify and assess the risks of material misstatement of the financial statements, whether due to fraud or error, and design and perform audit procedures responsive to those risks. Such procedures include examining, on a test basis, evidence regarding the amounts and disclosures in the financial statements.
• Obtain an understanding of internal control relevant to the audit in order to design audit procedures that are appropriate in the circumstances, but not for the purpose of expressing an opinion on the effectiveness of the City’s internal control. Accordingly, no such opinion is expressed.
• Evaluate the appropriateness of accounting policies used and the reasonableness of significant accounting estimates made by management, as well as evaluate the overall presentation of the financial statements.
• Conclude whether, in our judgment, there are conditions or events, considered in the aggregate, that raise substantial doubt about the City’s ability to continue as a going concern for a reasonable period of time.
We are required to communicate with those charged with governance regarding, among other matters, the planned scope and timing of the audit, significant audit findings, and certain internal control–related matters that we identified during the audit.
Required Supplementary Information
Accounting principles generally accepted in the United States of America require that the management’s discussion and analysis, budgetary comparison information, and pension and OPEB information be presented to supplement the basic financial statements. Such information, although not a part of the basic financial statements, is required by the Governmental Accounting Standards Board who considers it to be an essential part of financial reporting for placing the basic financial statements in an appropriate operational, economic, or historical context. We have applied certain limited procedures to the required supplementary information in accordance with auditing standards generally accepted in the United States of America, which consisted of inquiries of management about the methods of preparing the information and comparing the information for consistency with management’s responses to our inquiries, the basic financial statements, and other knowledge we obtained during our audit of the basic financial statements. We do not express an opinion or provide any assurance on the information because the limited procedures do not provide us with sufficient evidence to express an opinion or provide any assurance
2
Supplementary Information

Our audit was conducted for the purpose of forming opinions on the financial statements that collectively comprise the City’s basic financial statements. The combining and individual nonmajor fund financial statements and schedules are presented for purposes of additional analysis and are not a required part of the basic financial statements. Such information is the responsibility of management and was derived from and relates directly to the underlying accounting and other records used to prepare the basic financial statements. Such information has been subjected to the auditing procedures applied in the audit of the basic financial statements and certain additional procedures, including comparing and reconciling such information directly to the underlying accounting and other records used to prepare the basic financial statements or to the basic financial statements themselves, and other additional procedures in accordance with auditing standards generally accepted in the United States of America. In our opinion, the combining and individual nonmajor fund financial statements and schedules are fairly stated, in all material respects, in relation to the basic financial statements as a whole.
Other Information
Management is responsible for the other information included in the annual comprehensive financial report (ACFR). The other information comprises the introductory section and statistical section, but does not include the financial statements and our auditor's report thereon. Our opinions on the financial statements do not cover the other information, and we do not express an opinion or any form of assurance thereon. In connection with our audit of the financial statements, our responsibility is to read the other information and consider whether a material inconsistency exists between the other information and the financial statements, or the other information otherwise appears to be materially misstated. If, based on the work performed, we conclude that an uncorrected material misstatement of the other information exists, we are required to describe it in our report.
Other Reporting Required by Government Auditing Standards
In accordance with Government Auditing Standards, we have also issued our report dated February 17, 2023, on our consideration of the City’s internal control over financial reporting and on our tests of its compliance with certain provisions of laws, regulations, contracts, and grant agreements and other matters. The purpose of that report is solely to describe the scope of our testing of internal control over financial reporting and compliance and the results of that testing, and not to provide an opinion on the effectiveness of internal control over financial reporting or on compliance. That report is an integral part of an audit performed in accordance with Government Auditing Standards in considering the City’s internal control over financial reporting and compliance.
Waco, Texas
February 17, 2023
3
THIS PAGE LEFT BLANK INTENTIONALLY
MANAGEMENT’S DISCUSSION AND ANALYSIS
THIS PAGE LEFT BLANK INTENTIONALLY
Management’s Discussion and Analysis
As management of the City of Forney (the “City”), we offer readers of the City’s financial statements this narrative overview and analysis of the financial activities of the City for the fiscal year ended September 30, 2022 We encourage readers to read the information presented here in conjunction with additional information that we have furnished in the City’s financial statements, which follow this narrative.
FINANCIAL HIGHLIGHTS
• The assets and deferred outflows of resources of the City exceeded its liabilities and deferred inflows of resources at the close of the most recent fiscal year by $207,382,122 (net position). Of this amount, $32,676,832 (unrestricted net position) may be used to meet the City’s ongoing obligations to citizens and creditors.
• The City’s total net position increased by $70,517,951 The increase from operations was due to an increase in governmental activities net position largely due to an increase in property tax revenue, sales tax revenue, and capital contributions as well as a prior period adjustment to record developer contributions from prior years. The increase in business-type activities net position was due to an increase in capital contributions and a prior period adjustment to record developer contributions from prior years.
• At the end of the current fiscal year, the City’s governmental funds reported combined fund balances of $43,799,692, an increase of $236,801 or 1%, in comparison with the prior year. The majority of this increase is due to an increase in impact fee revenue generated by high levels of development in the area
• The City’s total bonded debt decreased by $6,895,000, or 20%, during the current fiscal year due to current year debt service payments.
OVERVIEW OF THE FINANCIAL STATEMENTS
This discussion and analysis is intended to serve as an introduction to the City’s basic financial statements. The City’s basic financial statements comprise three components: 1) government-wide financial statements, 2) fund financial statements, and 3) notes to the financial statements. The basic financial statements present two different views of the City through the use of government-wide statements and fund financial statements. This report also contains other supplementary information in addition to the basic financial statements themselves.
Basic Financial Statements
The first two statements in the basic financial statements are the government-wide financial statements. They provide both short and long-term information about the City’s financial status.
The next statements are fund financial statements. These statements focus on the activities of the individual parts of the City’s government. These statements provide more detail than the government-wide statements. There are three parts to the fund financial statements: 1) the governmental funds statements; 2) the proprietary fund statements; and 3) the fiduciary fund statements.
The next section of the basic financial statements is the notes. The notes to the financial statements explain in detail some of the data contained in those statements. After the notes, required supplemental information is provided to show details about the City’s budgetary information and pension plan and OPEB plan
Government-wide financial statements
The government-wide financial statements are designed to provide readers with a broad overview of the City’s finances, in a manner similar to a private-sector business. The government-wide statements provide short and long-term information about the City’s financial status as a whole.
4
The statement of net position presents information on all of the City’s assets, liabilities, and deferred outflows/inflows of resources, with the difference between them reported as net position. Over time, increases or decreases in net position may serve as a useful indicator of whether the financial position of the City is improving or deteriorating.
The statement of activities presents information showing how the City’s net position changed during the fiscal year. All changes in net position are reported as soon as the underlying event giving rise to the change occurs, regardless of the timing of related cash flows. Thus, revenues and expenses are reported in this statement for some items that will only result in cash flows in future fiscal periods (e.g., uncollected taxes and earned but unused compensated absences).
Both the government-wide financial statements include not only the City itself (known as the primary government), but also a legally separate economic development corporation for which the City is financially accountable. Financial information for this component unit is reported separately from the financial information presented for the primary government itself.
The government-wide financial statements are divided into three categories: 1) governmental activities; 2) business-type activities; and 3) component units. The governmental activities include most of the City’s basic services such as public safety, parks and recreation, and general administration. Property taxes, sales tax and state and federal grant funds finance most of these activities. The business-type activities are those that the City charges customers to provide. These include the utility services offered by the City. The final category is the component unit.
Fund financial statements
The fund financial statements provide a more detailed look at the City’s most significant activities. A fund is a grouping of related accounts that is used to maintain control over resources that have been segregated for specific activities or objectives. The City, like other state and local governments, uses fund accounting to ensure and demonstrate compliance with finance-related legal requirements All of the funds of the City can be divided into three categories: governmental funds, proprietary funds, and fiduciary funds. The fund financial statements for governmental funds, proprietary funds, and fiduciary funds can be found in the financial section of this report.
Governmental funds
Governmental funds are used to account for essentially the same functions reported as governmental activities in the government-wide financial statements. However, unlike the government-wide financial statements, governmental fund financial statements focus on current sources and uses of spendable resources, as well as on balances of spendable resources available at the end of the fiscal year. Such information may be useful in evaluating a government’s near-term financing requirements.
Most of the City’s basic services are accounted for in governmental funds. These funds focus on how assets can readily be converted into cash flow in and out, and what monies are left at year-end that will be available for spending in the next year. Governmental funds are reported using an accounting method called modified accrual accounting which provides a short-term spending focus. As a result, the governmental fund financial statements give the reader a detailed short-term view that helps him or her determine if there are more or less financial resources available to finance the City’s programs. The relationship between government activities (reported in the Statement of Net Position and the Statement of Activities) and governmental funds is described in a reconciliation that is a part of the fund financial statements.
Because the focus of governmental funds is narrower than that of the government-wide financial statements, it is useful to compare the information presented for governmental funds with similar information presented for governmental activities in government-wide financial statements. By doing so, readers may better understand the long-term impact of the City’s near-term financial decisions. Both the governmental fund balance sheet and the governmental fund statement of revenues, expenditures, and changes in fund balances provide a reconciliation to facilitate this comparison between governmental funds and governmental activities.
The City maintains seven individual governmental funds. Information is presented separately in the governmental fund balance sheet and in the governmental fund statement of revenues, expenditures, and changes in fund balances for the General Fund, Debt Service Fund, Capital Projects Fund, Roadway Impact Fund, and the ARPA Fund which are considered to be major funds. Data from the other governmental funds are combined into a single, aggregated presentation. Individual fund data for each of these non-major governmental funds is provided in the form of combining statements in the supplementary information.
5
The City adopts an annual budget for its General Fund, as required by the General Statutes. The budget is a legally adopted document that incorporates input from the citizens of the City, the management of the City, and the decisions of the City Council about which services to provide and how to pay for them. It also authorizes the City to obtain funds from identified sources to finance these current period activities. The budgetary statement provided for the General Fund demonstrates how well the City complied with the budget ordinance and whether the City succeeded in providing the services as planned when the budget was adopted. The budgetary comparison statement uses the budgetary basis of accounting and is presented using the same format, language, and classifications as the legal budget document. The statement shows four columns: 1) the original budget; 2) the final budget as amended by the Council; 3) the actual resources, charges to appropriations, and ending balances in the General Fund; and 4) the difference or variance between the final budget and the actual resources and charges.
Proprietary funds
The City of Forney has one type of proprietary fund which is the Utility Fund. The City charges customers for the services it provides, whether to outside customers or to other units within the City. These services are generally reported in proprietary funds. Proprietary funds are reported in the same way that all activities are reported in the statement of net position and the statement of activities.
Proprietary funds provide the same type of information as the government-wide financial statements, only in more detail. The proprietary fund financial statements provide separate information for the Utility Fund. The basic proprietary fund financial statements can be found on pages 20-22 of this report.
Notes to the financial statements
The notes provide additional information that is essential to a full understanding of the data provided in the government-wide and fund financial statements. The notes to the financial statements are on pages 25-49 of this report.
Other Information
In addition to the basic financial statements and accompanying notes, this report includes certain required supplementary information concerning the City’s budgetary information and progress in funding its obligation to provide pension benefits and OPEB benefits to its employees and retirees
The combining statements referred to earlier in connection with the non-major governmental funds are presented immediately following the required supplementary information. Combining statements and individual fund statements can be found on pages 59-60 of this report.
CITY OF FORNEY’S NET POSITION
As noted earlier, net position may serve over time as one useful indicator of a government’s financial condition. The assets and deferred outflows of resources of the City of Forney exceeded the liabilities and deferred inflows of resources by $207,382,122 as of September 30, 2022. The City’s net position increased by $26,566,755 for fiscal year ended September 30, 2022.
6
2022 2021 2022 2021 2022 2021 Current and other assets 54,162,154 $ 50,855,959 $ 32,682,380 $ 34,413,564 $ 86,844,534 $ 85,269,523 $ Capital assets 106,855,767 64,110,083 55,402,942 33,728,934 162,258,709 97,839,017 Total assets 161,017,921 114,966,042 88,085,322 68,142,498 249,103,243 183,108,540 Deferred outflows of resources 2,833,311 2,876,762 408,188 274,777 3,241,499 3,151,539 Long-term liabilities outstanding 29,733,631 38,516,333 2,933,352 3,325,309 32,666,983 41,841,642 Other liabilities 9,218,089 2,393,958 952,121 4,106,471 10,170,210 6,500,429 Total liabilities 38,951,720 40,910,291 3,885,473 7,431,780 42,837,193 48,342,071 Deferred inflows of resources 1,861,605 973,426 263,822 80,411 2,125,427 1,053,837 Net position: Net investment, in capital assets 85,443,652 38,620,898 52,971,217 30,868,966 138,414,869 69,489,864 Restricted 28,190,781 19,919,436 8,099,640 6,849,658 36,290,421 26,769,094 Unrestricted 9,403,474 17,418,753 23,273,358 23,186,460 32,676,832 40,605,213 Total net position 123,037,907 $ 75,959,087 $ 84,344,215 $ 60,905,084 $ 207,382,122 $ 136,864,171 $ Governmental Activities Business-type Activities Totals
Net Investment in Capital Assets – The largest portion of the City’s net position, 67%, reflects the City’s net investment in capital assets (e.g., land, buildings, machinery and equipment) less any related debt still outstanding that was issued to acquire those items. The City uses these capital assets to provide services to citizens; consequently, these assets are not available for future spending. Although the City’s investment in its capital assets is reported net of the outstanding related debt, the resources needed to repay that debt must be provided by other sources, since the capital assets cannot be used to liquidate these liabilities.
Restricted Net Position – The restricted net position of $36,290,421, or 17% of total net position represents resources that are subject to external restrictions or their use, or by enabling legislation. Restricted net position is comprised of state imposed restrictions; namely 38% for impact fees and 54% for courts fees restricted for use within the municipal court
Unrestricted Net Position – Unrestricted net position of $32,676,832 is available to fund City programs to citizens and obligations to creditors.
CHANGES IN NET POSITION
Governmental activities net position before transfers increased by $4,990,678, primarily due to an increase in capital contributions Property tax revenues increased despite the City adopting a lower tax rate. This was primarily attributed to an 18% increase in certified appraised values.
Business-type activities net position before transfers and extraordinary expense increased by $3,307,228 This is primarily due to developer contributions in FY22 and a decrease in utility expenses.
Governmental-type activities – Governmental-type activities increased the City’s net position by $17,089,725. Key elements of this increase are as follows:
Property tax revenue increased due to an increase in appraised values Sales tax revenue continued to increase, keeping in line with the City’s current growth. Additionally, the City restated beginning net position by $29,989,095 to record infrastructure donated by developers in prior years.
7
2022 2021 2022 2021 2022 2021 Revenues: Program revenues: Charges for services 7,577,114 $ 10,398,145 $ 27,549,698 $ 27,422,723 $ 35,126,812 $ 37,820,868 $ Operating grants and contributions 47,156 1,627,435 - 175,360 47,156 1,802,795 Capital grants and contributions 9,010,460 2,305,917 4,070,260 - 13,080,720 2,305,917 General revenues: Property taxes 15,063,814 13,228,918 - - 15,063,814 13,228,918 Franchise taxes 3,527,220 3,625,118 - - 3,527,220 3,625,118 Sales taxes 11,325,531 9,681,490 - - 11,325,531 9,681,490 Other taxes 205,895 107,545 - - 205,895 107,545 Investment income 1,079,925) ( 71,047 27,949 4,450 1,051,976) ( 75,497 Miscellaneous 400,146 117,650 214,255 171,114 614,401 288,764 Total revenues 46,077,411 41,163,265 31,862,162 27,773,647 77,939,573 68,936,912 Expenses: General government 8,424,525 6,148,822 - - 8,424,525 6,148,822 Public safety 11,130,641 10,417,689 - - 11,130,641 10,417,689 Public works 5,217,743 8,087,331 - - 5,217,743 8,087,331 Public services and operations 973,473 886,190 - - 973,473 886,190 Parks and recreation 2,564,170 2,556,071 - - 2,564,170 2,556,071 Interest on long-term debt 801,325 1,092,306 - - 801,325 1,092,306 Utilities - - 22,260,941 21,479,654 22,260,941 21,479,654 Total expenses 29,111,877 29,188,409 22,260,941 21,479,654 51,372,818 50,668,063 Increases in net position before transfers and extraordinary item (expense) 16,965,534 11,974,856 9,601,221 6,293,993 26,566,755 18,268,849 Transfers 124,191 2,932,018 124,191) ( 2,932,018) ( -Increase (decrease) in net position 17,089,725 14,906,874 9,477,030 3,361,975 26,566,755 18,268,849 Net position, beginning 75,959,087 61,052,213 60,905,084 57,543,109 136,864,171 118,595,322 Prior period adjustment 29,989,095 - 13,962,101 - 43,951,196Net position, ending 123,037,907 $ 75,959,087 $ 84,344,215 $ 60,905,084 $ 207,382,122 $ 136,864,171 $ Governmental Activities Business-type Activities Totals
Business-type activities – Business type activities increased the City of Forney’s net position by $9,477,030. Additionally, an increase of $13,962,101 related to a prior period adjustment to record infrastructure donated by developers in prior years was recorded Finally, the City received an additional $4,070,620 in developer contributions in 2022.
FINANCIAL ANALYSIS OF THE CITY’S FUNDS
As noted earlier, the City of Forney uses fund accounting to ensure and demonstrate compliance with finance related legal requirements.
Governmental funds – The focus of the City of Forney’s governmental funds is to provide information on nearterm inflows, outflows, and balances of spendable resources. Such information is useful in assessing the City’s financing requirements. Specifically, unassigned fund balance may serve as a useful measure of the city’s net resources available for discretionary use as they represent the portion of fund balance which has not been limited to use for a particular purpose by either an external party, the city itself, or a group or individual authorized by the governing body to assign resources for a particular purpose.
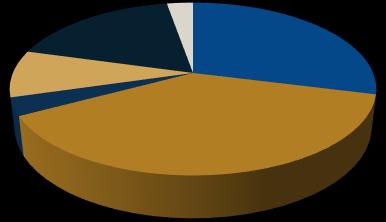
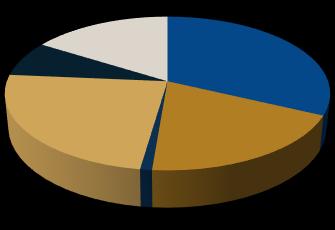
8 32% 19% -1% 24% 8% 16% Revenues - Governmental Activities Fiscal Year 2022 (excludes transfers) Property Tax Grants/Contributions Miscellaneous Sales Tax Franchise Tax Charges for Services 29% 38% 3% 9% 18% 3% Primary Government Functional Expenes for Governmental Activities - Fiscal Year 2022 General Government
Safety
Services and Operations
and Recreation
Works
and Fiscal Agent Fees
Public
Public
Parks
Public
Interest
At the close of the current fiscal year, the governmental funds reported combined ending fund balances of $43,799,692, an increase of $236,801, or 1% in comparison with the prior year. The components of total fund balances are as follows:
• Restricted fund balances of $28,219,995 consist of amounts with constraints put on their use by externally imposed creditors, grantors, contributions, laws, regulations or enabling legislation. Obligations for bonded debt is $1,737,769, or 6%, and debt proceeds for capital expenditures of $19,491,689, or 69%, account for the majority of restricted fund balances. Restrictions imposed by legislation amounts to $6,990,537 or 25%.
• Committed fund balance of $35,703 is for the police department as imposed by City Council for specific purposes.
• Assigned fund balance of $12,517,229 is for general reserve and use in the subsequent year’s budget as imposed by City Council or City Management for specific purposes.
As a measure of the General Fund’s liquidity, it is useful to compare unassigned fund balance to total General Fund expenditures. Unassigned fund balance equates to 13% of total General Fund expenditures.
Significant changes in fund balances of major funds are as follows:
• The General Fund’s fund balance decreased by $7,952,602 or 34%, partially due to negative investment earnings in the amount of $1.1 million, and primarily due to a $15 million transfer to the capital projects fund.
• The Debt Service Fund’s fund balance decreased by $301,377, or 15%, due to principal and interest expenditures for two bond issues being paid from fund balance
• The Roadway Impact Fund’s fund balance increased by $739,232, or 14%, due to an increase in impact fees received.
• The Capital Projects Fund’s fund balance increased by $7,298,231, or 60%, largely due to a $15 million transfer in from the General Fund.
Proprietary Funds
The City of Forney’s proprietary funds provide the same type of information found in the government-wide financial statements, but in more detail. Unrestricted net position of the proprietary funds at the end of the fiscal year amounted to $23,273,358
General Fund Budgetary Highlights
During the fiscal year, the City revised the budget on several occasions. Generally, budget amendments fall into one of three categories: (1) amendments made to adjust the estimates that are used to prepare the original budget ordinance once exact information is available; (2) amendments made to recognize new funding amounts from external sources, such as federal and state grants; and (3) increases in appropriations that become necessary to maintain services.
Revenues were more than the budgeted amounts mainly in the areas of property tax, sales tax, franchise tax, and license and permit revenues. Expenditures were less than budgeted in the majority of departments for salary and benefits.
CAPITAL ASSETS AND DEBT ADMINISTRATION
Capital assets The City’s investment in capital assets for its governmental and business-type activities as of September 30, 2022, amounted to $162,258,709 (net of accumulated depreciation). These assets include land, buildings, improvements, machinery and equipment, vehicles and construction in progress. This amount represents a net decrease (including additions and deductions) of $909,345 (net of accumulated depreciation) from the prior fiscal year.
9
Major capital asset transactions during the year include the following additions (there were no significant demolitions or disposals):
• Roadway improvements
• Water and sewer line improvements
More detailed information about capital assets is presented on pages 35-36 in the notes to the financial statements.
OF FORNEY’S OUTSTANDING BONDS AND NOTES PAYABLE AT YEAR-END
The City’s long term debt decreased by $7,240,493 due to payments made throughout the year. More detailed information about the long-term obligations is presented on pages 37-40 in the notes to the financial statements.
ECONOMIC FACTORS AND NEXT YEAR’S BUDGETS AND RATES
Although the economy is the primary factor, the City’s elected and appointed officials considered many factors when setting the fiscal year 2023 budget, tax rates, and fees that will be charged for the business-type activities. The City will finish FY 2022 with an unexpected surplus in funds as Forney has continued to experience unprecedented growth in both sales tax and building permits and associated fees.
The property tax base in Forney has continued to grow at a rapid rate with a 107% increase in values in the last 5 years. The increased values and early redemption of debt have allowed for a decrease in the property tax rate of just over $0.18 in the same time period. This budget proposes a tax rate of $0.43551 and will raise an additional $1,180,503 or 9.21% in property tax revenue from FY 2022.
Both sales tax and building permit revenue depend on the health of the economy. Therefore, the fiscal year 2023 budget includes a conservative 7% increase in sales tax over the actual collections in fiscal year 2022 and no increase in building permit revenue or associated fees Commercial and retail permit sales continue to be strong however, residential permit sales have decreased dramatically with rising rates and inflation.
Forney’s continued growth and increased revenue will allow the funding of additional staff and supplies required to meet the needs of the citizens. The fiscal year 2023 budget includes 20 new positions and adjusted pay pans or all City Employees. All employees will receive a 3% cost of living adjustment and nonuniformed employees will be eligible for a possible 2% merit adjustment.
10
CITY OF FORNEY’S CAPITAL ASSETS AT YEAR-END 2022 2021 2022 2021 2022 2021 Land $8,444,675 $5,017,448 $703,953 $703,953 $9,148,628 $5,721,401 Infrastructure 69,518,100 34,782,504 52,444,029 31,706,009 121,962,129 66,488,513 Buildings and improvements 19,226,002 17,960,981 - - 19,226,002 17,960,981 Machinery and equipment 4,449,309 3,426,614 1,182,801 1,263,104 5,632,110 4,689,718 Construction in progress 5,217,681 2,922,536 1,072,159 55,868 6,289,840 2,978,404 Total 106,855,767 $ 64,110,083 $ 55,402,942 $ 33,728,934 $ 162,258,709 $ 97,839,017 $ Governmental Activities Business-type Activities Totals
2022 2021 2022 2021 2022 2021 General obligation bonds and certificates of obligation 19,725,000 $ 23,265,000 $ 2,485,000 $ 2,920,000 $ 22,210,000 $ 26,185,000 $ Pass-through toll revenue and limited tax bonds 4,645,000 7,565,000 - - 4,645,000 7,565,000 Tax Notes 630,000 930,000 - - 630,000 930,000 Notes payable 174,231 219,724 - - 174,231 219,724 Total 25,174,231 $ 31,979,724 $ 2,485,000 $ 2,920,000 $ 27,659,231 $ 34,899,724 $ Governmental Activities Business-type Activities Totals
CITY
North Texas Municipal Water District (NTMWD) is increasing the cost of water purchases by $.40 per 1,000 gallons or 13.4% for Fiscal Year 2023 The FY2023 budget proposes passing the cost increase on to all water customers to include residential, commercial, wholesale, and industrial.
Additionally, NTMWD is increasing the cost of wastewater treatment and transmission and this cost will be passed on to customers through a $1.00 monthly increase in the sewer service charge.
The City recently renewed the contract for solid waste disposal services, and the contract includes a provision that there will be no rate increase to the City for a period of three years. Therefore, the fiscal year 2023 budget does not include any increase in garbage rates.
CONTACTING THE CITY’S FINANCIAL MANAGEMENT
The financial report is designed to provide our citizens, customers, investors and creditors with a general overview of the City’s finances. If you have questions about this report or need additional information, contact the Finance Division, City of Forney, P.O. Box 826, Forney, Texas 75126-0826
11
BASIC FINANCIAL STATEMENTS
THIS PAGE LEFT BLANK INTENTIONALLY
CITY OF FORNEY, TEXAS
Component Unit Governmental Business-type Activities Activities Total Forney EDC ASSETS Cash and investments 50,822,396 $ 20,923,799 $ 71,746,195 $ 8,095,674 $ Receivables (net of allowances) Taxes receivable 2,219,545 - 2,219,545 641,794 Accounts receivable 256,721 2,430,388 2,687,109 150 Lease receivable - - - 59,037 Intergovernmental receivable 863,492 - 863,492Restricted assets: Cash and investments - 9,328,193 9,328,193Capital assets, not being depreciated 13,662,356 1,776,112 15,438,468 404,263 Capital assets, being depreciated, net 93,193,411 53,626,830 146,820,241 2,507,755 Total assets 161,017,921 88,085,322 249,103,243 11,708,673 DEFERRED OUTFLOWS OF RESOURCES Deferred loss on bond refunding 415,748 65,576 481,324Pension related 2,339,283 331,518 2,670,801 33,260 OPEB related 78,280 11,094 89,374 1,113 Total deferred outflows of resources 2,833,311 408,188 3,241,499 34,373 LIABILITIES Accounts payable 442,591 326,696 769,287 13,609 Accrued liabilities 639,446 87,603 727,049 9,434 Due to other governments 32,826 - 32,826Unearned revenue 6,772,867 57,579 6,830,446Accrued interest payable 113,460 16,794 130,254 10,097 Customer & developer deposits 1,216,899 463,449 1,680,348Noncurrent liabilities: Due within one year: Long-term debt 3,931,794 455,000 4,386,794 115,000 Compensated absences 132,356 12,243 144,599 2,116 Due in more than one year: Long-term debt 22,541,069 2,042,301 24,583,370 1,305,000 Compensated absences 397,069 36,728 433,797 6,347 Net pension liability 2,466,853 349,597 2,816,450 35,074 Total OPEB liability 264,490 37,483 301,973 3,761 Total liabilities 38,951,720 3,885,473 42,837,193 1,500,438 DEFERRED INFLOWS OF RESOURCES Lease related - - - 58,920 Pension related 1,813,006 256,935 2,069,941 25,777 OPEB related 48,599 6,887 55,486 691 Total deferred inflows of resources 1,861,605 263,822 2,125,427 85,388 NET POSITION Net investment in capital assets 85,443,652 52,971,217 138,414,869 1,492,018 Restricted: Use of impact fees 5,871,094 8,099,640 13,970,734Debt service 1,708,555 - 1,708,555Municipal court use 79,638 - 79,638Capital improvements 19,491,689 - 19,491,689Public improvement district 855,064 - 855,064Tourism 184,741 - 184,741Unrestricted 9,403,474 23,273,358 32,676,832 8,665,202 Total net position 123,037,907 $ 84,344,215 $ 207,382,122 $ 10,157,220 $
Primary Government
STATEMENT OF NET POSITION
30, 2022
12
SEPTEMBER
The accompanying notes are an integral part of these financial statements.
CITY OF FORNEY, TEXAS
STATEMENT OF ACTIVITIES
FOR THE YEAR ENDED SEPTEMBER 30, 2022
Sales taxes
Franchise taxes
Other taxes
Miscellaneous
Investment income
Transfers
Total general revenues and transfers
Change in net position
Net position -- beginning
Prior period adjustment
Net position -- ending
Operating Charges for Grants and Expenses Services Contributions Function/Program Activities Primary Government Governmental activities: General government 8,424,525 $ 6,743 $ - $ Public safety 11,130,641 2,450,837 47,156 Public services and operations 973,473 -Parks and recreation 2,564,170 158,228Public works 5,217,743 4,961,306Interest and charges on long-term debt 801,325 -Total governmental activities 29,111,877 7,577,114 47,156 Business-type activities: Utility fund 22,260,941 27,549,698Total Business-type activities 22,260,941 27,549,698Total primary government 51,372,818 35,126,812 47,156 Component unit: Economic development 3,080,413 73,708Total Component unit 3,080,413 $ 73,708 $ - $
General revenues: Property taxes
Revenue
Program
The accompanying notes are an integral part of these financial statements. 13
Program Revenue Component Capital Unit Grants and Governmental Business-Type Contributions Activities Activities Total Forney EDC - $ 8,417,782) $( - $ 8,417,782) $( - $ - 8,632,648) ( - 8,632,648) (- 973,473) ( - 973,473) (- 2,405,942) ( - 2,405,942) (9,010,460 8,754,023 - 8,754,023- 801,325) ( - 801,325) (9,010,460 12,477,147) ( - 12,477,147) (4,070,260 - 9,359,017 9,359,0174,070,260 - 9,359,017 9,359,01713,080,720 12,477,147) ( 9,359,017 3,118,130) (- 3,006,705) ( - $ 3,006,705) $( 15,063,814 - 15,063,81411,325,531 - 11,325,531 3,775,177 3,527,220 - 3,527,220205,895 - 205,895400,146 214,255 614,401 4,082 1,079,925) ( 27,949 1,051,976) ( 3,175 124,191 124,191) ( -29,566,872 118,013 29,684,885 3,782,434 17,089,725 9,477,030 26,566,755 775,729 75,959,087 60,905,084 136,864,171 9,381,491 29,989,095 13,962,101 43,951,196123,037,907 $ 84,344,215 $ 207,382,122 $ 10,157,220 $ Primary Government Net (Expense) Revenue and Changes in Net Position 14
CITY OF FORNEY, TEXAS
BALANCE SHEET
SEPTEMBER 30, 2022
General Debt Service Roadway Fund Fund Impact Fund ASSETS Cash and investments 15,925,487 $ 1,727,611 $ 5,871,094 $ Taxes receivable, net 2,125,141 94,404Due from other governments - 863,492Accounts receivable 256,721 -Total assets 18,307,349 2,685,507 5,871,094 LIABILITIES Accounts payable 431,437 -Accrued salaries and wages 639,446 -Due to other governments 32,826 -Developer deposits 1,216,899 Unearned revenues 17,311 -Total liabilities 2,337,919 -DEFERRED INFLOWS OF RESOURCES Unavailable revenue 310,095 947,738Total deferred inflows of resources 310,095 947,738FUND BALANCES Restricted for: Debt service - 1,737,769Use of impact fees - - 5,871,094 Capital improvements - -Municipal court use 79,638 -Tourism - -Public Improvement District - -Committed for: Police 35,703 -Assigned for: General reserve 4,920,115 -Subsequent year's budget 7,597,114 -Unassigned 3,026,765 -Total fund balances 15,659,335 1,737,769 5,871,094 Total liabilities, deferred inflows, and fund balances 18,307,349 $ 2,685,507 $ 5,871,094 $
of these financial
15
GOVERNMENTAL FUNDS The accompanying notes are an integral part
statements.
Total Total Capital ARPA Nonmajor Governmental Projects Fund Fund Funds Funds 19,496,423 $ 6,755,556 $ 1,046,225 $ 50,822,396 $ - - - 2,219,545 - - - 863,492 - - - 256,721 19,496,423 6,755,556 1,046,225 54,162,154 4,734 - 6,420 442,591 - - - 639,446 - - - 32,826 - 1,216,899 - 6,755,556 - 6,772,867 4,734 6,755,556 6,420 9,104,629 - - - 1,257,833 - - - 1,257,833 - - - 1,737,769 - - - 5,871,094 19,491,689 - - 19,491,689 - - - 79,638 - - 184,741 184,741 - - 855,064 855,064 - - - 35,703 - - - 4,920,115 - - - 7,597,114 - - - 3,026,765 19,491,689 - 1,039,805 43,799,692 19,496,423 $ 6,755,556 $ 1,046,225 $ 54,162,154 $ 16
THIS PAGE LEFT BLANK INTENTIONALLY
CITY OF FORNEY, TEXAS
RECONCILIATION OF THE GOVERNMENTAL FUNDS BALANCE SHEET TO THE GOVERNMENTAL ACTIVITIES STATEMENT OF NET POSITION
SEPTEMBER 30, 2022
Amounts reported for governmental activities in the statement of net position are different because:
Capital assets used in governmental activities are not financial resources and, therefore, are not reported in the funds.
Revenue reported as unavailable revenue in the governmental fund financial statements was recorded as revenue in the government-wide financial statements
Interest is accrued on outstanding debt in the government-wide financial statements, whereas in the governmental fund financial statements, an expenditure is reported when due.
Certain long-term liabilities are not due and payable in the current period and therefore are not reported in the funds. Also, the loss on refunding of bonds, the premium on issuance of bonds and deferred resource outflows (inflows) related to the net pension liability are not reported in the funds.
The accompanying notes are an integral part of these financial statements.
Total fund balances - governmental funds 43,799,692 $
106,855,767
Property taxes 244,988 Court fines and fees 149,353 Pass-through toll grant 863,492 Subtotal 1,257,833
113,460) (
Bonds payable 24,370,000) ( Premiums and discounts on bonds payable 1,298,632) ( Notes payable 804,231) ( Compensated absences 529,425) ( Net pension liability 2,466,853) ( Net other post-employment benefit liability 264,490) ( Deferred loss on bond refunding 415,748 Deferred outflows and inflows related to pension 526,277 Deferred outflows and inflows related to other post-employment benefit 29,681 Subtotal 28,761,925) ( Net position of governmental activities 123,037,907 $
17
CITY OF FORNEY, TEXAS
STATEMENT OF REVENUES, EXPENDITURES AND CHANGES IN FUND BALANCES
GOVERNMENTAL FUNDS
FOR THE YEAR ENDED SEPTEMBER 30, 2022
General Debt Service Roadway Fund Fund Impact Fund REVENUES Property taxes 8,415,728 $ 3,436,173 $ - $ Sales taxes 11,325,531 -Hotel/motel taxes - -Franchise taxes 3,527,220 -Beverage taxes 70,731 -Licenses and permits 5,702,180 -Intergovernmental revenues 40,676 4,019,141Charges for services 1,468,830 4,954Impact fees - - 1,792,142 Fines and forfeitures 195,911 -Investments earnings 1,138,794) ( 23,941 13,125 Contributions and donations 7,182 -Miscellaneous 190,773 -Total revenues 29,805,968 7,484,209 1,805,267 EXPENDITURES Current: General government 6,422,890 -Public safety 11,135,139 -Public works 3,539,023 - 19,035 Public services and operations 1,001,452 -Culture and recreation 1,930,395 -Debt service: Principal - 6,805,493Interest - 1,035,460Capital outlay - -Total expenditures 24,028,899 7,840,953 19,035 EXCESS (DEFICIENCY) OF REVENUES OVER (UNDER) EXPENDITURES 5,777,069 356,744) ( 1,786,232 OTHER FINANCING SOURCES (USES) Transfers in 1,270,329 55,367Transfers out 15,000,000) ( - 1,047,000) ( Insurance recoveries - -Total other financing sources (uses) 13,729,671) ( 55,367 1,047,000) ( NET CHANGE IN FUND BALANCE 7,952,602) ( 301,377) ( 739,232 FUND BALANCE - BEGINNING 23,611,937 2,039,146 5,131,862 FUND BALANCE - ENDING 15,659,335 $ 1,737,769 $ 5,871,094 $
The
of these financial statements. 18
accompanying notes are an integral part
Total Total Capital ARPA Nonmajor Governmental Projects Fund Fund Funds Funds 2,280,485 $ - $ 821,781 $ 14,954,167 $ - - - 11,325,531 - - 135,164 135,164 - - - 3,527,220 - - - 70,731 - - - 5,702,180 - 6,480 192,402 4,258,699 91,251 - - 1,565,035 - - - 1,792,142 - - - 195,911 20,151 - 1,652 1,079,925) ( - - - 7,182 14,276 - - 205,049 2,406,163 6,480 1,150,999 42,659,086 - 6,480 697,682 7,127,052 - - - 11,135,139 1,280,942 - - 4,839,000 - - - 1,001,452 - - - 1,930,395 - - - 6,805,493 - - - 1,035,460 8,714,660 - - 8,714,660 9,995,602 6,480 697,682 42,588,651 7,589,439) ( - 453,317 70,435 16,047,000 - - 17,372,696 1,201,505) ( - - 17,248,505) ( 42,175 - - 42,175 14,887,670 - - 166,366 7,298,231 - 453,317 236,801 12,193,458 - 586,488 43,562,891 19,491,689 $ - $ 1,039,805 $ 43,799,692 $ 19
RECONCILIATION OF THE STATEMENT OF REVENUES, EXPENDITURES AND CHANGES IN FUND BALANCES OF GOVERNMENTAL FUNDS TO THE STATEMENT OF ACTIVITIES
FOR THE YEAR ENDED SEPTEMBER 30, 2022
Amounts reported for governmental activities in the Statement of Activities are different because:
Governmental funds report capital outlays as expenditures. However, in the statement of activities, the cost of these assets is allocated over their estimated useful lives and reported as depreciation expense. This is the amount of capital outlays for the fiscal year.
Depreciation expense on capital assets is reported in the government-wide statement of activities and changes in net position but they do not require the use of current financial resources. Therefore, depreciation expense is not reported as expenditures in the governmental funds.
Other miscellaneous transactions involving capital assets, including disposals and adjustments, are reported in the statement of activities and statement of net position. However, these transactions do not require the use of current financial resources, and are therefore not reported in the governmental fund financial statements.
Current year long-term debt principal payments on contractual obligations, bonds payable and capital leases are expenditures in the fund financial statements but are shown as reductions in long-term debt in the government-wide financial statements.
in the statement of activities that do not provide current financial resources are not reported as revenue in the fund financial statements.
Certain pension and other post-employment (OPEB) expenditures are not expended in the government-wide financial statements and recorded as deferred resource outflows and inflows. These items relate to contributions made after the measurement date. Additionally, a portion of the City’s unrecognized deferred resource outflows and inflows
Net change in fund balances - total governmental funds: 236,801 $
15,925,796
3,131,516) (
37,691) (
Principal paid on bonds 6,805,493 Current year changes
accrued interest payable
not
resources; therefore,
governmental funds. 42,558 Premiums, discounts
the governmentwide financial statements, the gain or loss is
reported. 191,577 Current
61,959 Revenues
3,797,295) (
to the
and
liabilities
792,043 Change in net position - statement of activities 17,089,725 $
in
do
require the use of current financial
they are not reported as expenditures in
and deferred losses on refunding are recognized in the fund financial statements as other and shown as an increase in financial resources. In
calculated and
year changes in long-term liabilities for compensated absences do not require the use of current financial resources; therefore, they are not reported as expenditures in governmental funds.
related
pension
OPEB
were amortized.
CITY OF FORNEY, TEXAS
notes
of these financial statements. 20
The accompanying
are an integral part
CITY OF FORNEY, TEXAS
STATEMENT OF NET POSITION PROPRIETARY FUND
SEPTEMBER 30, 2022
Business-Type Activities Utility Fund ASSETS Current assets: Cash and cash equivalents 9,841,988 $ Investments 11,081,811 Restricted cash and cash equivalents 9,328,193 Accounts receivable, net 2,430,388 Total current assets 32,682,380 Noncurrent assets: Capital assets not being depreciated 1,776,112 Capital assets (net of accumulated depreciation) 53,626,830 Total noncurrent assets 55,402,942 Total assets 88,085,322 DEFERRED OUTFLOWS OF RESOURCES Deferred loss on bond refunding 65,576 Deferred outflow related to pensions 331,518 Deferred outflow related to other post-employment benefit 11,094 Total deferred outflows of resources 408,188 LIABILITIES Current liabilities: Accounts payable 326,696 Accrued liabilities 87,603 Accrued interest payable 16,794 Unearned revenue 57,579 Bonds and notes payable- current 455,000 Compensated absences - current 12,243 Customer deposits 463,449 Total current liabilities 1,419,364 Noncurrent liabilities: Bonds payable 2,042,301 Compensated absences 36,728 Net pension liability 349,597 Net other post-employment benefit liability 37,483 Total noncurrent liabilities 2,466,109 Total liabilities 3,885,473 DEFERRED INFLOWS OF RESOURCES Deferred resource inflow related to pension 256,935 Deferred resource inflow related to other post-employment benefit 6,887 Total deferred inflows of resources 263,822 NET POSITION Net investment in capital assets 52,971,217 Restricted for user impact fees 8,099,640 Unrestricted 23,273,358 Total net position 84,344,215 $
21
The accompanying notes are an integral part of these financial statements.
CITY OF FORNEY, TEXAS
STATEMENT OF REVENUES, EXPENSES, AND CHANGES IN NET POSITION PROPRIETARY FUND
FOR THE YEAR ENDED SEPTEMBER 30, 2022
Business-Type Activities Utility Fund OPERATING REVENUES Charges for services: Water and sewer sales 24,984,622 $ Refuse collection 1,138,010 Impact fees 1,427,066 Miscellaneous revenue 214,255 Total operating revenues 27,763,953 OPERATING EXPENSES Personnel services 2,511,383 Supplies and materials 96,517 Maintenance and repair 1,049,258 Contracted services 682,842 Water purchases 12,368,651 Interceptor fees 2,946,618 Refuse collection 820,146 Depreciation 1,733,225 Total operating expenses 22,208,640 OPERATING INCOME 5,555,313 NON-OPERATING REVENUES (EXPENSES) Capital contributions 4,070,260 Investment earnings 27,949 Interest expense 52,301) ( Total nonoperating revenues (expenses) 4,045,908 INCOME BEFORE TRANSFERS 9,601,221 TRANSFERS IN (OUT) Transfers in 1,146,138 Transfers out 1,270,329) ( CHANGE IN NET POSITION 9,477,030 TOTAL NET POSITION - BEGINNING 60,905,084 PRIOR PERIOD ADJUSTMENT 13,962,101 TOTAL NET POSITION - ENDING 84,344,215 $
The accompanying notes are an integral part of these financial statements. 22
CITY OF FORNEY, TEXAS
STATEMENT OF CASH FLOWS PROPRIETARY FUND
FOR THE YEAR ENDED SEPTEMBER 30, 2022
Business-Type Activities Utility Fund CASH FLOWS FROM OPERATING ACTIVITIES Receipts from customers 24,672,965 $ Payments to suppliers and service providers 17,751,476) ( Payments to employees for salaries and benefits 2,425,097) ( Net cash provided by (used for) operating activities 4,496,392 CASH FLOWS FROM NONCAPITAL FINANCING ACTIVITIES Transfers from other funds 1,146,138 Transfers to other funds 1,270,329) ( Net cash provided by (used for) noncapital financing activities 124,191) ( CASH FLOWS FROM CAPITAL AND RELATED FINANCING ACTIVITIES Acquisition and construction of capital assets 5,374,872) ( Payments on long-term debt 435,000) ( Interest paid on capital debt 45,544) ( Net cash provided by (used for) capital and related financing activities 5,855,416) ( CASH FLOWS FROM INVESTING ACTIVITIES Interest on investments 27,949 Purchase of investments 479) ( Net cash provided by (used for) investing activities 27,470 NET INCREASE (DECREASE) IN CASH AND CASH EQUIVALENTS 1,455,745) ( CASH AND CASH EQUIVALENTS - BEGINNING 20,625,926 CASH AND CASH EQUIVALENTS - ENDING 19,170,181 Reconciliation of operating income (loss) to net cash provided (used for) operating activities: Operating income (loss) 5,555,313 Adjustments to reconcile operating income (loss) to net cash provided by (used for) operating activities: Depreciation expense 1,733,225 (Increase) decrease in accounts receivable 275,918 Increase (decrease) in accounts payable 195,405 Increase (decrease) in accrued liabilities 3,631 Increase (decrease) in customer deposits 13,520 Increase (decrease) in unearned revenues 3,366,906) ( Increase (decrease) in net pension liability 47,885 Increase (decrease) in net OPEB liability 15,276 Increase (decrease) in compensated absences 23,125 Total adjustments 1,058,921) ( Net cash provided by (used for) operating activities 4,496,392 $
23
NOTES TO FINANCIAL STATEMENTS
SEPTEMBER 30, 2022
I. SUMMARY OF SIGNIFICANT ACCOUNTING POLICIES
The City of Forney (“City”) was originally incorporated in 1910 and operates under a home rule charter adopted in an election held November 4, 1997 and a Council/Manager form of government with a City Council comprised of the Mayor and six Council members. Some of the services provided are public safety (police and fire protection), municipal court, streets, engineering, water distribution, sewer collection, recreation, and general administrative services.
The accounting and reporting policies of the City relating to the funds included in the accompanying basic financial statements conform to accounting principles generally accepted in the United States of America (“GAAP”) applicable to state and local governments. Generally accepted accounting principles for local governments include those principles prescribed by the Governmental Accounting Standards Board (“GASB”), the American Institute of Certified Public Accounts in the publication entitled State and Local Governments-Audit and Accounting Guide and by the Financial Accounting Standards Board when applicable. The more significant accounting policies of the City are described below:
A. Reporting Entity
The City is a municipal corporation governed by an elected Mayor and six-member council and has the authority to make decisions, appoint administrators and managers, and significantly influence operations. It also has the primary accountability for fiscal matters. Therefore, the City is a financial reporting entity as defined by GASB in its Statement No. 14, “The Financial Reporting Entity,” as amended by GASB Statement No. 39 “Determining Whether Certain Organizations are Component Units.”
Component units are organizations for which the City is financially accountable and all other organizations for which the nature and significance of their relationship with the City are such that exclusion would cause the reporting entity’s financial statements to be misleading or incomplete. Financial accountability exists if the City appoints a voting majority of an organization’s governing board and is either able to impose its will on that organization or there is a potential for the organization to provide specific financial benefits to, or impose specific financial burdens on, the City. The City may be financially accountable for governmental organizations with a separately elected governing board, a governing board appointed by another government, or a jointly appointed board that is fiscally dependent on the City. The financial statements of the component unit may be discretely presented in a separate column from the primary government or blended with the financial statements of primary government. GASB 39 added clarification to GASB 14 by including entities which meet all three of the following requirements.
1. The economic resources received or held by the separate organization are entirely for the direct benefit of the primary government, its component units, or its constituents.
2. The primary government, or its component units, is entitled to, or has the ability to otherwise access a majority of the economic resources received or held by the separate organization.
3. The economic resources received or held by an individual organization that the specific primary government, or its component units, is entitled to, or has the ability to other access, are significant to the primary government.
The financial statements of the following component unit have been “discretely presented” in the accompanying report because (i) their governing boards are not substantially the same as the governing body of the City, or (ii) the component unit provides services entirely or almost entirely to the citizenry and not the City.
24
CITY OF FORNEY, TEXAS
Discretely Presented Component Unit
The City has one component unit, Forney Economic Development Corporation (“EDC”). The EDC was incorporated September 15, 1994 and is governed by a seven-member board appointed by and serving at the pleasure of the City Council. Thus, the EDC is legally separate, but due to the City appointing the voting majority of the EDC board, it is classified as a discretely presented component unit. The funding for the EDC occurs by the City transferring ¼ of City sales tax collections to the EDC. Adding the creation of the EDC to the resources currently available will more than double the current ability to assist economic development prospects. All of the EDC funding can be used for direct assistance to business prospects and continued development of infrastructure. The nature and significance of the relationship between the primary government and the organization is such that exclusion would cause the City’s financial statements to be misleading or incomplete. The EDC does not issue separate financial statements.
B. Government-wide and Fund Financial Statements
The basic financial statements include both government-wide (based on the City as a whole) and fund financial statements. The government-wide financial statements (i.e., the statement of net position and the statement of activities) report information on all of the nonfiduciary activities of the primary government and its component units. For the most part, the effect of interfund activity has been removed from these statements. Governmental activities, which normally are supported by taxes and intergovernmental revenues, are reported separately from business-type activities, which rely to a significant extent on fees and charges for support. Likewise, the primary government is reported separately from certain legally separate component units for which the primary government is financially accountable.
The government-wide statement of activities demonstrates the degree to which the direct expenses of a functional category (Public Safety, Public Works, etc.) or segment are offset by program revenues. Direct expenses are those that are clearly identifiable with specific function or segment. Program revenues include (1) charges to customers or applicants who purchase, use, or directly benefit from goods, services, or privileges provided by a given function or segment, and (2) grants and contributions that are restricted to meeting the operational or capital requirements of a particular function or segment Taxes and other items not properly included among program revenues are reported instead as general revenues.
The net cost (by function or business-type activity) is normally covered by general revenue (property and sales taxes, franchise fees, and interest income)
Separate financial statements are provided for governmental funds and proprietary funds. Major individual governmental funds and major individual enterprise funds are reported as separate columns in the fund financial statements. GASB Statement No. 34 sets forth minimum criteria (percentage of assets, liabilities, revenues, or expenditures/expenses of either fund category for the governmental and enterprise combined) for the determination of major funds. The nonmajor funds are combined in a separate column in the fund financial statements. The nonmajor funds are detailed in the combining section of the statements.
The government-wide focus is more on the sustainability of the City as an entity and the change in aggregate financial position resulting from the activities of the fiscal period. The focus of the fund financial statements is on the major individual funds of the governmental and business-type categories and the component units. Each presentation provides valuable information that can be analyzed and compared to enhance the usefulness of the information.
25
C. Measurement Focus, Basis of Accounting and Financial Statement Presentation
Measurement focus refers to what is being measured; basis of accounting refers to when revenues and expenditures are recognized in the accounts and reported in the financial statements. Basis of accounting related to the timing of the measurement made, regardless of the measurement applied. The government-wide financial statements are reported using the economic resources measurement focus and the accrual basis of accounting, as are the proprietary fund financial statements. The economic resources measurement focus means all assets, deferred outflows/inflows of resources, and liabilities (whether current or noncurrent) are included on the statement of net position and the operating statements present increases (revenues) and decreases (expenses) in total net position. Under the accrual basis of accounting, revenues are recognized when earned, including unbilled water and sewer services which are accrued. Expenses are recognized at the time the liability is incurred.
Governmental fund level financial statements are reported using the current financial resources measurement focus and the modified accrual basis of accounting. Revenues are recognized as soon as they are both measurable and available. Revenues are considered to be available when they are collectible within the current period or soon enough thereafter to pay liabilities of the current period. For this purpose, the City considers revenues to be available if they are collected within 60 days of the end of the current fiscal period. In applying the susceptible to accrual concept to intergovernmental revenue, the legal and contractual requirements of the numerous individual programs are used as guidance. Generally, monies must be expended on a specific purpose or project before any amounts will be paid to the City; therefore, revenues are recognized based upon the expenditures recorded. Ad valorem taxes are recognized as revenues in the year for which they are levied. Sales taxes, franchise taxes, hotel occupancy taxes, charges for services and fines are recognized as revenue as earned, when measurable and available. Licenses, permits, and miscellaneous revenues (except earnings on investments) are recorded as revenues when received in cash because they are generally not measurable until actually received. Investment earnings are recorded as earned since they are measurable and available.
Proprietary funds distinguish operating revenues and expenses from nonoperating items. Operating revenues and expenses generally result from providing services and producing and delivering goods in connection with a proprietary fund’s principal ongoing operations. The principal operating revenues of the City’s water and sewer are charges to customers for sales and services. Operating expenses for the enterprise funds include the cost of sales and services, administrative expenses, and depreciation on capital assets. All revenues and expenses not meeting this definition are reported as non-operating revenues and expenses.
Governmental Funds
The focus of governmental fund measurement (in the fund financial statements) is upon determination of financial position and changes in financial position (sources, uses, and balances of financial resources) rather than upon net income. The following is a description of the major governmental funds of the City:
The City reports the following major governmental funds:
The General Fund is the general operating fund of the City. It is used to account for all financial resources except those required to be accounted for in another fund. All general tax revenues and other receipts that are not restricted by law or contractual agreement to some other fund are accounted for in this fund. General operating expenditures, fixed charges and capital improvements costs that are not paid through other funds are paid from this fund.
The Debt Service Fund is used to account for the accumulation of resources for, and the payment of, general long-term debt principal, interest, and related costs.
26
The Roadway Impact Fund special revenue fund accounts for the resources accumulated in the form of roadway impact fees for maintenance and operations of infrastructure and future projects.
The Capital Projects Fund accounts for the acquisition or construction of infrastructure and building projects being financed from bond proceeds, grants, and transfers from other funds.
The ARPA Fund accounts for federal funds granted through the American Rescue Plan Act.
Proprietary Funds
The focus of proprietary fund measurement is upon determination of operating income, changes in net position, financial position, and cash flows, which is similar to businesses. The following is a description of the major proprietary funds of the City:
The Utility Fund accounts for the operation of the City’s water and sanitary sewer utility and trash collection which are self-supporting activities rendering services on a user-charge basis.
As a general rule, the effect of interfund activity has been eliminated from the government-wide financial statements. Exceptions to this general rule are charges between the City’s governmental and business-type activities. Eliminations of these charges would distort the direct costs and program revenues reported for the various functions concerned.
When both restricted and unrestricted resources are available for use, it is the City’s policy to use the restricted resources first, and then use the unrestricted resources as needed.
D. Assets, Deferred Outflows/Inflows of Resources, Liabilities, and Fund Balance or Net Position
1. Cash and Investments
Cash of all funds is pooled into a common interest-bearing bank account in order to maximize investment opportunities. Each fund whose monies are deposited in the pooled cash has equity therein, and interest earned on these monies is allocated based upon relative equity at each month end.
The City’s cash and cash equivalents are considered to be cash on hand, demand deposits and short-term investments with original maturities of three months or less from the date of acquisition. Investments for the City are reported at fair value, except for the position in investment pools. The City’s investment in pools and are reported at the net asset value per share (which approximates fair value) even though it is calculated using the amortized cost method.
For purposes of the statement of cash flows, proprietary funds consider all highly liquid investments (including restricted assets) with a maturity of three months or less when purchased to be cash equivalents.
2. Inventories and prepaid Items
Inventories are valued at cost using the first‐in/first‐out (FIFO) method and consist of expendable supplies and vehicle repair parts. The cost of such inventories is recorded as expenditures/expenses when consumed rather than when purchased.
Certain payments to vendors reflect costs applicable to future accounting periods and are recorded as prepaid items in both the government‐wide and fund financial statements. The cost of prepaid items is recorded as expenditures/expenses when consumed rather than when purchased.
27
3. Interfund Transactions, Receivables and Payables
Short-term advances between funds are accounted for in the appropriate interfund receivable and payable accounts and are reported as “due to/from other funds.”
4. Property Taxes and Other Receivables Property Taxes
The City’s property tax is levied each October 1, on the assessed value listed as of the prior January 1 for all real property located in the City. Assessed value represents the appraisal value less applicable exemptions authorized by the City Council. The Appraisal Board of Review established appraised values at 100% for estimated market value. A tax lien attaches to the property on January 1 of each year, to secure the payment of all taxes, penalties, and interest ultimately imposed for the year on that property, whether or not the taxes are imposed in the year the lien attaches.
Taxes are due October 1 immediately following the levy date and are delinquent after the following January 31st. Revenues are recognized as the related ad valorem taxes are collected. Additional delinquent property taxes estimated to be collectible within 60 days following the close of the fiscal year have been recognized as a revenue at the fund level.
In Texas, county-wide central appraisal districts are required under the Property Tax Code to assess all property within the appraisal district on the basis of 100% of its market value and are prohibited from applying any assessment ratios. The value of property within the appraisal district must be reviewed every five years; however, the City may, at its own expense, require annual reviews of appraisal values. The City may challenge appraised values established by the appraisal district through various appeals, and, if necessary, take legal action. Under this legislation, the City continues to set tax rates on City property. However, of the no new revenue rate, including tax rates for bonds and other contractual obligations, adjusted for new improvements, exceed the rate of the previous year by more than 3.5%, qualified voters of the City may petition for an election to determine whether to limit the tax rate to no more than 3.5% above the tax rate of the previous year.
The statutes of the State of Texas do not prescribe a legal debt limit. However, Article XI, Section 5 of the Texas Constitution applicable to cities of more than 5,000 population limits the ad valorem tax rate to $2.50 per $100 assessed value. The City’s property tax rate for the current fiscal year is $0.50107 per $100 assessed value.
Allowances for Uncollectible Accounts
Governmental trade and property tax receivables are shown net of an allowance for uncollectible. All other allowances for uncollectible accounts are based on historical collection rates. The property tax receivable allowance is based on the average collection rate of delinquent taxes over the last 20 years.
The allowance for uncollectible accounts for utility billing in the enterprise fund is estimated based on a percentage of aged balances outstanding.
5. Restricted Assets
Assets are reported as restricted when limitations on their use change the nature of normal understanding of the availability of the asset. Such constraints are either externally imposed by creditors, contributors, grantors, or laws of the other governments, or are imposed by law through constitutional provisions or enabling legislation. Restricted assets in the proprietary fund represent cash and cash equivalents and investments set aside for repayment of customer’s water/sewer deposits, impact fees, specific capital additions and various bond covenants.
Impact fees are the capital recovery fees that are, by law, restricted to the projects these funds may be used to support.
Customer deposits received for water and wastewater services are, by law, to be considered restricted assets. These activities are included in the Utility Fund.
28
6. Capital Assets
Capital assets, which include land, buildings, equipment, and improvements, purchased or acquired, are reported in the applicable governmental or business-type activities columns in the government-wide financial statements and proprietary fund financial statements. The City defines capital assets as assets with an initial individual cost of more than $5,000 and an estimated useful life in excess of two years. Such assets are recorded at historical cost or estimated historical if historical cost is not available. Donated capital assets are recorded at acquisition value, which is the price that would be paid to acquire an asset with equivalent service potential at the date of donation. Additions, improvements, and other capital outlays that significantly extend the useful life of an asset are capitalized. Other costs incurred for repairs and maintenance are expenses.
Major outlays for capital assets and improvements are capitalized as projects are constructed. Capital assets are being depreciated using the straight-line method over the following estimated useful lives:
7. Compensated Absences
It is the City’s policy to permit employees to accumulate earned but unused vacation, compensatory time, and sick pay benefits. All vacation and comp time is accrued at the close of the fiscal year end in the government-wide and proprietary fund financial statements.
8. Long-term Debt
In the government-wide financial statements, and proprietary funds in the fund financial statements, long-term debt and other long-term obligations are reported as liabilities in the applicable governmental activities, business-type activities, or proprietary fund type statement of net position. Bond premiums and discounts are deferred and amortized over the life of the bonds using the straight-line method The City has compared this method to the effective interest method and found the difference between the two methods to be immaterial. Bonds payable are reported net of the applicable bond premium or discount. Bond issuance costs are expensed in the year they are incurred.
In the fund financial statements, governmental funds recognize bond premiums and discounts, as well as bond issuance costs, during the current period. The face amount of debt issued is reported as other financing sources. Premiums received on debt issuances are reported as other financing sources while discounts on debt issuances are reported as other financing uses. Issuance costs, whether or not withheld from the actual debt proceeds, are reported as debt service expenditures.
9. Deferred Outflows/Inflows of Resources
In addition to assets, the statement of financial position will sometimes report a separate section for deferred outflows of resources. This separate financial statement element, deferred outflows of resources, represents a consumption of net assets that applies to a future period(s) and so will not be recognized as an outflow of resources (expense/expenditure) until then. The City has three types of items, which arise only under a full accrual basis of accounting that qualify for reporting in this category. Accordingly, the items deferred loss on bond refunding and deferred resource outflows related to the City’s pension and other post-employment benefit plans are reported in the statement of net position. These amounts are deferred and recognized as an outflow of resources in the period that the amounts become available.
29
Assets Years Infrastructure 10-40 Buildings 20-50 Building Improvements 10-25 Vehicles 5 Office Equipment 5 Machinery and Equipment 5-10
In addition to liabilities, the statement of financial position will sometimes report a separate section for deferred inflows of resources. This separate financial statement element, deferred inflows of resources, represents an acquisition of net assets that applies to that time. The City has one type of item, which arises only under a modified accrual basis of accounting that qualifies for reporting in this category. Accordingly, the item, unavailable revenue, is reported only in the governmental funds balance sheet. The governmental funds report unavailable revenue from property taxes and notes receivable from TX DOT. These amounts are deferred and recognized as an inflow of resources in the period that the amounts become available. Additionally, the City has two types of deferred inflow of resources that are required to be reported under the full accrual basis of accounting. These items, deferred resource inflows related to the City’s pension and other post-employment benefit plans, are reported in the statement of net position.
10. Net Position Flow Assumption
Sometimes the City will fund outlays for a particular purpose from both restricted (e.g., restricted bond or grant proceeds) and unrestricted resources. In order to calculate the amounts to report as restricted-net position and unrestricted-net position in the government-wide and proprietary fund financial statements, a flow assumption must be made about the order in which the resources are considered to be applied. It is the City’s policy to consider restricted-net position to have been depleted before unrestricted-net position is applied.
11. Fund Balance Policies
Fund balance of governmental funds is reported in various categories based on the nature of any limitations requiring the use of resources for specific purposes. The City Council can establish limitations on the use of resources through either a commitment (committed fund balance) or an assignment (assigned fund balance).
• Nonspendable: This classification includes amounts that cannot be spent because they are either (a) not in spendable form or (b) are legally or contractually required to be maintained intact. Nonspendable items are not expected to be converted to cash within the next year.
• Restricted: This classification includes amounts for which constraints have been placed on the use of the resources either (a) externally imposed by creditors, grantors, contributors, or laws or regulations of other governments, or (b) imposed by law through constitutional provisions or enabling legislation.
• Committed: This classification includes amounts that can be used only for specific purposes pursuant to constraints imposed by ordinance of the City Council. These amounts cannot be used for any other purpose unless the City Council removes or changes the specified use by taking the same type of action that was employed when the funds were initially committed. This classification also includes contractual obligations to the extent that existing resources have been specifically committed for use in satisfying those contractual requirements.
• Assigned: This classification includes amounts that are constrained by the City’s intent to be used for a specific purpose but are neither restricted nor committed. This intent can be expressed by the City Council or City Manager per the City’s Fund Balance Policy.
• Unassigned: This classification includes the residual fund balance for the General Fund. The unassigned classification also includes negative residual fund balance of any other governmental fund that cannot be eliminated by offsetting assigned fund balance amounts.
It is the City’s goal to achieve and maintain an unassigned fund balance in the General Fund equal to 5% of yearly expenditures. The City considers a balance of less than 5% to be cause for concern, barring unusual or deliberate circumstances. In the event that the unassigned fund balance is calculated to be less than the policy stipulates, the City shall plan to adjust budget resources in subsequent fiscal years to restore the balance.
30
12. Fund Balance Flow Assumption
Sometimes the City will fund outlays for a particular purpose from both restricted and unrestricted resources (the total of committed, assigned and unassigned fund balance). In order to calculate the amounts to report as restricted, committed, assigned and unassigned fund balance in the governmental fund financial statements, a flow assumption must be made about the order in which the resources are considered to be applied. It is the City’s policy to consider restricted fund balance to have been depleted before using any of the components of unrestricted fund balance. Further, when the components of unrestricted fund balance can be used for the same purpose, committed fund balance is depleted first, followed by assigned fund balance. Unassigned fund balance is applied last.
13. Use of Estimates
The preparation of financial statements in conformity with GAAP requires the use of management’s estimates.
14. Leases
The EDC is a lessor for noncancellable leases and recognizes a lease receivable and a deferred inflow of resources in the government‐wide and governmental fund financial statements. At the commencement of a lease, the EDC initially measures the lease receivable at the present value of payments expected to be received during the lease term. Subsequently, the lease receivable is reduced by the principal portion of lease payments received. The deferred inflow of resources is initially measured as the initial amount of the lease receivable, adjusted for lease payments received at or before the lease commencement date. Subsequently, the deferred inflow of resources is recognized as revenue over the life of the lease term.
Key estimates and judgments include how the EDC determines (1) the discount rate it uses to discount the expected lease receipts to present value, (2) lease term, and (3) lease receipts.
• The EDC uses its estimated incremental borrowing rate as the discount rate for leases.
• The lease term includes the noncancellable period of the lease. Lease receipts included in the measurement of the lease receivable are composed of fixed payments from the lessee.
The EDC monitors changes in circumstances that would require a remeasurement of its lease and will remeasure the lease receivable and deferred inflows of resources if certain changes occur that are expected to significantly affect the amount of the lease receivable.
The City has not entered into any lease agreements.
15. Pensions
For purposes of measuring the net pension liability, pension related deferred outflows and inflows of resources, and pension expense, City specific information about its Fiduciary Net Position in the Texas Municipal Retirement System (TMRS) and additions to/deductions from TMRS’s Fiduciary Net Position have been determined on the same basis as they are reported by TMRS. For this purpose, plan contributions are recognized in the period that compensation is reported for the employee, which is when contributions are legally due. Benefit payments and refunds are recognized when due and payable in accordance with the benefit terms. Investments are reported at fair value.
31
16. Other Post-Employment Benefits
TMRS Supplemental Death Benefits Fund. The City participates in the Texas Municipal Retirement System Supplemental Death Benefit Fund (TMRS SDBF), which is an optional single-employer defined benefit life insurance plan that is administered by TMRS. It provides death benefits to active and, if elected, retired employees of participating employers. Contribution rates are determined annually for each participating municipality as a percentage of that City’s covered payroll. The death benefit for retirees is considered an other postemployment benefit (OPEB). The OPEB program is an unfunded trust because the SDBF trust covers both actives and retirees and is not segregated. The Total OPEB Liability of the plan has been determined using the flow of economic resources measurement focus and full accrual basis of accounting. This includes for purposes of measuring the Total OPEB Liability, deferred inflows and outflows of resources, and OPEB expense. Benefit payments are recognized when due and payable in accordance with the benefit terms.
II. BUDGETS AND BUDGETARY ACCOUNTING
The City’s Home Rule Charter provides for the submission of the budget to the City Council by the City Manager. The City’s fiscal year runs October 1 through September 30.
The following procedures are followed in establishing the budgetary data:
• No later than August 15th, the City management submits to the City Council a proposed operating budget for the fiscal year commencing October 1. The operating budget includes proposed expenditures and the means of financing them.
• Public hearings are conducted to obtain taxpayer comments.
• Prior to September 30, the budget is legally enacted through passage of an ordinance.
• The level of control (the level at which expenditures may not exceed budget) is the fund level. The City Manager or Director of Finance is authorized to approve a transfer of budgeted amounts within departments; however, any revisions that alter the total of any fund must be approved by the City Council.
• Budgets for the General Fund, Debt Service Fund, Roadway Impact Fund, Capital Projects Fund, and Hotel/Motel Tax Fund are legally adopted on a basis consistent with generally accepted accounting principles. The City does not legally adopt a budget for the Fox Hollow PID Fund. The majority of the City’s Capital Projects Funds are budgeted on an annual basis. For budgeted capital projects not expended during the fiscal year, the City will roll those balances into the following year’s budget.
• According to the City Charter, total estimated expenditures of the General Fund are to be budgeted.
III. STEWARDSHIP, COMPLIANCE AND ACCOUNTABILITY Expenditures Exceeding Appropriations
For the year ended September 30, 2022, total expenditures exceeded appropriations in the following funds:
These overages were funded with existing fund balance.
32
Fund Budget Overage General Fund 195,551 $ Debt Service 906,953 Roadway Impact 108
IV. CASH AND INVESTMENTS
The City’s funds are required to be deposited and invested under the terms of a depository contract. The depository bank deposits for safekeeping and trust with the City’s agent bank approved pledged securities in an amount sufficient to protect City funds on a day-to-day basis during the period of the contract. The pledge of approved securities is waived only to the extent of the depository bank’s dollar amount of Federal Deposit Insurance Corporation (“FDIC”) insurance.
The City categorizes its fair value measurements within the fair value hierarchy established by generally accepted accounting principles. GASB Statement No. 72, Fair Value Measurement and Application provides a framework for measuring fair value which establishes a three-level fair value hierarchy that describes the inputs that are used to measure assets and liabilities.
• Level 1 inputs are quoted prices (unadjusted) for identical assets or liabilities in active markets that a government can access at the measurement date.
• Level 2 inputs are inputs other than quoted prices included within Level 1 that are observable for an asset or liability, either directly or indirectly.
• Level 3 inputs are unobservable inputs for an asset or liability.
The fair value hierarchy gives the highest priority to Level 1 inputs and the lowest priority to Level 3 inputs. If a price for an identical asset or liability is not observable, a government should measure fair value using another valuation technique that maximizes the use of relevant observable inputs and minimizes the use of unobservable inputs. If the fair value of an asset or a liability is measured using inputs from more than one level of the fair value hierarchy, the measurement is considered to be based on the lowest priority level input that is significant to the entire measurement.
As of September 30, 2022, the City had the following investments:
Of the City’s total fair value investments, $4,925,460 were valued using the present value of expected future cash flow model, $19,367,735 were valued using option-adjusted discounted cash flow model, and $36,346,290 were valued using documented trade history in exact security. The City invests in external investment pools with a credit rating of AAAm.
33
Weighted Average Maturity 9/30/2022 (Level 1) (Level 2) (Days) Primary government Certificates of deposit 5,126 $ Investment pools: TexPool 15,613,100 37 TexStar 5,021,119 39 Total investment pools 20,634,219 Investments by fair value level: Debt securities: U.S. Treasury Bonds 14,495,590 $ 14,495,590 $ - $ 608 Federal Home Loan Bank Bonds 33,346,290 - 33,346,290 753 Federal Farm Credit Bank Bonds 4,872,145 - 4,872,145 230 Hawaii ST-GB Municipal Bonds 3,000,000 - 3,000,000 366 Lloyds Bank Commercial Paper 4,925,460 - 4,925,460 1 Total debt securities 60,639,485 14,495,590 46,143,895 Total investments of the primary government 81,278,830 $ 14,495,590 $ 46,143,895 $ Portfolio weighted average maturity (days) 454 Component unit Certificates of deposit 6,868 $ Investment pools: TexPool 207,983 37 Total investments of the component unit 214,851 Total investments of the reporting entity 81,493,681 $ Fair Value Measurement Using Fair Value Measurement Using
Analysis of Specific Deposit and Investment Risks
Credit Risk – Credit risk is the risk that an issuer or other counterparty to an investment will not fulfill its obligations. The ratings of securities by nationally recognized rating agencies are designed to give an indication of credit risk. At year-end, the City was not significantly exposed to credit risk.
Custodial Credit Risk – Deposits are exposed to custodial credit risk if they are not covered by depository insurance and the deposits are uncollateralized, collateralized with securities held by the pledging financial institution, or collateralized with securities held by the pledging financial institution's trust department or agent but not in the City's name.
As of September 30, 2022, the City’s deposit balances were under collateralized by securities held by the financial institution in the City’s name or by Federal Deposit Insurance Corporation ("FDIC") insurance by $1,729,695.
Interest Rate Risk – This is the risk that changes in interest rates will adversely affect the fair value of an investment. At year end, the City was not exposed to interest rate risk.
Foreign Currency Risk – This is the risk that exchange rates will adversely affect the fair value of an investment. At year-end, the City was not exposed to foreign currency risk.
V. RECEIVABLES
Receivables as of year-end for the City’s individual major funds and nonmajor funds, including the applicable allowances for uncollectible accounts, are as follows:
VI. LEASE RECEIVABLES
A summary of leases receivable as of September 30, 2022, are as follows:
34
Proprietary General Debt Service Utility Total Accounts 854,133 $ - $ 2,765,353 $ 3,619,486 $ Taxes 2,184,786 124,730 - 2,309,516 Intergovernmental - 863,492 - 863,492 Gross Receivables 3,038,919 988,222 2,765,353 6,792,494 Less: Allowance for uncollectibles 657,057) ( 30,326) ( 334,965) ( 1,022,348) ( Net receivables 2,381,862 $ 957,896 $ 2,430,388 $ 5,770,146 $ Governmental Funds
Initial Amount Revenue Interest Year of of Initial Current Receivable Purpose of Lease Rate Lease Receivable Year 09/30/22 Component Unit - Forney EDC: Right to Use: Building 0.475% 2022 82,489 $ 23,568 59,037 Total leases receivable 23,568 $ 59,037 $
VII. CAPITAL ASSETS
Capital asset activity for the year ended September 30, 2022, was as follows:
35
Beginning Deletions/ Prior Period Ending Governmental activities: Balance Additions Transfers Adjustment Balance Capital assets, not being depreciated: Land 5,017,448 $ - $ 3,427,227 $ - $ 8,444,675 $ Construction in progress 2,922,536 7,886,641 5,591,496) ( - 5,217,681 Total assets not being depreciated 7,939,984 7,886,641 2,164,269) ( - 13,662,356 Capital assets, being depreciated: Buildings and improvements 24,463,501 6,620 1,888,047 - 26,358,168 Machinery and equipment 11,942,651 821,399 24,435) ( - 12,739,615 Infrastructure 49,499,237 7,211,136 58,090 30,154,938 86,923,401 Total capital assets being depreciated 85,905,389 8,039,155 1,921,702 30,154,938 126,021,184 Less accumulated depreciation: Buildings and improvements 6,502,521) ( 629,645) ( - - 7,132,166) ( Machinery and equipment 7,155,018) ( 1,174,321) ( 39,033 - 8,290,306) ( Infrastructure 16,077,751) ( 1,327,550) ( - - 17,405,301) ( Total accumulated depreciation 29,735,290) ( 3,131,516) ( 39,033 - 32,827,773) ( Total capital assets being depreciated, net 56,170,099 4,907,639 1,960,735 30,154,938 93,193,411 Governmental activities capital assets, net 64,110,083 $ 12,794,280 $ 203,534) $( 30,154,938 $ 106,855,767 $ Beginning Deletions/ Prior Period Ending Business-type activities: Balance Additions Transfers Adjustment Balance Capital assets, not being depreciated: Land 703,953 $ - $ - $ - $ 703,953 $ Construction in progress 55,868 5,031,134 4,014,843) ( - 1,072,159 Total assets not being depreciated 759,821 5,031,134 4,014,843) ( - 1,776,112 Capital assets, being depreciated: Sewer plant & infrastructure 15,460,474 2,472,056 4,216,717 8,414,270 30,563,517 Water plant & infrastructure 28,071,932 1,598,204 201,874) ( 5,547,831 35,016,093 Machinery and equipment 3,075,019 343,738 - - 3,418,757 Total capital assets being depreciated 46,607,425 4,413,998 4,014,843 13,962,101 68,998,367 Less accumulated depreciation: Sewer plant & infrastructure 3,513,403) ( 503,315) ( - - 4,016,718) ( Water plant & infrastructure 8,312,994) ( 805,869) ( - - 9,118,863) ( Machinery and equipment 1,811,915) ( 424,041) ( - - 2,235,956) ( Total accumulated depreciation 13,638,312) ( 1,733,225) ( - - 15,371,537) ( Total capital assets being depreciated, net 32,969,113 2,680,773 4,014,843 13,962,101 53,626,830 Business-type activities capital assets, net 33,728,934 $ 7,711,907 $ - $ 13,962,101 $ 55,402,942 $ Depreciation expense was charged to functions/programs of the primary government as follows: Governmental activities: General government 1,498,602 $ Public safety 507,222 Public works 432,184 Public services and operations 29,392 Culture and recreation 664,116 Total 3,131,516 $ Business-type activities: Utility 1,733,225 $ Total 1,733,225 $
Capital asset activity for the discretely presented component unit, Forney EDC, as of September 30, 2022, is as follows:
VIII. CONSTRUCTION COMMITMENTS
The City has several active construction projects as of September 30, 2022. The projects include street infrastructure, water/sewer infrastructure improvements, park improvements, and building improvements.
A summary of these projects as of September 30, 2022 included the following:
IX. LONG-TERM OBLIGATIONS
A summary of long-term debt transactions, including the current portion, for the year ended September 30, 2022, is as follows:
36
Beginning Ending Component Unit - Forney EDC Balance Additions Retirements Balance Capital assets, not being depreciated: Land 404,263 $ - $ - $ 404,263 $ Total assets not being depreciated 404,263 - - 404,263 Capital assets, being depreciated: Buildings and improvements 2,466,497 601,870 - 3,068,367 Machinery, furniture and equipment 50,416 - - 50,416 Total capital assets being depreciated 2,516,913 601,870 - 3,118,783 Less accumulated depreciation: Buildings and improvements 291,453) ( 289,531) ( - 580,984) ( Machinery, furniture and equipment 22,637) ( 7,407) ( - 30,044) ( Total accumulated depreciation 314,090) ( 296,938) ( - 611,028) ( Total capital assets being depreciated, net 2,202,823 304,932 - 2,507,755 Business-type activities capital assets, net 2,607,086 $ 304,932 $ - $ 2,912,018 $
Remaining Project Commitment Street improvements 2,051,276 $ Facilities improvements 9,555,470 Technology projects 887,611 Water/sewer line infrastructure projects 8,558,345 Total 21,052,702 $
Beginning Ending Due Within Governmental activities: Balance Increases Reductions Balance One Year General obligation bonds and certificates of obligation 23,265,000 $ - $ 3,540,000) $( 19,725,000 $ 2,690,000 $ Pass-through toll revenue and limited tax bond 7,565,000 - 2,920,000) $( 4,645,000 885,000 Tax Notes 930,000 300,000) ( 630,000 310,000 Plus: Issuance premiums 1,783,033 - 276,809) ( 1,506,224Less: Issuance discounts 232,854) ( - 25,262 207,592) (Financing arrangements 219,724 - 45,493) ( 174,231 46,794 Total long-term debt 33,529,903 - 7,057,040) ( 26,472,863 3,931,794 Compensated absences 591,384 587,895 649,854) ( 529,425 132,356 Total governmental long-term liabilities 34,121,287 $ 587,895 $ 7,706,894) $( 27,002,288 $ 4,064,150 $
Other Information
The liability for compensated absences is liquidated by the General Fund with an estimated 86% and the Utility Fund is responsible for the remaining 14%.
The City’s notes payable contains a provision that in the event of default, outstanding amounts become immediately due. The City’s general obligation bonds, certificates of obligation, and tax notes contain a provision that in an event of default, creditors may seek a writ of mandamus to compel City officials to carry out their legally imposed duties with respect to debt. As outstanding debt does not become immediately due, the remedy of mandamus may have to be relied upon from year to year.
Governmental Long-Term Debt
Debt service requirements are as follows:
A brief discussion of each bond issuance follows:
• $1,030,000 Series 2012 Tax and Waterworks and Sewer System (Limited Pledge) Revenue Certificate of Obligations issued November 6, 2012 for the purpose of land acquisition.
• $2,235,000 Series 2012 General Obligation bonds issued November 6, 2012 for the purpose of refinancing the 2000B CO portions of the 2003 CO.
• $4,945,000 Series 2014 Tax and Waterworks and Sewer System (Limited Pledge) Revenue Certificate of Obligations issued November 4, 2014 for the purpose of constructing and equipping a new fire station and an animal shelter.
37 Beginning Ending Due Within Business-type activities: Balance Increases Reductions Balance One Year Utility Fund: General obligation and certificate of obligation 2,920,000 $ - $ 435,000) $( 2,485,000 $ 455,000 $ Plus: Issuance premiums 16,402 - 4,101) ( 12,301Total long-term debt 2,936,402 - 439,101) ( 2,497,301 455,000 Compensated absences 25,846 85,346 62,221) ( 48,971 12,243 Total business-type long-term liabilities 2,962,248 $ 85,346 $ 501,322) $( 2,546,272 $ 467,243 $
Amounts Outstanding Interest Amounts September 30, Description Rates Issued 2022 Certificates of Obligation, Series 2012 1.0% - 3.0% 1,030,000 600,000 General Obligation Bonds, Series 2012 0.4% - 1.9% 2,235,000 195,000 Certificates of Obligation, Series 2014 2.0% - 4.0% 4,945,000 3,535,000 General Obligation Bonds, Series 2014 2.0% - 3.5% 3,440,000 715,000 General Obligation Bonds, Series 2015 3.5% - 4.0% 8,585,000 8,585,000 Certificates of Obligation, Series 2016 2.0% - 3.0% 2,500,000 1,900,000 General Obligation Bonds, Series 2016 2.0% - 4.0% 8,220,000 655,000 Pass-through Toll Revenue & Limited Tax Refunding Bonds, Series 2017 3.0% - 5.0% 11,465,000 4,645,000 General Obligation Bonds, Series 2020 1.29% 3,885,000 3,540,000 Total Bonds Payable 46,305,000 $ 24,370,000 $
Year Ending September 30, Principal Interest Total 2023 3,575,000 $ 827,287 $ 4,402,287 $ 2024 2,815,000 718,753 3,533,753 2025 2,905,000 625,731 3,530,731 2026 3,005,000 527,849 3,532,849 2027 2,850,000 421,807 3,271,807 2028-2032 7,885,000 1,132,528 9,017,528 2033-2036 1,335,000 66,572 1,401,572 Total 24,370,000 $ 4,320,527 $ 28,690,527 $ Governmental Activities
• $3,440,000 Series 2014 General Obligation Refunding Bonds issued November 1, 2014 for the purpose of refinancing portions of the 2005A Certificates of Obligations.
• $8,585,000 Series 2015 General Obligation Refunding Bonds issued June 1, 2015 for the purpose of refinancing portions of the 2007 General Obligation Bonds.
• $2,500,000 Series 2016 Tax and Waterworks and Sewer System (Limited Pledge) Revenue Certificates of Obligation issued for the purpose of improvement to certain roadways.
• $8,220,000 Series 2016 General Obligation Refunding Bonds issued August 2, 2016 for the purpose of refinancing portions of the 2007 General Obligation Bonds.
• $11,465,000 Series 2017 Subordinate Lien Pass-through Toll Revenue and Limited Tax Refunding Bonds issued August 15, 2017 for the purpose of refinancing portions of the 2008 Pass-through Toll Revenue and Limited Tax Revenue Bonds.
• $3,885,000 Series 2020 General Obligation Refunding bonds November 19, 2020 for the purpose of refinancing portions of the General Obligation Bonds, Series 2011 and all of the Certificates of Obligation, Series 2011.
Tax Notes Payable
The City issued Series 2017 Tax Notes with BNY Mellon in the amount of $2,055,000 for the purpose of acquisition of public safety equipment on August 15, 2017.
Debt service requirements for this tax note are as follows:
Financing Arrangements
In fiscal year 2018, the City purchased land previously known as Pinson Farm and entered into a financing agreement in the amount of $406,000
Debt service requirements for this financing arrangement are as follows:
Business-type
38
Year Ending September 30, Principal Interest Total 2023 310,000 $ 14,250 $ 324,250 $ 2024 320,000 4,800 324,800 Total 630,000 $ 19,050 $ 649,050 $ Governmental Activities
Year Ending September 30, Principal Interest Total 2023 46,794 $ 4,314 $ 51,108 $ 2024 48,131 2,977 51,108 2025 49,507 1,601 51,108 2026 29,799 283 30,082 Totals 174,231 $ 9,175 $ 183,406 $
Governmental Activities
Long-term Debt Amounts Interest Outstanding Rate Amounts September 30, Description Payable Issued 2022 General Obligation Bonds, Series 2014 2.25%-3.5% 1,290,000 $ 435,000 $ General Obligation Bonds, Series 2014A 2.25%-3.5% 1,350,000 445,000 General Obligation Bonds, Series 2020 WS 1.29% 1,820,000 1,605,000 4,460,000 $ 2,485,000 $
Debt service requirements are as follows:
Business-type Activities
A brief discussion of each bond issuance follows:
• $1,290,000 Series 2014 General Obligation Refunding Bonds issued November 1, 2014 for the purpose of refinancing portions of the 2005A Certificates of Obligations.
• $1,350,000 Series 2014A General Obligation Refunding Bonds issued November 1, 2014 for the purpose of refinancing portions of the 2005B Certificates of Obligations.
• $1,820,000 Series 2020 General Obligation Refunding bonds November 19, 2020 for the purpose of refinancing portions of the Certificates of Obligation, Series 2011.
Component Unit Long-term Debt
On September 19, 2013, the Forney EDC issued $2,000,000 of Sales Tax Revenue Bonds, Series 2013. These bonds were issued for the acquisition, improvement and equipment of land, buildings, and facilities to lease or sell to businesses in downtown Forney. Interest rates on the debt are set at 4.25% and final maturity will be in fiscal year 2032.
Debt service requirements are as follows:
39
Year Ending September 30, Principal Interest Total 2023 455,000 $ 41,052 $ 496,052 $ 2024 465,000 30,671 495,671 2025 475,000 19,684 494,684 2026 175,000 12,932 187,932 2027 180,000 10,643 190,643 2028-2032 735,000 19,060 754,060 Total 2,485,000 $ 134,042 $ 2,619,042 $
Beginning Ending Due Within Balance Increases Reductions Balance One Year Component Unit - Forney EDC: Series 2013 Sales Tax Revenue Bond 1,530,000 $ - $ 110,000) $( 1,420,000 $ 115,000 $ Total long-term debt 1,530,000 - 110,000) ( 1,420,000 115,000 Compensated absences 5,487 15,100 12,124) ( 8,463 $ 2,116 Total business-type long-term liabilities 1,535,487 $ 15,100 $ 122,124) $( 1,428,463 $ 117,116 $
Year Ending September 30, Principal Interest Total 2023 115,000 67,603 182,603 2024 120,000 62,715 182,715 2025 125,000 57,615 182,615 2026 130,000 51,990 181,990 2027 135,000 46,140 181,140 2028-2032 795,000 124,173 919,173 Total 1,420,000 $ 410,236 $ 1,830,236 $
Component Unit - Forney EDC
INTERFUND TRANSFERS
Interfund Transfers
The primary purpose of interfund transfers is the transfer of funds from one fund to support expenditures of another fund in accordance with the authority established for the individual fund
A summary of interfund transfers by fund type is as follows:
Transfers to and from the various funds to the capital projects fund are made in order to fund capital projects or other capital purchases. Transfers made from the utility fund to the general fund were made in order to fund capital projects. The transfer made from capital projects to debt service fund is to cover debt service payments.
XI. DEFINED BENEFIT PENSION Plan Description
The City of Forney participates as one of 901 plans in the nontraditional, joint contributory, hybrid defined benefit pension plan administered by the Texas Municipal Retirement System (TMRS). TMRS is an agency created by the State of Texas and administered in accordance with the TMRS Act, Subtitle G, Title 8, Texas Government Code (the TMRS Act) as an agent multiple-employer retirement system for municipal employees in the State of Texas. The TMRS Act places the general administration and management of the System with a six-member Board of Trustees. Although the Governor, with the advice and consent of the Senate, appoints the Board, TMRS is not fiscally dependent on the State of Texas. TMRS’s defined benefit pension plan is a tax-qualified plan under Section 401 (a) of the Internal Revenue Code. TMRS issues a publicly available annual comprehensive financial report (ACFR) that can be obtained at www.tmrs.com.
All eligible employees of the city are required to participate in TMRS.
Benefits Provided
TMRS provides retirement, disability, and death benefits. Benefit provisions are adopted by the governing body of the city, within the options available in the state statutes governing TMRS.
At retirement, the benefit is calculated as if the sum of the employee’s contributions, with interest, and the City-financed monetary credits with interest were used to purchase an annuity. Members may choose to receive their retirement benefit in one of seven payments options. Members may also choose to receive a portion of their benefit as a Partial Lump Sum Distribution in an amount equal to 12, 24, or 36 monthly payments, which cannot exceed 75% of the member’s deposits and interest.
A summary of plan provisions for the City are as follows:
40 X.
Transfers from Transfers to Amount General fund Capital Projects fund 15,000,000 $ Roadway General fund 697,000 Roadway Capital Projects fund 350,000 Utility fund General fund 1,270,329 Capital Projects fund Utility fund 1,146,138 Capital Projects fund Debt Service fund 55,367 Total 18,518,834 $
Employee deposit rate 7% Matching ratio (City to employee) 2 to 1 Years required for vesting 5 Service retirement eligibility 20 years to any age, 5 years at age 60 and above Updated service credit 100% Repeating Annuity increase to retirees 70% of CPI, repeating
Employees covered by benefit terms
At the December 31, 2021 valuation and measurement date, the following employees were covered by the benefit terms:
Contributions
The contribution rates for employees in TMRS are either 5%, 6%, or 7% of employee gross earnings, and the city matching percentages are either 100%, 150%, or 200%, both as adopted by the governing body of the city. Under the state law governing TMRS, the contribution rate for each city is determined annually by the actuary, using the Entry Age Normal (EAN) actuarial cost method. The actuarially determined rate is the estimated amount necessary to finance the cost of benefits earned by employees during the year, with an additional amount to finance any unfunded accrued liability.
Employees for the City of Forney were required to contribute 7% of their annual gross earnings during the fiscal year. The contribution rates for the City of Forney were 14.26% and 14.32% in the calendar years 2021 and 2022, respectively. The city’s contributions to TMRS for the year ended September 30, 2022, were $2,015,209, and were equal to the required contributions.
Net Pension Liability
The City’s Net Pension Liability (NPL) was measured as of December 31, 2021, and the Total Pension Liability (TPL) used to calculate the Net Pension Liability was determined by an actuarial valuation as of that date.
Within the governmental activities, the General Fund typically liquidates the net pension liability.
Actuarial assumptions
The Total Pension Liability in the December 31, 2022 actuarial valuation was determined using the following actuarial assumptions:
Salary increases were based on a service-related table. Mortality rates for active members are based on the PUB(10) mortality tables with the Public Safety table used for males and the General Employee table used for females. Mortality rates for healthy retirees and beneficiaries are based on the Genderdistinct 2019 Municipal Retirees of Texas mortality tables. The rates for actives, healthy retirees and beneficiaries are projected on a fully generational basis by Scale UMP to account for future mortality improvements. For disabled annuitants, the same mortality tables for healthy retirees are used with a 4-year set-forward for males and a 3-year set-forward for females. In addition, a 3.5% and 3.0% minimum mortality rate will be applied to reflect the impairment for younger members who become disabled for males and females. The rates are projected on a fully generational basis by Scale UMP to account for future mortality improvements subject to the floor.
The actuarial assumptions were developed primarily from the actuarial investigation of the experience of TMRS over the four-year period from December 31, 2014 to December 31, 2018. They were adopted in 2019 and first used in the December 31, 2019 actuarial valuation. The post-retirement mortality assumption for healthy annuitants and Annuity Purchase Rate (APRs) are based on the Mortality Experience Investigation Study covering 2009 through 2011 and dated December 31, 2013. In conjunction with these changes first used in the December 31, 2013. Plan assets are managed on a total return basis with an emphasis on both capital appreciation as well as the production of income, in order to satisfy the short-term and long-term funding needs of TMRS
41
Inactive employees or beneficiaries currently receiving benefits 30 Inactive employees entitled to but not yet receiving benefits 77 Active employees 176 Total 283
Inflation 2.50% Overall payroll growth 2.75% per year Investment Rate of Return 6.75%, net position plan investment expense, including inflation
The long-term expected rate of return on pension plan investments was determined using a buildingblock method in which best estimate ranges of expected future real rates of return (expected returns, net of pension plan investment expense and inflation) are developed for each major asset class. These ranges are combined to produce the long-term expected rate of return by weighting the expected future real rates of return by the target asset allocation percentage and by adding expected inflation. In determining their best estimate of a recommended investment return assumption under the various alternative asset allocation portfolios, GRS focused on the area between (1) arithmetic mean (aggressive) without an adjustment for time (conservative) and (2) the geometric mean (conservative) with an adjustment for time (aggressive). The target allocation and best estimates of real rates of return for each major asset class in fiscal year 2022 are summarized in the following table:
Discount Rate
The discount rate used to measure the Total Pension Liability was 6.75%. The projection of cash flows used to determine the discount rate assumed that employee and employer contributions will be made at the rates specified in statute. Based on that assumption, the pension plan’s Fiduciary Net Position was projected to be available to make all projected future benefit payments of current active and inactive employees. Therefore, the long-term expected rate of return on pension plan investments was applied to all periods of projected benefit payments to determine the Total Pension Liability.
Changes in the Net Pension Liability
42
Long-term Expected Real Rate of Return Asset Class Target Allocation (Arithmetic) Core Fixed Income 6.0% 2.00% Non-Core Fixed Income 20.0% 5.68% Global Equity 35.0% 7.55% Real Estate 12.0% 6.85% Other public & private markets 12.0% 7.22% Hedge funds 5.0% 5.35% Private Equity 10.0% 10.00% Total 100.0%
Total Pension Plan Fiduciary Net Pension Liability Net Position Liability (a) (b) (a) - (b) Balance at 12/31/2020 33,141,376 $ 28,646,236 $ 4,495,140 $ Changes for the year: Service cost 2,195,120 - 2,195,120 Interest 2,287,374 - 2,287,374 Difference between expected and actual experience 150,131 - 150,131 Contributions - employer - 1,705,039 1,705,039) ( Contributions - employee - 842,887 842,887) ( Net investment income - 3,745,475 3,745,475) ( Benefit payments, including refunds of employee contributions 703,838) ( 703,838) (Administrative expense - 17,278) ( 17,278 Other changes - 118 118) ( Net changes 3,928,787 5,572,403 1,643,616) ( Balance at 12/31/2021 37,070,163 $ 34,218,639 $ 2,851,524 $ Increase (Decrease)
The following presents the net pension liability of the City and EDC, calculated using the discount rate of 6.75%, as well as what the City and EDC’s net pension liability would be if it were calculated using a discount rate that is 1-percentage-point lower (5.75%) or 1-percentage-point higher (7.75%) than the current rate:
Pension Plan Fiduciary Net Position
Detailed information about the pension plan’s Fiduciary Net Position is available in a separately issued TMRS financial report. The report may be obtained on the Internet at www.tmrs.com.
Pension Expense and Deferred Outflows of Resources and Deferred Inflows of Resources Related to Pensions
For the year ended September 30, 2022 the City and EDC recognized pension expense of $898,191, $327,248, and $36,536 in the governmental activities, business-type activities, and EDC, respectively
At September 30, 2022 the City and EDC reported deferred outflows of resources and deferred inflows of resources related to pensions from the following sources:
$1,498,470 and $18,661 reported as deferred outflows of resources related to pension resulting from contributions subsequent to the measurement date will be recognized as a reduction of the net pension liability for the year ending September 30, 2023 for the City and EDC, respectively.
43
1% Decrease Current Single 1% Increase in Discount Discount Rate in Discount Rate (5.75%) (6.75%) Rate (7.75%) Primary government 9,770,347 $ 2,816,450 $ 2,697,547) $( Discretely presented component unit 121,672 35,074 33,593) ( Total 9,892,019 $ 2,851,524 $ 2,731,140) $(
Primary Government: Deferred Deferred Outflows of Resources Inflows of Resources Differences between expected and actual economic experience 1,050,089 $ 173,334 $ Changes in actuarial assumptions 122,242 8,410 Difference between projected and actual investment earnings - 1,888,197 Contributions subsequent to the measurement date 1,498,470Total 2,670,801 $ 2,069,941 $ Component Unit - Forney EDC: Deferred Deferred Outflows of Resources Inflows of Resources Differences between expected and actual economic experience 13,077 $ 2,159 $ Changes in actuarial assumptions 1,522 105 Difference between projected and actual investment earnings - 23,513 Contributions subsequent to the measurement date 18,661Total 33,260 $ 25,777 $
Other amounts reported as deferred outflows and inflows of resources related to pensions will be recognized in pension expenses as follows:
Within the governmental activities, the General Fund generally liquidates the net pension liability. In the business-type activities, the net pension liability is liquidated by the Utility Fund.
Health Care Coverage
During the year ended September 30, 2022, employees of the City were covered by a health insurance plan (“Plan”). The City contributed $485 per month per employee. The City also contributes to the cost of dependent coverage on the following scale: 50% for employees with a base salary that is less than $50,000 annually, 40% for employees with a base salary between $50,001 and $75,000 annually, 30% for employees with a base salary between $75,001 and $100,000 annually and 25% for employees with a base salary over $100,000. The City Manager received 50% of the cost for dependents as agreed in his contract. Employees, at their option, authorized payroll withholdings to pay contributions for their dependents. All contributions were paid to Blue Cross Blue Shield. The Plan was authorized by Article 3.51-2, Texas Insurance code, and is documented by contractual agreement.
Insurance Coverage
In accordance with state statue, the City was protected against unanticipated catastrophic individual or aggregate loss by stop-loss coverage carried through Texas Municipal League, a commercial insurer licensed or eligible to do business in Texas, in accordance with the Texas Insurance code. Stop-loss coverage was in effect for individual claims exceeding $125,000 and for aggregate loss. According to the latest actuarial opinion dated October 1, 2013, the unfunded claim benefit obligation included no reported claims that were unpaid and no estimated claims incurred, but not reported.
XII. DEFINED OTHER POST-EMPLOYMENT BENEFIT PLANS Plan Description
The City voluntarily participates in a single-employer other postemployment benefit (OPEB) plan administered by TMRS. The Plan is a group-term life insurance plan known as the Supplemental Death Benefits Fund (SDBF). The Plan is established and administered in accordance with the TMRS Act identically to the City’s pension plan. SDBF includes coverage for both active and retired members, and assets are commingled for the payment of such benefits. Therefore, the Plan does not qualify as an OPEB Trust in accordance with paragraph 4 of GASB Statement No. 75.
Benefits Provided
The SDBF provides group-term life insurance to City employees who are active members in TMRS, including or not including retirees. The City Council opted into this program via an ordinance, and may terminate coverage under, and discontinue participation in, the SDBF by adopting an ordinance before November 1 of any year to be effective the following January 1.
Payments from this fund are similar to group-term life insurance benefits, and are paid to the designated beneficiaries upon the receipt of an approved application for payment. The death benefit for active employees provides a lump-sum payment approximately equal to the employee’s annual salary (calculated based on the employee’s actual earnings for the 12-month period preceding the month of death). The death benefit for retirees is considered an other employment benefit and is a fixed amount of $7,500.
44
Year ended, Primary Component September 30, Government Unit 2022 236,163) $( 2,941) $( 2023 536,036) ( 6,675) ( 2024 143,351) ( 1,785) ( 2025 131,492) ( 1,637) ( 2026 124,846 1,555 Thereafter 24,586 305
Contributions
The City contributes to the SDBF at a contractually required rate as determined by an annual actuarial valuation, which was 0.10% and 0.10% for 2021 and 2022, of which 0.02% and 0.02%, respectively, represented the retiree-only portion for each year, as a percentage of annual covered payroll. The rate is equal to the cost of providing one-year term life insurance. The funding policy for the SDBF program is to assure that adequate resources are available to meet all death benefit payments for the upcoming year; the intent is not to prefund retiree term life insurance during employees’ entire careers. The City’s contributions to the SDBF for the years ended September 30, 2022 and 2021 were $14,189 and $12,951, respectively, representing contributions for both active and retiree coverage, which equaled the required contributions each year.
Actuarial Assumptions
The total OPEB lLiability in the December 31, 2021 actuarial valuation was determined using the following actuarial assumptions:
Administrative expenses for the SDBF are paid through the TMRS Pension Trust Fund and are wholly accounted for under the provisions of GASB Statement No. 68.
Salary increases were based on a service-related table. Mortality rates for active members are based on the PUB(10) mortality tables with the Public Safety table used for males and the General Employee table used for females. Mortality rates for healthy retirees and beneficiaries are based on the Genderdistinct 2019 Municipal Retirees of Texas mortality tables. The rates for actives, healthy retirees and beneficiaries are projected on a fully generational basis by Scale UMP to account for future mortality improvements. For disabled annuitants, the same mortality tables for healthy retirees are used with a 4-year set-forward for males and a 3-year set-forward for females. In addition, a 3.5% and 3.0% minimum mortality rate will be applied to reflect the impairment for younger members who become disabled for males and females. The rates are projected on a fully generational basis by Scale UMP to account for future mortality improvements subject to the floor.
The actuarial assumptions used in the December 31, 2021 valuation were based on the results of an actuarial experience study for the period December 31, 2014 to December 31, 2018
Discount Rate
The SDBF program is treated as an unfunded OPEB plan because the SDBF trust covers both actives and retirees and the assets are not segregated for these groups. As such, a single discount rate of 1.84% was used to measure the total OPEB liability. Because the plan is essentially a “pay-as-you-go” plan, the single discount rate is equal to the prevailing municipal bond rate. The source of the municipal bond rate was fixed-income municipal bonds with 20 years to maturity that include only federally tax-exempt municipal bonds as reported in Fidelity Index’s “20-year Municipal GO AA Index”
as of December 31, 2021.
45 The number of employees currently covered by the benefit terms is as follows: Inactive employees or beneficiaries currently receiving benefits 25 Inactive employees entitled to but not yet receiving benefits 19 Active employees 176 Total 220
Inflation rate 2.50% per annum Projected salary increases 3.50% to 11.5% including inflation Discount rate 1.84%
Discount Rate Sensitivity Analysis
The following schedule shows the impact of the Total OPEB Liability if the discount rate used was 1% less than and 1% greater than the discount rate that was used (1.84%) in measuring the total OPEB liability.
Total
At September 30, 2022, the City and EDC reported a liability of $305,734 for its total OPEB liability. The total OPEB liability was determined by an actuarial valuation as of December 31, 2021. Changes in assumptions and other inputs reflect a change in the discount rate from 2.00% to 1.84%
Within the governmental activities, the General Fund typically liquidates the total OPEB liability. In the business-type activities, the total OPEB liability is liquidated by the Utility Fund.
Changes in the Total OPEB Liability
OPEB Expense and Deferred Outflows of Resources and Deferred Inflows of Resources Related to Pensions
For the year ended September 30, 2022 the City and EDC recognized pension expense of $16,953, $17,762, and $2,066 in the governmental activities, business-type activities, and EDC, respectively.
At September 30, 2022, the City and EDC reported deferred outflows of resources and deferred inflows of resources related to other post-employment benefits from the following sources:
46
1% Decrease Current Single 1% Increase in Discount Discount Rate in Discount Rate (0.84%) (1.84%) Rate (2.84%) Primary government 387,198 $ 301,973 $ 237,812 $ Discretely presented component unit 4,822 3,761 2,962 Total 392,020 $ 305,734 $ 240,774 $
OPEB Liability
Total OPEB Liability Balance at 12/31/2020 294,578 $ Changes for the year: Service cost 25,289 Interest 6,120 Difference between expected and actual experience 29,595) ( Changes of assumptions 11,750 Benefit payments 2,408) ( Net changes 11,156 Balance at 12/31/2021 305,734 $
Deferred Deferred Outflows of Resources Inflows of Resources Primary Government: Differences between expected and actual economic experience - $ 46,113 $ Changes in actuarial assumptions 87,266 9,373 Contributions subsequent to the measurement date 2,108Totals 89,374 $ 55,486 $
$2,108 and $26 reported as deferred outflows of resources related to OPEB resulting from contributions subsequent to the measurement date will be recognized as a reduction of the total OPEB liability for the year ending September 30, 2023 for the City and EDC, respectively. Other amounts of the reported as deferred outflows and inflows of resources related to OPEB will be recognized in OPEB expense as follows:
XIII. RISK MANAGEMENT
The City of Forney is exposed to various risks of loss related to tort liability, theft of and damage to property and destruction of assets; public officials’ errors and omissions; bodily injury and property damage; injury to employees and natural disasters. The City has general liability coverage at a cost that is considered to be economically justifiable by joining together with other governmental entities in the State as a member of the Texas Municipal League Intergovernmental Risk Pool (“TML”). TML is a selffunded pool operating as a common risk management and insurance program. The City pays an annual premium for TML for its above insurance coverage. The agreement for the formation of TML provides that TML will be self-sustaining through member premiums and will reinsure through commercial companies for claims in excess of acceptable risk levels; however, each category has its own level of reinsurance. The City continued to carry commercial insurance for other risks of loss. There were no significant reductions in commercial insurance coverage in the past fiscal year and settled claims resulting from these risks have not exceeded coverage in any of the past three fiscal years.
XIV. COMMITMENTS AND CONTINGENCIES
The City is a defendant in several pending lawsuits. City management estimates, based on the advice of legal counsel, that the potential claims against the City, in excess of insurance coverage, would not materially affect the basic financial statements of the City.
The City participates in a number of federal and state grant programs. These programs are subject to program compliance audits by the grantors or their representatives. Any liability that may arise as the result of these audits is not believed to be estimable or probable.
XV. TXDOT RECEIVABLE
The Texas Department of Transportation (TXDOT) has entered into a contract with the City of Forney to pay the City an annual amount of no less than $2,009,570 annually beginning in the year 2013 and ending in the year 2031. This payment is to reimburse the City for a portion of the costs associated with the construction of highway improvements to FM 740, FM 741 and US 80/FM 548 Interchange.
The City received a payment from TxDOT in the amount of $4,019,141 during the current fiscal year. The remaining balance of the receivable is $863,492
47 Deferred Deferred Outflows of Resources Inflows of Resources EDC: Differences between expected and actual economic experience - $ 574 $ Changes in actuarial assumptions 1,087 117 Contributions subsequent to the measurement date 26Totals 1,113 $ 691 $
Year ended, Primary Component September 30, Government Unit 2023 5,309 $ 66 $ 2024 5,309 66 2025 5,309 66 2026 5,309 66 2027 4,399 55 Thereafter 6,145 77
XVI. ADDITIONAL WATER AND SEWER INFORMATION
The City of Forney secures its water supply and sewer services from the North Texas Municipal Water District (“District”), a district authorized by the Texas Constitution, Article XVI, Section 59; created by the Texas Legislature, Article 8280-141; and authorized to act by the confirming vote of the majority of the qualified voters in each of the cities comprising the District. The District has police, taxation and eminent domain powers and is authorized to issue revenue and/or tax bonds upon approval by the Attorney General of the State of Texas and functions as a political subdivision of the State of Texas independent of the City. The District is governed by a 17-member board (“Board”). The Board has full power and discretion to establish its budget and to set the rates for the services it provides by contract with its member cities and customers. The Board is empowered by statue and contract, or otherwise permitted by laws, to discontinue a facility or service in order to prevent an abuse or to enforce payment of an unpaid charge, fee or rental due to the District. Because of the factors mentioned above, the District is not included in the City’s basic financial statements.
The City purchases its water from the North Texas Municipal Water District (“NTMWD”). Each year, NTMWD calculates the cost of water based upon the previous year’s usage. The City currently pays $2.99 per thousand gallons for water with total cost for this current fiscal year being $7,384,375
The City entered into a contract for wastewater treatment services with the District. The District has been designated by the Texas Water Quality Board as the regional agency to provide and develop a Regional System for Wastewater Treatment in the general area of the East Fork of the Trinity River, which includes the City of Forney and other cities located in Collin, Dallas, Kaufman and Rockwall Counties, Texas. Relative thereto, the City of Forney and other cities have entered into wastewater system contracts with the District, which provide for the establishment, operation and maintenance of a Regional Wastewater System for the purpose of providing facilities to adequately receive, transport, treat and dispose of wastewater for the cities. In order to provide said service, the contract provides that (a) the District will acquire, design, construct and complete the system, repair, replace and/or extend the system to provide service to the cities; (b) in consideration of payments to be made under the contract, each of the cities shall have the right to discharge all of its wastewater from its sewage system into the District’s system, subject to certain quality requirements set forth in the contract; (c) the District will issue its bonds, in amounts and at times determined by the District, to provide for the wastewater treatment facilities; (d) each city agrees to pay its proportionate share of the annual requirement sufficient to pay or provide for the payment of an “Operation and Maintenance Component” and a “Bond Service Component.”
Each city’s proportionate share of the annual requirement shall be a percentage obtained by dividing such city’s estimated contributing flow to the system by the total estimated contributing flow to the system by all cities during such fiscal year. No city will exercise oversight responsibility for the District and no city is liable for the District’s debt. The City of Forney’s payment for the current fiscal period was $3,208,825.
XVII. TAX ABATEMENTS
The City negotiates property tax abatement agreements and direct sales tax reimbursement agreements on an individual basis. The City has tax abatement agreements with three entities as of September 30, 2022:
XVIII. PRIOR PERIOD ADJUSTMENT
During the fiscal year, the City determined that infrastructure was understated at the beginning of the year due to capital assets developers contributed to the City not being reported in the statement of net position. Therefore, the City increased its governmental and business-type activities beginning net position by $29,989,095 and $13,962,101, respectively.
48
Percentage Amount of of Taxes Taxes Abated Abated during during the Purpose the Fiscal Year Fiscal Year Bloomfield Homes 60% 21,013 $ Highland Homes 80% 65,025 First Texas Homes 80% 34,730
ACCOUNTING PRINCIPLES
Significant new accounting standards issued by the Governmental Accounting Standards Board (GASB) not yet implemented by the District include the following:
Statement No. 94, Public-Private and Public-Public Partnerships and Availability Payment Arrangements
– The primary objective of this Statement is to improve financial reporting by addressing issues related to public-private and public-public partnership arrangements (PPPs). As used in this Statement, a PPP is an arrangement in which a government (the transferor) contracts with an operator (a governmental or nongovernmental entity) to provide public services by conveying control of the right to operate or use a nonfinancial asset, such as infrastructure or other capital asset (the underlying PPP asset), for a period of time in an exchange or exchangelike transaction. GASB 94 will become effective for reporting periods beginning after June 15, 2022, and the impact has not yet been determined.
Statement No. 96, Subscription-Based Information Technology Arrangements - This Statement provides guidance on the accounting and financial reporting for subscription-based information technology arrangements (SBITAs) for government end users (governments). This Statement (1) defines a SBITA; (2) establishes that a SBITA results in a right-to-use subscription asset an intangible asset and a corresponding subscription liability; (3) provides the capitalization criteria for outlays other than subscription payments, including implementation costs of a SBITA; and (4) requires note disclosures regarding a SBITA. To the extent relevant, the standards for SBITAs are based on the standards established in Statement No. 87, Leases, as amended. This Statement will become effective for reporting periods beginning after June 15, 2022, and the impact has not yet been determined.
GASB Statement No. 100, Accounting Changes and Error Corrections an amendment of GASB Statement No. 62 - The primary objective of this Statement is to enhance accounting and financial reporting requirements for accounting changes and error corrections to provide more understandable, reliable, relevant, consistent, and comparable information for making decisions or assessing accountability. This Statement will become effective for reporting periods beginning after June 15, 2023, and the impact has not yet been determined.
GASB Statement No. 101, Compensated Absences - The objective of this Statement is to better meet the information needs of financial statement users by updating the recognition and measurement guidance for compensated absences. That objective is achieved by aligning the recognition and measurement guidance under a unified model and by amending certain previously required disclosures. This Statement will become effective for reporting periods beginning after December 15, 2023, and the impact has not yet been determined.
49 XIX. NEW
THIS PAGE LEFT BLANK INTENTIONALLY
REQUIRED SUPPLEMENTARY
INFORMATION
CITY OF FORNEY, TEXAS
FOR THE YEAR ENDED SEPTEMBER 30, 2022
Variance with Final Budget Positive Original Final Actual (Negative) REVENUES Property taxes 8,295,876 $ 8,317,876 $ 8,415,728 $ 97,852 $ Sales taxes 9,741,027 11,090,220 11,325,531 235,311 Franchise taxes 3,480,000 3,530,000 3,527,220 2,780) ( Beverage taxes 45,000 60,000 70,731 10,731 Licenses and permits 2,128,000 4,763,500 5,702,180 938,680 Intergovernmental revenues - - 40,676 40,676 Charges for services 1,474,133 1,424,091 1,468,830 44,739 Fines and forfeitures 195,300 180,450 195,911 15,461 Investments earnings 50,000 120,741 1,138,794) ( 1,259,535) ( Contributions and donations - 7,500 7,182 318) ( Miscellaneous 79,500 66,251 190,773 124,522 Total revenues 25,488,836 29,560,629 29,805,968 245,339 EXPENDITURES Current: General government: Administration and public information 7,211,882 6,328,116 6,079,528 248,588 Municipal court 348,661 335,700 343,362 7,662) ( Public safety: Police 6,076,800 5,373,934 5,705,748 331,814) ( Fire 6,129,676 5,325,440 5,429,391 103,951) ( Public works: Streets 1,554,600 1,531,360 1,470,765 60,595 Planning and development 730,896 641,738 583,496 58,242 Facilities maintenance 812,784 898,981 797,655 101,326 Fleet management 486,920 647,525 687,107 39,582) ( Public services and operations: Building inspections 717,198 695,914 653,147 42,767 Animal control 373,986 344,840 348,305 3,465) ( Culture and recreation: Parks 2,062,310 1,709,800 1,930,395 220,595) ( Total expenditures 26,505,713 23,833,348 24,028,899 195,551) ( EXCESS (DEFICIENCY) OF REVENUES OVER (UNDER) EXPENDITURES 1,016,877) ( 5,727,281 5,777,069 49,788 OTHER FINANCING SOURCES (USES) Transfers in 1,366,329 1,369,929 1,270,329 99,600) ( Transfers out 15,190,000) ( 15,190,000) ( 15,000,000) ( 190,000 Total other financing sources (uses) 13,823,671) ( 13,820,071) ( 13,729,671) ( 90,400 NET CHANGE IN FUND BALANCE 14,840,548) ( 8,092,790) ( 7,952,602) ( 140,188 FUND BALANCE - BEGINNING 23,611,937 23,611,937 23,611,937FUND BALANCE - ENDING 8,771,389 $ 15,519,147 $ 15,659,335 $ 140,188 $ Budgeted Amounts
SCHEDULE OF REVENUES, EXPENDITURES AND CHANGES IN FUND BALANCE - BUDGET AND ACTUAL GENERAL FUND
50
CITY OF FORNEY, TEXAS
SCHEDULE OF REVENUES, EXPENDITURES AND
ROADWAY IMPACT FUND
FOR THE YEAR ENDED SEPTEMBER 30, 2022
Budgeted Amounts
Variance with Final Budget Positive Original Final Actual (Negative) REVENUES Impact fees 850,000 $ 1,800,000 $ 1,792,142 $ 7,858) $( Investment earnings - 7,000 13,125 6,125 Total revenues 850,000 1,807,000 1,805,267 1,733) ( EXPENDITURES Current: Public works - 18,927 19,035 108) ( Total expenditures - 18,927 19,035 108) ( EXCESS (DEFICIENCY) OF REVENUES OVER (UNDER) EXPENDITURES 850,000 1,788,073 1,786,232 1,841) ( OTHER FINANCING SOURCES (USES) Transfers out - 1,047,000) ( 1,047,000) (Total other financing sources (uses) - 1,047,000) ( 1,047,000) (NET CHANGE IN FUND BALANCE 850,000 741,073 739,232 1,841) ( FUND BALANCE - BEGINNING 5,131,862 5,131,862 5,131,862FUND BALANCE - ENDING 5,981,862 $ 5,872,935 $ 5,871,094 $ 1,841) $(
CHANGES IN FUND BALANCE
51
- BUDGET AND ACTUAL
CITY OF FORNEY, TEXAS
SCHEDULE OF CHANGES IN NET PENSION LIABILITY AND RELATED RATIOS
FOR THE YEAR ENDED SEPTEMBER 30, 2022
Note - GASB 68 requires 10 years of data to reported in this schedule. Additional years will be reported in subsequent years as the data becomes available.
Measurement period ended December 31, 2021 2020 A. Total pension liability Service Cost 2,195,120 $ 2,191,597 $ Interest (on the Total Pension Liability) 2,287,374 25,289 Difference between expected and actual experience 150,131 148,543 Changes in assumptions -Benefit payments, including refunds of employee contributions 703,838) ( 953,034) ( Net change in total pension liability 3,928,787 1,412,395 Total pension liability - beginning 33,141,376 29,707,230 633,193 Total pension liability - ending (a) 37,070,163 31,119,625 B. Plan fiduciary net position Contributions - Employer 1,705,039 1,663,587 Contributions - Employee 842,887 843,849 Net Investment Income 3,745,475 1,916,861 Benefit payments, including refunds of employee contributions 703,838) ( 953,034) ( Administrative Expenses 17,279) ( 12,372) ( Other 118 482) ( Net change in plan fiduciary net position 5,572,403 3,458,409 Plan fiduciary net position - beginning 28,646,236 25,187,826 Plan fiduciary net position - ending (b) 34,218,639 28,646,235 C. Net pension liability - ending (a) - (b) 2,851,524 $ 2,473,390 $ D. Plan fiduciary net position as a percentage of total pension liability 92.31% 92.05% E. Covered payroll 12,036,030 $ 12,054,990 $ F. Net position liability as a percentage of covered payroll 23.68% 20.52%
52
2019 2018 2017 2016 2015 2014 2,057,484 $ 1,816,160 $ 1,556,135 $ 1,371,142 $ 1,293,191 $ 1,126,842 $ 1,771,516 1,537,377 1,357,656 1,237,661 1,191,818 1,046,739 747,700 549,560 261,390 256,339) ( 744,030) ( 103,186 203,100 - - - 58,600) (577,019) ( 533,060) ( 752,237) ( 582,288) ( 240,931) ( 333,832) ( 4,202,781 3,370,037 2,422,944 1,770,176 1,441,448 1,942,935 25,504,449 22,134,412 19,711,468 17,941,292 16,499,844 14,556,909 29,707,230 25,504,449 22,134,412 19,711,468 17,941,292 16,499,844 1,517,709 1,327,677 1,181,687 1,078,254 1,028,802 847,353 788,740 701,994 609,566 535,304 507,987 484,123 3,149,666 582,901) ( 2,241,927 959,168 19,002 643,314 577,019) ( 533,060) ( 752,237) ( 582,288) ( 240,931) ( 333,832) ( 17,757) ( 11,246) ( 11,605) ( 10,821) ( 11,571) ( 6,714) ( 533) ( 587) ( 587) ( 583) ( 572) ( 552) ( 4,860,806 901,877 3,268,751 1,979,034 1,302,717 1,633,692 20,327,020 19,425,143 16,156,392 14,177,358 12,874,641 11,240,949 25,187,826 20,327,020 19,425,143 16,156,392 14,177,358 12,874,641 4,519,404 $ 5,177,429 $ 2,709,269 $ 3,555,076 $ 3,763,934 $ 3,625,203 $ 84.79% 79.70% 87.76% 81.96% 79.02% 78.03% 11,267,711 $ 10,028,490 $ 8,708,084 $ 7,647,196 $ 7,256,961 $ 6,916,048 $ 40.11% 51.63% 31.11% 46.49% 51.87% 52.42% 53
CITY OF FORNEY, TEXAS
SCHEDULE OF CONTRIBUTIONS FOR THE YEAR ENDED SEPTEMBER 30, 2022
Contributions in relation to the actuarially determined contribution
Contributions as a percentage of covered payroll
Note - GASB 68 requires 10 years of data to reported in this schedule. Additional years will be reported in subsequent years as the data becomes available.
NOTES TO SCHEDULE OF CONTRIBUTIONS
Actuarially determined contribution rates are calculated as of December 31 and become effective in January 13 months later.
Methods and Assumptions Used to Determine Contribution Rates:
Other Information:
Notes
Experience-based table of rates that are specific to the City's plan of benefits. Last updated for the 2019 valuation pursuant to an experience study of the period 2014-2018.
Post-retirement: 2019 Municipal Retirees of Texas Mortality Tables. The rates are projected on a fully generational basis with scale UMP.
Pre-retirement: PUB(10) mortality tables, with the Public Safety table used for males and the General Employee table used for females. The rates are projected on a fully generational basis with scale UMP.
There were no benefit changes during the year.
Fiscal year ended September 30, 2022 2021 2020 Actuarial determined contribution 2,015,209 $ 1,677,715 $ 1,561,131 $ 2,015,209 $ 1,677,715 $ 1,561,131 $ Contribution deficiency (excess) - -Covered payroll 14,189,108 11,927,171 11,377,923 14.20% 14.07% 13.72% Valuation
Notes
Date:
Actuarial Cost Method Entry Age
Amortization Method Level Percentage of Payroll, Closed Remaining Amortization 24 years Period Asset Valuation Method 10 Year smoothed fair value; 12% soft corridor Inflation 2.5% Salary Increases 3.5% to 11.5% including inflation Investment Rate of Return 6.75% Retirement Age
Normal
Mortality
54
2019 2018 2017 2016 2015 2014 1,478,423 $ 1,294,007 $ 1,153,873 $ 1,098,573 $ 979,573 $ 847,216 $ 1,478,423 $ 1,294,007 $ 1,153,873 $ 1,098,573 $ 979,573 $ 847,216 $ - - - - -11,020,021 9,274,693 8,428,945 7,779,767 6,916,048 6,004,927 13.42% 13.95% 13.69% 14.12% 14.16% 14.11% 55
CITY OF FORNEY, TEXAS
SCHEDULE OF CHANGES IN TOTAL OPEB LIABILITY AND RELATED RATIOS
TEXAS MUNICIPAL RETIREMENT SYSTEM - SUPPLEMENTAL DEATH BENEFITS FUND FOR THE YEAR ENDED SEPTEMBER 30, 2022
Note: This schedule is required to have 10 years of information, but the information prior to 2017 is not available.
Note: No assets are accumulated in a trust that meets the criteria in paragraph 4 of GASB Statement No. 75, Accounting and Financial Reporting for Postemployment Benefits Other Than Pensions.
Measurement period ended December 31, 2021 2020 A.Total OPEB liability Service Cost 25,289 $ 24,110 $ Interest (on the Total OPEB Liability) 6,120 6,679 Difference between expected and actual experience 29,595) ( 15,945) ( Changes of assumptions 11,750 49,526 Benefit payments, including refunds of employee contributions 2,408) ( 1,205) ( Net change in Total OPEB liability 11,156 63,165 Total OPEB liability - beginning 294,578 231,413 Total OPEB liability - ending (a) 305,734 294,578 B.Covered-employee payroll 12,036,030 $ 12,054,990 $ C.Total OPEB liability as a percentage of covered-employee payroll 2.54% 2.44%
56
2019 2018 2017 16,902 $ 19,054 $ 14,804 $ 6,676 5,841 5,233 9,513) ( 2,816) (46,388 16,414) ( 16,789 1,127) ( 1,003) ( 871) ( 59,326 4,662 35,955 172,087 167,425 131,470 231,413 172,087 167,425 11,267,711 $ 10,028,490 $ 8,708,084 $ 2.05% 1.72% 1.92% 57
THIS PAGE LEFT BLANK INTENTIONALLY
COMBINING AND INDIVIDUAL FUND STATEMENTS AND SCHEDULES
SPECIAL REVENUE FUNDS
Special Revenue Funds are used to account for revenues that are restricted in nature for a special purpose limited by state law and management intentions for expenditures.
Hotel/Motel Fund – to account for revenue collected from hotels and motels located within the Forney city limits.
Fox Hollow PID Fund – to account for revenue collected from special assessments in the Fox Hollow subdivision to be used only for the benefit of the subdivision.
NONMAJOR GOVERNMENTAL FUNDS
CITY OF FORNEY, TEXAS
COMBINING BALANCE SHEET
NONMAJOR GOVERNMENTAL FUNDS
SEPTEMBER 30, 2022
Special Revenue Funds
Total Non-Major Hotel/Motel Fox Hollow Governmental Fund PID Funds ASSETS Cash and investments 184,741 $ 861,484 $ 1,046,225 $ Total assets 184,741 861,484 1,046,225 LIABILITIES Accounts payable - 6,420 6,420 Total Liabilities - 6,420 6,420 FUND BALANCES Restricted for: Tourism 184,741 - 184,741 Public Improvement District - 855,064 855,064 Total fund balances 184,741 855,064 1,039,805 Total liabilities and fund balances 184,741 $ 861,484 $ 1,046,225 $
58
CITY OF FORNEY, TEXAS
COMBINING STATEMENT OF REVENUES, EXPENDITURES AND CHANGES IN FUND BALANCES NONMAJOR GOVERNMENTAL FUNDS
FOR THE YEAR ENDED SEPTEMBER 30, 2022
Special Revenue Funds
Total Non-Major Hotel/Motel Fox Hollow Governmental Fund PID Funds REVENUES Taxes: Property taxes - $ 821,781 $ 821,781 $ Hotel/motel taxes 135,164 - 135,164 Intergovernmental revenues - 192,402 192,402 Investment earnings - 1,652 1,652 Total revenues 135,164 1,015,835 1,150,999 EXPENDITURES Current: General government - 697,682 697,682 Total expenditures - 697,682 697,682 NET CHANGE IN FUND BALANCE 135,164 318,153 453,317 FUND BALANCE - BEGINNING 49,577 536,911 586,488 FUND BALANCE - ENDING 184,741 $ 855,064 $ 1,039,805 $
59
CITY OF FORNEY, TEXAS
CHANGES IN FUND BALANCE - BUDGET AND ACTUAL SCHEDULE OF REVENUES, EXPENDITURES AND
DEBT SERVICE FUND
FOR THE YEAR ENDED SEPTEMBER 30, 2022
Budgeted Amounts
Variance with Final Budget Positive Original Final Actual (Negative) REVENUES Property taxes 3,417,835 $ 3,378,000 $ 3,436,173 $ 58,173 $ Intergovernmental revenue 4,019,140 4,019,140 4,019,141 1 Charges for services - 4,955 4,954 1) ( Investment earnings 5,000 5,000 23,941 18,941 Total revenues 7,441,975 7,407,095 7,484,209 77,114 EXPENDITURES Debt service: Principal 4,920,000 6,925,000 6,805,493 119,507 Interest 1,047,655 9,000 1,035,460 1,026,460) ( Total expenditures 5,967,655 6,934,000 7,840,953 906,953) ( EXCESS (DEFICIENCY) OF REVENUES OVER (UNDER) EXPENDITURES 1,474,320 473,095 356,744) ( 829,839) ( OTHER FINANCING SOURCES (USES) Transfers in 51,108 51,108 55,367 4,259 Total other financing sources (uses) 51,108 51,108 55,367 4,259 NET CHANGE IN FUND BALANCE 1,525,428 524,203 301,377) ( 825,580) ( FUND BALANCE - BEGINNING 2,039,146 2,039,146 2,039,146FUND BALANCE - ENDING 3,564,574 $ 2,563,349 $ 1,737,769 $ 825,580) $(
60
CITY OF FORNEY, TEXAS
SCHEDULE OF REVENUES, EXPENDITURES AND CHANGES IN FUND BALANCE - BUDGET AND ACTUAL CAPITAL PROJECTS FUND
FOR THE YEAR ENDED SEPTEMBER 30, 2022
Budgeted Amounts
Variance with Final Budget Positive Original Final Actual (Negative) REVENUES Property taxes 2,000,000 $ 1,680,000 $ 2,280,485 $ 600,485 $ Charge for services 200,000 100,000 91,251 8,749) ( Investment income 1,500 8,168 20,151 11,983 Miscellaneous income - - 14,276 14,276 Total revenues 2,201,500 1,788,168 2,406,163 617,995 EXPENDITURES Current: Public works 1,520,000 1,250,000 1,280,942 30,942) ( Capital outlays 5,876,741 10,383,299 8,714,660 1,668,639 Total expenditures 7,396,741 11,633,299 9,995,602 1,637,697 EXCESS (DEFICIENCY) OF REVENUES OVER (UNDER) EXPENDITURES 5,195,241) ( 9,845,131) ( 7,589,439) ( 2,255,692 OTHER FINANCING SOURCES (USES) Insurance recoveries - 42,175 42,175Transfer in 15,000,000 15,350,000 16,047,000 697,000 Transfer out - 1,146,138) ( 1,201,505) ( 55,367) ( Total other financing sources (uses) 15,000,000 14,246,037 14,887,670 641,633 NET CHANGE IN FUND BALANCE 9,804,759 4,400,906 7,298,231 2,897,325 FUND BALANCE - BEGINNING 12,193,458 12,193,458 12,193,458FUND BALANCE - ENDING 21,998,217 $ 16,594,364 $ 19,491,689 $ 2,897,325 $
61
CITY OF FORNEY, TEXAS
SCHEDULE OF REVENUES, EXPENDITURES AND CHANGES IN FUND BALANCE - BUDGET AND ACTUAL HOTEL/MOTEL FUND
FOR THE YEAR ENDED SEPTEMBER 30, 2022
Budgeted Amounts
Variance with Final Budget Positive Original Final Actual (Negative) REVENUES Hotel/motel taxes 75,000 $ 130,000 $ 135,164 $ 5,164 $ Total revenues 75,000 130,000 135,164 5,164 EXPENDITURES - - -NET CHANGE IN FUND BALANCE 75,000 130,000 135,164 5,164 FUND BALANCE - BEGINNING 49,577 49,577 49,577FUND BALANCE - ENDING 124,577 $ 179,577 $ 184,741 $ 5,164 $
62
THIS PAGE LEFT BLANK INTENTIONALLY
STATISTICAL SECTION
THIS PAGE LEFT BLANK INTENTIONALLY
This part of the City of Forney, Texas’ annual comprehensive financial report presents detailed information as a context for understanding what the information in the financial statements, note disclosures, and required supplementary information says about the government’s overall financial health.
help the reader understand how
time.
information to help the reader assess the City’s most significant local revenue sources, the property tax.
These
present information to help the reader assess the affordability of the City’s current levels of outstanding debt and the City’s ability to issue additional debt in the future.
offer demographic and economic indicators to help the reader understand the environment within which the City’s financial activities take place.
These schedules contain service and infrastructure data to help the reader understand how the information in the City’s financial report relates to the services the City provides and the activities it performs.
Sources: Unless otherwise noted, the information in these schedules is derived from the annual comprehensive financial reports for the relevant year.
STATISTICAL SECTION
Contents Page Financial Trends 63 These schedules
information to
the City’s financial
and
Revenue Capacity 74 These schedules
Debt Capacity 80
Demographic and Economic Information 85
Operating Information 87
contain trend
performance
well-being have changed over
contain
schedules
These schedules
CITY OF FORNEY, TEXAS
NET POSITION BY COMPONENET
LAST TEN FISCAL YEARS (ACCRUAL BASIS OF ACCOUNTING) (UNAUDITED)
2013 2014 2015 2016 Governmental activities: Net investment in capital assets 20,440,755 $ 22,043,453 $ 24,513,186 $ 22,326,642 $ Restricted 5,891,886 9,293,408 14,380,773 5,035,645 Unrestricted 11,181,620 5,463,010 1,925,299) ( 8,043,790 Total Governmental Activities Net Position 37,514,261 36,799,871 36,968,660 35,406,077 Business-Type Activities: Net investment in capital assets 7,523,529 7,854,647 8,875,498 10,839,253 Restricted 2,567,839 2,567,839 2,764,485 1,530,912 Unrestricted 11,303,696 12,724,397 14,826,597 16,955,095 Total Business-Type Activities Net Position 21,395,064 23,146,883 26,466,580 29,325,260 Primary Government: Net investment in capital assets 27,964,284 29,898,100 33,388,684 33,165,895 Restricted 8,459,725 11,861,247 17,145,258 6,566,557 Unrestricted 22,485,316 18,187,407 12,901,298 24,998,885 Total Primary Government Net Position 58,909,325 $ 59,946,754 $ 63,435,240 $ 64,731,337 $
Fiscal Year 63
TABLE 1 2017 2018 2019 2020 2021 2022 26,124,675 $ 9,091,396 $ 16,969,844 $ 36,409,322 $ 38,620,898 $ 85,443,652 $ 4,917,004 29,818,164 24,717,558 16,650,410 19,919,436 28,190,781 9,508,649 5,247,309 4,450,313 7,992,481 17,418,753 9,403,474 40,550,328 44,156,869 46,137,715 61,052,213 75,959,087 123,037,907 14,265,773 17,536,902 26,259,404 31,262,721 30,868,966 52,971,217 3,170,206 6,111,159 1,510,191 3,058,375 6,849,658 8,099,640 16,529,023 22,515,626 21,439,027 23,222,013 23,186,460 23,273,358 33,965,002 46,163,687 49,208,622 57,543,109 60,905,084 84,344,215 40,390,448 26,628,298 43,229,248 67,672,043 69,489,864 138,414,869 8,087,210 35,929,323 26,227,749 19,708,785 26,769,094 22,319,687 26,037,672 27,762,935 25,889,340 31,214,494 40,605,213 32,676,832 74,515,330 $ 90,320,556 $ 95,346,337 $ 118,595,322 $ 136,864,171 $ 207,382,122 $ Fiscal Year 64
CITY OF FORNEY, TEXAS
CHANGES IN NET POSITION
LAST TEN FISCAL YEARS (ACCRUAL BASIS OF ACCOUNTING) (UNAUDITED) Fiscal
2013 2014 2015 2016 EXPENSES Governmental activities: General government 3,522,911 $ 5,050,743 $ 3,608,223 $ 4,018,323 $ Public safety 5,541,583 6,303,710 8,024,153 8,665,081 Public services 805,895 694,924 714,490 704,984 Parks and recreation 1,816,378 1,699,022 1,365,528 1,460,278 Public works 4,934,265 1,655,935 1,342,998 1,367,982 Library 37,585 - -Interest and other charges 3,427,876 3,105,300 3,157,842 2,724,252 Total governmental activities expenses 20,086,493 18,509,634 18,213,234 18,940,900 Business-type activities: Utility services 8,441,451 9,208,184 9,883,212 10,808,915 Total Business-type activities expenses 8,441,451 9,208,184 9,883,212 10,808,915 Total primary government expenses 28,527,944 27,717,818 28,096,446 29,749,815 PROGRAM REVENUES Governmental activities: Charge for services: General government 18,791 354,410 282,119 11,232 Public safety 352,579 589,819 512,794 717,622 Public services 290,170 - -Parks and recreation 41,325 39,684 37,748 59,384 Public works 1,930,659 686,221 3,273,590 1,682,863 Operating grants and contributions 159,563 340,391 348,145 7,350 Capital grants and contributions 1,017,157 37,000 33,317 621,493 Total governmental activities program revenues 3,810,244 2,047,525 4,487,713 3,099,944 Business-type activities: Charge for services: Utility services 11,625,160 11,525,477 13,506,550 14,152,555 Operating grants and contributions - - -Capital grants and contributions 184,276 - -Total business-type activities program revenues 11,809,436 11,525,477 13,506,550 14,152,555 Total primary government program revenues 15,619,680 13,573,002 17,994,263 17,252,499 NET (EXPENSE)/REVENUE Governmental activities 16,276,249) ( 16,462,109) ( 13,725,521) ( 15,840,956) ( Business-type activities 3,367,985 2,317,293 3,623,338 3,343,640 Total primary government program Net expenses 12,908,264) $( 14,144,816) $( 10,102,183) $( 12,497,316) $(
65
Year
TABLE 2 2017 2018 2019 2020 2021 2022 4,209,389 $ 4,537,043 $ 5,735,228 $ 6,453,583 $ 6,148,822 $ 8,424,525 $ 7,330,299 9,595,555 10,351,567 10,127,674 10,417,689 11,130,641 1,071,503 1,615,487 1,023,882 934,154 886,190 973,473 2,063,736 2,494,562 2,635,064 2,598,119 2,556,071 2,564,170 2,123,199 2,254,535 3,241,666 2,394,495 8,087,331 5,217,743 - - - -2,331,716 1,875,357 1,662,180 1,446,262 1,092,306 801,325 19,129,842 22,372,539 24,649,587 23,954,287 29,188,409 29,111,877 12,726,800 13,558,970 16,345,862 16,994,096 21,479,654 22,260,941 12,726,800 13,558,970 16,345,862 16,994,096 21,479,654 22,260,941 31,856,642 35,931,509 40,995,449 40,948,383 50,668,063 51,372,818 59,024 9,940 110,018 338,161 128,873 6,743 633,180 760,567 1,036,729 1,409,341 4,361,241 2,450,837 - - 886,190 -64,254 124,273 120,984 109,101 260,843 158,228 2,996,728 3,806,887 3,038,036 5,053,071 5,647,188 4,961,306 10,000 222,298 226,959 551,039 1,627,435 47,156 94,353 361,254 4,648 2,027,888 2,305,917 9,010,460 3,857,539 5,285,219 5,423,564 9,488,601 14,331,497 16,634,730 15,580,123 19,212,584 20,313,579 22,823,872 27,422,723 27,549,698 - 7,458,792 1,693,133 2,616,746 175,360- - - 2,900,000 - 4,070,260 15,580,123 26,671,376 22,006,712 28,340,618 27,598,083 31,619,958 19,437,662 31,956,595 27,430,276 37,829,219 41,929,580 48,254,688 15,272,303) ( 17,087,320) ( 19,226,023) ( 14,465,686) ( 14,856,912) ( 12,477,147) ( 2,853,323 13,112,406 5,660,850 11,346,522 6,118,429 9,359,017 12,418,980) $( 3,974,914) $( 13,565,173) $( 3,119,164) $( 8,738,483) $( 3,118,130) $( Fiscal Year 66
CITY OF FORNEY, TEXAS
CHANGES IN NET POSITION
LAST TEN FISCAL YEARS (ACCRUAL BASIS OF ACCOUNTING) Fiscal Year
2013 2014 2015 2016 GENERAL REVENUES AND OTHER CHANGES IN NET POSITION Governmental activities: Taxes: Property taxes 7,122,398 $ 7,289,819 $ 7,627,533 $ 8,209,164 $ Sales taxes 3,407,923 3,839,949 4,212,896 4,709,696 Franchise taxes 3,638,053 3,717,733 3,653,796 3,505,463 Other taxes 112,614 41,273 38,333 172,118 Investment income 63,815 51,115 155,264 112,348 Gain on sale of capital assets - - -Miscellaneous 68,611 56,497 59,995 186,883 Extraordinary item 1,444,258) ( - -Transfers 402,642 601,333 458,247 528,752 Total governmental activities 13,371,798 15,597,719 16,206,064 17,424,424 Business-type activities: Investment income 6,475 31,350 48,010 20,934 Gain on sale of capital assets - - -Miscellaneous 2,450 4,509 403,669 22,858 Transfers 402,642) ( 601,333) ( 458,247) ( 528,752) ( Total business-type activities 393,717) ( 565,474) ( 6,568) ( 484,960) ( Total primary government 12,978,081 15,032,245 16,199,496 16,939,464 CHANGE IN NET POSITION Governmental activities 2,904,451) ( 864,390) ( 2,480,543 1,583,468 Business-type activities 2,974,268 1,751,819 3,616,770 2,858,680 Total primary government 69,817 $ 887,429 $ 6,097,313 $ 4,442,148 $
67
TABLE 2 2017 2018 2019 2020 2021 2022 8,762,216 $ 9,707,103 $ 10,470,757 $ 11,888,141 $ 13,228,918 $ 15,063,814 $ 4,988,763 5,749,249 6,351,122 7,561,479 9,681,490 11,325,531 6,166,444 3,538,039 3,418,342 3,452,551 3,625,118 3,527,220 184,340 191,948 185,150 173,034 107,545 205,895 239,970 497,765 540,886) ( 3,110,009 71,047 1,079,925) ( - - 21,578 6,358 -74,821 93,206 77,082 98,378 117,650 400,146 - - - - -- 1,031,984 2,109,914 3,090,234 2,932,018 124,191 20,416,554 20,809,294 22,093,059 29,380,184 29,763,786 29,566,872 30,726 126,441 549,479) ( 66,127 4,450 27,949 - - 6,383 30 -1,755,693 4,682 37,095 12,042 171,114 214,255 - 1,031,984) ( 2,109,914) ( 3,090,234) ( 2,932,018) ( 124,191) ( 1,786,419 900,861) ( 2,615,915) ( 3,012,035) ( 2,756,454) ( 118,013 22,202,973 19,908,433 19,477,144 26,368,149 27,007,332 29,684,885 5,144,251 3,721,974 1,980,846 14,914,498 14,906,874 17,089,725 4,639,742 12,211,545 3,044,935 8,334,487 3,361,975 9,477,030 9,783,993 $ 15,933,519 $ 5,025,781 $ 23,248,985 $ 18,268,849 $ 26,566,755 $ Fiscal Year 68
THIS PAGE LEFT BLANK INTENTIONALLY
CITY OF FORNEY, TEXAS
GOVERNMENTAL ACTIVITIES TAX REVENUES BY SOURCE
LAST TEN FISCAL YEARS (ACCRUAL BASIS OF ACCOUNTING)
TABLE 3 Alcoholic Fiscal Property Sales Franchise Hotel Beverage Year Tax Tax Tax Tax Tax Total 2013 7,122,398 3,407,923 3,638,053 90,504 22,110 14,280,988 2014 7,270,549 3,839,949 3,717,733 89,802 41,273 14,959,306 2015 7,698,456 4,144,445 3,653,796 99,404 38,333 15,634,434 2016 8,209,164 4,709,696 3,505,463 126,752 45,366 16,596,441 2017 8,762,216 4,988,763 6,166,444 138,834 45,506 20,101,763 2018 9,707,103 5,749,249 3,538,039 140,150 51,798 19,186,339 2019 10,470,757 6,351,122 3,418,342 128,979 56,171 20,425,371 2020 11,888,141 7,561,479 3,452,551 122,897 50,137 23,075,205 2021 13,228,918 9,681,490 3,625,118 49,557 57,968 26,643,051 2022 14,954,167 11,325,531 3,527,220 135,164 70,731 30,012,813
69
CITY OF FORNEY, TEXAS
FUND BALANCES OF GOVERNMENTAL FUNDS
LAST TEN FISCAL YEARS
(MODIFIED ACCRUAL BASIS OF ACCOUNTING) (UNAUDITED)
2013 2014 2015 2016 General Fund Restricted for: Municipal Court 86,439 $ 86,439 $ 114,180 $ 126,146 $ Committed for: Police 69,930 69,930 50,566 63,684 Assigned for: Subsequent year's budget - - - 1,635,090 General reserve 1,893,207 1,893,207 3,133,053 3,252,949 Unassigned 2,961,848 3,819,842 2,690,964 1,343,152 Total General Fund 5,011,424 5,869,418 5,988,763 6,421,021 All Other Governmental Funds Restricted for: Debt service 4,067,297 4,304,860 4,299,472 4,161,496 Use of impact fees 1,481,780 1,742,291 1,892,343 2,185,265 Capital improvements 4,867,416 3,342,822 9,310,332 4,422,008 Tourism 124,050 108,452 71,670 110,290 Public Improvement District - - -Committed for: Capital improvements 1,513,856 - -Assigned for: Capital improvements - - - 4,453,267 Equipment replacement 183,112 - -Special projects - donations 12,475 - -Community Benefit Fund 241,565 15 15Total all other governmental funds 12,491,551 $ 9,498,440 $ 15,573,832 $ 15,332,326 $
Fiscal Year 70
TABLE 4 2017 2018 2019 2020 2021 2022 97,961 $ 86,519 $ 77,089 $ 56,784 $ 69,838 $ 79,638 $ 65,858 88,768 32,756 23,867 32,913 35,703 3,411,341 2,491,709 2,803,544 2,864,059 14,320,096 7,597,114 3,567,917 4,181,100 4,250,707 4,913,166 4,913,727 4,920,115 1,641,777 1,162,899 - 6,073,886 4,275,363 3,026,765 8,784,854 8,010,995 7,164,096 13,931,762 23,611,937 15,659,335 4,061,777 3,641,192 3,048,330 2,627,322 2,039,146 1,737,769 2,113,419 99,541 1,302,367 2,961,594 5,131,862 5,871,094 5,058,192 13,751,049 8,802,955 11,550,916 12,193,458 19,491,689 103,655 20,919 57,988 - 49,577 184,741 167,505 267,403 442,087 399,975 536,911 855,064 - - - - -3,504,186 - - - -- - - - -- - - - -- - - - -15,008,734 $ 17,780,104 $ 13,653,727 $ 17,539,807 $ 19,950,954 $ 28,140,357 $ Fiscal Year 71
CITY OF FORNEY, TEXAS
CHANGES IN FUND BALANCES OF GOVERNMENTAL FUNDS
LAST TEN FISCAL YEARS (MODIFIED ACCRUAL BASIS OF ACCOUNTING) (UNAUDITED) Fiscal Year
2013 2014 2015 2016 REVENUES Property taxes 7,122,398 $ 7,270,549 $ 7,692,263 $ 8,094,304 $ Sales taxes 3,407,923 3,839,949 4,212,896 4,709,696 Franchise taxes 3,638,053 3,717,733 3,653,796 3,505,463 Other taxes 112,614 131,075 137,737 172,118 Fines and forfeitures 283,411 213,305 222,886 279,553 Licenses and permits 949,007 608,204 542,322 712,457 Charge for services 646,358 483,489 3,075,300 1,187,352 Contributions and donations 562,009 19,000 23,817 428,843 Impact fees 839,448 259,848 148,851 287,078 Intergovernmental 4,221,085 3,978,938 4,236,168 4,019,000 Investment income 63,810 51,120 155,264 112,348 Miscellaneous 68,621 71,978 77,483 371,061 Total Revenues 21,914,737 20,645,188 24,178,783 23,879,273 EXPENDITURES General government 3,029,497 3,079,170 3,081,859 3,401,352 Public safety 5,137,340 5,903,836 6,186,164 6,725,645 Public works 6,317,481 1,055,368 1,128,216 1,146,561 Public services and operations 793,640 647,689 647,572 669,532 Culture and recreation 1,126,443 1,106,325 1,151,393 1,243,090 Library 52,585 45,875 67,380Intergovernmental - - - 46,531 Capital outlay 3,160,822 3,856,913 3,152,480 5,387,862 Debt service Principal retirement 4,134,293 4,571,621 5,083,913 5,449,508 Interest and other charges 3,503,846 3,114,841 2,763,979 2,716,974 Bond issuance costs - - 259,160 135,819 Total Expenditures 27,255,947 23,381,638 23,522,116 26,922,874 47044232 53845748 OTHER FINANCING SOURCES (USES) Debt issuance 3,265,000 - 15,680,000 10,720,000 Payment to refunding bond escrow agent 2,180,000) ( - 11,757,415) ( 8,667,653) ( Premiums and discount on debt issue 11,073) ( - 1,357,198 588,274 Insurance recoveries - - 21,241Extraordinary item (expense) 1,444,258) ( - -Transfers in (out) 402,644 601,333 458,247 528,752 Sale of assets - - 11,205 64,980 Total Other Financing Sources (Uses) 32,313 601,333 5,770,476 3,234,353 NET CHANGE IN FUND BALANCES 5,308,897) $( 2,135,117) $( 17,094,973) $( 190,752 $ Debt service as percentage of noncapital expenditures 31.70% 39.37% 39.80% 38.55%
72
TABLE 5 2017 2018 2019 2020 2021 2022 8,769,295 $ 9,739,104 $ 10,434,973 $ 11,943,160 $ 13,236,979 $ 14,954,167 $ 4,988,763 5,749,249 6,351,122 7,561,479 9,681,490 11,325,531 6,166,444 3,538,039 3,418,342 3,452,551 3,625,118 3,527,220 184,340 191,948 185,150 173,034 107,545 205,895 175,663 167,374 260,477 203,915 205,386 195,911 1,752,986 2,372,781 1,471,601 2,956,929 6,986,179 5,702,180 995,924 1,172,987 1,273,491 1,762,737 3,077,707 1,565,035 14,762 8,447 4,648 2,007,888 10,117 7,182 814,682 971,003 1,161,161 1,641,975 2,280,800 1,792,142 4,108,732 4,224,439 4,344,519 4,881,914 5,785,486 4,258,699 239,970 497,765 540,886) ( 3,110,009 71,047 1,079,925) ( 100,785 467,047 106,101 150,762 98,634 205,049 28,312,346 29,100,183 28,470,699 39,846,353 45,166,488 42,659,086 3,460,398 4,350,321 5,638,822 6,323,386 6,063,277 7,127,052 7,380,150 8,704,209 9,416,004 9,115,250 9,454,133 11,135,139 1,513,351 1,595,230 2,794,177 1,869,009 6,175,136 4,839,000 1,035,962 1,554,194 990,379 887,254 855,218 1,001,452 1,332,124 1,717,930 1,797,128 1,727,806 1,539,510 1,930,395 - - - - -301,396 44,670 - - -5,177,726 1,766,351 6,661,455 4,207,927 3,941,503 8,714,660 5,775,597 6,332,845 6,389,699 6,547,078 6,719,229 6,805,493 2,401,459 2,074,249 1,912,612 1,664,527 1,283,157 1,035,460 230,707 - - - 43,02528,608,870 28,139,999 35,600,276 32,342,237 36,074,188 42,588,651 57217740 56279998 13,520,000 - - - 3,885,00012,589,898) ( - - - 3,841,975) (1,394,030 - - - -- - 26,300 14,838 23,979 42,175 - - - - -- 1,031,984 2,109,914 3,090,234 2,932,018 124,191 12,633 5,343 20,087 44,558 -2,336,765 1,037,327 2,156,301 3,149,630 2,999,022 166,366 12091322 2,040,241 $ 1,997,511 $ 4,973,276) $( 10,653,746 $ 12,091,322 $ 236,801 $ 35.88% 31.88% 28.69% 29.19% 25.01% 29.41% Fiscal Year 73
CITY OF FORNEY, TEXAS
ASSESSED VALUE AND ESTIMATED ACTUAL VALUE OF TAXABLE PROPERTY
LAST TEN FISCAL YEARS (UNAUDITED)
Note: Property is reassessed annually. Property is assessed actual value; therefore, the assessed values are equal to the actual value. Tax rates are per $100 of assessed value.
Residential: include single family, vacant lots, acreage, farm and ranch
Commercial: include real property, industrial and utilities
Fiscal Year Less: Ended Residential Commercial Personal Tax Exempt Sept. 30 Property Property Property Real Property 2013 764,959,431 $ 311,146,971 $ 87,584,330 $ 216,535,693 $ 2014 768,272,697 329,201,623 88,644,960 218,688,028 2015 840,904,873 328,801,122 97,753,070 220,336,313 2016 924,494,180 377,814,042 114,725,740 267,831,558 2017 1,069,021,810 389,158,547 110,749,911 291,613,032 2018 1,266,261,417 405,817,241 116,361,171 302,419,220 2019 1,413,385,232 411,360,109 134,276,328 290,419,678 2020 1,644,078,207 459,051,038 181,355,580 348,501,157 2021 1,928,936,283 536,708,971 189,418,358 360,032,723 2022 2,176,451,798 682,841,557 233,793,487 438,535,374
Source: Kaufman County Appraisal District
74
Real Property
TABLE 6 Total Estimated Total Taxable Direct Actual Total Taxable Assessed Tax Taxable Assessed Value Value Rate Value Inc / (Dec) 947,155,039 $ 0.749020 1,074,751,498 $ 0.50% 967,431,252 0.749020 1,099,546,999 2.14% 1,047,122,752 0.723486 1,183,749,808 8.24% 1,149,202,404 0.698483 1,323,154,447 9.75% 1,277,317,236 0.651111 1,453,797,441 11.15% 1,486,020,609 0.621111 1,664,513,808 16.34% 1,668,601,991 0.621111 1,864,057,186 12.29% 1,935,983,668 0.580000 2,159,723,220 16.02% 2,295,030,889 0.538710 2,530,302,007 18.55% 2,654,551,468 0.501069 2,968,325,237 15.67% 10 Yr Avg 11.06% 75
THIS PAGE LEFT BLANK INTENTIONALLY
CITY OF FORNEY, TEXAS
PROPRIETARY TAX RATES DIRECT AND OVERLAPPING GOVERNMENTS
TABLE 7 General Forney Fiscal Year Operating/ Obligation Independent Ended General Debt Total School Kaufman Sept. 30 Rate Service Direct District County 2013 0.316925 0.432095 0.749020 1.540000 0.556500 2014 0.316925 0.432095 0.749020 1.540000 0.576200 2015 0.333638 0.389848 0.723486 1.540000 0.576200 2016 0.350398 0.348085 0.698483 1.540000 0.576200 2017 0.338445 0.312666 0.651111 1.540000 0.588700 2018 0.358330 0.262781 0.621111 1.540000 0.588700 2019 0.393237 0.227874 0.621111 1.540000 0.588700 2020 0.380567 0.199433 0.580000 1.470000 0.537112 2021 0.378201 0.160509 0.538710 1.374700 0.504957 2022 0.356015 0.145054 0.501069 1.372000 0.461171
LAST TEN FISCAL YEARS (PER $100 OF ASSESSED VALUE) (UNAUDITED)
Overlapping rates are those of local and county governments that apply to property over within the City of Forney. City Direct Rates Overlapping Rates * 76
Source: Kaufman County Appraisal District
*
CITY FORNEY, TEXAS
PRINCIPAL PROPERTY TAXPAYERS CURRENT YEAR AND NINE YEARS AGO (UNAUDITED) Assessed Percentage Taxable Value of Assessed Taxpayer 2022 Fiscal Year Rank Taxable Value NLP Goodyear BTS LLC 59,900,000 $ 1 3.09% Smurfit Kappa 39,666,747 2 2.05% Bluemound Land Properties LLC ETAL 39,388,276 3 2.03% Rose Englebrook LP & Rose Marlborough Square Apts 38,000,000 4 1.96% DFW Gateway Oaks Apartments LLC ETAL 36,600,000 5 1.89% Emerson Forney Apartments LP 32,600,000 6 1.68% Valfair Construction Inc. 29,640,884 7 1.53% Goodyear Tire & Rubber Co. 29,551,511 8 1.53% Oncor Electric Delivery Co LLC 25,375,025 9 1.31% South Forney LLC 23,546,286 10 1.22% Orange County Container Group LLC Oncor Electric Delivery Company WalMart Real Estate Business Trust Steve Silver Company Lowes Home Center Inc Acme Realty Forney Phase II Ltd. Sealy SW Properties LP Forney Deerval LLC ETAL Forney Senior Living LLC OHI Asset (LA) LLC 354,268,729 $ 18.30%
Kaufman County
77
Source:
Appraisal District
TABLE 8 Assessed Percentage Taxable Value of Assessed 2013 Fiscal Year Rank Taxable Value 41,468,556 $ 1 4.70% 19,446,000 2 2.21% 18,356,660 3 2.08% 17,800,630 4 2.02% 10,325,030 5 1.17% 7,767,840 6 0.88% - 7 0.82% 6,787,060 8 0.77% 5,182,350 9 0.59% 4,899,730 10 0.56% 132,033,856 $ 15.80% 78
THIS PAGE LEFT BLANK INTENTIONALLY
CITY OF FORNEY, TEXAS
TEN FISCAL YEARS (UNAUDITED) TABLE 9 Fiscal Year Total Tax Collections in Ended Levy for Subsequent Sept. 30 Fiscal Year Amount % of Levy Years Amounts % of Levy 2013 7,453,761 $ 7,022,474 $ 94.21% 420,334 $ 7,442,808 $ 99.9% 2014 7,246,254 7,168,440 98.93% 45,098 7,240,385 99.9% 2015 7,568,618 7,517,753 99.33% 60,185 7,563,730 99.9% 2016 7,970,603 7,927,286 99.46% 88,802 7,962,123 99.9% 2017 8,317,470 8,268,087 99.41% 181,884 8,310,651 99.9% 2018 9,134,346 9,097,250 99.59% 206,266 9,128,039 99.9% 2019 10,219,571 10,167,840 99.49% 65,324 10,181,536 99.6% 2020 11,597,231 11,533,848 99.45% 149,891 11,507,998 99.2% 2021 12,281,187 12,219,603 99.50% 119,656 12,183,909 99.2% 2022 13,526,712 13,424,527 99.24% - 13,424,527 99.2%
Kaufman County Appraisal District Fiscal Year of the Levy Collected within the Total Collections to Date 79
PROPERTY TAX LEVIES AND COLLECTIONS LAST
Source:
CITY OF FORNEY, TEXAS
RATIO OF OUTSTANDING DEBT BY TYPE
LAST
General Certificates PassFiscal Obligation of Other Tax Through Premiums/ Year Bonds Obligation Obligations Notes Bond Discounts 2013 28,060,000 $ 6,693,936 $ 319,633 $ - $ 35,487,944 $ - $ 2014 26,925,000 6,232,823 277,247 - 32,895,0002015 27,485,479 9,505,000 233,813 - 29,860,000 1,117,561 2016 23,555,000 11,500,000 189,305 - 26,270,000 1,413,881 2017 22,110,000 10,995,000 143,708 2,055,000 22,145,000 2,556,366 2018 20,255,000 10,470,000 445,729 1,780,000 18,565,000 2,304,821 2019 18,355,000 9,930,000 356,030 1,505,000 14,980,000 2,053,276 2020 16,400,000 9,380,000 263,952 1,220,000 11,315,000 1,801,731 2021 16,840,000 6,425,000 219,724 930,000 7,565,000 1,550,186 2022 18,335,000 6,035,000 174,231 630,000 4,645,000 1,298,632 Governmental Activities 80
TEN FISCAL YEARS (UNAUDITED)
Business-Type Activities
TABLE 10 General Certificates Total Percentage Obligation of Premiums/ Primary of Personal Per Bond Obligation Discounts Government Income (1) Capita (1) 1,465,000 $ 5,732,177 $ - $ 77,255,260 $ 18.07% 4,868 1,295,000 6,617,177 - 74,242,247 17.37% 2,756 3,765,000 2,854,521 41,008 74,862,382 18.07% 4,868 3,145,000 2,425,000 36,907 68,535,093 13.76% 2,413 2,730,000 2,300,000 32,806 65,067,880 13.88% 2,655 2,310,000 2,170,000 28,705 58,329,255 11.67% 2,372 1,870,000 2,040,000 24,604 51,113,910 7.69% 1,805 1,415,000 1,905,000 20,503 43,721,186 5.68% 1,422 1,150,000 1,770,000 16,402 36,466,312 3.85% 1,031 2,485,000 - 12,301 33,615,164 2.54% 687
81
CITY OF FORNEY, TEXAS
RATIOS OF GENERAL BONDED DEBT OUTSTANDING
LAST TEN FISCAL YEARS
(UNAUDITED)
% of Net Less Bonded Debt Net Bonded Fiscal Estimated Assessed Gross Debt Service Net of Assessed Debt per Year Population1 Value2 Bonded Debt3 Funds Bonded Debt Value Capita 2013 15,870 947,155,039 $ 41,951,113 $ 3,068,728 $ 38,882,385 $ 4.11% 2,450 $ 2014 16,000 967,431,252 41,070,000 3,118,168 37,951,832 3.92% 2,372 2015 16,800 1,047,122,752 44,768,569 3,294,791 41,473,778 3.96% 2,469 2016 18,418 1,149,202,404 42,075,788 3,369,738 38,706,050 3.37% 2,102 2017 19,122 1,277,317,236 42,779,172 3,414,381 39,364,791 3.08% 2,059 2018 20,336 1,486,020,609 39,318,526 3,628,463 35,690,063 2.40% 1,755 2019 23,470 1,668,601,991 35,777,877 3,513,061 32,264,816 1.93% 1,375 2020 25,030 1,935,983,668 32,142,229 2,533,196 29,609,033 1.53% 1,183 2021 26,820 2,295,030,889 28,681,582 1,937,790 26,743,792 1.17% 997 2022 27,040 2,654,551,468 24,370,000 1,737,769 22,632,231 0.85% 837 Source: 1 City Staff 2 Kaufman County Appraisal District 3 Schedule of Bonds Payable and Total Bonds for Fiscal Year (does not include debt to be reimbursed by TxDOT with pass-through usage) 82
TABLE 11
CITY OF FORNEY, TEXAS
DIRECT AND OVERLAPPING GOVERNMENTAL ACTIVITIES DEBT
SEPTEMBER 30, 2022 (UNAUDITED)
Source: "Texas Municipal Report" as of September 30, 2022, prepared by the Municipal Advisory Council.
Note: Overlapping governments are those that coincide, at least in part, with the geographic boundaries of the City. This schedule estimates the portion of the outstanding debt of those overlapping governments that are borne by the residents and businesses of the City of Forney. This process recognizes that, when considered the City of Forney's ability to issue and repay long-term debt, the entire debt burden borne by the residents and businesses should be taken into account. However, this does not imply that every taxpayer is a resident, and therefore responsible for repaying the debt of each overlapping government.
(1) The percentage of overlapping debt applicable is estimated using the taxable assessed property values. Applicable percentages were estimated by determining the portion of the overlapping government's taxable assessed value that is within the City of Forney's boundaries and dividing it by the overlapping government's total taxable assessed value.
TABLE 12 Percentage of Debt City Share of Gross Bonded Applicable to Overlapping Governmental Subdivision Debt Area Debt Forney Independent School District 927,117,263 $ 39.37% 365,006,066 $ Kaufman County 234,832,296 18.08% 42,457,679 1,161,949,559 407,463,746 City of Forney 26,704,127 434,167,873 Ratio of overlapping bonded debt to taxable assessed valuation (valued at 100% of market value) 22.43% Per capita overlapping bonded debt 17,346 $
83
All taxable property within the City is subject to the assessment, levy and collection by the City of a continuing, direct annual ad valorem tax sufficient to provide for the payment of principal of and interest on all ad valorem tax debt within the limits prescribed by law. Article XI, Section 5, of the Texas Constitution is applicable to the City, and provides for a maximum ad valorem tax rate of $2.50 per $100 taxable assessed valuation for all City purposes. The Home Rule Charter of the City adopts the constitutionally authorized maximum tax rate of $2.50 per $100 taxable assessed valuation. Administratively, the Attorney General of the State of Texas will permit allocation of $1.50 of the $2.50 maximum tax rate for all general obligation debt services, as calculated at the time of issuance and based on a 90% collection rate.
SEPTEMBER 30, 2022 (UNAUDITED) TABLE 13 Allowable levy per $100 Valuation $1.50 Levy for Debt Service 0.145054 Percentage of allowable levy used 9.67%
CITY OF FORNEY, TEXAS LEGAL DEBT MARGIN INFORMATION
84
CITY OF FORNEY, TEXAS
DEMOGRAPHIC AND ECONOMIC STATISTICS
Fiscal Estimated Personal Per Capita Average Grade School Unemployment Year Population 1 Income 2 Income Age 3 Enrollment 4 Rate 5 2013 15,870 427,506,060 $ 26,938 $ 31.70 8,488 7.70% 2014 16,000 465,120,000 29,070 32.60 8,945 4.80% 2015 16,800 498,110,000 28,405 33.60 8,995 6.90% 2016 18,418 540,249,000 29,323 31.30 9,281 6.60% 2017 19,122 468,641,976 24,508 30.50 9,707 3.56% 2018 20,336 500,000,000 24,587 30.50 10,198 3.56% 2019 23,470 664,482,640 28,312 30.30 11,133 3.10% 2020 25,030 769,470,897 30,742 30.90 11,888 6.90% 2021 26,820 948,252,000 35,356 33.30 12,763 5.60% 2022 27,040 1,322,790,636 48,920 33.80 14,340 4.40% Sources: 1 EDC - Claritas 2 EDC - Claritas 3 EDC - Claritas 4 Forney ISD 5 Texas Workforce Commission 85
LAST TEN FISCAL YEARS (UNAUDITED) TABLE 14
THIS PAGE LEFT BLANK INTENTIONALLY
CITY OF FORNEY, TEXAS
PRINCIPAL EMPLOYERS
CURRENT AND NINE YEARS AGO (UNAUDITED)
Percentage Percentage No. of of Total City No. of of Total City Name of Employer Employees Rank Employment Employees Rank Employment Forney ISD 1,458 1 9.67% 1,150 1 20.62% Amazon 650 2 WalMart 398 3 2.64% 360 2 6.46% Smurfit Kappa 260 4 1.72% Intex Electric 250 5 1.66% 149 5 2.67% City of Forney 224 6 1.49% 116 7 2.08% Kroger Marketplace 222 7 1.47% Steve Silver Company 200 8 1.33% 200 4 3.59% Lowe's Home Improvement 165 9 1.09% 120 6 2.15% Goodyear Tire & Rubber 160 10 1.06% Orange County Containers 300 3 5.38% Brookshire's Grocery 92 8 1.65% Classic Industries 75 9 1.35% NexEra Energy 41 10 0.74% Totals 3,987 22.13% 2,603 46.68% Total employment within City 15,079 5,576
TABLE 15
2022 2013 86
Source: Forney Economic Development Corporation and employer records
CITY OF FORNEY, TEXAS
FULL-TIME EQUIVALENT CITY GOVERNMENT EMPLOYEES BY FUNCTION/PROGRAM
LAST TEN FISCAL YEARS (UNAUDITED) Function/Program 2013 2014 2015 2016 2017 General Government 24.00 25.00 26.00 30.00 36.00 Public Safety: Municipal Court 2.50 2.63 2.63 2.63 2.63 Police 36.00 39.63 41.63 43.00 46.00 Fire 24.00 24.00 24.00 27.50 31.00 Animal Control 2.00 2.00 2.00 3.00 3.00 Public Works 9.00 8.00 8.00 5.00 7.00 Parks and Recreation 8.00 9.00 9.00 9.00 9.00 Water and Sewer Systems 12.00 13.00 13.00 15.00 13.00 Total 117.50 123.26 126.26 135.13 147.63 87
TABLE 16 2018 2019 2020 2021 2022 40.00 46.00 44.50 49.00 51.50 3.00 3.00 3.00 3.00 3.00 47.00 47.00 48.00 49.00 54.50 38.00 38.00 38.00 43.00 52.00 3.00 3.00 3.00 3.00 4.50 7.00 6.00 9.00 13.50 17.00 12.00 12.00 11.00 15.00 16.00 11.00 11.00 10.00 12.00 25.00 161.00 166.00 166.50 187.50 223.50 88
CITY OF FORNEY, TEXAS
OPERATING INDICATORS BY FUNCTION
LAST TEN FISCAL YEARS (UNAUDITED) 2013 2014 2015 2016 Function/Program Public Safety Municipal Court Number of cases filed 211 328 625 2,608 Police Physical Arrests 764 807 635 748 Traffic Violations 1,681 2,346 2,129 1,804 Fire Number of calls answered 3,464 3,441 3,261 4,066 Animal Control Number of calls 512 1,856 1,584 825 Public Works Streets maintained 150 150 150 152 Water and Wastewater New connections 212 151 113 120 Annual gallons of water pumped (millions) 1,369 1,370 1,558 1,849 Miles of water mains maintained 105 105 108 108 Fiscal Year 89
TABLE 17 2017 2018 2019 2020 2021 2022 1,558 1,955 2,892 2,339 2,100 2,019 528 737 767 662 552 719 1,455 2,247 2,299 2,196 5,965 6,762 5,427 6,222 6,400 5,745 7,502 6,509 774 1,101 1,106 959 833 982 113 95 99 130 140 156 242 371 165 165 381 231 1,750 1,956 2,043 2,345 2,406 2,754 113 115 122 132 136 140 Fiscal Year 90
CITY OF FORNEY, TEXAS
CAPITAL ASSET STATISTICS BY FUNCTION
LAST TEN FISCAL YEARS (UNAUDITED) 2013 2014 2015 2016 Function/Program Public Safety Police Stations 1 1 1 1 Patrol units 23 24 24 26 Fire Stations 1 1 1 1 Public Works Streets (miles) 150 150 150 152 Parks and Recreation Parks (acreage) 258 258 258 258 Number of playgrounds 6 6 6 6 Water and Wastewater Water main (miles) 105 105 105 108 Sewer mains (miles) 75 75 75 93 Storm drainage (miles) 19 19 19 19
Fiscal Year 91
Source: City departments
TABLE 18 2017 2018 2019 2020 2021 2022 1 1 1 1 1 1 14 13 15 15 22 24 2 2 2 2 2 2 113 95 99 130 140 156 274 262 262 268 268 268 6 6 6 6 6 6 113 115 122 132 136 140 93 113 118 128 133 138 33 33 36 42 46 49 Fiscal Year 92
THIS PAGE LEFT BLANK INTENTIONALLY
COMPLIANCE SECTION
THIS PAGE LEFT BLANK INTENTIONALLY
INDEPENDENT AUDITOR’S REPORT ON INTERNAL CONTROL OVER FINANCIAL REPORTING AND ON COMPLIANCE AND OTHER MATTERS BASED ON AN AUDIT OF FINANCIAL STATEMENTS PERFORMED IN ACCORDANCE WITH GOVERNMENT AUDITING STANDARDS
Honorable Mayor and Members of the City Council City of Forney, Texas
We have audited, in accordance with the auditing standards generally accepted in the United States of America and the standards applicable to financial audits contained in Government Auditing Standards issued by the Comptroller General of the United States, the financial statements of the governmental activities, the business-type activities, the discretely presented component unit, each major fund, and the aggregate remaining fund information of the City of Forney, Texas, as of and for the year ended September 30, 2022, and the related notes to the financial statements, which collectively comprise the City of Forney, Texas’ basic financial statements, and have issued our report thereon dated February 17, 2023.
Report on Control Over Financial Reporting
In planning and performing our audit of the financial statements, we considered the City of Forney, Texas’ internal control over financial reporting (internal control) as a basis for designing audit procedures that are appropriate in the circumstances for the purpose of expressing our opinions on the financial statements, but not for the purpose of expressing an opinion on the effectiveness of the City of Forney, Texas internal control. Accordingly, we do not express an opinion on the effectiveness of the City of Forney, Texas internal control.
A deficiency in internal control exists when the design or operation of a control does not allow management or employees in the normal course of performing their assigned functions, to prevent, or detect and correct misstatements on a timely basis. A material weakness is a deficiency, or a combination of deficiencies, in internal control, such that there is a reasonable possibility that a material misstatement of the entity’s financial statements will not be prevented, or detected and corrected on a timely basis. A significant deficiency is a deficiency, or a combination of deficiencies, in internal control that is less severe than a material weakness, yet important enough to merit attention by those charged with governance.
Our consideration of internal control was for the limited purpose described in the first paragraph of this section and was not designed to identify all deficiencies in internal control that might be material weaknesses or significant deficiencies and therefore, material weaknesses or significant deficiencies may exist that were not identified. We identified certain deficiencies in internal control, described in the accompanying Schedule of Findings and Responses as items 2022-001 and 2022-002 that we consider to be material weaknesses.
93
Report on Compliance and Other Matters
As part of obtaining reasonable assurance about whether the City of Forney, Texas’ financial statements are free from material misstatement, we performed tests of its compliance with certain provisions of laws, regulations, contracts, and grant agreements, noncompliance with which could have a direct and material effect on the financial statements. However, providing an opinion on compliance with those provisions was not an objective of our audit and, accordingly, we do not express such an opinion. The results of our tests disclosed an instance of noncompliance or other matters that are required to be reported under Government Auditing Standards and which is described in the accompanying Schedule of Findings and Responses as item 2022-003.
City of Forney, Texas’ Response to Findings
City of Forney, Texas’ response to the findings identified in our audit are described in the accompanying Schedule of Findings and Responses. City of Forney, Texas’ response was not subjected to the auditing procedures applied in the audit of the financial statements and, accordingly, we express no opinion on it.
Purpose of this Report
The purpose of this report is solely to describe the scope of our testing of internal control and compliance and the results of that testing, and not to provide an opinion on the effectiveness of the entity’s internal control or on compliance. This report is an integral part of an audit performed in accordance with Government Auditing Standards in considering the entity’s internal control and compliance. Accordingly, this communication is not suitable for any other purpose.
Waco, Texas
February 17, 2023
94
CITY OF FORNEY, TEXAS
SCHEDULE OF FINDINGS AND RESPONSES FOR THE YEAR ENDED SEPTEMBER 30, 2022
Finding Number: 2022-001
Criteria: Management is responsible for establishing and maintaining an effective system of internal control over financial reporting. Proper reporting of developer contributions and capital assets is a key component of effective internal control over financial reporting.
Condition: A prior period adjustment in the amount of $31,382,260 was required to report the value of infrastructure assets donated by developers, which were not previously accounted for on the GL.
Effect: The City’s reported capital assets were incomplete, understating capital assets and net position in the 2021 government-wide financial statements.
Recommendation: We recommend enhancing internal controls to ensure that developer contributions are recorded on the GL and related infrastructure is added to the capital asset listing and depreciated.
Management’s Response: We acknowledged that there were control deficiencies in this area prior to our annual audit and we have already started reviewing internal policies and procedures to correct these issues.
Finding Number: 2022-002
Criteria: Management is responsible for proper reporting of investment activity
Condition: A material adjustment in the amount of $1,433,766 was required to adjust investments to fair market value on the GL.
Effect: The City’s investments and investment income were overstated
Recommendation: We recommend enhancing internal controls to ensure that investment activity is routinely reviewed and reconciled to the GL.
Management’s Response: We acknowledged that there were control deficiencies in this area prior to our annual audit and we have already started reviewing internal policies and procedures to correct these issues.
Finding Number: 2022-003
Criteria: Per the Public Funds Investment Act, the City is required to have its bank deposits adequately secured.
Condition: The City bank balance was not properly collateralized on the date of the highest cash balance.
Effect: The City at a time during the year had material deposits that were unsecured.
Recommendation: We recommend the City routinely monitor their cash balances and request the bank to add collateral when required.
Management’s Response: We acknowledged that there were control deficiencies in this area prior to our annual audit and we have already started reviewing internal policies and procedures to correct these issues.
95
THIS PAGE LEFT BLANK INTENTIONALLY
