


STRATEGIC ECONOMIC DEVELOPMENT PLAN City of Cibolo, Texas Prepared by: May 6, 2024 RKG Associates, Inc. Economic, Planning and Real Estate Advisors 2121 Eisenhower Avenue, Suite 402 Alexandria, VA 22314 Tel: 703.739.0965 www.rkgassociates.com Credit: www.kingspan.com Credit: www.santikos.com
1. I NTRODUCTION
Since the turn of the 20th century, Cibolo has transformed from a small community steeped in agriculture to a populated regional suburb. Population expansions accompanied this transformation, facilitating Cibolo’s economic growth over the previous two decades. The City has increased its spending capacities, expanded its job market, and absorbed substantial real estate investment (Figure 1-1).
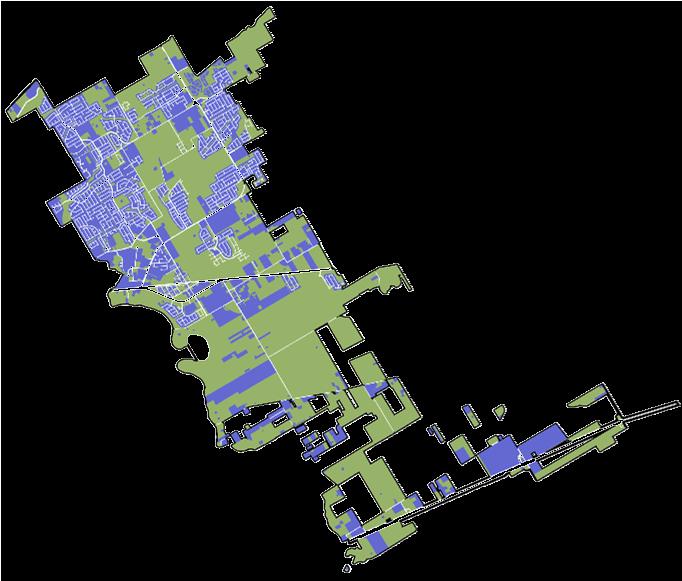
While Cibolo has developed a strong economic foundation, unmet opportunities are available that can further maximize the City’s growth potential and better ensure long-term economic sustainability. For instance, Cibolo’s development activity has skyrocketed in the previous two decades. However, most development has been dedicated to single family detached homes. The singular focus on developing single family detached homes can limit the City’s economic development potential, reducing their ability to attract catalytic business investment and a dynamic workforce needed in today’s competitive landscape.
Figure 1-1
Developed Land in 2000

Cibolo, Texas
Developed Land in 2023
Cibolo, Texas
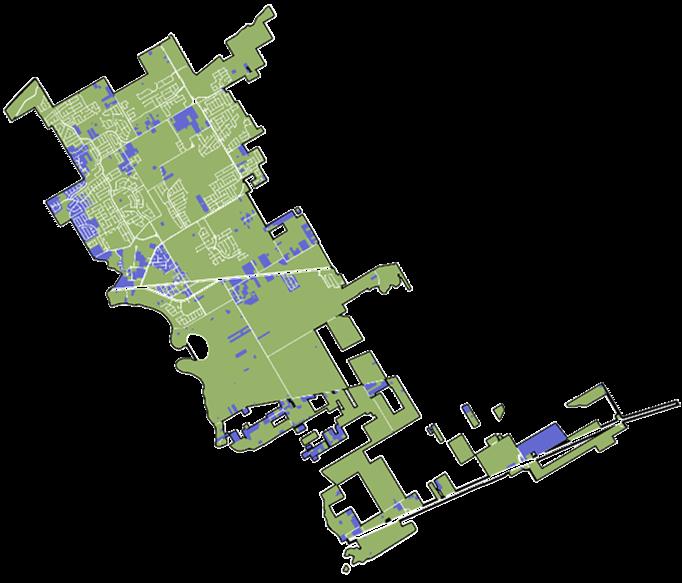

Vacant Land
Developed Land
Source: ACS Estimates, ESRI, RKG Associates Inc., 2023

The Strategic Economic Development Plan (SEDP) identifies market-driven opportunities and recommends strategies to bolster Cibolo’s environment for pursuing economic development. Several of the identified opportunities and recommended strategies detailed in this report reflect the cooperative effort with members of the SEDP Working Group (Table 1-1). The SEDP Working Group consisted of the City’s elected leadership, administration, business community, and key stakeholders, which helped identify feasible economic development goals, review market findings and opportunities, and prioritize recommended strategies.
City of Cibolo, Texas Strategic Economic Development Plan Page | 1-1
NAME AFFILIATION
Board Vice President, District 7 Table 1-1
Kelsee Jordan Lee City of Cibolo
Isabella Ellis City of Cibolo
Alora Wachholz City of Cibolo
Patricia Qaiyyim
Stosh Boyle
Kenderlynn Christophe
Derek Ottman
Marcus Mattingly
Cody Hicks
Justin Triesch
ROLE
Planning & Economic Development Director
Economic Development Specialist
Economic Development Manager
Board Secretary, District 1
Director, District 2
Director, District 3
Director, District 4
Board President, District 5
Board Treasurer, District 6
Strategic Economic Development Plan Page | 1-2
City of Cibolo, Texas
CEDC
CEDC
CEDC
CEDC
CEDC
CEDC
CEDC
2. E XECUTIVE S UMMARY
INTRODUCTION
Since the turn of the 20th century, Cibolo has transformed from a small community steeped in agriculture to a populated regional suburb. Population expansions accompanied this transformation, facilitating Cibolo’s economic growth over the previous two decades. The City has increased its spending capacities, expanded its job market, and absorbed substantial real estate investment.
While Cibolo has developed a strong economic foundation, unmet opportunities are available that can further maximize the City’s growth potential and better ensure long-term economic sustainability. For instance, Cibolo’s development activity has skyrocketed in the previous two decades. However, most development has been dedicated to single family detached homes. The singular focus on developing single family detached homes can limit the City’s economic development potential, reducing their ability to attract catalytic business investment and a dynamic workforce needed in today’s competitive landscape.
The Strategic Economic Development Plan (SEDP) identifies market-driven opportunities and recommends strategies to bolster Cibolo’s environment for pursuing economic development. Several of the identified opportunities and recommended strategies detailed in this report reflect the cooperative effort with members of the SEDP Working Group. The SEDP Working Group consisted of the City’s elected leadership, administration, business community, and key stakeholders, which helped identify feasible economic development goals, review market findings and opportunities, and prioritize recommended strategies.
KEY FINDINGS
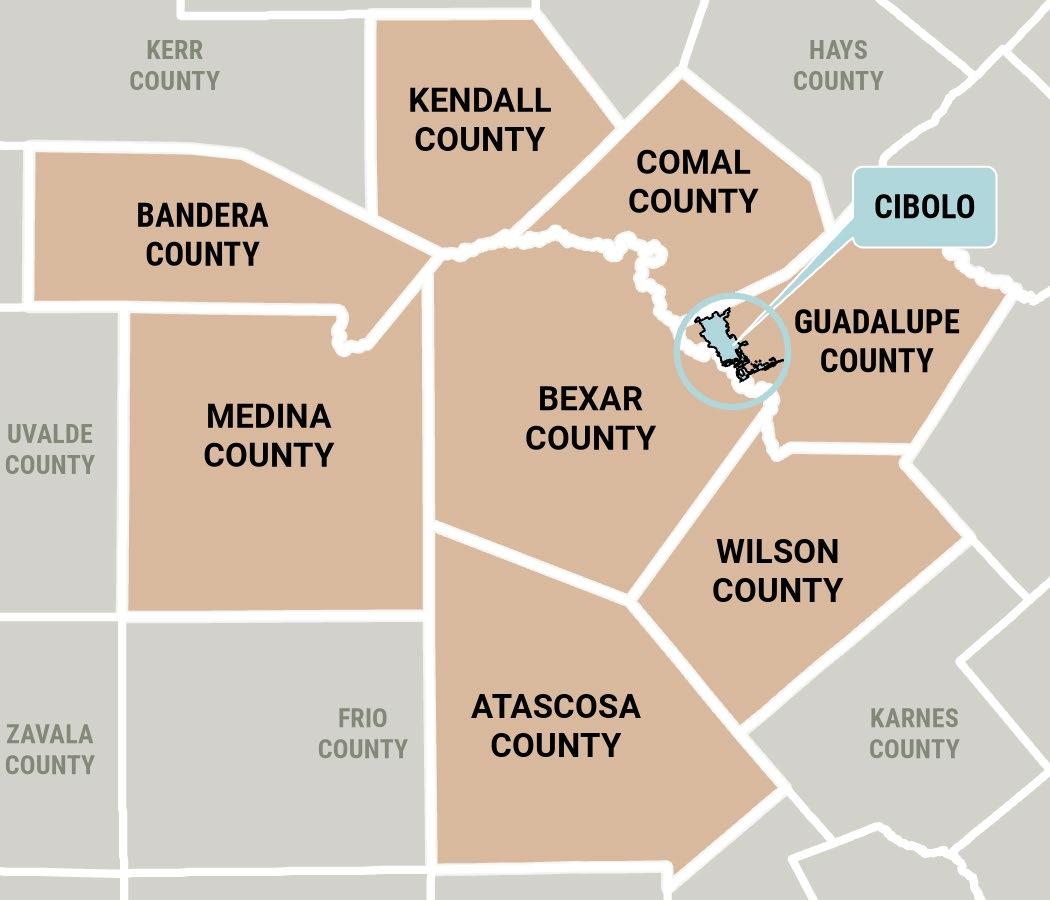
The following sections summarize key findings derived from the primary analyses conducted in the SEDP: Socioeconomic Analysis, Real Estate Analysis, and Target Industry Analysis. Each of these primary analyses focus on trends and conditions unfolding in Cibolo, Guadalupe County, and the broader San Antonio-New Braunfels Metropolitan Statistical Area (MSA).
The MSA consists of eight counties: [1] Kendall County, [2] Comal County, [3] Guadalupe County, [4] Bexar County, [5] Wilson County, [6] Atascosa County, [7] Bandera County, and [8] Medina County Throughout this Executive Summary, the San Antonio-New Braunfels MSA will be referred to as the ‘MSA’ or the ‘Region. The maps on the next page illustrate the MSA, along with Cibolo, located on the edge of Western Guadalupe County and northwestern edge of Bexar County.
City of Cibolo, Texas Strategic Economic Development Plan Page | 2-1


1. SOCIOECONOMIC ANALYSIS FINDINGS
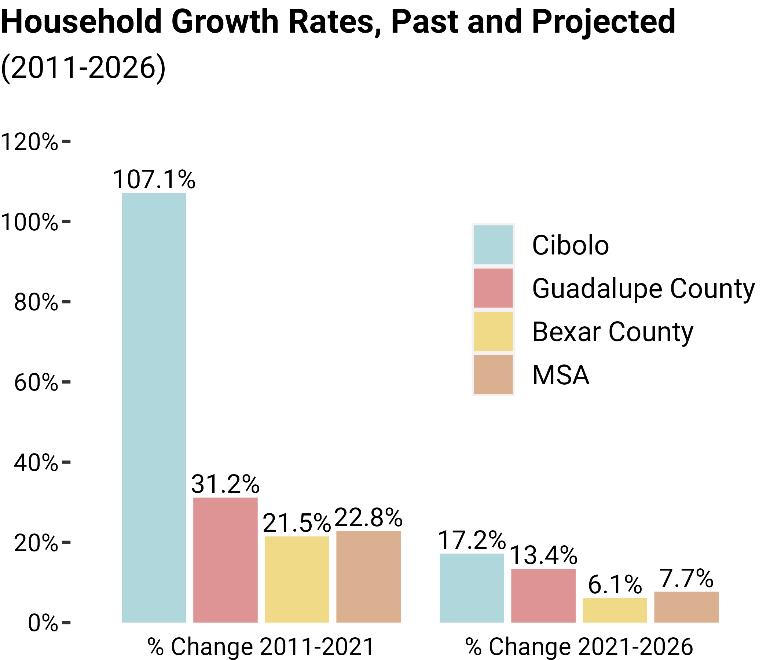
Regional growth rates exceeded Bexar County growth rates. Rapid population growth rates and household base expansions occurred throughout the region, particularly in communities outside of Bexar County (San Antonio) This surge can be largely attributed to the swift construction of rooftops in previously undeveloped areas, particularly those with abundant and untapped land resources like Cibolo.
Trends in Cibolo reflect a prototypical suburban community characterized by the proliferation of master-planned subdivisions, growing household sizes, and an influx of families with children. However, the emphasis on suburban development may constrain the City’s appeal to potential businesses and limit access for certain segments of the workforce needed to sustain a diverse economy.
Cibolo is competitively positioned to facilitate business development. The City boasts a highly educated population, making it an attractive destination for businesses operating in white-collar industry segments. Furthermore, Cibolo's population is becoming increasingly diverse and includes a significant presence of veterans, which can create opportunities for entrepreneurship.
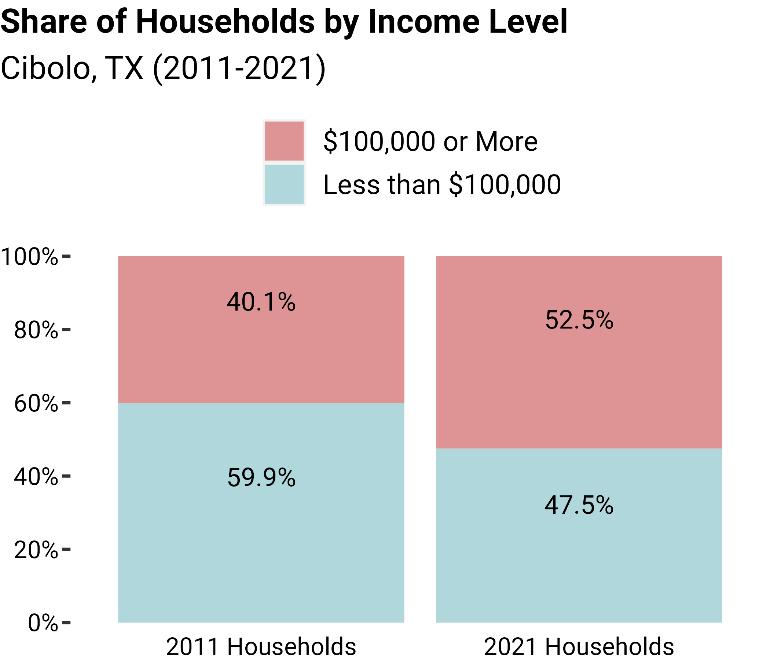
Rising income levels suggest ensuing affordability challenges. Households earning $100,000 or more represent a more significant share of the City’s household base than a decade ago. The influx of higher incomes has accelerated housing costs, reaching levels unaffordable to key workforce segments (particularly service and production-based workers).
City of Cibolo, Texas Strategic Economic Development Plan Page | 2-2
Map 2-1: Geography Under Analysis
2. REAL ESTATE ANALYSIS FINDINGS
Strategic land assets fueled industrial development in Cibolo. The City’s availability of developable land offering interstate accessibility catalyzed the formation of Schneider Industrial Park. These assets also led to Aisin’s substantial investment along Interstate-10. Today, industrial uses represent the largest proportion of Cibolo’s non-residential inventory and the greatest short-term opportunity for Cibolo.
Cibolo’s non-residential development inventory diversified in the previous decade. Until 2011, industrial development constituted a substantial 80% of Cibolo’s non-residential development inventory. However, rapid population growth through the previous decade stimulated unprecedented retail investment, as retail uses today constitute a significant share (approximately 37%) of the City’s non-residential development inventory.
Consumer demand is likely short of justifying additional retail investment. While the City aims to attract further retail investment, especially sit down restaurants, Cibolo faces unfavorable market forces. At a base level, there is little unmet existing restaurant demand. More strategically, the City is located in close proximity to New Braunfels and Live Oak, which are both regional retail destinations. Restaurants are driven to maximize revenues by targeting leasing opportunities within these destinations, where traffic levels and demand are highest. Expanding the City’s housing stock is an effective approach to create the additional critical mass needed to drive additional retail/restaurant investment.
Cibolo’s residential development patterns paint a picture of a traditional suburban landscape. Standard subdivisions represent most of Cibolo’s housing stock. The emphasis on building single family homes limits housing options and maximizes land consumption (on a per unit basis). As supply is constrained and housing demand remains high, prices escalate. Escalating housing prices have made living options unaffordable to key segments of the workforce, which can discourage business investment.
Although the City has abundant developable land resources, future land use policies can limit future economic opportunity. Cibolo is competitively positioned to capture both residential and non-residential development opportunities that can facilitate job creation, tax base growth, and workforce development. However, current land use designations limits some of these opportunities including housing diversity and production-based opportunities.
3. TARGET INDUSTRY ANALYSIS FINDINGS
Business recruitment, attracting business investment to Cibolo, is a primary function of the City’s economic development efforts. A strategic approach towards business recruitment, likely to generate the most immediate returns, is targeting businesses within industries that demonstrate market potential in Cibolo. The selection of such industries is a complex process, not only accounting for several local socioeconomic and real estate trends, but the results generated from a cluster analysis.
City of Cibolo, Texas Strategic Economic Development Plan Page | 2-3
Cluster analysis serves as a valuable tool in understanding how different industries perform within the context of Cibolo's market. Industries with higher cluster analysis scores indicate stronger performance within Cibolo's marketplace. These scores are based on three main factors outlined in Figure 4-9: [1] the total number of jobs in the industry (represented by bubble size), [2] the growth rate of industry jobs between 2010 and 2023 (y-axis), and [3] the industry's location quotient (x-axis).
Industry Clusters
Cibolo, TX (2010-2023)
Total Number of Jobs
The location quotient (LQ) measures the concentration of industry jobs in Cibolo compared to the San Antonio Metropolitan Statistical Area (MSA). Industries with higher LQs are more specialized in Cibolo, suggesting a concentration of industry-specific skill sets. This specialization can serve as a driving factor in recruitment efforts, as industries tend to thrive and grow more easily in areas where a concentration already exists. Industries with the highest location quotients include Manufacturing (2.54 LQ) as well as Mining & Extraction (12.38 LQ).
The above graphic provides a high-level understanding of specialized industries in Cibolo. Each of these industries is composed of several subindustries, detailed at a more granular level. For instance, Manufacturing composes a diverse mix of subindustries, ranging from food manufacturing to furniture manufacturing.
In Cibolo, automotive parts manufacturing subindustry is significant subindustry as several jobs were created following AISIN’s recent investments. Following a deep dive analysis, RKG Associates identified and classified 4 high-level industry categories of which are composed of
City of Cibolo, Texas Strategic Economic Development Plan Page | 2-4
Construction Manufacturing Wholesale Trade Retail Trade Transportation /Warehousing Finance & Insurance Professional & Technical Services Admin Support Services Education Health Care Arts & Recreation Accommodation & Food Services Other Services Government -200.0% -150.0% -100.0% -50.0% 0.0% 50.0% 100.0% 150.0% 200.0% 250.0% 300.0% 350.0% 400.0% 450.0% 500.0% 550.0% 0.00 0.50 1.00 1.50 2.00 2.50 3.00
Location Quotient
2010 to 2023 Growth Rate
several subindustries the City of Cibolo should consider pursuing through business recruitment efforts towards in the short-term:
1) Transportation Parts & Components Manufacturing
2) Intermediate Components Manufacturing
3) Acute and Specialty Health Care
4) Entrepreneurial Development
The following table indicates subindustries that fall under each of the above identified target industries. Market indicators suggest that these subindustries can support further employment expansions within the City of Cibolo. If applicable, a subindustry will correspond with a specific 4-digit NAICS code.
City of Cibolo, Texas Strategic Economic Development Plan Page | 2-5
Transportation Parts & Components Manufacturing Subindustries NAICS Codes Motor Vehicle Parts Manufacturing 3363 Aerospace Product Parts and Parts Manufacturing 3364 Engine, Turbine, Power Transmission Equipment Manufacturing 3336 General Freight Trucking 4841 Rail Transportation 4821 Process, Distribution, and Logistics Consulting 5416 Architectural, Engineering, and Related Services 5413 Acute and Specialty Health Care Subindustries NAICS Codes Offices of Physicians 6212 Outpatient Care Centers 6214 Individual and Family Services 6241 Skilled Nursing Facilities 6231
City of Cibolo, Texas Strategic Economic Development Plan Page | 2-6 Assisted Living Facilities for the Elderly 6233 Home Health Care Services 6216 Mental Health Practitioners 6213 Intermediate Component Manufacturing Subindustries NAICS Codes Construction and Mining Machinery Manufacturing 3331 Industrial Machinery Manufacturing 3332 Wood Product Manufacturing 3212, 3219 Nonferrous Metal Production and Processing 3314 Plastics Product Manufacturing 3261 Process, Distribution, and Logistics Consulting 5416 Architectural, Engineering, and Related Services 5413 Entrepreneurial Development Subindustries NAICS Codes Specialty Food and Beverage Manufacturing 3114, 3121 Management, Scientific, and Technical Consulting Services 5416 Specialized Design and Computer Systems Design Services 5414, 5415 Personal Care Services 8121 Data Processing, Hosting, and Related Services 5182 Accounting, Tax Preparation, Bookkeeping 5412 Architectural, Engineering, and Related Services 5413
OPPORTUNITY SITE ANALYSIS
As part of this effort, RKG Associates worked with city staff and the Economic Development Corporation (EDC) board of directors to understand specific economic development opportunity sites within Cibolo. The analysis focused on identifying the economic activity centers within Cibolo (within the city limits of Cibolo, specifically), and then assessing if there are any parcels or collection of parcels that currently have a competitive advantage to catalyze new investment or bolster the economic potential of that area.
The first step was to determine the existing economic activity centers in Cibolo. RKG, city staff, and the EDC board analyzed properties in Cibolo to evaluate those areas that contain high concentrations of commercial activity, appropriate infrastructure and transportation capacity, and geographic proximity to local and regional consumer bases. Multiple areas were identified, with each area being defined to best reflect current and projected boundaries to accommodate non-residential and mixed-use development, infill development, adaptive reuse, or redevelopment.
The next step was to identify properties within each economic activity center that demonstrate the potential to attract and sustain business investment consistent with the vision for that area and can serve as a catalyst to advance the city’s goal to attract and retain business
The result of this effort is detailed in Map 5-1. As seen, a total of six economic activity centers were identified for further analysis. It is important to note that these areas (listed below) reflect those locations with the greatest current, or short-term (less than five years) opportunity for economic development investment and coordinate with the city’s comprehensive plan. That said, other areas also have economic activity potential that could be considered as the city’s development patterns evolve and/or local community priorities shift.
I-35 Corridor
1103 Crossing
FM-78 East
FM-78 West
Downtown
I-10 Corridor
City of Cibolo, Texas Strategic Economic Development Plan Page | 2-7
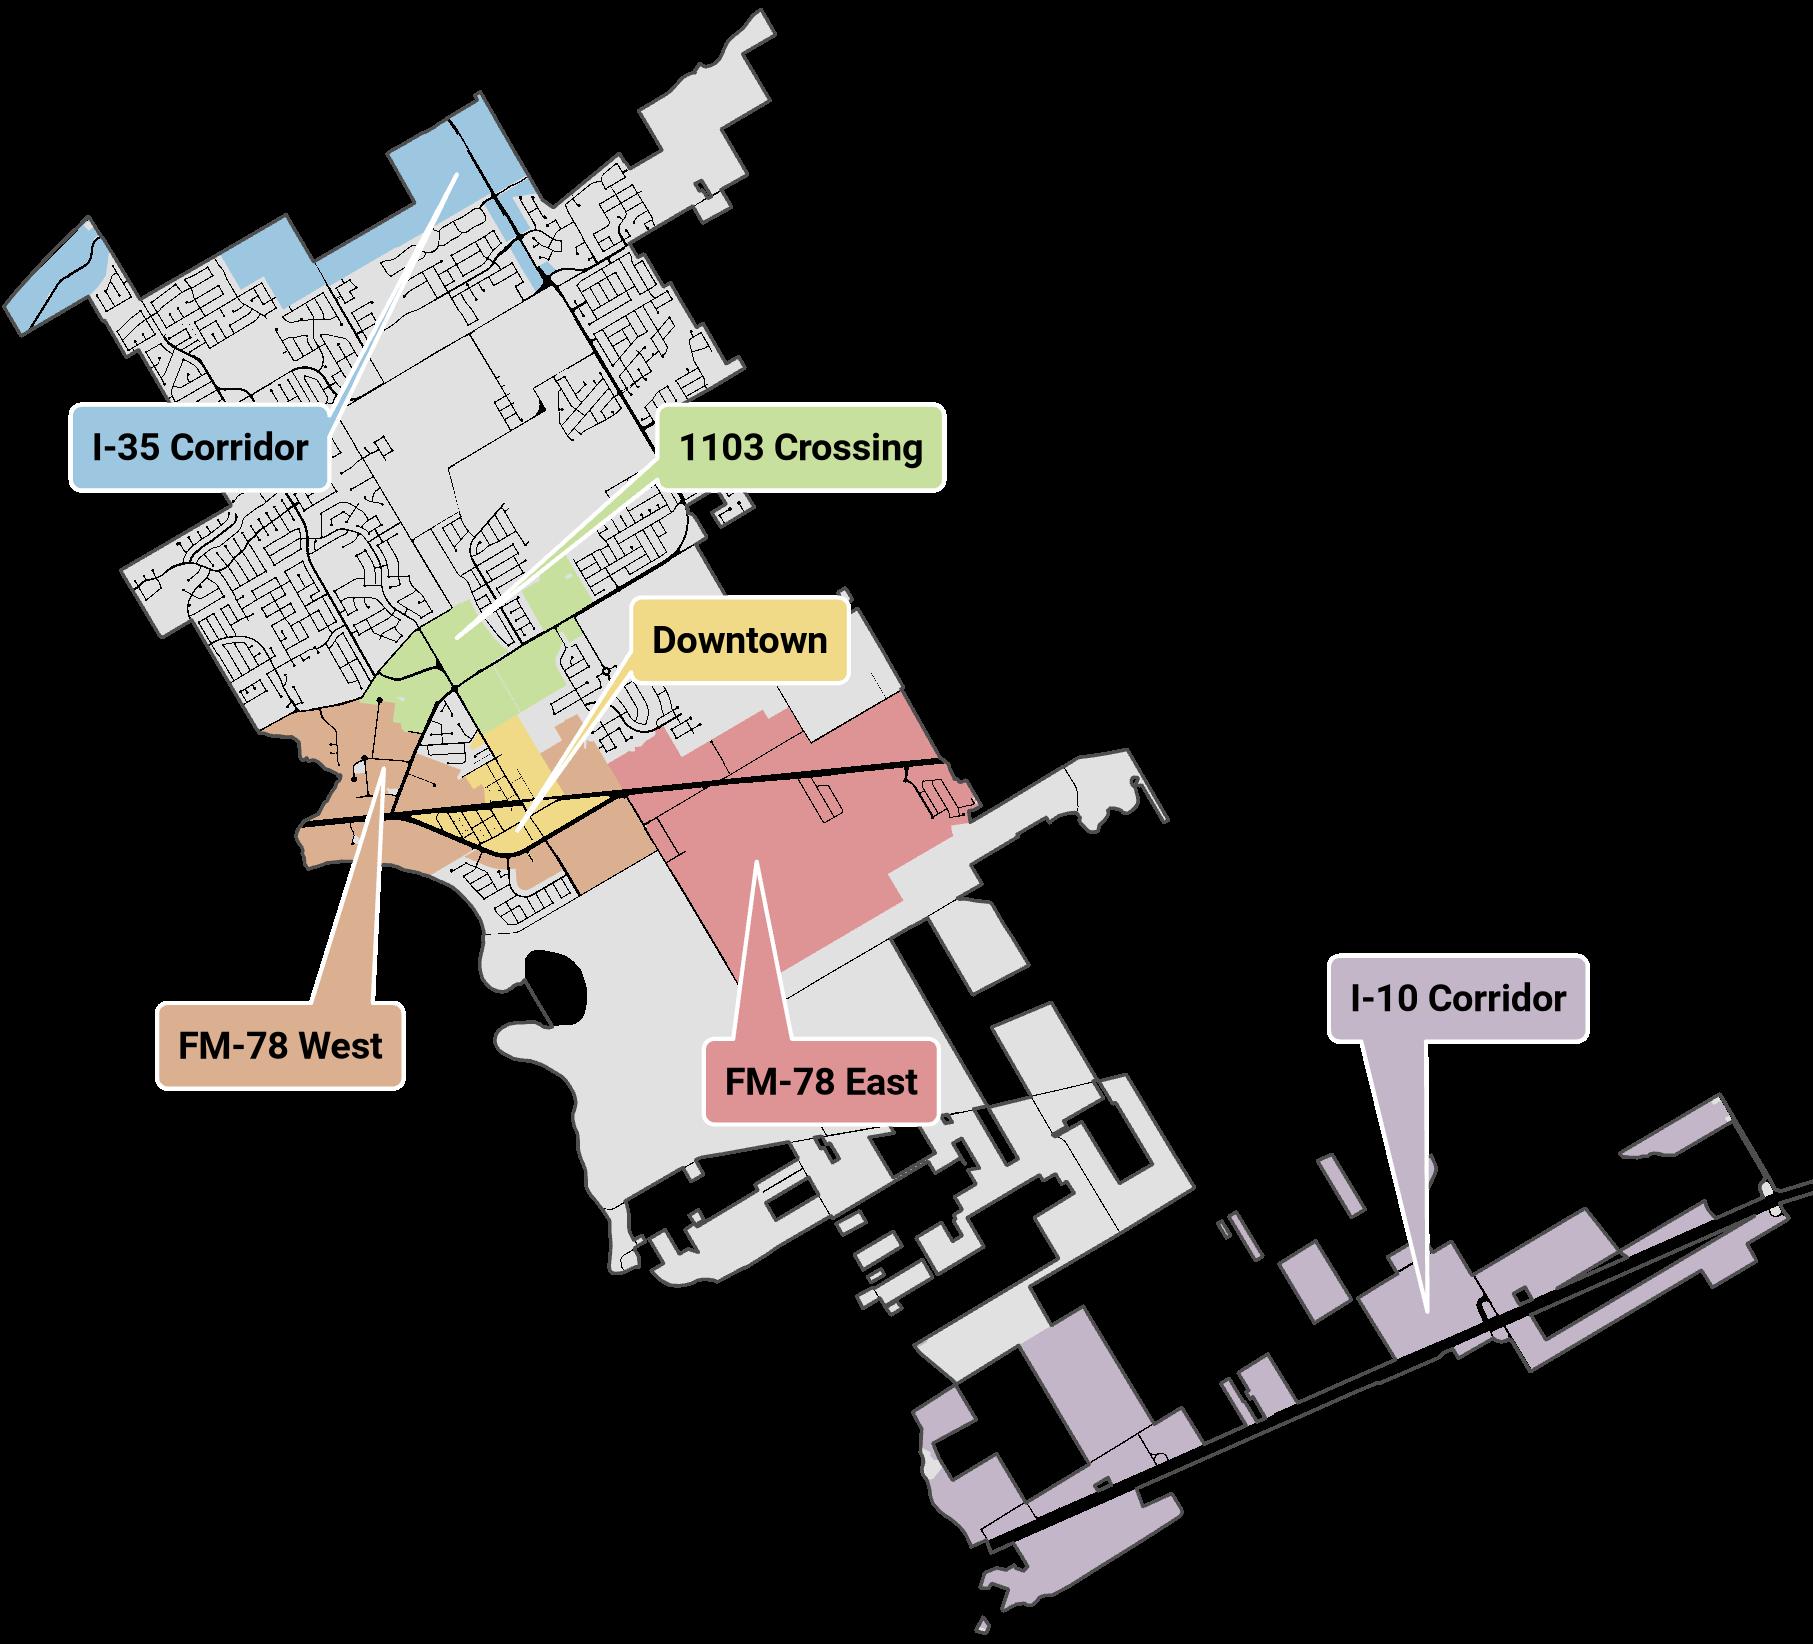
I-35 CORRIDOR
The Interstate-35 economic activity center consists of properties with the most direct access to Interstate-35 within the City of Cibolo. Cibolo Crossing, a major retail development consisting of regional anchors including the Santikos Movie Theater, occupies the city’s entire frontage along I-35. The west side of the study area consists of substantial land acreage, offering development opportunities that can capitalize on the proximity to the interstate without having direct access or visibility. The study area is considered Cibolo’s most viable opportunity to create a vibrant economic stronghold that acts as a regional attraction in the short-term
City of Cibolo, Texas Strategic Economic Development Plan Page | 2-8
Map 2-2: Cibolo Economic Activity Areas
1103 CROSSING
1103 Crossing is Cibolo’s primary retail hub, anchored by Walmart and H-E-B. Retail investment rapidly expanded in the vicinity of these major anchors, capitalizing on anticipated traffic flows to maximize revenue potential. With the area already exhibiting a strong gravitational pull, several catalytic opportunities remain to leverage its momentum. These opportunities aim to strengthen community ties and enhance retail performance. This also includes phasing out existing developments that underperform, replacing them with uses better suited to foster economic growth.
DOWNTOWN
The future of Downtown Cibolo, especially historical Main Street, has been a source of disagreement within Cibolo. Opinions diverge on the area’s long-term vision and the appropriate land uses and levels of activity. On one hand, there are advocates for preserving Downtown Cibolo as is, concerned that additional commercial investment would adversely impact historical significance and charm. On the other hand, there are proponents for additional commercial investment and revitalization efforts, aimed at enhancing Main Street’s position as a community hub for entertainment and recreation. While there is an existing Downtown Master Plan, it was reported during this process that there is not consensus on the best approach. As efforts towards establishing consensus are made, including the impending update to the Downtown plan, opportunities exist in the meantime to foster economic growth in the economic opportunity area.
FM-78 WEST
The FM-78 West economic activity center is bisected by FM-78 and the Union Pacific railroad. FM-78 is the main east-west transportation connector for central Cibolo, but a secondary route compared to traffic volumes on I-35 and I-10. This activity area offers several catalytic development opportunities, especially for capitalizing on the EDC property/Niemetz Park site as well as proximity to Schneider Business Park. Schneider Business Park is a critical component of the city’s economy, elevating Cibolo’s regional presence as an industrial hub. The concentration of production-based businesses makes additional investments in small scale industrial uses targeted at the remaining vacant parcels within the study area.
Generally, RKG recommends the City affirm a vision for the corridor. Current zoning indicates a strategy for FM-78 to become a commercial corridor similar to Roy Richard Drive. However, the retail analysis provided in the Real Estate Market chapter indicates the demand for retail and restaurant development within Central Cibolo does not justify the amount of land dedicated to commercial use (through zoning). Short-term opportunities include small-scale industrial and flex development and/or residential development. Given FM-78 is this major east-west transportation corridor through Cibolo, frontage parcels should be committed to higher intensity uses than traditional single-family development.
City of Cibolo, Texas Strategic Economic Development Plan Page | 2-9
All that said, the current vision for FM-78 reflects a long-term growth plan depending on additional residential development to create market demand for additional retail development. Affirming this remains the vision for the corridor will set expectations for the economic development of both the FM-78 West and FM-78 East economic activity centers.
The EDC property/Niemietz Park serves as a significant recreational space for Cibolo residents, featuring athletic facilities, playground equipment, and walking trails. There is an interest within the city to modernize Niemetz Park, incentivizing the City of Cibolo to consider numerous strategies towards revitalization. The strategies under consideration vary in scope and scale, designed to increase Niemetz Park’s economic potential.
FM-78 EAST
The FM-78 East economic activity center has seen minimal investment, with much of the area still undeveloped. The investments that have materialized primarily revolve around mobile home parks, agricultural estates, and the ongoing construction of an expansive subdivision called Venado Crossing. With extensive land resources and integration with FM-78, the area presents an opportunity to develop a dynamic work-live-play destination. This destination could enhance the economic value of areas east of Haeckerville Rd and strengthen the potential for a more dynamic employment hub along FM-78.
I-10 CORRIDOR
The Interstate 10 economic activity center is an advantageous area for industrial investment given the substantial developable acreage that can absorb manufacturing facilities and logistics based operations. Developable land along with the area’s direct access to I-10 has attracted significant industrial investment in the previous decade, including AISIN and the nearly operational OMNI industrial park. Streamlining future industrial development can accelerate the city’s productionbased economy, Cibolo’s most viable opportunity for job growth in the short-term.
IMPLEMENTATION STRATEGY
The Implementation Chapter discusses economic development strategies for the City of Cibolo Economic Development Corporation (EDC) and the City Council to adopt, recommended by RKG Associates and the Working Group (listed in the Introduction section). These strategies were crafted on account of feedback from local and regional implementation partners, empirical research, and input from the City of Cibolo EDC, elected officials, and staff. The initial section of this chapter details the defined principles and goals identified by the City Council and the EDC board of directors. The next sections detail discrete ‘priority action’ recommendations and implementation steps to assist the Cibolo community in pursuing their economic development goals.
City of Cibolo,
Strategic Economic Development Plan Page | 2-10
Texas
The implementation strategy is organized into six general topic areas: [1] Business Retention and Expansion; [2] Business Recruitment; [3] Existing Asset Development; [4] Toolbox Development; [5] Outreach, Communication, and Marketing; and [6] Organization and Coordination. These topic areas reflect the basic tenets of effective business retention, expansion, and recruitment activities.
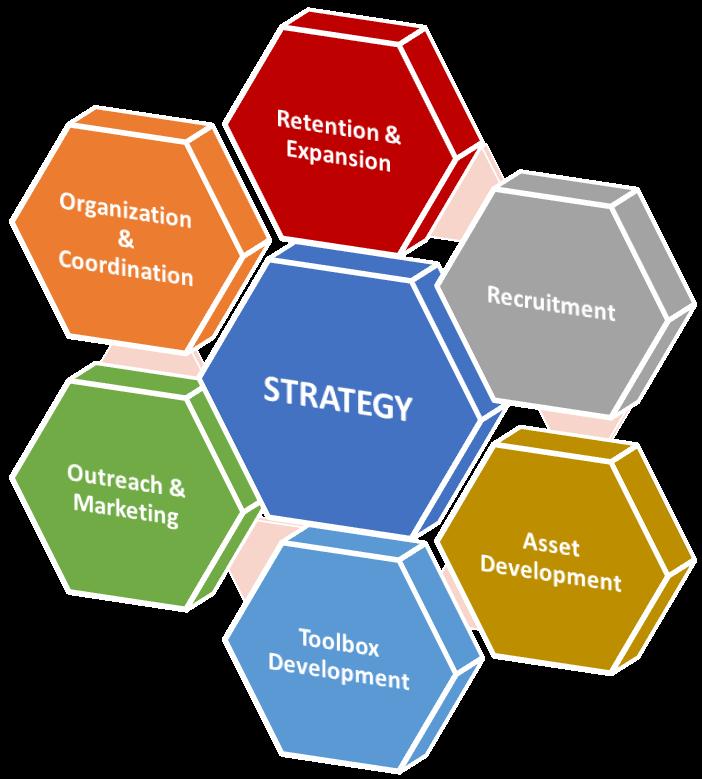
The success of each topic area depends on the effectiveness of all other topic areas. For example, the City’s business retention and expansion strategies will depend on committing to a comprehensive and proactive marketing, outreach, and communication strategy with existing businesses within Cibolo. Without consistent communication, the City will be limited in its effectiveness when trying to engage individual businesses regarding growth needs and challenges.
The assembled Working Group represents the various public and private perspectives that influence and are influenced by the City’s economic development efforts. This Working Group provided guidance and feedback throughout the development of this plan. As part of that effort, a comprehensive outreach strategy was held to identify, refine, and prioritize the City’s economic development goals that were initiated through previous efforts. These goals were presented and reviewed with the EDC Board of Directors and the City Council in joint work sessions, who provided feedback on refining these goals
• Enhance business retention and expansion efforts.
• Increase the City’s developable non-residential land assets.
• Increase the City’s entrepreneurial policies and programs.
• Strengthen relationships with local and regional stakeholders.
• Diversify the City’s housing supply to support business recruitment and retention.
• Increase consumer demand to support greater retail and restaurant investment.
• Enhance coordination of utility investment and development to support industrial development.
• Build stronger connections between businesses and regional training providers.
The Implementation Chapter provides a detailed matrix with specific action steps for each economic development objective under the six topic areas. The matrix identifies leadership responsibilities, partnership opportunities, prioritization of effort, and potential cost estimates for each action. It is important to note that this tool is advisory for the City’s economic development efforts. It is not RKG
City of Cibolo, Texas Strategic Economic Development Plan Page | 2-11
Associates’ intent for the EDC, City, and its staff to interpret the implementation matrix as an absolute instruction manual on implementation. Rather, RKG intends this matrix to inform and advise the City on best practices and approaches. The City Council, EDC, and economic development staff should use the implementation matrix as a guide to develop an annual business plan that focuses on local economic development priorities and maximizes local partnerships and resources to achieve success. Interpretation of the matrix most likely will be required as markets, partnerships, priorities, and local leadership evolve and change.
The following Implementation Chapter also provides contextual information on several ‘priority actions’ that necessitate a more detailed discussion on the ‘why’ as well as the ‘how’ for implementation. These actions can be complex and/or considered essential. To this point, RKG Associates is providing thorough descriptions so that the community has the necessary context to customize these approaches to community preferences while maintaining the stated purpose for those actions. Please refer to the Implementation Chapter for that information.
City of Cibolo, Texas Strategic Economic Development Plan Page | 2-12
Action
Create a single database of all Cibolo businesses based on lists already available (e.g., secondary data vendors, partner organization membership lists…)
Provide opportunity for businesses to register/review their information in the business list through the City's economic development website
Work with property owners and landlords to collect business contact information
1.1.5 Implement volunteer walks, having 3-5 volunteers (e.g., Ambassadors) canvas the City's activity centers to gather contact information
Implement an annual business survey to identify emerging trends/needs
1.2.1 Establish a fixed date (e.g., week) that the survey will be released. This should be consistent year over year. Recommend the Fall
Action 1.2.2 Ensure the survey covers the following topics: Market climate/changes, Regulatory environment, Growth/contraction needs and concerns, Workforce needs, and Physical space needs
Action 1.2.3 Work with the chambers, other business organizations, and industry roundtables to refine questions and expand awareness of the survey each year
Action 1.2.4 Invest in multimedia marketing and outreach at least 2 months prior to the release of the survey each year (e.g., print, social media, direct outreach)
Action 1.2.5 Share general results of the survey with roundtables, partner organizations, and the community through the monthly newsletter
Action 1.2.6 Use results of survey to prioritize retention/expansion visits for the year
1.2.7 Work with respective roundtables about industry-specific findings from survey to determine annual action items
1.2.8 Retain all survey results to create a longitudinal assessment tool (e.g., Excel database) that can help economic development efforts become more predictive to changing market climates
Action 1.2.9 Strengthen partnerships with nearby municipalities to implement a broader survey effort through joint marketing, expanding the suvey reach, and developing regional trend data (target increased responses, shared costs...)
Proactively outreach to existing businesses through 1-on-1 meetings
1.3.2 Establish quotas for number of monthly visits, targeting ten (10) per month for each FTE committed to BRE efforts, expanding as volunteers are trained assist (e.g., Ambassadors)
Coordinate with economic development partners for business visits (e.g., chambers)
Action 1.3.5 Maintain database of visited businesses to track frequency and results of the visit through a Consumer Relationship Management (CRM) software
Activate business Ambassadors to assist in outreach, providing them training on questions to ask and how to track the conversation
Page | 2-13 City of Cibolo, Texas Estimated Cost Strategic Economic Development Plan Implementation Matrix Public/NP Private 123456789 10 Cost Type BUSINESS RETENTION AND EXPANSION Objective 1.1
CC, COC A One Time Action 1.1.2
information CC ST Annual Action
CC O, I, R Included 5.5.1 Annual Action
CC, COC O, ST Annual
CC, COC O, A Biennial Action 1.1.6
build
database CC O, ST Biennial Objective 1.2 Action
CC, COC O, A Annual
City of Cibolo, Texas Strategic Economic Development Plan
1.1.1
Utilize the state's business license processes to collect more detailed data about businesses, particularly contact
1.1.3
1.1.4
Action
Ask industry roundtable members to advertise volunteer walks and engage their relationships to
the
CC O, ST Annual
CC, COC O, ST Annual
CC Included 5.5.2 Annual
CC O, ST Annual
CC ST Annual
CC O, ST Annual
CC ST Annual
CC, MU ST Annual Objective 1.3 Action 1.3.1 Use
year CC ST Continuous Action
CC I,N ST Continuous Action 1.3.3
CC ST Annual Action
CC, COC ST Continuous
Action
Action
the comprehensive business list to identify new companies to visit and track past visit efforts. Do not concentrate on the same businesses year over
Use business survey results to prioritize outreach efforts to companies that indicate growth needs or challenges to maintain operations
1.3.4
CC B Annual Action 1.3.6
CC C Included 5.5.1 One Time Action 1.3.7
CC O, Included 5.3.1 Annual Implementation
Create a direct "help line" initiative on the City's economic development website that allows businesses to connect to an economic development staff member for assistance
Timing (Year)
Continue to develop a comprehensive list of all businesses within the City
Implementation Lead
home-based businesses to comply with the City's affidavit policy and expand the business contact database
Action 1.5.2 Use state data to identify home-based businesses (based on a geospatial analysis of business address)
Action 1.5.3 Consider implementing a separate home-based business survey from the main survey targeted with questions more relevant to these entrepreneurs
Action 1.5.4 Create a home-based business networking series with quarterly events and lectures on subjects identified through the BRE outreach efforts
Page | 2-14 City of Cibolo, Texas Estimated Cost Strategic Economic Development Plan Implementation Matrix Public/NP Private 1234567 89 10 Cost Type BUSINESS RETENTION AND EXPANSION Objective 1.4
City of Cibolo, Texas Strategic Economic Development Plan
CC, EDU O, I, R ST One Time Action 1.4.2
sure all partner organizations have representation
crossover missions CC, COC, EDU O, I, R ST One Time Action
CC O, I, R A Quarterly
Action 1.4.1 Have an industry roundtable for every key market sector including [1] Industrial; [2]Retail; [3] Restaurant; [4] Workforce/Education; [5] Health Care; [6] Professional Services; [7] Downtown
Make
on roundtables that
1.4.3 Meet each roundtable quarterly or semiannually as necessary, with one meeting targeted immediately after the release of the business survey results
opportunities;
implementation
annual
planning session CC O, I, R ST Annual Action 1.4.5 Use feedback from roundtables to help set annual action plan CC ST Annual Objective 1.5 Action 1.5.1
CC, COC O, A Annual
CC,
ST Annual
Action 1.4.4 Use roundtable meeting to discuss: [1] market climate; [2] regulatory issues; [3] growth
[4]
coordination at the
business
Create and implement a marketing campaign to engage all
TX
CC, COC O, ST Annual
CC, COC B Quarterly
1.5.5
CC O, ST Quarterly Objective 1.6 Action 1.6.1 Create
annual lecture on available
assistance programs CC, COC A Annual
Cohost at least two (2) networking/marketing events annually with municipal/regional partners targeting small business owners (e.g., less than 50 employees) CC A Semiannual Action 1.6.3 Host two (2) social gathering events for the city's industry clusters CC B Semiannual Action 1.6.4 Hold two (2) lecture/guest speaker events; bringing in regional/national industry leaders to discuss sector/market trends. This can be co-hosted with regional partners CC C Semiannual Action 1.6.5 Host at least two (2) women-owned and two (2) minority-owned business networking events annually CC A Semiannual Action 1.6.6 Host young professional/entrepreneur networking events quarterly in partnership with neighboring municipalities CC, MU A Semiannual Action 1.6.7 Host a "State of the City" event for business leaders to discuss activities over the past year, successes, opportunities, and share the business plan for the next year CC A Annual BUSINESS RECRUITMENT AND ATTRACTION Objective 2.1 Action 2.1.1 Engage industry roundtables and individual businesses to generate potential recruitment leads through vertical and horizontal supply chains CC, COC ST Quarterly Action 2.1.2 Establish quarterly work sessions with implementation partners (e.g., chambers, MU, SATX) to discuss opportunities and implementation strategies CC, COC, MU A Quarterly Action 2.1.3 Maintain local property and land database, coordinating with partners on maintaining an accurate and up-to-date list to augment the LoopNet data currently presented on the economic development website CC C Included 3.2.1 Annual Action 2.1.4 Collaborate on leads collected through business outreach and marketing efforts CC, COC, MU ST Annual Action 2.1.5 Work with local partners to build relationships with site selectors in target industry sectors, adding them the City's economic development newsletter distribution list CC, COC, MU O, ST Annual Action 2.1.6 Create a municipal economic development coalition focused on information sharing, best practice engagement, and collaboration on cross jurisdictional needs/opportunities (e.g., workforce development) CC, MU ST Annual Expand existing business networking series to connect more local businesses Actively engage Cibolo's home-based businesses Build additional industry roundtables in a number of different market areas Implementation Lead Implementation Timing (Year) Become more proactive with regional and statewide partners in business recruitment
Action
If enough interest, create a home-based business roundtable
an
local, county, state, and federal
Action 1.6.2
City of Cibolo, Texas Strategic Economic Development
Page | 2-15 City of Cibolo, Texas Estimated Cost Strategic Economic Development Plan Implementation Matrix Public/NP Private 123456789 10 Cost Type BUSINESS RECRUITMENT AND ATTRACTION Objective 2.2 Action 2.2.1 Partner with local and state entities to market through relevant digital and print mediums annually CC, COC, SATX, GVEC C C/D Annual Action 2.2.2 Host a searchable online database of available commercial space and land for prospectus businesses to review CC A Annual Action 2.2.3 Create a 'tip line' for citizens to call/Email/text ideas on business recruitment and any leads they may have on businesses that may wish to relocate or expand to Cibolo CC C Included 5.5.1 One Time Action 2.2.4 Develop/refine the City's business recruitment collateral (see OUTREACH, COMMUNICATION, AND MARKETING section) CC Included 5.1.1 Annual Objective 2.3 Action 2.3.1 Hire an additional full-time staff member dedicated to small business/entrepreneurial development CC D Annual Action 2.3.2 Provide information seminars in partnership with nearby municipalities on how to start, operate, and grow a business CC, MU B Annual Action 2.3.3 Fund the training of 2-3 new mentors each year, selecting within business sectors that are underrepresented, particularly women and people of color CC, MU O, B Annual Action 2.3.4 Work with local banks to create a PPP revolving loan fund that offers low/no-interest loans and/or gap financing to start-ups
pool CC, MU F F One Time Action 2.3.5
local HR, engineering,
legal
create
entrepreneurs to use CC, MU O, ST Annual Action 2.3.6 Provide financial
entrepreneurs
to
services such as human resources assistance, financial planning assistance,
legal assistance CC, MU D Annual Action
business tracking data CC ST Annual Action 2.3.8 Modify incentive programs to offer financial support to startups and small businesses to locate and grow in Cibolo (e.g., one-time grants for creating jobs above area median income), requiring participation in an entrepreneurial training program CC D Annual Action 2.3.9 Identify a highly visible, well appointed location for a comprehensive incubator/business support facility CC D Annual ASSET DEVELOPMENT Objective 3.1 Action 3.1.1 Build upon the strategic recommendations in the opportunity site analysis as an initiation point for engagement and action CC ST Annual Action 3.1.2 Define short-term, midterm, and long-term visions consistent with economic development plan CC C B/E Annual Action 3.1.3 Proactively engage with property owners to understand investment strategies CC ST Annual Action 3.1.4 Work with ETJ property owners on potential annexation and offer incentive packages targeted at encouraging voluntary annexation into Cibolo CC ST Continuous Action 3.1.5 Enact regulatory changes to allow defined visions to occur (see TOOLBOX DEVELOPMENT section) CC ST One Time Action 3.1.6 Create a marketing brochure for each employment center/commercial corridor that encapsulates the vision CC C C Biennial Scale proactive marketing and recruitment efforts to best leverage the City's resources and market reach Create/update small area plans for the City's primary economic activity centers Expand start-up and entrepreneurial development services open to all businesses with the addition of an entrepreneurial development staff member Implementation Lead Implementation Timing (Year)
Plan
and small businesses seeking to grow. Target an 80% private/20% public resource
Engage
accounting, and
professionals to
a database of potential consultants for
assistance for
and small businesses
access critical
and
2.3.7 Proactively market small business initiatives to existing businesses, focusing on home-based businesses using updated
of Cibolo,
Strategic Economic Development
Page | 2-16 City of Cibolo, Texas Estimated Cost Strategic Economic Development Plan Implementation Matrix Public/NP Private 123456789 10 Cost Type ASSET DEVELOPMENT Objective 3.2 Action 3.2.1 Inventory all existing vacant commercial and industrial land and buildings in collaboration with Costar reporting data and engagement with local real estate listing entities CC I, O, R ST Annual Action 3.2.2 Connect with all property owners to detail price, availability, and vision for those asset; include in online listings CC I, O, R ST Annual Action 3.2.3 Create an 'open source' database for property owners and brokers to submit new listings and changes to existing listings, particularly for listings not covered under Costar or similar virtual listing services CC C Included 5.5.1 One Time Action 3.2.4 Create a web-accessible database of those assets to connect to the economic development website CC C Included 5.5.1 One Time Action 3.2.5 Work with regional and state implementation partners to make sure their asset lists are current and complete CC, SATX, GVEC ST Annual Action 3.2.6 Maintain regular communication with property owners to ensure occupied/developed land is removed CC O, ST Annual Objective 3.3 Action 3.3.1 Create a comprehensive ownership database of all commercial properties in each of the opportunity sites to begin a dialogue about their property interests and investment priorities CC O, I, R C Annual Action 3.3.2 Engage in dialogue with owners, particularly catalytic parcels, on a regular basis to track changing strategies and create new opportunities CC O, I, R ST Annual Action 3.3.3 Create a catalyst sites prospectus, defining property ownership, implementation concepts, and available incentives to help bring the vision to fruition CC C Included 5.1.6 Biennial Objective 3.4 Action 3.4.1 Encourage consolidation of providers within City limits (e.g., Green Valley SUD, GVEC, City of Schertz, etc.) CC, UP, MU ST Continuous Action 3.4.2 Establish protocols for capital investment/job creation CC, UP, MU ST Continuous Objective 3.5 Action 3.5.1 Create a fund dedicated to [1] land acquisition for economic development purposes and [2] gap financing in real estate developments with economic development benefits CC F ST One Time Action 3.5.2 Seed the fund with $500,000 for initial operations CC F F One Time Action 3.5.3 Create a board of directors comprised of public, staff, and private sector representatives to review applications and negotiate agreements CC F, O, ST One Time Action 3.5.4 Develop specific criteria for access to Fund resources (e.g., minimum job creation, minimum, capital investment, creation of workforce housing, blight removal…) including performance requirements and claw back provisions CC F, O, ST Annual TOOLBOX DEVELOPMENT Objective 4.1 Action 4.1.1 Rezone land based on the results of the small area planning process CC ST As Needed Action 4.1.2 Consider creating higher density housing zones in/adjacent to activity centers to accommodate housing growth commensurate with job growth and accommodate the City's growing retiree population CC ST As Needed Action 4.1.3 Encourage the continued development of active mobility trailways integrated with parks and activity centers CC ST As Needed Action 4.1.4 Consider overlay districts in areas where rezoning will be too difficult or time consuming CC ST As Needed Action 4.1.5 Consider a full update to the City's comprehensive plan to reflect recent and emerging changes in the City's growth and development goals including the newly defined vision for its employment centers CC C E One Time Identify 4-6 priority investment/reinvestment properties within the City Maintain a locally-comprehensive comprehensive property and asset database Continue collaboration with utility partners on serving primary activity centers Consider creating an Economic Development Opportunity Fund Match land use regulations to economic development vision, particularly in economic activity centers Implementation Lead Implementation Timing (Year)
City
Texas
Plan
City of Cibolo, Texas Strategic Economic Development Plan Page | 2-17 City of Cibolo, Texas Estimated Cost Strategic Economic Development Plan Implementation Matrix Public/NP Private 123456789 10 Cost Type TOOLBOX DEVELOPMENT Objective 4.2 Action 4.2.1 Create area-specific incentives in each activity center (e.g., promote housing diversity in I-35 at 1103, job creation in FM-78 East) CC ST One Time Action 4.2.2 Find consensus between policymakers, businesses, and residents over Downtown's long-term vision. Moreover, continue to engage with Downtown businesses to help with Downtown's ongoing planning efforts CC ST One Time Action 4.2.3 Create industry-specific incentives available throughout the City (e.g., industrial investment along I-10, healthcare investment in I35) CC ST One Time Action 4.2.4 Scale incentives based on size of prospect, particularly targeting startup and small businesses (fewer than 5 jobs) CC ST One Time Action 4.2.5 Create a scoring matrix that prioritizes location of the investment, type of business, size of project, quality of jobs, benefits packages offered, and any other characteristic valued by the City CC ST One Time Action 4.2.6 Create specific incentive levels based on the scoring for projects CC ST One Time Action 4.2.7 Engage with local and state partners to implement similar requirements for investments in the City CC ST One Time Action 4.2.8 Require claw back provisions in all incentive packages to ensure compliance with stated agreements CC ST Continuous Action 4.2.9 Tie any incentives to businesses with less than five (5) employees to participating in a small business development program/mentorship program CC ST Continuous Objective 4.3 Action 4.3.1 Increase staffing capacity to implement the full economic development strategy and become more proactive in business assistance CC D Annual Action 4.3.2 Define/refine position to be a liaison to local businesses to help address business/regulatory/policy challenges CC ST Continuous Action 4.3.3 Provide assistance to businesses going through the city's permitting process CC ST Continuous Action 4.3.4 Become conduit to the HR, professional services, and legal service support and networking CC ST Continuous OUTREACH, MARKETING, AND COMMUNICATION Objective 5.1 Action 5.1.1 Create all materials listed below in print and digital format, updating regularly (minimum once a year) CC C C Annual Action 5.1.2 Create target industry-specific fact and information sheets CC C Included Annual Action 5.1.3 Refine the existing marketing document to reflect recommended changes where applicable (e.g., incentives) CC C Included Annual Action 5.1.4 Create a property prospectus book detailed in 3.3.3 (digital only) CC C Included Annual Action 5.1.5 Create quality of life information sheets on livability and amenities in Cibolo CC C Included Annual Action 5.1.6 Create materials to market the new ombudsman program CC C Included Biennial Hire/reposition an existing City staff member under economic development to be a development ombudsman Create economic development incentives that match the City’s priorities and performance expectations Create marketing collateral necessary for effective retention and recruitment efforts Implementation Lead Implementation Timing (Year)
Implementation Lead Implementation Timing (Year)
OUTREACH, MARKETING, AND COMMUNICATION
Objective 5.2
Action 5.2.1 Highlight recent economic development activity and successes, maintaining a 'running tally' dashboard of accomplishments for the year
Action 5.2.2 Publish regular opinion editorials from business owners, partner organizations, or invited guests focused on topics that influence (or are influenced by) economic development in Cibolo
Action 5.2.3 Include separate topic-themed economic development messages authored by a city staff member in each newsletter
Action 5.2.4 Implement, monitor, and report the results of opinion polls and business surveys through the newsletter
Action 5.2.5 Highlight a different Cibolo business (preferably from the target industries) in each newsletter that have invested, expanded, or created new jobs
Action 5.2.6 Target writing two (2) or three (3) industry/market white papers each year focused on educating local businesses and residents about current or impending market shifts and how they will impact local/regional businesses
Activate existing business leaders in economic development efforts
Action 5.3.1 Develop at least five (5) business Ambassadors, individuals who can work with economic development staff to promote Cibolo and engage existing/prospective business owners in targeted industries. Train more as necessary
Action 5.3.2 Develop a network of mentors in each of the target industries, focusing on developing women, minority and young business owners to reach the city's diverse business base
Action 5.3.3 Develop at least four (4) engaged Cibolo residents as Advocates that can assist in community outreach and resident interaction
Action
Implement a proactive community engagement and education initiative Enact a monthly newsletter detailing market and economic development activities
Create a Business-2-Business database that businesses can access to find specific services/networking opportunities
Action 5.4.1 Hold an annual "State of the City" meeting open to the public (and televised) to discuss accomplishments and ongoing efforts for the previous/upcoming year
Action 5.4.2 Implement a biennial resident survey to gauge the goals and concerns of Cibolo residents about the City's economic development efforts. Use the results to inform any changes to approach
Action 5.4.3 Hold a community outreach meeting in each employment center annually to engage business leaders and residents on economic development issues, opportunities, and challenges those areas are facing
Action 5.4.4 Host semiannual panelist discussions on topics of economic development each year. These discussions should address specific market/location opportunities and challenges facing local businesses
Action 5.4.5 Provide an online portal for citizens and groups to submit questions, provide feedback on content, or request meetings on the economic development website
Enhance Cibolo's electronic and social media presence and activity
Action 5.5.1 Create a separate Cibolo economic development website outside the City's website structure based on the functional changes in scope/mission, augmenting content based on the included recommendations
Ensure weekly use of social media platforms (e.g., SnapChat, Instagram, Twitter, Facebook…)
Action 5.5.3 Enhance economic development connections with the GC, MU, and SATX websites and social media. Consider joint messaging/collabotation on social media events/posts
Action 5.5.4 Use the website to collect information, allow individuals to sign up for the newsletter, and better engage economic development staff
Create a citizens section on the website with access to educational information, the annual survey and results information, contact information for the assigned staff liaison, and the newsletter registration
City of Cibolo, Texas Strategic Economic
Page | 2-18 City of Cibolo,
Estimated Cost Strategic Economic Development Plan Implementation Matrix Public/NP Private 123456789 10 Cost Type
Development Plan
Texas
CC ST Monthly
CC ST Monthly
CC ST Monthly
CC ST Monthly
CC ST Monthly
CC O, I, R ST Monthly Objective
5.3
CC O, A Biennial
CC O, Included 2.2.4 Annual
CC N A Biennial
CC A Continuous Objective
5.3.4
5.4
CC N A Annual
CC N ST Biennial
CC N A Annual
CC C B Semiannual
CC A One Time Objective
5.5
CC C C One Time Action 5.5.2
CC Included One Time
CC Included One Time
CC Included One Time Action
CC Included One Time
5.5.5
AND
5.6
Action 5.6.1 Establish a formal economic development dashboard to track performance across each of these topic areas: [1] retention, [2] recruitment, [3] fiscal sustainability, [4] entrepreneurial development (once an etnrepreneurial specialist is hired)
Action 5.6.2 Retention metrics should include: [1] site visits performed, [2] ombudsman assists, [3] capital investment, [4] network event attendance, [5] prospect contacts
Action 5.6.3 Add a sixth metric jobs retained/expanded to retention metrics once the City has a consistent methodology to accurately collect and disseminate that information.
Action 5.6.4 Recruitment metrics should include: [1] number of prospects (visits and meetings) [2] acquired projects, [3] total jobs created, [4] average annual wage, [5] total capital investment, [6] debrief highlights from lost opportunities
Action 5.6.5 Fiscal sustainability metrics should include: [1] number of incentives, [2] dollar value of incentives, [3] jobs created/preserved from incentives, [4] capital investment created, [5] new tax revenues, [6] other benefits (e.g., infrastructure investments)
Action 5.6.6 Entrepreneurial metrics (once an entrepreneurial specialist is hired) should include: [1] enrollment inquiries, [2] business enrollment, [3] graduations, [4] jobs created, [5] debrief on businesses leaving the mentorship program
ORGANIZATION AND COORDINATION
6.1.1 Have the Planning & Economic Development Director serve in an administrative and public engagement role, guiding City recruitment collaboration efforts and being the direct point of contact with the EDC and partners
6.1.2 Have the existing Economc Development Manager position continue to address recruitment efforts, providing support when practical on the management of the ED website and networking events
Action 6.1.3 Hire a marketing and communications consultant to refresh all existing marketing collateral and create all new marketing collateral (both print and virtual) for economic development.
Action 6.1.4 Consider restructuring the Economic Development Manager position into more marketing and communications, overseeing all marketing collateral, managing the economic development website, and overseeing all social media and networking events
Action 6.1.5 Continue the
engagement and more proactively engage in workforce development
of Cibolo,
Page | 2-19 City of Cibolo, Texas Estimated Cost Strategic Economic Development Plan Implementation Matrix Public/NP Private 1234567 89 10 Cost Type OUTREACH,
City
Texas Strategic Economic Development Plan
MARKETING,
COMMUNICATION Objective
CC ST One Time
CC ST Semiannual
ST Semiannual
CC ST Semiannual
CC ST Semiannual
CC ST Semiannual
Objective 6.1 Action
CC ST Annual (Salary) Action
CC ST Annual (Salary)
CC C C One Time
CC ST Annual (Salary)
existing Business Retention and Expansion position to focus on all business outreach and engagement with existing businesses, managing the business roundtables, and administering the annual business survey CC ST Annual (Salary) Action 6.1.6 Hire an additional business retention and expansion specialist, expanding the City's capacity for business
CC D Annual (Salary) Action 6.1.7 Hire a City staff member under economic development to be
development
CC D Annual (Salary) Action 6.1.8 Hire a City staff member under economic development to be an entrepeneurial development specialist CC D Annual (Salary) Objective 6.2 Action 6.2.1 Create a quarterly coordination meeting schedule with the Chamber, MU, SATX A Quarterly Action 6.2.2 Establish a semiannual strategic meeting schedule with other regional and statewide partners CC, COC, MU, SATX, TX A Semiannual Action 6.2.3 Provide quarterly/semiannual reports to regional and statewide partners on activity and successes CC ST Quarterly Action 6.2.4 Establish a formal quarterly or semiannual coordination meeting with neighboring municipalities to address regional and crossboundary market issues CC, MU ST Quarterly Objective 6.3 Action 6.3.1 Create an official business advisory board of 5 to 10 business leaders and implementation partners (e.g., post-secondary education institutions) interested and willing to participate in the City's economic development effort CC ST One Time Action 6.3.2 Host monthly meetings with the advisory board on projects, activity, and strategy to garner advice and assistance in implementation CC ST Monthly Action 6.3.3 Have the City Council appoint at least one (1) member of the advisory board, though avoid having elected officials attending the meetings CC ST Annual Action 6.3.4 Create a committee structure to focus efforts in coordination with the City's focus areas; [1] Business Retention, [2] Marketing and Outreach, [3] Business Recruitment CC ST One Time Action 6.3.5 Ensure each committee is chaired (or co-chaired) by an active EDC board member CC ST Continuous Formalize staffing roles and responsibilities within the economic development department, expanding staff capacity to fully achieve the stated economic development goals
economic development dashboard in the City's Performance Management Program (PMP) on the City's economic development website to provide real-time information about the activity and successes of local economic development efforts Implementation Lead Implementation Timing (Year)
a Business Advisory Board to help with strategic planning and implementation of the City's economic development strategic plan
strategic relationships with local and statewide implementation partners
a
ombudsman
Refine the
Create
Enhance
Strategic Economic
Page | 2-20 City of Cibolo, Texas Estimated Cost Strategic Economic Development Plan Implementation Matrix Public/NP Private 123456789 10 Cost Type ORGANIZATION AND COORDINATION Objective 6.4 Action 6.4.1 Reconfigure information requirements on business licenses to collect more robust contact information and data about the business (e.g., NAICS code) CC ST Continuous Action 6.4.2 Work with Guadalupe County or create a locally-maintained version of property assessment data that combines all land, building, and business information to make geospatial analyses/searches more insightful CC, GC ST Continuous Action 6.4.3 Require all business building permit and applications to include full contact and business (if known) information CC ST Continuous
Implementation Leaders Cost Estimate Legend: Public ST Staff Time CC City of Cibolo A Under $1,000 GC Guadalupe County B $1,000 to $10,000 MU Other Municipalities C $10,000 to $50,000 TX State of Texas D $50,000 to $100,000 E $100,000 to $250,000 F $250,000 to $500,000 Partners G Over $500,000 COC Chambers of Commerce SATX Greater:SATX Regional Economic Partnership EDU Colleges & Universities in Region Action GVEC Guadalupe County Electric Cooperative Private C Consultant F Financial Institutions I Industry Leaders N Neighborhood Residents O Property Owners R Realtors/Brokers Work with City departments to develop comprehensive databases to help economic development efforts Implementation Lead Implementation Timing (Year)
City of Cibolo, Texas
Development Plan
LEGEND
3 . SOCIOECONOMIC ANALYSIS
INTRODUCTION
Cibolo's socioeconomic landscape has undergone remarkable shifts in recent years Transitioning from its roots as an agricultural community, the City continues to develop within the broader San Antonio-New Braunfels Metropolitan Statistical Area (MSA). Cibolo’s recent transition has been marked by unprecedented population growth, substantial investments in retail and services, alongside significant expansions in its production-based economy Much of Cibolo's growth can be attributed to the rapid expansion of San Antonio's employment base and continued strength of the region’s military infrastructure, resulting in predominantly residential growth for the City.
As the City of Cibolo aims to diversify its economy and transition away from being solely a bedroom community to fostering a more dynamic employment base, it finds itself in a competitive position due to favorable socioeconomic trends. These include a highly educated population, a diversifying resident base, and a substantial veteran presence. However, significant challenges loom, such as rising living costs and development patterns that align more with suburban living than with an employment center attractive to modern businesses.
The Socioeconomic Analysis assesses several demographic and economic trends emerging in Cibolo and unfolding throughout the region. The results of the analysis aim to shape policies and programs that can help the City of Cibolo sustain long-term economic sustainability.
KEY FINDINGS
Regional growth rates exceeded Bexar County growth rates. Rapid population growth rates and household base expansions occurred throughout the region, particularly in communities outside of Bexar County (San Antonio) This surge can be largely attributed to the swift construction of rooftops in previously undeveloped areas, particularly those with abundant and untapped land resources like Cibolo.
Trends in Cibolo reflect a prototypical suburban community characterized by the proliferation of master-planned subdivisions, growing household sizes, and an influx of families with children. However, the emphasis on suburban development may constrain the City’s appeal to potential businesses and limit access for certain segments of the workforce needed to sustain a diverse economy.
Cibolo is competitively positioned to facilitate business development. The City boasts a highly educated population, making it an attractive destination for businesses operating in white-collar industry segments. Furthermore, Cibolo's population is becoming increasingly diverse and includes a significant presence of veterans, which can create opportunities for entrepreneurship.
City of Cibolo, Texas Strategic Economic Development Plan Page | 3-1
Rising income levels suggest ensuing affordability challenges. Households earning $100,000 or more represent a more significant share of the City’s household base than a decade ago. The influx of higher incomes has accelerated housing costs, reaching levels unaffordable to key workforce segments (particularly service and production-based workers).
METHODOLOGY
1. DATA SOURCES
The Socioeconomic Analysis assesses various demographic and economic data metrics. Demographic data comes from the U.S. Census Bureau as well as estimates and projections from ESRI. ESRI is a nationally recognized third-party data provider that uses U.S. Census data to generate its estimates and projections for geographic areas. Economic data on workforce characteristics mostly came from the Bureau of Labor Statistics (BLS) and Lightcast. Lightcast provides labor market conditions of geographic areas nationwide, including the City of Cibolo.
2. GEOGRAPHIC STUDY BOUNDARIES
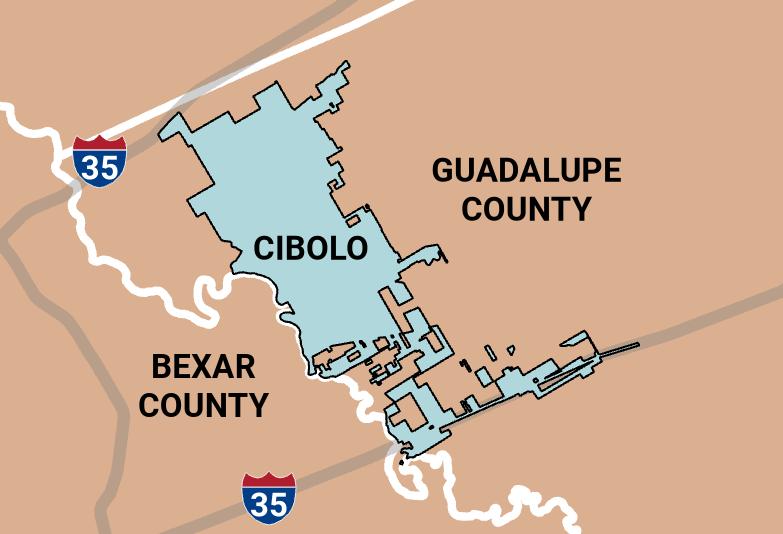
The socioeconomic analysis focuses on demographic and economic trends in Cibolo, and the City’s relation to the broader San Antonio-New Braunfels MSA. The MSA consists of eight counties: [1] Kendall County, [2] Comal County, [3] Guadalupe County, [4] Bexar County, [5] Wilson County, [6] Atascosa County, [7] Bandera County, [8] Medina County Throughout this report, the San Antonio-New Braunfels MSA will be referred to as the ‘MSA’ or the ‘Region.’ The maps below illustrate the MSA, along with Cibolo, located on the edge of Western Guadalupe County and northwestern edge of Bexar County.
Source: ACS Estimates, ESRI, RKG Associates Inc., 2023
City of Cibolo, Texas Strategic Economic Development Plan Page | 3-2
Map 3-1: Geographic Study Boundaries
Cibolo’s intersection with major thoroughfares, I-35 and IH-10, competitively positions the City to expand and sustain economic growth.
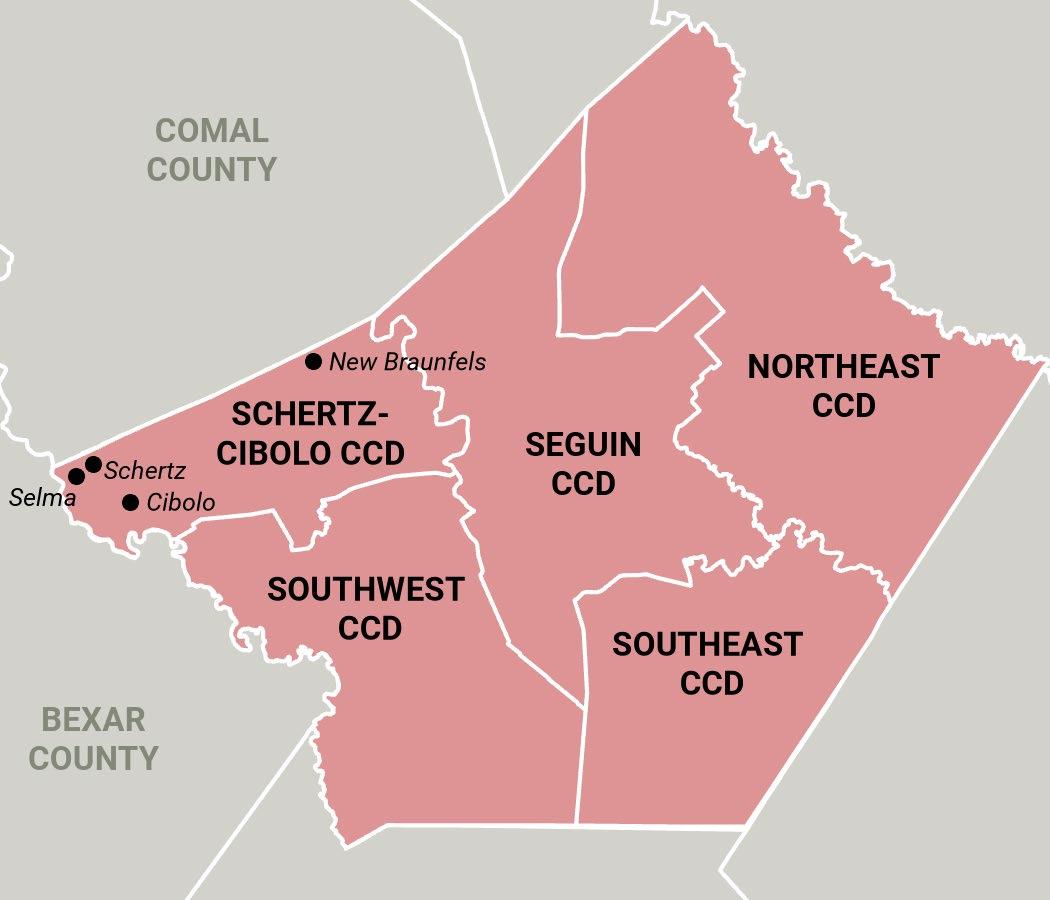
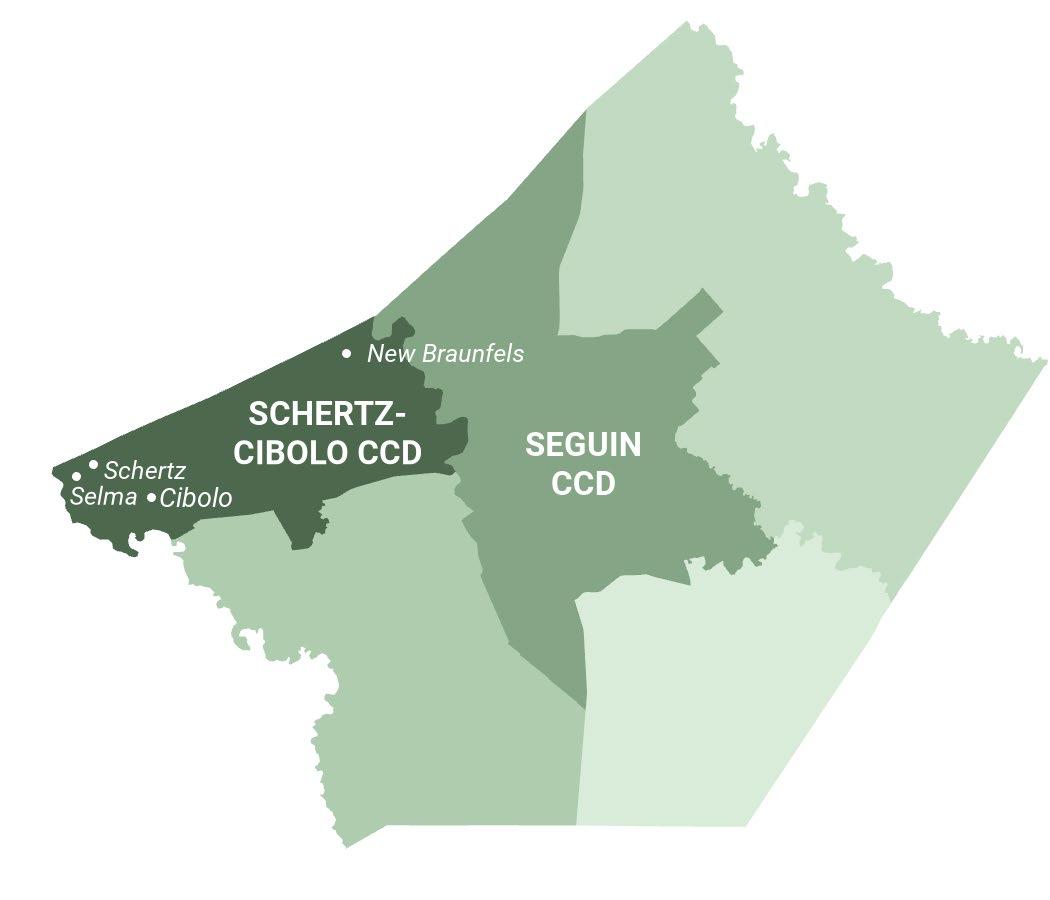
The subsequent analyses also focused on distinct subdivisions of Guadalupe County delineated by the U.S. Census Bureau. Analyses of Census County Divisions (CCDs) provide a greater perspective of how growth patterns vary throughout Guadalupe County. Given Guadalupe County’s predominately rural footprint, it is expected that socioeconomic trends will differentiate among County subdivisions concentrated with a greater development footprint. In particular, the SchertzCibolo CCD, which stretches throughout northwestern Guadalupe County, is more developed than other CCDs (Map 3-2). The Schertz-Cibolo CCD includes Cibolo, along with portions of Selma, Schertz, and New Braunfels that have areas within Guadalupe County.
DEMOGRAPHIC ASSESSMENT
1. POPULATION TRENDS AND PROJECTIONS
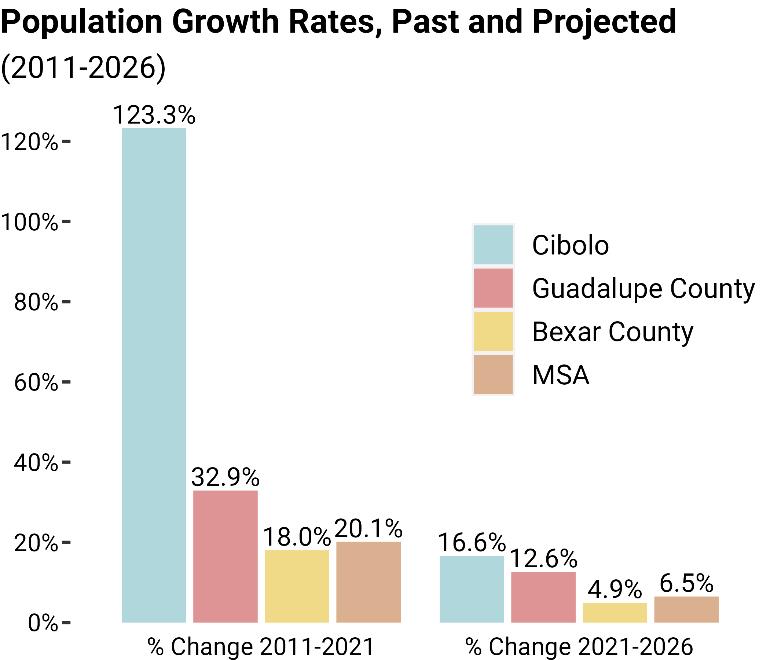
Cibolo underwent unprecedented growth, as the City’s population more than doubled from roughly 14,000 residents to 31,000 residents between 2011 and 2021 (Figure 3-1). The exponential growth rate reflects several factors that attracted people to live in the City. This includes but is not limited to, Cibolo’s availability of cost-effective homeownership options, opportunities for children of families to enroll in the highly rated Schertz-Cibolo-Universal City Independent School District (SCUC ISD), and convenient access to nearby employment centers and military installations.


City
Strategic Economic Development Plan Page | 3-3
of Cibolo, Texas
Figure 3-1
Source: ACS Estimates, ESRI, RKG Associates Inc., 2023
Map 3-2: Guadalupe County Subdivisions
Source: ACS Estimates, ESRI, RKG Associates Inc., 2023
Cibolo’s swift transformation into a population center is reflective of an emerging regional trend, where attractive living opportunities are not only limited to Bexar County. As a whole, 10-year population growth rates in the San Antonio-New Braunfels MSA exceeded Bexar County’s population growth rates. The MSA’s higher growth rates reflect rapid residential development into communities throughout the region’s northern counties, including Guadalupe County and Comal County. Like Cibolo, most of these communities in the region’s northern counties have evolved into bedroom communities serving major employment centers such as the City of San Antonio.
While Cibolo has largely evolved into a bedroom community, the City is in a competitive position to expand its job base and pivot towards more of an employment center. The City’s rapid population growth was accompanied by the growth of demographic cohorts considered integral to business development and job creation. That includes a diversifying population, increasingly educated population, and active veteran population.
2. AGE OF POPULATION TRENDS
A) Cibolo
Figure 3-2
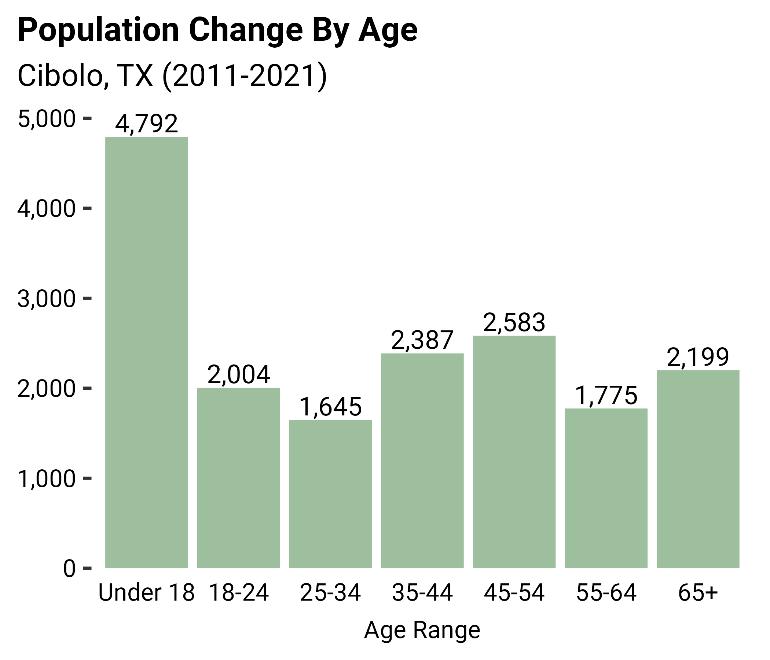
Source: ACS Estimates, ESRI, RKG Associates Inc., 2023
School-aged children under the age of 18 represented a significant share of Cibolo’s population growth since 2011 (Figure 3-2). The substantial influx of school-aged children coincided with a rapid increase in the number of families, expanding at a rate of 75% since 2011. The influx of families with school-aged children can be attributed to the City’s attractiveness of offering high-quality local schools and cost-effective homeownership opportunities. Meanwhile, Cibolo offers working parents’ convenient access to nearby employment hubs including San Antonio and military installations to the south and New Braunfels to the north. Commuting opportunities lend themselves to the working-age population in general, not just working parents. The prime working-age population, persons ages 25-54, represents 40% of the City’s current total population. While there is a substantial presence within the City, most prime working-age workers are employed outside the City
City of Cibolo, Texas Strategic Economic Development Plan Page | 3-4
B) Guadalupe County
3-3
Guadalupe County’s population is aging, with seniors aged 65 and older constituting a disproportionate share of the County’s population growth (Figure 3-3). While Cibolo accounted for roughly 25% of the County’s growth among senior residents, approximately 60% was concentrated throughout the broader Schertz-Cibolo CCD This reflects the subdivision’s appeal as a favorable living environment for seniors. Schertz and Selma, along with Cibolo, provide convenient access to medical services that are underserved in Guadalupe County. Given the limited availability of medical services within the County, proximity to healthcare facilities in adjacent medical hubs like Bexar County becomes increasingly important for seniors.
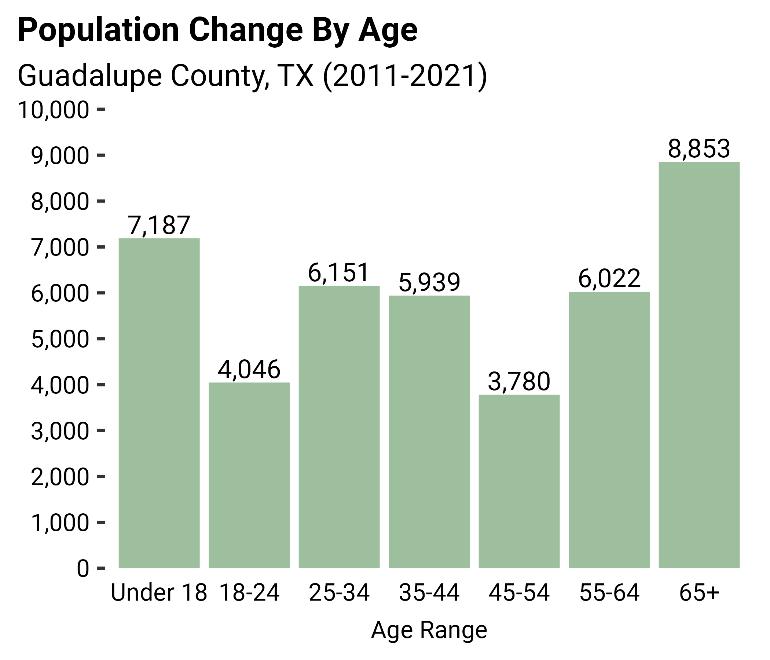
Source: ACS Estimates, ESRI, RKG Associates Inc., 2023
The high demand among seniors to reside in communities within the Schertz-Cibolo CCD points to potential labor market challenges over time. Since most senior residents are retired, existing and prospective businesses may face difficulties in recruiting workers. This decreased availability of workers could diminish the attractiveness of Cibolo and other communities within the SchertzCibolo CCD for business investment.
Within the Schertz-Cibolo CCD, a notable portion of the current housing inventory is inhabited by retirees (age 65+) or individuals transitioning to retirement (age 55+). Combined, this demographic composition results in fewer available units occupied by individuals in the prime of their careers (ages 25-54). Stimulating expansions in the housing supply becomes crucial to address this challenge, providing options that accommodate a wide range of income levels. This includes a mixture of apartments, townhomes, and missing middle housing options such as duplexes and triplexes. Increasing the availability and price diversity of housing options (e.g., townhomes, cottage homes, multifamily homes) can effectively boost the pool of available workers in the prime of their careers, fostering an environment conducive to attracting business investment
City of Cibolo, Texas Strategic Economic Development Plan Page | 3-5
Figure
C) San Antonio-New Braunfels MSA


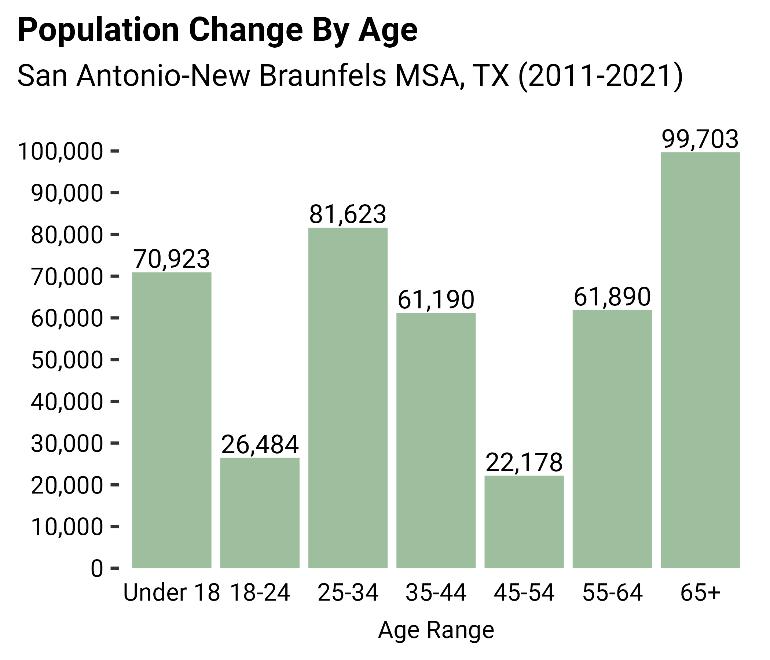
As evidenced in Guadalupe County and across the region (Figure 3-4), population growth is diverse, with a high concentration of individuals aged 65 and above. While high levels of growth for seniors may not directly benefit a region’s economic development efforts, recent migration data reveals a promising shift to increases in prime working-age residents (ages 25-54). This positive trend is in line with the region's growing economic competitiveness within the State of Texas. In site selection decisions, large firms with national or international presence often collaborate with state governments to identify the most cost-effective metropolitan area for their operations within the state. Historically, investments have favored the Dallas or Austin MSAs in Texas, driven by significant influxes of prime working-age residents to these regions. However, the San Antonio-New Braunfels MSA is increasingly emerging as a competitive location, drawing interest from firms considering relocation to Texas (e.g., Toyota).
If a business decides to relocate to the region, it's highly probable that it will target San Antonio for several reasons A primary reason is that younger generations living in and moving to the
City of Cibolo, Texas Strategic Economic Development Plan Page | 3-6
Largest % of Growth
Smallest % of Growth
Map 3-3: Percentage of Senior (Age 65+) Growth by Subdivision
Source: ACS Estimates, ESRI, RKG Associates Inc., 2023
Figure 3-4
Source: ACS Estimates, ESRI, RKG Associates Inc., 2023
region reside in San Antonio. Consequently, Cibolo will need to enhance the availability of services and amenities catering to younger generations if it wishes to be considered for business investment. This includes apartments and work-live-play (e.g., Avalon in Alpharetta, GA www.experienceavalon.com) activity centers.
3. EDUCATIONAL ATTAINMENT
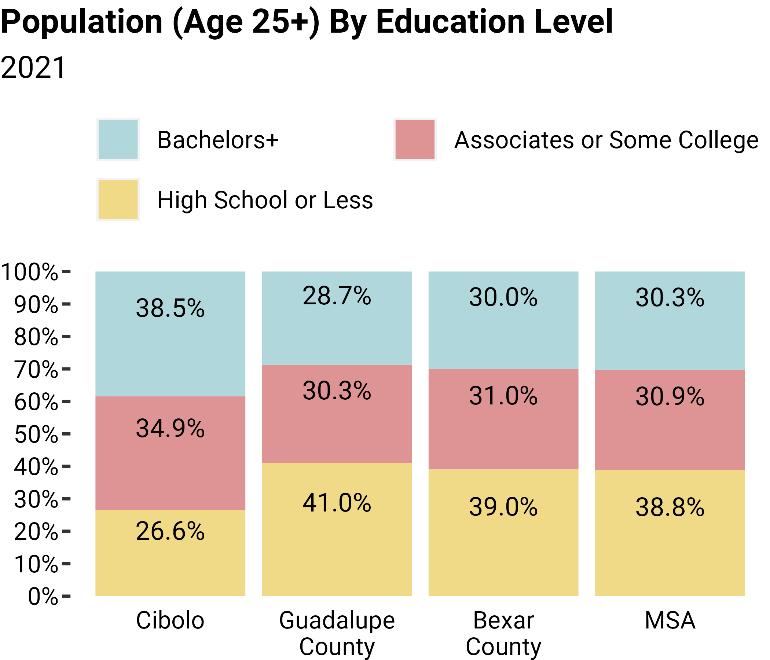
Cibolo boasts a highly educated population, with nearly 40% of residents holding a Bachelor’s Degree or higher (Figure 3-5). This educated demographic has access to a wider range of job opportunities and tends to command higher wages. Leveraging this asset could significantly enhance Cibolo’s economic development initiatives, particularly for white collar and professional services jobs.
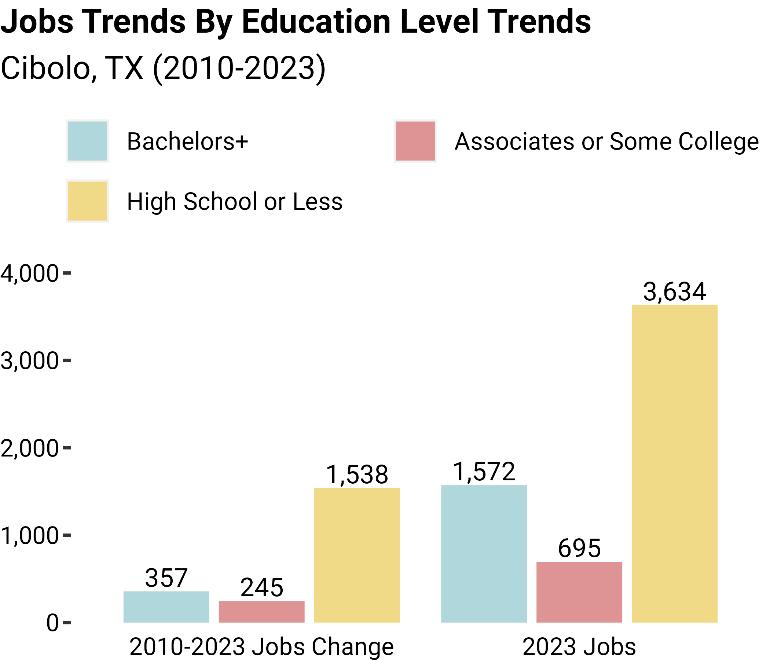
However, despite the high level of education among its residents, the City faces a challenge: a limited presence of businesses in traditional white-collar sectors. Consequently, significantly fewer job opportunities within Cibolo require a bachelor’s degree or higher (Figure 3-6). As a result, many of the City’s highly educated individuals commute outside of Cibolo for work.

While the abundance of highly educated residents presents a valuable asset, Cibolo must take steps to fully capitalize on it. This includes developing highlyamenitized economic activity centers that offer strong walkability, a mixture of residential and commercial development, and convenient services (e.g., dining options, a pharmacy, dry cleaners…) for daytime workers. To achieve this, the City should consider implementing supportive policies and enhancing amenities to attract businesses and promote economic growth (specific recommendations are detailed in the Implementation Chapter)
City of
Strategic Economic Development Plan Page | 3-7
Cibolo, Texas
Figure 3-6
Source: Lightcast, RKG Associates Inc., 2023
Figure 3-5
Source: ACS Estimates, ESRI, RKG Associates Inc., 2023
Key initiatives could involve creating vibrant work-live-play activity centers (as referenced earlier) and diversifying housing options to accommodate various income levels. By doing so, Cibolo can position itself as an attractive destination for businesses in today’s competitive economic development landscape.
4. POPULATION DIVERSITY TRENDS
5. VETERAN POPULATION
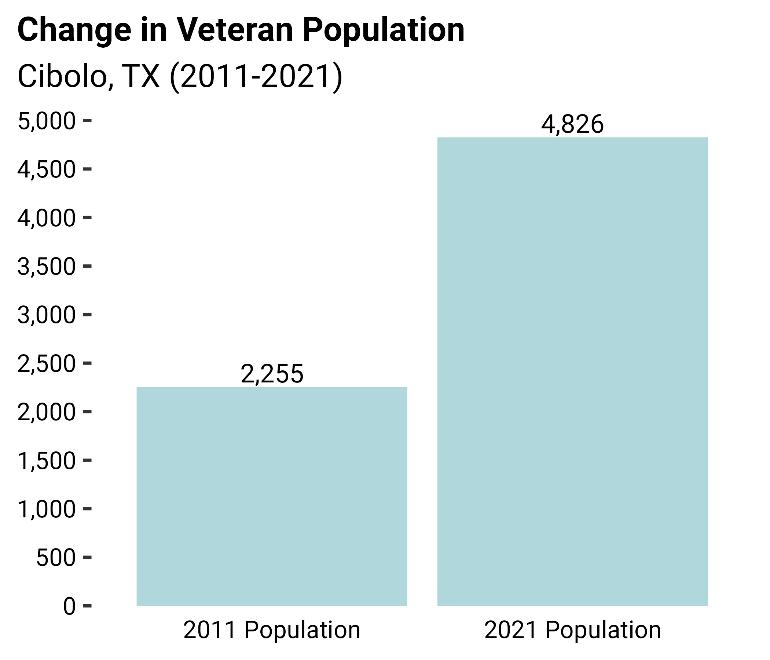
The veteran population in Cibolo more than doubled in the previous decade (Figure 3-8). This rapid growth reflects Cibolo’s convenient access to nearby military installations including the Randolph Air Force Base. Following military discharge, veterans often prefer to reside near military bases to pursue onbase civilian employment, maintain communal ties, and access amenities and services reserved for post-active duty members such as medical services and favorable sales tax treatment (e.g., Commissary purchases). A substantial
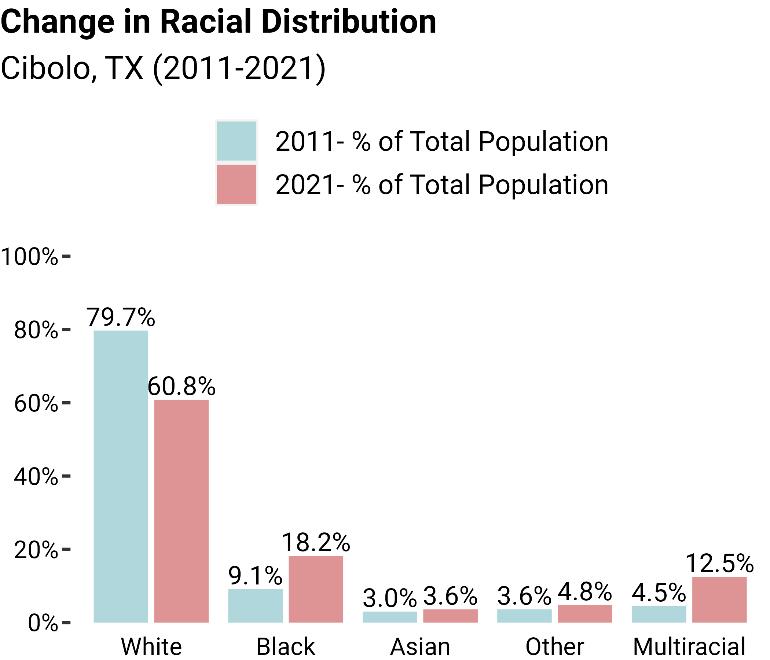
In the previous decade, Cibolo’s population diversified Compared to 2011, the proportion of White residents as a part of the City’s total population decreased (Figure 3-7). This decrease was offset by increased proportions of all other racial groups. The influx of these groups coincided with rising income levels. Notably, as of 2021, the median incomes of the Black population ($108,651) and Asian population exceeds the median income of the White population ($106,287). The combination of a diversifying population and rising income levels provide strong incentives for the creation of a minority-focused entrepreneurial program. Given sufficient tools and resources to pursue entrepreneurship, national data indicate persons of color are more likely to start a business.

City of Cibolo,
Strategic Economic Development Plan Page | 3-8
Texas
Figure 3-7
Source: ACS Estimates, ESRI, RKG Associates Inc., 2023
Figure 3-8
Source: ACS Estimates, ESRI, RKG Associates Inc., 2023
proportion of veterans have chosen Cibolo as a place to retire, as evidenced by the existing age distribution of the City’s veteran population. As of 2021, approximately 40% of the City’s veteran population are at the age of retirement (Aged 65+) or at the age of transitioning to retirement (Ages 55-64).
Despite a high proportion of veterans either retired or transitioning to retirement, most (approximately 60%) are of working age. The combination of a disproportion share of veterans of working age combined with the substantial proportion of highly educated veterans nearly 60% have a bachelor’s degree or above, provides a strong justification for pursuing entrepreneurial initiatives.
Given the demographic composition of Cibolo's veteran population and their strong potential for entrepreneurial initiatives, the City can play a pivotal role in facilitating their success. By partnering with organizations like the Small Business Veterans Affairs (VA), Cibolo can provide tailored support and resources to veterans interested in entrepreneurship. This collaboration can empower veterans to harness their skills and education, driving innovation and economic growth within the community. By fostering a supportive environment for veteran-led businesses, Cibolo can not only enrich its economic landscape but also honor the service and contributions of its veteran population.
6. HOUSEHOLD TRENDS AND PROJECTIONS


Source: ACS Estimates, ESRI, RKG Associates Inc., 2023
The total number of households in Cibolo more than doubled between 2011 and 2021, with families with children constituting nearly 40% of this growth (Figure 3-9). This influx of families with children contributed to increases in the City’s average household size, which rose from 3.09 persons per household in 2011 to over 3.3 persons per household in 2021. This upward shift in average household size, coupled with the influx of schoolaged children, reflects the Cibolo school system’s desirability and relative affordability within the region. These factors are leading contributors to the City’s suburban development patterns. The rapid development of master-planned single-family subdivisions, a distinctive feature of Cibolo (and other suburban communities), has contributed to this growth pattern Areas like Comal County, Kendall County, Guadalupe County, and west of San Antonio have experienced similar patterns due to abundant land resources and the demand for housing.
City of Cibolo, Texas Strategic Economic Development Plan Page | 3-9
Figure 3-9
7. HOUSEHOLD INCOME TRENDS
Figure 3-10
ECONOMIC BASE ANALYSIS
1. INDUSTRY ANALYSIS
A) Cibolo
Source: ACS Estimates, ESRI, RKG Associates Inc., 2023
Single-family subdivisions consume extensive land resources while producing fewer housing units compared to denser housing types. As Cibolo's housing demand steadily rises and the rate of housing unit production fails to meet this demand, increases in housing prices within the City are anticipated. This challenge is exacerbated by the influx of high-income earners, who can outcompete lower-earning households for existing housing inventory. Over the past decade, this trend has reshaped the distribution of income levels among the City's residents. In 2011, households earning $100,000 or less constituted a larger proportion of the City's household base (Figure 3-10). However, a decade later, households earning $100,000 or more now make up a larger proportion of the City's household base. Implementing policies focused on increasing the housing supply and diversifying the inventory to accommodate various income levels will be crucial for sustaining business investment and job creation.

Job growth in Cibolo was largely a response to local and statewide factors. Statewide, substantial investment continues to target production-based industries such as automotive manufacturing and oil production. Investment flows have been felt in Cibolo as the Manufacturing industry and Mining & Oil Extraction industry generated the most net jobs in Cibolo between 2010 and 2023 (Figure 3-11) AISIN, which represented most of the job growth within the Manufacturing industry, located their factory in Cibolo to supply automotive parts to the nearby Toyota plant in south San Antonio. Job growth in the Mining & Oil Extraction industry reflects investments into extraction equipment suppliers that serve oilfield operations throughout Texas.
In the past decade, Cibolo has experienced significant growth in its residential population, resulting in a surge in demand for various services. This expansion has notably fueled job creation, particularly in sectors catering to both new and existing residents. Among these sectors,
City of Cibolo, Texas Strategic Economic Development Plan Page | 3-10
the Accommodation & Food Services industry and Retail Trade industry have seen notable growth, evidenced by the opening of numerous new stores and restaurants.
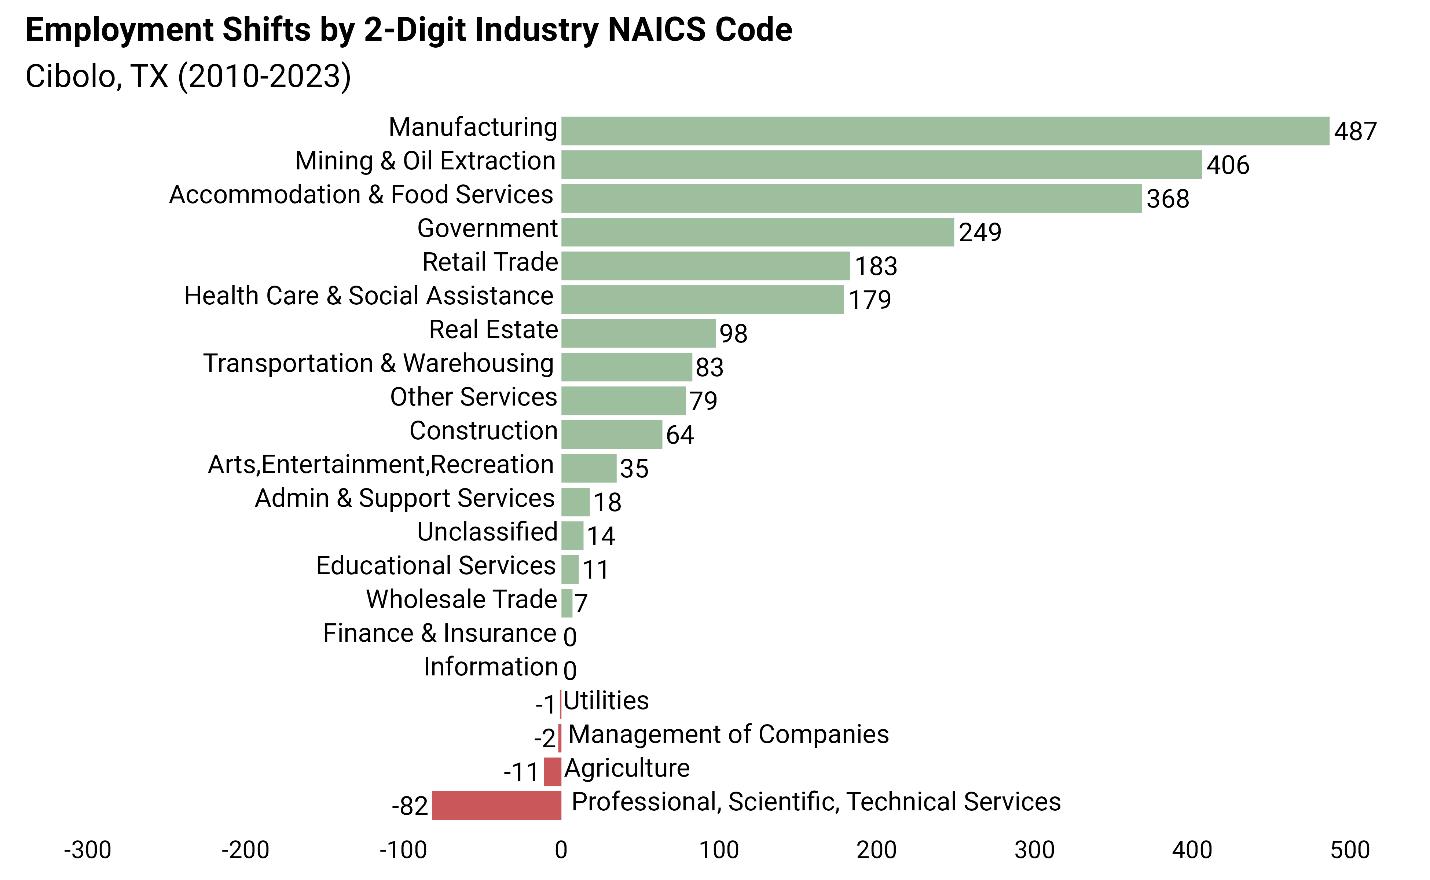
Source: Lightcast, RKG Associates Inc., 2023
While the City of Cibolo does invest recruitment efforts in other sectors, it currently expends considerable effort on targeting restaurants. The City of Cibolo should allocate fewer resources towards recruiting restaurants and more resources towards growing primary industries such as manufacturing, technology, and healthcare. These sectors not only support job growth but also lead to higher income gains and contribute significantly to increasing the daytime population. By diversifying its focus and concentrating efforts on these industries, Cibolo can create a robust economic environment that naturally attracts further investment in restaurants and other related sectors
B) Guadalupe County
Guadalupe County continues to emerge into a thriving production-based hub, with the Manufacturing and Transportation & Warehousing industries collectively adding 7,000 additional jobs in the previous decade (Figure 3-12). This figure includes investments by major multinational corporations such as Continental and Caterpillar, choosing Guadalupe County due to its advantageous location near interstates—IH-10 & I-35 and state highway thoroughfares TX-130.
City of Cibolo, Texas Strategic Economic Development Plan Page | 3-11
Figure 3-11
of Cibolo, Texas
Given Cibolo's strategic intersection with IH-10 and its ample supply of developable land tailored for industrial development, the City stands in a competitive position to accommodate further job growth. Additionally, the expanded labor pool throughout Guadalupe County serves as an attractive asset for production-based businesses considering relocation.
While the City of Cibolo aims to diversify its employment base in the long run by generating growth in traditional white-collar sectors more commonly found in Bexar County, short-term investments in production-based industries can pivot the City towards attracting white-collar sectors in the future. Such investments can foster organic growth and yield economic returns that will ultimately support the expansion into traditional white-collar sectors.
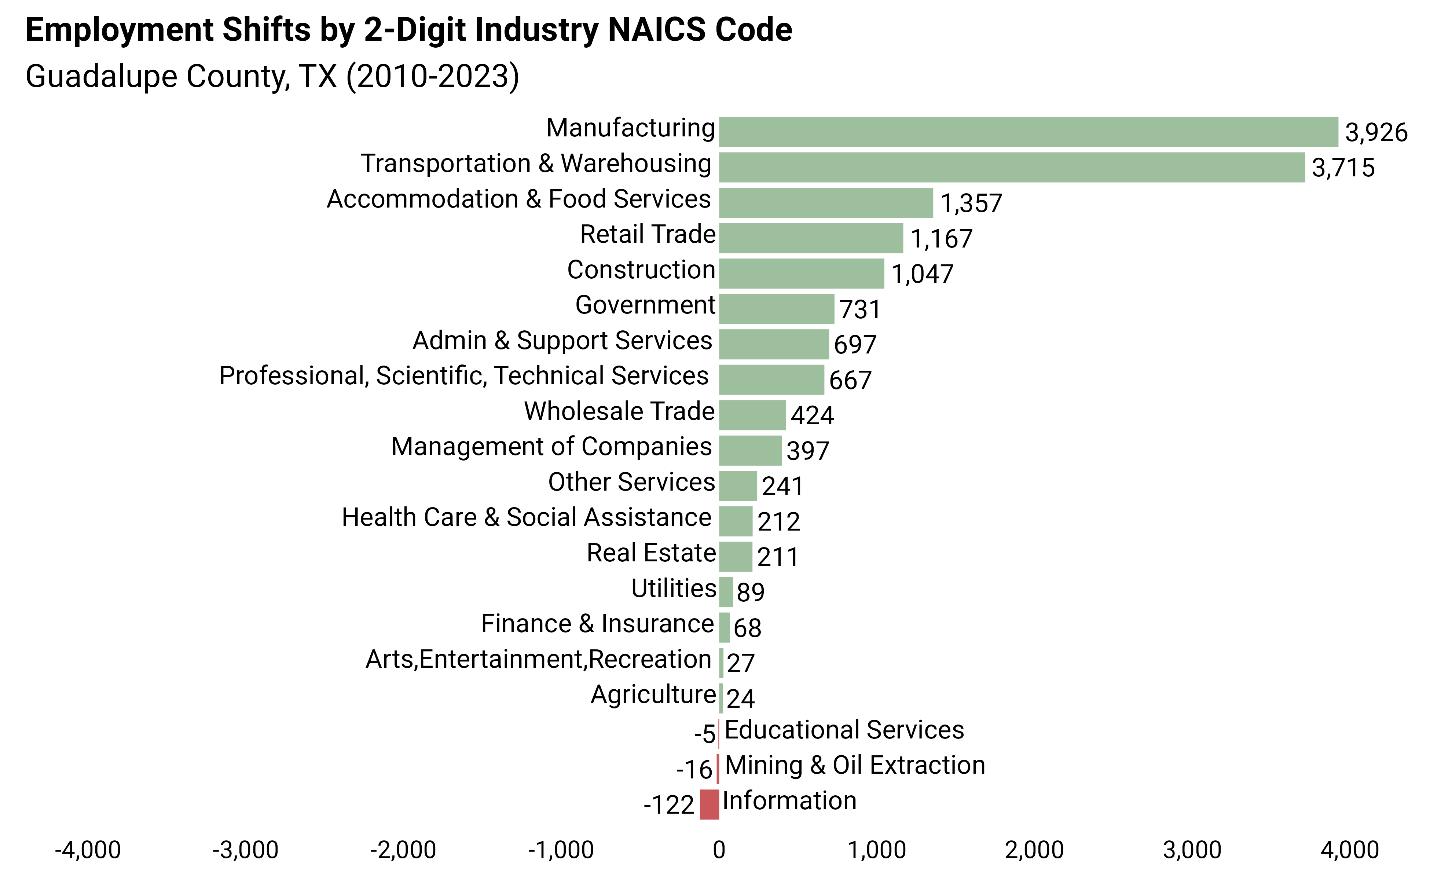
Source: Lightcast, RKG Associates Inc., 2023
City
Strategic Economic Development Plan Page | 3-12
Figure 3-12
C) San Antonio New-Braunfels MSA
Most job growth in the region is concentrated within Bexar County as the City of San Antonio represents the region’s nucleus of economic growth. Job growth is particularly significant in traditional white-collar sectors that typically command higher wages. For instance, 90% of job growth within the Health Care & Social Assistance industry occurred in Bexar County. While Bexar County represents most job growth in the region, Guadalupe County has made its mark in production-based industries. Notably, among the 12,646 additional manufacturing jobs within the MSA, approximately 33% occurred in Guadalupe County.
3-13
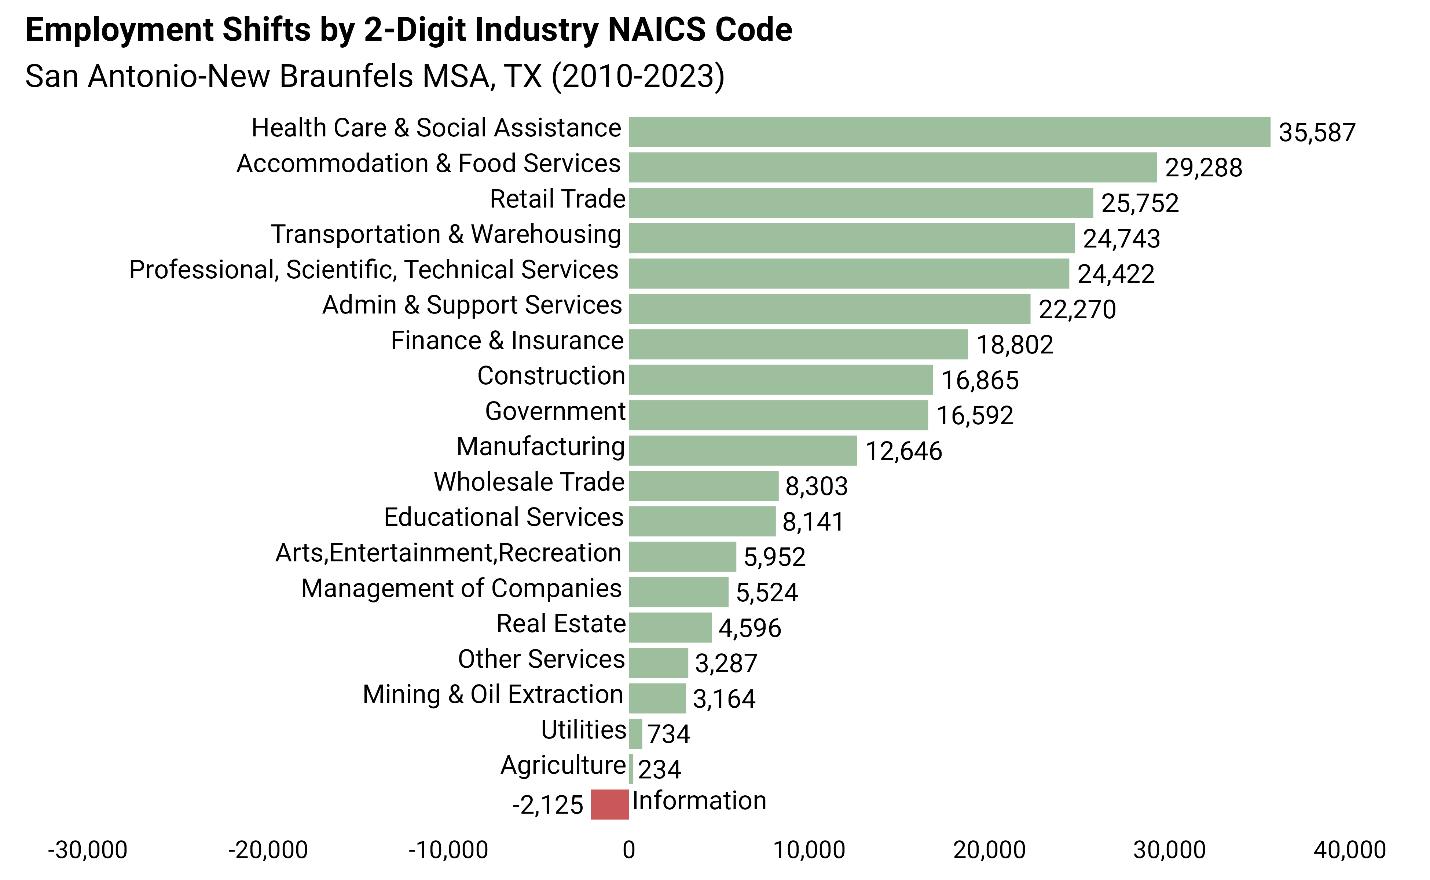
Source: Lightcast, RKG Associates Inc., 2023
2. UNEMPLOYMENT RATE AND LABOR FORCE POPULATION TRENDS
Triggered by the COVID-19 pandemic, Cibolo’s unemployment rate spiked nearly 7 percentage points between March and April 2020 (Figure 3-14). The spike in unemployment was primarily due to layoffs in service-based industries, as customer-facing businesses such as restaurants and retailers cut several staff members in wake of social-distancing restrictions. Temporary layoffs and consequential spikes in unemployment occurred throughout the region As a major tourist and hospitality destination, Bexar County observed the sharpest spike in their unemployment rate. Cibolo’s increase in their unemployment rate wasn’t nearly as severe as the other study areas under analysis. In relation to the other study areas, Cibolo’s population constituted a higher number of workers employed in white-collar sectors. Most businesses operating within white-
City
Strategic Economic Development Plan Page | 3-13
of Cibolo, Texas
Figure
collar sectors were able to offer workfrom-home opportunities, allowing their workers to continue working and resist layoffs. A healthy unemployment rate typically falls within the range of 3% to 5%. When the rate surpasses 5%, it may suggest insufficient business activity to employ the available workforce. Conversely, a rate below 3% may indicate a shortage of workers relative to business demand.
The unemployment rate factors in residents who commute outside the City for work As for Cibolo, along with typical suburban fringe communities, most of the City’s labor force especially white-collar workers leave the City for employment. To this point, while the City's unemployment rate may appear robust by national standards, this doesn't necessarily translate into a robust business landscape.
In reality, Cibolo’s current business supply is notably smaller than its potential, considering the growing labor force population (Figure 3-15). While the growth of the labor force will help attract business investment, ancillary strategies that can continue its upward trajectory will be needed. Notably, strategies that focus on attracting young professionals and offsetting the City’s rising costs of living.
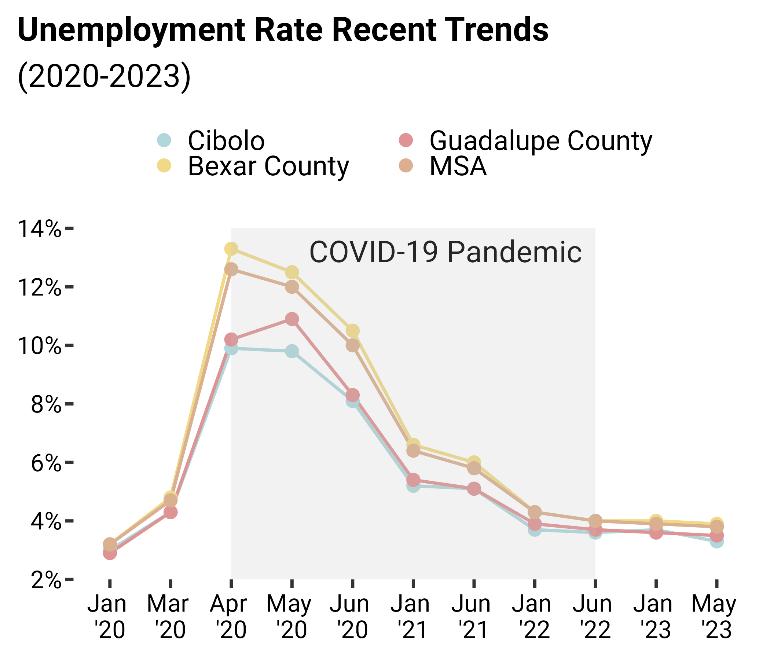

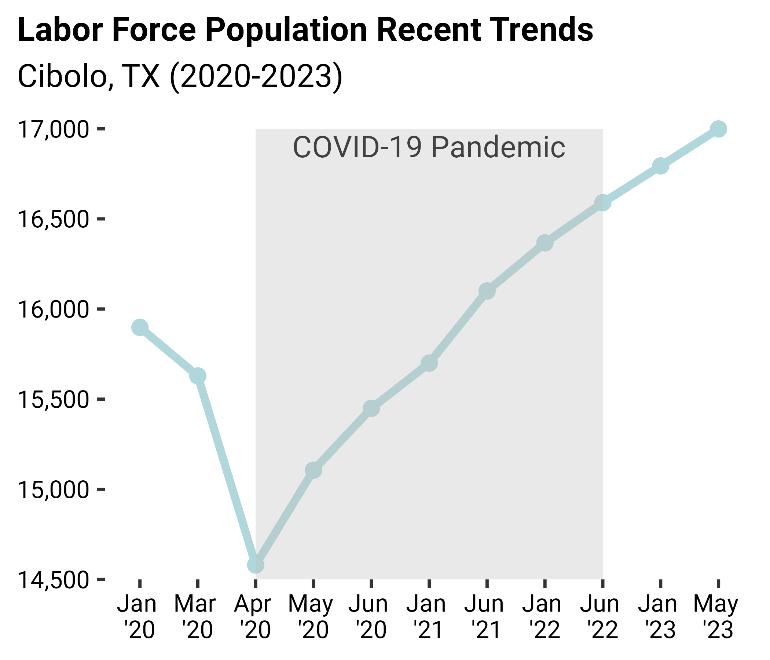
City
Strategic Economic Development Plan Page | 3-14
of Cibolo, Texas
Figure 3-15
Source: ACS Estimates, ESRI, RKG Associates Inc., 2023
Figure 3-14
Source: ACS Estimates, ESRI, RKG Associates Inc., 2023
3. COMMUTING PATTERNS
As repeatedly mentioned throughout this report, most Cibolo residents commute to work outside the City (Map 3-4), reflecting the City’s role as a bedroom community for regional employment hubs like the City of San Antonio


A) Where Cibolo Residents Work


More than half of Cibolo residents commute to Bexar County for work (Figure 3-16). This is largely a result of the lack of job opportunities that correspond to the skillsets and educational attainment levels of those living in Cibolo. Most white-collar professionals living in the City will commute to Bexar County, which offers jobs that command higher wages. Cibolo currently lacks the infrastructure needed to appeal to business investment. This includes a limited office inventory along with minimal housing options affordable to entry-to-mid level white-collar professionals, as well as service-based workers.
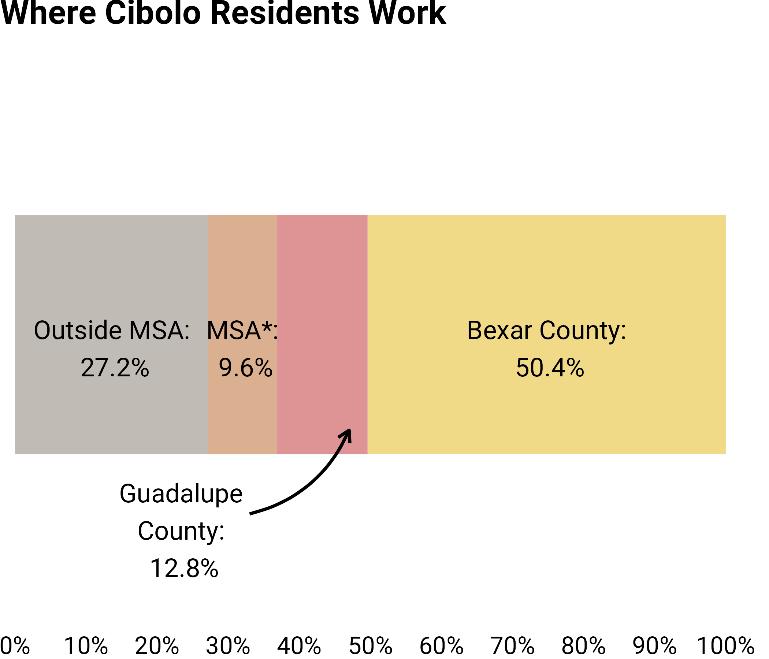
City of Cibolo, Texas Strategic Economic Development Plan Page | 3-15
Figure 3-16
12,962
2,629
Source: LEHD, RKG Associates Inc., 2023 295 Residents Live and Work in Cibolo
Outbound
Inbound Commuters
Map 3-4: Inbound and Outbound Commuting Patterns
Source: LEHD RKG Associates Inc., 2023
B) Where Cibolo Workers Live
While most Cibolo residents commute to Bexar County for work, most of those working in Cibolo commute from Bexar County (Figure 3-17). Bexar County provides a substantial housing inventory affordable to the types of workers employed in Cibolo (e.g., lower-waged serviced based workers and blue-collar workers). The large proportion of workers commuting from other parts of Guadalupe County also reflects the greater supply of workforce housing options available in these areas, albeit at a smaller scale than the supply seen in Bexar County. Workforce housing options represent housing units affordable to lower-waged workers, typically employed in services and blue collar sectors.
INSIGHTS & IMPLICATIONS

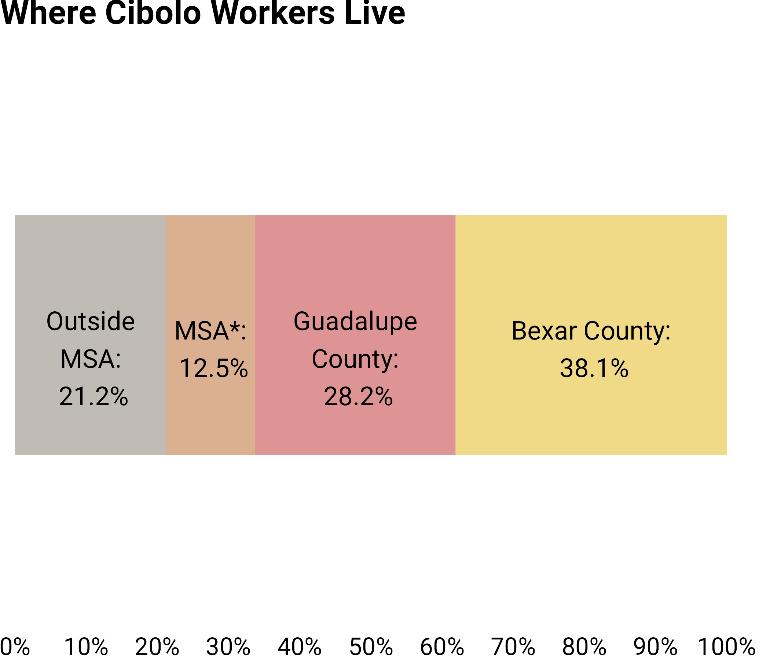
Source: LEHD, RKG Associates Inc., 2023
Cibolo experienced remarkable growth over the past decade, evolving into a bedroom community with unprecedented expansions in its household base. While it maintains characteristics of a traditional suburb, Cibolo has also emerged as a thriving industrial employment hub, notably with the recent investment by AISIN along the IH-10 corridor. Despite its strengths in attracting business investment within the production sector, the City is witnessing significant demographic shifts, including a diversifying and highly educated population, indicating promising opportunities for entrepreneurial ventures in various sectors.
To capitalize on these opportunities and diversify its economic base, the City of Cibolo must consider implementing policies and programs to address affordability challenges and cater to the evolving needs of modern businesses. This could involve initiatives such as the creation of livework-play activity centers, which can foster a vibrant business environment while enhancing quality of life for residents.
City
Strategic Economic Development Plan Page | 3-16
of Cibolo, Texas
Figure 3-17
4. REAL ESTATE ANALYSIS
INTRODUCTION
The Real Estate Analysis assesses Cibolo’s residential and non-residential marketplace, to understand recent trends, current conditions, and emerging opportunities. This assessment is designed to assist the City of Cibolo in creating policies and programs that bolster their built environment while fostering economic growth.
KEY FINDINGS
Strategic land assets fueled industrial development in Cibolo. The City’s availability of developable land offering interstate accessibility catalyzed the formation of Schneider Industrial Park. These assets also led to Aisin’s substantial investment along Interstate-10. Today, industrial uses represent the largest proportion of Cibolo’s non-residential inventory and the greatest shortterm opportunity for Cibolo
Cibolo’s non-residential development inventory diversified in the previous decade. Until 2011, industrial development constituted a substantial 80% of Cibolo’s non-residential development inventory. However, rapid population growth through the previous decade stimulated unprecedented retail investment, as retail uses today constitute a significant share (approximately 37%) of the City’s non-residential development inventory.
Consumer demand is likely short of justifying additional retail investment. While the City aims to attract further retail investment, especially sit down restaurants, Cibolo faces unfavorable market forces. At a base level, there is little unmet existing restaurant demand. More strategically, the City is located in close proximity to New Braunfels and Live Oak, which are both regional retail destinations. Restaurants are driven to maximize revenues by targeting leasing opportunities within these destinations, where traffic levels and demand are highest. Expanding the City’s housing stock is an effective approach to create the additional critical mass needed to drive additional retail/restaurant investment.
Cibolo’s residential development patterns paint a picture of a traditional suburban landscape. Standard subdivisions represent most of Cibolo’s housing stock. The emphasis on building single family homes limits housing options and maximizes land consumption (on a per unit basis). As supply is constrained and housing demand remains high, prices escalate. Escalating housing prices have made living options unaffordable to key segments of the workforce, which can discourage business investment.
Although the City has abundant developable land resources, future land use policies can limit future economic opportunity. Cibolo is competitively positioned to capture both residential and
City of Cibolo, Texas Strategic Economic Development Plan Page | 4-1
non-residential development opportunities that can facilitate job creation, tax base growth, and workforce development. However, current land use designations, such as single family uses, limits some of these opportunities including housing diversity and production-based opportunities.
DEVELOPMENT TRENDS
1. NON-RESIDENTIAL BUILDING INVENTORY

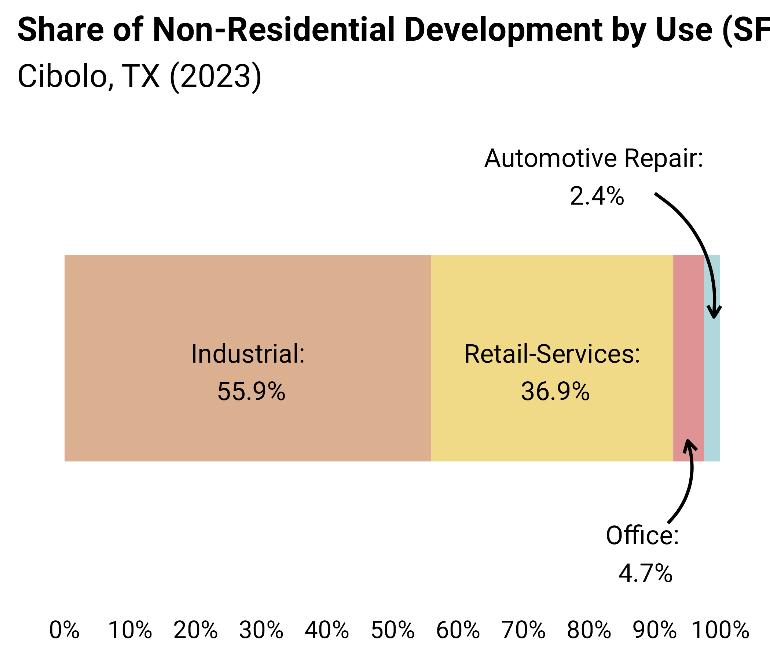
Source: ACS Estimates, ESRI, RKG Associates Inc., 2023
Industrial spaces constitute more than half of Cibolo’s non-residential development inventory (Figure 4-1). The City’s strategic location near I-35 and I-10 has stimulated investments toward manufacturing facilities, light industrial uses, and warehousing operations. Investments have generated hundreds of production-based jobs in Cibolo, creating a strong employment base. Interstate accessibility and an abundant labor supply serve as the primary market factors driving industrial development investment into Cibolo. These factors played a major role in attracting Aisin, the City’s most notable presence on a national and international scale. Speculative investors also recognized the City’s marketable assets. Recent annexations occurred along I-10 with plans of future industrial space. While Cibolo is competitively positioned to continue attracting industrial development investment, potential limitations could curb future opportunities. Such limitations include padreadiness, Senate Bill (S.B.) 2038, and countywide land competition.
• Pad-Readiness: Through discussions with local and regional stakeholders, RKG Associates uncovered a growing trend among large-scale industrial investors who are increasingly interested in pad-ready sites. Pad-ready sites are properties that are graded for immediate development opportunities and are prepared with on-site utilities (e.g., water and wastewater infrastructure, sufficient electrical capacity etc.). The City of Cibolo should continue coordinating with utility providers (e.g., the recently mediated agreement with GVSUD that enables Cibolo to provide wastewater to approximately 3,200 acres south of FM-78 and north of I-10) while pooling additional financial resources to stimulate investments toward pad-ready sites, especially along I-10.
City
Strategic Economic Development Plan Page | 4-2
of Cibolo, Texas
Figure 4-1
• S.B. 2038: Introduced in Fall 2023, the State of Texas now allows landlords with properties in a municipality’s Extraterritorial Jurisdiction (ETJ) to withdraw from its boundaries. The legislative shift carries significant implications including for industrial developers given the opportunity to sidestep tax obligations that would have otherwise been incurred following a formal annexation into City limits. Moreover, a potential development may not be in the city’s best interest as its not subject to building codes and standards.
Within Cibolo’s ETJ, particularly along the I-10 corridor, numerous properties can access utilities facilitated by third-party entities. Given the circumstances, the economics for ETJ landlords to annex diminishes substantially (Map 4-1). Proactive strategies should be employed to encourage landlords to annex voluntarily.

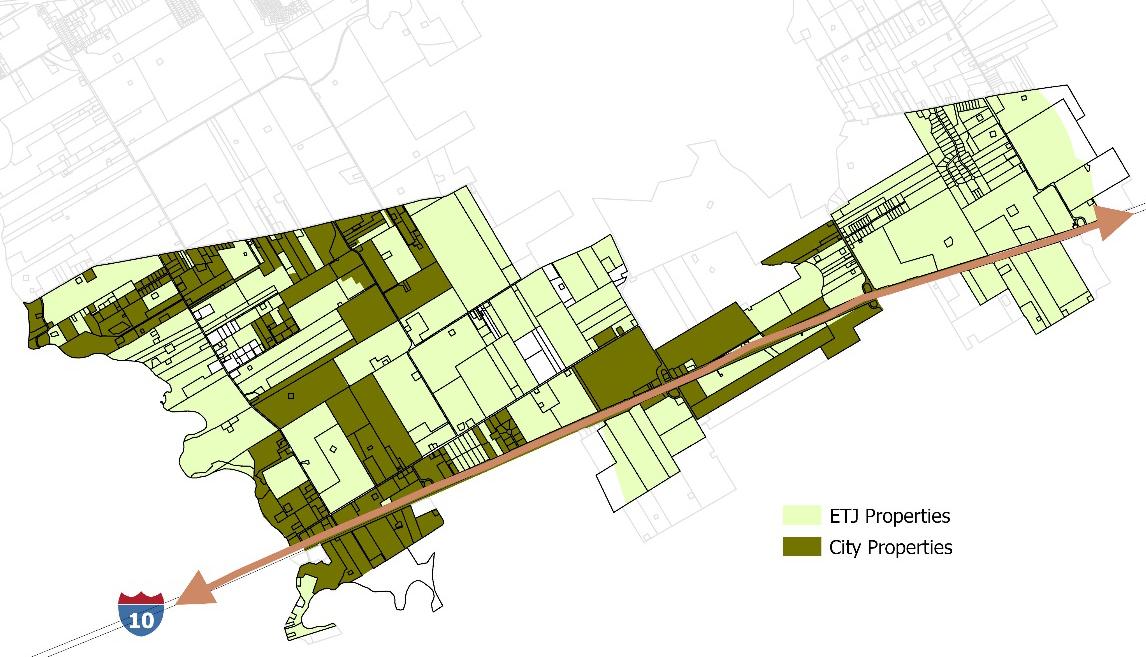

• Countywide Land Competition: Without financial incentives, there is less of an economic rationale for industrial investors to locate within a municipality’s boundaries given the additional tax requirements Meanwhile, unincorporated Guadalupe County remains largely undeveloped with substantial developable land resources to absorb additional industrial development. These circumstances impose competition on Guadalupe County’s municipalities, including Cibolo, to attract additional development.
2. RECENT NON-RESIDENTIAL BUILDING ACTIVITIES
Approximately 60% of Cibolo’s total non-residential building space has been constructed since 2011, underscoring the City’s rapid economic transformation relative to previous decades. Prior to 2011 and even before AISIN developed a footprint in Cibolo, the City established a solid base
City
Strategic Economic Development Plan Page | 4-3
of Cibolo, Texas
Map 4-1: ETJ Development Opportunities
Source: ACS Estimates, ESRI, RKG Associates Inc., 2023
ETJ Properties City Properties
Bexar County
for industrial operations. Cibolo’s Schneider Industrial Park has been operating since the 1990’s and remains an integral part of the City’s production-based economy. Until 2011, industrial uses constituted nearly 80% of Cibolo’s non-residential building square footage.
Since then, Cibolo’s non-residential development landscape has undergone significant shifts marked by large retail investment. As a result, retail/services development constituted half of non-residential construction activities between 2011 and 2023, well above the existing built environment prior to 2011 (Figure 4-2).
Rapid household growth and increased traffic flows in Cibolo stimulated this surge in retail/services development since 2011. Investors responded to upward shifts in demand, supplying retail spaces largely configured within neighborhood strip centers as well as a few single-tenant brand name retailers with a strong gravitational investment pull. This includes the existing Walmart Supercenter located between West Borgfeld Road and Cibolo Valley Drive.
4-2
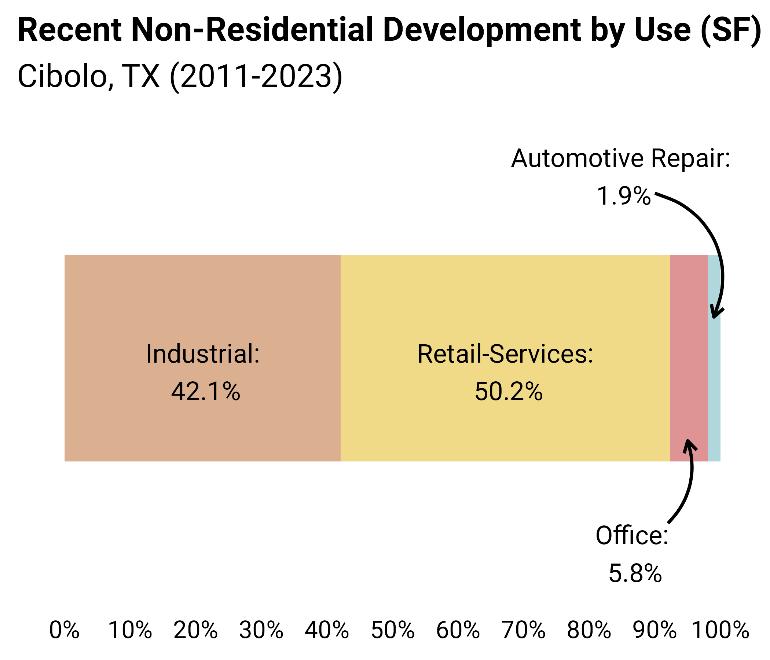
Source: ACS Estimates, ESRI, RKG Associates Inc., 2023
Following Walmart’s land acquisition in September 2013, retail investment surged in the immediate vicinity (Figure 4-3). The heightened investment was driven by the anticipation of leveraging increased traffic flows once Walmart opened shop which occurred in 2016. The operating retail properties showcased in Figure 4-3, which includes Walmart and H-E-B, represent roughly half of Cibolo’s total retail development inventory. Most of the City’s remaining developed retail inventory is proximate to I-35, dispersed throughout Cibolo Crossing. All of this demonstrates a clear trend: retail investment gravitates towards locations with robust traffic flows. This is made clear through the concentration of retail development around Walmart and H-E-B, coupled with Cibolo Crossing’s investment along I-35
City
Strategic Economic Development Plan Page | 4-4
of Cibolo, Texas
Figure


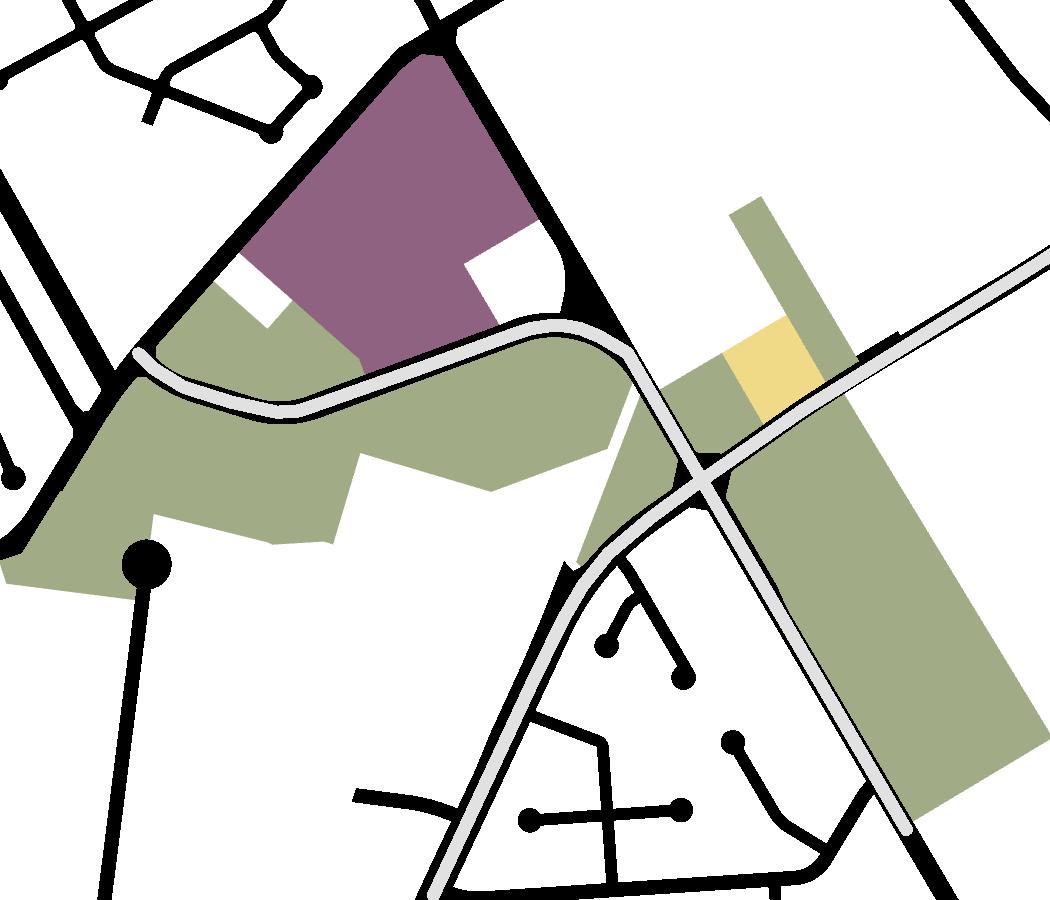


Pre-Walmart Acquisition (September 2013)


Land


Source: Costar, Guadalupe County Assessors, RKG Associates Inc., 2023 Retail Investment
Timeline of Key Events…


2013
In September of 2013, Walmart acquires 20 acres of land between W Borgfeld Rd and Cibolo Valley Dr, anticipating that population growth continues in Cibolo and surrounding areas. 2014


Walmart’s announcement ripples retail investment as land plots are purchased in the immediate vicinity. This includes the future neighborhood strip centers of Cibolo Marketplace and the Shops at Buffalo Bend. HEB acquires its existing property in March 2014. 2015

Both AutoZone and CVS purchase their existing properties and develop in the same year.

2021-Present
Additional land was purchased for two additional neighborhood strip centers nearly finished construction at the timing of this report. Borgfeld Plaza, a future neighborhood strip center earlier in the development stages, purchased their land in January 2021.

City
Strategic Economic Development Plan Page | 4-5 Future Walmart Site Future H-E-B Walmart H-E-B
of Cibolo, Texas
Today
Figure 4-3: Evolution of Retail Cluster Around Walmart
Undeveloped
Walmart
Despite these advantages, it appears the City's retail market is reaching a point of saturation, with insufficient consumer demand to justify further retail investment. To overcome this challenge, the consumer base will need to be expanded, which can effectively be accomplished through additional housing development.
3. RESIDENTIAL DEVELOPMENT INVENTORY
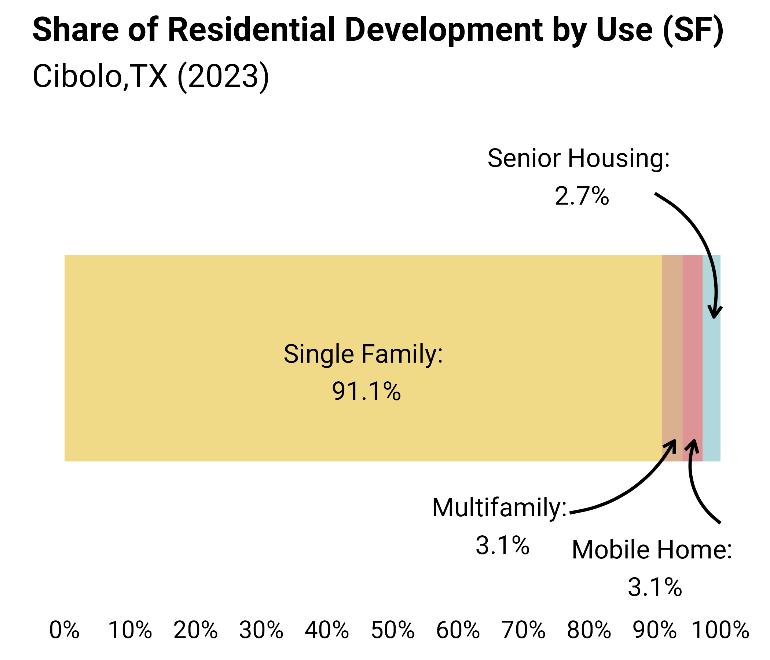
Residential development in Cibolo is predominantly single family detached homes (Figure 4-4). This reflects the City’s high rates of homeownership and rapid development of master-planned subdivisions since the turn of the century These characteristics have fueled Cibolo’s transformation into a typical bedroom community with a minimal representation of other types of housing options (e.g., townhomes, apartments, etc.), which are typically integrated into dynamic economic activity centers. Specifically, larger employment centers typically offer a greater share of rental opportunities to provide living options for workers unable to afford the costs of homeownership This includes service-based workers and blue-collar workers, most of whom earn wages that are insufficient to afford the rising cost of homeownership in Cibolo.
Figure 4-5 on page 4-7 depicts the annual earnings of several occupations with a significant representation in Cibolo’s employment base. Based on their annual earnings, the y-axis indicates the corresponding maximum amount of housing costs considered affordable. As illustrated, each of these occupations earn annual salaries insufficient to afford Cibolo’s median rental and homeownership rates.
The rising affordability challenges coupled with the lack of multifamily rental units can reduce the City’s competitiveness for attracting business investment. This affects not only retail and restaurant businesses, but also potential businesses within traditional white-collar industry segments the City aims to attract (e.g., professional services, healthcare etc.).
City of Cibolo, Texas Strategic Economic Development Plan Page | 4-6
Figure 4-4
Source: Guadalupe County Assessors, RKG Associates Inc., 2023
4-5
Monthly Housing Costs of Key Occupations
Cibolo, TX (2021)
Median Renter-Occupied Costs
Source: ACS Estimates, Lightcast, RKG Associates Inc., 2023 Median Owner-Occupied Costs
4. RECENT RESIDENTIAL BUILDING ACTIVITIES
The predominance of single family home development has been the case since 2011, constituting roughly 86% of total residential development (Figure 4-6). However, there has been a shift towards additional housing typologies in response to evolving market demands. The increasing senior population has led to the development of senior housing complexes like The Brooks at Cibolo. Additionally, developments like Trophy Oaks have emerged to meet a rising demand for multifamily rental options while expanding the availability of workforce housing units.
4-6
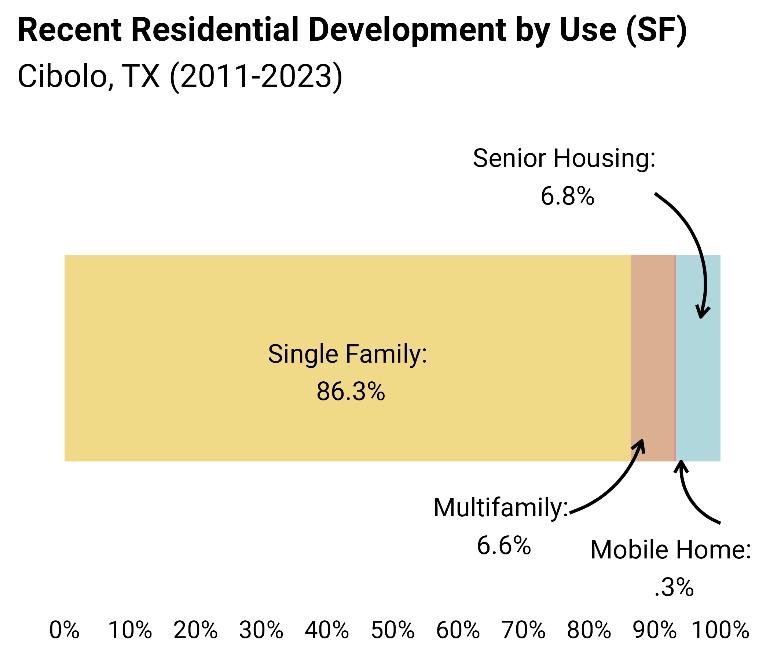
Source: Guadalupe County Assessors, RKG Associates Inc., 2023
Workforce housing units are homes affordable to incomes earning between 80% and 120% of Area Median Income (AMI). Typically, these homes are intended to accommodate living opportunities for essential segments of the workforce, including service-based and blue-collar workers. Insufficient housing affordable to workers can discourage business investment, particularly in places like Cibolo with acute housing shortages (Figure 4-7).
City of Cibolo, Texas Strategic Economic Development Plan Page | 4-7
HEB Service Worker AISIN Operations Manager Patrol Officer Food Server Fast Food Worker Cashier Customer Service Rep Construction Supervisor Truck Driver $0 $250 $500 $750 $1,000 $1,250 $1,500 $1,750 $2,000 $2,250 $2,500 $2,750 $3,000 $0 $10,000 $20,000 $30,000 $40,000 $50,000 $60,000 $70,000 $80,000 $90,000 $100,000 Monthly Housing Costs Annual Salary
Figure
Figure
Source: ACS Estimates, RKG Associates Inc., 2023
As outlined in Figure 4-7, rental households with the highest incomes (above 120% of AMI) face a housing shortage of approximately 507 units tailored to their income bracket Conversely, a surplus of units exists for those earning between 80% AMI and 120% AMI. Given the circumstances, the highest earning households will seek out rental opportunities that would have otherwise been tailored to their income bracket. As highest earning households will outbid lower earning households, this will result in escalating rental rates across Cibolo’s marketplace overtime.
Numerous rental properties are currently in the planning stages within the City’s development pipeline which can help mitigate market rent escalation, as additional units will be available for the highest income earning households. However, additional income-controlled units, like those available in Trophy Oaks, may be needed to avoid the displacement of key workforce segments.
City of Cibolo, Texas Strategic Economic Development Plan Page | 4-8
-48 -5 -185 581 120 -507 -600 -400 -200 0 200 400 600 Under 30% of AMI 30% - 50% of AMI 50% - 80% of AMI 80% - 100% of AMI 100% - 120% of AMI Above 120% of AMI
Figure 4-7
Rental Housing Supply/Demand Equilibrium by Income Level
Cibolo, TX (2021)
5. DEVELOPABLE LAND OPPORTUNITIES
Despite the substantial growth that has occurred in Cibolo since 2000, the City still possesses abundant land resources (Map 4-2). Vacant land makes up a significant percentage of the City, with a considerable portion immediately available for development without floodplain constraints. Among the 7,413 acres of land considered vacant within Cibolo, nearly 80%, or 5,833 acres, are developable and unconstrained by wetlands.


Source: Guadalupe County Assessors, RKG Associates Inc., 2023

With Cibolo Crossing occupying all of the City’s I-35 frontage, vacant land along 1103 offers the most viable opportunity to create a regional activity center in the short-term.
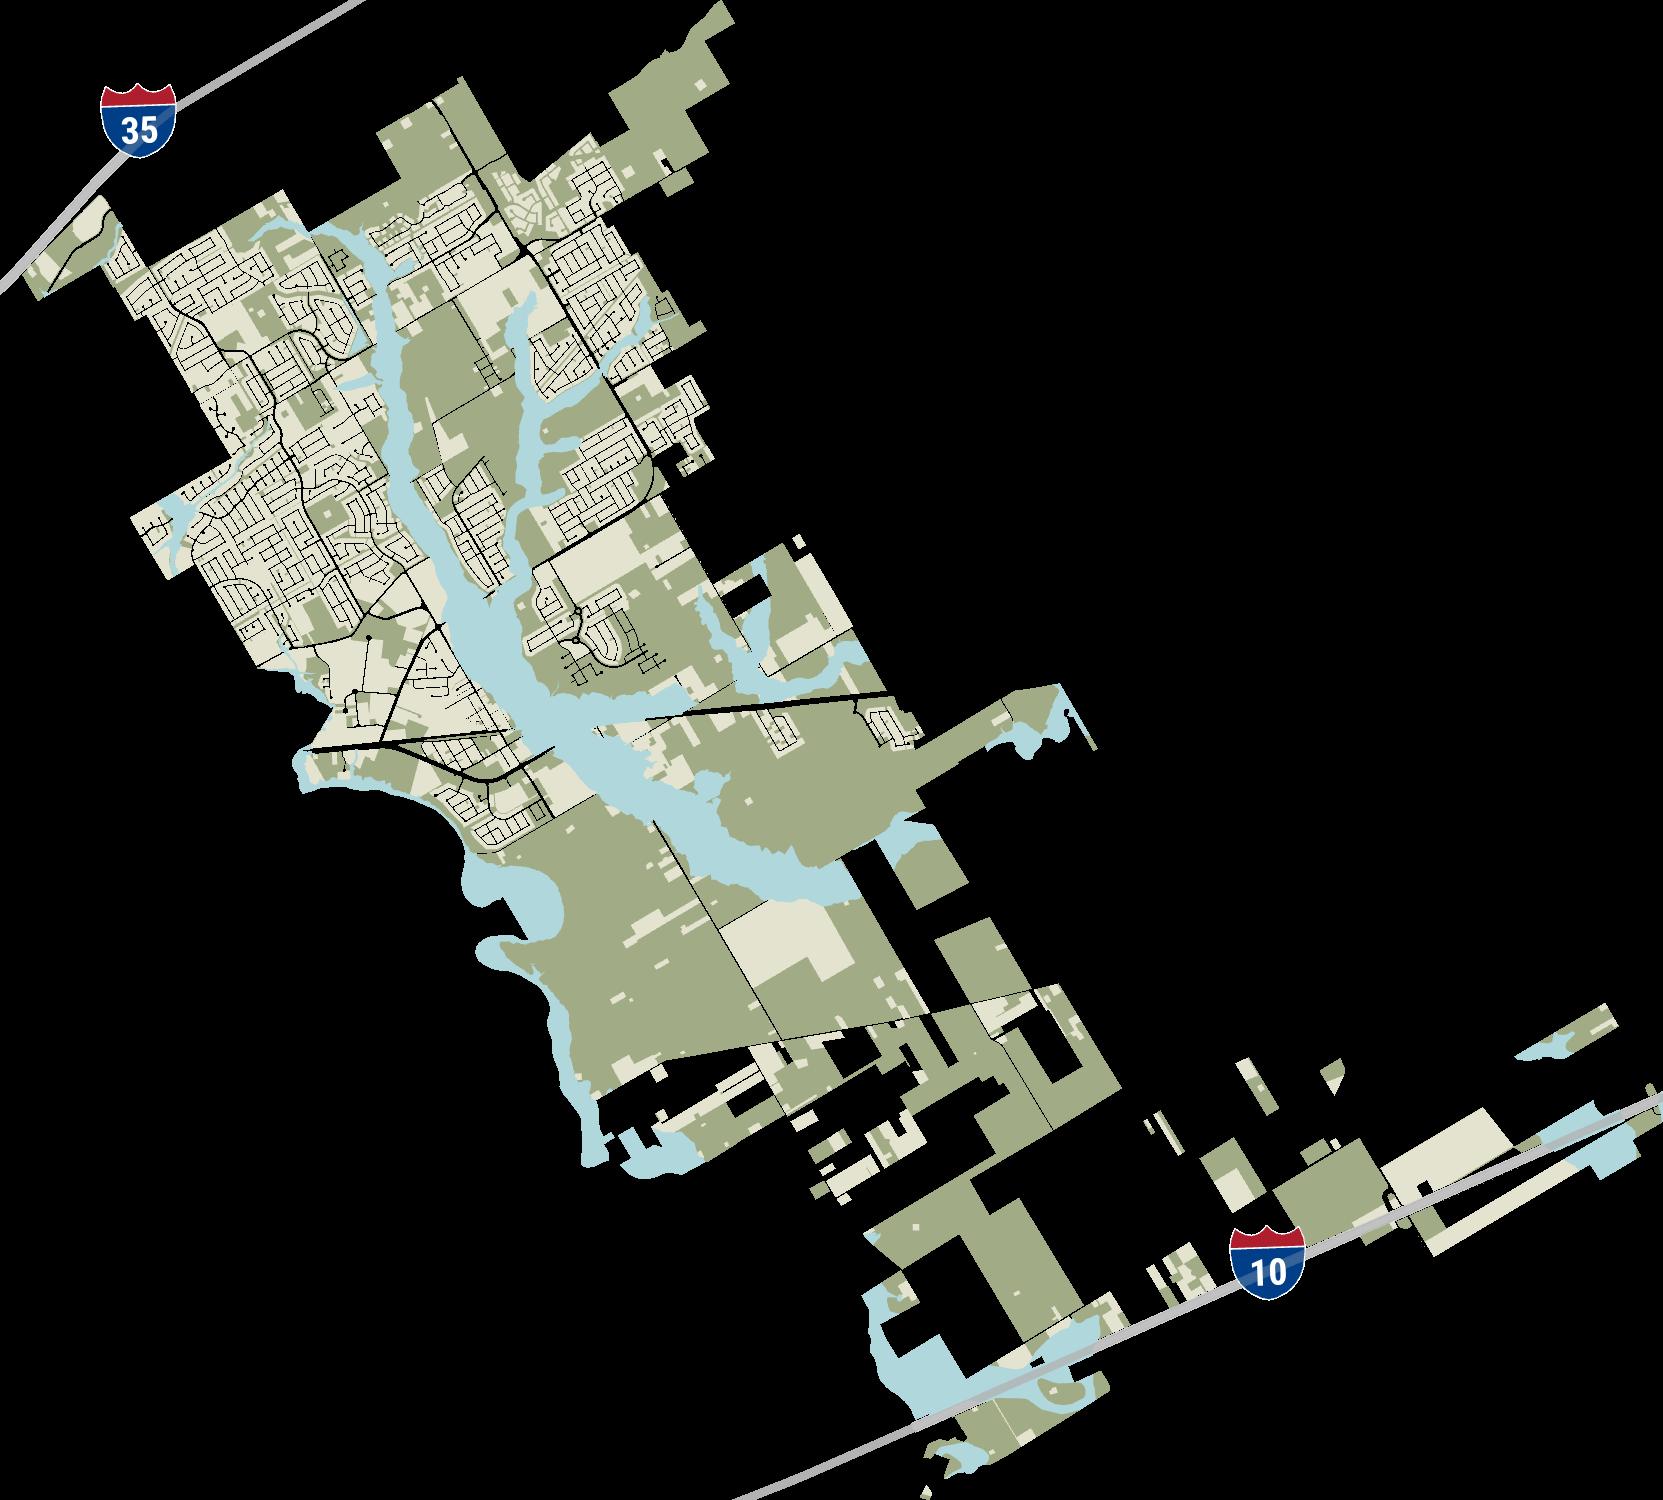
Within the City’s boundaries, nearly 5,900 acres are considered and developable, unconstrained by wetlands.


I-10 offers several opportunities to expand the City’s industrial development inventory that can capitalize on emerging market forces.

Substantial developable land resources create opportunities for stimulating investment that aligns with Cibolo's long-term economic development objectives (detailed later in this report). Such initiatives can include expanding job opportunities, attracting retail investment, and diversifying its development inventory beyond residential uses. By leveraging the advantage of developable land resources, Cibolo can pursue sustainable growth and unlock its economic potential.
City of Cibolo, Texas Strategic Economic Development Plan Page | 4-9
Floodplain
Vacant Land
Map 4-2
4-8
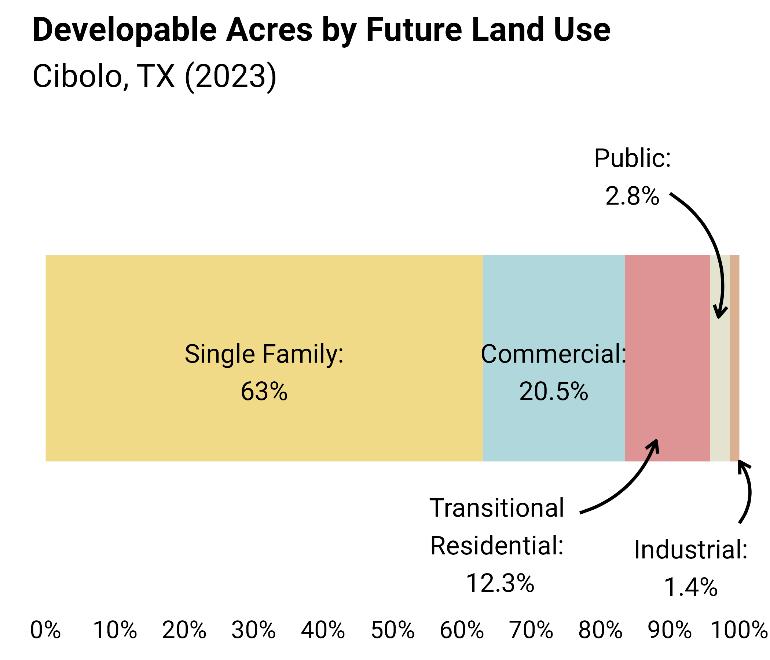
Source: Guadalupe County Assessors, RKG Associates Inc., 2023
However, existing policies particularly future land use plans may hinder this potential. Currently, a significant portion of vacant, developable land is earmarked for additional single-family home subdivisions. This category constitutes approximately 63% of future land use allocations (Figure 4-8). This allocation disproportionately limits the types of development that could spur exponential job growth, such as industrial development, which is limited to only 1.4%, or 80 acres, of the City’s future land use plans within the Cibolo’s boundaries. Moreover, single family land use policies restrict the residential development capacity in Cibolo, thereby limiting potential workforce expansions and discouraging sufficient population density to attract the additional retail investment identified through this study. These restrictions not only constrain the range of industries Cibolo can target for job expansion but also hinder its ability to foster a thriving economic ecosystem. Currently, efforts are being made through the Comprehensive Planning process to update the distribution of future land uses. RKG has recommended the City consider several land use alternatives including mixed-use zoning in economic activity centers, diversifying the housing typologies within the land use categories, and increasing land dedicated to warehousing, flex space, industrial space, and manufacturing space within Cibolo limits.
MARKET ANALYSES
RKG Associates analyzed regional market performance conditions and trends of three primary non-residential building uses: Office, Retail, and Industrial. The analyses’ findings can provide the City of Cibolo with valuable insights on potential investment opportunities across the spectrum of non-residential building uses. REIS, a national repository of non-residential real estate data, provided the data points under analysis, which covers key market indicators across the regional San Antonio marketplace.
1. OFFICE MARKET
As the nucleus for regional white-collar employment, the City of San Antonio captures most of the region’s traditional office inventory. However, northbound economic flows beyond the City of San Antonio have stimulated recent investment potential. So much so that REIS began tracking office market performance trends in the region’s ‘Outer Counties’: Guadalupe County, Comal County, and Kendall County (Map 4-3). REIS identifies the ‘Outer Counties’ as one of the six distinct submarkets within the broader San Antonio Office Marketplace; the remaining five
City of Cibolo, Texas Strategic Economic Development Plan Page | 4-10
Figure
submarkets are distributed across Bexar County. RKG Associates analyzed all six submarkets within the broader San Antonio Office Marketplace, albeit with a particular emphasis on the ‘Outer Counties’ submarket as trends there are more reflective of trends occurring in Cibolo.
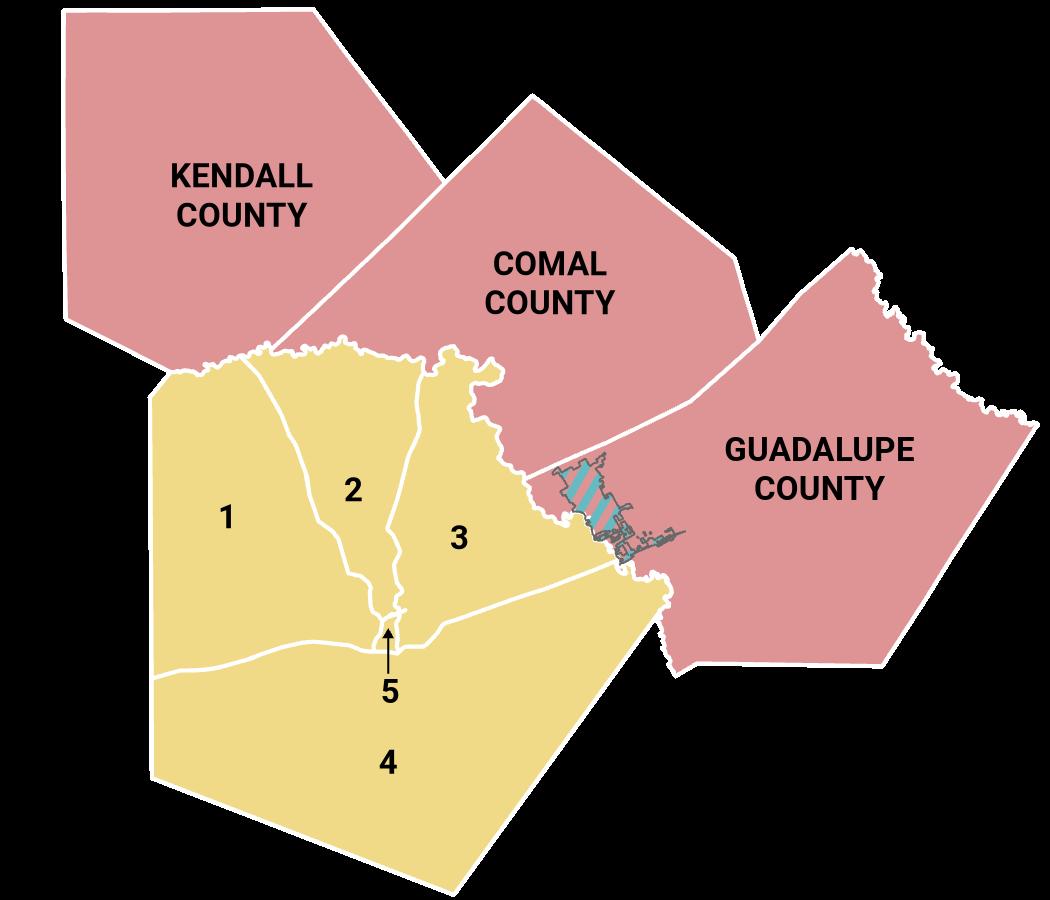


A) Inventory


Located in Guadalupe County, Cibolo is in the ‘Outer Counties’ submarket.
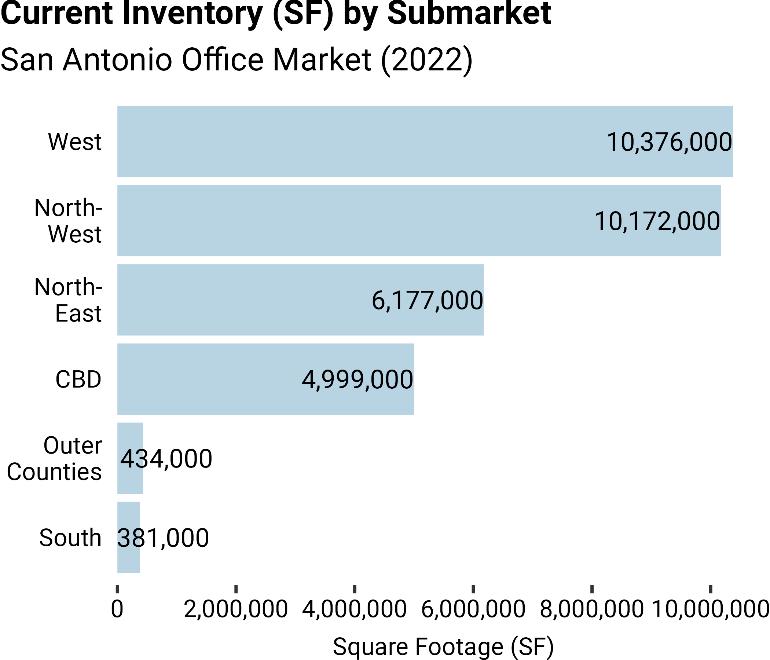
From the 1970’s to early 2000’s, the suburban business park flourished as a development model across metropolitan regions nationwide. This model constituted several behemoth office buildings typically scaled well over 100,000 SF distributed across vast landscapes. Both the City of Plano, Texas in Dallas-Fort Worth and the City of Alpharetta, Georgia in Metro Atlanta represent major suburban enclaves that adopted this model, resulting in substantial office space inventory and corresponding job growth among whitecollar industries. Unlike Plano and Alpharetta, most suburbs in the San Antonio-New Braunfels MSA absorbed negligible investment into office spaces. This includes suburbs north of Bexar County within the Outer
City
Strategic Economic Development Plan Page | 4-11
of Cibolo, Texas
Map 4-3 San Antonio Office Marketplace Submarket Boundaries
Outer Counties Submarket 1 West 2 Northwest 3 Northeast 4 South 5 CBD Bexar County Submarkets
Source: REIS, RKG Associates Inc., 2023
Figure 4-9
Source: REIS, RKG Associates Inc., 2023
Counties submarket, such as the City of Cibolo. Consequently, the Outer Counties submarket constitutes a negligible proportion of the broader San Antonio Office Market (Figure 4-9). Most office inventory is in Bexar County, primarily distributed across the City of San Antonio.
B) Vacancies and Absorption Rates
The City of San Antonio retains its position as the central hub for white-collar employers in the region, boasting the highest concentrations of office inventory. However, the Outer Counties' limited historical investment may have inadvertently yielded a favorable outcome, particularly in light of shifting workplace preferences.
Accelerated by the COVID-19 pandemic, there has been a notable increase in the preference for hybrid or fully remote employment opportunities among workers. This trend has led several white-collar businesses to downsize their office spaces, resulting in significant portions of the market's existing inventory becoming vacant or available for sublease. Consequently, high vacancy rates and negative absorption have become evident in the market, especially in the Central Business District submarket (Figure 4-10).
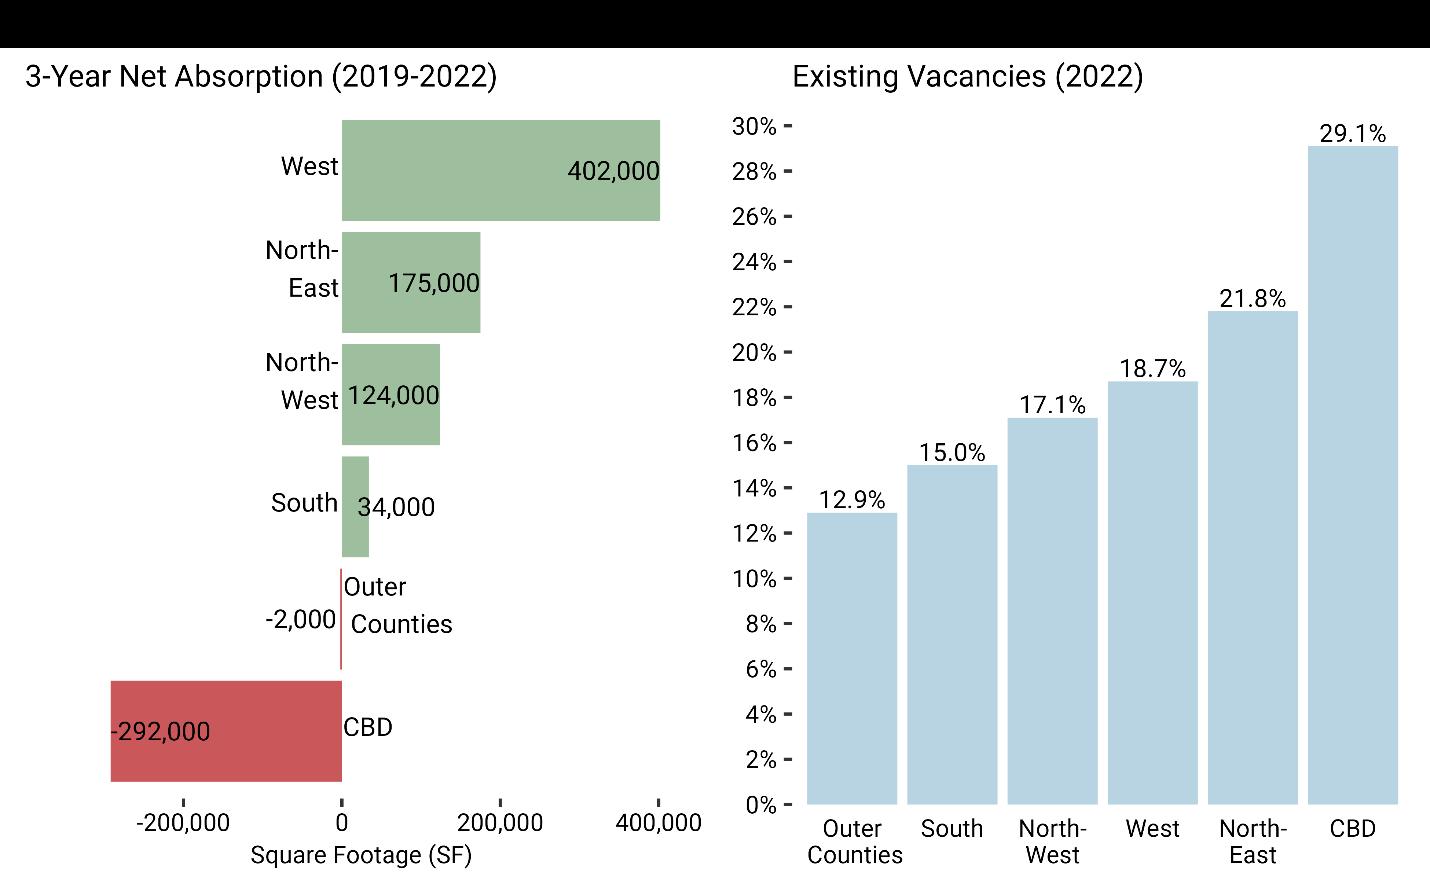
Note that vacancy rates could be even higher than illustrated in Figure 4-10 as subleasing activity is not factored in, which has steadily increased. While many businesses are expected to gradually return to in-person work, albeit on a smaller scale, it is unlikely that existing buildings with high vacancies will attract leasing activity at the same pace as before the pandemic. Consequently, landlords of underutilized buildings are left grappling with properties that are underperforming
City
Strategic Economic Development Plan Page | 4-12
of Cibolo, Texas
Figure 4-10
and outdated. Fortunately, albeit inadvertently, the City of Cibolo has been spared the burden of addressing these economic deficiencies, as it has never invested in office buildings that could continue to decline in functional value.
C) Cibolo Office Market
As a microcosm of trends occurring throughout the Outer Counties submarket, Cibolo’s existing office inventory is limited. Once again, corresponding with the minimal number of white-collar businesses operating within the City’s limits. The existing inventory primarily is small scale offices that have been converted from single family homes, old banks, or an office space attached to a broader production facility To this point, several medical office users are occupying traditional retail strip centers due to the lack of desirable space.
However, Cibolo is well-positioned to expand its office inventory, particularly to accommodate small businesses or 'hub and spoke' models for larger businesses. The 'hub and spoke' model, popularized by national-scale businesses, involves downsizing from previous office setups due to shifting workplace preferences. The model allows businesses to maintain a presence in a metropolitan region without the need for extensive office space. In light of these opportunities, RKG Associates recommends that Cibolo streamline investments towards office spaces ranging between 1,000 to 5,000 square feet.
D) Medical Offices in Cibolo
Medical uses, particularly dental offices, have accounted for the majority of office investment in Cibolo. This heightened investment in medical spaces reflects a growing unmet demand for healthcare services among the City's expanding demographic cohorts, particularly young families and seniors. Data indicates that more than 94% of medical spending by Cibolo residents occurs outside the City limits (a detailed graphic of this finding is in the target industry chapter of this report). While the City's current population level does not meet the threshold to justify investment in a full-scale hospital due to the presence of these facilities in nearby communities, it is adequate for off-campus surgical centers, private physicians' offices, and similar facilities. Moreover, senior care services such as assisted living facilities are apparently undersupplied, which RKG Associates learned through interviews with local stakeholders.
2. RETAIL MARKET
The Outer Counties retail submarket consists of the same three counties as its office submarket: Guadalupe County, Comal County, and Kendall County (Map 4-4). As observed in the office market analysis, REIS only began tracking the Outer Counties’ retail submarket since 2019. Northbound investment beyond Bexar County and San Antonio led to REIS to begin tracking the Outer Counties, as unprecedented levels of household growth in the previous decade stimulated retail inventory expansions. This includes Cibolo, absorbing retail investment in recent years due to the City’s access to Interstate-35 and larger local consumer base.
City of Cibolo, Texas Strategic Economic Development Plan Page | 4-13
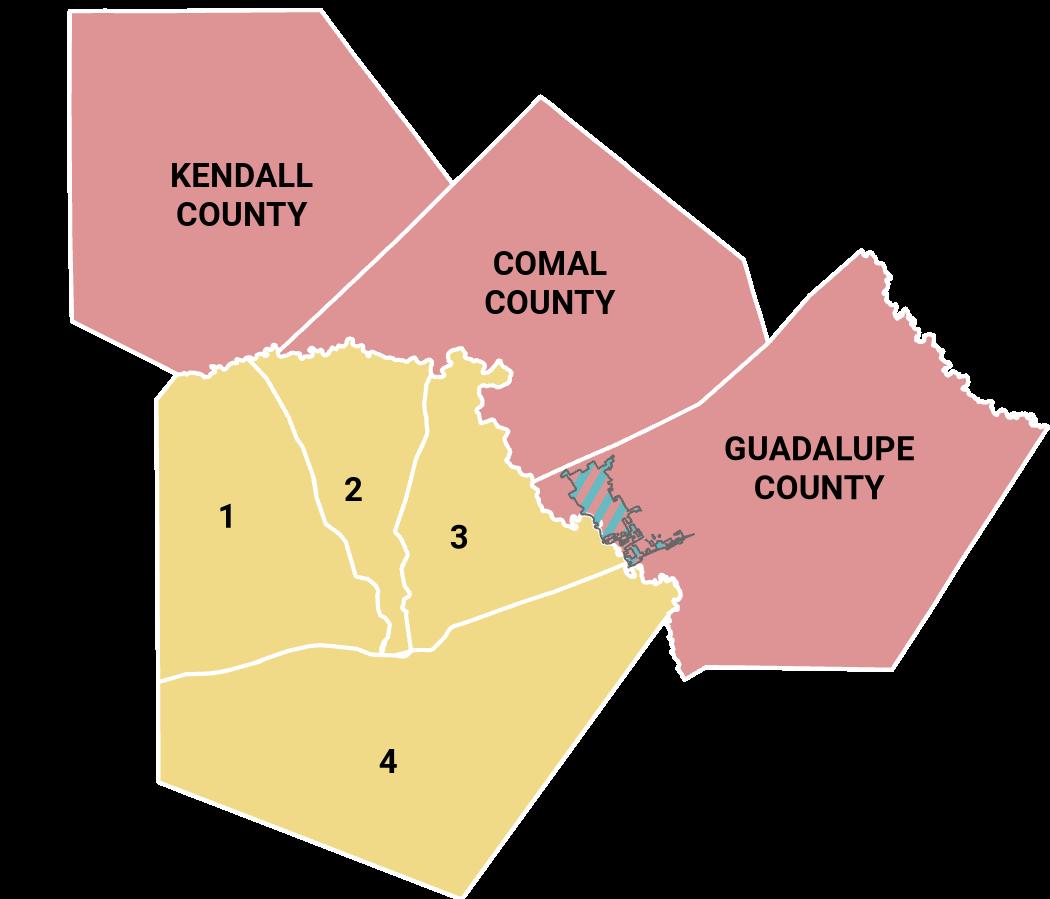
Source: REIS, RKG Associates Inc., 2023
A) Inventory

Outer Counties is the smallest submarket in the broader San Antonio Retail Market (Figure 4-11), reinforcing the critical importance of population densities needed to attract retail investment. That said, it makes sense why most of the region’s inventory is located within submarkets distributed throughout highly-populated Bexar County, which includes the City of San Antonio. Retailers, especially restaurants, tend to focus their investments in areas with large population distributions and steady traffic flows. This is crucial for ensuring a consistent flow of customers.
B) Restaurant Leasing Activity

Located in Guadalupe County, Cibolo is in the ‘Outer Counties’ submarket. The Outer Counties’ retail boundaries remain the same as its office boundaries.

Figure 4-11
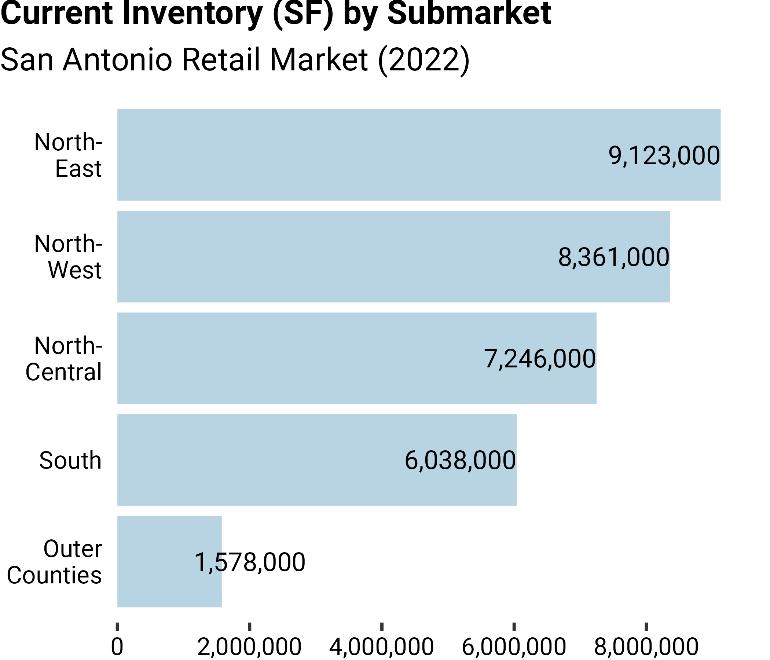
Source: REIS, RKG Associates Inc., 2023
One of the primary community development goals for the City of Cibolo identified during this effort is to attract more restaurants
City of Cibolo, Texas Strategic Economic Development Plan Page | 4-14
Outer
Bexar County Submarkets 1 Northwest 2 North Central 3 Northeast 4 South
Counties Submarket
Map 4-4: San Antonio Retail Marketplace Submarket Boundaries
to establish themselves within the municipal boundaries. Restaurants typically seek out locations near densely populated areas or busy roads with heavy traffic to maximize their revenue potential. These factors have prompted sit-down restaurants like Willies Grill & Ice House and the Magnolia Pancake Haus to set up in Cibolo Crossing, taking advantage of the high traffic along I-35. Cibolo Crossing occupies the entire I-35 frontage within Cibolo, making it the most economically viable location for retailers, including restaurants. However, apart from Cibolo Crossing, attracting further restaurant investment will be challenging for the City. Current capture rates reflect almost all restaurant spending in Cibolo and the City faces stiff competition from super regional retail clusters that exist in Live Oak and New Braunfels.
The following pages Map 4-5 and Map 4-6 depict the primary factors shaping restaurant leasing trends in the broader San Antonio Retail Marketplace over the past decade, emphasizing Cibolo's comparative disadvantage against areas that have attracted more investment. Map 4-5 illustrates that the highest concentrations of signed leases are found in close proximity to densely populated areas, especially within Bexar County, where there are significant numbers of households and/or jobs.
Map 4-6 presents a case study focusing on national-brand restaurants that have established locations within a 15-minute drive from Cibolo's intersection with Interstate-35. The restaurants featured in this study include Chili's, Longhorn Steakhouse, Chuy's, Texas Roadhouse, and Olive Garden. As illustrated, all of these restaurants chose to open branches in both Live Oak and New Braunfels, bypassing investment in the areas in between, notably including the City of Cibolo.
City
Strategic Economic Development Plan Page | 4-15
of Cibolo, Texas
City of Cibolo, Texas Strategic Economic Development Plan

Contains The Rim, UTSA, and Methodist Hospital, all major sources of consumer demand
Restaurants seek out leases in locations that offer the most proximate access to a consistent consumer base. This is why most restaurants have leased spaces near population clusters and employment centers in Bexar County, especially near the San Antonio’s Central Business District.

Source: REIS, RKG Associates Inc., 2023

Cibolo Crossing’s intersection with I-35 encouraged some restaurant leasing activity.
New Braunfels’ population has exploded over the previous decade, as leasing activity picked up to capitalize on demand shifts.


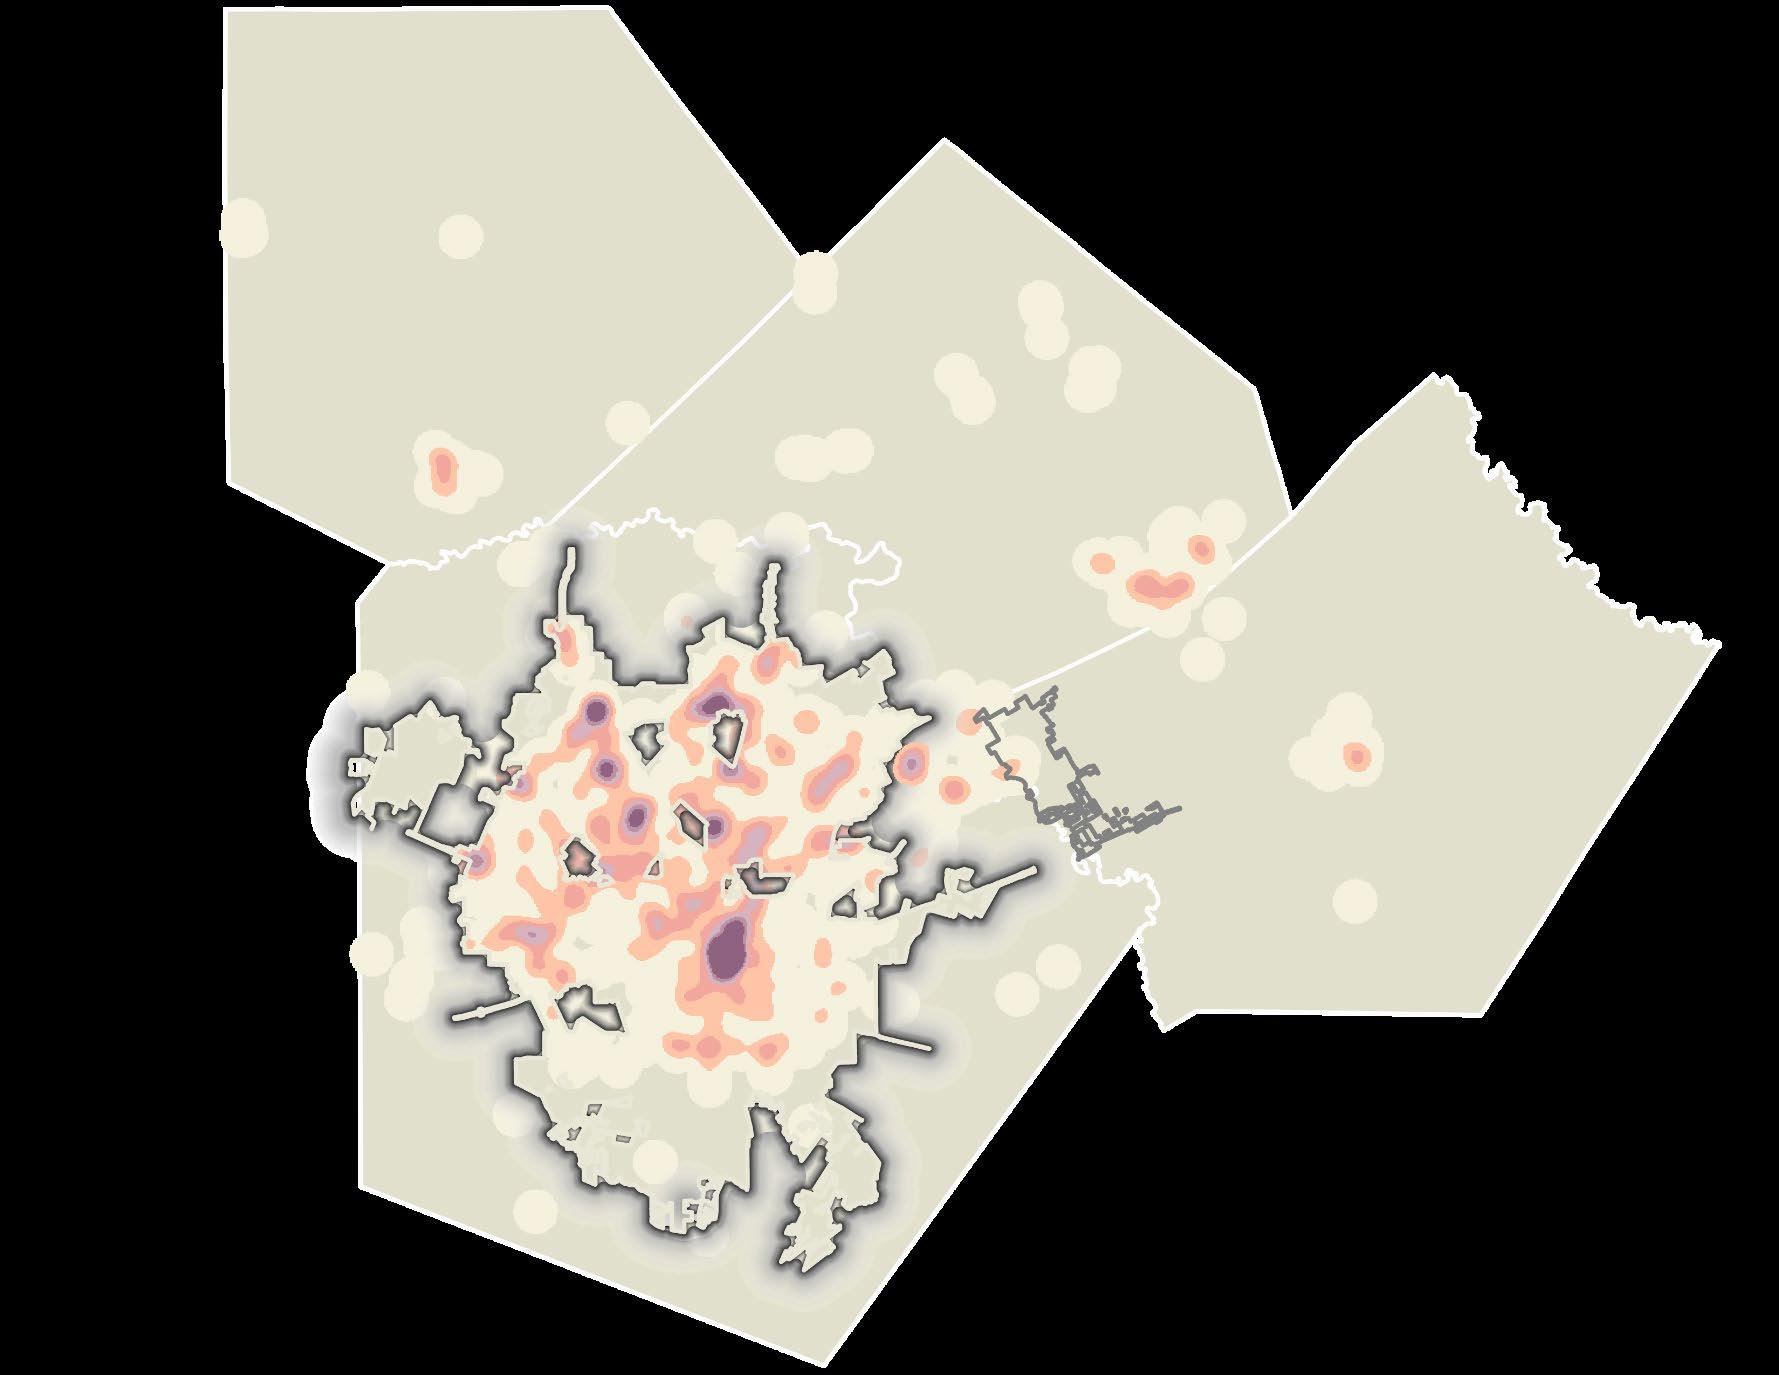
Cibolo is tucked between the consumer catchment areas of Live Oak and New Braunfels, two established retail destinations. Given that Cibolo residents can drive within reason to both Live Oak and New Braunfels, Cibolo is at a competitive disadvantage for capturing restaurant investment within their city boundaries.

Page | 4-16
Most Leasing Activity
Least Leasing Activity
Map 4-5: Concentrations of Restaurant Leasing Activity Over Previous 10 Years
City of Cibolo, Texas
Economic Development Plan
Map 4-6: Concentrations of Restaurant Leasing Activity Over Previous 10 Years
REIS, RKG Associates Inc., 2023
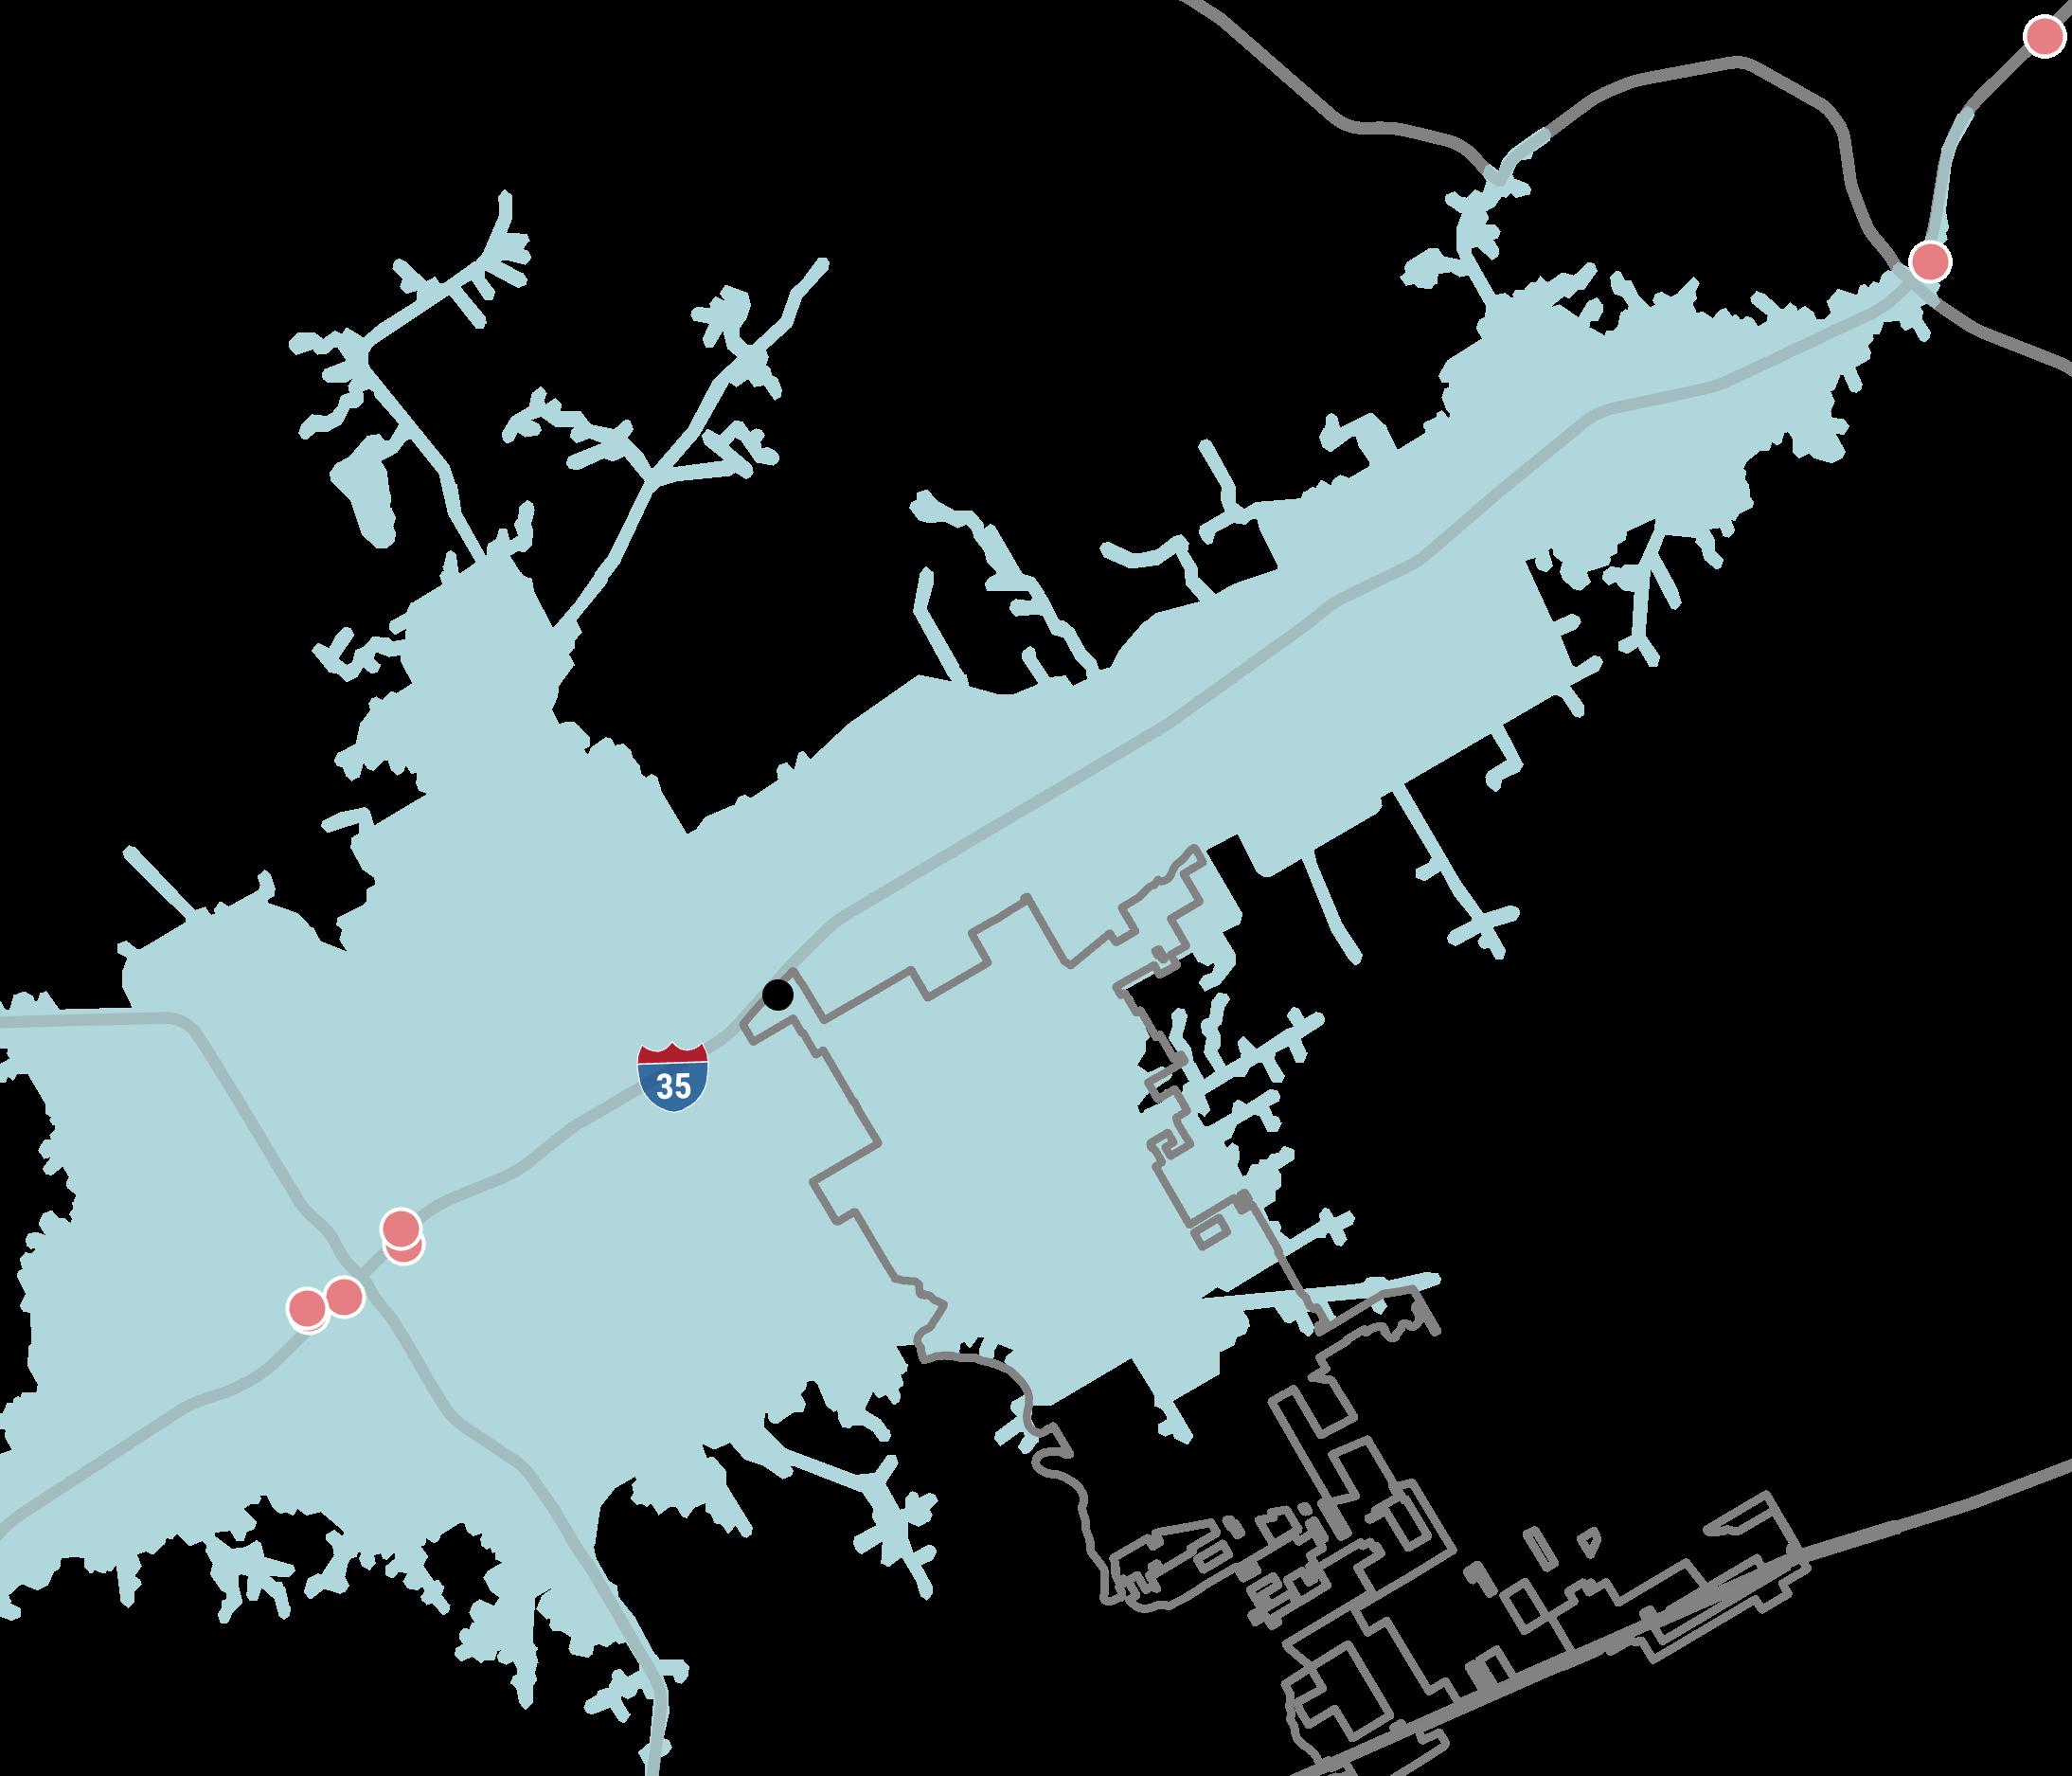
Chilis, Longhorn Steakhouse, Chuy’s, Texas Roadhouse, and Olive Garden have locations in Live Oak and New Braunfels Locating here is intentional, as each restaurant can ‘catch’ consumers within an approximately 15-minute drive time area.

Page | 4-17
Strategic
Source:
The limitation for investment in sites between Live Oak and New Braunfels is driven, in part, by restaurants' anticipation of drawing consumers from populated communities like Cibolo. Opening an additional restaurant in the areas between Live Oak and New Braunfels creates the potential risk of diverting sales from their existing locations while incurring additional overhead costs associated with operating an additional location (called ‘cannibalization’ in retail terms).
Supply and demand are critically important for retailers Restaurants, like those examined in this case study, are inclined to expand into areas like Cibolo if there’s sufficient consumer demand. Therefore, the most effective strategy for attracting more restaurant investment involves expanding the City's consumer base, achievable through increases in both residential and daytime populations.
C) Vacancies and Absorption Rates
In the Outer Counties submarket, consistent population growth prompted retailers to lease space in anticipation of rising consumer demand. This is reflected in the submarket’s positive absorption rates, as 121,000 square feet of additional retail space went under lease between 2019 and 2022 (Figure 4-12). Despite this positive trend, the submarket experienced the highest vacancy rates compared to others in the broader San Antonio Retail Market.
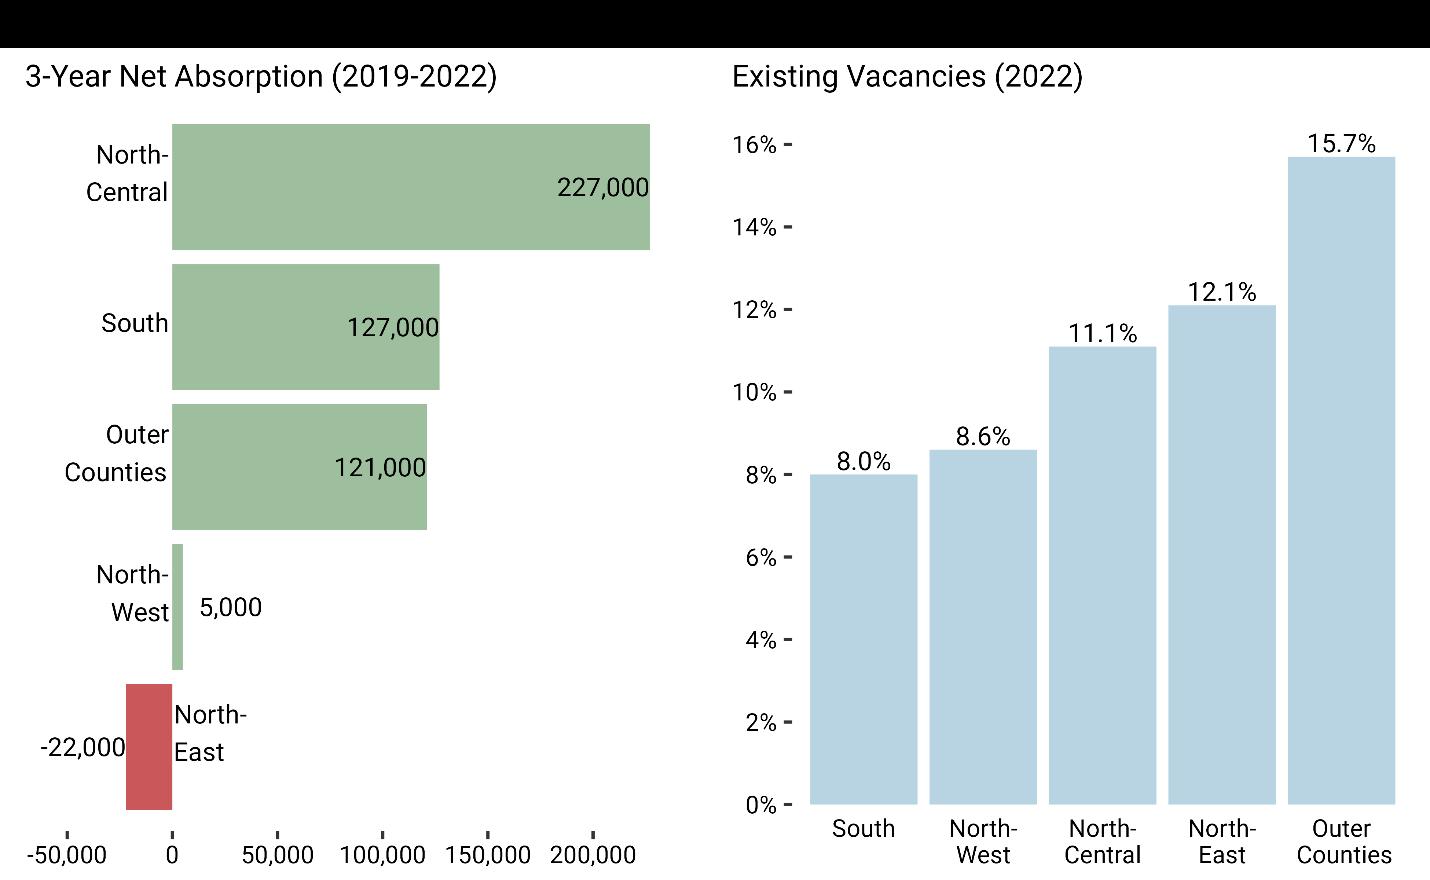
Source: REIS, RKG Associates Inc., 2023
It’s likely that while population growth has been steady, it hasn’t reached a threshold to justify investment beyond current levels. As Cibolo aims to attract more retail investment, including
City of Cibolo, Texas Strategic Economic Development Plan Page | 4-18
Figure 4-12
from well-known brands), growing the population will likely be the most effective approach. The Supply-Demand Analysis in the following section will provide greater insight into the extent that Cibolo can capture additional retail investment.
D) Supply-Demand Analysis
RKG Associates conducted a Supply-Demand Analysis to evaluate the market potential for further retail investment in Cibolo, utilizing data from Environics, a data repository for geospatial modeling. The analysis focused on several key data points for assessing retail supply-demand dynamics:
• Gaps and Surpluses: These represent the difference between the sales generated within a defined market area and the amount spent by local residents. A gap occurs when local sales fall short of resident spending, indicating that residents also shop outside the area. Conversely, a surplus occurs when local sales exceed resident spending.
• Supportable Square Footage (SF): This denotes the additional retail square footage that could be supported based on the identified gap and surplus figures.
• Capturable Square Footage (SF): This reflects the percentage of the supportable square footage that could realistically be attained based on expected demand.
RKG Associates evaluated retail supply-demand balances to assess the viability of future retail investment in key trade areas across the City, classified by drive times (as illustrated in Map 4-7). The drive times illustrated in the map represent first ring drive times, where roughly 70% of consumer demand is typically captured. While not illustrated, second and third ring drive times were calculated in estimating aggregate demand
1. Interstate-35
Compared to other trade areas analyzed in the supply-demand analysis, the Interstate-35 trade area stands out with the largest supply of retail inventory and the highest consumer spending. This is primarily because the trade area overlaps with major retail destinations, attracting residents not only from Cibolo but also from population clusters along the I-35 corridor, such as Selma and Live Oak. This overlap is evident through retail surpluses marked in red across various retail segments. These surpluses may indicate an existing oversupply of stores in these segments, with insufficient demand to justify further investment.
Although gaps were identified in the analysis, suggesting unmet demand, this doesn't provide a complete picture that more investment couldn't take place. For example, full-service restaurants show a sales gap. Without additional context, this might indicate that there's potential for competitively positioning full-service restaurants in the I-35 trade area or accommodating additional supportable square footage. However, considering Capturable Square Foot data and typical drive times for restaurants, it only appears one additional full-service restaurant is viable within the existing marketplace (Table 4-1).
City of Cibolo, Texas Strategic Economic Development Plan Page | 4-19
Map 4-7: First Ring Drive Times

First ring drive time for the Interstate-35 Trade Area utilized a 5-minute drive time catchment area originating from Cibolo Crossing.

First ring drive time for the Downtown Trade Area utilized a 7.5-minute drive time catchment area originating from 110 N Main Street.

First ring drive time for the Interstate-10 Trade Area utilized a 5-minute drive time catchment area originating from 177 Motts
2. Downtown


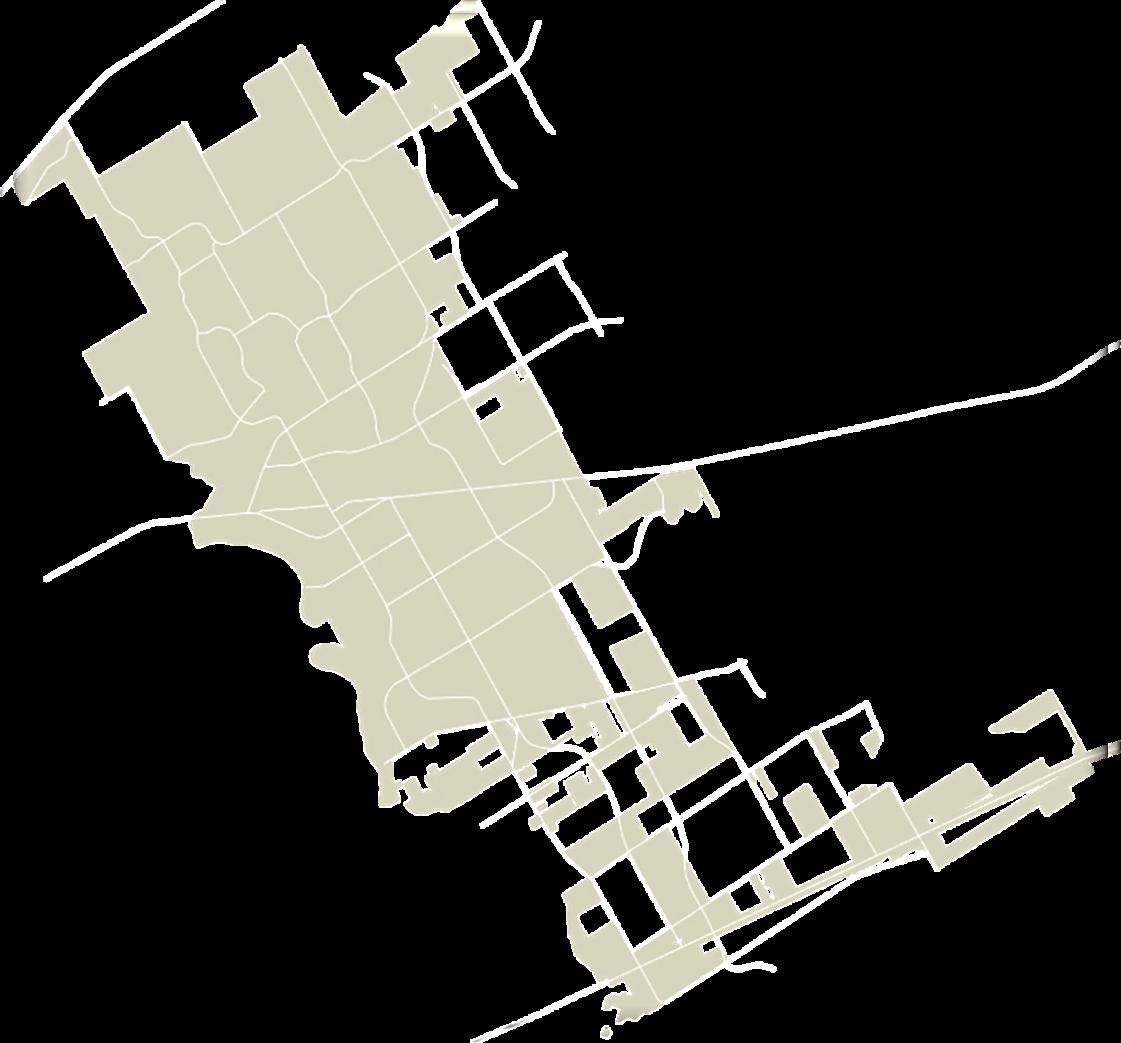
Source: Environics, RKG Associates Inc., 2023


Unlike the Interstate-35 trade area, gaps were present across all retail segments under analysis. Although this points to unmet demand, it isn’t high enough to justify additional square footage. Given that the Downtown market area’s boundaries overlap with an already saturated Interstate35, additional square footage could result in an oversaturated marketplace. Full-service restaurants may be further discentivized given that they would have to compete with several sitdown restaurants already operating within the trade area. This includes new restaurants near FM-78 along with the several restaurants located along Main Street.
3. Interstate 10
The Interstate 10 area is the least likely to support additional retail investment in the short-term. Unmet demand for additional retail space is capturable, but the existing consumer base is not sufficient to justify investment. This is largely due to the lack of people living within a 5-minute drive time, where typically 70% of demand is generated. Meanwhile, drive times over 5 minutes overlap with populated areas. However, most residents living in these populated areas will gravitate towards existing retail destinations that can easily be accessed. For instance, residents living in the red area live close enough to drive to retailers located in Live Oak and Selma.
City of Cibolo, Texas Strategic Economic Development Plan Page | 4-20
Table 4-1 I-35 Corridor Retail Gap Analysis
SEGMENT
Source: Environics, RKG Associates Inc., 2023
Table 4-2
Retail Gap Analysis
Source: Environics, RKG Associates Inc., 2023
City of Cibolo, Texas Strategic Economic Development Plan Page | 4-21
RETAIL
GAP/ (SURPLUS) SUPPORTABLE SF CAPTURABLE SF AVG. STORE SF Department stores $44,511,176 139,221 12,337 100,00-150,000 Building material and supplies dealers ($66,257,947) 47,496 11,222 5,000-10,000 Clothing stores $27,532,401 85,147 8,733 50,000 - 100,000 Full-Service Res taurants $22,094,029 70,949 7,487 5,000-10,000 Other general merchandise stores ($98,233,946) 22,153 4,593 40,000-60,000 Special food services $9,941,277 21,766 4,229 5,000-30,000 Automotive parts, accessories, and tire stores ($44,576,954) 27,297 3,938 15,000-40,000 Electronics and appliance stores ($11,606,407) 4,013 3,007 60,000-80,000 Furniture stores ($2,320,256) 12,645 2,274 20,000-50,000 Limited-Service Restaurants ($92,316,633) 0 0 2,000-10,000 RETAIL SEGMENT GAP/ (SURPLUS) SUPPORTABLE SF CAPTURABLE SF AVG. STORE SF Clothing stores $12,532,463 38,758 8,656 40,000-60,000 Health and personal care stores $24,519,946 47,394 6,383 20,000 - 40,000 Electronics and appliance stores $6,583,748 14,082 2,459 60,000-80,000 Furniture stores $4,897,520 13,689 2,346 20,000 - 50,000 Home furnishings stores $3,531,887 13,256 2,231 20,000 - 50,000 Full-Service Restaurants $17,778,797 32,924 2,192 5,000-10,000 Building material and supplies dealers $10,543,063 20,979 2,119 15,000-40,000 Shoe stores $2,062,734 8,058 1,621 5,000 - 30,000 Jewelry, luggage, and leather goods stores $3,835,345 6,778 1,585 1,000-5,000 Limited Service Restaurants $11,086,316 23,488 706 2,000-10,000
Downtown
Table 4-3 I-10 Corridor Retail Gap Analysis
Source: Environics, RKG Associates Inc., 2023
3. INDUSTRIAL MARKET
San Antonio’s Industrial Market comprises a smaller area than REIS’s defined Office and Retail markets for San Antonio (Map 4-8). As illustrated in Map 4-8, an Outer Counties submarket is non-existent while only a minimal fraction of Comal County and Guadalupe County are considered. This includes the northern half of Cibolo, represented due to the concentration of industrial activities operating within the Schneider Industrial Park. The remainder of the Outer Counties submarket is excluded from REIS’s consideration. Unfortunately, this misrepresents the industrial significance and projected potential for expansions for other close-in areas of the Outer Counties submarket, as further investment beyond Bexar County is projected along the Interstate-35 and Interstate-10 corridors.
City of Cibolo,
Strategic Economic Development Plan Page | 4-22 RETAIL SEGMENT GAP/ (SURPLUS) SUPPORTABLE SF CAPTURABLE SF AVG. STORE SF Clothing stores $20,400,754 63,091 30,129 50,000 - 100,000 Full-Service Restaurants $29,087,949 53,867 17,508 5,000-10,000 Automotive parts, accessories, and tire stores $10,789,657 28,348 11,856 15,000-40,000 Furniture stores $7,948,398 22,216 10,157 20,000-50,000 Sporting goods $7,554,605 22,076 8,801 50,000 - 80,000 Shoe stores $3,844,514 15,018 7,902 5,000 - 30,000 Jewelry, luggage, and leather goods $6,559,839 11,593 5,960 5,000 - 30,000 Special food services $5,288,152 11,578 4,300 5,000 - 30,000 Office supplies, etc. $2,230,463 6,271 2,308 30,000 - 60,000 Limited Service Restaurants $5,958,830 12,625 0 2,000-10,000
Texas
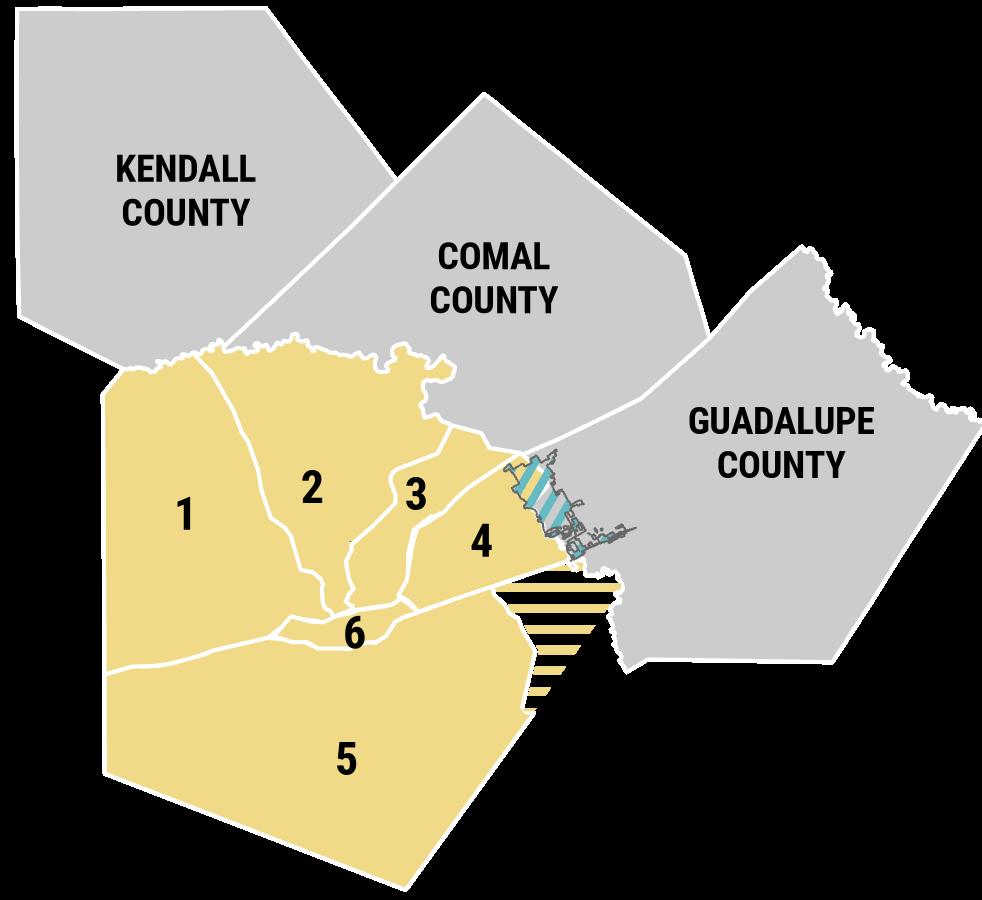
Source: REIS, RKG Associates Inc., 2023
A) Inventory
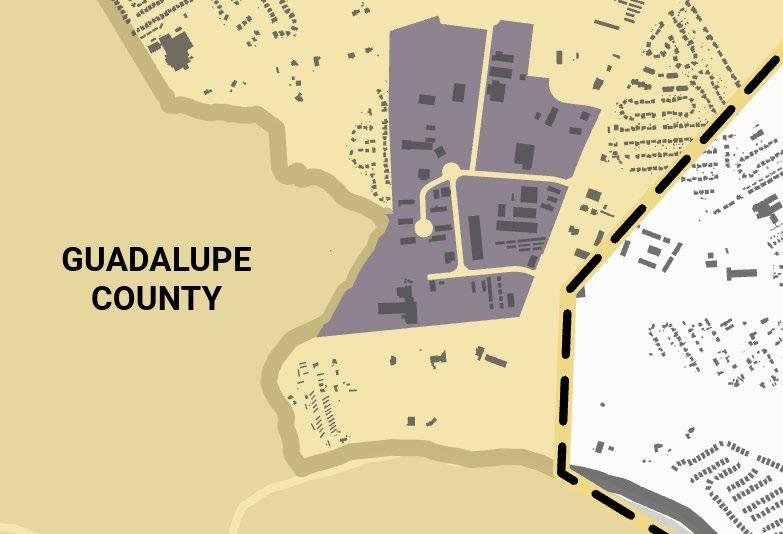
Schneider Industrial Park is included in REIS’s East Submarket in the broader San Antonio Industrial Marketplace.
Substantial inventory expansions occurred in the Northeast, South Bexar, and East Submarket, which includes the City of Cibolo (Figure 4-13). The rapid expansions of industrial inventory reflect developer’s preference for targeting investment near Interstate-35 and Interstate-10. Given the nature of industrial operations, and their corresponding preference to locate operations near Interstates, recent development makes sense. A significant portion of additional inventory has been developed into large-scale mega-warehouses, which can occupy between 100,000 SF to 500,000 SF of space. Such warehouses are integral to towards advancing supply chain operations between the rapidly expanding Austin-San Antonio metroplex
City of Cibolo, Texas Strategic Economic Development Plan Page | 4-23
Cibolo 1 Northwest 3 Northeast 5 South 2 North Central 4 East 6 Central Outer Counties Submarkets
Industrial Marketplace Submarket Boundaries
Map 4-8: San Antonio
B) Vacancies and Absorption Rates
The demand for industrial spaces, driven by factors such as a growing regional consumer base and increased advanced manufacturing operations, outpaced the rate at which new construction is being delivered. Total absorption, representing the square footage leased by industrial users, has exceeded the total construction delivered since 2019, which reinforces this disparity (Figure 4-14).
However, it's worth noting that the absorption data might not fully capture the entire industrial marketplace, as it only considers leased square footage and excludes the ownership market. This means that the actual performance of the total industrial marketplace could be even higher, especially considering major tenants like Amazon and Aisin, who own and operate their own facilities rather than leasing them. These ownershipbased operations add another layer of demand that isn't reflected in the absorption of data alone.
INSIGHTS & IMPLICATIONS
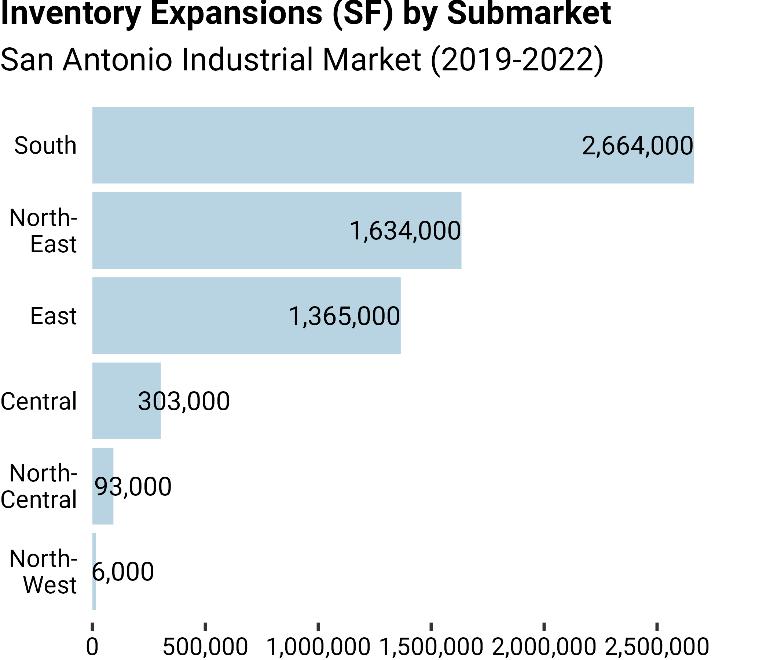
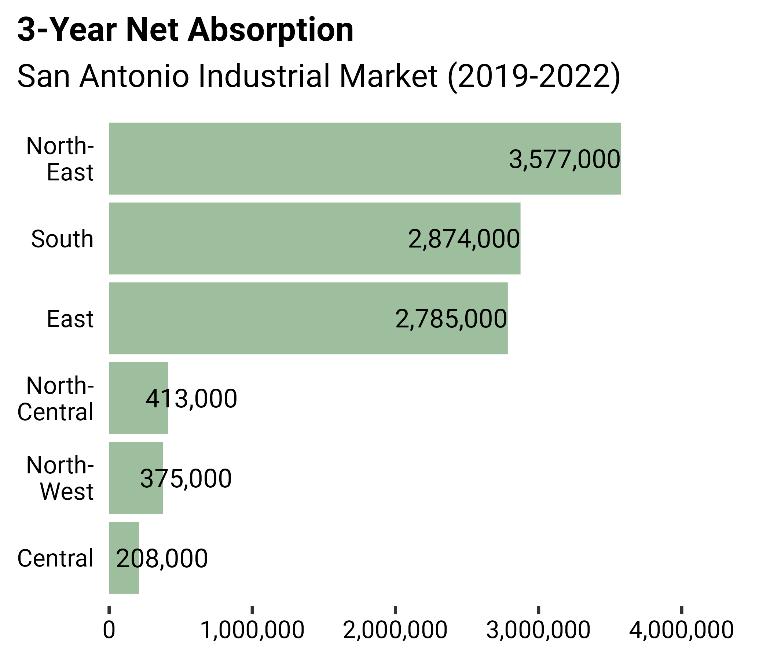
Cibolo has key assets needed to develop into a primary employment center. This includes substantial developable land resources and interstate accessibility, allowing market forces to naturally drive industrial investment. Unlike the organic growth potential in industrial sectors, attracting retail and office investment will require proactive measures and strategic initiatives due to shifting workplace preferences and competitive landscapes.
The City’s retail market appears to be reaching levels of saturation, and further investment may be discouraged given the size of the existing consumer base. Consumer base expansions will be required to attract greater retail investment, which can effectively be achieved through increasing the housing supply.
City of Cibolo, Texas Strategic Economic Development Plan Page | 4-24
Source: REIS, RKG Associates Inc., 2023
Figure 4-14
Source: REIS, RKG Associates Inc., 2023
Figure 4-13
Increasing the housing supply is essential not only for expanding the consumer base but also for accommodating the workforce needed to support Cibolo's growth trajectory. By strategically aligning residential development with retail and office spaces, the City can create vibrant mixeduse environments that attract both residents and businesses.
In conclusion, while Cibolo's natural assets lay a strong foundation for industrial growth, proactive efforts are required to stimulate retail and office investment. By strategically addressing housing supply and fostering a supportive business environment, Cibolo can position itself as a dynamic and attractive destination for diverse economic opportunities.
City
Cibolo,
Strategic Economic Development Plan Page | 4-25
of
Texas
5. TARGET INDUSTRIES ANALYSIS
INTRODUCTION
The Target Industry Analysis chapter expands upon the analyses presented in the previous chapters. Consolidating insights from the socioeconomic and real estate analyses with the findings presented in this chapter effectively identifies industry segments with the greatest potential for job creation Towards the end of this chapter, we delve into specific industry segments that the City of Cibolo should prioritize in their business recruitment efforts. Preceding this discussion will include an examination of the City’s workforce demographics and workplace conditions, as well as any strengths, weaknesses, limitations, and opportunities that could influence business investment.
WORKFORCE ANALYSIS
1. EMPLOYMENT PROJECTIONS
As outlined in Figure 5-1, Guadalupe County’s employment base is anticipated to increase by nearly 10,000 jobs between 2023 and 2033. Notably, the occupational segment with the largest projected employment gains is production occupations, which experienced organic growth due to the county’s inherent advantages interstate access and developable land resources.
Figure 5-1
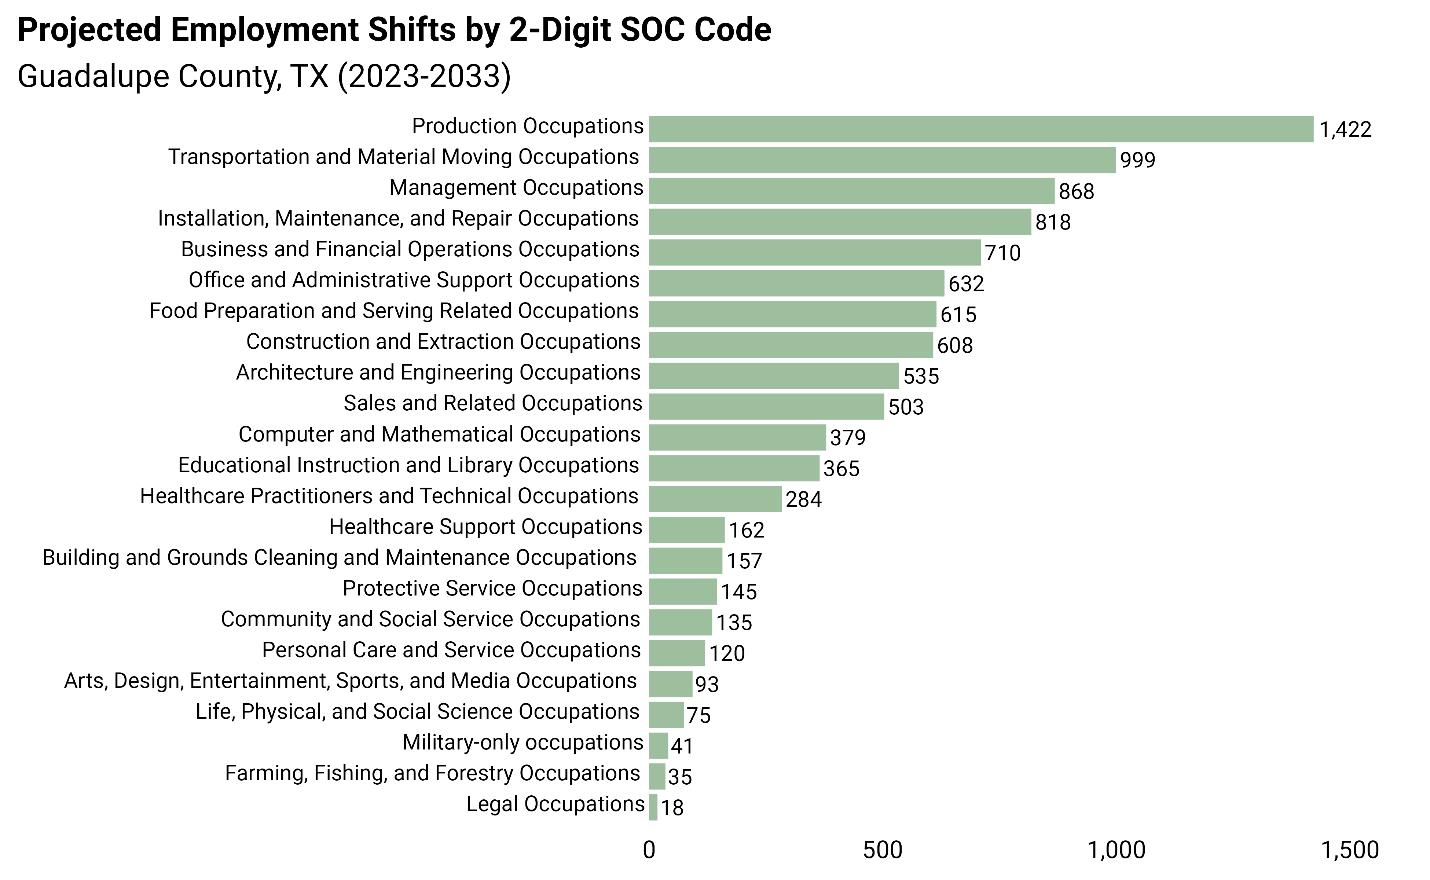
Source: Lightcast, RKG Associates Inc., 2023
City of Cibolo, Texas Strategic Economic Development Plan Page | 5-1
City of Cibolo, Texas
However, ensuring that Guadalupe County’s employment base aligns with these projections across all occupational segments cannot rely solely on market forces. Targeted interventions are essential, not only to attract new businesses but also to retain existing ones. Failing to do so heightens the risk of falling short of the 2033 projections, which is feasible given the complex set of challenges Guadalupe County faces that reduces its competitive edge for business investment. This includes rising affordability challenges and a limited housing inventory that accommodates workers across industry segments.
The City of Cibolo can adopt a comprehensive approach to help meet these projections, directing investments towards workforce development programs, supporting new housing options, and enhancing the built environment. By taking proactive measures, Cibolo can better position itself to meet its employment growth targets and sustain its economic vitality.
2. WORKFORCE DEVELOPMENT
High-skilled white-collar occupations, typically tailored for highly educated or experienced professionals, constitute approximately 30% of Cibolo’s job market (Figure 5-2). While highskilled white-collar professionals constitute the largest share of Cibolo's job market, it's noteworthy that many of these roles diverge from the conventional image associated with whitecollar jobs in industries like technology, healthcare, and professional services. Unlike the stereotypical roles of a lawyer, doctor, or accountant, a significant portion of Cibolo’s high-skilled white-collar roles are represented in education or public administration.

Low-Skilled BlueCollar, 10.1%

Semi-Skilled BlueCollar, 18.4%


Occupational Skills Existing Levels
Cibolo, TX (2023)


High-Skilled WhiteCollar,30.7%

High-Skilled BlueCollar, 1.0%


Low-Skilled White-Collar, 16.5%

Source: Lightcast, RKG Associates Inc., 2023

Semi-Skilled WhiteCollar, 23.3%
Strategic Economic Development Plan Page | 5-2
Figure 5-2: Distribution of Occupation Skillsets
Notably, approximately 40% of the City's high-skilled white-collar occupations are found within the education sector, encompassing roles such as teachers or administrators. While these occupations may not conform to the traditional image of office-based employment, they play a crucial role in shaping the City's economic landscape. Recognizing the significance of these roles is essential for accurately assessing Cibolo's economic composition and identifying avenues for growth and development.
For instance, consider the white-collar occupations represented in the education sector. Many of these positions require essential workforce skills such as writing or deductive reasoning, which are fundamental competencies applicable to roles within other traditional white-collar sectors (Figure 5-3). This highlights the potential for individuals in the education sector to transition their skills to other industries. By acknowledging the transferability of skills among white-collar professionals, the City can tailor strategies that can support and nurture the City’s job market. This could involve initiatives aimed at workforce development programs or entrepreneurship, stimulating investments in areas that capitalize on existing skill sets and contribute to diversifying the City’s economic base.
5-3:
Approximately 40% of high-skilled whitecollar occupation are education based roles, such as Teachers and Educational Administrators. To perform these roles, critical competencies are required, particularly those listed on the right. Such competencies are transferable to several other white-collar industries.

Source: Lightcast, RKG Associates Inc., 2023
Comprehensive workforce development strategies can encompass a range of initiatives designed to equip Guadalupe County’s workforce to meet the demands of local businesses. For instance, consider Production-Based Occupations, such as machinists or fabrication technicians. These roles necessitate specialized skill sets to perform the job requirement fulfilled by businesses (e.g., AISIN, Caterpillar etc.). Access to training programs that offer instruction in these skill sets is
City of Cibolo, Texas Strategic Economic Development Plan Page | 5-3
Public Speaking Complex Problem Solving Writing Program Development
Figure
Transferable Competencies
of Cibolo, Texas
crucial, and fortunately, existing programs now operate in Guadalupe County. Enrollees of Texas State Technical College (TSTC), in New Braunfels, prepare graduates for several manufacturing job opportunities. The City of Cibolo should strongly consider exploring partnerships with TSTC, as a way to leverage resources that can ultimately strengthen labor market conditions for production-based businesses operating in the City.
3. HIGHER EDUCATION OPPORTUNITIES
Table 5-1 outlines the highest average number of job openings and corresponding applicable degrees rewarded within Guadalupe County. Very few degrees are rewarded in general, let alone rewarded for the most abundant job openings in Guadalupe County (Table 5-1).
EDUCATIONAL DEGREE PROGRAM
Source: Lightcast, RKG Associates Inc., 2023
This statistic reflects the lack of post-secondary education institutions in Guadalupe County, as most degrees are rewarded in nearby Bexar County. Consequently, the majority of workforce recruitment efforts are likely to be targeted in Bexar County, where a more robust educational
Strategic Economic Development Plan Page | 5-4
City
DEGREES AWARDED (2022) ANNUAL JOB OPENINGS (2015-2023) Business and Related Support Services 81 2,348 Multi/Interdisciplinary Studies 0 1,502 Engineering-related Technologies/Technicians 0 1,401 Health Professions and Related Programs 126 1,166 Construction Trades 0 935 Liberal Arts and General Studies 0 857 Transportation and Materials Moving 0 718 Agricultural/Animal/Plant/Veterinary Science 0 646 Family and Consumer Sciences/Human Sciences 0 609 Culinary, Entertainment, and Personal Services 14 591 Mechanic and Repair Technologies/Technicians 0 590 Natural Resources and Conservation 0 484 Precision Production 0 406 Education 39 406 Parks, Recreation, Leisure, Fitness, and Kinesiology 35 353
Table 5-1: Top 15 Average Annual Job Openings By Educational Degree Program—Guadalupe County
infrastructure exists. This is especially true for traditional white-collar businesses, which often require a skilled and educated workforce.
This presents significant challenges for Cibolo in attracting business investment, as the City will inevitably compete for graduates and workers with Bexar County. Compounding this challenge is the fact that Bexar County offers a more accommodating environment for businesses to thrive. For example, Cibolo's cost of living structure may be limiting for entry-to-mid-level career professionals, as many individuals in the early stages of their careers may prefer more affordable housing opportunities located in Bexar County. This trend underscores why the majority of investment targets Bexar County, which boasts the necessary physical infrastructure more desirable to modern businesses
4. WORKPLACE PREFERENCES AND WORKFORCE HOUSING
The connection between labor markets and the built environment is becoming increasingly significant in today’s economic development landscape. Workers are demonstrating a growing preference towards living and working in walkable areas nestled within mixed-use activity centers. In response to this trend, businesses are investing in workspaces located within these locations desired by workers as part of their efforts to attract and retain talent. This dynamic between workers and businesses supports why most white-collar employment opportunities remain in the City of San Antonio and are targeting specific areas near The Rim and The Pearl District. Consequently, the ability to provide housing opportunities in tandem with job opportunities supports why most workers live and work within Bexar County. As discussed in previous sections of this report, this differs to Cibolo which lacks sufficient housing opportunities for most workforce segments, let alone white-collar workers.
COMPETITIVENESS INDICATORS
1. BUSINESS DIVERSITY
Relative to the State of Texas, minorities represent a smaller share of business owners than the majority population (Figure 5-4).
Given the increasing emphasis of diverse ownership structures and shifting priorities towards advancing Diversity, Equity, and Inclusion (DEI) objectives, Texas appears to be a favorable location for non-traditional business owners. Although the rates of minority ownership are lower in the MSA relative to the State, Cibolo’s diversifying population can serve as an asset for entrepreneurial development. Given that large proportions of minorities have a Bachelor’s degree or higher, a demographic cohort typically more inclined to jumpstart small businesses, offers a compelling case for the creation of a minority-based entrepreneurial program. Given sufficient access to capital and business development training resources, such a program could empower more minorities to pursue entrepreneurship.
City of Cibolo, Texas Strategic Economic Development Plan Page | 5-5
Figure 5-4: Proportion of Business Owners by Race


Source: ACS Estimates, RKG Associates Inc., 2023
2. PERSONAL FINANCIALS


The early stages of entrepreneurship often rely on personal wealth derived from liquidating assets, such as selling homes, or savings accumulated from employment income. Wealth creation not only facilitates entrepreneurship but also grants greater access to tools and resources that improve residents' quality of life, thereby better preparing them for opportunities in the labor market.
All else being equal, a resident without financial savings faces limited job opportunities and minimal career advancement compared to a wealthier resident with greater savings. While an impoverished resident may deplete most of their financial resources on basic living expenses, a wealthier resident may have more resources to invest in workforce development training programs and participate in career networking events.
Given that 5.4% of Cibolo residents are below the poverty level (Figure 5-5), the City of Cibolo can undertake initiatives that strengthen the financial support
5-5
Cibolo Poverty Rates Selected Areas Throughout Region
Bexar County Guadalupe County*
MSA
Source: ACS Estimates, RKG Associates Inc., 2023 * Excludes Cibolo
City of Cibolo, Texas Strategic Economic Development Plan Page | 5-6
San Antonio-New Braunfels MSA 89.2% White 1.8% Black 8.6% Asian Rest of Texas 82.1% White 14.9% Asian 3.0% Black 1.0% American Indian/Native Alaskan
13.8% 15.1% 10.0% 5.4% 0% 5% 10% 15% 20%
Figure
system for these residents. And ultimately, expand their pool of accessible job opportunities in the long-term as the City accumulates more financial resources. While Cibolo reported a lower proportion of residents below the poverty line compared to Guadalupe County and the wider region, its higher concentration of households with rising income levels enables greater coordination and consolidation of financial resources to assist its own residents who fall below the poverty line.
3. HOUSING AFFORDABILITY
Over the past decade, housing expenses in Cibolo have surged, mainly due to the influx of wealthier households. This trend is especially pronounced in the rental market, where monthly rents spiked by approximately 40% (Figure 5-6). In 2012, 57.1% of renters earned less than $75,000. Today, that figure has decreased to 37.9% of renters earning less than $75,000. The outflow of these low-to-moderate income renters suggests a lack of available housing opportunities tailored to their income bracket. For those that currently reside in Cibolo, nearly 75% spend more than 30% of their monthly income on housing expenses, known as being cost-burdened (Figure 5-7).
Figure 5-7: Cost-Burdened Trends

5-6

Change in Monthly Housing Costs by Tenure
Cibolo, TX (2012-2022)
Households

Households
City
Strategic Economic Development Plan Page | 5-7
of Cibolo, Texas
$1,330 $1,872 $1,665 $2,123 $1,200 $1,400 $1,600 $1,800 $2,000 $2,200 2012 2022
41% Increase 28% Increase
Figure
54% 46% Share of Cost-Burdened and Cost-Unburdened Rental Households Earning $75,000 or Less Source: ACS Estimates, RKG Associates Inc., 2023 24% 76% Share of Cost-Burdened and Cost-Unburdened Rental Households Earning $75,000 or Less 2012 2022 Cost Burdened Cost Unburdened
Source: ACS Estimates, RKG Associates Inc., 2023
Renter
Owner
Without policies that provide sufficient housing opportunities tailored to low-to-moderate income households, more are prone to move elsewhere. This can heighten workforce recruitment challenges for businesses in key industry segments, including retail-services and manufacturing.
4. HEALTHCARE ACCESSIBILITY

Figure 5-8
Expenditures Outside Cibolo, 96.0%
The lack of medical care facilities in Cibolo can reduce the City’s competitiveness for business investment and workforce attraction. A full-service emergency hospital does not operate within Guadalupe County, let alone Cibolo. Consequently, most Cibolo residents are forced to leave the City for healthcare services as an estimated 96% of healthcare expenditures are expended outside the City’s limits (Figure 5-8). The remaining 4% of healthcare expenditures are consumed within medical care facilities operating in Cibolo, which includes small-scale physician’s offices, dental offices, and ambulatory facilities. While Cibolo’s existing population and even its projected population in the short-term are unviable to attract a full-scale emergency hospital, additional expansions of what has operated in Cibolo (e.g., ambulatory facilities) can increase the provision of medical services and therefore enable more investment from businesses
5. EDUCATION
The Schertz-Cibolo-Universal City school district stands out as one of the top 10 performing school districts in the greater San Antonio region. Exceptional school districts like Schertz-CiboloUniversal City are major draws for households, significantly contributing to the expansion of Cibolo's resident base. While Cibolo's strong primary and secondary education system has helped support economic growth, the absence of post-secondary education opportunities poses a challenge in enhancing the skill sets of the City's
Share of Health Expenditures in Cibolo and Outside Cibolo
Source: Lightcast, RKG Associates Inc., 2023
Expenditures In Cibolo, 4.0%
Table 5-2: Schools Rankings, Greater San Antonio
Source: Niche, RKG Associates Inc., 2023
City of Cibolo, Texas Strategic Economic Development Plan Page | 5-8
RANK SCHOOL DISTRICT OVERALL GRADE 1 Basis Texas Charter Schools A+ 2 Alamo Heights A+ 3 Boerne A 4 Randolph Field A 5 Fort Sam Houston A 6 Comal A 7 Northeast A 8 Schertz-Cibolo-Universal City A 9 Medina Valley A10 Lackland A-
workforce. It's crucial that the City take proactive steps in coordinating with accessible postsecondary education institutions, such as the Alamo Colleges and TSTC, to address this gap. Coordinated efforts can help these community colleges design curriculums tailored to meet the demands of local businesses, effectively expanding the job pool for Cibolo residents seeking employment opportunities.
S.W.O.T ANALYSIS
1. SITE SELECTION CRITERIA
No more than 15 years ago, economic development efforts consisted of traditional methods to lure business investment. State and local incentives were prioritized for site selection among businesses. This approach has changed drastically. Today, a community’s availability of skilled labor and qualityof-life assets are considered paramount for attracting businesses. Given Cibolo’s abundance of highly educated residents and appealing quality-of-life assets comparatively cost-effective homeownership opportunities (although this is diminishing as housing prices increase faster than inflation) and high-quality school districts the City can be a competitive location in today’s economic development landscape. Such advantages are crucial for attracting businesses in traditional white-collar industry segments, such as professional services and technology. However, leveraging these advantages may require Cibolo to restructure their built environment. This may be more of a long-term opportunity. Conversely, Cibolo is better suited for production-based industries in the short term. Although, the City must ensure its utility infrastructure is prepared to capitalize on this short-term opportunity.
2. STRENGTHS
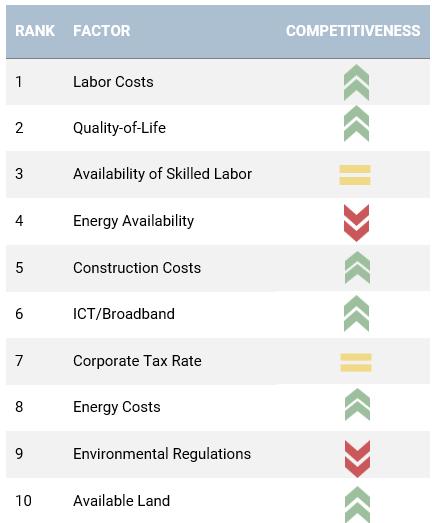
Source: Area Development Magazine, RKG Associates Inc., 2023
Highly Educated Workforce: Roughly 40 percent of residents have attained a bachelor’s degree or higher. The abundance of degree earners can attract business investment, particularly within value-added industries, as businesses often focus investments in areas with a strong base of
City of Cibolo,
Strategic Economic Development Plan Page | 5-9
Texas
Table 5-3: Site Selection Trends
skilled professionals. The higher wages typically commanded by skilled professionals can generate significant economic returns while increasing Cibolo’s spending capacities.
Availability of Land: Cibolo boasts an abundance of developable land, offering ripe opportunities for catalytic investment. Significant opportunities that demonstrate market potential for investment and growth include developing industrial spaces along I-10, such as manufacturing centers and logistics facilities.
Quality of Life Assets: Cibolo boasts cost-effective homeownership opportunities, reputable public schools, and convenient accessibility to nearby employment centers. These assets contributed to Cibolo’s transformation into a population center.
Proximity to Military Installations: Cibolo is near several military installations operating in Bexar County. This includes the Randolph Air Force Base, set adjacent to Cibolo’s municipal boundaries As federally backed installations, military bases provide Cibolo with a stable source of workers and veterans, contributing to the City’s long term economic sustainability.
3. WEAKNESSES
Workforce Housing: The diversity of housing types and price points is limited. Specifically, there is not an abundance of workforce housing units in Cibolo, which can discourage investment in the City’s fastest growing industry segments (e.g., manufacturing, retail-service).
Underperforming Fiscal Assets: Some of the City’s largest and most opportune properties are designated for agriculture uses, generating substantially fewer revenues than all other private land uses.
Business Engagement: While engagement with existing businesses is a current priority, staffing and resources limit the capacity to collect business intelligence to maximize the potential to support additional industry expansion.
Peripheral to San Antonio: The City has primarily formed into a traditional bedroom community for San Antonio. The distance to San Antonio will make it challenging to expand and diversify the City’s economic base beyond residential uses without new development pattern support.
Land availability outside City: Several developers have taken advantage of the reduced taxes outside the City’s boundaries. This is prone to become a more imminent problem given recent legislation (e.g., Senate Bill 2038)
Oversaturated Marketplace: Cibolo is adjacent to major retail destinations, which may discourage additional retail investment within their City limits without substantial new residential and daytime population growth.
City of Cibolo, Texas Strategic Economic Development Plan Page | 5-10
4. OPPORTUNITIES
Emerging Regional Sectors: Transportation (automotive, heavy equipment, aircraft) manufacturing continue to emerge into industry strongholds within the MSA, encouraging expansion opportunities in Cibolo.
Federal Funding Programs: Federal funding into Texas-based semiconductor production (CHIPS Act) can facilitate investments into horizontal supply chain operations within Cibolo.
Healthcare Services: Cibolo’s and Guadalupe County’s growth of seniors and family households increased the demand for medical services. Cibolo’s proximity to Bexar County, a national health care hub, can help expand the supply of medical services.
Coordination and Cooperation: Increasing engagement with key economic development players (e.g., local/regional governments, business organizations, educational institutions, utility providers, etc.) in a forum focused on Cibolo and coordinating efforts to advance the City’s strategic plan.
Entrepreneurial Development: The City’s favorable demographic trends (diversifying population, highly educated residents, abundance of veterans) can promote entrepreneurship opportunities.
Increasing Consumer Demand: Strategic investments in housing and job creation can create the critical mass needed to support retail expansions.
5. THREATS
Resistance to change: Not enough developable land is set aside for industries positioned to generate the highest job and economic returns for the City
Underutilization of Downtown: Cibolo’s historical downtown has a development character that can’t be fabricated, which can appeal to a significant consumer base. Disinvestment and strict regulations can limit its potential.
Insufficient Public Engagement: Economic development requires community buy-in and public investment. Forming a unified vision among community members can help the City capitalize on emerging market opportunities
Lack of cooperation from utility and infrastructure partners: Increasing engagement with key economic development players (e.g., local/regional governments, business organizations, educational institutions, utility providers, etc.) in a forum focused on Cibolo and coordinating efforts to advance the City’s strategic plan.
City of Cibolo, Texas Strategic Economic Development Plan Page | 5-11
BUSINESS RECRUITMENT STRATEGY RECOMMENDATIONS
Business recruitment, attracting business investment to Cibolo, is a primary function of the City’s economic development efforts. A strategic approach towards business recruitment, likely to generate the most immediate returns, is targeting businesses within industries that demonstrate market potential in Cibolo. The selection of such industries is a complex process, not only accounting for several local socioeconomic and real estate trends, but the results generated from a cluster analysis.
Cluster analysis serves as a valuable tool in understanding how different industries perform within the context of Cibolo's market. Industries with higher cluster analysis scores indicate stronger performance within Cibolo's marketplace. These scores are based on three main factors outlined in Figure 5-9: [1] the total number of jobs in the industry (represented by bubble size), [2] the growth rate of industry jobs between 2010 and 2023 (y-axis), and [3] the industry's location quotient (x-axis).
The location quotient (LQ) measures the concentration of industry jobs in Cibolo compared to the San Antonio Metropolitan Statistical Area (MSA). Industries with higher LQs are more specialized in Cibolo, suggesting a concentration of industry-specific skill sets. This specialization can serve as a driving factor in recruitment efforts, as industries tend to thrive and grow more easily in areas where a concentration already exists. Industries with the highest location quotients include Manufacturing (2.54 LQ) as well as Mining & Extraction (12.38 LQ).
5-9
Total Number of Jobs
City of Cibolo, Texas Strategic Economic Development Plan Page | 5-12
Construction Manufacturing Wholesale Trade Retail Trade Transportation /Warehousing Finance & Insurance Professional & Technical Services Admin Support Services Education Health Care Arts & Recreation Accommodation & Food Services Other Services Government -200.0% -150.0% -100.0% -50.0% 0.0% 50.0% 100.0% 150.0% 200.0% 250.0% 300.0% 350.0% 400.0% 450.0% 500.0% 550.0% 0.00 0.50 1.00 1.50 2.00 2.50 3.00 2010 to 2023 Growth Rate Location Quotient
Industry
Clusters
Cibolo, TX (2010-2023)
Figure
Figure 5-9 provides a high-level understanding of specialized industries in Cibolo. Each of these industries is composed of several subindustries, detailed at a more granular level. For instance, Manufacturing composes a diverse mix of subindustries, ranging from food manufacturing to furniture manufacturing. In Cibolo, automotive parts manufacturing subindustry is significant subindustry as several jobs were created following AISIN’s recent investment. Following a deep dive analysis, RKG Associates identified and classified 4 high-level industry categories of which are composed of several subindustries the City of Cibolo should consider pursuing through business recruitment efforts towards in the short-term:
1) Transportation Parts & Components Manufacturing
2) Intermediate Components Manufacturing
3) Acute and Specialty Health Care
4) Entrepreneurial Development
The following sections detail specific business recruitment opportunities included in each of the 4 industry categories which are justified through Cibolo’s assets and evolving socioeconomic trends. Potential limitations are also discussed that could limit the growth of each industry.


Business Recruitment
Clusters


City
Strategic Economic Development Plan Page | 5-13
of Cibolo, Texas
Transportation Parts
Components Manufacturing Intermediate
Manufacturing Entrepreneurial Development Acute and Specialty Health Care
&
Component
1. TRANSPORTATION PARTS & COMPONENTS MANUFACTURING
Transportation Parts & Components Manufacturing encompasses businesses that produce essential parts or components integrated into various transportation vehicles such as automobiles, heavy duty vehicles, and airplanes. In Cibolo, this sector has gained significant traction, notably with the establishment of AISIN, a major parts supplier to Toyota, along Interstate-10. AISIN is just one example of several transportation-related manufacturers investing in Guadalupe County to enhance cost efficiencies and streamline supply chain processes. With major global players such as Continental and Caterpillar also making investments, reflects Guadalupe County’s strategic advantages. This includes interstate accessibility, ample developable land resources, and a skilled labor pool.
Given Cibolo's shared advantages with Guadalupe County, the City is well-positioned to attract further investment from Transportation Parts & Components Manufacturers. Below are a few of the subindustries the City of Cibolo can consider for business recruitment (Table 5-4).
SUBINDUSTRIES
While the region has attracted notable investments in transportation-related manufacturing, there is still ample opportunity for further growth, especially within the Automotive Parts Manufacturing industry. Regionally, this sector consumes the highest dollar amount of imports compared to all other manufacturing industries. Since imports represent products consumed outside the region, there is substantial opportunity for these currently imported products to be manufactured within the region, including places like Cibolo.
The availability of skilled labor is integral for further investment. With thousands of workers in key occupations residing within a 45-minute drive from Cibolo, a robust labor pool is available to facilitate workforce recruitment and leverage the City’s market dynamics for Transportation Parts and Components manufacturing.
City of Cibolo, Texas Strategic Economic Development Plan Page | 5-14
NAICS CODES Motor Vehicle Parts Manufacturing 3363 Aerospace Product Parts and Parts Manufacturing 3364 Engine, Turbine, Power Transmission Equipment Manufacturing 3336 General Freight Trucking 4841 Rail Transportation 4821 Process, Distribution, and Logistics Consulting 5416 Architectural, Engineering, and Related Services 5413 Table 5-4
Transportation Parts & Components Manufacturing:
Leveraging Regional Trade Networks and Resources
MSA imports billions ($) across automotive-related supply chains
The substantial dollar amount imported creates a viable opportunity for business currently operating outside the MSA to invest within the MSA. Cibolo can leverage its competitive assets to attract investment across sectors such as Motor Vehicles Parts Manufacturing as well as Engine, Turbine, and Transmission Manufacturing.
Large Import Flows

Share (%) of supply chain imported from outside region.


Robust regional labor resources.
The blue shading in the map to the right illustrates a 45minute drive time from the City of Cibolo. Within this catchment area includes thousands of workers employed in production-based roles, equipped with the skills needed for transportation parts & components manufacturers. The abundance of labor working in this drive-time is a major factor for attracting business investment.

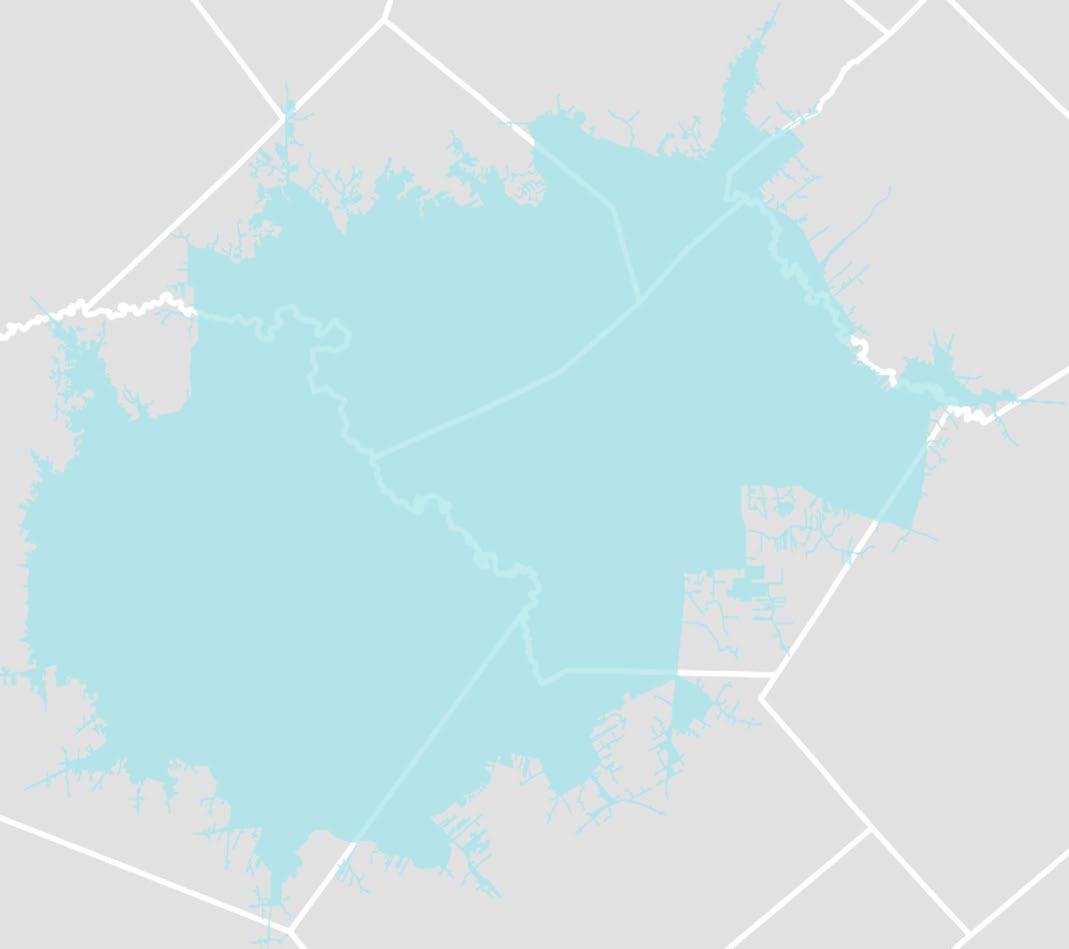
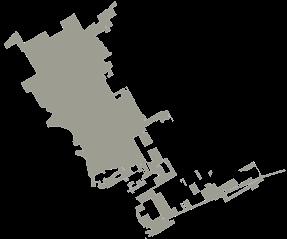


Thousands of workers in production-based roles within 45-minute drive time from Cibolo, including technicians, mechanics, and engineers.

Comal County Bexar County Guadalupe County Engine, Turbine, Transmission Manufacturing $128.61 Million 53% Imports & Exports Motor Vehicle Parts Manufacturing Imports & Exports 61% $2.24 Billion Motor Vehicle Parts Wholesalers $662.36 Million 64% Imports & Exports $141.39 Million 87% Imports & Exports Motor Vehicle Body Manufacturing
Amount Imported ($) Exports Imports
Cibolo’s investment potential for Transportation Parts and Components Manufacturing cannot rely solely on market forces. It is situated alongside several communities throughout the region that boast similar marketable assets, including developable land, interstate accessibility, and a robust labor pool. Consequently, these communities are equally competitively positioned to attract investment like Cibolo.
The City of Cibolo can gain a competitive advantage by offering diverse living opportunities that accommodate workers across various income levels within the Transportation Parts and Components Manufacturing industry. Providing workforce options can be designed to be affordable for critical occupations employed within the industry-- (e.g., miscellaneous assemblers and manufacturers, machinists, etc.) By addressing the housing needs of workers at different income levels, Cibolo can attract a talented and diverse workforce to support the growth of the Transportation Parts and Components Manufacturing industry.
2. ACUTE AND SPECIALITY HEALTH CARE
The San Antonio-New Braunfels MSA is home to nationally recognized healthcare systems, primarily concentrated in Bexar County. With the close proximity of these medical facilities to residents living in Guadalupe County, many county residents have easy access to key healthcare services in Bexar County. Convenient access to Bexar County medical facilities has limited healthcare investment in Guadalupe County, including areas like Schertz and Cibolo. Additional investment may be discouraged to avoid oversaturating the marketplace. However, there are still opportunities in Cibolo, albeit on a smaller scale. These opportunities include satellite emergency clinics and private physician offices.
Table 5-5
City
Strategic Economic Development Plan Page | 5-16
of Cibolo, Texas
SUBINDUSTRIES NAICS CODES Offices of Physicians 6212 Outpatient Care Centers 6214 Individual and Family Services 6241 Skilled Nursing Facilities 6231 Assisted Living Facilities for the Elderly 6233 Home Health Care Services 6216 Mental Health Practitioners 6213
Acute & Specialty Health Care:
Localizing unmet demand
Increasing sources of demand justify investments in medical facilities.
Several demographic cohorts represent a larger share of Cibolo’s population, which will stimulate shifts in demand.
Aged 55 and
Larger Shares
of key demographic cohorts most likely to fuel upward shifts in demand
Most additional medical services can be delivered within the short-term basis.
Most medical services are consumed outside the City of Cibolo. Excluding expenditures incurred at a full-scale medical hospital, like nearby Methodist Hospital in Bexar County, medical industry segments with the largest dollar amount of expenditures incurred outside Cibolo include Office of Physicians, Outpatient Care Centers, Individual and Family Services, and Skilled Nursing facilities. Pursuing investments within these industry segments can help meet unmet demand.
Large Unmet Demand Significant shares (%) of medical expenses spent outside Cibolo.
Spent outside Cibolo
Spent inside Cibolo
Share of expenses in vs. outside Cibolo
Residents
Older Households Earning $100,000+ 465 1,365 2012 2021 Residents with Ambulatory Difficulty 1,214 2,685 2011 2021 1594 5573 2011 2021 Households with Children Under 18 2,335 4,695 2011 2021
Skilled Nursing Facilities Offices of Physicians 94% $81.64 Million Outpatient Care Centers $35.36 Million 95% Share of expenses in vs. outside Cibolo $30.93 Million 98% Individual and Family Services
Demand ($) Met Outside Cibolo Share of expenses in vs. outside Cibolo 99% Share of expenses in vs. outside Cibolo $21.71 Million
Cibolo's aging population, expanding household base, and increasing income levels are critical socioeconomic factors that justify additional investment in the healthcare sector. The unmet demand for healthcare services is evident through substantial medical expenditures incurred outside the City limits across various industry segments.
Although Cibolo's current population may not be large enough to support investment in a comprehensive medical hospital, there is potential for growth in the healthcare sector. This growth opportunity lies in the development of more specialized and smaller-scale healthcare facilities that cater to the needs of the local community. By focusing on specialized services and smaller-scale facilities, Cibolo can meet the healthcare demands of its residents while fostering economic development within the City
3. INTERMEDIATE COMPONENT MANUFACTURING
Intermediate component manufacturers are industrial operations that produce components or parts that are essential for the production or functioning of a final product. These components may not be the finished product themselves but are crucial in facilitating the production process or enhancing the performance of the end product for the user. Examples of intermediate components include specialized parts for machinery, electronic components for devices, or raw materials for further processing in manufacturing. These manufacturers play a vital role in the supply chain by providing essential components that enable the production of a wide range of goods for end-users.
Table 5-6
SUBINDUSTRIES
NAICS CODES
Construction and Mining Machinery Manufacturing 3331
Industrial Machinery Manufacturing 3332
Wood Product Manufacturing 3212, 3219
Nonferrous Metal Production and Processing 3314
Plastics Product Manufacturing 3261
Process, Distribution, and Logistics Consulting 5416
Architectural, Engineering, and Related Services 5413
City of Cibolo, Texas Strategic Economic Development Plan Page | 5-18
Intermediate Component Manufacturing:
Coordination and Cooperation with Guadalupe County
Guadalupe County absorbed considerable employment expansions between 2010 and 2023. A greater abundance of labor increases Cibolo’s competitive edge for attracting business investment. Workers employed in industrial hotspots like Seguin, will consider employment opportunities in Cibolo if business investment were to materialize.
Architectural and Structural Metals Manufacturing
Veneer, Plywood, Engineered Wood Product Manufacturing
Key Industries that observed positive job growth among intermediate component manufacturers.
General Purpose Machinery Manufacturing
Other Fabricated Metal Manufacturing
Other Wood Product Manufacturing
Nonferrous Metal Processing
Industrial Machinery Manufacturing
Plastics Product Manufacturing
The rapid pace of technological innovation leads to shifts in demand for new labor skills. Continuous updates to production processes and machinery on a macroscale prompts demand for new skillsets. Such innovations were a primary justifier for the recent creation of advanced manufacturing training programs at Texas State Technical College (TSTC) in New Braunfels. The creation of training programs can be an effective approach towards ensuring the labor supply is readily prepared to meet the changing expectations among employment opportunities. To this point, Cibolo must consider cooperating with TSTC, allowing citybased businesses to be on the cutting edge of technological innovations.


344 New Jobs 265 New Jobs 251 New Jobs 245 New Jobs 212 New Jobs 172 New Jobs 168 New Jobs 119 New Jobs
Candidate Employer Workforce Development Skills and Competencies Networking Ready for Workforce
4. ENTREPRENUERIAL DEVELOPMENT
Entrepreneurship has been on the rise in the City of Cibolo over the past few years, particularly in the service-based sector, with businesses like Ernie’s Patio Bar and the Rooted Fork emerging in Cibolo’s historical downtown. These businesses have capitalized on the City’s expanding consumer base and have grown locally.
However, it's important to note that entrepreneurship in Cibolo has largely developed without direct assistance from the City, as there is currently no entrepreneurial development program in place. Establishing localized small business development services could foster even more entrepreneurship and lead to increased job growth in the City
Table 5-7
SUBINDUSTRIES
Specialty Food and Beverage Manufacturing 3114, 3121
Management, Scientific, and Technical Consulting Services 5416
Specialized Design and Computer Systems Design Services 5414, 5415
To support entrepreneurship effectively, the City of Cibolo should consider leveraging resources with the Small Business Development Center (SBDC). By partnering with organizations that specialize in entrepreneurial support and development, the City can provide aspiring entrepreneurs with the necessary resources, guidance, and mentorship to help them succeed
Furthermore, the City can capitalize on key demographic trends to expedite entrepreneurship. This includes tapping into the growing minority population in Cibolo, as well as leveraging the presence of highly educated residents who may have innovative business ideas. By fostering an environment that encourages and supports entrepreneurship, the City of Cibolo can further stimulate economic growth and vitality within the community.
City of Cibolo, Texas Strategic Economic Development Plan Page | 5-20
NAICS
CODES
Personal Care Services 8121 Data Processing, Hosting, and Related Services 5182 Accounting, Tax Preparation, Bookkeeping 5412 Architectural, Engineering, and Related Services 5413
Entrepreneurial Development:
Bridging gaps to empower home grown ventures.
A larger representation of Cibolo’s population includes demographic cohorts with traditionally high levels of entrepreneurial spirit. This includes increases in the City’s diversity levels, veterans, and educational attainment levels.
Increased Diversity

Increasing diversity levels offer opportunities to minority-based entrepreneurial program.
Veteran Owned
Veterans can access exclusive financial incentives and contract-bid advantages.
Increasing Education

Those with higher educational attainment levels are more inclined to develop businesses among industries that command high wages (e.g., Tech, Healthcare)
Facilitating entrepreneurial ventures will require financial and technical guidance. In the region, pursuing entrepreneurship has been supported through costly tools and resources. For instance, most entrepreneurships have been financed through personal/family assets and assisted through legal/professional providers. Expanding the range of entrepreneurial ventures will require the creation of an entrepreneurial program with dedicated funding streams and technical advisors for those that lack access to such tools and resources.
Entrepreneurial Businesses By Financing Approach San Antonio-New Braunfels MSA (2016)
Antonio-New Braunfels MSA (2016)
22.18% 18.55% 47.78% 10.12% 65.74% 10.48% 12.61% 3.09% 7.20% 0% 20% 40% 60% 80% 100% Family Friends Professional Colleagues Employees Legal/Professional Advisors Customers Suppliers Government-Supported Entities Other Source Entrepreneurial
San
68.50% 2.59% 16.76% 3.57% 4.55% 0.70% 0.17% 3.16% 0% 20% 40% 60% 80% 100% Personal/Family Assets Home Equity Loan Personal/Business Credit Cards Government Loan Personal Loan Venture Capital Grants Other
Businesses By Source of Assistance
6. OPPORTUNITY SITE ANALYSIS
INTRODUCTION & METHODOLOGY
As part of this effort, RKG Associates worked with City staff and the Economic Development Corporation (EDC) board of directors to understand specific economic development opportunity sites within Cibolo. The analysis focused on identifying the economic activity centers within Cibolo (within the city limits of Cibolo, specifically), and then assessing if there are any parcels or collection of parcels that currently have a competitive advantage to catalyze new investment or bolster the economic potential of that area.
The first step was to determine the existing economic activity centers in Cibolo. RKG, city staff, and the EDC board analyzed properties in Cibolo to evaluate those areas that contain high concentrations of commercial activity, appropriate infrastructure and transportation capacity, and geographic proximity to local and regional consumer bases. Multiple areas were identified, with each area being defined to best reflect current and projected boundaries to accommodate non-residential and mixed-use development, infill development, adaptive reuse, or redevelopment.
The next step was to identify properties within each economic activity center that demonstrate the potential to attract and sustain business investment consistent with the vision for that area and can serve as a catalyst to advance the City’s goal to attract and retain business. Several physical, spatial, and political factors were considered to determine the properties with the greatest investment potential:
Parcel Size – The size of the parcel determines the scale of the development opportunity. Larger parcels can more easily accommodate infill or redevelopment. To this point, larger parcels were weighted higher as potential investment sites.
Vacancies – Undeveloped parcels are easier to develop than built properties requiring infill investment, adaptive reuse of existing structures, or redevelopment through demolition. Simply put, the cost structure of developing vacant land is lower. To this point, vacant parcels scored higher than built parcels.
Agricultural Uses – Agricultural uses constitute a large proportion of developable land in Cibolo and can be a barrier to development as property owners may be reluctant to sell their land. Land allocated for agricultural use was assessed individually to understand the current and future use of the property. Sites where agricultural use is determined to be temporary or transitional (e.g., a single farm animal on a pasture) were scored higher than those with active, intense agricultural uses (e.g., active ranches or fields).
City of Cibolo, Texas Strategic Economic Development Plan Page | 6-1
Environmental Constraints – Several floodplains extend north to south throughout the City, limiting opportunities that are impacted by the floodplain. Flooding challenges are well known in Cibolo and throughout Texas. Properties impacted by floodplain or other environmental constraints were scored lower than those unencumbered by such issues.
Land Uses – Incompatible land uses given the context of the overall commercial corridor were considered for infill development or redevelopment opportunities (e.g., trailer parks in commercial areas). In other words, parcels that are underutilized (from a density perspective) or inconsistent with the defined vision scored higher than similar properties with development.
City Priority Areas – Specific economic activity areas containing properties that have generated interest and proposals from the development community (e.g., Cibolo Crossing at I-35). Staff and the EDC board identified specific areas of particular interest for economic development investment, which were incorporated in the opportunity site analysis.
Underutilized Properties – For the purposes of this assessment, properties in economic activity centers with Floor Area Ratios (FAR) below 0.25 are considered underutilized. Increasing the densities of properties in walkable, mixed-use economic activity center can build upon its success and strengthen the City’s potential to attract greater investment.
Employment Patterns and Daytime Population – Properties near concentrated employment clusters, especially in proximity to facilities that relate to the City’s identified target industries (production-based industries) were scored higher than those more isolated or further away from these locations.
The result of this effort is detailed in Map 6-1. As seen, a total of six economic activity centers were identified for further analysis. It is important to note that these areas (listed below) reflect those locations with the greatest current, or short-term (less than five years) opportunity for economic development investment and coordinate with the City’s comprehensive plan. That said, other areas also have economic activity potential that could be considered as the city’s development patterns evolve and/or local community priorities shift.
I-35 Corridor
1103 Crossing
FM-78 East
FM-78 West
Downtown
I-10 Corridor
City of Cibolo, Texas Strategic Economic Development Plan Page | 6-2
of Cibolo, Texas
Source:
I-35 Corridor
The Interstate-35 economic activity center consists of properties with the most direct access to Interstate-35 within the City of Cibolo. Cibolo Crossing, a major retail development consisting of regional anchors including the Santikos Movie Theater, occupies the City’s entire frontage along I-35. The west side of the study area consists of substantial land acreage, offering development opportunities that can capitalize on the proximity to the interstate without having direct access or visibility. The study area is considered Cibolo’s most viable opportunity to create a vibrant economic stronghold that acts as a regional attraction in the short-term.
SHORT TERM STRATEGIES
I35: 1, Intensive
Infill Development
Cibolo Crossing is a catalytic development within Cibolo. The property already has attracted regional businesses and has the capacity for additional development. It is RKG Associates’
City
Strategic Economic Development Plan Page | 6-3
Map 6-1: Cibolo Economic activity Areas
City of Cibolo, Working Group, RKG Associates Inc., 2023
understanding that the current owner has phased development plans for the undeveloped parcels along I-35 and the parcels across Ripps Kreusler Road. That said, the City should engage with the owner to ensure buildout at Cibolo Crossing maximizes the economic development potential for the community. Simply put, this site is the City’s best short-term economic development asset. RKG encourages the City to collaborate with the owner to build out Cibolo Crossing with high concentrations of vertical mixed-use buildings, reflecting a robust live-work-play activity center.
Vertical mixed-use buildings should be designed to accommodate substantial new housing units, supported by ground-floor retail to foster a vibrant street life. This walkable development pattern will also encourage professional office opportunities, bringing a more diverse job market to Cibolo. Without the strong live-work-play concept, attracting new office space in this area will be more challenging. Additionally, this intensive strategy is essential for generating the necessary population density to drive consumer demand, stimulating further investment in restaurants and retail outlets.
MID TERM STRATEGIES
I35:
2, Scaled Development Approach
Given Cibolo’s limited availability of assets with access to I-35, it’s paramount to maximize the economic potential of these remaining vacant parcels. These parcels located along 1103 are ideally suited for a town-center style development, designed to infuse energy into the area without sacrificing the community’s character. To this point, RKG Associates highly recommends these parcels be developed through a scaled-down approach. This involves concentrating the highest density development along the frontage of 1103 while decreasing the development density moving away from 1103. Configured within these decreasing densities would include transitional housing types, such as townhomes and missing middle housing typologies (e.g., duplexes, triplexes, cottage homes…).
The depth of these parcels from 1103 enable this scaled approach to development. A design concept would entail 5-6 story mixed-use buildings fronting 1103 with ground floor commercial (and potentially second floor office) with medium density residential behind these buildings and scaling back to patio homes or cottage-style single family homes as you get closer to the Warbler Woods Bird Sanctuary. The intent of this approach is to maximize the commercial opportunities for Cibolo (retail/service, job creation) in a manner that is supported through better walkability and increased market demand. This concept also diversifies the city’s housing supply with a range of ownership (cottage homes, townhouses) and rental properties that can appeal to a variety of senior and working-aged households.
City of Cibolo, Texas Strategic Economic Development Plan Page | 6-4
LONG TERM STRATEGIES
I35: 3, Design corridors, not islands
Just south of the I35: 2 opportunity site are several vacant parcels delineated for single-use commercial frontage. This form of commercial development is prototypical in Cibolo, especially as isolated convenience retail strip centers on the outskirts of subdivisions. While single-use commercial frontage may generate tax revenues, its isolation and lack of pedestrian accessibility limit its economic potential. Embracing pedestrian-scale development could unlock far greater economic benefits, attracting diverse businesses and fostering job creation
RKG Associates recommend the development of 1-2 story liner buildings along the 'I-35: 2' opportunity site, offering continuous street frontage. Parking would be located at the rear of each building, with front entrances oriented towards the sidewalk. These buildings could accommodate a variety of economically beneficial uses, including small-scale professional offices, medical spaces, and active retail such as gyms and cafes. This approach not only maximizes the use of space but also fosters pedestrian-friendly environments conducive to economic activity and community engagement.
I35: 4, Market Demand Designed for Walkability
This opportunity site is intended to strengthen the market support for both Cibolo Crossing and the I35: 2 and I35: 3 opportunity sites. The amount of commercial development potential in these three locations is greater than the current market can support. Opportunity site 4 offers an opportunity to continue to diversify the city’s ownership housing supply while creating additional demand for commercial services and growing the city’s workforce.
The concept for this area is to continue offering diverse ownership housing opportunities, integrating cottage homes with townhomes and traditional single family homes with a design that creates non-motorized trails that connect directly to Cibolo Crossing and the I35: 2 development sites. Creating greater walkability and bicycle connections to the two work/shopping hubs in north Cibolo will create an asset unique outside of the 1604 Loop. Given the national trend of businesses seeking highly amenitized live-work-play destinations combined with Cibolo’s relative affordability to other communities with these assets, it is highly likely that Cibolo will have a competitive advantage in attracting more commercial investment under these development conditions.
City of Cibolo, Texas Strategic Economic Development Plan Page | 6-5
City of Cibolo, Texas
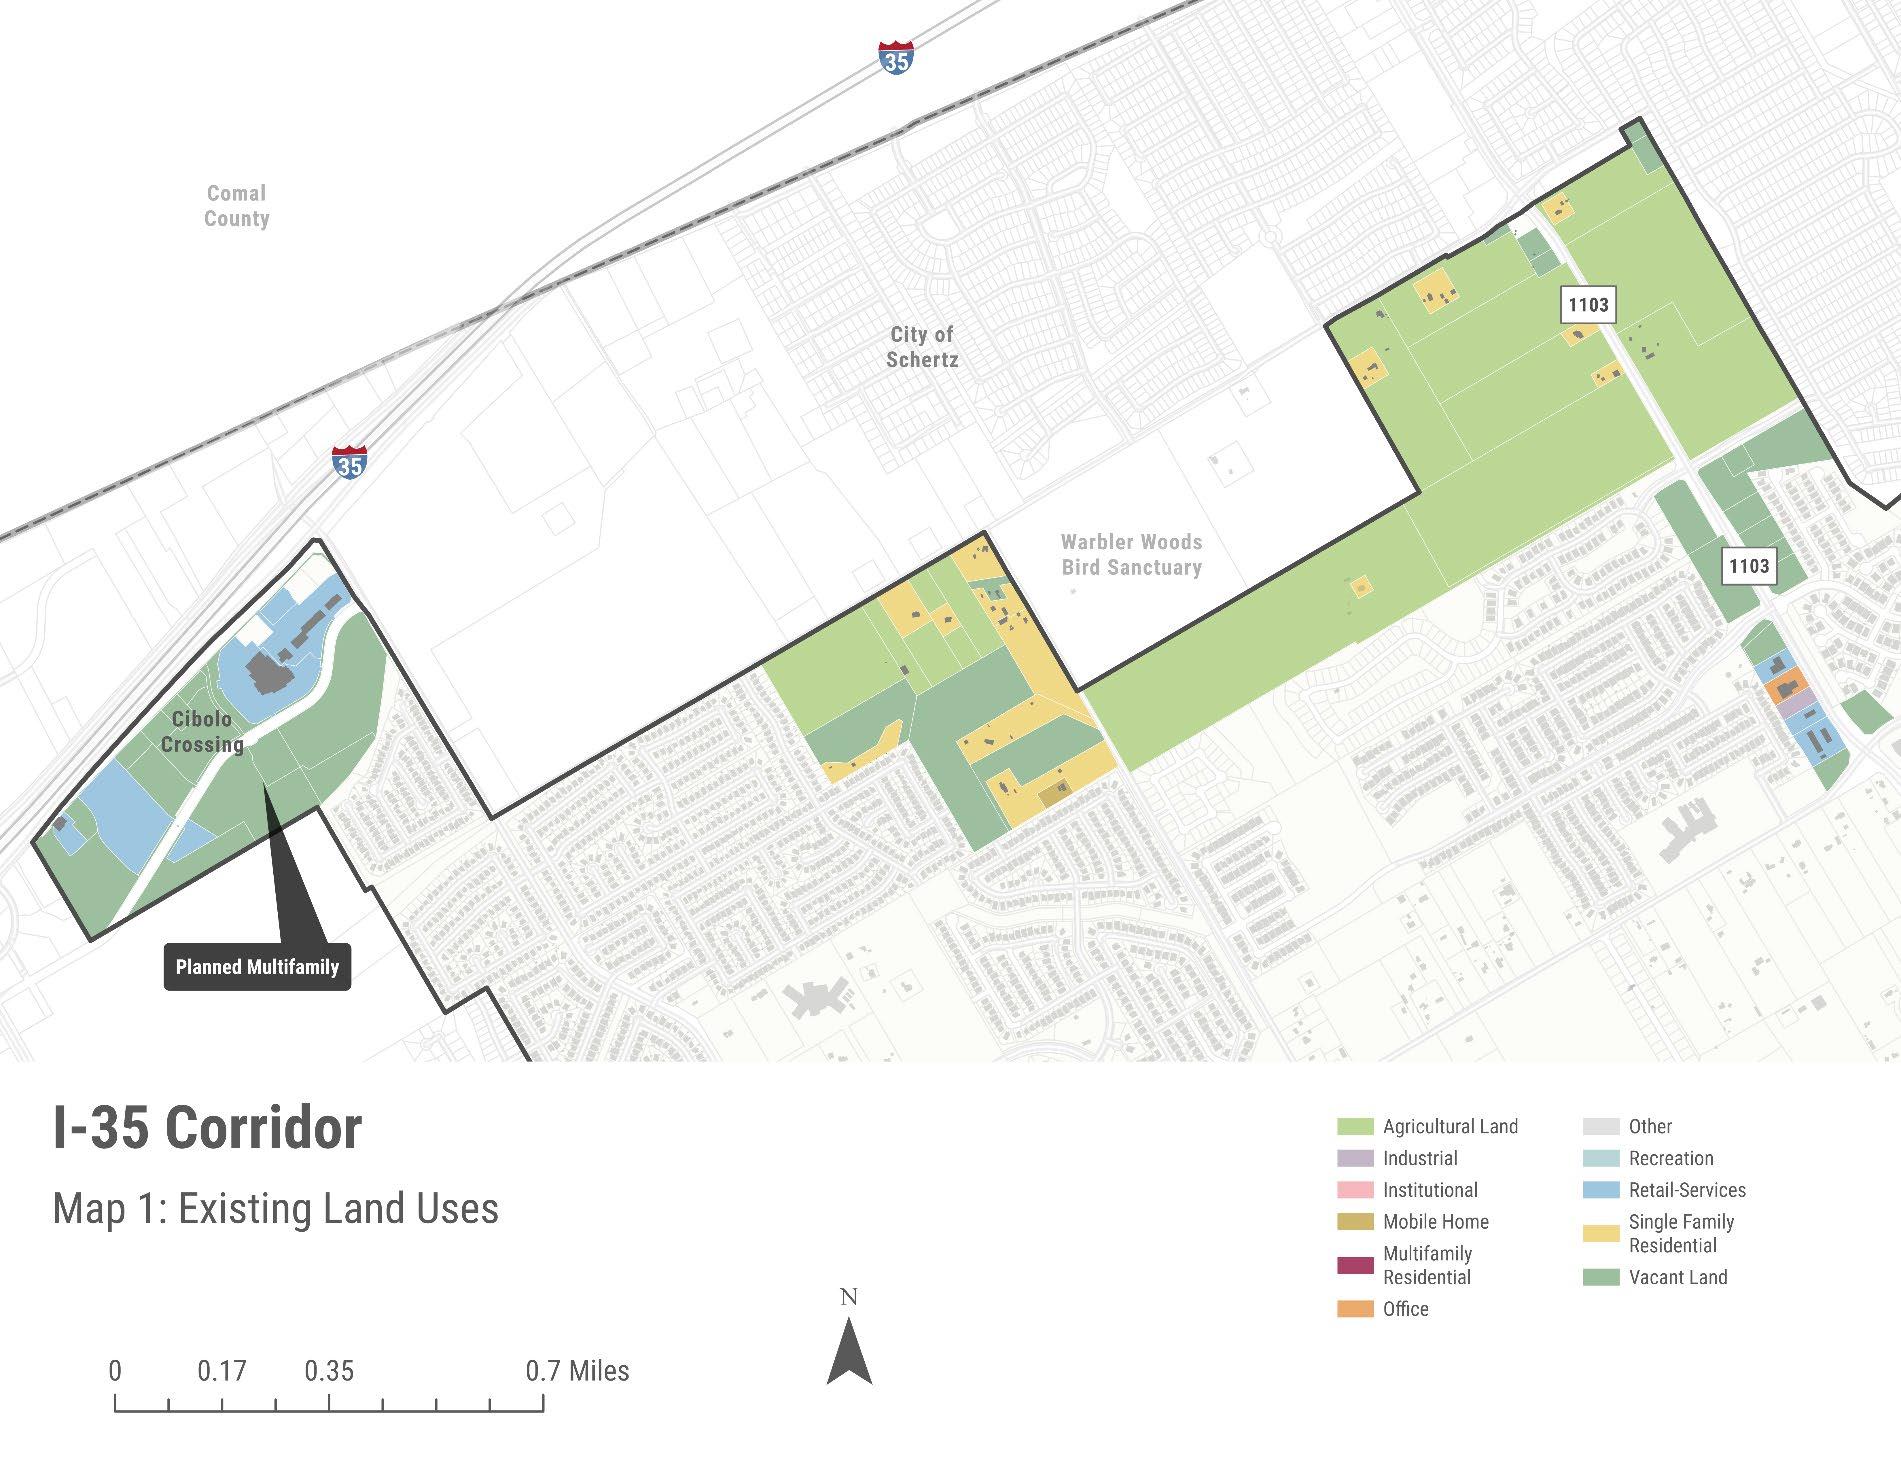
Page | 6-6
Strategic Economic Development Plan
City of Cibolo, Texas
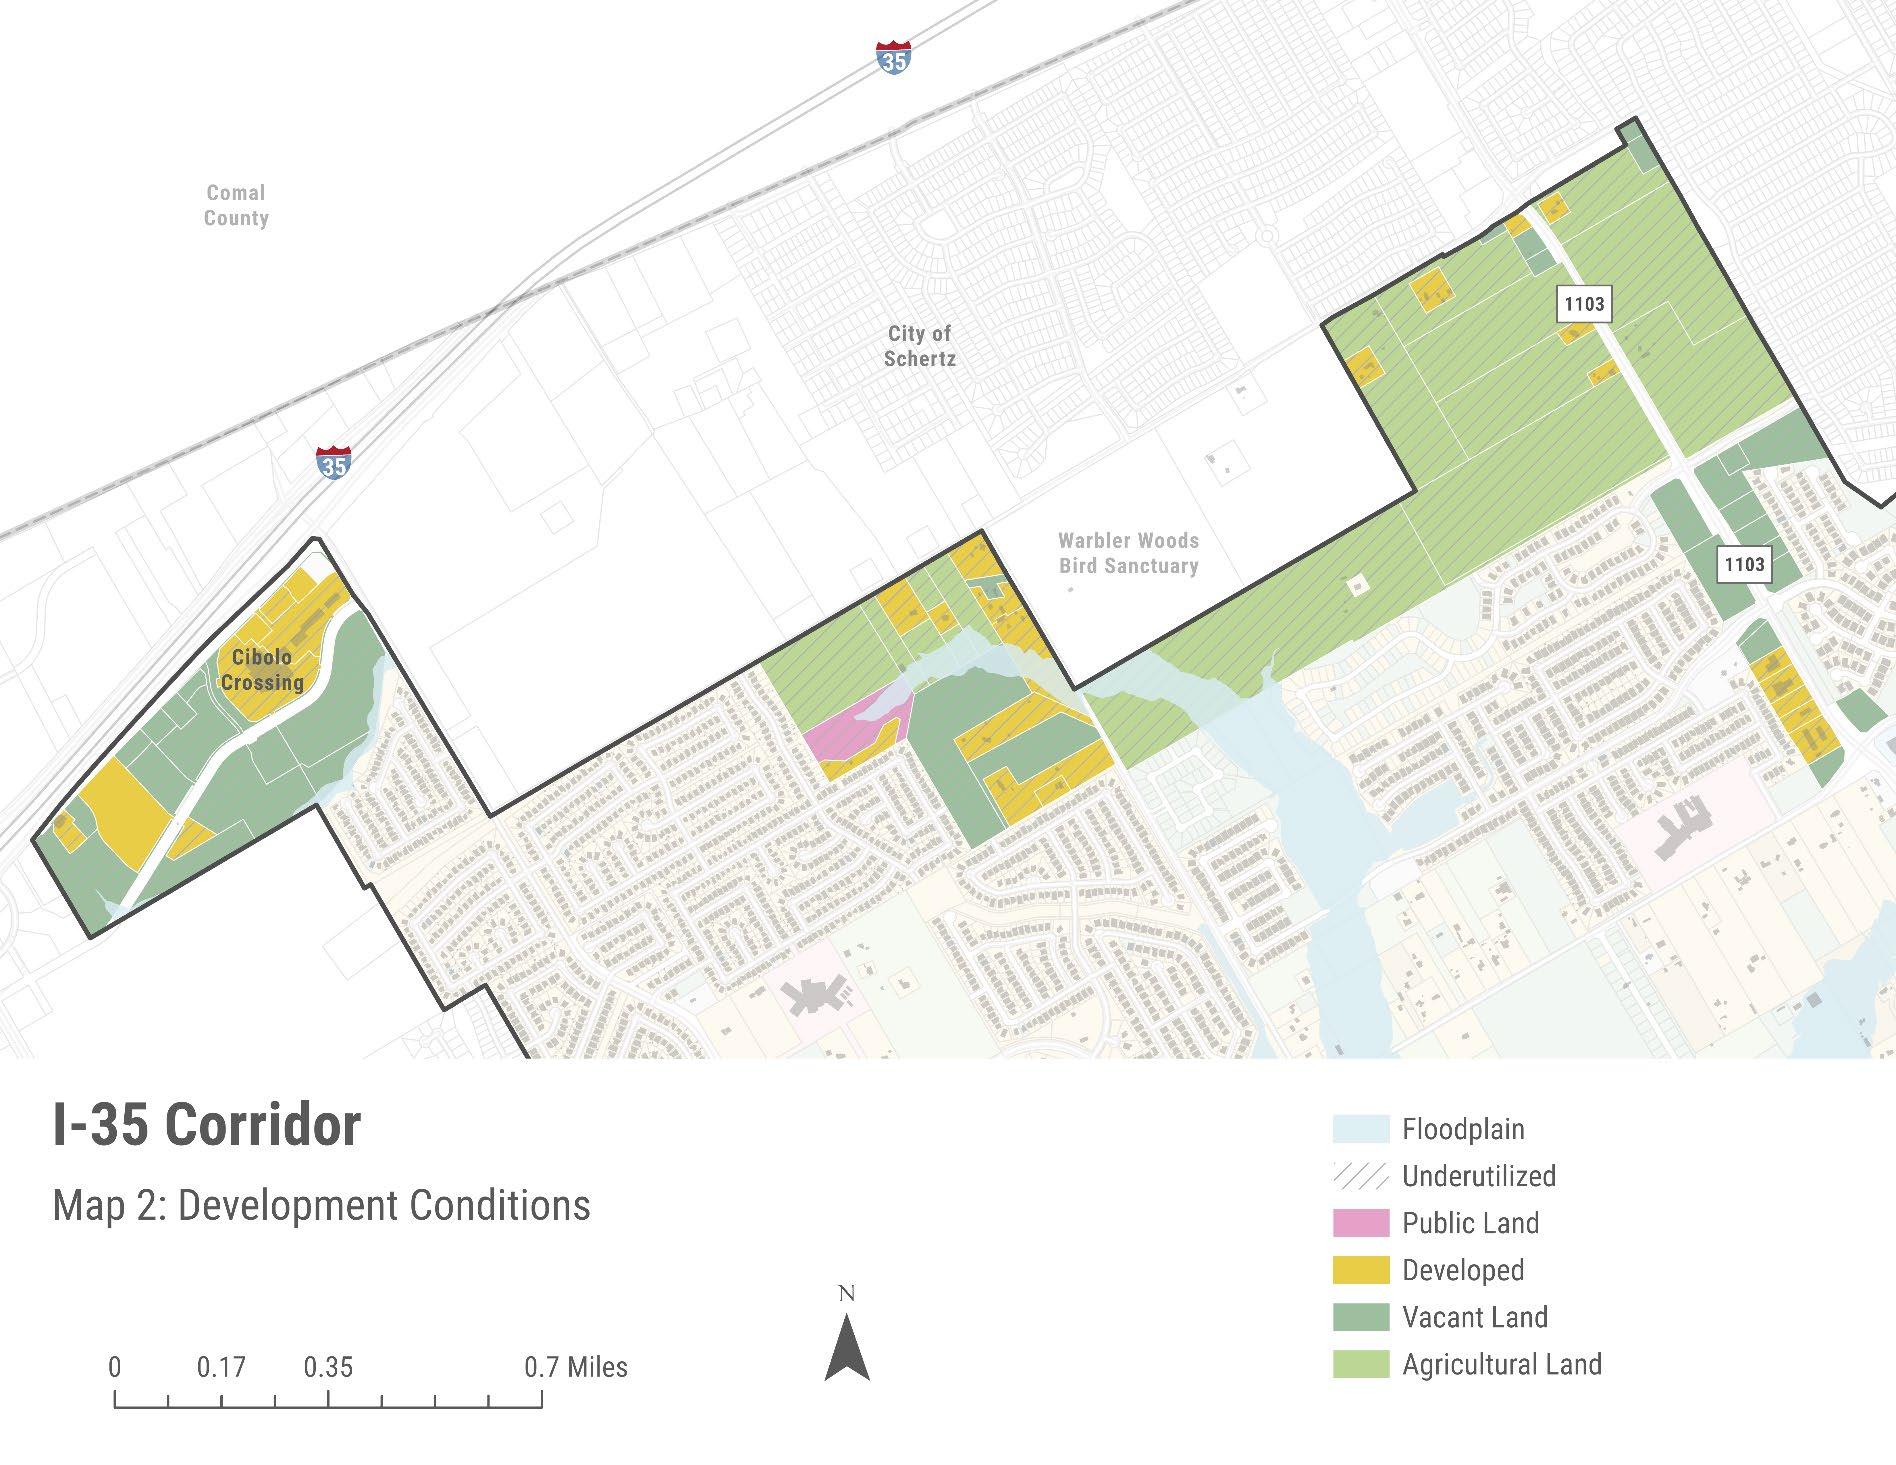
Page | 6-7
Strategic Economic Development Plan
City of Cibolo, Texas
Economic Development Plan
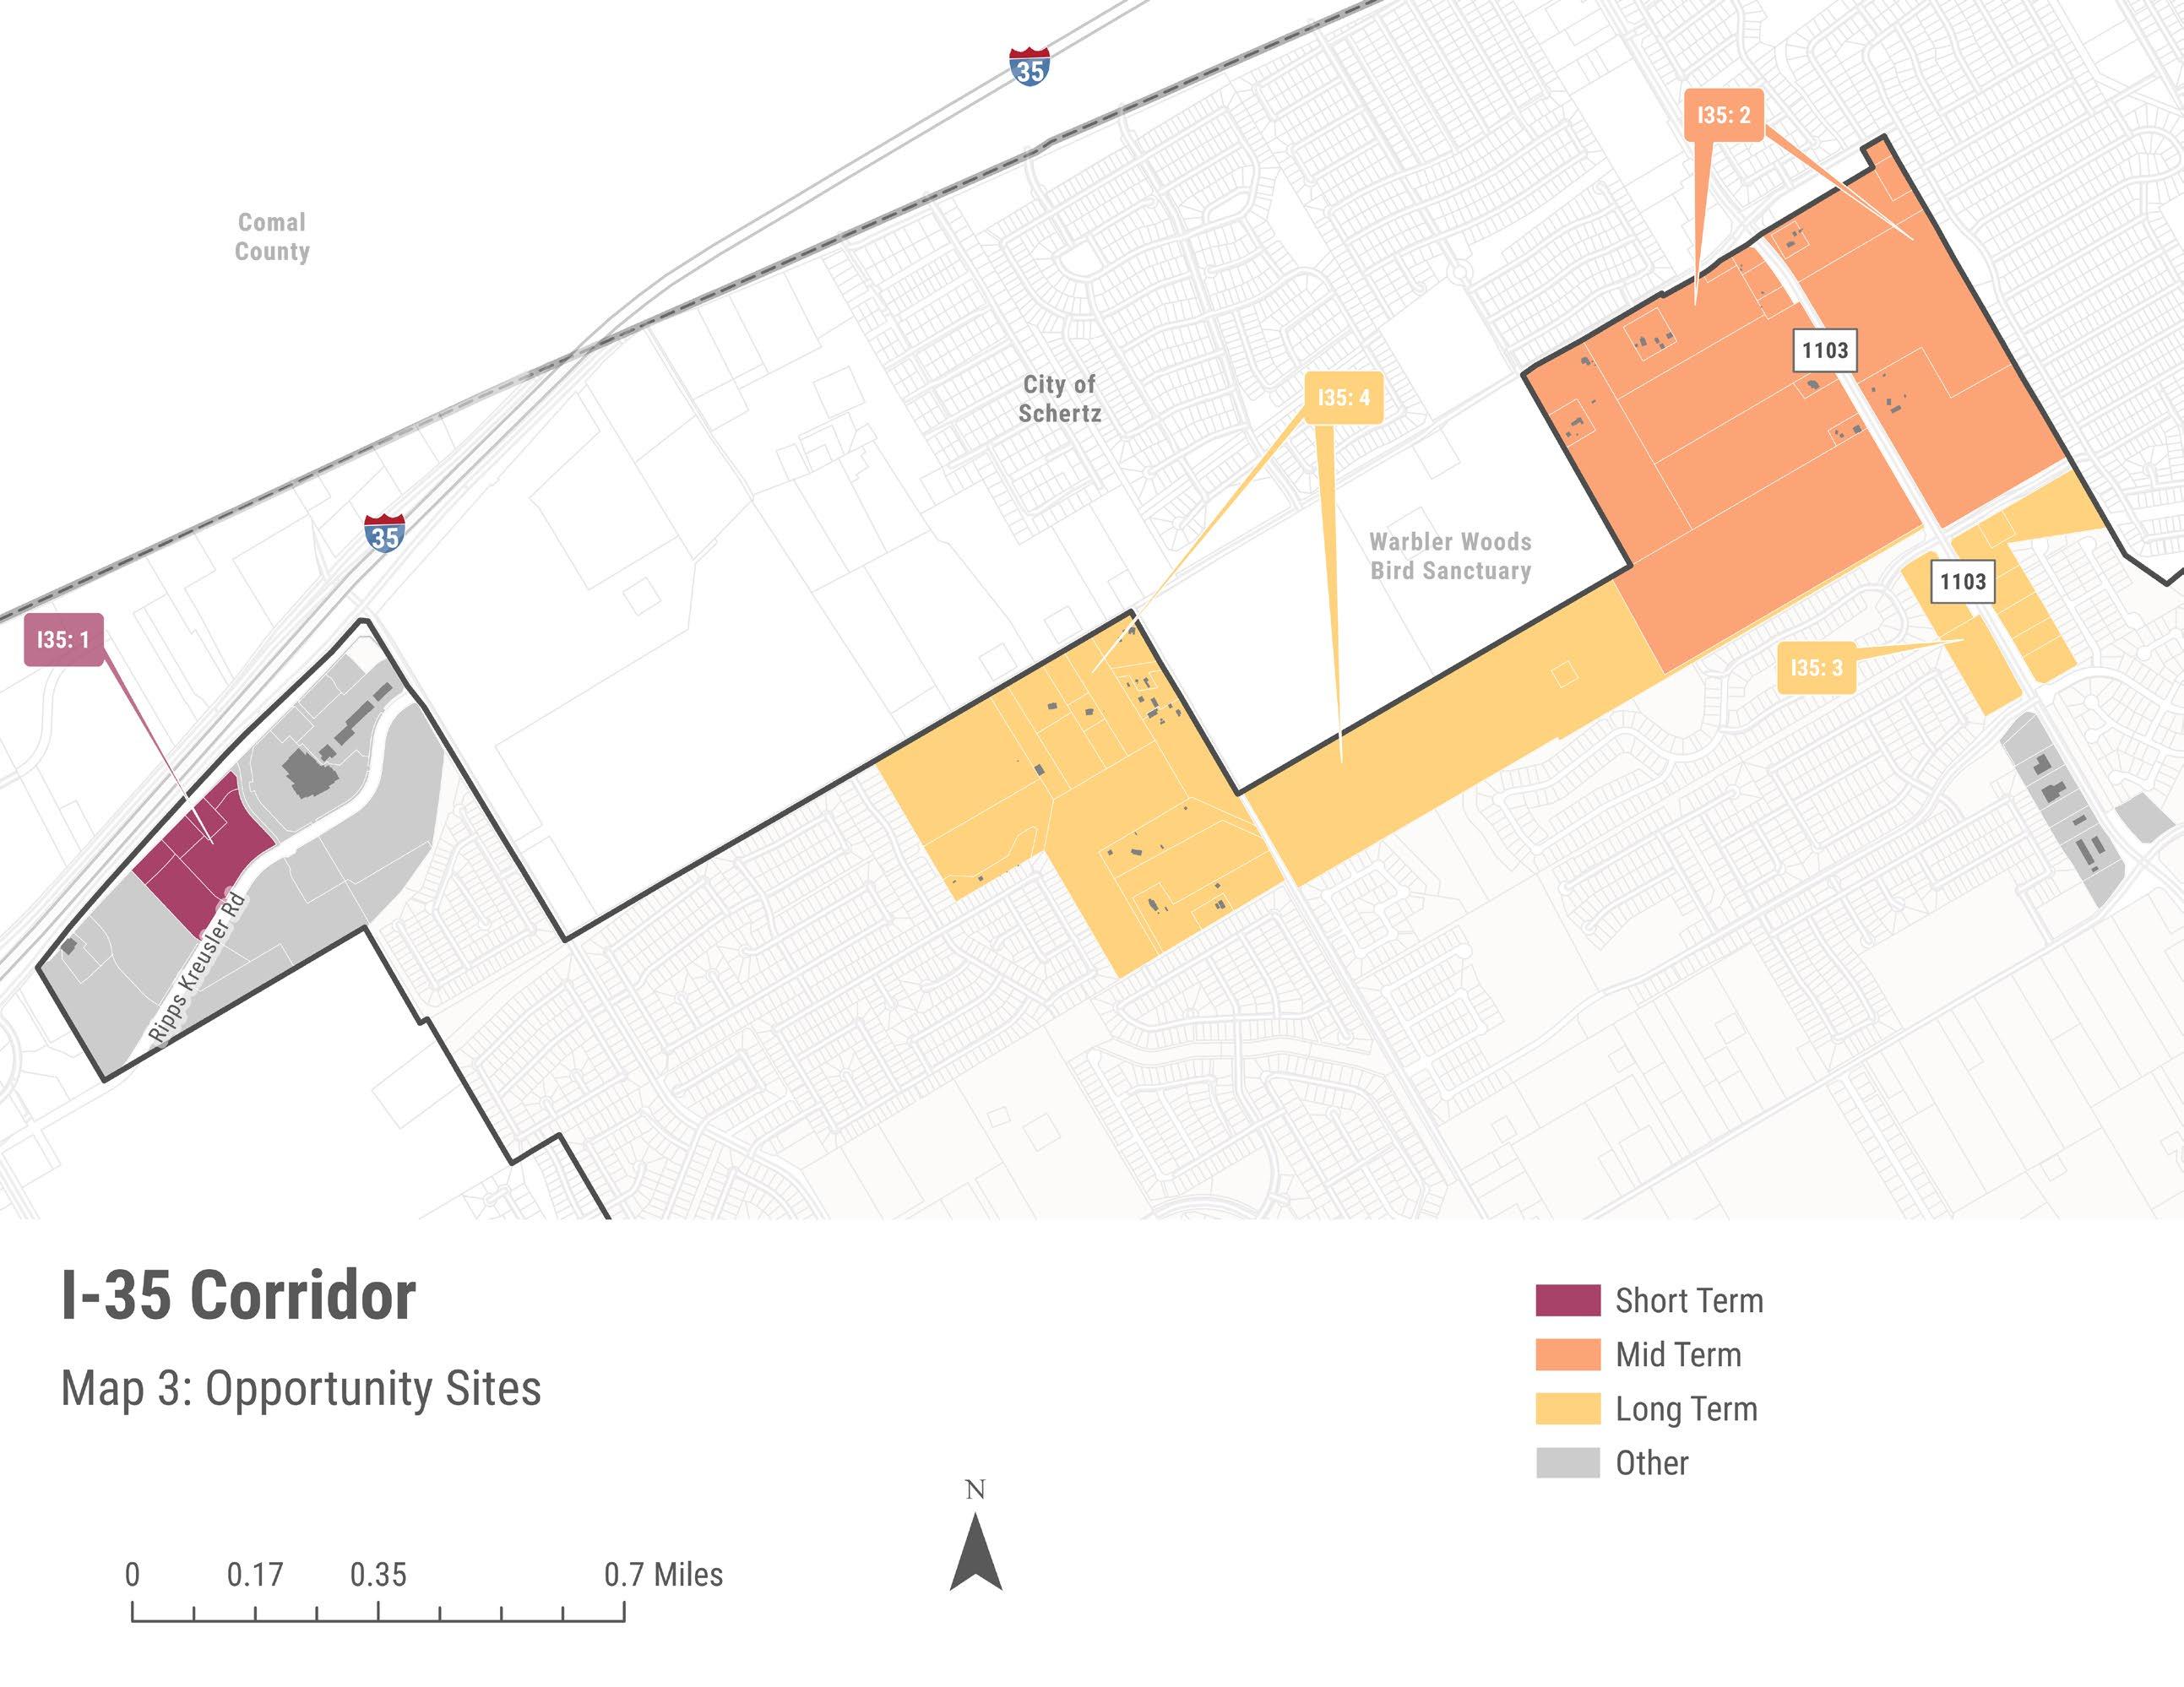
Strategic
Page | 6-8
1103 Crossing
1103 Crossing is Cibolo’s primary retail hub, anchored by Walmart and H-E-B. Retail investment rapidly expanded in the vicinity of these major anchors, capitalizing on anticipated traffic flows to maximize revenue potential. With the area already exhibiting a strong gravitational pull, several catalytic opportunities remain to leverage its momentum. These opportunities aim to strengthen community ties and enhance retail performance. This also includes phasing out existing developments that underperform, replacing them with uses better suited to foster economic growth.
SHORT TERM STRATEGIES
1103: 1, Increase foot traffic
Adjacent to this property is the future multifamily development, known as Knight’s Crossing. Knight’s Crossing will consist of hundreds of new units, translating to hundreds of new households with consumer demands. To enhance the marketability of Knight’s Crossing and meet the consumer expectations of its residents, RKG Associates suggests integrating live-work opportunities. As discussed earlier, two primary pillars should be emphasized in future retail development in true mixed-use projects: walkability and connectivity. Moreover, such a livework-play destination should be integrated with the Town Creek Trails to create a cohesive integration with the City’s larger transportation network. All that said, not only will automobile traffic flows continue at the benefit of existing retail, but foot traffic will come in as an additional force.
MID TERM STRATEGIES
1103: 2, Activating an Underutilized Site
Opportunity site 2 currently is used as a storage yard. Its strategic location between the 1103 retail hub of Walmart and H-E-B combined with its proximity to the Schneider Business Park make it an ideal candidate for a more intense economic development use that would create greater tax revenue and increase jobs. This unique location also creates an opportunity for Cibolo to target users that make an ideal transition from traditional retail to traditional industrial, the flex warehouse showroom model.
Cibolo’s market dynamics support the adoption of the showroom model, an innovative approach where the front of the building is used as the retail space/showroom for the business and the rear of the building is the warehousing space to store the products being sold. Businesses such as countertop and appliance businesses. Given Cibolo’s abundance of production-based workers and the rising demand for home goods, the City is well-positioned to embrace such showroom models.
City of Cibolo, Texas Strategic Economic Development Plan Page | 6-9
1103:
3, Active Park Potential
There is a large parcel that encompasses 50 acres to the east of H-E-B. A significant portion of the land is constrained by floodplains, restricting the scope of potential development opportunities. It is RKG’s understanding that the frontage along 1103 has development potential, but the rest of the site is heavily impacted by environmental issues. Further, it is RKG’s understanding that a park/trail development is planned to the immediate east of the HE-B property between that property and this subject site
Given the development limitations, this parcel can still absorb investments that maximize its utility and enhance the overall appeal of the area. Most notably, parcels like this are used as active recreation facilities throughout Texas and the U.S. (e.g., sports fields). Creating a destination use at this site can increase the recreation capacity within Cibolo and bring additional activity to the 1103 Crossing area, further supporting the existing retail and dining infrastructure.
As will be detailed in the FM-78 economic activity area section, there is the potential to relocate the park amenities at Niemetz Park to this location, creating a larger and more economically viable economic development site along FM-78. While a strategy that relocates Niemetz Park to the 1103 Crossing area is speculative, given this property is privately owned and costs for acquisition, development, and operation are unknown, it does address some important challenges facing Cibolo.
First, it expands the capacity of Niemetz Park to accommodate more sports fields. Given the current strategy to reconfigure the Park as part of the EDC development plan, the cost to reconstruct Niemetz Park will not be avoided under that plan. This effort increases the Park’s offerings in a location that is better served by support amenities. Second, it increases the size of the redevelopment parcel along FM-78. This increases the opportunities for uses at that location, which in turn creates a stronger market viability to attract investment. Simply put, using both the EDC property and the Park property creates a site that can accommodate a livework-play development that increases consumer demand in central Cibolo that will support the envisioned restaurant cluster currently being considered.
LONG TERM STRATEGIES
1103: 4, Experience and Agricultural Economy
This site is another property constrained by wetlands and yet limited in the scope of development opportunities. The potential uses for this site are limited due to the environmental constraints, but the site is well situated and will be served by the City’s trail system. To this point, this site has economic development potential that would strengthen the 1103 Crossing area. Specifically, the site should be investigated to accommodate a winery or brewery business. These uses are compatible with lands with environmental concerns and can take advantage of its proximity to the developing trail system in Cibolo.
City of Cibolo, Texas Strategic Economic Development Plan Page | 6-10
City of Cibolo, Texas
Economic Development Plan
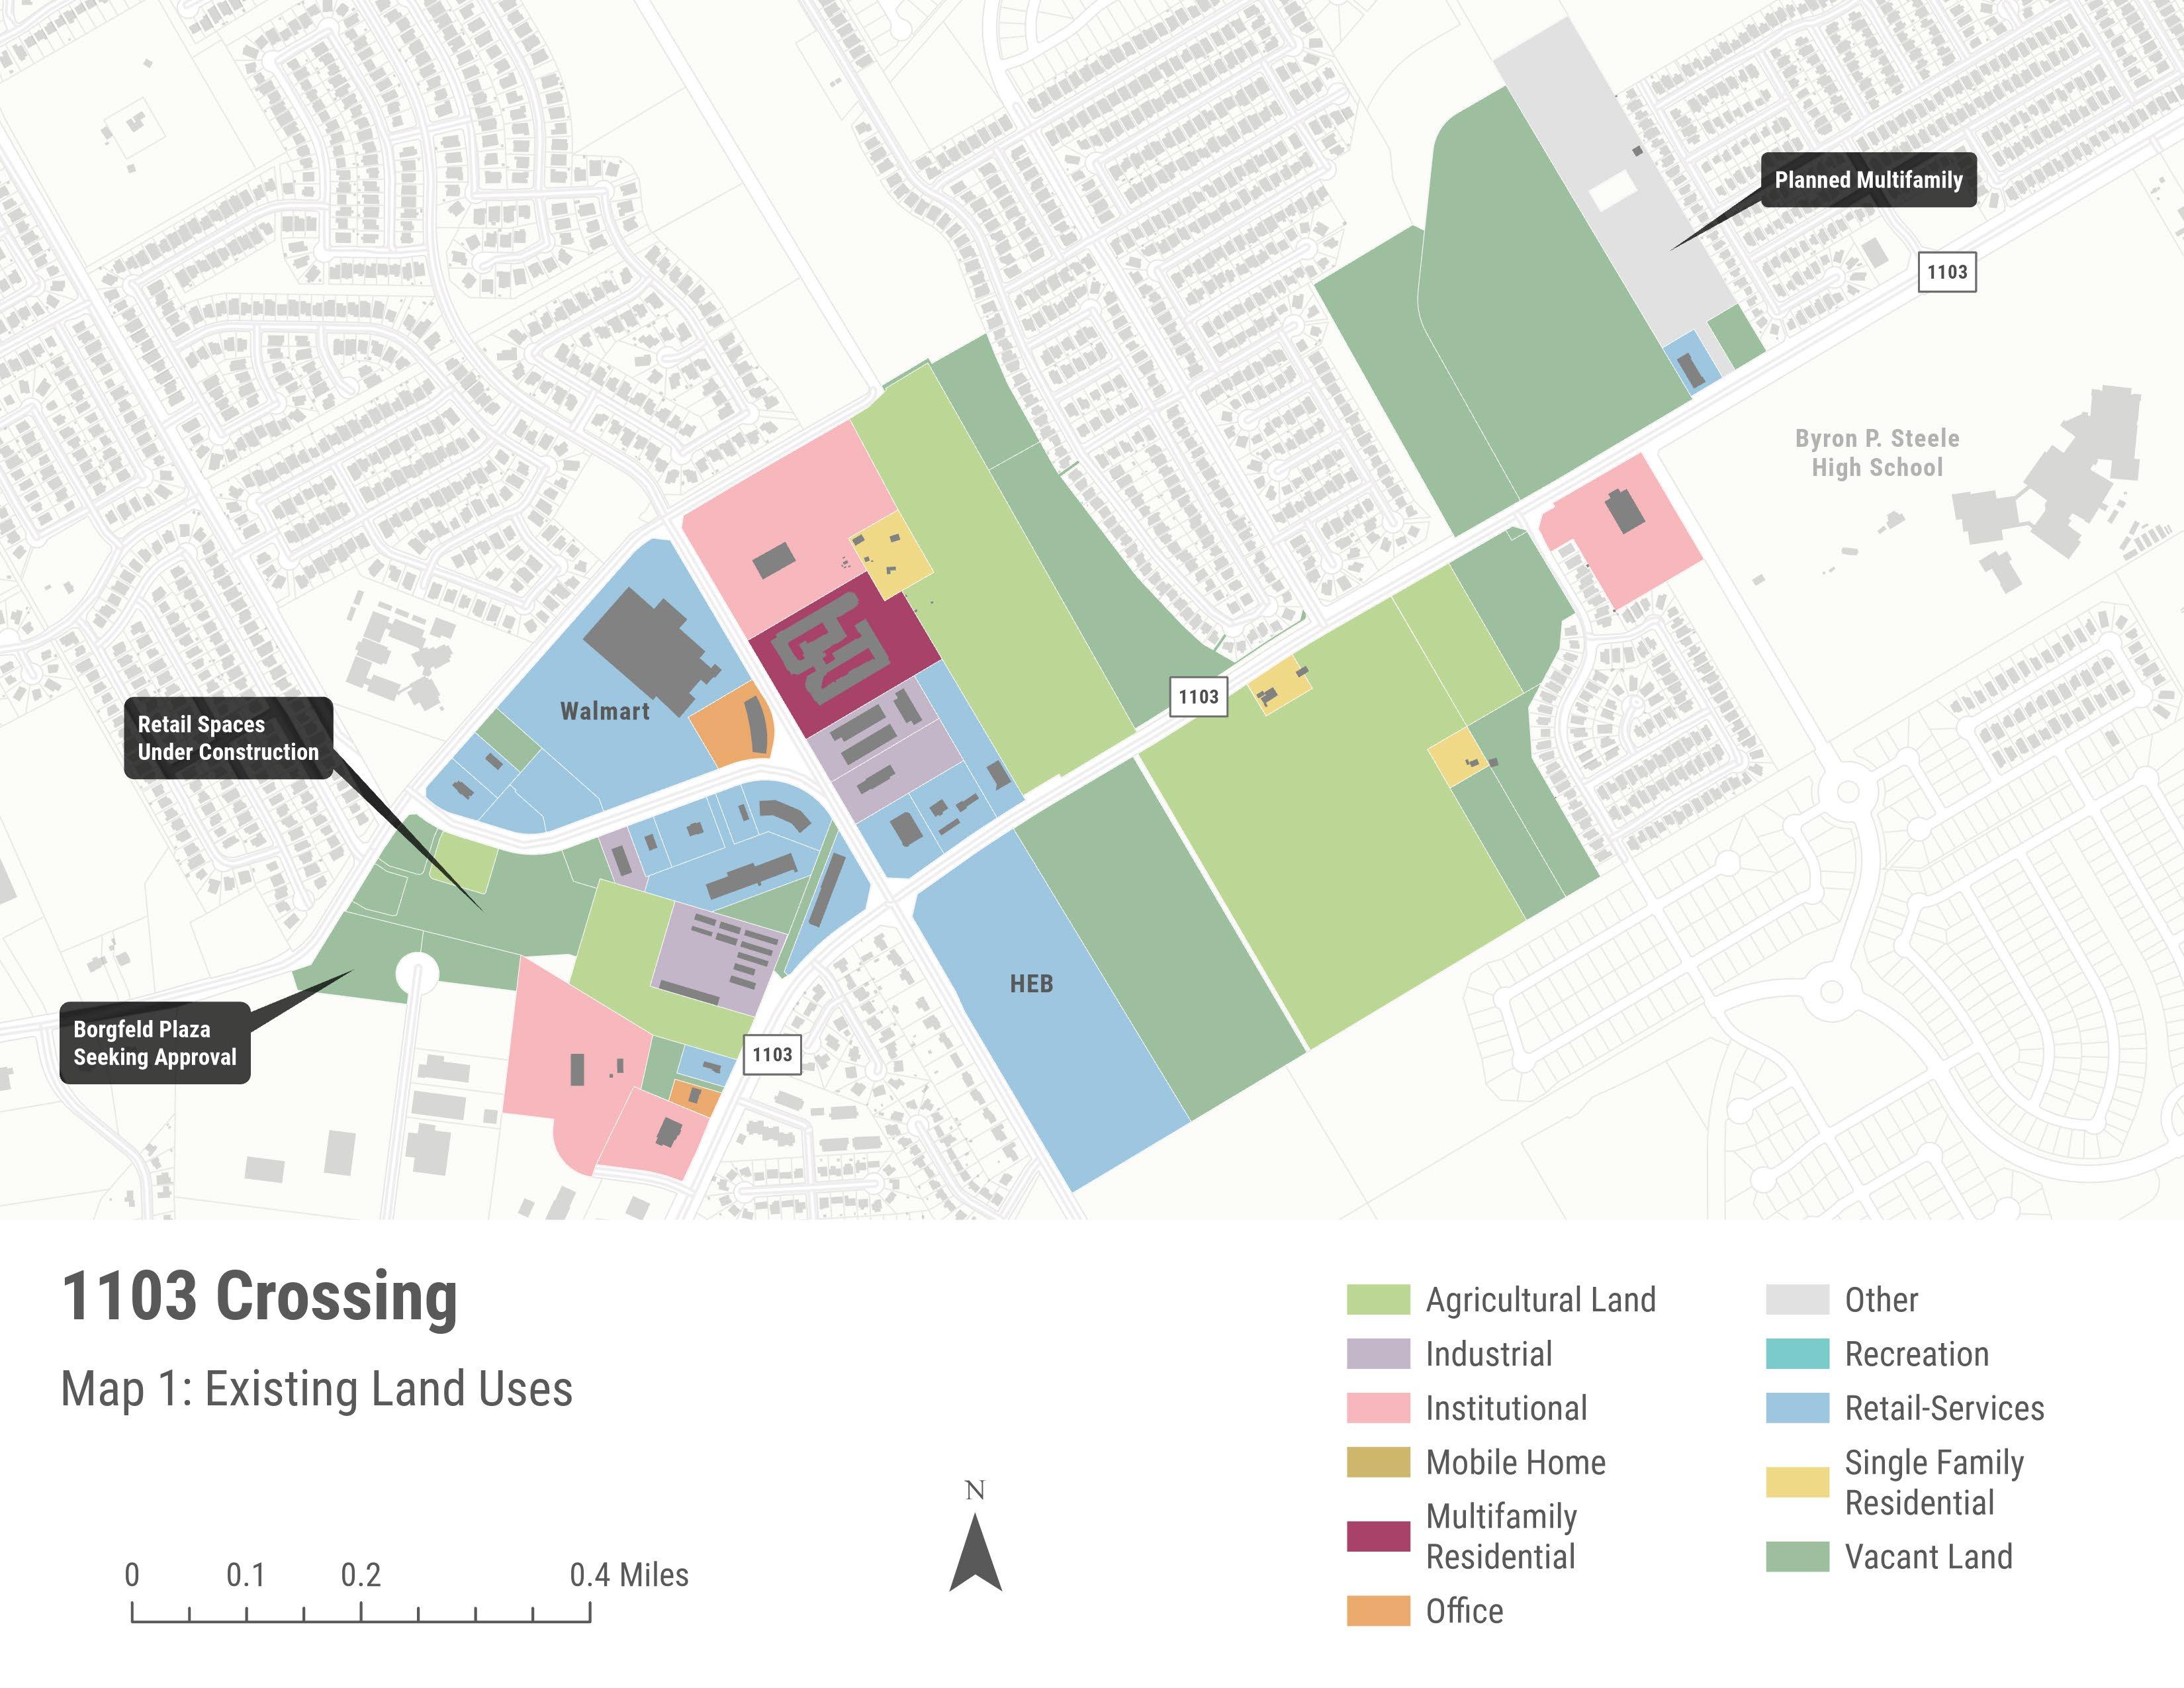
Page | 6-11
Strategic
City of Cibolo, Texas Strategic Economic Development Plan
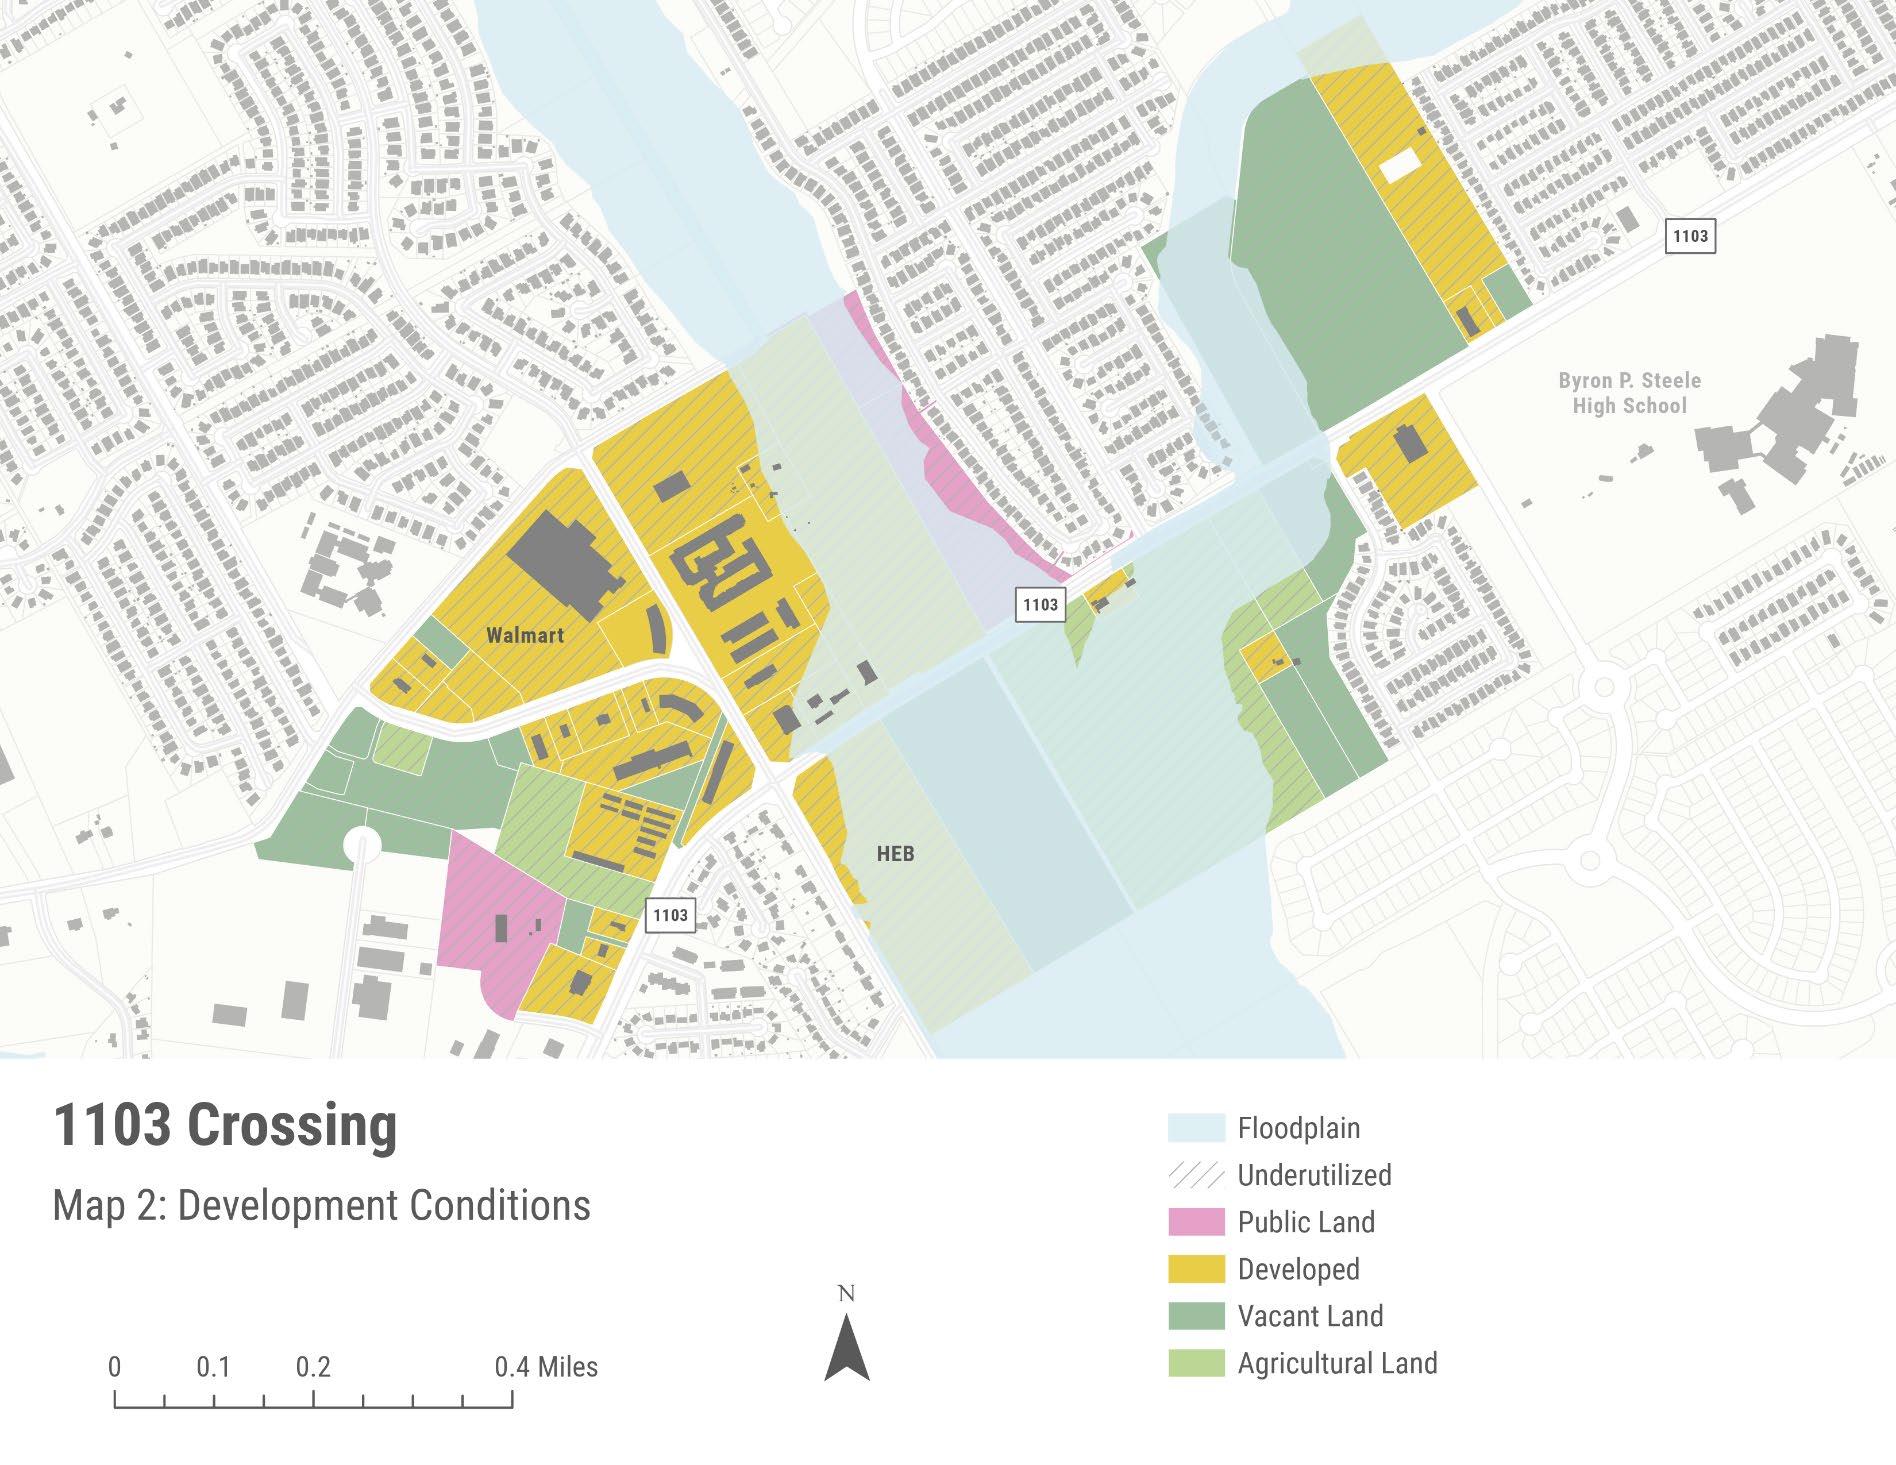
Page | 6-12
City of Cibolo, Texas
Economic Development Plan
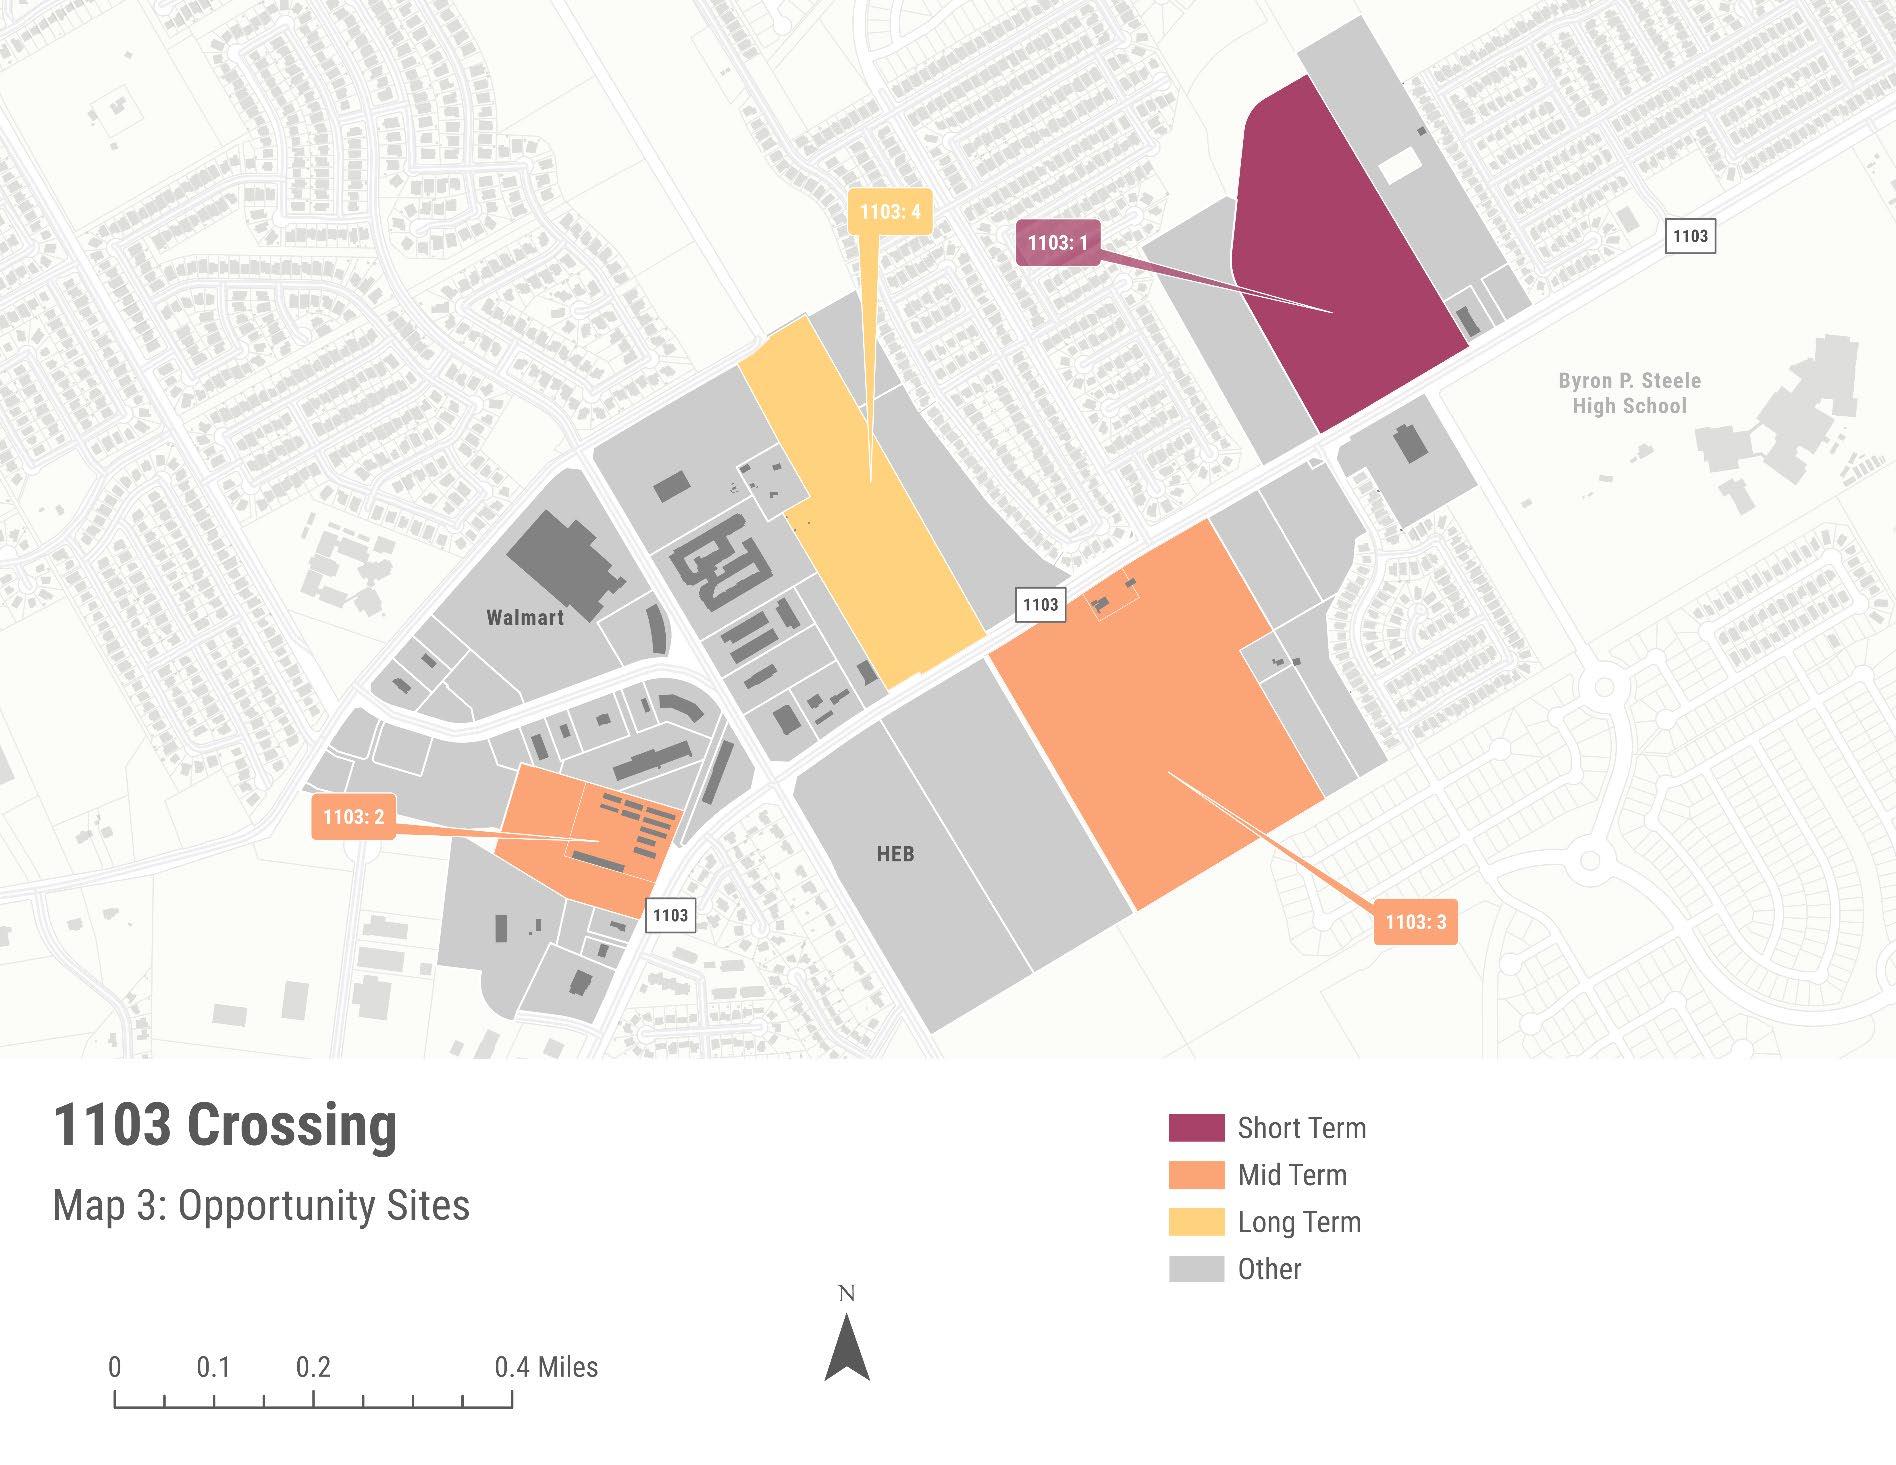
Page | 6-13
Strategic
Downtown
The future of Downtown Cibolo, especially historical Main Street, has been a source of disagreement within Cibolo. Opinions diverge on the area’s long-term vision and the appropriate land uses and levels of activity. On one hand, there are advocates for preserving Downtown Cibolo as is, concerned that additional commercial investment would adversely impact historical significance and charm. On the other hand, there are proponents for additional commercial investment and revitalization efforts, aimed at enhancing Main Street’s position as a community hub for entertainment and recreation While there is an existing Downtown Master Plan, it was reported during this process that there is no consensus on the best approach. As efforts towards establishing consensus are made, including the impending update to the Downtown plan, opportunities exist in the meantime to foster economic growth in the economic opportunity area.
SHORT TERM STRATEGIES
DT: 1 and DT: 2, Flex Space
Strong market indicators point to pent-up demand for small-scale production-based facilities within the northeast region of San Antonio, especially as the region’s supply chain networks expand and cottage manufacturing is revived into a normalized business model. Locations appropriate for this development tend to be sized similarly to sites 1 and 2. Location along FM78 is appropriate for such development, and the area is appropriate for such development, given its transportation access and consistency with the development in the adjacent Schneider Business Park. Thus, these properties offer sufficient land resources to capitalize on these bullish opportunities. The market analysis indicates that spaces between 5,000 and 15,000 square feet are the most marketable in the community.
MID TERM STRATEGIES
DT: 3, Centralizing Entrepreneurship
Efforts
Site 3 is adjacent to the existing City annex building, which includes the economic development department offices. Most of the site is undeveloped, bound by Pfeil Road to the north, Loop 539W to the south and frontage parcels along Main Street to the east. It is RKG’s understanding that the current Downtown plan identified this site for future civic use. From an economic development perspective, this site presents a strong opportunity to co-locate City-sponsored entrepreneurial services with the economic development offices in a single facility.
The concept can work by modifying the existing building that economic development is located to co-locate an entrepreneurial center or as a new facility where both operations are located. The concept for an entrepreneurial center would be to have space available to accommodate entrepreneurial classes and provide support services (e.g., financial or legal assistance), access SBDC services remotely (e.g., computer terminals), and potentially incubator space to house entrepreneurs.
City of Cibolo, Texas Strategic Economic Development Plan Page | 6-14
City of Cibolo, Texas
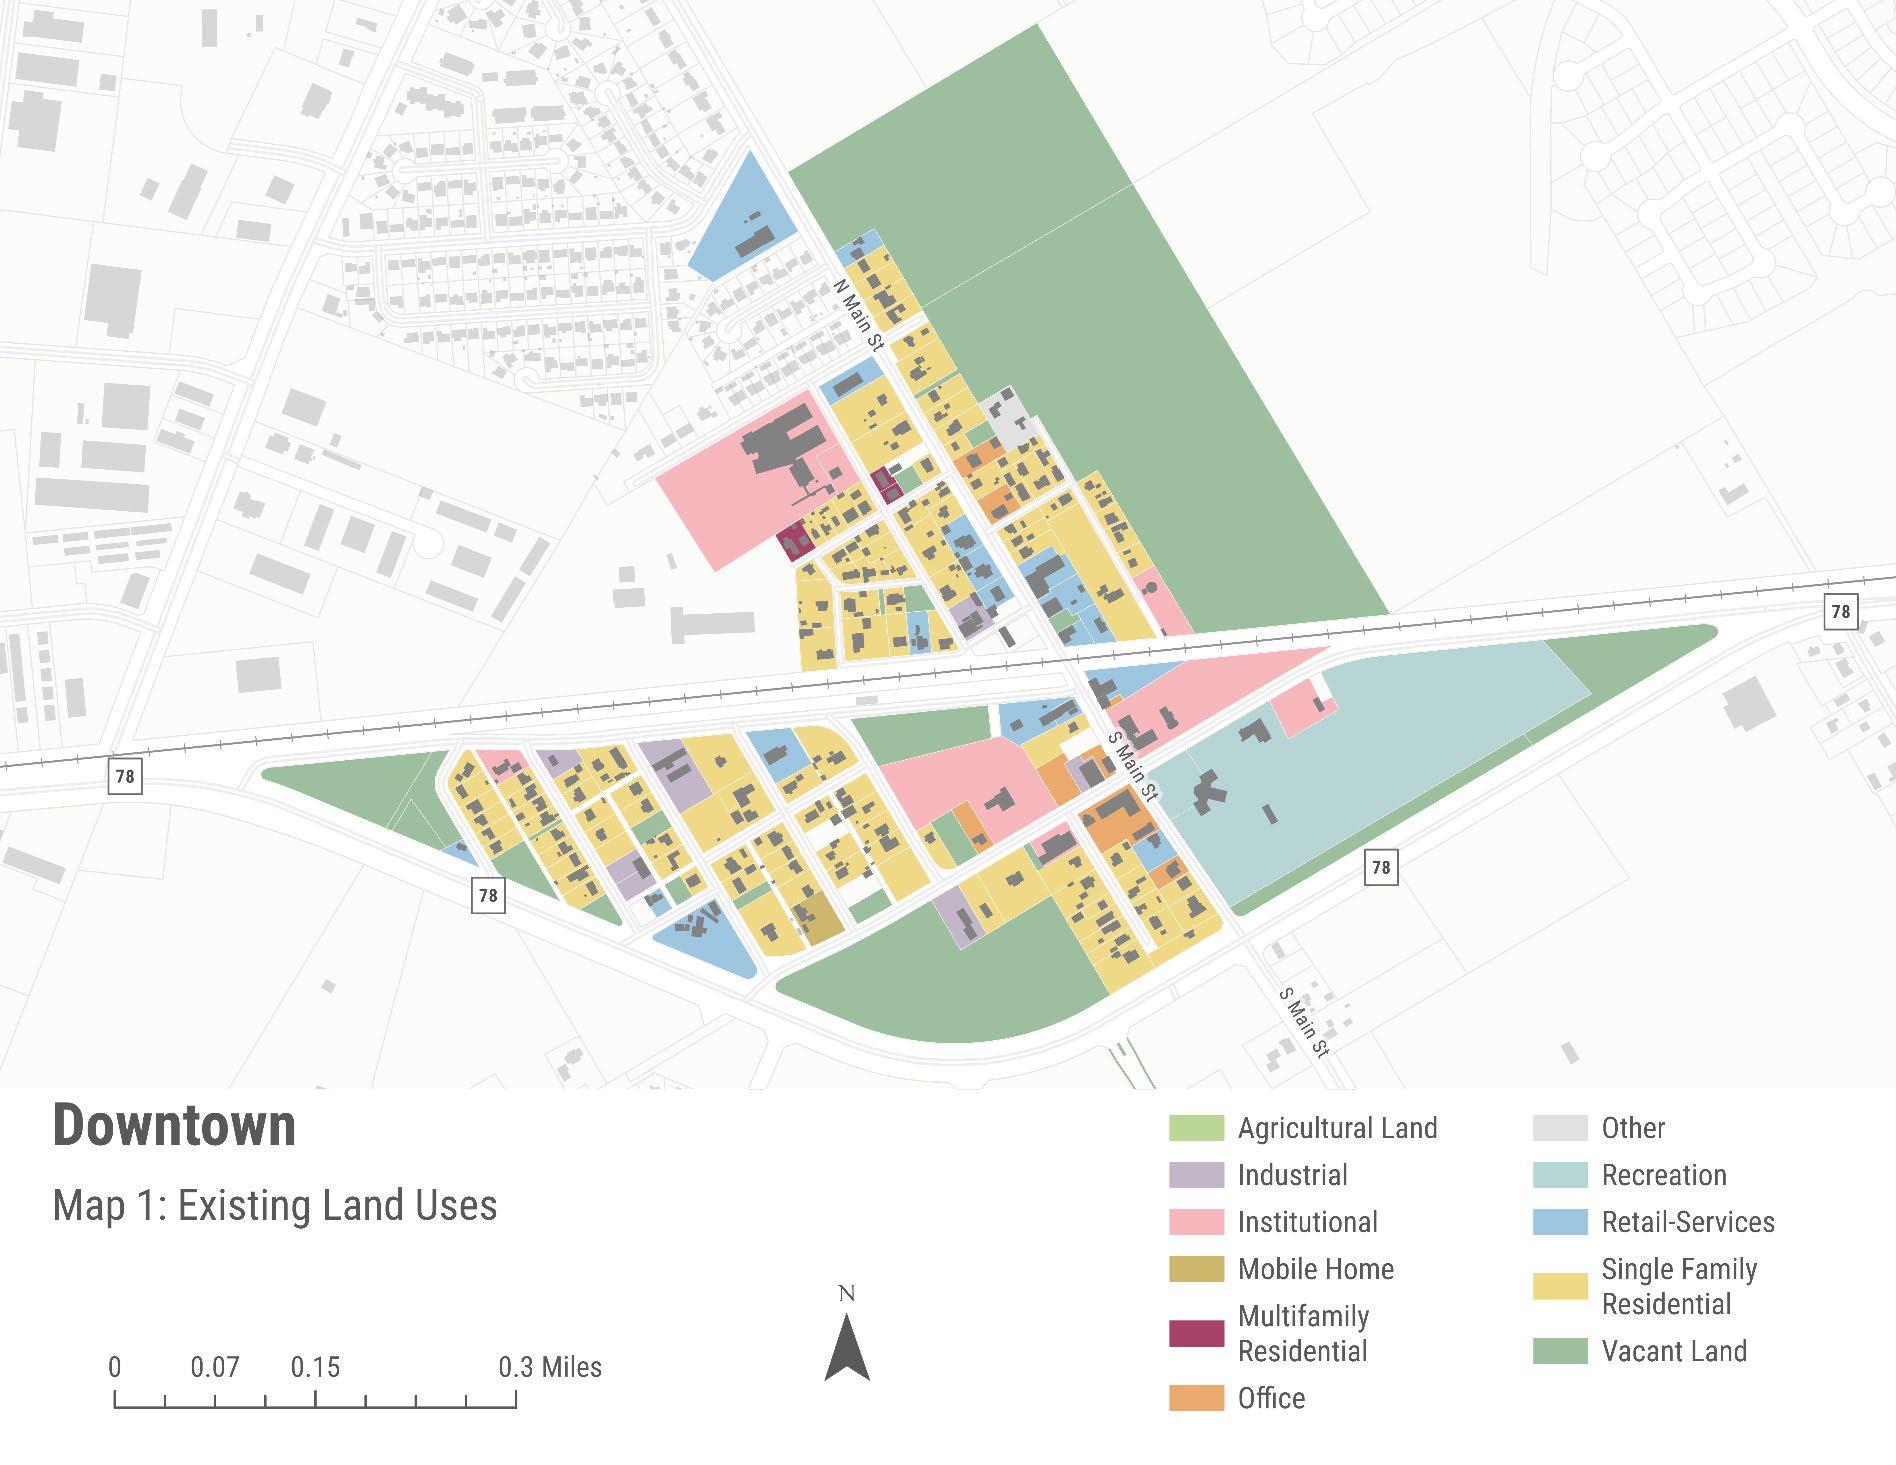
Page | 6-15
Strategic Economic Development Plan
City of Cibolo, Texas
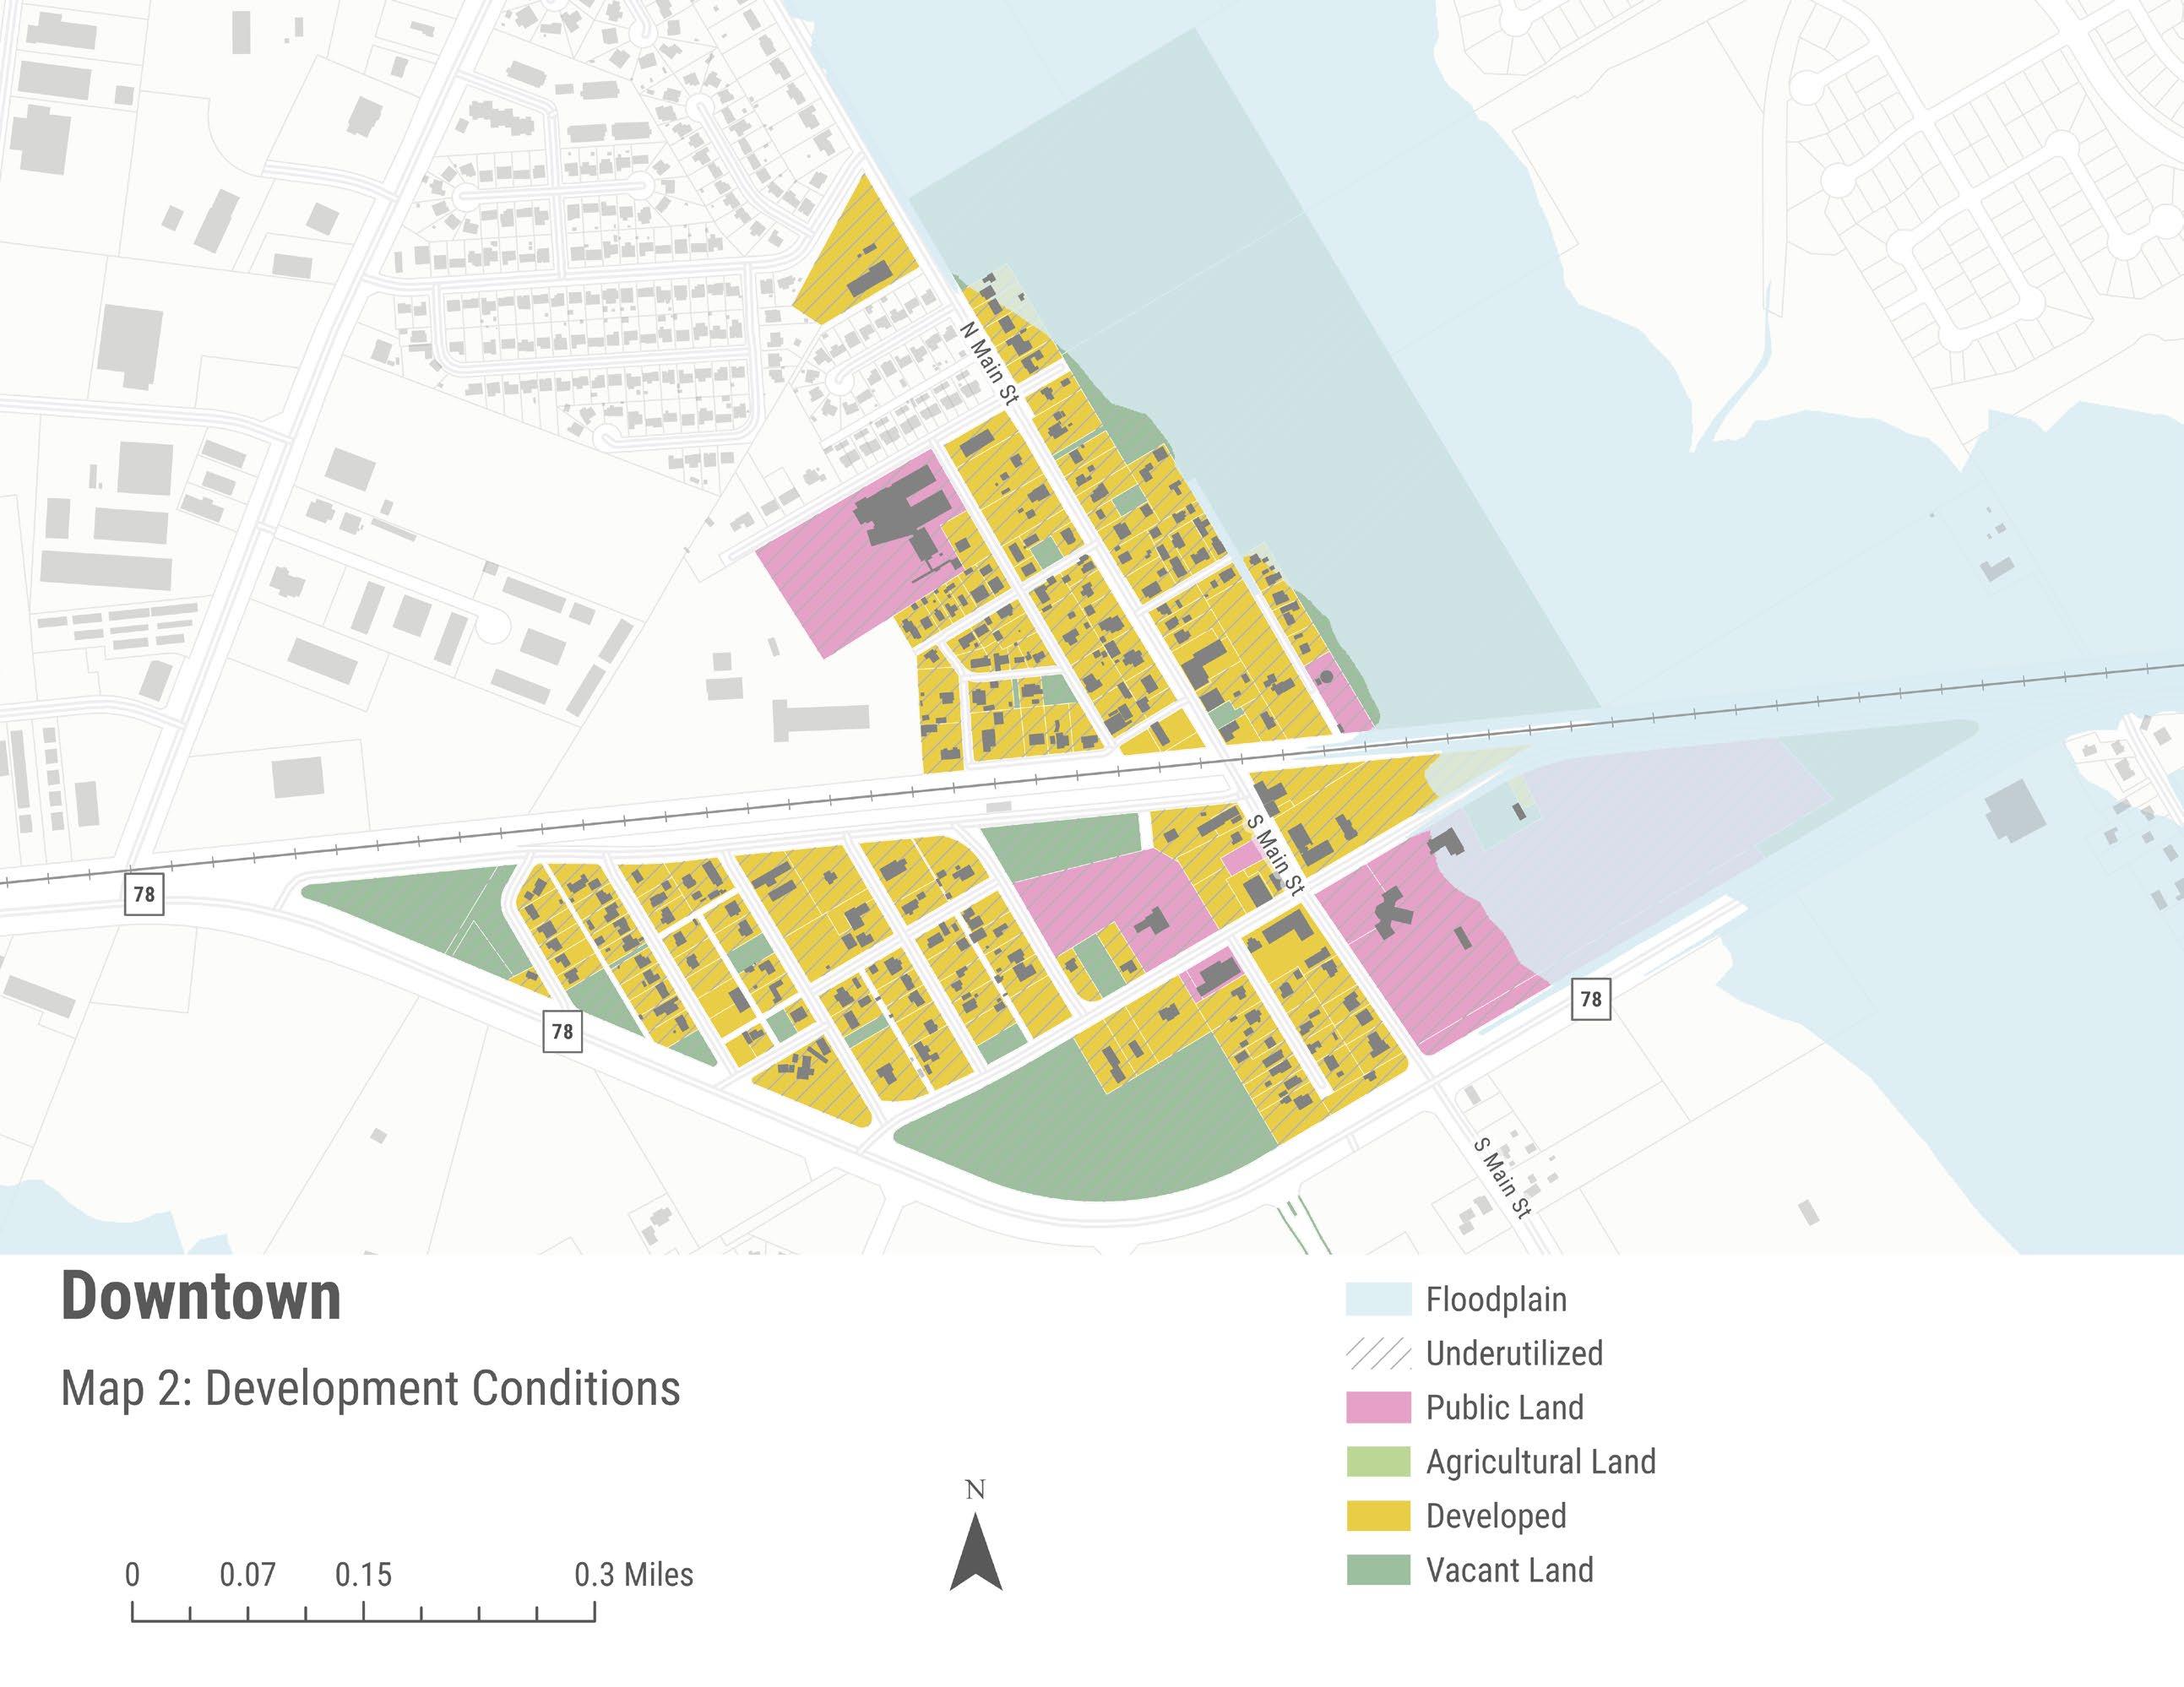
Page | 6-16
Strategic Economic Development Plan
City of Cibolo, Texas
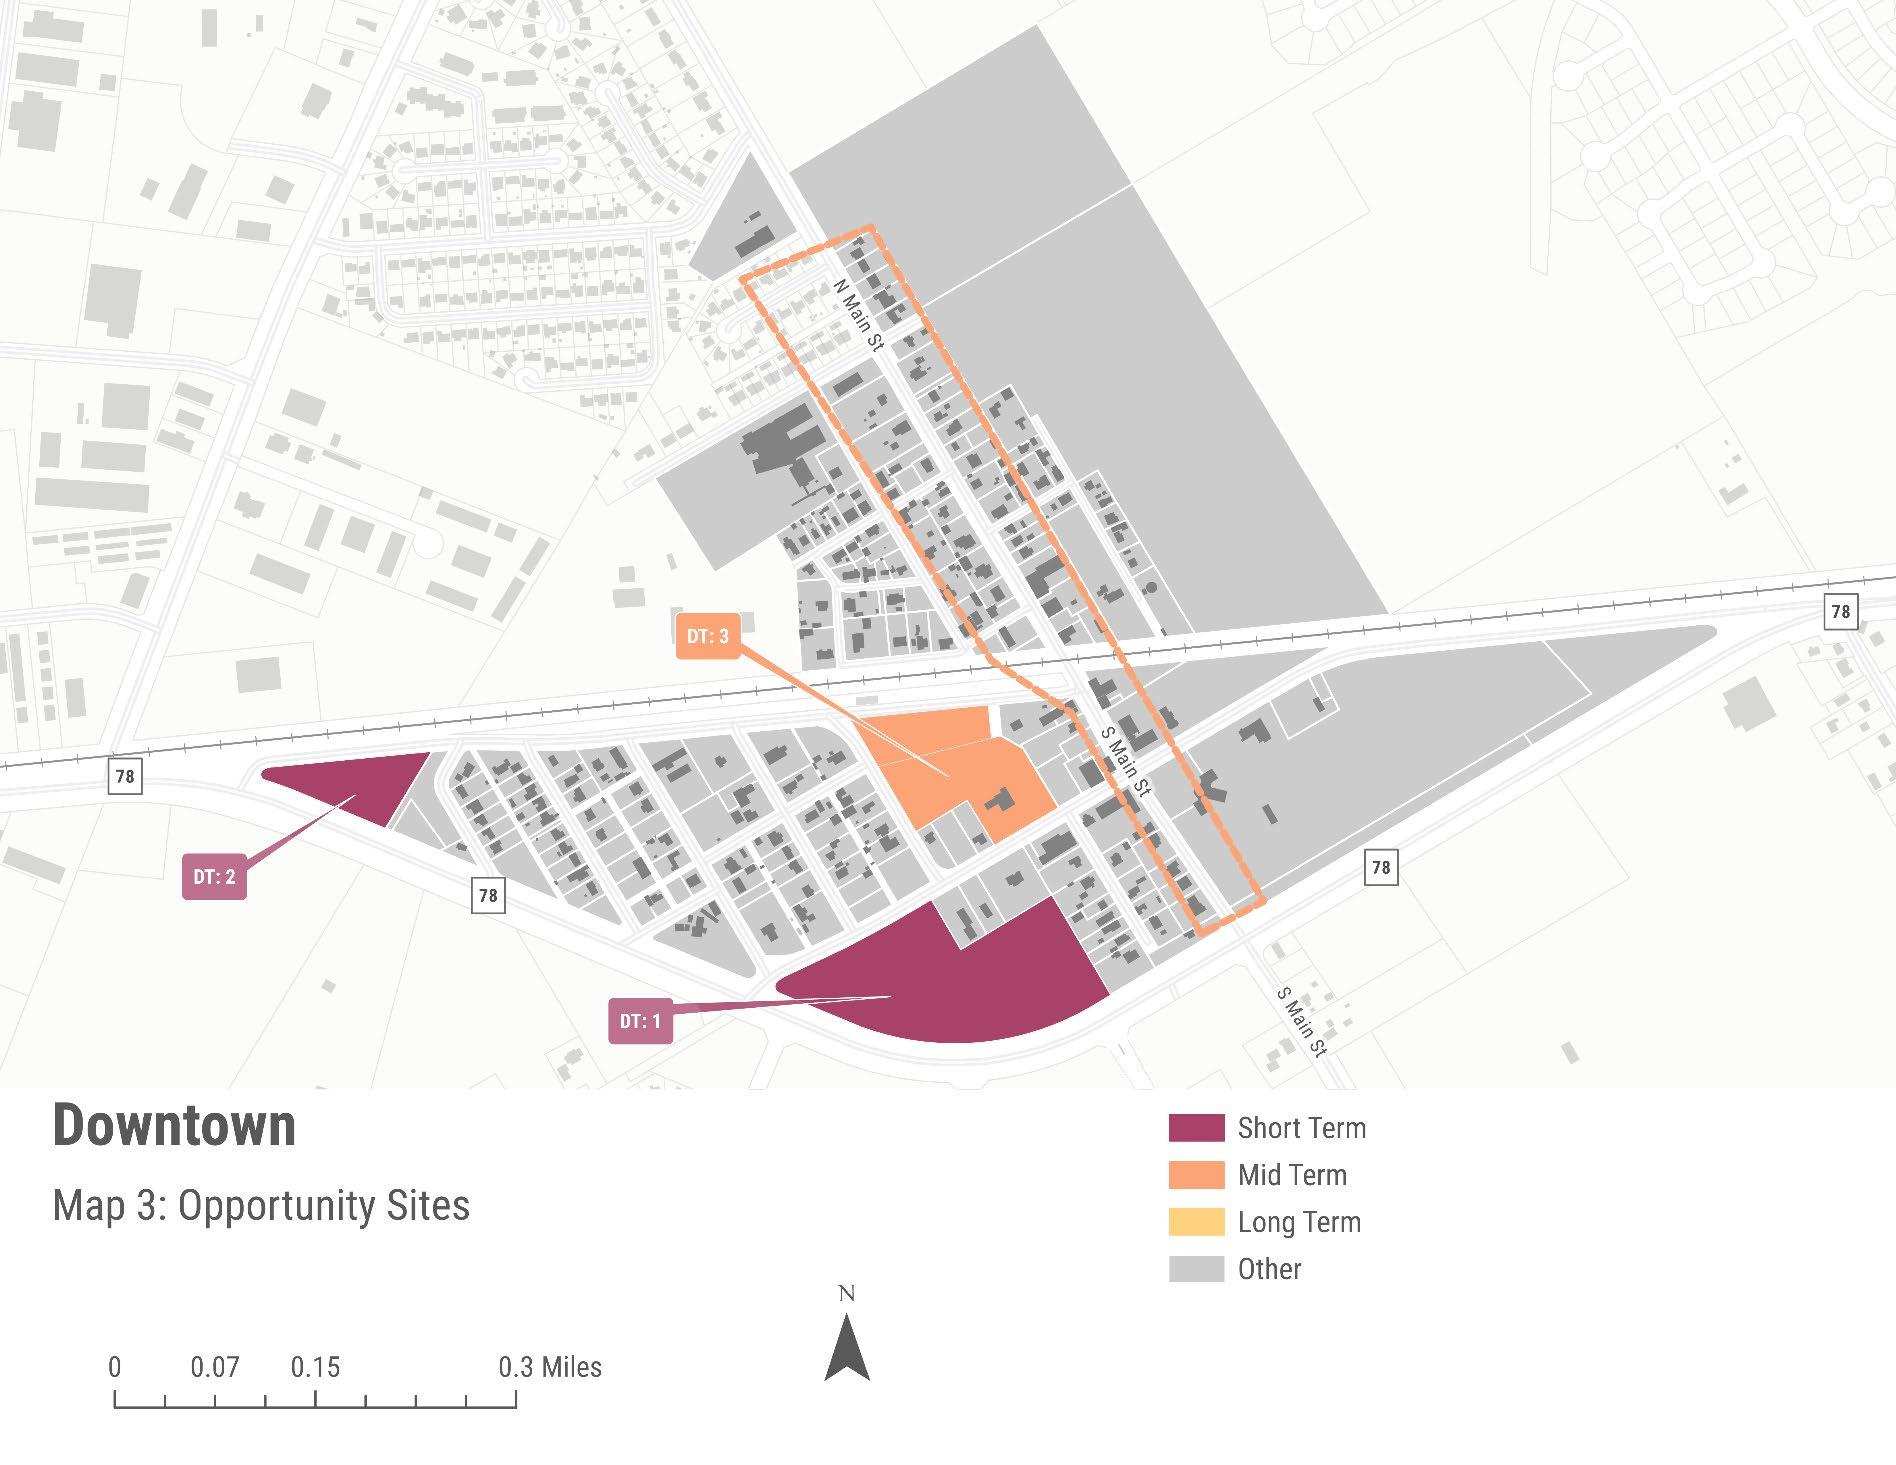
Page | 6-17
Strategic Economic Development Plan
FM-78 West
The FM-78 West economic activity center is bisected by FM-78 and the Union Pacific railroad. FM-78 is the main east-west transportation connector for central Cibolo, but a secondary route compared to traffic volumes on IH-35 and I-10 This activity area offers several catalytic development opportunities, especially for capitalizing on EDC property/Niemetz Park site as well as proximity to Schneider Business Park. Schneider Business Park is a critical component of the city’s economy, elevating Cibolo’s regional presence as an industrial hub. The concentration of production-based businesses makes additional investments in small scale industrial uses targeted at the remaining vacant parcels within the study area.
Generally, RKG recommends the City affirm a vision for the corridor. Current zoning indicates a strategy for FM-78 to become a commercial corridor similar to Roy Richard Drive. However, the retail analysis provided in the Real Estate Market chapter indicates the demand for retail and restaurant development within Central Cibolo does not justify the amount of land dedicated to commercial use (through zoning). Short-term opportunities include small-scale industrial and flex development and/or residential development. Given FM-78 is this major east-west transportation corridor through Cibolo, frontage parcels should be committed to higher intensity uses than traditional single-family development.
All that said, the current vision for FM-78 reflects a long-term growth plan depending on additional residential development to create market demand for additional retail development. Affirming this remains the vision for the corridor will set expectations for the economic development of both the FM-78 West and FM-78 East economic activity centers.
SHORT TERM STRATEGIES
FM-78 West: 1, Red River Ranch Frontage
The Red River Ranch mixed use development has several frontage parcels along FM-78 currently being marketed for commercial development. It is RKG Associates’ understanding that these properties have been actively advertised for several years with no concrete retail/service prospects currently interested in the site. The retail market assessment discussed earlier in the report indicates that there is insufficient demand for any substantial retail and restaurant development in central Cibolo, thus limiting the short-term potential to attract retail/service development to FM-78 West: 1. Increasing residential development either through medium intensity for-sale or for-rent product or encouraging vertical mixed-use medium intensity development would likely stimulate new investment and support current (e.g., Downtown) and potential (through mixed-use development) commercial activity in Central Cibolo.
FM-78 West: 2, EDC Site/Niemetz Park Strategies
The EDC purchased a large tract of land along FM-78 adjacent to Niemietz Park. There have been previous studies that assessed the market potential for developing the site to
City of Cibolo,
Strategic Economic Development Plan Page | 6-18
Texas
accommodate a hotel/conference center and a cluster of sit-down restaurants in coordination with the rehabilitation (and potential realignment) of Niemietz Park. While the assessment of these options is ongoing and no definitive solutions have been adopted about the EDC site or Niemietz Park , this economic development strategy recommends the following alternative approaches for the City and EDC to consider.
Alternative 1; EDC Site Development Only
This alternative focuses on potential use of the EDC site, leaving Niemietz Park as is. From a market perspective, the EDC site has the greatest potential to accommodate smaller-scale (5,000 SF to 25,000 SF) industrial or flex space development. This approach envisions users such as construction companies, wholesale retailers, automotive service facilities, and small/light manufacturing/machining businesses (to name a few). The site’s size and location make it ideal for limited truck traffic (using FM-78) and its proximity to Schneider Business Park. The EDC can consider reserving the site’s frontage along FM-78 for more commercial-focused uses (e.g., restaurants) as a longer-term strategy for development of that portion of the parcel.
Alternative 2; EDC Site/Niemetz Park Combined Strategy
The City Council and EDC Board have been discussing approaches that potentially realign Niemietz Park (without losing any acreage dedicated to the park) to modernize the Park’s facility and increase the potential for development on the remaining EDC land. A strategy like this creates the greatest potential for success if the Park is aligned to occupy the portion of the site furthest from FM-78 (available through an access road) and the frontage land is dedicated to economic development activity. This alignment maximizes the potential for interest, as road frontage is more desirable due to its higher visibility.
From a development perspective for the EDC component, committing the full frontage of the combined site expands options for development. While the smallscale industrial/flex concept remains valid. Focusing development closer to FM78 and expanding roadway frontage adds the potential to develop a mid-scale mixed-use live-work-play destination that compliments Downtown (through offering a development scale not possible along Main Street) while increasing consumer demand through medium density residential growth. The amenitized live-work-play design (envision a town-center concept) can be integrated with the park design through strategic non-motorized trails and paths. Simply put, the EDC development could offer the parking and amenities (e.g., small-scale retail and dining) for park attendees while attracting residents seeking a convenient location that has walking and biking connections to open space (Niemietz Park) and the unique environment of Downtown Cibolo.
City of Cibolo, Texas Strategic Economic Development Plan Page | 6-19
Alternative 3, Relocating Niemietz Park
As discusses in the 1103 Crossing section, there is a concept where the environmentally impacted 50-acre parcel located east of H-E-B (see 1103: 2 under midterm strategies in the 1103 Corridor discussion) is acquired for active park use, accommodating the uses already located at Niemietz Park. Under this scenario, the current Niemietz Park land would be combined with the EDC land to create a larger economic development site. Moving Niemetz Park to this parcel can maximize the utility of the FM-78 land for economic development use, while strategically using environmentally impacted land in a location where increased recreational activity is already underway and expanding Niemietz Park size from roughly 12 acres to more than 25 acres (depending on usable land)
As part of the swap, the land utilized for the existing Niemietz Park could support several robust economic development opportunities. This includes a larger town center style development designed as a vibrant work-live-play destination detailed in Alternative 2. Expanding the town center concept could create a sufficient base of consumers to support some of the additional City objectives for FM-78 (e.g., hotel/convention center). Alternatively, the expanded EDC site could generate greater economic investment in production-based businesses, increasing jobs and capital investment in Cibolo.
RKG recognizes that Alternative 3 is highly speculative and will require further market and financial analysis to determine its feasibility. That said, further market and financial feasibility is recommended for any strategy that will require the realignment or rehabilitation of Niemietz Park. Estimating the potential revenue from land sales for developing the property and the costs to realign and rehabilitate Niemietz Park will provide the information necessary for the EDC and City Council to make an informed decision on the future of this site.
MID TERM STRATEGIES
FM-78
West: 3, Flex Space
As noted for the EDC/Niemietz Park site, this parcel has a short-term opportunity to accommodate smaller-scale industrial or flex space development. Given the site’s adjacency to the EDC parcel, the City should consider acquisition to expand the land area and consistency of development along FM-78 in this area. Potential uses as a stand-alone site include microbrewery, retail showroom, or makerspace.
LONG TERM STRATEGIES
FM-78
West: 4, Assemblage and Redevelopment
This opportunity site comprises several land-intensive properties, mainly occupied by singlefamily homes. Relocating and redeveloping these properties presents numerous economic
City of Cibolo, Texas Strategic Economic Development Plan Page | 6-20
development opportunities. With their frontage along Borgfeld Road, a high-traffic corridor, non-residential development can take advantage of the transportation accessibility and excellent visibility. The short-term opportunities are consistent with FM-78 West: 1, small scale industrial or flex uses with the long-term potential for small commercial uses on the frontage of FM-78.
FM-78 West: 5, Gateway Development
These two properties front Cibolo’s western access point along FM-78, offering the potential to transform into a landmark gateway development. This gateway development can evoke an immediate positive image for visitors upon entering Cibolo. RKG envisions a mixed-use development for the site, with vertically integrated mixed use buildings along FM-78 and medium density for-sale residential development further off of the road frontage. The for-sale product can be underrepresented typologies (e.g., cottage homes or townhomes) that will increase price and type diversity to support older households in Cibolo that seek to age-inplace as well as younger working-aged households that cannot/do not want to purchase a traditional single-family house.
A significant barrier towards developing this gateway concept at this location is the existing mobile home park. If the City chooses to move forward with this or any concept that displaces the residents of the mobile home park, relocation assistance should be required of the developer.
FM-78 West: 6, Underutilized Parcels
There are several properties currently residential houses that have potential to expand the city’s employment base. Located on the western edge of Cibolo along West Borgfeld Road, this collection of properties constitutes a sizable redevelopment opportunity to expand the industrial/flex capacity of Cibolo in a manner consistent with the development scale of nearby Schneider Business Park. Alternatively, this opportunity site can accommodate a higher density residential development to expand the diversity of housing within Cibolo.
City of Cibolo, Texas Strategic Economic Development Plan Page | 6-21
City of Cibolo, Texas Strategic Economic Development Plan
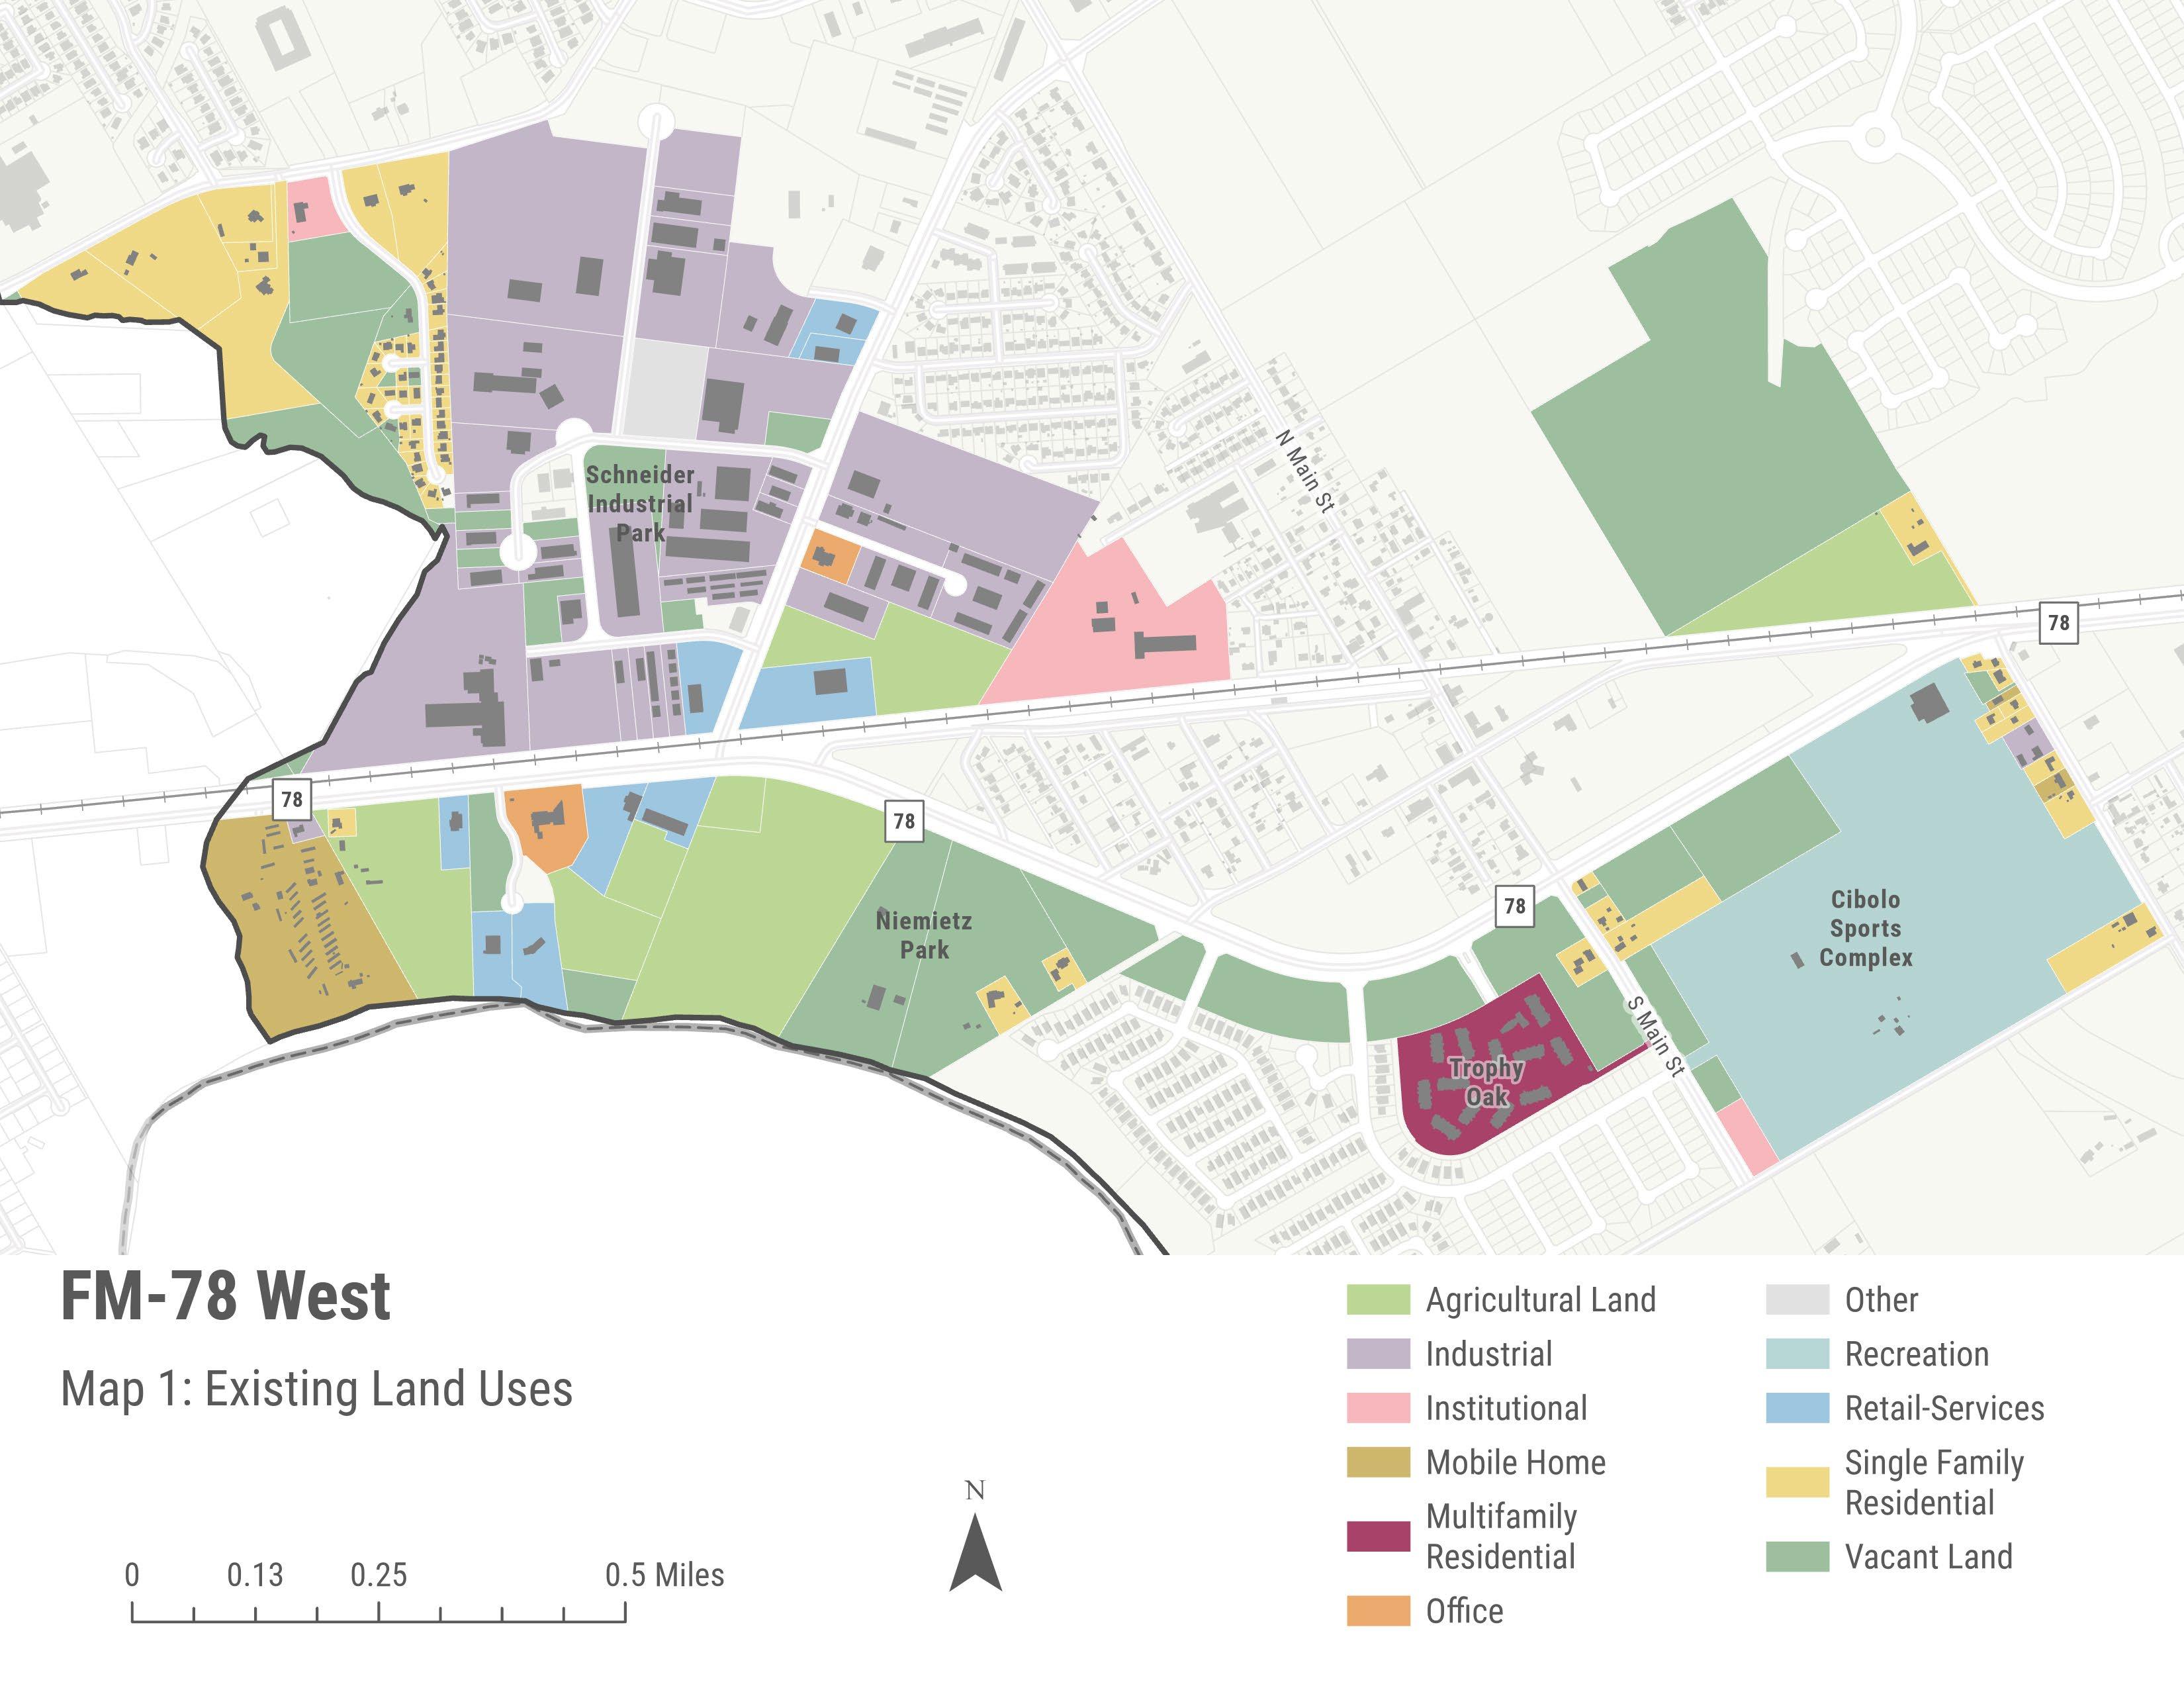
Page | 6-22
City of Cibolo, Texas Strategic Economic Development Plan
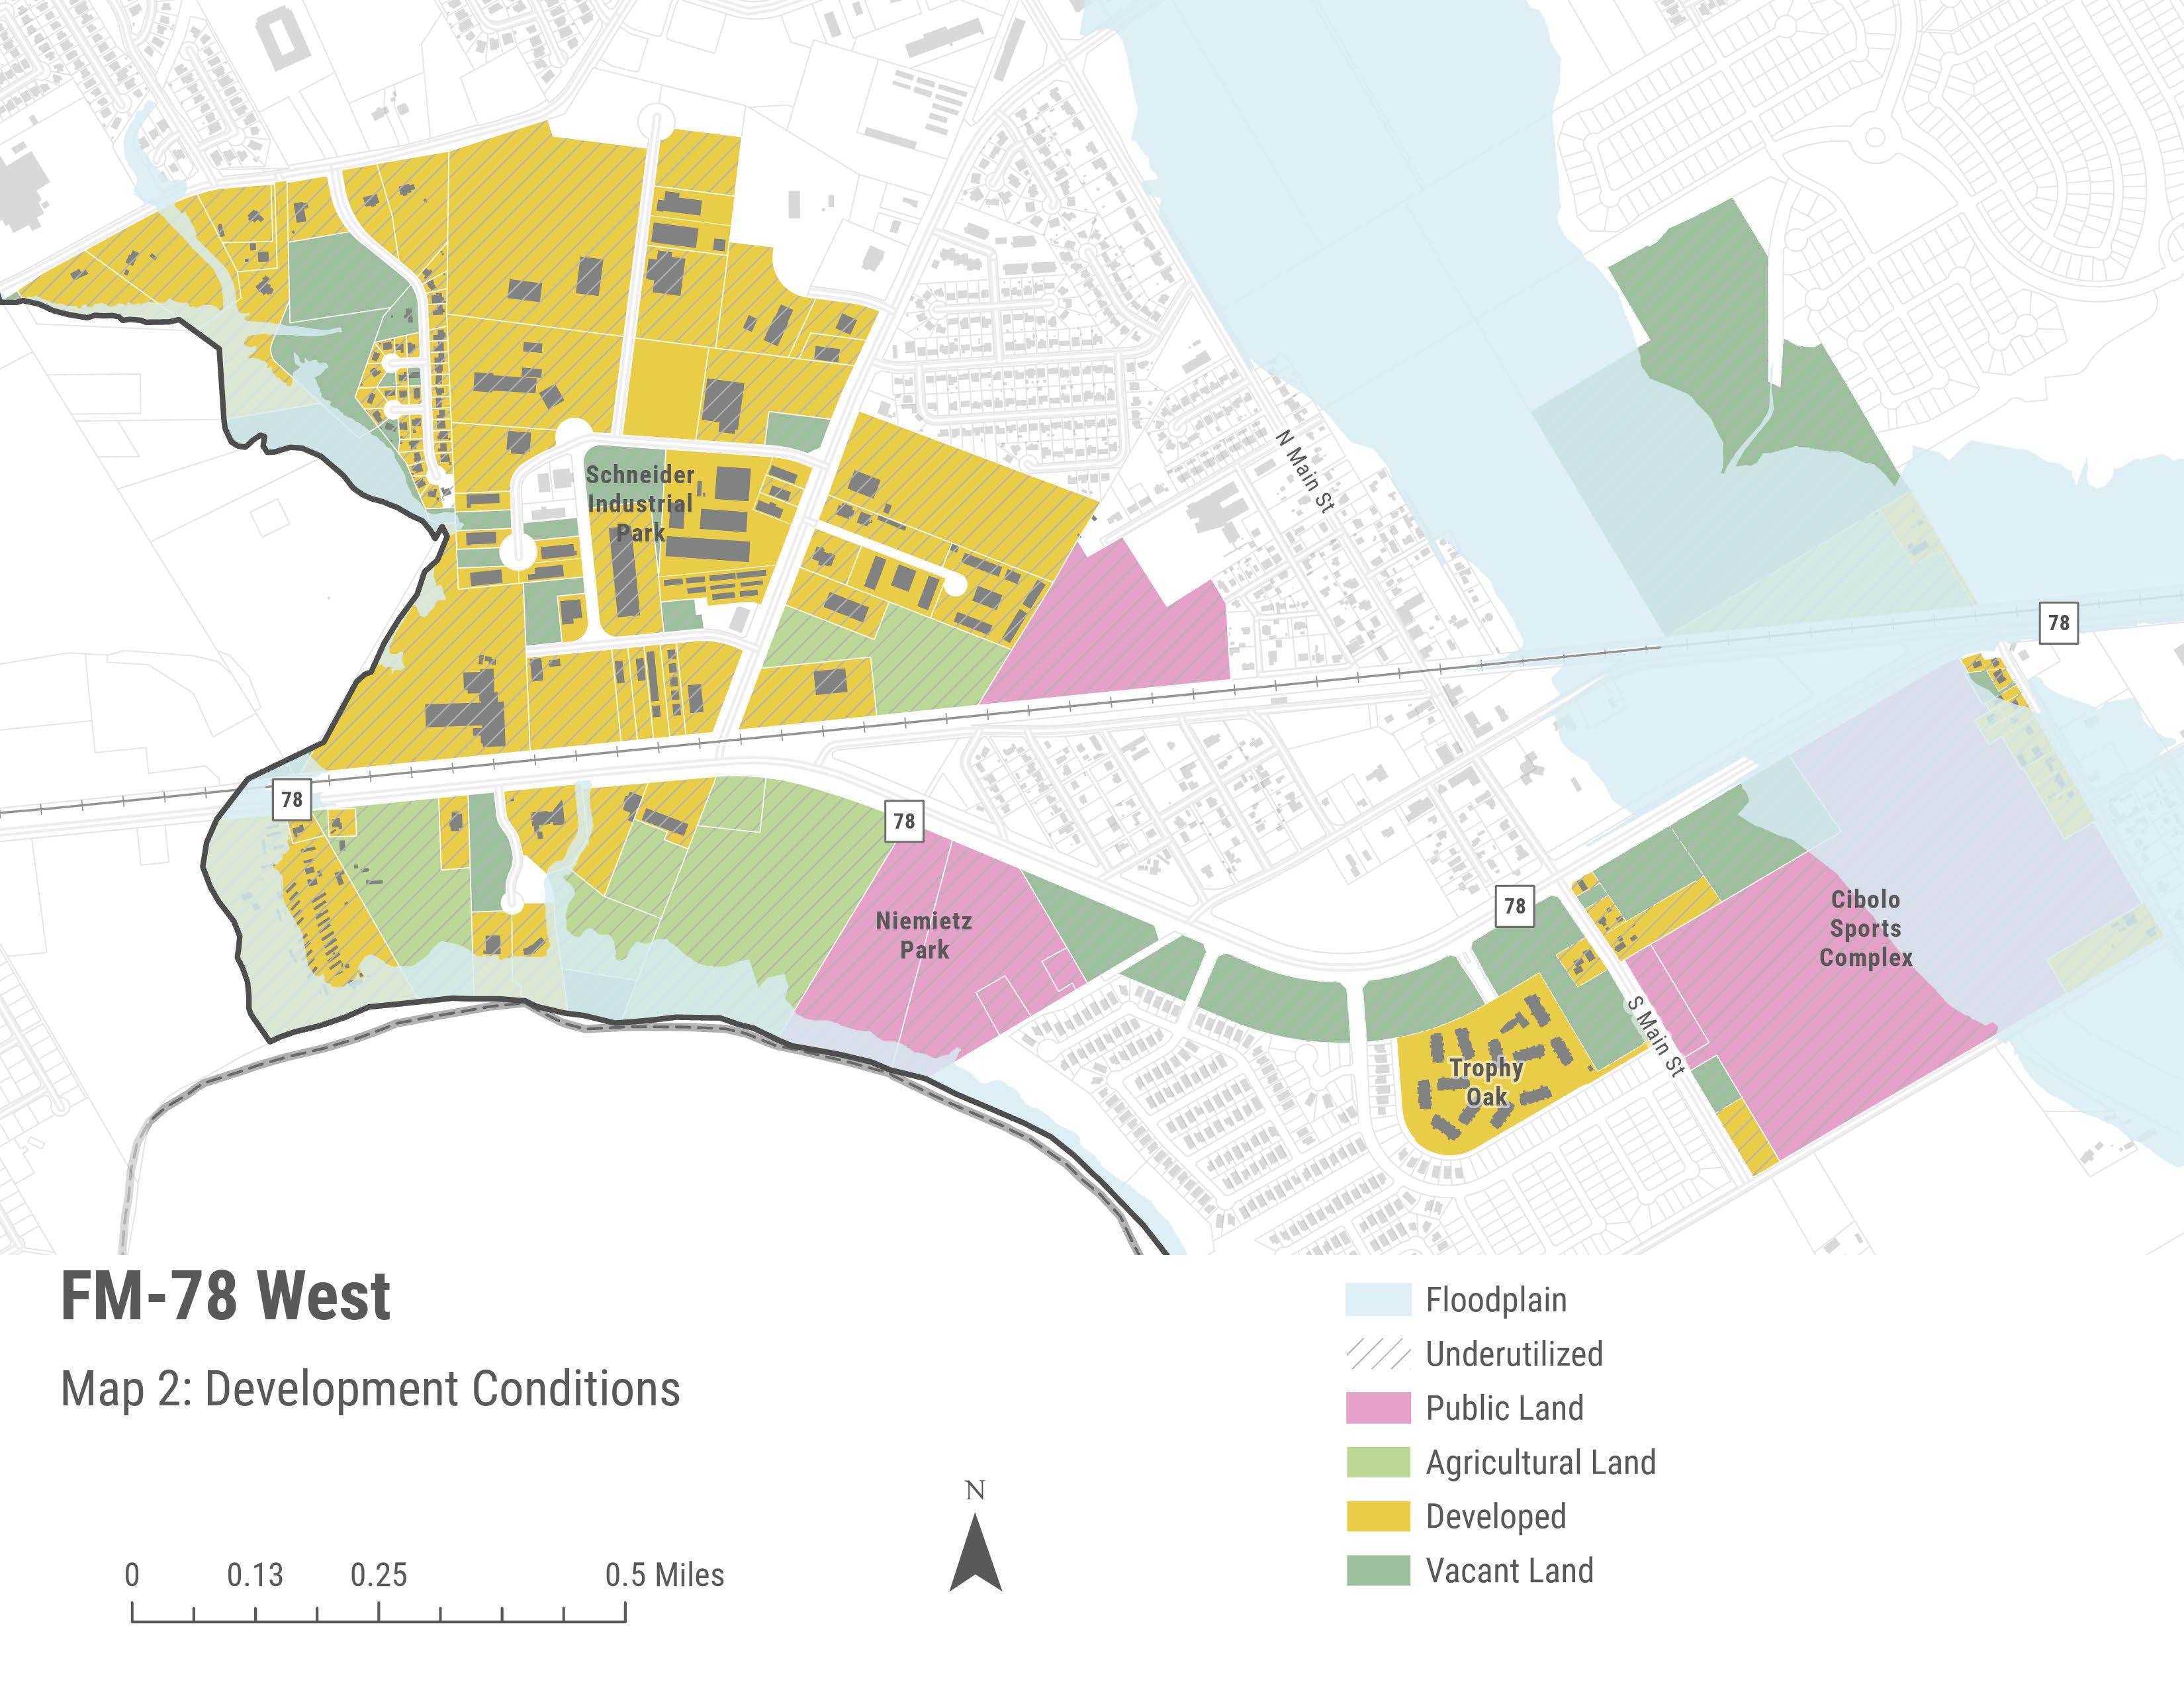
Page | 6-23
City of Cibolo, Texas Strategic Economic Development Plan
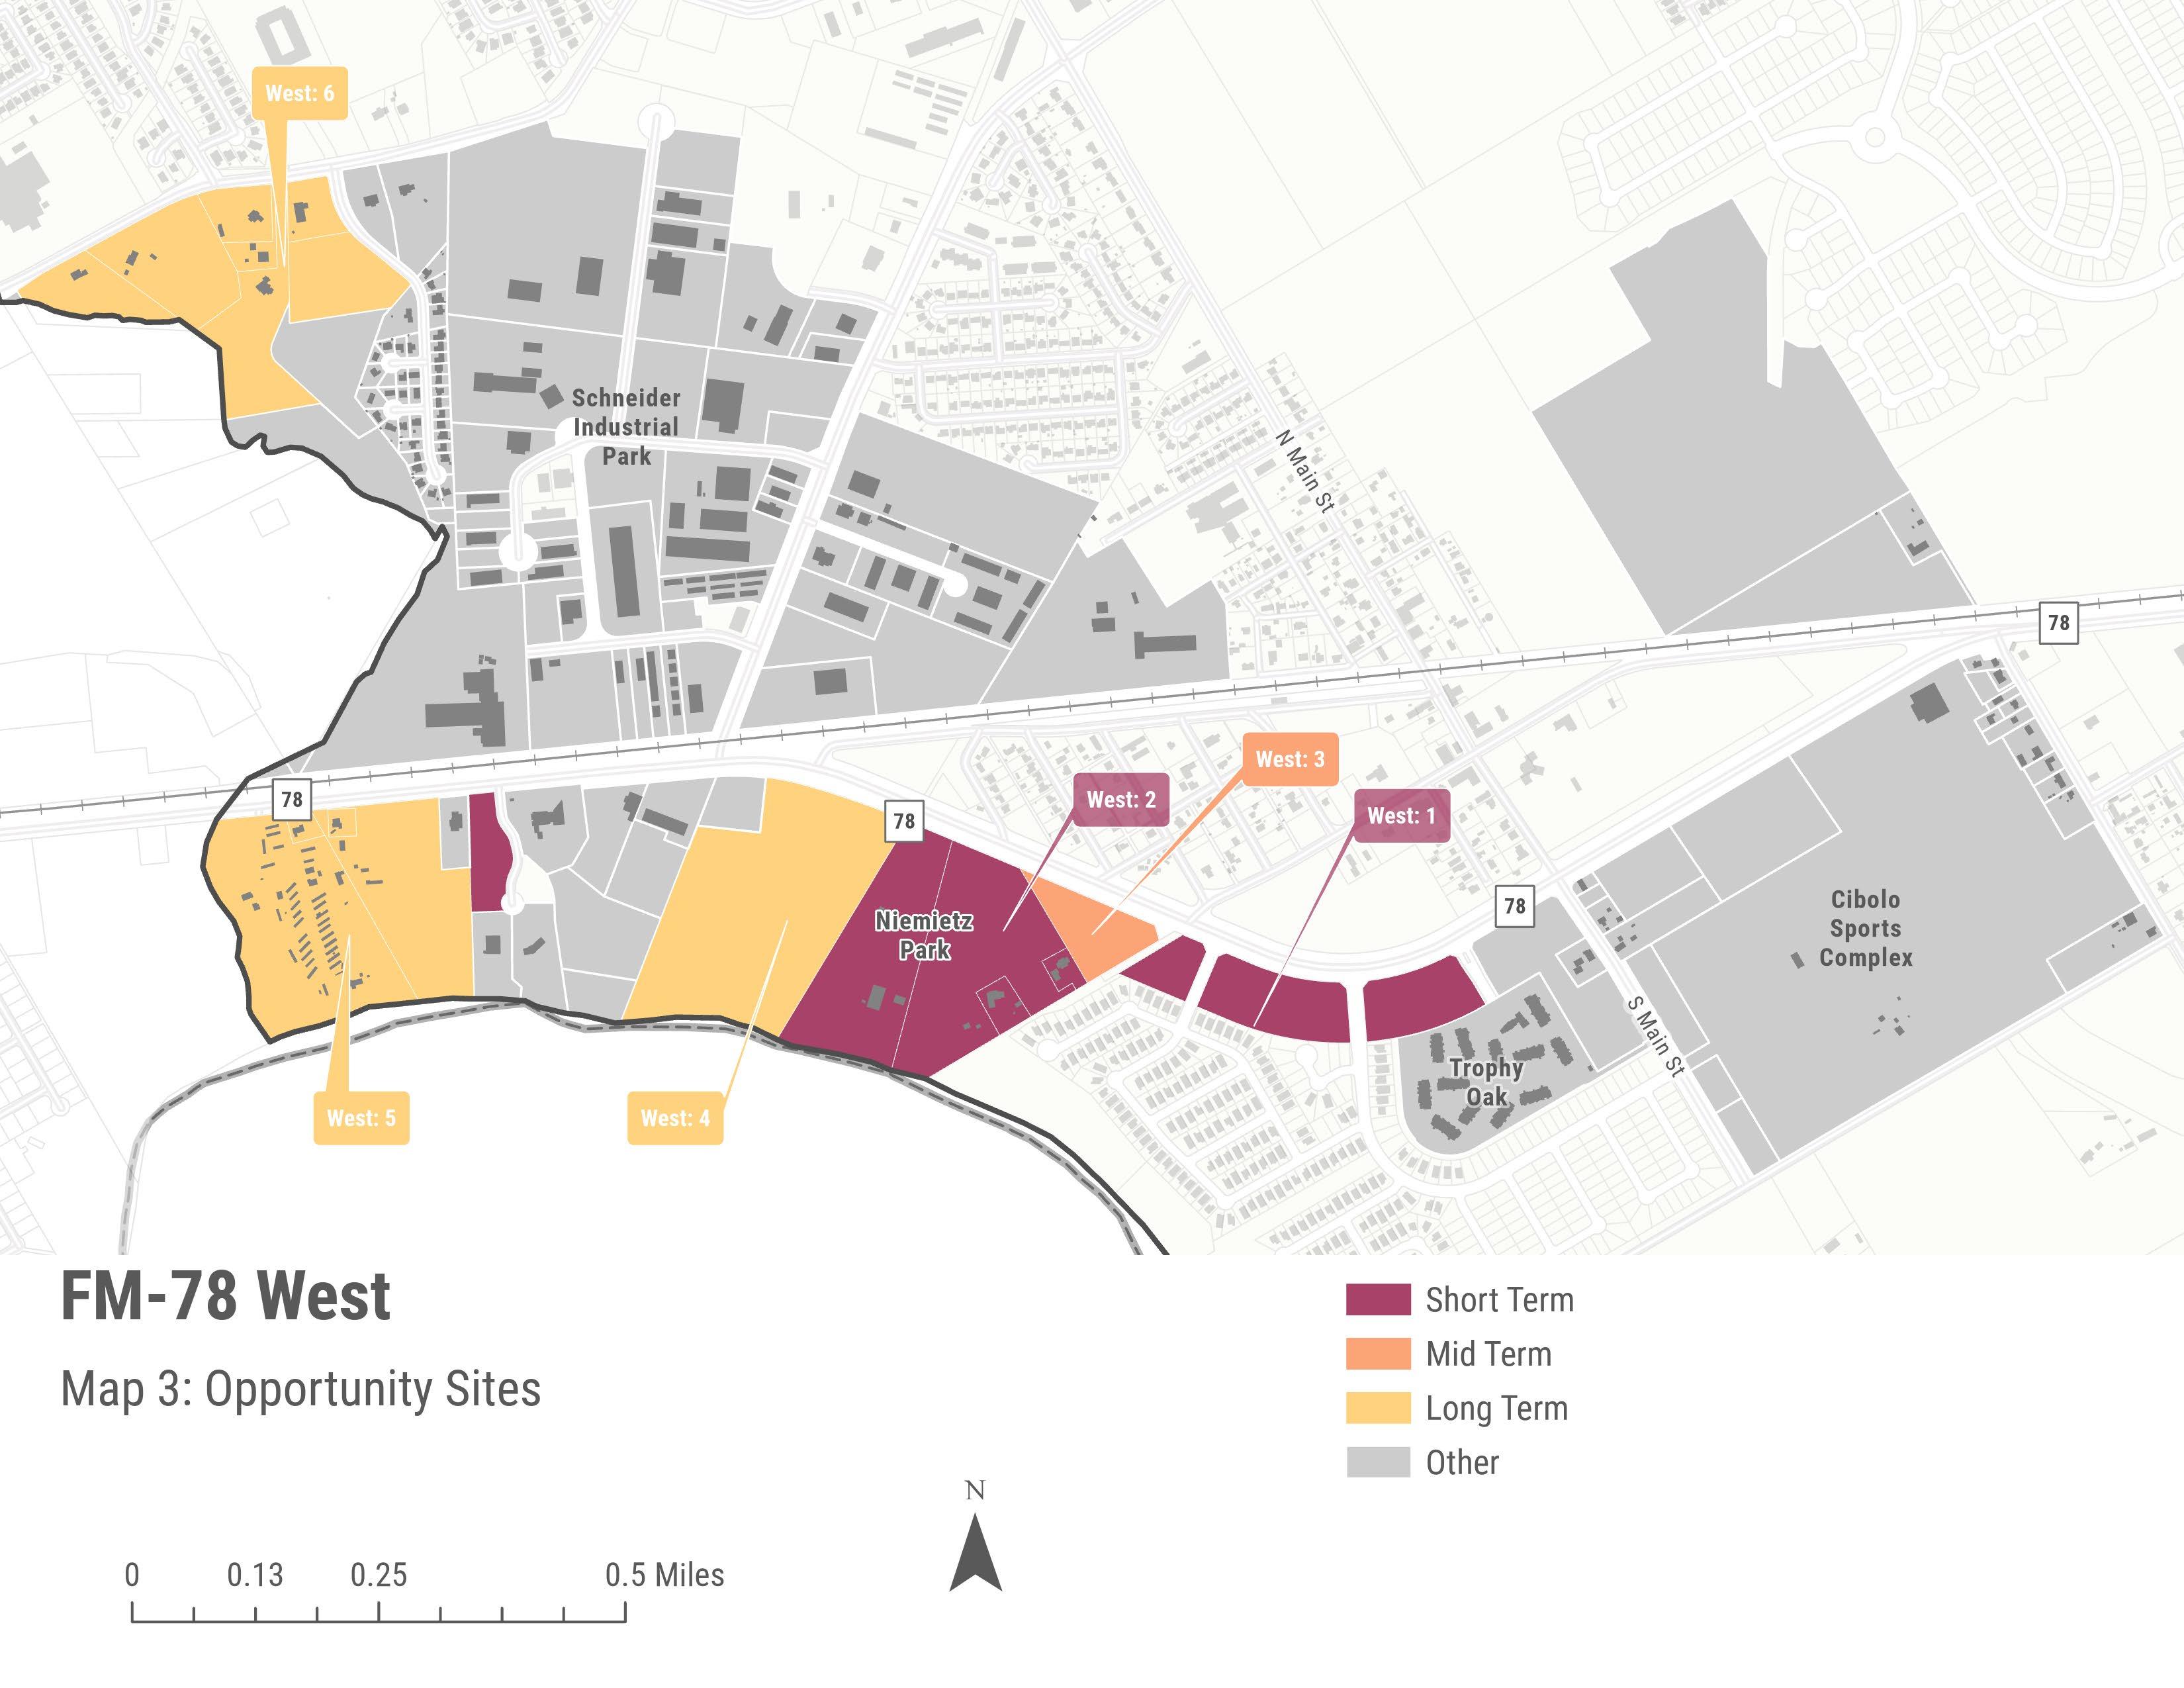
Page | 6-24
FM-78 East
The FM-78 East economic activity center has seen minimal investment, with much of the area still undeveloped. The investments that have materialized primarily revolve around mobile home parks, agricultural estates, and the ongoing construction of an expansive subdivision called Venado Crossing. With extensive land resources and integration with FM-78, the area presents an opportunity to develop a dynamic work-live-play destination. This destination could enhance the economic value of areas east of Haeckerville Road and strengthen the potential for a more dynamic employment hub along FM-78
Comprehensive Mid-Term and Long-Term Strategies
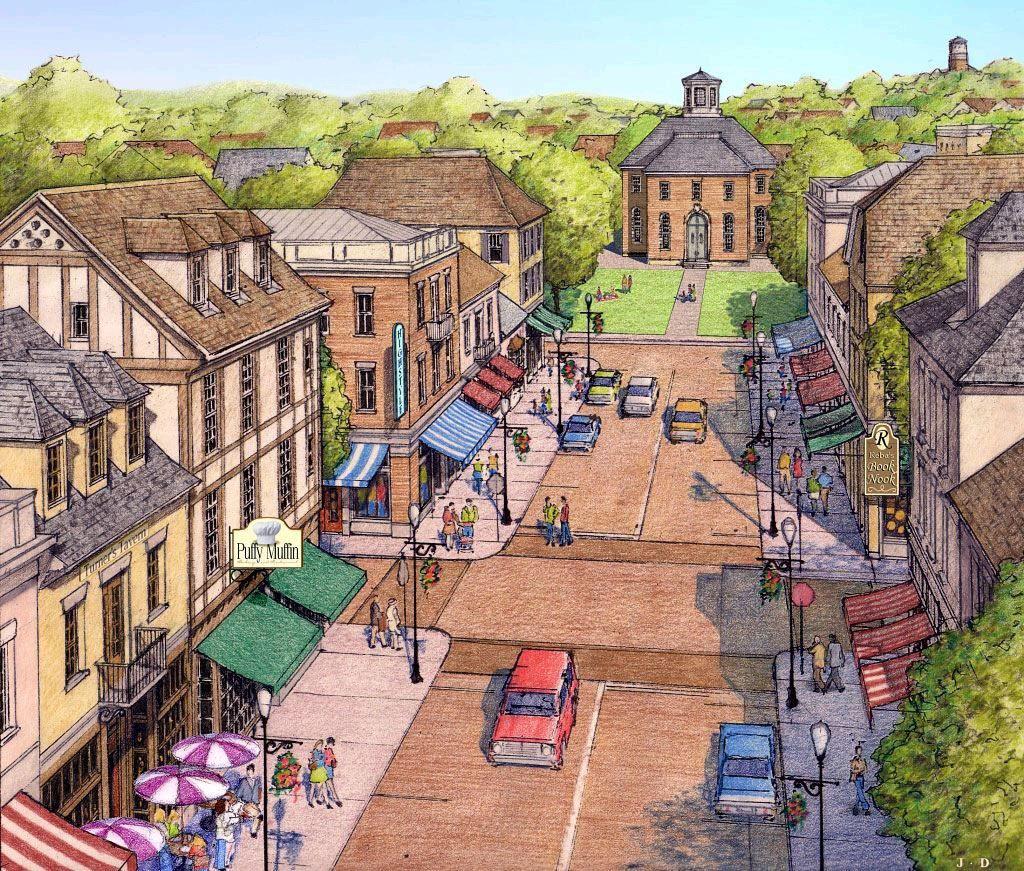
The properties within this site are intended to jumpstart the development of a secondary employment center. RKG Associates envisions creating a walkable environment with urban-inspired elements, tailored to better suit Cibolo's lower-density development patterns. This approach blends the walkability and energy of urban areas with the unique character and scale that define Cibolo's community identity. Below are a couple of examples resembling RKG Associates' vision for the area, design ed with active commercial uses to foster vibrant street life. The most commercially intensive uses would be situated near FM78, allowing nearby residents to walk to the area while also facilitating easy access for visitors by vehicle.
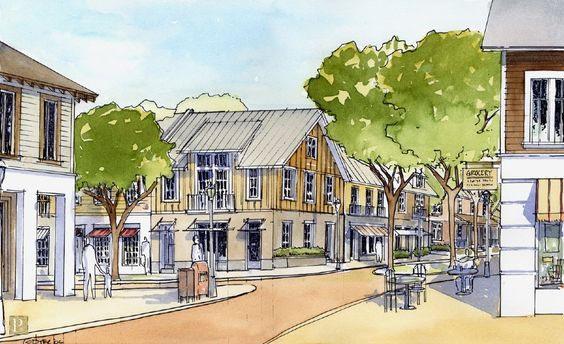
City
Strategic Economic Development Plan Page | 6-25
of Cibolo, Texas
of Cibolo, Texas
The sliding density scale development approach, with the highest densities near FM-78 while decreasing in distance from FM-78, offers application to this area. Further away from FM-78 could be composed of diverse housing typologies arranged into a neo-traditional neighborhood setting. This arrangement would include a mixture of missing middle housing, townhomes, and single family residential seamlessly integrated with walking trails and pocket parks. Below are a couple examples that illustrate potential design opportunities.
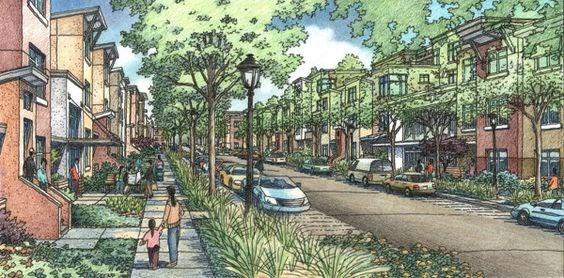
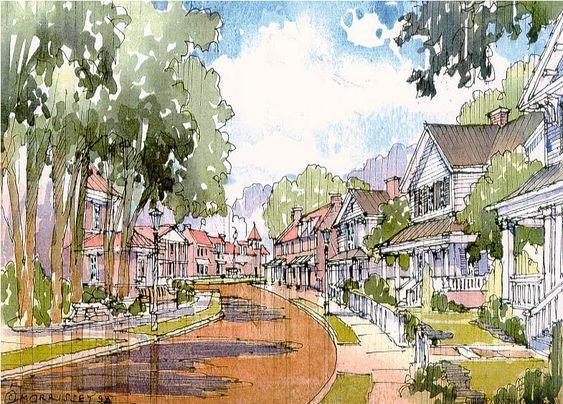
Strategic Economic Development Plan Page | 6-26
City
City of Cibolo, Texas
Economic Development Plan
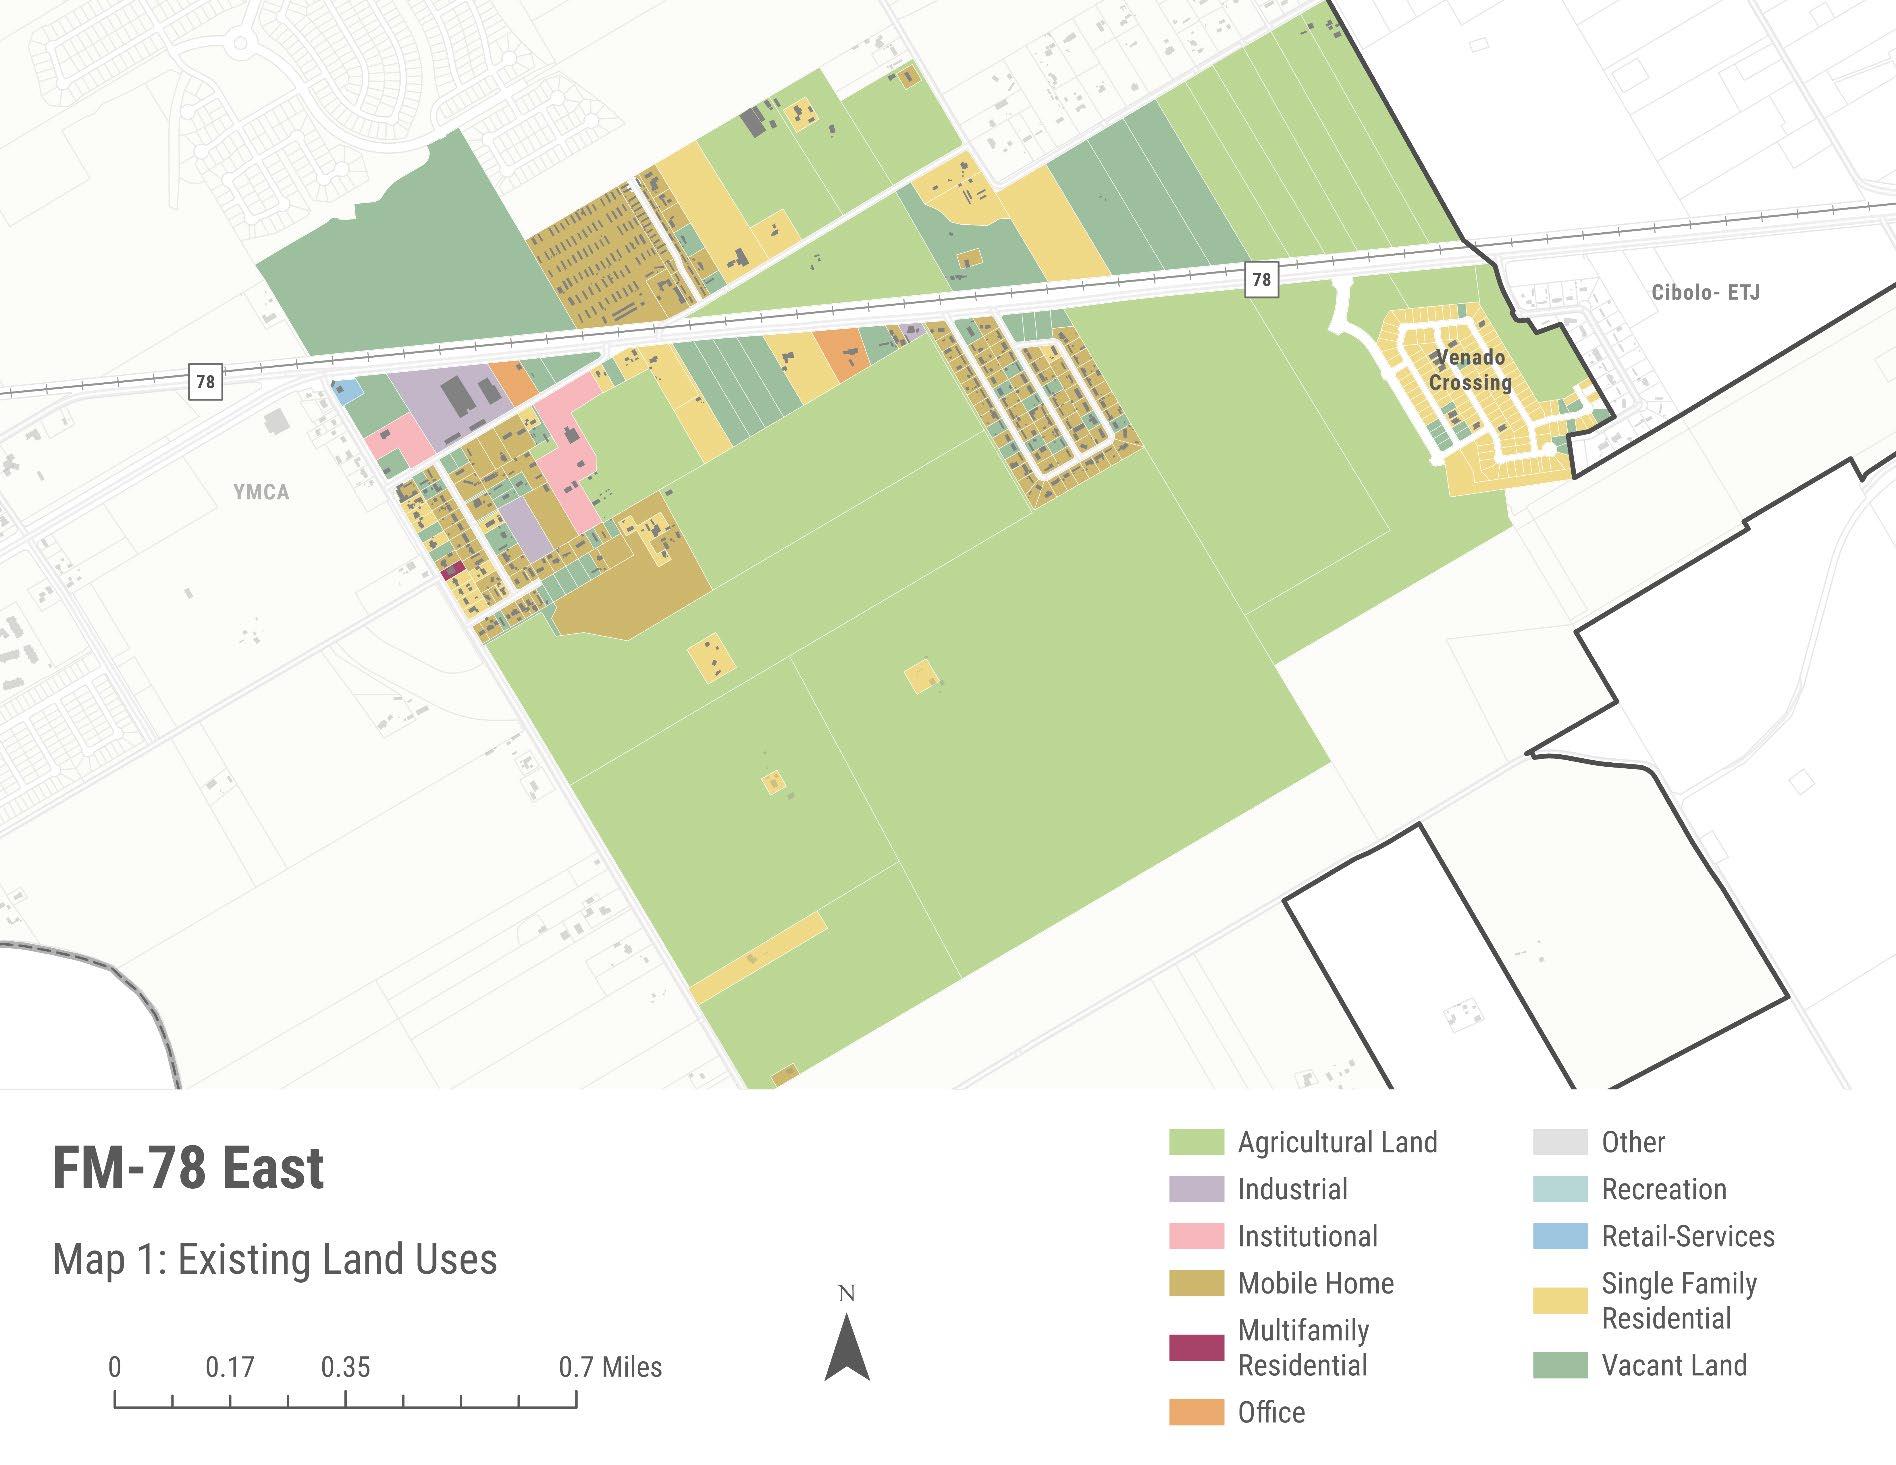
Page | 6-27
Strategic
City of Cibolo, Texas
Economic Development Plan
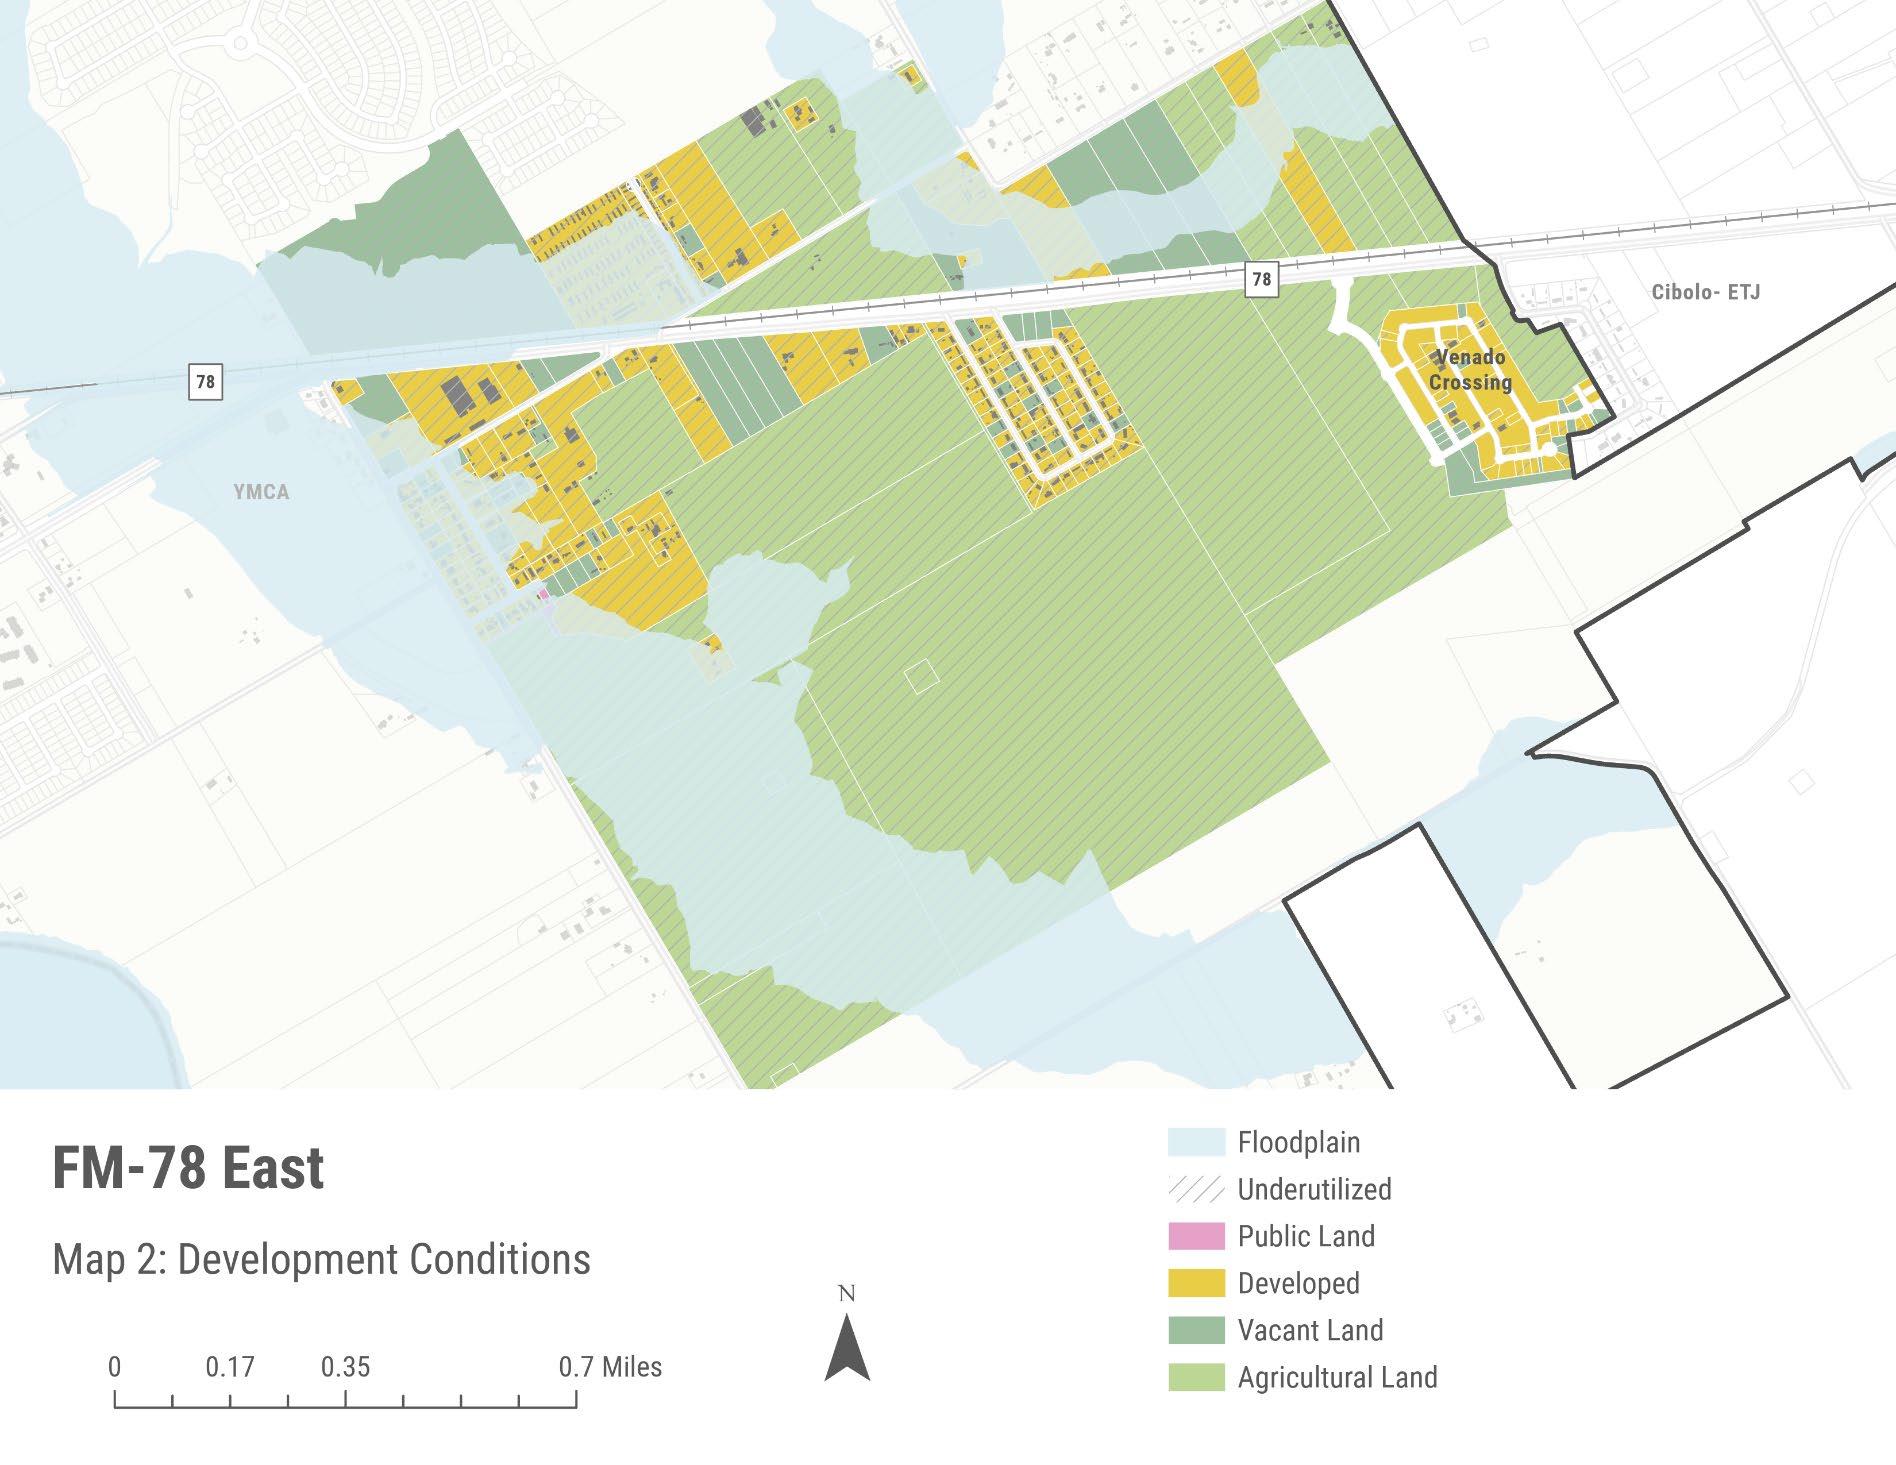
Page | 6-28
Strategic
City of Cibolo, Texas
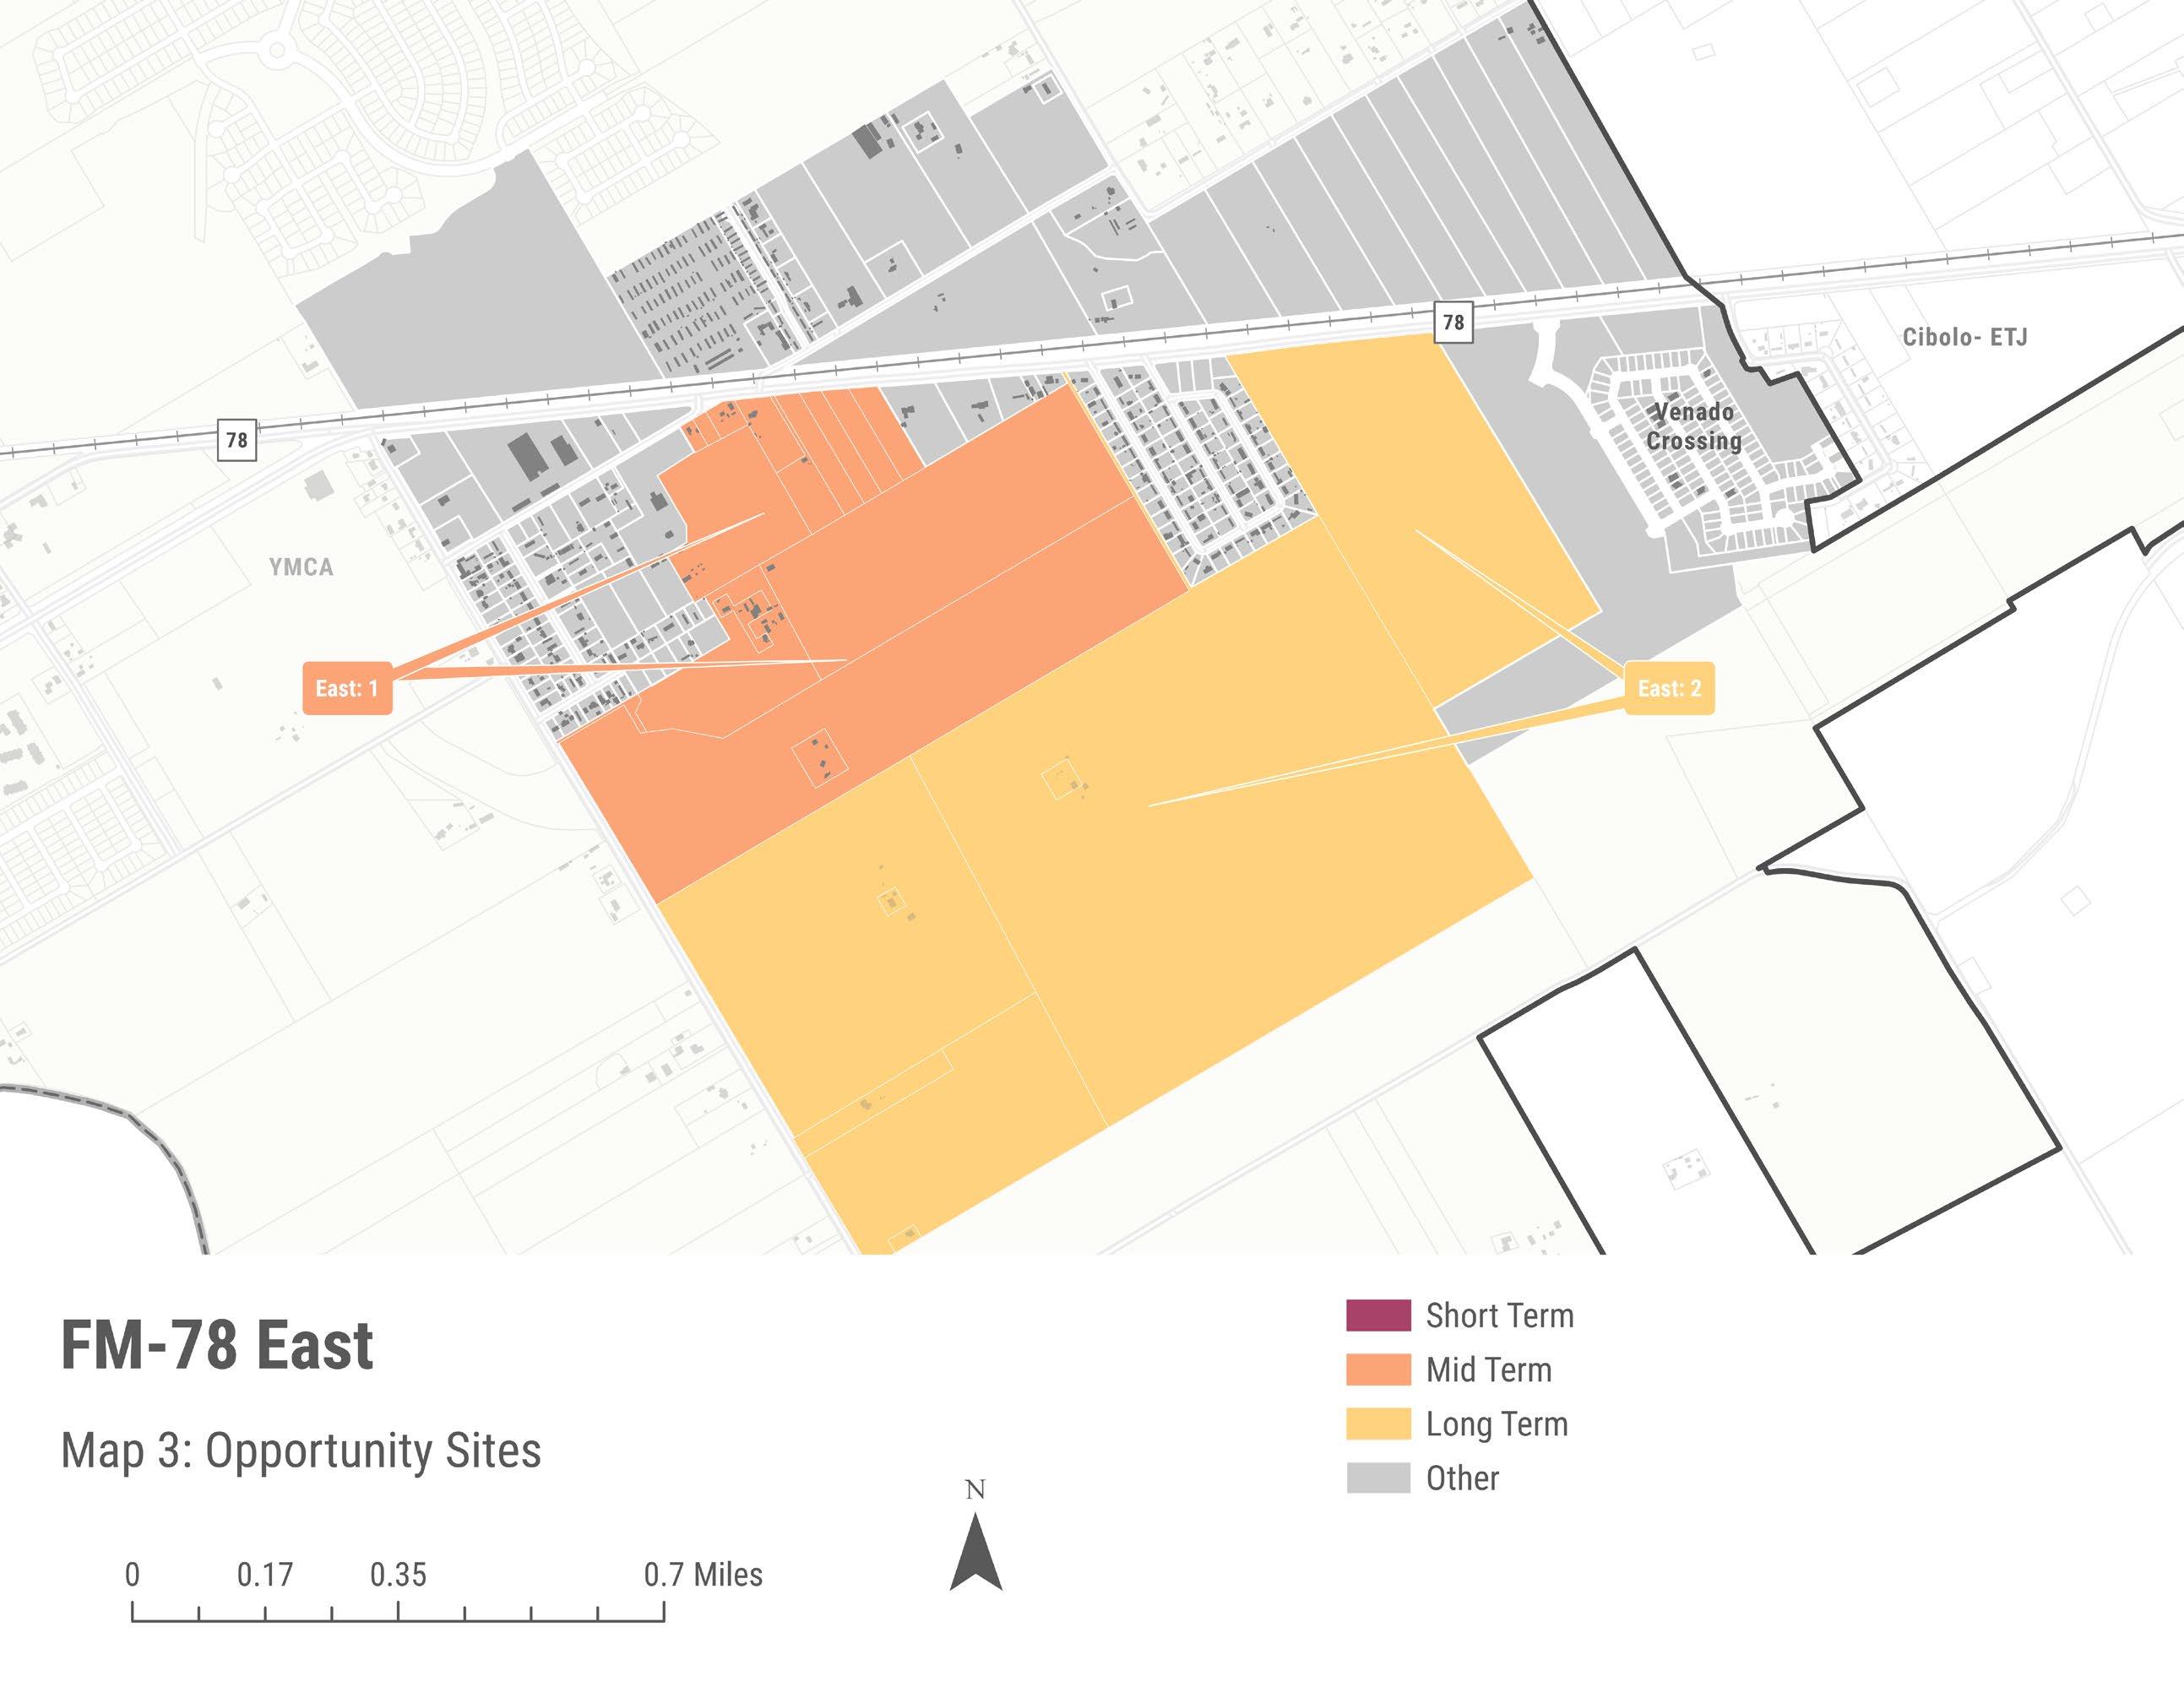
Page | 6-29
Strategic Economic Development Plan
I-10 Corridor
The Interstate 10 economic activity center is an advantageous area for industrial investment given the substantial developable acreage that can absorb manufacturing facilities and logistics based operations. Developable land along with the area’s direct access to I-10 has attracted significant industrial investment in the previous decade, including AISIN and the nearly operational OMNI industrial park. Streamlining future industrial development can accelerate the city’s productionbased economy, Cibolo’s most viable opportunity for job growth in the short-term.
SHORT TERM STRATEGIES
I-10: 1, Redevelopment
It is RKG Associates understanding that the raceway owner seeks to pursue redevelopment that can generate economic returns. RKG Associates recommends coordinating with the raceway owner to focus marketing the site for a single large-scale industrial facility similar to the AISIN plant
I-10: 2, Proactive Outreach
Omni Industrial Park is nearly operational. The City should coordinate with the property owner to inquire on the types of production-based businesses considering lease agreements, and then collaborate on a marketing and outreach campaign to businesses within the City’s target industry clusters.
I-10: 3, Small-Scale Flex Space
Opportunity site #3 is not as large as some of the other opportunity sites in this activity center. Creating a strategy to target different sizes and scale of businesses is more logical for this site and creates opportunities for support businesses to locate near the larger companies they serve (e.g., AISIN). Creating an investment fund to create pad-ready sites for small-scale flex spaces can accelerate these development types while maximizing the potential of smaller parcels in the I-10 corridor.
MID TERM STRATEGIES
I-10: 4 and I-10: 5, Creating an Industrial Employment Cluster
Much of the I-10 corridor is located outside the City’s boundaries. RKG Associates understands that the City envisions the creation of two gateway developments along I-10 at the eastern and western boundaries of the City. However, there is a large area bounded by Bolton Road to the south, Haeckerville Road to the west, Schmoekel Road to the north (extended to Haeckerville Road) and Santa Clara Road to the east. RKG Associates recommends this area, which includes sites #4 and #5, be zoned as a large-scale employment cluster focused on production-based industries, as this area offers the highest potential to expand the city’s employment base and fiscal sustainability. Working with property owners in the ETJ area to annex into the City should be a goal for Cibolo, creating the proper business environment to encourage owners.
City of Cibolo,
Strategic Economic Development Plan Page | 6-30
Texas
City of Cibolo, Texas Strategic Economic Development Plan
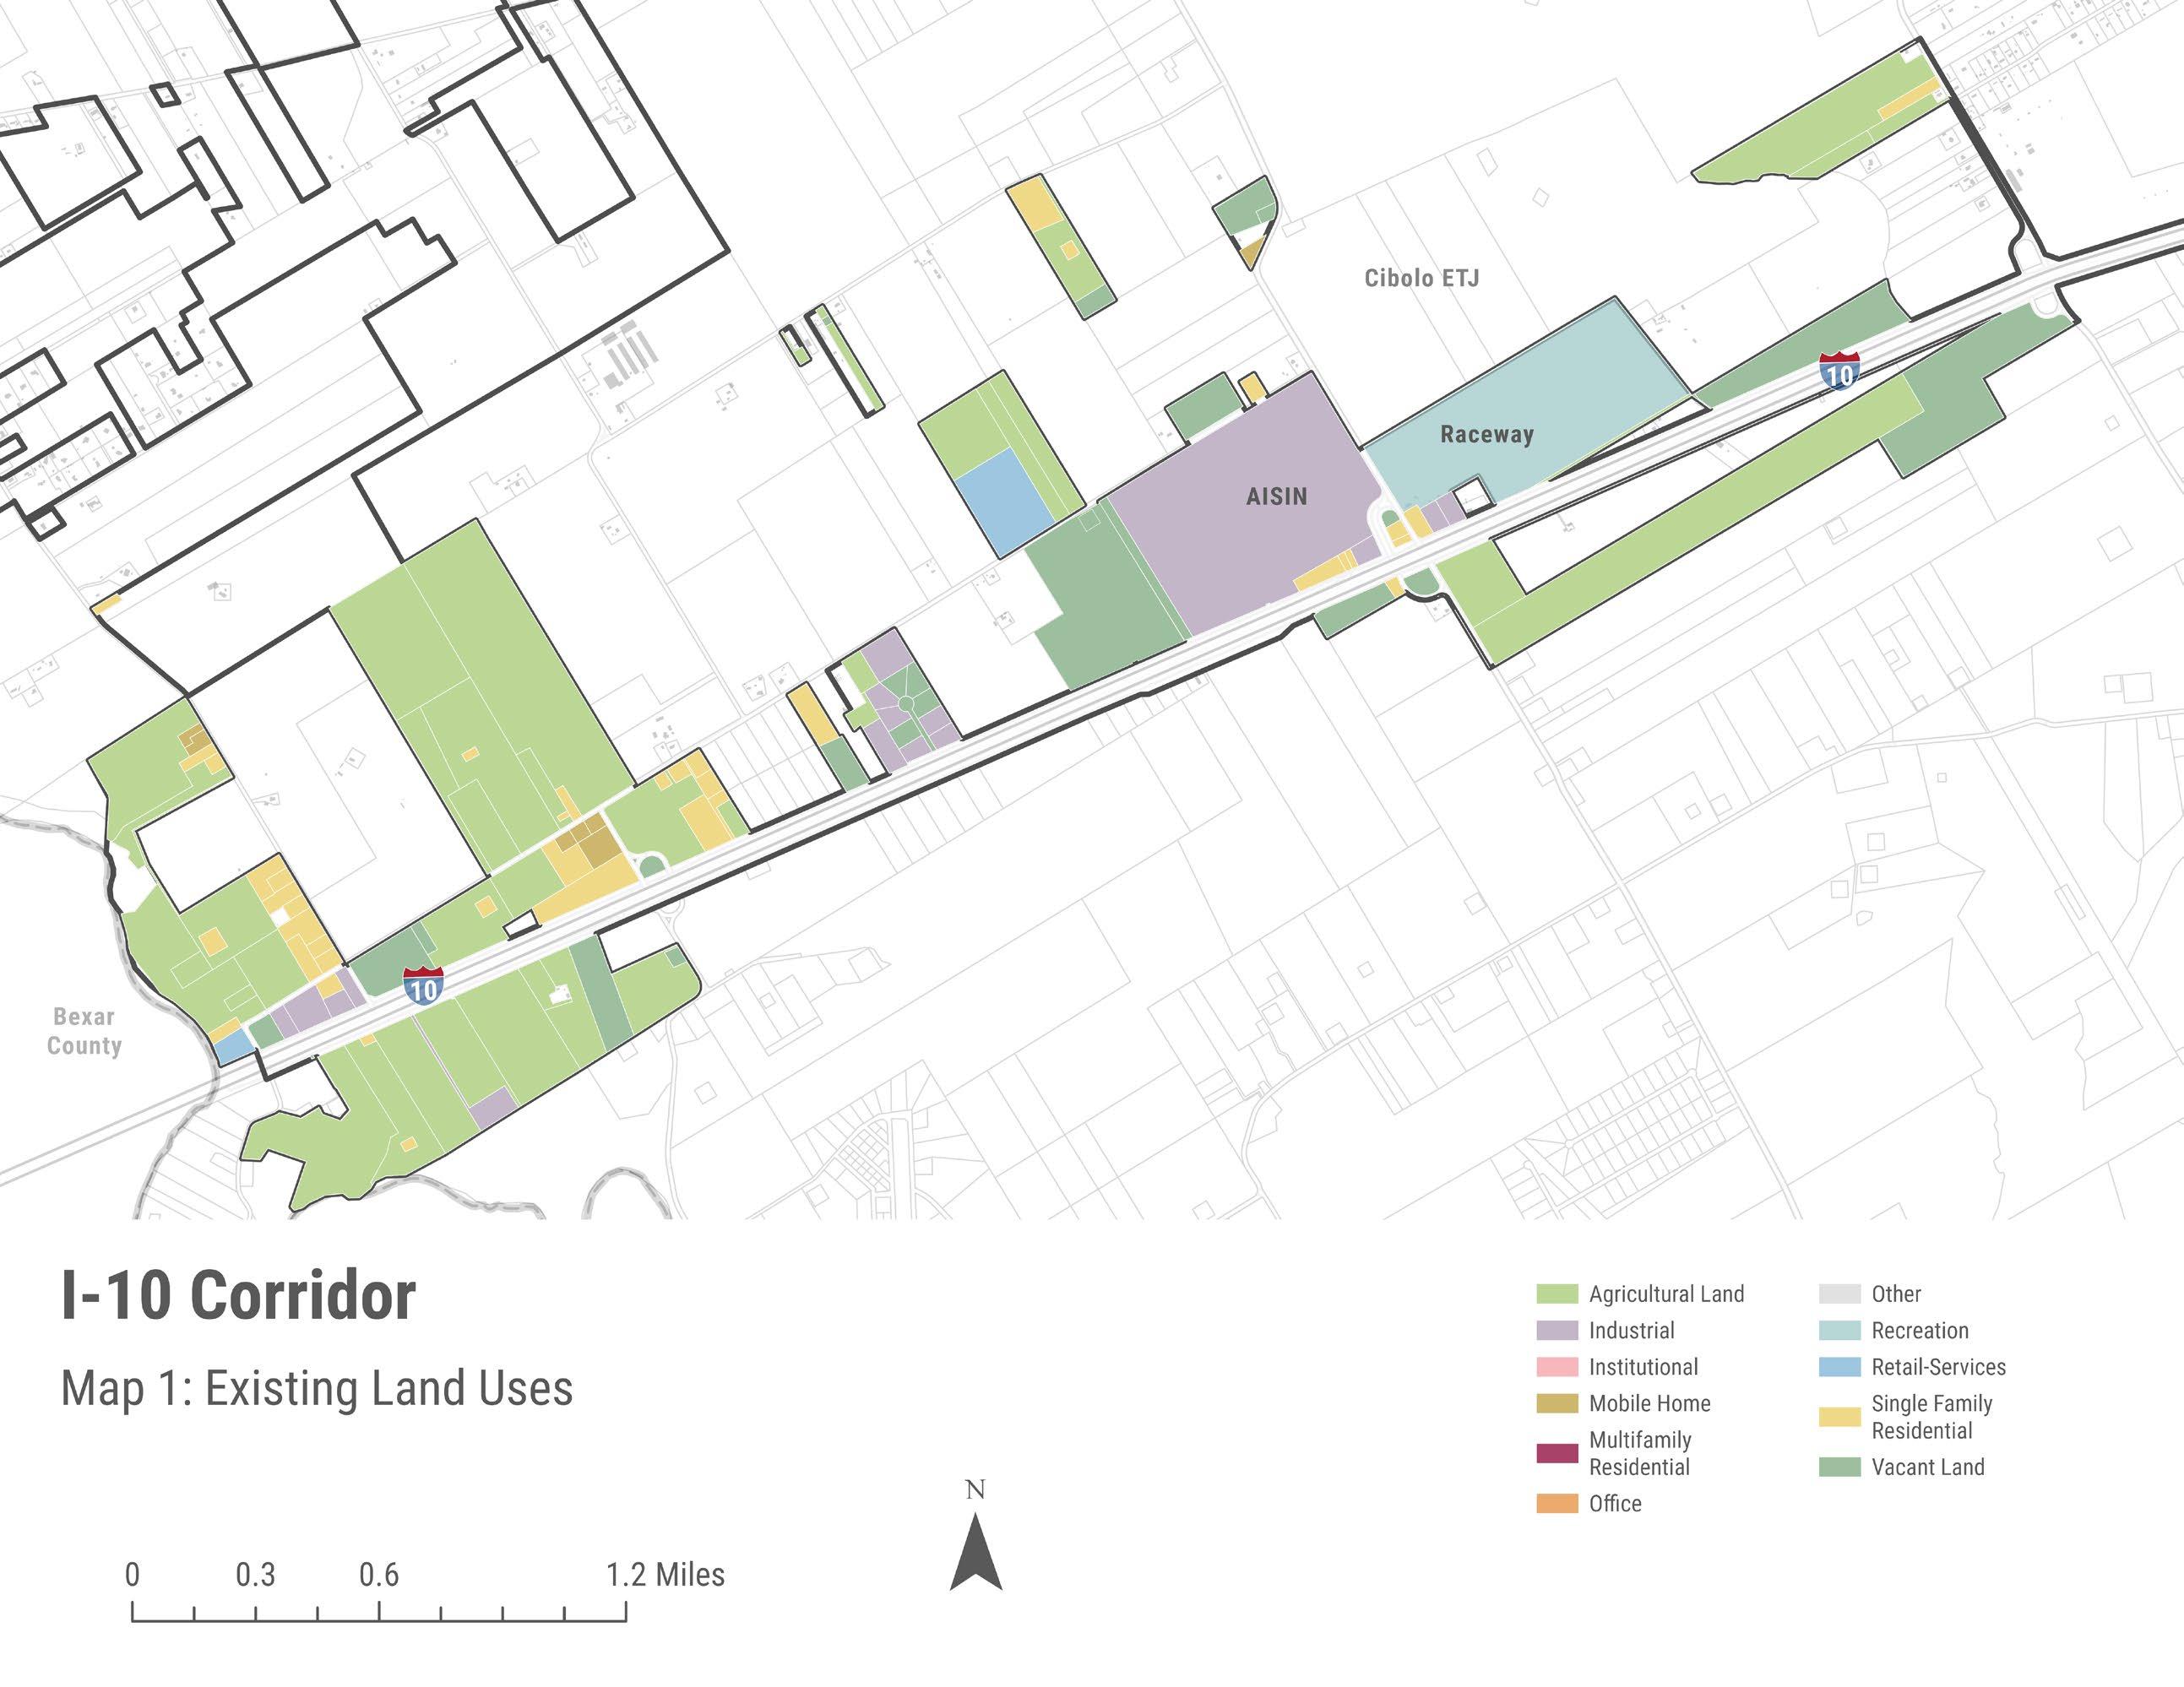
Page | 6-31
City of Cibolo, Texas Strategic Economic Development Plan
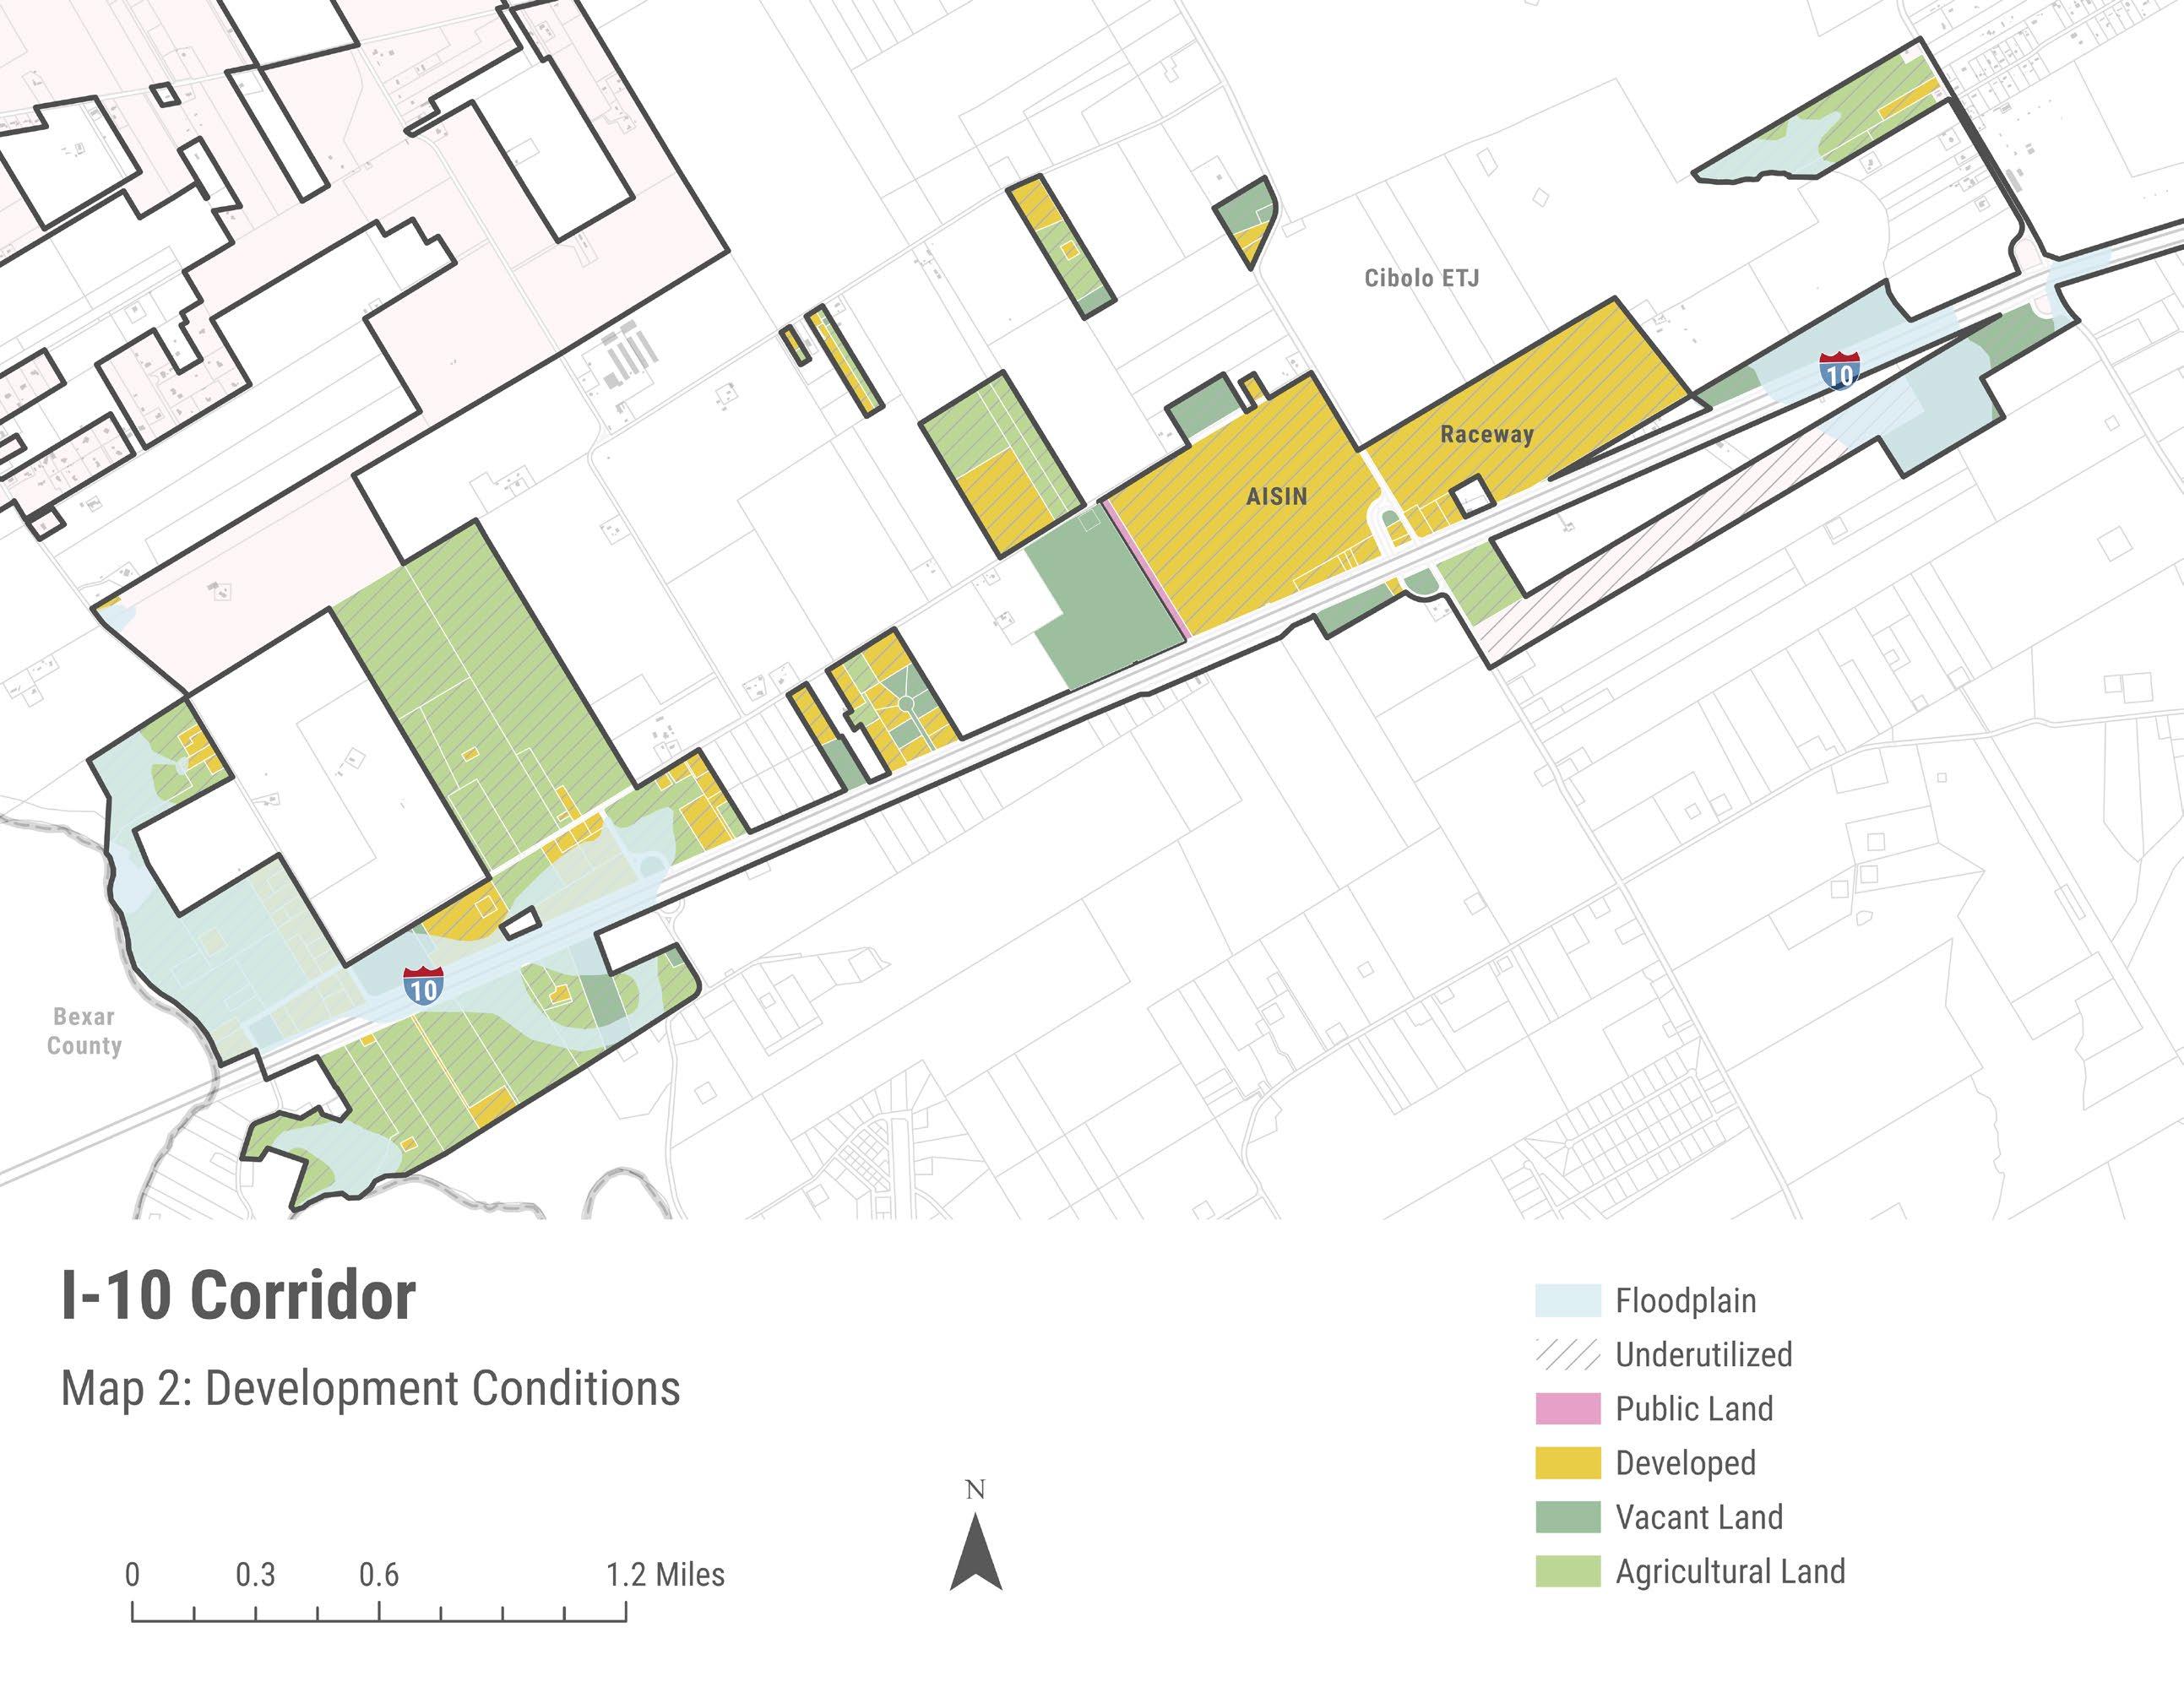
Page | 6-32
City of Cibolo, Texas Strategic Economic Development Plan
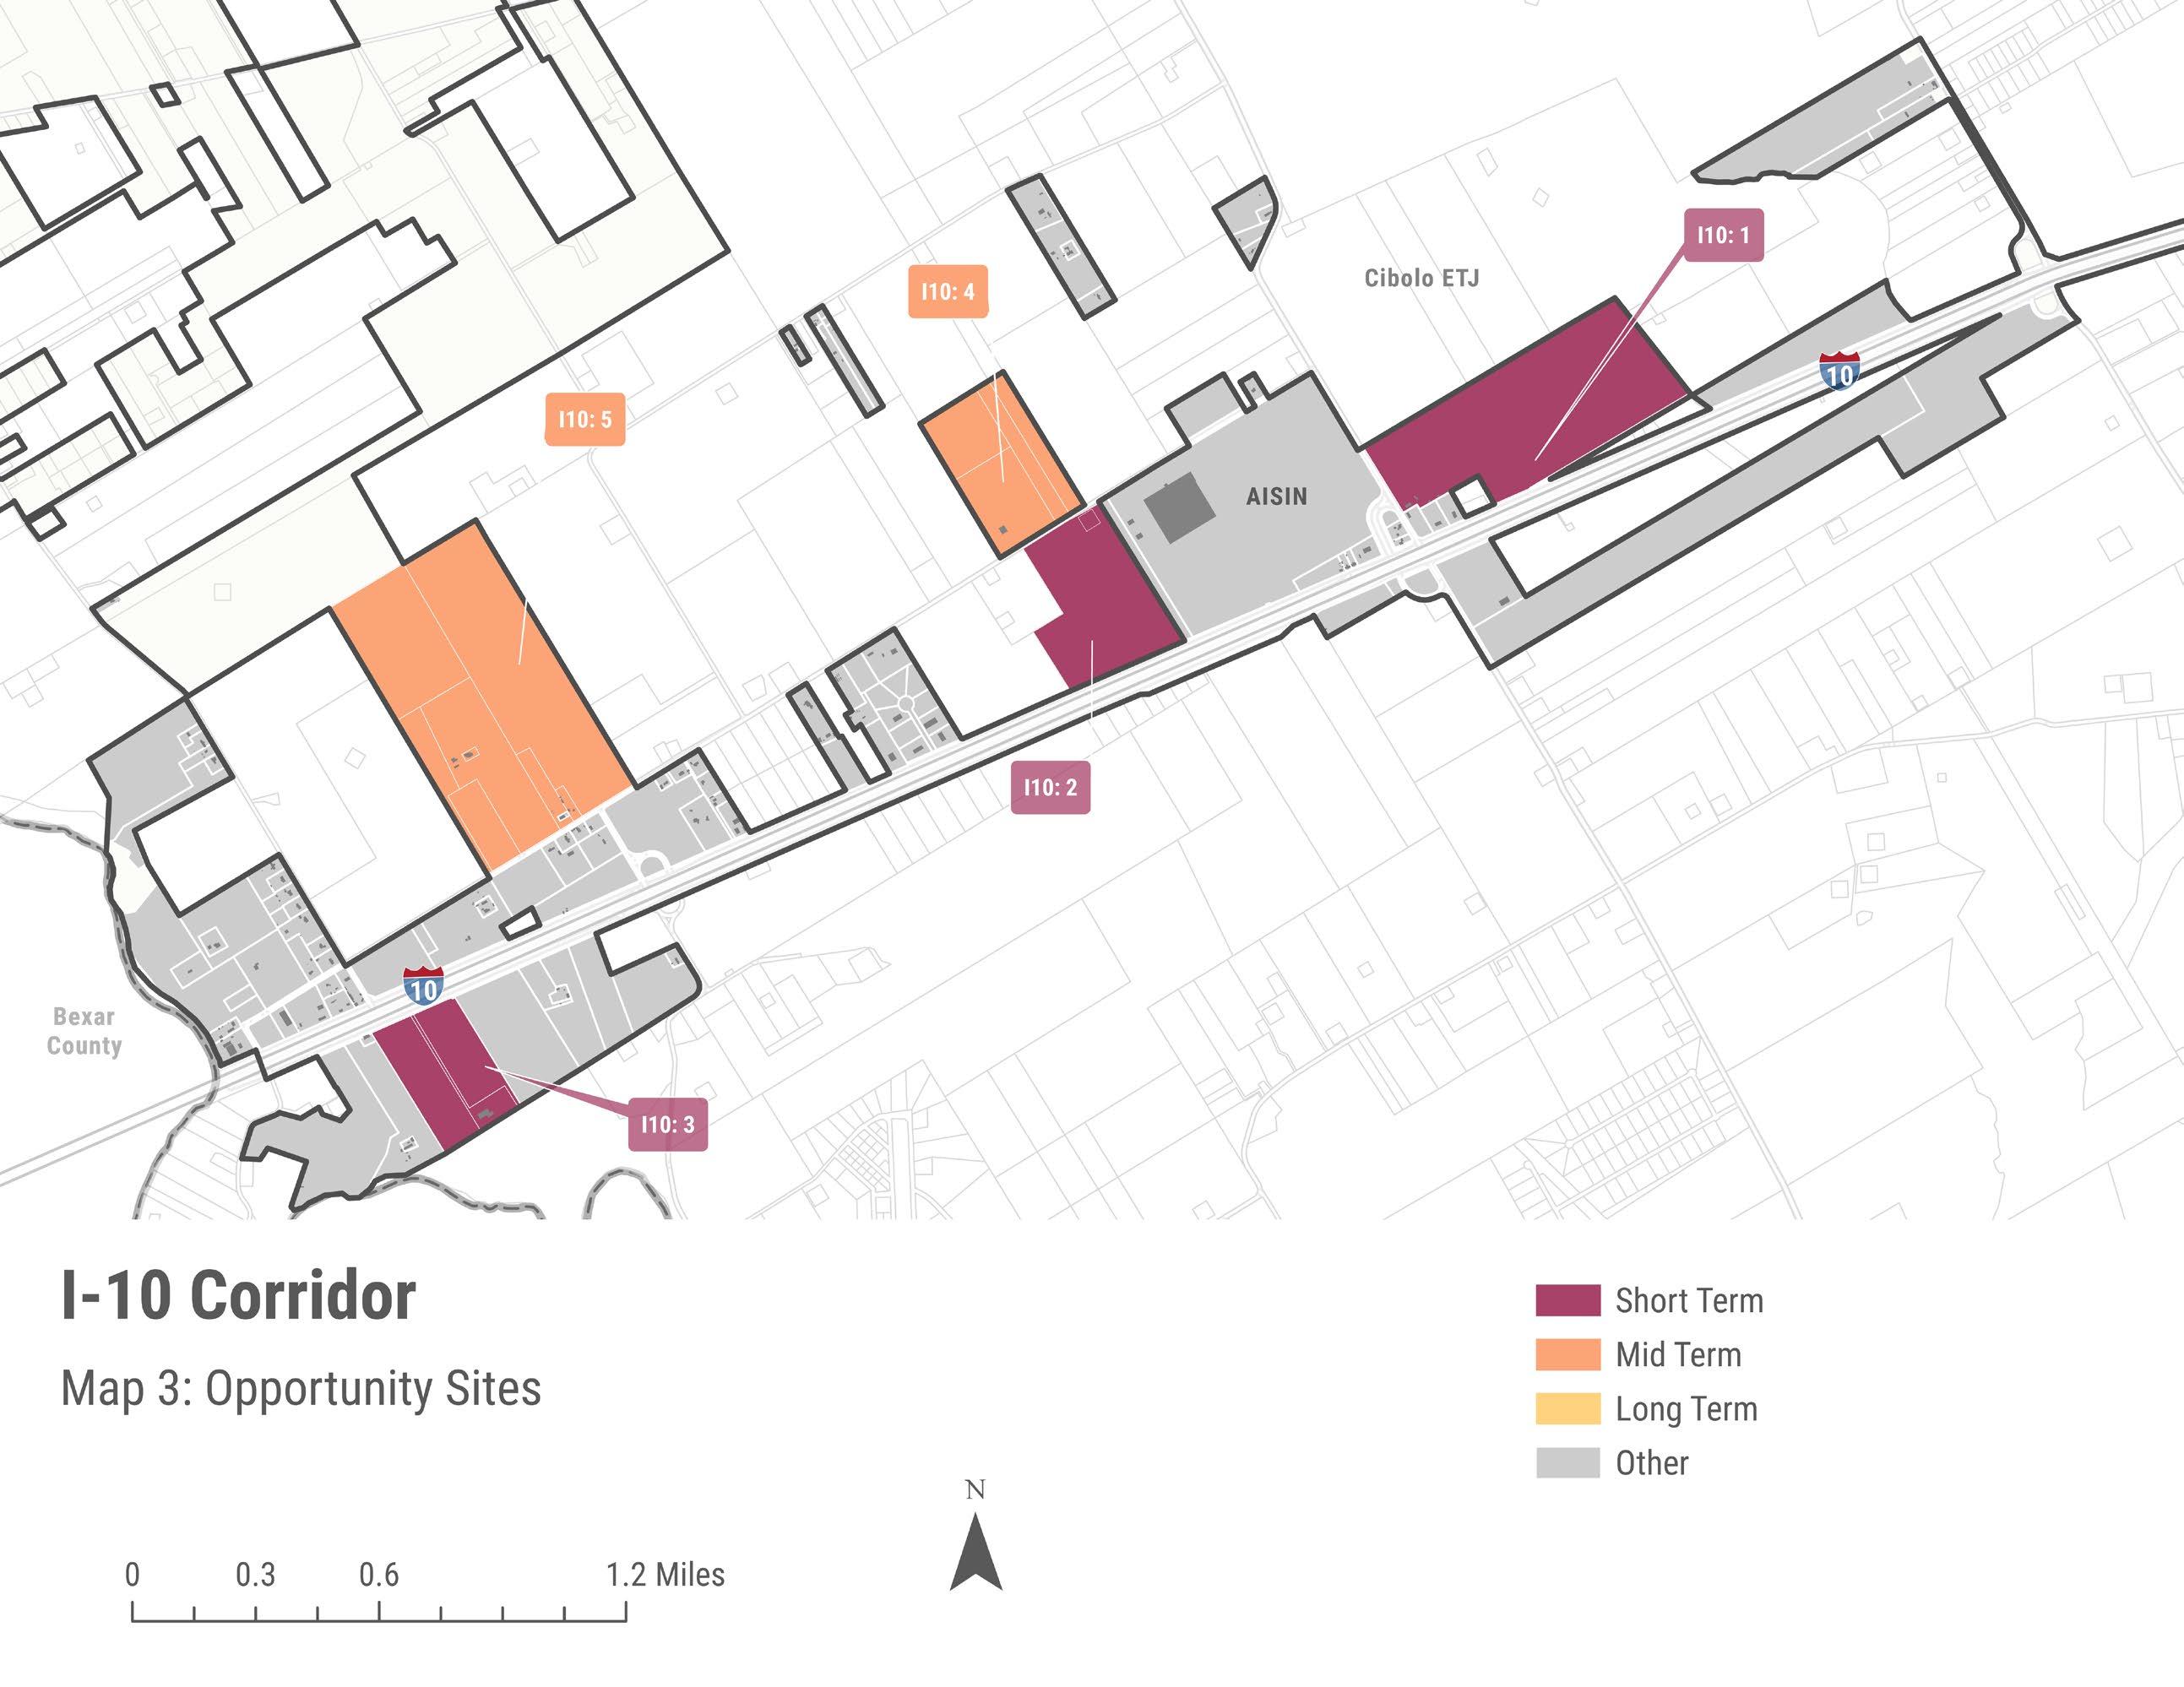
Page | 6-33
7. I MPLEMENTATION
INTRODUCTION
This chapter discusses economic development strategies for the City of Cibolo Economic Development Corporation (EDC) and the City Council to adopt, recommended by RKG Associates and the Working Group (listed in the Introduction section). These strategies were crafted on account of feedback from local and regional implementation partners, empirical research, and input from the City of Cibolo EDC, elected officials, and staff. The initial section of this chapter details the defined principles and goals identified by the City Council and the EDC board of directors. The next sections detail discrete ‘priority action’ recommendations and implementation steps to assist the Cibolo community in pursuing their economic development goals.
STRUCTURE OF THE PLAN
The implementation strategy is organized into six general topic areas: [1] Business Retention and Expansion; [2] Business Recruitment; [3] Existing Asset Development; [4] Toolbox Development; [5] Outreach, Communication, and Marketing; and [6] Organization and Coordination. These topic areas reflect the basic tenets of effective business retention, expansion, and recruitment activities.
The success of each topic area depends on the effectiveness of all other topic areas. For example, the City’s business retention and expansion strategies will depend on committing to a comprehensive and proactive marketing, outreach, and communication strategy with existing businesses within Cibolo. Without consistent communication, the City will be limited in its effectiveness when trying to engage individual businesses regarding growth needs and challenges.
PROPOSED ECONOMIC DEVELOPMENT GOALS
The assembled Working Group represents the various public and private perspectives that influence and are influenced by the City’s economic development efforts. This Working
City of Cibolo, Texas Strategic Economic Development Plan Page | 7-1
Group provided guidance and feedback throughout the development of this plan. As part of that effort, a comprehensive outreach strategy was held to identify, refine, and prioritize the City’s economic development goals that were initiated through previous efforts. These goals were presented and reviewed with the EDC Board of Directors and the City Council in joint work sessions, who provided feedback on refining these goals.
• Enhance business retention and expansion efforts. The City must continue engaging with existing Cibolo-based businesses to understand their unique set of challenges. Expanding the scope of strategies towards business retention and expansion is likely to foster greater economic development outcomes. This includes increasing communication and outreach through consistent surveys and one-on-one meetings with all existing Cibolo-based businesses. Such efforts enable the City to design effective policies aimed at preserving and creating jobs.
• Increase the City’s developable non-residential land assets. Most developable land parcels are designated for future residential development, especially master-planned single family subdivisions. These subdivisions consume substantial land resources that could otherwise be used for valuable commercial or industrial development opportunities. Rezoning developable land parcels located in key economic activity areas (e.g., I-35, FM-78) from residential to non-residential usage can boost economic returns (see Opportunity Sites chapter).
• Increase the City’s entrepreneurial policies and programs. The City of Cibolo connects aspiring entrepreneurs to business development training and financial opportunities in the greater Cibolo area. The City can localize more of these opportunities such as providing mentorship programs, networking forums, and investment platforms. Such opportunities can facilitate entrepreneurship rates among demographic cohorts known to jumpstart small businesses, including the city’s highly educated population, veteran community, and minority residents.
• Strengthen relationships with local and regional stakeholders. The City has limited staff and financial resources to pursue all its economic development goals. But Cibolo has working relationships with several local and regional economic development entities that can help meet its goals. This includes Guadalupe County, local utility providers, Greater:SATX, local chambers of commerce, and neighboring municipalities. The City must maintain its engagement with such entities to leverage their resources, but with a heightened focus on addressing the specific needs and priorities of Cibolo to expand local capacity without increasing staff or financial resource needs
• Diversify the City’s housing supply to support business recruitment and retention. Cibolo’s housing supply is mostly single family homes for purchase, becoming more and more restricted to high-income households as value growth outpaces income levels Increasing the typology and price point of homes to accommodate a wider range of
City of Cibolo, Texas Strategic Economic Development Plan Page | 7-2
households can increase housing choice for existing residents as well as the potential workforce. Given the projected growth of jobs throughout the greater San Antonio region, housing growth will be necessary everywhere. The communities that have the most robust housing market and therefore labor force have a competitive advantage in attracting and sustaining business investment. Without sufficient price appropriate housing opportunities for all positions within a business, those businesses are less likely to consider Cibolo if better options exist regionally.
• Increase consumer demand to support greater retail and restaurant investment. Cibolo experienced rapid population growth in the previous decade, which led to substantial retail and restaurant investment. Despite this, the community has expressed clear preferences for additional support services and conveniences. While the City of Cibolo aims to continue attracting such investments, the existing marketplace appears oversaturated with existing demand insufficient to justify significant increases in supply. This is especially evident for national brand restaurants, which already operate in regional retail hubs like Live Oak and New Braunfels. Additional retail and/or restaurant investment in Cibolo will require expanding the City’s consumer base, in turn, requiring the City to expand local housing supply.
• Enhance coordination of utility investment and development to support industrial development. IH-10 in Cibolo is positioned for catalytic industrial development, comparable to internationally recognized businesses such as AISIN. The strategic location offers immense investment potential. However, addressing potential infrastructure limitations will be crucial to realize this opportunity, which can be achieved through greater collaboration with utility providers servicing IH-10. Such collaboration must ensure properties are readily prepared with sufficient electrical capacity and water/sewer service (e.g., the recent agreement with GVSUD)
• Build stronger connections between businesses and regional training providers. The availability of a skilled workforce is essential to attract business investment, particularly for production-based businesses, which offer the greatest economic potential in Cibolo in the short term. The City of Cibolo must enhance cooperation between local businesses and nearby workforce development programs to ensure that training programs are specifically designed to meet the workforce needs of these businesses.
BUILDING FOR SUCCESS
The City’s current economic development staff have achieved success executing the previous strategic plan initiatives. While previous efforts should be lauded, this analysis and planning process has identified areas where additional efficiencies can be achieved to better leverage existing staff and financial resources. RKG Associates has compiled a series of ‘building blocks’ for the Cibolo City Council and Economic Development Corporation to consider as the community revises and refines its economic development goals, priorities, and actions. This
City of Cibolo, Texas Strategic Economic Development Plan Page | 7-3
section should be considered advisory in nature, providing insight from RKG’s previous experiences for future decision making.
• Investment in economic development staff and implementation are inconsistent with previous and current economic development goals. The goals defined in the previous section require human capital and financial resources greater than the City’s current investment in economic development. Managing municipal resources is a challenge throughout the U.S., and Cibolo is no different. That said, the City and EDC leadership need to ‘right-size’ their focus and expectations to match current investment levels. Attempting to implement the entire implementation matrix with the current 2.5 staff members and budget committed to economic development will reduce efficiency and not maximize success.
RKG Associates recommends Cibolo prioritize actions and focus staff and financial resources to execute those initial efforts, deferring lower priority actions until the resources can be committed and/or partners can be identified to fund and execute those goals. The implementation matrix represents RKG Associates’ recommendation to Cibolo on how to prioritize efforts, targeting those efforts most likely to produce new jobs, capital investment, and fiscal sustainability. However, the City Council, EDC Board of Directors, and the City’s economic development staff should collaborate on defining those priorities and building a business plan commensurate with local capacity.
• Plan your economic development efforts with a long-term vision for Cibolo in mind. Economic development is not an event or a point in time, rather it is a series of actions and investments that position a community (or communities) for success when done in a logical and strategic fashion. In other words, economic development is a marathon and not a sprint. Maintaining a consistent approach and focus will ultimately create greater economic development success (as defined by the community) than a series of independent actions and investments. Divergent opinions and little consensus around defining economic development goals and priorities can lead to wasted resources and lower efficiency. This strategic economic development plan is intended to define a vision for the City based on the input from local elected, business, community, and technical perspectives.
Equally important is to avoid urges to refocus efforts, even for a limited time period, to pursue ‘one-off’ ideas or initiatives that do not advance the defined mission and priority actions for economic development. Communities commonly experience temptation to pursue a ‘new’ or ‘emerging’ initiative when it complements the defined mission. While refocusing efforts oftentimes are warranted and even necessary any decisions to deviate from the defined annual business plan or priorities should be done intentionally and strategically
• Evolution of development (e.g., from rural to suburban to diverse) is critical for long-term sustainability. Land use development is a sensitive subject in almost every community throughout the U.S. Like any subjective topic, ‘good’ and ‘bad’ are contextual to the observer. Cibolo has developed as a traditional suburban bedroom community, converting historically
City of Cibolo, Texas Strategic Economic Development Plan Page | 7-4
agricultural land assets into large subdivisions, single-use commercial properties, and production-based activity centers. This development pattern is consistent with most of the San Antonio region (excepting the City of San Antonio proper) and general suburbia throughout America. While this development pattern is successful at creating desirable neighborhoods, it has limitations from an economic development perspective. On one hand, single residential land uses limit the accessibility and desirability of the community. In this case, having almost exclusively developed single family detached housing, only one facet of the consumer marketplace can be served. While this is good for attracting retail businesses (having a concentration of high income households), it limits that growth since most retail and service workers cannot afford to purchase a single family detached house.
The City Council and EDC Board of Directors have identified economic development goals that require strategic development investments that go beyond the traditional bedroom community scope and scale. These goals recognize that long-term economic and fiscal sustainability require a more diverse built environment. They also recognize that traditional suburban neighborhoods and vibrant activity centers can coexist Creating land use regulations that enable more intense development patterns in strategic locations can enhance economic vitality, strengthen the community’s support service infrastructure, and diversify the local economy. All of these factors contribute to a more sustainable fiscal future for Cibolo. Tools, such as scaled development zones (discussed in the Opportunity Sites chapter), can create seamless transitions that balance scale and growth while respecting the existing built environment.
• Embrace market realities and plan around them. Real estate markets evolve over time. The era of shopping malls lasted for more than 50 years, but is now waning and leaving large, expensive developments with limited adaptive reuse potential. Similarly, the suburban office campus era delivered billions of square feet of office space across America. Many of these campuses are now going through infill development, redevelopment, or adaptive reuse due to diminishing market demand. In both of these examples, shifts in market forces have required communities to reimagine these assets.
Feedback provided during this effort indicates that the Cibolo community is poised to evolve. The desire for additional retail and restaurant options necessitates more households in Cibolo to create the market demand support. The stated goal of attracting more medical services within Cibolo will require changes to the built environment, as highly amenitized, walkable, activity centers are preferred in the modern office market. Finally, attracting the scale of production-based businesses envisioned for Cibolo will benefit from creating a diversity of housing types and price points to accommodate the workforce necessary to attract those businesses.
City of Cibolo, Texas Strategic Economic Development Plan Page | 7-5
PRIORITY ACTIONS
The following section provides a detailed matrix of recommended action items for the City to consider as it refines its short-term economic development business plan. While each of those actions are integral to positioning the City for success, there are some ‘priority actions’ that necessitate a more detailed discussion on the ‘why’ as well as the ‘how’ for implementation. These actions can be complex and/or considered essential. To this point, RKG Associates is providing thorough descriptions so that the community has the necessary context to customize these approaches to community preferences while maintaining the stated purpose for those actions.
1. BUSINESS RETENTION AND EXPANSION
Enhance the City’s existing businesses list. The City of Cibolo should continue to develop and proactively update a list of all businesses within its boundaries. This is essential for facilitating consistent communication with all businesses, updating them on available economic development programs, opportunities, and incentives that can enable them to expand within the city’s limits. Implementation partners and community members that have relationships with existing businesses can help with these efforts (e.g. chambers of commerce, etc.), while the City can work with the various state licensing entities (e.g., the Texas Comptroller of Public Accounts) to collect contact information of businesses located in Cibolo.
Proactively reach out to existing businesses through 1-on-1 meetings. In-person meetings can nurture trust and transparency between the City of Cibolo and the local business community; particularly small businesses that may be underrepresented at networking events. The City of Cibolo must meet and engage with all businesses throughout its municipal boundaries, establishing quantifiable metrics to track engagement progress and maintain accountability. For instance, a quantifiable metric could be a time-based objective, holding Cibolo accountable to meet with all business within a specific time frame (e.g., meet with all businesses within a twoyear time frame). Existing staff levels, however, can limit the pace of engagement with local businesses. RKG recommends having a dedicated staff member to help with these efforts and work with local implementation partners that have relationships with existing businesses, including the chambers of commerce and other local/regional partners.
Implement an annual business survey to identify emerging trends/needs. An annual business survey can be an effective approach towards engaging with local businesses to understand and respond to prevailing market conditions and trends, shifting regulations, workforce needs, and physical workspace requirements. Survey responses can facilitate the creation of programs and policies that address common challenges and needs among businesses. These responses can also be used to identify specific businesses vulnerable to downsizing or closing, catalyzing the City to prioritize in-person visits to those specific businesses. Assessing the results of the survey will be critical to evaluate shifting market conditions.
City of Cibolo, Texas Strategic Economic Development Plan Page | 7-6
Create additional industry roundtables to meet quarterly on market/economic issues. Industry roundtables gather professionals from a particular industry on a quarterly basis. Roundtables are an effective platform for communicating business-related challenges and opportunities in Cibolo. The City’s participation at meetings is critical, drawing insights that can be used to develop programs and policies for sustaining and growing a particular industry. While all industries are encouraged to form roundtables, RKG recommends the following industries be prioritized for forming roundtables:
Industrial
Retail
Restaurant
Workforce Development and Education
Health Care
Professional Services
Downtown Businesses
Roundtables are integral for facilitating the creation of programs and policies that focus on workforce development, entrepreneurship, and asset development. This is particularly beneficial for market segments historically underrepresented in economic development discussions (e.g., small businesses)
Actively engage Cibolo’s home-based businesses. As a means of adapting to the ‘new normal’ following the COVID-19 pandemic, many entrepreneurs are expected to turn to home-based businesses. This is especially the case for entrepreneurs in traditionally white-collar segments, able to coordinate their operations virtually. Key actions items can include the creation of business surveys and advisory groups geared toward home-based businesses.
Expand existing business networking series to connect more local businesses. Networking opportunities can enable local businesses to develop professional connections, recruit workers, and identify market shifts. Such opportunities can be engineered through interactive events and seminars, especially in casual stress-free environments. These events are different than traditional social and happy-hour type gatherings. Typically, these events bring in outside experts or keynote speakers, engaging the business community to provide emerging market information or provide insights into existing challenges identified in the business survey/business outreach initiatives. The City of Cibolo can partner with local and regional organizations (e.g., chambers of commerce, Greater:SATX, etc.) to develop specific subject matter events, applied to various market segments Industrial, Health Care, Workforce Development and Education.
2. BUSINESS RECRUITMENT AND ATTRACTION
Become more proactive with regional and statewide partners in business recruitment. Statewide, regional, and local economic development organizations actively engage in largerscale business recruitment, including Greater:SATX, Guadalupe Valley Electric Cooperative
City of Cibolo, Texas Strategic Economic Development Plan Page | 7-7
(GVEC), and the State of Texas. Given the limited resources the City has to dedicate to economic development, the greater potential for success in investing in BRE activities, and the top-down approach that most business recruitment site selection efforts follow (particularly for mid-scale and large-scale companies), RKG Associates recommends the City continue to coordinate with these larger organizations on potential business recruitment opportunities, leveraging their efforts to enhance market awareness of the City.
• Engage industry roundtables to generate potential recruitment leads: Participation in industry roundtables (discussed in Business Recruitment and Expansion) is valuable for networking with existing businesses that can connect the City to prospective businesses within their vertical or horizontal supply chains. This is especially crucial for recruiting intermediate component manufacturers that produce parts assembled within end-user products.
• Leverage relationships with nearby communities to joint market to common target industries: Competition between nearby communities can reduce Cibolo’s opportunities for attracting business operations. Rather, partnerships between communities can “be a mutually beneficial and cost-effective mechanism for business recruitment. Cibolo should encourage this group to increase its proactive retention and recruitment efforts for shared target industries and objectives (e.g., Restaurants, Retail). For instance, an alliance among local municipalities in the Northeast quadrant of the San Antonio region (e.g., Selma, Schertz) can be used to leverage financial resources for business recruitment.
Expand start-up and entrepreneurial development services open to all businesses with the addition of an entrepreneurial development staff member. The City’s existing entrepreneurial services are limited. In contrast, the City has a growing diverse population of well-educated, former military individuals with the potential for starting a new business. Creating a structured small business development program could help encourage aspiring entrepreneurs to start and grow their businesses across industry segments. Such a program could become successful through a multistakeholder approach that involves local quasi-governmental agencies, educational institutions, and business leaders. However, expanding the City’s efforts in entrepreneurial development will require additional capital (e.g., incubator space) and staffing capacity.
• Form strategic partnerships for staffing and technical assistance: The closest Small Business Development Center (SBDC) operates out of University of Texas at San Antonio (UTSA). The SBDC offers entrepreneurial courses on start-up assistance, financing opportunities, digital marketing, and branding. The City of Cibolo must consider coordinating with the SBDC at UTSA, in order to receive an in-house consultant that can help with small business development training and guidance. The City will need to identify a physical location in Cibolo, for the SBDC consultant and other volunteers (retired mentors) to execute entrepreneurial development services.
City of Cibolo, Texas Strategic Economic Development Plan Page | 7-8
• Develop a mentorship program that involves past or current business leaders: Mentors can help enable aspiring entrepreneurs’ business development goals through sharing their experiences and business connections. The City of Cibolo should consider developing a program that connects local business leaders to entrepreneurs seeking to start or grow their business. Strong consideration should be given to retirees acting as mentors, able to commit more time for mentorship than current professionals.
• Develop a small business revolving loan fund in coordination with financial partners to administer loan funds on behalf of the City: A major challenge for entrepreneurs is to secure financing for their business operations. In response, the City should activate a small business revolving fund for business planning services and capital needs. Loans can be offered at very low interest rates with government guarantees backed by the City of Cibolo and if possible, local, and regional stakeholders (e.g., nearby municipalities, Guadalupe County). The program would involve partnership with one (or multiple) banks, having these institutions match the City’s investment in exchange for managing the origination and administration of the loans.
• Partner with local firms to offer free/reduced cost business support services: Early-stage businesses may lack the financial resources to fund specialized professional services. The City of Cibolo should coordinate with local professional services firms to inquire about offering reduced (or free) rates for local entrepreneurs. This includes legal services, human resources, and accounting services.
• Centralize Entrepreneurial Activities: A central location for supporting entrepreneurial activities throughout all market sectors can enhance cost-efficiencies for City-sponsored programs. Moreover, a central location can encourage cross-pollination between market sectors to facilitate the commercialization of innovative business solutions (discussed in the Opportunity Sites section of the report)
3. ASSET DEVELOPMENT
Create/update small area plans for the City’s primary economic centers. The City of Cibolo has identified several areas positioned for development opportunities. For example, the FM-78 corridor has development potential that is not aligned with historic visions for that corridor. Finding consensus among decisionmakers has been an ongoing challenge in relation to things like character, scale, and developmental density levels. Without a defined and unified real estate vision, future projects will remain stalled which limits the City’s overall economic development vision. RKG Associates recommends the City of Cibolo continue to build consensus for each of the City’s primary economic activity centers (detailed in the Opportunity Sites section). These small area plans serve to clearly define the scale and vision for each economic activity center, while balancing the interests of community members and the City’s economic development objectives. An integral part to defining such visions will involve incompatible land-use/zoning
City of Cibolo, Texas Strategic Economic Development Plan Page | 7-9
regulations that limit economic progress. This includes economic activity areas zoned for lowdensity residential that are positioned to become walkable live-work-play destinations.
Maintain a locally managed database of available land and building space. On their website, the City of Cibolo has maintained a publicly available database that includes a useful GIS component. The database advertises a comprehensive spectrum of spatial sizes, ranging from smaller-scale spaces (10,000 SF or below) to larger-scale spaces (25,000 SF and above). The database is powered by data provider, LoopNet. While LoopNet strives to provide current and comprehensive data, the source is not infallible. This is particularly true for smaller spaces. RKG Associates recommends that the City continue maintaining the database but also engage with the brokerage and property ownership community within the City to ensure accurate reporting.
Identify 4-6 priority investment/reinvestment properties within the City. Based on the economic development small area plans mentioned above, the City should identify 4-6 priority investment/reinvestment properties to focus their efforts. As the properties are identified, the City should develop a prospectus book highlighting each site, current use/ownership, City vision, and the tools available to develop the site. Consistent communication with property owners will be critical to cooperate on investment strategies that are compatible with the City’s vision.
Economic Development Opportunity Fund. Real estate acquisitions, especially those involving property assemblage can be complex and costly transactions. Expanding the pool of public resources can be an effective mechanism for streamlining such acquisitions. This can be critical for acquiring properties located within the City’s economic activity areas, needed to be realigned to reflect the area’s long-term vision. Through the City’s approval, a sponsored entity should be given the authority to manage the economic development opportunity fund.
4. TOOLBOX DEVELOPMENT
Match land use and/or zoning regulations to economic development vision. Too large a focus on suburban land use patterns can limit transformative economic development projects. Realigning land use and zoning regulations that support marketplace preferences will be required to attract pivotal business investment and enhance long-term fiscal sustainability. Marketplace preferences, particularly among professional services sectors, include higher density mixed-use environments with an emphasis on walkability and connectivity. RKG Associates acknowledges and understands many community members have concerns about Cibolo losing its small-town character It is not recommended that Cibolo transform into an urban center. However, permitting greater flexibility and densities in areas that make sense (e.g., FM-78, FM1103) can help Cibolo develop a stable economic foundation and preserve its high quality-of-life.
Create economic development incentives that match the City’s priorities and performance expectations. RKG Associates recommend the City consider incentives that vary by location (e.g., Downtown, I-10), type of business (e.g., Retail Industrial,), and structural circumstances (e.g., high vacancies). Each of these incentives should include claw back requirements that would make
City of Cibolo, Texas Strategic Economic Development Plan Page | 7-10
the recipient reimburse the City of Cibolo for failure to meet incentive-term conditions. For instance, if a proportion of a retail strip building (e.g., 25% or higher) remains vacant for a fixedperiod time, the property owner will be required to restructure the property to support another revenue-generating activity integrating housing units. Other performance requirements could include the net-new number of jobs created and the amount of capital investment.
RKG Associates recommends prioritizing the refinement of its incentive package tools to support entrepreneurial and small business retention, expansion, and recruitment. From a financial incentive perspective, the threshold to qualify for a small business incentive should be low (e.g., create 1-2 jobs) and consider more generous thresholds for City residents seeking to start or expand a business. For instance, creating 1-2 jobs but allotting more time to achieve these thresholds than non-residents. Finally, RKG recommends specific incentives be created for aspiring minority entrepreneurs or existing business owners. Incentives for small businesses should be restricted to entrepreneurs that are involved in a business planning service (e.g., SBDC), to increase their chances of meeting defined performance metrics.
Hire a developmental ombudsman. The ombudsman position is focused on providing property owners and investors technical and process-oriented assistance when going through the development review and entitlement processes. Whether it is a rezoning or variance request, the ombudsman program is intended to help applicants navigate City rules and regulations. The position has two priorities. First, the ombudsman must be familiar with all procedures and expectations in the City of Cibolo and be able to advise applicants on how to ensure a complete application package. Second, the ombudsman must be able to collaborate with industry professionals (i.e., engineers) to provide advisory services when it comes to technical needs.
5. OUTREACH, MARKETING, AND COMMUNICATION
Business Outreach
Create marketing collateral necessary for effective recruitment and retention efforts. Communication and marketing are critical for retaining and attracting investment activities. The City of Cibolo will need to enhance their ‘marketing collateral’ to sustain business investment activities. Specific materials include:
• Target Industry Content: Industry-specific marketing materials for each of the target industries are important for disseminating specific data that is valuable to the City’s target industries (see Chapter 4 for recommended target industries) The documents should highlight information including employment and establishment growth data, regional wage rates, current businesses operating in the area, competitive advantages of operating locally, unique incentives available (where applicable) and local business contacts (ambassadors). A focus on reporting employment data is critical given the importance for prospective businesses to locate near a skilled workforce.
City of Cibolo, Texas Strategic Economic Development Plan Page | 7-11
• Incentive Sheet: The City of Cibolo publishes state and local incentives on their economic development website. The City should proactively update the website to advertise new incentives when they are established.
• Business Testimonial Book: Through stakeholder interviews, RKG Associates uncovered several “success stories” of existing businesses succeeding in Cibolo. However, these experiences are not chronicled or readily available to use in marketing. RKG recommends crafting a business testimonials book with written statements from existing industry leaders on topics ranging from quality of life, business climate, value-add created by the City, and personal preference to do business locally. Getting input from companies that have chosen Cibolo and thrive locally is valuable to industry recruitment. Individual testimonies of leaders from a range of businesses by size should be a priority.
• Property Assemblage Book: The City should create a property assemblage book that highlights those catalytic land assets identified in each of the economic activity centers where the City and property owner are aligned on the future development program. To this point, the assemblage book should only highlight those assets where the property owners are engaged and supportive of the City marketing their property. The book should focus on the top catalytic projects. Each listing should provide information on all the properties as well as the community’s development vision for that area.
Develop business ambassadors to assist in business engagement and marketing. The ambassador program is a collection of business and industry leaders that provide support to the economic development staff for industry recruitment and retention. Although these individuals will have no formal authority within the recruitment process, they provide a ‘real life’ vantage point for prospects doing business in Cibolo. Their most important function is to provide a business perspective for prospects interested in locating/expanding within the City. Utilizing business leaders in the recruitment process legitimizes the recruitment effort through testimonials while leveraging staff’s time and effort. The most effective ambassadors may not be from the largest businesses. Cibolo should identify ambassadors from each of the major industry sectors to ensure appropriate coverage regardless of the prospect.
Enact a monthly newsletter detailing market and economic development activities. A monthly newsletter should advertise networking events, provide opinion editorials, and highlight developments occurring in certain target industries. Opinion editorials on subjects such as emerging national economic trends, regional economic development investments, and changing policy and strategic actions of the City can increase business owner awareness of market trends and activity, create interest and engagement from business owners seeking additional information, and build rapport between economic development staff and current and prospective business owners. Effectively, a newsletter is a way to provide information and highlight successes to citizens, business owners, and prospective investors. Further, the monthly newsletter can serve to provide updated content for the City’s economic development website.
City of Cibolo, Texas Strategic Economic Development Plan Page | 7-12
Community Outreach
Community awareness and support are critical components of implementation. Simply put, the amount of financial and political support for economic development is influenced by the willingness of residents to endorse local action. Increased awareness and education about economic development can only benefit implementation in building sustainable and strategic relationships with all local stakeholders.
Host community update meetings. RKG recommends the City engage with community advocates to meet with citizen and civic groups to provide annual updates on economic development related actions This effort can dovetail into a staff-led “State of the City” presentation/discussion to be held at different locations throughout the City, enabling community members to hear about economic development efforts and ask questions/give feedback.
Implement a biennial survey for residents. A biennial survey targeted at residents can gauge local understanding and support of economic development as well as identify any communitybased goals and concerns. The survey can cover topics such as preferred economic development outcomes, perceived concerns about future development (or a lack of future development), and opinions on the level and quality of various amenities and services. Their responses can help facilitate the creation of programs and policies that advance community goals and provide content to develop targeted approaches to address common/detailed community concerns. In an effort to minimize ‘survey fatigue’ from residents, the survey should be held no more frequently than every other year.
Develop citizen advocates to assist in community engagement. Given the challenge of reaching all the different community groups in Cibolo, RKG Associates recommends a select group of interested citizens assist in engaging local civic organizations (e.g., homeowner associations, social clubs). Ideally, the community advocates would be individuals with strong ties and broad recognition within either a specific area of the City or with a civic group. Individuals selected to be advocates should be familiar with the City’s economic development efforts, can discuss and explain economic development concepts, and be well-spoken. Most importantly, the advocates must be available to assist in outreach to various community (e.g., congregations) and civic (e.g., neighborhood groups) entities. Outreach meetings should occur on a quarterly basis to keep community residents up to date about local economic development issues.
Create an online portal through economic development website for citizens to engage. To ensure constant and consistent communication with residents and civic organizations, an online tool should be made accessible for community members to provide feedback on economic development programs and to request meetings with staff members. Having a dedicated communication portal online can offer individual citizens the opportunity to ask questions, provide recommendations, or seek clarification on the City’s economic development efforts. While the City currently has a ‘Contact Us’ form on the existing economic development
City of Cibolo, Texas Strategic Economic Development Plan Page | 7-13
website, RKG envisions an interactive website that enumerates the type of contact to make based on the citizen’s specific need or question. For example, having a separate link for inquiries about information, for providing leads to the economic development staff on potential opportunities/retention needs, and for volunteering to be an ambassador or advocate offers a more user-friendly interface that may increase participation.
General Outreach
Establish an economic development dashboard to highlight activities and impacts. Traditional economic development metrics include job creation, business attraction, and tax revenue growth. These metrics alone can overlook the performance of all economic development activities in a community. That said, additional metrics are essential to track the effectiveness and efficiency of various implementation programs. For instance, tracking the number of jobs created from the support of local incentives. This can help gauge whether new incentives need to be developed or existing incentives need to be refined to support greater job growth.
RKG Associates recommend the City establish an economic development dashboard that not only tracks traditional economic development metrics but metrics that track the performance of local programs. Recommended metrics categorized under topic areas are listed below:
Business Retention and Expansion
o Site visits performed
o Ombudsman assists
o Jobs retained/expanded
o Capital Investment
o Network event attendance
o Survey participation
o Programs/strategies created from roundtable discussions
Business Recruitment and Attraction
o Number of prospective businesses engaged
o Successful recruitments
o Total jobs created
o Average annual wage
o Total capital investment
o Debrief highlights from lost opportunities
Entrepreneurial Development
o Enrollment inquiries
o Business enrollment
o State/regional investment
o Graduation rates
o Job created per graduate and associated NAICS code
City of Cibolo, Texas Strategic Economic Development Plan Page | 7-14
o Debrief on businesses leaving the program
Fiscal Sustainability Metrics
o Number of incentives
o Value of incentives
o Jobs created/preserved from incentives
o Capital Investment
o New tax revenues
o Infrastructure investments
Enhance the City’s virtual media presence. The City has been proactive to promote local economic development efforts online. In particular, marketing the City’s successes on Instagram and LinkedIn. The City of Cibolo should continue updating their economic development website to reflect current information (e.g., real estate data, number of businesses per industry).
6. ORGANIZATION AND COORDINATION
The importance of pursuing economic development through joint-cooperation and strategic partnerships is critical for achieving the proposed economic development goals. The City of Cibolo needs financial and technical support from all relevant partners and stakeholders. This includes The Chamber (Schertz-Cibolo-Selma-Universal City Area), Texas Tri-County Chamber of Commerce, Guadalupe County, Greater:SATX, etc. To summarize, advancing coordination and cooperation in business retention and recruitment should be pursued with any entity with an interest in advancing economic and social outcomes in Cibolo, Guadalupe County, and throughout the San Antonio-New Braunfels MSA.
Fund economic development activities commensurate with economic development goals. The current volume of financial investments and staff capacity is insufficient to meet all of Cibolo’s proposed economic development goals At a base level, the proposed economic development goals will require more than 2.5 full-time equivalent (FTE) positions. Attempting to accomplish the full stated goal list under current capacity levels most likely will not achieve the full extent of success in any individual goal.
In the short term, the City needs to prioritize efforts so that existing staff and financial resources can be deployed in an efficient and effective manner. RKG Associates recommends the City focus proactive staff and investment efforts on business retention and expansion (BRE) and marketing and outreach efforts (in addition to administrative responsibilities), leaving large-scale recruitment efforts to regional and state partners. Focusing on ‘growing what we have’ positions economic development staff for success by aligning the potential influence of a small city with the needs/challenges of an existing business.
Over time, the City should consider hiring additional staff to address specific economic development opportunities. Specifically, RKG Associates recommends hiring additional staff to assist in the business retention and expansion efforts, hiring a development ombudsman position
City of Cibolo, Texas Strategic Economic Development Plan Page | 7-15
to assist existing and potential businesses navigate all local and state development/permitting requirements, and finally expanding support services for entrepreneurs and home-based businesses through a dedicated entrepreneurial development position. The implementation matrix details the recommended order of these hires based on RKG’s assessment of the potential benefit for each new position.
Leverage local and regional partnerships to support economic development activities. The City of Cibolo has limited staff and financial resources to achieve all the proposed economic development goals. To help offset these limitations, the City needs to continue to build coordination with local mission-based entities focused on enhancing the economic and social climate in the area. Coordination among organizations is vital for bolstering the City’s efforts on business recruitment, communication and outreach, and small business development.
IMPLEMENTATION MATRIX
The following pages detail the proposed strategic economic development implementation matrix. This matrix provides specific action steps for each objective while identifying leadership responsibilities, partnership opportunities, prioritization of effort, and potential cost estimates. It is important to note that this tool is advisory for the City’s economic development efforts. It is not RKG Associates’ intent for the EDC, City, and its staff to interpret the implementation matrix as an absolute instruction manual on implementation. Rather, RKG intends this matrix to inform and advise the City on best practices and approaches. The City Council, EDC, and economic development staff should use the implementation matrix as a guide to develop an annual business plan that focuses on local economic development priorities and maximizes local partnerships and resources to achieve success. Interpretation of the matrix most likely will be required as markets, partnerships, priorities, and local leadership evolve and change
City of Cibolo, Texas Strategic Economic Development Plan Page | 7-16
Action
Create a single database of all Cibolo businesses based on lists already available (e.g., secondary data vendors, partner organization membership lists…)
Provide opportunity for businesses to register/review their information in the business list through the City's economic development website
Work with property owners and landlords to collect business contact information
1.1.5 Implement volunteer walks, having 3-5 volunteers (e.g., Ambassadors) canvas the City's activity centers to gather contact information
Implement an annual business survey to identify emerging trends/needs
1.2.1 Establish a fixed date (e.g., week) that the survey will be released. This should be consistent year over year. Recommend the Fall
Action 1.2.2 Ensure the survey covers the following topics: Market climate/changes, Regulatory environment, Growth/contraction needs and concerns, Workforce needs, and Physical space needs
Action 1.2.3 Work with the chambers, other business organizations, and industry roundtables to refine questions and expand awareness of the survey each year
Action 1.2.4 Invest in multimedia marketing and outreach at least 2 months prior to the release of the survey each year (e.g., print, social media, direct outreach)
Action 1.2.5 Share general results of the survey with roundtables, partner organizations, and the community through the monthly newsletter
Action 1.2.6 Use results of survey to prioritize retention/expansion visits for the year
1.2.7 Work with respective roundtables about industry-specific findings from survey to determine annual action items
1.2.8 Retain all survey results to create a longitudinal assessment tool (e.g., Excel database) that can help economic development efforts become more predictive to changing market climates
Action 1.2.9 Strengthen partnerships with nearby municipalities to implement a broader survey effort through joint marketing, expanding the suvey reach, and developing regional trend data (target increased responses, shared costs...)
Proactively outreach to existing businesses through 1-on-1 meetings
1.3.2 Establish quotas for number of monthly visits, targeting ten (10) per month for each FTE committed to BRE efforts, expanding as volunteers are trained assist (e.g., Ambassadors)
Coordinate with economic development partners for business visits (e.g., chambers)
Action 1.3.5 Maintain database of visited businesses to track frequency and results of the visit through a Consumer Relationship Management (CRM) software
Activate business Ambassadors to assist in outreach, providing them training on questions to ask and how to track the conversation
Page | 7-17 City of Cibolo, Texas Estimated Cost Strategic Economic Development Plan Implementation Matrix Public/NP Private 123456789 10 Cost Type BUSINESS RETENTION AND EXPANSION Objective 1.1
CC, COC A One Time Action 1.1.2
information CC ST Annual Action
CC O, I, R Included 5.5.1 Annual Action
CC, COC O, ST Annual
CC, COC O, A Biennial Action 1.1.6
build
database CC O, ST Biennial Objective 1.2 Action
CC, COC O, A Annual
City of Cibolo, Texas Strategic Economic Development Plan
1.1.1
Utilize the state's business license processes to collect more detailed data about businesses, particularly contact
1.1.3
1.1.4
Action
Ask industry roundtable members to advertise volunteer walks and engage their relationships to
the
CC O, ST Annual
CC, COC O, ST Annual
CC Included 5.5.2 Annual
CC O, ST Annual
CC ST Annual
CC O, ST Annual
CC ST Annual
CC, MU ST Annual Objective 1.3 Action 1.3.1 Use
year CC ST Continuous Action
CC I,N ST Continuous Action 1.3.3
CC ST Annual Action
CC, COC ST Continuous
Action
Action
the comprehensive business list to identify new companies to visit and track past visit efforts. Do not concentrate on the same businesses year over
Use business survey results to prioritize outreach efforts to companies that indicate growth needs or challenges to maintain operations
1.3.4
CC B Annual Action 1.3.6
CC C Included 5.5.1 One Time Action 1.3.7
CC O, Included 5.3.1 Annual Implementation
Create a direct "help line" initiative on the City's economic development website that allows businesses to connect to an economic development staff member for assistance
Timing (Year)
Continue to develop a comprehensive list of all businesses within the City
Implementation Lead
home-based businesses to comply with the City's affidavit policy and expand the business contact database
Action 1.5.2 Use state data to identify home-based businesses (based on a geospatial analysis of business address)
Action 1.5.3 Consider implementing a separate home-based business survey from the main survey targeted with questions more relevant to these entrepreneurs
Action 1.5.4 Create a home-based business networking series with quarterly events and lectures on subjects identified through the BRE outreach efforts
Page | 7-18 City of Cibolo, Texas Estimated Cost Strategic Economic Development Plan Implementation Matrix Public/NP Private 1234567 89 10 Cost Type BUSINESS RETENTION AND EXPANSION Objective 1.4
City of Cibolo, Texas Strategic Economic Development Plan
CC, EDU O, I, R ST One Time Action 1.4.2
sure all partner organizations have representation
crossover missions CC, COC, EDU O, I, R ST One Time Action
CC O, I, R A Quarterly
Action 1.4.1 Have an industry roundtable for every key market sector including [1] Industrial; [2]Retail; [3] Restaurant; [4] Workforce/Education; [5] Health Care; [6] Professional Services; [7] Downtown
Make
on roundtables that
1.4.3 Meet each roundtable quarterly or semiannually as necessary, with one meeting targeted immediately after the release of the business survey results
opportunities;
implementation
annual
planning session CC O, I, R ST Annual Action 1.4.5 Use feedback from roundtables to help set annual action plan CC ST Annual Objective 1.5 Action 1.5.1
CC, COC O, A Annual
CC,
ST Annual
Action 1.4.4 Use roundtable meeting to discuss: [1] market climate; [2] regulatory issues; [3] growth
[4]
coordination at the
business
Create and implement a marketing campaign to engage all
TX
CC, COC O, ST Annual
CC, COC B Quarterly
1.5.5
CC O, ST Quarterly Objective 1.6 Action 1.6.1 Create
annual lecture on available
assistance programs CC, COC A Annual
Cohost at least two (2) networking/marketing events annually with municipal/regional partners targeting small business owners (e.g., less than 50 employees) CC A Semiannual Action 1.6.3 Host two (2) social gathering events for the city's industry clusters CC B Semiannual Action 1.6.4 Hold two (2) lecture/guest speaker events; bringing in regional/national industry leaders to discuss sector/market trends. This can be co-hosted with regional partners CC C Semiannual Action 1.6.5 Host at least two (2) women-owned and two (2) minority-owned business networking events annually CC A Semiannual Action 1.6.6 Host young professional/entrepreneur networking events quarterly in partnership with neighboring municipalities CC, MU A Semiannual Action 1.6.7 Host a "State of the City" event for business leaders to discuss activities over the past year, successes, opportunities, and share the business plan for the next year CC A Annual BUSINESS RECRUITMENT AND ATTRACTION Objective 2.1 Action 2.1.1 Engage industry roundtables and individual businesses to generate potential recruitment leads through vertical and horizontal supply chains CC, COC ST Quarterly Action 2.1.2 Establish quarterly work sessions with implementation partners (e.g., chambers, MU, SATX) to discuss opportunities and implementation strategies CC, COC, MU A Quarterly Action 2.1.3 Maintain local property and land database, coordinating with partners on maintaining an accurate and up-to-date list to augment the LoopNet data currently presented on the economic development website CC C Included 3.2.1 Annual Action 2.1.4 Collaborate on leads collected through business outreach and marketing efforts CC, COC, MU ST Annual Action 2.1.5 Work with local partners to build relationships with site selectors in target industry sectors, adding them the City's economic development newsletter distribution list CC, COC, MU O, ST Annual Action 2.1.6 Create a municipal economic development coalition focused on information sharing, best practice engagement, and collaboration on cross jurisdictional needs/opportunities (e.g., workforce development) CC, MU ST Annual Expand existing business networking series to connect more local businesses Actively engage Cibolo's home-based businesses Build additional industry roundtables in a number of different market areas Implementation Lead Implementation Timing (Year) Become more proactive with regional and statewide partners in business recruitment
Action
If enough interest, create a home-based business roundtable
an
local, county, state, and federal
Action 1.6.2
City of Cibolo, Texas Strategic Economic Development
Page | 7-19 City of Cibolo, Texas Estimated Cost Strategic Economic Development Plan Implementation Matrix Public/NP Private 123456789 10 Cost Type BUSINESS RECRUITMENT AND ATTRACTION Objective 2.2 Action 2.2.1 Partner with local and state entities to market through relevant digital and print mediums annually CC, COC, SATX, GVEC C C/D Annual Action 2.2.2 Host a searchable online database of available commercial space and land for prospectus businesses to review CC A Annual Action 2.2.3 Create a 'tip line' for citizens to call/Email/text ideas on business recruitment and any leads they may have on businesses that may wish to relocate or expand to Cibolo CC C Included 5.5.1 One Time Action 2.2.4 Develop/refine the City's business recruitment collateral (see OUTREACH, COMMUNICATION, AND MARKETING section) CC Included 5.1.1 Annual Objective 2.3 Action 2.3.1 Hire an additional full-time staff member dedicated to small business/entrepreneurial development CC D Annual Action 2.3.2 Provide information seminars in partnership with nearby municipalities on how to start, operate, and grow a business CC, MU B Annual Action 2.3.3 Fund the training of 2-3 new mentors each year, selecting within business sectors that are underrepresented, particularly women and people of color CC, MU O, B Annual Action 2.3.4 Work with local banks to create a PPP revolving loan fund that offers low/no-interest loans and/or gap financing to start-ups
pool CC, MU F F One Time Action 2.3.5
local HR, engineering,
legal
create
entrepreneurs to use CC, MU O, ST Annual Action 2.3.6 Provide financial
entrepreneurs
to
services such as human resources assistance, financial planning assistance,
legal assistance CC, MU D Annual Action
business tracking data CC ST Annual Action 2.3.8 Modify incentive programs to offer financial support to startups and small businesses to locate and grow in Cibolo (e.g., one-time grants for creating jobs above area median income), requiring participation in an entrepreneurial training program CC D Annual Action 2.3.9 Identify a highly visible, well appointed location for a comprehensive incubator/business support facility CC D Annual ASSET DEVELOPMENT Objective 3.1 Action 3.1.1 Build upon the strategic recommendations in the opportunity site analysis as an initiation point for engagement and action CC ST Annual Action 3.1.2 Define short-term, midterm, and long-term visions consistent with economic development plan CC C B/E Annual Action 3.1.3 Proactively engage with property owners to understand investment strategies CC ST Annual Action 3.1.4 Work with ETJ property owners on potential annexation and offer incentive packages targeted at encouraging voluntary annexation into Cibolo CC ST Continuous Action 3.1.5 Enact regulatory changes to allow defined visions to occur (see TOOLBOX DEVELOPMENT section) CC ST One Time Action 3.1.6 Create a marketing brochure for each employment center/commercial corridor that encapsulates the vision CC C C Biennial Scale proactive marketing and recruitment efforts to best leverage the City's resources and market reach Create/update small area plans for the City's primary economic activity centers Expand start-up and entrepreneurial development services open to all businesses with the addition of an entrepreneurial development staff member Implementation Lead Implementation Timing (Year)
Plan
and small businesses seeking to grow. Target an 80% private/20% public resource
Engage
accounting, and
professionals to
a database of potential consultants for
assistance for
and small businesses
access critical
and
2.3.7 Proactively market small business initiatives to existing businesses, focusing on home-based businesses using updated
of Cibolo,
Strategic Economic
Page | 7-20 City of Cibolo, Texas Estimated Cost Strategic Economic Development Plan Implementation Matrix Public/NP Private 123456789 10 Cost Type ASSET DEVELOPMENT Objective 3.2 Action 3.2.1 Inventory all existing vacant commercial and industrial land and buildings in collaboration with Costar reporting data and engagement with local real estate listing entities CC I, O, R ST Annual Action 3.2.2 Connect with all property owners to detail price, availability, and vision for those asset; include in online listings CC I, O, R ST Annual Action 3.2.3 Create an 'open source' database for property owners and brokers to submit new listings and changes to existing listings, particularly for listings not covered under Costar or similar virtual listing services CC C Included 5.5.1 One Time Action 3.2.4 Create a web-accessible database of those assets to connect to the economic development website CC C Included 5.5.1 One Time Action 3.2.5 Work with regional and state implementation partners to make sure their asset lists are current and complete CC, SATX, GVEC ST Annual Action 3.2.6 Maintain regular communication with property owners to ensure occupied/developed land is removed CC O, ST Annual Objective 3.3 Action 3.3.1 Create a comprehensive ownership database of all commercial properties in each of the opportunity sites to begin a dialogue about their property interests and investment priorities CC O, I, R C Annual Action 3.3.2 Engage in dialogue with owners, particularly catalytic parcels, on a regular basis to track changing strategies and create new opportunities CC O, I, R ST Annual Action 3.3.3 Create a catalyst sites prospectus, defining property ownership, implementation concepts, and available incentives to help bring the vision to fruition CC C Included 5.1.6 Biennial Objective 3.4 Action 3.4.1 Encourage consolidation of providers within City limits (e.g., Green Valley SUD, GVEC, City of Schertz, etc.) CC, UP, MU ST Continuous Action 3.4.2 Establish protocols for capital investment/job creation CC, UP, MU ST Continuous Objective 3.5 Action 3.5.1 Create a fund dedicated to [1] land acquisition for economic development purposes and [2] gap financing in real estate developments with economic development benefits CC F ST One Time Action 3.5.2 Seed the fund with $500,000 for initial operations CC F F One Time Action 3.5.3 Create a board of directors comprised of public, staff, and private sector representatives to review applications and negotiate agreements CC F, O, ST One Time Action 3.5.4 Develop specific criteria for access to Fund resources (e.g., minimum job creation, minimum, capital investment, creation of workforce housing, blight removal…) including performance requirements and claw back provisions CC F, O, ST Annual TOOLBOX DEVELOPMENT Objective 4.1 Action 4.1.1 Rezone land based on the results of the small area planning process CC ST As Needed Action 4.1.2 Consider creating higher density housing zones in/adjacent to activity centers to accommodate housing growth commensurate with job growth and accommodate the City's growing retiree population CC ST As Needed Action 4.1.3 Encourage the continued development of active mobility trailways integrated with parks and activity centers CC ST As Needed Action 4.1.4 Consider overlay districts in areas where rezoning will be too difficult or time consuming CC ST As Needed Action 4.1.5 Consider a full update to the City's comprehensive plan to reflect recent and emerging changes in the City's growth and development goals including the newly defined vision for its employment centers CC C E One Time Identify 4-6 priority investment/reinvestment properties within the City Maintain a locally-comprehensive comprehensive property and asset database Continue collaboration with utility partners on serving primary activity centers Consider creating an Economic Development Opportunity Fund Match land use regulations to economic development vision, particularly in economic activity centers Implementation Lead Implementation Timing (Year)
City
Texas
Development Plan
City of Cibolo, Texas Strategic Economic Development Plan Page | 7-21 City of Cibolo, Texas Estimated Cost Strategic Economic Development Plan Implementation Matrix Public/NP Private 123456789 10 Cost Type TOOLBOX DEVELOPMENT Objective 4.2 Action 4.2.1 Create area-specific incentives in each activity center (e.g., promote housing diversity in I-35 at 1103, job creation in FM-78 East) CC ST One Time Action 4.2.2 Find consensus between policymakers, businesses, and residents over Downtown's long-term vision. Moreover, continue to engage with Downtown businesses to help with Downtown's ongoing planning efforts CC ST One Time Action 4.2.3 Create industry-specific incentives available throughout the City (e.g., industrial investment along I-10, healthcare investment in I35) CC ST One Time Action 4.2.4 Scale incentives based on size of prospect, particularly targeting startup and small businesses (fewer than 5 jobs) CC ST One Time Action 4.2.5 Create a scoring matrix that prioritizes location of the investment, type of business, size of project, quality of jobs, benefits packages offered, and any other characteristic valued by the City CC ST One Time Action 4.2.6 Create specific incentive levels based on the scoring for projects CC ST One Time Action 4.2.7 Engage with local and state partners to implement similar requirements for investments in the City CC ST One Time Action 4.2.8 Require claw back provisions in all incentive packages to ensure compliance with stated agreements CC ST Continuous Action 4.2.9 Tie any incentives to businesses with less than five (5) employees to participating in a small business development program/mentorship program CC ST Continuous Objective 4.3 Action 4.3.1 Increase staffing capacity to implement the full economic development strategy and become more proactive in business assistance CC D Annual Action 4.3.2 Define/refine position to be a liaison to local businesses to help address business/regulatory/policy challenges CC ST Continuous Action 4.3.3 Provide assistance to businesses going through the city's permitting process CC ST Continuous Action 4.3.4 Become conduit to the HR, professional services, and legal service support and networking CC ST Continuous OUTREACH, MARKETING, AND COMMUNICATION Objective 5.1 Action 5.1.1 Create all materials listed below in print and digital format, updating regularly (minimum once a year) CC C C Annual Action 5.1.2 Create target industry-specific fact and information sheets CC C Included Annual Action 5.1.3 Refine the existing marketing document to reflect recommended changes where applicable (e.g., incentives) CC C Included Annual Action 5.1.4 Create a property prospectus book detailed in 3.3.3 (digital only) CC C Included Annual Action 5.1.5 Create quality of life information sheets on livability and amenities in Cibolo CC C Included Annual Action 5.1.6 Create materials to market the new ombudsman program CC C Included Biennial Hire/reposition an existing City staff member under economic development to be a development ombudsman Create economic development incentives that match the City’s priorities and performance expectations Create marketing collateral necessary for effective retention and recruitment efforts Implementation Lead Implementation Timing (Year)
Implementation Lead Implementation Timing (Year)
OUTREACH, MARKETING, AND COMMUNICATION
Objective 5.2
Action 5.2.1 Highlight recent economic development activity and successes, maintaining a 'running tally' dashboard of accomplishments for the year
Action 5.2.2 Publish regular opinion editorials from business owners, partner organizations, or invited guests focused on topics that influence (or are influenced by) economic development in Cibolo
Action 5.2.3 Include separate topic-themed economic development messages authored by a city staff member in each newsletter
Action 5.2.4 Implement, monitor, and report the results of opinion polls and business surveys through the newsletter
Action 5.2.5 Highlight a different Cibolo business (preferably from the target industries) in each newsletter that have invested, expanded, or created new jobs
Action 5.2.6 Target writing two (2) or three (3) industry/market white papers each year focused on educating local businesses and residents about current or impending market shifts and how they will impact local/regional businesses
Activate existing business leaders in economic development efforts
Action 5.3.1 Develop at least five (5) business Ambassadors, individuals who can work with economic development staff to promote Cibolo and engage existing/prospective business owners in targeted industries. Train more as necessary
Action 5.3.2 Develop a network of mentors in each of the target industries, focusing on developing women, minority and young business owners to reach the city's diverse business base
Action 5.3.3 Develop at least four (4) engaged Cibolo residents as Advocates that can assist in community outreach and resident interaction
Action
Implement a proactive community engagement and education initiative Enact a monthly newsletter detailing market and economic development activities
Create a Business-2-Business database that businesses can access to find specific services/networking opportunities
Action 5.4.1 Hold an annual "State of the City" meeting open to the public (and televised) to discuss accomplishments and ongoing efforts for the previous/upcoming year
Action 5.4.2 Implement a biennial resident survey to gauge the goals and concerns of Cibolo residents about the City's economic development efforts. Use the results to inform any changes to approach
Action 5.4.3 Hold a community outreach meeting in each employment center annually to engage business leaders and residents on economic development issues, opportunities, and challenges those areas are facing
Action 5.4.4 Host semiannual panelist discussions on topics of economic development each year. These discussions should address specific market/location opportunities and challenges facing local businesses
Action 5.4.5 Provide an online portal for citizens and groups to submit questions, provide feedback on content, or request meetings on the economic development website
Enhance Cibolo's electronic and social media presence and activity
Action 5.5.1 Create a separate Cibolo economic development website outside the City's website structure based on the functional changes in scope/mission, augmenting content based on the included recommendations
Ensure weekly use of social media platforms (e.g., SnapChat, Instagram, Twitter, Facebook…)
Action 5.5.3 Enhance economic development connections with the GC, MU, and SATX websites and social media. Consider joint messaging/collabotation on social media events/posts
Action 5.5.4 Use the website to collect information, allow individuals to sign up for the newsletter, and better engage economic development staff
Create a citizens section on the website with access to educational information, the annual survey and results information, contact information for the assigned staff liaison, and the newsletter registration
City of Cibolo, Texas Strategic Economic
Page | 7-22 City of Cibolo,
Estimated Cost Strategic Economic Development Plan Implementation Matrix Public/NP Private 123456789 10 Cost Type
Development Plan
Texas
CC ST Monthly
CC ST Monthly
CC ST Monthly
CC ST Monthly
CC ST Monthly
CC O, I, R ST Monthly Objective
5.3
CC O, A Biennial
CC O, Included 2.2.4 Annual
CC N A Biennial
CC A Continuous Objective
5.3.4
5.4
CC N A Annual
CC N ST Biennial
CC N A Annual
CC C B Semiannual
CC A One Time Objective
5.5
CC C C One Time Action 5.5.2
CC Included One Time
CC Included One Time
CC Included One Time Action
CC Included One Time
5.5.5
AND
5.6
Action 5.6.1 Establish a formal economic development dashboard to track performance across each of these topic areas: [1] retention, [2] recruitment, [3] fiscal sustainability, [4] entrepreneurial development (once an etnrepreneurial specialist is hired)
Action 5.6.2 Retention metrics should include: [1] site visits performed, [2] ombudsman assists, [3] capital investment, [4] network event attendance, [5] prospect contacts
Action 5.6.3 Add a sixth metric jobs retained/expanded to retention metrics once the City has a consistent methodology to accurately collect and disseminate that information.
Action 5.6.4 Recruitment metrics should include: [1] number of prospects (visits and meetings) [2] acquired projects, [3] total jobs created, [4] average annual wage, [5] total capital investment, [6] debrief highlights from lost opportunities
Action 5.6.5 Fiscal sustainability metrics should include: [1] number of incentives, [2] dollar value of incentives, [3] jobs created/preserved from incentives, [4] capital investment created, [5] new tax revenues, [6] other benefits (e.g., infrastructure investments)
Action 5.6.6 Entrepreneurial metrics (once an entrepreneurial specialist is hired) should include: [1] enrollment inquiries, [2] business enrollment, [3] graduations, [4] jobs created, [5] debrief on businesses leaving the mentorship program
ORGANIZATION AND COORDINATION
6.1.1 Have the Planning & Economic Development Director serve in an administrative and public engagement role, guiding City recruitment collaboration efforts and being the direct point of contact with the EDC and partners
6.1.2 Have the existing Economc Development Manager position continue to address recruitment efforts, providing support when practical on the management of the ED website and networking events
Action 6.1.3 Hire a marketing and communications consultant to refresh all existing marketing collateral and create all new marketing collateral (both print and virtual) for economic development.
Action 6.1.4 Consider restructuring the Economic Development Manager position into more marketing and communications, overseeing all marketing collateral, managing the economic development website, and overseeing all social media and networking events
Action 6.1.5 Continue the
engagement and more proactively engage in workforce development
Cibolo,
Page | 7-23 City of Cibolo, Texas Estimated Cost Strategic Economic Development Plan Implementation Matrix Public/NP Private 1234567 89 10 Cost Type OUTREACH,
City of
Texas Strategic Economic Development Plan
MARKETING,
COMMUNICATION Objective
CC ST One Time
CC ST Semiannual
ST Semiannual
CC ST Semiannual
CC ST Semiannual
CC ST Semiannual
Objective 6.1 Action
CC ST Annual (Salary) Action
CC ST Annual (Salary)
CC C C One Time
CC ST Annual (Salary)
existing Business Retention and Expansion position to focus on all business outreach and engagement with existing businesses, managing the business roundtables, and administering the annual business survey CC ST Annual (Salary) Action 6.1.6 Hire an additional business retention and expansion specialist, expanding the City's capacity for business
CC D Annual (Salary) Action 6.1.7 Hire a City staff member under economic development to be
development
CC D Annual (Salary) Action 6.1.8 Hire a City staff member under economic development to be an entrepeneurial development specialist CC D Annual (Salary) Objective 6.2 Action 6.2.1 Create a quarterly coordination meeting schedule with the Chamber, MU, SATX A Quarterly Action 6.2.2 Establish a semiannual strategic meeting schedule with other regional and statewide partners CC, COC, MU, SATX, TX A Semiannual Action 6.2.3 Provide quarterly/semiannual reports to regional and statewide partners on activity and successes CC ST Quarterly Action 6.2.4 Establish a formal quarterly or semiannual coordination meeting with neighboring municipalities to address regional and crossboundary market issues CC, MU ST Quarterly Objective 6.3 Action 6.3.1 Create an official business advisory board of 5 to 10 business leaders and implementation partners (e.g., post-secondary education institutions) interested and willing to participate in the City's economic development effort CC ST One Time Action 6.3.2 Host monthly meetings with the advisory board on projects, activity, and strategy to garner advice and assistance in implementation CC ST Monthly Action 6.3.3 Have the City Council appoint at least one (1) member of the advisory board, though avoid having elected officials attending the meetings CC ST Annual Action 6.3.4 Create a committee structure to focus efforts in coordination with the City's focus areas; [1] Business Retention, [2] Marketing and Outreach, [3] Business Recruitment CC ST One Time Action 6.3.5 Ensure each committee is chaired (or co-chaired) by an active EDC board member CC ST Continuous Formalize staffing roles and responsibilities within the economic development department, expanding staff capacity to fully achieve the stated economic development goals
economic development dashboard in the City's Performance Management Program (PMP) on the City's economic development website to provide real-time information about the activity and successes of local economic development efforts Implementation Lead Implementation Timing (Year)
a Business Advisory Board to help with strategic planning and implementation of the City's economic development strategic plan
strategic relationships with local and statewide implementation partners
a
ombudsman
Refine the
Create
Enhance
LEGEND
Strategic Economic
Page | 7-24 City of Cibolo, Texas Estimated Cost Strategic Economic Development Plan Implementation Matrix Public/NP Private 123456789 10 Cost Type ORGANIZATION AND COORDINATION Objective 6.4 Action 6.4.1 Reconfigure information requirements on business licenses to collect more robust contact information and data about the business (e.g., NAICS code) CC ST Continuous Action 6.4.2 Work with Guadalupe County or create a locally-maintained version of property assessment data that combines all land, building, and business information to make geospatial analyses/searches more insightful CC, GC ST Continuous Action 6.4.3 Require all business building permit and applications to include full contact and business (if known) information CC ST Continuous
City of Cibolo, Texas
Development Plan
Implementation Leaders Cost Estimate Legend: Public ST Staff Time CC City of Cibolo A Under $1,000 GC Guadalupe County B $1,000 to $10,000 MU Other Municipalities C $10,000 to $50,000 TX State of Texas D $50,000 to $100,000 E $100,000 to $250,000 F $250,000 to $500,000 Partners G Over $500,000 COC Chambers of Commerce SATX Greater:SATX Regional Economic Partnership EDU Colleges
Universities in Region Action GVEC Guadalupe County Electric Cooperative Private C Consultant F Financial Institutions I Industry Leaders N Neighborhood Residents O Property Owners R Realtors/Brokers Work with City departments to develop comprehensive databases to help economic development efforts Implementation Lead Implementation Timing (Year)
&
