CITY OF AMARILLO, TEXAS

For The Fiscal Year Ended | September 30, 2018


Progress can be defined many ways. Progress can be forward movement toward a goal. Progress can be gradual betterment. These definitions of progress describe Amarillo. Amarillo’s progress is apparent – and the future is exciting.
As mayor, I have been honored to help lead this effort to bring progressand improve the quality of life for all Amarillo residents. The Amarillo City Council, elected by the citizens to carry out the community’s vision for the future, are dedicated to progress in Amarillo.
One of the guiding principles in how Amarillo City Council achieves progress and growth is Fiscal Responsibility. This is one of eight pillars defined in the BluePrint for Amarillo – along with Public Safety, Economic Development and Redevelopment, Civic Pride, Highly Educated Population, Customer Service, Excellence in Communication and Transportation.
How the City manages taxpayer money is the most important priority for every level of city government. Managing the City’s finances and resources responsibly and with transparency allows us to grow as a city. This is the foundation of a vibrant and expanding community. Fiscal Responsibility makes progress possible.
The Popular Annual Financial Report (PAFR) is a summary of how the city managed taxpayer money for the fiscal year ended September 30, 2018. The PAFR is designed to provide an overview of the City of Amarillo’s financial position, policies and its commitment to providing fiscally responsible programs and services that are responsive to citizens.
Fiscal Responsibility leads to progress in other council pillars – Economic Development and Redevelopment, Public Safety, and Civic Pride.
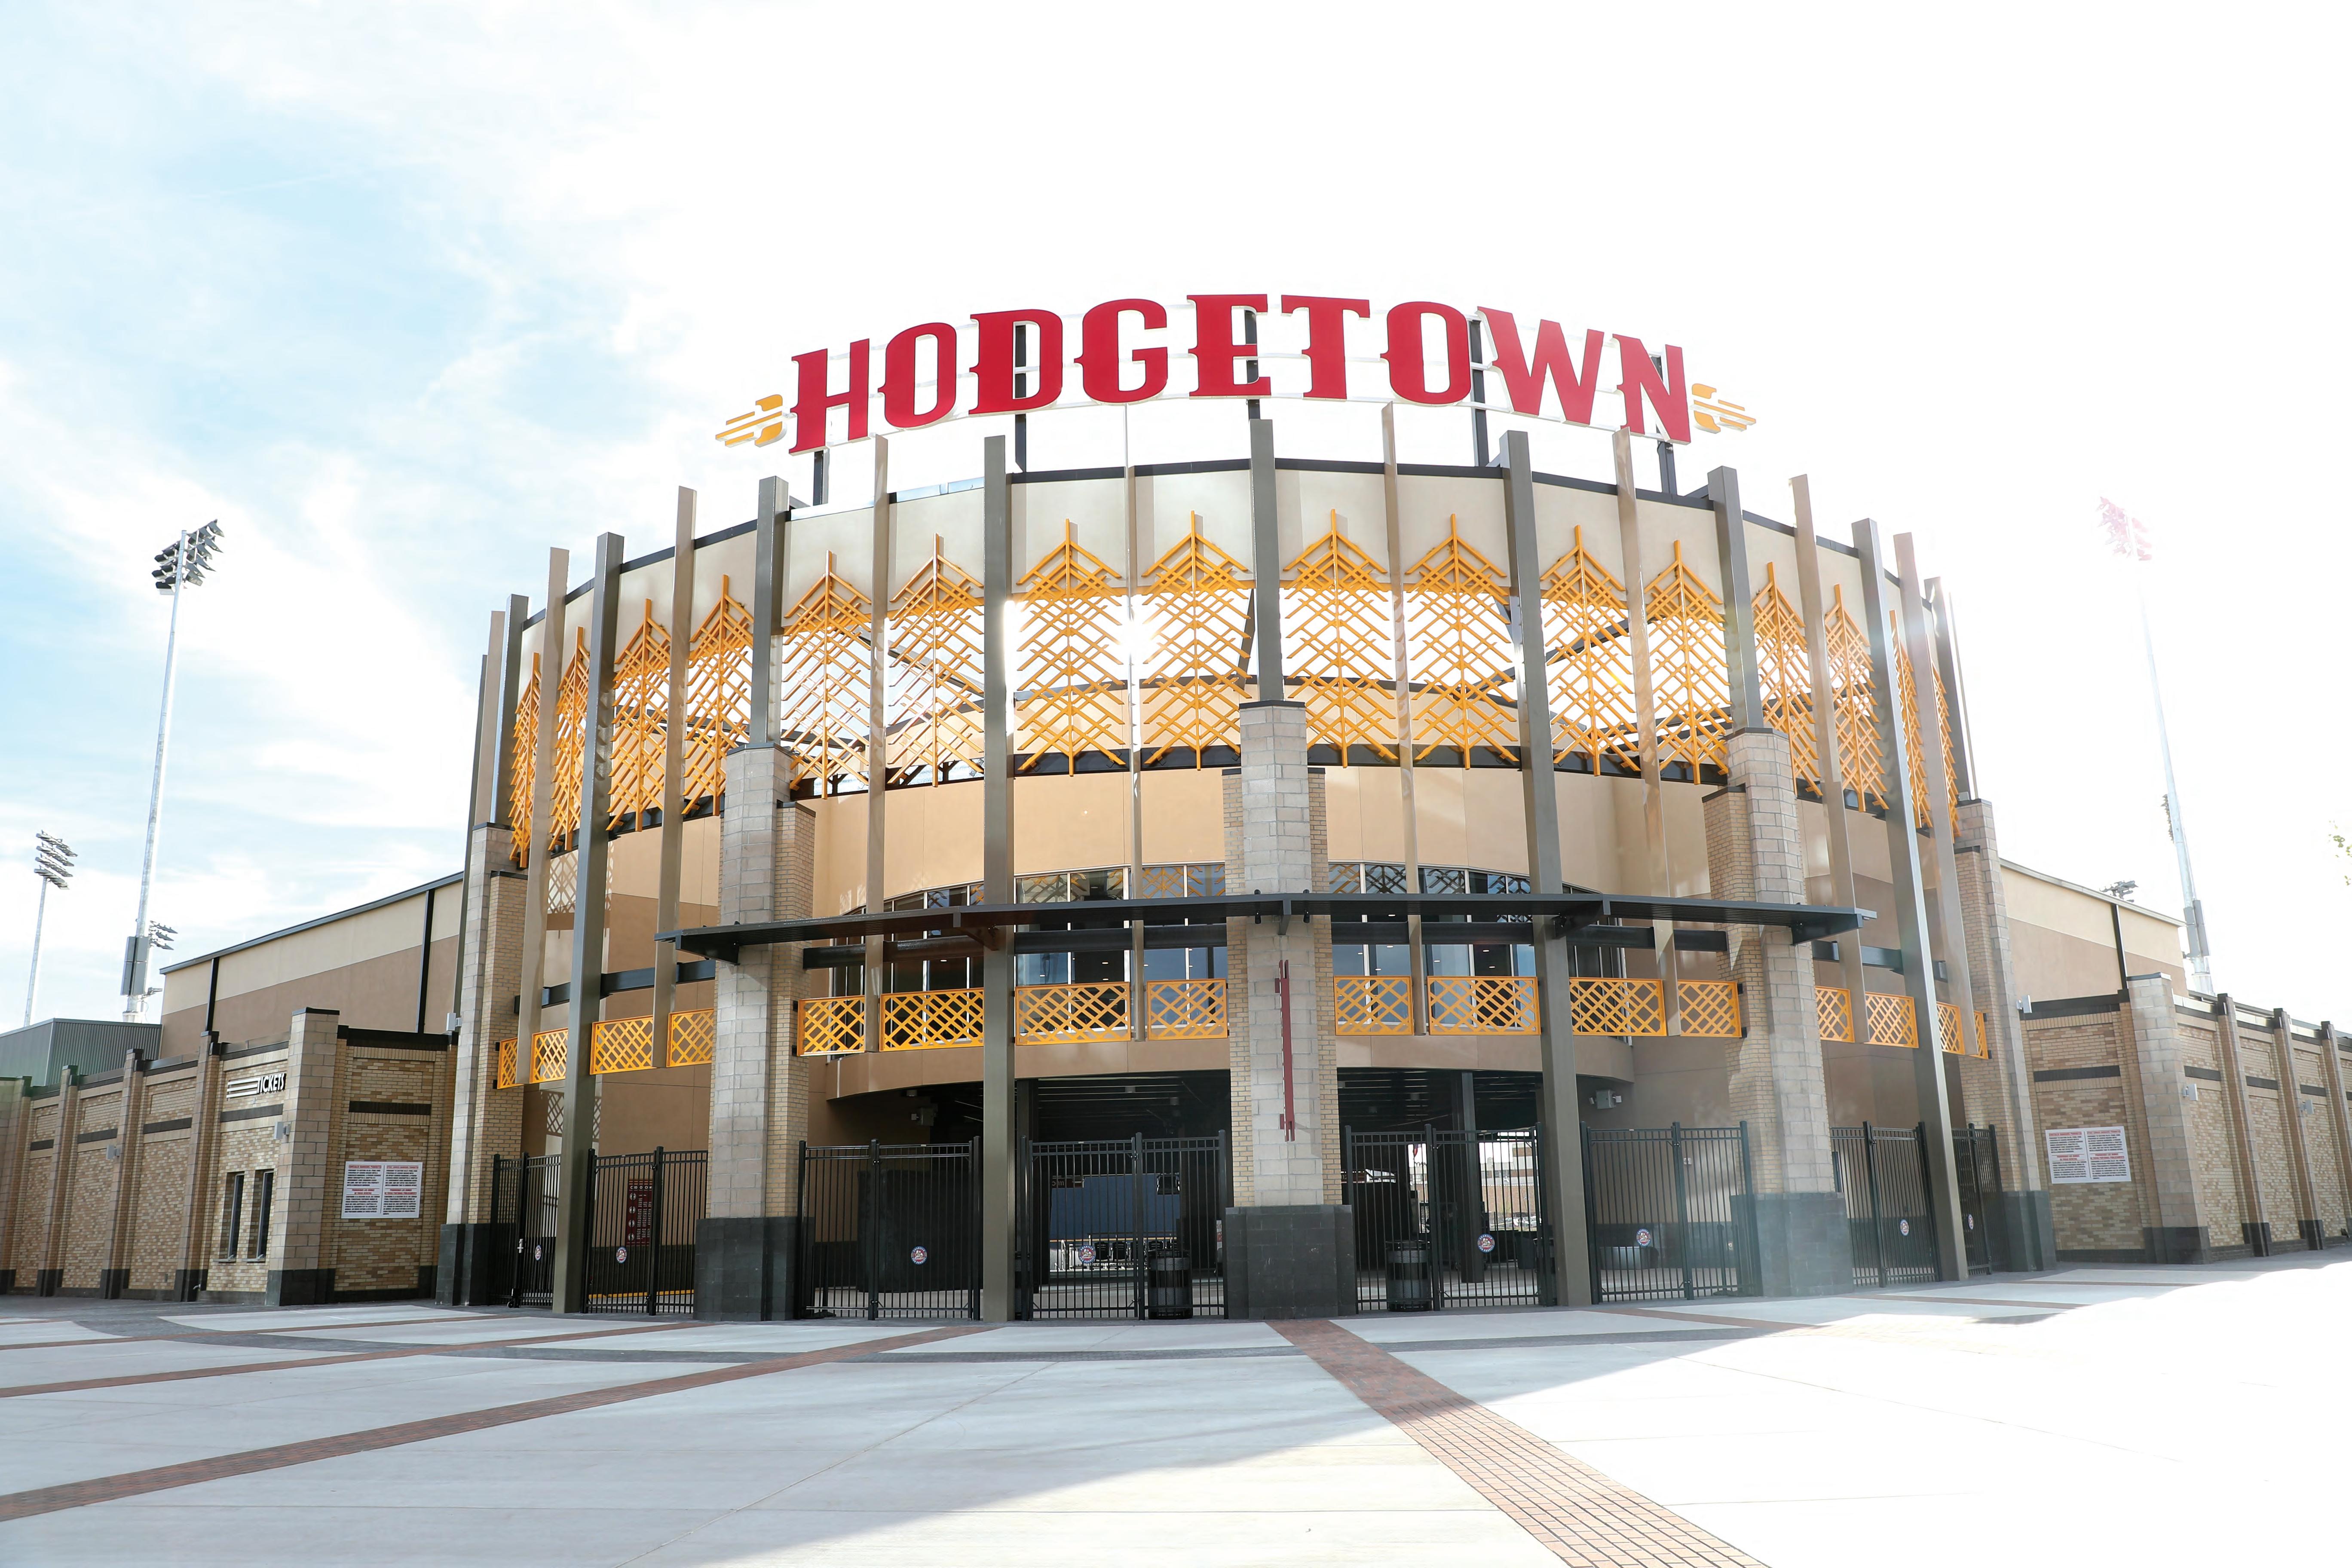
For Economic Development and Redevelopment, the City recently opened its multi-purpose event venue, Hodgetown, the home of the Amarillo Sod Poodles. Opened in April and funded through hotel occupancy taxes, Hodgetown represents the final piece in the Downtown Catalyst Project.
For Public Safety, the City recently added back 11 positions in the Amarillo Police Department that were previously unfunded and created six new police officer positions, along with five new positions in the Amarillo Fire Department.
For Civic Pride, the North Heights, Barrio, San Jacinto and Eastridge neighborhoods have been the beneficiaries of more than $10.3 million in improvement projects and neighborhood plan funds, $2.6 million of which was approved by voters in a 2016 bond election.
This is an exciting time for Amarillo. The city is growing thanks to a vision for the future that meets the needs of all parts of the city. The Council and I are honored to have been entrusted by the people of Amarillo to carry out this vision – and to make Amarillo’s future a reality.
POPULATION: 204,828 (estimated)
PUBLIC SAFETY:
Annual police services
Annual fire services
Number of fire stations
Number of fire hydrants
PHYSICAL:
Miles of streets
Number of street lights
Signalized intersections
Miles of storm sewers
AIRPORT:
Number of airlines
Scheduled daily flights
Annual passengers
MUNICIPAL WATER UTILITY:
Average daily production (gal)
Water distribution miles
Number of water wells
Wastewater plants
TRANSIT:
Number of buses/vans
Miles of fixed route
Fixed route passengers Demand

The government-wide financial statements are designed to provide readers with a broad overview of the finances of the City in a manner similar to a private-sector business.
The statement of net position presents information on all of the City’s assets, deferred outflows of resources, liabilities, and deferred inflows of resources with the difference reported as net position. Over time, increases or decreases in net position may serve as a useful indicator of whether the financial position of the City is improving or deteriorating. The statement of activities presents information showing how the City’s net position changed during the most recent fiscal year. All changes in net position are reported as soon as the underlying event giving rise to the change occurs, regardless of the timing of related cash flows. Thus, revenues and expenses are reported in this statement for some items that will not result in cash flows until future fiscal
periods (e.g., uncollected taxes). The change in net position is not reported here, but is the difference of total revenues and total expense. This year net position increased by $31,811,250. Revenues increased overall mainly due to an increased collection of sales tax, property tax, hotel occupancy tax, water and sewer charges, and solid waste charges. Citywide expenses remained consistent with the prior year with the largest increase in Culture and Recreation. During 2017/18, the City began fully operating both municipal golf courses instead of contracting some of the services outside the entity. However, additional revenues were recognized in golf operations related to this change. Another increase in expenses was in Solid Waste. New programs were implemented during 2017/18 including a big and bulky curbside program and a pilot program for carts along with additional resources invested in dumpsters, alley cleanup and an urgent response crew.
Current Assets
Noncurrent and Capital Assets
Total Assets
Deferred Outflows of Resources
Current Liabilities
Noncurrent Liabilities
Total Liabilities
Deferred Inflows of Resources
Net Position: Net Investment in Capital Assets Assests
Restricted Unrestricted
Total Net Position FYE 9/30/18
9/30/17
9/30/16 $241,725 1,284,813 $1,526,538 $32,624 $73,747 533,860 $607,607 $22,215 $869,778 38,214 21,348 $929,340 $253,684 1,149,502 $1,403,186 $49,410 $58,841 545,380 $604,221 $1,423 $813,812 22,149 10,991 $846,952 $249,855 1,088,272 $1,338,127 $63,258 $62,213 500,253 $562,466 $224 $799,699 17,868 21,128 $838,695

Charges for Services
Operating Grants & Contributions
Capital Grants & Contributions
Property Taxes
Sales Taxes
Other Taxes
Investment Earnings
Insurance Recovery/Cost
Total
$314,500 $134,207 20,393 15,389 43,304 56,094 24,366 1,330 (1,378) $293,705

$17,075 104,181 21,875 26,368 13,835 5,567 23,381 3,776 2,372 59,713 2,564 12,825 $293,532

STATEMENT OF REVENUES, EXPENDITURES & CHANGES IN FUND BALANCE
REVENUES
Taxes
License and Permits
Interfund Revenues
Intergovernmental Revenues
Citizen Contributions
Charges for Services
Fines and Forfeitures
Investment Earnings
Other Rentals and Commissions
Miscellaneous
Total Revenues
EXPENDITURES
General Government
Staff Services
Public Safety and Health
Streets, Traffic and Engineering
Culture and Recreation
Solid Waste Transit
Information Technology
Tourism
Capital Outlay
Total Expenditures
Excess of Revenues Over Expenditures
FYE 9/30/18
$126,924,503
3,300,746 1,297,732
4,433,519 48,883
36,066,879 4,578,390
782,752 482,908 192,617
178,108,929
4,148,506 10,133,298
90,587,450 15,016,651 22,181,243 15,293,540 5,038,578 3,996,924 3,108,395 1,318,293 170,822,878
7,286,051
FYE 9/30/17
$122,918,067 3,379,143 1,362,765 3,686,195 185,550
34,016,832 4,787,634 636,631 479,190 289,068
171,741,075
4,228,149 10,163,868
89,504,357
15,397,049 20,864,111 14,132,745 4,716,811 3,911,465 3,055,383 127,399 166,101,337
5,639,738
Net position represents the City’s assets less liabilities.
Net investment in capital assets consists of capital assets, net of accumulated depreciation, reduced by the outstanding balances of borrowings attributable to the acquisition, construction, or improvement of those assets.
Restricted net position consists of restricted assets reduced by liabilities and deferred inflows of resources related to those assets. For 2018, this category consists of $9.6 million restricted for debt service, $1.6 million for Tax Increment Financing, and $27.0 million restricted for other purposes such as grants.
Unrestricted net position is the remaining net position of the City after subtracting net investment in capital assets and restricted net position.
Charges for services represent fees paid by individuals, businesses, or other governments who purchase, use or directly benefit from the goods and services the City provides. For 2018, the largest items in this category include $85 million for water and wastewater charges, $21 million in solid waste charges, $5 million in drainage utility charges, and $11 million in airport charges. Water charges were strong and increased due to the City not receiving large amounts of precipitation during 2018.
Operating grants and contributions are grants and contributions that may be used to finance the regular operations of the City.
OTHER FINANCING SOURCES (USES)
Transfers In
Transfers Out
Net Change in Fund Balance
FUND BALANCE - BEGINNING
FUND BALANCE - ENDING
1,035,808 (5,897,312) 2,424,547
45,662,673
$48,087,220
177,820 (8,234,735) (2,417,177)
48,079,850 $45,662,673
Capital grants and contributions involve a capital asset of the City and may not be used for operating purposes.

A fund is a grouping of related accounts that is used to maintain control over resources that have been segregated for specific activities or objectives. The City, like other state and local governments, uses fund accounting to ensure and demonstrate compliance with finance-related legal requirements. All of the funds of the City can be divided into three categories: government funds, proprietary funds, and fiduciary funds. This report presents only the operating statements of the general fund, the water and sewer fund, the drainage utility fund, and the airport fund. For information on the other funds, as well as more detailed information on the funds presented here, a copy of the City’s Comprehensive Annual Financial Report may be obtained from the Finance Department at the Amarillo City Hall, 601 S. Buchanan St., Amarillo, TX 79101 or online at bit.ly/COAFinancialInformation .
Governmental funds are used to account for essentially the same functions reported as governmental activities in the government-wide financial statements. However, unlike the government-wide financial statements, governmental fund financial statements focus on near-term inflows and outflows of spendable resources, as well as on balances of spendable resources available at the end of the fiscal year. Accordingly, these statements do not reflect capital assets or longterm debt, and they report capital outlay as opposed to depreciation and report proceeds and principal reductions of long-term debt as sources and expenditures which increase or decrease fund balance. Such statements are useful in evaluating a government’s near-term financial requirements.
Because the focus of governmental funds is narrower than that of the government-wide financial statements, it is useful to compare the information presented for governmental funds with similar information presented for governmental activities in the government-wide financial statements. By doing so, readers may better understand the long-term impact of the government’s near-term financing decisions. Both the governmental fund balance sheet and the governmental fund statement of revenues, expenditures, and changes in fund balances provide a reconciliation to facilitate this comparison between governmental funds and governmental activities.
In addition to a general fund, the City maintains special revenue funds, two debt service funds, nine capital projects funds, and one permanent fund. Included in this special newsletter is the general fund statement of revenues, expenditures and changes in fund balance with comparative data from fiscal year ending September 30, 2017. Largest of the City’s funds, the general fund accounts for the majority of the City services, including police, fire, street maintenance, solid waste collection and disposal, traffic, parks, library, transit, and administrative services.
General Fund revenues increased over the previous fiscal year. The City saw an increase in sales tax collections for fiscal year 2018. Total sales tax collections came in at $57.40 million. Sales tax receipts remain strong; fiscal year 2018 saw an increase of approximately $1.86 million from fiscal year 2017 collections, which set a new record in collections for the City. The City saw a slight reduction in net hotel occupancy tax revenue in 2017/18, recording approximately $6.35 million, down from $6.59 million. The City had gross hotel occupancy tax receipts of $6.93 million and rebated $577 thousand to the convention hotel per the development agreement. Electricity and gas franchise fees came in slightly higher than expected, $11.68 million or a $196 thousand increase over 2016/17. The City also saw increased property tax collections of $44.06 million versus $42.00 million during 2016/17 due to increased appraised values in the City limits as well as a rate increase to fund voter approved general obligation bonds from the November 2016 bond election. Sanitation fees and landfill charges came in approximately $472 thousand higher than 2016/17 at $20.07 million. The City saw increased use at the landfill and a small increase in commercial and residential customers that affected these revenues.

STATEMENT OF REVENUES, EXPENDITURES & CHANGES IN NET POSITION
OPERATING REVENUES
Utility Sales and Service
Tap Fees and Frontage Charges
Rents and Miscellaneous
Total Operating Revenues
OPERATING EXPENSES
Salaries, Wages and Fringe Benefits
Supplies
Fuel and Power
Contractual Services
Water Authority Charges
Other Charges
Depreciation
Total Operating Expenses
Operating Income
Total Nonoperating Revenues (Expenses)
Income before Contributions and Transfers
Capital Contributions
Net Transfers from (to) Other Funds
Change in Net Position
NET POSITION - BEGINNING OF YEAR
PRIOR PERIOD ADJUSTMENT
NET POSITION - BEGINNING OF YEAR (Restated)
NET POSITION - END OF YEAR

FYE 9/30/18
$81,896,464 271,403
82,295,583 13,920,177 1,513,845 4,582,045 5,881,144 5,896,428 10,791,622 14,196,462 56,781,723 25,513,860 (1,542,744) 23,971,116 4,027,924 (553,859) 27,445,181
440,727,320 (5,742,514)
434,984,806
$462,429,987
FYE 9/30/17
$73,545,211 310,453 82,405 73,938,069
14,467,892 1,350,992 4,618,493
5,063,458 6,974,102
10,086,833
14,550,803
57,112,573
16,825,496 (3,315,915)
13,509,581
5,226,486 (922,560)
17,813,507
422,913,813422,913,813
$440,727,320
NUMBER OF CITY WATER & SEWER CUSTOMERS
Fund balance is the net position of a governmental fund (difference between assets and liabilities).
Capital outlay represents the acquisition or construction of capital assets in the governmental funds. For governmental fund accounting, capital assets are expensed when purchased or constructed through the line item capital outlay.
Other financing sources (uses) represent increases (decreases) in the fund balances of a governmental fund other than revenues (expenditures). Examples include transfers between funds within the City and bond proceeds.
Depreciation is the allocation of the cost of using a capital asset over the asset’s estimated useful life.
Capital contributions are funds and/or assets contributed to the City specifically for the acquisition, construction, or improvement of capital assets.
Deferred outflow of resources is a consumption of net assets by the government that is applicable to a future reporting period.
Deferred inflow of resources is an acquisition of net assets by the government that is applicable to a future reporting period.
Water is Amarillo’s most precious resource. And the City of Amarillo has been recognized for protecting this resource. For the first time, the city earned the Blue Legacy Conservation Award from the Texas Water Foundation, the Texas Water Development Board and the Texas Conservation Advisory Council. The award showcases water stewardship and water conservation.
The city was recognized for its reclaimed water program, which is the supply of treated wastewater plants over the past five years. This correlates to 3.3 billion gallons a year provided by the city, in partnership to Xcel/SPS for generation of electricity.

The City maintains three different types of proprietary funds. Enterprise funds are used to report the same functions presented as business-type activities in the government-wide financial statements. The City uses enterprise funds to account for its water and sewer system, the drainage utility system, and for its international airport. Internal service funds are an accounting device used to accumulate and allocate costs internally among a governmental entity’s various functions. The City uses internal service funds to account for its fleet of vehicles, its management information systems, and its general and employee health self-insured programs.
Proprietary funds provide the same type information as the government-wide financial statements, only in more detail. The water and sewer fund, drainage utility fund, and airport fund statements of revenues, expenditures and changes in net position are presented in this special newsletter with comparative data from fiscal year ending September 30, 2017.
STATEMENT OF REVENUES, EXPENDITURES & CHANGES IN NET POSITION
FYE 9/30/18
Drainage Utility Assessments
Forfeited Discounts
OPERATING REVENUES FYE 9/30/17 $5,454,267 93,814
Total Operating Revenues
OPERATING EXPENSES
Salaries, Wages and Fringe Benefits
Supplies
Contractual Services
Other Charges
Depreciation
Total Operating Expenses
Operating Income (Loss)
Total Nonoperating Revenues (Expenses)
Income (Loss) before Contributions and Transfers
Capital Contributions
Net Transfers from (to) Other Funds
Change in Net Position
NET POSITION - BEGINNING OF YEAR
PRIOR PERIOD ADJUSTMENT
NET POSITION - BEGINNING OF YEAR (Restated)
NET POSITION - END OF YEAR
The Internet has changed how consumers purchase goods/services. The City of Amarillo has partnered with the Amarillo Chamber of Commerce on the “Buy the Way – Keep It Local” (BTW) campaign, which shows the importance of shopping locally. Sales taxes are a primary revenue source. The BTW campaign is helping. There was a 3.24 percent increase in sales taxes from May 2018–April 2019 compared to May 2017–April 2018. Sales taxes for the past fiscal year were up 2.99 percent compared to the previous year. Through April, sales taxes increased 1.98 percent from the same time last year. With the BTW campaign, Amarillo is taking a proactive approach to a changing economy.
14,029,236 (564,210) 13,465,026 $17,260,087 $5,452,126 88,359 5,540,485 1,309,766 185,836 957,723 436,002 117,147 3,006,474 2,534,011 15,678 2,549,689 12,444 (244,958) 2,317,175 11,712,06111,712,061 $14,029,236


STATEMENT OF REVENUES, EXPENDITURES & CHANGES IN NET
OPERATING REVENUES
Airfield Fees and Commissions
Terminal Building Revenue
Other Building Revenue
Total Operating Revenues
OPERATING EXPENSES
Salaries, Wages and Fringe Benefits
Supplies
Fuel and Power
Other Contractual
Other Charges
Depreciation
Total Operating Expenses
Operating Income (Loss)
Total Nonoperating Revenues (Expenses)
Net Loss before Contributions and Transfers
Capital Contributions
Net Transfers from (to) Other Funds
Change in Net Position
NET POSITION - BEGINNING OF YEAR PRIOR PERIOD ADJUSTMENT
NET POSITION - BEGINNING OF YEAR (Restated)
NET POSITION - END OF YEAR
TX-PACE (Texas Commercial Property Assessed Clean Energy) is a proven financial tool that enables Texas property owners to upgrade facility infrastructure with little-or-no upfront capital outlay. The program is designed so that owners lower their operating costs and pay for eligible improvements with the savings generated, taking advantage of affordable, long-term financing.
FYE 9/30/18
$788,190 7,434,616 1,691,765 9,914,571 3,393,879 457,031 544,216 1,997,578 2,562,998 5,625,417 14,581,119 (4,666,548) 2,202,202 (2,464,346) 3,190,753 (219,867) 506,540 80,127,908 (1,228,832) 78,899,076 $79,405,616

FYE 9/30/17
$628,243 7,162,945 1,637,825 9,429,013
3,374,750 458,604 615,376 1,316,102 2,374,843 5,453,657 13,593,332 (4,164,319) 1,412,940 (2,751,379) 2,089,395 (29,755) (691,739) 80,819,64780,819,647
$80,127,908
TX-PACE can be used to pay for new heating and cooling systems, lighting improvements, solar panels, water pumps, insulation and more, for existing properties – including commercial, industrial, agricultural, nonprofit and multifamily.
Owners gain access to private, affordable, long-term (typically 10-20 years) financing that is not available through traditional funding avenues.
The Amarillo City Council approved the PACE program for use in the city limits and extraterritorial jurisdiction (ETJ). There are no City of Amarillo funds involved in this program, as projects are funded by private dollars where property owners interested in the program select their own capital provider.
The first project for the City of Amarillo’s Beautification and Public Arts Advisory Board was to approve a mural at Rick Husband Amarillo International Airport.
It required Joey Martinez only two days to combine the many iconic images of Amarillo into a massive graffiti-style mural that encompasses an entire wall at Rick Husband Amarillo International Airport. The site of the mural is a 12-by-48 foot curved wall on the west side of the second floor ticket area – clearly visible to visitors.

EMPLOYER
Amarillo Independent School District
CNS Pantex
Baptist/St. Anthony’s Health Systems
Tyson Foods Inc.
Northwest Texas Healthcare
Affiliated Foods
Walmart
Texas Department of Criminal Justice
Bell Helicopter, Inc
Amarillo VA Health Center
Amarillo continues to receive a AAA debt rating from Standard & Poor’s rating service on general obligation debt, water and sewer revenue bond debt, and drainage utility debt. AAA is the highest rating which allows the City to enjoy favorable interest rates on the issuance of debt.
While this presentation does not conform to Generally Accepted Accounting Principles (GAAP), the purpose of these statements is to provide the citizen with a selection of the information contained within the City’s Comprehensive Annual Financial Report (CAFR). Component unit information has been excluded from this presentation in order to focus on the primary government. The City’s accounting policies do conform to GAAP as set forth by the Governmental Accounting Standards Board. The City’s separately prepared and audited CAFR offers a complete description of the City’s significant accounting policies and other disclosures required by GAAP, as well as a more detailed analysis of the City’s financial position. A copy of the CAFR can be obtained at the Finance Department at the Amarillo City Hall (601 S. Buchanan St.) or online at bit.ly/COAFinancialInformation .
Ginger Nelson, Mayor
Elaine Hays, Place 1
Freda Powell, Place 2
Eddy Sauer, Place 3
Howard Smith, Place 4
Jared Miller, City Manager
Michelle Bonner, Deputy City Manager
Kevin Starbuck, Assistant City Manager
Floyd Hartman, Assistant City Manager
Laura Storrs, Director of Finance
Jordan Schupbach, Director of Public Communications
Raymond Lee, Director of Public Works
Jonathan Gresham, Director of Utilities
Rich Gagnon, Information Technology Director
Michael Kashuba, Director of Parks & Recreation
Ed Drain, Chief of Police
Jeff Greenlee, Fire Chief
Bryan McWilliams, City Attorney
Frances Hibbs, City Secretary
Valerie Kuhnert, City Auditor
(806) 378-4209
michelle.bonner@amarillo.gov
601 S. Buchanan St. P.O. Box 1971
Amarillo, Texas 79105-1971
Fax (806) 378-9394
City TDD (806) 378-4229