

Letter from Mayor
Letter from Mayor
Letter from Mayor Cole Stanley
Letter from Mayor Cole Stanley


Transportation safety is one of our city’s most important priorities. Every resident deserves safe streets to travel on, whether it be by walking, biking, taking transit, or driving. That’s why we are proud to introduce Amarillo’s first Safe Streets and Roads for All (SS4A) Plan, a roadmap to improve safety for everyone in our community.
Transportation safety is one of our city's most important priorities. Every resident deserves safe streets to travel on, whether it be by walking, biking, taking transit, or driving. That's why we are proud to introduce Amarillo's first Safe Streets and Roads for All (SS4A) Plan, a roadmap to improve safety for everyone in our community.
As part of this plan, we have developed a vision with a critical goal of reducing fatal and severe injury crashes in Amarillo by 35 percent by 2035. This goal reflects our commitment to creating a safer, more connected city for all roadway users, including but not limited to pedestrians, bicyclists, drivers, and transit users
As part of this plan, we have developed a vision with a critical goal of reducing fatal and severe injury crashes in Amarillo by 35 percent by 2035. This goal reflects our commitment to creating a safer, more connected city for all roadway users, including but not limited to pedestrians, bicyclists, drivers, and transit users.
This plan is rooted in extensive community input and data analysis, identifying the areas where safety improvements are most needed. From safer crossings to improving street lighting, traffic calming, new traffic signals, street reconstruction, and better biking and walking infrastructure, the SS4A Plan outlines specific actions we will take to make Amarillo’s streets safer.
This plan is rooted in extensive community input and data analysis, identifying the areas where safety improvements are most needed. From safer crossings to improving street lighting, traffic calming, new traffic signals, street reconstruction, and better biking and walking infrastructure, the SS4A Plan outlines specific actions we will take to make Amarillo's streets safer.
We are excited to work together with the community to bring this vision to life. With this plan, we are taking firm steps toward a future where crashes are less frequent, less severe, and everyone can travel with confidence and peace of mind. These efforts will not only save lives but also enhance the quality of life for all Amarillo residents.
We are excited to work together with the community to bring this vision to life. With this plan, we are taking firm steps toward a future where crashes are less frequent, less severe, and everyone can travel with confidence and peace of mind. These efforts will not only save lives but also enhance the quality of life for all Amarillo residents.
Thank you for supporting our mission to make Amarillo a safer, stronger community for generations to come
Thank you for supporting our mission to make Amarillo a safer, stronger community for generations to come.
Sincerely,
Sincerely,

Cole Stanley Mayor, City of Amarillo
Cole Stanley Mayor, City of Amarillo
Acknowledgements
The City of Amarillo’s first Safe Streets and Roads for All (SS4A) Plan is the result of a yearlong effort involving extensive analysis, planning, engineering, and community engagement. This document reflects a collaborative process that brought together expertise from planning and engineering professionals, City staff, Metropolitan Planning Organization (MPO) staff, the Texas Department of Transportation (TxDOT), the Citizen Oversight Committee, community leaders, and thousands of Amarillo residents who participated in the public engagement process.
The success of this effort was made possible through the contributions of the following individuals and organizations:
Project Team
Emily Koller, Planning Director, City of Amarillo
Shari Kendall, Community Engagement Manager, City of Amarillo
Jon Barnes, Grants and Special Projects Manager, City of Amarillo
Joy Stuart, Senior Communications Officer, City of Amarillo
Yige Eagle Tang, Senior Associate, The Goodman Corporation
Robert McHaney, Chief of Integrated Planning, The Goodman Corporation
Jonathan Brooks, Transit Practice Lead, The Goodman Corporation
Citizen Oversight Committee
Tim Ingalls
Sherrie Ferguson
Terri Guengerich
Chris Podzemny
Steve Rodgers
Steph Atkinson
Adam Schaer
Jimmy Muncy
Luis Pena
MPO Staff
Travis Muno, MPO Administrator, Amarillo MPO
Jenifer Ramirez, Senior Planner, Amarillo MPO

Source: https://www.visitamarillo.com/
Additional City Staff
Kyle Schniederjan, Capital Projects and Development Engineering Director, City of Amarillo
Jackson Zaharia, City Engineer & Floodplain Admin., City of Amarillo
Michael Padilla, Assistant Director of Public Works, City of Amarillo
Monica Silva, Social Media Manager, City of Amarillo
Donny Hooper, Assistant City Manager & Public Infrastructure Director, City of Amarillo
Michael Kashuba, Parks & Recreation Director, City of Amarillo
Jeramy Parrie, Engineering GIS Coordinator, City of Amarillo
Chase Brady, Multimedia Production Manager, City of Amarillo
David Henry, Media Relations Manager, City of Amarillo
Kristen Wolbach, OE&I Director, City of Amarillo
Andrew Freeman, Deputy City Manager/Public Safety Director, City of Amarillo
Martin Birkenfeld, Chief of Police, City of Amarillo
Julia Miller, Transit Planner, City of Amarillo
Other Partner Organizations
Texas Department of Transportation
Amarillo Independent School District (ISD) Canyon ISD

Highland Park ISD
Panhandle Regional Planning Commission
Amarillo College
This plan is a testament to the dedication and collaboration of these individuals and organizations. Their contributions have played a vital role in shaping a safer and more accessible transportation future for Amarillo.
Acronyms, Abbreviations, and Key Terms
Glossary of Acronyms
AADT Annual Average Daily Traffic
AISD Amarillo Independent School District
Amarillo MPO Amarillo Area Metropolitan Planning Organization
AASHTO American Association of State Highway and Transportation Officials
ACT Amarillo City Transit
ADA American Disabilities Act
APS Audible Pedestrian Signals
ADT Average Daily Traffic
BCA Benefit Cost Analysis
BIL Bipartisan Infrastructure Law
CAT 7 Category 7
CATM Crash Analysis Technical Memorandum
CIP Capital Improvement Plan
COA City of Amarillo
CRIS Crash Records Information System
DOT Department of Transportation
DVMT Daily Vehicle Miles Traveled
E&I Engineering & Inspection
FHWA Federal Highway Administration
FTA Federal Transit Administration
GIS Geographic Information Systems
HAWK Signal High-intensity Activated Crosswalk Signal
HIN High Injury Network
HSIP Highway Safety Improvement Program
ISD Independent School District
City of Amarillo | Transportation Safety Action Plan
ISTEA
KABCO Scale
Intermodal Surface Transportation Efficiency Act
K – Fatal
A – Incapacitating Injury
B – Non-Incapacitating Injury
C – Possible Injury
O – Property Damage Only
LEP Limited English Proficiency
LOS Level of Service
MEV Million Entering Vehicles
MPO Metropolitan Planning Organization
NOFO Notice of Funding Opportunity
PCI Pavement Condition Index
POC Project Oversight Committee
PHB Pedestrian Hybrid Beacon
PRPC Panhandle Regional Planning Commission
PROMPT Panhandle Regional Organization to Maximize Public Transportation
PTASP Public Transportation Agency Safety Plan
BUILD Better Utilizing Investments to Leverage Development Grant Program
ROW Right-of-Way
SGR State of Good Repair
SHSP Texas Strategic Highway Safety Plan
SRTS Safe Routes to School
SS4A Safe Streets and Roads for All
TA Transportation Alternatives
TDC Transportation Development Credits
TM Technical Memorandum
TMUTCD Texas Manual on Uniform Traffic Control Devices
TIP Transportation Improvement Program
TRB Transportation Research Board
TSAP Transportation Safety Action Plan
Acronyms, Abbreviations, and Key Terms
TxDOT
Texas Department of Transportation
USDOT United States Department of Transportation
V/C Volume / Capacity
VMT Vehicle Miles Traveled
VSL Value of Statistical Life
WTAMU West Texas A&M University
Chapter 1: Overview
In 2024, the City of Amarillo launched a Safe Streets and Roads for All (SS4A) planning initiative, funded by the U.S. Department of Transportation (USDOT) SS4A grant program. This project aims to identify the City’s most unsafe streets and roadways, with the goal of significantly reducing serious injuries and fatalities on Amarillo’s roads. This planning process occurred over a year long period and implemented a multi-faceted strategy by utilizing a synthesis of innovative data analyses techniques, public engagement feedback, and urban planning best practices to create the recommended list of projects.
The Amarillo SS4A project was launched in February of 2024 and started with an online survey, which gained over 4,700 responses. Regular meetings with City staff were also held, as well as stakeholder meetings with the Citizen Oversight Committee meetings. In addition to the public engagement strategies, the project team also developed the crash analysis and Amarillo’s HighInjury Network (HIN). A HIN is a small portion of a city’s streets or roadways where a disproportionately high number of severe traffic injuries or fatalities occur. Through the engagement and analysis phases of this project, Amarillo’s most dangerous roads were identified. From there, a final project list was created and prioritized which can be used by city officials as a guidebook as to which projects should be completed first.
SS4A Plan Overview
A Safe Streets and Roads for All Plan (Plan) is a comprehensive roadway safety strategy aimed at reducing transportation-related fatalities and serious injuries on a community’s roadway network. Established by the Bipartisan Infrastructure Law (BIL), this USDOT federal grant program appropriates $5 billion in funds over a five-year period, between 2022 – 2026. This initiative aims to create safe transportation networks for all users, regardless of age or ability, including drivers, pedestrians, cyclists, and those that take transit. The plan is typically developed by a local government or agency and involves analyzing crash data to determine a community’s most dangerous intersections and roadways and recommending proven safety countermeasures that will reduce serious injuries and fatalities on those roads. Recommended street improvements can vary, but often include roadway redesigns, enhanced signage, upgraded lighting, and traffic calming measures.
The SS4A program encourages a collaborative and data-driven approach, often involving public input and partnerships with local stakeholders to ensure that safety improvements address a community’s specific needs. These plans aim to drastically reduce serious injuries and fatalities through prioritizing the most dangerous areas, promoting a safer transportation network.
The Safe Systems Approach
In 2022, the United States Department of Transportation (USDOT) has adopted a Safe Systems Approach as the guiding paradigm to address roadway safety. 1 The Safe Systems Approach aims to eliminate fatal and serious injuries for all roadway users. This approach focuses on reducing roadway risks through the creation of numerous layers of protection, to both prevent crashes from occurring and to minimize harm when crashes do occur. Unlike traditional roadway safety strategies, the Safe Systems Approach accounts for both human mistakes and vulnerabilities, designing a system with redundancies to protect all roadway users.
There are six principles to the Safe Systems Approach 2, which are detailed below and displayed in Figure 1.1
• Death and Serious Injuries are Unacceptable: A Safe System Approach prioritizes the elimination of crashes that result in death and serious injuries.
• Humans Make Mistakes: People will inevitably make mistakes and decisions that can lead or contribute to crashes, but the transportation system can be designed and operated to accommodate certain types and levels of human mistakes and avoid death and serious injuries when a crash occurs.
• Humans are Vulnerable: Human bodies have physical limits for tolerating crash forces before death or serious injury occurs; therefore, it is critical to design and operate a transportation system that is human-centric and accommodates physical human vulnerabilities.
• Responsibility is Shared: All stakeholders, including government at all levels, industry, non-profits/advocacy groups, researchers, and the general public, are vital to preventing fatalities and serious injuries on our roadways.
• Safety is Proactive: Proactive tools should be used to identify and address safety issues in the transportation system, rather than waiting for crashes to occur and reacting afterwards.
• Redundancy is Crucial: Reducing risks requires that all parts of the transportation system be strengthened, so that if one part fails, the other parts still protect people.
1 USDOT, Federal Highways Administration The Safe Systems Approach. Retrieved from: https://safety.fhwa.dot.gov/zerodeaths/docs/FHWA_SafeSystem_Brochure_V9_508_200717.pdf
2 USDOT. What is a Safe Systems Approach? (2024). Retrieved from: https://www.transportation.gov/NRSS/SafeSystem

Amarillo SS4A Plan
Why does Amarillo need an SS4A plan? The City of Amarillo initiated this roadway safety plan to identify specifically which roads in Amarillo are most in need of transportation safety improvements. Conducting this analysis will identify tailored results for the Amarillo community and provide valuable insight for city appointed and elected officials when choosing which roads and areas of town to make transportation investment decisions. The results of the analysis will utilize Amarillo’s existing infrastructure, including roads, sidewalks, and bike lanes, to perform the safety analyses, which will produce results and recommendations that are tailored for this community. Additionally, the community of Amarillo also has an opportunity to weigh into the planning process through a robust engagement strategy. This aspect makes the Plan truly
3 USDOT. What is a Safe Systems Approach? (2024). Retrieved from: https://www.transportation.gov/NRSS/SafeSystem
Figure 1.1. Safe Systems Approach Methodology 3
uniquely Amarillo – through integrating the community’s insight into overall project recommendations. The plan itself will be used as a playbook for implementation and will be the basis for future discretionary funding pursuits.
Another reason why Amarillo is conducting this Plan is to balance transportation improvement dollars – both geographically and across different transportation options This Plan seeks to improve safety for all roadway users, and emphasizes the safety of vulnerable roadway users, including pedestrians, cyclists, and individuals with special needs, including children, seniors, and people with disabilities. For example, a major theme heard from the Amarillo community was safety concerns around schools. This theme was given a high priority when recommending the final projects because students walking between their homes and schools are vulnerable roadway users and should have adequate protection from vehicular traffic through dedicated sidewalk or trail facilities.
This Plan is also in alignment with other City of Amarillo overarching goals. City Plan – Vision 2045 4 , is Amarillo’s Comprehensive Plan and outlines the vision of the future of Amarillo and provides insight on the City’s desired direction for the future through a collection of guiding principles, policies, and recommendations. Below highlight several supporting statements from City Plan that support the community’s desire to create safer streets in Amarillo:
• Guiding Principle: Create a variety of walkable destinations throughout the city while ensuring convenient local and cross-town connectivity for cars, bikes, and transit.
• Guiding Principle: Increase overall quality of life for all residents by promoting safe, clean, and protected neighborhoods with well-amenities park spaces, goods, and services nearby.
• Mobility Goal 1: Ensure pedestrian safety and walkability at major intersections
• Mobility Goal 4: Improve sidewalk connectivity to parks and schools.
• Mobility Chapter Recommendation: Adopt a Vision Zero/Safe Streets and Roads for All framework as a City policy.
• Mobility Chapter Recommendation: Continue safety improvements in Downtown.
Vision and Goals
The Vision and Goal Framework serves as the foundational roadmap for the City of Amarillo’s SS4A Plan, outlining collective inputs and strategic objectives. It offers a comprehensive guide to steer efforts towards creating safer streets and enhancing road infrastructure to benefit all roadway users. This framework establishes a clear vision for the future and sets measurable goals to ensure progress and accountability in achieving a safe and accessible community. Figure 1.2 on the following page visually displays the visioning process for this Plan. Several factors were taken into consideration when developing the overarching vision for this Plan Once the vision was established, seven specific goals were identified to help achieve this vision. Figure 1.3 provides additional detail on the Plan’s goals.
4 City of Amarillo. City Plan (2024). Retrieved from: https://www.amarillo.gov/planning/city-plan/

Figure 1.2 Vision and Goals Process

Figure 1.3 Plan Goals
Report Structure
The Amarillo SS4A Plan is organized in seven chapters along with eight technical memorandums, outlined below. This structure is designed to balance ease of reading while also providing detailed analysis Many of the chapters are supported with a more detailed technical memo that can be found in the appendix. This setup allows for the chapters to be concise, easy to read, and focused on the main points and key ideas, while the technical memos provide indepth information for audiences that need more detail. This way, the report is easy to understand while still having the depth needed for technical work. The report will start off with an overview of existing conditions, followed by a summarization of the engagement efforts, crash analysis, High Injury Network analysis, and concludes with final project recommendations.
• Chapter 1: Overview – This chapter provides an introduction to the Safe Streets and Roads for All federal grant program and examines the need for a SS4A Plan in Amarillo.
• Chapter 2: Existing Conditions – This chapter provides a review of the City’s existing demographic and infrastructure conditions to help inform the final project selection process. Land uses, transportation demand, major destinations, and other land use impacts on transportation infrastructure are explored.
• Chapter 3: Policy Review – This chapter provides an overview of the existing City of Amarillo policy documents. This analysis includes city plans, guidelines, and design standards and their applicability to the SS4A plan. Key safety policy opportunities are also identified through a gap analysis of existing planning documents.
• Chapter 4: Community Engagement – This chapter provides an overview of the public engagement methods that were conducted for this project. Additionally, highlights from the public’s feedback are also identified and summarized.
• Chapter 5: Crash Overview and High Injury Network Development – This chapter provides an overview of the detailed crash analysis that was conducted and identifies Amarillo’s most dangerous intersections and road segments through a HIN analysis. The results of these analyses are summarized in this chapter.
• Chapter 6: Safety Strategy Framework – This chapter introduces the Safety Focus Areas in Amarillo. These are areas of frequent concern that have been identified through the crash analysis, HIN, and engagement process. Specific action items are discussed to help address these safety focus areas. The chapter concludes with key metrics to ensure plan goals and action items are being completed.
• Chapter 7: Project Summary – This chapter provides an overview of the 16 safety improvement projects selected for the Amarillo SS4A Plan.
• Technical Memorandums (TM) – Below provides the list of tech memos that have been prepared for this analysis:
o Technical Memorandum 1: Existing Conditions – This memo provides a detailed overview of Amarillo’s existing transportation and safety conditions. An analysis is provided of Amarillo’s roads, sidewalks, bike lanes, and other transportation infrastructure. Major land uses and destinations are also reviewed as part of this analysis. This technical memo corresponds to the content that can be found in Chapter 2: Existing Conditions.
o Technical Memorandum 2: Transportation Demand Analysis – A transportation demand analysis was performed, and the process is documented in a memo. This analysis is summarized in Chapter 2: Existing Conditions.
o Technical Memorandum 3: Plan Document Review – This memo analyzes previous plans and studies that have been conducted in Amarillo and identifies plan parallels and plan differences. Additionally, existing transportation guidelines and regulations are also reviewed as part of this memo. The content in this memo corresponds with Chapter 3: Policy Review.
o Technical Memorandum 4: Online Survey #1 Analysis – A detailed analysis of the first online survey was performed to understand the public’s desires for transportation safety improvements in Amarillo. This memo documents that process and identifies key highlights found in the public input. This analysis is summarized in Chapter 4: Community Engagement.
o Technical Memorandum 5: Online Survey #2 Analysis – A detailed analysis of the second online survey was also conducted. This memo documents that process and identifies key highlights found in the public input. This analysis is summarized in Chapter 4: Community Engagement.
o Technical Memorandum 6: Crash Analysis – A detailed crash analysis was performed for all crashes in Amarillo that have occurred in the past five years. This technical memo documents the analysis and identifies key findings from the study. This memo corresponds with content that can be found in Chapter 5: Crash Overview and High Injury Network Development
o Technical Memorandum 7: High Injury Network Development – A methodology was developed and performed to identify Amarillo’s HIN. This memo documents the methodology, process, and results of the HIN development. This memo corresponds with content that can be found in Chapter 5: Crash Overview and High Injury Network Development.
o Technical Memorandum 8: Targeted Safety Improvement Projects – This memo details each of the 16 recommended final projects. Details are provided for each of these projects that outline specific recommended safety improvements at particular locations. The 16 projects are being aligned with available funding opportunities in a funding grant matrix. This memo details project phasing and provides a prioritization timeline for implementation.
• Appendices – Below provides the list of technical appendices which contain supplemental information on the analyses performed in this project:
o Appendix A: Transportation Demand Analysis Maps – The first appendix provides the collection of all maps developed for the transportation demand analysis that are referred to in Chapter 2 and in Technical Memorandum 2: Transportation Demand Analysis.
o Appendix B: Funding Sources – The second appendix provides additional information on each of the funding sources that have been identified as part of Chapter 7: Project Summary and Technical Memorandum 8: Targeted Safety Improvement Projects.
o Appendix C: Planning Level Detailed Cost Estimates – The final appendix includes a detailed line-item cost breakdown for all 16 projects outlined in Chapter 7: Project Summary and Technical Memorandum 8: Targeted Safety Improvement Projects.
Chapter 2: Existing Conditions
The Existing Conditions chapter provides an overview of the City of Amarillo’s population, existing transportation infrastructure, transportation need, and nearby land uses and destinations. For additional information and to review the full existing conditions analysis and Transportation Demand analysis, refer to Technical Memorandum 1: Existing Conditions and Technical Memorandum 2: Transportation Demand Analysis for more information.
Population Overview
The City of Amarillo is an urban area located in the plains of the Texas Panhandle, as shown in Figure 2.1. Established in 1887, Amarillo is home to more than 201,000 residents and over 10,000 businesses. 5

Figure 2.1. Location Map
5 Amarillo Chamber of Commerce. (2024). Amarillo’s History, from https://www.amarillo-chamber.org/amarillohistory.html
Table 2.1 displays a community snapshot of key demographic statistics for Amarillo, and how the City compares to communities of similar size, the region, and the state. Compared to the state of Texas, the City of Amarillo is older and has a higher number of young children (displayed in the population pyramid in Figure 2.2). The median age and average household size reflect this, showing that Amarillo is on average older and contains smaller household sizes than the State of Texas average. Commuting times are also well below the statewide average in Amarillo and the surrounding region.

6 Data Source: ESRI Business Analyst (2023). Population Estimates. Retrieved from https://bao.arcgis.com/esriBAO/login/
7 Data Source: ESRI Business Analyst (2023). Age by Sex Profile. Retrieved from https://bao.arcgis.com/esriBAO/login/
Table 2.1. Community Comparison Snapshot 6
Figure 2.2. 2023 Population Pyramid 7
Table 2.2 shows historic population growth for the City, Potter County, Randall County, and the entire Amarillo Metropolitan Statistical Area (MSA). The table also provides 2023 population estimates, as well as projected population growth to 2050 as documented in the Amarillo Metropolitan Transportation Plan 2020 – 2045. The City of Amarillo has grown by approximately 6% since 2010, adding over 12,000 residents to the City’s population. This growth is expected to continue into 2050, where the City is anticipated to add almost 77,000 additional residents. Overall, the Amarillo MSA area is experiencing growth, but looking closer, this growth is not distributed evenly within the region. Over the past 13 years, Randall County has seen 21% growth since 2010, while Potter County has seen a negative growth rate of approximately -3%.
The development of the SS4A Plan for Amarillo considered key demographic factors within the community’s profile. Amarillo has a larger share of residents over age 60 compared to the Texas average, emphasizing the need for transportation safety measures like ADA improvements, curb ramps, and safer pedestrian crossings to support this group’s mobility. The City also has a higher percentage of young children, highlighting the importance of prioritizing safe connections between homes and schools. Additionally, Amarillo’s average commute time is up to 8 minutes shorter than the statewide average, potentially reducing driving-related risks for its residents.
8 Data Source: ESRI Business Analyst (2023). Demographic and Income Profile. Retrieved from https://bao.arcgis.com/esriBAO/login/
9 Data Source: Amarillo Metropolitan Planning Organization (MPO) (2019). Amarillo Metropolitan Transportation Plan 2020 – 2045.
Table 2.2. Historic Population Growth and Population Projections 8
Transportation Infrastructure
This section assesses the current state of Amarillo’s transportation infrastructure, including an assessment of the City’s roadway network, bicycle and pedestrian infrastructure, public transit infrastructure, and the City’s current pavement conditions.
Figure 2.3 displays the functional classification of the roadways in the City, as defined by the Texas Department of Transportation’s (TxDOT) Statewide Planning Map. This map also identifies roads that are owned and operated by TxDOT, such as the highway system, including Interstate 40, Interstate 27, US Highway 87, and Loop 335. The City is encompassed by Loop 335 US Route 66 also passes through Amarillo and is a major tourism draw for the area. The City’s major highways are I-40, which bisects Amarillo in the east/west direction, and I-27/US87, transversing the City in the north/south direction.

2.3. 2024 Functional Classification 10
10 Data Source: Texas Department of Transportation (TxDOT). (2024). Statewide Planning Map. Retrieved from: https://www.txdot.gov/apps/statewide_mapping/StatewidePlanningMap.html
Figure
The City of Amarillo’s existing sidewalk and bike lane data was last updated in 2020. Based on the database, more than half of the streets in the city (52%) have sidewalks. Figure 2.4 displays Amarillo’s existing pedestrian and bicycle infrastructure. The current sidewalk and bicycle infrastructure in Amarillo follows the pattern of existing residential development and is generally more prevalent in southeastern Amarillo than in the northern and western parts of the City.

Amarillo City Transit (ACT) provides public transportation to Amarillo’s residents. Currently, ACT provides 12 transit routes, including 10 fixed routes and 2 on-call routes (Route 13 and 30), as displayed in Figure 2.5 Within the Route 13 and 30 service areas, the City provides on-demand transportation services via a bus through an app called OneRide.
11 Data Source: Amarillo Area Metropolitan Planning Organization (MPO) (2020). Amarillo Area in Motion Multimodal Plan. https://www.amarillo.gov/mpo/
Figure 2.4. 2020 Existing Sidewalk and Bicycle Infrastructure 11

The City of Amarillo produces an annual pavement maintenance report that includes the City’s pavement condition assessments, and which streets need to be upgraded first. In 2020, the City conducted a pavement conditions assessment where each street segment was assigned a Pavement Condition Index (PCI) rating on a scale from 1 – 100. The study indicated that Amarillo has an average PCI rating of 67.8, which corresponds to a “Fair” condition according to the City’s rating criteria Displayed in Figure 2.6, roadway quality tends to improve when traveling away from Downtown Amarillo into newer neighborhood developments and areas of town. Local neighborhood streets have higher PCI ratings over larger arterial thoroughfares, especially in neighborhoods in southwest Amarillo. In contrast, streets in neighborhoods north of Amarillo Boulevard and southeast of US 287 exhibit lower quality due to the age of the infrastructure. These streets may require improvements sooner than other parts of the city to maintain acceptable roadway conditions.
12 Data Source: Amarillo City Transit. (2024). Bus Routes.
Figure 2.5. 2024 Public Transit Routes 12

The SS4A Plan for Amarillo addresses several key observations regarding the City’s infrastructure. Planned future development and population growth in southwest Amarillo will require a focus on roadway safety for all transportation modes (walking, biking, and driving) in alignment with Amarillo MPO’s Thoroughfare Plan. While much of the City’s street network includes sidewalks, their condition varies. Sidewalks in newer developments are generally in good condition, but older neighborhoods, such as Country Club, exhibit aging infrastructure, including broken, uneven, and ponding-prone sidewalks. Addressing these issues can enhance pedestrian comfort and safety. Additionally, pavement conditions, as reflected in PCI rankings, significantly impact transportation safety and reliability. Poor roadways with potholes and cracks create safety hazards and disrupt travel. Improving pavement quality will enhance safety, reduce long-term maintenance costs, and improve reliability for all users, including pedestrians, cyclists, and drivers. 13 Data Source: City of Amarillo. (2020). PCI Ratings. GIS Shapefile.
Figure 2.6 2020 Pavement Conditions 13
Transportation Demand
A Transportation demand analysis was conducted for the City of Amarillo. The analysis identifies areas of a given community that requires more balanced transportation investments through the observation of human- and built environmental-related characteristics.
The results of the transportation demand analysis are displayed below in Figure 2.7. A large cluster of high transportation facility need exists in Downtown Amarillo. Several other neighborhoods have higher scores that are generally near Downtown. The further away from Downtown, generally there is a lower score. However, a handful of neighborhoods that are not near Downtown Amarillo still are highlighted as high transportation demand areas, including the Owners, Ridgecrest, Paramount Mays, and Hamlet neighborhoods.

In developing the SS4A Plan for Amarillo, addressing transportation demand is critical. Certain areas of the city, particularly in the north and northeast, have poorer pavement conditions and fewer sidewalk and bicycle infrastructure options. This highlights the need for balanced distribution of transportation projects and programs across all parts of Amarillo. Engaging
Figure 2.7 Analysis Results
residents, community leaders, and stakeholders in these areas is essential to ensure their transportation needs and priorities are fully considered throughout the planning process.
Land Uses & Destinations
As part of the City Plan: Vision 2045 comprehensive planning process, the City of Amarillo measured their existing land use as of 2023 and created a future land use plan to guide future land use development in Amarillo. Figure 2.8 displays the City’s existing land uses as of 2023. The City’s desired future land use pattern is displayed in Figure 2.9. Titled the “Complete Neighborhoods Scenario,” this future land use map illustrates the community’s vision for land use and development patterns in 2045. The objective of the Complete Neighborhoods Scenario is to capture future growth projections through a balance of land uses and strategic densities that create desirable, healthy, and vibrant communities across Amarillo.

City of Amarillo (2024). City Plan. Retrieved from https://www.amarillo.gov/planning/city-plan/
Figure 2.8. 2023 Existing Land Use 14

Major destinations are also relevant to analyze in a SS4A Plan since large trip attractions and economic activity centers generate the most traffic. Often times, multiple travel modes and lastmile connections occur at major destinations, so ensuring quality in transportation safety infrastructure is critical. In Amarillo, several major activity centers are incorporated into the study. Figure 2.10 displays the City’s current activity centers.
Figure 2.9 Amarillo Complete Neighborhoods Scenario (Future Land Use Plan)

The SS4A Plan for Amarillo emphasizes integrating the community’s land use patterns to enhance transportation safety. Many schools are located within or near neighborhoods, making it a priority to ensure safe multimodal connections for children walking and biking to school. Bicycle and pedestrian safety in areas with high pedestrian activity, particularly near major activity centers, is another key focus for safety improvements. Additionally, Amarillo’s commercial land uses are concentrated along high-speed arterials, which will be analyzed to identify opportunities for access management. This may include consolidating driveways, incorporating pedestrian and cyclist amenities in underutilized spaces, and modifying street parking to improve safety and accessibility.
15 Data Source: ESRI Business Analyst
Figure 2.10 Activity Centers 15
Chapter 3: Policy Review
As part of the SS4A planning process, a policy review was conducted which includes an assessment of the City of Amarillo’s plans, transportation guidelines, and design standards. The Plan Review section identifies consistencies and areas for improvement across various transportation plans. The Transportation Guidelines Review section highlights both strengths and areas for improvement in current plans, with a focus on recommendations for traffic calming, safe street design, and school zone safety. The Design Standards Review section assesses Amarillo’s design details for sidewalks, bike lanes, and ADA ramps. To view the full policy review analysis, refer to Technical Memorandum 3: Plan Document Review.
Plan Review
Reviewing existing local, regional, and state plans over the past decade is crucial for shaping Amarillo's future transportation and mobility network. The Plan Review process includes an assessment of plans to identify where goals and recommendations align, as well as gaps or areas of inconsistencies. As illustrated in Figure 3.1, Plan Parallels highlight five key areas where the reviewed plans consistently align: Mobility and Connectivity, Infrastructure Improvements, Transit Improvements, Active Transportation Network Enhancements, and Technology Integration. Plan Differences focus on three areas of gaps and inconsistencies among the plans, where priorities and strategies diverge: Active Transportation Safety Funding, Safety Prioritization, and Pedestrian Improvements. These categories provide a structured framework for further discussion and analysis.

Figure 3.1: Categorization of Safety Aspects from Reviewed Transportation Plans
While all plans share a commitment to safety, their priorities vary based on scope and focus. Some emphasize pedestrian and cyclist safety within urban areas, prioritizing walkability and connectivity, while others target traffic management, regional mobility, or highway safety. These differences reflect the varying contexts, and users’ needs each plan addresses, highlighting the challenge of balancing diverse priorities across Amarillo’s transportation network.
This comprehensive review of these transportation plans provides valuable insights into the shared objectives and distinct focuses aimed at improving Amarillo's transportation infrastructure. By synthesizing perspectives from these diverse plans, this Plan can strategically prioritize infrastructure improvements, enhance active transportation options, promote active transportation, and integrate advanced technologies. This collaborative effort ensures that future developments align with community needs, fostering a safer, more connected, and sustainable transportation network for all Amarillo residents.
3.1: Plan Review Summary
Area Metropolitan Planning Organization (Amarillo MPO)
Vision and Summary
This plan is a comprehensive framework designed to enhance the safety, reliability, efficiency, and cost-effective transportation service to the Amarillo community. The plan prioritizes the safety of the public, transit employees, and transit assets through risk mitigation, safety assurance, and continuous improvement efforts. 16
This plan is known as Amarillo Area in Motion (AAIM), and aims to create a safe, comfortable, and connected transportation network that leverages technology to deliver high-quality service for all users. This plan aims to develop an integrated system that efficiently connects roadways, public transit, biking, and walking, enhancing safety, accessibility, and sustainability to improve the quality of life for residents and foster economic growth. 17
The mission of this plan is to promote mobility and accessibility with an effective transportation system for people and goods in the Amarillo area. It aims to create a safe, efficient, multimodal network that minimizes impact on cultural, economic, and environmental resources, emphasizing alternate transportation modes and maintaining existing facilities while meeting future needs 18
16 City of Amarillo. (2020). Amarillo City Transit Safety Plan
17 Amarillo Area Metropolitan planning Organization (Amarillo MPO). (2021). Amarillo Area Regional Multimodal Mobility
18 Amarillo Metropolitan Planning Organization. (2022). Amarillo Metropolitan Transportation Plan 2020-2045.
Table
Plan
Regionally Coordinated Public Transportation Plan 2022-2026
2022
Panhandle Regional Planning Commission
Amarillo Metropolitan Planning Organization Unified Planning Work Program
2024
Amarillo MPO
City of Amarillo, Community Investment Program 2023/2024 –2027/2028
2024
City of Amarillo
City Plan Vision 2045
2024
City of Amarillo
Vision and Summary
This plan for the Texas Panhandle envisions a future where public transportation services provide equal access to all residents, including seniors, people with disabilities, lowincome individuals, veterans, youth, and others in need. It seeks to improve access and promote transportation throughout the Panhandle by strategically coordinating all available resources. 19
This plan for the Amarillo AMPO aims to create a safe, efficient, and sustainable transportation system that enhances residents' quality of life and promotes economic vitality. It aims to provide accessible, and multimodal transportation options through collaborative planning and community engagement, ensuring the region's current and future transportation needs are met. 20
The program for the City of Amarillo represents a strategic commitment to enhancing public infrastructure and facilities over five years. Rooted in the City's Blueprint for Amarillo 21 initiative and supported by successive City Councils, this program outlines comprehensive investments in transportation, community planning, public safety, utilities, and information technology. It aims to support sustainable growth, enhance the urban environment, and align with community needs and priorities for a vibrant, resilient, and well-connected city. 22
The city’s Comprehensive Plan aims to help Amarillo anticipate and manage future changes in alignment with the community's preferences. It oversees growth, ensures predictability for developers, identifies infrastructure needs, and provides legal backing for ordinances. Incorporating community feedback, it reflects the collective vision for the future and articulates residents' goals. 23
19 Panhandle Regional Planning Commission. (2022). Regionally Coordinated Transportation Plan 2022-2026. https://www.tprompt.org/reports-plans/
20 Amarillo Area Metropolitan Planning Organization (MPO). (2024). Amarillo Metropolitan Planning Organization Unified Planning Work Program. https://www.amarillo.gov/mpo/
21 Amarillo Pioneer. (2018, March 16). New Blueprint for Amarillo to Be Approved by City Council Amarillo Pioneer. https://www.amarillopioneer.com/blog/2018/3/16/new-blueprint-for-amarillo-to-be-approved-by-city-council
22 City of Amarillo. (2024). Community Investment Program 2023/24-2027/28.
23 City of Amarillo. (2024). City Plan Vision 2045. https://www.amarillo.gov/planning/city-plan/
Transportation Guidelines Review
Transportation guidelines were evaluated from Amarillo’s transportation plans, highlighting their contributions to safety, connectivity, and multimodal goals. Table 3.2 provides a concise summary of key transportation practice areas reviewed from the relevant plans. It outlines the purpose, aspects reviewed, and main findings, highlighting both the strengths and areas for improvement in creating a safe, connected, and multimodal transportation network.
Table 3.2: Summary of the Key Transportation Guide Reviewed
Practice
Complete Streets
Pedestrian Facilities
2021 Amarillo Regional Multimodal Mobility Plan, 2024 MPO Unified Planning Work Program, 2045 City Vision
2021 Amarillo Regional Multimodal Mobility Plan, 2020-2045 Amarillo Metropolitan Transportation Plan
To enhance safety, connectivity, and access for all travel modes.
Bike Facilities
To improve pedestrian infrastructure and safety, promote active travel, and ensure ADA compliance.
Safety, Connectivity, Multimodal planning, Regional Accessibility.
Strengths: Strong focus on safety and accessibility across jurisdictions.
Areas for improvement: Lack of specific timelines and funding clarity for implementation.
Shared Use Facilities
2021 Amarillo Regional Multimodal Mobility Plan, 2020-2045 Amarillo Metropolitan Transportation Plan
2021 Amarillo Regional Multimodal Mobility Plan, 2020-2045
Amarillo
Metropolitan Transportation Plan
To provide safe, designated spaces and promote bicycling as a viable mode of transportation.
Sidewalks, Crosswalks, ADA compliance, Traffic calming, Signalized intersections, Midblock crossings.
Strengths: Comprehensive pedestrian improvements with ADA compliance focus.
Areas for improvement: Inconsistent maintenance funding and insufficient focus on high-density pedestrian areas.
Shared lanes, Bike lanes, Cycle tracks, Bike signals, Bike parking, Off-road trails.
Strengths: Extensive network for bicycle facilities.
Areas for improvement: Insufficient bike parking and lack of bike protection in high-traffic areas.
To create facilities that cater to both bicyclists and pedestrians, enhancing connectivity and safety.
Shared-use paths, Side paths, Trails, Paved shoulders.
Strengths: Safe, physically separated spaces for nonmotorized users.
Areas for improvement: Limited shared-use facility network in suburban areas.
Practice Areas Plans
Access Management
Traffic Calming
2021 Amarillo Regional Multimodal Mobility Plan
Purpose Aspects Reviewed Main Findings
To control access points in highdemand areas and improve safety for all users.
Driveway consolidation, Safe turning lanes, Raised medians, Roundabouts.
Strengths: Reduces conflicts between vehicles, pedestrians, and bicyclists.
Areas for improvement: Some measures may reduce accessibility for businesses.
Signage & Wayfinding
2021 Amarillo Regional Multimodal Mobility Plan
Mid-Block Crossings
2021 Amarillo Regional Multimodal Mobility Plan, 2045 City Vision
To encourage safer driving behavior through street design rather than relying on signals and signs.
Speed humps, Chicanes, Traffic circles, Pinch points.
2021 Amarillo Regional Multimodal Mobility Plan
To improve navigation and enhance the aesthetics of key areas, including historic districts.
To improve pedestrian safety and connectivity between intersections in highdemand areas.
Wayfinding signage, Trail markers, Branding, Historic signage restoration.
Strengths: Effective at reducing vehicle speeds in key areas.
Areas for improvement: May impact emergency vehicle response times.
Strengths: Enhances user experience and supports cultural heritage.
Areas for improvement: Limited focus on integrating digital wayfinding solutions.
High-visibility markings, Lighting, Pedestrian priority signage.
Strengths: Improves pedestrian connectivity and safety.
Areas for improvement: Enforcement of pedestrian priority
Recommendations for New and Updated Guidelines
Based on the plan review and survey analysis, the following recommendations are proposed to address identified gaps and support the city’s transportation safety goals:
• Transportation Design Manual: The absence of an official design manual presents challenges when proposing new projects, as it leaves room for variability in design criteria. This manual serves as a reference document outlining standardized engineering and planning criteria for roadway design, ensuring consistency across projects. Establishing a comprehensive manual would help clarify essential design elements, such as buffer requirements between sidewalks and travel lanes, driveway spacing, travel lane widths, and specifications for concrete medians and access management. The Transportation Design Manual may require City Council adoption or be implemented administratively by the City’s transportation or public works department.
• Traffic Calming: The existing traffic calming guidelines outlined in the Bicycle and Pedestrian Toolbox of the 2021 Amarillo Regional Multimodal Mobility Plan provide a solid foundation. Expanding these guidelines with additional details could further enhance their effectiveness, particularly for residential neighborhoods and school zones. These guidelines could be incorporated into the TDM or remain a standalone document, which may not require City Council adoption unless changes to ordinances (e.g., speed limits or enforcement policies) are proposed.
• Safe Streets Design: As a proposed new recommendation to enhance the existing guidelines, it would be beneficial to introduce a comprehensive Safe Streets Design guide that integrates all related safety countermeasures and design elements into a single document. By combining both planning and engineering perspectives, this guide would provide actionable instructions on how to design streets that enhance safety for all users. It could be incorporated into the Transportation Design Manual if it updates city standards or establishes new road design criteria, following the same adoption process. If standalone, it may not require City Council adoption but could be endorsed by city staff for consistency in project design.
• School Zone Safety Guideline: As a recommended new guideline, a comprehensive School Zone Safety guide is proposed to provide clear, actionable instructions for improving safety around schools. This guide would establish criteria for defining school zones, considering factors such as proximity to school entrances, school levels (elementary, junior high, high school), and the functional classification of surrounding streets. It may require City Council approval if they include enforceable regulations like speed limits or crossing guard policies. If serving as a best-practice document, they could be adopted administratively by the transportation or public works department.
Design Standards Review
The review of design standards is a critical component of the SS4A report as it directly impacts the safety and accessibility of transportation infrastructure for all users, including pedestrians, cyclists, and drivers. For Amarillo, design standards set the foundation for implementing consistent safety measures across the city’s transportation network. By evaluating existing
standards, this report identifies where current practices align with safety goals and where gaps or outdated approaches may require updating. The focus is on key infrastructure elements, such as sidewalks, bike lanes, and ADA ramps, assessing their compliance with local, state, and national guidelines. While some standards promote safety and accessibility effectively, others may benefit from enhancement to better reflect Amarillo’s unique needs. To review the full design standards analysis that was conducted, refer to Technical Memorandum 3: Plan Document Review for further information.
Table 3.3. Pedestrian and Bike Design
Infrastructure Design Standards Review Summary Infrastructure
City of Amarillo Design Standard Details
Commercial Sidewalks: 6’ minimum with 1/4 “per foot maximum transverse slope, no space required between the edge of the sidewalk and back of curb”
Local
County
Sidewalks
State
National
Residential Sidewalks: 4’ minimum with 1/4 “per foot maximum transverse slope, no space required between the edge of the sidewalk and back of curb”
Sidewalk with 8” side curb: 4’ minimum with 1/4 “per foot maximum transverse slope, no space required between the edge of the sidewalk and back of curb, and 6” to 8” wide sidewalk curb”
Randall County Subdivision Regulations IV. CONSTRUCTION METHODS
All sidewalks and step treads shall have a minimum transverse slope of one eighth (1/8) inch per foot and a maximum transverse slope of quarter (1/4) inch per foot. All sidewalks constructed at a location designated on the plans shall be not less than four (4) feet in width.
Potter County
None
TxDOT Roadway Design Manual
Chapter 3 New Location and Reconstruction (4R) Design Criteria
Wider than 6-ft is applicable for commercial areas, school routes, or other areas with concentrated pedestrian traffic. 5’ is the minimum for sidewalks.
American Association of State Highway and Transportation Officials (AASHTO)
A Policy on Geometric Design of Highways and Streets
4.17.1 Sidewalks
Sidewalk widths in residential areas may vary from 4 to 8 ft. Sidewalks less than 5 ft in width require the addition of a passing section every 200 ft for accessibility.
Infrastructure Level Policies or Standards
Bike Lane Local
None
None
TxDOT Bicycle Accommodation Design Guidance
Section 4: Bicycle Facilities
This TxDOT Bicycle Accommodation Design Guidance is based on the review of national guidelines for the best practices for the design of bicycle facilities and is the governing bicycle guidance document for TxDOT. The 2012 AASHTO Guide for the Development of Bicycle Facilities (AASHTO Bike Guide) continues to be the governing document for specific design criteria that is not contained within this TxDOT Bicycle Accommodation Design Guidance. National
AASHTO Guide for the Development of Bicycle Facilities
Chapter 4 - Design of On-Road Facilities
A bicyclist’s preferred operating width is 5 ft. Therefore, under most circumstances the recommended width for bike lanes is 5 ft
City of Amarillo Details
Local
County
State
ADA Ramps
ADA Standard for New Residential Intersection: Directional ramp 4’ wide with a minimum of 3’ by 4’ wide landing space
Randall County & Potter County
None
TxDOT ROADWAY STANDARDS
Miscellaneous Details
Pedestrian Facilities Curb Ramps (PED-18)
AASHTO
A Policy on Geometric Design of Highways and Streets
4.17.3 Curb Ramps
Several Federal laws, including the Rehabilitation Act of 1973 and the Americans with Disabilities Act of 1990 (ADA), require that facilities for pedestrian use be readily accessible to, and usable by, individuals with disabilities. When designing a project that includes curbs and adjacent sidewalks, proper attention should be given to the needs of persons with disabilities, such as those with mobility or visual impairment. Curb ramps are necessary to provide access between the sidewalk and the street at pedestrian crossings. Detectable warnings are needed where the curb has been removed to alert pedestrians with visual disabilities that they have arrived at the street/sidewalk interface.
Chapter 4: Community Engagement
Introduction
A multifaceted public engagement strategy was performed for the Amarillo SS4A Plan. The public engagement process gathered input from over 6,900 comments across various platforms, including in person events, online engagements, and stakeholder/committee meetings. This chapter documents this process and provides an overview of the high-level feedback received throughout the planning process. Figure 4.1 below displays highlights of the engagement efforts and advertisement materials.


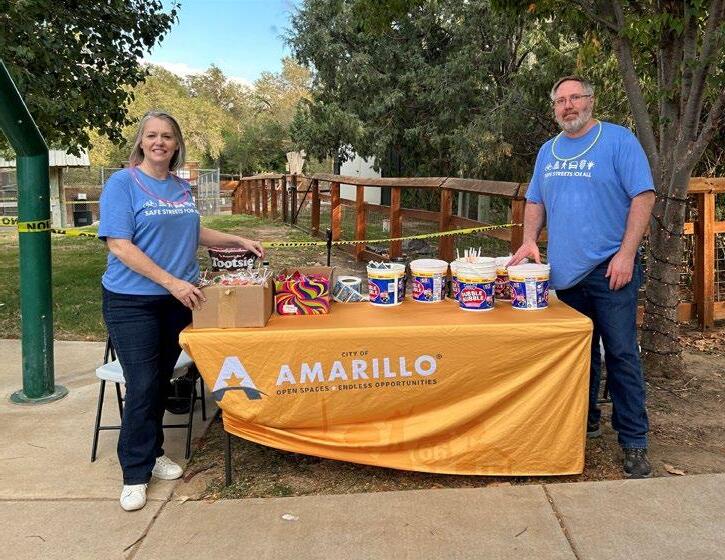
Figure 4.1 SS4A Engagement Highlights
Engagement Methods Overview
The project team engaged the community of Amarillo through an array of in-person and virtual methods. Table 4.1 summarizes all of the engagement methods implemented for the Amarillo SS4A project. The first round of engagement focused on the first online survey, where staff members attended many local events to advertise this effort. The second round of engagement centered around the second online survey, where the project team attended more pop-up events, library visits, and social media advertisements. The public engagement timeline started in May of 2024 and concluded in October of 2024.
Engagement Method
Project Website
Online Surveys
Title/Type Description
Amarillo SS4A
Project Website
Online Survey #1
Online Survey #2
Open House Open House
Business Connections
Provided the public with project information, engagement and meeting summaries, and hosted the online surveys
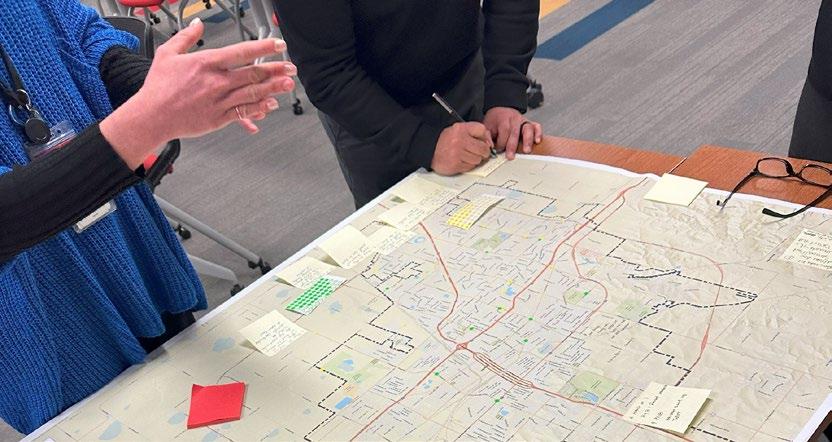
Interactive map activity allowing the public to call out transportation safety issues in specific areas of Amarillo.
This online survey, hosted on the Survey Monkey platform, asked the public additional high-level questions on transportation safety policy direction and preferred safety improvement treatments.
An open house was conducted at the end of the planning process to showcase the highlights from the SS4A report.
May – Advertising online survey #1
Transit Station May – Advertising online survey #1
Southwest Library June – Advertising online survey #1
City of Amarillo Lunch & Learn June – Advertising online survey #1
Southwest Library June – Advertising online survey #1
Starlight
Theatre/Sam
Houston Park P&R
In-Person Events
June – Advertising online survey #1
Northwest Library June – Advertising online survey #1
Pop-Up Park Party at Eastridge Park June – Advertising online survey #1
Downtown Library June – Advertising online survey #1
June Jazz at Amarillo College June – Advertising online survey #1
East Branch Library
Patriotic Pet Parade
June – Advertising online survey #1
June – Advertising online survey #1
Table 4.1. Amarillo SS4A Engagement Methods
Engagement Method
In-Person Events (Cont.)
Title/Type
Description
Southwest Branch Library July – Advertising online survey #1
North Branch Library July – Advertising online survey #1
Southwest Branch Library July – Advertising online survey #1
Transit Station July – Advertising online survey #1
East Branch Library July – Advertising online survey #1
Southwest Branch July – Advertising online survey #1
North Branch Library July – Advertising online survey #1
High Noon Event July – Advertising online survey #1
Pop-Up Park Party at Bones Hooks July – Advertising online survey #1
Westover Pop-Up Park Party September – Advertising online survey #2
City Council September – Advertising online survey #2
Northwest Library Branch Visit September – Advertising online survey #2
Southwest Library Branch Visit September – Advertising online survey #2
Boo at the Zoo (1) October – Advertising online survey #2
Boo at the Zoo (2) October – Advertising online survey #2
Transit Station Visit October – Advertising online survey #2
North Library Branch Visit October – Advertising online survey #2
East Library Branch Visit October – Advertising online survey #2
Downtown Library Visit October – Advertising online survey #2
Southwest Library Branch Visit October – Advertising online survey #2
Lunch & Learn October – Advertising online survey #2
Stakeholder
Interviews October, individual stakeholder meetings
Press Release Safe Street and Roads for Amarillo
Channel 10
Online Advertisements
City of Amarillo offers ‘Safe Streets and Roads’ interactive map to identify roadway needs
MSN City of Amarillo launches the Amarillo Safe Streets and Roads Interactive Map
Facebook Posted on City of Amarillo Official Account
Facebook Posted on City of Amarillo Official Account
Email blast Sent SS4A Public Launch Email to all Committee members
Engagement Method
Online Advertisements (Cont.)
Title/Type
Description
My High Plains City of Amarillo launches the Amarillo Safe Streets and Roads Interactive Map
Facebook Posted on City of Amarillo Official Account
Meta Advertisement -1
Meta Advertisement -2
Facebook Posted on City of Amarillo Official Account
Facebook Posted on City of Amarillo Official Account
Next Door Advertisement
Facebook Posted in nine Facebook groups
Email Blast Participants from 1st Survey
Email Blast City of Amarillo Employees
Email Blast Neighborhood Associations
Email Blast Realtors Association
Email Blast Community Connectors
Email Blast Participants from 1st Survey
Facebook Post #1
Facebook Post #2
Facebook Post #3
Press Release
Channel 7 News
Posters
Merchandise and Physical Advertising
Advertising online survey #2
Advertising online survey #2
Advertising online survey #2
Advertising online survey #2
Advertising online survey #2
Located at five libraries, Warford Center, transit stations, golf course, the zoo, a tennis center, swimming pools, Get Fit, Wastewater and utility departments, environmental health, and the police station
Postcards Sent to targeted neighborhoods
Yard Signs
Thompson Park, Bones Hook Park, Medi Park, John Stiff Park, Rick Klein Park, Rails to Trails, transit station, Warford Center, the zoo, golf courses, the tennis center, swimming pools, City Hall, and 6th Street
Wrist Bands Brought to various in person events
T-Shirts
Worn by Staff at in person events
Citizen Oversight Committee Meetings
The Citizen Oversight Committee was crafted to bring in targeted and diverse feedback from key stakeholders in the Amarillo community. Members of the Citizen Oversight Committee range from professional engineers and regional/state partners to everyday citizens, including individuals who take transit and walk, students, and people of diverse socioeconomic backgrounds. Overall, three meetings were conducted with the Citizen Oversight Committee. Meeting dates and content discussed are summarized below in Table 4.2. The first committee meeting was held in Amarillo in person, with the following two held on virtual platforms. Pictures and feedback gathered from the first Citizen Oversight Committee are displayed in Figure 4.2.
1 February 29, 2024
2 May 29, 2024
3 September 26, 2024
Project introduction, crash overview, SS4A process, proven safety countermeasures, project timeline, next steps
Project background, vision and goals, crash analysis, online survey, next steps
Crash trends, High Injury Network development, online survey results, transportation demand analysis overview, next steps


Stakeholder Project Development Meetings
Once the initial public engagement phase had been completed, the project team moved into the project development phase. To vet projects, the project team held two additional stakeholder meetings to review project feasibility The first meeting was held on November 4th, and the second one was held on December 2nd, 2024. Attendees included City staff and local and regional partners who all had a chance to weigh in on the development of the identified projects in this study. Specifically, City of Amarillo departments that were represented in this meeting included Amarillo City Transit, Capital Projects and Development Engineering, the City Manager’s office, Community Development, the Fire Department, the Office of Engagement & Innovation, Parks and Recreation, Planning, Police Department, Public Health Department, Public Works, and the Streets Department. Additionally, several regional and state partners were present for these meetings, including the Amarillo Metropolitan Planning Organization (MPO) and TxDOT’s Amarillo District Office.
Table 4.2 Citizen Oversight Committee Meetings
Figure 4.2 Citizen Oversight Committee Meeting 1
Online Surveys
Two online surveys were conducted for the Amarillo SS4A process. The first online survey was open from May 21st, 2024, to July 28th,2024 on the project website, and aimed to gather community input on various safety countermeasures, including reducing speed, new or improved sidewalks, new or improved bike lanes, more streetlights, more stop signs and/or signals, crosswalks or pedestrian refuge islands, and other safety countermeasures that residents could comment on if not listed. This online survey was presented in an interactive map format. The second online survey was open between September 23rd, 2024, and October 25th, 2024, and sought to identify community-backed strategies and policies for transportation safety in the City of Amarillo. The sections below summarize key findings from the online surveys.
A more detailed analysis for each of the online surveys can be found in their respective technical memorandums. Please refer to Technical Memorandum 4: Online Survey #1 Analysis and Technical Memorandum 5: Online Survey #2 Analysis for additional details and highlights from the online survey results.
Online Survey #1 Feedback Highlights
The first online survey gathered a total of 4,771 comments between the months of May and July of 2024, totaling approximately a 10-week period The primary purpose of the survey was to collect community feedback that would guide the development and implementation of safetyoriented projects for the City’s streets. In addition to leaving individual comments on specific locations around Amarillo, the public was asked to categorize their comment into a specific countermeasure, that best describes their comment. There were seven countermeasures available to categorize comments, including Reduce Speed, New or Improved Sidewalk, New or Improved Bike Lane, More Streetlights, More Stop Signs and/or Signals, Crosswalk or Pedestrian Refuge Island, and Other Comments. Figure 4.3 displays the different comment types provided in the online survey.

Figure 4.3 Countermeasure Types
Public feedback was summarized by each countermeasure type. The survey results were then visually summarized in heat maps of comments. From there, the comment cluster areas were explored further to identify common themes and relationships. Figure 4.4 provides an example of how the online survey feedback was summarized through heat maps and callouts. Table 4.3 summarizes the top three highlight areas for each countermeasure type. The top three countermeasures that were used in the online survey were More Stop Signs and/or Signals (25% of total comments), followed by New or Improved Sidewalk (17% of total comments), and Reduce Speed (14% of total comments). From this analysis, several key safety problem areas were identified by prioritizing areas that had a higher number of comments. The public indicated that the areas in Amarillo that obtain the highest transportation safety issues include the intersection of Loop 335 and Arden Road, the intersection of Georgia Street and Farmers Avenue, the Hillside Road Corridor (between Loop 335 and I-27), the area around the Amarillo High School and the Amarillo Public Library, Olsen Boulevard/Teckla Boulevard, and the area around the Amarillo Collegiate Academy (Georgia Street). To learn more about the online survey analysis and to review additional themes identified by the public, please refer to Technical Memorandum 4: Online Survey #1 Analysis

Figure 4.4. Example of Survey Feedback Summary
Table 4.3. Online Survey 1 Highlights
Countermeasure Type
More Stop Signs and/or Signals
New or Improved Sidewalk
Reduce Speed
Crosswalk or Pedestrian Refuge Island
New or Improved Bike Lane
More Streetlights
Top Three Highlights
The intersection of Loop 335 and Arden Road
The intersection of Georgia Street and Farmers Avenue
Hillside Road Corridor (between Loop 335 and I-27)
The intersection of Georgia Street and Farmers Avenue
Amarillo High School/Amarillo Public Library/John Stiff Memorial Park area
Woodlands Elementary School/De Zavala Middle School Sidewalks
Olsen Boulevard/Teckla Boulevard
In front of Amarillo Collegiate Academy (Georgia Street)
Soncy Road (from I-40 to Hillside Road)
Amarillo High School/Amarillo Public Library/John Stiff Memorial Park area
Hillside Road Corridor (between Loop 335 and I-27)
In front of Amarillo Collegiate Academy (Georgia Street)
Extend Rock Island Trail
Medical Center Neighborhood
Teckla Boulevard
The intersection of Loop 335 and Arden Road
Highland Park Village Neighborhood
The intersection of Georgia Street and Farmers Avenue
Online Survey #2 Feedback Highlights
The second online survey was live for approximately one month, between September 23rd, 2024, and October 25th, 2024.A total of 1,404 responses were collected. The survey featured a total of 12 multiple choice questions. Overall, residents’ top transportation safety priorities included crash hotspot improvements, speed management, safer routes to key destinations, and pavement condition improvements. The public would generally like to see an increase in law enforcement to deal with speeding issues across arterial roads the City and would also like to see safer street design in future roadway rehabilitation projects (such as the construction of medians). The public would like to see the City focus more investment in the maintenance of City streets, by smoothing roads and maintaining better roadway quality. Finally, the public wanted to see holistic approaches to improve roadway safety, such as enhanced lighting, traffic calming measures, and better intersection design. To learn more about the second online survey analysis and to review the specific feedback received for each question in the survey, please refer to Technical Memorandum 5: Online Survey #2 Analysis.
Transportation Research Board (TRB) Poster Session
TRB is a globally recognized organization dedicated to advancing innovation and excellence in transportation research and practice 24. Each year, TRB hosts its Annual Meeting in Washington, D.C., drawing thousands of transportation professionals from around the world. This premier event serves as a platform for sharing cutting-edge research, fostering collaboration, and addressing critical transportation challenges across all modes and disciplines.
The community engagement effort for the Amarillo SS4A Plan was selected for inclusion in TRB’s Best Practices, New Technologies, and Lessons Learned in Public Involvement and Communications for Transportation section, based on the large number of responses collected through two survey practices. A poster was presented to showcase to transportation professionals worldwide the significant level of community involvement, the effectiveness of the survey advertising strategies, and the overall success of the engagement process. This recognition highlights the Plan's ability to achieve substantial community participation and underscores the importance of strategic outreach in public engagement initiatives.

24 Transportation Research Board. (n.d.). About TRB. National Academies of Sciences, Engineering, and Medicine. Retrieved January 10, 2025, from https://www.nationalacademies.org/trb/about
Figure 4.5 City of Amarillo staff and consultant team staff presenting at the 2025 TRB Annual Meeting
Open House
To conclude the project, the project team and city planning staff hosted two Open House events on January 23, 2025, one at the Downtown Library and another at the Southwest Library. The Open House events were open to the public and attracted a strong turnout from local residents. These events aimed to provide a comprehensive overview of the project, including its origins, the analyses performed, the engagement efforts conducted, and the resulting outcomes.
The Open House events were well-received, with approximately 80 attendees engaging in discussions with the project team and offering compliments on the project’s approach and outcomes. To foster interaction, attendees were given five stickers to vote for their five favorite proposed projects, adding an element of participatory decision-making This input will also assist in future project prioritization among stakeholders.

Conclusion
A thorough, multifaceted public engagement strategy was implemented during the SS4A planning process for Amarillo. The public is supportive of transportation safety improvements and had much to say on where safety improvements are needed most in Amarillo. Additionally, the community had the chance to weigh in on higher-level transportation safety policy direction and preferred countermeasure treatments. Overall, over 6,200 individuals were involved during the public engagement process, which is just over 3% of Amarillo’s entire population.
Figure 4.6. Project Team Engaging with Open House Attendees
Chapter 5: Crash Overview and High Injury Network Development
Introduction
A key component of the SS4A planning process is to conduct a detailed crash analysis, which ultimately helped inform the development of Amarillo’s High Injury Network (HIN). The crash analysis provides a comprehensive overview of crashes that have occurred within the city limits from 2019 to 2023. Through the assessment of crash trends, focus areas for improvements and holistic approaches to crash reduction can be identified and pursued. One of the tools that was developed to help inform data driven decision making processes is a high injury network The HIN is a critical tool used in roadway safety analyses to identify and prioritize roadways and intersections with the highest concentrations of severe and fatal crashes for vulnerable (pedestrian and bike crashes) and all roadway users. By focusing on these areas, the City can implement targeted interventions to enhance safety and reduce traffic-related injuries and fatalities.
This chapter is divided into two parts. First, the crash analysis is reviewed and high-level takeaways from this analysis is presented. From there, the chapter provides details on Amarillo’s HIN. A total of four HINs were developed, as shown in Figure 5.1, including a HIN that covers all modes of transportation, and one that covers vulnerable roadway users (cyclists and pedestrians). Within these two focus areas, a corridor HIN and an intersection HIN were developed for each.

It is essential to holistically assess where crash hot spots are located on Amarillo’s streets. Tailored strategies and actions require a thorough understanding of local needs and improvement areas to make informed recommendations for improvements These analyses, paired with public and stakeholder feedback, enabled sound decision making during the project development process. This crash analysis and HIN development also helped inform the City’s vision and goals for the SS4A plan.
Figure 5.1 HIN Categories
Crash Analysis Overview
To review a more detailed version of the crash analysis that was performed for Amarillo, refer to Technical Memorandum 6: Crash Analysis for the full analysis and findings. A total of 18,023 crashes occurred between 2019 and 2023 in the City of Amarillo on all roads except the interstates. 25 The Texas Department of Transportation’s (TxDOT) Crash Reporting Information System (CRIS) provided the crash data. The High Injury Network (HIN) is developed from this crash database as well.
Figure 5.2 illustrates the crash density for crashes analyzed in this memo. It shows hotspots primarily clustered around downtown Amarillo and major corridors such as SW 34th Avenue, SW 45th Avenue, Hillside Road, S Georgia Street, S Western Street, S Coulter Street, NE 24th Street, among others.
25 Excluding the interstates from the database is made due to limited safety-related resources, prioritizing the safety of local roads over interstate facilities.
City of Amarillo | Safe Streets and Roads for All Plan

Figure 5.2. Crash Density (Overview)
Overall Crash Trends
The crash trend analysis from 2019 to 2023 indicates an overall decreasing pattern in crash occurrences as illustrated in Figure 5.3. While there was an initial peak in 2019 with 4,232 crashes, subsequent years saw variations, ultimately resulting in a total reduction of 28.8 percent by 2023. Alongside the crash data, Figure 5.3 also includes DVMT (Daily Vehicle Miles Traveled) data from Potter County and Randall County, where City of Amarillo is situated. Derived from the TxDOT Roadway inventory up to 2022, DVMT offers insights into total vehicle miles traveled in both counties, covering on-system and off-system roadways. Despite fluctuations in crash occurrences over the years, DVMT consistently shows an overall increase in vehicle travel, using 2019 as a base year. The data highlights the importance of monitoring traffic volume alongside crash trends to ensure effective transportation planning and safety countermeasures within the region.

The fatal crash rate in Amarillo, measured per 100,000 population, remained below the Texas average from 2019 to 2023 but increased from 2022 to 2023, as seen in Figure 5.4. After reaching a low of 7.5 in 2022, the rate rose to 12.0 in 2023. Meanwhile, the Texas fatal crash rate remained relatively higher but showed a slight decline after peaking in 2021. While the overall number of crashes in Amarillo has decreased, as mentioned above, the rising fatality rate highlights the need for targeted safety countermeasures.
Figure 5.3 Total Number of Crashes and Daily Vehicle Miles Traveled by Year
Crash Analysis Highlights
Understanding crash patterns is essential for identifying key risk factors and guiding safety improvements. This section analyzed emphasis areas, severity, vulnerable roadway users, contributing factors, manner of collisions, light conditions, and driver age to highlight trends in Amarillo’s crash data. The emphasis area analysis compares Amarillo’s crash trends to statewide averages, while other sections focus on local crash characteristics to identify areas for targeted interventions aimed at reducing severe and fatal crashes.
Emphasis Area
Emphasis areas highlight key crash factors to identify trends and guide safety improvements. Comparing Amarillo’s crash data to statewide averages helps pinpoint areas where targeted interventions may be needed.
As shown in Table 5.1, several emphasis areas in Amarillo exceed statewide levels, indicating key risk factors that may contribute to the increasing fatal crash rate as shown in Figure 5.4
Intersection-related crashes are much higher in Amarillo when comparing to statewide average, along with crashes involving vulnerable roadway users Speed-related, left-turn-related, and stop sign/red light running crashes also exceed state averages. However, distraction-in-driving crashes are lower in Amarillo. These trends suggest a need for enhanced intersection safety, speed management, and vulnerable roadway users focused improvements.
Figure 5.4. Fatal crash rate per 100,000 population by year
Amarillo Texas
Table 5.1. Amarillo vs Texas Emphasis Area Crash
(2019-2023)
Crash Severity
Crash severity, categorized by the KABCO scale (K: Fatal, A: Severe Injury, B: Minor Injury, C: Possible Injury, O: Property Damage Only), is crucial for prioritizing safety measures and reducing injury and fatality rates. When analyzing Amarillo’s crashes over the past five years, the analysis reveals that 69.0 percent resulted in no reported injuries, while 12.8 percent involved possible injuries (C), 8.0 percent saw minor injuries (B), 2.5 percent were incapacitating injuries (A), 0.4 percent were fatal (K), and 7.3 percent had unknown outcomes. The total number of crashes in each category and the percentage distribution of each is summarized in Table 5.2
Table 5.2. Number of Crashes by Severity
Vulnerable Roadway Users
While analyzing crash data, a notable pattern appeared – while vehicle-related crashes typically accounted for most crashes, the severe or fatal injuries that involved vulnerable roadway users (namely pedestrians and bicyclists) stood out significantly For the City of Amarillo, approximately 2.1 percent of vehicle-related crashes, 3.8 percent of fixed object-related crashes, and 1.1 percent of parked car-related crashes resulted in severe or fatal crashes. In contrast, 35.9 percent of pedestrian crashes and 17.5 percent of bike crashes led to severe or fatal injuries. This translates to pedestrian crashes being 17 times more likely to result in a severe or fatal injury compared to vehicular crashes, while bicycle crashes are eight times more likely as shown in Figure 5.5

Contributing Factors
Another piece of the crash analysis evaluated crash contributing factors. A contributing factor in a crash refers to any element or circumstance that primarily contributes to the occurrence or severity of the crash. These factors can include human error (such as distracted driving or speeding), vehicle-related issues (such as mechanical failure), or external factors (such as the presence of animals on the road). Figure 5.6 displays the top 10 contributing factors in Amarillo’s crashes. The top three contributing factors include speed-related (including drivers failing to control speed, speeding, and unsafe speed), followed by distraction in the vehicle or driver inattention, and failure to yield right of way while turning left.
Figure 5.5 Distribution of First Harmful Events in Fatal (K) and Severe (A) Crashes

5.6. Top 10 Contributing Factors
Manners of Collision
The manner of collision was also analyzed as part of the crash analysis, which refers to the specific circumstances or dynamics involved in how vehicles or objects come into contact during a crash. It includes factors such as the angle of collision, and the relative motion of the vehicles or objects involved. Most of the crashes had two or more vehicles involved (76.3 percent), while only 23.7 percent of crashes involved one vehicle. Among crashes that involve two or more vehicles, almost half of the crashes (45.9 percent) occurred when vehicles were driving the same direction, followed by angled crashes (36.3 percent), where two cars hit at an angle. Crashes occurred in vehicles driving in opposite directions constitute 17.3 percent of two or more vehicle crashes, while crashes occurred in “Other” accounted for about half a percent.
Among all crashes, the top three most common manners of collision include one motor vehicle –going straight (18.3 percent), angle – both going straight (16.9 percent), and same direction –both going straight – read end (12.2 percent). Figure 5.7 shows the top 10 manners of collision.
Figure

Figure 5.7 Percentage of Crashes by Manner of Collision
Light Condition
Another assessment from the crash analysis includes the lighting conditions. Understanding light conditions per crash is essential for evaluating visibility, assessing risk, identifying infrastructure needs, and prioritizing safety interventions. Light conditions directly impact visibility for drivers, pedestrians, and cyclists, which can influence perception and reaction times. The majority of crashes occurred under daylight conditions, accounting for 71.5 percent of all crashes. Crashes that occurred during dark lighted conditions constituted 19.8 percent while those in dark not-lighted conditions represented 5.3 percent of the total. Figure 5.8 illustrates the crash distributing between light conditions

Driver Age
The driver age distribution in crashes reveals notable disparities. The 20 to 24 year age group has the highest involvement in crashes at 14 percent, closely followed by the 15 to 19 year age group at 13 percent. However, their population share is almost half compared to their share in crashes. Conversely, age groups from 45 to 64 years exhibit relatively even percentages of crash involvement compared to their population shares. Figure 5.9 illustrates a comparison of age groups between crash data and population representation. This data underscores the importance of tailored strategies to address the specific risks faced by younger drivers, such as targeted educational programs, while also ensuring ongoing safety measures for drivers of all ages
Figure 5.8 Distribution of Crashes by Light Conditions

High Injury Network (HIN) Overview
The HIN is a critical tool used in roadway safety analyses to identify and prioritize roadways and intersections with the highest concentrations of severe and fatal crashes for vulnerable (pedestrian and bike crashes) and all roadway users. By focusing on these areas, the City can implement targeted interventions to enhance safety and reduce traffic-related injuries and fatalities.
Types of High Injury Networks
Four different HIN analyses were conducted, which work together to provide a comprehensive understanding of where the most critical safety issues lie. The "All Modes of Transportation HIN" provides a broad overview, identifying corridors or intersections with the highest concentrations of severe and fatal crashes across all travel modes. Meanwhile, the "Vulnerable Roadway Users HIN" delves deeper into crashes involving pedestrians and cyclists, highlighting specific corridors and intersections that require targeted safety improvements. By conducting multiple levels of HIN analysis, the City can ensure that safety interventions are effectively prioritized and tailored to address the unique risks faced by different roadway users.
Figure 5.9 Age Distribution in Crashes Compared to Population Share

All Modes of Transportation
This category looks at fatal and severe crashes across all modes of transportation to pinpoint critical areas for safety interventions.


Corridor HIN
This category encompasses all types of modes of transportation, aiming to identify large sections of roadway where fatal and severe crashes are most frequent.
Intersection HIN
This analysis identifies intersections with high rates of severe and fatal crashes across all types of travel modes.
Vulnerable Roadway Users
This category considers all levels of crash severity, including fatal, severe, nonsevere, possible injury, and non-injury crashes for pedestrian and cyclist-related crashes only. This comprehensive approach is necessary due to the severity and limited number of crashes involving vulnerable roadway users, ensuring that all vulnerable user related crashes are taken into account to address their safety needs effectively.
Results
Corridor HIN
This analysis focuses solely on the safety of vulnerable road users, identifying corridors with high rates of pedestrian and bicyclist crashes.
Intersection HIN
This category highlights intersections where pedestrians and bicyclists experience the most crashes.
The analysis resulted in the creation of four sets of maps, each representing a different aspect of the High Injury Network. The High Injury Network maps serve as a foundation for Amarillo's SS4A Plan. These results will guide the City's efforts in implementing targeted safety improvements, ultimately aiming to reduce serious traffic-related injuries and fatalities across all modes of transportation.
Below are the key findings for each map:
• High Injury Corridors for All Modes of Transportation (Figure 5.10)
60.4 percent of fatal and severe crashes occurred on just 8.7 percent of Amarillo's roadways.
This indicates a significant concentration of severe incidents on a relatively small portion of the road network, highlighting critical areas for safety improvements.
• High Injury Intersections for All Modes of Transportation (Figure 5.11)
63.3 percent of fatal and severe crashes occurred on just 2 percent of Amarillo's intersections. All intersections that include at least one fatality or more than two severe injuries ranked higher than the other intersection in the City and are thus included in this map. These high-risk intersections signify areas of heightened safety concerns, necessitating focused safety countermeasures to reduce risks and enhance overall road safety for all users.
• High Injury Corridors for Vulnerable Roadway Users (Figure 5.12)
66 percent of bike and pedestrian crashes occurred on only 3.4 percent of the roadways.
This statistic emphasizes the vulnerability of non-motorized road users and the need for targeted safety measures on these specific corridors.
• High Injury Intersections for Vulnerable Roadway Users (Figure 5.13)
These intersections have a considerable number of crashes involving vulnerable roadway users, such as pedestrians and cyclists. Almost 50 percent of pedestrian and bike crashes occurred on just 0.5 percent of Amarillo's intersections. All intersections that include at least one fatality ranked higher than the rest are thus included in this map. These intersections underscore the urgent need for targeted safety measures to protect these vulnerable road users and improve the overall safety of our City's streets.
City of Amarillo | Transportation Safety Action Plan

Figure 5.10. High Injury Corridors for All Modes of Transportation
Amarillo

Figure 5.11. High Injury Intersections for All Modes of Transportation
Amarillo

Figure 5.12. High Injury Corridors for Vulnerable Roadway Users
Amarillo

Chapter 5: Crash Overview and High Injury Network Development
Figure 5.13. High Injury Intersections for Vulnerable Roadway Users
Chapter 6: Safety Strategy Framework
Introduction
In support of the stated Vision and Goals, the Plan recommends City of Amarillo to adopt seven strategies in correspondence to the seven goals identified in Chapter 1, each with associated action items aimed at achieving the vision of reducing 35% of fatalities and serious injuries within the City of Amarillo by 2035
Goals and Strategies
Goals define the overarching vision, while strategies outline the specific approaches to achieving them. Strategies are recommended approaches that guide how the City can improve transportation safety. These are designed to support the overall vision and goals. Therefore, goals and strategies need to align to ensure that the SS4A Plan is consistent, actionable, and effective in achieving its desired outcomes. When aligned, strategies provide a clear roadmap to turn goals into measurable actions through strategies, ensuring resources are used efficiently and efforts remain cohesive.
Table 6.1. Goals and Strategies


Safe Access for All A
Develop transportation networks that prioritize safety for all roadway users.
Reduce fatalities and serious injuries through comprehensive and collaborative efforts. Engagement & Collaboration C
Engage with community members, stakeholders, transportation professionals, and relevant entities
Data Driven D
Progress and Transparency E
Implement comprehensive data analyses to inform decisions.
Establish clear metrics and milestones to monitor progress.
Consistency with City Plans F Ensure alignment and coordination between the SS4A Plan and other city plans.
Action Items and Performance Indicators
Each strategy is supported by action items, which are specific steps the City is recommended to take for safety improvements. Adopting this plan and its vision (Action Item A1) is strongly recommended to meet federal requirements and enable Amarillo to apply for SS4A Implementation Grant funding. Performance indicators measure progress and assess the impact of action items.
This section below outlines the recommended action items and performance indicators, providing a framework for implementing the Plan’s vision and tracking progress.
Strategy A – Develop transportation networks that prioritize safety for all roadway users
No.
Action Items
A1 The City of Amarillo accepts the vision to commit to reducing 35% of fatal and severe crashes by 2035*
Performance Indicators
• City’s adoption of the SS4A Plan
• Regular assessment of crash statistics in Amarillo
A2
A3
Establish a dedicated funding source for regular maintenance of safety infrastructure, to include but not limited to, pavement markings, crosswalks, bike paint, bollards, and other physical separations, and specialized sidewalk/ street-cleaning equipment.
Prioritize engineering solutions, educational initiatives, and enforcement and monitoring practices that support national and statewide Safe Routes to School programs.
A4 Develop and implement a citywide Complete Streets Policy to ensure safe access for all roadway users.
* Aim to reduce 60 fatal and severe crashes by 2035.
• Funding sources established in the city budget
• Annual allocation for maintenance projects
• Number of proposed projects that improve safety near schools
• Engagement feedback collected per each school on student safety priorities
• Adoption of the policy
• Regular assessment of complete streets projects

Strategy B – Reduce fatalities and serious injuries through comprehensive and collaborative efforts
Items
B1
B2
B3
Establish traffic calming guidelines detailing standards for implementing traffic calming countermeasures
Establish a policy to conduct routine walking audits to review safety needs during the design phase of roadway projects.
• Adoption of the guidelines
• Number of traffic calming projects completed following the guidelines
• Adoption of the policy
• Number of audits conducted
• Incorporation of any feedback collected from residents/ stakeholders into the design
• Speed reductions achieved
• Feedback collected from residents/stakeholders
B4
B5
Develop a Neighborhood Streets Program to improve safety and encourage safe speeds in neighborhoods.
Review and update city design standards, design guidelines, or policies to incorporate proven safety countermeasures
• Involvement of neighborhood leaders and/or associations
• Neighborhood transportation safety infrastructure/signage built
• Review completed
• Adoption of proposed recommendations
Create an online, interactive map of for the High Injury Network (HIN) Completed
Strategy C – Engage with community members, stakeholders, transportation professionals, and relevant entities No.
• Number of local community organizations or groups engaged
C1
Collaborate with a broad range of local community groups, including advocates for walking, taking transit, and/or students, to engage more stakeholders
C2
C3
Develop an education program promoting safe behavior among all roadway users via informational videos and outreach in schools, libraries, zoos, and other public spaces.
Commit to an adaptive approach to the Plan’s implementation, ensuring adjustments are based on outcomes and feedback.
• Diversity of groups/members participating in the plan that is reflective of the racial and geographic diversity of the City of Amarillo
• Number of materials distributed
• Number of outreach events held annually
• Number of documented scope changes for proposed projects to align with different funding opportunities or resources

Strategy D – Implement comprehensive data analyses to inform decisions
No.
Action Items
Performance Indicators
D1 Develop a HIN map to prioritize investments in highrisk areas Completed
D2 Utilize crash data, public input, and equity analysis to guide project proposal and preliminary design. Completed
D3 Review current plans, guidelines, and design standards to propose recommendations for closing gaps or addressing inconsistencies. Completed
D4 Conduct ongoing crash analyses and engage community members, leaders, and partners to share findings and identify direction for future equity work related to traffic safety.
D5 Update the Pavement Condition Index (PCI) for roadways to reflect current conditions.
D6
Conduct a comprehensive GIS assessment of Amarillo’s transportation safety infrastructure, including inventory and condition analysis for elements such as bike lanes, curb ramps, bollards, bike racks, crosswalks, and related features.
• Number of engagement sessions held
• Crash analysis reports published annually
• Completion of updated PCI report
• Completion of a detailed GIS database and technical report documenting the current state and quality of transportation safety infrastructure
Figure 6.1 Public Engagement Tools
Strategy E – Establish clear metrics and milestones to monitor progress
No. Action Items
F1
Create a public-facing dashboard to track the progress of safety projects.
F2 Publish an annual report summarizing crash trends, project milestones, and progress toward reducing fatalities.
F3
Conduct before-and-after crash analysis for built projects to understand their effectiveness in crash reduction.
Performance Indicators
• Dashboard launch date
• Frequency of updates
• Timely publication of reports
• Annual presentation of reports to Amarillo City Council
• Number of analyses conducted annually
• Percentage reduction in crashes for evaluated projects
Strategy F – Ensure alignment and coordination between the SS4A Plan and other city plans No.
Performance Indicators
G1 Review proposed projects for consistency with city and regional plans during the project scoping phase Completed
G2 Conduct annual interdepartmental meetings to ensure cohesive planning efforts.
G3 Include transportation safety priorities in the city’s next update to the comprehensive plan.
• Initiation of coordination meetings held
• Number of coordination meetings held annually
• Inclusion of transportation safety priorities in the updated comprehensive plan
• Number of safety-focused policies or projects incorporated in the plan
Chapter 7: Project Summary
Project Overview
Based on community input, crash analysis, and the High Injury Network tool developed for this Plan, a total of 16 projects have been proposed. These projects are categorized into three timeframes: Short-Term, Medium-Term, and Long-Term. For detailed descriptions of each project, please refer to Technical Memorandum 8: Targeted Safety Improvement Projects.
Table 7.1 provides a comprehensive list of the proposed projects along with their planning-level cost estimates. The project numbers are provided solely for reference purposes and do not indicate any prioritization. The planning-level cost estimates include construction costs, construction soft costs, and engineering and environmental costs. For detailed line-item costs, please refer to Appendix C: Planning Level Detailed Cost Estimates.
*Note: Project 16 is within TxDOT’s right-of-way (ROW) and is therefore beyond the City’s authority to determine cost estimates.

Figure 7.1. Project Overview Map
Letter from Mayor
Letter from Mayor Cole Stanley
Transportation safety is one of our city’s most important priorities. Every resident deserves safe streets to travel on, whether it be by walking, biking, taking transit, or driving. That’s why we are proud to introduce Amarillo’s first Safe Streets and Roads for All (SS4A) Plan, a roadmap to improve safety for everyone in our community.
As part of this plan, we have developed a vision with a critical goal of reducing fatal and severe injury crashes in Amarillo by 35 percent by 2035. This goal reflects our commitment to creating a safer, more connected city for all roadway users, including but not limited to pedestrians, bicyclists, drivers, and transit users

This plan is rooted in extensive community input and data analysis, identifying the areas where safety improvements are most needed. From safer crossings to improving street lighting, traffic calming, new traffic signals, street reconstruction, and better biking and walking infrastructure, the SS4A Plan outlines specific actions we will take to make Amarillo’s streets safer.
We are excited to work together with the community to bring this vision to life. With this plan, we are taking firm steps toward a future where crashes are less frequent, less severe, and everyone can travel with confidence and peace of mind. These efforts will not only save lives but also enhance the quality of life for all Amarillo residents.
Thank you for supporting our mission to make Amarillo a safer, stronger community for generations to come
Sincerely,

City of Amarillo | Safe Streets and Roads for All (SS4A) Plan
Technical Memorandums
Cole Stanley Mayor, City of Amarillo
Technical Memorandum 1: Existing Conditions
Introduction
The Existing Conditions Technical Memorandum (the memo) provides a summary of the City of Amarillo’s (City) existing transportation infrastructure and current demographic composition. This Technical Memorandum focuses on relevant existing conditions information on how it impacts transportation safety in the City. The memo is broken down into four sections:
1. Population Overview – A snapshot of the community’s demographic makeup and how that impacts transportation safety in Amarillo
2. Transportation Infrastructure – A brief overview of Amarillo’s existing transportation infrastructure, including a review of existing roadway, sidewalk, and bicycle networks, speed limits, pavement conditions, functional classifications, and public transit infrastructure.
3. Transportation Demand – A Transportation Demand analysis was conducted to review the need of Amarillo’s active transportation infrastructure as well as several other statistics relevant to the City’s transportation safety.
4. Land Uses & Destinations – An overview of Amarillo’s existing land uses and distribution, including a review of the City’s major destinations, including government buildings, major employment centers, and schools.
Crash history, statistics, and crash trends also play an important role in the Safe Streets and Roads for All Plan (SS4A Plan). Therefore, a separate crash technical memorandum has been prepared that takes a deep dive into current crash data. If you would like to review Amarillo’s crash history report and findings, please see Technical Memorandum 6: Crash Analysis.
Population Overview
Amarillo Today
The City of Amarillo is an urban area located in the plains of the Texas panhandle. Established in 1887, Amarillo is home to more than 201,000 residents and over 10,000 businesses 26 Table TM-1.1 displays a community snapshot of key demographic statistics for Amarillo, and how the city compares to communities of similar size, the region, and the state Compared to the state of Texas, the City of Amarillo is older and has a higher number of young children (displayed in the population pyramid in Figure TM-1.1). The median age and average household size reflect this, showing Amarillo is on average older and obtains smaller household sizes than the State of Texas average. Commuting times are also well below the statewide average in Amarillo and the surrounding region. The City’s race and ethnicity distribution is 26 Amarillo Chamber of Commerce. (2024). Amarillo’s History, from https://www.amarillo-chamber.org/amarillohistory.html
shown in Figure TM-1.2 Amarillo is relatively less diverse when comparing to the state average and has a higher percentage of individuals identifying as white alone.

27 Data Source: ESRI Business Analyst (2023). Population Estimates. Retrieved from https://bao.arcgis.com/esriBAO/login/
28 Data Source: ESRI Business Analyst (2023). Age by Sex Profile. Retrieved from https://bao.arcgis.com/esriBAO/login/
Table TM-1.1. Community Comparison Snapshot 27
Figure TM-1.1. 2023 Population Pyramid 28

Table TM-1.2 shows historic population growth for the City, Potter County, Randall County, and the entire Amarillo Metropolitan Statistical Area (MSA). The table also provides 2023 population estimates, as well as projected population growth to 2050 as documented in the Amarillo Metropolitan Transportation Plan 2020 – 2045. The City of Amarillo has grown by approximately 6% since 2010, adding over 12,000 residents to the City’s population. This growth is expected to continue into 2050, where the City is anticipated to add almost 77,000 additional residents Overall, the Amarillo MSA area is experiencing growth, but looking closer, this growth is not distributed evenly within the region. Over the past 13 years, Randall County has seen 21% growth since 2010, while Potter County has seen a negative growth rate of approximately -3%.
29 Data Source: ESRI Business Analyst (2023). Demographic and Income Profile. Retrieved from https://bao.arcgis.com/esriBAO/login/
Figure TM-1.2 2023 Race and Ethnicity Distribution 29
Demographic Impacts on Transportation Safety
Several demographic factors are relevant for the development of the SS4A Plan for the City, particularly when considering the community’s demographic profile. These key facts include:
• Amarillo has larger shares of their population that are over age 60 compared to the State of Texas, which highlights the importance of incorporating transportation safety measures that allow this population group to safely walk, drive, use mobility devices, and take transit to their destination. ADA improvements such as curb ramps and safer pedestrian crossing infrastructure, may be necessary to address this group’s safety and mobility needs
• The City has a higher percentage of young children compared to the State of Texas, indicating the importance of prioritizing safe transportation connections between homes and schools within the plan.
• Commute times are much lower than the statewide average. People who live in Amarillo spend on average up to 8 minutes less on their commute when compared to the State of Texas. This shorter commute time could reduce exposure to driving-related risks when compared to the state average.
30 Data Source: ESRI Business Analyst (2023). Demographic and Income Profile. Retrieved from https://bao.arcgis.com/esriBAO/login/
31 Data Source: Amarillo Metropolitan Planning Organization (MPO) (2019). Amarillo Metropolitan Transportation Plan 2020 – 2045 https://www.amarillo.gov/mpo/
Transportation Infrastructure
This section assesses the current state of Amarillo’s transportation infrastructure, including an assessment of the City’s roadway network, bicycle and pedestrian infrastructure, public transit infrastructure, and the City’s current pavement conditions.
Roadway Network
Figure TM-1.3 displays the City’s functional classification as defined by the Texas Department of Transportation’s (TxDOT) Statewide Planning Map. This map also identifies roads that are owned and operated TxDOT, such as the highway system, including Interstate 40, Interstate 27, US Highway 87, and Loop 335, and several major arterials, such as Amarillo Boulevard (Interstate 40 Business), Fritch Highway (State Highway 136), and the Washington/ Hughes/ Broadway corridor (FM 2196 and FM 1541). The City is encompassed by Loop 335 and has a gridded downtown street pattern with a railroad yard as the focal point of the historic town. US Route 66 also passes through Amarillo and is a major tourism draw for the area. The City’s major highways are I-40, which bisects Amarillo in the east/west direction, and carries national freight traffic from coast to coast. I-27/US-87 transverses the City in the north/south direction and carries traffic through Downtown Amarillo.

TM-1.3. 2024 Functional Classification 32
32 Data Source: Texas Department of Transportation (TxDOT). (2024). Statewide Planning Map. Retrieved from: https://www.txdot.gov/apps/statewide_mapping/StatewidePlanningMap.html
Figure
Figure TM-1.4 identifies the current Amarillo Area Metropolitan Planning Organization (MPO) Thoroughfare Plan, which was created as part of the 2020 Amarillo Area Regional Multimodal Mobility Plan update Within the City limits only a few new roads are recommended to be constructed for regional mobility.

Sidewalk and Bicycle Infrastructure
The City of Amarillo’s existing sidewalk and bike lane data was last updated in 2020. Based on the database, more than half of the streets in the city (52%) have sidewalks. However, some sidewalk infrastructure measures less than the standard width, with certain sidewalks being below the 4-foot minimum for residential areas and the 6-foot minimum for commercial areas as outlined in the Amarillo Design Standards. Several examples of existing sidewalks are shown below in Figure TM-1.5.
33 Data Source: Amarillo Area Metropolitan Planning Organization (MPO). (2020). Amarillo Area in Motion Multimodal Plan.
Figure TM-1.4. Existing (2020) Thoroughfare Plan 33
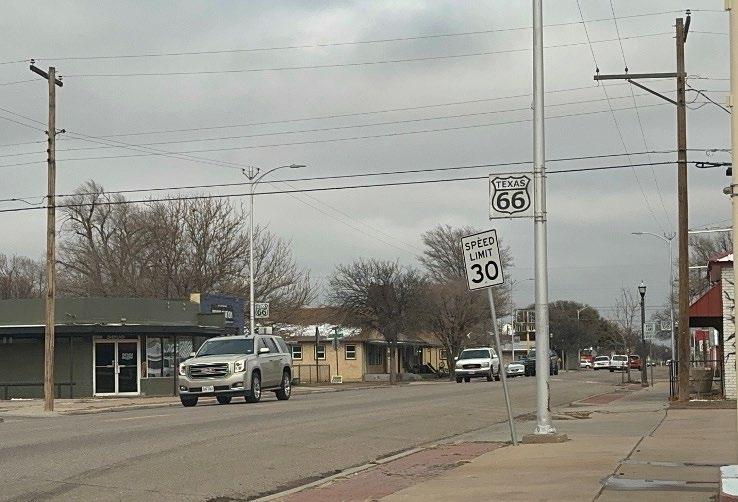

Figure TM-1.6 displays Amarillo’s existing pedestrian and bicycle infrastructure. The current sidewalk and bicycle infrastructure in Amarillo follows the pattern of existing residential development. The City’s bicycle infrastructure has seen several recent improvements, such as the installation of bicycle lanes on 7th, 8th, and 15th Avenues, and along Johnson Street. The existing bicycle network is mostly bicycle routes (shared lanes/sharrows), however, the Amarillo Area Metropolitan Planning Organization (AAMPO) Regional Mobility Plan’s proposed bicycle network calls for a shift to build dedicated shared use paths and trails – bicycle facilities that are separated from the main lanes of traffic.
A Sidewalk Gap Prioritization analysis was conducted by the AAMPO for the Amarillo Area in Motion Multimodal Plan (AAIM). The results of this analysis are displayed in Figure TM-1.7 This sidewalk gap prioritization process was developed to help the City of Amarillo identify what areas have the highest need for pedestrian investment. To score these identified sidewalk gaps into tiers of priority, the study area was divided into 500-foot hexagonal areas.
Once scored, the hexagonal areas were then sorted into one of three priority tiers (low, medium, and high), based on their overall score. Gaps identified as low priority are ones that only meet one criterion, medium priority gaps meet two to three, and high priority gaps meet four or more of the seven criteria. Several high priority pedestrian focus areas were identified from this analysis, and include the following:
1. Neighborhood surrounding the Palo Duro High School
2. Amarillo Boulevard from Hughes Street to Ridgemere Boulevard
3. Neighborhood surrounding the Carver Elementary School
4. Washington Street from 10th Street to Wolflin Avenue
5. Coulter Road from 45th Street to Hillside Road
6. Hillside Road from Coulter Street to Star Lane
7. 4th Avenue from 16th Street to Russell Long Boulevard
Figure TM-1.5 Existing Sidewalk Infrastructure (Left) and Existing Pedestrian Crossing Infrastructure (Right)
Data Source: Amarillo Area Metropolitan Planning Organization (MPO) (2020). Amarillo Area in Motion Multimodal Plan. Retrieved from: https://www.amarillo.gov/mpo/
Figure TM-1.6 2020 Existing Sidewalk and Bicycle Infrastructure 34

Public Transit
Amarillo City Transit (ACT) provides mass transit to Amarillo’s residents. Currently, ACT provides 12 transit routes, including 10 fixed routes and 2 on-call routes (Route 13 and 30), as displayed in Figure TM-1.8. Additionally, an app called OneRide is available in Amarillo that can call a community service bus for on-demand transportation services. Since the COVID-19 pandemic, ACT’s fixed routes have been operating at a reduced service on Saturdays, and not operating on Sundays. ACT has a total of 68 employees and 28 bus vehicles. According to the American Community Survey, 0.42% people commute by transit in Amarillo, as compared to the State of Texas’ transit mode split of 0.85% of all workers 36 The City of Amarillo has a below average rate of transit commuters when compared to the overall state.
35 Data Source: Amarillo Area Metropolitan Planning Organization (MPO). (2020). Amarillo Area in Motion Multimodal Plan. Retrieved from: https://www.amarillo.gov/mpo/
36 Means of Transportation to Work, City of Amarillo; State of Texas, American Community Survey 1-Year Estimates, 2022. Data.census.gov
Figure TM-1.7. 2020 Existing Sidewalk Gap Analysis 35

Pavement Conditions
The City of Amarillo produces an annual pavement maintenance report that includes the City’s pavement condition assessments, and which streets need to be upgraded first. In 2018, the City conducted a pavement conditions assessment where each street segment was assigned a Pavement Condition Index (PCI) rating on a scale from 1 – 100. The study indicated that Amarillo has an average PCI rating of 67.8, which corresponds to a “Fair” condition according to the City’s rating criteria. As displayed in Table TM-1.3, the City classifies street pavement conditions into PCI ranges. Over 83% of Amarillo’s roadway network received a rating of “Fair” or above.
In the context of the PCI ratings for Amarillo, it is crucial to understand the implications of the different stages in the roadway’s life cycle. Once a roadway attains a “Fair” rating, its condition begins to deteriorate at an accelerated rate comparing to “New”, “Very Good”, or “Good” conditions as shown in Figure TM-1.9. This rapid decline emphasizes the need for timely maintenance and intervention to prevent further degradation. When a roadway progresses beyond the "Fair" stage to the "Poor" stage, it is at significant risk of becoming undriveable. At this point, extensive repairs or complete reconstruction may be necessary to restore its usability.
37 Data Source: Amarillo City Transit. (2024). Bus Routes. Retrieved from: https://www.amarillo.gov/amarillo-citytransit/
Figure TM-1.8 2024 Public Transit Routes 37
Additionally, roadways in the "Fair" condition often exhibit early signs of distress such as minor cracks and surface wear, which can escalate quickly if not addressed. As displayed in Figure TM-1.9, preventative maintenance is an effective approach to managing long-term infrastructure costs, reducing the need for more extensive repairs in the future.

Displayed in Figure TM-1.10, roadway quality tends to improve when traveling away from Downtown Amarillo into newer neighborhood developments and areas of town. Local neighborhood streets have higher PCI ratings over larger arterial thoroughfares, especially in neighborhoods in southwest Amarillo. In contrast, streets in neighborhoods north of Amarillo Boulevard and southeast of US 287 exhibit lower quality due to the age of the infrastructure. These streets may require improvements sooner than other parts of the city to maintain acceptable roadway conditions.
38 Texas Department of Transportation (TxDOT). (2018). Initial transportation asset management plan. North Central Texas Council of Governments.
Figure TM-1.9. Life Cycle Maintenance and Costs 38
39 Data Source: City of Amarillo. (2020). PCI Ratings. GIS Shapefile. 40 Data Source: City of Amarillo. (2020). PCI Ratings. GIS Shapefile.
Table TM-1.3 Amarillo PCI Ratings 39
Figure TM-1.10 2020 Pavement Conditions 40
Infrastructure Impacts on Transportation Safety
Several key observations over City’s infrastructure are noted below and are essential to incorporate in the SS4A Plan. These key facts include:
• New development and population growth is planned to occur in southwest Amarillo. As this growth occurs, roadway safety for all transportation modes (walking, biking, driving) will be important when building new streets, in accordance with AAMPO’s Thoroughfare Plan.
• Much of Amarillo’s street network is lined with sidewalks. Generally, sidewalks within new developments are in relatively good condition. Sidewalks within older neighborhoods (such as Country Club) show signs of aging infrastructure and are sometimes broken or uneven Though sidewalk conditions varied from good to poor, based on field observations, broken and uneven sidewalks were observed. Some sidewalks also have ponding issues Strategies can be identified to enhance the comfort, safety, and overall walking experience for Amarillo’s streets.
• Pavement conditions, as indicated by PCI rankings, play a role in transportation safety. Poor roadway conditions, including potholes and cracks, not only pose safety risks but also lead to unreliable travel times. Improving these conditions will enhance Amarillo's transportation network by improving traffic flow, minimizing disruptions, and ultimately enhancing travel reliability. Additionally, better pavement conditions will reduce long-term maintenance costs while improving safety for all road users, including pedestrians, cyclists, and drivers.
Transportation Demand
Demand measures in transportation look at how improvements, funding, and resources are distributed for transportation projects across a larger area This section of the existing conditions report explores Amarillo’s existing distribution of transportation resources, ensuring that all residents, regardless of race, age, socioeconomic status, or transportation mode preference, have fair access to safe and reliable transportation options.
Transportation Demand Analysis
A transportation demand analysis was conducted for the City of Amarillo. The analysis identifies areas of a given community that requires more balanced transportation investments through the observation of human- and built environmental-related characteristics. The purpose of the analysis is to identify areas within Amarillo where transportation investments are needed most and to ensure that recommendations from the SS4A Plan are distributed throughout the city.
The analysis comprised of 13 different indicators, detailed below in Table TM-1.4 Five categories were created for the final ranking, and rank from very high to very low transportation facility demand. The primary statistical method was to transform each block group’s values for the 13 indicators into a percentile rank between one and 100 and then find the average of all 13 indicators. The result is a rank order of each block group in comparison to all other block groups. Higher values mean higher relative priority and feasibility transportation need. The five categories were classified using natural breaks, which identifies inherent groupings or gaps within the data distribution. This technique helps to minimize variance within classes and maximize variance between classes, resulting in a more accurate and visually meaningful representation of spatial data.
Table TM-1.4. Indicator Details
Households in Poverty
Homes of Workers with Jobs Paying
Less Than $15,000 Annually
Work Sites of Workers with Jobs Paying Less Than $15,000 Annually
Single Parent Female Headed Households with Children Under Age 18
Households with One or More Persons with a Disability
People of Color Population
Workers Commuting by Transit
Homes of Workers with High School Education or Less
Community Survey
The results of the analysis are displayed below in Figure TM-1.11 A large cluster of high transportation facility need exists in Downtown Amarillo. Several other neighborhoods have higher scores that are generally near Downtown. The further away from Downtown, generally there is a lower score. However, a handful of neighborhoods that are not near Downtown Amarillo still are highlighted as high demand areas, including the Owners, Ridgecrest, Paramount Mays, and Hamlet neighborhoods.

Demand Impacts on Transportation Safety
Several key indicators are essential for the development of the SS4A Plan for Amarillo when incorporating the community’s transportation demand conditions. These key facts include:
• Amarillo’s higher transportation demand areas are concentrated on the north and northeast sides of the City, which is also where PCI ratings are generally lower. These areas also have generally less sidewalk and bicycle infrastructure. This highlights the importance of ensuring transportation projects and programs reach all areas of the city.
Figure TM-1.11. Transportation Demand Analysis
• Engaging with community residents, leaders, or stakeholders in these high demand areas is crucial to ensure balanced fair representation throughout the planning process.
Land Uses & Destinations
Transportation and land use are closely interconnected. Land use patterns influence travel demands, while transportation infrastructure shapes mobility and access to different land uses in the city. Together they help shape the overall quality of life for residents, visitors, and businesses in Amarillo As part of the existing conditions assessment, current land uses were reviewed to understand how they interact with the transportation network, ensuring that future transportation planning supports safe access to key destinations and land use areas throughout the city.
Existing and Future Land Uses
As part of the City Plan: Vision 2045 comprehensive planning process, the City of Amarillo measured their existing land use as of 2023 and also created a future land use plan to guide future land use development in Amarillo. Figure TM-1.12 displays the City’s existing land uses, and Table TM-1.5 below summarizes the City’s existing land use acreage and percent distribution. Amarillo’s current land use mix is primarily comprised of low-density single-family residential (28%), open space (27%), and commercial areas (20%). Public and institutional land uses also occupy a notable share (12%), while other land uses each account for less than three percent of the total area. Overall, Amarillo’s land uses are generally separated and segmented.
41 City of Amarillo (2024). City Plan – Chapter 3 Land Use Framework: Growth Management & Capacity. Retrieved from: https://www.amarillo.gov/planning/city-plan/
Table TM-1.5. Amarillo Existing Land Use Distribution (2023) 41
The City’s desired future land use pattern is displayed in Figure TM-1.13 Titled the “Complete Neighborhoods Scenario,” this future land use map illustrates the community’s vision for land use and development patterns in 2045. The objective of the Complete Neighborhoods Scenario is to capture future growth projections through a balance of land uses and strategic densities that create desirable, healthy, and vibrant communities across Amarillo. The Complete Neighborhoods Scenario map utilizes Place Types, which are future land use designations that can have a mix of individual land uses, allowing for greater flexibility than traditional future land use categories (such as residential, commercial, industrial, etc.). The Place Types included in Amarillo’s future land use patterns include Reserve, Parks/Open Space, Manufacturing Logistics District, Innovation Mixed-Use, Campus, Commercial, Regional Mixed-Use, Community Mixed-Use, Neighborhood Mixed-Use, Neighborhood – High, Neighborhood –Medium, and Neighborhood – Low. The Complete Neighborhoods Scenario future land use plan generally follows in alignment with what is on the ground today. Existing neighborhoods are preserved in the future, and new commercial or mixed-use development is concentrated along key corridors and around major intersections. Industrial and manufacturing land uses are concentrated on the east side of Amarillo, specifically around the airport.

42 City of Amarillo. (2024). City Plan. Retrieved from https://www.amarillo.gov/planning/city-plan/
Figure TM-1.12. 2023 Existing Land Use 42

Major Destinations
Major destinations are also relevant to analyze in a SS4A Plan since large trip attractions and economic activity centers generate the most traffic. Often time multiple travel modes and lastmile connections occur at major destinations, so ensuring quality in transportation safety infrastructure is critical. In Amarillo, several major activity centers are incorporated into the study. Figure TM-1.14 display’s the City’s current activity centers. Key economic generators in Amarillo include:
• Major industrial business parks and commercial centers along the City’s major corridors
• The medical center/medial park that surrounds the Amarillo Botanical Gardens
• Education facilities, including Amarillo ISD schools, Amarillo College (community college), trade schools, day cares, and other similar learning institutions
• Downtown Amarillo/Amarillo Central Business District
• Rick Husband Amarillo International Airport
Figure TM-1.13 Amarillo Complete Neighborhoods Scenario (Future Land Use Plan)
• Other major local destinations such as the Wonderland Amusement Park, the American Quarter House Hall of Fame and Museum, Cadillac Ranch or any of the City’s community parks
Land Use Impacts on Transportation Safety
Several highlights are noted below for the development of the SS4A Plan for Amarillo in respect to incorporating the community’s land use patterns. These key facts include:
• Many of Amarillo’s schools are located within or nearby existing neighborhoods. A major component of this SS4A Plan is to ensure safe multimodal connections exist between neighborhoods and nearby schools. Transportation safety around schools is very high on the priority list so that children can walk and bike safely to school.
• Enhancing bicycle and pedestrian safety in areas with high existing pedestrian activity is an important consideration. Safety recommendations may prioritize major activity centers during the project selection process.
Figure TM-1.14. Activity Centers Data Source: ESRI Business Analyst
• Amarillo’s commercial land uses are concentrated along relatively higher speed arterials. The City’s arterial network will be analyzed during this planning process to see if opportunities exist to implement access management best practices, such as consolidating driveways, adding pedestrian or cyclist amenities in underutilized right-ofway, or modifying street parking.
Conclusion
The City of Amarillo has already made significant strides to ensure a high-quality multimodal transportation network through previous planning efforts. Recent planning studies such as the Amarillo Area Regional Multimodal Mobility Plan and City Plan (the City’s 2045 Comprehensive Plan) lay a solid foundation for the SS4A Plan and shows the City’s commitment to long range planning and improving quality of life for people who live in Amarillo. The city's extensive sidewalk network and the majority of roadways being in Fair to Very Good condition are key assets. At the same time, areas with aging infrastructure or high-speed corridors offer opportunities for targeted improvements. Understanding Amarillo’s existing transportation conditions is essential for identifying roadway safety projects that address gaps in connectivity and safety for all roadway users. The content in this chapter will serve as a basis for identifying and prioritizing roadway safety projects within the SS4A Plan, ultimately improving the City’s transportation safety and quality of life for all residents
Technical Memorandum 2: Transportation Demand Analysis
Introduction
The City of Amarillo is assessing the city-wide need for accessibility, connectivity, environment, health, etc. and how transportation systems affect and/or influence safe and balanced outcomes Analyzing demand in transportation ensures that everyone has fair and equal access to transportation systems, regardless of income, race, disability, or other socio-economic factors. It focuses on making quality transportation options affordable and accessible, and used for all communities. Additionally, it involves engaging diverse populations in the planning and decision-making processes to address and rectify disparities.
The Transportation Demand Analysis is a measure that identifies areas of a given community that require more balanced transportation investments through the observation of human- and built environmental-related characteristics. The purpose of the analysis is to identify areas within Amarillo where transportation investments are needed most and to ensure that recommendations from this Safe Streets and Roadways for All Plan (SS4A Plan) are fairly distributed throughout the city.
The analysis is comprised of 13 different indicators, detailed below in Table TM-2.1. The table describes each indicator used, along with the geographic analysis level and data sources for each observed factor. Data sources include the decennial census, American Community Survey, the Longitudinal Employer-Household Dynamics survey, and the Center for Neighborhood Technology. The first five measures analyze baseline demographic information, the second set of measures determines area of Amarillo that are more likely to be active transportation facility users (i.e. pedestrians, bicyclists, transit users, scooters, etc.), and the last set of measures looks at built environment characteristics. The primary statistical method was to transform each block group’s values for the 13 indicators into a percentile rank between one and 100 and then find the average of all 13 indicators. The result is a rank order of each block group in comparison to all other block groups. Higher values mean higher relative priority and feasibility in transportation demand
The original methodology included three built environment factors concerned with walkability: street intersection density, average block perimeter, and compact neighborhood score. All three factors originated from the Center for Neighborhood Technology’s (CNT) Housing+Transportation Index. 43 However, CNT’s most recent data release included only the average block size, with an explanation that statistical analysis had revealed the prior three measures essentially measured the same observation and therefore a singular measure weighted equivalent to three is sufficient. Therefore, Factors 1-12 were given equal weights, while Factor 13 (Average Block Size) is given triple weight. The result is an index generally
43 Center for Neighborhood Technology, Housing+Transportation Index. https://cnt.org/tools/housing-andtransportation-affordability-index
following the original 15 equally weighted factors. In other words, a built environment development pattern potentially more conducive to walking, measured by block size, has the same 20% overall weight in the result. The index does not capture actual walking conditions as no sufficient datasets exist about intersection safety, sidewalk existence and quality, and infrastructure accessibility – the three key factors for actual walkability necessary to connect people to active transportation facilities.
Table TM-2.1. Indicator Details
Households in Poverty
Homes of Workers with Jobs Paying Less Than $15,000 Annually
Work Sites of Workers with Jobs Paying Less Than $15,000 Annually
Single Parent Female Headed
Households with Children Under Age 18
Households with One or More
Persons with a Disability
People of Color Population
Workers Commuting by Transit
Homes of Workers with High School Education or Less
Work Sites of Workers with High School Education or Less
Census Bureau, Longitudinal EmployerHousehold Dynamics
Bureau, Longitudinal EmployerHousehold Dynamics
Household Dynamics
Household Dynamics
EmployerHousehold Dynamics
Results
The City of Amarillo was able to assess clear priority locations where investments for vulnerable roadway users (e.g., pedestrians and cyclists) are needed most by combining the thirteen indicators in the methodology. Each indicator was analyzed and mapped individually (see appendix), and the results of the final, combined analysis are visualized in Figure TM-2.1. The darker the shaded block group, the higher the potential transportation demand. The final results of the analysis are displayed on the following page in Figure TM-2.2.
Five categories were created for the final ranking, and rank from very high to very low transportation facility demand. The five categories were classified using natural breaks, which identifies inherent groupings or gaps within the data distribution. This technique helps to minimize variance within classes and maximize variance between classes, resulting in a more accurate and visually meaningful representation of spatial data.
Amarillo neighborhoods were overlaid on the analysis results. This analysis can be useful when prioritizing projects in areas or neighborhoods with high transportation needs. A large cluster of high transportation facility need exists in Downtown Amarillo. Several other neighborhoods pop up that are generally near Downtown. The further one travels from Downtown, generally the lower the score becomes. However, a handful of neighborhoods that are not near Downtown Amarillo still are highlighted as high priority areas, including the Owners, Ridgecrest, Paramount Mays, and Hamlet neighborhoods. Neighborhoods that contain a “Very High” block group-level final ranking result include:
• Hamlet
• North Heights
• North Amarillo
• Eastridge
• Stockyards
• San Jacinto
• Sunset/Westlawn
• Owners
• Bivins
• Downtown
• Plemons Eakle
• Gables
• Barrio
• Fairgrounds Sunrise
• Lawndale Oakdale
• Lawrence Park
• Ridgecrest
• Paramount Mays

Figure TM-2.1 Methodology
City of Amarillo | Transportation Safety Action Plan

Figure TM-2.2. Analysis Results
Fundamental Demographic Demand
The Fundamental Demographic Demand indicators were the first five factors analyzed in the index. Data was gathered through the American Community Survey (ACS) and visualized geographically to indicate the demographic distribution of analyzed factors within the city. Each of the five individual factors provides valuable insight into the Amarillo community. The five indictors that were used in the Fundamental Demographic Demand Analysis are displayed in Figure TM-2.3.

Figure TM-2.3. Fundamental Demographic Demand Factors
To view full scale maps of each individual Fundamental Demographic Demand factor, please see Appendix A: Transportation Demand Analysis Maps. The results of each analyzed factor in the Fundamental Demographic Demand Analysis are as follows:
• Factor 1 – Households in Poverty: Higher levels of poverty in Amarillo are generally concentrated in the north side of town, specifically north of Interstate 40. The block groups with the highest levels of poverty are also some of the older areas of Amarillo and are near industrial land uses.
• Factor 2 – Homes of Workers with Jobs Paying Less Than $15,000 Annually: This indicator was analyzed to understand where low wage workers live in higher concentrations within Amarillo. The results of this analysis show areas along the perimeter of Amarillo to have higher concentrations of where low wage workers live.
• Factor 3 – Work Sites of Jobs Paying Less Than $15,000 Annually: This indicator was reviewed to understand where low wage workers work in higher concentrations in Amarillo. This analysis highlights a few block groups where low wage jobs are more prominent in Amarillo, which are generally concentrated in industrial areas, with one block group highlighted in the downtown area as well.
• Factor 4 – Single Parent Female Headed Households with Children Under 18: Single parent female household indicators in Amarillo are scattered throughout the city, which is typical and not necessarily tied to surrounding land use patterns.
• Factor 5 – Households with One or More Persons with a Disability: Disability status is also scattered throughout Amarillo, with several block groups in the northeast and northwest side of town showing the highest levels of this indicator.
Each factor was analyzed on the block group level in Amarillo, of which the City obtains 182 individual block groups. The Fundamental Demographic Demand Factors 1 – 5 (Appendix A: Transportation Demand Analysis Maps) were analyzed for each block group, and then were each given a percent rank within that dataset. This percentile rank indicates where each block group's value stands relative to others in the city, expressed as a percentage. This analysis is key for assessing performance, identifying outliers, and making data-driven decision making. Factors 1 – 5 were weighed evenly against each other to produce a final percent ranking for all census block groups in Amarillo.
The overall results of the Fundamental Demographic Demand Analysis are displayed in Figure TM-2.4 on the following page. Generally, block groups located on the northern side of Amarillo ranked higher than those on the south side. Specifically, block groups adjacent and above Interstate 40 see higher rankings in this analysis.
City of Amarillo | Transportation Safety Action Plan
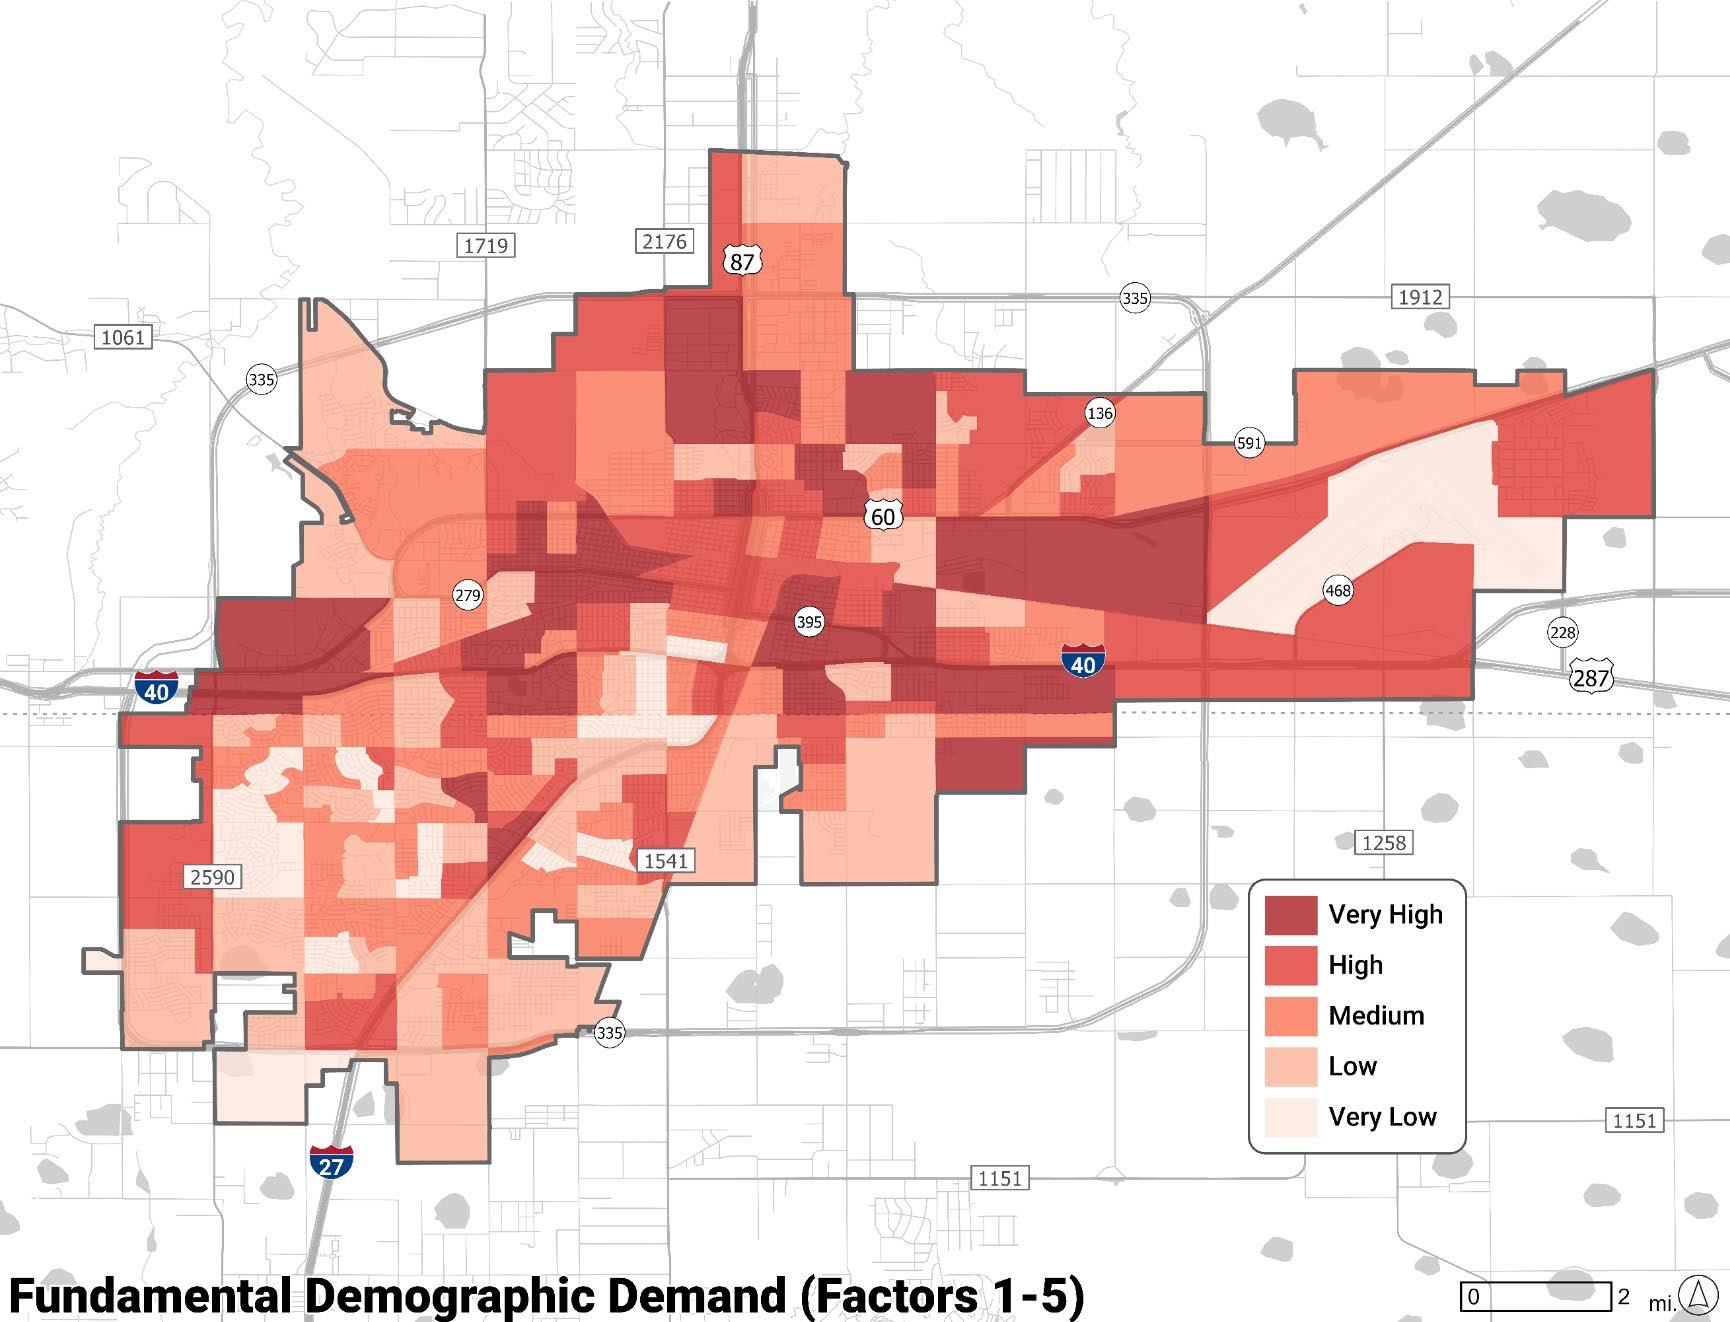
Figure TM-2.4. Fundamental Demographic Demand
Likely Higher Active Transportation Use
The Likely Higher Active Transportation Use analysis reviews the propensity of active transportation facility (i.e., sidewalks and bicycle lanes) usage broken down by block groups in Amarillo. The factors included in this analysis are displayed in Figure TM-2.5 and include people of color, zero vehicle households, workers commuting by transit, and home and work site of workers with high school or less of education.
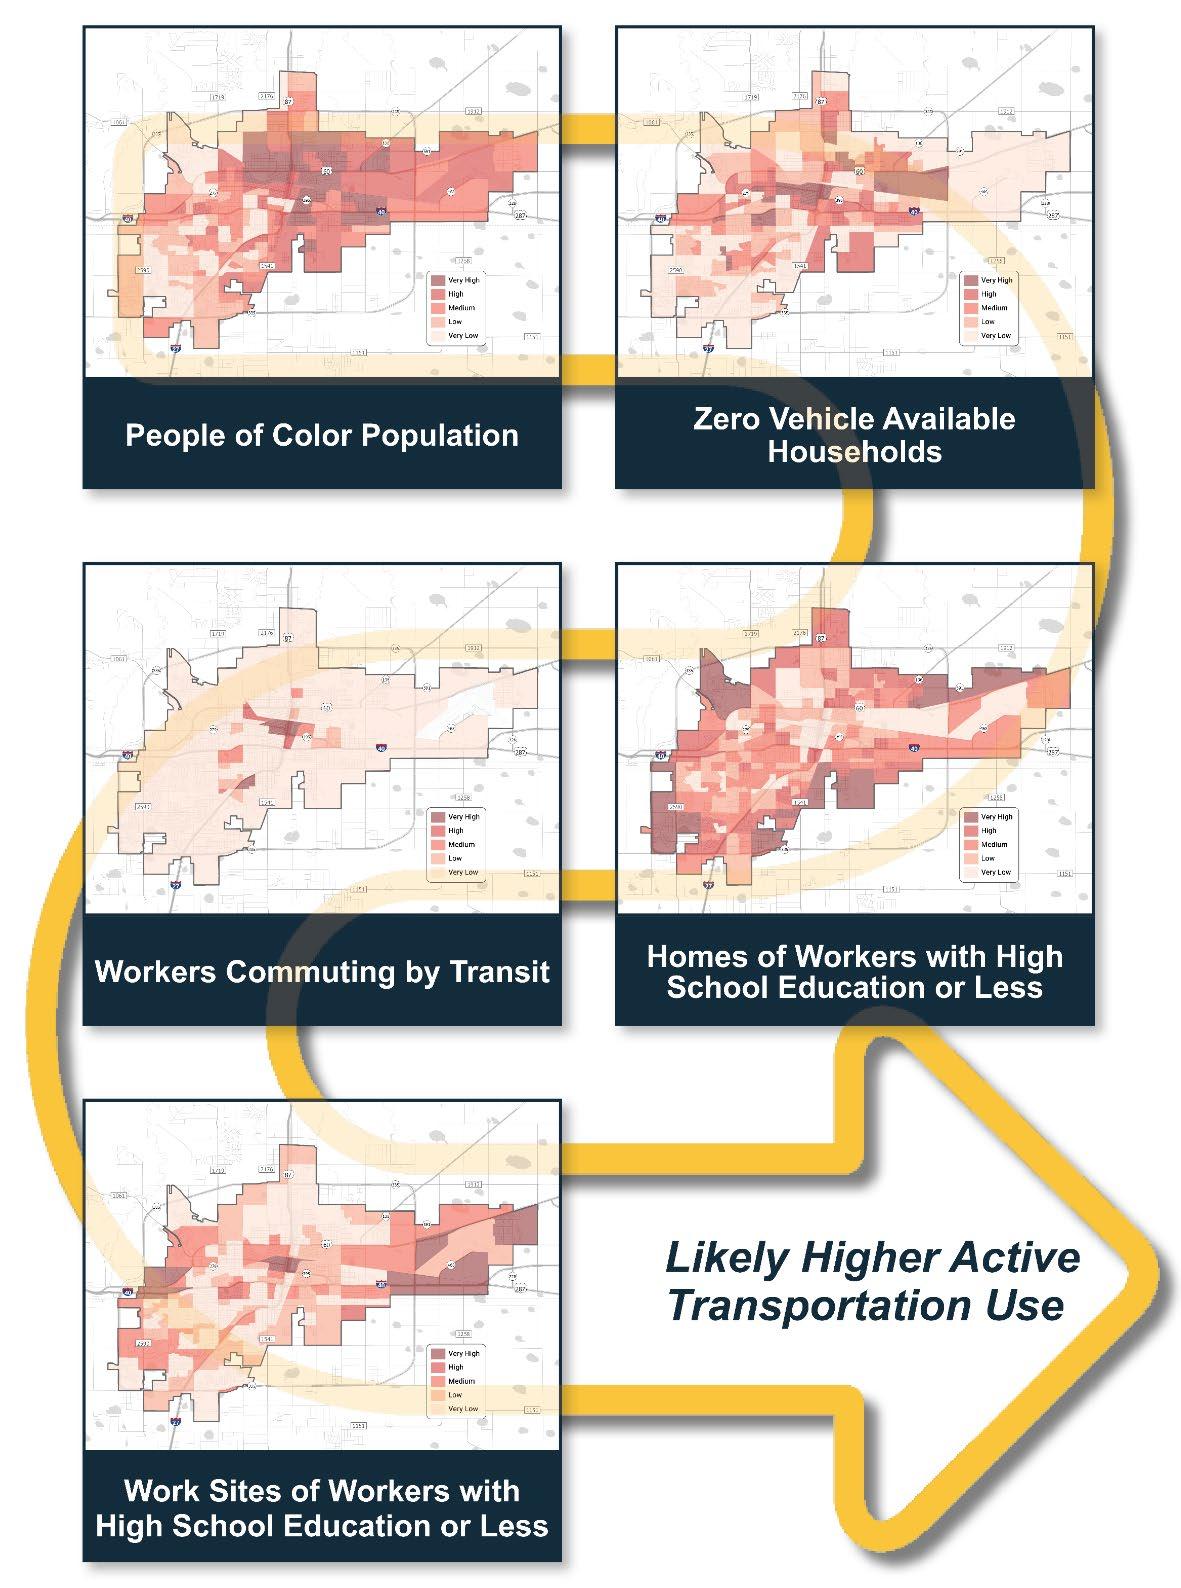
Figure TM-2.5. Likely Higher Active Transportation Use Methodology
Full page maps of each indicator are found in Appendix A: Transportation Demand Analysis Maps. The results of each analyzed factor in the Likely Higher Active Transportation Use analysis are as follows:
• Factor 6 – People of Color Population: Block groups in Amarillo show that people of color (any non-white individuals) are more concentrated within Downtown Amarillo and to the north and east. South and west Amarillo has lower concentrations of people of color.
• Factor 7 – Zero Vehicle Available Households: Block groups with higher levels of zero vehicle households are generally concentrated in the middle of Amarillo, typically within or directly adjacent to Downtown.
• Factor 8 – Workers Commuting by Transit: Downtown Amarillo sees the highest concentration of workers commuting by transit, followed by a cluster around the Walmart and several schools, including St. Joseph Catholic Elementary School, Amarillo Montessori Academy, and Lamar Elementary School.
• Factor 9 – Homes of Workers with High School Education or Less: Homes of workers with lower education levels are concentrated on the outskirts of Amarillo, with higher levels shown on the edges of the City limits.
• Factor 10 – Work Sites of Workers with High School Education or Less: Work sites of people with lower education levels are concentrated in industrial areas of Amarillo, on the far east and west edges of town. Additionally, a concentration of work sites with workers that have lower education levels exists in Downtown Amarillo.
Factors 6 – 10 (Appendix A: Transportation Demand Analysis Maps) were individually analyzed with a percent rank function in Excel by block groups in Amarillo. The five factors were weighed evenly in the Likely Higher Active Transportation Use analysis. The likely higher active transportation use factors were then combined into an overall map, which is displayed on the following page in Figure TM-2.6. The analysis produced pockets of higher ranked block groups across Amarillo. Generally, southwest neighborhoods ranked lower than the rest of the city. However, outside of the southern neighborhoods, concentrations of higher likely active transportation use are scattered throughout the entirety of the city
City of Amarillo | Transportation Safety Action Plan

Figure TM-2.6. Likely Higher Active Transportation Use
Human and Built Environment Suitability
The Human and Built Environment analysis reviews characteristics of the built environment to identify areas of Amarillo where physical built characteristics would encourage higher active transportation usage. Three indicators were included in this analysis, including population density, household density, and average block size – all by block groups in Amarillo. Individual factor results are displayed in Figure TM-2.7. The data gathered for the Human and Built Environment analysis was retrieved from the Center for Neighborhood Technology’s (CNT) Housing + Transportation Index.

Figure TM-2.7 Human and Built Environment Factors
Full page maps of each indicator are found in Appendix A: Transportation Demand Analysis Maps. The results of each analyzed factor in the Human and Built Environment Suitability analysis are as follows:
• Factor 11 – Population Density: Population density in Amarillo is generally concentrated in the southwest neighborhoods of Amarillo, with pockets of high densities in north Amarillo as well.
• Factor 12 – Household Density: Household density follows the same patterns as population density. Southwest and northeast Amarillo are highlighted as concentrations of higher household density.
• Factor 13 – Average Block Size: Most of the City of Amarillo was assigned a very high ranking for average block size. Typical downtown gridded street blocks are 300’ by 300’, which is in alignment with Downtown Amarillo’s block sizes. This indicates that most block groups in Amarillo have smaller block sizes, which creates a safer, more connected environment for vulnerable roadway users such as pedestrians and cyclists.
The results of the Human and Built Environment Suitability analysis are displayed on the following page in Figure TM-2.8 (and individual map results displayed in Appendix A: Transportation Demand Analysis Maps). Land that is concentrated around Downtown Amarillo and along Interstate 27 gathered a higher ranking for this analysis. The further out from downtown one goes, the lower the ranking, generally. This is because street patterns near downtown are oriented in a gridded structure and have higher household and population densities, making these sidewalks more likely to be used.
more pleasant walking and biking environment, which can indicate where new improvements are needed most for vulnerable roadway users. This result aligns with the 3rd edition of TCRP Report 165: Transit Capacity and Quality of Service Manual (TCQSM). Density typically has a double effect on the demand for active transportation facilities: People are more likely to use active transportation facilities when they live in dense areas and there are more people near active transportation facilities service as density increases.

Figure TM-2.8. Human and Built Environment Suitability
Conclusion
Overall, transportation and active transportation investment would benefit neighborhoods that are closer to Downtown Amarillo, as seen through the hot spot analysis displayed below in Figure TM-2.9. A hot spot analysis was conducted in ArcGIS to identify statistically significant clusters of either high or low attribute values within a dataset. This analysis highlights areas in Amarillo where intense activity (hot spots) or relative scarcity (cold spots) in the results exist.
This information is beneficial for the SS4A Plan and can guide elected and appointed officials where new transportation investments are needed first. Ultimately, by combining all 13 factors, the results show that new transportation investments are needed most in neighborhoods that are surrounding Downtown Amarillo and north of Interstate 40 – almost all of central Amarillo.
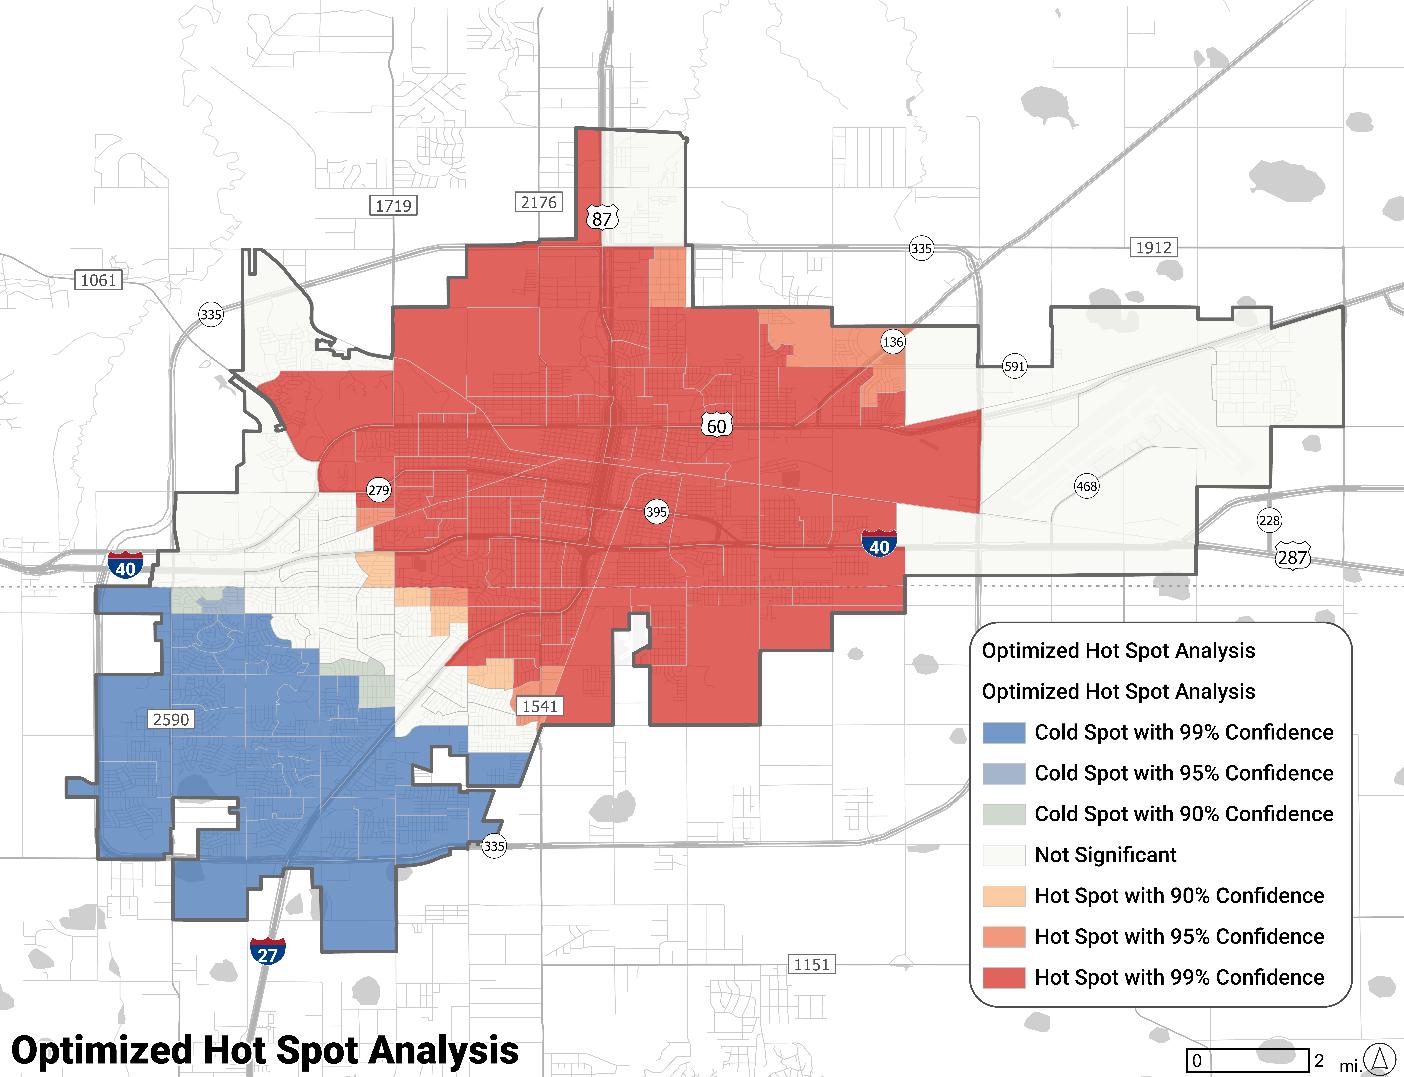
Figure TM-2.9 Optimized Hot Spot Analysis
Technical Memorandum 3: Plan Document Review
Introduction
This memo evaluates local, regional, and state transportation plans, as well as design standards for the City of Amarillo, to identify opportunities for improving the city's transportation network. Seven plans and five standards were reviewed, with a focus on how they align with the key goals of safety, mobility, and connectivity, emphasizing safety as the central priority. The review identifies strengths, gaps, and inconsistencies, offering insights into areas for enhancement within Amarillo’s transportation strategies. Table TM-3.1: Plan Review Summary lists all reviewed plans, Table TM-3.6: Summary of the Key Transportation Guide Reviewed outlines all reviewed guidelines, and Table TM-3.8. Pedestrian and Bike Design Infrastructure Design Standards Review Summary provides an overview of the pedestrian and bike related design standards.
The Plan Review section identifies consistencies and areas for improvement across various transportation plans, categorized into Plan Parallels and Plan Differences. Plan Parallels highlight shared goals like mobility, connectivity, infrastructure upgrades, transit options, active transportation, and technology integration. Plan Differences reveal gaps in funding strategies, safety prioritization, and pedestrian improvements, highlighting opportunities to better align Amarillo’s plans with its safety and active transportation objectives.
The Transportation Guidelines Review section highlights both strengths and areas for improvement in current plans, with a focus on recommendations for traffic calming, safe street design, and school zone safety. While the guidelines promote safety and connectivity, additional guidelines can provide clear direction for engineers when proposing and designing surface transportation projects
The Design Standards Review section assesses Amarillo’s details for sidewalks, bike lanes, and ADA ramps. While the city provides detailed standards for pedestrian infrastructure, there is a lack of local bike lane requirements. Amarillo’s sidewalk standards generally align with or exceed state and national guidelines; however, areas such as safety buffers and ADA ramps may benefit from incorporating additional best practices from state and national recommendations. Updating these standards could improve safety and accessibility across the city's transportation network.
Ultimately, the analysis serves as a foundational component for future strategic planning, providing recommendations that align with the broader goals of the Safe Streets and Roads for All (SS4A) Action Plan. The insights gained from this review aim to foster collaboration across agencies, ensuring Amarillo's transportation network evolves to meet the needs of all its residents, while promoting safety, connectivity, and accessibility
Plan Review
Summary
Reviewing existing local, regional, and state plans over the past decade is crucial for shaping Amarillo's future transportation and mobility network The Plan Review process includes an assessment of plans to identify where goals and recommendations align, as well as gaps or areas of inconsistencies By reviewing seven different plans (Table TM-3.1), the Safety aspect has been extracted into Plan Parallels and Plan Differences across various categories. Plan Parallels refer to the goals, objectives, and projects that consistently align across all the reviewed plans, sharing the same overarching goal of enhancing safety within the transportation network. As illustrated in Figure TM-3.1, Plan Parallels highlight six key areas where the reviewed plans consistently align: Mobility and Connectivity, Infrastructure Improvements, Transit Improvements, Active Transportation Network Enhancements, and Technology Integration. Plan Differences focus on three areas of gaps and inconsistencies among the plans, where priorities and strategies diverge: Active Transportation Safety Funding, Safety Prioritization, and Pedestrian Improvements. These categories provide a structured framework for further discussion and analysis.
While all plans share a commitment to safety, their priorities vary based on scope and focus. Some emphasize pedestrian and cyclist safety within urban areas, prioritizing walkability and connectivity, while others target traffic management, regional mobility, or highway safety. These differences reflect the varying contexts and user needs each plan addresses, highlighting the challenge of balancing diverse priorities across Amarillo’s transportation network.
The comprehensive review of these transportation plans would provide valuable insights into the shared objectives and distinct focuses aimed at improving Amarillo's transportation infrastructure. By synthesizing perspectives from these diverse plans, the Safe Streets and Roadways for All Plan (SS4A Plan) can strategically prioritize infrastructure improvements, enhance active transportation options, promote active transportation, and integrate advanced technologies. This collaborative effort ensures that future developments align with community needs, fostering a safer, more connected, and sustainable transportation network for all Amarillo residents.

Figure TM-3.1: Categorization of Safety Aspects from Reviewed Transportation Plans
Table TM-3.1: Plan Review Summary Plan
Amarillo City Transit Safety Plan
2020
City of Amarillo
Amarillo Area Regional Multimodal Mobility Plan
2021
Amarillo Area Metropolitan Planning Organization (Amarillo MPO)
Amarillo Metropolitan Transportation Plan 2020-2045
2022
Vision and Summary
This plan is a comprehensive framework designed to enhance the safety, reliability, efficiency, and cost-effective transportation service to the Amarillo community
The plan prioritizes the safety of the public, transit employees, and transit assets through risk mitigation, safety assurance, and continuous improvement efforts. 44
This plan is known as Amarillo Area in Motion (AAIM), and aims to create a safe, comfortable, and connected transportation network that leverages technology to deliver high-quality service for all users. This plan aims to develop an integrated system that efficiently connects roadways, public transit, biking, and walking, enhancing safety, accessibility, and sustainability to improve the quality of life for residents and foster economic growth. 45
The mission of this plan is to promote mobility and accessibility with an effective transportation system for people and goods in the Amarillo area. It aims to create a safe, efficient, multimodal network that minimizes impact on cultural, economic, and environmental resources, emphasizing alternate
44 City of Amarillo. (2020). Amarillo City Transit Safety Plan
45 Amarillo Area Metropolitan planning Organization (MPO). (2021). Amarillo Area Regional Multimodal Mobility Plan
Plan
Amarillo MPO
Regionally Coordinated Public Transportation Plan 2022-2026
2022
Panhandle Regional Planning Commission
Amarillo Area Metropolitan Planning Organization Unified Planning Work Program
2024
Amarillo MPO
City of Amarillo, Community Investment Program 2023/2024 –2027/2028
2024
City of Amarillo
City Plan Vision 2045
2024
City of Amarillo
Vision and Summary
transportation modes and maintaining existing facilities while meeting future needs 46
This plan for the Texas Panhandle envisions a future where public transportation services provide equal access to all residents, including seniors, people with disabilities, lowincome individuals, veterans, youth, and others in need. It seeks to improve access and promote transportation throughout the Panhandle by strategically coordinating all available resources. 47
This plan for the Amarillo MPO aims to create a safe, efficient, and sustainable transportation system that enhances residents' quality of life and promotes economic vitality. It aims to provide accessible and multimodal transportation options through collaborative planning and community engagement, ensuring the region's current and future transportation needs are met. 48
The program for the City of Amarillo represents a strategic commitment to enhancing public infrastructure and facilities over five years. Rooted in the City's Blueprint for Amarillo 49 initiative and supported by successive City Councils, this program outlines comprehensive investments in transportation, community planning, public safety, utilities, and information technology. It aims to support sustainable growth, enhance the urban environment, and align with community needs and priorities for a vibrant, resilient, and well-connected city. 50
The city’s Comprehensive Plan aims to help Amarillo anticipate and manage future changes in alignment with the community's preferences. It oversees growth, ensures predictability for developers, identifies infrastructure needs, and provides legal backing for ordinances. Incorporating community feedback, it reflects the collective vision for the future and articulates residents' goals. 51
46 Amarillo Area Metropolitan Planning Organization (MPO) (2022). Amarillo Metropolitan Transportation Plan 20202045.
47 Panhandle Regional Planning Commission. (2022). Regionally Coordinated Transportation Plan 2022-2026 https://www.tprompt.org/reports-plans/
48 Amarillo Area Metropolitan Planning Organization (MPO). (2024). Amarillo Metropolitan Planning Organization Unified Planning Work Program.
49 Amarillo Pioneer. (2018, March 16). New Blueprint for Amarillo to Be Approved by City Council Amarillo Pioneer https://www.amarillopioneer.com/blog/2018/3/16/new-blueprint-for-amarillo-to-be-approved-by-city-council
50 City of Amarillo. (2024). Community Investment Program 2023/24-2027/28
51 City of Amarillo. (2024). City Plan Vision 2045.
Plan Parallels
The reviewed transportation plans for Amarillo show many similarities in major goals and overall recommendations, reflecting a shared vision among local policymakers, stakeholders, and the public. The consistency across the reviewed plans highlights enduring priorities and objectives for enhancing mobility and connectivity within the city over time. Table TM-3.2 shows the comparison of various Amarillo plans across similar key improvement categories, highlighting the focus areas such as mobility and connectivity, infrastructure improvements, transit improvements, biking and walking improvements, and technology integration Each circle represents a dot indicating that the plan addresses the corresponding category, with all of these areas emphasizing safety as a fundamental component to ensure the well-being of residents and the efficient, safe movement of people
2020 City Transit Safety Plan
2021 Amarillo Regional Multimodal Mobility Plan
2020-2045 Amarillo Metropolitan Transportation Plan
2022 Regionally Coordinated Public Transportation Plan
2024 Amarillo MPO Unified Planning Work Program
2024 Community Investment Program
2045 City Plan Vision
Table TM-3.2: Comparison of Amarillo Plans Across Key Improvement Categories
Definition
1. Mobility and Connectivity
Mobility and connectivity refer to the ease and efficiency with which people can move throughout the transportation network. This category focuses on integrating different modes of transportation such as automobiles, public transit, biking, and walking to create seamless connections and improve accessibility 52. The goal is to reduce travel times and enhance the overall flow of movement within the community.
2. Infrastructure Improvements
Infrastructure improvements involve the enhancement of physical structures and facilities essential to the transportation system, such as roads, bridges, sidewalks, and traffic signals 53 . This category emphasizes maintaining and upgrading these assets to ensure a safe, efficient, and sustainable transportation environment.
3. Transit Improvements
Transit improvements focus on enhancing public transportation systems, including buses 54. This may involve expanding routes, increasing service frequency, upgrading transit stations, and improving the overall rider experience and operational efficiency.
4. Active Transportation Network Enhancements
This category includes efforts to support non-motorized forms of travel, such as walking, biking, and scootering. Enhancements may involve the construction of bike lanes, and pedestrian pathways to promote safer, healthier, and more sustainable transportation options for residents 55 .
5. Technology Integration
Technology integration refers to the use of innovative technologies to improve transportation management, efficiency, and safety 56. These technologies help optimize the transportation network and enhance user experience.
Mobility and Connectivity
Many of Amarillo's transportation plans share a common goal of improving safety, connectivity, and mobility. Each plan addresses safety, whether through congestion reduction, pedestrian and transit improvements, or infrastructure updates.
For example, the 2045 City Plan Vision provides a long-term roadmap for Amarillo’s transportation system, targeting congestion reduction, pedestrian safety, and increased accessibility. It emphasizes creating connections between neighborhoods, schools, parks, major
52 Amarillo Metropolitan Planning Organization. (2022). Amarillo Metropolitan Transportation Plan 2020-2045.
53 Amarillo Metropolitan Planning Organization. (2022). Amarillo Metropolitan Transportation Plan 2020-2045.
54 City of Amarillo. (2020). Amarillo City Transit Safety Plan.
55 Amarillo Area Metropolitan planning Organization (MPO). (2021). Amarillo Area Regional Multimodal Mobility Plan
56 Amarillo Area Metropolitan planning Organization (MPO). (2021). Amarillo Area Regional Multimodal Mobility Plan
intersections, and within commercial and mixed-use areas to foster a more livable and inclusive community. Figure TM-3.2 illustrated how an underutilized alley could be transformed into an activated walkway with opportunities for public art, increased tree canopy, and retrofitted commercial spaces.

The 2020 City Transit Safety Plan outlines strategies and initiatives to improve the safety, efficiency, and accessibility of the city's transit system It aims to create a safe and efficient transit system by regularly updating the Safety Management System and conducting community outreach programs to raise awareness about transit safety, promoting greater community involvement.
The 2024 Amarillo MPO Unified Planning Work Program aims to improve the connectivity of various transportation modes. It focuses on maintaining and updating the 2020-2045 Amarillo Metropolitan Transportation Plan to ensure a well-connected and reliable transportation network.
The 2020-2045 Metropolitan Transportation Plan highlights the collective responsibility of local authorities, citizens, and businesses to enhance the transportation network's safety and efficiency through targeted safety strategies.
The 2021 Amarillo Regional Multimodal Mobility Plan prioritizes safety and connectivity. The 2021 Amarillo Regional Multimodal Mobility Plan focuses on creating a cohesive mobility network, reducing congestion, and improving pedestrian safety and walkability, particularly at major intersections as mentioned in Figure TM-3.3. The plan also recommends enhanced
57 City of Amarillo. (2024). 2045 City plan vision.
Figure TM-3.2 Future Activated Walkway Illustration 57
connectivity to parks and schools with specific projects like improvements for John Stiff Park, Thompson Park, Amarillo High School, and West Plains High School. Additionally, it also emphasizes accessibility improvements and diverse transportation choices.

Figure TM-3.3: Intersection Safety Recommendation Matrix 58
58 City of Amarillo. (2021). Amarillo Area Regional Multimodal Mobility Plan.

From June 2020 to January 2021, the public feedback initiative gathered user comments on mobility, focusing on eight categories: new road connections, bicycle routes, sidewalks, transit stops, roadway safety, congestion, intersection issues, and other concerns. Survey results, depicted in Figure TM-3.4 underscored the community's emphasis on improvements across these areas. Notably, 68% of respondents prioritized safety, highlighting the necessity for a safer and more connected transportation network for all users
Figure TM-3.4. All Social Pinpoint Map Survey Comments 59
59 City of Amarillo. (2021). Amarillo Area Regional Multimodal Mobility Plan.
Infrastructure Improvements
The infrastructure improvements across various Amarillo plans showcase a concerted effort to enhance the transportation network for all roadway users. Each plan emphasizes upgrades across roadways, sidewalks, and multimodal systems to improve connectivity for pedestrians, cyclists, and motorists.
The 2045 City Plan Vision emphasizes complete streets principles, targeting upgrades to accommodate all modes of transportation. Priority areas include 34th, 45th, and Hillside Avenues, along with improving north-south connections across I-40 and addressing limited crossing opportunities on major roadways like Hastings Avenue, Amarillo Boulevard, and Soncy Road. The plan mandates sidewalk improvements during infill and redevelopment, maintaining a sidewalk gap inventory, and prioritizing equitable improvements, particularly in East and North Amarillo. It also highlights the need for updated regulations to ensure infrastructure improvements align with community needs. Figure TM-3.5 illustrates these priority mobility improvements. The plan also calls for updated regulations to mandate sidewalk improvements during infill and redevelopment, maintaining a sidewalk gap inventory, and ensuring equitable improvements, especially in East and North Amarillo.

Figure TM-3.5: Priority Mobility Improvements 60
60 City of Amarillo. (2024). 2045 City plan vision.
The 2024 Amarillo MPO Unified Planning Work Program takes a comprehensive approach to short-range urban transportation improvements. It addresses infrastructure improvements through a comprehensive approach that includes updating the Transportation Improvement Program (TIP) and the Metropolitan Transportation Plan (MTP). It focuses on assessing existing infrastructure conditions, identifying deficiencies, and planning necessary upgrades and new projects. The UPWP emphasizes community engagement to ensure that infrastructure developments align with resident needs and coordinates with various agencies to integrate improvements into a cohesive regional transportation network. This approach aims to enhance the efficiency, effectiveness, and overall quality of the region's transportation infrastructure
The 2020-2045 Amarillo Metropolitan Transportation Plan outlines specific projects for roadways, bicycle, pedestrian, and transit infrastructure, including multi-use roadways, SRTS (Safe Routes to School) projects, and maintaining the transit network in a State of Good Repair. Infrastructure improvements planned for various transportation modes are as follows:
• Roadway Infrastructure:
o Multi-use roadway encircling the city with two to six lanes, serving local, regional, and freight traffic. Includes operational enhancements such as signing, signalization, and striping for improved mobility.
o Multiple upgrade projects of 4-lane arterial with center left lane at Bell St, Sundown Ln, S Georgia St, Tradewind St and Grand St.
• Bicycle Infrastructure:
o A project that ties bicycle and pedestrian trails to the transit transfer station in the Central Business District (CBD), connecting to existing trails of the regional hospital district
o SRTS Projects: Creation of safer and fully accessible crossings, walkways, trails, and bikeways surrounding schools to reduce speeds and potential conflicts with motor vehicle traffic.
• Pedestrian Infrastructure:
o Identifying and addressing deficiencies and gaps in the pedestrian network and enhance safety with improved intersection access and median crossings.
o SRTS Projects: Sidewalk projects to improve pedestrian safety and accessibility near schools, including specific sidewalk projects on NE 15th Ave, NE 24th Ave, and N Coulter St
• Transit Infrastructure:
o Adoption of a Transit Asset Management Plan (TAM) to maintain the transit network in a State of Good Repair (SGR) by using the condition of assets to prioritize funding.
The 2021 Amarillo Regional Multimodal Mobility Plan further details improvements across all modes, such as widening projects on FM 1541, FM 2186, and FM 2590 for roadways, expanding the bicycle network, and enhancing pedestrian safety with mid-block crossings and pedestrian hybrid beacons. Collectively, these plans aim to create a more connected, safe, and
efficient transportation system for the Amarillo community. Detailed infrastructure improvements planned for various transportation modes are as follows:
• Roadway Infrastructure:
o Development of a well-connected thoroughfare network, including updates to the thoroughfare plan, and specific widening projects on FM 1541, FM 2186, and FM 2590 to enhance multimodal facilities and safety.
• Bicycle Infrastructure:
o Expansion and integration of the bicycle network, including projects such as onstreet bicycle lanes and enhanced streetscaping on 4th Avenue and 6th Avenue, comfortable bicycle facilities on NE 15th Avenue/NE 16th Avenue, continuous sidewalks on Western Street, extending the Rock Island Rail Trail into downtown Amarillo, and separated bicycle lanes on Russell Long Blvd at West Texas A&M’s campus
• Pedestrian Infrastructure:
o Priority sidewalk gap projects, pedestrian focus areas with site-level plans, midblock crossings, pedestrian hybrid beacons, curb ramps, crossing islands, and enhanced street lighting for pedestrian safety. Notable projects include improvements around Palo Duro High School, E Amarillo Blvd from Hughes to Ridgemere, and Coulter Rd from 45th Ave to Hillside Rd. Figure TM-3.6 shows an example of a selected pedestrian focus area near Palo Duro High School.

• Transit Infrastructure:
o Proposed additional transit routes connecting Downtown Amarillo to WTAMU campus and Rick Husband Airport, targeted transit stop improvements, bike rack installation at high-use bus stops, and bus shelter replacements within the ACT network.
Transit Improvements
The transit improvement plans for Amarillo collectively aim to enhance public transportation accessibility and efficiency. Each plan emphasizes improvements in transit infrastructure and services to better serve the community, especially underserved populations.
The 2020 Amarillo City Transit Safety Plan focuses on a Safety Management System for passengers, employees, and equipment and efficiency of the city's transit system by establishing and maintaining a Safety Management System Policy. This includes upgrading transit infrastructure, expanding and improving bus routes, and enhancing the condition and
Figure TM-3.6. Example of Pedestrian Focus Areas – Palo Duro High School 61
61 City of Amarillo. (2021). Amarillo Area Regional Multimodal Mobility Plan.
accessibility of bus stops. Safety measures are implemented to protect passengers and operators, supported by regular safety audits, risk mitigation strategies, and community outreach to raise awareness about transit safety. This approach ensures the system is reliable and user-friendly for all residents, with incident review boards and data-driven safety improvements
The 2024 Amarillo MPO’s Unified Planning Work Program assists in expanding fixed-route transit systems, evaluating transit services for underserved populations, and conducting ridership studies. Safety planning for transit passengers and reviewing services for underserved populations, including low-income, minority, elderly, and disabled individuals, are key components as well. The MPO also conducts transit ridership studies to identify system deficiencies and assess customer needs. Additionally, the MPO actively participates in regional public transportation planning through the Panhandle Regional Organization to Maximize Public Transportation (PROMPT), promoting job accessibility and public transportation access for the elderly and disabled.

Similarly, the 2020-2045 Amarillo Metropolitan Transportation Plan emphasizes safety through comprehensive planning and improved transit routes and stops. The plan targets safety concerns for underserved populations such as low-income, minority, elderly, and disabled individuals.
The 2024 Community Investment Program, in partnership with the Federal Transit Administration (FTA) and Texas Department of Transportation (TxDOT) is a comprehensive initiative aimed at enhancing public transportation accessibility. This program prioritizes ADAcompliant upgrades to bus stop facilities, ensuring that stops are accessible to all users, including those with disabilities. Supported by a $1.8 million five-year initiative, outlined in Table TM-3.3, the program aims to improve infrastructure and enhance safety across the city’s transit network.
Figure TM-3.7. The Panhandle Regional Organization to Maximize Public Transportation (PROMPT) Committee
Table TM-3.3: Transit Fixed route Projects from the City of Amarillo, Community Investment Program
Project Name Description Locations
Establish ADA Concrete Pads for Transit Stops
ADA concrete pads put in place for future ACT stops (bench/shelter capabilities).
Dixie and Plains, (3) W. Amarillo Blvd. locations, (2) locations at Evergreen St. (Eastridge), (2) locations at S. Arthur St, N. Spring St. (Catholic Charities), Ross St. & 14th (T Anchor), 10th and Grand, S.E. 20th Ave. & S. Lincoln St., 34th and Osage St. (2), Amarillo Blvd. & Evergreen St. (Est), and 45th and Teckla (2)
FY 2024/2025
$700,000
Transit Route 4142 Bus Stop Infrastructure Improvements
Transit bus stop shelter and infrastructure investment.
E 22nd and Washington (AC), Social Security office (I27), Walmart (I27), ADVO (Washington), OB AC stop
FY 2025/2026
$400,000
Bike Rack Project
Bus Shelter Replacement
Install bike racks at high use bus stops.
NE 24th Ave & N Seminole St (Happy State), Jason Ave & Palm St (United Supermarket), 19th and Grand St, Ross St and 14th Ave (T Anchor), 6th and S Carolina St, Hobbs Rd & Olsen Blvd, SW 45th Ave & Teckla Blvd, 34th Ave and Danvers, Westgate Mall, Wallace Blvd (Texas Panhandle Centers)
FY 2026/2027
$350,000
Replacing outdated shelters within the ACT network with new, up-todate shelters.
Various locations within the ACT network
FY 2027/2028
$ 350,000
Table TM-3.4 outlines the projects identified by the Panhandle Regional Organization to Maximize Public Transportation (PROMPT) Board in the Regionally Coordination Public Transportation Plan for potential future funding. These initiatives are intended for implementation as funding becomes available. While the projects are listed, they are not prioritized, ensuring flexibility in addressing the most pressing needs as opportunities arise.
Table TM-3.4: Future Transportation Initiatives Identified by the PROMPT Board in the Regionally Coordination Public Transportation Plan 62 Project
2 Research Regional Mass Commuter Program
3
Pilot Program for Transportation to and from WT’s Harrington Academic Hall and Canyon Campus
4 Pilot Program for Return to Home Services after Hospitalization
5 Design of New Routes for Direct Service to Priority Populations
6 Design Service Routes to Multiple Counties
8 Increase Outreach to Priority Populations Regarding Transit Options
9 Establish a Regional Mobility Management Program
11 Taxi Voucher Program Pilot Project
Study feasibility of commuter services to support workforce in manufacturing, agriculture, logistics, etc., increasing transportation access for priority populations.
Explore and launch pilot program for mass commuter bus route between West Texas AM University’s (WTAMU) Canyon Campus and Harrington Academic Hall to manage traffic congestion and increase access.
Initiate program to coordinate transportation for discharged hospital patients back to rural areas, ensuring equitable access for low-income and elderly patients.
Study and design new routes to increase access to high-growth areas for priority populations, focusing on underserved regions in Amarillo
Plan regular service routes to communities with high pickup volumes, improving efficiency and coordination between rural and urban transit providers.
Extend public information campaign, establish social media presence, network with health and human service agencies to raise awareness of transit options.
Re-establish a mobility management program to assess community needs and connect resources to transit providers, coordinating services and meeting transit needs.
Design and pilot a taxi voucher program with Amarillo City Transit to provide flexible transportation for same-day service needs, especially for dialysis patients.
Panhandle Transit, WTAMU
Amarillo City Transit
Panhandle Transit
PRPC, Amarillo City Transit
62 Panhandle Regional Planning Commission. (n.d.). Regionally Coordinated Public Transportation Plan 2022-2026. Retrieved from https://drive.google.com/file/d/1b_SN0KcNmZDF1zn8os5jK3nh3Sa4CSdp/view
Active Transportation Network Enhancements
The plans across Amarillo emphasize significant investments in walking and biking infrastructure, demonstrating a shared commitment to promoting active transportation. The 2045 City Plan Vision aims to improve pedestrian safety and walkability at major intersections, enhance sidewalk connectivity within commercial and mixed-use areas, and prioritize sidewalks connecting parks and schools. This includes developing an inventory of traffic signal pedestrian elements, establishing sidewalk maintenance schedules, creating funding programs for sidewalk improvements, and formulating a prioritization plan for sidewalk illumination. Additionally, the plan emphasizes the need to collect before and after data on traffic volumes, speeds, and pedestrian/bike activity Sidewalks and multi-use pathways are created to offer pedestrians maximum comfort, with local streets safely accommodating both cars and cyclists. Heavier traffic streets will include designated bike facilities, like the separated bike lanes detailed in the Neighborhood Mixed Use section, to promote safe and efficient transportation for everyone.
The 2020 City Transit Safety Plan sets specific safety targets for fatalities, injuries, and safety events involving pedestrians and cyclists per million revenue miles and measures system reliability by the distance between mechanical failures impacting these users. Amarillo City Transit coordinates with the MPO and state to align these targets and commits to continuous safety improvement through proactive hazard reporting and employee training focused on safety
The 2020-2045 Amarillo Metropolitan Transportation Plan has enhanced the active transportation network by adopting the Amarillo Hike and Bike Plan, updating the Comprehensive Plan, and integrating bike and pedestrian facilities into the Parks Master Plan. Key projects include the Rock Island Rail Trail, which links trails to transit and the hospital district, and the installation of numerous ADA-compliant ramps. Additionally, Amarillo mandates the installation of sidewalks and ramps in new developments to ensure the inclusion of pedestrian facilities, while the MPO continues to support projects that promote walking and bicycling as viable transportation options.
The 2024 Amarillo MPO Unified Planning Work Program supports these objectives by incorporating these elements into its broader transportation planning efforts. The UPWP outlines activities aimed at expanding and refining pedestrian and bicycle facilities as part of the MTP and TIP. This includes collecting active transportation data, evaluating system performance, conducting studies to assess existing conditions and identifying gaps, and promoting active transportation through public outreach and stakeholder collaboration.
The Amarillo Area Regional Multimodal Mobility Plan strongly emphasizes walking and biking improvements. Key recommendations include:
• Bicycle Network Enhancements: Upgrades to the existing bicycle network and creation of new connections to form loops and link major destinations. Facility types include side paths on arterial roads, on-street bicycle lanes on lower-speed roads, and bicycle routes on local streets as shown in Figure TM-3.8.

Figure TM-3.8: Proposed Bicycle Network 63
63 City of Amarillo. (2021). Amarillo Area Regional Multimodal Mobility Plan.
• Sidewalk Gap Prioritization: Identification and prioritization of sidewalk gaps in Amarillo and Canyon, categorizing them into three priority tiers based on specific criteria as depicted in Figure TM-3.9

• Pedestrian Focus Areas: Areas with the highest need for pedestrian improvements, such as the Palo Duro High School Neighborhood, E Amarillo Blvd, Carver Elementary School Neighborhood, Washington St, Coulter Rd, and Hillside Rd, as illustrated in Figure TM-3.10
Figure TM-3.9: Sidewalk Gap Prioritization Results 64
64 City of Amarillo. (2021). Amarillo Area Regional Multimodal Mobility Plan.
City of Amarillo | Transportation Safety Action Plan

Both the 2020-2045 Amarillo Metropolitan Transportation Plan and the 2021 Amarillo Regional Multimodal Mobility Plan emphasize the importance of Safe Routes to School (SRTS) projects as a means to enhance pedestrian and cyclist safety, improve connectivity to key destinations like schools and parks, and promote active transportation for students. These projects are designed to create safer, more accessible walking and biking routes for children, while fostering community engagement and educational initiatives. Community engagement is pivotal, fostering collaboration among parents, schools, and local authorities to support and maintain safe routes throughout Amarillo. Additionally, both plans integrate Complete Streets principles, as outlined in the Transportation Guidelines Review section, to ensure that streets are safe and usable
65
Figure TM-3.10: Pedestrian Focus Area Locations 65
City of Amarillo. (2021). Amarillo Area Regional Multimodal Mobility Plan.
for all travel modes, while encouraging mixed-use developments that support walkability and local accessibility. By prioritizing sidewalk gaps, bicycle network upgrades, and pedestrianfocused improvements, these plans aim to create a safer, more connected transportation environment for Amarillo's residents.
Technology Integration
The 2045 City Plan Vision and the 2020-2045 Amarillo Metropolitan Transportation Plan both emphasize integrating technology to enhance transportation efficiency and safety. The 2045 City Plan Vision advocates data-driven approaches to mobility improvements, adopting Safe Streets and Roads for All policies, and ensuring context-sensitive design that aligns with adjacent land use. The plan also recommends modifying street standards to include more pedestrian curb cuts and incorporating traffic calming measures in street retrofits.
The 2020 City Transit Safety Plan utilizes data from risk management to identify safety issues, such as types and causes of injuries and their occurrence times, to make informed safety and operational decisions. Similarly, the 2024 Amarillo MPO Unified Planning Work Program highlights the importance of data development and maintenance which includes managing Geographic Information System (GIS) databases and performance measures for more efficient infrastructure and service improvements.
The 2021 Amarillo Regional Multimodal Mobility Plan recommends integrating emerging technologies to optimize traffic operations and enhance safety measures. This includes installing Pedestrian Hybrid Beacons (PHBs) as advanced crossing signals and upgrading existing traffic signals.
The 2020-2045 Amarillo Metropolitan Transportation Plan also focuses on technology integration through advanced traffic signal systems and radar detection technology at intersections. These technologies are designed to improve traffic flow, enhance safety, and accommodate future growth in the region.
The 2024 Community Investment Program allocates $2.5 million over five years for the City of Amarillo’s IT strategy. This investment is designed to enhance the city’s technological infrastructure, advancing efficiency, transparency, and collaboration in local governance. By leveraging modern digital tools, the strategy aims to improve community services and increase citizen engagement, positioning technology as a key driver of innovation and effective governance.
All the reviewed plans emphasize technology integration to enhance transportation efficiency and safety. Table TM-3.5 illustrates the key strategies each plan employs for incorporating advanced technologies.
Table TM-3.5: Technology Integration Strategies Summary
2045 City Plan Vision
2020 City Transit Safety Plan
2024 Amarillo MPO
Unified Planning Work Program
2021 Amarillo Regional Multimodal Mobility Plan
2020-2045 Amarillo
Metropolitan Transportation Plan
2024 Community Investment Program
Data-driven mobility improvements
Data-driven safety decisions
Data and GIS management
Emerging technologies for Traffic operations
Traffic signal systems
Investment in advanced IT infrastructure
Vision Zero policies, context-sensitive design, traffic calming measures
Use of Risk Management data, informed safety and operational decisions
Management of GIS databases, performance measures
Installation of Pedestrian Hybrid Beacons (PHBs), advanced traffic and crossing signals
Advanced traffic signal systems, radar detection technology
Enhance IT capabilities for efficient operations, greater transparency, and improved citizen engagement
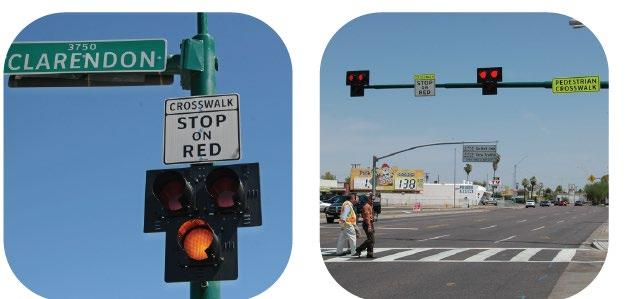
Plan Differences
Overall, the visions and goals across the reviewed Amarillo transportation plans show strong alignment, as evidenced by the numerous areas of agreement identified in the Plan Parallels section. While there are some technical differences in funding allocations and project
66 Amarillo Area Metropolitan Planning Organization (MPO). (2021). Amarillo Area Regional Multimodal Mobility Plan
The Bicycle and Pedestrian Toolbox. pg. 25
Figure TM-3.11. Pedestrian Hybrid Beacon 66
preferences, safety prioritization varies across the plans. Some plans focus on pedestrian and cyclist safety on city streets, while others address traffic management and overall roadway safety, and some emphasize non-city streets such as highways, interstates, or other freight corridors. Despite these differences, the plans collectively aim to create a safer, more balanced transportation network for the region.
Definitions
1. Funding Allocation
Funding allocation involves the strategic distribution of financial resources to various transportation projects. This category focuses on how budgets are prioritized for different initiatives for safety enhancements.
2. Safety Prioritization
Safety prioritization emphasizes the implementation of measures to protect all roadway users, including drivers, cyclists, and pedestrians.
3. Pedestrian Improvements
Pedestrian improvements focus on enhancing the walking environment to ensure safety and accessibility. This includes developing better sidewalks, adding crosswalks, and designing pedestrian-friendly intersections.
Active Transportation Safety Funding
The goals and actions across Amarillo's transportation plans show a focus on safety and active transportation, but some inconsistencies exist when comparing the stated goals to actual funding practices. Current funding strategies mainly focus on road projects, such as resurfacing and reconstruction, leaving pedestrian and bicycle infrastructure with relatively less investment. To achieve safety for all roadway users, a more balanced distribution of resources across all travel modes is recommended.
The 2021 Regional Multimodal Mobility Plan envisions “a safe, comfortable, and connected multimodal transportation network” and includes a specific action to increase sidewalk funding in the medium term. Similarly, the 2045 City Vision Plan identifies several active transportation and safety-related goals, including ensuring pedestrian safety at major intersections, improving sidewalk connectivity within commercial areas and to parks and schools, and developing standards that emphasize pedestrian safety and mobility. These objectives underscore the importance of active transportation within the city’s long-term vision.
However, current funding allocation criteria within the Capital Improvement Program (CIP) focus primarily on pavement data, with no specified consideration of crash data or pedestrian or bicycle infrastructure needs. For example, the streets budget is divided approximately into thirds for growth (new capacity), maintenance (smaller scale work), and Rehabilitation/Repair/ Replacement (RRR). Prioritization for reconstruction projects relies on the Pavement Condition Index (PCI), based on 2017 data, which does not account for safety or connectivity for active transportation.
The CIP budget also reflects broader infrastructure challenges. While streets receive the largest allocation of funds, they also face the highest unfunded amount, with the total funded amount estimated to be only one-tenth of what is needed. This funding gap, driven by inflation in construction costs and the deteriorated condition of many roadways, necessitates prioritizing maintenance and reconstruction. However, the absence of strategy to integrate pedestrian and bicycle safety into these priorities limits the city’s ability to fully align with the goals outlined in its transportation plans.

To better support Amarillo’s transportation goals, the CIP could incorporate additional criteria addressing pedestrian and bicycle infrastructure needs. Exploring external funding sources, such as grants from the Federal Highway Administration (FHWA), Texas Department of Transportation (TxDOT), or the Metropolitan Planning Organization (MPO), could also help expand resources for active transportation projects. These adjustments would enhance Amarillo’s ability to create a safer, more connected transportation network for all roadway users.
Safety Prioritization
The safety prioritization across Amarillo’s transportation plans varies based on their scope and focus, with the 2045 City Vision Plan emphasizing pedestrian and cyclist safety in specific city areas, and the 2020-2045 Amarillo Metropolitan Transportation Plan focusing on a hierarchical road system to manage traffic and growth. The 2021 Regional Multimodal Mobility Plan integrates regional and city networks with a focus on business highways, farmers-to-market roads, and other freight corridors. These differences are expected due to the varied levels of the plans, but together they create a cohesive approach to enhancing safety across the region. Details include:
The 2045 City Vision Plan prioritizes safety and focuses on improving specific roadways identified by the City Plan Stakeholder Committee and public input. Key streets include 10th and 15th Avenues, Coulter Street, Bell Street, and 34th Avenue, with planned improvements such
67 City of Amarillo. (2024). 2045 City plan vision.
Figure TM-3.12: Street Budget 67
as adding signals, medians, and pedestrian enhancements. Specific areas like Amarillo High School, Amarillo College, and connections to downtown and parks also received attention. These improvements aim to enhance safety for pedestrians, cyclists, and drivers in high-traffic and community-focused areas across the city.
The 2020-2045 Amarillo Metropolitan Transportation Plan outlines a detailed hierarchy of roadways, primarily focusing on highways rather than specific city areas. Freeways, such as Interstates 40, 27, and US 87/287, are high-capacity roads with grade-separated intersections and limited access, designed for fast-moving traffic. Expressways, like Loop 335, share similar characteristics but often have at-grade intersections and may include frontage roads. Arterial streets, such as Bell and 45th Avenues, serve major traffic corridors with four to six lanes and restricted access. Minor arterials and collector streets accommodate lower volumes and connect local streets to major routes, with lower speed limits and more direct access. Local streets, designed for residential areas, have narrower rights-of-way and lower traffic speeds, creating safer environments for pedestrians and local travel. Each roadway classification plays a crucial role in supporting the city's growth and mobility needs, with a focus on balancing vehicle capacity, safety, and access.
The 2021 Amarillo Regional Multimodal Mobility Plan focuses on developing a comprehensive road network that integrates both the City of Amarillo and the City of Canyon into a unified system. It emphasizes expanding the existing grid street network, improving rural road infrastructure, and establishing a clearer hierarchy for arterial roads, with primary and secondary classifications to better prioritize future projects. Special attention is given to regional connectivity, particularly in growth areas like Randall County, while also addressing safety improvements by eliminating dangerous 90-degree bends on rural roads.
Pedestrian Improvements
The 2021 Regional Multimodal Mobility Plan and the 2045 City Vision Plan reflect differing priorities and approaches to transportation projects in Amarillo, particularly regarding pedestrian improvements. While both plans address various projects within the city limits, their focus areas and scopes highlight unique strategies for meeting the city’s transportation needs.
• Coulter Street: Both plans address Coulter Street, but with different emphases. The 2045 City Vision Plan prioritizes connections from 34th Street into nearby neighborhoods and plans links between 9th and Tascosa Road. In contrast, the 2021 Regional Multimodal Mobility Plan focuses on improving pedestrian infrastructure along Coulter Road from 45th to Hillside.
• Washington Street: The 2021 Regional Multimodal Mobility Plan highlights improvements on Washington Street from 10th to Wolflin to enhance pedestrian safety, while the 2045 City Vision Plan does not address this corridor. Conversely, Plains Boulevard, another key route, is absent from the 2021 Regional Multimodal Mobility Plan.
• School Safety: The 2021 Regional Multimodal Mobility Plan emphasizes pedestrian safety around schools, targeting projects near Palo Duro High School and Carver
Elementary to improve crossings and build sidewalks. In contrast, the 2045 City Vision Plan extends its focus beyond specific corridors, emphasizing connectivity to downtown, major landmarks like the Botanic Gardens, Medi Park, and Thompson Park, as well as pedestrian infrastructure improvements around Amarillo College.
These distinctions illustrate the different priorities of the two plans: the 2021 Regional Multimodal Mobility Plan prioritizes localized pedestrian safety and targeted corridor improvements, while the 2045 City Vision Plan takes a broader approach, emphasizing citywide connectivity and enhancing access to cultural and recreational destinations.
Transportation Guidelines Review
This section evaluates key areas of practice from Amarillo’s transportation plans, highlighting their contributions to safety, connectivity, and multimodal goals. To complement this review, results from a public online survey conducted as part of the Amarillo Safe Streets and Roads for All (SS4A) Plan are integrated into this section. This survey provides valuable insight into community priorities and preferences for safety improvements, aligning directly with policyfocused objectives of the reviewed plans. By considering both plan-based guidance and public input, this section identifies opportunities to refine transportation guidelines that better address Amarillo's safety and active transportation needs.
Table TM-3.6 provides a concise summary of key transportation practice areas reviewed from the relevant plans. It outlines the purpose, aspects reviewed, and main findings, highlighting both the strengths and areas for improvement in creating a safe, connected, and multimodal transportation network.
Table TM-3.6: Summary of the Key Transportation Guide Reviewed
Practice Areas Plans
Complete Street
2021 Amarillo Regional Multimodal Mobility Plan, 2024 MPO Unified Planning Work Program, 2045 City Vision
Purpose
Aspects Reviewed Main Findings
Strengths:
To enhance safety, connectivity, and access for all travel modes.
Safety, Connectivity, Multimodal planning, Regional Accessibility.
Pedestrian Facilities
2021 Amarillo Regional Multimodal Mobility Plan, 2020-2045 Amarillo
Metropolitan Transportation Plan
To improve pedestrian infrastructure and safety, promote active travel, and ensure ADA compliance.
Sidewalks, Crosswalks, ADA compliance, Traffic calming, Signalized intersections, Mid-block crossings.
Strong focus on safety and accessibility across jurisdictions.
Areas for improvement: Lack of specific timelines and funding clarity for implementation.
Strength: Comprehensive pedestrian improvements with ADA compliance focus.
Area for improvement: Inconsistent maintenance funding and insufficient focus on high-density pedestrian areas.
Bike Facilities
2021 Amarillo Regional Multimodal Mobility Plan, 2020-2045 Amarillo
Metropolitan Transportation Plan
To provide safe, designated spaces and promote bicycling as a viable mode of transportation.
Shared lanes, Bike lanes, Cycle tracks, Bike signals, Bike parking, Off-road trails.
Strength: Extensive network for bicycle facilities.
Area for improvement: Insufficient bike parking and lack of bike protection in high-traffic areas.
Shared Use Facilities
2021 Amarillo Regional Multimodal Mobility Plan, 2020-2045 Amarillo
Metropolitan Transportation Plan
To create facilities that cater to both bicyclists and pedestrians, enhancing connectivity and safety.
Shared-use paths, Side paths, Trails, Paved shoulders.
Strength: Safe, physically separated spaces for nonmotorized users.
Area for improvement: Limited shared-use facility network in suburban areas.
Practice Areas Plans
Access Management
2021 Amarillo Regional Multimodal Mobility Plan
Purpose Aspects Reviewed
To control access points in high-demand areas and improve safety for all users.
Driveway consolidation, Safe turning lanes, Raised medians, Roundabouts.
Main Findings
Strength: Reduces conflicts between vehicles, pedestrians, and bicyclists.
Area for improvement: Some measures may reduce accessibility for businesses.
Traffic Calming
2021 Amarillo Regional Multimodal Mobility Plan
Signage & Wayfinding
2021 Amarillo Regional Multimodal Mobility Plan, 2045 City Vision
To encourage safer driving behavior through street design rather than relying on signals and signs.
Speed humps, Chicanes, Traffic circles, Pinch points.
Strength: Effective at reducing vehicle speeds in key areas.
Area for improvement: May impact emergency vehicle response times.
Mid-Block Crossings
2021 Amarillo Regional Multimodal Mobility Plan
To improve navigation and enhance the aesthetics of key areas, including historic districts.
Wayfinding signage, Trail markers, Branding, Historic signage restoration.
Strength: Enhances user experience and supports cultural heritage.
Area for improvement: Limited focus on integrating digital wayfinding solutions.
To improve pedestrian safety and connectivity between intersections in high-demand areas.
High-visibility markings, Lighting, Pedestrian priority signage.
Strength: Improves pedestrian connectivity and safety.
Area for improvement: Enforcement of pedestrian priority
Existing
Complete Street
The 2021 Amarillo Regional Multimodal Mobility Plan, the 2024 MPO Unified Planning Work Program, and 2045 City Vision each prioritize the incorporation of Complete Streets principles. The 2021 Amarillo Regional Multimodal Mobility Plan focuses on safety and connectivity, ensuring streets cater to all modes of travel. The 2024 MPO Unified Planning Work Program emphasizes creating a safe, accessible transportation network through regional multimodal planning and safe, accessible transportation options. 2045 City Vision commits to integrating Complete Streets principles across all jurisdictions, aiming to provide an equitable and safe transportation network for travelers of all ages and abilities. Together, these plans strive to create a comprehensive, inclusive transportation system for the region.
Pedestrian Facilities
The Bicycle and Pedestrian Toolbox 68 found in the 2021 Amarillo Regional Multimodal Mobility Plan highlights pedestrian facilities such as sidewalks, pedestrian-only streets, marked crosswalks, mid-block crossings, curb ramps, crossing islands, signalized intersections, pedestrian hybrid beacons, and rectangular rapid flashing beacons (RRFBs). Additionally, elements such as street furniture, shade, lighting, and curb extensions improve the pedestrian environment by offering rest areas, enhanced visibility, and shorter crossing distances. Collectively, these facilities can create a safer and more comfortable pedestrian network, encouraging walking and active transportation within the community.
The 2020-2045 Amarillo Metropolitan Transportation Plan includes discussions around sidewalks, walkways, curb ramps, traffic calming measures, off-road trails, pedestrian bridges and underpasses, and ensures ADA compliance.

Figure TM-3.13: Pedestrian Facilities 69
68 Amarillo Area Metropolitan planning Organization (MPO). (2021). Amarillo Area Regional Multimodal Mobility Plan The Bicycle and Pedestrian Toolbox. 69 Amarillo Area Metropolitan planning Organization (MPO). (2021). Amarillo Area Regional Multimodal Mobility Plan The Bicycle and Pedestrian Toolbox. pg. 2.
Bike Facilities
The Bicycle and Pedestrian Toolbox of the 2021 Amarillo Regional Multimodal Mobility Plan highlights bicycle facilities such as shared lanes, bike lanes, two-way cycle tracks, bike lanes at intersections, bicycle signals, bike boxes, two-stage turn queue boxes, buffer treatments, shared-use paths, and paved shoulders. These facilities provide designated spaces for bicyclists, enhance safety at intersections, and offer physical separation from motorized traffic. Collectively, these bicycle and pedestrian facilities can create a comprehensive network that promotes multimodal transportation and encourages active travel within the community.
The 2020-2045 Amarillo Metropolitan Transportation Plan includes bike lane striping, wide paved shoulders, bike parking, bus racks, off-road trails, and bike bridges and underpasses.
Shared Use Facilities
The Bicycle and Pedestrian Toolbox of 2021 Amarillo Regional Multimodal Mobility Plan highlights shared-use facilities such as shared-use paths, sidepaths, and trails, which are physically separated from motorized traffic and designed for two-way travel. These facilities accommodate pedestrians, bicyclists, and other non-motorized users, enhancing safety and comfort. Additionally, paved shoulders offer space for bicyclists and pedestrians in areas where standard facilities may not be feasible. These shared-use facilities can promote active transportation and create a more connected, multimodal network within the community.
Access Management
The Bicycle and Pedestrian Toolbox of 2021 Amarillo Regional Multimodal Mobility Plan highlights access management as a critical strategy for controlling where roadway users enter and exit high-demand areas such as commercial or employment centers. Effective access management minimizes crashes caused by unsafe turning movements, improves traffic flow, and reduces conflicts with bicyclists and pedestrians. Techniques include driveway closure, consolidation, or relocation, safe turning lanes, and median treatments like raised medians and roundabouts, which collectively can enhance safety and efficiency for all modes of transportation
Traffic Calming
The Bicycle and Pedestrian Toolbox found in the 2021 Amarillo Regional Multimodal Mobility Plan outlines traffic calming measures that are designed to promote responsible driving behavior through street design, reducing reliance on traffic control devices such as signals and signs. The Bicycle and Pedestrian Toolbox includes techniques like speed humps, speed cushions, chicanes, traffic circles, and pinch points, all aimed at reducing vehicle speeds and improving safety for all road users. These measures can be particularly effective in neighborhood or mixed-use settings with high bicycle and pedestrian activity.

TM-3.14: Traffic Calming at an Intersection 70
Signage & Wayfinding
The Bicycle and Pedestrian Toolbox of the 2021 Amarillo Regional Multimodal Mobility Plan outlines signage and wayfinding strategies that involve the strategic placement of signs and markers to help people navigate to destinations, including entertainment districts, landmarks, and trails. Effective wayfinding enhances user experience by providing clear, consistent directions, establishing a sense of place, and supporting branding and marketing efforts for specific areas.
The 2045 City Vision Plan aims to restore and replace iconic signage along Route 66, increase interpretive signage and storytelling elements, and develop a public-private partnership strategy for enhancing the aesthetics of buildings and signage along highways.
Mid-Block Crossing
The Bicycle and Pedestrian Toolbox of the 2021 Amarillo Regional Multimodal Mobility Plan details mid-block crossings that provide designated pedestrian crossing points between intersections, improving connectivity and safety. These crossings are especially useful in areas with long blocks or high pedestrian demand. The design includes high-visibility markings, appropriate signage, and adequate lighting to ensure pedestrian safety. Mid-block crossings are typically used near schools, parks, transit stops, and other high-demand destinations, offering a safer alternative to crossing at undesignated locations
70 Amarillo Area Metropolitan planning Organization (MPO). (2021). Amarillo Area Regional Multimodal Mobility Plan
The Bicycle and Pedestrian Toolbox. pg. 25
Figure

Online Survey Analysis Integration
To enhance the Transportation Guidelines Review, integrating the public survey findings with policy-focused objectives provides critical context for aligning community priorities with planning strategies. By incorporating this feedback, Amarillo can ensure that its guidelines not only reflect best practices but also address the specific safety needs and expectations of its residents. This approach bridges the gap between technical policies and community-driven priorities, fostering a more inclusive and responsive transportation planning process.
This survey was live for approximately four weeks, between September 23rd, 2024, and October 25th, 2024, and received a total of 1,404 responses. The survey results are highlighted below. This analysis ties into the overall policy review to analyze what the adopted City of Amarillo long range planning documents say in comparison to what the public prioritizes. A thorough analysis of both is needed to inform system-wide and wholistic recommendations to promote transportation safety in Amarillo.
Major findings of the survey include the following:
71 Amarillo Area Metropolitan planning Organization (MPO). (2021). Amarillo Area Regional Multimodal Mobility Plan The Bicycle and Pedestrian Toolbox. pg. 5. 0
Figure TM-3.15: Mid-Block Crossing 71
1. Survey respondents were asked to document which neighborhood they live in. The top three neighborhoods that had the most responses included Olsen, Wolflin, and Puckett. Two new categories were made for this table, including the “Not in City Limits,” response, which gathered approximately 2.7 percent response rate, and “Unknown,” which gathered 1.3 percent of total responses to this question. See Table TM-3.7 for the full breakdown of responses by neighborhood.
Table TM-3.7: Survey Responses by Neighborhood
2. The public was asked to select up to two responses to show their top prioritization criteria for transportation improvements in Amarillo. The majority of respondents, approximately 54.7 percent, indicated they want to see transportation investments in areas with high crash hotspots. This was followed by lowering speeds (29.3 percent) and creating safer connections to destinations such as schools, transit, and jobs (26.9 percent). There was a close fourth place, which was improving pedestrian and bicycle safety, which consisted of 25.9 percent of responses. The results of this question are displayed in Figure TM-3.16

3. 67.8 percent of respondents indicated they would be willing to remove parking spaces within the public right-of-way in order to construct additional sidewalks, bike lanes, or other pedestrian or bicycle infrastructure. 32.2 percent of respondents said they would not be willing to trade the parking spaces. This question was included due to potential right-of-way constraints in areas needing new pedestrian or bike infrastructure.
4. Survey respondents were asked to help identify strategies to address speeding in both residential neighborhoods and along arterial roadways.
o When it comes to residential neighborhoods, the top three strategies to address roadway safety include:
Construct more speed cushions;
Increase law enforcement; and
Road diet on residential streets.
o When it comes to arterial roadways, the top three strategies to address roadway safety include:
Increased law enforcement;
Convert two-way left-turn lane into a concrete median; and
More speed limit signs.
Figure TM-3.16 Question 2: Project Prioritization Criteria – Which criteria should the City prioritize when selecting safety projects for implementation? (Select up to 2 Options)
5. Displayed in Figure TM-3.17, when it comes to policy changes to support safer streets in Amarillo, approximately 54.9 percent of survey respondents want Amarillo’s streets to be designed safer to protect all roadway users. Following this, 38.7 percent of respondents want to see stronger traffic enforcement, and 31.2 percent of respondents want to see an increase in safety funding allocation. Only 21.2 percent of survey respondents prioritized a citywide zero traffic death policy.

Figure TM-3.17 Question 6: Which policy changes would you most support to foster safer streets in Amarillo? (Select up to 2 Options)
• When discussing physical infrastructure safety improvements, the public was asked to choose their top three choices for both streets in Amarillo and intersections. The public chose the following top improvements:
o When it comes to safety improvements along streets in Amarillo, the public would like to see:
Smoother roadway pavement;
More streetlights; and
Speed bumps/cushions.
o When it comes to safety improvements at intersections in Amarillo, the public would like to see:
More streetlights;
More dedicated turn lanes; and
More traffic signals.
• When asked if more funding becomes available, the projects that should be of highest priority to the City, according to the public, are pavement quality projects (i.e., upgrading
existing road surfaces), intersection improvements (i.e., improvement of pedestrian crossings, signal timing and lane configuration), and traffic calming (i.e., speed bumps, roundabouts, and curb extensions). The results of this question are displayed in Figure TM-3.18.

Figure TM-3.18. Question 9: If more funding becomes available, which types of projects do you think should be the highest priority for the City? (Select up to 3)
• When asked what their primary mode of transportation was traveling through Amarillo, responses to this question indicated that most people drive in Amarillo (97.7 percent), followed by walking (58.9 percent). The rest of the transportation modes had a general even split, with rideshare services gathering 14.2 percent of responses, the “Other (please specify)” category gathering 13.8 percent of responses, and biking as 12.3 percent of responses. Transit came in last place with approximately 2.1 percent of responses. Results are summarized in Figure TM-3.19

TM-3.19. Question 10: How do you usually get around Amarillo? (Select exactly 2 options)
The public provided clear directions for transportation safety policy in Amarillo through the online survey. The public would generally like to see an increase in law enforcement to deal with speeding issues across arterial roads the City and would also like to see safer street design in future roadway rehabilitation projects (such as the construction of medians). The public would like to see the City focus more investment in the maintenance of City streets, by smoothing roads and maintaining better roadway quality. Finally, the public wanted to see wholistic approaches to improve roadway safety, such as enhanced lighting, traffic calming measures, and better intersection design.
Figure
Recommendations for New and Updated Guidelines
Based on the plan review and survey analysis, the following recommendations are proposed to address identified gaps and support the city’s transportation safety goals:
Transportation Design Manual
The absence of an official design manual presents challenges when proposing new projects, as it leaves room for variability in design criteria. Establishing a comprehensive manual would help clarify essential design elements, such as buffer requirements between sidewalks and travel lanes, driveway spacing, travel lane widths, and specifications for concrete medians and access management. Providing standardized guidelines for planners, engineers, and developers would ensure more consistent and effective street designs that prioritize safety and functionality.
Traffic Calming
The existing traffic calming guidelines outlined in the Bicycle and Pedestrian Toolbox of the 2021 Amarillo Regional Multimodal Mobility Plan provide a solid foundation. Expanding these guidelines with additional detail could further enhance their effectiveness, particularly for neighborhoods and school zones. Factors such as traffic volumes (AADT), speed limits, roadway classifications, and school types could inform where traffic calming measures are most appropriate. Innovative solutions like raised pedestrian crossings (Figure TM-3.20), curb extensions, chicanes, and speed cushions could be added to the toolkit to enhance safety in high-priority areas.

Figure TM-3.20. Raised Crosswalk Source: NearMap
Safe Streets Design
As a proposed new recommendation to enhance the existing guidelines, it would be beneficial to introduce a comprehensive Safe Streets Design guide that integrates all related safety countermeasures and design elements into a single document. This guide would not only focus on planning-level elements, such as renderings and proposed street features, but also include detailed engineering design concepts. Key elements would cover specific street configurations, such as sidewalk width, travel lane width, curb and gutter dimensions, safety buffers between sidewalks and curbs, streetlight spacing, crosswalk widths at intersections, and ADA ramps with appropriate landing spaces, as well as alternatives for various right-of-way scenarios. By combining both planning and engineering perspectives, this guide would provide actionable instructions on how to design streets that enhance safety for all users.

School Zone Safety Guideline
As a recommended new guideline, a comprehensive School Zone Safety guide is proposed to provide clear, actionable instructions for improving safety around schools. This guide would establish criteria for defining school zones, considering factors such as proximity to school entrances, school levels (elementary, junior high, high school), and the functional classification of surrounding streets. It may also include specific traffic calming measures like speed cushions, raised crosswalks, curb extensions, and pedestrian refuge islands, tailored to different traffic volumes and roadway classifications. Additionally, it could offer best practices for crossing guard placement at key intersections as it may be outlined to improve coordination between
Figure TM-3.21: Back of Curb Options 72
72 City of Amarillo. (2021). Amarillo Area Regional Multimodal Mobility Plan.
pedestrian and vehicular movements during peak school hours. This guide would create a comprehensive framework to enhance safety around schools in various right-of-way scenarios.
In terms of signage and flashing beacons, the guide could provide instructions on how to determine the need for school zone signs to indicate reduced speed limits and suggest the installation of flashing beacons in areas with heavy traffic or limited visibility. These beacons could be time-activated to operate during school start and dismissal times, alerting drivers to the presence of children.
Additionally, the guidelines could propose methodologies for identifying safe walking and biking routes, incorporating well-marked crosswalks and pedestrian signals to ensure that children have clearly defined, accessible, and safe paths to and from school.
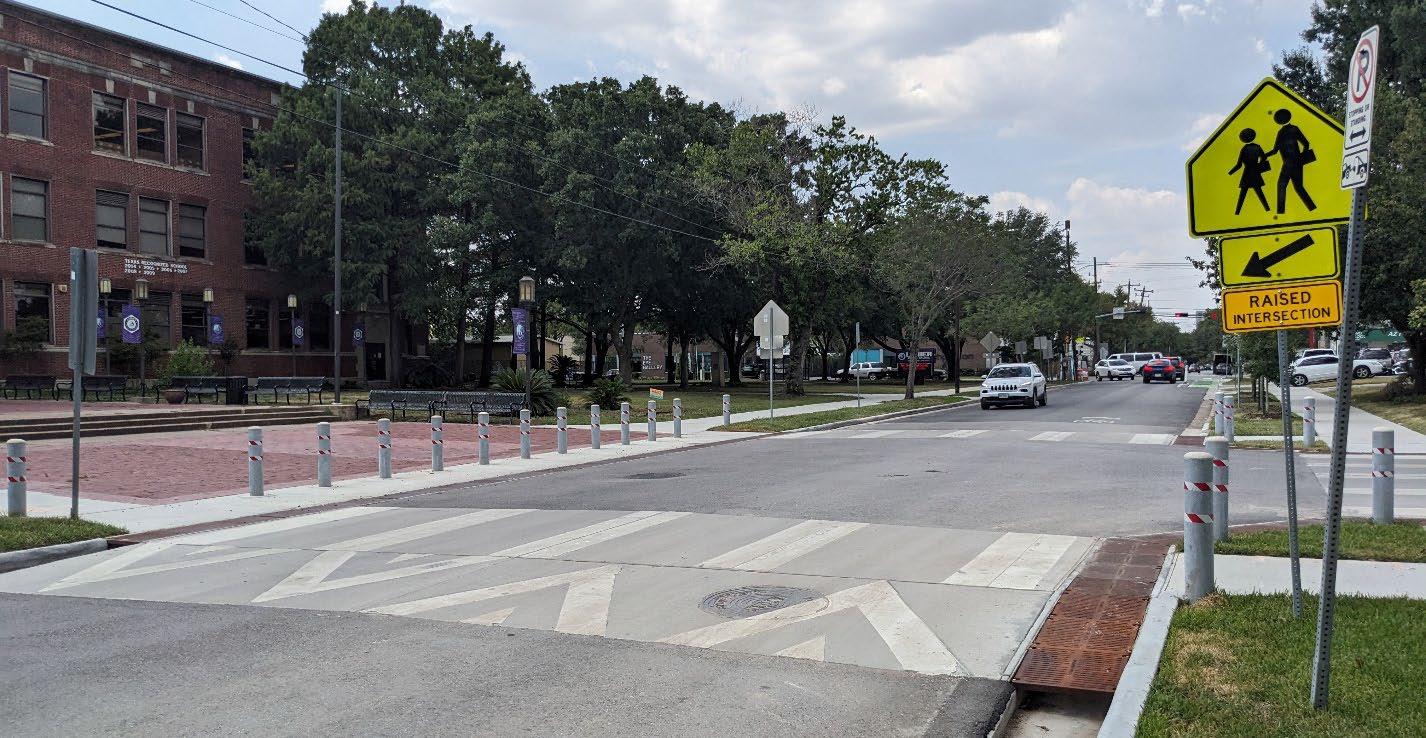
Design Standards Review
The review of design standards is a critical component of the SS4A report as it directly impacts the safety and accessibility of transportation infrastructure for all users, including pedestrians, cyclists, and drivers. For Amarillo, design standards set the foundation for implementing consistent safety measures across the city’s transportation network. By evaluating existing standards, this report identifies where current practices align with safety goals and where gaps or outdated approaches may require updating. The focus is on key infrastructure elements, such as sidewalks, bike lanes, and ADA ramps, assessing their compliance with local, state, and national guidelines. While some standards promote safety and accessibility effectively, others may benefit from enhancement to better reflect Amarillo’s unique needs.
Figure TM-3.22: Example of Raised Intersection near School Source: TGC
Table TM-3.8. Pedestrian and Bike Design Infrastructure Design Standards Review Summary
Infrastructure Level
Sidewalks
Policies or Standards
Local City of Amarillo Design Standard Details
Commercial Sidewalks: 6’ minimum with 1/4 “per foot maximum transverse slope, no space required between the edge of the sidewalk and back of curb”
Residential Sidewalks: 4’ minimum with 1/4 “per foot maximum transverse slope, no space required between the edge of the sidewalk and back of curb”
Sidewalk with 8” side curb: 4’ minimum with 1/4 “per foot maximum transverse slope, no space required between the edge of the sidewalk and back of curb, and 6” to 8” wide sidewalk curb”
IV. CONSTRUCTION METHODS
County Randall County Subdivision Regulations
All sidewalks and step treads shall have a minimum transverse slope of one eighth (1/8) inch per foot and a maximum transverse slope of quarter (1/4) inch per foot.
All sidewalks constructed at a location designated on the plans shall be not less than four (4) feet in width.
Potter County
None
TxDOT Roadway Design Manual
Chapter 3 — New Location and Reconstruction (4R) Design Criteria
State
National
Wider than 6-ft is applicable for commercial areas, school routes, or other areas with concentrated pedestrian traffic. 5’ is the minimum for sidewalks.
American Association of State Highway and Transportation Officials (AASHTO)
A Policy on Geometric Design of Highways and Streets
4.17.1 Sidewalks
Sidewalk widths in residential areas may vary from 4 to 8 ft. Sidewalks less than 5 ft in width require the addition of a passing section every 200 ft for accessibility.
Local None
County
None
TxDOT Bicycle Accommodation Design Guidance
Section 4: Bicycle Facilities
State
Bike Lane
This TxDOT Bicycle Accommodation Design Guidance is based on the review of national guidelines for the best practices for the design of bicycle facilities and is the governing bicycle guidance document for TxDOT. The 2012 AASHTO Guide for the Development of Bicycle Facilities (AASHTO Bike Guide) continues to be the governing document for specific design criteria that is not contained within this TxDOT Bicycle Accommodation Design Guidance.
National AASHTO Guide for the Development of Bicycle Facilities
Chapter 4 - Design of On-Road Facilities
A bicyclist’s preferred operating width is 5 ft. Therefore, under most circumstances the recommended width for bike lanes is 5 ft.
Infrastructure Level Policies or Standards
City of Amarillo Details
Local
County
State
ADA Ramps
National
ADA Standard for New Residential Intersection: Directional ramp 4’ wide with a minimum of 3’ by 4’ wide landing space
Randall County & Potter County
None
TxDOT ROADWAY STANDARDS
Miscellaneous Details
Pedestrian Facilities Curb Ramps (PED-18)
AASHTO
A Policy on Geometric Design of Highways and Streets
4.17.3 Curb Ramps
Several Federal laws, including the Rehabilitation Act of 1973 and the Americans with Disabilities Act of 1990 (ADA), require that facilities for pedestrian use be readily accessible to, and usable by, individuals with disabilities. When designing a project that includes curbs and adjacent sidewalks, proper attention should be given to the needs of persons with disabilities, such as those with mobility or visual impairment. Curb ramps are necessary to provide access between the sidewalk and the street at pedestrian crossings. Detectable warnings are needed where the curb has been removed to alert pedestrians with visual disabilities that they have arrived at the street/sidewalk interface.
Recommendations for New and Updated Design Standards
The review of Amarillo's design standards highlights the city's solid foundation in guidelines for sidewalks and ADA ramps, including detailed specifications for both commercial and residential areas that surpass the specificity of some state and national standards. However, there are opportunities to further enhance these standards by aligning them with broader state and national best practices. Key areas for improvement include the development of local detail sheets for bike lanes, shared use paths, and PHBs. Additionally, refinements are needed in crosswalk visibility, curb ramp compliance, and pedestrian push button standards. Addressing these gaps would significantly enhance safety, accessibility, and multimodal connectivity across the city's transportation network.
Sidewalk Details
Amarillo's existing sidewalk details could be improved by incorporating a safety buffer between the roadway and the sidewalk. This buffer enhances pedestrian safety by providing separation from vehicular traffic.
Bike Lane Details
Currently, the City lacks specific detail sheets for bike lanes. Introducing dedicated bike lane details would define lane configurations, pavement markings, and signage, thereby promoting cyclist safety and encouraging bicycle use.
Shared Use Path Details
Amarillo’s detail sheets could include guidance for shared use paths to accommodate both pedestrians and bicyclists. These details would specify path layout, surface material, separation from vehicular traffic, and intersection crossing treatments. Including shared use path details would enhance multimodal connectivity and safety for all users.
Crosswalk Details
Enhancing crosswalk details to include high-visibility markings and, where appropriate, pedestrian refuge islands can significantly improve pedestrian safety at intersections.
Curb Ramp Details
Updating curb ramp details to ensure compliance with the ADA is essential. This includes specifying ramp slopes, tactile warning surfaces, and proper drainage considerations. TxDOT provides detailed guidance on ADA-compliant curb ramps that can be adapted to Amarillo's standards.
Pedestrian Handrail Details
In areas with significant grade changes or where additional support is necessary, incorporating pedestrian handrail details can enhance safety.
PHB Details
Amarillo’s detail sheets could include standards for installing PHB. These details would guide placement and design to enhance pedestrian safety at mid-block crossings or high-demand locations.
Pedestrian Push Button Details
Amarillo could add a detail sheet for pedestrian push buttons, covering assembly placement, accessibility features, and operation. Including these standards would ensure consistency and improve usability for all pedestrians, including those with disabilities.
By adopting these enhancements, Amarillo can improve the safety and usability of its pedestrian and bicycle infrastructure, aligning with best practices observed in other Texas cities and state guidelines.
Technical Memorandum 4: Online Survey #1 Analysis
Introduction
The City of Amarillo (City) released a 10-week Safe Streets and Roads for All (SS4A) Survey seeking residents’ input regarding various strategies to improve roadway safety (Figure TM-4.1). The survey, open from May 21st, 2024, to July 28th,2024, aimed to gather community input on various safety countermeasures, including reducing speed, new or improved sidewalks, new or improved bike lanes, more streetlights, more stop signs and/or signals, crosswalks or pedestrian refuge islands, and other safety countermeasures that residents could comment on if not listed. By involving the public, the City sought to ensure that safety improvements align with residents’ experiences and needs.
The survey engagement involved participation from 6,880 unique users who provided a total of 4,771 comments. Such a high participation number demonstrates strong community engagement and reflects the commitment of City residents to improve roadway safety for all users. The insights gathered throughout this survey will inform the development of targeted safety projects and initiatives to create safer streets and roads for all roadway users in the City.
Figure TM-4.1. Survey Screenshot
Purpose and Needs
The primary purpose of the survey was to collect community feedback that would guide the development and implementation of safety-oriented projects for the City’s streets. The needs for the survey are listed below:
• Improve Safety for All Roadway Users: Address the safety concerns of pedestrians, cyclists, and drivers through targeted safety countermeasures Throughout this memo, the term “vulnerable roadway user” will be introduced to describe someone who is at a higher risk of injury or death in traffic crashes due to their lack of protection compared to those in motor vehicles 73This typically includes pedestrians, cyclists, and people using scooters or wheelchairs.
• Data-Driven Decision Making: Utilize feedback to support evidence-based project proposals that align with community needs
• Community Support: Ensuring that all proposed projects are backed by survey responses and have the support of the community, aligning with the needs and priorities of Amarillo's residents.
• Public Engagement: Foster a sense of ownership and involvement among residents in encouraging community involvement to ensure that projects reflect the needs and desires of City residents
• Quality of Life: Enhance overall well-being by creating safer, more accessible, and more comfortable walking, biking, and driving environment.
• Education and Awareness: Increase public awareness regarding transportation safety and countermeasures and promoting safe behaviors among all roadway users.
Survey Engagement Overview
To ensure widespread participation, the SS4A survey was promoted through an extensive and multi-faceted outreach strategy. To raise awareness and encourage community involvement, the City utilized a variety of channels, including press releases, social media posts, in-person events, and merchandise distribution
In-Person Events
City staff participated in 21 in-person events to directly engage with the community. These events provided opportunities for face-to-face interactions, allowing residents to learn about the SS4A survey and contribute their insights. These events ranged from business connections and transit station outreach to library sessions and pop-up park parties These in-person events ensured the survey reached a broad and diverse audience across the City. Table TM-4.1 shows a complete list of these in-person events.
73 Federal Highway Administration (FHWA). (n.d.). Vulnerable Road User Safety Assessment Guidance. Retrieved October 2022 from https://highways.dot.gov/safety/hsip/vru-safety-assessment-guidance


Figure TM-4.2 SS4A Engagement at Business Connections
Figure TM-4.3 SS4A Engagement at Transit Station

Online Advertisements
The engagement strategy also included online advertisements and social media campaigns, which played a significant role in driving participation Table TM-4.2 summarizes all online advertisements.
Figure TM-4.4 SS4A Engagement at the High Noon Event
6

Figure TM-4.5. SS4A Engagement Post on Facebook

Figure TM-4.6 SS4A Engagement Post on News Website
City of Amarillo | Safe Streets and Roads for All Plan


Figure TM-4.7. SS4A Engagement Advertisement on Next Door
Figure TM-4.8 SS4A Engagement Advertisement on the Meta Platform
Merchandise and Physical Advertising
The City utilized both merchandise and physical advertising to increase visibility and encourage participation in the survey. Posters were displayed in prominent locations such as libraries, transit stations, parks, and community centers, while stickers, postcards, yard signs, and wristbands were distributed across the City. These materials served as constant reminders for residents to participate in the survey, further expanding the reach of the engagement efforts. By combining in-person events, a strong online presence, and widespread distribution of promotional materials, the City ensured that the SS4A survey captured the voices of a wide range of Amarillo residents, making the proposed safety improvements truly reflective of the community's needs and priorities.
Table TM-4.3. Merchandise and Physical Advertising Summary
• Five libraries
• Warford Center
• Transit Station
• Gold Course
• Zoo
1 Poster
• Tennis Center
• Swimming Pools
• Get Fit
• Waste Water and Utility Departments
• Environmental Health
• Police Station 4 Post Cards At targeted neighborhoods 5 Yard Sign
• Thompson Park
• Bones Hook Park
• Medi Park
• John Stiff Park
• Rick Klein Park
• Rails to Trails
• Transit Station
• Warford Center
• Zoo • Golf Courses
• Tennis Center
• Swimming Pools
• City Hall
• 6th Street 6 Wrist Band At Various Event
City of Amarillo | Safe Streets and Roads for All Plan

Figure TM-4.9. SS4A Engagement Wrist Band
City of Amarillo | Safe Streets and Roads for All Plan

Figure TM-4.7 SS4A Engagement Yard Sign at the Zoo
City of Amarillo | Safe Streets and Roads for All Plan
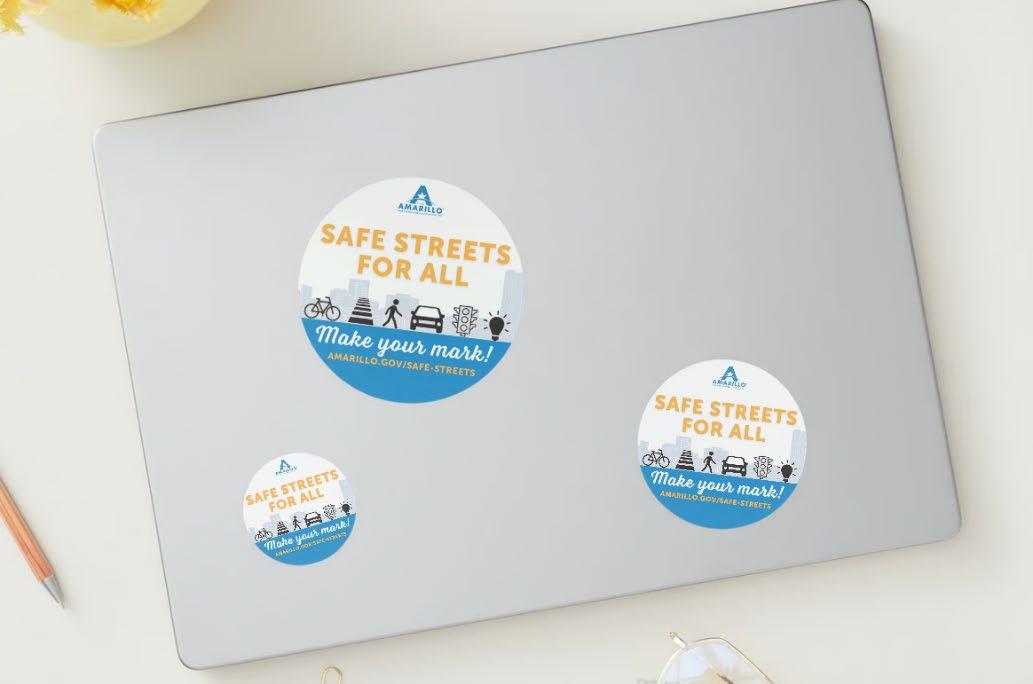

Figure TM-4.8 SS4A Engagement Sticker
Figure TM-4.9. SS4A Engagement Team T-Shirts
Mid-Point Survey Analysis
The survey team monitored engagement throughout the 10-week period and adjusted outreach efforts as needed to target underrepresented areas. For example, to encourage broader involvement, postcards were sent to areas with lower participation rates. Figure TM-4.10 shows a design of the mailed post card. This adaptive approach ensured that a diverse range of the Amarillo community had the opportunity to voice their concerns and suggestions for improving road safety for all roadway users.

Distribution of Comments by Engagement Type
Understanding the distribution of comments by engagement type is essential for evaluating the effectiveness of different outreach methods and ensuring that future public engagement efforts are well-targeted. Analyzing how residents engaged with the survey helps identify the most impactful channels and optimizes communication strategies for broader community involvement.
The chart in Figure TM-4.11 shows that Facebook was the most significant source of engagement, accounting for 67.2 percent of the total comments. This highlights the critical role of social media, particularly Facebook, in driving public participation in the survey. The project
Figure TM-4.10 SS4A Engagement Mail Card Design
website was the second-largest contributor, responsible for 14.1 percent of the comments, while the City of Amarillo's website also contributed significantly, generating 11.9 percent of the feedback.
Other channels, such as various news channels (2.6 percent), postcards (2.4 percent), yard signs (0.9 percent), and smaller contributors like Instagram (0.1 percent) and NextDoor (0.1 percent), had relatively less impact compared to the larger platforms. It is important to note that all in-person materials, such as posters and handouts, included QR codes directing participants to the online survey. As a result, there isn't a specific category for comments gathered from inperson events, as these methods were integrated with the digital engagement efforts.

Figure TM-4.11 Distribution of Comments by Engagement Type Summary
Key Findings
General Highlights
The online survey gathered a total of 4,771 comments between the months of May and July of 2024, totaling approximately a 10-week period In addition to leaving individual comments on specific locations around Amarillo, the public was asked to categorize their comment into a specific countermeasure, that best describes their comment. There were seven countermeasures available to categorize comments, including Reduce Speed, New or Improved Sidewalk, New or Improved Bike Lane, More Streetlights, More Stop Signs and/or Signals, Crosswalk or Pedestrian Refuge Island, and Other Comments Figure TM-4.12 displays the different comment types provided in the online survey.
Figure TM-4.12 Countermeasure Types
Figure TM-4.13 displays the engagement summary for the online survey. Over the two-month period, the online survey webpage had a total of 9,408 visits. There were 6,880 unique users that visited the website, and 2,153 of them left comments. On average, the public spent about four and a half minutes taking the online survey. The graph below also shows an overview of the engagement by day. Spikes in engagement were initiated by the City posting about the online survey on their Facebook page, especially seen on the spikes May 22nd and May 29th

The 4,771 comments were exported from the online survey platform into Excel format. One limitation of the online survey was the fact that commentors could only assign one countermeasure category. However, after a thorough review of comments, it was clear that many of the comments belonged under multiple countermeasure categories. An example of this could be a comment that called for new bicycle lanes and a new sidewalk along a particular corridor. Or many other comments discussed both the need for sidewalks and safe street crossings near Amarillo’s schools. To ensure a more comprehensive analysis, additional countermeasure tags were assigned where applicable. The comments by countermeasure type are summarized below in a pie chart in Figure TM-4.14 and specific numbers of comments categorized in each countermeasure type are shown in Table TM-4.4.
Figure TM-4.13 Online Survey Engagement Summary

Figure TM-4.14 Comments by Countermeasure Type Pie Chart
Table TM-4.4. Processed Comment Countermeasures Distribution
Note: The final number does not equal the 4,771 total comments due to individual comments being categorized under one or more countermeasure types.
Comments by Countermeasure Type
In this section, the analysis of survey comments is organized by countermeasure type, providing a detailed breakdown of the comments for each countermeasure type. Analyzing these categories highlights the key areas where the community feels safety improvements are needed. Understanding the distribution and focus of comments is crucial for developing and prioritizing projects and ensuring that the proposed safety interventions align with the specific needs and priorities of Amarillo's residents.
Each section begins with an overview of key themes, the number of comments received, and additional countermeasure tags. Heat maps for each countermeasure type were also prepared to show areas of high concentrations of comments, accompanied by summaries that highlight significant public feedback themes
Please note that not all hot spot areas are covered in the summaries of every single heat map, as common relationships might not have been discovered in the clusters, or due to some higher concentration areas being addressed in other categories. An example of this is the intersection of Loop 335 and Arden Road. This intersection was by far the most popular point of discussion in the online survey, regardless of countermeasure type. This intersection pops up on all countermeasure type heat maps, however, it is only specifically called out in the summaries in the first countermeasure type – More Stop and/or Signal This approach avoids redundancy and allows the analysis to focus on unique insights at other locations, while still acknowledging the significance of key areas like Loop 335 and Arden Road.

More Stop Signs and/or Signals Comment Highlights
A total of 1,603 comments are categorized under this countermeasure. The online survey comments assigned to this countermeasure type discussed various signal related issues in Amarillo, including discussions over stop signs that should be upgraded to signals, signal timing issues along corridors, and suggestions for changes to lane configurations at stoplights. Additionally, comments are visually displayed in a heat map in Figure TM-4.15 The numbering on the comment heat map is associated with the comment summaries provided in this section.

Figure TM-4.15. More Stop Signs and/or Signals Comment Heat Map
Sections below are numbered in association with the numbering on the comment heat map in Figure TM-4.15. For example, the circle that contains number 1 on the map in Figure TM-4.15 is associated the number 1 section below, describing conditions at the intersection of Loop 335 and Arden Road. From this analysis, several key takeaways were gathered from the public feedback. Specific key highlights for stop signs and signal safety concerns in Amarillo are as follows:
1. Loop 335 and Arden Road: Approximately 250 comments were made specifically about the intersection of Loop 335 and Arden Road. This intersection is by far the largest public concern when it comes to new stop signs/lights in Amarillo. This intersection is stop controlled, but public comments indicated that speeding is an issue in this intersection. Many comments also indicated that students attending West Plains High School often walk to the convenience store (Circle K) located on the opposite side of the intersection. The comments also discussed since this intersection is near a high school, young, inexperienced drivers frequent the intersection and create higher safety concerns for the public at this intersection. Overall, the public has expressed significant concern about this intersection, highlighting the need for a new signal or additional traffic control measures in Amarillo.
2. Hillside Road Corridor: Overall, 105 comments were placed along various locations on Hillside Road that indicate the need for additional stop signs or signals. Most of the comments indicated difficulty turning left onto Hillside Road, which is a busy thoroughfare and a major east/west connection point in Amarillo. Greenways Intermediate School is also located on Hillside Road, and the public is concerned with the safety of students, as well as the safety of all vulnerable roadway users attempting to cross Hillside Road. Additionally, Hillside Road has a speed of 50 miles per hour and is a five-lane undivided roadway with a continuous two-way left-turn lane. In fact, several side streets that intersect with Hillside Road were specifically called out with safety concerns by public and indicated a need for additional traffic control, including:
a. Hillside Road and Loop 335
b. Hillside Road and Time Square
c. Hillside Road and Aberdeen Parkway/Glenwood Drive
d. Hillside Road and Greenway Drive
e. Hillside Road and Andover Drive
f. Hillside Road and Hampton Drive
g. Hillside Road and Shawnee Trail
h. Hillside Road and Nancy Ellen Street
3. Amarillo High School Safety Concerns: A large cluster of comments in this category were placed around Amarillo High School (53 total comments), which is located at the intersection of Fulton Drive and Bell Street. Several safety concerns were recorded, including the following:
a. The public is mainly concerned with the intersection of Sandie Drive and Bell Street. This facility is a five-lane undivided thoroughfare with a continuous twoway left-turn lane. There is a flashing beacon for pedestrians to utilize when crossing the street, but public comments have stated that additional signage and traffic control devices are needed to adequately protect vulnerable roadway users, especially school children The public supports a signal at this intersection to fully stop vehicles and protect pedestrians and cyclists.
b. Enhanced traffic control countermeasures are desired by respondents at the intersection of Danbury Drive and Fulton Drive. Public stated that this intersection becomes very congested during school peak hours and can create dangerous situations for students trying to turn left out on Fulton Drive. Additionally, the public also expressed concerns for the safety of pedestrians crossing at this intersection.
4. Other High Priority Intersections: Below describes several intersections that had high concentrations of public comments that needs new or enhanced stop signs, traffic signals or other traffic control countermeasures:
a. Farmers Avenue and Georgia Street: This intersection gathered a total of 128 comments in this category. This intersection is a significant public concern. It is currently a four-way stop-controlled intersection, with both Farmers Avenue and Georgia Street being two-lane, undivided roadways that were previously surrounded by a more rural, undeveloped area. However, the public noted that the residential developments recently constructed in the vicinity seem to have increased traffic along these corridors and at this particular intersection The public has indicated this intersection gets very congested, and sometimes drivers will take dangerous actions to get through the intersection faster, such as following the vehicle in front of them through the intersection without stopping
b. 34th Avenue and Tradewind Street: A total of 77 comments were placed at this intersection Comments described dangerous maneuvers at this intersection, especially cars trying to turn left from Tradewind Street onto 34th Street. The public said that they often see risky behaviors and have witnessed many crashes of drivers trying to turn left onto 34th. The public also expressed concerns that these challenging left-turn maneuvers often lead to significant congestion on Tradewind Street at this intersection.
c. 34th Avenue and Grand Street: A total of 17 comments were placed on this intersection, with public suggestions for from a stop-controlled to a signalized intersection. The comments highlight concerns about frequent congestion, and many respondents expressed a desire to see a stoplight installed here
d. Coulter Street and Tascosa Road: The public has indicated this intersection is difficult to turn left onto Tascosa Road traveling from Coulter Street, especially during peak school hours. De Zavala Middle School and the Woodlands Elementary School are both located on Coulter Street to the north of this intersection, the need for enhanced traffic control was emphasized by the public
e. NE 8th Street and FM 1912: This intersection, currently a two-way stop where traffic on FM 1912 does not stop, has been noted in public comments as dangerous for left turns from the stop-controlled approaches due to the highspeed traffic on FM 1912.
f. Western Street and Loop 335: Comments from the online survey indicate that drivers often run the stop signs at the intersection of Western Street and the Loop 335 frontage road. The public has suggested upgrading these stop signs to signals to improve safety at this intersection.
g. Olsen Boulevard and Teckla Boulevard: Many public comments indicated that people run over the stop sign at this intersection. The public suggested additional street lighting at this intersection to improve visibility and safety.

New or Improved Sidewalk Comment Highlights
For the New or Improved Sidewalk countermeasure, a total of 1,098 comments were assigned to this countermeasure type The comments in this category mainly focused on key areas of Amarillo that lack adequate sidewalk connections, with a specific focus on safety and connectivity between neighborhoods and Amarillo’s many schools. Overall, the public is greatly concerned for the safety of students accessing their school from adjacent neighborhoods. Last mile sidewalk connection gaps are often present, and the public indicated these discrepancies in various areas throughout Amarillo. Comments are visually displayed in a heat map in Figure TM-4.16. The numbering on the comment heat map is associated with the comment summaries provided in this section.
City of Amarillo | Safe Streets and Roads for All Plan

Figure TM-4.16. New or Improved Sidewalk Comment Heat Map
Sections below are numbered in association with the numbering on the comment heat map in Figure TM-4.16. From this analysis, several key takeaways were gathered from this countermeasure analysis. Specific key highlights for sidewalk safety concerns in Amarillo are as follows:
1. Improvements around Amarillo Public Library & Amarillo High School Area: A total of 57 comments were made in this area of Amarillo. A holistic analysis of this area is recommended, as many students attending Amarillo High School are in walking range of the Amarillo Public Library and John Stiff Memorial Park. Many pedestrian realm improvements were discussed by the public in this area, including the following specific recommendations:
a. Sidewalks are desired along 45th Street between Coulter Street and Bell Street. Currently, sidewalks only exist immediately outside of the Southwest Amarillo Public Library, failing to connect to any adjacent facilities. Today there are no sidewalks on 45th Street, and the public desires for sidewalks on this street to improve connectivity to the park and the library.
b. More sidewalks and trails are generally desired within John Stiff Memorial Park. The public wishes for a sidewalk connection from the adjacent residential neighborhoods, and a trail connection from the ballpark facilities up to the library and the lake.
c. Discussed more in the Crosswalk or Pedestrian Refuge Island countermeasure type, the public also desires safer street crossings, both midblock and at the intersections of 45th Street and Coulter Street/Bell Street.
d. Sidewalk improvements along Bell Street near Amarillo High School, as well as enhanced crossing facilities, are also high priorities for the public when upgrading existing pedestrian infrastructure.
2. Georgia Street & Farmers Avenue: A total of 68 comments were left on the segment of Georgia Avenue between 58th Street and Farmers Avenue, and the segment of Farmers Avenue from Georgia Street to Athens Street. Today, the area near Farmers Avenue and the Burlington Northern and Santa Fe (BNSF) Railway crossing includes a large, open, gravel-covered public right-of-way, as shown in Figure TM-4.17. Residents from the Saturn Terrace neighborhood have expressed a strong desire for a sidewalk along Farmers Avenue to connect their neighborhood to the City View neighborhood, extending all the way to I-27 The public stated that people already use this graveled area for exercise, and a recreational trail is desired to improve pedestrian safety and to provide a dedicated facility for families, runners or others walking in the area. Additionally, the public desires a sidewalk along Georgia Street as well to connect the City View and Saturn View neighborhoods to the Amarillo Collegiate Academy School to the north.

3. Sidewalks to Schools: A key concern for survey respondents within this countermeasure type was the need to create safe pedestrian connections between neighborhoods and schools in Amarillo. Below describes several specific schools that received numerous comments from the public:
a. West Plains High School: Sidewalk connections are recommended along Arden Road. Today, there is a sidewalk gap between West Plains High School and the intersection of Arden Road and Loop 335.
b. Palo Duro High School: The public reported many instances of students walking down Grant Street from Palo Duro High School to Amarillo Boulevard for lunch. Currently, there are no sidewalks on Grant Street or any other parallel streets near the high school, and comments described frequently seeing students walking in the road on Grant Street.
c. Woodlands Elementary School & De Zavala Middle School: The public desires safe sidewalk connections to the Woodlands Elementary School and De Zavala Middle School particularly along Fairway Drive and Coulter Street. Additionally, the public desires sidewalks or trail connections from cul-de-sacs in adjacent neighborhoods to improve pedestrian connectivity to the schools
d. South Lawn Elementary School & Fannin Middle School: The public desires new sidewalk connections in residential areas around South Lawn Elementary School and Fannin Middle School. Streets frequently mentioned include 46th Street and Keith Street. There are currently very little sidewalk connections adjacent to the South Lawn Elementary School, and limited connections to the Fannin Middle School.
Figure TM-4.17 Farmers Avenue Near Athens Street Source: Google Streetview
4. Neighborhood Connectivity: Several clusters of comments were neighborhoodspecific, highlighting both the absence of sidewalks in some of Amarillo’s older neighborhoods and maintenance issues faced by others. Below highlights several neighborhood-specific sidewalk comments.
a. Fixing Broken Sidewalks in Downtown Amarillo: The public indicated improving the ADA ramps and aesthetics of existing sidewalk facilities in Downtown Amarillo.
b. San Jacinto Neighborhood: This neighborhood received a high concentration of comments, with a focus on the need to improve existing sidewalk facilities. Specific streets mentioned are 5th Street, Georgia Street, and McMasters Street. Safe sidewalk connections are also desired for students attending San Jacinto Elementary School.
c. Country Club/Avondale Neighborhood: The Country Club/Avondale neighborhood also saw a large cluster of comments. Several sidewalk gaps were identified, including those on Plains Avenue and 13th Avenue, along with the need for upgrading existing facilities in the east side of the neighborhood.
d. Barrio Neighborhood: The Barrio neighborhood is highlighted in this countermeasure type due to the lack of comments despite additional outreach The Barrio neighborhood has very little existing sidewalks overall with only 17 comments were made in this neighborhood for new sidewalks. This is particularly concerning given the presence of Glenwood Elementary School, where no sidewalks currently exist. The map shown in Figure TM-4.18 displays comment locations overlaid with the Barrio neighborhood boundary and Amarillo’s 2021 sidewalk network that was previously collected during the Amarillo Area’s Regional Multimodal Mobility Plan study.
5. Other Key Streets: Several additional street segments gathered a large clustering of comments and are identified as key segments for potential new sidewalks in Amarillo. These streets are detailed below:
a. Western Street: Western Street gathered a cluster of comments for a new sidewalk, specifically adjacent to the Amarillo Country Club all the way down to Plains Boulevard.
b. 34th Street: Continuous sidewalks are desired on 34th Street, with a large concentration of comments on 34th Street between Western Street and Georgia Street.
c. Hillside Road: According to public comments, sidewalk safety concerns exist on Hillside Road. While the corridor has sidewalk facilities, the public is concerned about pedestrians attempting to jaywalk in the streets.
d. 24th Avenue: A cluster of comments exist on 24th Street between Dumas Drive and Orange Street. The surrounding side streets in this neighborhood all have sidewalks, and therefore the public desires the gap to be filled on 24th Street.
e. Hastings Avenue: According to public feedback, sidewalks are desired on Hastings Avenue from Broadway Drive to Dumas Drive for people to be able to walk to the Amarillo Zoo and Thompson Park


Reduce Speed Comment Highlights
A total of 907 comments were assigned as speeding-related concerns in Amarillo. Common themes seen in this comment type included the need for speed reduction measures near schools, which was a recurring concern throughout the survey Many comments also discussed dangerous speeding conditions on many of Amarillo’s major arterials, including Bell Street, Coulter Street, Soncy Road, and Georgia Avenue. The numbering on the comment heat map in Figure TM-4.19 is associated with the comment summaries provided in this section.
Figure TM-4.18. Barrio Neighborhood Sidewalk Comments
City of Amarillo | Safe Streets and Roads for All Plan

Figure TM-4.19. Reduce Speed Comment Heat Map
Sections below are numbered in association with the numbering on the comment heat map in Figure TM-4.19. From this analysis, several key takeaways were gathered from this countermeasure analysis. Specific key highlights for speeding-related concerns generated by the public in Amarillo are as follows:
1. Olsen Boulevard & Teckla Boulevard: A total of 68 comments were made on Olsen Boulevard, starting from I-40 going south, and then turning south on Teckla Boulevard (shown in Figure TM-4.20). The public expressed significant concern over speeding issues along these corridors. The public’s recommendations included traffic calming countermeasures such as installing speed bumps/cushions or additional enforcement. Pedestrian safety was also a concern, especially on Teckla Boulevard, where sidewalks are directly adjacent to the roadway without any safety buffers. The public also expressed that the lack of a school zone designation near Olsen Park Elementary School further exacerbates safety concerns for students walking in the area against speeding traffic.

2. Amarillo Collegiate Academy: A total of 45 comments were made on Georgia Street near the Amarillo Collegiate Academy. The public desires a school zone designation at this location due to frequently speeding cars along Georgia Street. Comments indicated additional safety concerns with students trying to make left turns out of the school
Figure TM-4.20 Olsen Blvd near Teckla Blvd - No Safety Buffer Between the Sidewalk and Travel Lane Source: NearMap
3. Soncy Road: Many comments were placed along various locations on Soncy Road from I-40 to Hillside Road, which is a major commercial corridor that houses several major activity centers, such as the Westgate Plaza, the Shops at Soncy, the Westgate Mall, Sam’s Club, and other retailers. Soncy Road is a six-lane roadway facility with a continuous two-way left turn lane. Many comments related to speeding issues on Soncy Road describe dangerous near-misses between drivers speeding down Soncy Road and drivers trying to make left turns in and out of adjacent commercial centers. While the posted speed limit is 40mph, some comments expressed concerns that the conditions of this wide, six-lane facility encourage speeding. The public has suggested removing the continuous two-way left-turn lane and adding a median facility along Soncy Road to help prevent such behavior
4. Stephen F. Austin Middle School: Stephen F. Austin Middle School is encompassed by Elmwood Drive, a half-circle street that surrounds the entire middle school campus The public indicated several speeding-related concerns with this street in Amarillo, which are discussed in detail below.
a. The public is concerned with speeding issues with pedestrians crossing Elmwood Drive from adjacent side streets. Specifically, comments expressed that eight individual side streets intersect with Elmwood Drive, all of which have sidewalks and bring foot traffic to Stephen F. Austin Middle School, yet there are no safe crossing locations. This is a significant concern for the public.
b. The public has expressed concerns about traffic from the Tennis Center, which brings in additional traffic to the area and additional speeding concerns from the public.
c. Elmwood Drive currently lacks a school zone designation Public comments suggest that adding a school zone could help address the speeding issues along this road.
5. Speeding Concerns on Arterial Roads: Several of Amarillo’s major arterials were frequently mentioned as problem areas for speeding-related issues in Amarillo. Below calls out several specific roadway segments that gathered high concentrations of comments from the online survey.
a. Hillside Road between Soncy Road and Coulter Street: The Greenways Intermediate School is located along a stretch of Hillside Road, where the posted speed limit is 50mph. Despite the presence of the school, there is no school zone designation, which the public notes safety concerns. The combination of high speeds and the lack of school zone protection has caused the public to worry about the safety of students walking and driving to and from the school.
b. Bell Street near Amarillo High School: The public has raised concerns about speeding along Bell Street, particularly between Fulton Drive and 45th Avenue. At the intersections of Bell Street with 45th Street and Fulton Drive, there are right-turn slip lanes in all directions. The public is worried that these slip lanes allow drivers to maintain high speeds during turns, which poses a danger to pedestrians. An example of these slip lanes are shown in Figure TM-4.21

c. Coulter Street between 45th Street and Adren Road: This segment of Coulter Street varies between a six-lane facility with a two-way left turn lane and a fourlane facility with a two-way left turn lane. The public is concerned with people racing down this corridor and causing crashes with drivers trying to turn left from side streets. The speed limit on this segment of Coulter Street is 45mph, but public comments indicate people typically speed around 55 – 60mph down this corridor.
d. 24th Avenue between Dumas Drive and Angelus Drive: The public has expressed concerns about speeding on 24th Street, particularly due to the dangerous speeds at which vehicles travel, especially at night when visibility is low. The public also described how the lack of sidewalks and the slightly hilly terrain further contribute to a dangerous situation.
e. Farmers Avenue between Georgia Street and Washington Street: Speeding concerns are common along Farmers Avenue where the current speed limit is 55mph. The public has expressed a desire to lower the speed limit to a more reasonable level, such as 40mph.
Figure TM-4.21. Olsen Blvd at Fulton Drive

Crosswalk or Pedestrian Refuge Island Comment Highlights
This countermeasure type discussed areas of Amarillo require additional attention at intersections or in other midblock areas where pedestrians frequently cross and gathered a total of 799 comments in this countermeasure type. The comments in this section varied from general recommendations for midblock crossings along major corridors, and specific intersections where crossing is currently unsafe. Comments generally clustered around the Amarillo Public Library and the Amarillo High School, which was the number one safety concern for pedestrian crossings in Amarillo. Additionally, comments are visually displayed in a heat map in Figure TM-4.22. The numbering on the comment heat map is associated with the comment summaries provided in this section.
City of Amarillo | Safe Streets and Roads for All Plan

Figure TM-4.22. Crosswalk or Pedestrian Refuge Island Comment Heat Map
Sections below are numbered in association with the numbering on the comment heat map in Figure TM-4.22. From this analysis, several key takeaways were gathered from this countermeasure analysis. Specific key highlights for pedestrian crossing related concerns in Amarillo are as follows:
1. Amarillo Public Library & Amarillo High School Area: Over 55 comments were placed regarding crossing safety concerns near the Amarillo Public Library and the Amarillo High School making this the number one priority area for crossing safety improvements to the public. Public comment discussed the need for safer crossings at both intersections around the library, and midblock crosswalks at the library and at the high school. Multiple issues exist in this area, which are detailed below:
a. The public is greatly concerned about the intersection of 45th Avenue and Bell Street and the intersection of 45th Avenue and Coulter Street. These two intersections boarders the Amarillo Public Library and the John Stiff Memorial Park on either side. Both intersections have slip right-turn lanes and are major arterials with four to six lanes, which has raised concerns among the public.
b. The Amarillo Public Library is about half a mile from any pedestrian street crossing. The public desires a midblock crosswalk at the library to encourage safer pedestrian access and encourage walking.
c. The public expressed a desire for safer residential crossings between the park/library and the neighborhood to the south. Those living in the neighborhoods to the south, including the City Park and Southpark/Windsor neighborhoods, wish for a safe crossing over the drainage ditches, providing direct access to John Stiff Memorial Park and the library.
d. Several comments were left along Coulter Street between 45th Avenue and Hillside Road. Residents of the Colonies/Tutbury neighborhood provided comments asking for safe midblock crossings to the park.
e. The public is concerned about the safety of students attempting to cross Bell Street to go to school. There is a desire for a midblock crossing countermeasure, such as a flashing beacon, as the current school zone flashing beacon at the intersection of Bell Street and Sandie Drive does not effectively stop oncoming traffic (Figure TM-4.23). The public indicated the specific need to upgrade this crosswalk, and to provide a midblock crosswalk in front of the school as well.

2. Hillside Road: As detailed in other sections of this report, Hillside Road, a 50mph fivelane major arterial according to the Amarillo Thoroughfare Plan, is identified as a significant area of concern for roadway safety in Amarillo and gathered approximately 50 comments in this category. 74 The public indicates a strong need for safer crossing infrastructures, especially around the Greenways Intermediate School. Many parents wish they could walk their children to school but feel compelled to drive due to unsafe crossing environments. The public recommended installing a median with pedestrian refuge island on Hillside Road to enhance safety.
3. Georgia Street: Approximately 40 comments were placed on Georgia Street from Plains Avenue to 34th Street. Even though this section of Georgia Street is a 35mph five-lane major arterial facility, frequent speeding issues were reported by the public. Given the commercial nature of this corridor, particularly near the Wolflin Village shopping center, the public would like to see additional crossing infrastructure. Additionally, there is a desire to see a median placed along Georgia Street in this area to provide for pedestrian refuge islands to assist with street crossings, specifically at midblock locations near the Wolflin Village shopping center.
4. Western Street: A cluster of 30 comments was recorded along Western Street. Several sections along Western Street were specifically called out, including the existing pedestrian street crossing at Western Street and 9th Avenue. The public noted that traffic will not stop for pedestrians at this crosswalk, and that they wish additional safety
Figure TM-4.23. Students Waiting to Cross Bell Street
crossing countermeasures were installed, such as flashing beacons. Further, the public requested better signage and protection from vehicles at the Rock Island Rail Trail crossing (Western Street and Plains Boulevard). Additional pedestrian crossing infrastructure is desired by the public at various intersections along Western Street where no crossings exist today, including Wolflin Avenue, Olsen Boulevard, both 34th Street intersections, 45th Avenue (where all four approaches have right turn slip lanes), and a midblock crosswalk at the intersection of Prairie Avenue. Reports of people attempting to cross Western Street and Prairie Avenue were recorded in the online survey, specifically senior citizens from the adjacent Independence Village retirement home.
5. Amarillo Boulevard: Over 30 comments were left on Amarillo Boulevard between Heather Street and Western Street, which is a major commercial corridor and a principal arterial for the City, functioning as a five-lane roadway. Many of the public comments called for a center median, along with landscaping and pedestrian street lighting. Many of the comments advocated for midblock crosswalks and flashing beacon crossing facilities along this corridor.
6. Coulter Street through the Medical Center Neighborhood: Approximately 18 comments were placed along Coulter Street through the Medical Center area advocating for safer street crossings along this five-lane roadway that has a current speed limit of 40 mph. The comments emphasized that this area sees more foot traffic than other parts of Amarillo due to the presence of hotels and its popularity as a destination for patients and their visitors. The public requested additional safer midblock street crossings to enhance pedestrian safety.
7. Other High Priority Intersections: Several additional specific intersections were called out in the online survey, and are detailed as follows:
a. Georgia Street and Amarillo Collegiate Academy: As mentioned in previous sections, the public desires a midblock crossing in front of the Amarillo Collegiate Academy to allow students to safely walking or biking to the school.
b. Loop 335 and Arden Road: Frequently mentioned in other sections, this intersection gathered many public comments requesting safer pedestrian crossing infrastructure for students attending the West Plains High School.
c. 24th Street: Pedestrian crossings are desired by the public along 24th Street, where reports of jaywalking are commonly noted in the survey
d. Various Downtown Intersections: Several intersections in Downtown Amarillo were discussed to have better pedestrian crossing infrastructure, particularly along intersections along Polk Street and 10th Avenue.
e. Tacosca Road & Gem Lake Road and Amarillo Boulevard: Several comments focused on pedestrian safety at this large intersection, noting that all four approaches have slip right-turn lanes.

New or Improved Bike Lane Comment Highlights
The New or Improved Bike Lane countermeasure type gathered a total 425 comments discussing bicycle lanes in Amarillo. Generally, the public enjoys the City’s existing bike facilities, including both bike lanes and trails. Comments are visually displayed in a heat map in Figure TM-4.24. The numbering on the comment heat map is associated with the comment summaries provided in this section.
City of Amarillo | Safe Streets and Roads for All Plan

Figure TM-4.24. New or Improved Bike Lane Comment Heat Map
Sections below are numbered in association with the numbering on the comment heat map in Figure TM-4.24. From this analysis, several key takeaways were gathered from this countermeasure analysis. Specific key highlights for bicycling-related concerns in Amarillo are as follows:
1. Extend Rock Island Trail: The Rock Island Trail is a well-loved bicycle trail facility in Amarillo that runs adjacent to Plains Boulevard in an old railroad easement. Approximately 22 comments were made along this trail and all expressed desires to extend or improve the trail facility in the future. Specific recommendations from the public for the Rock Island Trail are described below:
a. The public expressed a desire for the Rock Island Trail to be extended westward Several hotels and commercial centers exist just west of the trail’s terminus, and the public indicated that extending the trail would provide convenient last-mile access to these major destinations.
b. Specific requests were made to extend the trail north to the BSA Hospital system, allowing workers to use the Rock Island Trail for commuting purposes. This extension would potentially require new bike lanes on Coulter Street, which is discussed further below in this section.
c. The public would like to see the trail extended on the north side to the new City bus terminal, which is currently underway as an existing city project.
d. Generally, the public loves the Rock Island Bike Trail and wants to see similar trail facilities in the future The public expressed that the separation from vehicles makes the Rock Island Trail enjoyable and safe for biking and specific requests were made for a similar north-south biking trail throughout Amarillo.
2. Medical Center Neighborhood Bicycle Improvements: The Medical Center neighborhood was frequently mentioned in this countermeasure category, gathering approximately 20 comments The Rock Island Trail currently ends in the Medical Center area, and several suggestions were made to add dedicated bicycle facilities to connect trail users to surrounding destinations and activity centers. Specifically, bicycle lanes are suggested by the public on Coulter Street, to connect the existing trail terminus to the medical facilities north of Wolflin Avenue and Amarillo Boulevard. This bicycle connectivity is desired so that people can use the Rock Island Trail to commute to work. The Medical Center area is home to major employment centers, including BCA Hospital, the Northwest Texas Hospital, and many additional medical offices, nursing homes, and rehabilitation centers.
According to the survey, in addition to Coulter Street, bicycle lanes are also specifically desired along Wallace Boulevard and Point W Parkway. The public would like future bike lanes on Wallace Boulevard connect to the 9th Street Trails north of 9th Avenue, with a safe street crossing needed to make this connection feasible. Additionally, since the Medical Center neighborhood is on the edge of Amarillo and surrounded by undeveloped land, there is a desire from the public for additional hiking, biking, and nature trails in the areas surrounding areas
3. Improvements to Existing Bicycle Facilities: Several existing bike lanes were discussed in the comments where upgrades or improvements are needed to improve safety for cyclists. Below summarizes the existing bike lanes that were of concern to the public:
a. Teckla Boulevard: Today, bike lanes exist on Teckla Boulevard from Andrews Avenue to about 600 feet north of the intersection of 45th Street. The public has indicated a strong desire for this bike lane to be completed from Olsen Boulevard to 45th Street along Teckla Boulevard. Two specific concerns were raised: First, is there is a gap between Floyd Avenue and 34th Avenue and the public desires to have this gap filled to complete the cycling network. Second, the bike lanes abruptly end at about 600 feet north of the intersection of Teckla Boulevard and 45th Street. The public wishes the bike lanes were carried through to the intersection for added safety and protection for cyclists
b. Bicycle Lanes Carried Through at Intersections: The public expressed a desire for Amarillo’s bicycle infrastructure to extend through street intersections. Today, many of Amarillo’s existing bicycle lanes disappear at intersections creating confusion, unsafe environments for cyclists, and ultimately may inhibit cyclists from using the bike lanes due to safety concerns. Several specific intersections where this occurs include Teckla Boulevard and 45th Street, Hansford Drive/Bush Drive and I-40 Northbound Frontage Road, and 7th Street in Downtown Amarillo at various intersections
4. Downtown Bike Lanes: Downtown Amarillo has several bike lanes and other bicycle infrastructure, and the public had many comments on this aspect. Several general recommendations were made to Downtown’s bicycle infrastructure, including the public desire to reduce all downtown 3-lane, one-way roads down to two lanes and add a protected bike lane. Another significant concern was the public dislike of biking on bricked streets, such as the 7th Street bicycle lane. Many reported that biking on these streets is uncomfortable and impractical due to the bumpy surface.
5. New Bike Lanes: New bike lanes were requested in several locations around Amarillo, including the following:
a. Fairway Drive: A cluster of comments supported adding dedicated sidewalk and bicycle lane facilities along this corridor. Many people walk and bike along this corridor already, so dedicated facilities are desired to improve safety for pedestrians and cyclists.
b. Wolflin Avenue: Public expressed interests in a bicycle facility along Wolflin Avenue to connect the commercial center to adjacent residential areas.
c. Georgia Avenue and Farmers Avenue: This intersection generated significant public interest, gathering around 20 comments in this category. Discussed in several of the previous categories, this road clearly is a major key area for the public in Amarillo.
d. Travis Street: The public has expressed a desire for bicycle lanes on Travis Street to connect the Hines Memorial Park to Carver Elementary School and other nearby destinations.

More Streetlights Comment Highlights
This countermeasure gathered 423 comments regarding streetlights in Amarillo. Many of the comments in this category discussed the need for additional neighborhood lighting, especially near local neighborhood park facilities. Several specific streets were identified as high priority areas and are detailed in this section. Comments are visually displayed in a heat map in Figure TM-4.25. The numbering on the comment heat map is associated with the comment summaries provided in this section.
City of Amarillo | Safe Streets and Roads for All Plan

Figure TM-4.25. More Streetlights Comment Heat Map
Sections below are numbered in association with the numbering on the comment heat map in Figure TM-4.25. From this analysis, several key takeaways were gathered from this countermeasure analysis. Specific key highlights for lighting-related concerns in Amarillo are as follows:
1. Loop 335 and Arden Road: This intersection remains a high priority intersection for safety improvements in Amarillo, with 30 comments placed at this intersection for lighting concerns. In addition to the slew of requests for upgrading the stop signs to traffic signals, comments discussed the need for additional streetlighting at this intersection. Public comments near this intersection discussed how dark this intersection can get at night causing drivers often to hit the stop signs and medians due to lack of lighting. The public is particularly concerned about the lack of lighting due to student drivers and student pedestrians who regularly use this intersection especially when it is difficult to see in the early morning hours
2. Amarillo Boulevard: Amarillo Boulevard, specifically on the north side of Amarillo between Western Street and Eastern Street gathered 23 comments regarding lighting concerns. The public indicated the need for additional street lighting at night and that this roadway can become quite dark. Additionally, comments discussed the desire to install decorative lighting and additional landscaping features along the medians on Amarillo Boulevard. Other comments mentioned how this segment is already lined with street lighting, but that often the existing lights are broken or not working at night.
3. Highland Park Village Neighborhood: The Highland Park Village neighborhood gathered a cluster of 20 comments regarding the need for additional street lighting. Comments indicated that the entire neighborhood only has very few streetlights, and the existing ones are old and provide inadequate lighting. Additionally, there were concerns about the safety of pedestrians walking to and from the Highland Park Village Park in the neighborhood. The lack of streetlighting is a great concern for both residents and visitors in this neighborhood.
4. Farmers Avenue & Georgia Street: Similarly to the New or Improved Sidewalk countermeasure category, these two street segments were frequently mentioned for lighting concerns. Specifically, 20 comments were left in this area concerned about the lighting of Georgia Street between 58th Street and Farmers Avenue, and Farmers Avenue between Georgia Street and Athens Street, including the intersection of the two streets.
5. Safety Lighting for Pedestrians near Local Parks: A large portion of the comments recorded in this category were concerned about street lighting for pedestrian safety between residential neighborhoods and nearby local parks. Below calls out specific highlights from the comments in this category.
a. Olsen School Park: More street lighting is desired by the public on Olsen Boulevard, specifically in front of the Olsen School Park, which is adjacent to the
Olsen Park Elementary School. The public specified that the park and Olsen Boulevard can be dark in the early mornings and evenings, and more streetlighting is desired to improve pedestrian visibility. The intersection of Olsen Boulevard and Harmony Street, where a crosswalk currently exists, was also requested by the public to add more lighting for safety and pedestrian visibility.
b. Paramount Terrace Elementary School Park: Comments discussed the need for additional lighting along Terrace Drive leading up to the park, and the elementary school. Comments indicate there is no streetlighting today, and how this area can become quite dark and dangerous for pedestrians using the park or crossing the street.
c. Thompson Park: More street lighting is desired throughout all areas of Thompson Park. The comments mention the need for additional lighting on the internal park street network for safety and visibility, as well as additional street lighting needed on walking and biking trails. It was also noted that Hastings Avenue north of Thompson Park is also a dark corridor and could benefit from additional streetlighting.
d. Martin Road Park & Gene Howe Park: A cluster of comments were placed on several streets near Martin Road Park and Gene Howe Park, including 15th Avenue, Martin Road, and Dale Street. Specifically, comments were raised about the east side of Martin Road, where there is a fence and a steep drop into the lake. The public indicated that this sharp drop on the other side of the fence can be extremely dangerous at night without any lighting around.
e. East Park: Comments indicate the need for lighting in East Park and in the residential areas leading up to this park. It was noted that the only source of streetlighting that is available in the park today are the lights on the basketball courts. Additionally, it was also mentioned that additional streetlighting is needed between Sanborn Elementary School and the park, separated only by one block.
f. Eastridge School Park: Comments indicated the need for additional streetlights throughout the Eastridge neighborhood, and specifically to provide safety for people walking to and from the Eastridge School Park and the elementary school. Comments indicate that it is often time hard to see pedestrians in this neighborhood due to lack of adequate street lighting.

Other Comment Highlights
A total of 1,078 comments were categorized as “Other” comments. Despite the large number of comments in this category, many of these comments were tagged with previously mentioned countermeasure types through the keyword association analysis Several themes emerged from these comments, including school or student-related comments, school zone related comments, signs other than stop signs, and trails. Table TM-4.5 details themes from each major comment area in this comment type.
Table
TM-4.5.
Other Comment Categorization
Student and/or School Related Comments
School or school-related comments made up approximately 46% of those categorized as “Other.” These comments primarily discussed the need for drivers to slow down near schools and adjacent residential areas. Many comments highlighted the dangers for students crossing streets near schools, particularly due to speeding vehicles and lack of crosswalks or adequate crossing infrastructure. Additionally, many comments pointed out the lack of sidewalks near schools and in adjacent neighborhoods as well. There were also concerns streets near high schools often have higher rates of safety issues due to inexperienced drivers frequenting the nearby street.
Comments in this category also discussed the need for new school zones, particularly at the Amarillo Collegiate Academy Commentors report dangerous conditions for pedestrians due to high traffic volumes, frequent speeding, and insufficient signage or enforcement in areas where students and other pedestrians are present during school hours. Multiple incidents of near-miss collisions and actual crashes were reported in this section of comments. Other school zone related comments include the request for new school zone traffic control infrastructure for the Olsen Park Elementary School, and upgrades/additional protection at the Amarillo High School due to high speeds on Bell Street.
Roadway Repair
Roadway repair concerns made up a significant portion of the feedback from residents, with the majority focusing on the poor condition of various streets. Many residents highlighted the dangers posed by large potholes, rough surfaces, and erosion on key streets such as Grand Street and Hyde Parkway. Residents expressed frustration with temporary patchwork repairs and called for complete repaving of the affected roads. Additionally, drainage problems, discussed in later of this section, exacerbated the road conditions, with water pooling in low spots and causing further deterioration. Frequent requests were made to address both the surface quality and underlying drainage issues to ensure long-term road safety and usability.
Roadway Capacity Related
Comments related to roadway capacity emphasized the need for road widening and the creation of additional lanes, particularly in areas experiencing increased traffic volumes due to new developments. Streets like Georgia Street and Farmers Avenue were frequently mentioned as needing expansion to alleviate congestion and improve traffic flow. Additionally, several intersections were cited as needing dedicated turn lanes to reduce bottlenecks and confusion. The public also suggested traffic circles/roundabouts and other measures to enhance the capacity and safety of heavy traffic roads. There were calls for redesigning streets in the downtown area to improve access for all road users, including pedestrians and cyclists, through road diets and lane reductions.
Turning Movement Related
Residents expressed concerns about dangerous turning movements at various intersections, highlighting the need for better traffic control measures. Issues such as the lack of dedicated turn lanes, poorly timed traffic signals, and confusing road markings were frequently mentioned. Specific intersections, like those on Bell Street and Hillside Road, were identified as needing safety improvements to reduce the risk of collisions. Many comments called for the installation of curbed medians and concrete barriers to prevent illegal left turns and to channel traffic more safely. There was also significant support for the addition of protected turn signals and better signage to clarify turning rules for drivers.
Connectivity Related
Connectivity-related comments focused on the need for new road extensions, better access to key areas, and improvements to the existing street grid. Residents frequently mentioned the benefits of extending roads like Coulter and Clubview Drive to reach key destinations or to connect with other major streets in the area. Such extensions could enhance traffic flow and reduce congestion on adjacent streets, making travel more efficient and providing alternative routes for drivers. By extending these roads, residents believe that connectivity between neighborhoods, commercial areas, and other parts of the city would improve, ultimately leading to less traffic buildup on currently overburdened routes. There were also calls to connect deadend streets and provide more direct access routes, particularly in neighborhoods that feel disconnected from the rest of the city. The public expressed concerns about the lack of adequate access to parks, schools, and commercial areas, suggesting that improved connectivity could reduce travel times and make these areas safer and more accessible for all residents.
Parking Related
Approximately 5% of the comments assigned to the “Other” category discussed parking related safety issues in Amarillo. Residents are concerned about the safety hazards caused by parking issues on various streets, particularly during high-traffic events like sports games and school peak times Some comments recommended removing parking on one side of the street for safety, examples include 10th Avenue, Independence Street, and NW 1st Street from Western Street to Palo Duro High School. The public would like the City to consider removing on-street
parking near intersections as conflicts with turning vehicles can occur. Other recommendations in this category suggest additional enforcement of existing parking rules, especially in Downtown Amarillo. There are also calls for better parking lot maintenance and to reduce the surface parking lot footprint in favor of structured parking to enhance safety for pedestrians and cyclists
Drainage Related
Around 3% of the “Other” comments discussed drainage related issues in Amarillo. The public discussed frequent intersections or streets where water pools during times of heavy rain, including 45th Street (around Osage Street), Pond Street, Prestwick Street, and frontage road intersections with I-27. Concerns were raised about public health risks related to standing and stagnant water, and requests were made for improved drainage and debris removal Other intersections that were mentioned where drainage was requested to be improved include Ridgewood Drive and Devon Drive, 58th Avenue and Janae Street, and Mockingbird Lane and Britain Drive.
On- and Off- Ramp Related
A small percentage, 2%, of comments categorized as “Other” discussed ramp-related issues in Amarillo. Concerns were raised about dangerous on-ramp situations, particularly the narrow roadway and tight turns near the baseball field on 10th Avenue, where residents suggested developing an additional on-ramp. The westbound frontage road on-ramp to I-40 from Georgia Street was frequently mentioned as hazardous due to short merging distances and vehicles stopping on the ramp. Similarly, the northbound frontage road on-ramp to I-27 from 45th Avenue was cited for unsafe merging conditions. Additional feedback included the lack of an off-ramp for westbound I-40 to SE 3rd Avenue, issues with ramps being too close to off-ramps causing dangerous merging, and suggestions for better signage reminding drivers to accelerate when entering highways. Flooding issues that make ramps impassable after heavy rains and the need for repaving and lengthening ramps for safer merging were also mentioned.
Bus Related
Lastly, 1% of comments discussed bus related safety in Amarillo. Comments discussed the desires for upgraded bus stop amenities including benches and covered bus stops. Some of the comments desired a bus stop to several popular local destinations, including local movie theaters, Goodwill, and the Public Library. Additionally, many comments discussed the need for improved public transportation in the Medical Center neighborhood since this area has inherently higher transit ridership levels than other areas of Amarillo.
Comments by Neighborhood
In addition to leaving comments, the public was also asked to identify which neighborhood in Amarillo they lived in. This question was optional, and not all participants provided this information To analyze the data spatially, each comment was mapped using GIS, and a neighborhood assignment was made based on the comment’s geographic location. This allows
for a comparison between the percentage of comments originating from where survey participants live and where their comments were placed geographically. Table TM-4.6 below shows the top 10 most commented on neighborhoods, both by where people live and by the comment locations.
The results of this geospatial analysis are displayed on the following page in Figure TM-4.26 This graph shows the distribution of comments by neighborhood, distinguishing where there is a balance between the number of comments left by residents and the locations where comments were placed. The purpose of this graph is to highlight the neighborhoods that had an even split between people who lived in the neighborhood versus where people were leaving comments. For example, neighborhoods like Sleepy Hollow, Hollywood/Scotsman, and The Woodlands have yellow and blue bars of similar lengths, indicating a balance between where people live and where they left comments. This balance suggests that residents are equally concerned about their own neighborhoods and actively comment on issues within their immediate surroundings. On the other hand, neighborhoods with significant differences between the yellow and blue bars indicate that residents are focusing their comments on areas outside their own neighborhoods. This graphical representation provides valuable insights into the engagement of Amarillo's residents across different neighborhoods.
Several maps were also created to visually display where respondents live versus the neighborhoods where comments were placed. These maps also provide the name and the geographic boundaries of Amarillo’s neighborhoods. Figure TM-4.27 shows the neighborhoods where survey participants live with darker shades representing neighborhoods where a higher number of comments were generated. Similarly, Figure TM-4.28 displays the neighborhoods where the comments were placed with darker shades indicate neighborhoods where more comments were located.
Table TM-4.6. Top 10 Neighborhoods by Where People Live and by Where the Comments were Made
City of Amarillo | Safe Streets and Roads for All Plan

Figure TM-4.26. Distribution of Comments by Neighborhood by Where People Live and by Where the Comments were Placed
City of Amarillo | Safe Streets and Roads for All Plan

Figure TM-4.27. Comments by Where People Live
City of Amarillo | Safe Streets and Roads for All Plan

Figure TM-4.28. Comments by Where Comments were Placed
Comment Reaction Highlights
The public was allowed to react to other comments that were placed in the online survey. The table below summarizes the comment reactions by countermeasure type. More Stop Signs and/or Signals gathered more comment upvotes than the others, followed by Reduce Speed and New or Improved Sidewalks. This indicates where the public’s priorities are in terms of types of safety improvements throughout the City.
Table TM-4.7. Comment Reactions by Countermeasure Type
Conclusion
Overall, a total of 4,771 comments were reviewed, analyzed, and summarized based on countermeasure type and by neighborhood. Amarillo residents identified several high priority safety concern areas, especially near schools. The public expressed significant concern about student and school-related safety, and a large portion of the comments detailed safety issues around schools including sidewalk gaps, lack of safe crossing infrastructure, and the need to for traffic calming countermeasures near school areas.
In addition to school safety, the "More Stop Signs and/or Signals" countermeasure received the most attention, with the public requesting for improvements at key intersections citywide such as 45th Avenue and Bell Street, 45th Avenue and Coulter Street, and Loop 335 and Arden Road.
Speed reduction measures were also a priority, especially on major arterials and in residential areas, where speeding poses significant risks. Streets such as Hillside Road, Bell Street, Soncy Road, and Teckla Boulevard were frequently mentioned as needing interventions to reduce speeds and enhance safety.
Sidewalk improvements were another major concern, with many residents pointing out the lack of connectivity in neighborhoods and near parks and schools specifically along 45th Street, Georgia Street, Western Street, and Farmers Avenue
Similarly, the public emphasized the need for better crosswalks and pedestrian refuge islands in high-traffic areas to enhance pedestrian safety. Key locations include Bell Street (Amarillo High
School), 45th Avenue and Bell Street and 45th Avenue and Coulter Street, Western Street and 9th Avenue.
Bicycle infrastructure also garnered attention, with calls for new bike lanes and upgrades to existing ones. Some of the most commented streets or locations include Teckla Boulevard, Rock Island Trail, Fairway Drive, and Wolflin Avenue.
Lighting improvements were highlighted as necessary to improve safety in poorly lit areas, particularly in residential neighborhoods and along major roads. Areas of concern include Georgia Street, Olsen Boulevard, Thompson Park, Amarillo Boulevard, and Highland Park Village Neighborhood
The public feedback gathered through this online survey will inform project development and prioritization of projects within Amarillo's Safe Streets and Roads for All Plan. Incorporating community feedback is essential to ensure the plan reflects the needs and concerns of residents. By carefully analyzing and integrating these insights, the City can create a safer, more accessible transportation network that aligns with the public's expectations and priorities.
Technical Memorandum 5: Online Survey #2 Analysis
Introduction
A second online survey was developed for the Amarillo Safe Streets and Roads for All (SS4A) plan to identify community-backed strategies and policies for transportation safety in the City of Amarillo. The survey will help planners, engineers, stakeholders, and city officials in making more informed decisions on strategies to enhance safety for all roadway users By aligning future transportation initiatives with the needs and priorities of those who live, work, and travel in Amarillo, this approach ensures a more inclusive and responsive planning process
The second online survey was live for approximately one month, between September 23rd, 2024, and October 25th, 2024. A total of 1,404 responses were collected Survey responses were collected through several sources, detailed in Table TM-5.1 below. The majority of survey responses were collected through social media outreach, totaling 735 responses. Additionally, email links proved to be an effective source as well, contributing 439 responses to the overall survey pool.
Table TM-5.1 Survey Responses by Collector Type
Survey Engagement Overview
To ensure widespread participation and to build upon the momentum of the first online survey, several advertisement strategies were implemented to gather feedback for the second online survey. Table TM-5.2 provides the details and dates for all outreach efforts conducted by the engagement team. For this online survey, a multifaceted engagement strategy was implemented, and consisted of in-person events, library visits, email blasts, Facebook posts, and other media coverage and outreach. Figure TM-5.1 and Figure TM-5.2 showcase some of the in-person outreach engagement efforts.
Table TM-5.2 Online Survey #2 Advertisement Efforts
Media Type
In-Person Event
Library Visits
Email Blasts
Facebook Posts
Westover Pop-Up Park Party
City Council
Boo at the Zoo
Boo at the Zoo
Transit Station Visit
Northwest Branch Visit
Southwest Branch
North Branch Visit
East Branch Visit
Downtown
Southwest Branch
Participants from 1st Survey
City of Amarillo Employees
Neighborhood Associations
Realtors Association
Community Connectors
Facebook Post #1
Facebook Post #2
Facebook Post #3
Media Coverage
September 23, 2024
September 24, 2024
October 18, 2024
October 19, 2024
October 22, 2024
September 26, 2024
September 30, 2024
October 3, 2024
October 5, 2024
October 15, 2024
October 16, 2024
October 15, 2024
October 15, 2024
October 17, 2024
October 17, 2024
October 17, 2024
September 25, 2024
October 7, 2024
October 23, 2024
Press Release (No date available)
Lunch & Learn
Channel 7 News
Stakeholder Interviews
October 9, 2024
October 17, 2024
October 2024


Figure TM-5.1 In-Person Outreach
Figure TM-5.2 Pop-Up Event
Survey Feedback Summary
The second online survey had a total of 12 multiple choice questions. This Technical Memo summarizes the feedback, by each question, in the following sections. Most of the questions in this online survey included an “Other (please specify)” as an option in order to provide any open-ended feedback or to expand on an idea the respondent may have. The open-ended feedback was analyzed for each question and is summarized in the analysis notes for that question. Overall, residents’ top transportation safety priorities included crash hotspot improvements, speed management, safer routes to key destinations, and pavement condition improvements There is also a strong community interest in policies and projects that address road safety holistically, such as enhanced lighting, traffic calming, and better intersection design.
Question 1: What neighborhood in Amarillo do you live in?
Table TM-5.3 summarizes the responses gathered for this question. Many Amarillo neighborhoods were represented in the second online survey. The top three neighborhoods that had the most responses included Olsen, Wolflin, and Puckett. Comments that were recorded in the “Other (please specify)” response category were reviewed and assigned to specific neighborhood if applicable. Two new categories were made for this table, including the “Not in City Limits,” response, which gathered approximately 2.7 percent response rate, and “Unknown,” which gathered 1.3 percent of total responses to this question.
Table TM-5.3 Survey Responses by Neighborhood
Question 2: Project Prioritization Criteria – Which criteria should the City prioritize when selecting safety projects for implementation? (Select up to 2 Options)

TM-5.3 Question 2 Survey Results
The results of this question are displayed above in Figure TM-5.3 For question 2, the public was asked to select up to two responses to show their top prioritization criteria for transportation improvements in Amarillo. The majority of respondents, approximately 54.7 percent, indicated they want to see transportation investments in areas with high crash hotspots. This was followed by lowering speeds (29.3 percent) and creating safer connections to destinations such as schools, transit, and jobs (26.9 percent). There was a close fourth place, which was improving pedestrian and bicycle safety, which consisted of 25.9 percent of responses. After the top four options, the response rate drops, leaving transportation equity, other input (an openended response), and cost-effective solutions lower on the public’s priority list. Overall, the public made a clear indication that addressing crash hotspots is a high priority in selecting transportation safety projects. This strong preference underscores the community's focus on targeted improvements that can effectively reduce crashes in high-risk areas.
Approximately 15.6 percent of survey respondents chose to fill in their own answers by using the “Other (please specify)” category. Respondents indicated concerns about roadway conditions, emphasizing issues with potholes, uneven surfaces, and construction-related issues such as the need for better construction zone signage and access difficulties with closed streets. The public also desires to see better street lighting and asked to prioritize installing new streetlights on city streets, particularly on major roads and intersections, to enhance visibility and safety. Traffic control was also a major topic of discussion in this category, where the public indicated the desire for better red-light enforcement, adding more stop signs, and more optimized traffic signal timing.
Figure
Question 3: Would you be willing to remove parking spaces within public right-of-way for additional sidewalks, bike lanes, or other pedestrian or bike infrastructure?

TM-5.4 Question 3 Survey Results
The results of this question are summarized in Figure TM-5.4 67.8 percent of respondents indicated they would be willing to remove parking spaces within the public right-of-way to construct additional sidewalks, bike lanes, or other pedestrian or bicycle infrastructure. 32.2 percent of respondents said they would not be willing to trade the parking spaces. This question was included due to potential right-of-way constraints in areas needing new pedestrian or bike infrastructure. In some cases, removing on-street parking may be one of the few feasible options for adding these facilities. While not a default approach, this strategy may be necessary in specific situations, and gathering resident feedback helps inform decisions if such trade-offs become necessary.
Figure
Question 4: Speeding is the leading cause of crashes in Amarillo and was a major concern in our last survey. How should the City address speeding in residential neighborhoods in future safety projects? (Select up to 3 Options)

The results of this question are summarized in Figure TM-5.5. The public was asked to select up to three options for this question to indicate how they would like the City of Amarillo to address speeding in residential neighborhoods. The majority of respondents (64.8 percent) indicated they want to see additional speed cushions be installed within residential neighborhoods. Following that, the second highest ranked option was increased law enforcement (44.0 percent) and road diet on residential streets (33.1 percent).
Approximately 10.1 percent of respondents selected “Other (please specify)” as an option for addressing speeding within residential neighborhoods. The open-ended feedback discussed wanting to see speed reductions and additional traffic signage on neighborhood streets, such as more speed limit signs or flashing warning signs to slow down near parks, schools, or crosswalk/intersection areas. The public also expanded on their desire for additional traffic enforcement on residential streets in the open-ended responses, specifically for increased enforcement around the issue of stop sign and red light running.
Figure TM-5.5 Question 4 Survey Results
Question 5: How do you want the City to address speeding on arterial roads in future safety improvement projects? (Select up to 3 Options)

The results of this question are summarized in Figure TM-5.6. There was a close tie for first place – with increased law enforcement gathering 45.3 percent of responses and converting two-way left-turn lanes into a concrete median, gathering 44.9 percent or responses The third place priority is adding additional speed limit signs on arterial streets. Following the top three options, the public indicated their priorities for addressing speeding on arterial roads are road diets (38.5 percent), roundabouts (30.9 percent), and additional education campaigns (9.1 percent).
Approximately 8.0 percent of respondents answered “Other (please specify)” for this question. The open-ended feedback gathered from this question discussed the need for increased enforcement specifically around construction sites and near schools. The public also indicated that upgrading traffic signals and optimizing signal timing could help address speeding along arterial roads. Additionally, there was expanded support for removing center turn lanes in the open-ended feedback, with comments discussing how drivers will sometimes use the center turn lane to weave through traffic or make other unsafe traffic maneuvers.
Figure TM-5.6. Question 5 Survey Results
Question 6: Which policy changes would you most support to foster safer streets in Amarillo? (Select up to 2 Options)
TM-5.7. Question 6 Survey Results
The results of this question are summarized in Figure TM-5.7 For this question, respondents were allowed to choose up to two options. Approximately 54.9 percent of survey respondents want Amarillo’s streets to be designed safer to protect all roadway users. Following this, 38.7 percent of respondents want to see stronger traffic enforcement, and 31.2 percent of respondents want to see an increase in safety funding allocation. Only 21.2 percent of survey respondents prioritized a citywide zero traffic death policy.
Approximately 7.1 percent of survey respondents responded “Other (please specify)” for this question. Open-ended feedback themes heard from this question included the appeal for a policy around more frequent street maintenance to fill potholes, smooth roads, and to maintain quality driving conditions. Other feedback discussed citywide policies for better construction zone signage, increased law enforcement for residential speeding, and more street lighting along arterials and residential areas for public safety.
Figure
Question 7: Choose your top 3 improvements you would like to see implemented on streets in Amarillo.

TM-5.8 Question 7 Survey Results
The feedback gathered from this question is displayed in Figure TM-5.8. Respondents were asked to choose their top three types of safety improvements they want to see prioritized in Amarillo. The top ranked choice for this question was smoother roadway pavement (49.2 percent), followed by streetlights (45.4 percent), and speed bumps/cushions (35.7 percent). Excluding the “Other (please specify)” category, the bottom three categories included medians (14.5 percent), bike lanes (13.0 percent), and bus stops (3.7 percent).
Almost 10 percent of survey respondents selected “Other (please specify)” as a response to this question. The open-ended feedback themes heard from this question included additional roadway maintenance improvements including intersection redesign, intersection timing upgrades, filling potholes, and more frequent pavement marking and curb painting. The public also discussed reallocating infrastructure improvement funding to hire more police officers for additional enforcement. Lastly, construction zones were again frequently mentioned in the openended feedback. The public expressed hesitation to begin new roadway improvement projects before finished the existing construction in the City.
Figure
Question 8: Choose your top 3 improvements you would like to see implemented at intersections in Amarillo.

TM-5.9. Question 8 Survey Results
The results of this question are displayed in Figure TM-5.9. The public was asked to choose their top three improvements that would be implemented at intersections in Amarillo. The top three improvements include streetlights (50.4 percent), turn lanes (44.3 percent), and traffic signals (41.7 percent). This is on par with the general street lighting and traffic signalization feedback themes heard throughout this survey The bottom three categories in this question, excluding “Other (please specify)”, include pedestrian signals (20.4 percent), curb extensions or bulb-outs (19.2 percent), and ADA curb ramps (12.5 percent).
Approximately 8.8 percent of survey respondents chose the “Other (please specify)” category. Open-ended feedback gathered from this question discussed the need for better signal timing, both specifically for more coordinated timing along corridors, and smarter signals that can detect the presence of vehicles, rather than only being on a timed loop. Also, regarding signals, there was frequent and mixed feedback about flashing yellow arrows at intersections. Some of the open-ended feedback indicated the wish to have more frequent flashing yellow arrows due to congestion and long left turn wait times, but other comments said they want flashing yellow arrows removed all together to enhance safety and potential left turn crash conflicts with oncoming traffic. Another theme was the request to have more law enforcement at intersections due to frequent red light running and drivers not stopping fully when turning right.
Figure
Question 9: If more funding becomes available, which types of projects do you think should be the highest priority for the City? (Select up to 3)
TM-5.10. Question 9 Survey Results
The results of this question are displayed in Figure TM-5.10. In this question, the public was asked to select up to three choices for this question. There was a close tie for first place, with pavement quality coming in as the highest ranked answer for this question (51.8 percent), followed by intersection improvements (50.6 percent). The third highest ranked category in this question was traffic calming, gathering 43.4 percent of responses. The bottom three responses in this category, excluding the “Other (please specify)” category, include school zone safety, roadway redesign, and public awareness. The top themes are in alignment with other feedback heard in this survey, with the public frequently mentioning pavement conditions as a public concern.
Approximately 5.5 percent of survey respondents chose “Other (please specify)” as a category in this question. The feedback discussed familiar themes of increased law enforcement, finishing roadway construction, and adding additional stop lights and stop signs around the City.
Figure
Question 10: How do you usually get around Amarillo? (Select exactly 2 Options)
TM-5.11 Question 10 Survey Results
Responses to this question indicated that most people drive in Amarillo as their primary mode of transportation (97.7 percent), followed by walking (58.9 percent). The rest of the transportation modes had a general even split, with rideshare services gathering 14.2 percent of responses, the “Other (please specify)” category gathering 13.8 percent of responses, and biking as 12.3 percent of responses. Transit came in last place with approximately 2.1 percent of responses
The “Other (please specify)” category indicated that some individuals rely on family members for their transportation needs, or primarily use some form of carpooling. Other respondents indicated that traveling by motorcycle was their primary form of transportation. Lastly, some of the open-ended feedback indicated that some respondents only drive, and that they just chose the “Other (please specify)” category because they do not use a second mode of transportation
Figure
Demographic Questions
Several optional demographic questions were also collected at the end of the online survey. Table TM-5.4 and Table TM-5.5 summarize the results of these questions. About a fourth of the survey respondents were over 60 years old. Most survey respondents were white (79.4 percent) and were between the ages of 30 – 59 (approximately 61.9 percent). The age and race distribution of survey respondents were optional questions, so not every participant answered these questions.
Table TM-5.4 Question 11 Survey Results
Table TM-5.5. Question 12 Survey Results
Conclusion
The public provided clear directions for transportation safety policy in Amarillo. The public would generally like to see an increase in law enforcement to deal with speeding issues across arterial roads the City and would also like to see safer street design in future roadway rehabilitation projects (such as the construction of medians). The public would like to see the City focus more investment in the maintenance of City streets, by smoothing roads and maintaining better roadway quality. Finally, the public wanted to see wholistic approaches to improve roadway safety, such as enhanced lighting, traffic calming measures, and better intersection design.
Technical Memorandum 6: Crash Analysis
Crash Analysis
The safety of all roadway users is a top priority for the City of Amarillo (City) The Crash Analysis Technical Memorandum (CATM) is part of the City’s undergoing Safe Streets and Roads for All (SS4A) Plan and it’s also a continuation effort of the City’s 2045 City Plan. The CATM aims to provide a comprehensive overview of crashes that have occurred within the city limits from 2019 to 2023. By examining and analyzing crash data over this five-year period, the CATM identifies trends, patterns, and potential contributing factors to these crashes
The findings in this memo will serve as a foundation for informed decision-making and implementation of targeted countermeasures aimed at reducing the frequency and severity of crashes within the city.
Summary
A total of 18,023 crashes occurred between 2019 and 2023 in the City of Amarillo on all roads except the interstates 75 The Texas Department of Transportation’s (TxDOT) Crash Reporting Information System (CRIS) provided the crash data. The High Injury Network (HIN) is developed from this crash database as well
Figure TM-6.1 illustrates the crash density for crashes analyzed in this memo. It shows hotspots primarily clustered around downtown Amarillo and major corridors such as SW 34th Avenue, SW 45th Avenue, Hillside Road, S Georgia Street, S Western Street, S Coulter Street, NE 24th Street, among others. To enhance readability, four quadrant crash density maps are also provided in this section.
75 Excluding the interstates from the database is made due to limited safety-related resources, prioritizing the safety of local roads over interstate facilities
City of Amarillo | Safe Streets and Roads for All Plan
Figure TM-6.1. Crash Density (Overview)
City of Amarillo | Safe Streets and Roads for All Plan

Figure TM-6.2. Crash Density (Northwest Quadrant)
City of Amarillo | Safe Streets and Roads for All Plan

Figure TM-6.3. Crash Density (Northeast Quadrant)
City of Amarillo | Safe Streets and Roads for All Plan

Figure TM-6.4. Crash Density (Southwest Quadrant)
City of Amarillo | Safe Streets and Roads for All Plan

Figure TM-6.5. Crash Density (Southeast Quadrant)
Overall Crash Trend
The crash trend analysis from 2019 to 2023 indicates an overall decreasing pattern in crash occurrences as illustrated in Figure TM-6.6. While there was an initial peak in 2019 with 4,232 crashes, subsequent years saw variations, ultimately resulting in a total reduction of 28.8 percent by 2023 Alongside the crash data, Figure TM-6.6 also includes DVMT (Daily Vehicle Miles Traveled) data from Potter County and Randall County, where City of Amarillo is situated. Derived from the TxDOT Roadway inventory up to 2022, DVMT offers insights into total vehicle miles traveled in both counties, covering on-system and off-system roadways. Despite fluctuations in crash occurrences over the years, DVMT consistently shows an overall increase in vehicle travel, using 2019 as a base year. The data highlights the importance of monitoring traffic volume alongside crash trends to ensure effective transportation planning and safety countermeasures within the region.
Crash Characteristics
The section below discusses the characteristics of the 18,023 crashes occurring from 20192023 and provides information about the crash characteristics such as crash severities, first harmful events, contributing factors, other factors, and manner of collision. The data presented in this section is a comprehensive overview of the dynamics shaping road safety within the fiveyear timeframe.
Crash Severity
Crash Severity, commonly represented by the KABCO scale, is a method used to categorize the severity of crashes. The scale categorizes the severity of crashes into five levels: Fatal (K),
Figure TM-6.6. Total Number of Crashes and Daily Vehicle Miles Traveled by Year
Incapacitating/ Severe Injury (A), Non-Incapacitating/ Non-Severe Injury (B), Possible Injury (C), and Property Damage Only (O), based on the extent of injuries and property damage involved. Understanding crash severity is essential for prioritizing safety countermeasures, allocating resources effectively, and implementing targeted countermeasures to reduce injury and fatality rates.
The crash severity analysis revealed that most crashes (69.0 percent) did not result in any reported injuries. Following this, 12.8 percent were classified as possible (C) injury crashes, with an additional 8.0 percent categorized as suspected minor (B) injury crashes. Within the City, a total of 64 fatal (K) crashes occurred, constituting 0.4 percent of total crashes, alongside 446 incapacitating (A) injury crashes, which accounted for 2.5 percent of the total. The remaining crashes resulted in unknown injuries, comprising 7.3 percent of the total crash count. Table TM6.1 illustrates the number of crashes by severity, Figure TM-6.7 shows the distribution of crashes by severity based on percentages.

Table TM-6.1. Number of Crashes by Severity
Figure TM-6.7 Distribution of Crashes by Severity
First Harmful Event
The first harmful event is the first injury or damage-producing event that characterizes the crash type. It usually includes motor vehicle, pedestrian, pedal cyclist/ bike, fixed object, etc. 76 Understanding the first harmful event is crucial for identifying crash patterns, evaluating existing safety countermeasures, and prioritizing infrastructure improvements. Analyzing this data also offers insights into vulnerable roadway users, enabling targeted safety countermeasures. See the next section for more on vulnerable roadway users.
Of all crashes analyzed, vehicle crashes constituted the majority at 76.3 percent, followed by crashes involving fixed objects (such as light poles and fences) at 11.6 percent, and crashes with parked cars at 8.9 percent. Pedestrian-related crashes accounted for 0.9 percent of the total, while bike crashes comprised 0.4 percent. Crashes involving trains were less than 0.1 percent, with all other crashes including overturns, animal-related crashes, and crashes with other objects contributing to 1.7 percent of the total. Table TM-6.2 also compares the First Harmful Event data for the entire state of Texas over the same period (2019 to 2023). It is evident that the trend for both the City of Amarillo and the State of Texas is similar, with vehicle crashes having the highest percentage of total crashes, while pedestrian and bike crashes have lower percentages.
Table TM-6.2. Percentages of Crashes by First Harmful Event
Vulnerable Roadway Users
While analyzing crash data, a notable pattern appeared – while vehicle-related crashes typically accounted for most crashes, the severe or fatal injuries that involved vulnerable roadway users (namely pedestrians and bicyclists) stood out significantly.
For the City of Amarillo, approximately 2.1 percent of vehicle-related crashes, 3.8 percent of fixed objects-related crashes, and 1.1 percent of parked car-related crashes resulted in severe or fatal crashes In contrast, 35.9 percent of pedestrian crashes and 17.5 percent of bike
76 Federal Highway Administration. (n.d.). Chapter 3. program level strategies for integrating speed management. Chapter 3.
Program Level Strategies for Integrating Speed Management | FHWA. Retrieved February 8, 2023, from https://highways.dot.gov/safety/speed-management/integrating-speed-management-within-roadway-departureintersections-and-4
crashes led to severe or fatal injuries. This translates to pedestrian crashes being 17 times more likely to result in a severe or fatal injury compared to vehicular crashes, while bicycle crashes are eight times more likely as shown in Figure TM-6.8.
Examining data related to vulnerable roadway users is essential for identifying areas of concern, prioritizing infrastructure enhancements to improve safety for pedestrians, cyclists.
Figure TM-6.9
illustrates the distribution of first harmful events between Texas and Amarillo in crashes, showcasing their share of percentages of the total number of crashes versus percentages of fatal and severe crashes when comparing to the number of crashes by each first harmful event. For instance, in the city of Amarillo, pedestrian crashes represent only 0.9 percent of total crashes, but 35.9 percent of pedestrian crashes were fatal or severe crashes. Similarly, bike crashes account for only 0.4 percent of total crashes, but almost 18 percent of bike crashes were fatal or severe crashes In contrast, despite vehicle crashes representing 76 percent of total crashes, only approximately two percent of these result in severe or fatal crashes.
The State of Texas, on the other hand, shows a significant difference in fatal and severe crashes compared to the City of Amarillo. The percentage of pedestrian and bicycle crashes among all crashes was the same between Texas and Amarillo. However, when comparing fatal and severe crashes, only 2.3% of such crashes involved bicycles statewide, whereas in Amarillo, the figure was 17.5%. Similarly, pedestrian crashes accounted for 10.3% of Texas's total fatal and severe crashes, compared to nearly 36% in Amarillo. In Texas, 50% of fatal and severe crashes involved vehicles, whereas in Amarillo, vehicles were involved in only 2.1% of such crashes. Several factors may explain these disparities:
• This analysis focuses more on city roads, whereas the TxDOT crash information covers the entire state, including highways. According to the 2022 TxDOT Roadway Inventory, Texas has almost 260 times the daily vehicle miles traveled (DVMT) compared to the City of Amarillo. More DVMT means more cars on the road, which leads to an increasing number of fatal and severe vehicle crashes.
Figure TM-6.8. Distribution of First Harmful Events in fatal (K) and severe (A) Crashes
• Amarillo is more urbanized compared to the overall state of Texas. This urbanization results in denser streets, more complicated roadways, a higher density of intersections, and more concentrated activities, leading to increased pedestrian and bike movement. Consequently, this results in higher percentages of fatal and severe pedestrian and bike crashes.

Despite the differences between the statewide average and Amarillo's data, both sets show an increase in the percentage of fatal and severe pedestrian and bike crashes relative to their share in total crashes. Therefore, pedestrians and bicyclists are identified as vulnerable roadway users as they are at a higher risk of getting seriously or fatally injury in crashes compared to vehicle crashes. These findings emphasize the necessity of creating a Safe Street for All Plan.
Figure TM-6.10 depicts a crash density map of vulnerable roadway user crashes, indicating that a significant concentration of such crashes occurred near downtown areas, Amarillo Boulevard, SW 6th Avenue and Georgia Street, SW 45th Avenue and Western Street, and Coulter Street and Wolflin Avenue. This visualization underscores the need for targeted interventions and enhanced safety measures to protect vulnerable roadway users in these high-risk areas. Four quadrant crash density maps are also provided in this section.
Figure TM-6.9. Distribution of First Harmful Events in Total Crashes and Fatal (K) and Severe (A) Crashes
City of Amarillo | Safe Streets and Roads for All Plan

Figure TM-6.10. Vulnerable User Crash Density Map (Overview)
City of Amarillo | Safe Streets and Roads for All Plan

Figure TM-6.11. Vulnerable User Crash Density Map (Northwest Quadrant)
City of Amarillo | Safe Streets and Roads for All Plan

Figure TM-6.12. Vulnerable User Crash Density Map (Northeast Quadrant)
City of Amarillo | Safe Streets and Roads for All Plan

Figure TM-6.13. Vulnerable User Crash Density Map (Southwest Quadrant)
City of Amarillo | Safe Streets and Roads for All Plan

Figure TM-6.14. Vulnerable User Crash Density Map (Southeast Quadrant)
Contributing Factor
A contributing factor in a crash refers to any element or circumstance that primarily contributes to the occurrence or severity of the crash. These factors can include human error (such as distracted driving or speeding), vehicle-related issues (such as mechanical failure), or external factors (such as the presence of animals on the road). Identifying contributing factors in crashes provides insights into the root causes of crashes, guiding the development of targeted countermeasures, enforcement strategies, and educational campaigns aimed at reducing risky behaviors and improving compliance with traffic laws.
The primary contributing factor for crashes in the City was speed-related, including drivers failing to control speed, speeding, and unsafe speed, totaling 30.2 percent of all crashes. This was followed by distraction in the vehicle or driver inattention, contributing to 11.8 percent of crashes, and failure to yield right of way while turning left, accounting for 8.6 percent. Disregarding stop signs or signals was the fourth most common contributing factor, representing 7.7 percent of crashes, with drivers failing to yield right of way at stop signs following closely behind at 5.7 percent. Figure TM-6.15 presents the top 10 most common contributing factors.
Figure TM-6.15 Top 10 Contributing Factors
Other Factors
Other factors generally encompass secondary or non-primary elements that may have contributed to the crash but are not considered as primary causes. These factors might include additional conditions or circumstances that were present at the time of the crash but were not directly responsible for initiating the crash event.
Among all analyzed crashes, most of the crashes did not involve any other factors (52.0 percent), followed by slowing or stopping related (15.6 percent). Slowing or stopping related including slowing or stopping for officer, flagman, or traffic control, or to make left turn, or for traffic, etc. Parking or driveway related is the third most other factors that leads to crashes (12.6 percent), it includes one vehicle parked at improper locations, one vehicle leaving its driveway, one vehicle entering driveway, etc. Table TM-6.3 presents the top 10 most common other factors.
Other Factors
Manner of Collision
The manner of collision refers to the specific circumstances or dynamics involved in how vehicles or objects come into contact during a crash. It includes factors such as the angle of collision, and the relative motion of the vehicles or objects involved. Understanding the manner of collision is critical for developing countermeasures tailored to specific crash scenarios, such as improving intersection design, implementing traffic calming countermeasures, and enhancing road signage to reduce the likelihood of common collision types.
Most of the crashes had two or more vehicles involved (76.3 percent), while only 23.7 percent of crashes involved one vehicle. Among crashes that involve two or more vehicles, almost half of the crashes (45.9 percent) occurred when vehicles were driving the same direction, followed by angled crashes (36.3 percent), where two cars hit at an angle. Crashes occurred in vehicles driving in opposite directions constitute 17.3 percent of two or more vehicle crashes, while crashes occurred in “Other” accounted for about half a percent.
Table TM-6.3. Top 10
Among all crashes, top 3 most common manner of collision includes one motor vehicle – going straight (18.3 percent), angle – both going straight (16.9 percent), and same direction – both going straight – read end (12.2 percent). The following figure shows the top 10 manner of collisions.
Figure TM-6.16 Percentage of Crashes by Manner of Collisions
Temporal Factors
Weather, light conditions, and time of day are important elements in understanding traffic crashes. This section analyzes the temporal aspects of crashes in Amarillo from 2019 to 2023, aiming to inform proactive measures for creating safer streets and roads for all.
Weather Conditions
The majority of the crashes occurred on clear days (85.5 percent), followed by cloudy days (8.7 percent), and rain (3.1 percent) Table TM-6.4 provides a comprehensive breakdown of weather factors, ranked by the percentage of crashes.
Table TM-6.4. Distribution of Crashes by Weather Conditions
By understanding the relationship between weather conditions and crash occurrences, transportation agencies and policymakers can implement targeted strategies to mitigate risks during different weather conditions. This might include deploying additional signage or improving road maintenance practices.
Day of Week
Friday had the highest number of crashes (16.6 percent). It is followed by Thursday (15.7 percent), and Wednesday (14.9 percent). On average, more crashes occurred on weekdays than on the weekends.
Table TM-6.5 Distribution of Crashes by Day of Week
Time of Day
The analysis of crash data by time of day reveals distinct temporal patterns in crash occurrences. Afternoon peak hours, notably from 3 PM to 6 PM, exhibit the highest crash counts, it constitutes for a total of 31.5 percent of total crashes, reflecting heightened traffic volume and potential driver stress or distraction during rush hour. Similarly, morning peak hours, spanning from 7 AM to 9 AM, demonstrate elevated crash frequencies, where it accounts for 12.3 percent of overall crashes, aligning with increased commuting traffic. Late morning hours around 11 AM, as well as early afternoon hours around 12 PM and 1 PM, also show relatively high crash counts, possibly influenced by factors such as lunch breaks and midday traffic patterns. Conversely, late-night and early morning hours, spanning from midnight to 6 AM, generally experience lower crash counts, indicating decreased traffic volume and reduced driver activity during these hours.
Examining crash data by time of day provides insights into patterns of crash occurrence and helps identify opportunities for implementing time-specific countermeasures, such as enhanced lighting in high-risk areas, targeted enforcement of impaired driving laws during peak risk periods, and adjustments to traffic signal timing to improve safety during low-visibility conditions.

Light Conditions
In analyzing crash data, it's evident that the majority of crashes occurred under daylight conditions, accounting for 71.5 percent of all crashes. Following daylight conditions, crashes during dark lighted conditions constituted 19.8 percent while those in dark not-lighted conditions represented 5.3 percent of the total. Figure TM-6.18 illustrates the crash distributing between light conditions, and Figure TM-6.19 shows a crash heat map for crashes occurred under dark.
Figure TM-6.17. Number of Crashes by Hour
Understanding light conditions per crash data is essential for evaluating visibility, assessing risk, identifying infrastructure needs, and prioritizing safety interventions. Light conditions directly impact visibility for drivers, pedestrians, and cyclists, which can influence perception and reaction times. Crashes occurring during darkness without proper lighting may signify heightened risk. Analyzing light conditions helps identify areas requiring improved road design and infrastructure, such as enhanced street lighting. By prioritizing safety interventions based on light conditions, authorities can effectively reduce crash risks and enhance road safety for all users.
Figure TM-6.18 Distribution of Crashes by Light Conditions
City of Amarillo | Safe Streets and Roads for All Plan

Figure TM-6.19. Crash under Dark Heat Map
Demographics
This section delves into crash demographic information, including gender, ethnicity, and driver age. With a total of 45,919 individuals involved in crashes, the majority experienced no injuries (79.1 percent), followed by unknown injury (7.8 percent) and possible injury (7.6 percent). Fatal injuries constituted 0.1 percent of total injuries, severe injuries 1.1 percent, and non-severe injuries 4.2 percent. By examining these demographic characteristics, authorities can uncover specific trends, disparities, ensure balanced distribution to safety improvements, and risk factors affecting various segments of the population This analysis is also crucial for developing targeted education programs to enhance road safety.
Gender
Male drivers make up around 47.6 percent of crashes in Amarillo, while female drivers comprised 45.9 percent. The gender of the remaining drivers was unknown. This gender breakdown among crash-involved drivers mirrors the overall demographic distribution of the city, with male representing 49.5 percent and female 50.5 percent of the total population according to the 2022 ACS 5-Year Estimates. Understanding gender distribution helps in designing genderspecific safety campaigns and educational programs to address risky behaviors.
Ethnicity
In terms of ethnicity, most of the drivers involved in the crashes were identified as White, making up 55.4 percent of the total. This was followed by Hispanic drivers at 24.6 percent, and Black drivers at 9.5 percent. Asian drivers represented 2.4 percent, and Native American drivers comprised 0.2 percent of the total. The rest were labeled as “Other” This distribution aligns with the overall demographic distribution per 2022 ACS 5-Year Estimates as shown in Table TM-6.6
Table TM-6.6. Ethnicity Distribution in Crashes Compared to Population Share
Driver Age
The driver age distribution in crashes reveals notable disparities. The 20 to 24 years age group has the highest involvement in crashes at 14.0 percent, closely followed by the 15 to 19 years age group at 13.0 percent. However, their population share is almost half compared to their share in crashes. Conversely, age groups from 45 to 64 years exhibit relatively even percentages of crash involvement compared to their population shares. Figure TM-6.20 illustrates a comparison of age groups between crash data and population representation. This data underscores the importance of tailored strategies to address the specific risks faced by younger drivers, such as targeted educational programs, while also ensuring ongoing safety measures for drivers of all ages.
Figure TM-6.20 Age Distribution in Crashes Compared to Population Share
Technical
Development
Introduction
The High Injury Network (HIN) is a critical tool used in roadway safety analyses to identify and prioritize roadways and intersections with the highest concentrations of severe and fatal crashes for vulnerable (pedestrian and bike crashes) and all roadway users. By focusing on these areas, the City can implement targeted interventions to enhance safety and reduce traffic-related injuries and fatalities. In Amarillo, the HIN is categorized based on the modes of transportation: "All Modes of Transportation," which includes vehicle crashes, fixed object crashes, pedestrian crashes, bike crashes, and all other types of crashes, as well as "Vulnerable Roadway Users," which includes only pedestrian and bike crashes.
Types of High Injury Networks
This memo develops four different HIN analyses, which work together to provide a comprehensive understanding of where the most critical safety issues lie. The "All Modes of Transportation HIN" provides a broad overview, identifying corridors or intersections with the highest concentrations of severe and fatal crashes across all travel modes. Meanwhile, the "Vulnerable Roadway Users HIN" delves deeper into crashes involving pedestrians and cyclists, highlighting specific corridors and intersections that require targeted safety improvements. By conducting multiple levels of HIN analysis, the City can ensure that safety interventions are effectively prioritized and tailored to address the unique risks faced by different roadway users.
All Modes of Transportation
This category looks at fatal and severe crashes across all modes of transportation to pinpoint critical areas for safety interventions.
Corridor HIN
This category encompasses all types of modes of transportation, aiming to identify large sections of roadway where fatal and severe crashes are most frequent.
Intersection HIN
This analysis identifies intersections with high rates of severe and fatal crashes across all types of travel modes.
Vulnerable Roadway Users
This category considers all levels of crash severity, including fatal, severe, nonsevere, possible injury, and non-injury crashes for pedestrian and cyclist-related crashes only. This comprehensive approach is necessary due to the severity and
limited number of crashes involving vulnerable roadway users, ensuring that all vulnerable user related crashes are taken into account to address their safety needs effectively.
Corridor HIN
This analysis focuses solely on the safety of vulnerable road users, identifying corridors with high rates of pedestrian and bicyclist crashes.
Intersection HIN
This category highlights intersections where pedestrians and bicyclists experience the most crashes.
Methodology
Data Processing
The creation of the High Injury Network for the City of Amarillo involved a systematic approach to data processing, consisting of two main steps: data collection and data refinement
Data Collection
The primary source of data is the Texas Department of Transportation (TxDOT) Crash Record Information System (CRIS) and Roadway Inventory datasets. The crash data covers a five-year period from 2019 to 2023. This dataset included detailed information on the location, severity, contributing factors, and dynamics of each crash. This data is collected by TxDOT through reports submitted by law enforcement agencies, which are then verified and compiled into the CRIS database. The roadway inventory data includes roadway centerline, annual average daily traffic (AADT), and the roadway length for each segment. This data is gathered through permanent and temporary traffic count sites, manual counts, surveys, and regular monitoring conducted by TxDOT to ensure accurate and up-to-date records of the state's roadways 77
Data Refinement
To refine the analysis, crashes that occurred on interstates such as I-40 and I-27 were excluded from the analysis. This was due to limited resources and interstates typically have different traffic patterns, speed limits, and crash dynamics compared to urban roadways, making them less comparable to the city streets that the HIN aims to improve.
However, crashes on Amarillo Blvd (U.S. Route 60), S Taylor Street (U.S. Route 287), S Fillmore Street (U.S. Route 87), Pierce Street (U.S. Route 60), S Buchanan Street (U.S. Route 287), Farm to Market 2186, State Loop 335, and other highways within the city limits were included in the analysis. These roads, despite being highways, have characteristics more similar to urban streets and are integral parts of Amarillo's road network.
77 TxDOT https://www.txdot.gov/business/resources/traffic-data-collection.html
Data Analysis
Crash Rate Analysis, Value of Statistical Life (VSL), and Crash Frequency were assessed to understand the exposure, severity, and frequency of crashes, respectively. These analyses provided valuable insights into areas with recurring safety concerns, informing the subsequent steps in the development of the High Injury Network.
Crash Rate Analysis
The Crash Rate Analysis helps determine the likelihood of crashes relative to the volume of traffic. Two separate crash rate analyses were conducted for the Corridor HIN and Intersection HIN, respectively as shown in Equation TM-7.1 and Equation TM-7.2.
• Corridor HIN: Calculated the rate of crashes per 100 million vehicle miles traveled
Equation TM-7.1 Crash Rate Per 100 Million Vehicle Miles Traveled 78
100,000,000
365
Where:
R = Crash rate for the road segment expressed as crashes per 100 million vehicle-miles of travel (VMT)
C = Total number of crashes in the study period
N = Number of years of data
V = Number of vehicles per day (both directions)
L = Length of the roadway segment in miles
• Intersection HIN: Calculated the rate of crashes per one million vehicles entered the intersection.
Equation TM-7.2. Crash Rate Per One Million Vehicle Entered78
1,000,000
Where:
R = Crash rate for the intersection expressed as accidents per million entering vehicles (MEV)
C = Total number of intersection crashes in the study period
N = Number of years of data
V = Traffic volumes entering the intersection daily
78 FHWA https://safety.fhwa.dot.gov/local_rural/training/fhwasa1210/s3.cfm
Value of Statistical Life (VSL)
The calculation of the VSL is a critical component to developing the HIN as it offers a quantitative assessment of the economic impacts associated with severe and fatal crashes. According to Federal Highway Administration (FHWA), assigning a monetary value to fatalities and severe injuries enables the prioritization of areas with high values, aiding in the selection of locations for safety countermeasures based on roadways with the highest potential cost savings. 79 FHWA’s recommended monetized values (shown in 2022 dollars) are summarized in Table TM-7.1.
Additionally, the guidance provides a basis for justifying safety policies to stakeholders and policymakers, while also enabling long-term planning for infrastructure improvements and safety programs. Integrating VSL into the development of the HIN ensures the City can make informed decisions, optimize resource allocation, and foster safer roadways, ultimately saving lives and reducing the societal burden of traffic-related injuries and fatalities.
Crash Frequency
The Crash Frequency analysis aims to identify corridors and intersections with the highest number of crashes per mile or per intersection, providing valuable insight into areas with recurring safety concerns. By examining crash frequency, the City can pinpoint locations requiring urgent safety countermeasures. This approach facilitates a comprehensive assessment of the overall safety landscape, enabling targeted strategies to address recurring crash patterns and enhance road safety for all users.
Data Synthesis
Following the analysis, each of the three components (Crash Rate Analysis, VSL, and Crash Frequency) were assigned a weight of 33.3%, totaling 100%. This weighting process enabled the creation of a unified metric that comprehensively evaluates road safety. By incorporating multiple factors, the synthesis facilitates a holistic assessment of roadway safety, considering not only the severity and frequency of crashes but also their exposure and economic implications.
By combining these factors, the analysis ranks corridors and intersections based on their overall safety scores, empowering decision-makers to implement targeted strategies addressing the most critical safety concerns effectively.
79 FHWA Benefit Cost Analysis https://www.transportation.gov/mission/office-secretary/office-policy/transportationpolicy/benefit-cost-analysis-guidance
Table TM-7.1. Recommended Monetized Value(s)
Results
The analysis resulted in the creation of four sets of maps, each representing a different aspect of the High Injury Network. The High Injury Network maps serve as a foundation for Amarillo's SS4A (Safe Streets and Roads for All) Action Plan. These results will guide the City's efforts in implementing targeted safety improvements, ultimately aiming to reduce serious traffic-related injuries and fatalities across all modes of transportation.
Below are the key findings for each map:
• High Injury Corridors for All Modes of Transportation (Figure TM-7.1)
60.4% of fatal and severe crashes occurred on just 8.7% of Amarillo's roadways. This indicates a significant concentration of severe incidents on a relatively small portion of the road network, highlighting critical areas for safety improvements.
• High Injury Intersections for All Modes of Transportation (Figure TM-7.2)
63.3% of fatal and severe crashes occurred on just 2% of Amarillo's intersections. All intersections that include at least one fatality or more than two severe injuries ranked higher than the other intersection in the City and are thus included in this map. These high-risk intersections signify areas of heightened safety concerns, necessitating focused safety countermeasures to reduce risks and enhance overall road safety for all users.
• High Injury Corridors for Vulnerable Roadway Users (Figure TM-7.3)
66% of bike and pedestrian crashes occurred on only 3.4% of the roadways. This statistic emphasizes the vulnerability of non-motorized road users and the need for targeted safety measures on these specific corridors.
• High Injury Intersections for Vulnerable Roadway Users (Figure TM-7.4)
These intersections have a considerable number of crashes involving vulnerable roadway users, such as pedestrians and cyclists. Almost 50% of pedestrian and bike crashes occurred on just 0.5% of Amarillo's intersections. All intersections that include at least one fatality ranked higher than the rest are thus included in this map. These intersections underscore the urgent need for targeted safety measures to protect these vulnerable road users and improve the overall safety of our City's streets.
City of Amarillo | Safe Streets and Roads for All Plan
Figure TM-7.1. High Injury Corridors for All Modes of Transportation
City of Amarillo | Safe Streets and Roads for All Plan
Figure TM-7.2. High Injury Intersections for All Modes of Transportation
City of Amarillo | Safe Streets and Roads for All Plan
Figure TM-7.3. High Injury Corridors for Vulnerable Roadway Users
City of Amarillo | Safe Streets and Roads for All Plan
Figure TM-7.4. High Injury Intersections for Vulnerable Roadway Users
Technical Memorandum 8: Targeted Safety Improvement Projects
Introduction
Technical Memorandum 8 – Target Safety Improvement provides an overview of the projects developed throughout the planning process, aimed at improving transportation safety in the City of Amarillo (City). All of the following Safe Streets for All (SS4A) projects are aligned with the City’s vision of reducing traffic fatalities and serious injuries by 35% by 2035. The proposed targeted safety improvement projects will help towards transforming the City’s transportation network into one that is safe, connected, and accessible. By actively addressing these priorities, the City aims to create an environment where all residents and visitors can navigate the community safely.
To guide the development of the SS4A projects, the plan focuses on three key principles: feasibility, comprehensiveness, and adaptability, as illustrated in Figure TM-8.1. Feasibility focuses on using engineering insights and identified funding opportunities to create feasible and achievable solutions. Comprehensiveness ensures that all necessary improvements are included upfront, allowing the City to easily remove unneeded elements rather than face challenges and then needing to add missing components later. Adaptability highlights the need for a flexible approach to accommodate changing priorities, specific funding opportunities, and other circumstances.
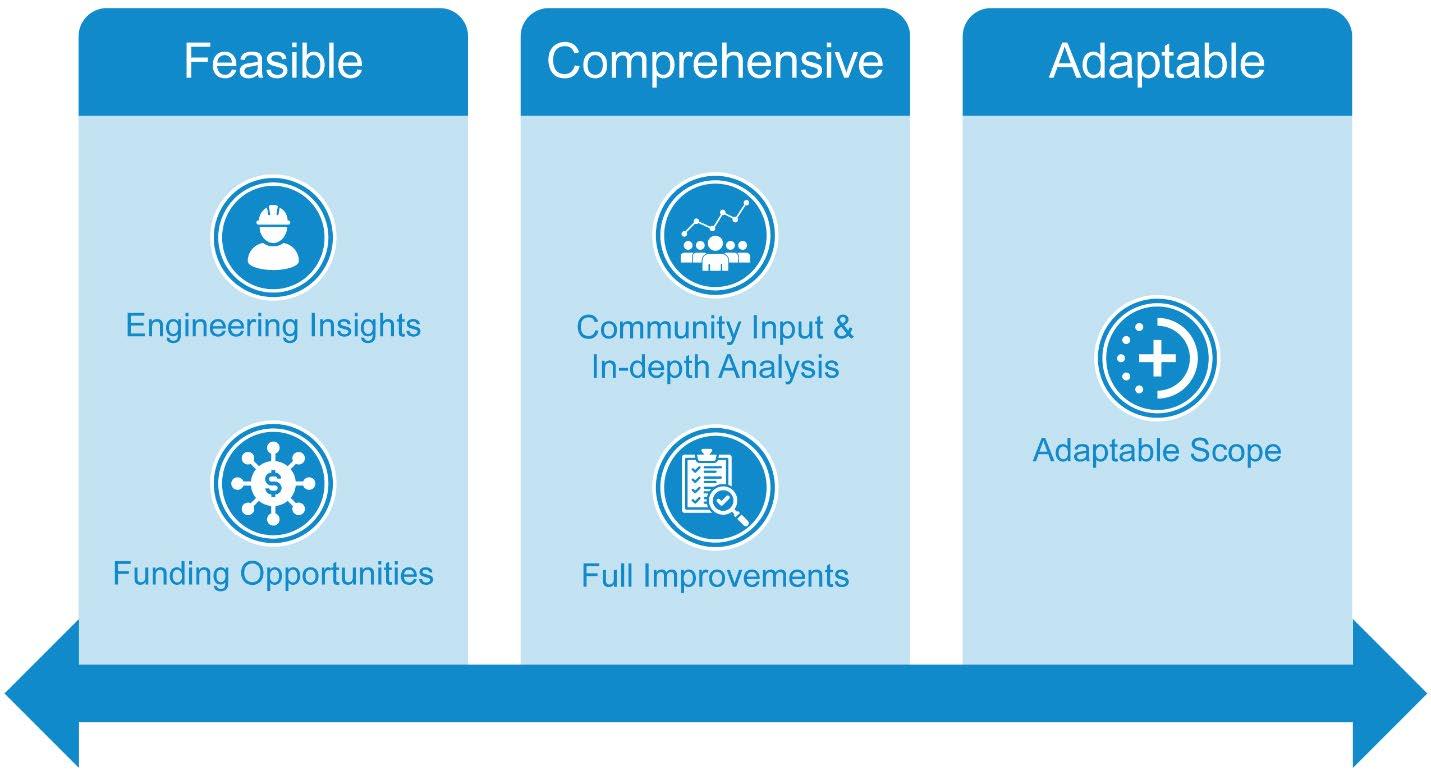
Figure TM-8.1 Project Proposal Guiding Principles
Guided by these principles and informed by sound planning principles such as crash analysis, high injury network development, survey practices, and a policy review process a total of 16 targeted SS4A safety projects have been identified to address key safety concerns. These projects are designed with a strong focus on safety while also enhancing mobility, connectivity, accessibility, and addressing other community needs (Figure TM-8.2)

The SS4A projects have been refined through collaboration with City, Amarillo Metropolitan Planning Organization (MPO), and Texas Department of Transportation (TxDOT) staff. A summary of all participating organizations and departments is provided below:
Figure TM-8.2. Project Design Focus
City of Amarillo | Transportation Safety Action Plan
Table TM-8.1. Summary of All Organizations and Departments
Organization
Amarillo MPO Amarillo MPO
City of Amarillo Amarillo City Transit
Department
City of Amarillo Capital Projects and Development Engineering
City of Amarillo City Manager's Office
City of Amarillo Community Development
City of Amarillo Fire Department
City of Amarillo Office of Engagement & Innovation
City of Amarillo Parks and Recreation
City of Amarillo Planning
City of Amarillo Police Department
City of Amarillo Public Health Department
City of Amarillo Public Works
City of Amarillo Streets Department
TxDOT Amarillo District Traffic Office
A total of 16 projects were proposed based on community input, crash analysis, and the High Injury Network tool developed for this Plan.
City of Amarillo | Transportation Safety Action Plan Technical Memorandum 8: Targeted
Figure TM-8.3 Overview of All Proposed Projects
As shown in the figure above, all the SS4A projects are categorized by timelines, reflecting their complexity, size, cost, and potential impacts. This categorization ensures projects align with funding opportunities, meet budget constraints, and balance immediate needs with long-term goals. Smaller, short-term projects provide localized improvements, while larger, long-term projects deliver regional impacts and inspire the community by showcasing transformative possibilities. Mid-term projects bridge the gap, offering broader benefits without the extended timelines of large-scale efforts.
• Short-Term Projects:
These projects typically take less than five years to complete. They are smaller in scale, less complex, relatively low cost, and require minimal or no utility or right-of-way coordination. Focused on targeted areas or neighborhoods, they deliver quick, localized benefits.
• Mid-Term Projects:
Mid-term projects usually take around five to 10 years to complete They require longer planning and coordination compared to short-term projects. They often involve corridors or multiple intersections, providing broader, medium-scale impacts.
• Long-Term Projects:
These projects generally take more than 10 years to complete and are large-scale efforts that require extensive planning, complex design, and significant coordination. They deliver regional impacts and can also serve as inspirational examples of what’s possible for the community.
Funding Sources
As part of this SS4A Plan, potential funding sources have been identified for each proposed project to enhance feasibility and implementation. Table TM-8.2 below lists all projects along with corresponding funding sources for each. Detailed information for each discretionary funding opportunity can be found under Appendix B: Funding Sources While this table highlights commonly used safety-related funding sources, it is important to note that additional funding opportunities may exist beyond those identified here. Furthermore, the project numbers are only for reference and do not indicate any form of prioritization.

Notably, Project 1 – Safer Speeds for Schools was awarded funding through the FY 2024 SS4A Demonstration Grant while the SS4A Plan was still under development. This success highlights the importance of robust safety analysis, meaningful community engagement, and careful alignment with funding opportunities. It also demonstrates how a wellthought-out SS4A Plan can significantly enhance a project's competitiveness during the funding application process, emphasizing the value of having a structured, actionable safety plan in place.
Project Profiles
A total of 16 projects are proposed to enhance transportation safety in the City, as shown in Figure TM-8.3. As stated above, the projects are categorized by timeline into Short-Term, Medium-Term, and Long-Term sections, with each project including a description, scope, project needs, and cost information.
Project needs include a summary of crash history, public input from the first survey practice, points of interest within the project area that would benefit from the improvements, and alignment with the City Plan Vision 2045.
Planning level cost estimates are provided, which include construction costs, construction soft costs, and engineering and environmental costs. A rounded total cost is provided at the beginning of each project profile. Detailed line-item costs are available in Appendix C: Planning Level Detailed Cost Estimates for reference.
Projects 1, 2, 3, and 10 were specifically developed to align with the requirements of targeted funding opportunities available during project development. All four projects have been submitted for funding, with Project 1 awarded funding through the SS4A Demonstration Grant. Project 2 and Project 3 were submitted in November 2024 to the Category 7 program, and Project 10 was submitted to the Highway Safety Improvement Program (HSIP) in December 2024. For HSIP, Project 10 was divided into two phases to facilitate funding feasibility, reflecting the adaptability of proposed project scopes to align with funding opportunities and limited resources.
To provide additional context, a subsection titled Funding-Driven Project Proposal has been included in the profiles of these four projects to explain how funding criteria influenced their development. The remaining projects were not tied to specific funding sources and therefore do not include this subsection. However, as shown in Table TM-8.2, a funding matrix is provided for each project to help identify potential funding opportunities and enhance safety throughout the City.
Project 1 – Safer Speed for Schools
Project Map

TM-8.4. Project 1 – Project Map

Timeframe
Short Term

Summary
Traffic calming improvements near five schools, including the Hamlet Elementary School, San Jacinto Elementary School, Margaret Wills Elementary School, Olsen Park Elementary School, and Crocket Middle School

Estimated Total Cost $654,000

Lead Agency City of Amarillo
Memorandum
Figure
Funding-Driven Project Proposal

Project Needs
Crash History
This project was developed with the City's request to target the Safe Streets and Roads for All (SS4A) Demonstration Grant. The grant requires temporary, easy-to-install, and removable safety improvements. This guided the proposed countermeasures, including rubber speed cushions, curb extensions using tuff curbs, and high visibility crosswalks.
The focus on traffic calming near schools stemmed from community engagement findings and crash data. The five schools were selected based on crash history and public input. Three of the schools are in a disadvantaged community, meeting Federal Highway Administration (FHWA) equity priorities, which ensures the proposed project addresses critical safety issues while aligning with grant requirements.
• 62% of total crashes within Amarillo occurred within half a mile of all schools in the City
• Speed-related crashes accounted for 31% (3,436) of all crashes that occurred within a half mile miles around all schools
Public Input
A total of 42 comments were collected, which highlighted significant concerns regarding schoolarea safety:
• Nearly 60 percent of the comments emphasized risks for children walking or biking to school, pointing to issues like speeding vehicles and insufficient pedestrian infrastructure, including missing crosswalks.
• Approximately one quarter of the comments focused on the dangers children face when crossing streets near schools, underscoring the urgent need for enhanced pedestrian safety measures in these areas.
• 21 percent of comments were from residents requesting new or improved traffic control at key intersections, including the intersection of Olsen Blvd and Teckla Blvd, where frequent stop sign violations and poor visibility were reported, posing risks to drivers and pedestrians. At the intersection of Olsen Blvd and S. Western Street, residents suggested 4-way stop to address recurring congestion and safety issues. Several comments also emphasized the need for traffic improvements near schools to ensure safer crossings and reduce risks for students traveling through these areas
80 Roadsafe Traffic Systems. (n.d.). Standard duty tuff curb. Retrieved December 30, 2024, from https://www.roadsafetraffic.com/standard-duty-tuff-curb/
Figure TM-8.5 Example of Tuff Curbs 80
Points of Interest
• The identified locations near neighborhoods and schools make these improvements essential for enhancing overall safety for school children and local residents
Project Scope
This project proposes traffic calming countermeasures for all five schools, including measures to improve pedestrian safety and reduce vehicle speeds. The proposed improvements are as follows:
1. Hamlet Elementary School
• Install curb extensions
• Remove and install new crosswalks
• Install rubber speed cushions
• Install speed limit signs

Figure TM-8.6 Project 1 – Illustration of Proposed Traffic Calming Countermeasures near Hamlet Elementary
2. San Jacinto Elementary School
• Install curb extensions
• Remove and install new crosswalks
• Install rubber speed cushions

3. Margaret Wills Elementary School
• Install curb extensions
• Remove and install new crosswalks

Figure TM-8.7. Project 1 – Illustration of Proposed Traffic Calming Countermeasures near San Jacinto Elementary
Figure TM-8.8. Project 1 – Illustration of Proposed Traffic Calming Countermeasures near Margaret Wills Elementary
4.
• Install curb extensions
• Install new crosswalks
5. David Crockett Middle School
• Install curb extensions
• Remove and install new crosswalks
• Install rubber speed cushions
• Install median island
• Install speed limit signs


Memorandum 8: Targeted Safety Improvement Projects
Olsen Park Elementary School
Figure TM-8.9 Project 1 – Illustration of Proposed Traffic Calming Countermeasures near Olsen Park Elementary
Figure TM-8.10. Project 1 – Illustration of Proposed Traffic Calming Countermeasures near Crockett Middle School

Project Planning Level Cost Estimates
The planning level cost estimate for the project is shown in Table TM-8.3 Construction related costs include construction management, inspections, quality control, and materials testing. A 20 percent contingency is built into the construction cost. Engineering and environmental costs include costs related to preparing construction plans, specifications, estimation, and permitting as well as environmental analysis. The cost estimates are in 2024 dollars and based on TxDOT’s November 2024 low-bid averages. Detailed cost estimates are provided in Appendix C: Planning Level Detailed Cost Estimates
Table TM-8.3. Project 1 – Planning Level Cost Estimates
Figure TM-8.11 Project 1 – Example Layout
Next Steps, Funding and Implementation
The City of Amarillo will serve as the lead agency for implementing this project. The project was submitted to the FHWA under the SS4A Demonstration Program in 2024 and successfully secured $654,300 in funding in November 2024.
Project 2 – Phase I Intersection Improvements
Project Map

TM-8.12. Project 2 – Project Map
Timeframe
Short Term

Summary
Intersection improvements at Bell Street and SW 34th Avenue, Bell Street and Fulton Drive, and Bell St and SW 45th Street. Additionally, bike lane improvements are proposed along Fulton Drive near Amarillo High School

Estimated Total Cost $813,000
Lead Agency City of Amarillo
Figure
Funding-Driven Project Proposal
This project was developed in alignment with the City’s request to propose improvements along or near Bell Street that could target the Category 7 Surface Transportation Block Grant. The project’s smaller scope, with a total cost under $1 million, was tailored to fit the grant’s practical funding range.
The proposed improvements were selected to meet the grant’s objectives of enhancing safety, accessibility, and traffic flow at key intersections. Community feedback during the planning process highlighted the need for better pedestrian and bicycle facilities along the Bell Street corridor. These enhancements address identified safety concerns and align with the grant’s focus on multimodal transportation needs, particularly near key locations such as SW 34th Avenue, SW 45th Avenue, and Fulton Drive, which are close to Amarillo High School.
Project Needs
Crash History
This project is located on the City’s High Injury Network. Between 2021 and 2023, as required by Category 7 funding criteria, a total of 231 crashes occurred along the one-mile stretch of Bell Street between 34th Street and 45th Street, as well as on Fulton Drive. These crashes included one fatal vehicle crash, one severe pedestrian crash, one severe bicycle crash, and three severe vehicle crashes.
Public Input
A total of 37 comments were collected for this project. Community engagement highlighted significant concerns regarding safety along the Bell Street corridor:
• 54 percent of comments requested better sidewalks and improved facilities for safer pedestrian crossings at major intersections, such as SW 34th Avenue and Bell Street and SW 45th Avenue and Bell Street with requests for crosswalks and streetlights.
• 28 percent of comments highlighted the need for improved traffic control devices, including traffic signals, flashing beacons, and reduced speed limits, to create safer conditions for students during school hours. Speeding and drivers failing to stop in crosswalks were frequently cited concerns, with calls for pedestrian-activated signals
• 10 percent of comments emphasized the need for traffic calming measures to address high-speed traffic and reckless driving, particularly near schools and during late-night hours, with reports of drag racing creating unsafe conditions
Points of Interest
The project area includes Amarillo High School, a grocery store, restaurants, John Stiff Memorial Park, and the Southwest Library, emphasizing the need to improve connectivity, accessibility, and safety for these points of interest.
Consistency with City Plan Vision 2045
The Amarillo City Plan 2045, adopted in 2024, identified a list of prioritized mobility improvements, including key corridors and intersections. Bell Street, Amarillo High School, and 34th Avenue are all identified as priorities in the plan.
Project Scope
1. Three Intersections - SW 34th Avenue & Bell Street, SW 45th Avenue and Bell Street, and Fulton Drive & Bell Street
• Widen the existing kidney islands at intersections
• Improve crosswalks, ADA ramps
• Install back plates with retroreflective boarders at all signal heads
• Install new sidewalks at the intersection of SW 45th Avenue and Bell St to close sidewalk gaps

81 Federal Highway Administration. (n.d.). Backplates with retroreflective borders. Retrieved December 30, 2024, from https://safety.fhwa.dot.gov/provencountermeasures/backplate.cfm
Figure TM-8.13 Backplates with Retroreflective Boarders


Figure TM-8.14 Project 2 – Example Layout at Bell Street and 34th Street
Figure TM-8.15 Project 2 – Example Layout at Bell Street and 45th Street
2. Fulton Drive from Kingston Road to Barclay Drive
• Improve bike lane markings at all crossings to enhance cyclist safety and visibility
• Improve pavement markings (such as stop bars, travel lane markings) as needed
Project Planning Level Cost Estimates
The planning level cost estimate for the project is shown in Table TM-8.4 Construction related costs include construction management, inspections, quality control, and materials testing. A 20 percent contingency is built into the construction cost. Engineering and environmental costs include costs related to preparing construction plans, specifications, estimation, and permitting as well as environmental analysis. The cost estimates are in 2024 dollars and based on TxDOT’s November 2024 low-bid averages. Detailed cost estimates are provided in Appendix C: Planning Level Detailed Cost Estimates.
Table TM-8.4 Project 2 – Planning Level Cost Estimates
Next Steps, Funding and Implementation
The City of Amarillo will be the lead agency for the implementation of this project. Table TM-8.2 has a full assessment of potential funding opportunities for this project. The project was submitted for Category 7 Funding in December 2024 Details of funding opportunities are presented in Appendix B: Funding Sources
Project 3 – Phase II Intersection Improvements
Project Map

TM-8.16. Project 3 – Project Map
Timeframe
Short Term
Summary
Intersection improvements at intersections of Bell Street and SW 11th Avenue, Bell Street and Plains Boulevard, Bell Street and Wolflin Avenue, and Coulter Street and SW 45Th Avenue
Estimated Total Cost
$347,000
Lead Agency
City of Amarillo
Figure
Project Needs
Crash History
This project is located on the City’s High Injury Network. Between 2021 and 2023 82 , a total of 190 crashes occurred along the project corridor Included in this count are one fatal crash and six severe crashes, two of which involved severe pedestrian crashes.
Public Input
A total of 22 comments were collected. Community feedback for this project highlighted the following:
• 41 percent of comments requested improved pedestrian and bike infrastructure along Bell Street to enhance safety and accessibility for non-motorized users.
• Approximately 35 percent of comments raised concerns about traffic signal timing and congestion along the corridor, particularly during peak hours. Feedback highlighted the need for better signal coordination to reduce delays and backups, improvements to slip lanes for safer and more efficient merging, and adjustments to reduce conflicts between merging traffic and through traffic
• 12 percent of comments expressed concerns about missing crosswalk connections to sidewalks and inadequate lighting, particularly on side streets leading to key destinations
• Safety concerns were also raised regarding missing pavement markings for merging lanes or turning lanes at Coulter Street and Bell Street
Points of Interest
The project area includes grocery stores, urgent care facilities, retail shops, restaurants, and high-density residential areas, highlighting the importance of improving connectivity, accessibility, and safety for these key destinations.
Project Scope
1. Two Intersections - SW 45th Street & Coulter Street and Bell Street & Wolflin Avenue
• Widen existing kidney islands
• Install backplates with retroreflective borders on all signal heads
• Improve crosswalks, ADA ramps
2. Bell Street & 11th Avenue
• Install one-way arrow sign, pavement markings, and signs in indicating merging for Bell Street southbound traffic
• Install median at the intersection to prohibit westbound left turn from SW11th
3. Bell Street & Plains Boulevard
• Replace the existing left turn signal head to 4-section signal head
82 Required crash analysis timeframe per the Category 7 Funding Opportunity.

Project Planning Level Cost Estimates
The planning level cost estimate for the project is shown in Table TM-8.5 Construction related costs include construction management, inspections, quality control, and materials testing. A 20 percent contingency is built into the construction cost. Engineering and environmental costs include costs related to preparing construction plans, specifications, estimation, and permitting as well as environmental analysis. The cost estimates are in 2024 dollars and based on TxDOT’s November 2024 low-bid averages. Detailed cost estimates are provided in Appendix C: Planning Level Detailed Cost Estimates.
Table TM-8.5. Project 3 – Planning Level Cost Estimates
Next Steps, Funding and Implementation
The City of Amarillo will be the lead agency for the implementation of this project. Table TM-8.2 has a full assessment of potential funding opportunities for this project. The project was submitted for Category 7 Funding in December 2024. Details of funding opportunities are presented in Appendix B: Funding Sources
Figure TM-8.17. Project 3 – Example Layout at Coulter Street and 45th Street
Project 4 – Non-TxDOT Signal Improvements
Project Map

Timeframe
Short Term
Summary
Traffic signal improvements or analysis at five intersections: Tascosa Road and Fairway Drive, Plains Boulevard and Bell Street, S Georgia Street and Farmers Avenue, Tradewind Street and E 34th Avenue, and E 34th Avenue and S Grand Street.
Estimated Total Cost $2,388,000
Lead Agency City of Amarillo
Figure TM-8.18 Project 4 – Project Map
Project Needs
Crash History
This project is located on the City’s High Injury Network. Between 2019 and 2023, there were a total of 122 crashes at these five intersections, all of which were vehicle crashes. These crashes included three severe crashes, and 10 non-severe crashes. The top two contributing factors for these crashes were speed-related and cars running signals or stop signs
Public Input
A total of 257 comments were collected for this project, and it received one of the highest comments under “More stop signs and/or signals” category Community feedback for this project highlighted the following:
• 79 percent of comments were residents requesting for new traffic signals at key intersections, including E 34th Avenue and Tradewind Street, E 34th Avenue and S Grand Street, and Farmers Avenue and S Georgia Street, due to heavy traffic congestion, dangerous driving behaviors caused by long delays, and frequent crashes.
• Approximately seven percent of the comments focused on the need for new sidewalks or improved crosswalks to enhance pedestrian safety and connectivity along the project
• Around five percent of the comments highlighted the lack of streetlights, with residents emphasizing the need for better lighting to improve visibility and reduce unsafe driving behaviors, especially during early mornings and evenings.
Points of Interest
These intersections are situated near high-density residential areas, regional airport, schools, and retail centers. Their proximity to these key destinations highlights the critical need for improving traffic signals to enhance safety, reduce congestion, and better accommodate the high volume of diverse traffic in these areas.
Consistency with City Plan Vision 2045
The Amarillo City Plan 2045 identified a list of prioritized mobility improvements, including key corridors and intersections. Bell Street, Coulter Street, and 45th Avenue are all identified as priorities in the plan.
Project Scope
1. Install new traffic signal at:
• E 34th Avenue and Tradewind Street
• Farmers Avenue and S Georgia Street
2. Conduct signal warrant analysis:
• E 34th Avenue and S Grand Street
3. Update 5-section signal head to 4 –section signal head at the intersection of Bell Street and Plains Boulevard (additional engineering analysis needed)

Figure TM-8.19 Typical Position and Arrangements of Separate Signal Faces with Flashing Yellow for Protected/Permissive Mode and Protected Only Mode Left Turns 83
4. Submit request to TxDOT for signal warrant analysis at the intersection of N Coulter Street and Tascosa Road
Project Planning Level Cost Estimates
The planning level cost estimate for the project is shown in Table TM-8.6. Construction related costs include construction management, inspections, quality control, and materials testing. A 20 percent contingency is built into the construction cost. Engineering and environmental costs include costs related to preparing construction plans, specifications, estimation, and permitting as well as environmental analysis. The cost estimates are in 2024 dollars and based on TxDOT’s October 2024 low-bid averages. Detailed cost estimates are provided in Appendix C: Planning Level Detailed Cost Estimates.
Cost based on three new traffic signal and signal heads (Item 1,2,3 in the Project Scope Section).
83 Federal Highway Administration. (2009). Figure 4D-12: Signal indications for protected/permissive mode of operation using a four-section head with flashing yellow arrow. Manual on Uniform Traffic Control Devices (MUTCD). Retrieved from https://mutcd.fhwa.dot.gov/htm/2009/part4/fig4d_12_longdesc.htm
Table TM-8.6 Project 4 – Planning Level Cost Estimates
Next Steps, Funding and Implementation
The City of Amarillo will be the lead agency for the implementation of this project. Sources of funding could include TxDOT HSIP, Category 7, and SS4A Implementation Grant Details of funding opportunities are presented in Appendix B: Funding Sources. Table TM-8.2 has a full assessment of potential funding opportunities for this project.
Project Map

TM-8.20. Project 5 – Project Map
Timeframe
Short Term
Summary
Install shared use path on north side of the corridor along Farmers Avenue between S Georgia Street and Athens Street.
Estimated Total Cost $1,056,000
Lead Agency City of Amarillo
Figure
Project Needs
Crash History
This project was proposed primarily based on robust public input gathered through survey engagement rather than crash history along the corridor. The project is not located on the City’s HIN. From 2019 to 2023, a total of three crashes occurred along the project corridor, none of which involved injuries. Notably, two of these crashes occurred under dark conditions.
Public Input
This project is one of the most frequently commented-on areas in the “New or Improved Sidewalk” and “New or Improved Bike Lane” categories, with a total of 233 comments collected Community feedback highlighted the following:
• 50 percent of comments were about the lack of safe walkways along Farmers Avenue, where pedestrians face unsafe conditions due to high-speed traffic and missing sidewalks.
• Additionally, 11 percent of comments request to accommodate bikers, particularly benefiting the rapidly expanding Saturn Terrace and The Meadows neighborhoods
• 10 percent of comments emphasized the need for better lighting along the project corridor to improve visibility and enhance overall safety
Points of Interest
Farmers Avenue connects growing residential neighborhoods like Saturn Terrace and The Meadows to Georgia Street. The ongoing Georgia Street Reconstruction Project aims to improve traffic flow and safety by widening South Georgia Street. The project includes expanding Georgia Street from one lane in each direction to two lanes in each direction, with a center turn lane and drainage improvements. This reconstruction, which includes the intersection of Georgia Street and Farmers Avenue, will enhance connectivity for residents, reduce congestion, and support safer travel for all road users.
Project Scope
Install a 10-foot-wide shared use path along the north side of Farmers Avenue from S Georgia Street to Athens Street.

Project Planning Level Cost Estimates
The planning level cost estimate for the project is shown in Table TM-8.7. Construction related costs include construction management, inspections, quality control, and materials testing. A 20 percent contingency is built into the construction cost. Engineering and environmental costs include costs related to preparing construction plans, specifications, estimation, and permitting as well as environmental analysis. The cost estimates are in 2024 dollars and based on TxDOT’s October 2024 low-bid averages. Detailed cost estimates are provided in Appendix C: Planning Level Detailed Cost Estimates.
TM-8.7. Project 5 – Planning Level Cost Estimates
Next Steps, Funding and Implementation
The City of Amarillo will be the lead agency for the implementation of this project. Sources of funding could include Category 7 and SS4A Implementation Grant. Details of funding opportunities are presented in Appendix B: Funding Sources Table TM-8.2 has a full assessment of potential funding opportunities for this project.
Figure TM-8.21 Project 5 – Example Layout
Table
Project 6 – Eastridge Safe Routes to School (SRTS)
Project Map

TM-8.22. Project 6 – Project Map
Timeframe
Medium Term
Summary
New sidewalks along NE 9th Avenue and Evergreen Street. Curb extension near school; Install crosswalks, pavement markings, and stop signs as needed along the entire corridor

Estimated Total Cost
$1,283,000
Lead Agency
City of Amarillo
Figure
Project Needs
Crash History
This project is on the City’s HIN, where a total of 35 crashes were reported between 2019 and 2023. These included one fatal crash, two severe crashes, and seven non-severe crashes. The fatal crash was a pedestrian crash where the pedestrian failed to yield the right of way to a vehicle. Along the project corridor, two bike crashes were reported, one of which was a severe crash caused by a driver failing to control their speed and stop at the proper location. Among the seven non-severe crashes, one was a pedestrian crash, and another was a bike crash.
Public Input
The Eastridge neighborhood provided feedback regarding the need for streetlights. A total of 36 comments were collected, community feedback highlighted the following:
• Nearly 40 percent of comments requested new sidewalks along Evergreen Street and other streets to improve safety for children walking to school, particularly during rainy weather when flooding forces pedestrians onto the road
• Concerns about speeding along Evergreen Street and surrounding areas (36 percent), with mentions of unsafe driving behaviors near the school and throughout the neighborhood
• 22 percent of comments specifically requesting additional streetlights to improve visibility along the project corridor and nearby neighborhoods.
• About 10 percent of comments noted safety concerns due to missing stop signs at key intersections, such as Gardenia Street and 16th Street, which create potential crash risks.
• General concerns about traffic calming and crossing improvements near the Eastridge Elementary School to enhance safety for students and residents.
Points of Interest
This project would improve connections between the high-density residential neighborhood and key destinations, including Eastridge Elementary School, nearby grocery stores, and local restaurants.
Consistency with City Plan Vision 2045
This project aligns with City Plan Vision 2045 by enhancing safety and connectivity in the Eastridge neighborhood. By improving sidewalks, crosswalks, and curb extensions, it supports the plan’s Complete Neighborhoods Scenario, fosters walkability, and strengthens access to local schools and businesses. These improvements reflect the plan's focus on transformative projects to revitalize neighborhoods.
Project Scope
• Install new sidewalks along with streetlights on the north side of NE 9th Avenue from Columbine Street and Heather Street, and along Evergreen Street from NE 9th Avenue to NE 14th Avenue
• Install crosswalks, pavement markings, and stop signs as needed along the corridor
• Curb extensions near school to reduce speeding and crossing distance

Project Planning Level Cost Estimates
The planning level cost estimate for the project is shown in Table TM-8.8. Construction related costs include construction management, inspections, quality control, and materials testing. A 20 percent contingency is built into the construction cost. Engineering and environmental costs include costs related to preparing construction plans, specifications, estimation, and permitting as well as environmental analysis. The cost estimates are in 2024 dollars and based on TxDOT’s October 2024 low-bid averages. Detailed cost estimates are provided in Appendix C: Planning Level Detailed Cost Estimates.
Table TM-8.8. Project 6 – Planning Level Cost Estimates
Figure TM-8.23. Project 6 – Example Layout
Next Steps, Funding and Implementation
The City of Amarillo will serve as the lead agency for implementing this project. Funding sources could include TxDOT HSIP, Category 7, and the SS4A Implementation Grant. The City may also collaborate with the Amarillo Independent School District (AISD)to complete the project. Detailed funding opportunities are outlined in Appendix B: Funding Sources. Table TM-8.2 has a full assessment of potential funding opportunities for this project.
Project 7 – Fannin and South Lawn SRTS
Project Map

Timeframe
Medium Term

Summary
Install sidewalks along SW 46th Street, S Bonham Street, SW 44th Street, S Jackson Street, Keith Street, and Parker Street; install one roundabout at the intersection of S Tyler Street, S Harrison Street, and SW 43rd Avenue.
Estimated Total Cost
$2,839,000
Lead Agency
City of Amarillo
Figure TM-8.24. Project 7 – Project Map
Project Needs
Crash History
The Project is on the City’s High Injury Network. From 2019 to 2023, a total of 151 crashes occurred along the project corridor. Among these, a total of one fatal crash, four severe crashes, and 11 non-severe crashes occurred. One of the severe crashes was a pedestrian crash at the intersection of SW 44th Street and S Jackson Street due to the driver failing to drive in a single lane.
Public Input
A total of 32 comments were collected along the project corridor. Community feedback demonstrated the following:
• 52 percent of comments emphasized the need for sidewalks along SW 46th Avenue, particularly between Washington and Georgia Streets, to provide a safe path for children walking to nearby schools. Existing conditions force pedestrians to use the street, which is dangerous due to high vehicle speeds and debris
• 32 percent of comments were about adding dedicated bike lanes, improving crosswalks, and implementing speed reduction measures, such as speed bumps or cushions, to address speeding vehicles and ensure safer travel for all users
• Several comments noted that the intersection of S Tyler Street and SW 43rd Street, with its unusual configuration of five intersecting streets, is confusing and used as a parking lot at night. Missing streetlights makes this intersection particularly dangerous for both drivers and pedestrians after dark.
Points of Interest
This project would improve connections between the residential neighborhoods and key destinations, including South Lawn Park, Fannin Middle School, South Lawn Elementary School, nearby grocery stores, and retail.
Project Scope
• Install new sidewalks on both sides of SW 44th Avenue, on one side of S Jackson Street, SW 46th Avenue, Parker Street, Keith Street, and S Bonham Street.
• Install speed cushions on S Tyler Street from SW 46th Avenue to SW 43rd Avenue.
• Install a new PHB/HAWK on SW 46th Avenue between S Fannin Street and S Bonham Street (additional warrant analysis is needed and needs to be approved by the City).
• Install a pilot roundabout project at the intersection pf S Harrison Street, S Tyler Street, and SW 43rd Avenue

Project Planning Level Cost Estimates
The planning level cost estimate for the project is shown in Table TM-8.9. Construction related costs include construction management, inspections, quality control, and materials testing. A 20 percent contingency is built into the construction cost. Engineering and environmental costs include costs related to preparing construction plans, specifications, estimation, and permitting as well as environmental analysis. The cost estimates are in 2024 dollars and based on TxDOT’s October 2024 low-bid averages. Detailed cost estimates are provided in Appendix C: Planning Level Detailed Cost Estimates.
Figure TM-8.25 Project 7 – Example Layout of Pilot Roundabout with Pocket Park
Table TM-8.9 Project 7 – Planning Level Cost Estimates
Next Steps, Funding and Implementation
The City of Amarillo will be the lead agency for the implementation of this project. Sources of funding could include HSIP, Category 7, SS4A Demonstration Grant*, and SS4A Implementation Grant. Details of funding opportunities are presented in Appendix B: Funding Sources Table TM-8.2 has a full assessment of potential funding opportunities for this project.
*Project scope will need to be adjusted to meet the grant guideline
Project 8 – Georgia Street Access Management
Project Map

– Project Map
Timeframe
Medium Term
Summary
Access management and bus shelter upgrades along Georgia Street from Canyon Drive to W Interstate 40 Frontage Road
Estimated Total Cost $2,976,000
Lead Agency City of Amarillo
Figure TM-8.26. Project 8
Project Needs
Crash History
This project is located on the City’s High Injury Network. S Georgia Street ranks among the top three corridors with the highest number of driveway-related crashes, with 91 percent of these crashes occurring within the project limits. Between 2019 and 2023, a total of 722 crashes were reported along the project corridor, including three fatal crashes, two of which involved pedestrians. Additionally, four pedestrian crashes and five bicycle crashes were recorded during this period.
Public Input
Georgia Street received a total of 20 comments requesting pedestrian refuge islands or medians. Key feedback included:
• Half of the comments emphasized the need for new sidewalks and center medians to enhance pedestrian safety by allowing crossings in stages and limiting dangerous left turns into businesses along the corridor
• Beautification efforts, including landscaping to provide shade and improve curbside appeal, were highlighted in 20 percent of comments.
• Around 10 percent of comments expressed concerns about the road's width with calls for medians and controlled U-turns to improve traffic flow and safety
Points of Interest
The project corridor connects to Randall County Veterans Park, Bus Route 43, high-density residential neighborhoods, restaurants, grocery stores, and shopping malls, highlighting the need to enhance connectivity, accessibility, and safety for these key destinations.
Project Scope
• Install concrete medians with landscape to improve access management along the corridor where needed
• Intersection improvements including improving or installing new crosswalks, ADA ramps, pavement markings, along the entire project corridor
• Install 3 bus shelters with benches and trash cans


Figure TM-8.27 Project 8 – Example Layout (Canyon Drive to Mohawk Drive)
Figure TM-8.28 Project 8 – Example Layout (Mohawk Drive to Overlook Drive)
Project Planning Level Cost Estimates
The planning level cost estimate for the project is shown in Table TM-8.10 Construction related costs include construction management, inspections, quality control, and materials testing. A 20 percent contingency is built into the construction cost. Engineering and environmental costs include costs related to preparing construction plans, specifications, estimation, and permitting as well as environmental analysis. The cost estimates are in 2024 dollars and based on TxDOT’s October 2024 low-bid averages. Detailed cost estimates are provided in Appendix C: Planning Level Detailed Cost Estimates.
Table TM-8.10. Project 8 – Planning Level Cost Estimates
Next Steps, Funding and Implementation
The City of Amarillo will be the lead agency for the implementation of this project. Sources of funding could include HSIP, Category 7, SS4A Demonstration Grant*, SS4A Implementation Grant, and BUILD. Details of funding opportunities are presented in Appendix B: Funding Sources. Table TM-8.2 has a full assessment of potential funding opportunities for this project.
*Project scope will need to be adjusted to meet the grant guideline
Project 9 – Woodlands Elementary School SRTS
Project Map

TM-8.29. Project 9 – Project Map
Timeframe
Medium Term
Summary
Install shared use path on Fairway Drive from N Western Street to N Coulter Street, install sidewalk along N Coulter Street from Tascosa Road to Fairway Drive.
Estimated Total Cost $5,092,000
Lead Agency
City of Amarillo
Figure
Project Needs
Crash History
This project is located on the City’s High Injury Network. Between 2019 and 2023, a total of 45 crashes were reported along the project corridor, including five severe vehicle crashes and five non-severe vehicle crashes.
Public Input
Woodlands Elementary School, particularly the area along Fairway Drive and Coulter Street, were in the top three areas that feedback was received. A total of 125 comments were collected along this corridor, with strong requests for “New or Improved Sidewalk” and “New or Improved Bike Lane”:
• Half of the comments emphasized the need for sidewalks and shared-use paths along Fairway Drive and N Coulter Street to improve connectivity and safety for pedestrians, runners, and cyclists, particularly children walking to and from nearby schools.
• Almost 30 percent of comments call for better signage, crosswalks, and ADA-compliant ramps at intersections to enhance accessibility and ensure safe crossings for all users
• Around 11 percent of comments request for speed cushions and other speed reduction measures were highlighted to slow traffic along Coulter Street and Fairway Drive, especially in school zones and near residential areas
• Concerns about drainage issues, with standing water causing health hazards such as mosquito breeding, were frequently mentioned, along with requests for improved stormwater management
Points of Interest
This project aims to enhance connectivity for nearby residential neighborhoods to Woodlands Elementary School and De Zavala Middle School.
Project Scope
• Install new shared use path along both sides of Fairway Dr. to include retaining walls and railings where needed at certain locations.
• Install new sidewalks (behind trees if possible) along both sides of N Coulter Street
• Install crosswalks, ADA ramps, stop bars, and other pavement markings at all intersections as needed

Project Planning Level Cost Estimates
The planning level cost estimate for the project is shown in Table TM-8.11 Construction related costs include construction management, inspections, quality control, and materials testing. A 20 percent contingency is built into the construction cost. Engineering and environmental costs include costs related to preparing construction plans, specifications, estimation, and permitting as well as environmental analysis. The cost estimates are in 2024 dollars and based on TxDOT’s October 2024 low-bid averages. Detailed cost estimates are provided in Appendix C: Planning Level Detailed Cost Estimates.
TM-8.11. Project 9 – Planning Level Cost Estimates
Next Steps, Funding and Implementation
The City of Amarillo will be the lead agency for the implementation of this project. Sources of funding could include TA, Category 7, SS4A Implementation Grant, and BUILD. Details of funding opportunities are presented in Appendix B: Funding Sources Table TM-8.2 has a full assessment of potential funding opportunities for this project.
Figure TM-8.30 Project 9 – Example Cross Section on Fairway Drive
Table
Project 10 – Amarillo High School SRTS
Project Map

TM-8.31. Project 10 – Project Map
Timeframe
Medium Term
Summary
Install sidewalk along west side of S Coulter Street and north side of SW 45th Avenue, along with a midblock crossing near the Southwest Amarillo Public Library; Install curb extensions at the intersection of Sandie Drive and Hatfield Circle near Amarillo High School.
Estimated Total Cost $2,644,000
Lead Agency City of Amarillo
Figure
Project Needs
Crash History
The project corridor is located on the City’s High Injury Network (HIN). Between 2019 and 2023, a total of 556 crashes were reported along the corridor, including one severe pedestrian crash and one pedestrian crash resulting in possible injury.
Public Input
Amarillo High School area, particularly along SW 45th Street and Coulter Street, received some of the highest levels of public feedback (111 comments), with strong requests for “New or Improved Sidewalk” and “Crosswalk or Pedestrian Refuge Island”:
• Over 40 percent of comments emphasized the need for sidewalks along Coulter Street and SW 45th Street to enhance pedestrian safety, particularly for children traveling to and from schools, and to improve access to the library and nearby parks
• 23 percent of comments highlighted the need for improving traffic control measures, including traffic signals and stop signs, to improve safety at key intersections such as Coulter Street and 45th Avenue. Residents noted dangerous turning conditions, speeding traffic, and visibility challenges, and better signal timing to address growing traffic volumes and improve access to neighborhoods, schools, and businesses
• Almost 20 percent of comments were made in request for midblock crossing improvements, such as a Pedestrian Hybrid Beacon (PHB) or HAWK signal, and median refuge islands to address the dangers of crossing wide, high-traffic roads
• Additional sidewalks and trails were requested within John Stiff Memorial Park, including connections from neighborhoods directly south into the park and from the ballfields to the library
• Enhanced crossing infrastructure was also sought in front of the library, along Coulter Street, and near Amarillo High School to improve pedestrian safety and accessibility.
Points of Interest
This project connects key destinations, including Amarillo High School, Puckett Elementary School, Bus Route 43, and the Southwest Amarillo Public Library, while serving the surrounding residential neighborhoods.
Consistency with City Plan Vision 2045
This project aligns with City Plan Vision 2045 by enhancing school connectivity to Amarillo High School and promoting safer, more accessible routes for students, pedestrians, and cyclists. Additionally, it supports the plan's goals of improving multimodal transportation infrastructure, fostering community connectivity, and prioritizing safety enhancements in high-traffic areas.
Project Scope
• Install new sidewalks on east side of Coulter Street and on both sides of the SW 45th Avenue Midblock crossing improvements on SW 45th Avenue near Amarillo public library using Pedestrian Hybrid Beacon (warrant analysis needed and need city approval) and a median refuge
• Install crosswalks at intersections and upgrade “kidney” island
• Install pavement markings and 2 bus shelters along the project corridor

Project Planning Level Cost Estimates
The planning level cost estimate for the project is shown in Table TM-8.12 Construction related costs include construction management, inspections, quality control, and materials testing. A 20 percent contingency is built into the construction cost. Engineering and environmental costs include costs related to preparing construction plans, specifications, estimation, and permitting as well as environmental analysis. The cost estimates are in 2024 dollars and based on TxDOT’s October 2024 low-bid averages. Detailed cost estimates are provided in Appendix C: Planning Level Detailed Cost Estimates
Figure TM-8.32. Project 10 – Example Layout Midblock Crossing
Table TM-8.12 Project 10 – Planning Level Cost Estimates
Next Steps, Funding and Implementation
The City of Amarillo will be the lead agency for the implementation of this project. This project was submitted to HSIP in December 2024. Table TM-8.2 has a full assessment of other potential funding opportunities for this project. Detailed funding opportunities are outlined in Appendix B: Funding Sources
City of Amarillo | Transportation Safety Action Plan
Project 11 – NE 24th Pavement and Sidewalk Improvement
Project Map

TM-8.33. Project 11 – Project Map
Timeframe
Long Term
Summary
Roadway pavement improvements and new sidewalks, bus stop upgrade on NE 24th Avenue from N Hughes Street to Highway 136.
Estimated Total Cost $40,385,000
Lead Agency City of Amarillo
Figure
Project Needs
Crash History
The project corridor is located on the City’s High Injury Network, with a total of 427 crashes reported. These include 4 fatal crashes, 17 severe crashes, and 53 non-severe crashes, of which 2 involved pedestrians and 2 involved bicyclists.
Public Input
NE 24th Avenue is one of the corridors with significant feedback in the category of “New or Improved Sidewalks,” with a total of 77 comments collected:
• Over half of the comments (51 percent) highlighted the urgent need for continuous sidewalks on both sides of NE 24th Street to provide safe pathways for pedestrians, particularly schoolchildren and transit users
• Nearly 30 percent addressed concerns about speeding, calling for measures to reduce vehicle speeds and enhance safety for pedestrians and cyclists.
• 23 percent of comments emphasized the dangers of crossing the street due to poor visibility caused by hills, speeding vehicles, and lack of pedestrian signals or crosswalks
• Requests included upgraded intersections with crosswalks and traffic lights to improve access to schools and Ross Rodgers Golf Course
• Additional concerns about flooding and poor road conditions highlighted the need for drainage improvements and better pavement quality.
Points of Interest
This project connects residential areas, parks, grocery stores, the North Amarillo Public Library, Travis Middle School, Ross Rodgers Golf Course, Bus Route 21, and other key destinations.
Project Scope
• Install new sidewalks on both sides of the corridor N Hughes Street to Highway 136.
• Reconstruct pavement, replace waterlines, and replace sanitary sewer lines from N Hughes to Dumas Drive, and from N Grand to Highway 136
• Improve two concrete bus pads along the corridor
• Implement a road diet on NE 24th Street from N Hughes to Dumas Drive (subject to additional study and City approval)

Project Planning Level Cost Estimates
The planning level cost estimate for the project is shown in Table TM-8.13 Construction related costs include construction management, inspections, quality control, and materials testing. A 20 percent contingency is built into the construction cost. Engineering and environmental costs include costs related to preparing construction plans, specifications, estimation, and permitting as well as environmental analysis. The cost estimates are in 2024 dollars and based on TxDOT’s October 2024 low-bid averages. Detailed cost estimates are provided in Appendix C: Planning Level Detailed Cost Estimates
Next Steps, Funding and Implementation
The City of Amarillo will be the lead agency for the implementation of this project. Sources of funding could include TA, Category 7, SS4A Implementation Grant, BUILD, and Section 5310 Scope adjustments are needed for all grant opportunities. Details of funding opportunities are presented in the Appendix B: Funding Sources Table TM-8.2 has a full assessment of potential funding opportunities for this project.
Figure TM-8.34 Project 11 – Example Cross Section
Table
Project 12 – Palo Duro High School SRTS
Project Map

TM-8.35. Project 12 – Project Map
Timeframe
Long Term
Summary
Install sidewalk along NE 15th Street from N Hughes Street to Bivins Street, upgrade one bus stop at the intersection of NE 15th Street and N Buchanan Street.
Estimated Total Cost $4,605,000
Lead Agency
City of Amarillo
Figure
Project Needs
Crash History
This project is located on the City’s High Injury Network. Between 2019 and 2023, a total of 115 crashes occurred along the project corridor, including four bicycle crashes and seven pedestrian crashes. Among these, one was a fatal pedestrian crash, and two involved severe pedestrian injuries.
Public Input
A total of 56 comments were collected along the project corridor, reflecting the community’s significant concerns regarding safety and visibility. There was a high concentration of requests for “New or Improved Sidewalks” and “More Streetlights.”
• Nearly half of the comments (47 percent) expressed the need for continuous sidewalks and improved bike lanes along NW 15th Avenue to ensure safe travel for pedestrians and bicyclists, particularly schoolchildren walking or biking to and from Park Hills and Palo Duro High Schools,
• About 30 percent of comments called for improved lighting, particularly near Martin Road Park and near schools, to enhance visibility and discourage unsafe driving,
• Around 20 percent of comments focused on traffic warnings and control signals, such as flashing school zone lights and traffic signals, to address pedestrian safety and reduce speeding in residential areas.
Points of Interest
This project connects residential neighborhoods to key destinations, including Park Hills Elementary School, Palo Duro High School, Bus Route 21, nearby parks, and ball fields, enhancing accessibility and safety for the community.
Project Scope
• Install new sidewalks along both sides of the project corridor along with streetlights
• Install crosswalks as needed
• Improve the angle parking along NE 15th Street to reverse angle parking
• Upgrade one bus stop with standard concrete bus pad


Figure TM-8.36 Project 12 – Example Layout Near Palo Duro High School
Figure TM-8.37 Project 12 – Example Diagram for Reverse Angle Parking
Project Planning Level Cost Estimates
The planning level cost estimate for the project is shown in Table TM-8.14 Construction related costs include construction management, inspections, quality control, and materials testing. A 20 percent contingency is built into the construction cost. Engineering and environmental costs include costs related to preparing construction plans, specifications, estimation, and permitting as well as environmental analysis. The cost estimates are in 2024 dollars and based on TxDOT’s October 2024 low-bid averages. Detailed cost estimates are provided in Appendix C: Planning Level Detailed Cost Estimates.
Table TM-8.14. Project 12 – Planning Level Cost Estimates
Next Steps, Funding and Implementation
The City of Amarillo will be the lead agency for the implementation of this project. Sources of funding could include HSIP, TA, Category 7, SS4A Implementation Grant, BUILD, and Section 5310. Scope adjustments are needed for all grant opportunities. Details of funding opportunities are presented in Appendix B: Funding Sources. Table TM-8.2 has a full assessment of potential funding opportunities for this project.
Project 13 – SW 6th Avenue Gateway Project
Project Map

TM-8.38. Project 13 – Project Map
Timeframe
Long Term
Summary
Total reconstruction of the SW 6th Avenue from Belleview Street to S Mc Masters Street, including the installation of a roundabout at the intersection of S Georgia Street, S Mc Masters Street, and SW 6th Avenue.
Estimated Total Costs
$19,121,000
Lead Agency
City of Amarillo
Figure
Project Needs
Crash History
This project is located on the City’s High Injury Network. Between 2019 and 2023, a total of 123 crashes occurred along the 0.8-mile corridor, including two pedestrian crashes, one of which was severe. Notably, 34 percent of these crashes occurred at the intersection of SW 6th Avenue, S Georgia Street, and S McMasters Street, highlighting the critical need for safety improvements at this location.
Public Input
This project has collected 34 comments, and almost all categories were evenly mentioned across: “New or Improved Sidewalk”, “Reduce Speed”, “New or Improved Bike Lane”, and “More Streetlights.” The even distribution indicates an overall need for improvements along this corridor.
• 45 percent of comments emphasized the need for sidewalks and crosswalks, particularly near schools such as San Jacinto Christian Academy and San Jacinto Elementary School, to ensure safer pedestrian crossings
• 29 percent of comments requested traffic calming countermeasures along the corridor, citing concerns about speeding and pedestrian safety. Feedback emphasized that 6th Street is highly dangerous for pedestrians, particularly as a major tourist area with inadequate sidewalks, poor lighting, and limited crosswalks. The public also called for reduced speed school zones near two local schools and suggested extending and improving curb extensions to enhance walkability and safety.
• Around 20 percent of comments requested improved traffic signals or stoplights to address safety concerns at key intersections, citing issues such as unclear signal visibility, outdated traffic lights, and the need for four-way stops to enhance traffic flow and pedestrian safety.
• Some comments highlighted the historical significance of the corridor as part of Route 66, with suggestions for street trees and decorative street lighting to enhance its aesthetic and align with the historic vision
• Some feedback also highlighted poor pavement conditions and the need for infrastructure improvements, such as new sidewalks and bike lanes, to promote walkability and cycling safety in this popular tourist and retail area
Points of Interest
SW 6th Avenue, part of the historic Texas Route 66, is a major attraction for both tourists and local residents. This corridor features key destinations, including San Jacinto Christian Academy and San Jacinto Elementary School, the Amarillo Route 66 Historical Sign, Bus Route 11, and the Texas Route 66 Visitor Center. Additionally, the area is home to a variety of local restaurants, retail shops, and other businesses that contribute to its vibrant and unique character. These points of interest highlight the importance of enhancing pedestrian safety, accessibility, and infrastructure to support tourism and community activity in this historically significant area.

Project Scope
• Install new sidewalks along both sides of the project corridor
• Install crosswalks and pedestrian lighting along the corridor
• Improve pavement condition along the corridor with new asphalt
• Upgrade 3 bus stops to bus shelters
• Convert the intersection of S Georgia Street, SW 6th Avenue, and McMaster Street to a roundabout (additional traffic study needed, needs city approval)
Figure TM-8.39 Photo of Route 66 Sign

Project Planning Level Cost Estimates
The planning level cost estimate for the project is shown in Table TM-8.15 Construction related costs include construction management, inspections, quality control, and materials testing. A 20 percent contingency is built into the construction cost. Engineering and environmental costs include costs related to preparing construction plans, specifications, estimation, and permitting as well as environmental analysis. The cost estimates are in 2024 dollars and based on TxDOT’s October 2024 low-bid averages. Detailed cost estimates are provided in Appendix C: Planning Level Detailed Cost Estimates
Figure TM-8.40. Project 13 – Example Layout for Proposed Roundabout
Table TM-8.15 Project 13 – Planning Level Cost Estimates
Next Steps, Funding and Implementation
The City of Amarillo will be the lead agency for the implementation of this project. Sources of funding could include TA, Category 7, SS4A Implementation Grant, and BUILD. Scope adjustments are needed for all grant opportunities. Details of funding opportunities are presented in Appendix B: Funding Sources Table TM-8.2 has a full assessment of potential funding opportunities for this project.
Project 14 – Western Street SUP and Access Management
Project Map

TM-8.41. Project 14 – Project Map
Timeframe
Summary
Access management and shared use path along Western Street from Canyon Drive to SW 34th Avenue
Estimated Total Cost
$9,174,000
Lead Agency City of Amarillo Long Term
Figure
Project Needs
Crash History
This project corridor is located on the city’s High Injury Network. Between 2019 and 2023, a total of 537 crashes were reported along the corridor, including three bicycle crashes and six pedestrian crashes. Notably, S Western Street ranks among the top three corridors with the highest number of crashes that could be significantly reduced through improved access management. Analysis indicated that up to 40 percent of total crashes along this corridor could potentially be mitigated by implementing access management countermeasures.
Public Input
A total of 120 comments were collected along this project with high concentration of comments in the “New or Improved Sidewalk” category:
• Almost half of the comments (43 percent) emphasized the need for clearly marked crosswalks and continuous ADA-compliant sidewalks on both sides of the corridor, particularly to improve pedestrian safety for seniors and people with disabilities who frequently cross the road.
• Over 30 percent of comments called for general infrastructure maintenance, including improved lane markings, pavement repairs, and removal of dips or uneven transitions that pose hazards for vehicles and pedestrians.
Points of Interest
Connects residential areas to retail establishments, the USPS, grocery stores, and other essential destinations.
Project Scope
• Install shared use path on west side of the corridor from Canyon Drive to SW 34th Avenue
• Extend curb line along Western Street where side streets occurs
• Install concrete medians to enhance access management along the corridor where needed

Project Planning Level Cost Estimates
The planning level cost estimate for the project is shown in Table TM-8.16 Construction related costs include construction management, inspections, quality control, and materials testing. A 20 percent contingency is built into the construction cost. Engineering and environmental costs include costs related to preparing construction plans, specifications, estimation, and permitting as well as environmental analysis. The cost estimates are in 2024 dollars and based on TxDOT’s October 2024 low-bid averages. Detailed cost estimates are provided in Appendix C: Planning Level Detailed Cost Estimates.
Next Steps, Funding and Implementation
The City of Amarillo will be the lead agency for the implementation of this project. Sources of funding could include TA, Category 7, SS4A Implementation Grant, and BUILD. Details of funding opportunities are presented in Appendix B: Funding Sources. Table TM-8.2 has a full assessment of potential funding opportunities for this project.
Figure TM-8.42 Project 14 – Example Layout for Proposed Roundabout
Table TM-8.16. Project 14 – Planning Level Cost Estimates
Project 15 – SW 34th Street Total Reconstruction
Project Map

TM-8.43. Project 15 – Project Map
Timeframe
Summary
Total reconstruction of SW 34th Avenue from S Western Street to S Tyler Street.
Estimated Total Cost
$36,817,000
Lead Agency City of Amarillo Long Term
Figure
Project Needs
Crash History
The project corridor is on the City’s High Injury Network. Between 2019-2023, a total of 482 crashes occurred along the corridor, including one fatal crash, 15 severe crashes (one of which was a severe pedestrian crash) and 43 non-severe crashes (including two non-severe bike crashes)
Public Input
The project corridor received a total of 45 comments. The majority of the comments were in the “New or Improved Sidewalk” and “Reduce Speed” categories:
• Over 40 percent of the comments emphasized the need for continuous, ADA-compliant sidewalks along 34th Avenue, especially between Western and Georgia Streets, to improve safety for pedestrians, including children, individuals in wheelchairs, and park visitors. Crosswalks were frequently requested at major intersections to enhance pedestrian safety.
• 35 percent of the comments pointed to poor road conditions along the corridor, including potholes, uneven surfaces, and manhole issues. Residents requested resurfacing to improve drivability and reduce hazards.
• Concerns about speeding and racing, particularly during evening hours, were common. Suggestions included implementing a road diet, reducing lane widths, and adding traffic calming measures like speed humps to slow traffic and improve neighborhood safety.
• Requests for improved lighting along the corridor were also frequent, with residents emphasizing the need for better visibility to deter unsafe driving behaviors and enhance pedestrian safety.
• Comments highlighted the need for better connectivity between neighborhoods, parks, and local destinations, with recommendations for improved pedestrian and bike access to Paramount Park and other community amenities.
Points of Interest
This project would connect nearby residential areas to Paramount Park, Coronado Elementary School, grocery stores, shopping centers, retail establishments, restaurants, and other key community destinations.
Project Scope
• This project involves the total reconstruction of the corridor, including:
• Installing new sidewalks along both sides of the corridor
• Implementing intersection improvements, such as new crosswalks, ADA ramps, and pavement markings
• Adding a midblock crossing near Paramount Park using a Pedestrian Hybrid Beacon (subject to additional analysis and City approval)
• Reconstructing roadway pavement and replacing water and sanitary sewer lines

Project Planning Level Cost Estimates
The planning level cost estimate for the project is shown in Table TM-8.17 Construction related costs include construction management, inspections, quality control, and materials testing. A 20 percent contingency is built into the construction cost. Engineering and environmental costs include costs related to preparing construction plans, specifications, estimation, and permitting as well as environmental analysis. The cost estimates are in 2024 dollars and based on TxDOT’s October 2024 low-bid averages. Detailed cost estimates are provided in Appendix C: Planning Level Detailed Cost Estimates
Figure TM-8.44 Project 15 – Example Layout for Proposed Roundabout
Table TM-8.17 Project 15 – Planning Level Cost Estimates
Next Steps, Funding and Implementation
The City of Amarillo will be the lead agency for the implementation of this project. Sources of funding could include TA, Category 7, SS4A Implementation Grant, and BUILD. Scope adjustments are needed for all grant opportunities. Details of funding opportunities are presented in Appendix B: Funding Sources. Table TM-8.2 has a full assessment of potential funding opportunities for this project.
Project 16 – TxDOT Facility Intersection Study
Project Map

TM-8.45. Project 16 – Project Map
Timeframe
Long Term
Summary
TxDOT study on two intersections including: Loop 335 and Arden Road and Loop 335 and Hillside Road. Both intersections are within TxDOT right-ofway (ROW).
Estimated Total Cost Not Applicable
Lead Agency TxDOT
Figure
Project Needs
Crash History
This project is not located on the City’s High Injury Network. Due to the recent (2024) openings of the Hillside Road and Loop 335 intersection in 2022 and the Arden Road and Loop 335 intersection, a full five-year crash data analysis could not be conducted. However, a total of eight vehicle crashes have been reported, including one non-severe vehicle crash between 2022 and 2023
Public Input
These two intersections received the highest volume of feedback among all locations, with nearly 300 comments collected. Of these, 251 comments focused on the Loop 335 and Arden Road intersection, ranking it in the top three for both the “More Stop Signs and/or Signals” and “More Streetlights” categories:
• Numerous comments called for the installation of traffic signals or stoplights at key intersections, such as Arden Road and Helium Road (Loop 335), to address frequent accidents and improve safety for high school students, staff, and parents navigating heavy traffic.
• Many residents expressed concerns about excessive speeding, with calls for better enforcement of speed limits, particularly in school zones, to protect young and inexperienced drivers as well as pedestrians
• Requests were made for enhanced pedestrian infrastructure, including crosswalks, sidewalks, streetlights, and even pedestrian bridges, to improve safety and accessibility for students walking to and from school
• The lack of lighting at intersections and along major routes was highlighted, with multiple comments mentioning the need for streetlights to improve visibility and reduce accidents during early mornings and evenings
• Calls to reconfigure traffic flow and improve road markings were frequent, with suggestions to add turn lanes, acceleration lanes, and clearer directional signage to ease congestion and reduce confusion at key intersections
Points of Interest
This project would improve safety connectivity to West Plains High School and nearby residential areas.
Project Scope
Both intersections fall within TxDOT's right-of-way, limiting the City’s authority to implement changes directly. However, action is needed to address safety concerns. A request to TxDOT can be submitted to study potential safety improvements for these two intersections, including but not limited to:
• New sidewalks to close the gap between the intersections and West Plains High School, enhancing pedestrian accessibility and safety
• Traffic control devices to improve traffic flow and reduce conflicts at key intersections
Project Planning Level Cost Estimates
Not Applicable
Next
Steps, Funding and Implementation
TxDOT would serve as the lead agency for implementing this study The City plans to submit a request to initiate the process of a study. During a recent MPO Technical Advisory Committee meeting, it was noted that TxDOT has commissioned a study for an overpass on Arden Road, demonstrating progress toward addressing safety and accessibility concerns.
Appendix A: Transportation Demand Analysis Maps

A.1. Analysis Results
Figure
City of Amarillo | Safe Streets and Roads for All Plan

Figure A.2. Fundamental Demographic Demand (Factors 1 – 5)
City of Amarillo | Safe Streets and Roads for All Plan

Figure A.3. Factor 1 – Households in Poverty
Amarillo

Figure A.4. Factor 2 – Home of Workers with Jobs Paying $15,000 Annually
City of Amarillo | Safe Streets and Roads for All Plan

Figure A.5. Factor 3 – Work Sites of Workers with Jobs Paying $15,000 Annually
Amarillo

Figure A.6. Factor 4 – Single Parent Female Headed Households with Children
City of Amarillo | Safe Streets and Roads for All Plan

Appendix A: Transportation Demand Analysis Maps
Figure A.7. Factor 5 – Households with a Member with a Disability
City of Amarillo | Safe Streets and Roads for All Plan
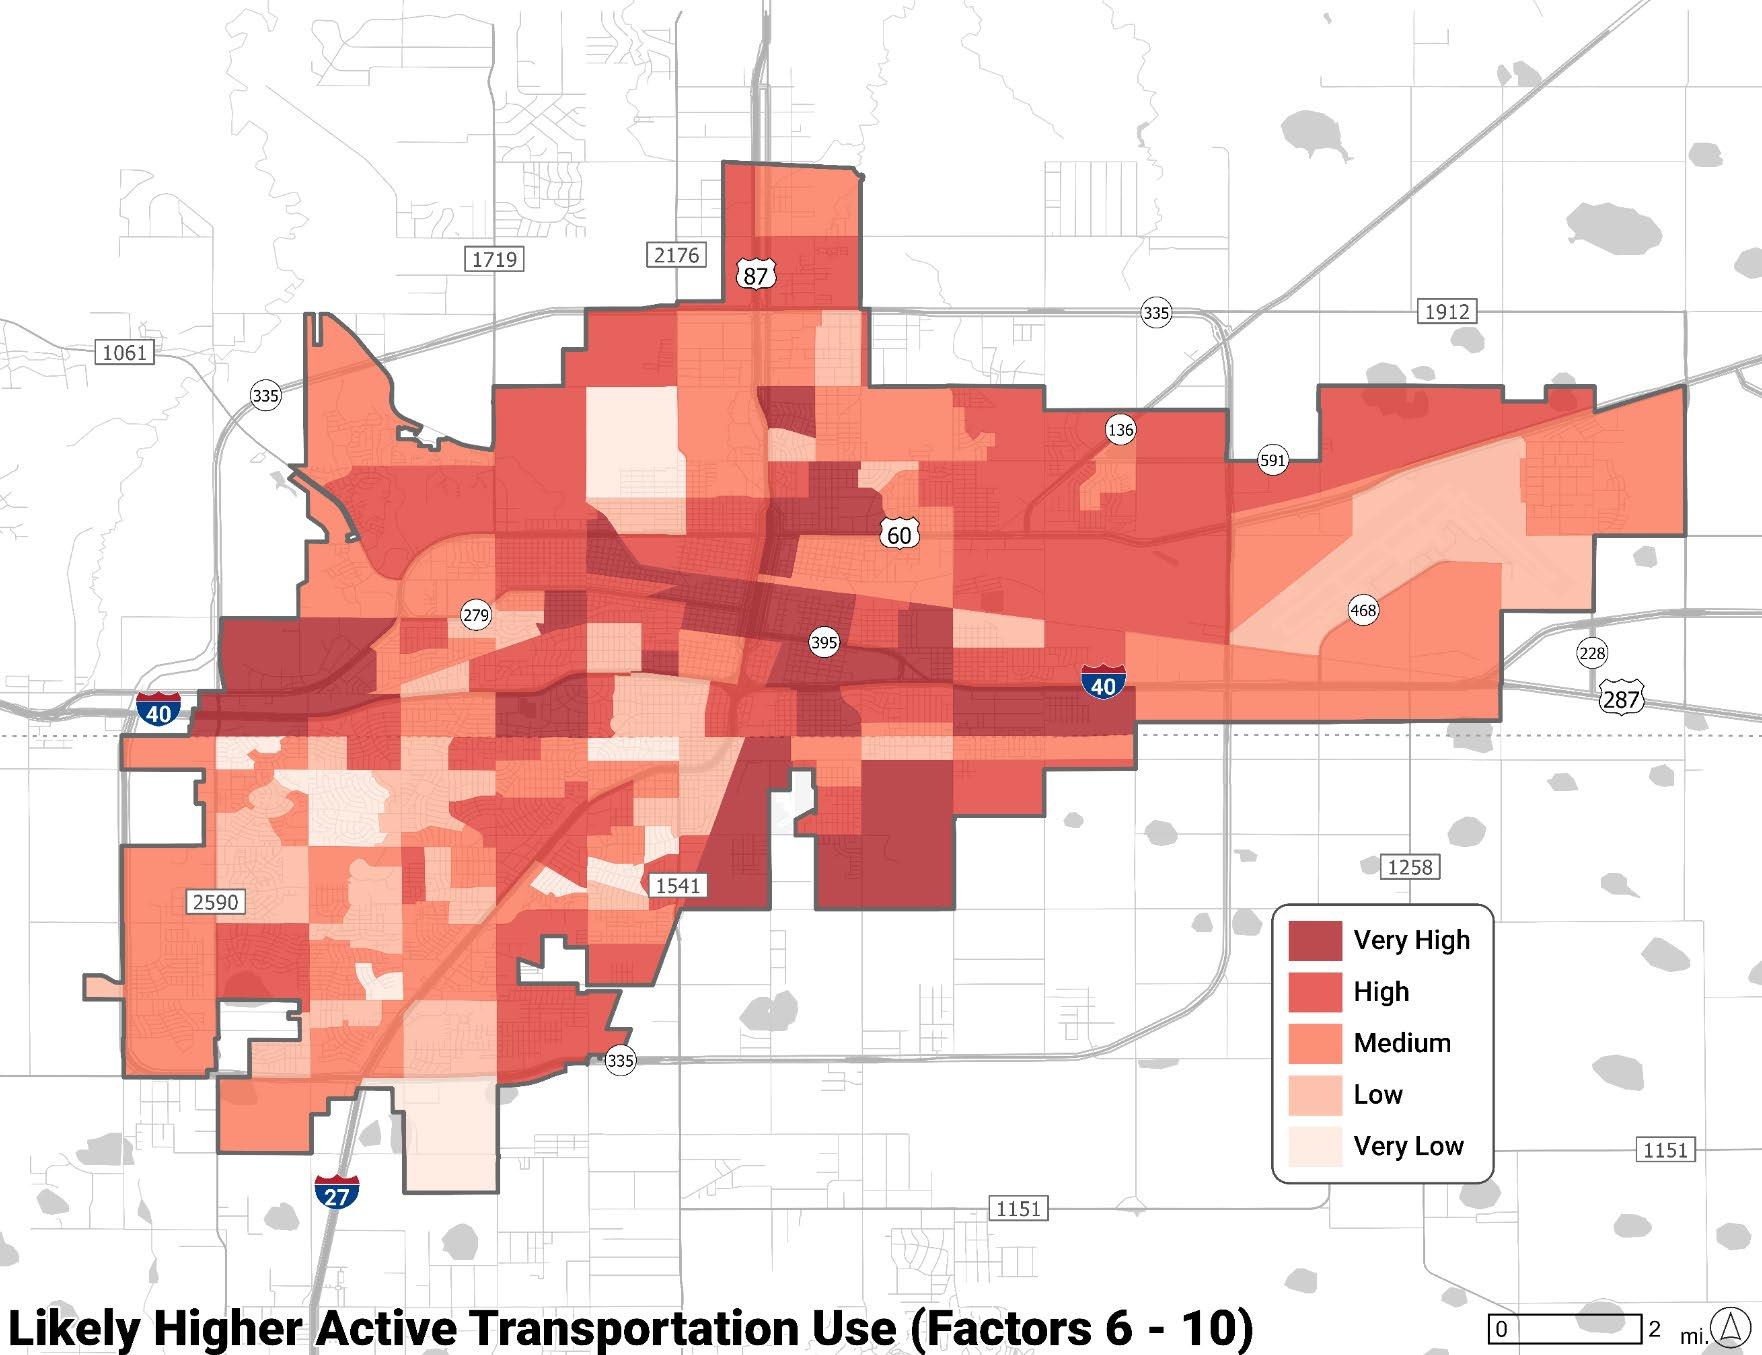
Figure A.8. Likely Higher Active Transportation Use (Factors 6 – 10)
City of Amarillo | Safe Streets and Roads for All Plan

Figure A.9. Factor 6 – People of Color Population
City of Amarillo | Safe Streets and Roads for All Plan

Figure A.10. Factor 7 – Zero Vehicle Available Households

City of Amarillo | Safe Streets and Roads for All Plan Appendix A: Transportation Demand Analysis Maps
Figure A.11. Factor 8 – Workers Commuting by Transit
City of Amarillo | Safe Streets and Roads for All Plan

Figure A.12. Factor 9 – Homes of Workers with High School Education or Less
of Amarillo

Figure A.13. Factor 10 – Work Sites of Workers with High School Education or Less
City of Amarillo | Safe Streets and Roads for All Plan

Figure A.14. Human & Built Environment Suitability (Factors 11 – 13)
City of Amarillo | Safe Streets and Roads for All Plan

Figure A.15. Factor 11 – Household Density
City of Amarillo | Safe Streets and Roads for All Plan

Appendix A: Transportation Demand Analysis Maps
Figure A.16. Factor 12 – Population Density
City of Amarillo | Safe Streets and Roads for All Plan

Appendix A: Transportation Demand Analysis Maps
Figure A.17. Factor 13 – Average Block Size
City of Amarillo | Safe Streets and Roads for All Plan

Appendix
Figure A.18. Optimized Hot Spot Analysis
Appendix B: Funding Sources
Funding Sources
A variety of funding sources are available for the projects outlined in Chapter 7 – Targeted Safety Improvement Projects. This appendix provides a summary of each identified funding source.

Texas Department of Transportation (TxDOT)
TxDOT Highway Safety Improvement Program (HSIP)
The TxDOT HSIP is designed for roadway safety projects that eliminate or reduce the number and severity of traffic crashes. Funding is limited to improvements that address the crashes identified in the Texas Strategic Highway Safety Plan (SHSP). Funds are provided for construction and operational improvements both on and off the state highway system. Funding is available statewide for this program and focuses primarily on improving safety and reducing severe crashes.
The HSIP funds a variety of projects, including but not limited to:
• Roadway and intersection improvements: Installation or upgrades of traffic signals, pavement markings, roundabouts, and other infrastructure to enhance traffic flow and safety.
• Pedestrian and bicycle safety enhancements: Construction of sidewalks, crosswalk improvements, bike lanes, shared-use paths, and lighting to improve visibility and safety for nonmotorized users.
• Systemic safety improvements: Installation of median barriers, guardrails, and railroad crossing upgrades such as warning devices and gates to mitigate crash severity and enhance safety in high-risk areas.
The program is open to local governments, transportation agencies, and other eligible entities with projects that align with the safety priorities outlined in the Texas Strategic Highway Safety Plan (SHSP).
HSIP funding supports construction and operational improvements on and off the state highway system, with a typical local match requirement of 10%. However, exceptions to the match requirement may apply for specific projects, ensuring greater accessibility for entities seeking to enhance roadway safety and reduce severe crashes.
TxDOT Transportation Alternatives (TA)
TxDOT’s Public Transportation Division administers federal funding programs, including the Transportation Alternatives (TA) Program, which provides funding for projects aimed at improving safety, access, and mobility for non-motorized roadway users. The program offers flexible funding opportunities for different project categories, addressing community-based needs, large-scale infrastructure, network enhancements and planning efforts.
The TA Program supports a variety of eligible projects, including:
• Community-Based Projects: Focus on preliminary engineering and construction for bike lanes, sidewalks, shared-use paths, and ADA-compliant pedestrian infrastructure. Funding ranges from $250,000 to $5 million per project
• Large-Scale Active Transportation Infrastructure: High-impact projects, such as regional trails or major active transportation corridors, with funding between $5 million and $25 million per project.
• Network Enhancements and Non-Infrastructure Projects: Quick construction or installation projects with limited construction elements or non-motorized transportation planning documents to support broader active transportation goals.
• Active Transportation Non-Infrastructure Projects: Funding for non-motorized transportation planning documents, such as pedestrian safety action plans, bicycle facility plans, and similar planning initiatives that assist communities in developing comprehensive strategies for active transportation.
Projects are evaluated based on safety improvements, access and mobility enhancements, and alignment with community goals. A 20% local match is required, unless Transportation Development Credits (TDCs) are applied.
By supporting a range of project sizes and scopes, the TA Program ensures that both localized and large-scale improvements can be realized, fostering safer and more accessible active transportation networks across Texas.

Amarillo Area Metropolitan Planning Organization (MPO)
Category 7 – Surface Transportation Block Grant
Category 7 (CAT 7) funding, administered through the Surface Transportation Block Grant (STBG) Program, provides flexible federal support for surface transportation projects. This program helps states and localities address infrastructure needs, including roadway improvements, public transit enhancements, and multimodal projects. To qualify, projects must meet federal eligibility criteria, including adherence to design standards and environmental requirements.
Typical eligible projects include but are not limited to:
• Roadway and Intersection Improvements: Widening, resurfacing, reconstruction, turn lanes, roundabouts, and traffic signal upgrades to improve capacity, safety, and congestion.
• Multimodal Enhancements: Sidewalks, ADA-compliant pedestrian infrastructure, bicycle facilities, and shared-use paths to improve safety and accessibility.
• Public Transit Infrastructure: Bus shelters, transit stations, parkand-ride facilities, and transit vehicle purchases to enhance system efficiency.
• Congestion Mitigation: Intelligent Transportation Systems (ITS), signal timing upgrades, and freight movement improvements to reduce congestion.
• Safety and Traffic Calming: Speed humps, speed cushions, curb extensions, and road diets to enhance roadway safety.
• Planning and Studies: Corridor studies, transportation plans, and environmental reviews to support future projects.
Local project sponsors are typically required to provide a minimum 20% match. The project selection process is managed by MPOs, which prioritize submissions based on factors such as safety improvements, congestion relief, multimodal integration, and regional economic benefits. CAT 7 funding offers communities the ability to develop transportation projects that align with their unique needs while promoting regional connectivity and economic growth.


U.S. Department of Transportation (USDOT)
Safe Streets and Roads for All (SS4A) Implementation Grant
The SS4A Implementation Grant, administered by the U.S. Department of Transportation (USDOT), provides funding to execute strategies and projects outlined in a community’s Comprehensive Safety Action Plan. This program focuses on reducing traffic fatalities and serious injuries through data-driven, community-oriented safety interventions that align with the Safe System Approach.
The Implementation Grant supports a variety of activities aimed at enhancing roadway safety:
• Infrastructure Safety Improvements: Projects may include constructing pedestrian facilities like sidewalks, crosswalks, pedestrian refuge islands, and shared-use paths or upgrading intersections with roundabouts, roadway reconfigurations, and traffic calming measures such as speed humps and road diets.
• Advanced Safety Technology and Systems: Funding is available for the installation of safety systems, including automated enforcement tools (e.g., speed and red-light cameras), intelligent transportation systems (ITS), and other advanced technologies designed to monitor and improve roadway safety.
• Behavioral and Operational Safety Measures: Communities can implement public education campaigns, promote safe driving behaviors, and introduce enforcement programs to address speeding, impaired driving, and other unsafe practices.
• Supplemental Planning and Analysis: The grant supports safety strategy refinement, road safety audits, and the preparation of designs and specifications for projects tied to comprehensive safety action plans.
Grants range from $100,000 to $25 million, depending on the size and scope of the project. Applicants must provide a minimum 20% non-federal match. Eligible recipients include metropolitan planning organizations (MPOs), cities, counties, tribal governments, and other political subdivisions of a state. The program prioritizes projects that demonstrate readiness for implementation, address high-risk areas, and align with community safety goals.
Safe Streets and Roads for All (SS4A) Demonstration Grant
The SS4A Demonstration Grant, administered by the U.S. Department of Transportation (USDOT), supports temporary or pilot projects that test innovative safety strategies as part of the Safe Streets and Roads for All initiative. These grants allow communities to evaluate new safety interventions before scaling them into permanent solutions, helping to address local traffic safety challenges and advance the Safe System Approach.
Demonstration Grants fund temporary, small-scale projects aimed at reducing crashes and improving roadway safety, including:
• Pilot Infrastructure Projects: Temporary installations such as protected bike lanes, pedestrian refuge islands, roundabouts, and curb extensions. These projects test design innovation and their potential impact on safety outcomes.
• Traffic Calming Measures: Short-term solutions like chicanes, temporary speed humps, narrowed lanes, or other designs to manage vehicle speeds and improve conditions for vulnerable road users.
• Evaluation and Community Engagement: Activities include data collection, public engagement, and feedback to refine safety solutions.
Demonstration projects allow communities to assess the effectiveness of safety strategies while building support for future implementation.
Grants provide funding for up to 80% of project costs, with recipients required to contribute a minimum 20% non-federal match. Eligible applicants include MPOs, cities, counties, tribal governments, and other political subdivisions of a state. Demonstration projects must align with a Comprehensive Safety Action Plan or similar framework and support broader safety goals.

Better Utilizing Investments to Leverage Development (BUILD) Grant Program
The Better Utilizing Investments to Leverage Development (BUILD) Grant, administered by the U.S. Department of Transportation (USDOT), provides discretionary funding for surface transportation infrastructure projects that have a significant local or regional impact. This program focuses on making transformative investments that enhance safety, economic development, community connectivity, and mobility.
BUILD grants support a diverse range of infrastructure projects across various transportation modes:
• Multimodal and Surface Transportation Projects: Roadway improvements, public transit infrastructure, rail upgrades, and port enhancements that improve mobility and reduce transportation bottlenecks.
• Freight and Economic Development Projects: Projects that enhance freight movement, improve access to industrial or commercial hubs, or expand regional economic opportunities.
• Community and Transportation Infrastructure Improvements: Projects that enhance community connectivity and access to essential services through upgraded infrastructure, including improved roadways.
BUILD grants provide funding for large-scale projects that demonstrate local or regional significance. The program supports both rural and urban projects. Entities seeking funding must demonstrate non-federal match contributions, typically between 20-50%, though this requirement may vary depending on the project's location and scope. Eligible applicants include state and local governments, metropolitan planning organizations (MPOs), tribal entities, transit agencies, and other public entities.

Federal Transit Administration (FTA)
Enhanced Mobility of Seniors and Individuals with Disabilities Program (Section 5310)
The Section 5310 program provides funding to improve mobility for seniors and individuals with disabilities by removing barriers to transportation services and expanding mobility options. This program aims to help states and localities enhance transportation services for these populations, promoting independence and improved access to community resources.
Eligible projects include:
• Traditional Capital Projects:
o Buses and vans
o Wheelchair lifts, ramps, and securement devices
o Transit-related information technology systems, including scheduling/routing/one-call systems
o Mobility management programs
o Acquisition of transportation services under a contract, lease, or other arrangement
• Nontraditional Projects:
o Construction of an accessible path to a bus stop, including curb-cuts, sidewalks, accessible pedestrian signals or other accessible features
o Improvements to signage, or way-finding technology
o Purchase of vehicles to support new accessible taxi, rides sharing and/or vanpooling programs
o Mobility management programs, etc.
Section 5310 provides both formula and discretionary funding, allocated to states and metropolitan planning organizations (MPOs) based on population data. Funding typically requires a local match, with 20% for capital projects and 50% for operating assistance. Public transportation providers, non-profit organizations, and local governmental authorities are eligible to apply for funding to enhance mobility services.
Safer Speed for Schools
Project 2 – Phase I Intersection Improvements
Project 3 – Phase II Intersection Improvements
Phase II Intersection Improvements
Project 4 – Non-TxDOT Signal Improvements
Project 5 – Farmers Avenue Shared Use Path (SUP)
Farmers Avenue Shared Use Path (SUP)
Project 6 – Eastridge Safe Routes to School (SRTS)
Eastridge Safe Routes to School (SRTS)
Project 7 – Fannin and South Lawn SRTS
Fannin and South Lawn SRTS
Project 8 – Georgia Street Access Management
Georgia Street Access Management
Project 9 – Woodlands Elementary School SRTS
Woodlands Elementary School SRTS
Project 10 – Amarillo High School SRTS
Amarillo High School SRTS