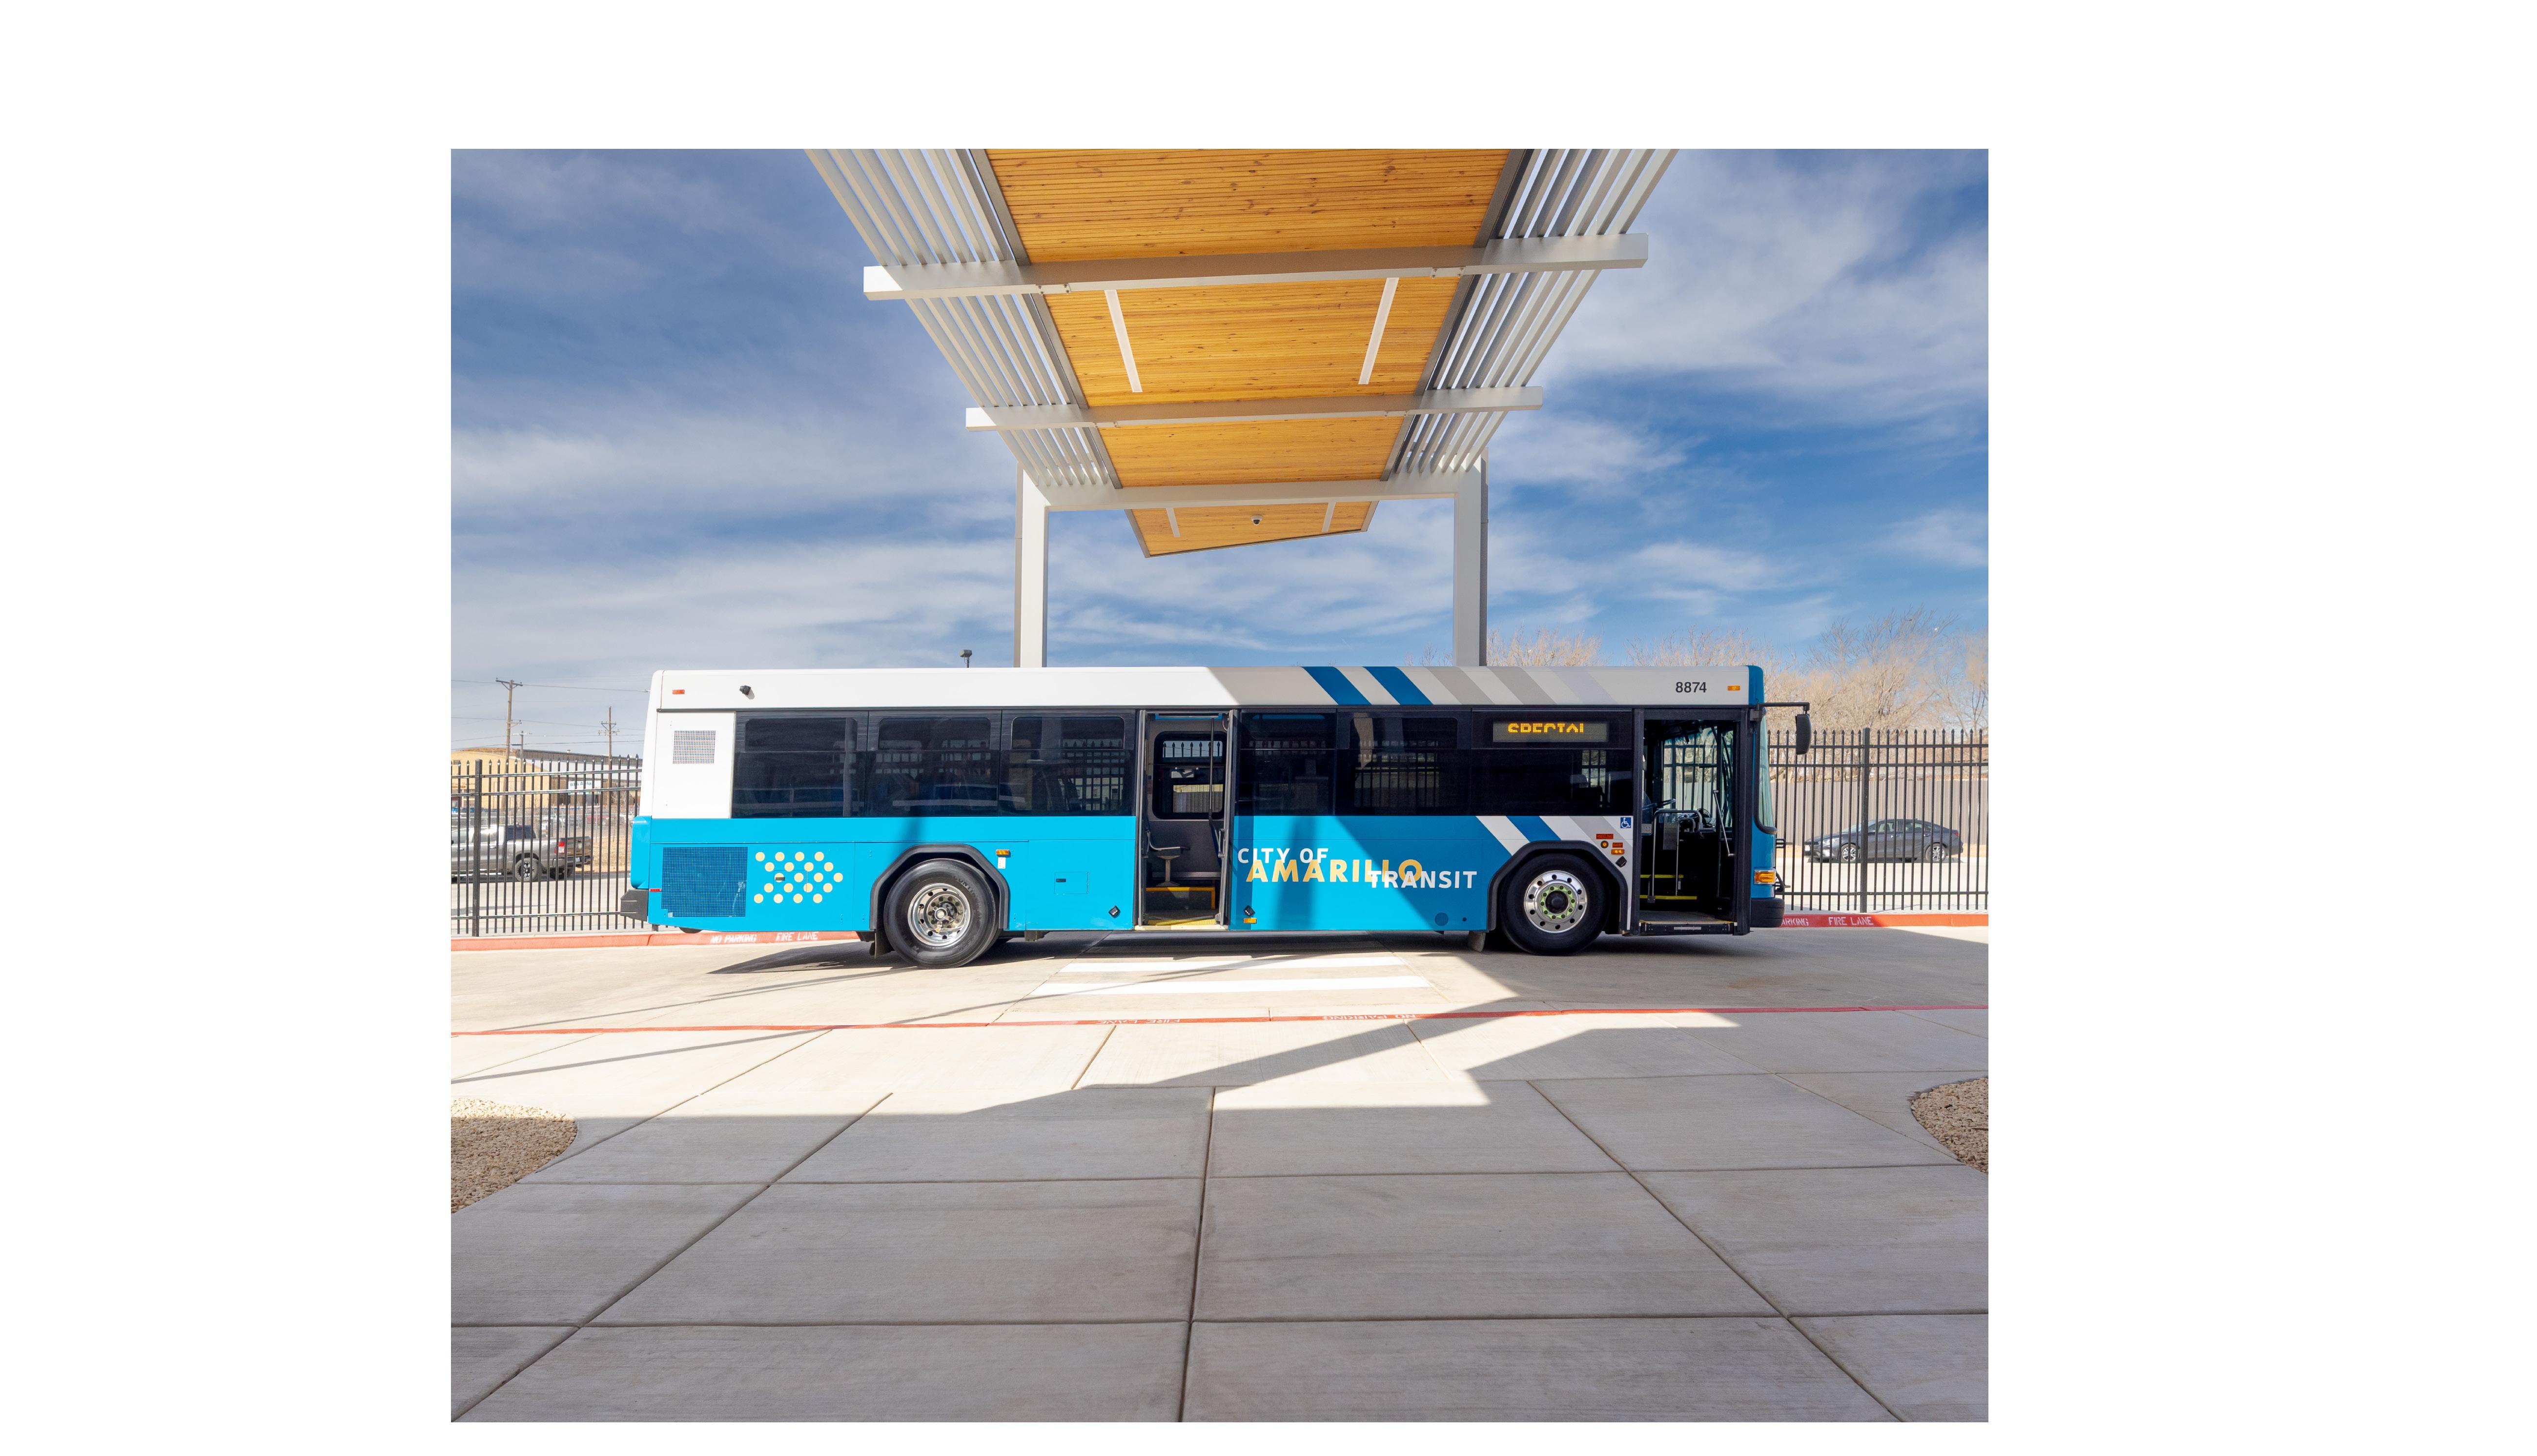
City of Amari o, Texas
POPULAR ANNUAL FINANCIAL REPORT FOR THE FISCAL YEAR ENDED SEPTEMBER 30, 2023
APRIL 2024


POPULAR ANNUAL FINANCIAL REPORT FOR THE FISCAL YEAR ENDED SEPTEMBER 30, 2023
APRIL 2024
In the City of Amarillo, there is a unique way of looking at challenges. Challenges are not obstacles. Challenges are an opportunity for success.
In the past year, the city has faced the challenges of Mother Nature, approved a budget and addressed complex issues such as homelessness and illegal dumping. These issues presented opportunities for the city to respond to community priorities in new and innovative ways.

The Popular Annual Financial Report (PAFR) details how the city managed taxpayer money for the past fiscal year. The PAFR also shows how community priorities are addressed.
The 2023/2024 budget: One of the responsibilities of city council is the city budget. Councilmembers dove into the budget for months, approving a $531 million budget. The budget reflects voter priorities of public safety and infrastructure, with funding for three new fire chiefs and four police officers. In addition, $28 million is budgeted for street projects.
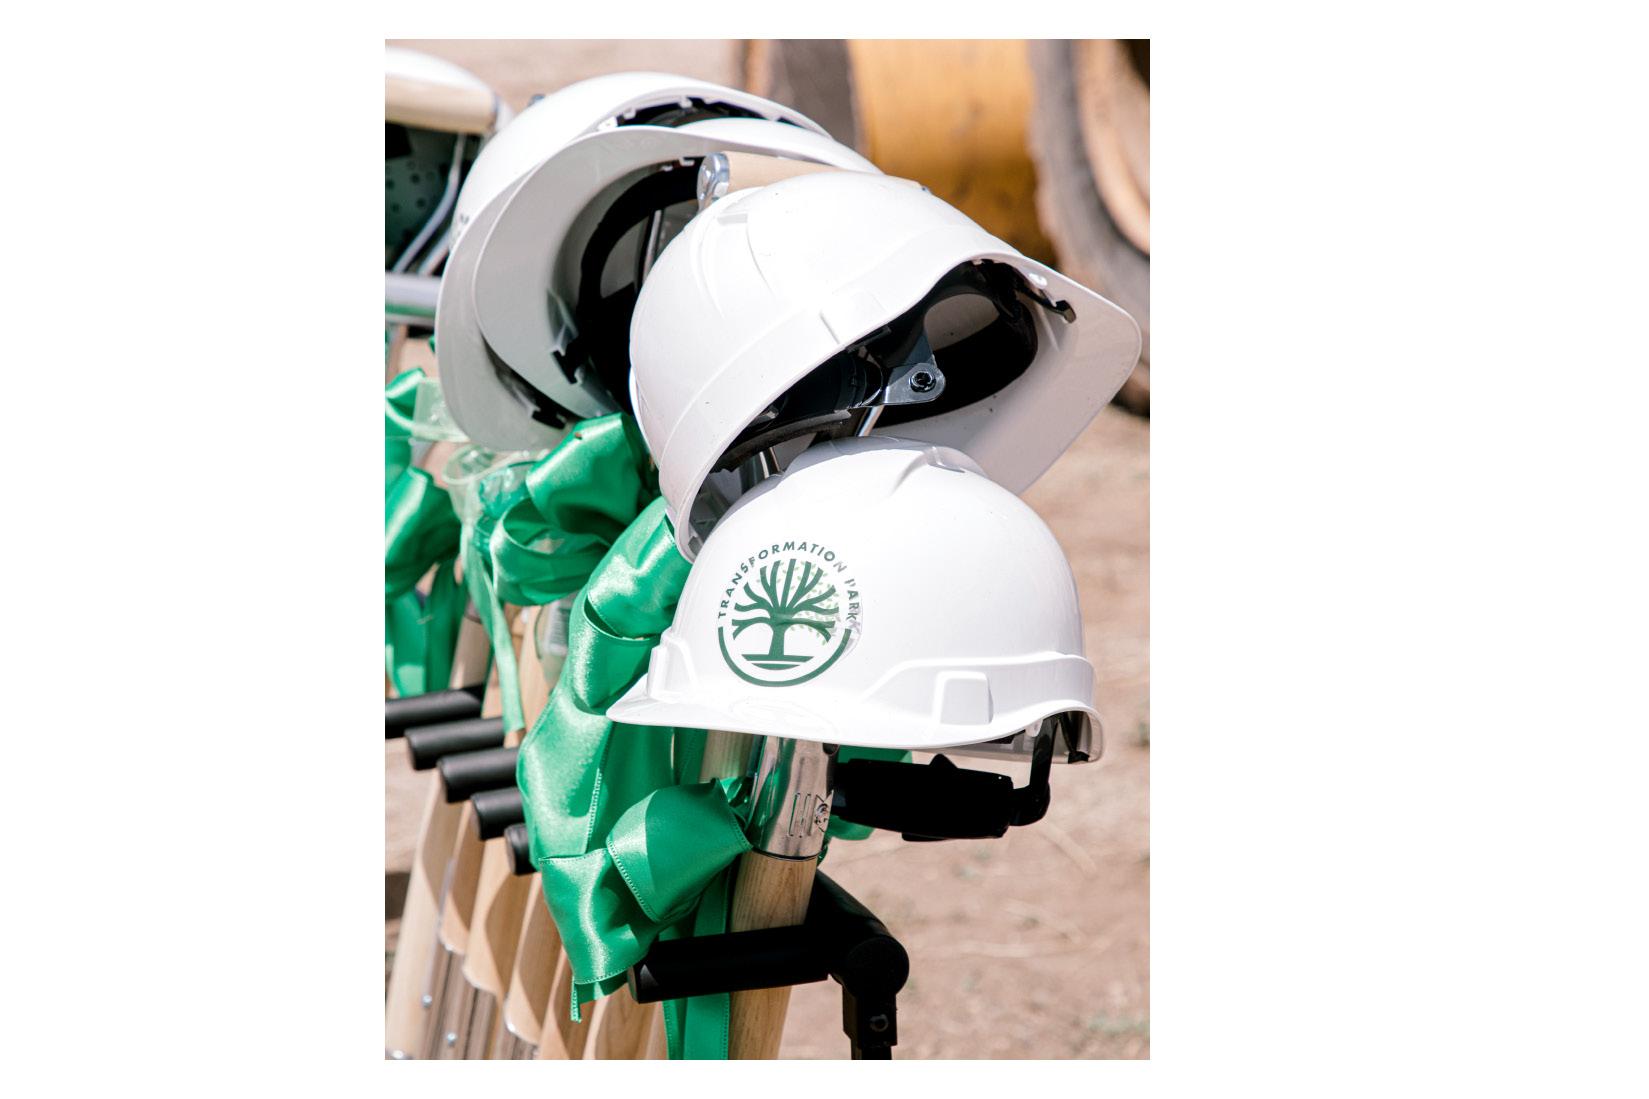
Helping the Homeless: Transformation Park is a reality in the making, providing an example of what Amarillo can accomplish when city, church and private resources are used for a common goal. Transformation Park will be a cabin community meeting the needs of those experiencing homelessness.
Fighting the Flood: Amarillo weather runs the gamut – from extreme heat and cold and wind to snow, drought and rain. In spring of 2023, rain put Amarillo to the test. The city endured flooding not seen since the early 1980s. In March 2024, council approved a $39 million bond for improvements to the city drainage system.
Illegal dumping: Amarillo is taking a unique approach to addressing illegal dumping with a pilot program. City staff implemented the Bulk Waste pilot program. Citizens work to pick up illegally dumped items from areas selected by the city. This strategic approach could expand across Amarillo's footprint, making it easier to work with the city while also beautifying the community.
Welcome, Emma: Thanks to Emma, technology is helping bridge the language barrier in Amarillo. Emma is a digital assistant that will live on the city website. Not only is Emma fluent in many languages (the Amarillo population is diverse), but she will also be able to provide residents with convenient access to essential city services and answers to commonly asked questions.
As Amarillo continues to grow, some community priorities will change. Some will remain constant. These priorities are opportunities to make Amarillo better for all.
Floyd Hartman Interim City Manager
Annual police services
Annual fire services
Number of fire stations
Number of fire hydrants
Miles of streets
Number of street lights
Signalized intersections
Miles of storm sewers AIRPORT
Number of airlines
Scheduled daily flights
indicator of whether the financial position of the City is improving or deteriorating.
The statement of activities presents information showing how the City's net position changed during the most recent fiscal year. All changes in net position are reported as soon as the underlying event giving rise to the change occurs, regardless of the timing of related cash flows. Thus, revenues and expenses are reported in this statement for some items that will not result in cash flows until future fiscal periods (e.g., uncollected taxes).
the prior year.
Water and Sewer revenues reflected a decrease due to unprecedented flooding during the late spring, with metered sales down 1% even with a 10% rate increase.
The City did see investment earnings at much higher levels than previous years at $22.8 million. During 2022/2023, the City granted a 5% pay increase to all employees and started to see vacancies begin to be filled.
Current Assets
Noncurrent and Capital Assets
Total Assets
Deferred
Current Liabilities
Noncurrent Liabilities
Total Liabilities
Deferred
Net
Restricted
Unrestricted
Total
1,600,829 $1,959,343 313,267 1,444,037 $1,757,303
$1,051,690
Charges for Services
Operating Grants & Contributions
Capital Grants & Contributions
Property Taxes
Sales Taxes
Other Taxes
Investment Earnings
Insurance Recovery/Cost Settlement Proceeds 156,252 40,053 19,866 58,014 67,508 27,897 538FYE 9/30/2021
172,951 67,289 26,301 66,701 74,468 31,005 83711,725
9/30/2022 Total $370,128 $451,631 $451,277
18,955 100,945 23,095 27,077 17,344 5,918 17,644 4,817 6,712 65,381 4,254 16,637 $308,779 18,792 96,807 24,903 29,742 18,035 5,389 19,237 4,892 8,019 79,054 4,909 16,401 $326,180
STATEMENT OF REVENUES, EXPENDITURES & CHANGES IN FUND BALANCE
FYE 9/30/2022
Net position represents the City’s assets less liabilities.
Net investment in capital assets consists of capital assets, net of accumulated depreciation, reduced by the outstanding balances of borrowings attributable to the acquisition, construction or improvement of those assets.
Restricted net position consists of restricted assets reduced by liabilities and deferred inflows of resources related to those assets. For 2023, this category consists of $33.9 million restricted for debt service, $5.1 million for Tax Increment Financing, and $14.9 million restricted for other purposes such as grants.
Taxes
License & Permits
Interfund Revenues
Intergovernmental Revenues
Citizen Contributions
Charges for Services
Fines & Forfeitures
Investment Earnings
Other Rentals & Commissions
Miscellaneous
Revenues
EXPENDITURES
General Government
Staff Services
Public Safety & Health
Streets, Traffic, & Engineering
Culture & Recreation
Solid Waste
Transit Information Technology
Economic Development/Tourism
Capital Outlay
Total Expenditures
OTHER FINANCING SOURCES (USES)
Transfers In Transfers Out
Net Change in Fund Balance
FUND BALANCE - BEGINNING FUND BALANCE - ENDING 3,459,194 (24,919,714) ($5,312,691) $78,672,479 $73,359,788
159,809,982 4,902,238 1,064,426 5,263,033 68,909 41,256,670 3,271,818 (846,012) 902,947 296,601
$215,990,612
Unrestricted net position is the remaining net position of the City after subtracting net investment in capital assets and restricted net position.
Charges for services represent fees paid by individuals, businesses, or other governments who purchase, use or directly benefit from the goods and services the City provides. For 2023, the largest items in this category include $94 million for water and wastewater charges, $27 million in solid waste charges, $7 million in drainage utility charges, and $13 million in airport charges
5,243,246 12,355,042 102,620,146 15,664,510 22,451,939 17,456,797 4,807,545 4,891,648 2,695,994 112,608 $188,299,475
$27,691,137 26,305,660 (44,795,539) $9,201,258
$69,471,221
$78,672,479
Operating grants and contributions are grants and contributions that may be used to finance the regular operations of the City. This category saw a decrease related to grants the City received in response to the ongoing COVID-19 pandemic.
Capital grants and contributions involve a capital asset of the City and may not be used for operating purposes.
Fund balance is the net position of a governmental fund (difference between assets and liabilities).
Capital outlay represents the acquisition or contraction of capital assets in the governmental funds. For governmental fund accounting, capital assets are expensed when purchased or constructed through the line item capital outlay.
Other financing sources (uses) represent increases (decreases) in the fund balances of a governmental fund other than revenue (expenditures). Examples include transfers between funds within the City bond proceeds.
Depreciation is the allocation of the cost of using a capital asset over the assets estimated useful life.
Capital contributions are funds and/or assets contributed to the City specifically for the acquisition, construction or improvement of capital assets.
government-wide financial statements. However, unlike the government-wide financial statements, governmental fund financial statements focus on near-term inflows and outflows of spendable resources, as well as on balances of spendable resources available at the end of the fiscal year. Accordingly, these statements do not reflect capital assets or long-term debt, and they report capital outlay as opposed to depreciation and report proceeds and principal reductions of long-term debt as sources and expenditures which increase or decrease fund balance. Such statements are useful in evaluating a government's near-term financial requirements.
Because the focus of governmental funds is narrower than that of the government-wide financial statements, it is useful to compare the information presented for governmental funds with similar information presented for governmental activities in the government-wide financial statements. By doing so, readers may better understand the long-term impact of the government's near-term financing decisions. Both the governmental fund balance sheet and the governmental fund statement of revenues, expenditures, and changes in fund balances provide a reconciliation to facilitate this comparison between governmental funds and governmental activities.
In addition to a general fund, the City maintains special revenue funds, two debt service funds, ten capital projects funds, and one permanent fund. Included in this special newsletter is the general fund statement of revenues, expenditures, and changes in fund balance with comparative data from fiscal year ending September 30, 2023. Largest of the City’s funds, the general fund accounts for the majority of the City services, including police, fire, street maintenance, solid waste collection and disposal, traffic, parks, library, transit, and administrative services.
General Fund revenues increased $18.5 million over the prior year. Property tax revenues increased $3.1 million due to increases in taxable values while the overall property tax rate decreased by $0.03706. Sales tax increased $0.9 million and continues to see growth into the new fiscal year. Hotel Occupancy Taxes decreased $0.4 million and has begun to flatten mainly due to a decrease in the average daily rate. Gross receipts business taxes increased $1.9 million as fuel prices remained high and unrestricted investment earnings increased $13.0 million due to the rise in interest rates.
The City maintains three different types of proprietary funds. Enterprise funds are used to report the same functions presented as business-type activities in the government-wide financial statements. The City uses enterprise funds to account for its water and sewer system, the drainage utility system, and for its international airport. Internal service funds are an accounting device used to accumulate and allocate costs internally among a governmental entity's various functions. The City uses internal service funds to account for its fleet of vehicles, its management information systems, and its general and employee health self-insured programs.
Proprietary funds provide the same type information as the government-wide financial statements, only in more detail. The water and sewer fund, drainage utility fund, and airport fund statements of revenues, expenditures and changes in net position are presented in this special newsletter with comparative data from fiscal year ending September 30, 2023.
STATEMENT OF REVENUES, EXPENSES & CHANGES IN NET POSITION
OPERATING REVENUES
Utility Sales and Service
Tap Fees and Frontage Charges
Rents and Miscellaneous
Total Operating Revenues
OPERATING EXPENSES
Salaries, Wages and Fringe Benefits
Supplies
Fuel and Power
Contractual Services
Water Authority Charges
Other Charges
Depreciation
Total Operating Expenses
Operating Income
FYE 9/30/2023
FYE 9/30/2022
NONOPERATING REVENUES (EXPENSES)
Total Nonoperating Revenues (Expenses)
Income before Contributions and Transfers
Capital Contributions
Net Transfers from (to) Other Funds
Change in Net Position
NET POSITION - BEGINNING OF YEAR
NET POSITION- END OF YEAR
$93,961,664
$16,656,970 3,116,970 6,791,582 11,360,971 7,216,296 16,231,101 16,123,392
$77,496,795
$16,464,869
$5,841,924 22,306,793 6,485,285 (3,242,554)
$25,549,524
$549,399,835
$577,454,885 93,225,821 232,289 503,554
6,273,564 14,795,055 15,620,102
$74,411,882
$19,423,449
$8,486,786 27,910,235 6,562,863 (2,816,983)
$31,656,115
$517,743,720
$549,399,835
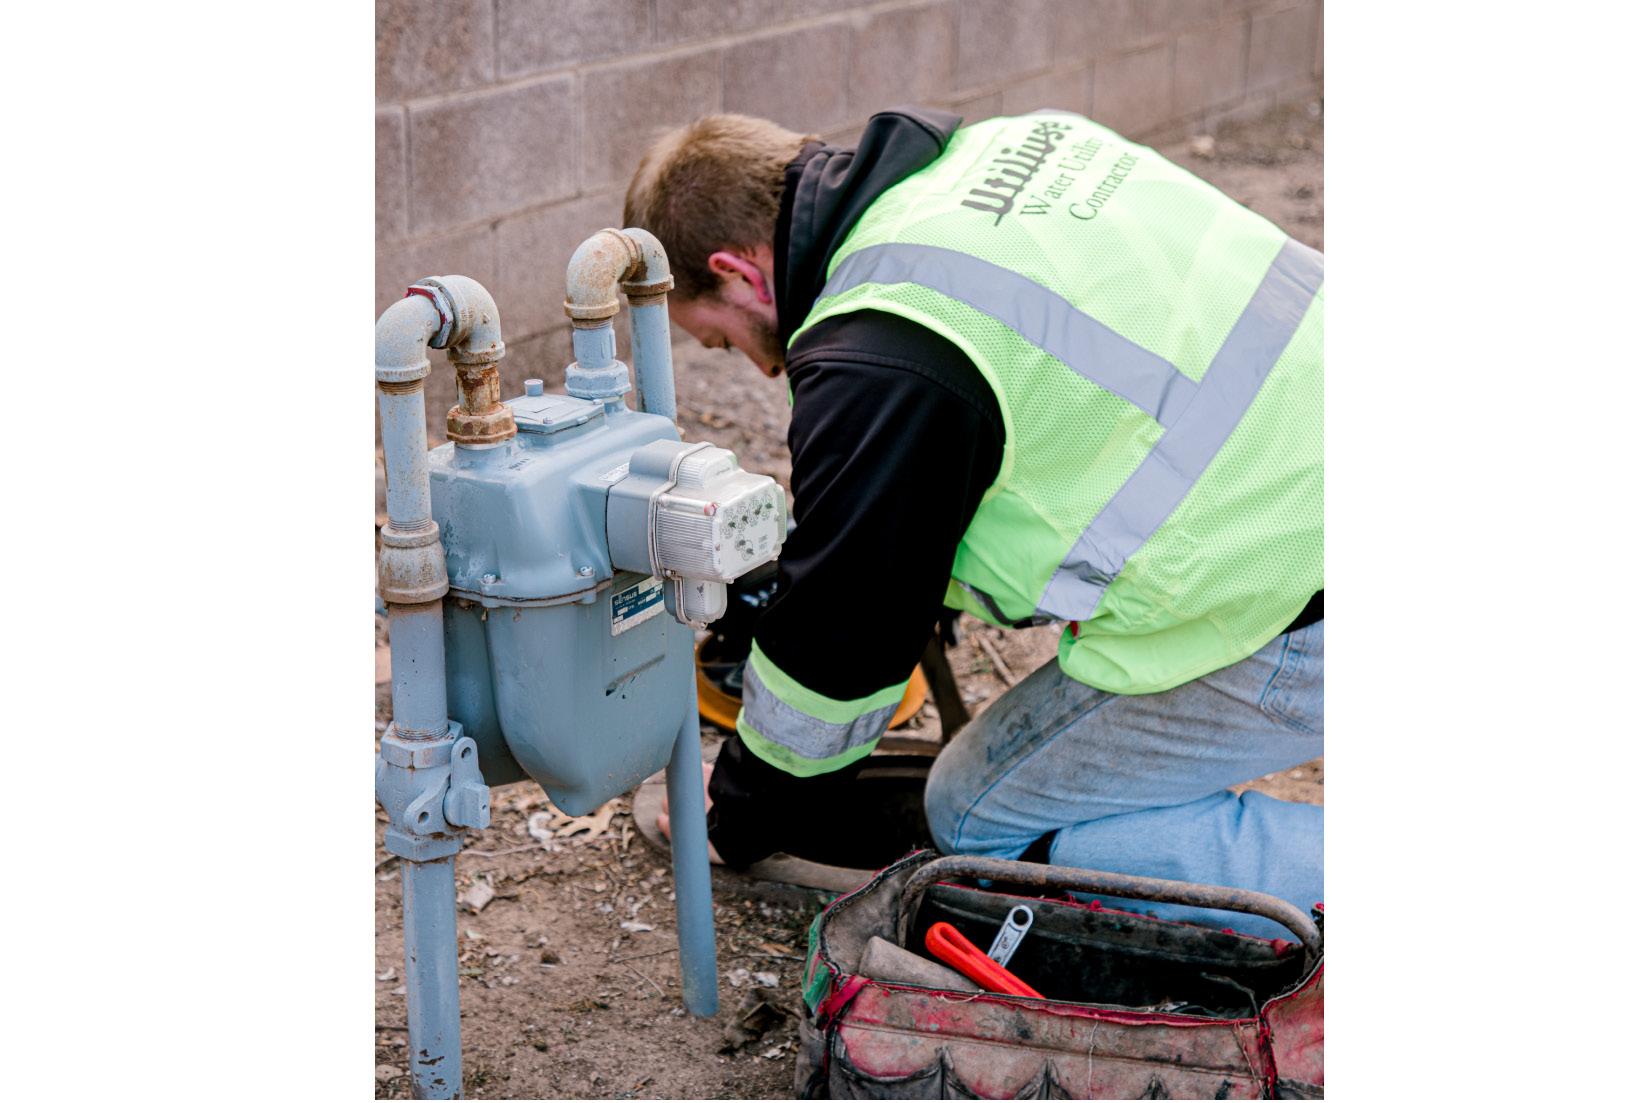
NUMBER OF CITY WATER & SEWER CUSTOMERS
Amarillo has come together to make history. A vision shared by many in the Amarillo community - to help those experiencing homelessness - has inspired a collaboration of groups, organizations and individuals to do something unique and groundbreaking in Amarillo.
The City of Amarillo, local churches, and the business community pooled resources to create Transformation Park, a nonprofit entity located near downtown. The collaboration is the result of the dedication and commitment of Amarillo residents with private and public resources to create a community to help those experiencing the difficulties of homelessness.
The facility will serve an array of needs for those experiencing homelessness, offering cabins that will serve as homes and a day center with access to educational resources, job training, healthcare services and mental health support. The day center was funded by a generous $1 million donation – an example of community support.
Transformation Park is more than just its physical structures, is a multifaceted approach to the problem of homelessness, and the project is a first for Amarillo. What made Transformation Park a reality is the cooperation of many in Amarillo who recognize that the problems of homelessness are varied and diverse but the goal shared by all is the same.
STATEMENT OF REVENUES, EXPENSES & CHANGES IN NET POSITION
OPERATING REVENUES FYE 9/30/2023
Drainage Utility Assesments
Forfeited Discounts
Total Operating Revenues 7,615,805 8,505 $7,624,310
Salaries, Wages, and Fringe Benefits
Contractual Services
Total Operating Expenses
Operating Income (Loss)
Total Nonoperating Revenues (Expenses)
Income (loss) before Contributions and Transfers
Capital Contributions
Net Transfers from (to) Other Funds Change in Net Position
NET POSITION - BEGINNING OF YEAR
NET POSITION- END OF YEAR
OPERATING EXPENSES 1,407,778 281,577 1,099,122 1,248,771 384,897 $4,422,145 $3,202,165 $403,664 3,605,829 947,000 (54,000) $4,498,829 $27,758,243 $32,257,072 6,836,305 65,686 $6,901,991 FYE 9/30/2022 819,810 1,078,920 877,971 1,116,022 371,901 $4,264,624 $2,637,367 ($480,413) 2,156,954 710,674 (369,622) $2,505,406 $25,252,837 $27,758,243
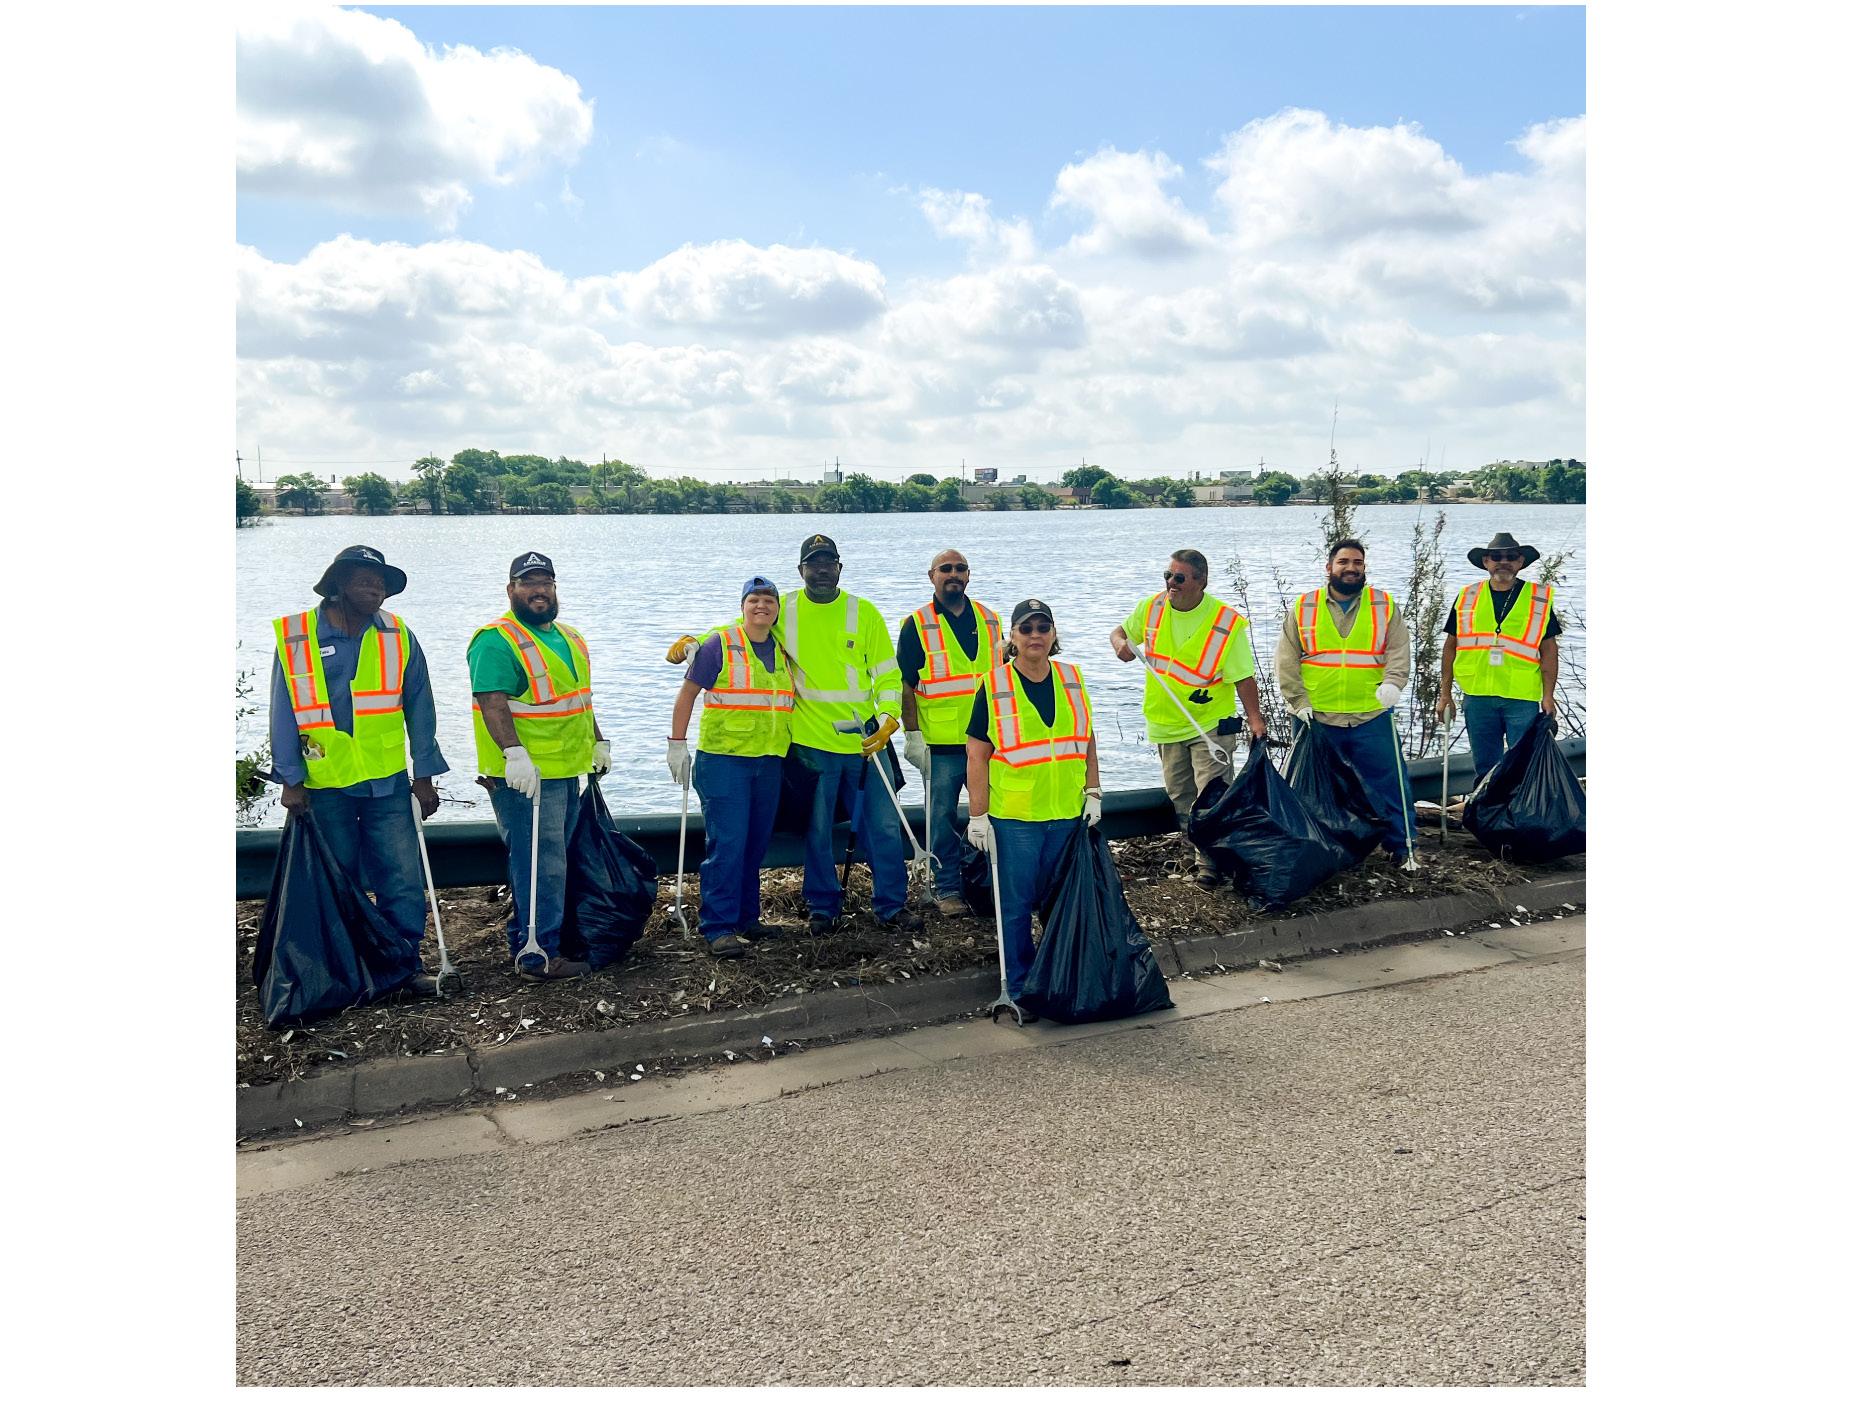
The clouds opened up in Amarillo in the spring of 2023, pelting the city in a deluge of rain not seen since 1981-82. Portions of the city
According to the National Weather Service, many spots in Amarillo were swamped with six to 14 inches of rain in the span of a month
For perspective, the city pumped more than one billion gallons of water from six playa lakes from June 2 to July 10 of 2023. During this time, Lawrence Lake near Interstate 40 in Amarillo pumped 435,000,000 gallons of water.
It was a monuental weather event – that put the city into action. Shortly after the waters subsided, council members helped organize several cleanup efforts across Amarillo to pick up debris and trash left by the receding waters.
In August 2023, the city purchased land near Lawrence Lake to help address flooding in the area, and in March 2024, Amarillo City Council considered $39 million for improvements to the city drainage system.
Mother Nature made history in Amarillo, but Amarillo responded in historical fashion.
OPERATING REVENUES
Airfield Fees and Commissions
Terminal Building Revenue
Other Building Revenue
Total Operating Revenues
OPERATING EXPENSES
Salaries, Wages, and Fringe Benefits
Supplies
Fuel and Power
Other Contractual
Other Charges
Depreciation
Total Operating Expenses
Operating Income (Loss)
Total Nonoperating Revenues (Expenses)
Net loss before Contributions and Transfers
Capital Contributions
Net Transfers from (to) Other Funds
Change in Net Position
NET POSITION - BEGINNING OF YEAR
NET POSITION- END OF YEAR

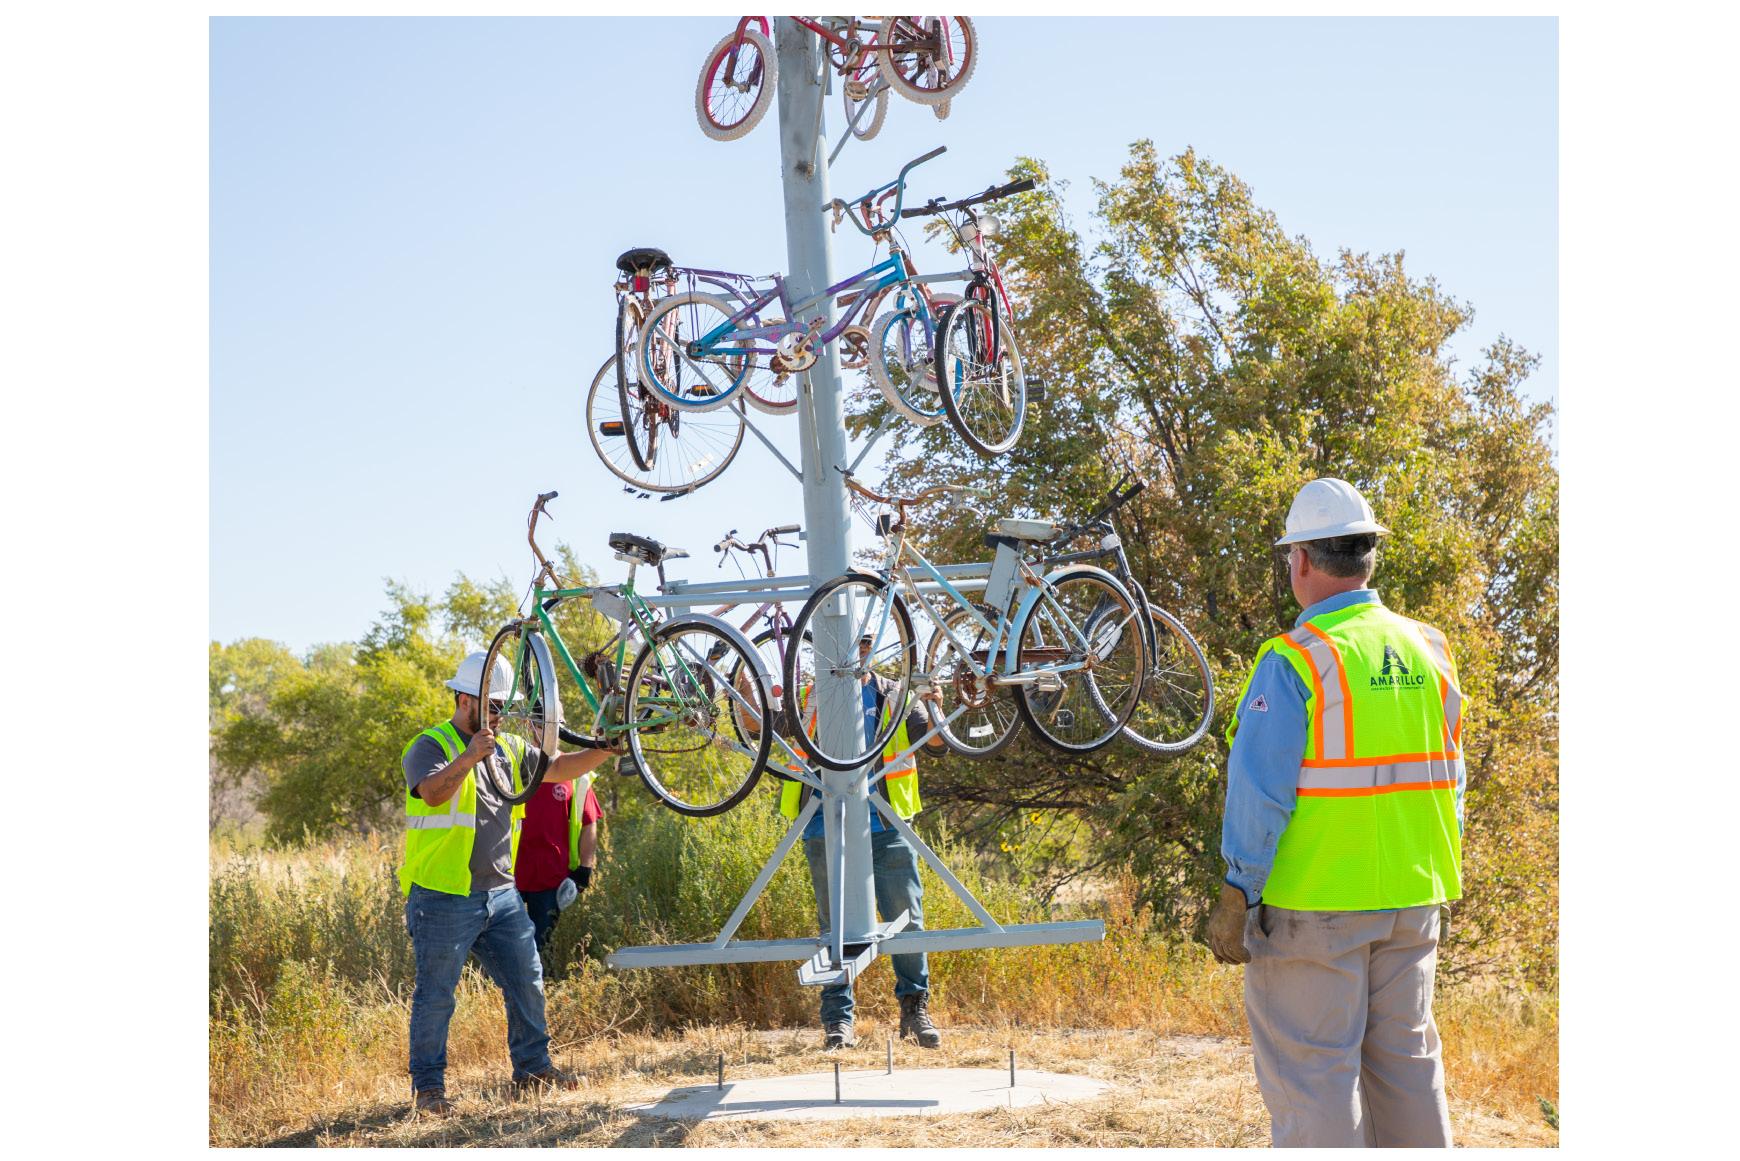
When people visit the trails at the Rick Klein Sports Complex, they are welcomed by a tree (of sorts) that perfectly captures the spirit of Amarillo and the outdoors.
Thanks the creativity of a local artist and the generosity of many in Amarillo, the trail head at Rick Klein Trails is home to a unique – and massive – bicycle tree scuplture.
The sculpture was created and donated by local artist Orville Ladehoff. It stands 12 feet tall and weighs 600 pounds with 12 bicycles as “branches.” The art is the result of not just Ladehoff, but several others who donated time and resources.
Skyrite, a local sign company, donated its services to transport the heavy sculpture to the park. The bicycles used to create the tree were donated by Matt Melvyn.
Amarillo’s new bicycle tree has become a symbol of the community’s love for the outdoors, and how art can inspire cooperation and unity.
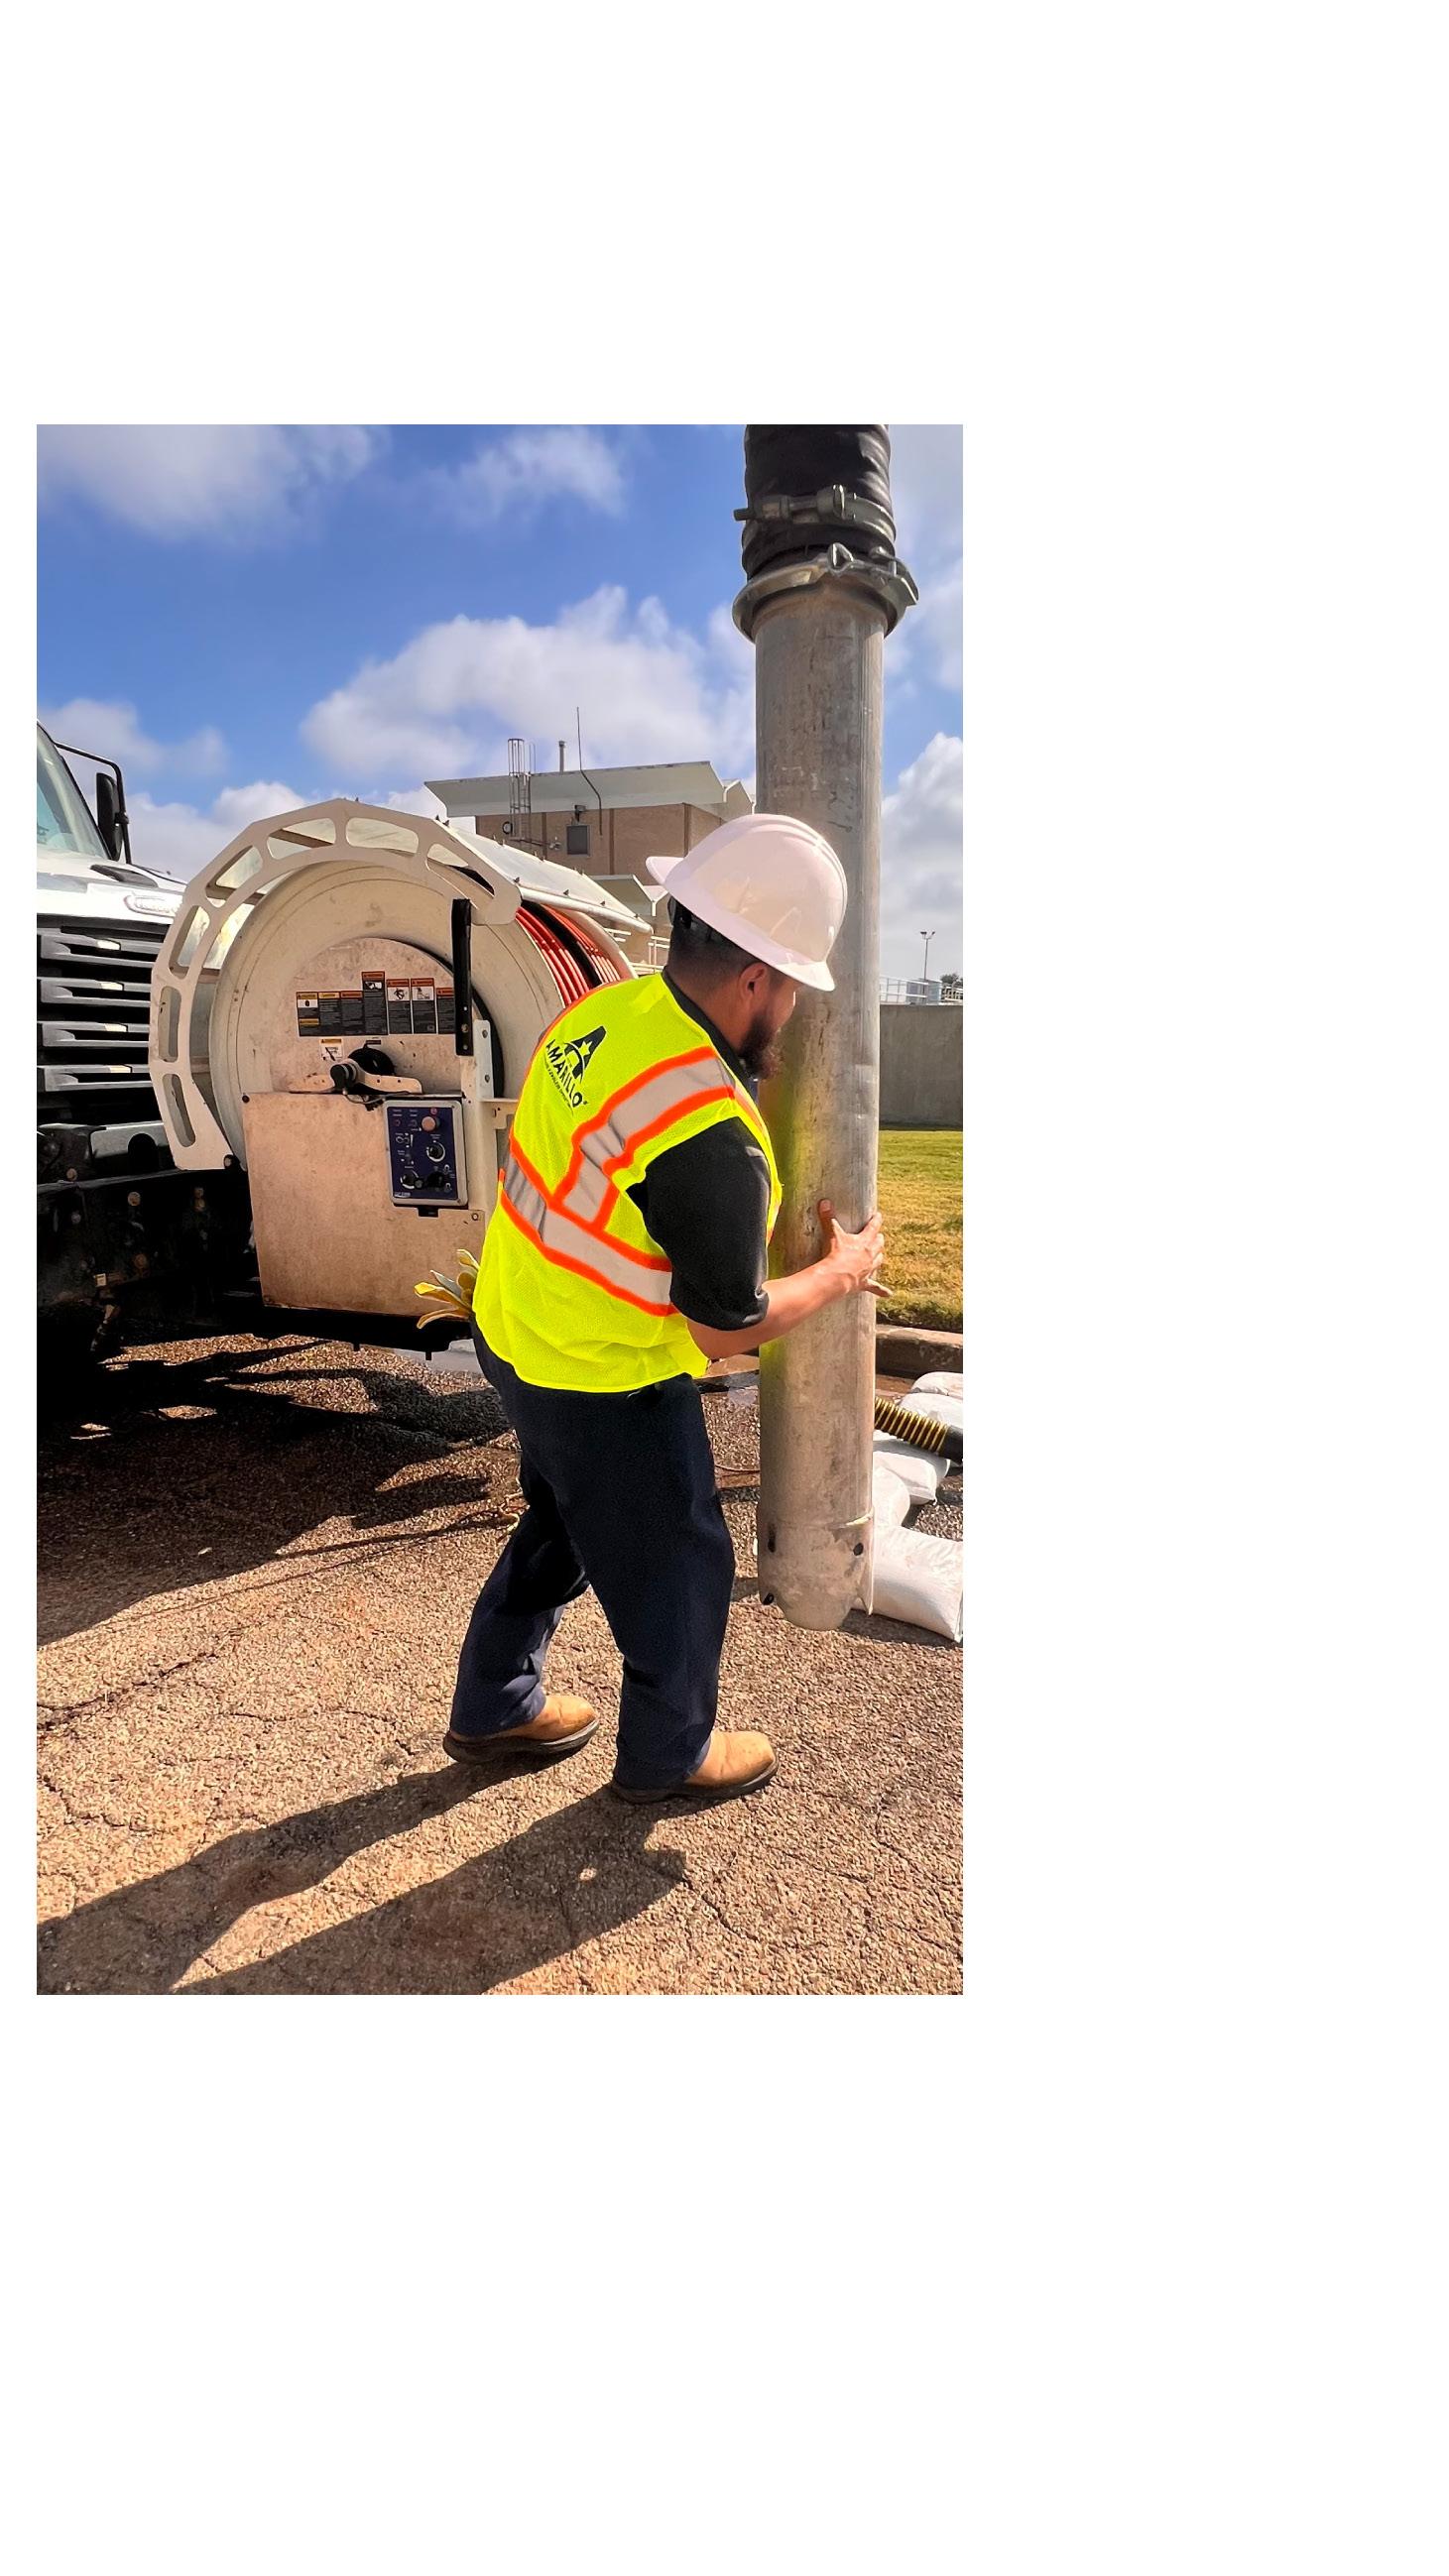
It is one of the largest expenditures in city history for a single project - $71.2 million. And it represents one of the most significant investments ever in Amarillo infrastructure.
The Northeast Sanitary Sewer Interceptor Project was unanimously approved by city council in October 2023.
It took decades of commitment from city personnel to bring the multimillion-dollar project to fruition, but it will also help ensure city infrastructure for decades.
So what is the Northeast Sanitary Sewer Interceptor Project?
The project creates 13 miles of sanitary sewer pipe in the northern parts of the city, which also increases sewer capacity for all parts of Amarillo.
As council recognized, this was a must-have project for the entire Amarillo community.
The project is funded with water and sewer revenue bonds with a tentative completion date of 2025.
Amarillo Independent School District
Tyson Foods Inc.
CNS Pantex
BSA Health Systems
Northwest Texas Healthcare City of Amarillo
Xcel Energy
Affiliated Foods

Amarillo continues to receive a AA+ to AAA debt rating from Standard & Poor’s rating service on general obligation debt, water and sewer revenue bond debt and drainage utility debt. These high ratings allow the City to enjoy favorable interest rates on the issuance of debt.
While this presentation does not conform to Generally Accepted Accounting Principles (GAAP), the purpose of these statements is to provide the citizen with a selection of the information contained within the City’s Annual Comprehensive Financial Report (ACFR). Component unit information has been excluded from this presentation in order to focus on the primary government. The City’s accounting policies do conform to GAAP as set forth by the Governmental Accounting Standards Board. The City’s separately prepared and audited ACFR offers a complete description of the City’s significant accounting policies and other disclosures required by GAAP, as well as a more detailed analysis of the City’s financial position. A copy of the ACFR can be obtained at the Finance Department at Amarillo City Hall (601 S Buchanan St.) or on the City website at amarillo.gov.
Cole Stanley, Mayor
Josh Craft, Place 1
Don Tipps, Place 2
Tom Scherlen, Place 3
Les Simpson, Place 4
Floyd Hartman, Interim City Manager
Andrew Freeman, Deputy City Manager
Rich Gagnon, Assistant City Manager & Chief Information Officer
Laura Storrs, Assistant City Manager & Chief Financial Officer
Martin Birkenfeld, Chief of Police
Stephanie Coggins, City Secretary
Michael Price, Interim Director of Utilities
Donny Hooper, Managing Director of Public Works
Michael Kashuba, Director of Parks & Recreation
Jason Mays, Fire Chief
Bryan McWilliams, City Attorney
Katrina Owens, Director of Finance
Jordan Schupbach, Director of Enagement & Innovation
Missy Laird, Information Technology Director