
Acknowledgements
Mayor and City Council
Cole Stanley, Mayor
Josh Craft, Councilmember, Place 1
Don Tipps, Councilmember, Place 2
Tom Scherlen, Councilmember, Place 3
Les Simpson, Councilmember, Place 4
Planning and Zoning Commission
Jason Ault, Chairman
Fred Griffin, Vice Chairman
Cindy Bulla
Noah Dawson
Dick Ford
Josh Langham
Landon Moreland
Steering Committee
Alan Abraham
Andrew Hall
Ann Scamahorn
Ben Whittenburg
Cindi Bulla
Dipak Kumar Patel
Ernesto Guzman
Greg Bliss
Helen Burton
Jeff Perkins
Jinger White
Joseph Peterson
Lloyd Brown
Mason Rogers
Matt Chamberlain
Matt Griffith
Renee Whitaker
RJ Soleyjacks
Scott Bentley
Sheila Sims
Sherrie Ferguson
Skylar Gallop
Teresa Kenedy
Tiffany Podzemny
Timothy Ingalls
Tom Roller
Tommie Knox
City Manager’s Office
Floyd Hartman, Interim City Manager
Andrew Freeman, Deputy City Manager
Laura Storrs, Assistant City Manager & Chief Financial Officer
Rich Gagnon, Assistant City Manager & Chief Information Officer
Office of Engagement & Innovation
Jordan Schupbach, Director of Engagement & Innovation
Kristen Wolbach, Deputy Director of Engagement and Innovation
Joy Stuart, Senior Communications Officer
David Henry, Media Relations Manager
Monica Silva, Social Media Manager
Chase Brady, Multimedia Production Manager
Isaiah Smith, Creative Design Manager
Jim Wallace, Special Projects Manager
Carter Estes, Project Manager
Planning Department
Emily Koller, AICP, Director of Planning
Drew Brassfield, CPM, SHRM-CP, Assistant Director of Planning
Shari Kendall, Community Engagement Manager
Jon Barnes, Grants and Special Projects Manager
Cody Balzen, Principal Planner
Brady Kendrick, Senior Planner
Byron Dill, Planner I
Chris Jackson, Planner II
Ella Ward, Planning Technician
Jenine Cruz, Administrative Technician
MIG, Inc.
Jay Renkens
Saul Vazquez
Avery Wolfe
Evan Lanning
Ander Garcia O’Dell
Claire Fettig
Alfonso Ramirez
Economic and Planning Systems, Inc. (EPS)
Clarion and Associates
Walter P. Moore


Introduction

What is a Comprehensive Plan?
A Brief History of Amarillo
Coordination With Other Plans: Building From a Strong Foundation
The Planning Process
Community Overview
How to Use This Plan
What is a Comprehensive Plan?
Why Cities Plan
A comprehensive plan is a tool that allows a city to anticipate future changes and to guide those changes in an effective, orderly manner that is consistent with the desires of the community. It acts as a tool for proactively managing and directing growth, lends predictability for developers by illustrating the types of development desired throughout the community, and identifies infrastructure needs. It gives legal backing to ordinances and development codes while mitigating arbitrary and capricious enforcement of these laws. With input from the community during the planning process, the document serves as a record of the community’s collective vision and aspirations for the future. As such, this Plan articulates residents’ goals for the community and serves as a tool to communicate desires regarding the City’s decisions and future outcomes related to public and private investments.
In the face of constant change, this is the most important reason to plan. A comprehensive plan with extensive public input allows a community’s residents to determine what factors will guide development decisions and gives them the opportunity to decide what the future of their city will be.
In particular, the City’s goals for long-range planning and its Comprehensive Plan include:
• To provide a balanced mix of land uses and services throughout the community;
• To ensure that public amenities and facilities can meet the demands of future development;
• To achieve efficiency in development patterns that reflect community values;
• To protect and enhance the identity, character, and visual appearance of the community;
• To involve residents in visioning and decisionmaking processes that directly influence how the city will evolve
• To guide annual work programs, prioritize improvements, and direct resource use.
In 1997, the Texas Legislature added Chapter 213 to the Local Government Code allowing cities in Texas the option to develop and adopt comprehensive plans. The Code establishes that the plans must consider land use, transportation and public facilities, and distinguishes between land use plans and zoning regulations. The state statute allows cities to define the relationship between the plan and any ordinances and development codes, but specifically requires that zoning regulations must be adopted in accordance with a comprehensive plan. This also leaves cities with creative freedom to determine the level of detail of the plan’s contents. Comprehensive plans across the state typically include topics they deem relevant, such as environmental constraints, demographic projections, infrastructure data, and housing in addition to the required land use and transportation topics.
What is City Plan?
City Plan — Vision 2045 (City Plan) is a long-range plan that creates a strategic framework to balance equitable growth, quality of life improvements, and public and private investments in Amarillo over the next two decades. City Plan will replace the City’s current Comprehensive Plan, which was originally adopted 14 years ago. This new vision and growth policy framework was developed through an extensive resident-driven process and now reflects the current needs and desires of the community.
The updated and unified policy direction will guide implementation tools such as zoning, economic development initiatives, and infrastructure and amenity investments. It also outlines new strategies for addressing citywide opportunities and challenges, centered around several priority topics and considerations, including Growth Management and Capacity; Making Places: Neighborhoods & Districts; Community Character; Mobility; and Parks and Cultural Resources.
The Plan provides guidance on how the City will evolve to take care of the development we have and plan for new development to come. Overall, this Plan will help shape the future of the places we work, live, play, and visit by preserving what’s important to our community and guiding investments that help make Amarillo a vibrant and attractive city.

A Brief History of Amarillo
Founding
Located in both Potter County and Randall County, Amarillo is situated in a geographically strategic location. The City was established as the administrative center upon its founding in 1887. The first railroad freight services also arrived in 1887. Approximately two decades later, Amarillo became the fifth city in the nation to adopt a City Commission and City Manager form of local governance. Since 1913, Amarillo has developed as an economic hub, allowing it to become one of the largest urban areas in the Texas Panhandle. There are direct highway connections to Oklahoma City to the east, Denver to the north, and Albuquerque to the west. These links to multiple states and the larger region help support the local economy. Amarillo’s community and decisionmakers can continue to shape the direction of growth and build on the City’s assets to strengthen its natural and built landscapes for future generations.
Driving Industries
Since its founding in 1887, the City of Amarillo has been one of the top commercial centers for the Texas Panhandle. After it was established, Amarillo became a prime cattle marketing center and the hub for freight movement. Amarillo also became a hub for health and educational services with the establishment of St. Anthony’s Hospital in 1901 and West Texas State College in 1910. Amarillo quickly became a key retail trade center for the Panhandle area, the State of Texas, and the surrounding multi-state area. By 1915, Amarillo began establishing itself as a natural resource hub. Gas and oil were both found in Amarillo, leading the community to add a zinc smelter, oil refineries, and oil-shipping facilities. In 1928 Amarillo established the United States Helium Plant, due to the high helium content near gas fields.
In 1942, the Amarillo Army Air Base was established, resulting in a sudden population spike. The base was in use for over twenty years. With the growth of large industries, Amarillo opened its international airport, increasing traffic from visitors and growing business opportunities. By the 1980’s, the City’s airport was serving five major airlines, and the Santa Fe and Burlington National railroads were serving the region. This Plan builds on the historic and existing industries in Amarillo and addresses opportunities to strengthen them while identifying new and burgeoning opportunities.
Eras of Development
Establishment Era – Ellwood Park was established as Amarillo’s first city park in the 1890s. In 1901, Amarillo opened the St. Anthony’s Hospital, representing the first medical center in the Panhandle region. Positioning itself to become the region’s leader in education and medicine, the City also founded West Texas State College in 1910. By this time, the City’s population had reached almost 10,000 residents.
Peak Development Era –
The largest population growth in Amarillo occurred between 1930 and 1960, when the Amarillo Army Air Base was established, and the international airport was opened. By 1960, many organizations and corporations moved their headquarters to Amarillo and the population reached over 130,000 residents. Population continued to increase in both Potter County and Randall County. By 1970, the Army Air Base was closed, and Amarillo’s population decreased for the first time. Nevertheless, the community continued to build significant infrastructure, such as a municipal building, a civic center, and High Plains Baptist Hospital.
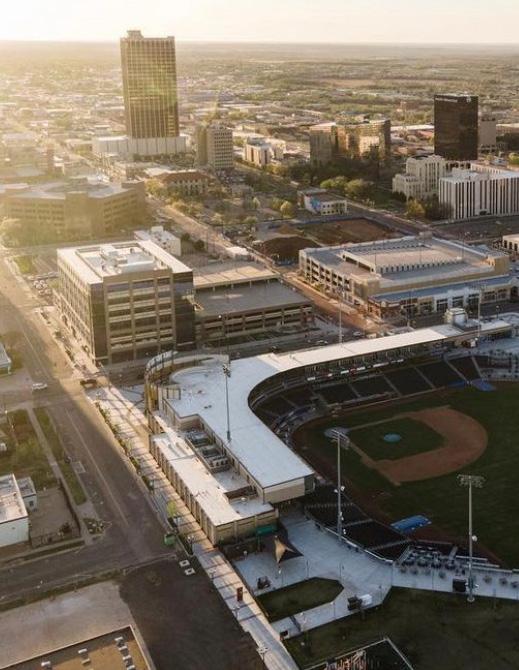
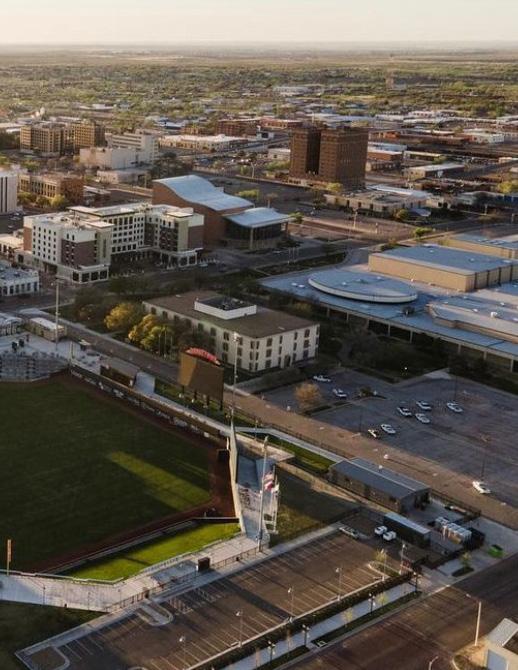
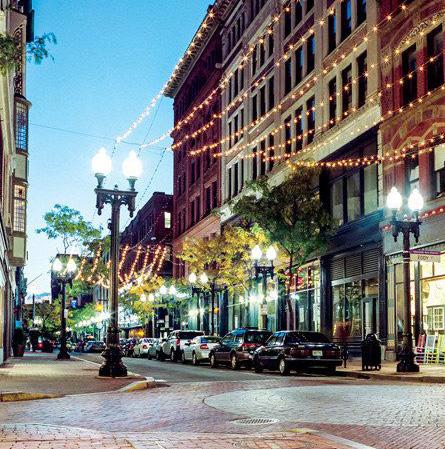
Recent Growth – Amarillo has experienced most of its slow but steady growth in recent years as greenfield single family and retail development to the southwest, an expansion of medical and professional services industries in the northwest and important economic anchors locating east near the airport and in Centerport Business Park. Downtown revitalization efforts around 2010 began to gain momentum while other core neighborhoods experienced decline and disinvestment proportional to new development in the southwest.
Amarillo is now facing growth concerns that it has never had to address before, reinforcing the need for the community to evaluate trends and plan for the future:
• The median home sale price exceeds the affordability level for the median household income.
• Economic Development recruitment successes will bring 4,000 jobs to the city in the next five years, more new jobs in a shorter period than the city has seen in decades.
• Amarillo Independent School District is losing population because of natural birthrate declines, creating challenges to retain schools that are vital community resources.
• Recent analyses of parks and public infrastructure illustrate inadequate funding for maintenance and operations. Much of this maintenance has been deferred for many years, and its cost is competing with growth and expansion for new development.
• Finally, the disparity between Potter and Randall Counties has never been greater, and with continued population decline in Potter, quality of life measures all continue downward trends as well.
Coordination with Other Plans: Building From a Strong Foundation
City Plan builds upon prior planning initiatives and citizen engagement efforts, including the most recent Comprehensive Plan, neighborhood plans, Parks Master Plan, and more. These other plans provide critical context from which City Plan evolved, including changing trends, conditions, community visioning, challenges, barriers, goals, and strategic actions. Furthermore, understanding the implementation progress of these plans highlights both goals still to be addressed and opportunities to celebrate achievements.
The following plans represent those that directly influenced City Plan; additional information about these plans can be found in the Appendices. These plans are also publicly available on the respective jurisdictional websites:
• 2010 Amarillo Comprehensive Plan
• Neighborhood Plans
• Public Arts & Beautification Plan
• 2021 Parks & Recreation Master Plan
• Amarillo Metropolitan Planning Organization TIP & RTP documents
• 2019 Regional Multimodal Mobility Plan
• 2017 Align Amarillo Economic Development Strategic Plan
• 2019 Downtown Amarillo Strategic Action Plan
• Partnership for Development Progress Strategic Plan
A comprehensive plan is unique in that it takes a truly holistic view of the City, including objectives and recommendations across a broad spectrum of topics and considering all areas of the community. However, this precludes a certain level of specificity and focus – a gap that other topical or area plans fill. The following provides a snapshot of priorities and recommendations from Amarillo’s adopted plans that have informed the development of City Plan.
Land Use, Neighborhoods & Job Centers
• Promote greater diversity in land use and establish higher-density mixed-use urban centers
• Continue to implement an enhanced conception of the Neighborhood Unit Concept
• Invest in the revitalization of older areas of Amarillo and protect economic anchors and investment areas
• Promote Amarillo as a City comprised of strong neighborhoods, providing adequate variety in housing options, amenities, and connectivity to employment and services
• Promote stability in older and/or underserved neighborhoods
• Infrastructure needs are underfunded, leading to deferred maintenance and implicating capacity challenges to accommodate future growth; pursue strategies to ensure long-term sustainability and appropriate contribution from new development activity
Economic Development
• Grow economic development through support of applied education and workforce training, entrepreneurship, and agriculture and life science industries, downtown investment, activity, and vibrancy, and enhancement of Amarillo as a great place to live, work, and play
Community Character
• Continue to cultivate and invest in Amarillo’s character, aesthetics, history, heritage, and identity
Mobility
• Promote greater safety and comfort for all types of mobility, particularly along high-traffic corridors and intersections, and following priority bicycle, pedestrian, and transit routes outlined in the Regional Multimodal Plan; recent transportation investments (federal and local) have focused on expansion and realignment of major highways to increase capacity, Amarillo Blvd., E. 10th Ave., intersection improvements, and transit operations
Parks & Cultural Resources
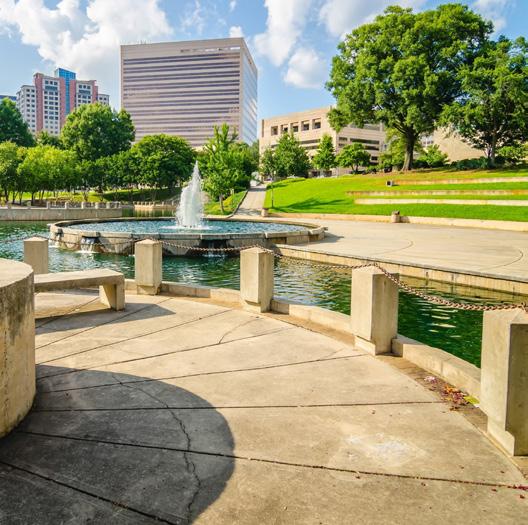
• Prioritize investment in existing community amenities, and add variety across Amarillo’s public space and park amenities, particularly to fill gaps in underserved areas
• Foster partnerships, collaboration, and innovation to promote tourism through art, entertainment, events, economic development, public space activation, and recreation.
Implementation
• Continue to proactively and extensively engage with the Amarillo community to ensure that residents have opportunity to influence decisions and outcomes
The Planning Process
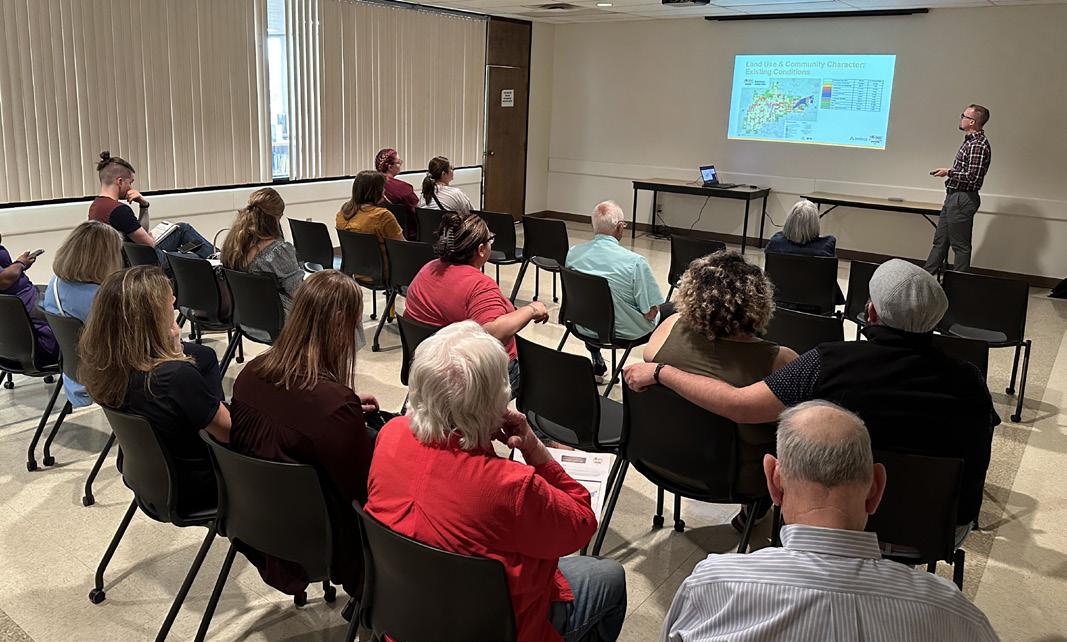
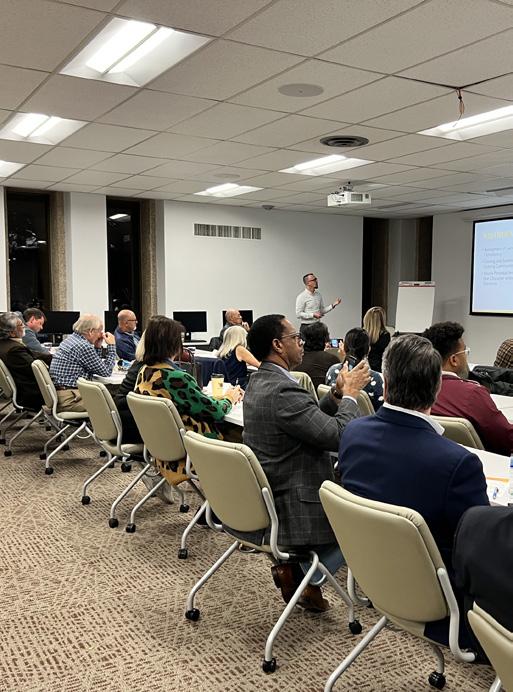
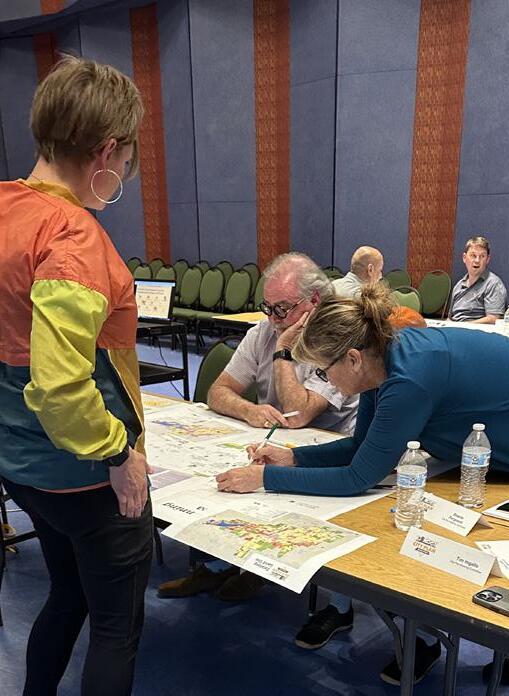
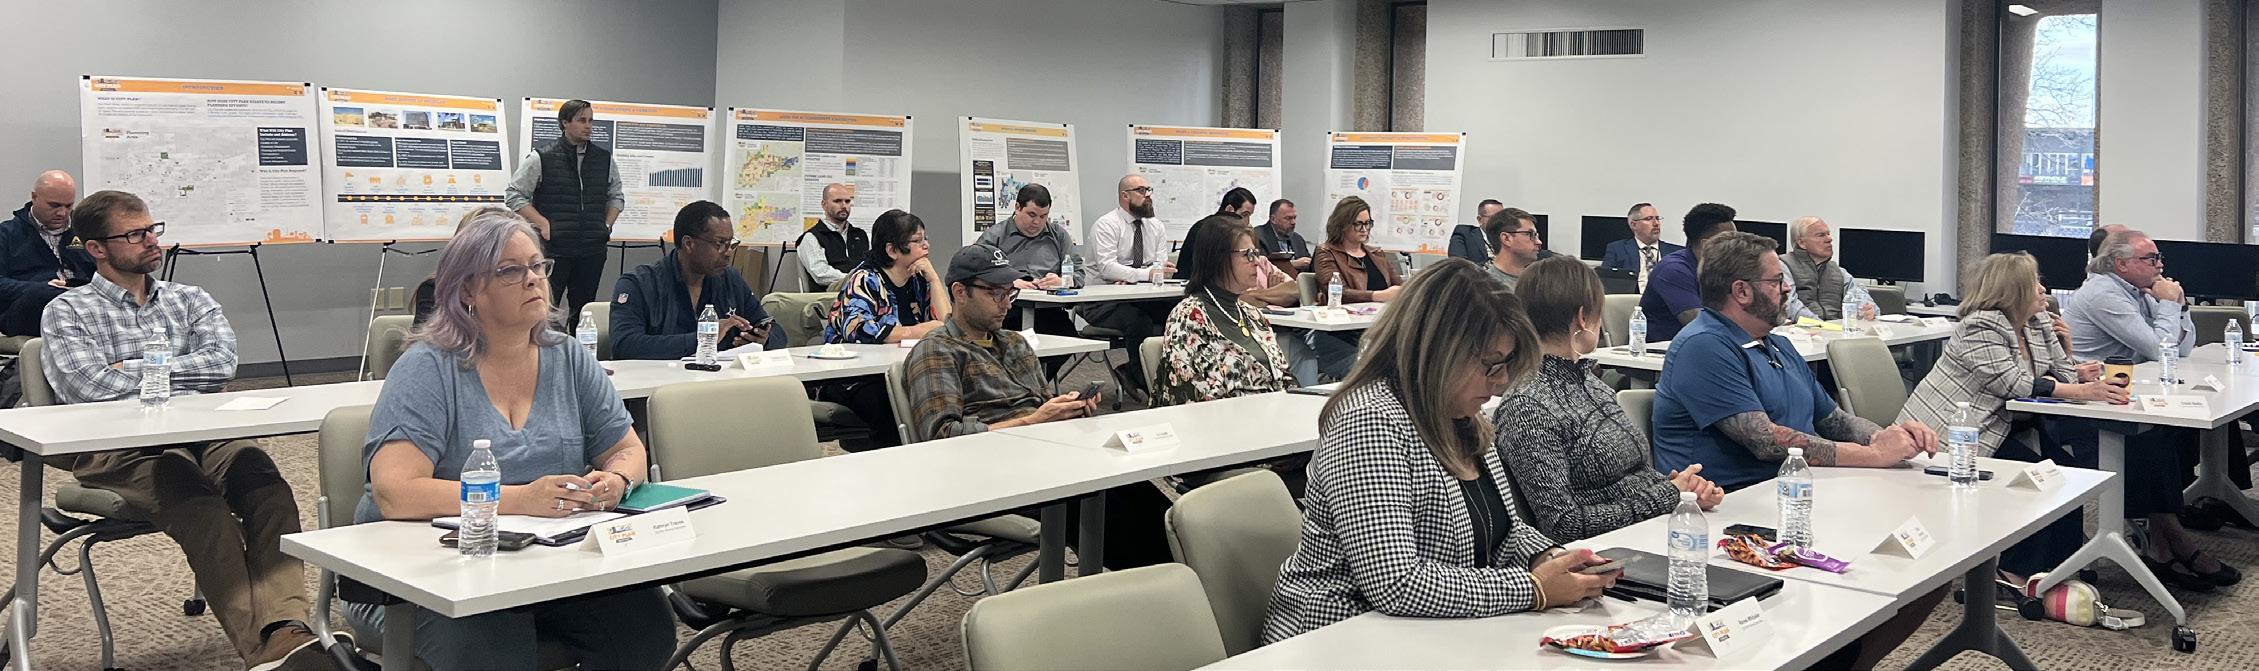
An integral part of City Plan was to design and implement a robust engagement process that truly captured and reflected the community’s perspectives, concerns, needs, and desires, establishing a collective Vision for 2045. The City has never undertaken an engagement effort of this duration and magnitude. This comprehensive approach to engagement signifies a purposeful shift toward a more community-centric process. This section outlines the outreach efforts and community input that directly shaped this Plan. An expanded summary is available in the Appendices.
City Plan Project Team
In collaboration with many partners, the City of Amarillo led efforts to create City Plan. The project team included City staff and a consultant team led by MIG, Inc. and also including Economic & Planning Systems (EPS), Clarion Associates, and Walter P. Moore. Together, this team managed the design and facilitation for engagement activities, events, and media throughout the City Plan development process.
In addition, the City Plan Steering Committee – a diverse collection of community members representing different districts and varying demographics within the City – met regularly throughout the planning process to provide input and feedback that directly shaped the Plan’s deliverables and outcomes. This group played a critical role as ambassadors and champions of City Plan.
Engagement Process
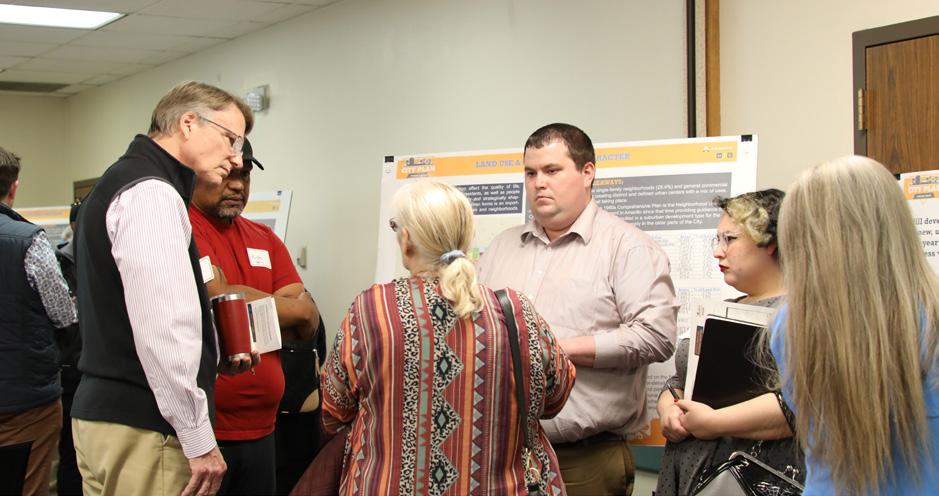
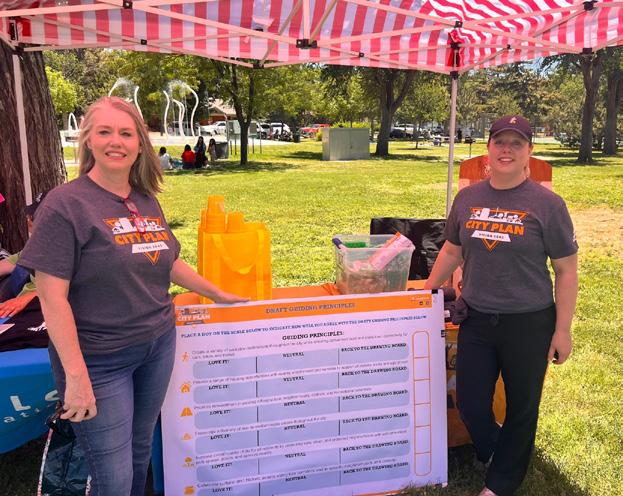
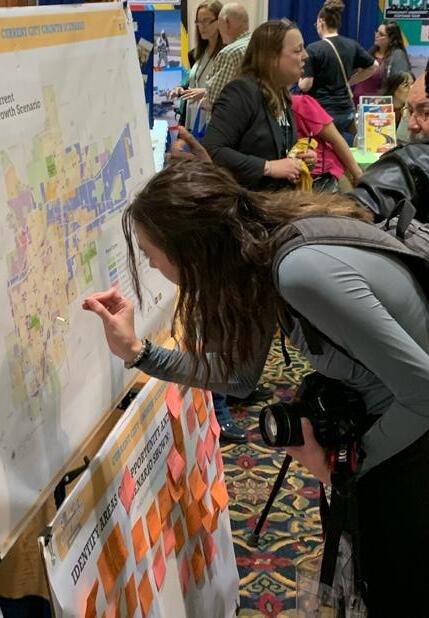
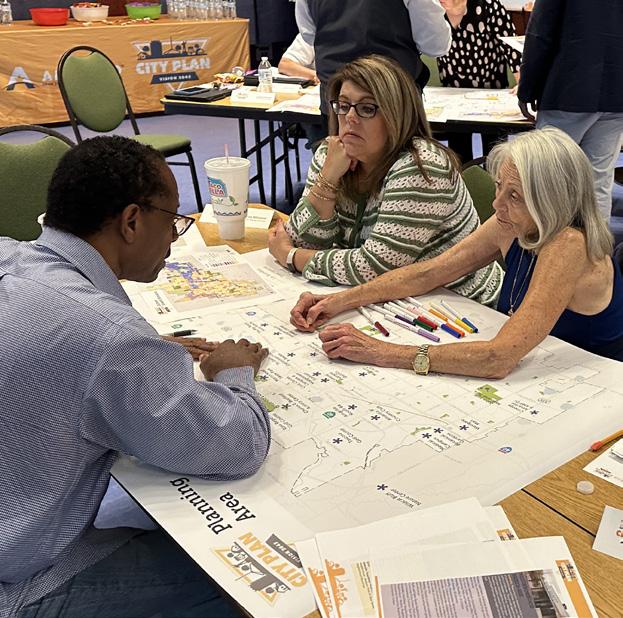
The project team developed a Public Participation Plan that outlined numerous opportunities for residents, property owners, youth, the development community, business owners, and representatives to shape and provide feedback on City Plan. This engagement approach emphasized specific outreach activities aiming to incorporate the variety of viewpoints from the community, with a focus on ensuring ample opportunities for various demographic groups to participate and have a voice in the City Plan process. The process involved interacting with representative community members, actively reaching out to traditionally underrepresented groups, engaging residents from all areas of Amarillo, and gathering meaningful and actionable feedback from all engagement activities. The project team and Steering Committee dedicated significant effort to ensure that community input directly influenced and informed the Plan’s outcomes so that participants could clearly see how their involvement and input shaped the concept, policies, and strategies recommended in City Plan.
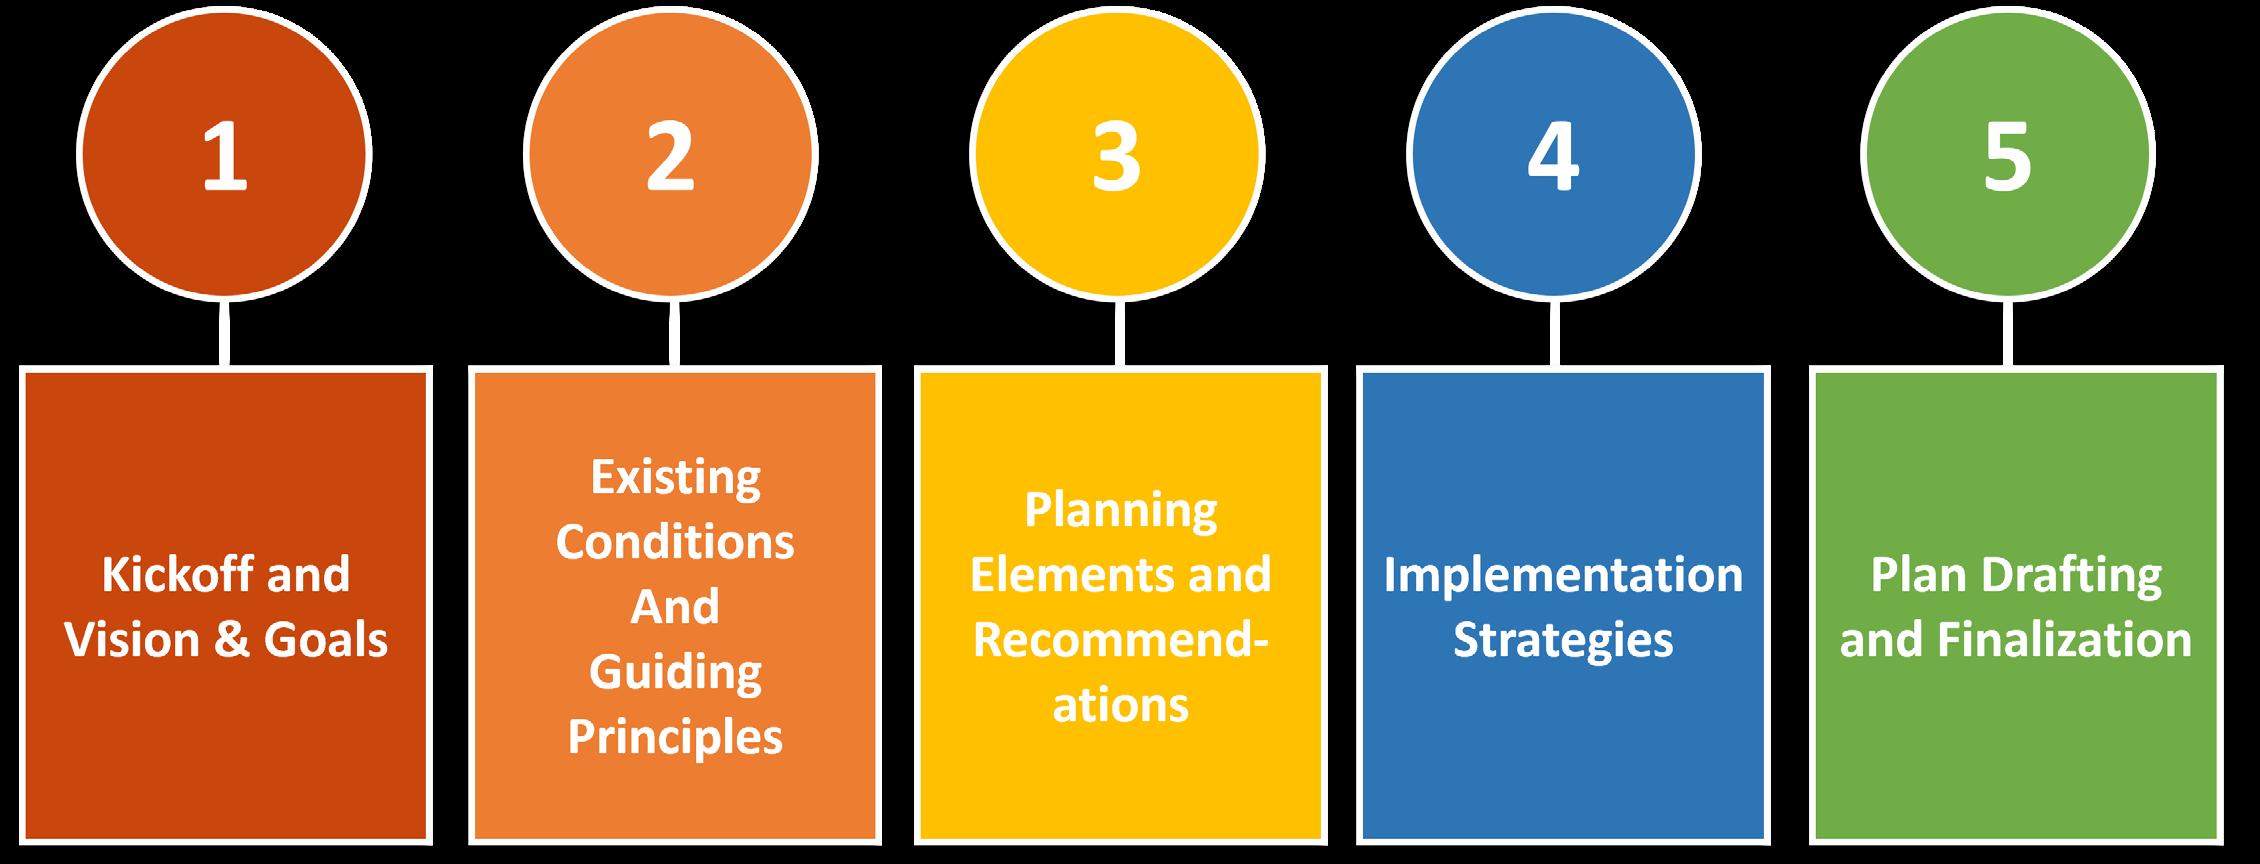
City Plan’s engagement strategy included a series of meetings, public events, small-group activities, stakeholder meetings, online and mobile engagement, and social media and email communications. A broad range of coordinated approaches and techniques were used to engage people during each phase, corresponding to each general phase of the Plan’s development. Each phase included priority messaging and objectives for that portion of the planning process.
Process Objectives
The following objectives guided the Plan’s development and engagement process.
Planning Objectives
• To foster excitement for City Plan
• To establish a vision and goal framework for the Plan
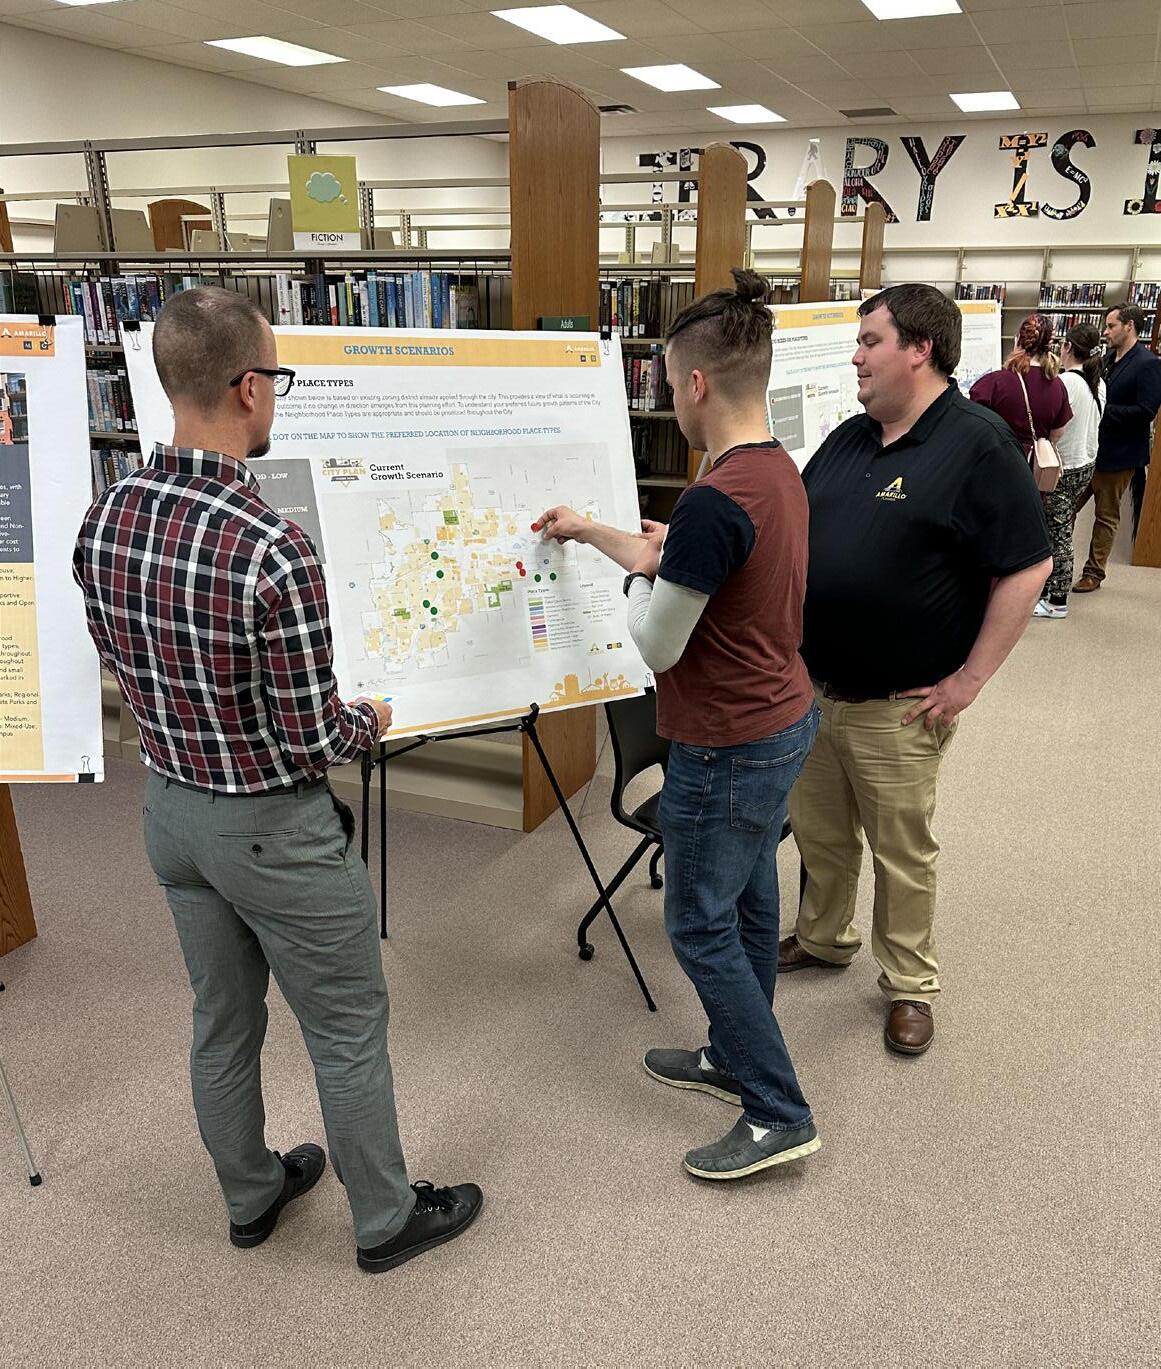
• To receive input on Growth Scenarios
• To educate the community on plan elements to be incorporated into City Plan
• To develop sound policy content upon which implementation strategies can be developed
Engagement Objectives
• To educate the community on City Plan
• To foster excitement for City Plan
• To establish a community-based vision for the future of Amarillo
• To energize and inform the community about next steps
• To engage the community and solicit input on plan elements, growth scenarios, and overall City Plan recommendations
• To gain participation
• To listen
• To garner feedback
• To create advocates


Community Overview
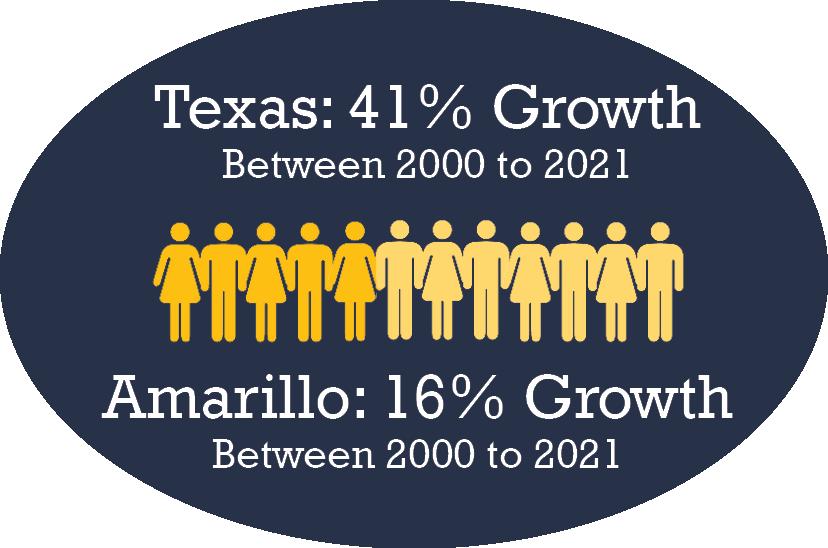
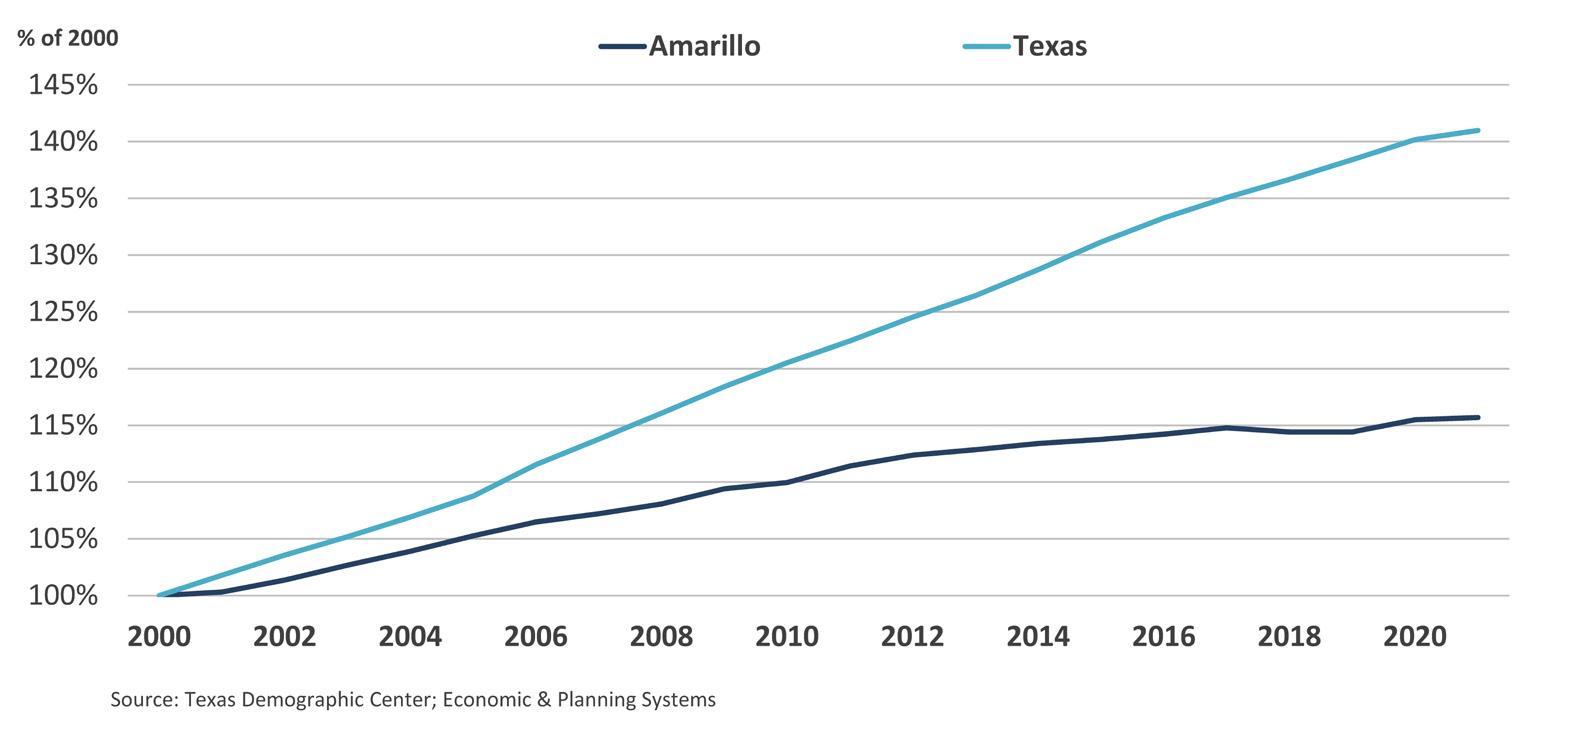
The population of Amarillo has steadily grown over the past two decades, reaching a total of about 201,000 residents as of 2021. Between 2000 and 2021, Amarillo added nearly 27,000 residents, which represents a growth rate of 16 percent, or 0.7 percent annually. However, this is a significantly slower growth rate than Texas as a whole over this timeframe. The majority of growth has occurred in Randall County, particularly on the southwest side of Amarillo. With a citywide area of 105.13 square miles, Amarillo currently has a population density of about 1,912 people per square mile.
The population of Amarillo is primarily White (77%), with a sizeable population of Hispanic and Latino residents (34%). Amarillo has a strong labor force, with about half of the population of prime working age (25-64), and a 65+ senior population (16%) slightly higher than the state as a whole. The median annual household income is $55,174 which is about $10,000 lower than the state median, indicating a concentration of lower income households who call Amarillo home. About 16 percent of Amarillo’s population lives below the poverty line.
Healthcare is the top sector for wages and salary
Accommodation & Food Services is the top sector for employment growth
Amarillo has a strong economy, with job creation roughly keeping pace with population growth over the last two decades. The economic base of the Amarillo metro area is diversified across several sectors, with the largest by wage and salary including health care, retail trade, manufacturing, accommodation and food services, and educational services. Accommodation and food services, construction, retail trade, and transportation and warehousing have experienced the most job growth over the last decade.
How to Use This Plan
City Plan is a policy document that is meant to guide the changes the community wants to see. Through a new vision, best practices, and a general “carrot” vs. “stick” approach, it provides a path towards a better Amarillo, but measurable change will be dependent on the continued efforts and engagement by the community.
This Plan will be referenced and used by an array of audiences, each with different perspectives, technical or experiential knowledge, and objectives, for purposes such as:
Residents – To understand the future vision for Amarillo and how the City plans to achieve that vision. Residents hold City staff and elected officials accountable to the vision and goals adopted within this Plan and participate in its implementation.
Developers, Investors, and Business Owners
– To understand the community’s goals and objectives, especially opportunities, needs, and parameters for how development should occur. These stakeholders help to achieve the community’s future vision within the private sector.
City Staff and Elected or Appointed Officials
– To implement the actionable policies laid out in this Plan that will help the community achieve its future vision and goals and to ensure that future decisions are compatible and aligned with the Plan.
Although many audiences may refer to this document for a variety of reasons, this Plan serves primarily as a roadmap for City officials and staff, who must make decisions on a daily basis that will determine the future direction, health, and character of the community. These decisions are carried out through:
• Targeted programs and expenditures prioritized through the City’s annual budget process, including routine but essential functions such as code enforcement.
• Major public improvements and land acquisition financed through the City’s capital improvement program and related bond initiatives.
• New and amended City ordinances and regulations closely linked to the goals and policies of this Plan (and associated review and approval procedures in the case of land development, subdivisions, and zoning matters).
• Departmental work plans and staffing.
• Support for ongoing planning and studies that will further clarify vision/goals, needs, costs, benefits, and strategies.
• Pursuit of external grant funding to supplement local budgets and/or expedite certain projects.
• Initiatives pursued in conjunction with other public and private partners to leverage resources and achieve successes neither could accomplish on their own.
The following chapter illustrates the overarching framework for City Plan – its core components and how they work together to present a versatile and userfriendly guide for all anticipated and intended audiences.
Introduction

Community Vision
Guiding Principles
Additional Plan Components
Vision & Guiding Principles
Introduction
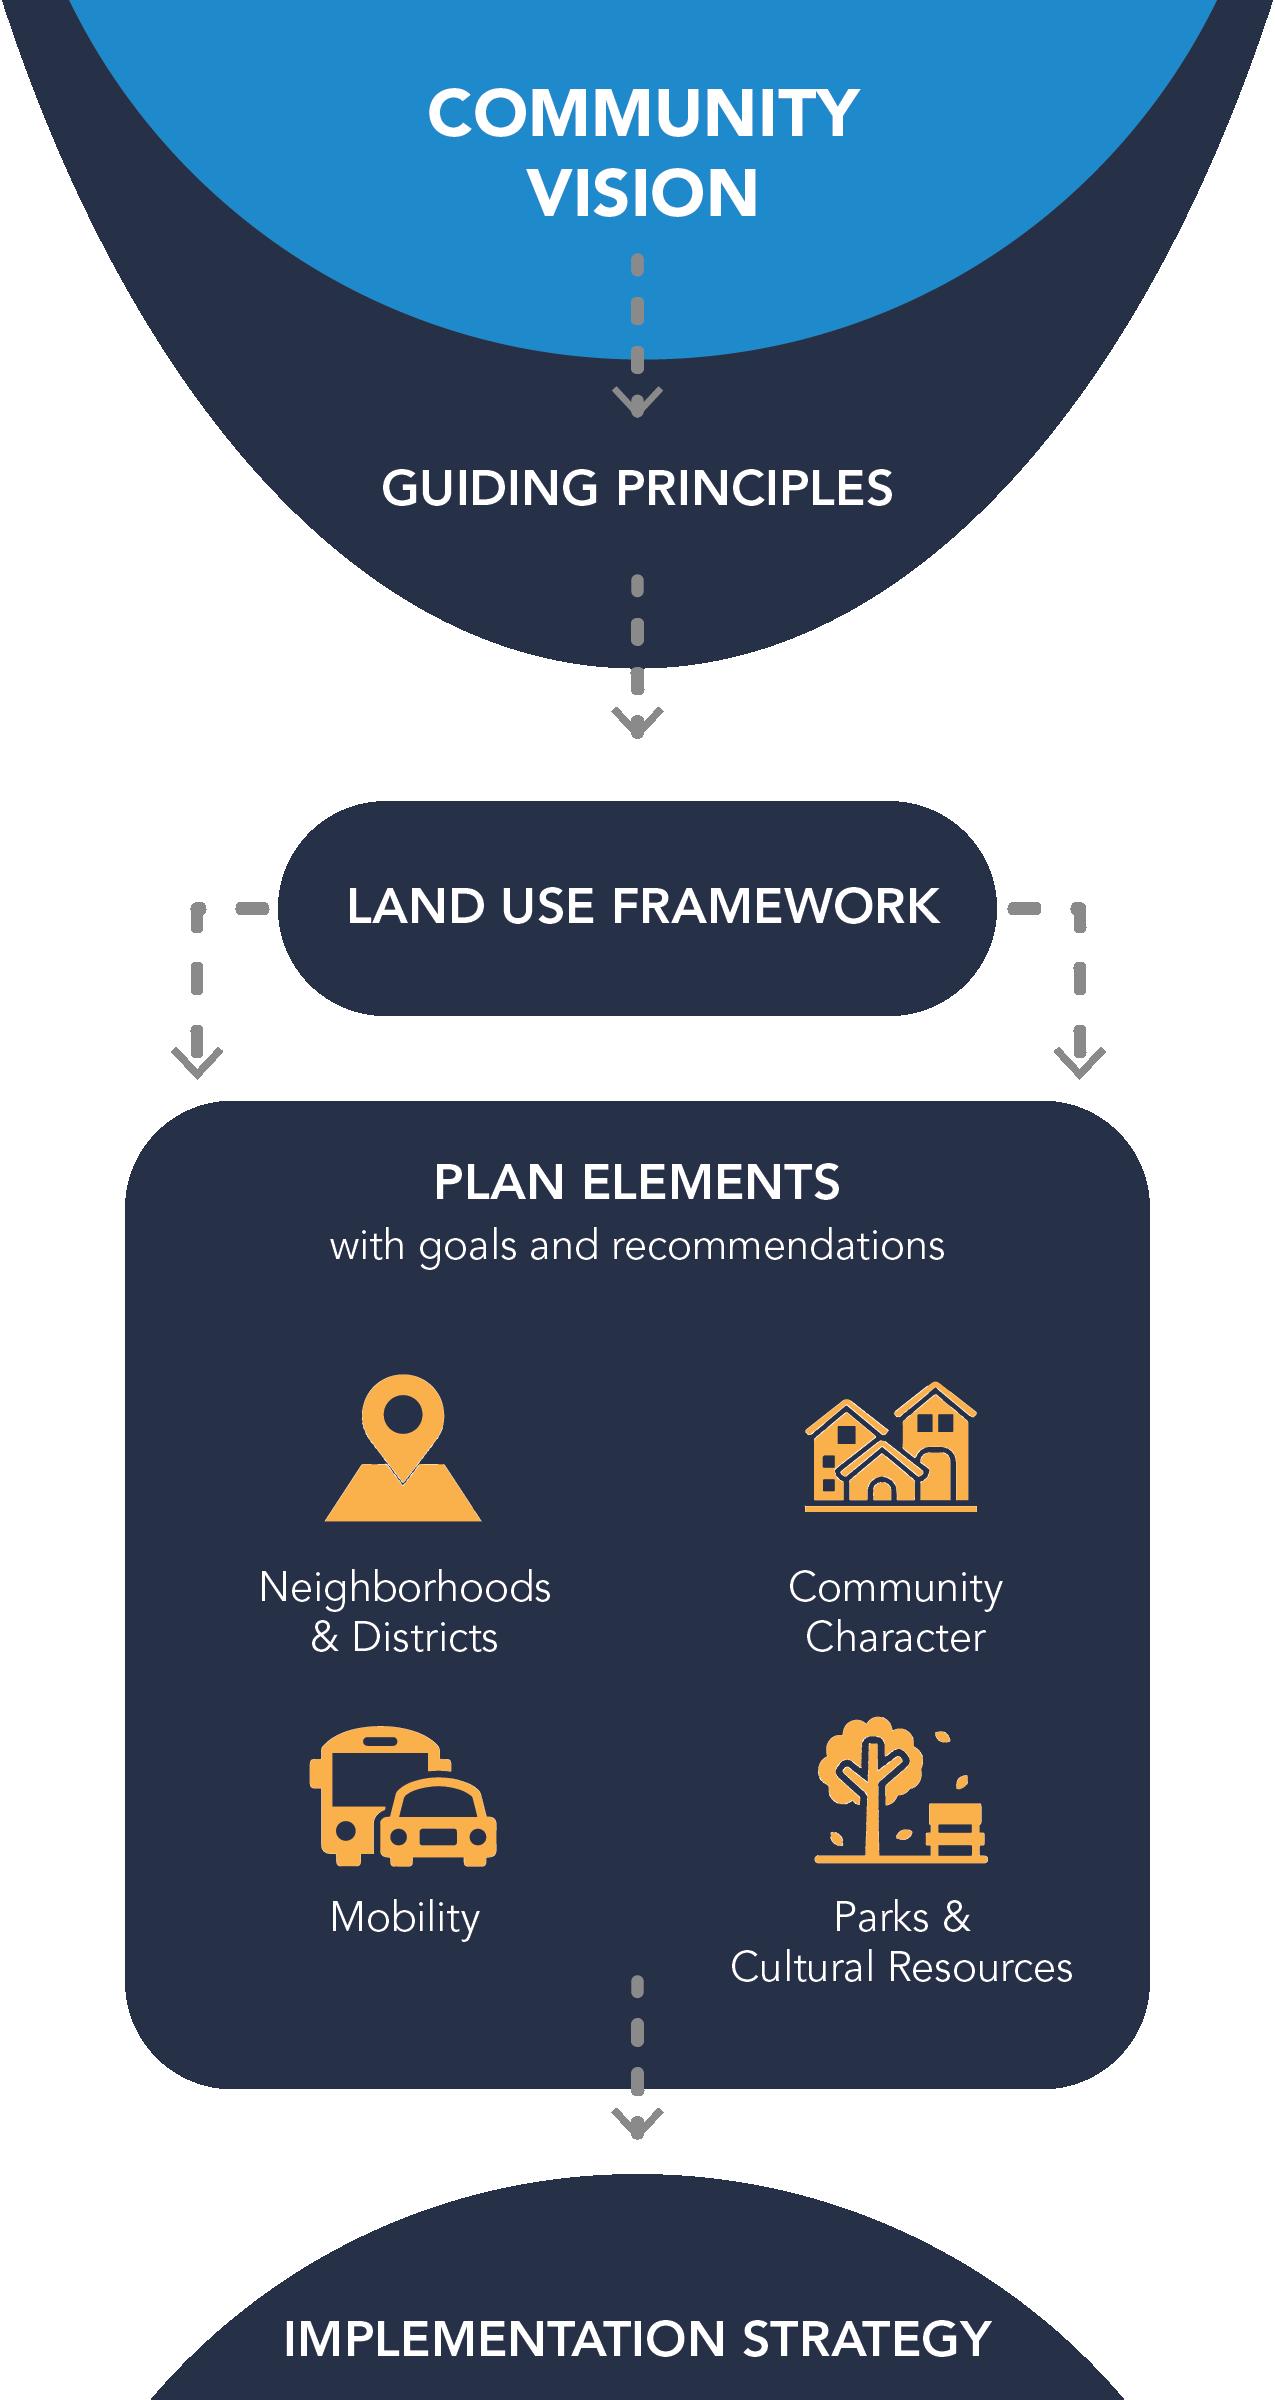
City Plan follows a predictable hierarchical framework. Each component builds progressively from the previous component, adding more detail to guide decisions and inform successful implementation. These components transition slowly from “what” to “where” to “how,” “when,” and “by whom.”
Community Vision
The community vision is the Plan’s most foundational component. It is a short, concise statement that reflects the community’s shared perspectives and high-level aspirations for Amarillo’s future. All other components of the Plan are derived from this collective understanding.
In 2045, Amarillo is a diverse, vibrant and family-friendly community surrounded by wideopen spaces that has reinvested in its original infrastructure, neighborhoods and districts and guided growth on its edges that have created amenities and opportunities for all Amarilloans.
Amarillo is a regional economic and service hub and national destination that celebrates its small-town charm, historic and cultural roots and strategic location with a unique mix of shopping, employment, housing, entertainment, parks, and open space.
1
Guiding Principles
City Plan has six guiding principles. Each guiding principle contributes structural support for the Vision, providing additional detail about the community’s values and desired future conditions. These statements begin to incorporate the role of action and responsibility into their phrasing, which paves the way for moving from the “what” to the “how.”
Create a variety of walkable destinations throughout the city while ensuring convenient local and cross-town connectivity for cars, bikes and transit.
2
3
Provide a range of housing opportunities with nearby employment and services to support all income levels and age groups.
Prioritize reinvestment in existing infrastructure, neighborhoods, districts, and recreational amenities.
4
Encourage a diversity of low- to medium-scale places throughout the city.
5
6
Increase overall quality of life for all residents by promoting safe, clean, and protected neighborhoods with well-amenitized park spaces, goods, and services nearby.
Celebrate cultural and historic assets along key corridors and in specific neighborhoods and districts.
Additional Plan Components
Land Use Framework – The Land Use Framework provides a comprehensive representation of the Vision and Guiding Principles through overall development and land use patterns. Central to the Land Use Framework is the Complete Neighborhoods Map, which illustrates a strategic approach for proactively managing anticipated growth and change through geographic Place Type (i.e., land use) allocations. This map is supported by detailed information for each Place Type and areas with the greatest anticipated growth and change. The Land Use Framework represents the “what” combined with “where.”
Plan Elements – four topical Plan Elements provide further detail and supplemental information to expand upon the Land Use Framework. These Elements include:
• Neighborhoods & Districts: Focused on housing and economic development.
• Community Character: Focused on land use compatibility, transitions, and design.
• Mobility: Focused on connectivity and access for all modes of transportation.
• Parks & Cultural Resources: Focused on community gathering spaces, areas of conservation, green infrastructure, historic preservation, and cultural celebration.
Each Element has a set of goals and recommendations. Goals provide additional topic-specific structure to the Vision and Guiding Principles, identifying more detailed outcomes and policy positions that the City should aim for in order to achieve the Vision. Recommendations are actionable steps embedded within each Goal to inform how the City can work towards each Goal, and ultimately, the Vision. The Plan Elements together holistically address the transition from the “what” and “where” to the “how.”
While each Element focuses on a different topical area, their recommendations and associated outcomes are synergistic, working as a web of interwoven relationships that together support the Vision, Guiding Principles, and Land Use Framework.
Implementation Strategy – the Implementation Strategy provides technical detail for each recommendation, intended for City staff and officials to understand fiscal impacts, roles and responsibilities, partnerships, and other important information about key actions and decisions. This content represents the “how,” “when,” and “who.”
Land Use Framework: Growth Management & Capacity
Introduction
Recent & Future Development Trends
Complete Neighborhooods
Land Use & Place Types
Neighborhood Patterns
Complete Neighborhoods Scenario
Areas of Targeted Growth & Change
Fiscal Considerations
Introduction
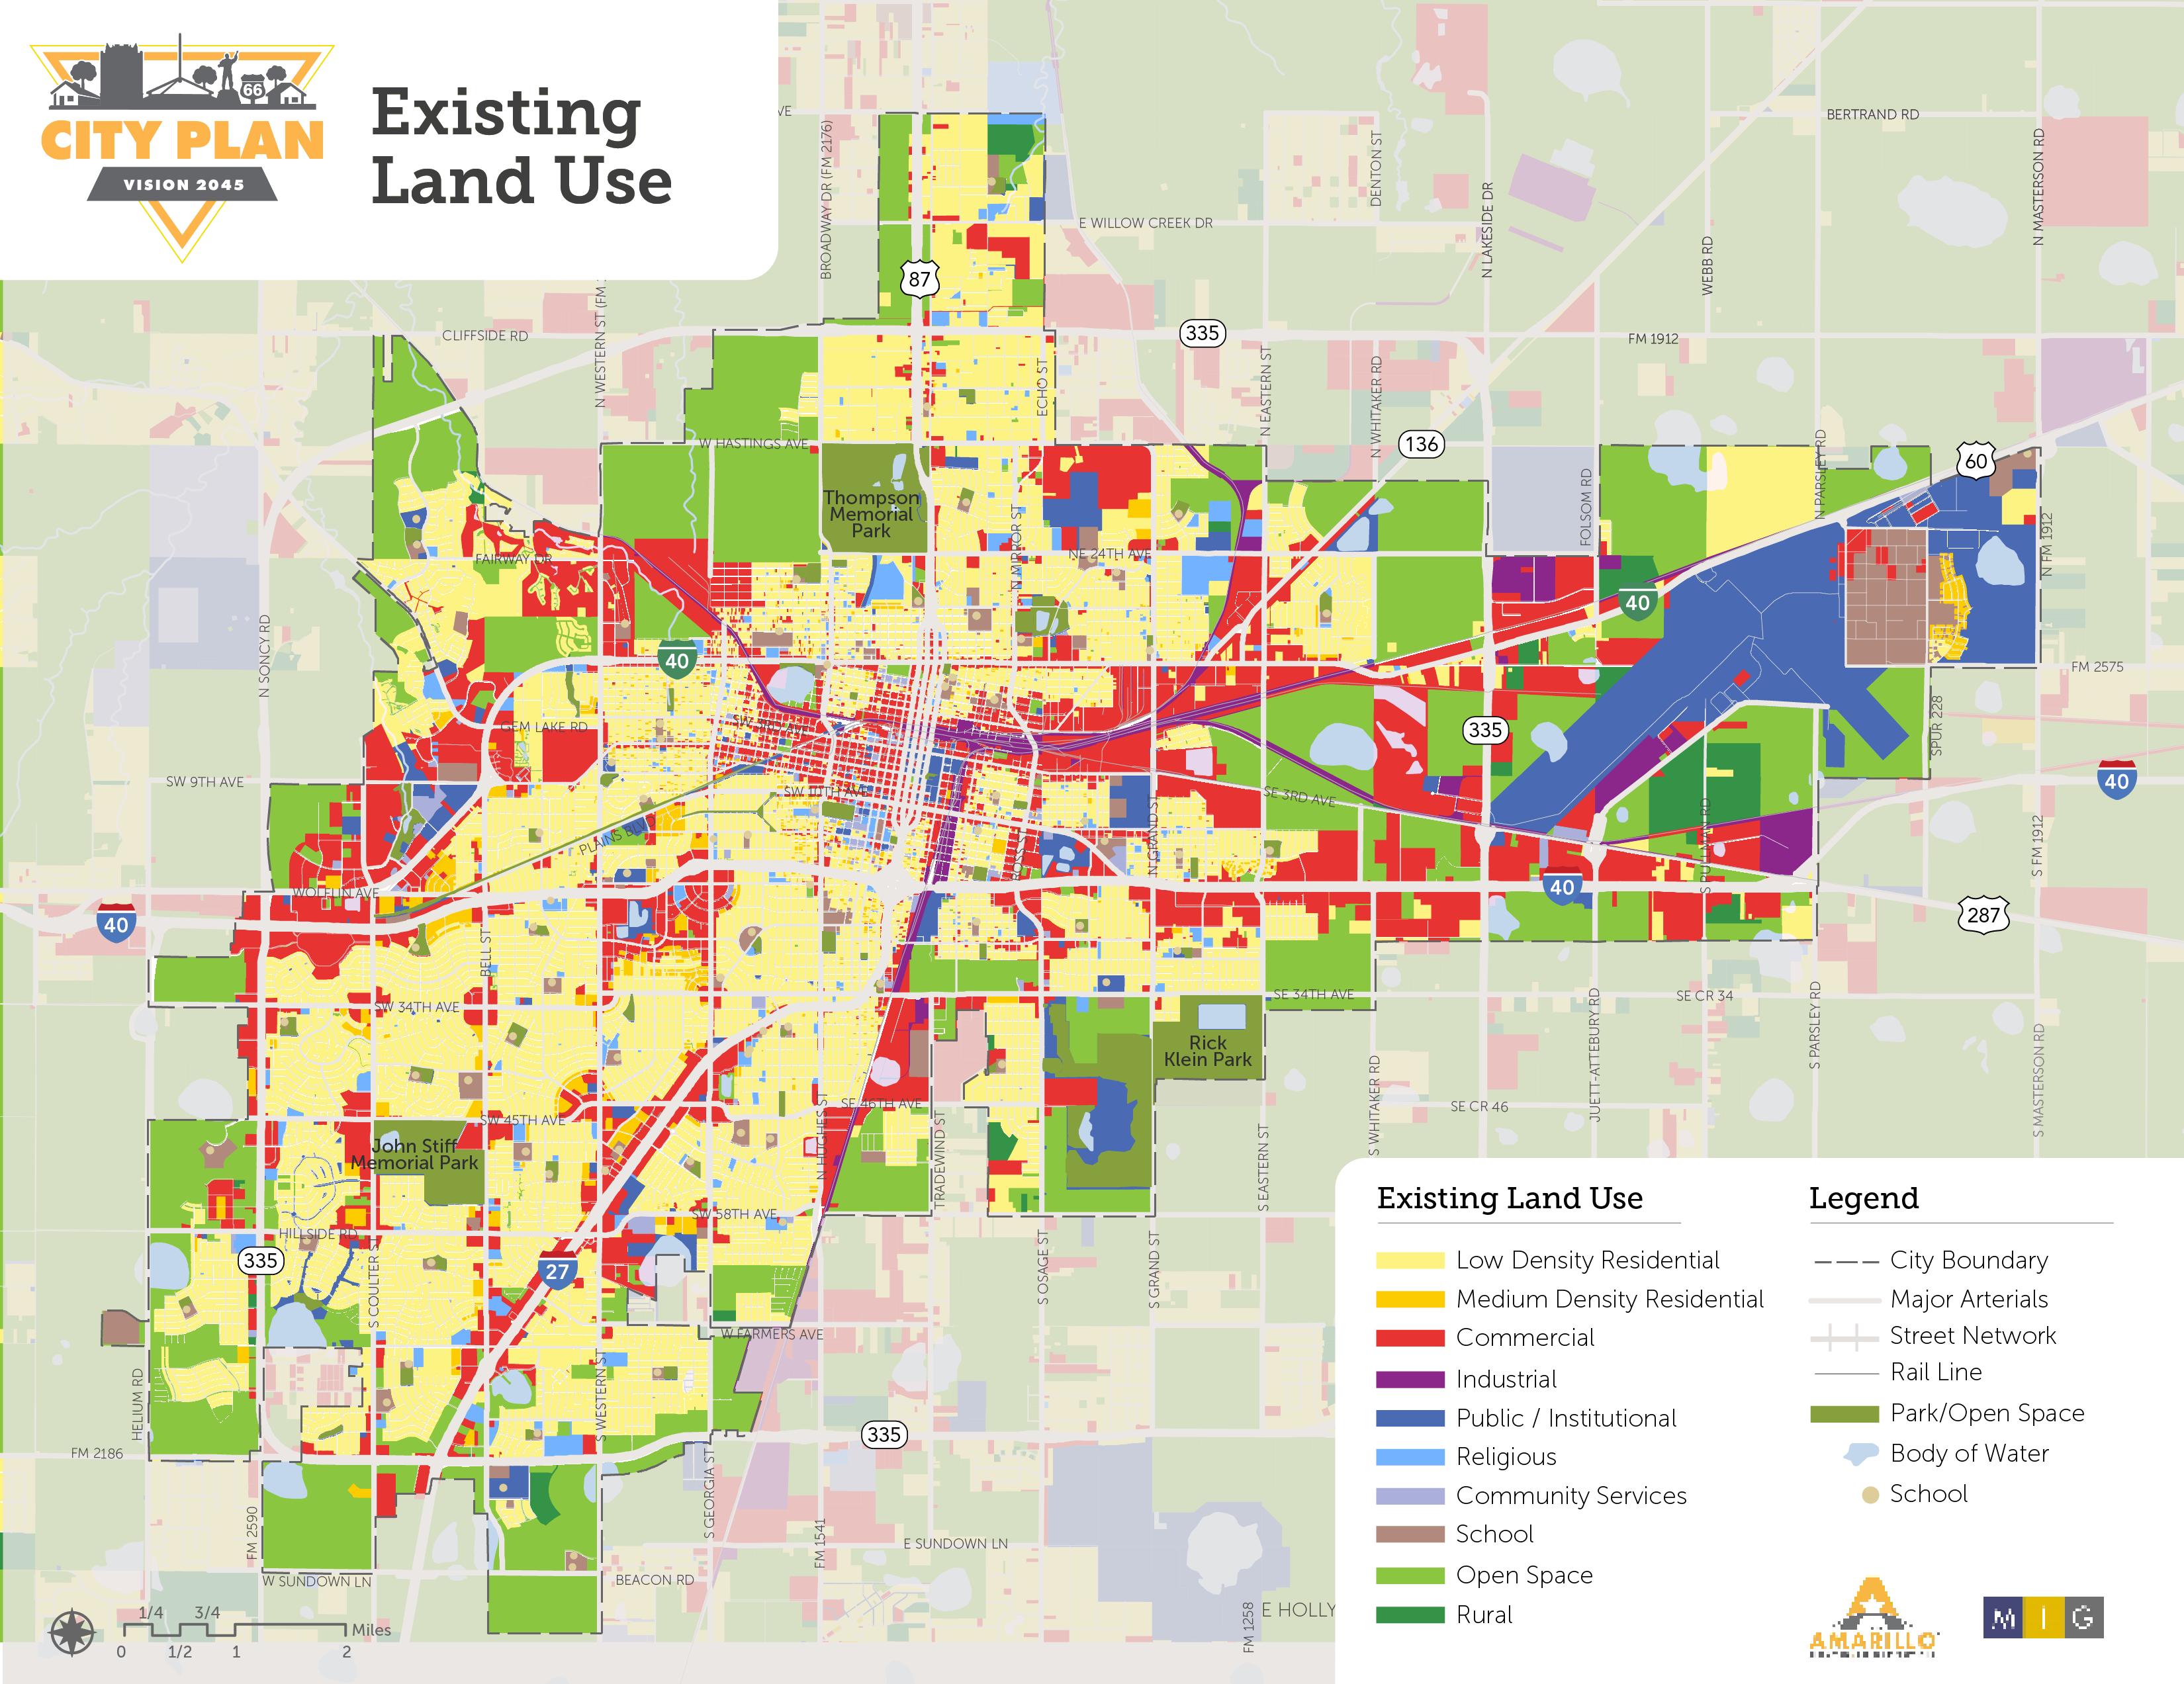
Amarillo currently has a land use mix that is predominantly low density single-family residential (28%), open space (27%), and commercial (20%). Public and institutional uses also comprise a significant portion of land in Amarillo (12%). Other land uses are less significant, each making up less than three percent of the total land area. Land uses in Amarillo tend to be segregated and segmented.
Recent & Future Development Trends
Physical development activity and population or economic growth have a symbiotic relationship. New development and redevelopment are necessary to accommodate natural growth in population (births and in-migration), while development can also provide new opportunities that increase in-migration through outside interest and demand – both for residents and for businesses. Development and growth trends have followed similar trajectories over the last two decades in Amarillo, each at a steady annual rate between 0.7% and 1.1%. This indicates that development is keeping pace with natural growth, but not necessarily driving growth.
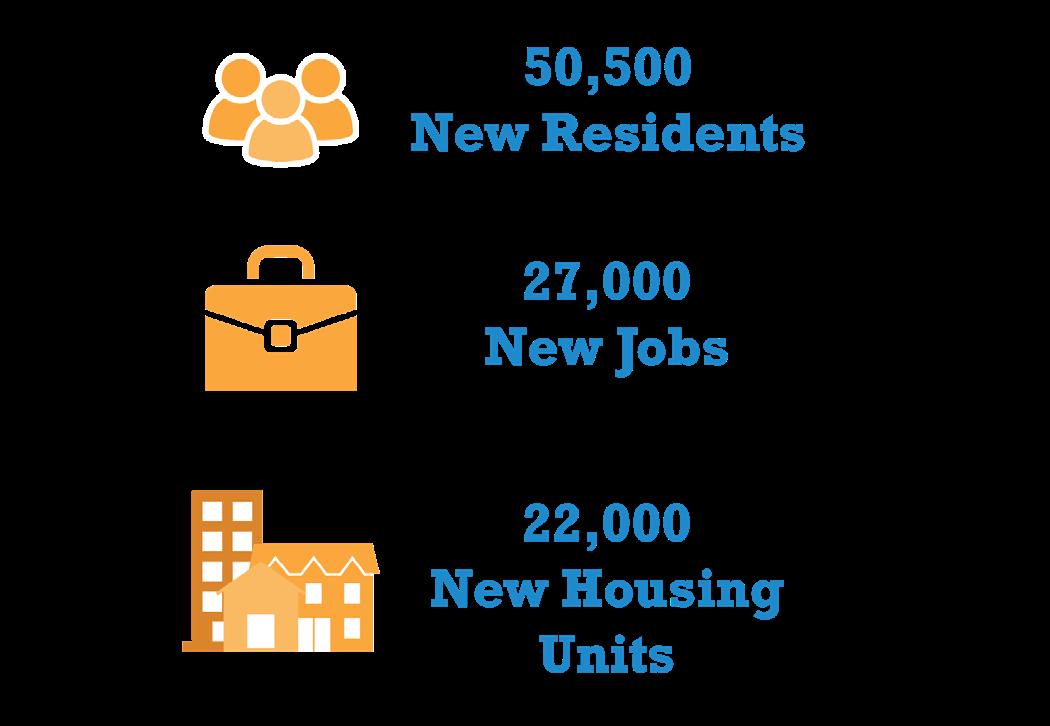
The Amarillo Metropolitan Planning Organization (MPO) forecasts that the City will grow at an annual rate of 0.96 percent over the coming decades, reaching a projected total of approximately 255,680 residents in 2040. These projections indicate an anticipated increase in the rate of growth compared to recent trends. With this anticipated increase in growth rates over the next 20 years – more than 50,000 new residents total – strategic development can help shape where and how that growth is accommodated or encouraged. This includes investment in areas that have experienced deterioration and proactive efforts to increase the diversity of development types and thus opportunity, prosperity, and quality of life for Amarillo residents, businesses, and workers.
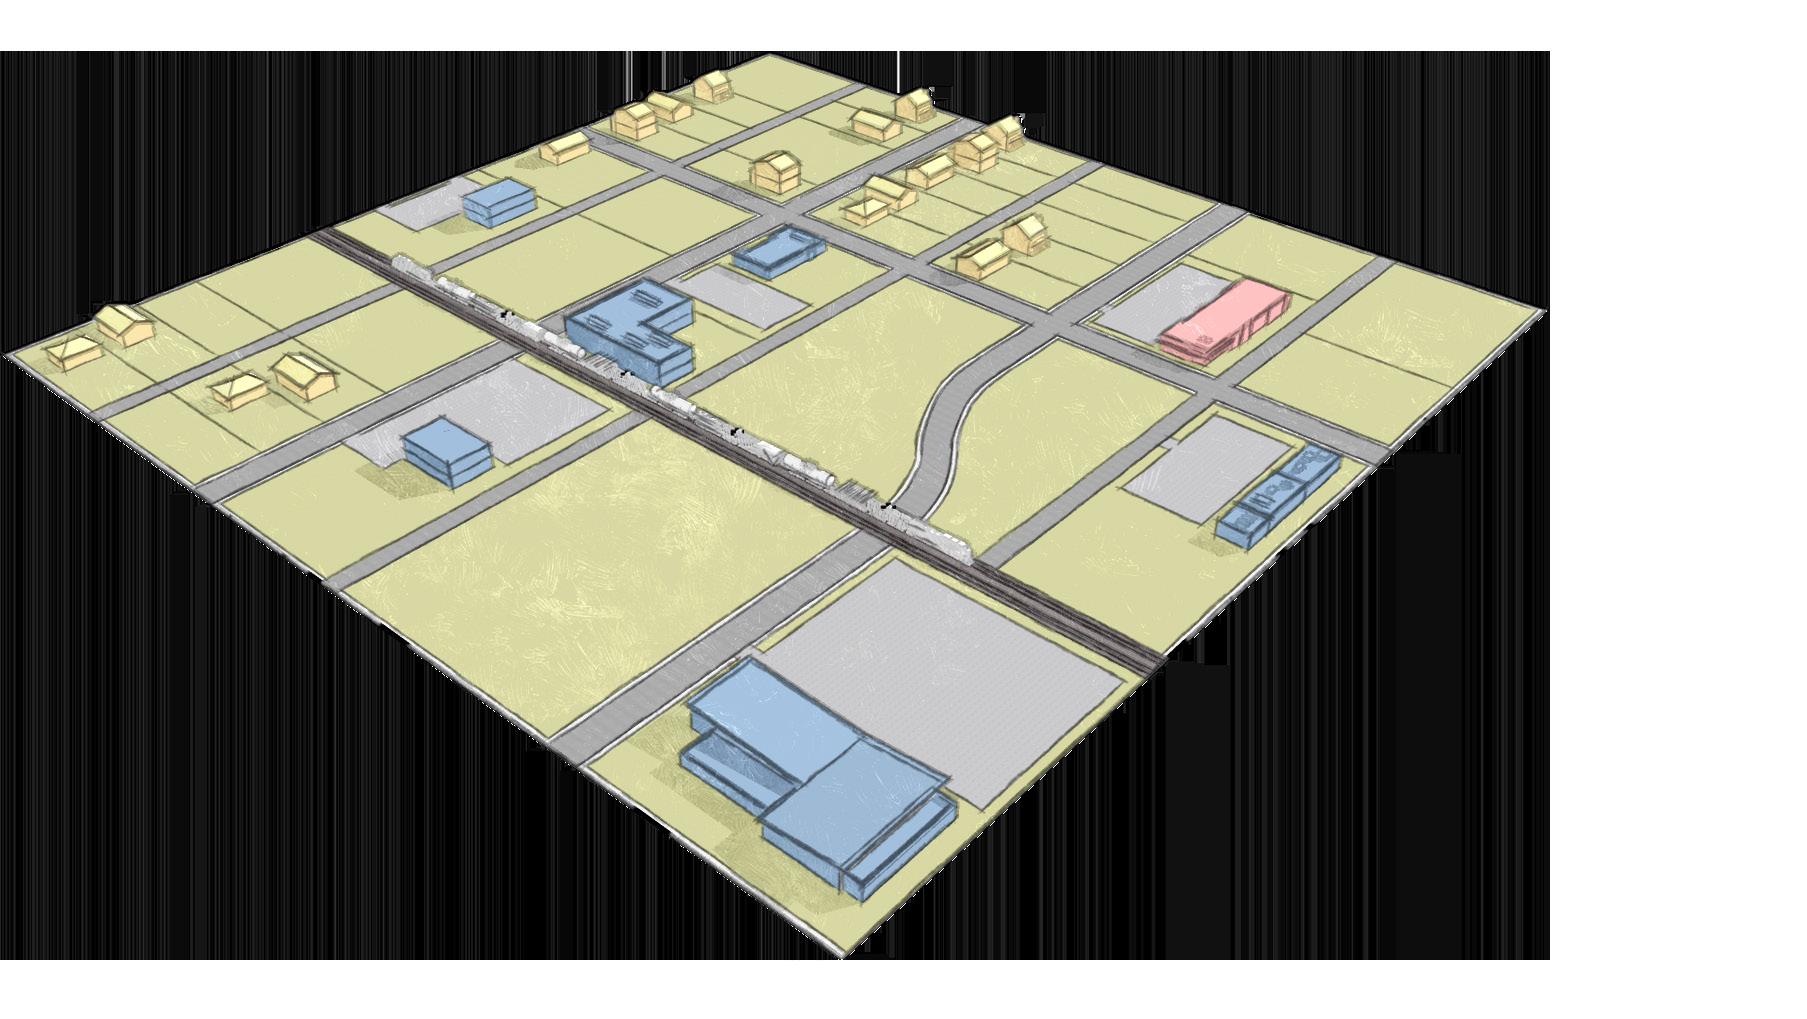
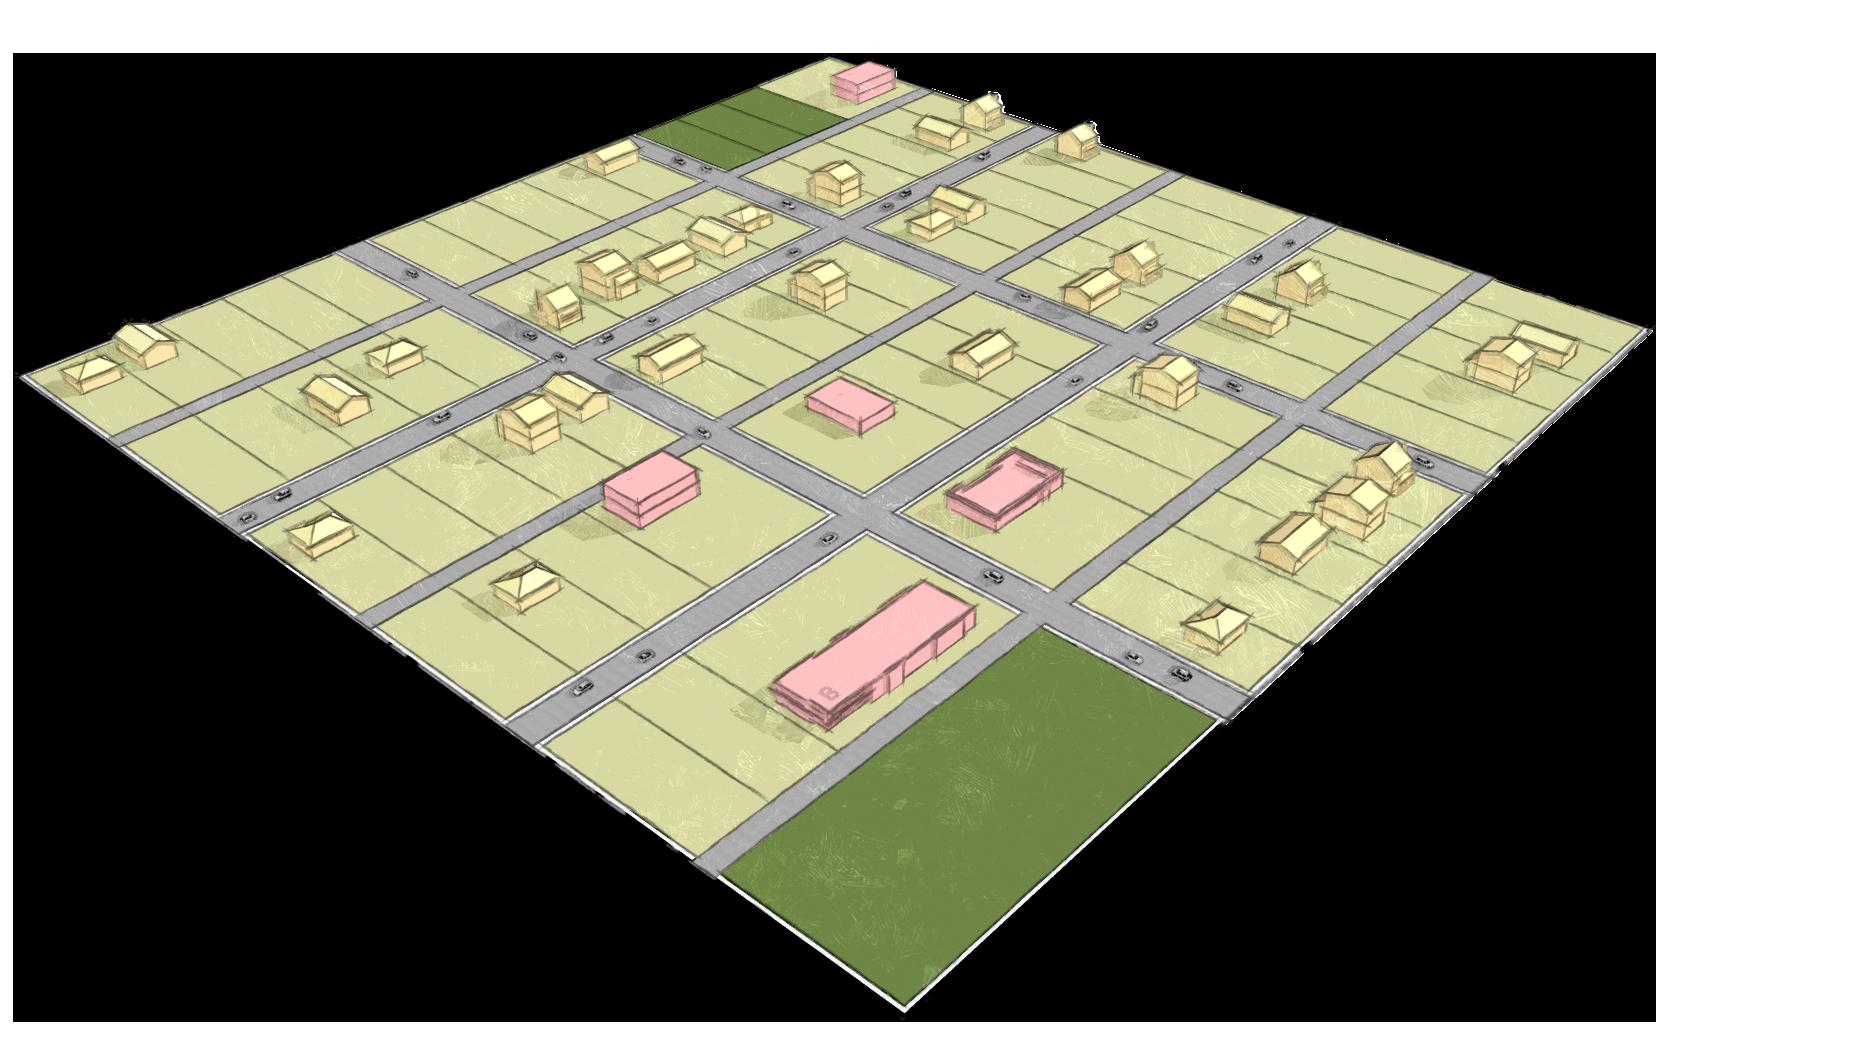
NEIGHBORHOOD UNIT CONCEPT
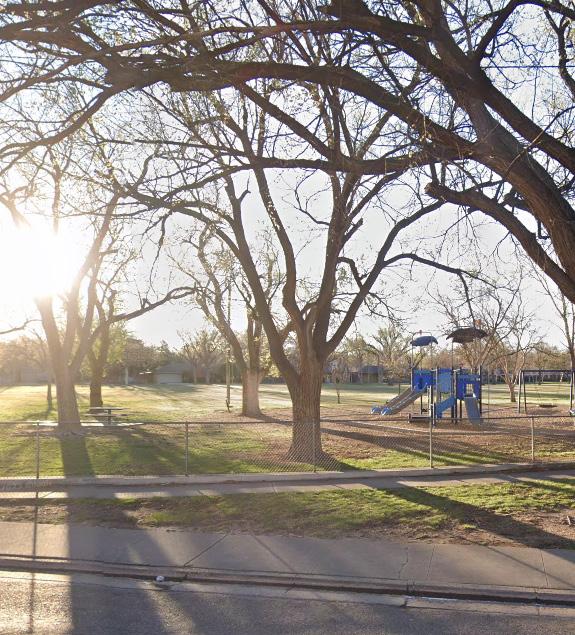
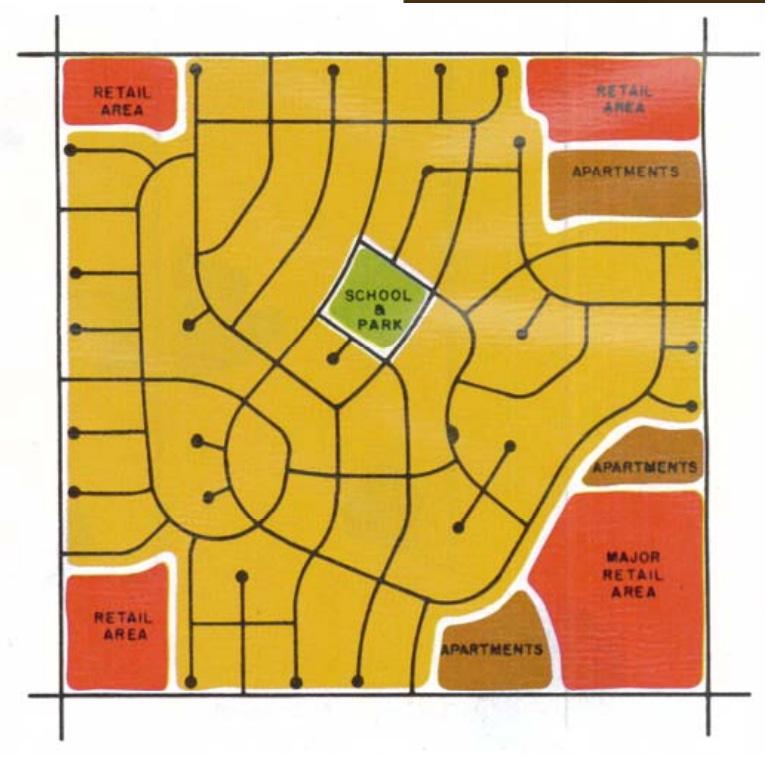
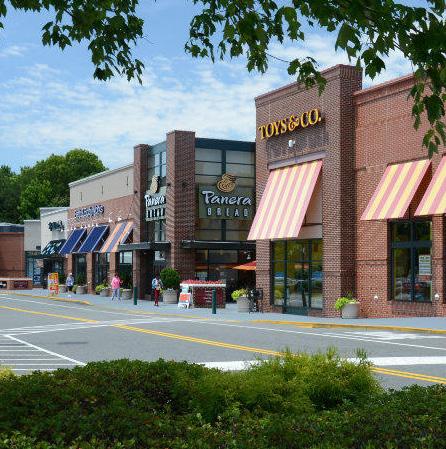
An implementation success from the 1980s Comprehensive Plan is the Neighborhood Unit Concept (NUC). This has shaped new development in Amarillo since that time, providing guidance for how to develop one square-mile sections. The NUC locates lower-density housing types in the interior, centered around a neighborhood park and/ or elementary school campus; larger commercial and institutional uses at the neighborhood edges and major intersections; and attached and multifamily housing and small-scale office uses providing a transition from the interior to the more intensive perimeter uses. Older parts of the City that already had an established fabric do not reflect this typology.
From an economic perspective, Amarillo has seen the most job growth in accommodation and food services, construction, retail trade, and transportation and warehousing industries over the last 20 years, with potential for continued demand and growth in these established areas. In addition, healthcare, manufacturing, and educational services continue to be strong economic sectors, indicating continued demand and growth. Amarillo has the opportunity to encourage new economic growth in areas that expand upon current economic foundations to bring high quality jobs, contribute to Amarillo’s culture, and attract new investment and talent.
Amarillo by 2045
From a residential perspective, Amarillo has accommodated recent population growth through greenfield, master planned singlefamily communities, expanding outward from the City’s core, even though many undeveloped and underutilized parcels exist within already-developed areas. This has left older parts of the City neglected while new homes are farther from daily needs and activity. In addition, these development trends have maintained the status quo in housing supply, which together with rising housing prices are leaving limited choice and opportunity to meet a wide variety of needs.
While recent economic and residential development activities have both been focused in the southern and western portions of Amarillo, uses continue to be relatively segregated and mostly low-density, perpetuating and exacerbating trends of sprawl and development homogeneity. By establishing a holistic plan for land use and development patterns that weaves together compatible industries and activities, balanced and mixed land uses, infill development, and multimodal connectivity, each development in Amarillo will contribute to the creation of distinct places that offer a greater range of choice and opportunity.
Complete Neighborhoods
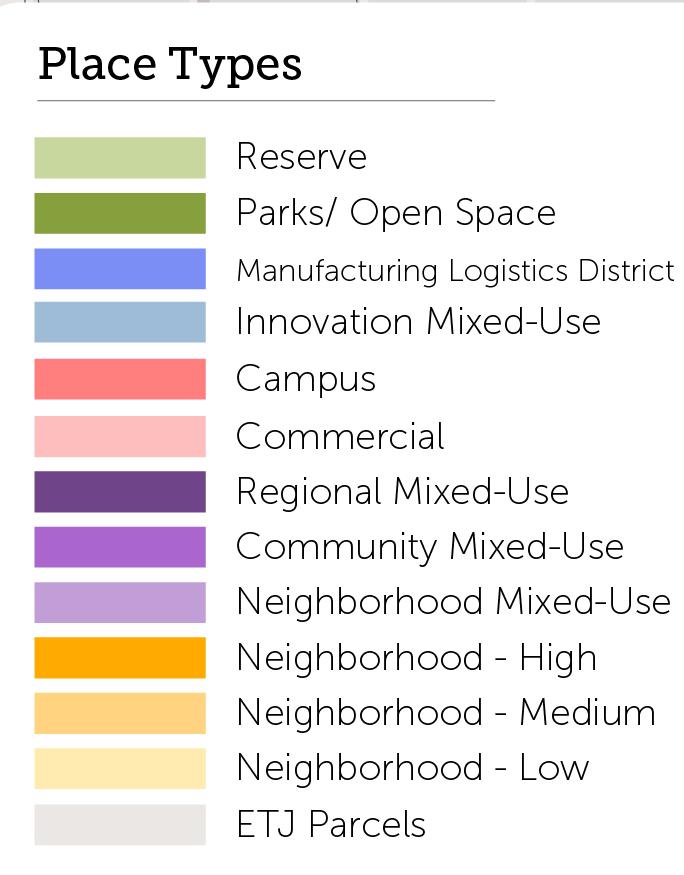
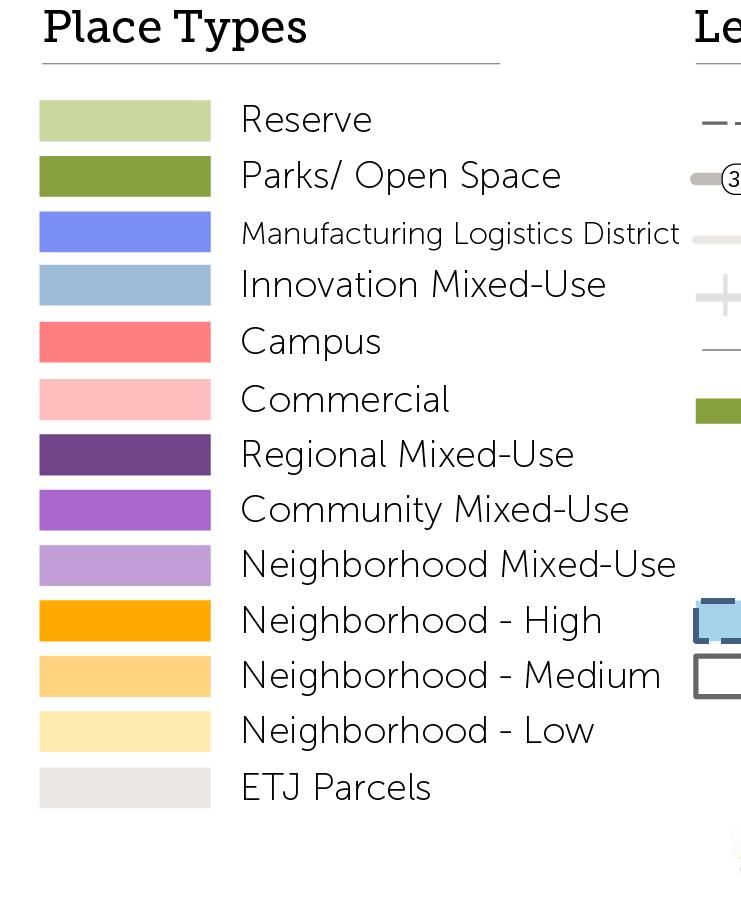
One of City Plan’s strongest tools for proactively guiding future development and growth in Amarillo is the Complete Neighborhoods Scenario and accompanying Place Types. The Complete Neighborhoods Scenario functions as a future land use map for the City, depicting the community’s vision through the geographic allocation of 12 different Place Types. Each Place Type goes beyond simply identifying land use by providing additional guidance for development characteristics that contribute to a high quality lived experience and clearly defined identity as well as increased opportunity, health, and vibrancy, no matter the overarching use. The individual characteristics of each Place Type work symbiotically to promote a cohesive, well-connected, and prosperous Amarillo.
The Complete Neighborhoods Scenario and Place Types laid out in City Plan do not have regulatory power. Rather, they provide clear policy direction for how the City’s regulatory tools (e.g., zoning and building codes, subdivision regulations, or design guidelines, among others) may be changed to better align with the community’s future vision. These changes may be initiated by the City and adopted through robust community engagement – such as adding new zoning districts or amending the regulations within existing districts. Alternatively, these changes may be initiated by property owners who request a zoning change that aligns with City Plan. A recent initiative (2019) to conduct a comprehensive review and revision of the City’s Zoning Ordinance was strategically deferred until after the City’s Comprehensive Plan could be updated. With the adoption of City Plan, Amarillo is now well-equipped with renewed guidance for land use and development regulation.
Furthermore, City Plan identifies Neighborhood Pattern Typologies and Targeted Areas of Growth and Change, which together illustrate the range of anticipated types and intensities of change – including top priorities –across Amarillo’s neighborhoods and areas of economic activity and production.
These tools and concepts are critically informed by current and projected conditions – both physical and demographic – which indicate the community needs that the City will need to support and provide for, as well as the City’s current capacity to meet those needs. This
chapter begins by discussing these conditions and how they have grounded City Plan’s recommendations for growth management and future development patterns.
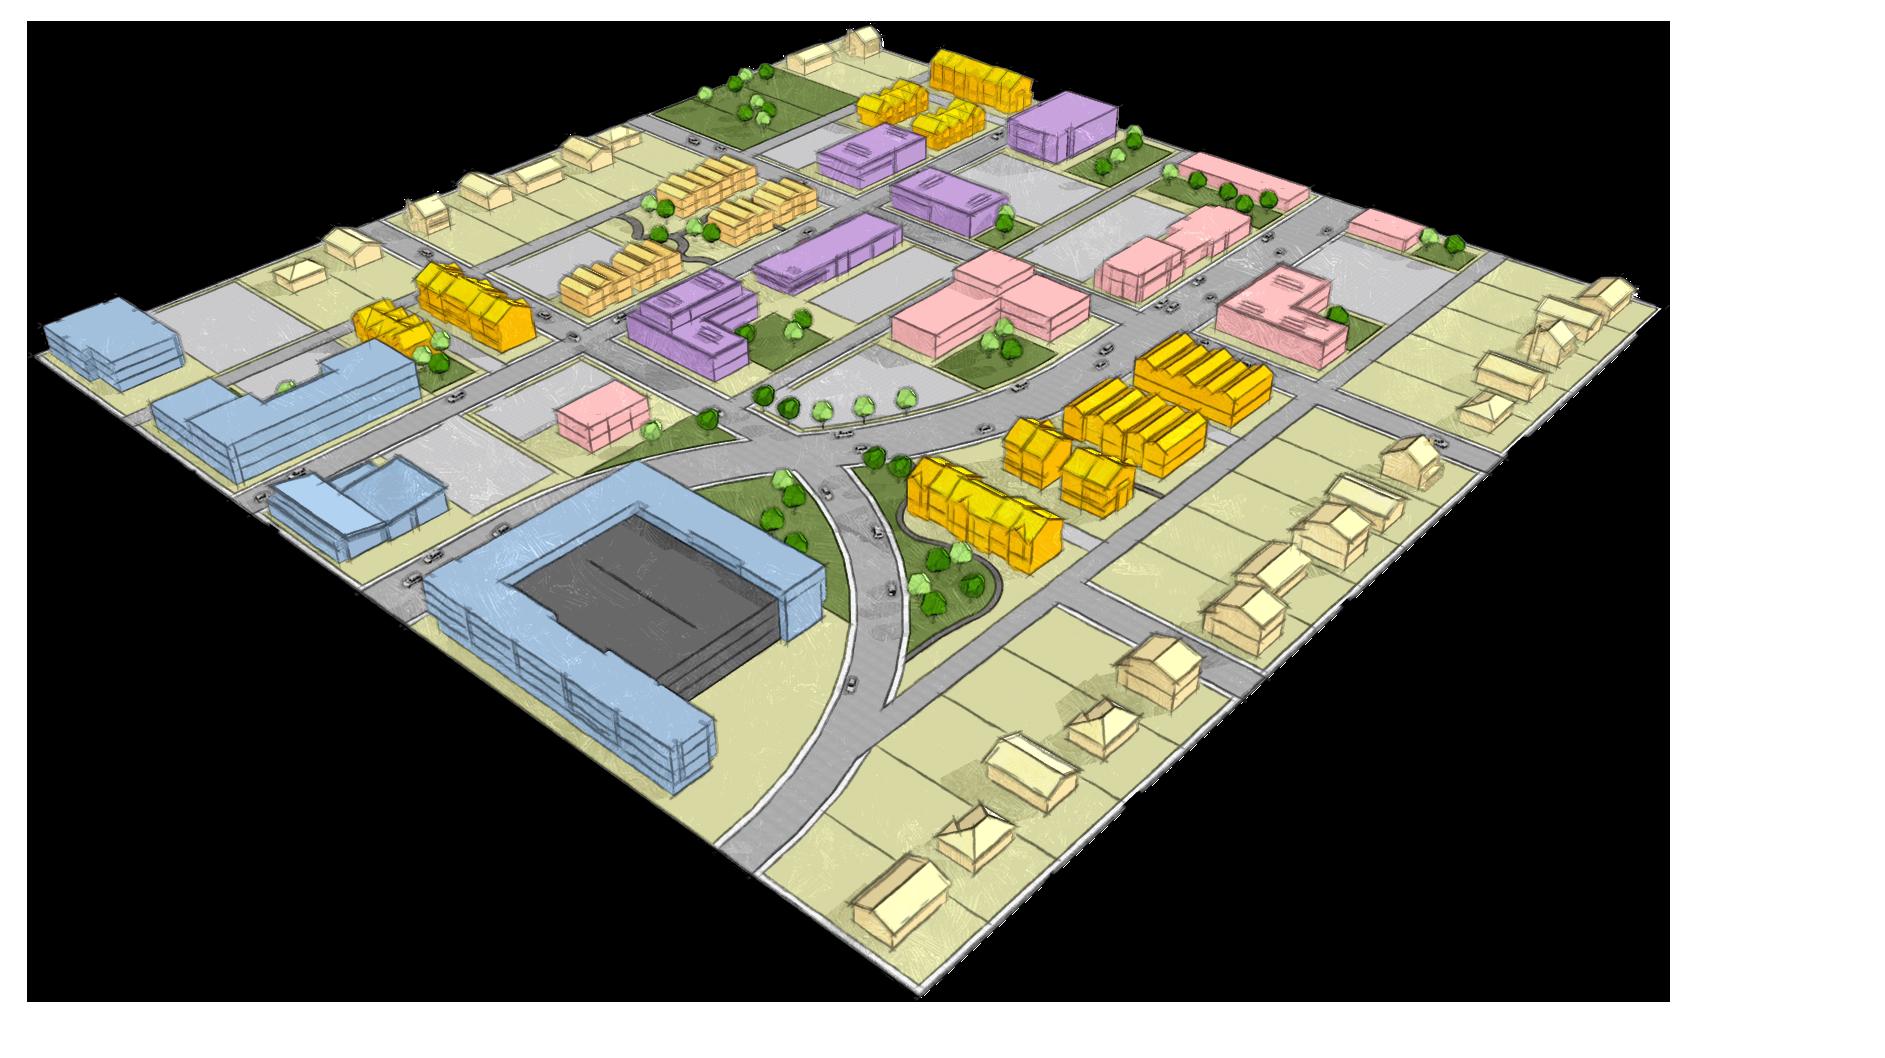
Using the concept of “Complete Neighborhoods” as the framework for future land use and development patterns implies the underlying intent of the policy – to provide residents, businesses, employees, and visitors with a comfortable experience across all portions of the City. Complete Neighborhoods will provide greater access to daily needs and amenities and provide buffers between different areas of use and intensity. While not all neighborhoods and districts will be the same, their distribution, adjacencies, and elements will together create a well-connected network of walkable destinations that serve a wide variety of needs and interests.
The Place Types embedded within the Complete Neighborhoods Scenario capture how future development will accommodate Amarillo’s anticipated growth. Residential growth will be accommodated
Comparison of Growth Strategies
Residential Growth
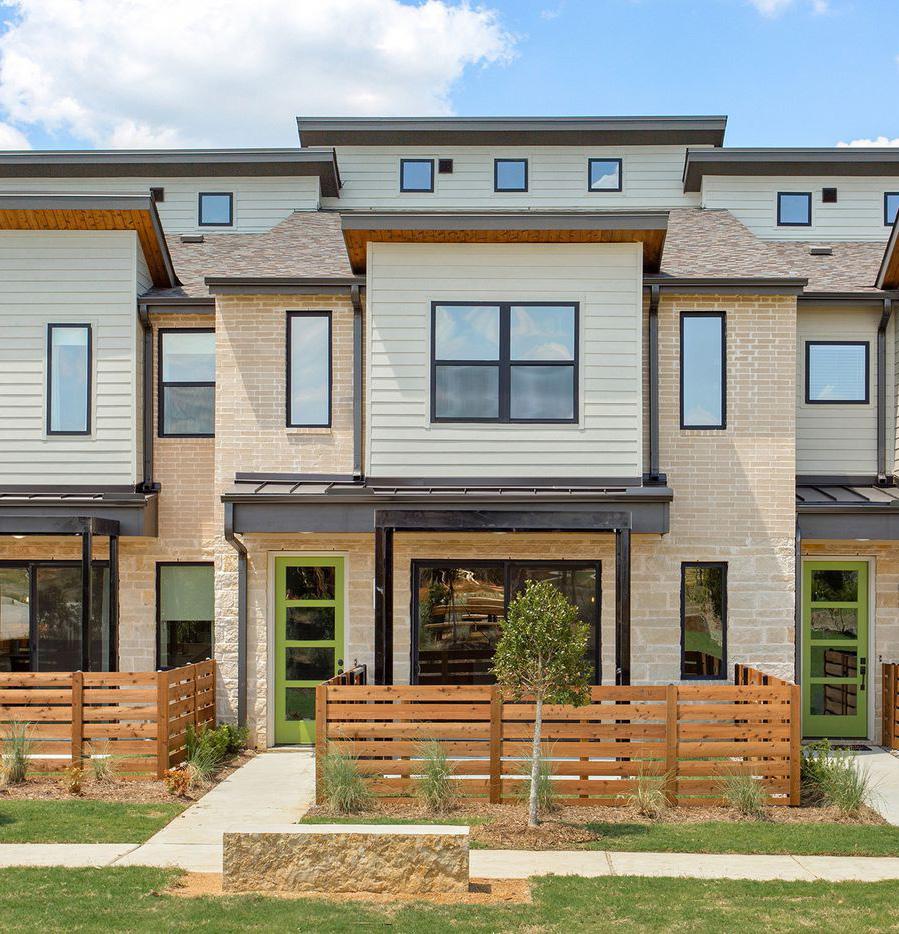
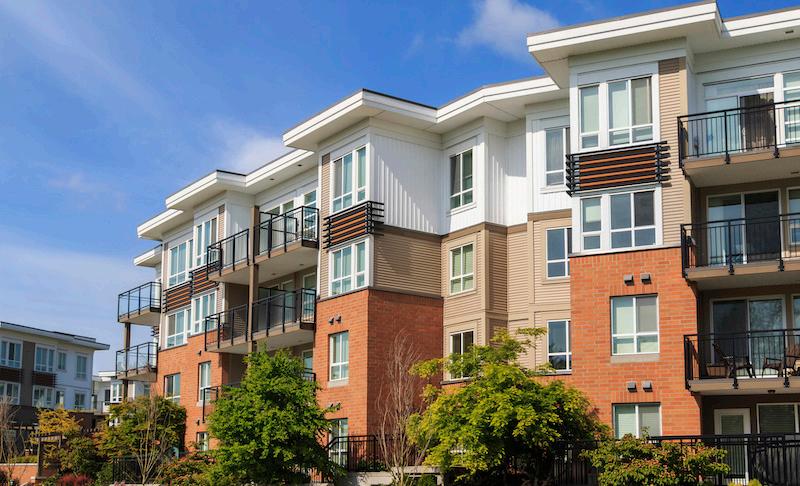
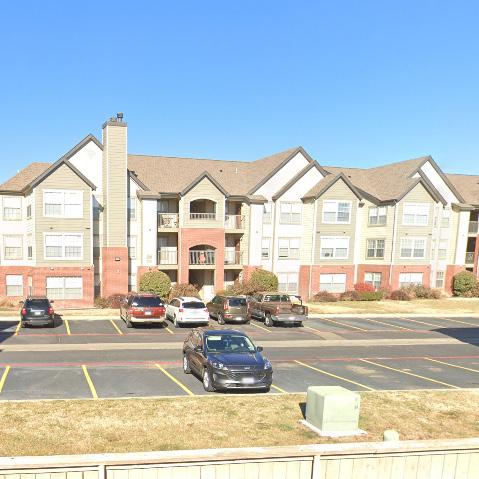
through the provision of diverse housing types, including the preservation of outlying low-density single-family areas, while strategically incorporating modest- andhigher-density housing where appropriate. For example, Accessory Dwelling Units (ADUs) and duplexes will offer more flexibility for some homeowners to house a relative or use rental income to support homeownership costs while incrementally adding more housing units to the market. Townhomes, small-scale multifamily and live-work units will offer smaller, more affordable homeownership and/or rental options and serve as a gradual transition from lower density neighborhoods to higher density or mixed-use areas. Furthermore, directing higher-density multifamily and residential mixed use along major corridors, near transit hubs, and near or within commercial activity centers will provide attractive options for residents who want to live closer to daily needs.
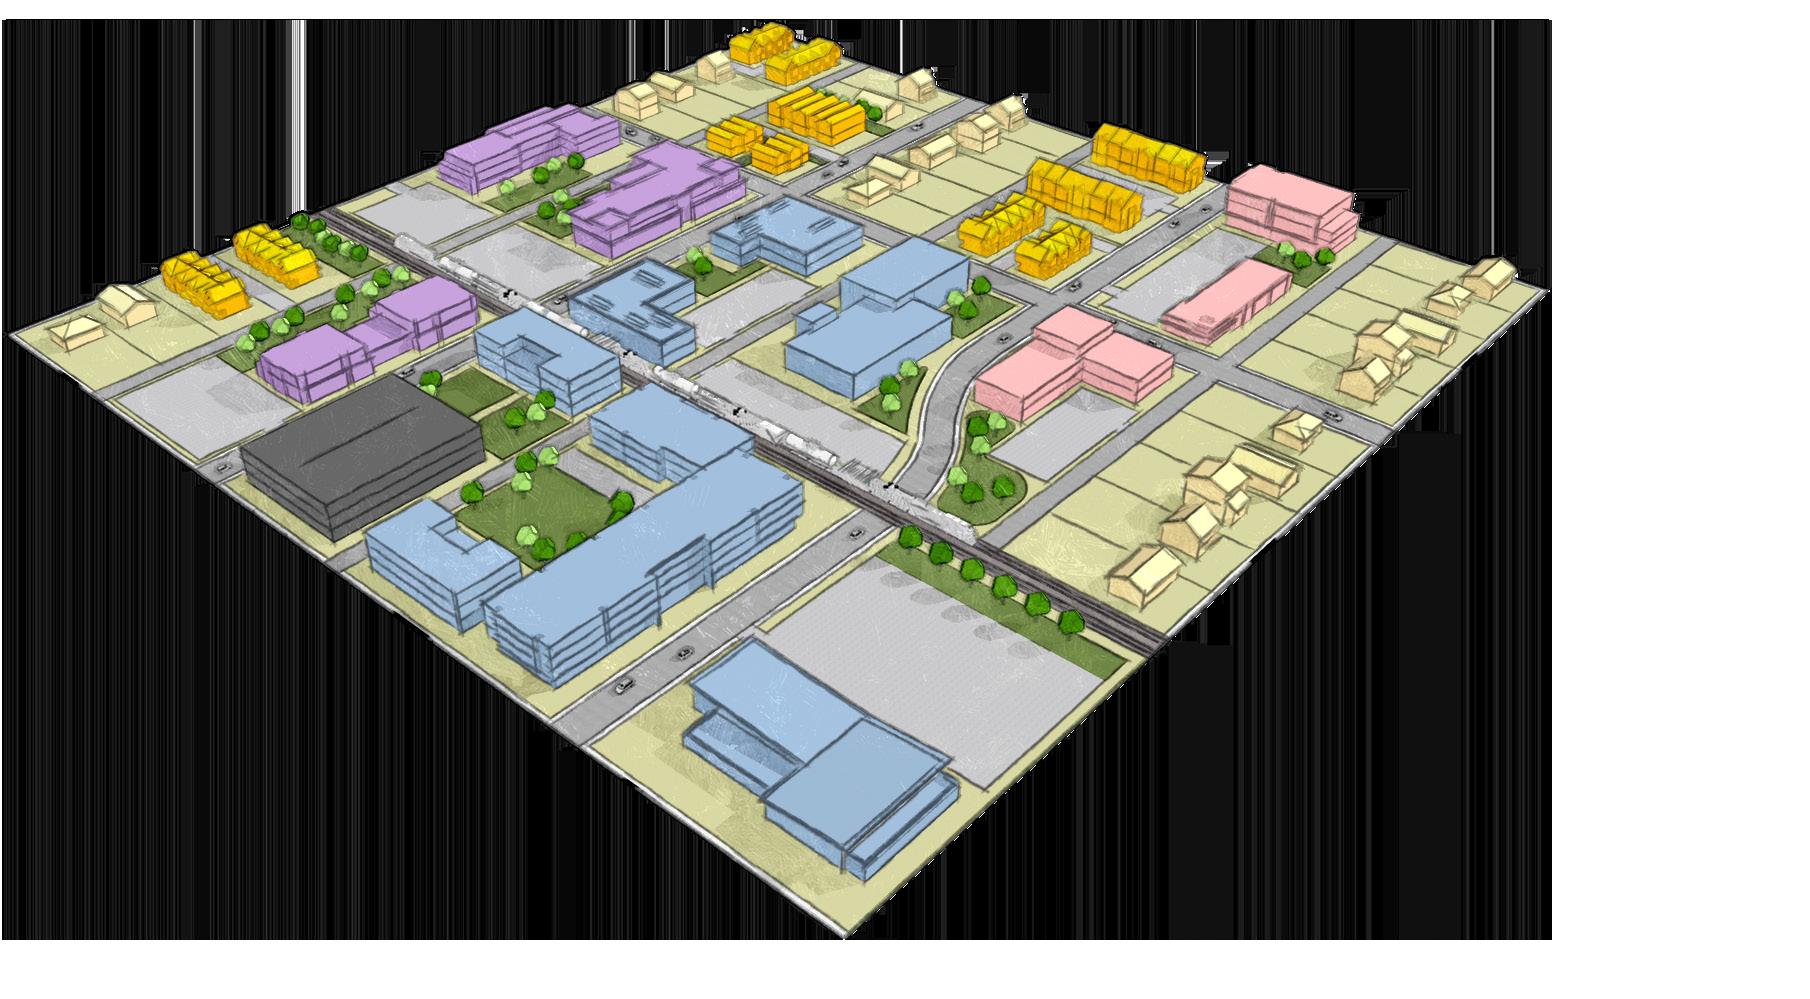
Neighborhood Unit Concept Complete Neighborhoods
Focus is on lower-density housing types located within the interior of a square mile section.
Commercial Growth
Places larger commercial and institutional uses at the neighborhood edges and major intersections. Small-scale office uses provide a transition buffer from the the more intensive perimeter uses.
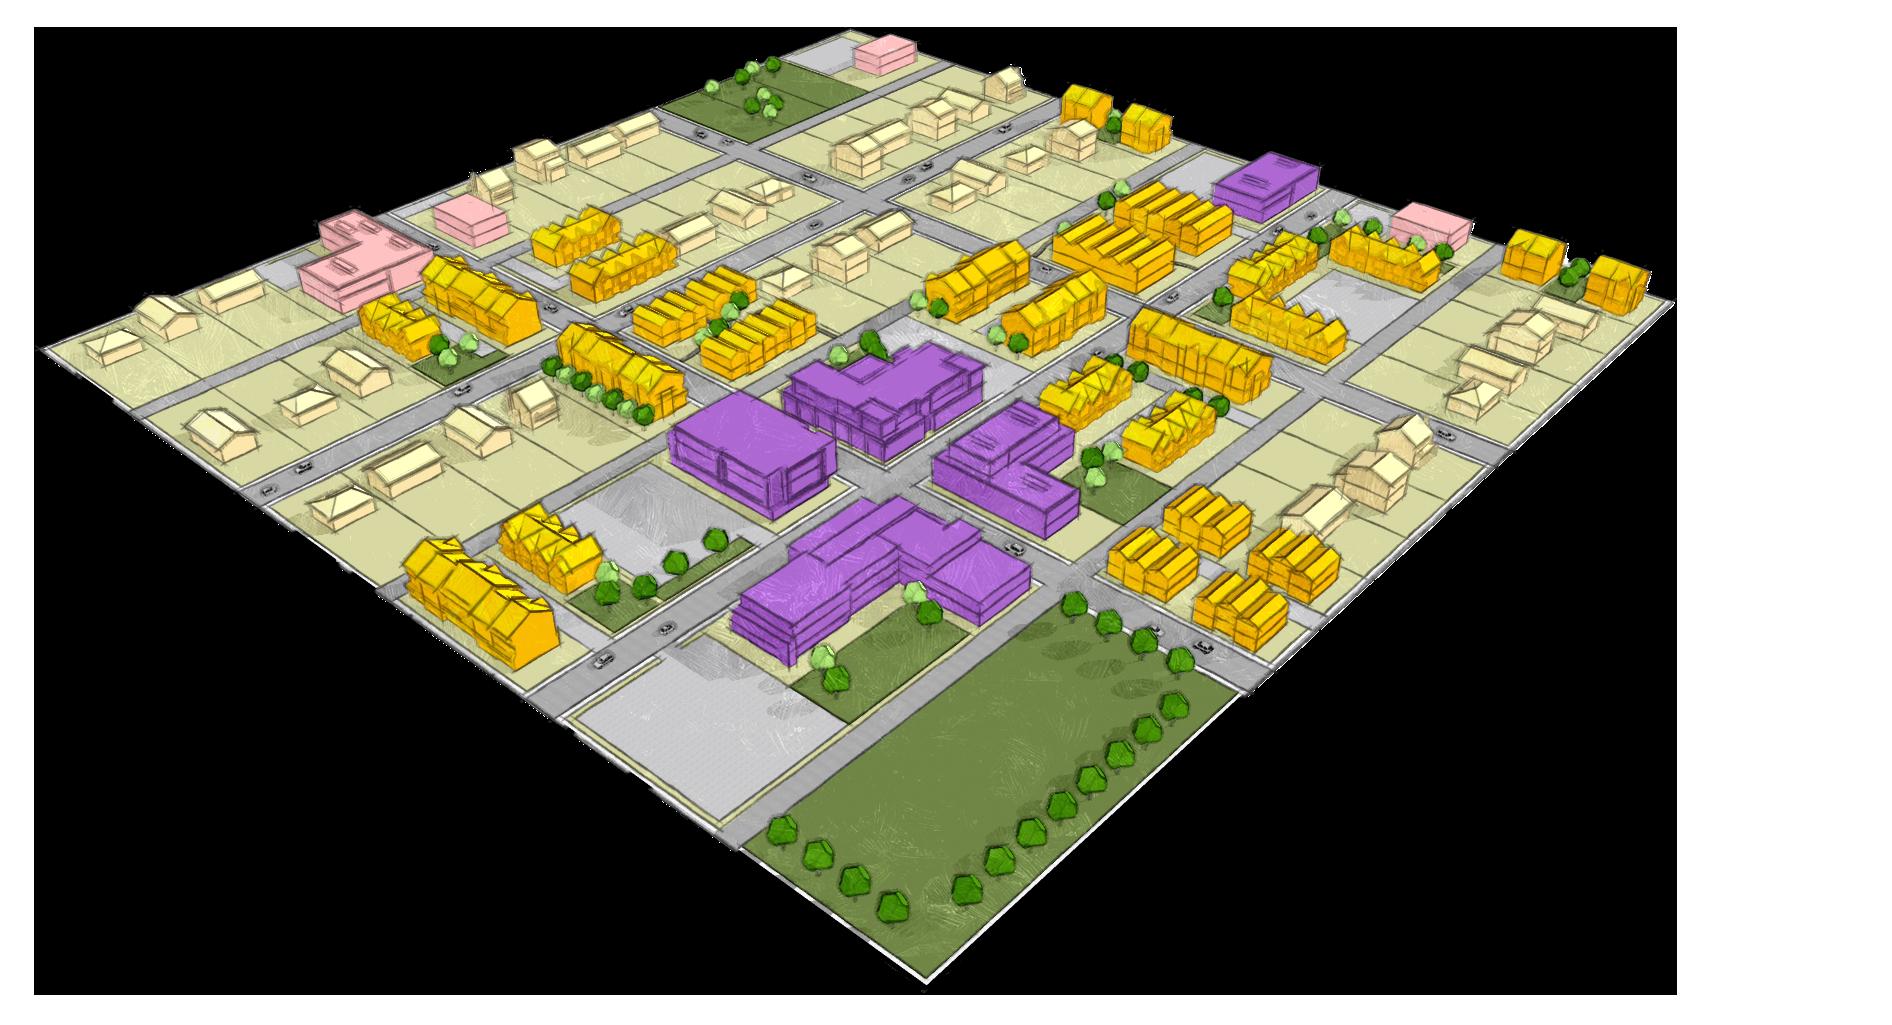
Focus is on introducing diverse housing types, while preserving low-density housing. Higher density multifamily and residential mixed-use to be located along major corridors, near transit hubs, and near or within commercial centers.
Creates distinct mixed-use, commercial, campus, and industrial districts, as well as hubs for concentrated commercial and retail activity or creative arts and innovation. Introduces a variety of residential, retail, hospitality, and office mixeduse nodes that range from locally-serving to regionally serving. Medium-density residential, commercial, and mixed-use development to serve as a buffer from more intense uses.
Parks & Open Space
A neighborhood park and/or elementary school campus is at the center of a square mile section.
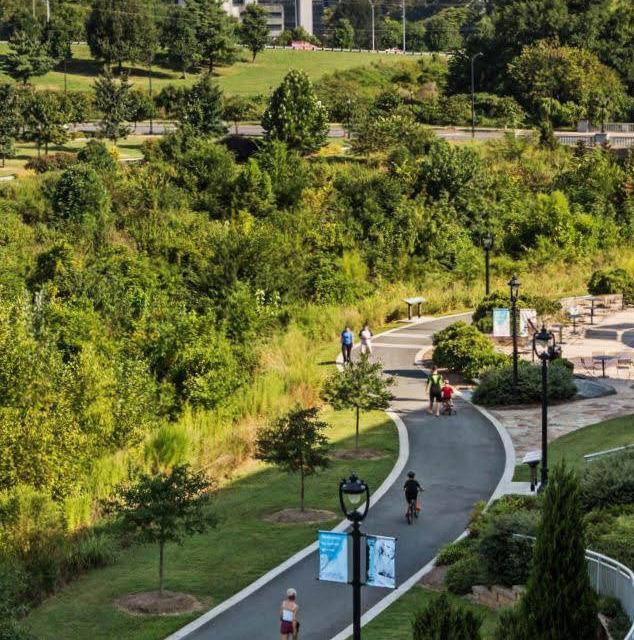
Community parks, public plazas, greenways, and trails will be integrated across districts and neighborhoods and multimodal connectivity will be prioritized.
Economic development will be accommodated and encouraged through careful preservation, cultivation, and formation of distinct mixed use, commercial, campus, and industrial districts. Development and zoning regulations will provide buffered and designated spaces for higher-intensity manufacturing, warehousing, and distribution centers; well-connected and conveniently located facilities for education, health care, and other large institutions; hubs for concentrated commercial and retail activity or creative arts and innovation; and a variety of residential, retail, hospitality, and office mixed-use nodes that range from small-scale and locally-serving to large-scale and regionally serving.
Community parks, public plazas, greenways, and trails will be integrated across districts and neighborhoods and multimodal connectivity will be prioritized. Together, the Complete Neighborhoods Scenario will not only accommodate Amarillo’s anticipated growth over the next 20+ years, but will elevate the quality of life and contribute to Amarillo’s attraction as a great place to do business, live, work, and play.
Land Use & Place Types
The Place Types outlined below represent the range of land uses and development patterns envisioned for Amarillo’s future. They are fundamentally informed by what’s on the ground today – the conditions and characteristics that Amarillo residents know, love, and/or hope will improve – while encouraging new investment and development to elevate and enhance the built environment and natural amenities to create holistic, complete neighborhoods and a dynamic urban system across all of Amarillo.
The following section details each Place Type, including:
• Purpose: a statement about primary purpose, including primary land use(s)
• Intended Densities (housing and jobs)
• Mobility Characteristics
• Neighboring Place Type Relationships & Transitions
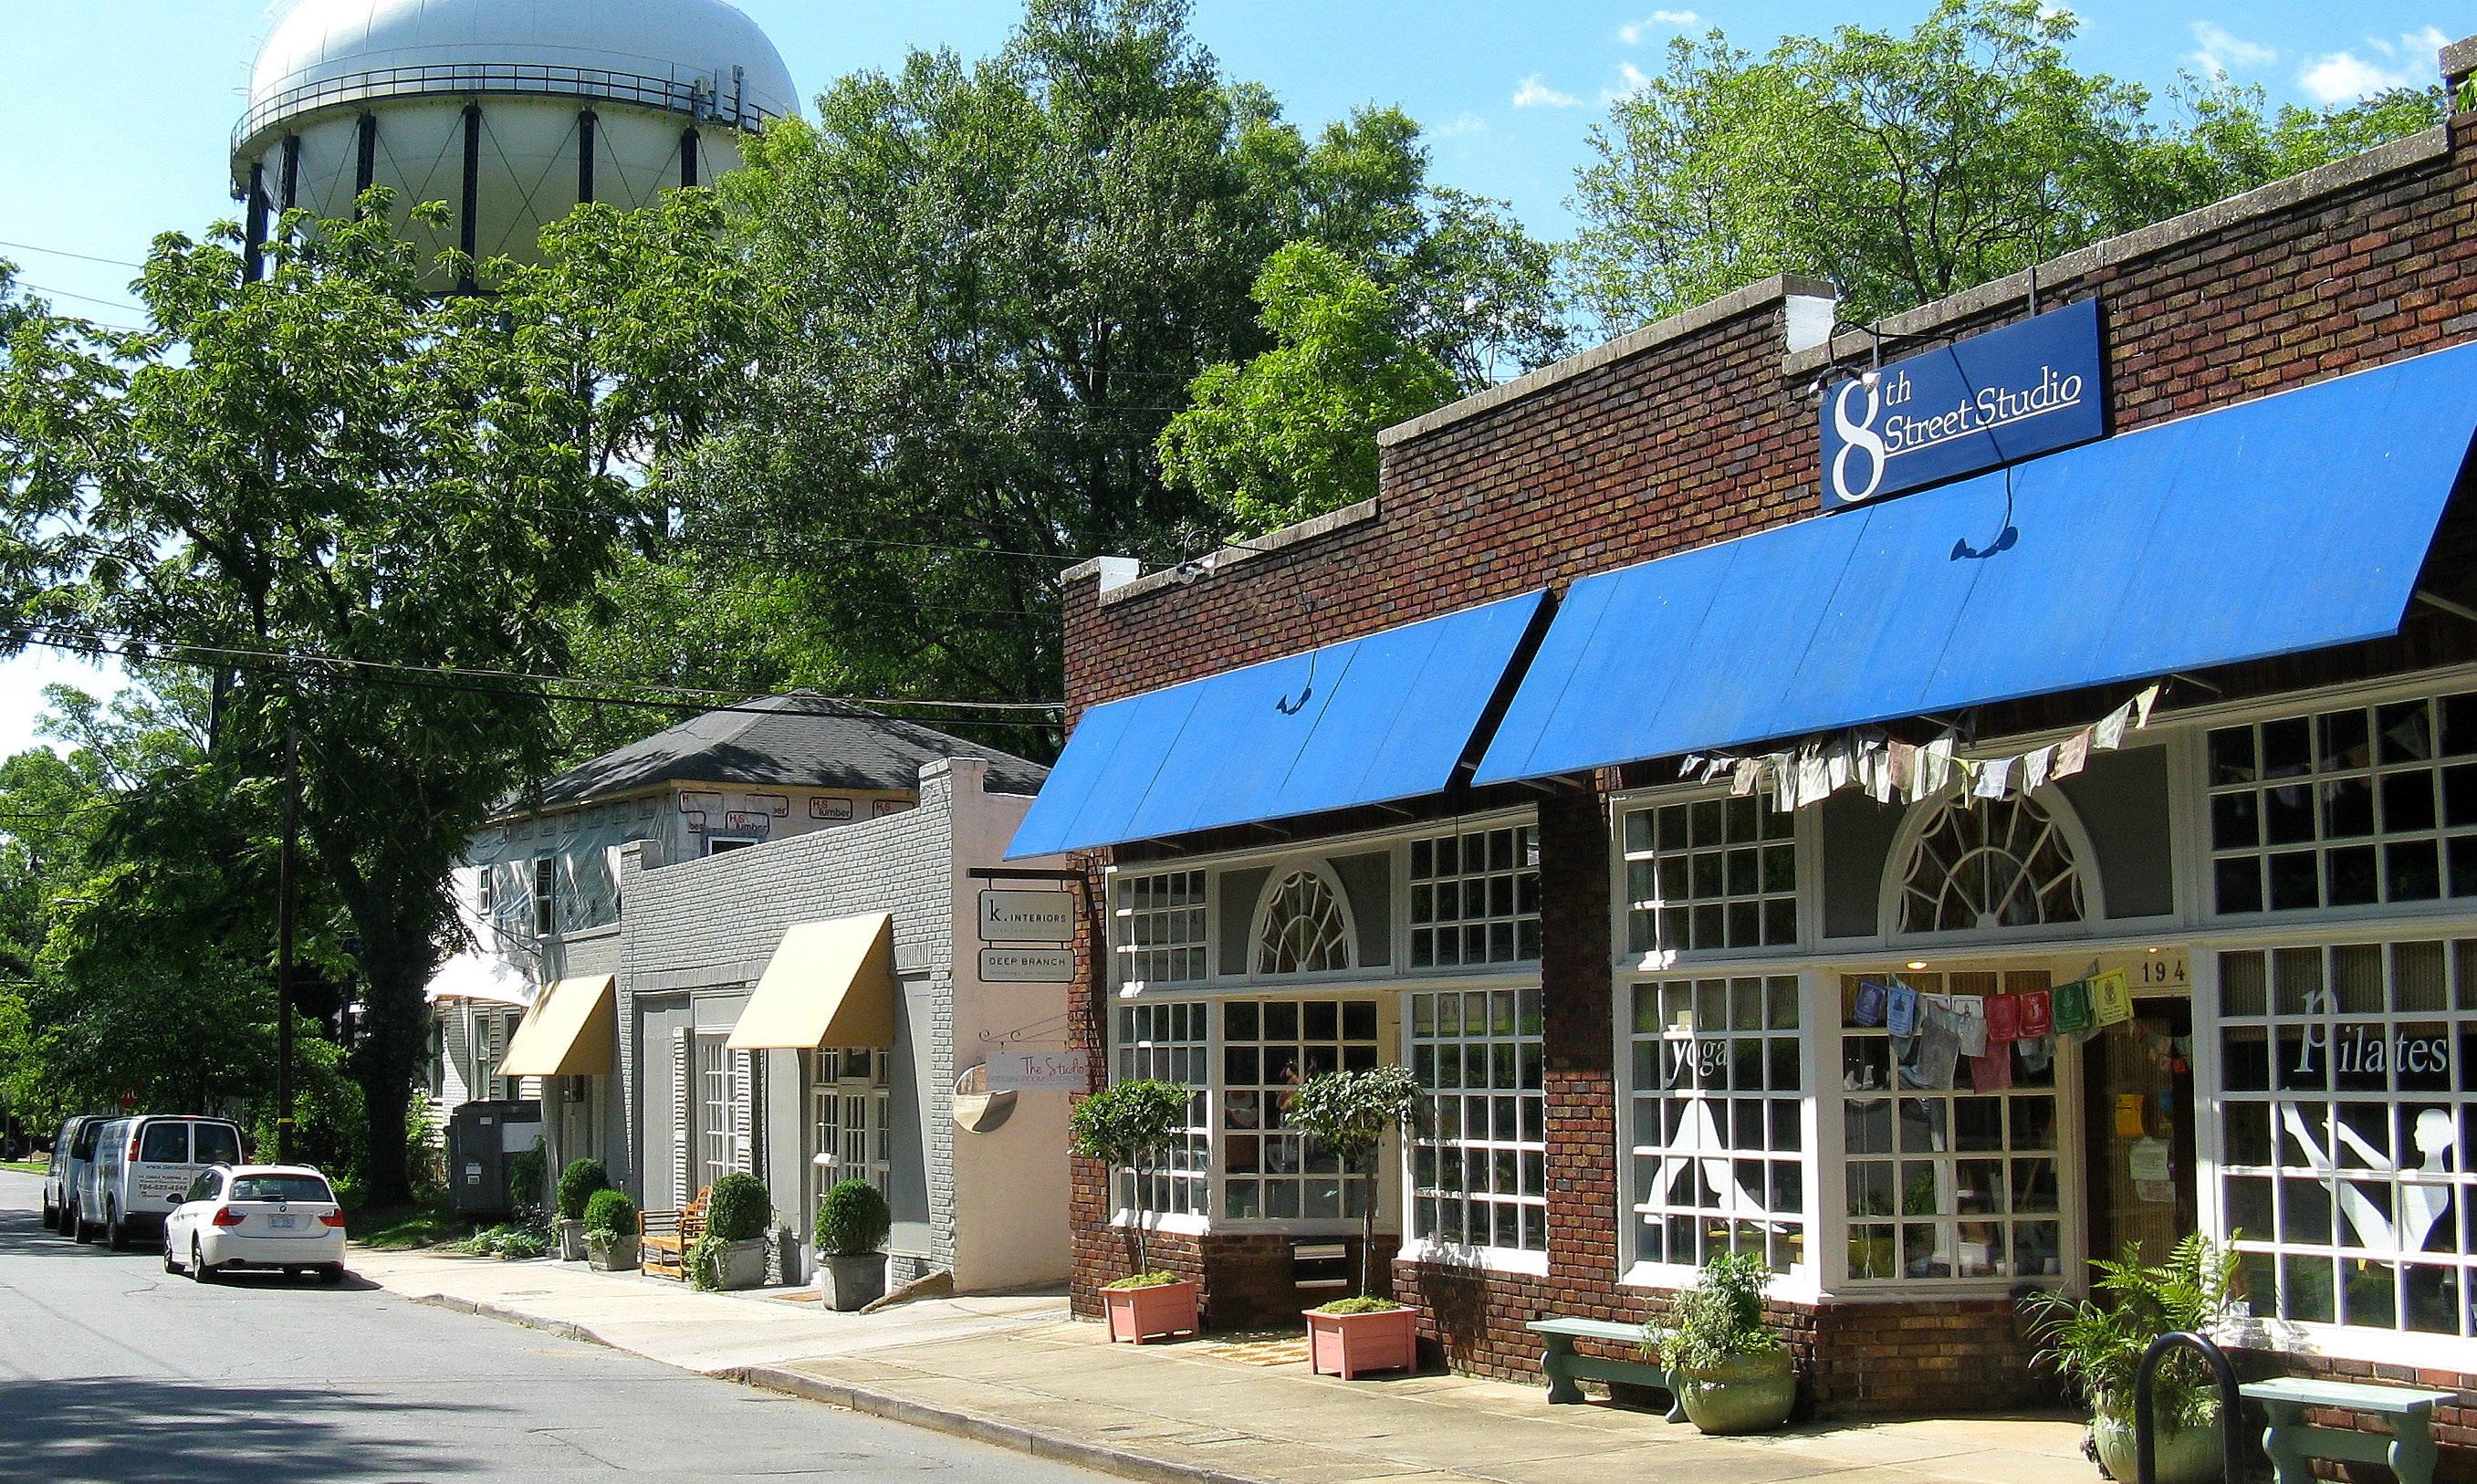
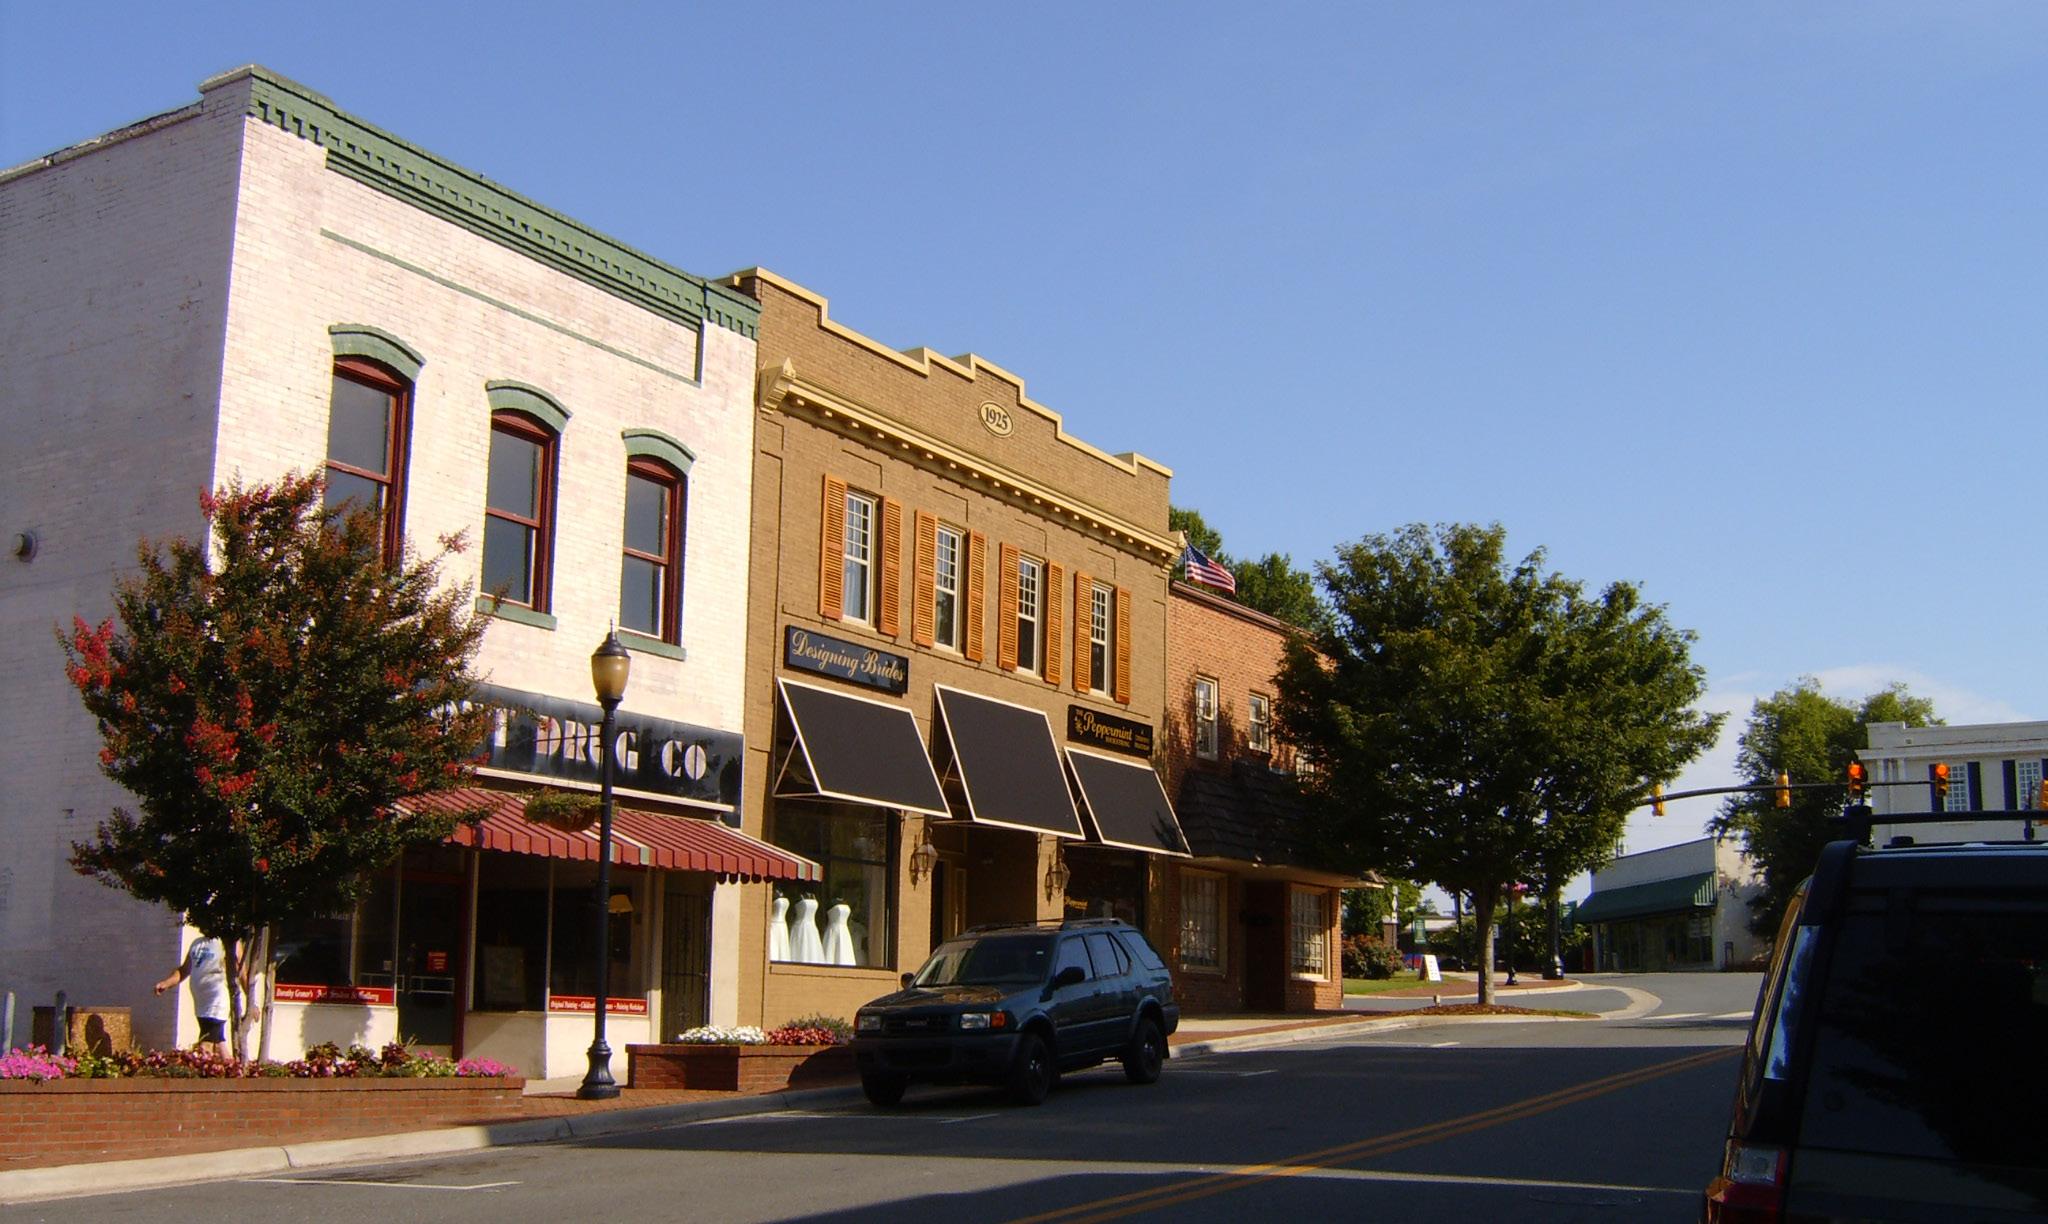
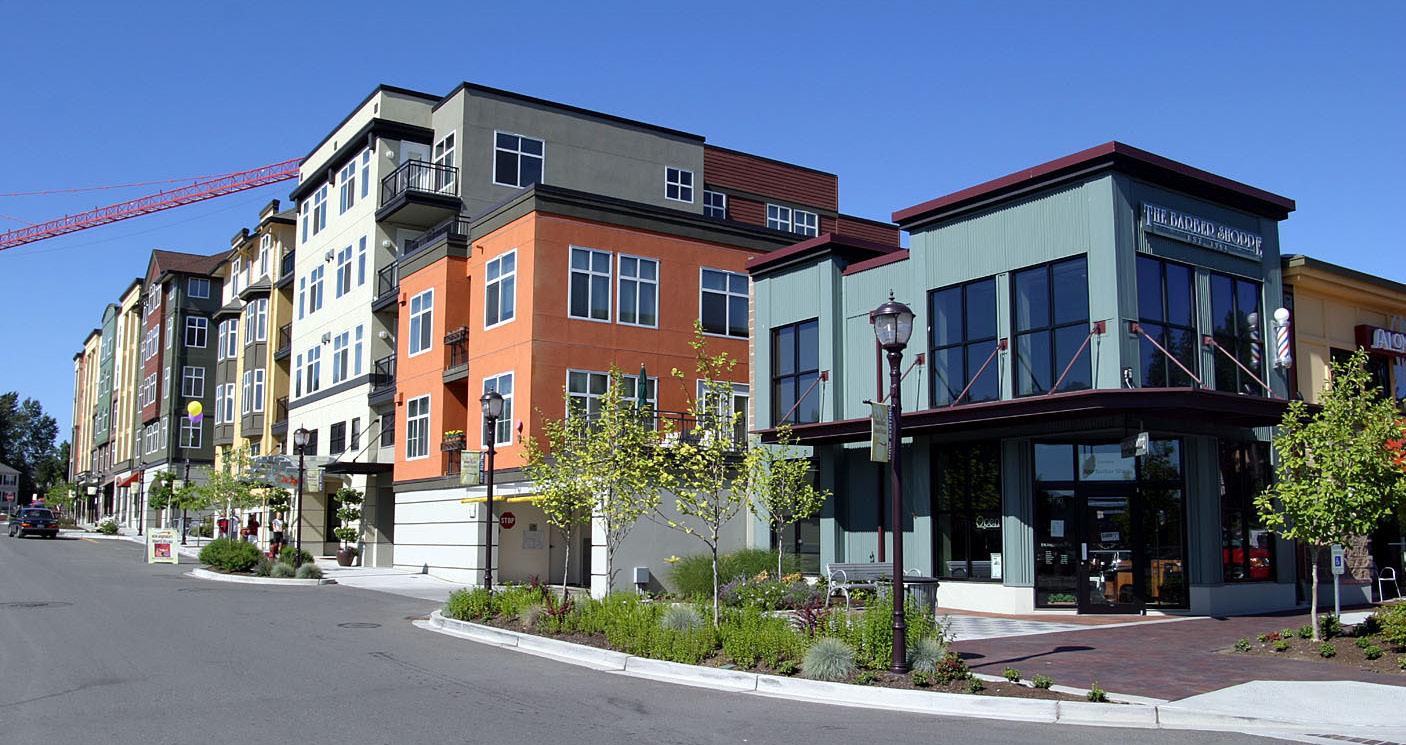
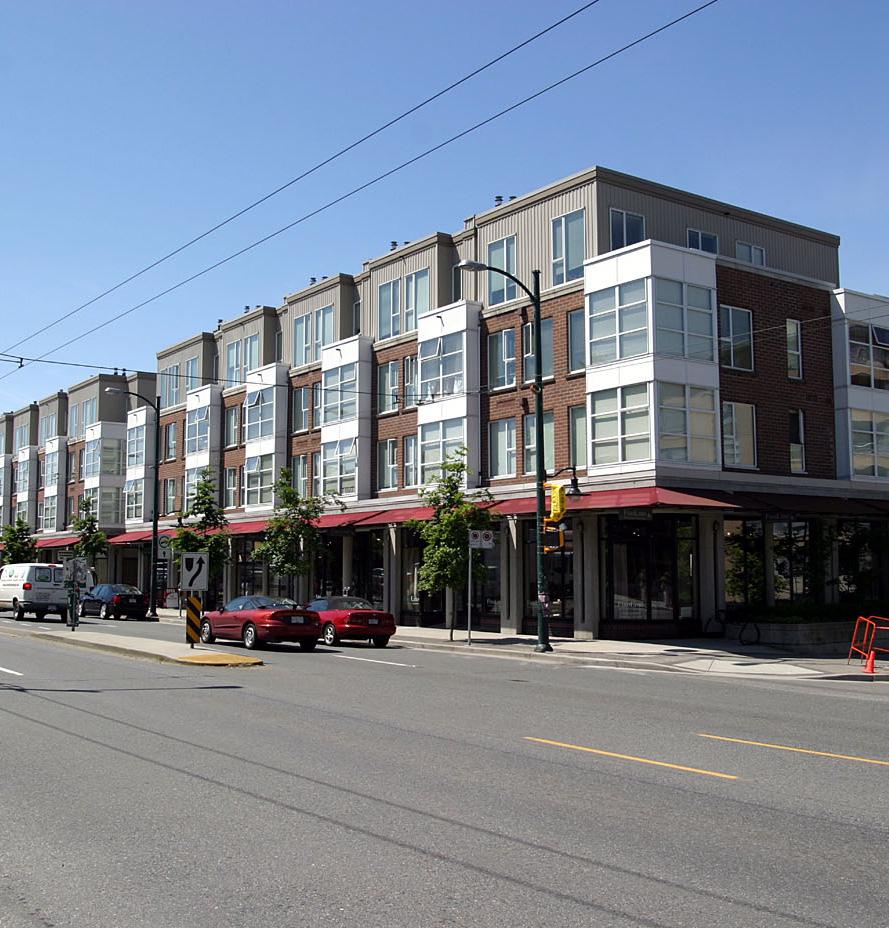
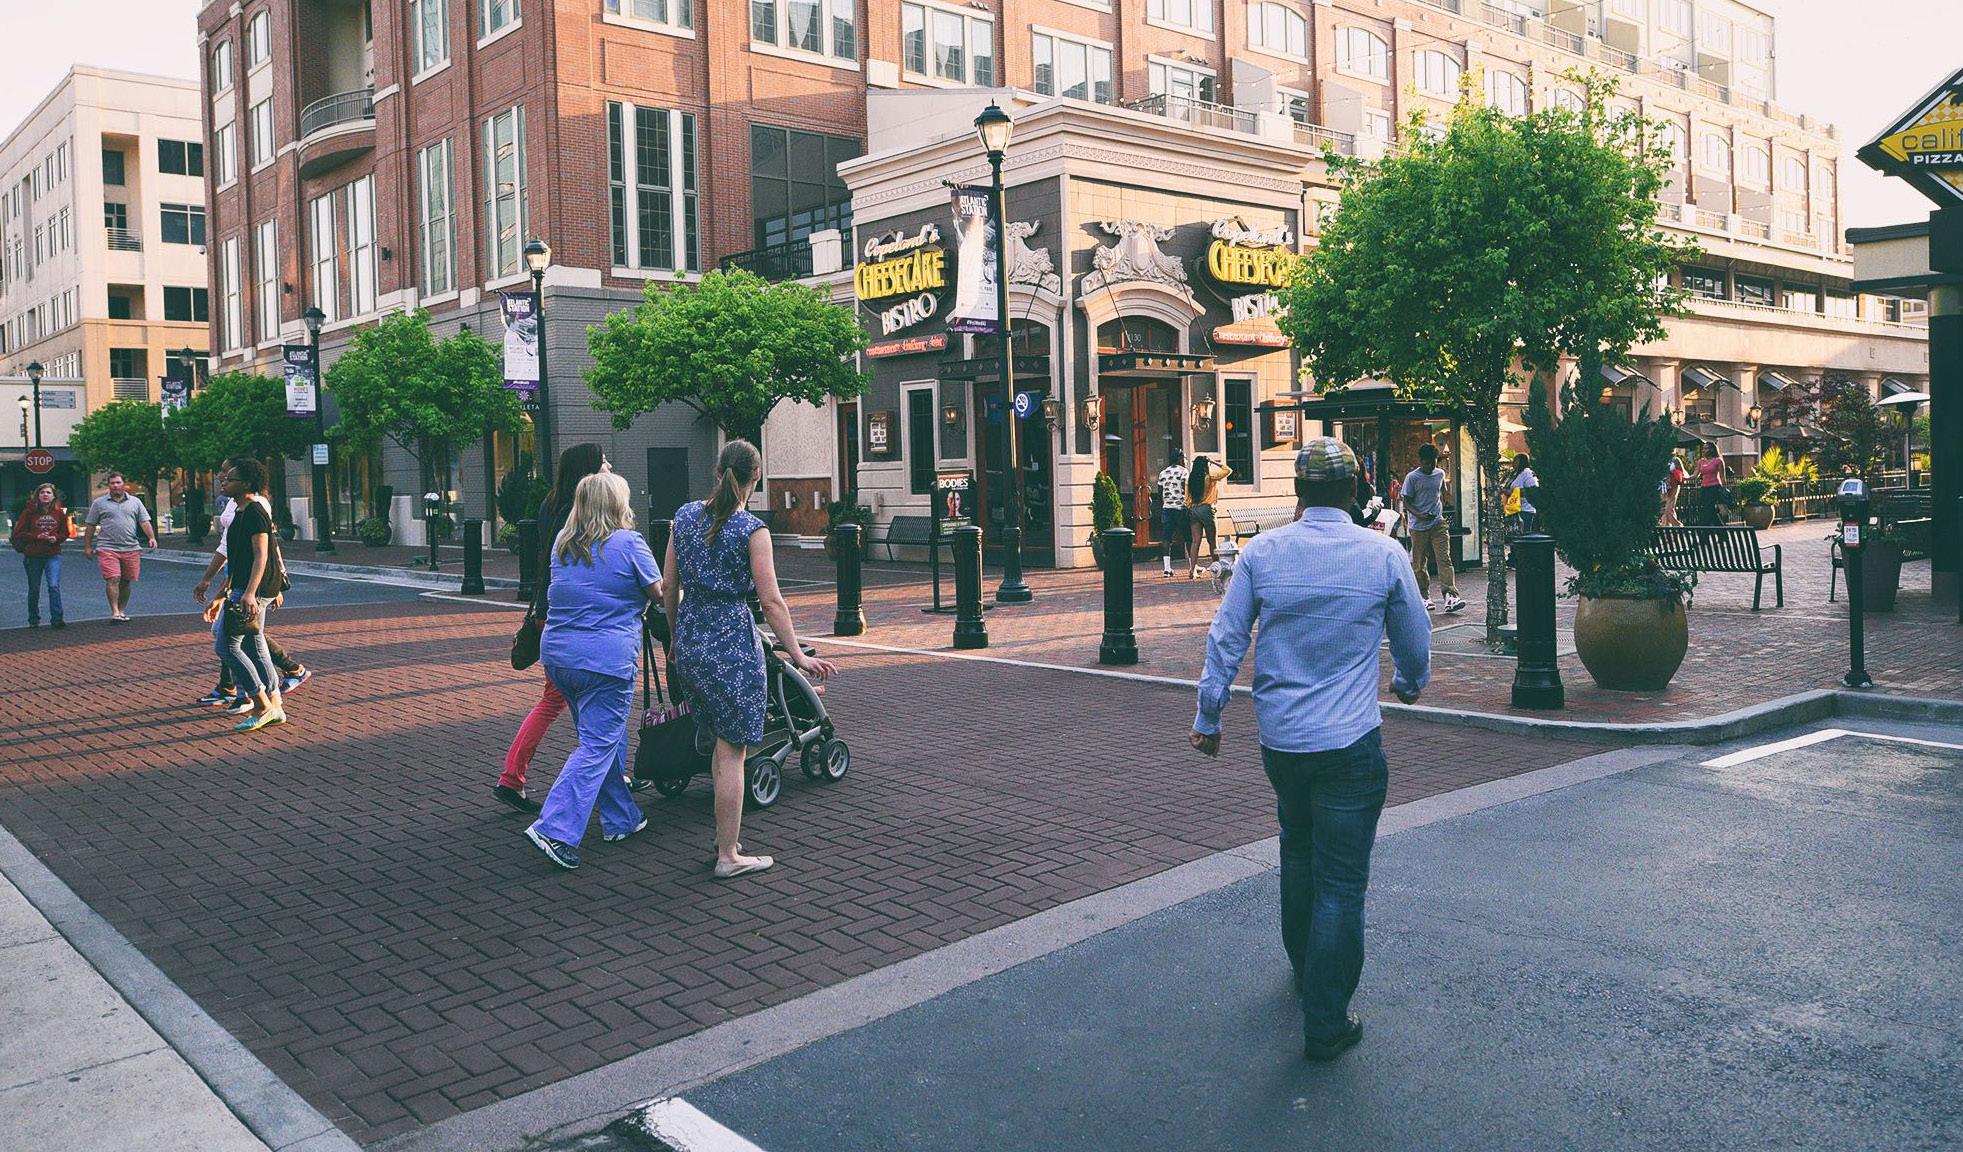
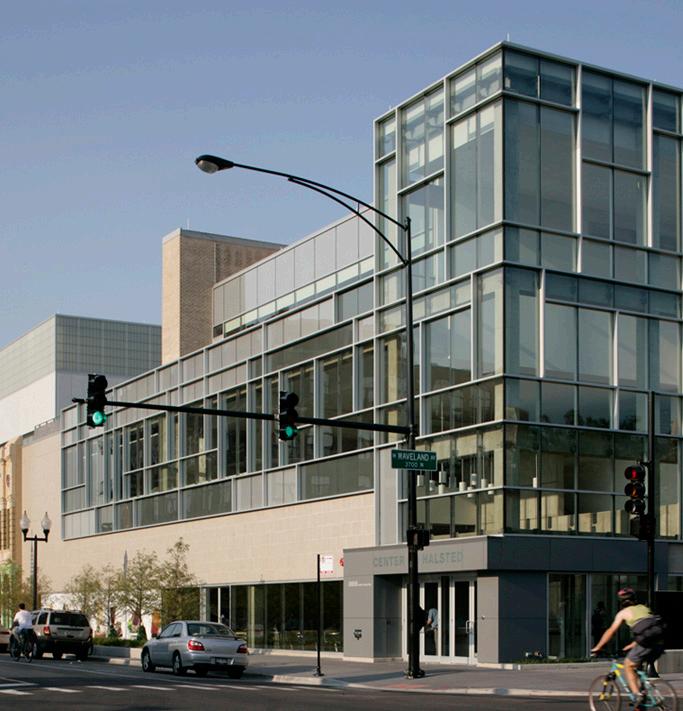
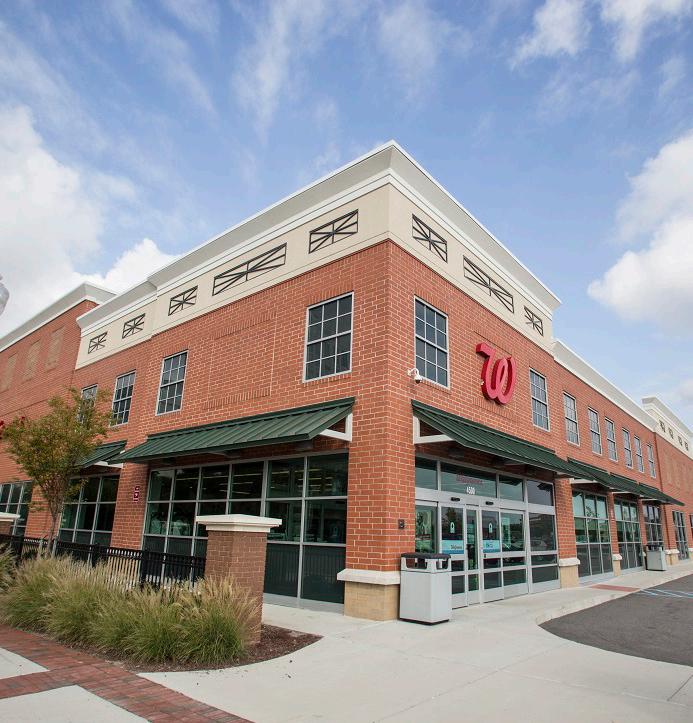
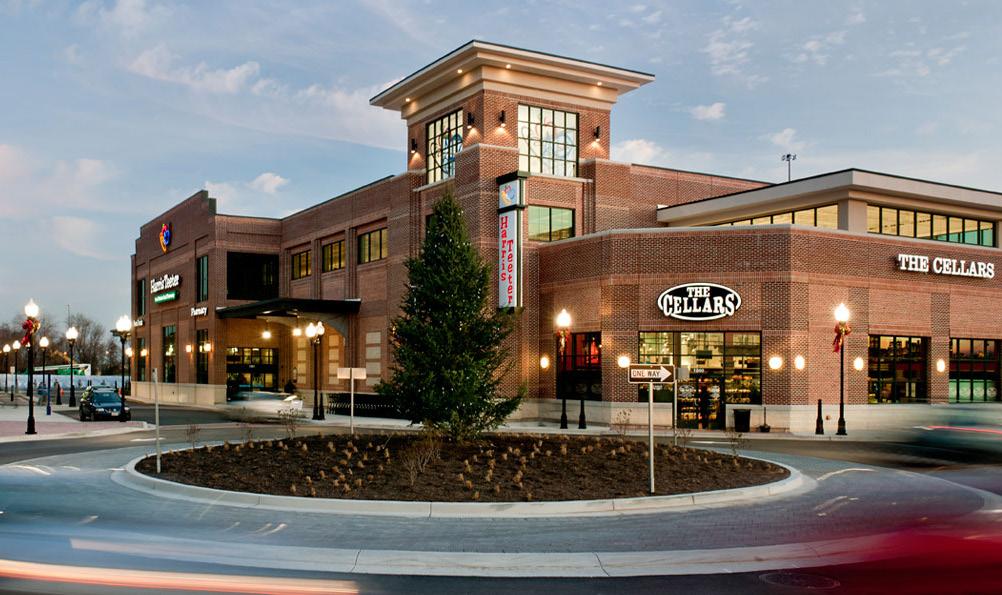
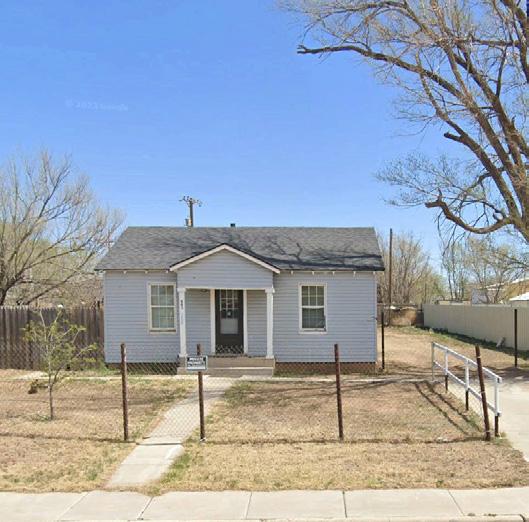
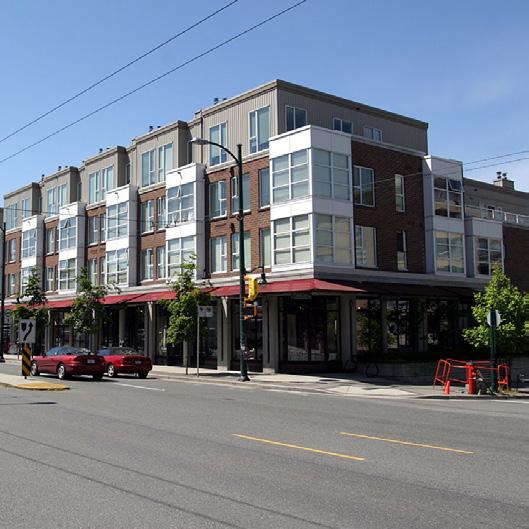
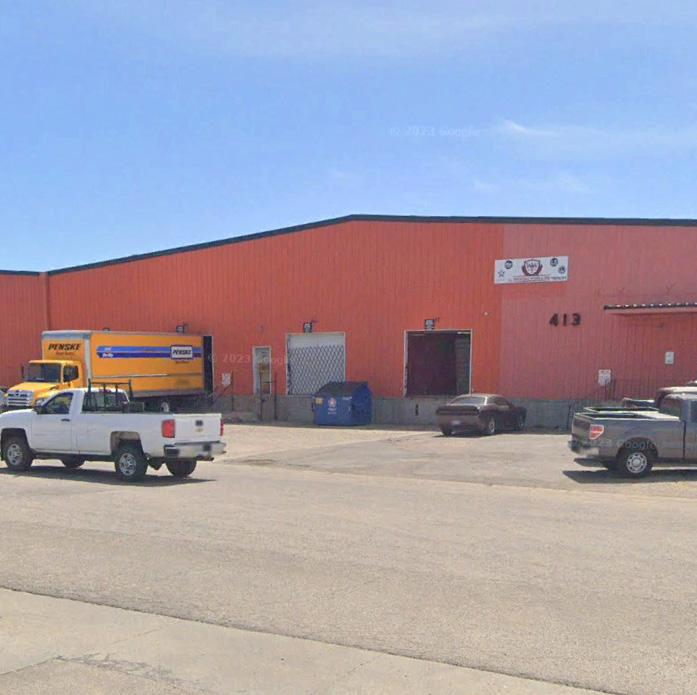
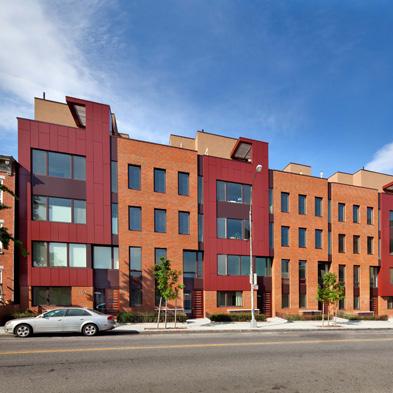
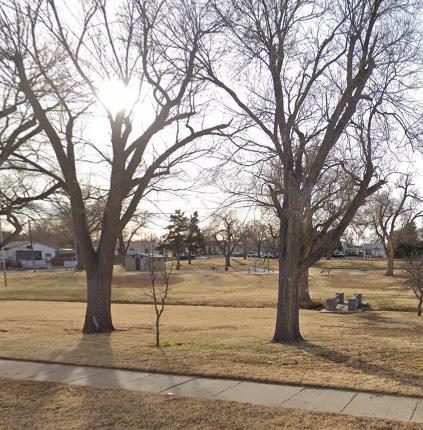
• Existing and precedent imagery to illustrate current and envisioned conditions
HOW WILL CITY PLAN’S COMPLETE NEIGHBORHOODS SCENARIO AFFECT AMARILLOANS?
Through a new vision, best practices, and an incentivized approach, we will work together to improve Amarillo. While City Plan lays the blueprint for an updated vision of future land use and development, the community aspects that Amarilloans know and love will be preserved and implementation will be a collective, inclusive, and voluntary effort. The overarching goal of City Plan is to maximize opportunity while minimizing challenges or negative impacts. Each sector of the community will experience varying outcomes:
Private Sector – Homeowners:
• Majority of homeowners will not experience any change
• In older neighborhoods, property owners may voluntarily change their zoning to protect singlefamily areas
• In new neighborhoods, property owners may see the introduction of new mixed use development with new amenities and enhanced connectivity.
Private Sector – Businesses & Developers:
• Businesses owners and developers will benefit from changes that make redevelopment and infill development easier. In some instances, property owners may voluntarily change their zoning to unlock new development opportunity, such as mixed-use or missing middle housing types.
Public Sector:
• Public infrastructure will be improved by enhanced and redesigned streets, new sidewalks and crosswalks, and improved parks and public spaces
• Policy updates will include revisions to development and land use regulations to align with community values, including broadened and creative opportunities for developers to contribute community amenities, such as parks, plazas, and trails.
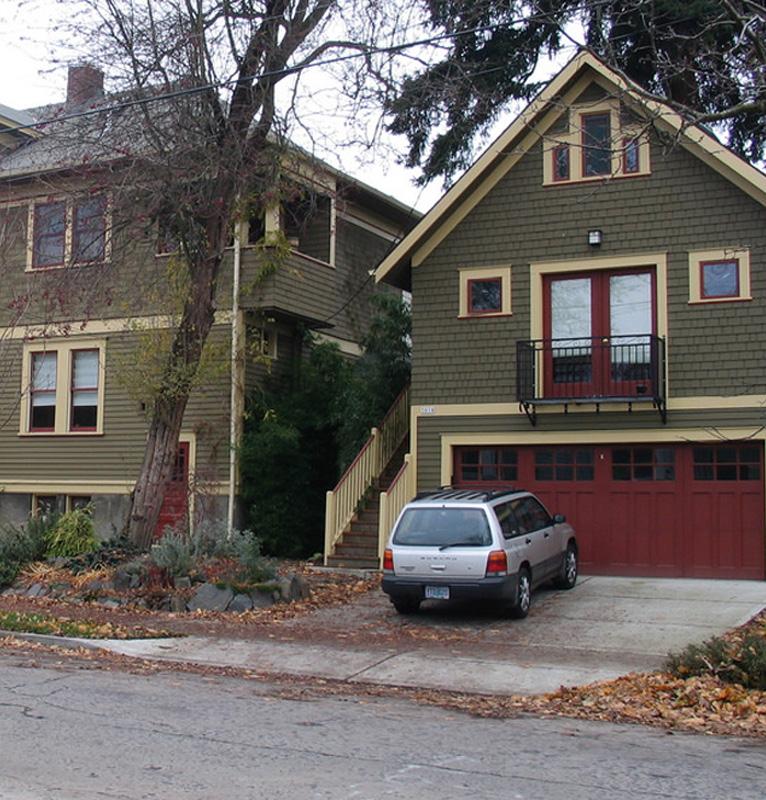
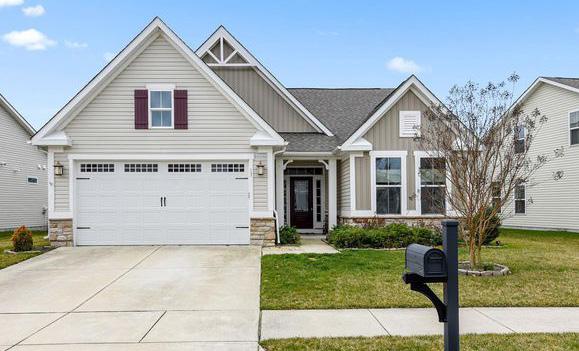
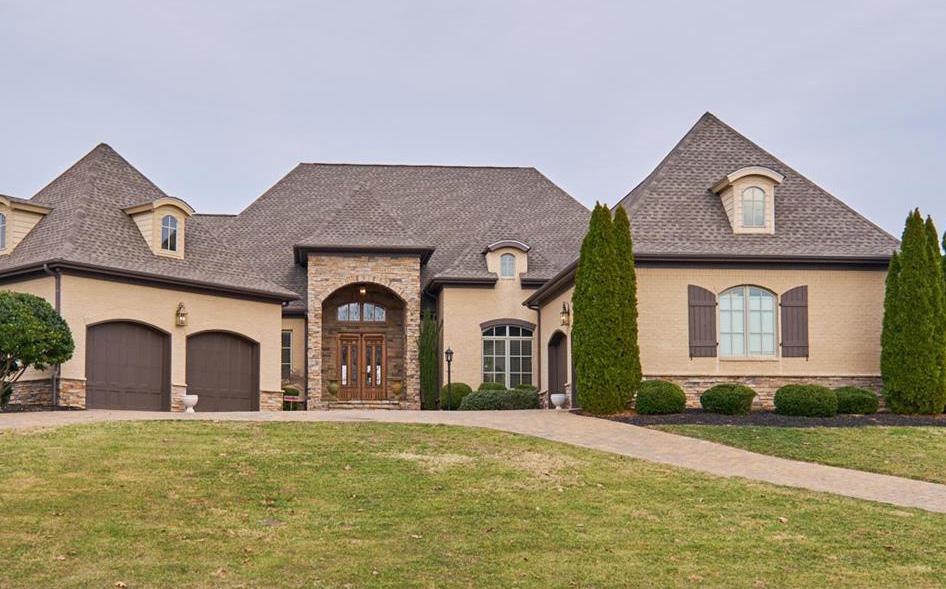
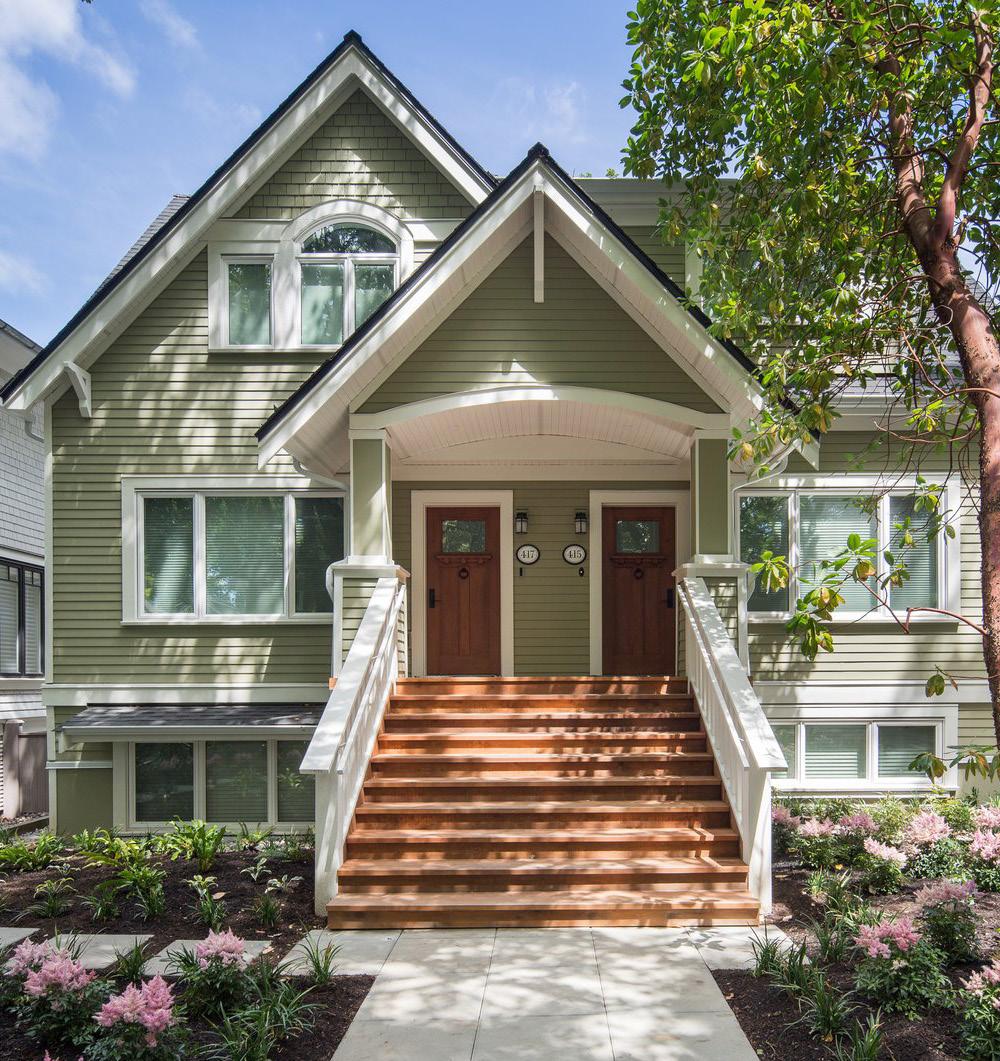
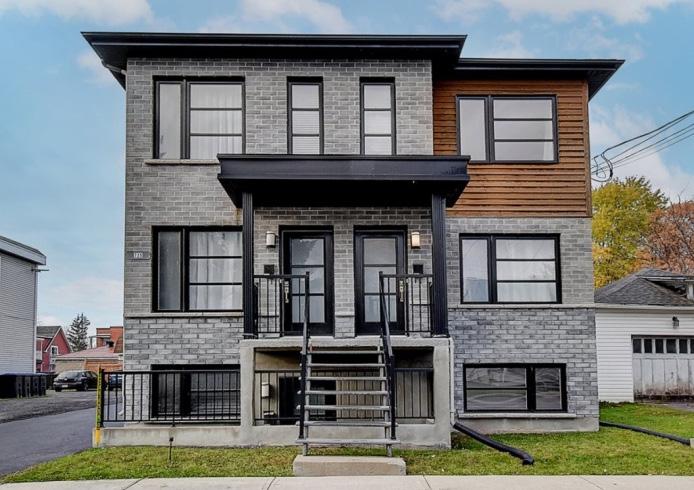
Neighborhood Low (NL)
Purpose
The purpose of the Neighborhood Low Place Type is to recognize neighborhoods of primarily singlefamily detached housing, guide development of new “traditional neighborhoods,” and promote a thoughtful introduction of mixed-income housing types in ways that don’t significantly change current character. These neighborhoods require adequate public facilities and services and shall be consistent with the Complete Neighborhoods concept.
• The primary land use is residential with the most typical development types including detached single-family homes.
• Accessory Dwelling Units (ADUs), parks, greenways, and public facilities or institutional uses may be integrated as secondary uses.
Intended Densities

1-9 dwelling units per acre

<0.5 job per acre
Mobility Characteristics
The road network supports lower traffic volumes, primarily composed of local streets. Sidewalks and/ or multi-use pathways provide comfort and access for pedestrians, and streets are safely shared between cars and cyclists. Transit connections are typically available at the periphery. Parking is primarily accommodated by private driveways and garages, while on-street parking is available for visitors.
Neighborhood Relationships & Transitions
Most Neighborhood Low areas will abut Neighborhood Medium, Parks & Open Space, or Neighborhood Mixed Use Place Types. Strategic transitions and buffers may include parks and public spaces, public facilities, or gradual changes in density.
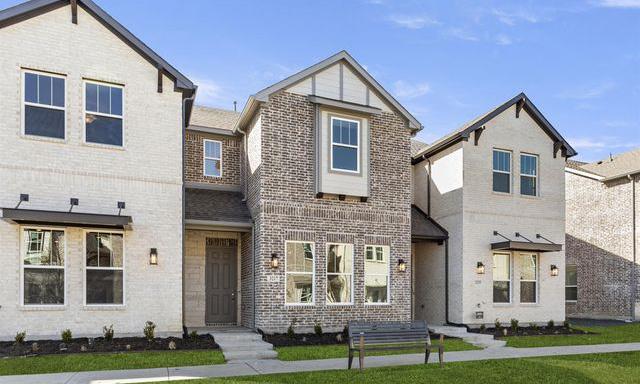
Neighborhood Medium (NM)
Purpose
The purpose of the Neighborhood Medium Place Type is to recognize existing neighborhoods which include a mix of housing types, including market-rate, workforce, and affordable1 options as well as both rental and ownership. New development shall be consistent with and advance the Complete Neighborhoods concept, to guide the development of new medium density neighborhoods that are better connected to amenities, goods, and services.
• The primary land use is residential, with typical development types including detached and attached single-family homes; tiny house communities; townhomes; duplexes, triplexes, and fourplexes; livework units; small-scale multifamily (5-20 units); and ADUs.
• Neighborhood-serving commercial, parks, public plazas, greenways, and public facilities or institutional uses may be integrated as secondary uses.
Intended Densities
16-22 dwelling units per acre
0.5 job per acre
Mobility Characteristics
The road network supports medium traffic volumes, primarily composed of collector and local streets. Sidewalks and/or multi-use pathways provide comfort and access for pedestrians, and local streets are safely shared between cars and cyclists while busier streets have dedicated bike facilities, such as separated bike lanes. Transit connections are typically available on busier collector roads and at the periphery. Parking is accommodated by private driveways and garages, small off-street surface lots or structured facilities, and on-street parking.
Neighborhood Relationships & Transitions
Most Neighborhood Medium areas will abut Neighborhood Low, Parks & Open Space, Neighborhood Mixed Use, or Community Mixed Use Place Types. Strategic transitions and buffers may include parks and public spaces, public facilities, or gradual changes in density.
1 Market-rate housing is that which occurs naturally in the housing market; affordable and workforce housing both refer to subsidized, incomerestricted housing. See Glossary for definitions.
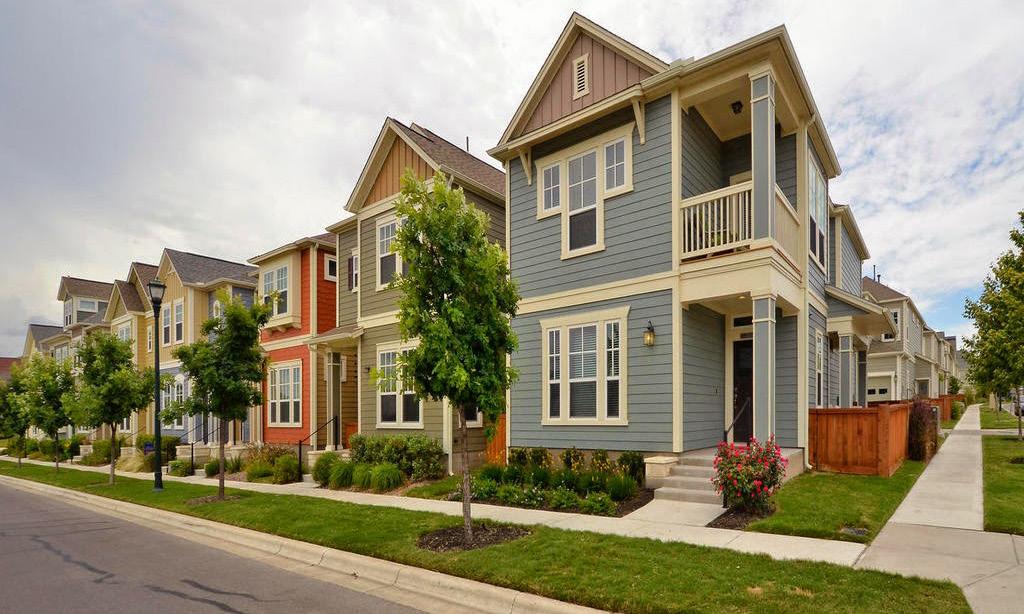
Neighborhood High (NH)
Purpose
The purpose of the Neighborhood High Place Type is to guide the development of moderate to higher intensity housing types, with multi-family development being the primary use. Development should include marketrate, workforce, and affordable2 options as well as both rental and ownership. These neighborhoods may serve as a transition between lower intensity Neighborhood Districts and Non-Residential Centers. NH areas support live-work-play environments, as well as higher cost transportation facilities to connect residents to jobs and services.
• The primary land use is residential, with typical development types including townhomes; duplexes, triplexes, and fourplexes; live-work units; Tiny House communities; mid- to- high-scale multifamily (10+ units); and attached single-family homes.
• Parks, public plazas, greenways, public facilities, institutional uses, and mixed-use may be integrated as secondary uses.
Intended Densities
20-50 dwelling units per acre
2 jobs per acre
Mobility Characteristics
The road network supports higher traffic volumes, comprised of local, collector, and arterial streets. Sidewalks and/or multi-use pathways provide a high level of comfort for pedestrians, and all streets have dedicated bike facilities, such as separated bike lanes. Transit connections are typically available at mobility hubs dispersed across these neighborhoods along collectors and arterials. Parking is primarily accommodated by structured facilities, small, dispersed off-street lots, private driveways and garages, and on-street parking.
Neighborhood Relationships & Transitions
Most Neighborhood High areas will abut Neighborhood Medium, Neighborhood Mixed Use, Community Mixed Use, Regional Mixed Use, Commercial, or Campus Place Types. Strategic transitions and buffers may include parks and public spaces, public facilities, transit hubs, gradual changes in density, or integration of supportive mixed-use development.
2 Market-rate housing is that which occurs naturally in the housing market; affordable and workforce housing both refer to subsidized, incomerestricted housing. See Glossary for definitions.
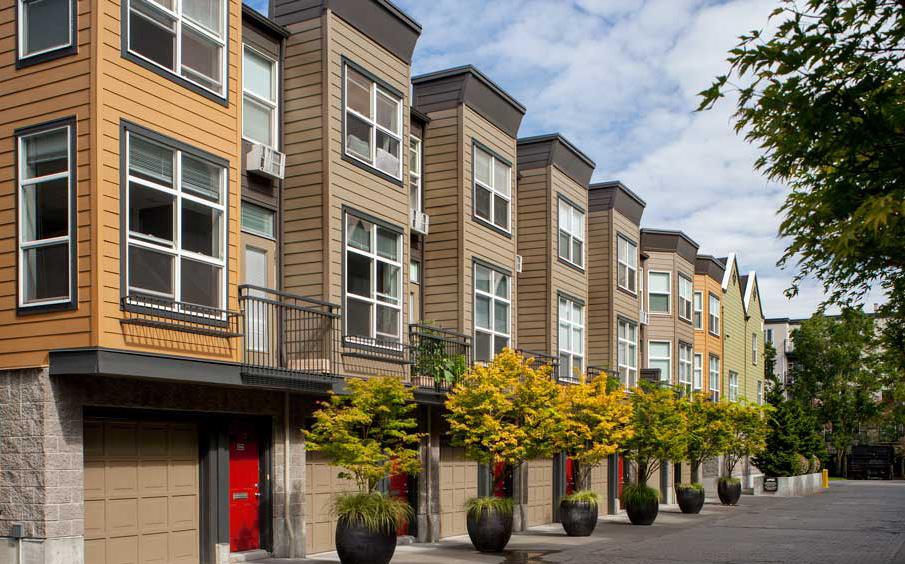
Neighborhood Mixed Use (NMU)
Purpose
The purpose of the Neighborhood Mixed Use Place Type is to provide neighborhood-serving activity and an appropriate transition between mixed-use/non-residential Place Types and residential Place Types.
• These areas are characterized by a mix of residential uses and lower density retail, office, and/or service uses; primary development types include small scale storefront and office buildings; vertical mixed-use with ground floor commercial and residential upper floors; live-work units; small- to- mid-scale multifamily (5-20 units); and attached single-family homes.
• Parks, public plazas, greenways, public facilities, and institutional uses may be integrated as secondary uses.
Intended Densities
9-22 dwelling units per acre
25 jobs per acre
Mobility Characteristics
The road network supports medium traffic volumes, comprised primarily of local and collector streets, although busier arterials may also be present. Sidewalks and/ or multi-use pathways provide a high level of comfort for pedestrians, and local streets are safely shared between cars and cyclists while busier streets have dedicated bike facilities, such as separated bike lanes. Transit connections are typically available on busier collector roads and at the periphery. Parking is primarily accommodated by on-street parking, small, dispersed off-street surface lots, and private driveways or garages.
Neighborhood Relationships & Transitions
Most Neighborhood Mixed Use areas will abut Neighborhood Low, Neighborhood Medium, Neighborhood High, Community Mixed Use, Regional Mixed Use, Commercial, or Campus Place Types. Strategic transitions and buffers may include parks and public spaces, public facilities, or gradual changes in density. Transitions should generally be achieved through both use and built form, with low heights and moderate massing.

Community Mixed Use (CMU)
Purpose
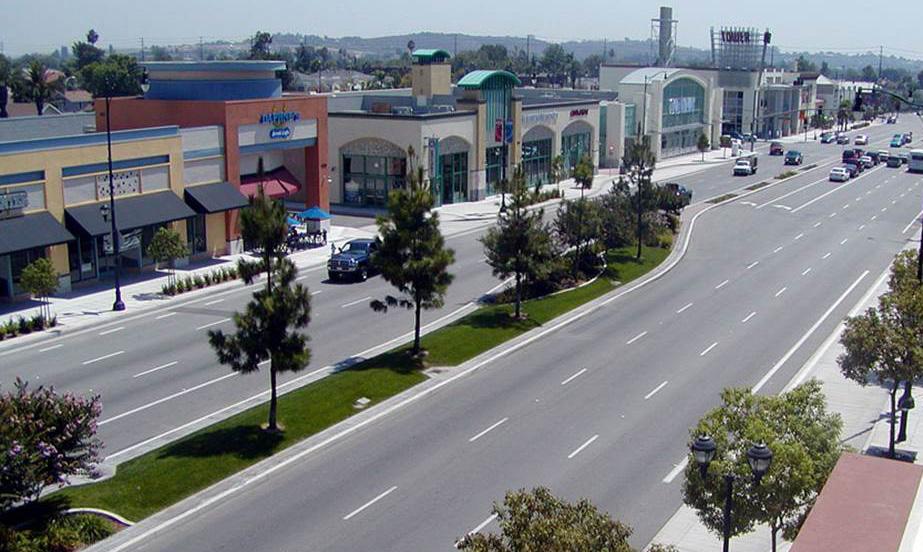
The purpose of the Community Mixed Use Place Type is to provide concentrated areas of activity and services, offering convenient access for multiple neighborhoods at high visibility locations. These areas serve as community centers, providing jobs, access to daily needs, and a safe, enjoyable experience for residents, employees, and visitors alike. CMU areas should be distributed throughout the city, primarily along corridors or major intersections.
• These areas are characterized by a mix of moderate density residential, retail, office, civic, institutional, and/or service uses; primary development types include small- to- mid-size storefront, commercial services, and/or office buildings; vertical mixed-use with ground floor commercial and residential or office above; livework units; mid-scale multifamily (10-20 units); and attached single-family homes.
• Parks, public plazas, greenways, public facilities, and institutional uses may also be integrated as secondary uses.
Intended Densities
13-36 dwelling units per acre
50 jobs per acre
Mobility Characteristics
Community Mixed Use areas are typically found along busier thoroughfares (collectors and arterials) or at central intersections – thus supporting higher traffic volumes. Sidewalks and/or multi-use pathways provide a high level of comfort and highly visible connectivity for pedestrians. Selected streets within and connecting to CMU areas offer dedicated bike facilities, such as protected bike lanes. Transit connections are typically embedded within or at the edge of CMU areas (mobility hubs). Parking is primarily accommodated through onstreet parking, small off-street surface lots that maximize opportunity for shared parking operations, and private driveways or garages.
Neighborhood Relationships & Transitions
Most Community Mixed Use areas will abut Neighborhood Medium, Neighborhood High, Neighborhood Mixed Use, Regional Mixed Use, Commercial, or Campus Place Types. Strategic transitions and buffers may include parks and public spaces, public facilities, transit hubs, or gradual changes in density. Transitions should generally be achieved in the form of both use and built form, with moderate heights and massing.
Regional Mixed Use (RMU)
Purpose
The purpose of the Regional Mixed Use Place Type is to provide concentrated areas of activity and services, offering convenient access for multiple neighborhoods and the city as a whole at high visibility locations. These areas serve as larger community centers, providing jobs, access to daily needs and entertainment, and a safe, enjoyable experience for residents, employees, and visitors alike.
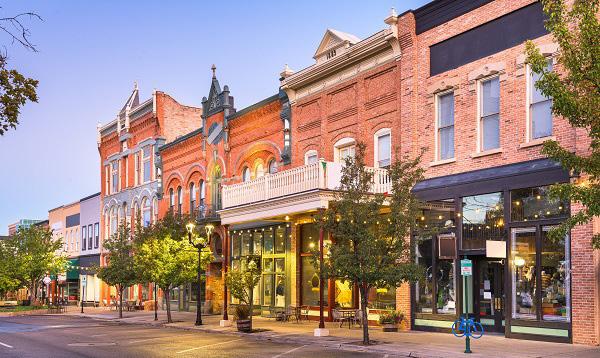
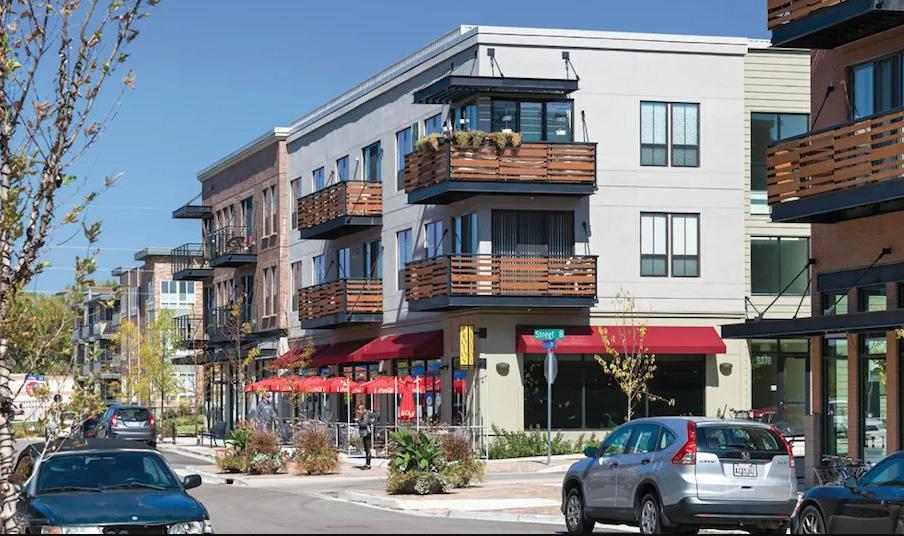
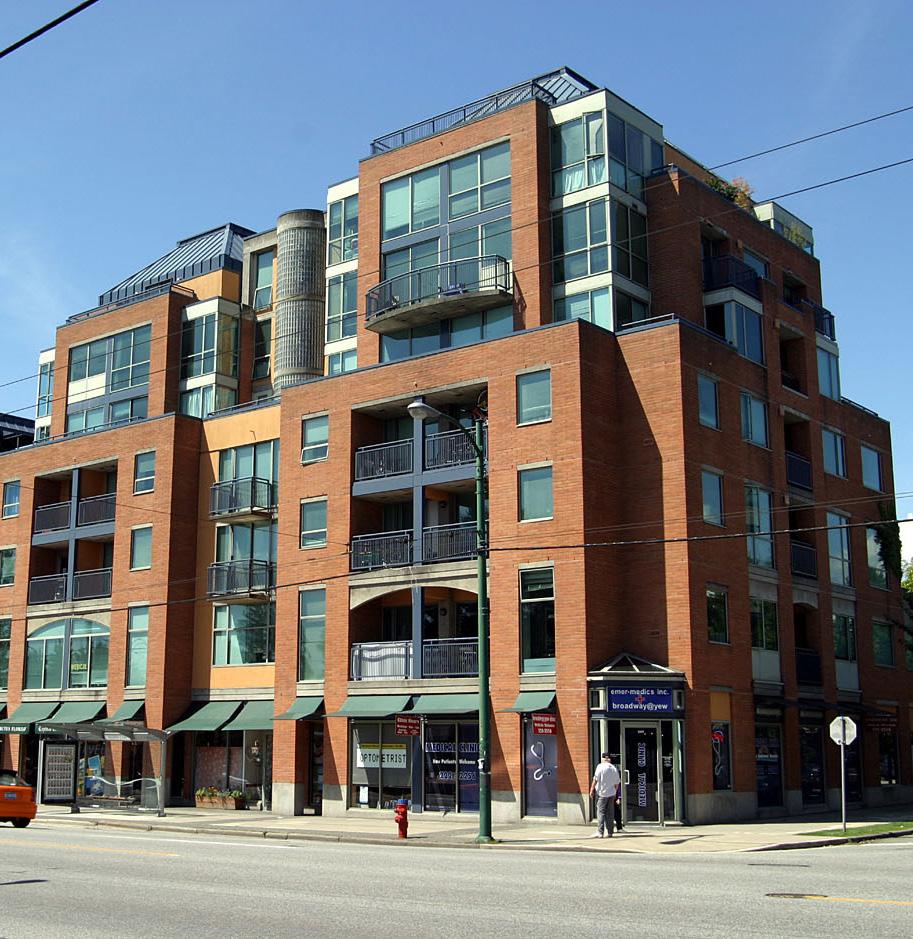
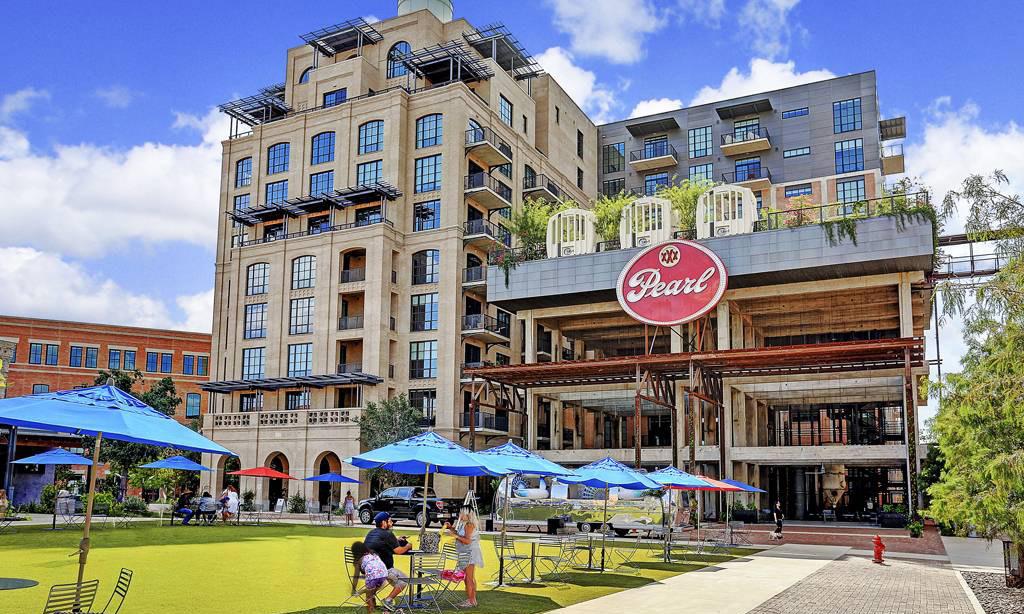
• These areas are characterized by a higher density mix of commercial and residential uses in a well-connected and walkable place. Minimal setback requirements create or support an existing urban built form and activated “main street” feel. Primary development types include mid- to- highsize storefront, commercial services, and/or office buildings; vertical mixed-use with ground floor commercial and residential or office above; hospitality establishments; live-work units; and mid- to- high-scale multifamily (20+ units).
• Parks, public plazas, greenways, public facilities, institutional uses; and townhomes may also be integrated as secondary uses.
Intended Densities
20-50 dwelling units per acre
75 jobs per acre
Mobility Characteristics
The road network supports higher traffic volumes, comprised of local, collector, and arterials streets. Sidewalks and/or multi-use pathways provide a high level of comfort and highly visible connectivity for pedestrians. Selected streets within and connecting to RMU areas offer dedicated bike facilities, such as protected bike lanes. Transit connections are embedded within RMU areas (mobility hubs). Parking is primarily accommodated through off-street structured facilities, dispersed surface lots that are well landscaped and maximize opportunity for shared parking operations, and on-street parking.
Neighborhood Relationships & Transitions
Most Regional Mixed Use areas will abut Neighborhood High, Neighborhood Mixed Use, Commercial, Campus, or Innovation Place Types. Strategic transitions and buffers may include parks and public spaces, public facilities, transit hubs, or changes in density.

Commercial (CM)
Purpose
The purpose of the Commercial Place Type is to facilitate a range of retail and employment spaces that are well connected to each other and to surrounding development. CM areas may be either lower density and more auto-oriented or higher intensity and more urban.
• As implied in the name, the primary land use is commercial, with typical development types including mid- to- high-scale retail and service storefronts and office buildings.
• Parks, public plazas, greenways, hospitality establishments, or vertical mixed-use may also be integrated as secondary uses.
Intended Densities
0 dwelling units per acre
40 jobs per acre
Mobility Characteristics
The road network supports medium traffic volumes, primarily comprised of collector and local streets. Sidewalks and/or multi-use pathways provide comfort and connectivity for pedestrians. Select collector streets within and connecting to CM areas offer dedicated bike facilities, such as protected bike lanes, while cars and cyclists safely share local roads. Transit connections are typically available on busier collector roads or at the periphery. Parking is accommodated by structured facilities, dispersed surface lots that are well-landscaped and maximize shared parking operations, and on-street parking.
Neighborhood Relationships & Transitions
Most Commercial areas will abut Neighborhood Medium, Neighborhood High, Neighborhood Mixed Use, Regional Mixed Use, Campus, or Innovation Place Types. Strategic transitions and buffers may include parks and public spaces, public facilities, transit hubs, or gradual changes in density.
Campus (CP)
Purpose
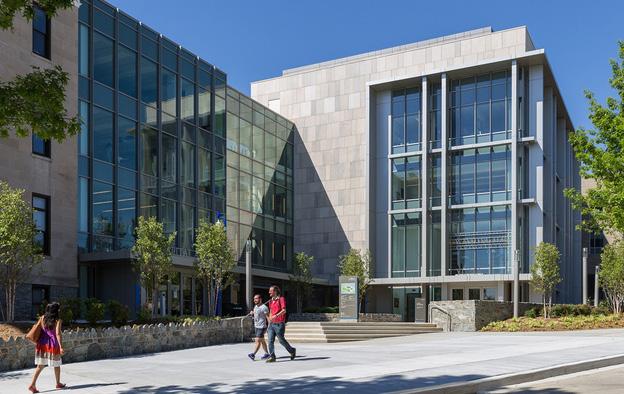
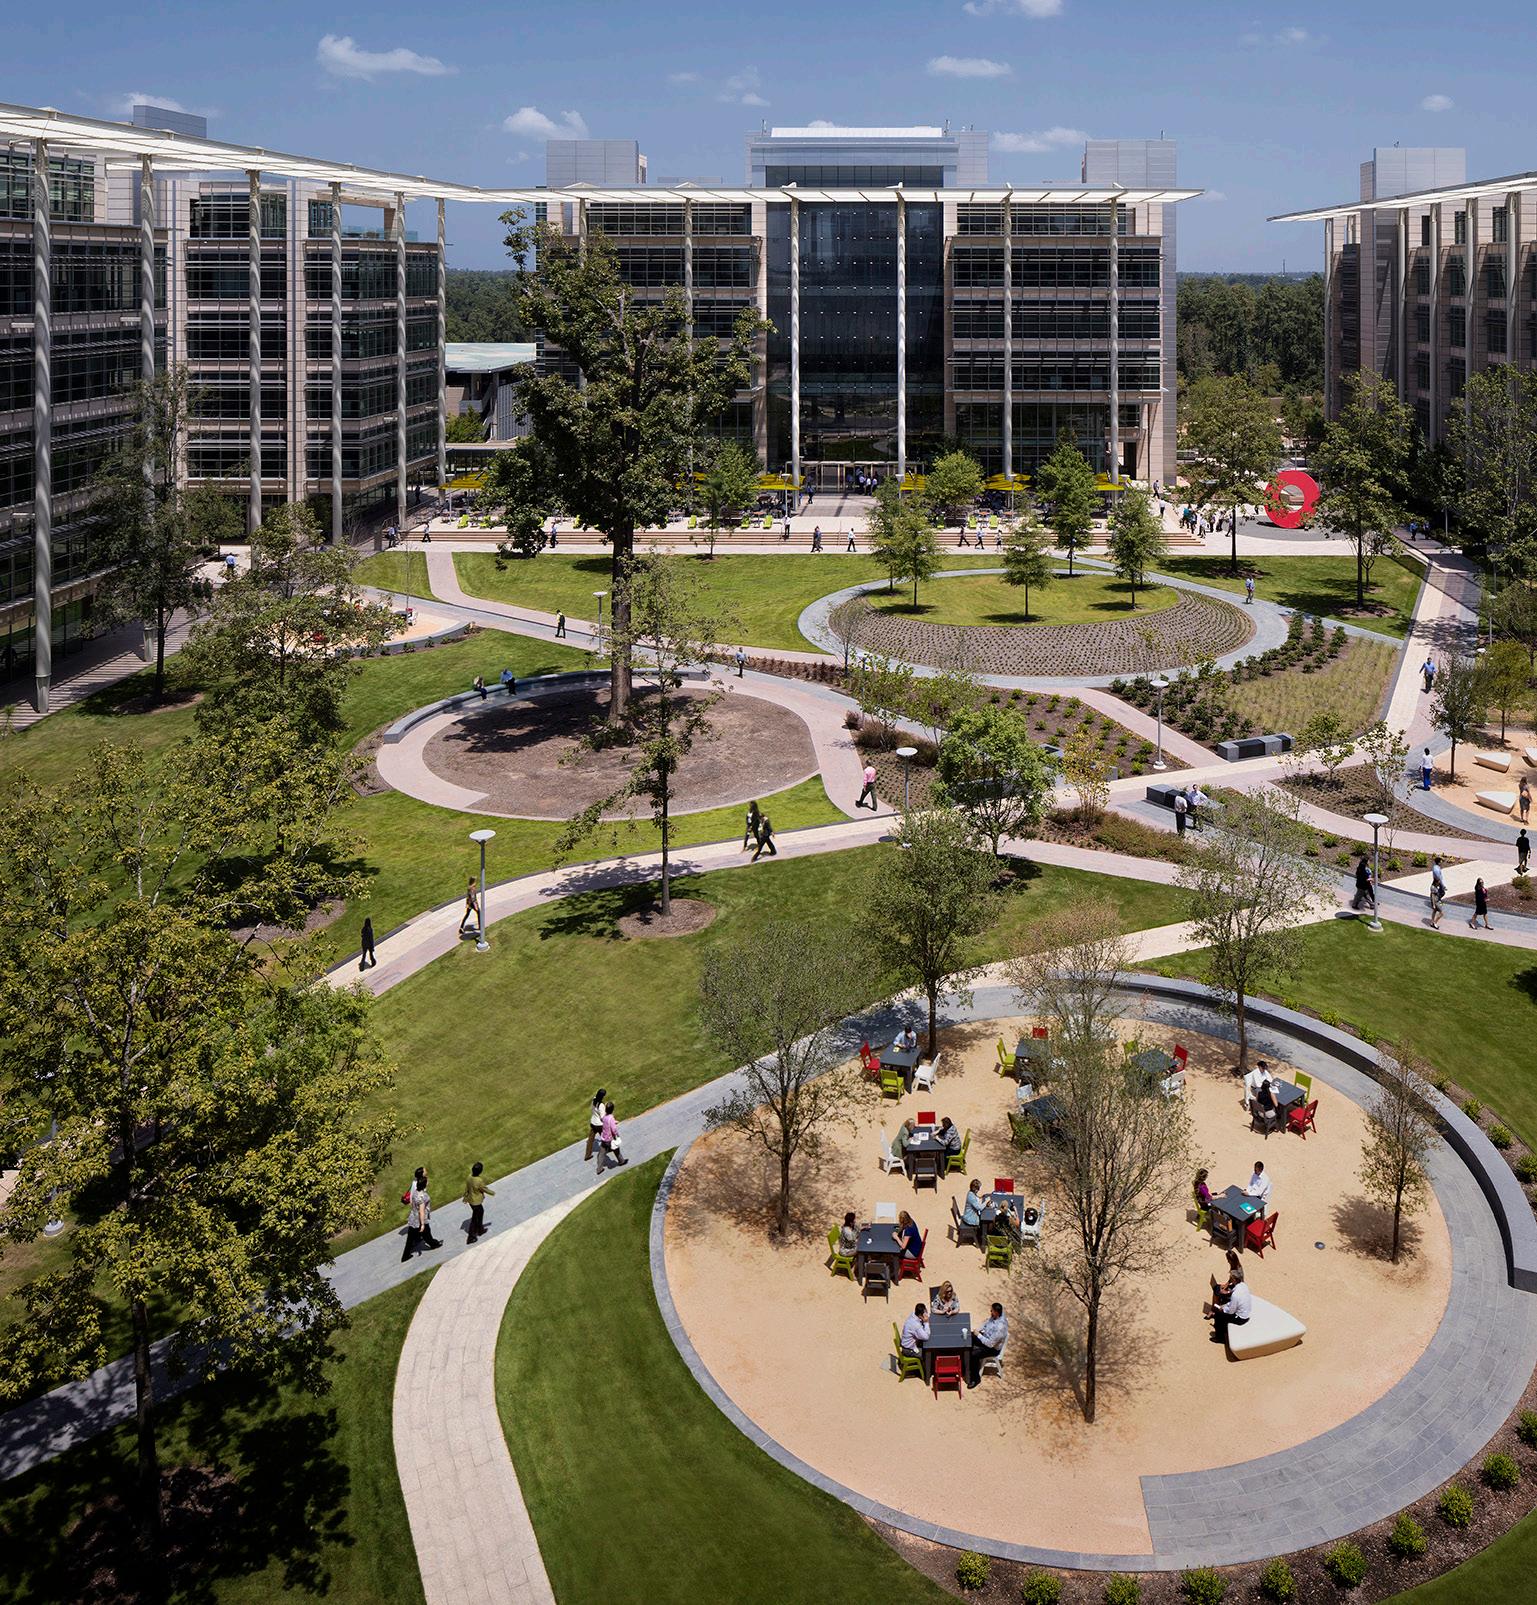
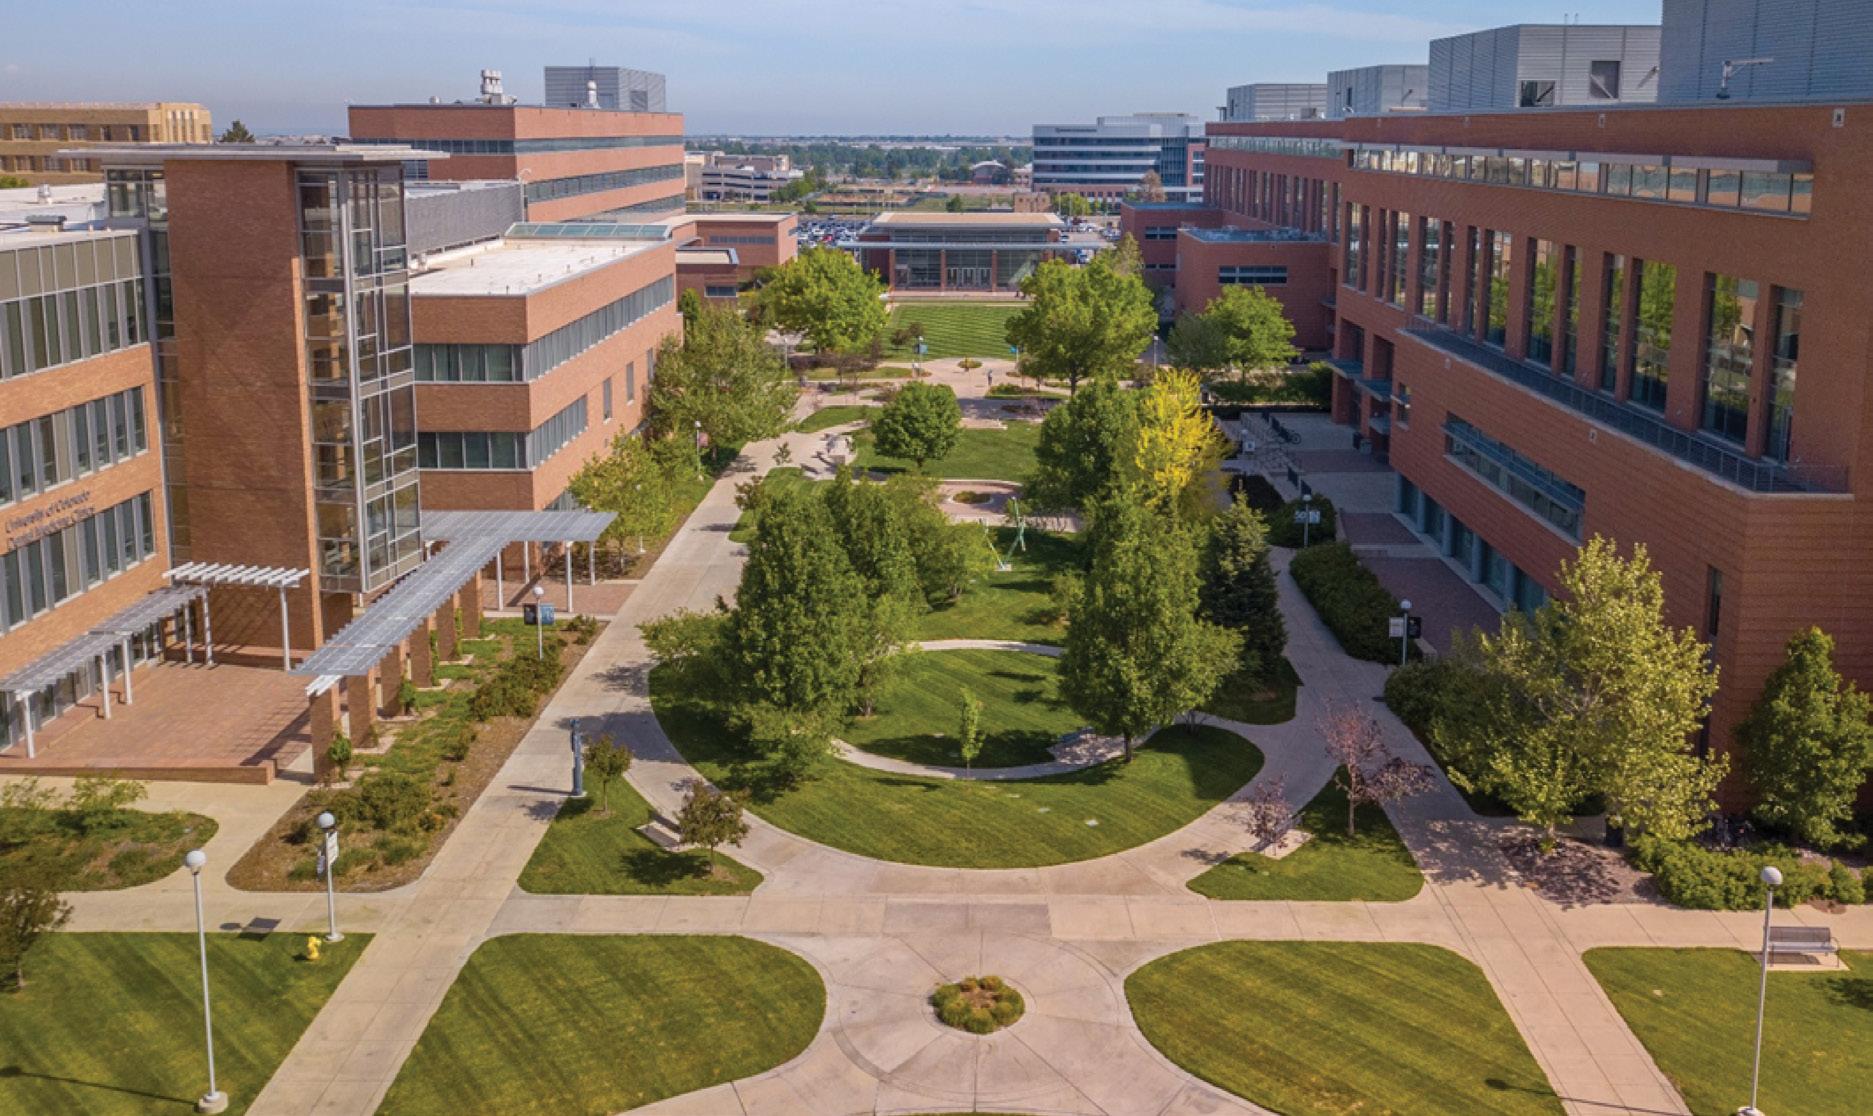
The purpose of the Campus Place Type is to facilitate a range of employment and service activities that are typically structured within a campus environment –where a cluster of buildings and grounds provide a curated space for that specific service or use. CP areas have strong internal and external connectivity, are compatible with neighboring development, and offer unique, visually appealing spaces that contribute to the broader community character and fabric. CP areas may range in density and intensity, but all share similarly distinguishable characteristics.
• Primary land uses include medical services, business parks, public facilities, or institutional uses. Typical development types include mid- tohigh-scale facility and office buildings, which may be connected, grouped, or more dispersed across the campus.
• Parks, public plazas, open space, greenways, or supportive residential and retail uses may be integrated as secondary uses.
Intended Densities
0-36 dwelling units per acre
50 jobs per acre
Mobility Characteristics
The road network supports medium traffic volumes, primarily comprised of collector and local streets and access points that accommodate large vehicles. Sidewalks and/or multi-use pathways provide comfort and connectivity for pedestrians. Selected streets within and major routes connecting to CP areas offer dedicated bike facilities, such as protected bike lanes. Transit connections are typically available at the periphery along busier collector or neighboring arterial roads. Parking is accommodated by structured facilities, dispersed surface lots that are well landscaped, and on-street parking.
Neighborhood Relationships & Transitions
Most Campus areas will abut Neighborhood Medium, Neighborhood High, Neighborhood Mixed Use, Community Mixed Use, Regional Mixed Use, Commercial, or Innovation Place Types. Strategic transitions and buffers may include parks and public spaces, public facilities, transit hubs, or gradual changes in density.
Innovation (IN)
Purpose
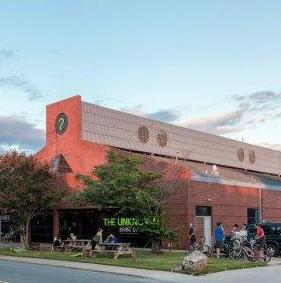
The purpose of the Innovation Place Type is to facilitate small-scale clean fabrication and manufacturing activity with a particular focus on innovation and creative arts industries, complemented by other supporting uses such as higher intensity office, retail, or housing to create interesting, multi-purpose spaces. IN areas support industrial arts, art-oriented fabrication, creative businesses and workspaces, fabrication, processing and assembly, technological learning centers, vocational training, and research or development institutions..
• Development patterns include a range of small to higher-scale mixed-use centers, with typical development types including live-work units; mid- to- high-scale multifamily (10+ units); smallto- mid-scale makerspace or manufacturing warehouses; vertical mixed-use with ground floor retail or light industrial uses and residential or offices on upper floors; and public facilities or institutional centers.
• Parks, plazas, greenways, small-scale office buildings, and supportive service commercial may also be incorporated as supporting uses.
Intended Densities
0 dwelling units per acre
30-50 jobs per acre
Mobility Characteristics
The road network supports low-to-medium traffic volumes, primarily comprised of collector and local streets and access points that accommodate large vehicles. Sidewalks and/or multi-use pathways provide comfort and connectivity for pedestrians. Select streets within IN areas offer dedicated bike facilities, such as protected bike lanes. Transit connections are typically available at nearby hubs. Parking is accommodated primarily through on-street parking, supplemented by small, dispersed surface lots and private driveways or garages.
Neighborhood Relationships & Transitions
Most Innovation areas will abut Neighborhood High, Community Mixed Use, Regional Mixed Use, Commercial, Campus, Manufacturing & Logistics, or Parks & Open Space Place Types. Strategic transitions and buffers may include parks and public spaces, public facilities, transit hubs, or gradual changes in density and use.
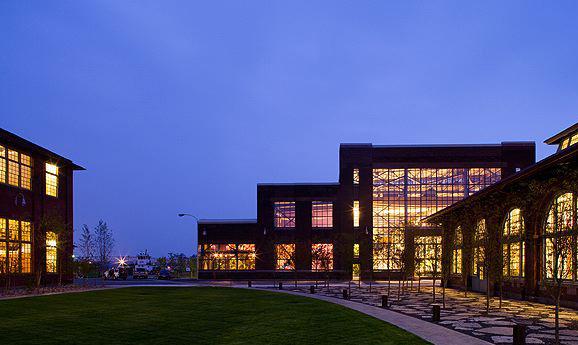
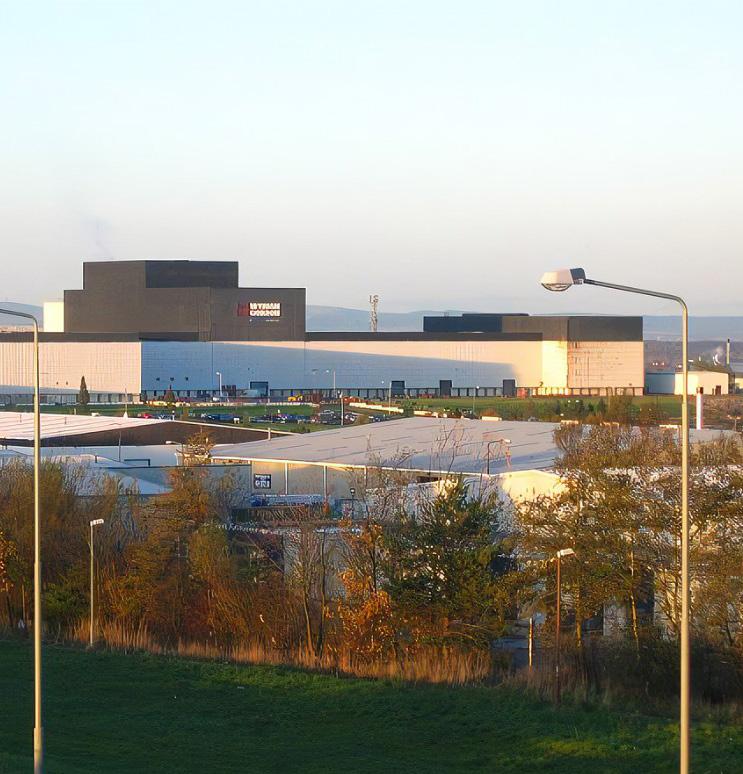
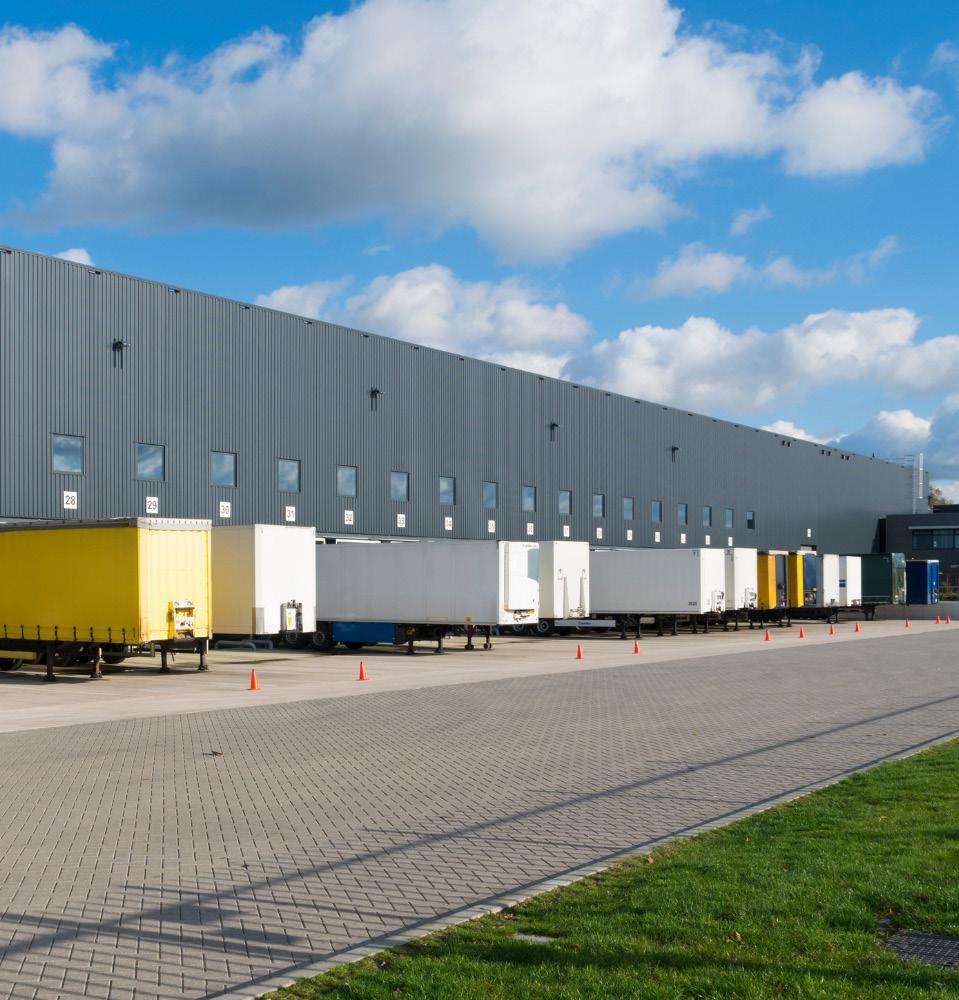
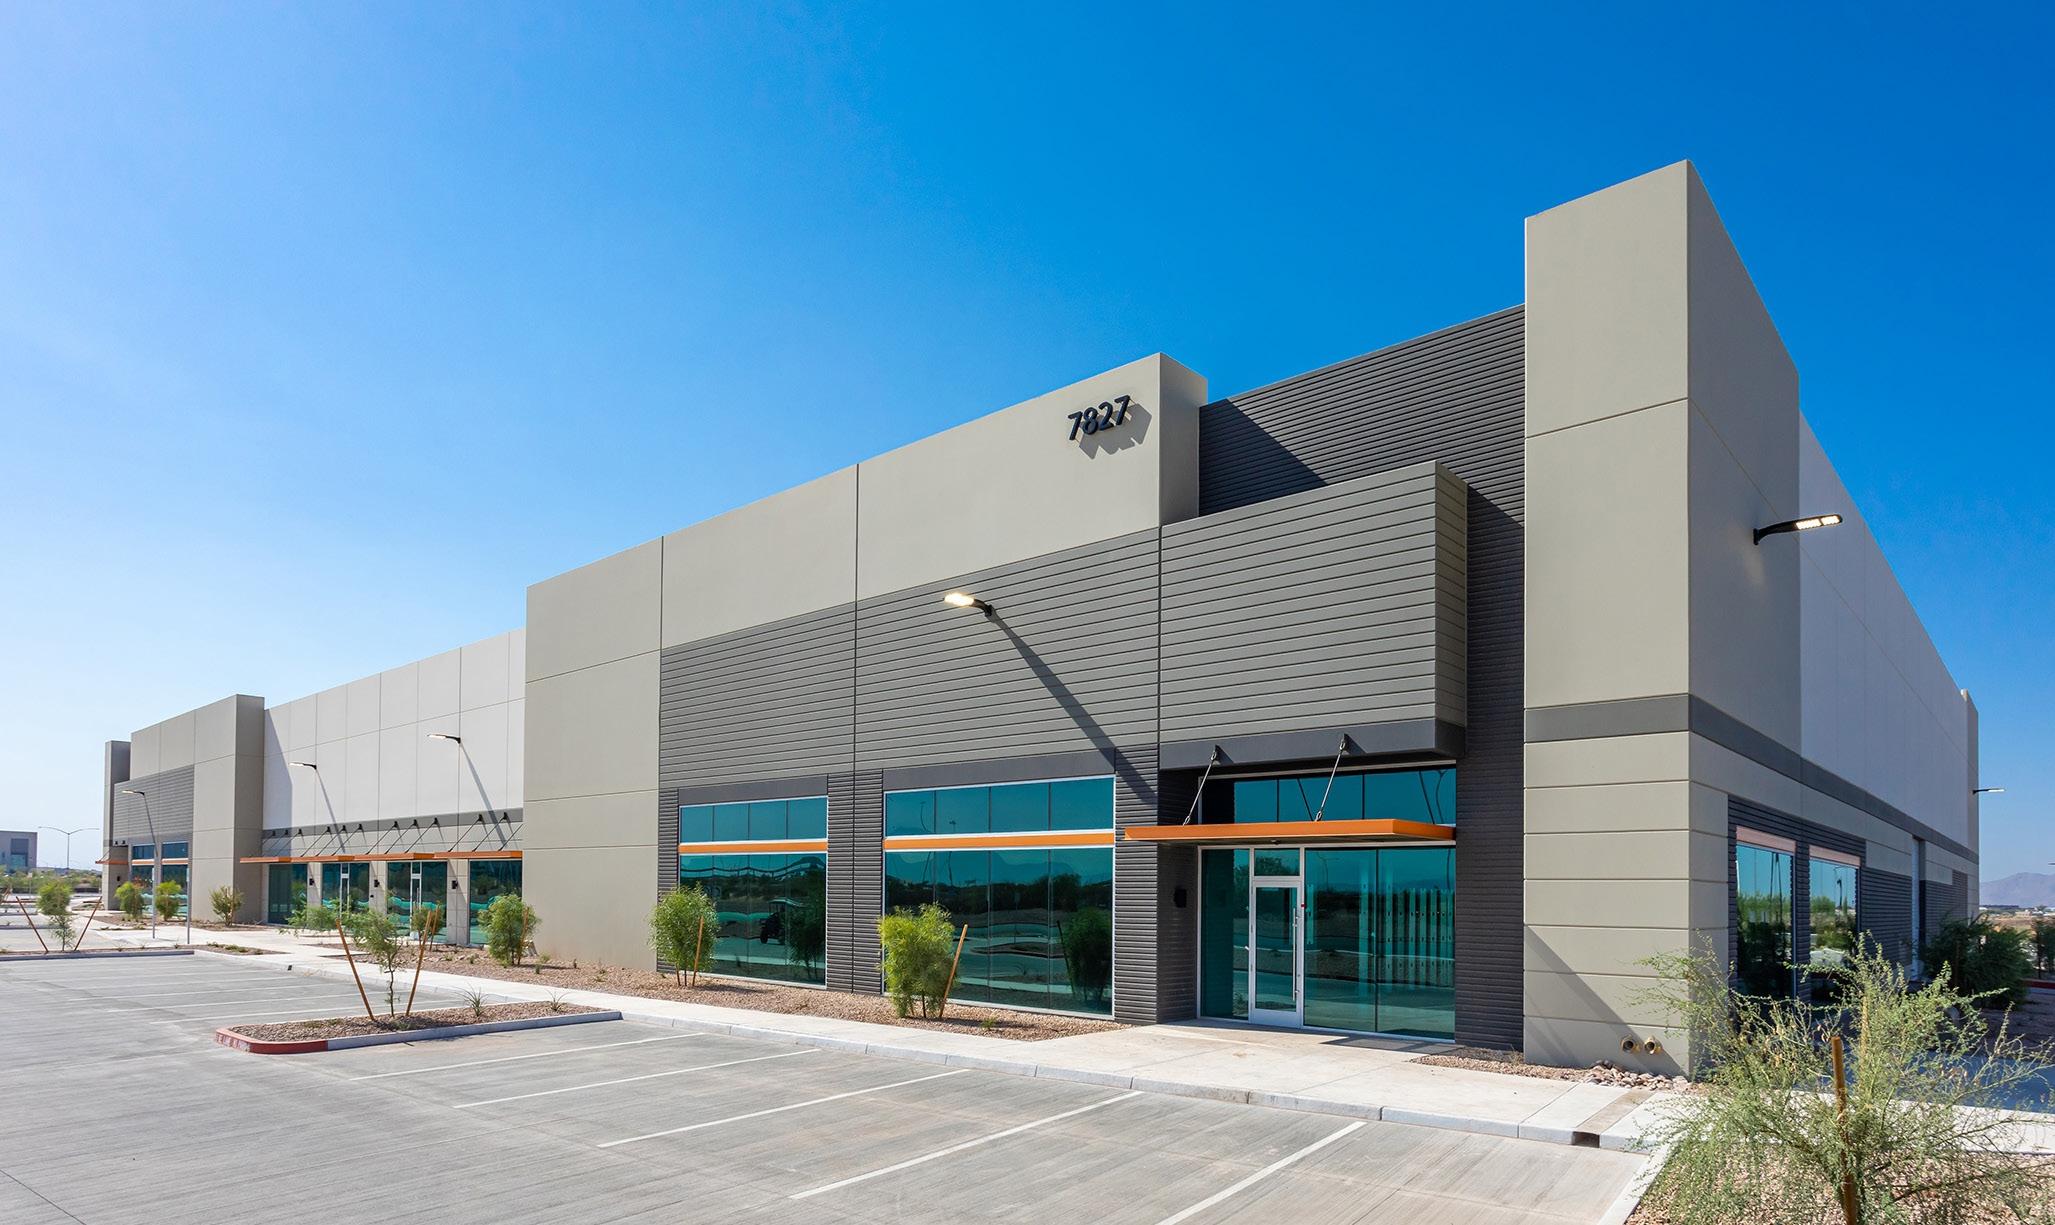
Manufacturing & Logistics (ML)
Purpose
The purpose of the Manufacturing and Logistics Place Type is to support more intensive manufacturing and industrial uses, such as processing, warehousing and distribution, and fabrication as well as larger business parks or agricultural land and facilities.
• Typical development types include larger warehouses, plants, distribution centers, and agricultural land and facilities.
• Parks, plazas, greenways, or more expansive office complexes may also be integrated as secondary uses.
Intended Densities
0 dwelling units per acre
20-40 jobs per acre
Mobility Characteristics
The road network supports low-to-medium traffic volumes, primarily comprised of collector and local streets, but easily accessible to major arterials and highway routes. Access points accommodate large vehicles. Sidewalks and/or multi-use pathways provide comfort for pedestrians. Select streets within ML areas offer dedicated bike facilities, such as protected bike lanes. Transit connections are typically available at nearby hubs. Parking is accommodated primarily through dispersed off-street surface lots, while private drives and garages may also contribute.
Neighborhood Relationships & Transitions
Most Manufacturing areas will abut Commercial, Campus, Innovation, or Parks & Open Space Place Types. Strategic transitions and buffers may include parks and public spaces, public facilities, transit hubs, or gradual changes in density and use.
Parks & Open Space (POS)
Purpose
The purpose of the Parks & Open Space Place Type is to dedicate land for the provision of active and passive recreation opportunities throughout Amarillo and preserve natural areas.
• Primary uses include informal and natural open space as well as formal parks, greenways, and open spaces with improvements and amenities such as trails, playgrounds, pavilions, shade structures, art, picnic facilities, interpretation, bathrooms, etc. POS areas may range from large, expansive areas and regional community parks to small neighborhood pocket parks.
• Public facilities, institutional uses, and limited smallscale retail or hospitality may also be incorporated as secondary and supportive uses.
Intended Densities
0 dwelling units per acre
<0.5 job per acre
Mobility Characteristics
The road network within Parks & Open Space areas will typically be limited, with arterials or collectors providing access to larger, regionally-serving areas and local roads providing access within neighborhoods. Stronger emphasis should be placed on pedestrian and bike connections and facilities, such as sidewalks, multi-use pathways and trails, and dedicated, protected bike lanes along roadways. Transit connections are typically available at the periphery or within adjacent place types. Parking is accommodated by on-street parking and small, dispersed, and welllandscaped off-street surface lots.
Neighborhood Relationships & Transitions
Parks & Open Space areas may abut and/or be incorporated within any other Place Type. However, larger POS areas will mostly be found near Neighborhood Low, Neighborhood Medium, Innovation, and Manufacturing & Logistics Place Types. POS lands are frequently used as strategic transitions or buffers between Place Types.
Reserve (R)
Purpose
The purpose of the Reserve Place Type is to hold identified undeveloped areas for potential future development and preserve lands actively used for agriculture and ranching. Reserving some undeveloped land in the present, while still providing flexibility for its future potential development, strategically focuses more intensive development in other areas of the community where infrastructure, services, and close proximity to amenities (such as housing, jobs, childcare, etc.) already exist.
• The primary current uses for Reserve lands include agriculture and ranching, recreation, and vacant/ undeveloped.
• Large estate homes may also be integrated as existing secondary uses.
Intended Densities
<1 dwelling unit per acre
<1 job per acre
Mobility Characteristics
The road network within Reserve areas is very minimal, serving low intensities and primarily composed of rural local or County roads. Formal pedestrian or bike infrastructure and connectivity are not high priorities, and transit connections are typically farther away within adjacent Place Types. Limited parking needs are accommodated by private driveways and garages.
Neighborhood Relationships & Transitions
Reserve areas may abut any other Place Type (except for Regional Mixed Use). Transitions should be focused within the abutting development to define edges or ensure compatibility between uses.

Neighborhood Patterns
Amarillo’s neighborhoods exhibit variety in their current context and conditions, informed by when and where they were built, surrounding uses, proximity to Downtown, and many other factors. Because of this variation in underlying conditions, Amarillo’s neighborhoods are anticipated to experience different degrees and types of change over the next 20+ years. The three Neighborhood Patterns below illustrate this expected range of transition and change from current to future conditions, each of which can be applied to specific neighborhoods and areas within Amarillo. All three patterns emphasize the goal to create “complete neighborhoods,” with greater access to daily needs and amenities and providing buffers between different areas of use and intensity.
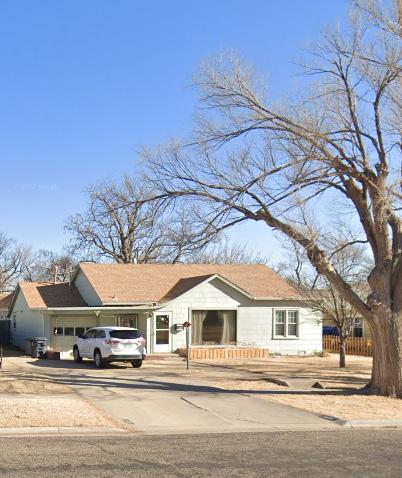
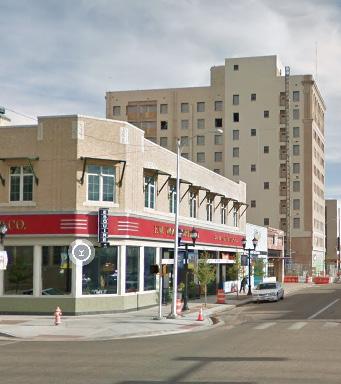
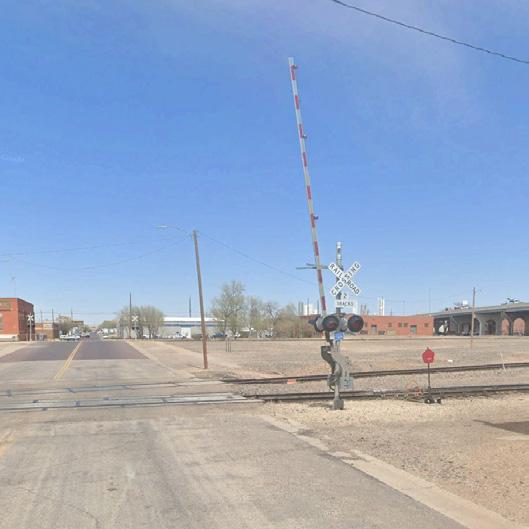
Older Neighborhoods
These neighborhoods are well-established, framed by the City’s oldest development patterns, buildings, and infrastructure. While some older neighborhoods have lost investment and vibrancy over the years, many have a distinct historic character. In some instances, they are home to long-term residents who want to preserve the characteristics and community they know and cherish. Local streets in these neighborhoods generally follow a grid pattern, but block lengths may be irregular, and freight or transit infrastructure such as railroad tracks may be embedded, creating barriers to connectivity. These neighborhoods are mostly found close to Downtown and are often adjacent to or intertwined with historically established industrial uses.
With the introduction of commercial and mixed uses, the primary goals for the aspirational pattern include:
• Protection of existing residential development and character.
• Preservation of light industrial uses that provide local jobs.
• The use of the Neighborhood Mixed-Use and Commercial Place Types as a transitional buffer between industrial and residential uses, while simultaneously providing locally-serving amenities and activity.
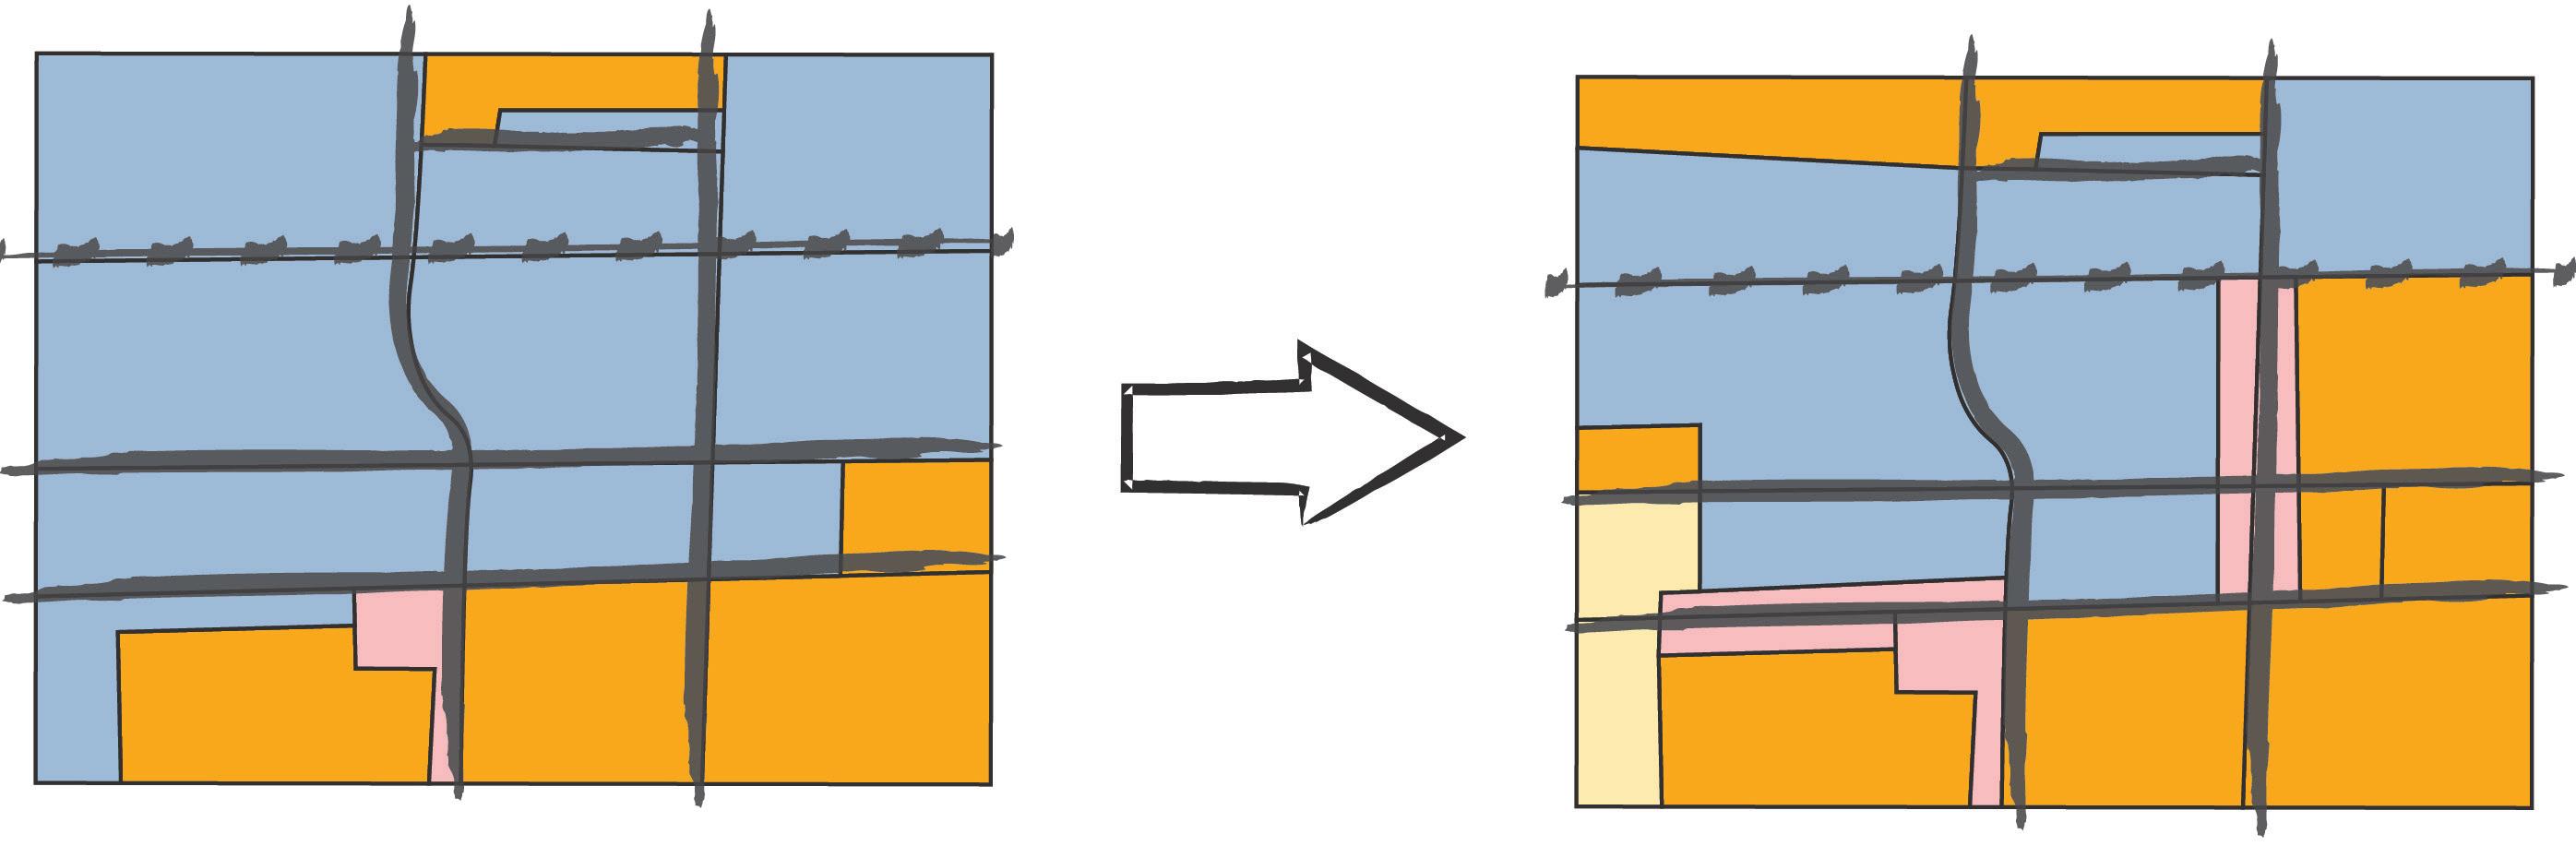
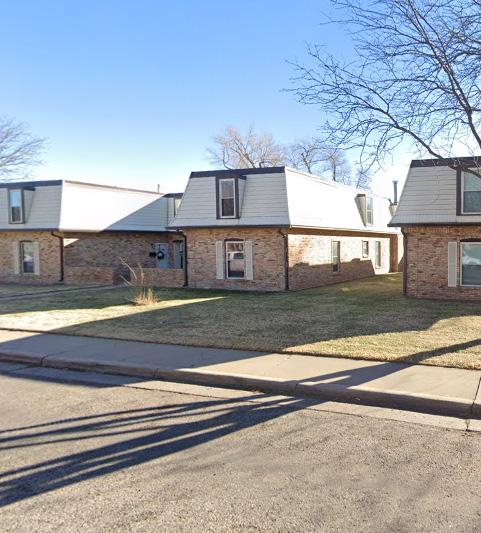
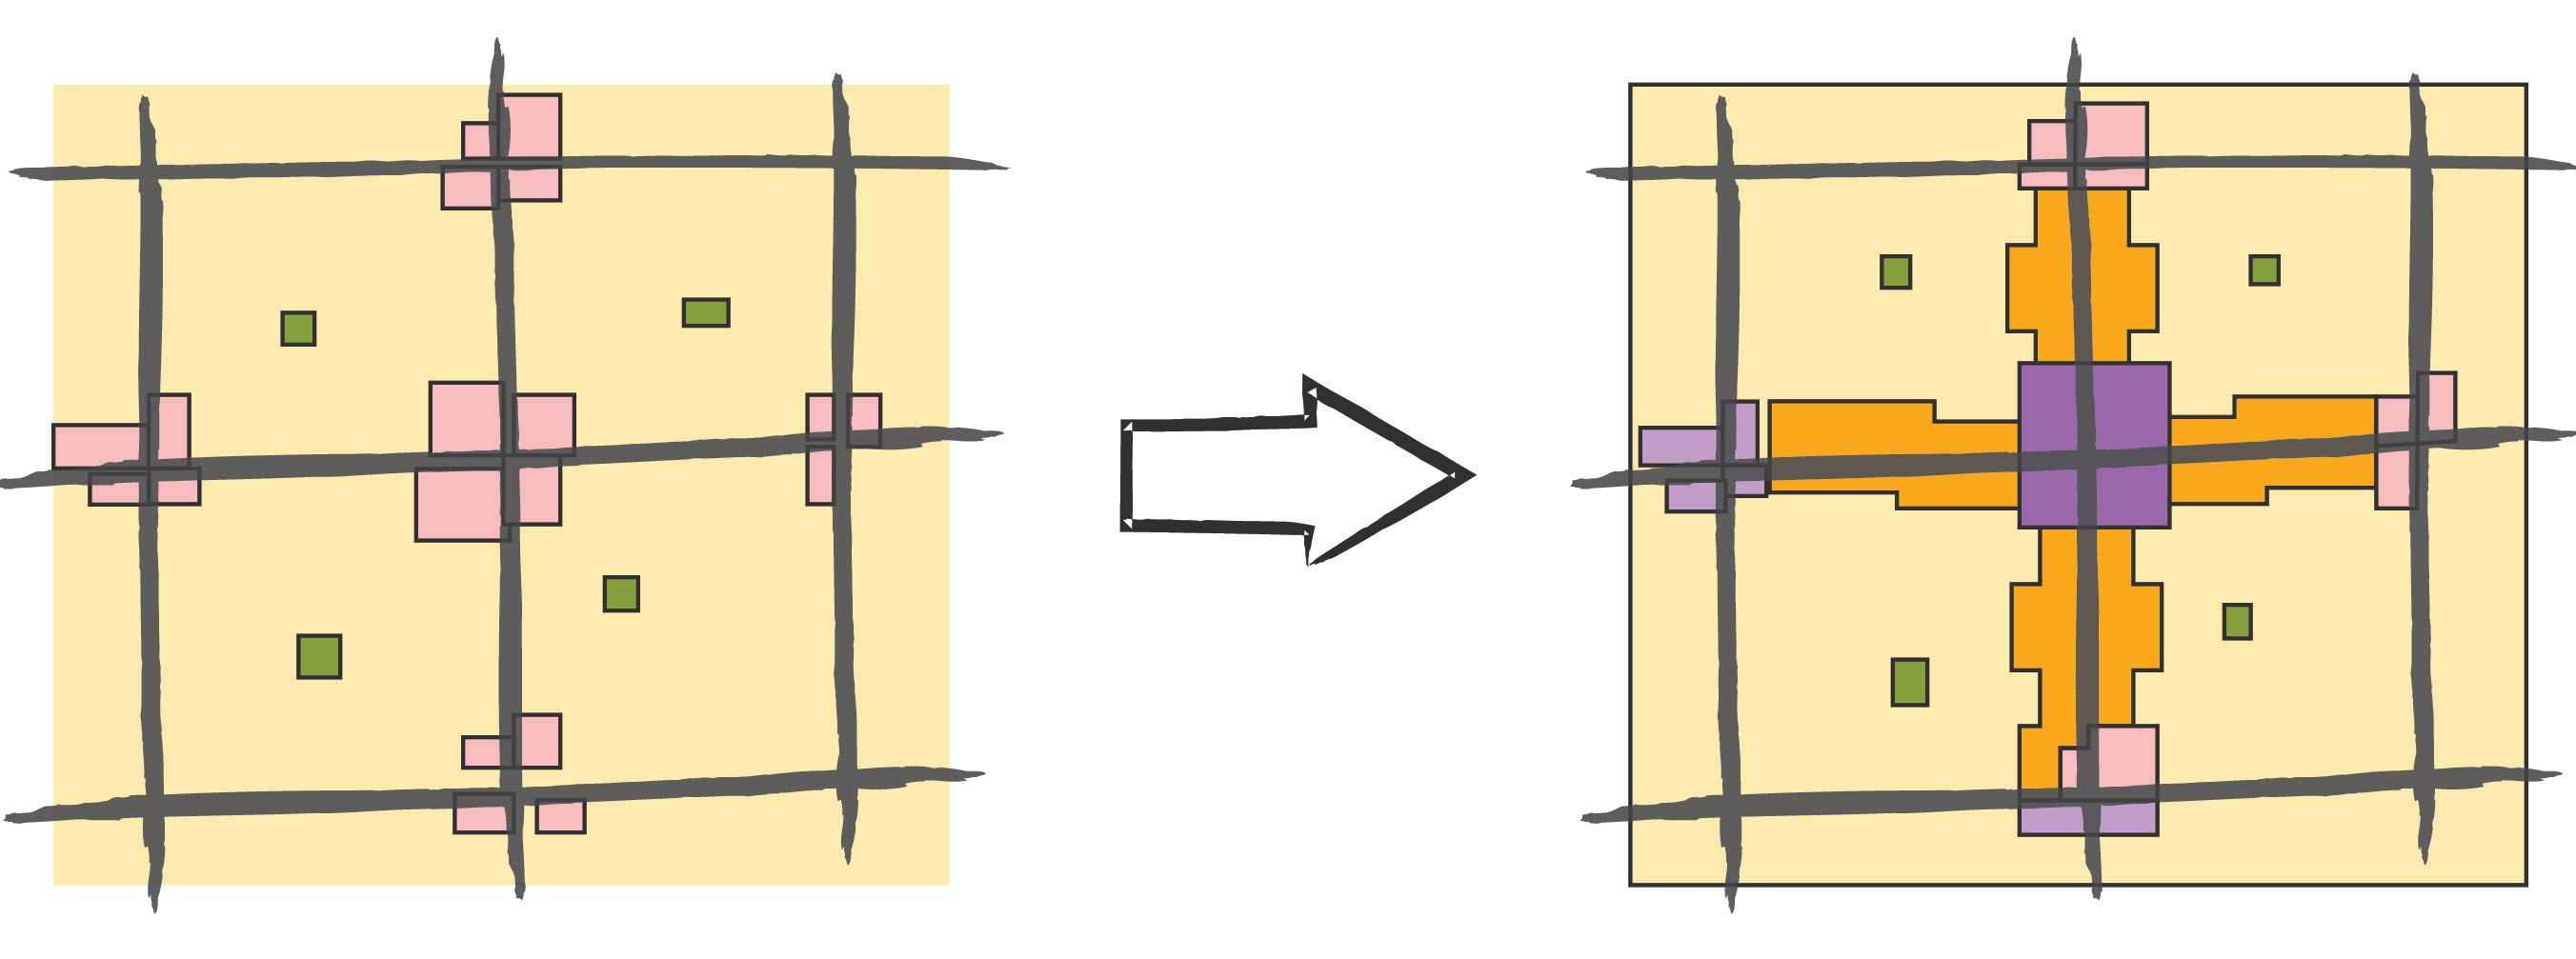
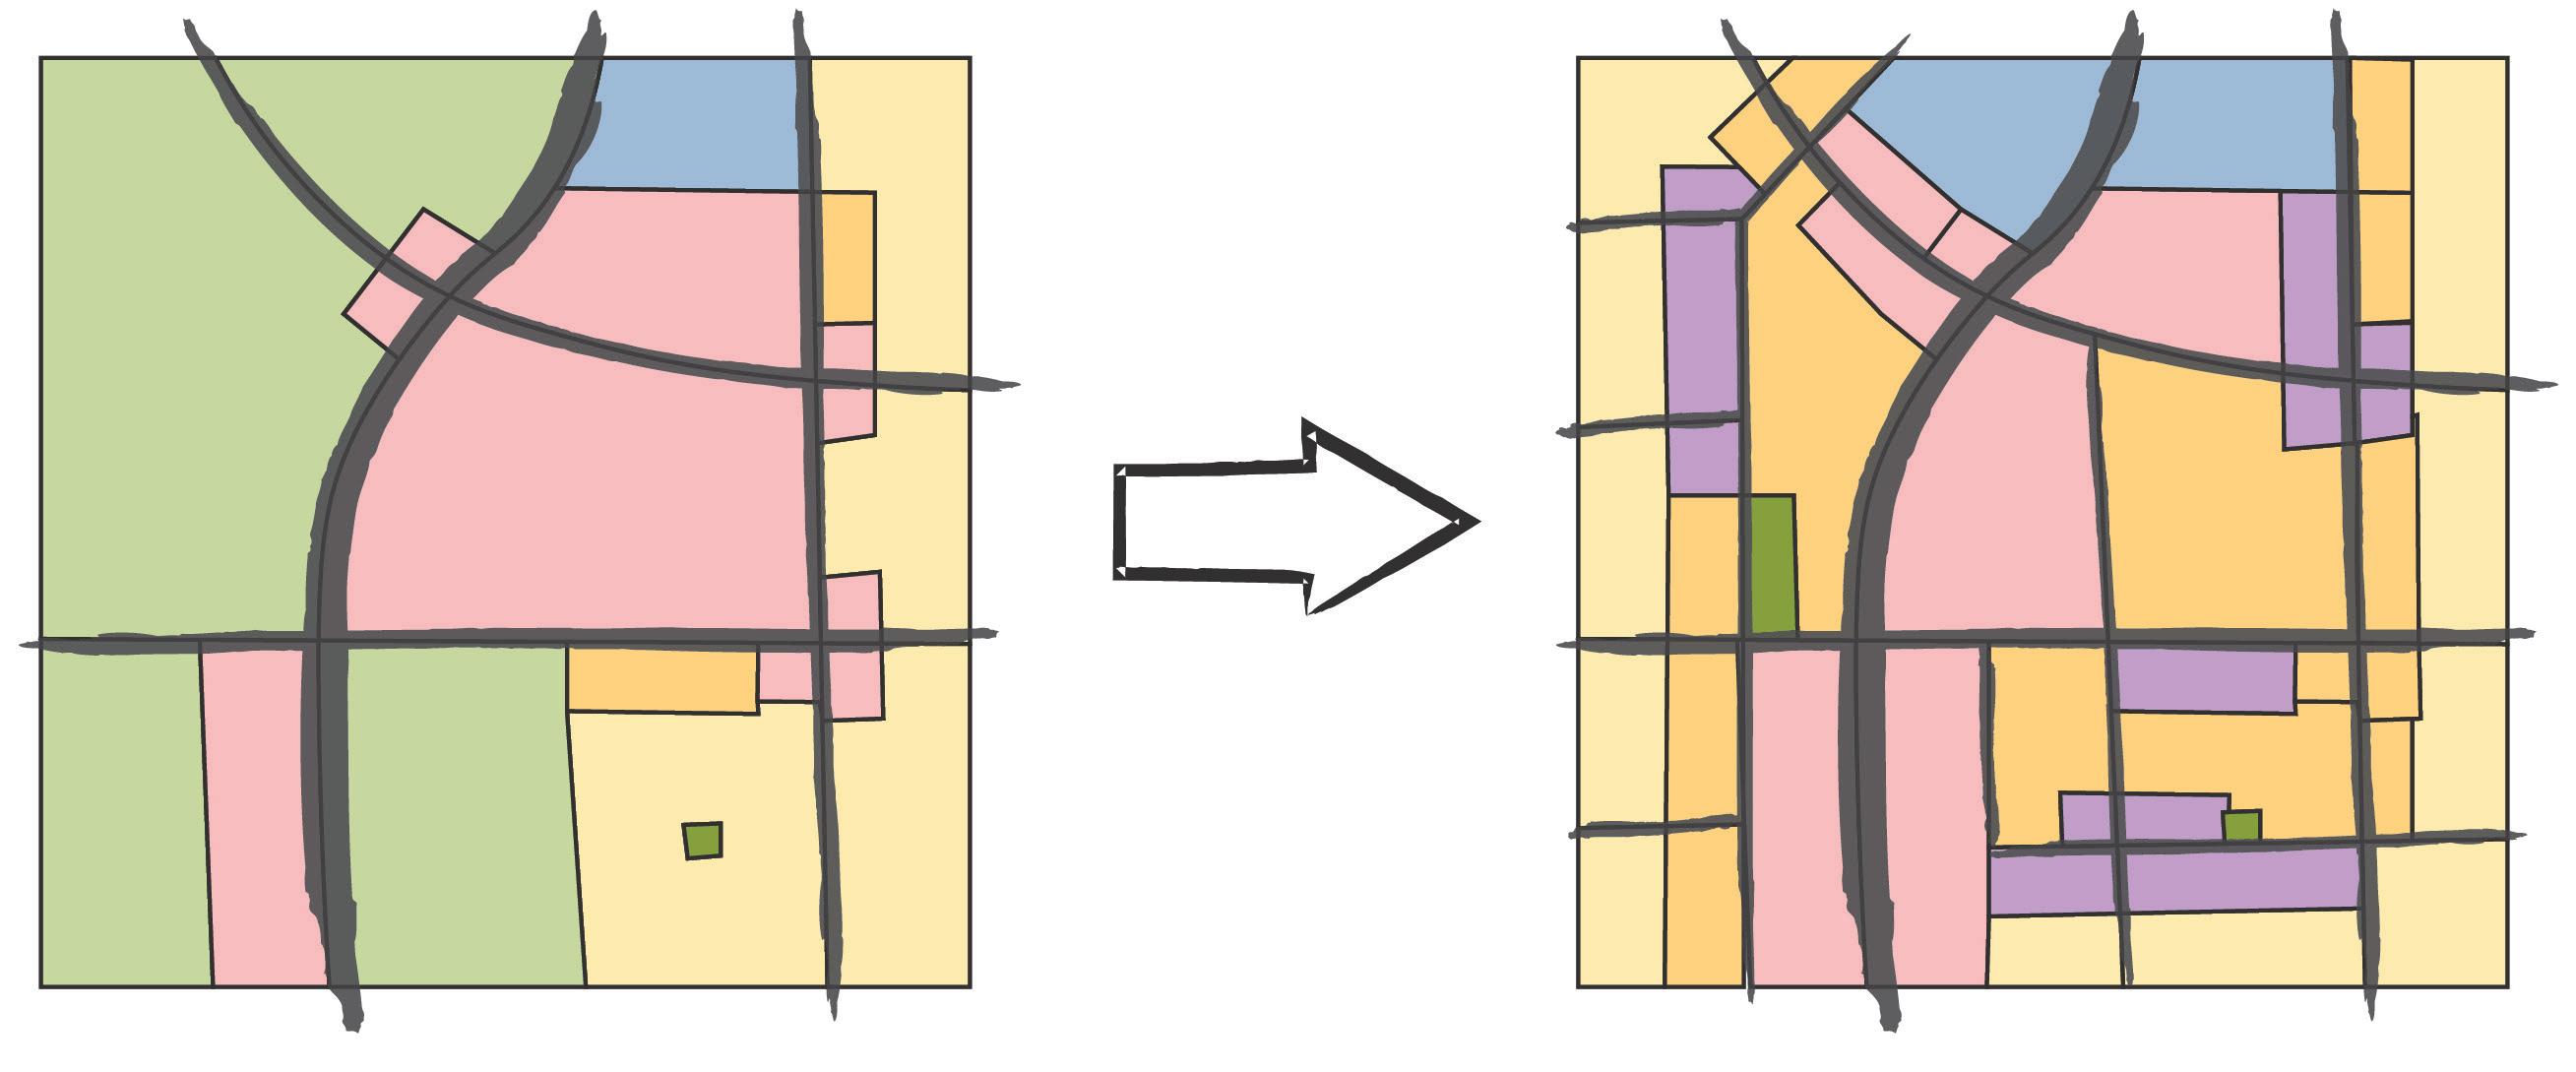
Existing Newer Neighborhoods
These neighborhoods are also well-established but have been built more recently. They tend to follow the Neighborhood Unit Concept, with single-family residential as the primary use, and commercial uses at major intersection corners. These neighborhoods typically have a community park or other open space amenity at the center and encompass a total area of one square mile bounded by section line arterials. While somewhat walkable within, the commercial uses on the edge tend to be hard to access and the arterials serve as barriers to destinations beyond the neighborhood. Additionally, midor- higher-density housing has not been integrated in the way that the Neighborhood Unit Concept envisioned. The street networks in these neighborhoods tend to be more suburban and curvilinear within the City’s
larger thoroughfare block-grid. While this development pattern is found in all four quadrants of Amarillo, these neighborhoods are most prevalent in the southwestern portion of the city.
The aspirational pattern establishes opportunities for Community and Neighborhood Mixed Use as well as Neighborhood Medium and High Place Types. Key goals for the aspirational pattern include:
• The creation of more walkable destinations closer to residences.
• Increasing housing diversity by incorporating missing middle housing development along key corridors.
Neighborhood Low
Neighborhood High
Neighborhood Mixed Use
Community Mixed Use
Commercial Parks & Open Space
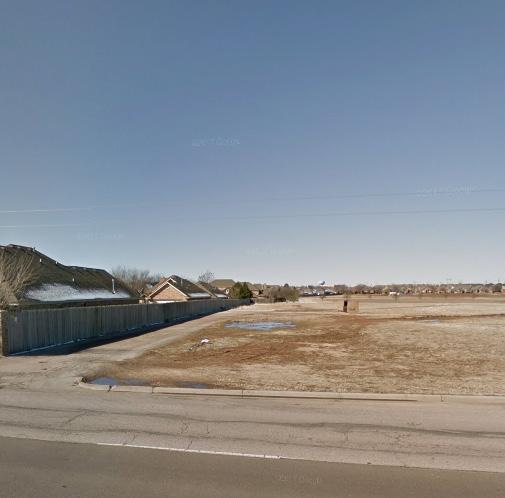
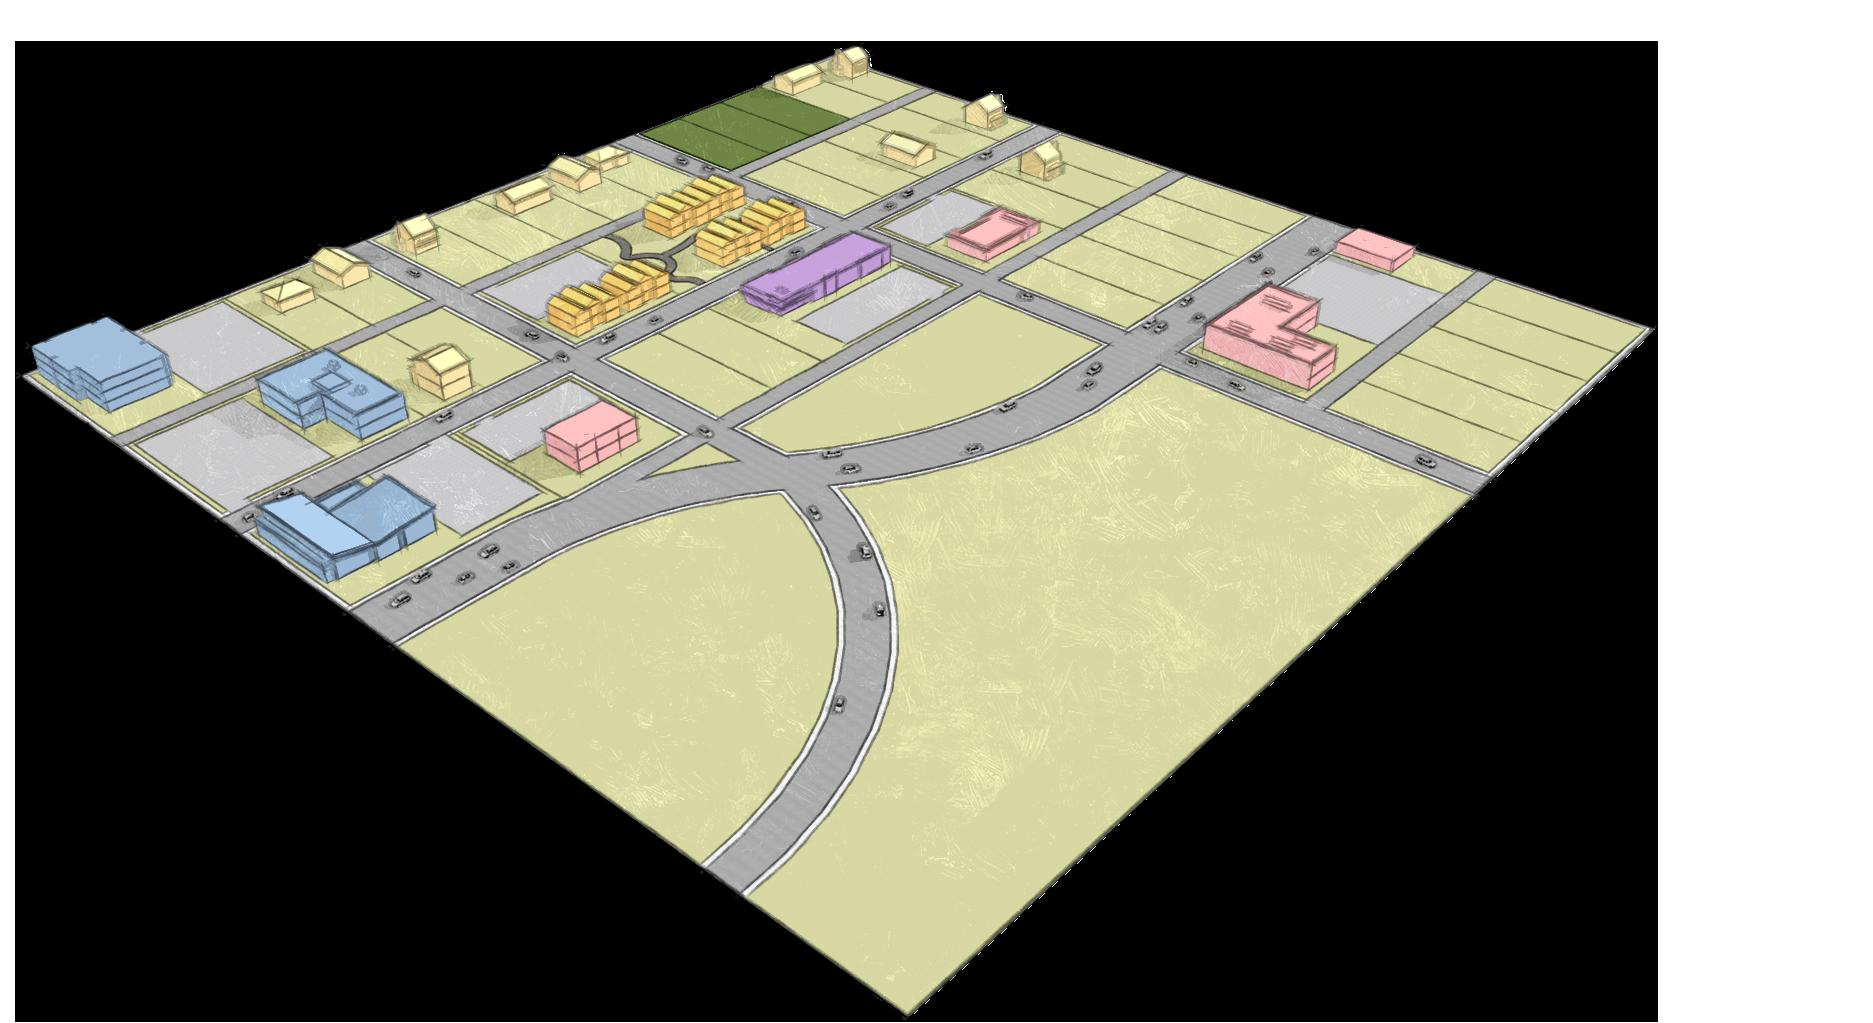
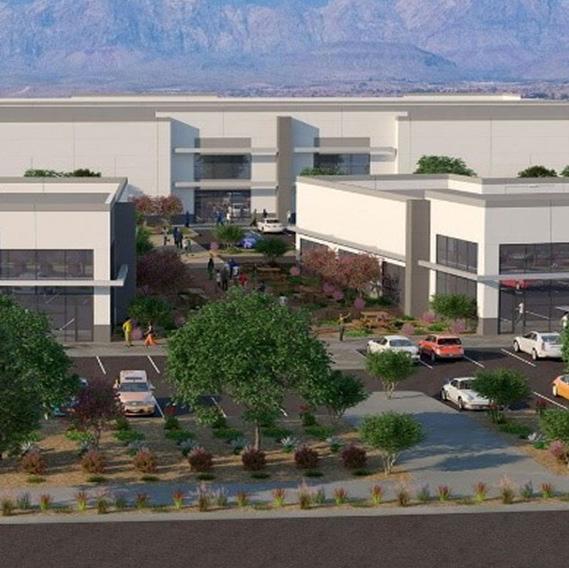
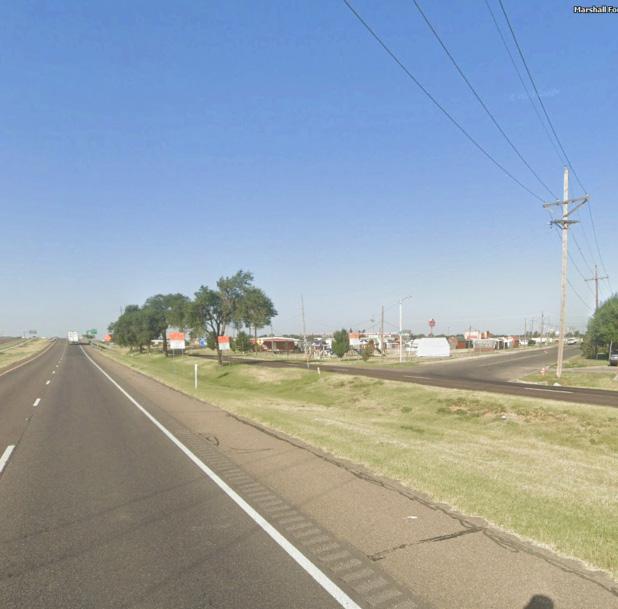
New Neighborhoods
These neighborhoods are those most recently developed, primarily master planned single-family communities found at the City’s periphery and in its southwestern area. They tend to be more autooriented, with larger, somewhat irregular blocks and curvilinear streets within the City’s larger thoroughfare block-grid. Uses tend to be segregated, with a fabric of strictly residential neighborhoods and pockets of big box retail and commercial uses between them. These neighborhoods often abut undeveloped land, leaving edges undefined or residential communities isolated.
LEGEND Reserve
The primary goals for the aspirational pattern include:
• To proactively plan for and define neighborhood edges.
• To strategically locate commercial and neighborhood mixed-use in areas closest to highways.
• To utilize the Neighborhood Medium Place Type as a transitional buffer between Commercial and Neighborhood Low Place Types.
Commercial Parks & Open Space
Neighborhood Medium
Neighborhood Mixed Use
Neighborhood Low Innovation

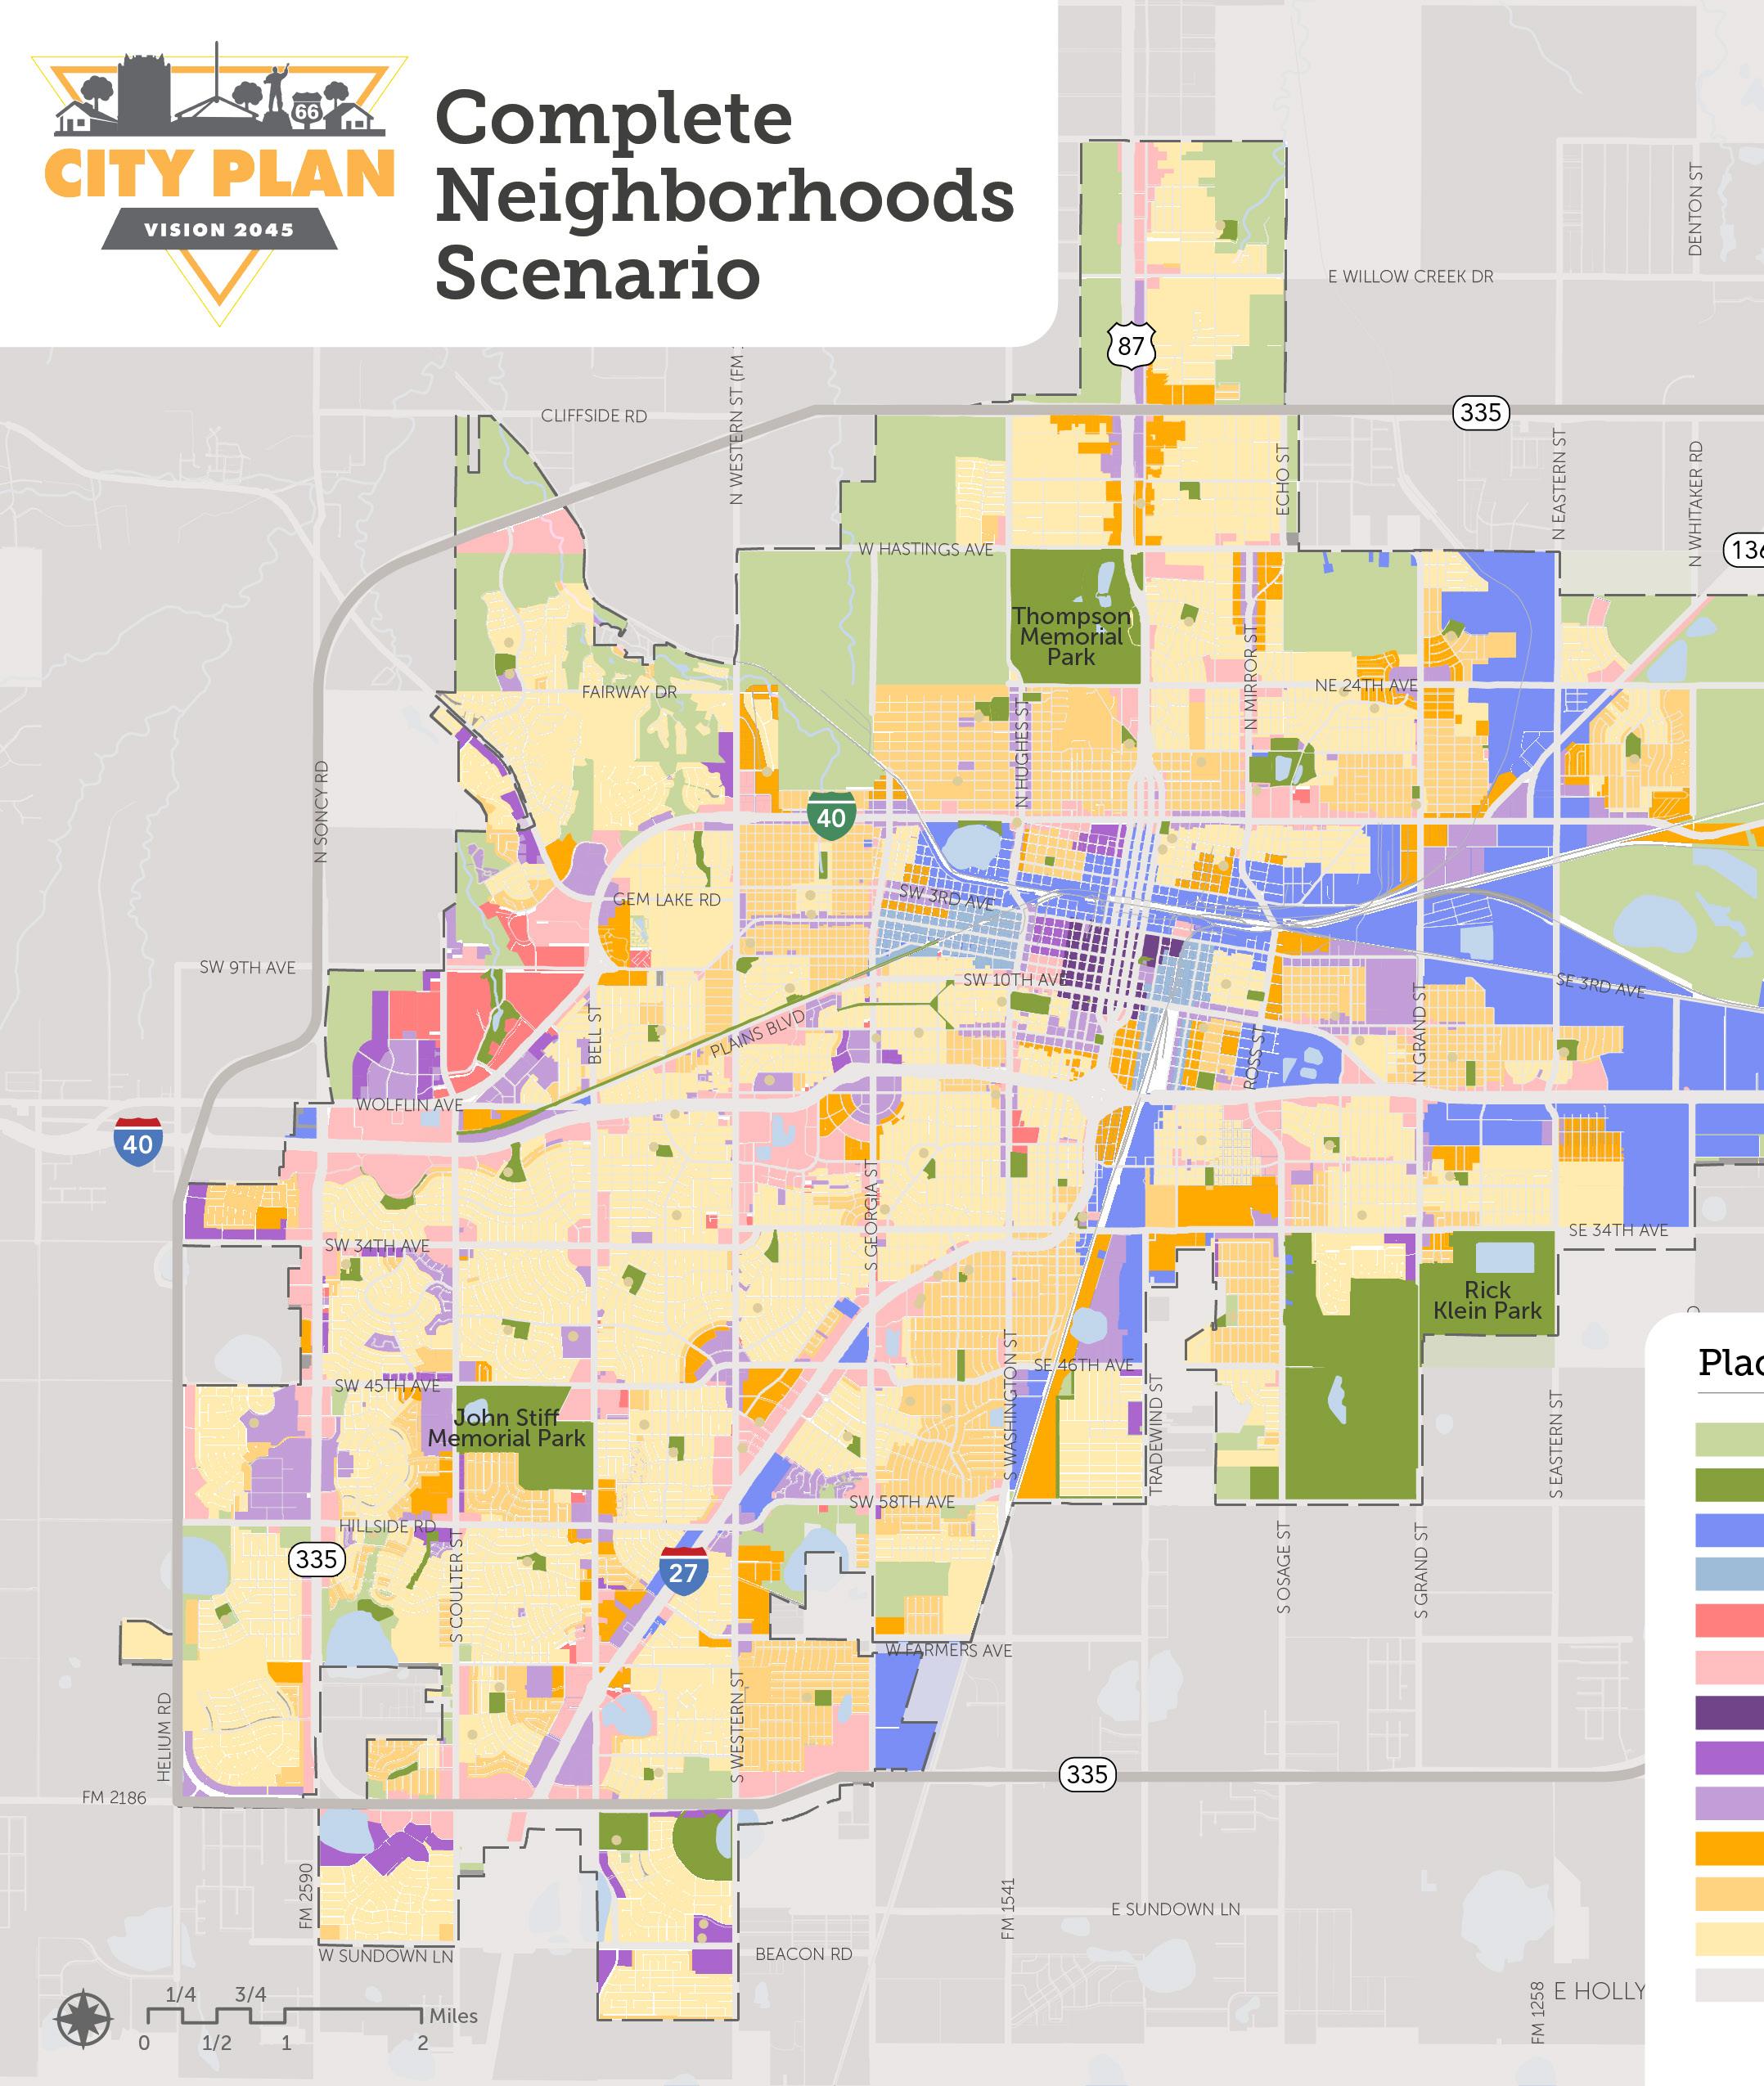
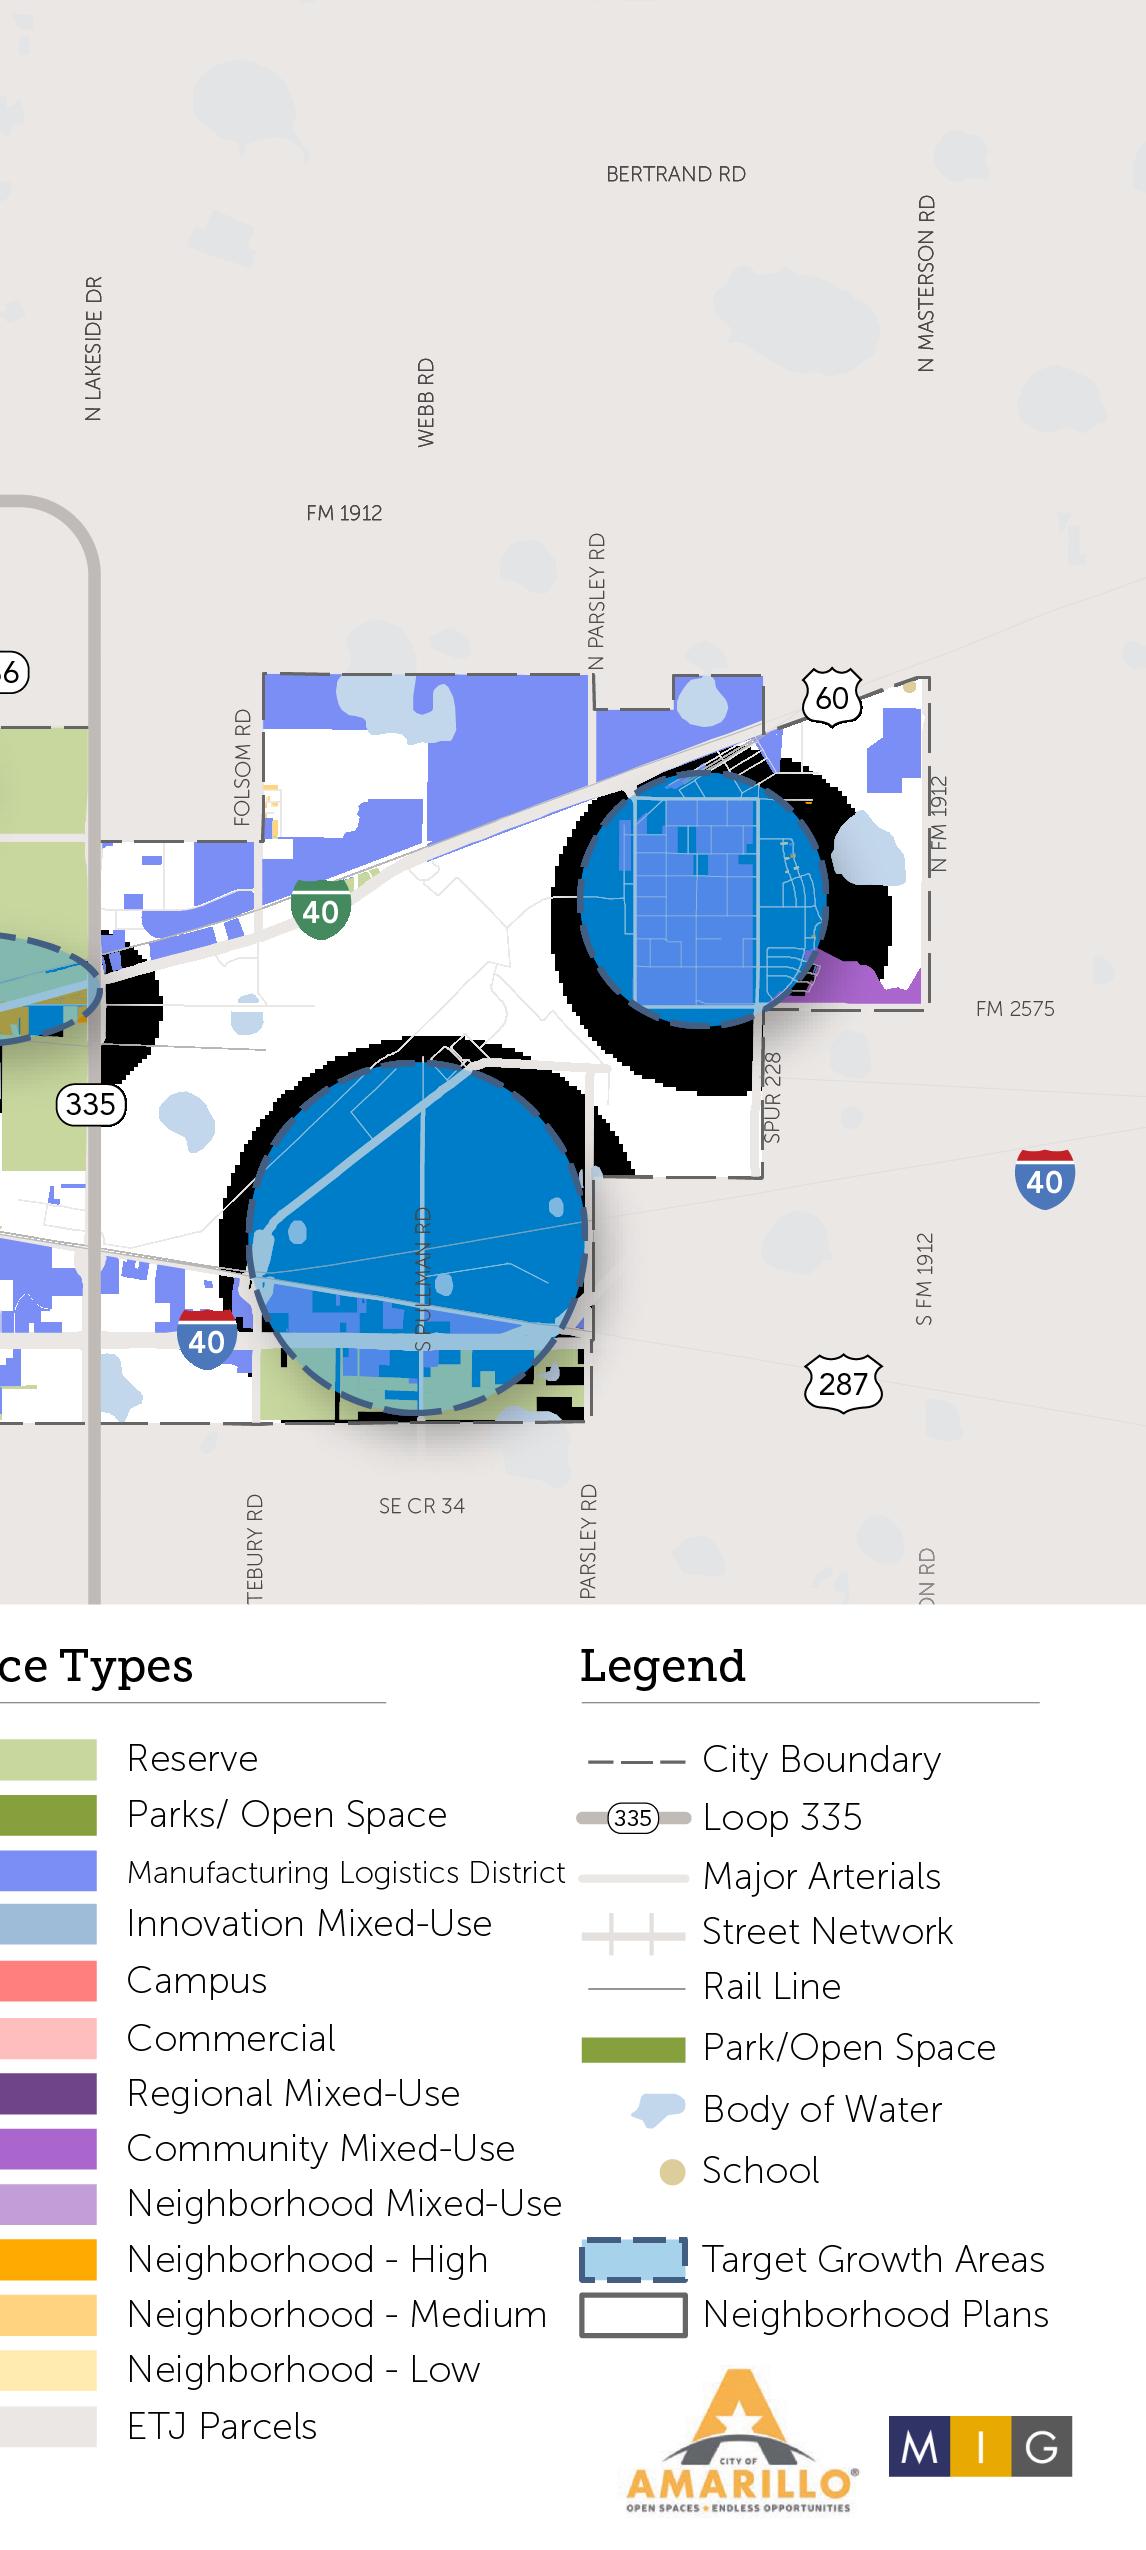
Complete Neighborhoods Scenario
The Complete Neighborhoods Scenario Map illustrates the community’s vision for land use and development patterns in 2045. Building from existing conditions, this map distributes the place types and neighborhood patterns across Amarillo’s geography. The objective of the Complete Neighborhoods Scenario is to capture future growth projections through a balance of land uses and strategic densities that create desirable, healthy, and vibrant communities across the city. The Complete Neighborhoods Scenario seeks to provide current and future Amarillo residents with access to opportunity – such as housing, jobs, childcare and education, entertainment, and recreation – while reducing adjacencies to incompatible uses and protecting against harms – such as pollution, high costs of living, and long commutes.
Most place type allocations generally reflect current characteristics, or an improvement to current characteristics, although some areas do depict a departure from what’s on the ground today. These are the areas with the greatest capacity to accommodate future growth, such as vacant and undeveloped land or areas well-positioned for increased density and/or mixed activity. In addition, some areas have begun to transform without City intervention in recent years, indicating an opportunity for strategic investment or refinement of development regulations to support desired outcomes.
Areas of Targeted Growth & Change
of parcels in Amarillo are vacant of vacant parcels are within adopted Neighborhood Plan areas of parcels in Amarillo are agricultural agricultural parcels lie on the periphery of the city
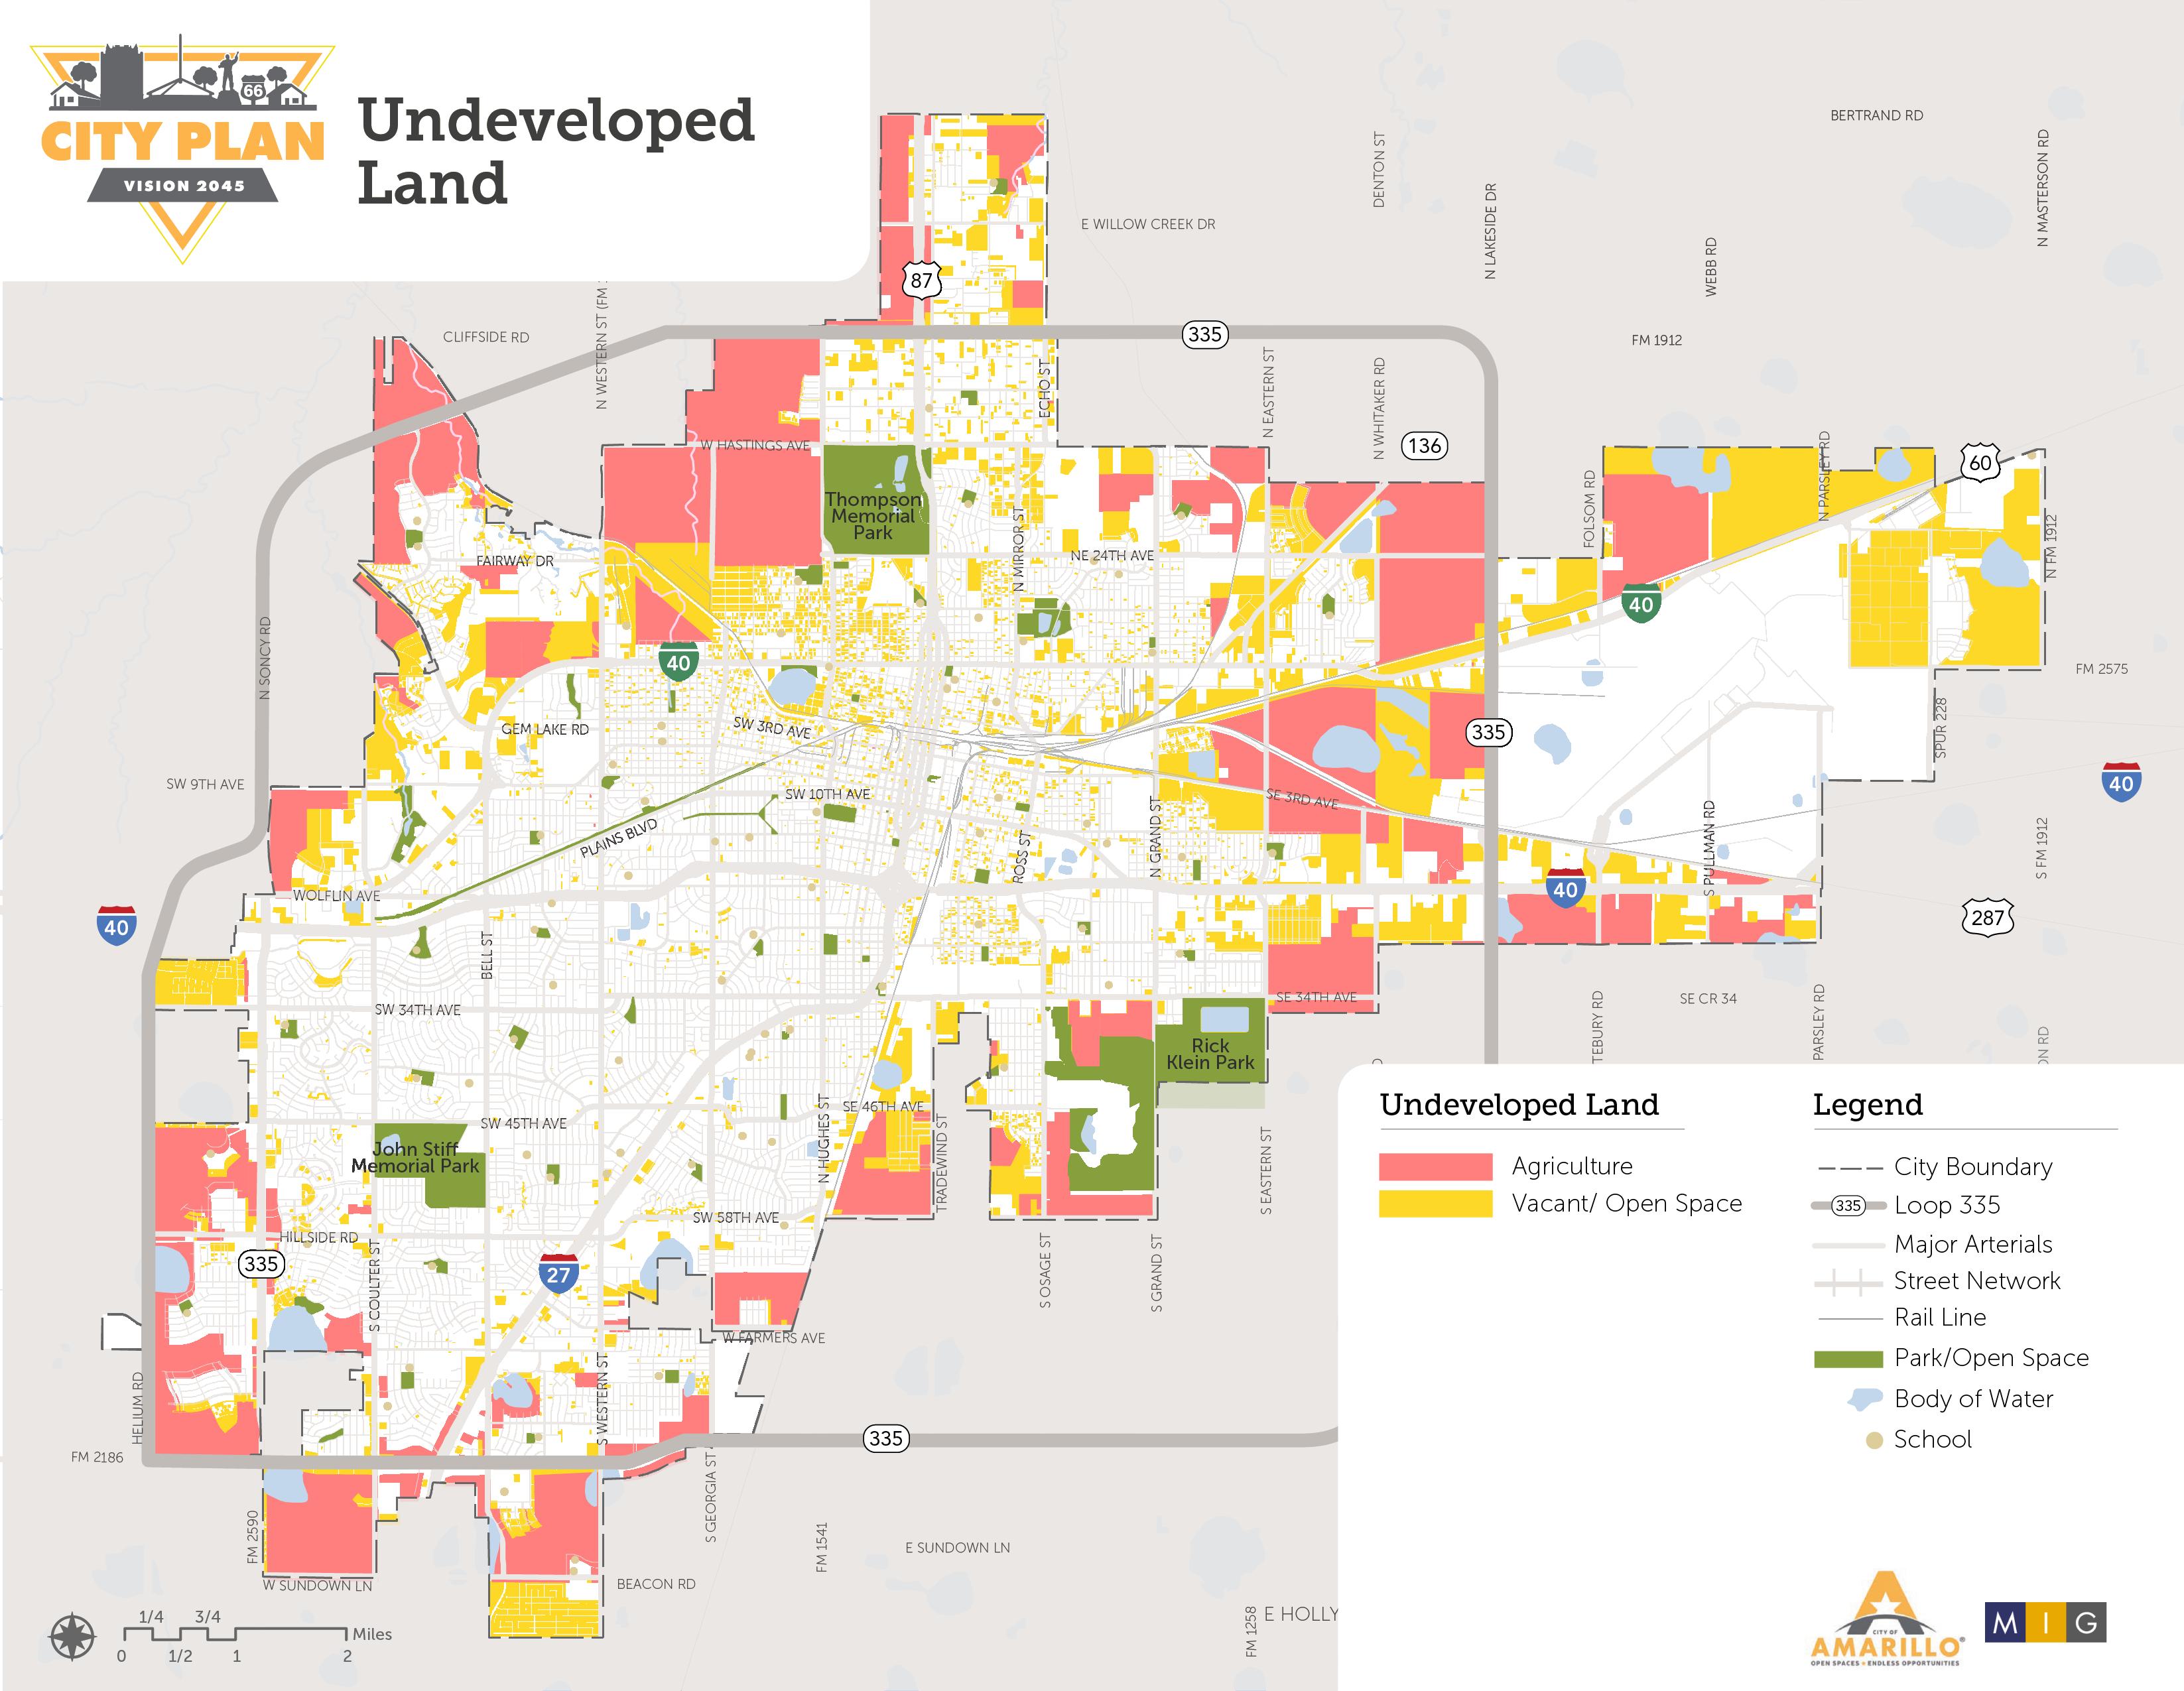
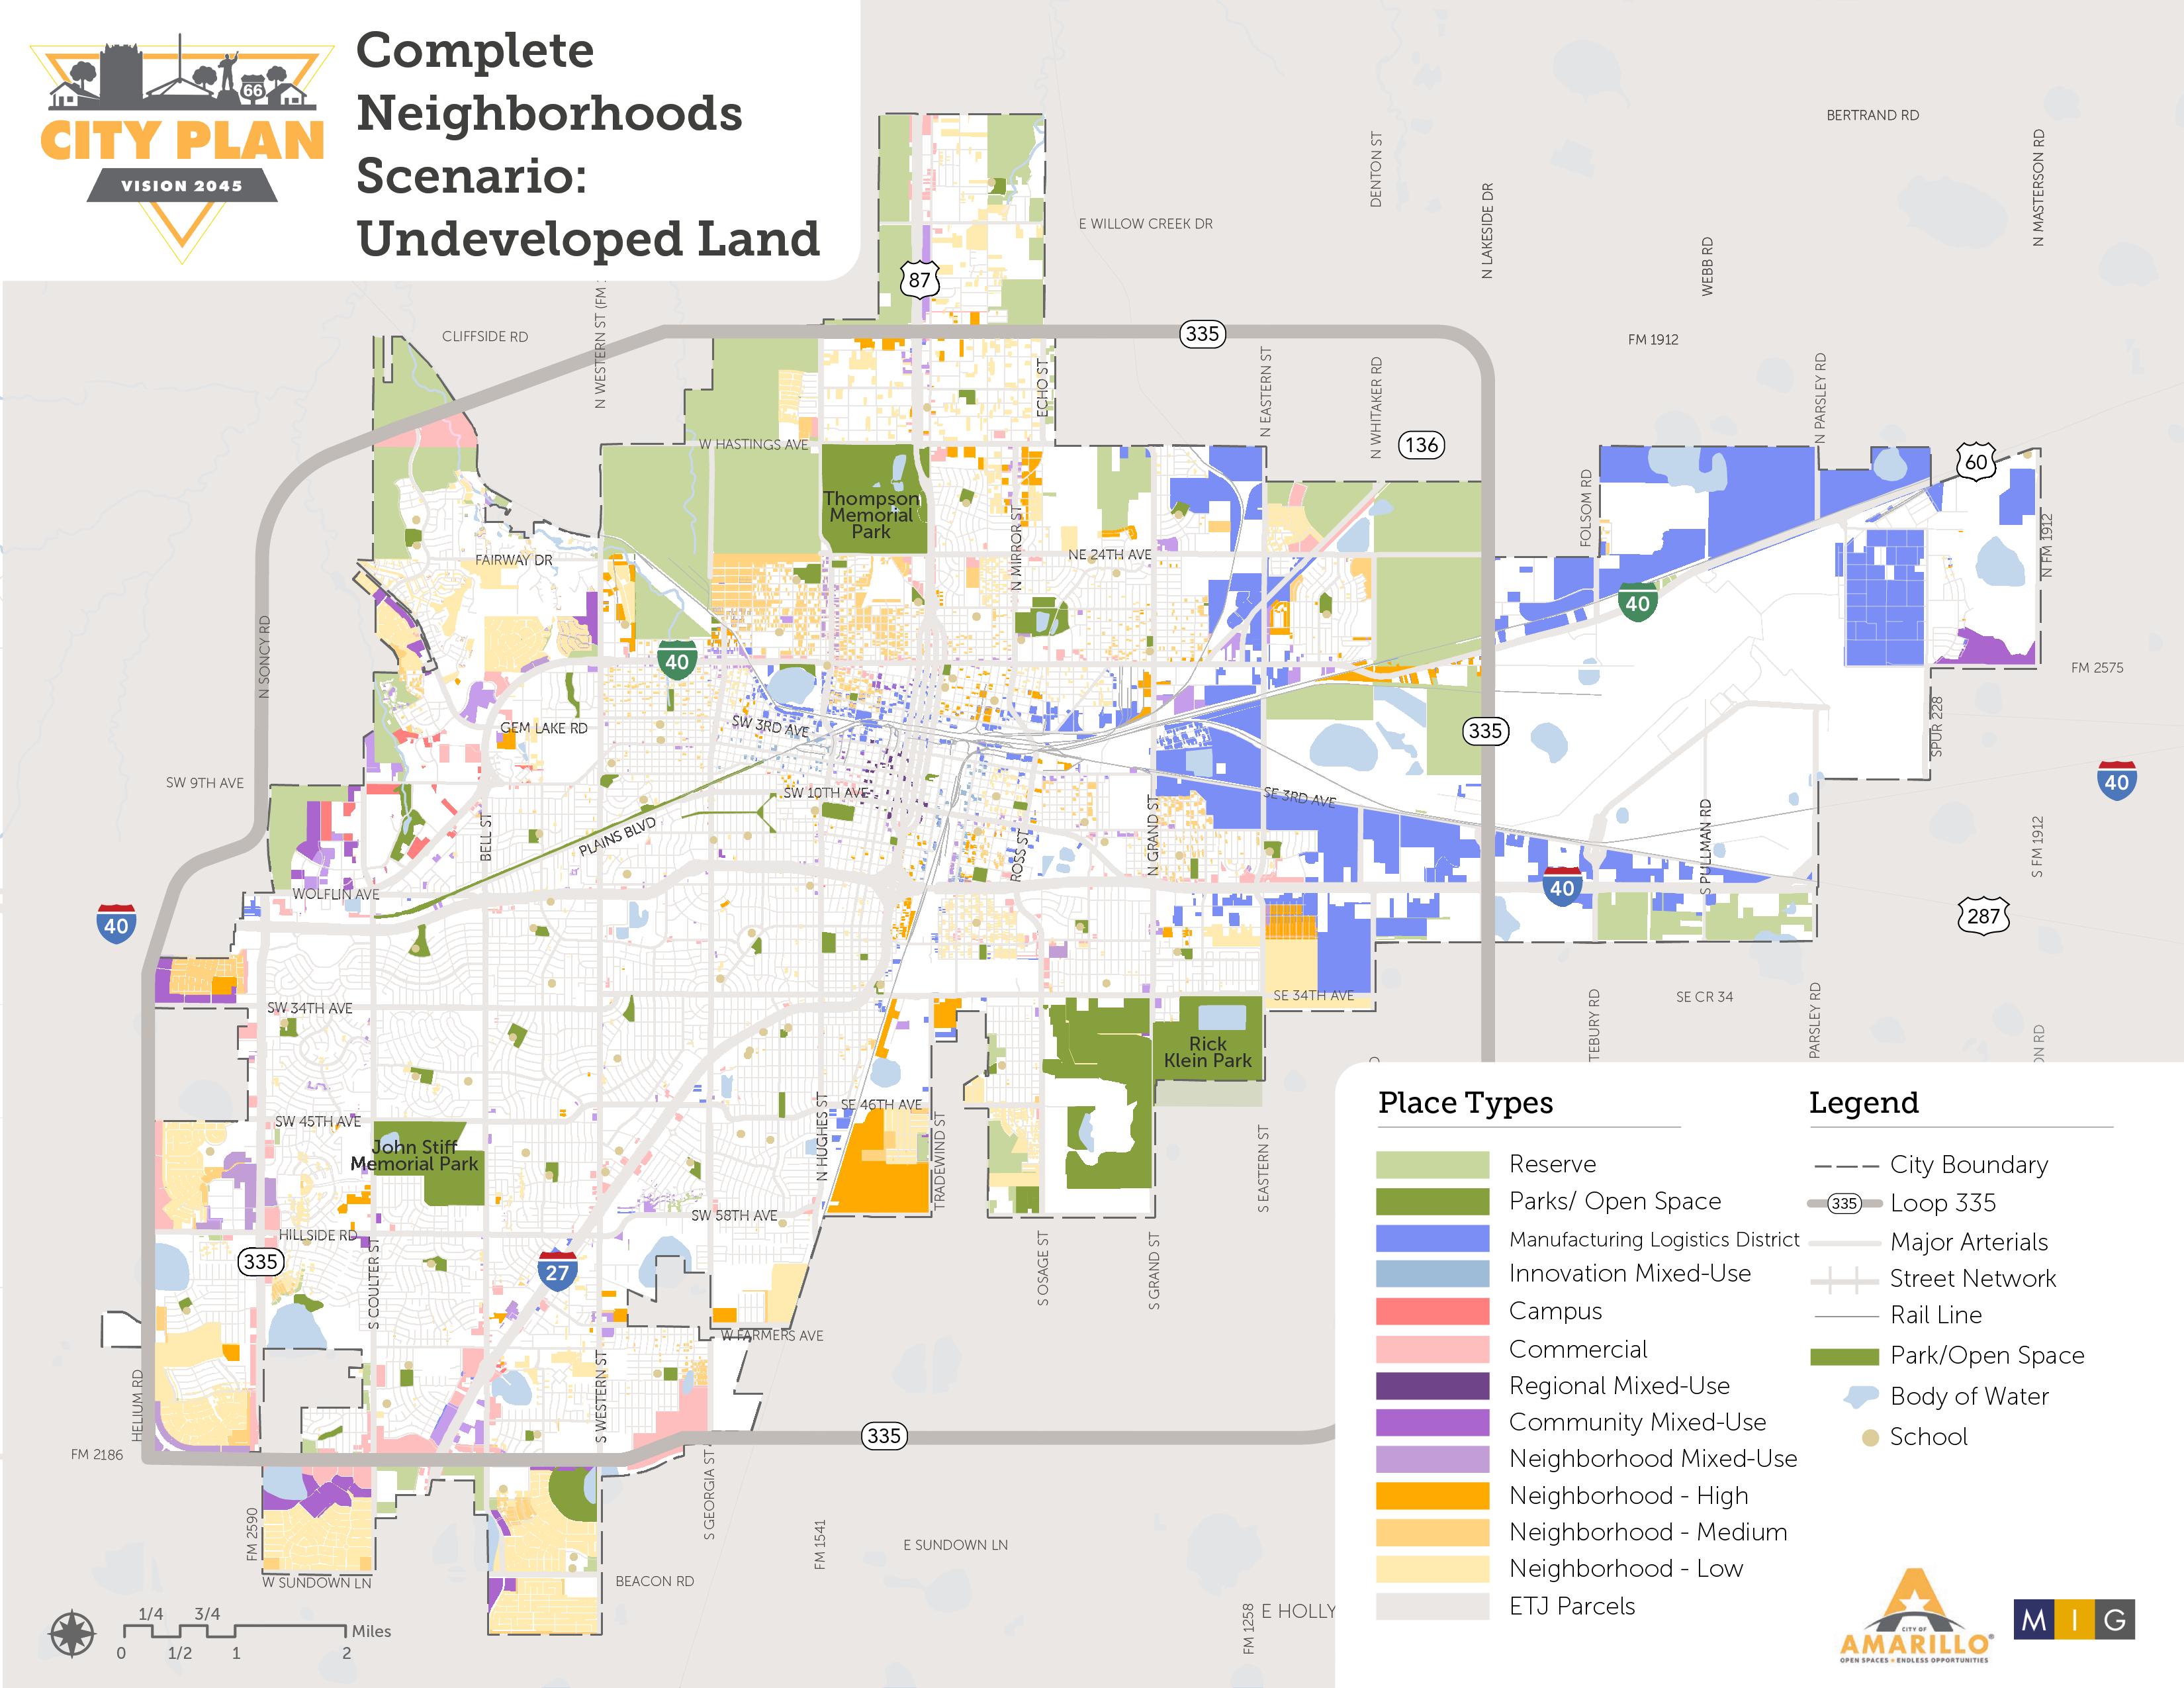
Vacant and undeveloped land offers a clear opportunity for new development to accommodate growth. While Amarillo has historically prioritized new greenfield development at the periphery, the Complete Neighborhoods Scenario also capitalizes on the many
vacant lots dispersed across Amarillo’s more developed areas. The map to the left shows lots that are currently undeveloped in Amarillo while the map below shows the Place Types allocated to those lots in the Complete Neighborhoods Scenario.
Corridors & Centers
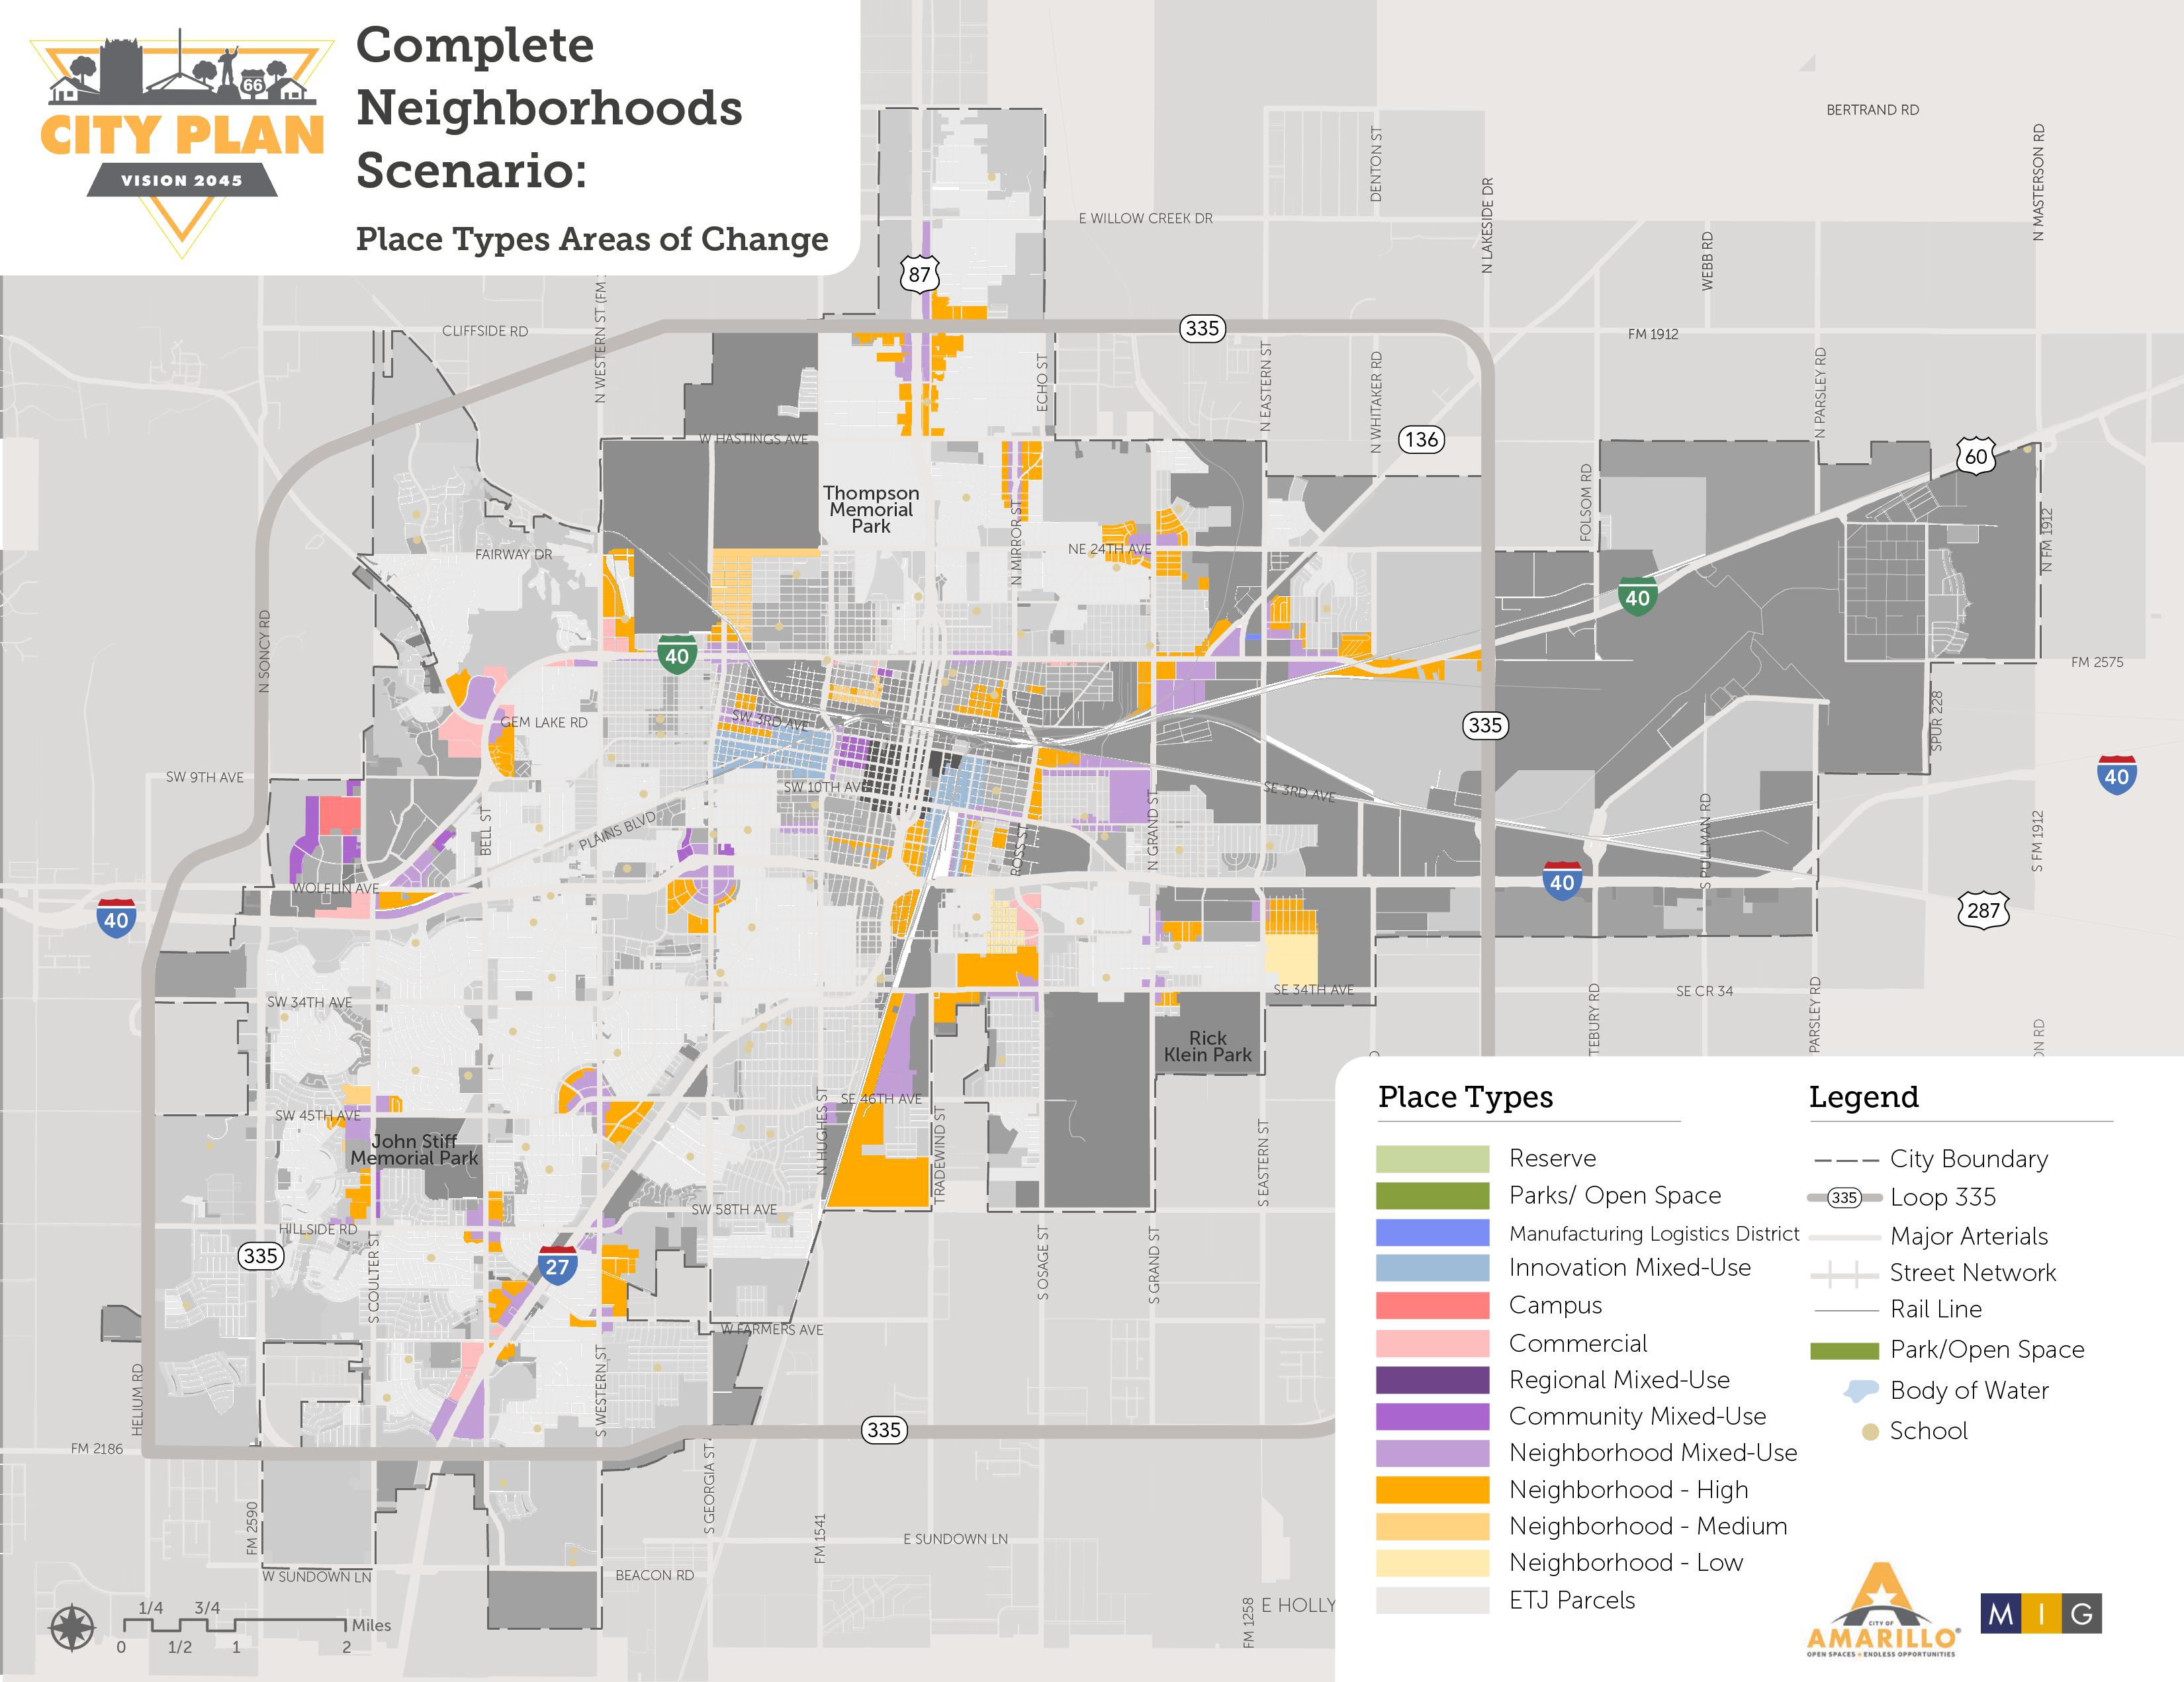
Beyond new development – whether it be greenfield or infill – the Complete Neighborhoods Scenario envisions several developed areas that will experience significant change in the coming decades, with the objective of maximizing corridors and community centers to provide greater opportunity, better quality of life, and an enhanced public realm for Amarillo residents. The
7% 47%
map below illustrates all developed parcels where the allocated Place Type reflects a marked departure from current conditions and characteristics. Many of these changes are grounded in increased density or mix of uses and activity, which is reflected in the prevalence of Neighborhood High, Neighborhood Mixed-Use, and Innovation Mixed-Use Place Types in these areas.
11% of parcels in Amarillo are designated with new Place Types are Neighborhood High are Innovation Mixed Use
27% are Neighborhood Mixed Use
5% are Neighborhood Medium
4% are Neighborhood Low
3% each are Commercial and Community Mixed Use
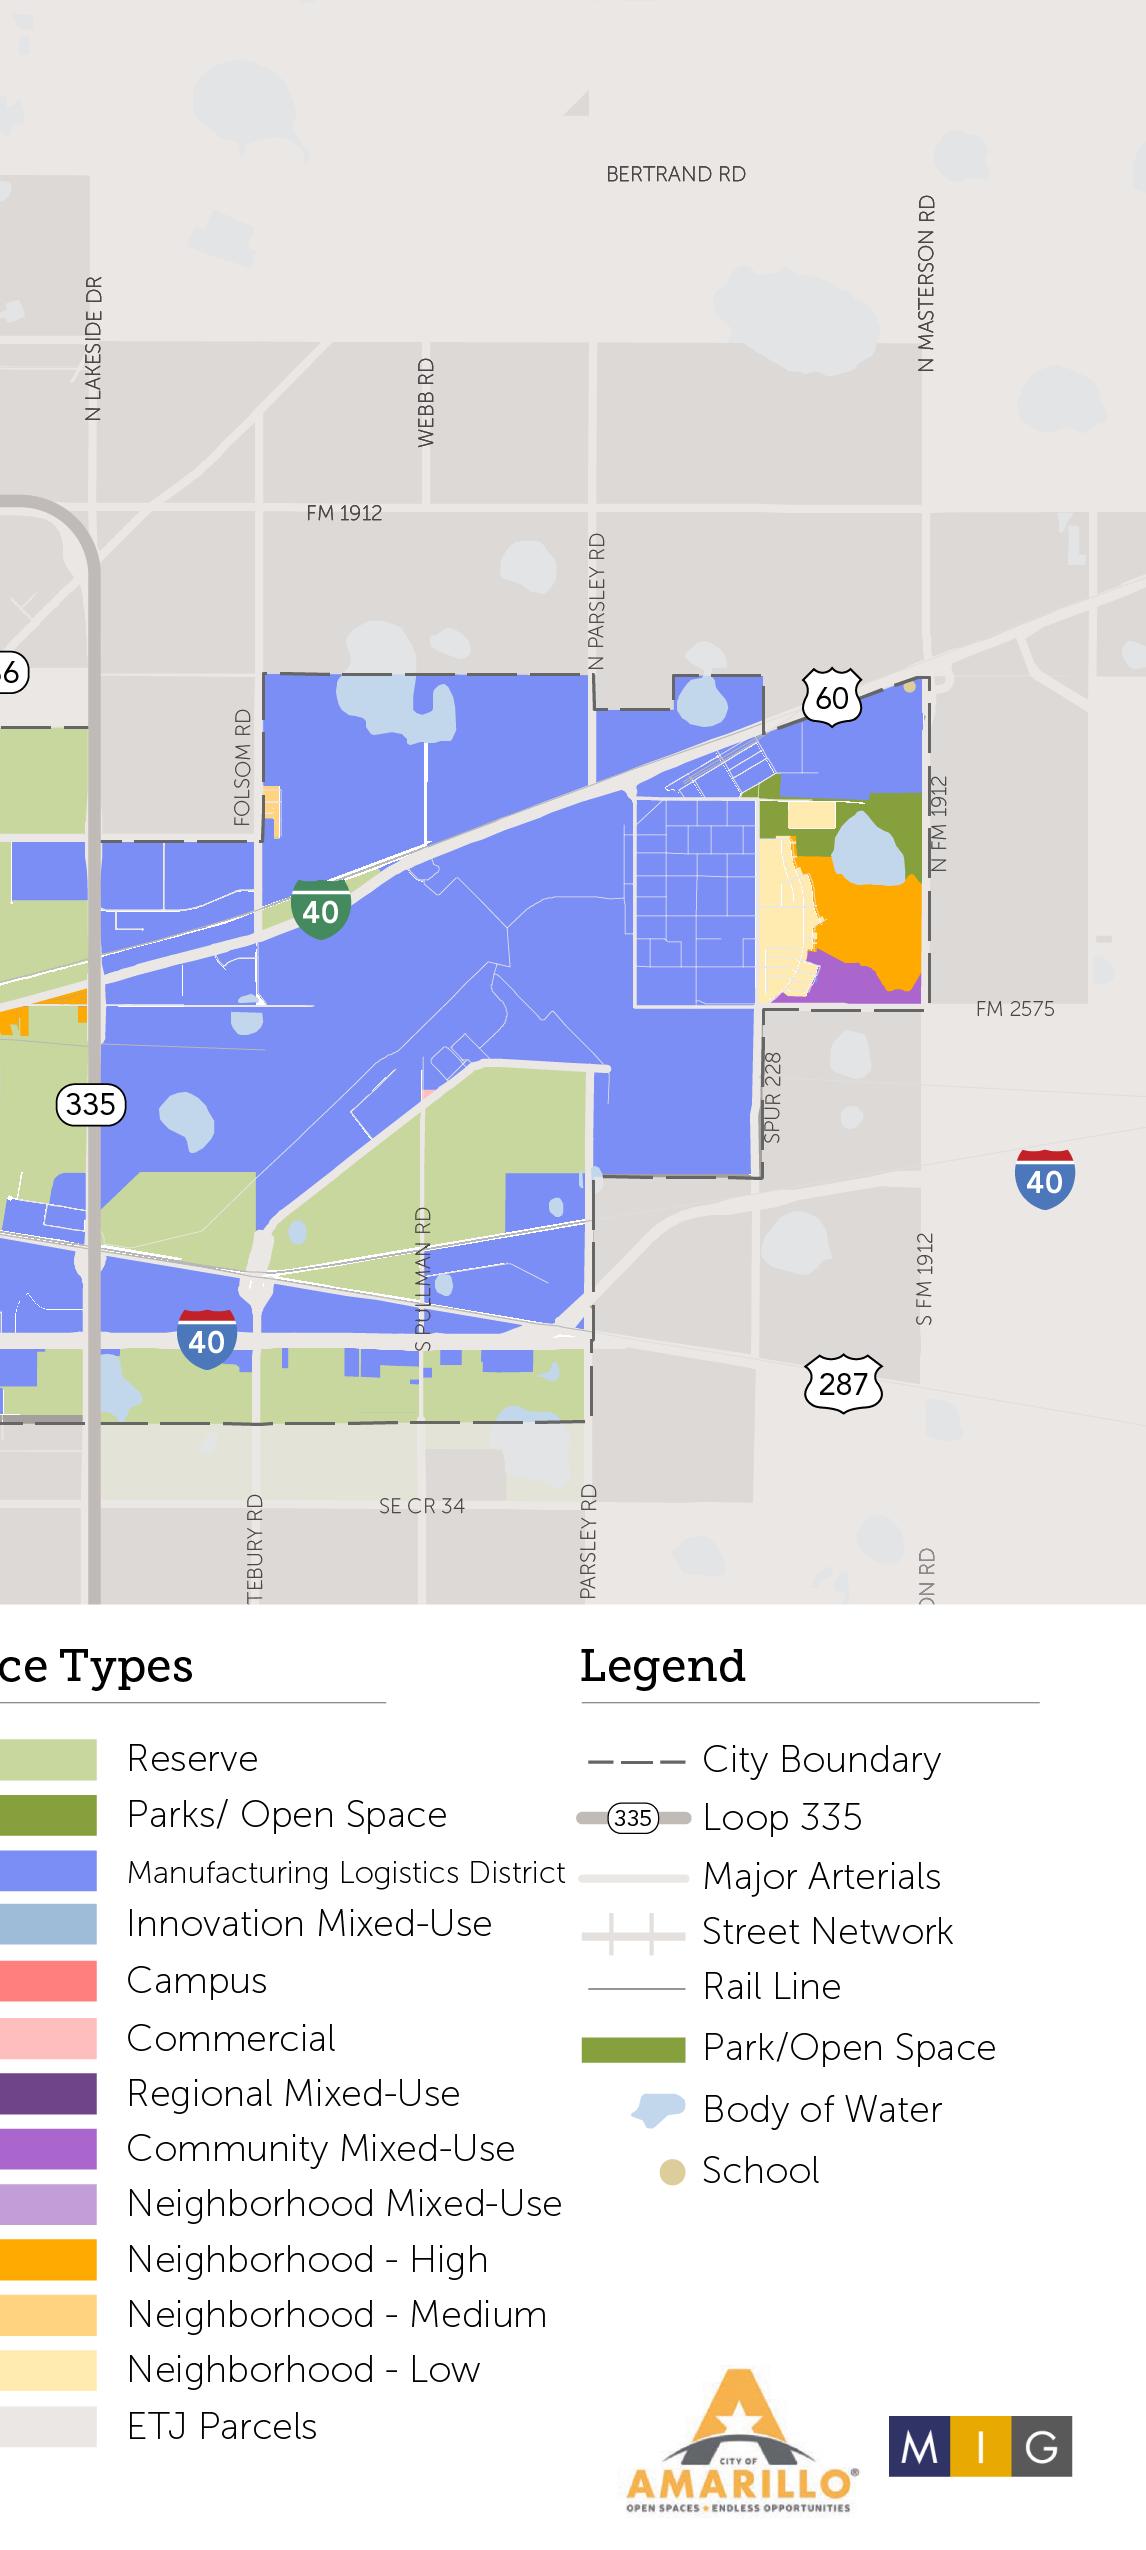
East Amarillo as a Growing Economic Center
City Plan recognizes the importance of East Amarillo as an employment center for the city and region. Recent economic development recruitment successes have resulted in the location of multiple major employers, while the development of housing, retail, and commercial has lagged. Large tracts of land owned by the Amarillo Economic Development Corporation, Amarillo College, and the City of Amarillo’s Rick Husband International Airport pose opportunities for the continued strategic recruitment of major employers along with supportive services and residential, especially workforce housing. The Complete Neighborhoods Scenario provides a framework for better coordinating development in the future especially around housing, transportation, and infrastructure as employers continue to locate in this area. A sub-area plan could also be a helpful tool to address specific planning needs related to the airport and federal aviation guidelines for noise, height, and land use.
Neighborhood Stabilization
In some cases, land use changes, infrastructure investment, and other placemaking initiatives will be critical for turning around current patterns of disinvestment and decline in character that some neighborhoods have experienced over the last decades. It will be up to residents and property owners to initiate land use changes, guided by the objectives of City Plan, to reduce incompatible adjacent uses and offer predictability for future investment from the private sector. Areas with the following conditions should be prioritized for further planning and stabilization efforts.
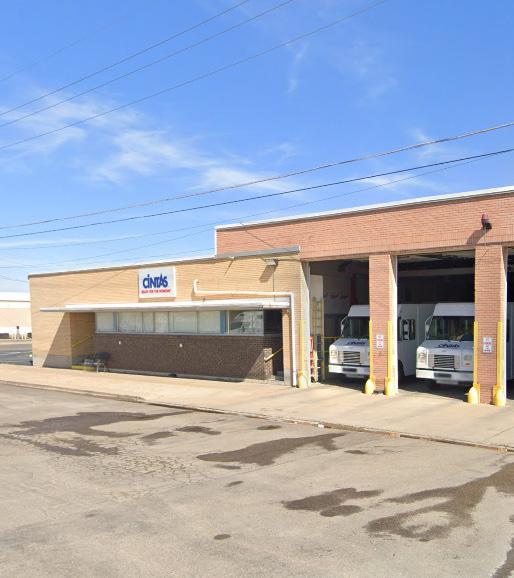
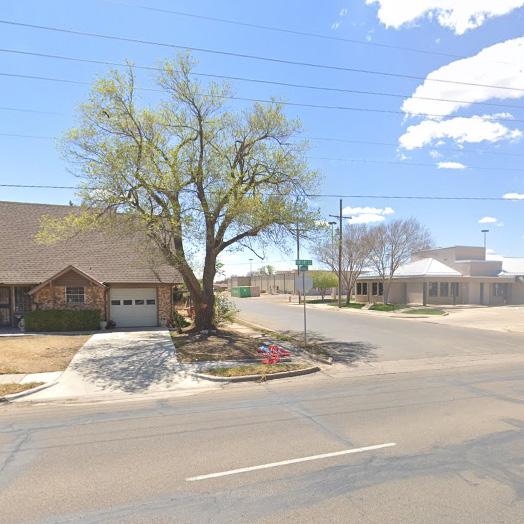
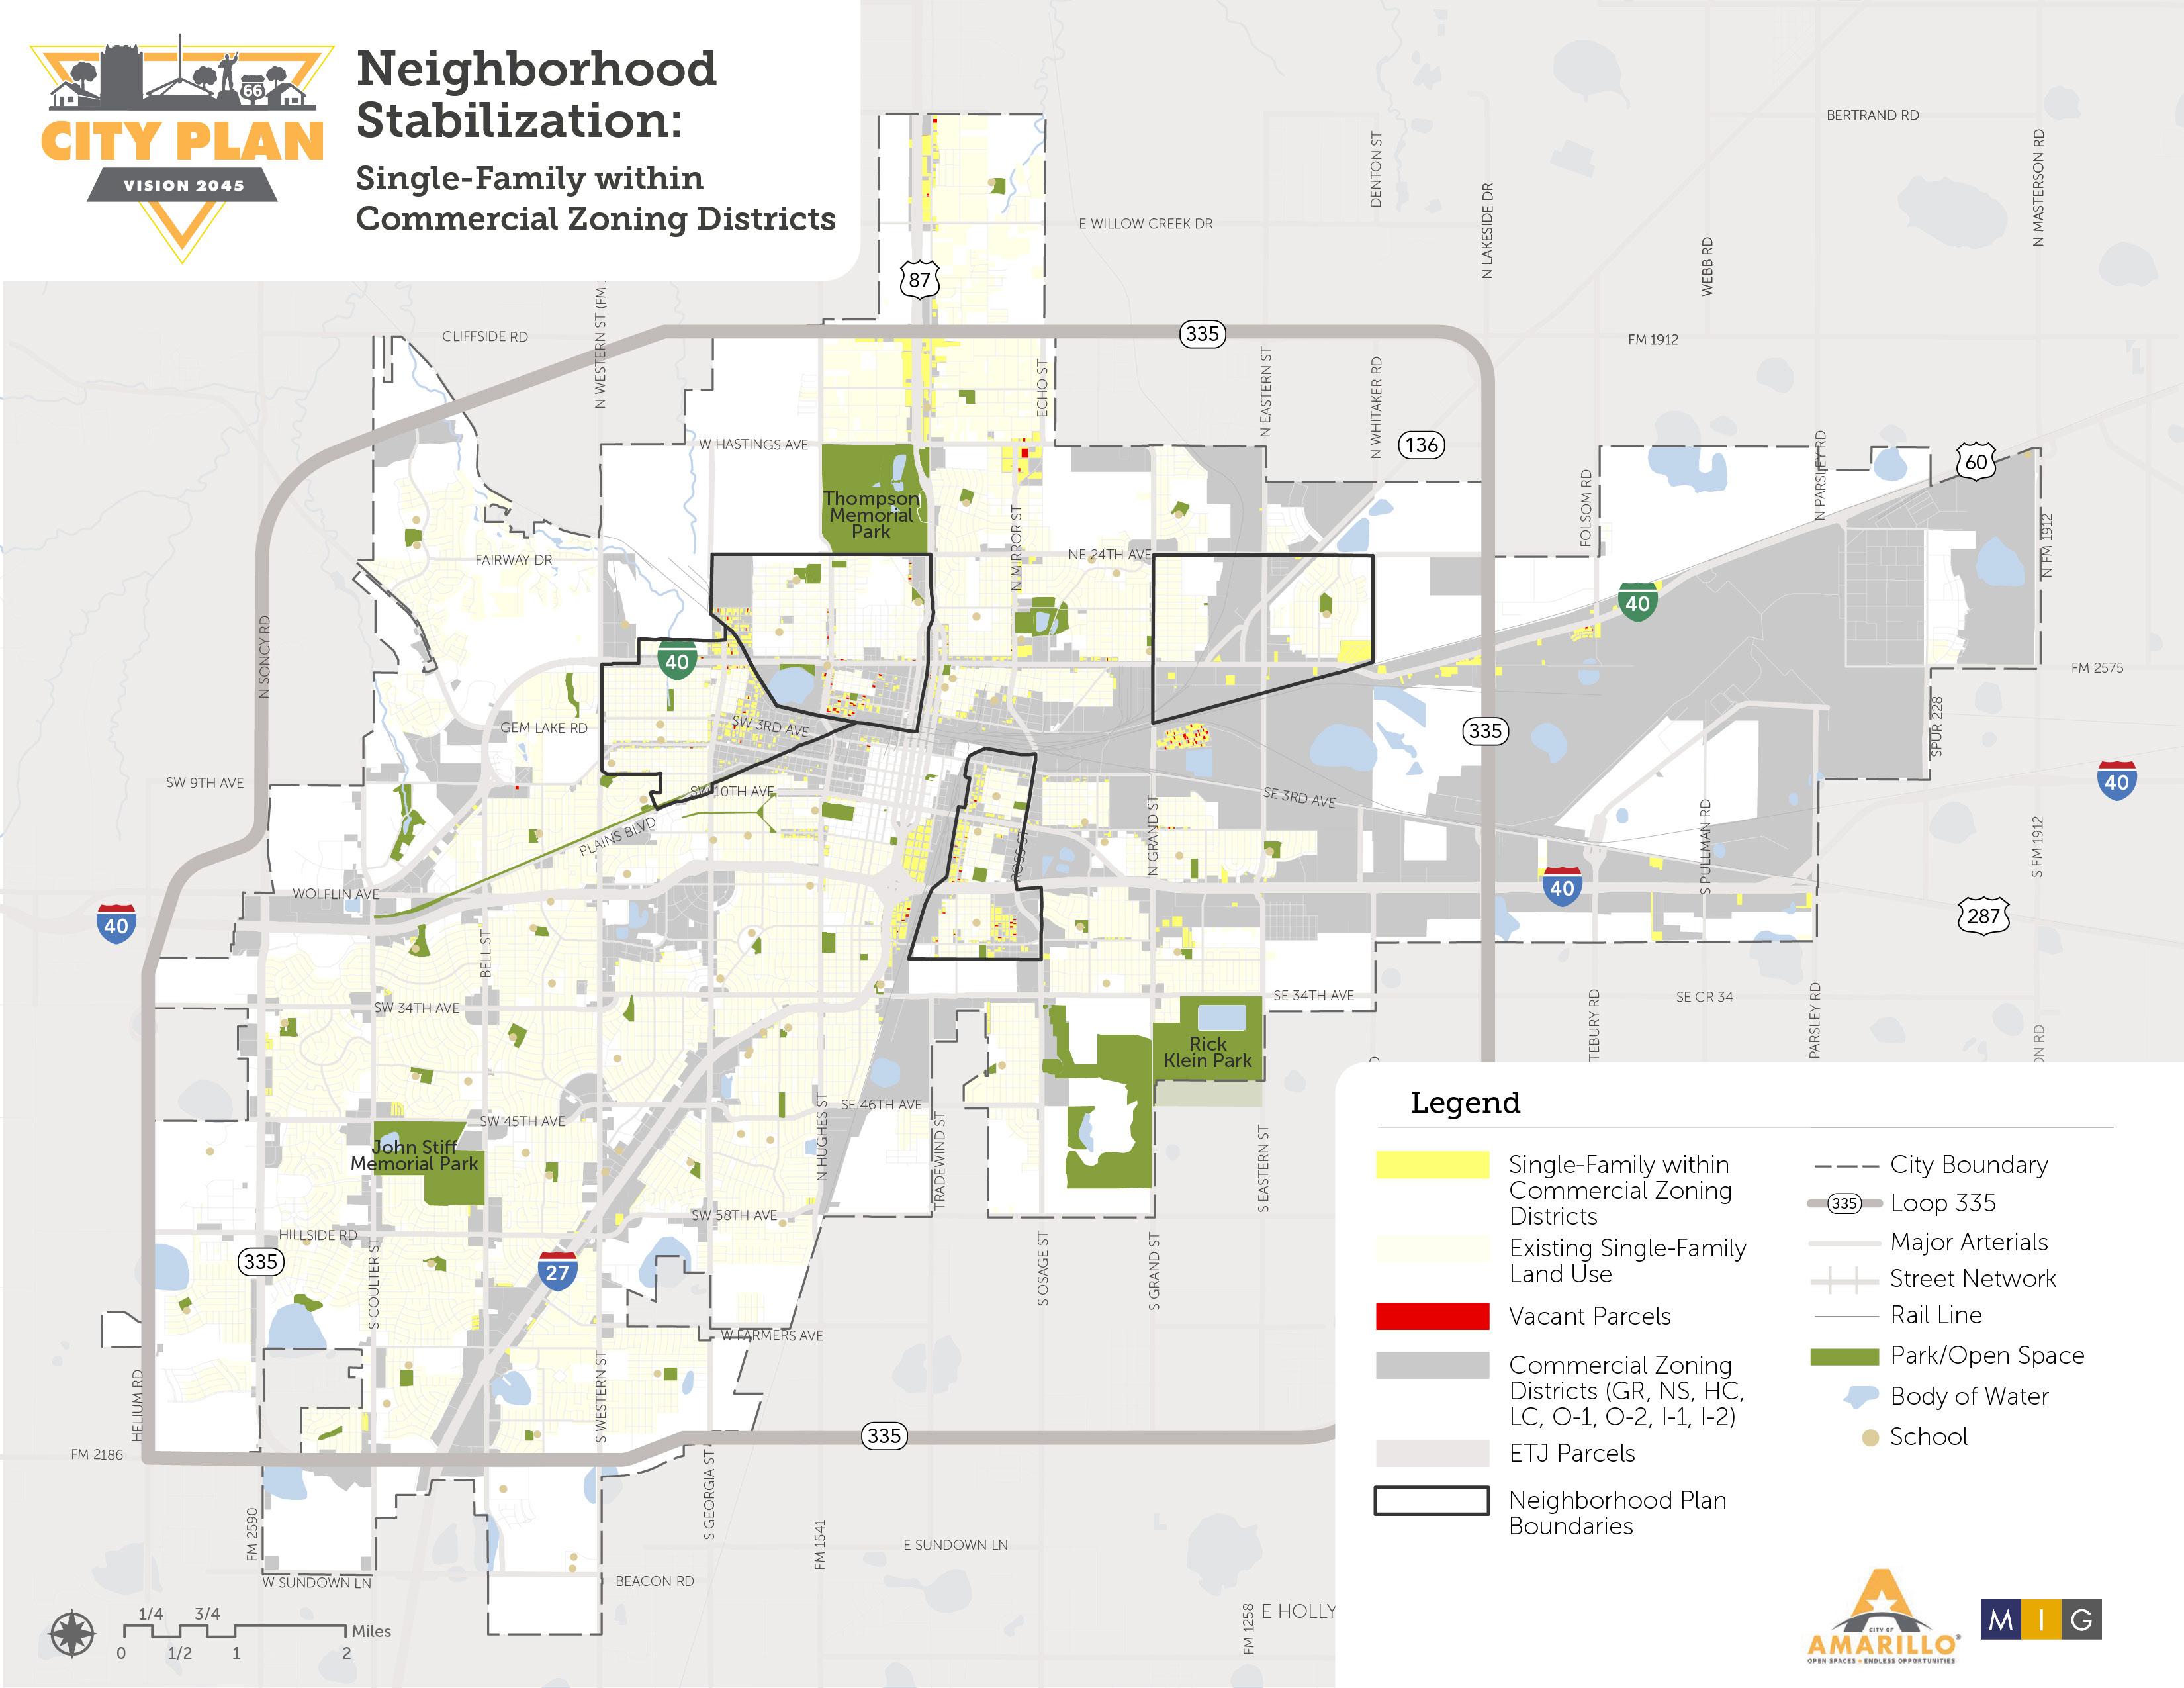
Single Family Neighborhoods within Commercial & Industrial Areas
Some single-family neighborhoods built long ago are currently zoned as commercial or industrial due to the presence of those uses nearby. In particular, properties zoned Light Industrial-1, and Heavy Industrial-2 are non-conforming and at risk of encroachment. With strategic planning and voluntary zoning changes, these incompatible uses can be clarified and contained, preserving both where they are appropriate and promoting new compatible infill development. The map titled “Neighborhood Stabilization: Single-Family within Commercial Zoning Districts” (next page) illustrates these areas.
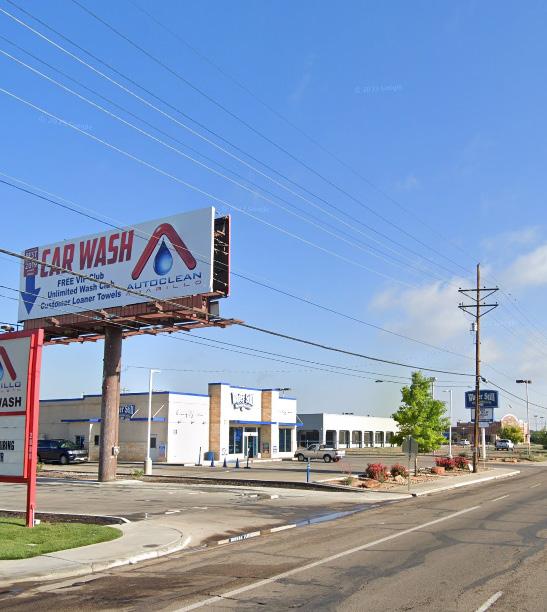
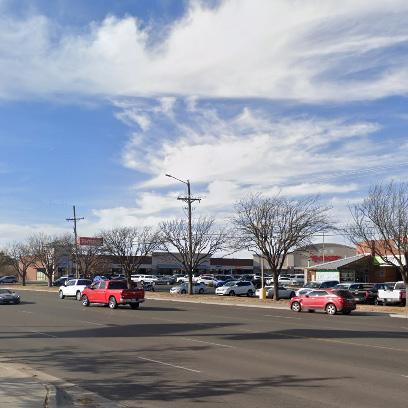
Declining Commercial Corridors
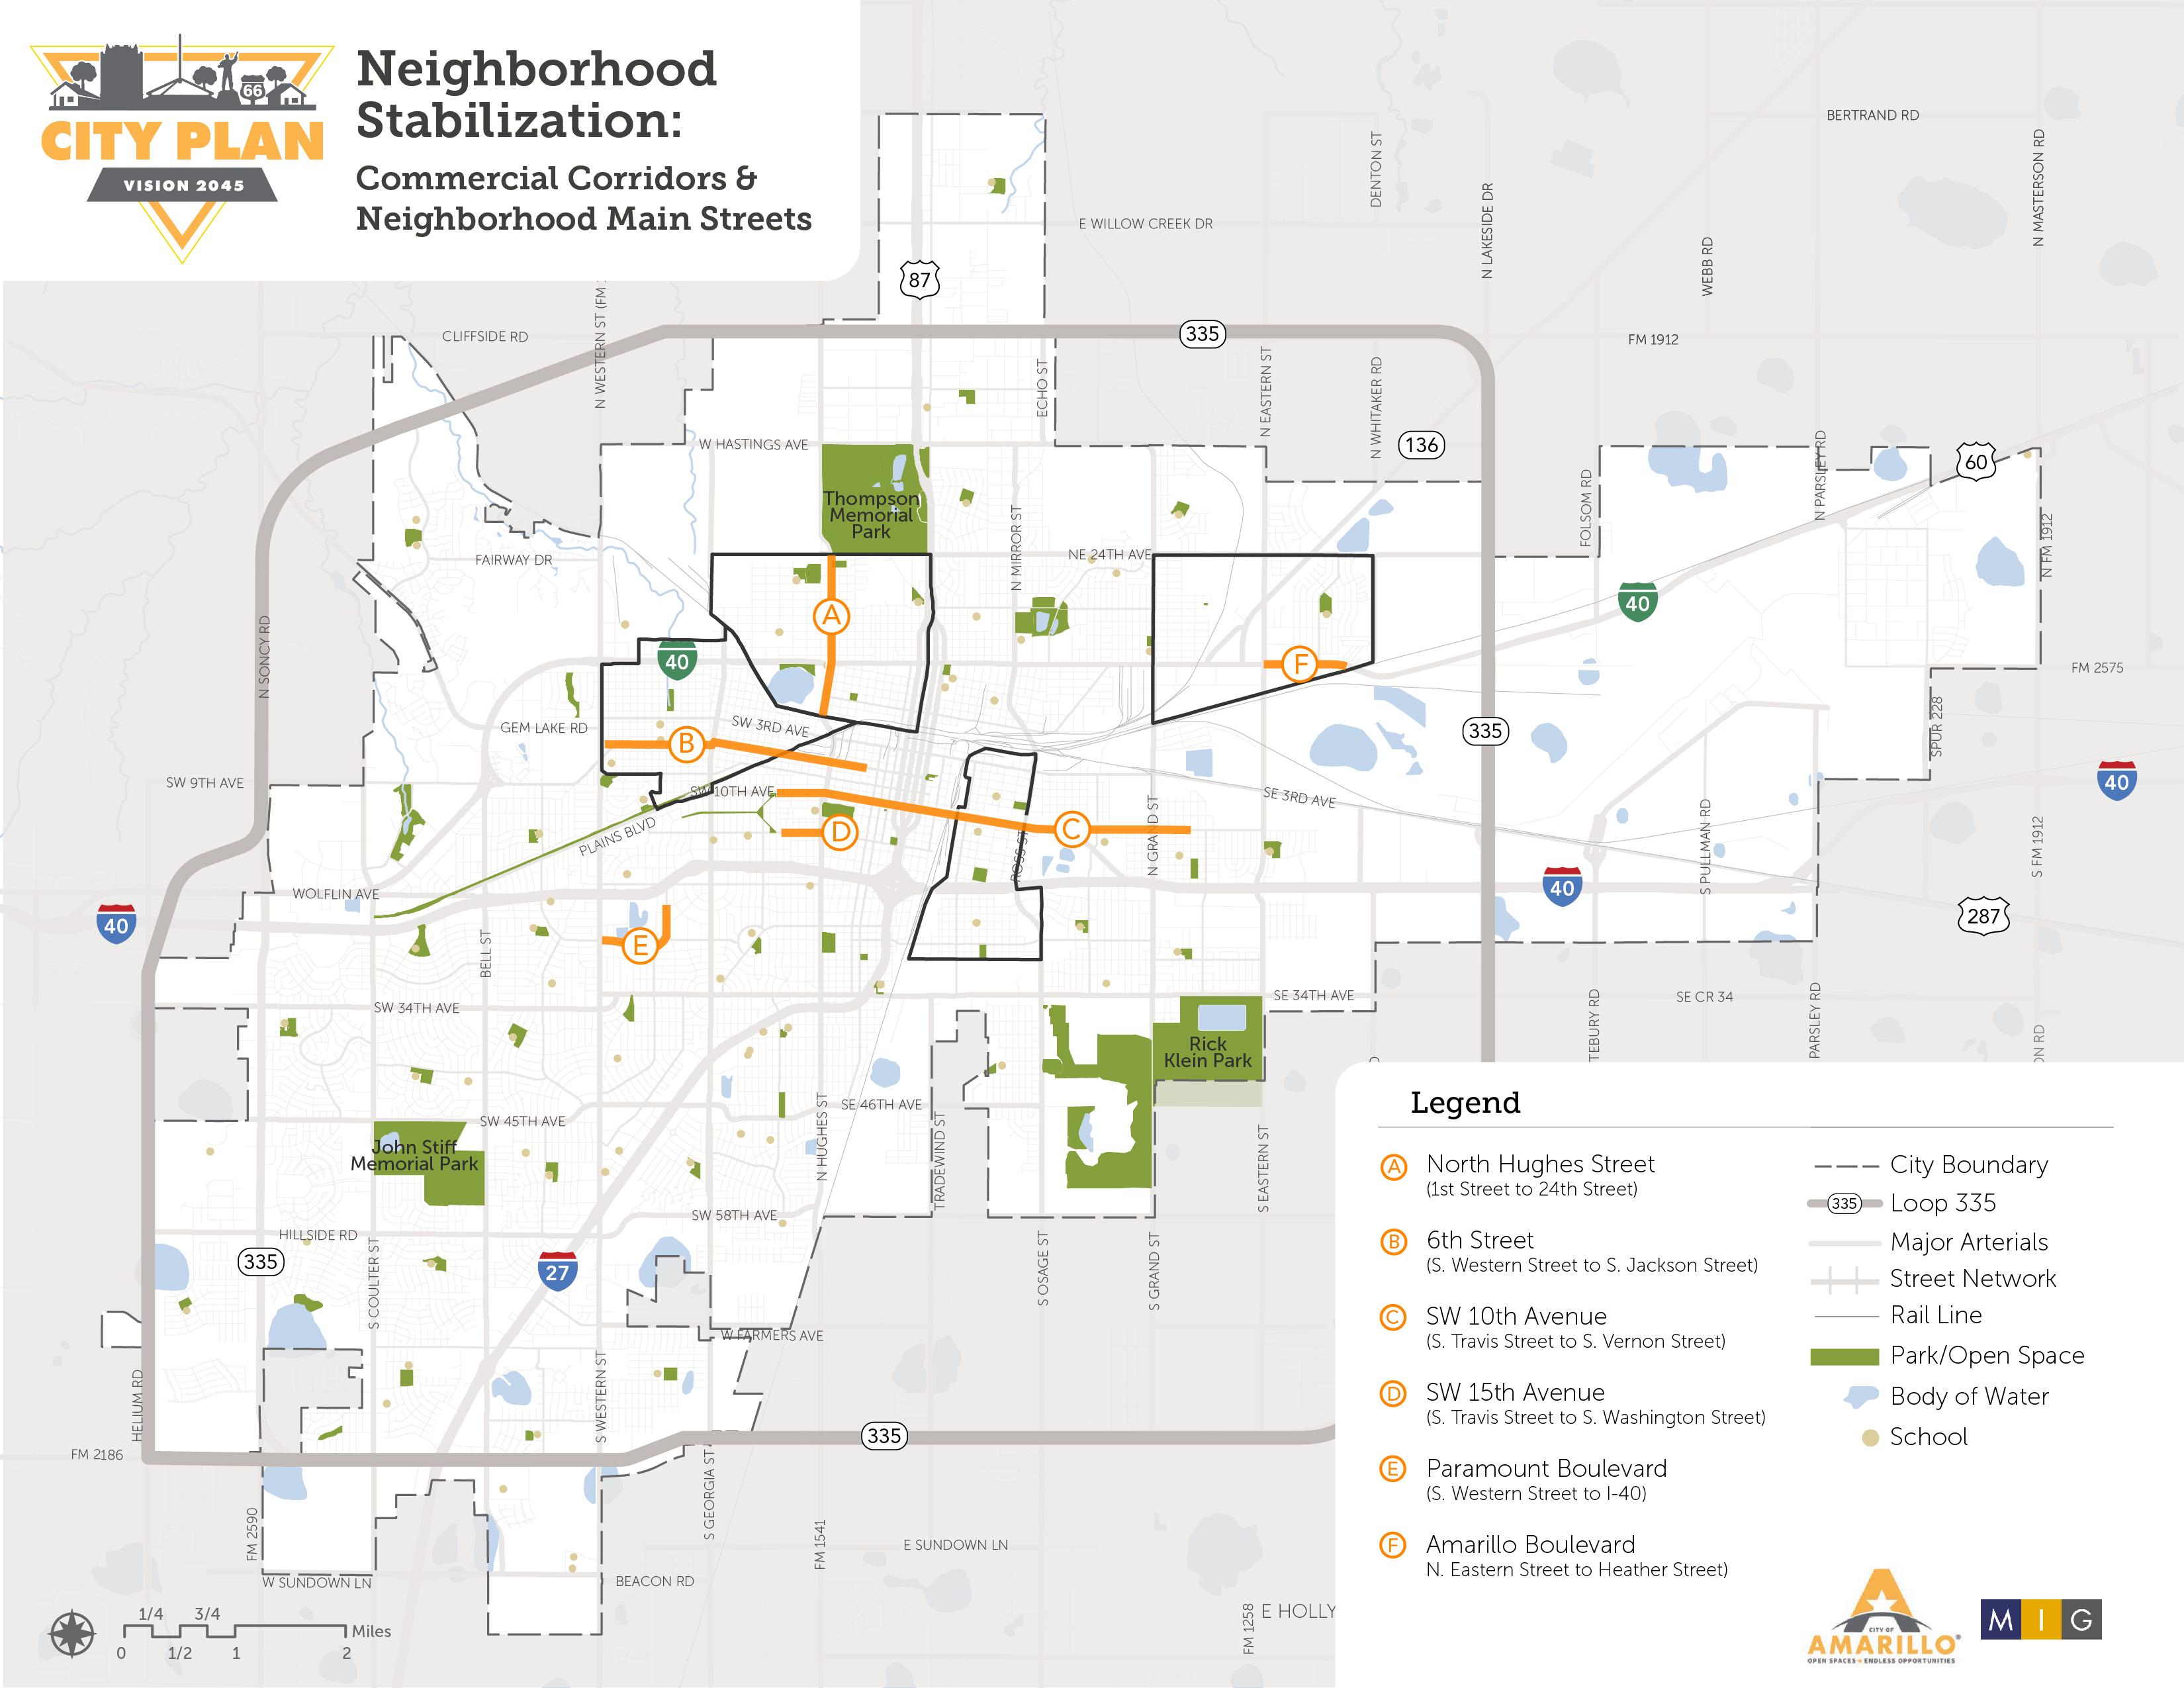
Several commercial corridors of historic importance exist near the neighborhoods identified above. These corridors have also experienced decline and are at risk of still further decline. Many also exhibit the negative effects of auto-oriented development trends, producing busy, expansive streets that do not invite foot traffic. With strategic planning and reinvestment, these areas can be revitalized as walkable, mixed-use districts and main streets that serve nearby neighborhoods. The map titled “Neighborhood Stabilization: Commercial Corridors & Neighborhood Main Streets” (page 60) shows the location of these specific corridors, which include:
• North Hughes Street, from 1st Street to 24th Street
• Sixth Street, from S. Western Street to S. Jackson Street
• 10th Avenue, from S. Travis Street to S. Grand Street
• SW 15th Avenue, from S. Travis Street to S. Washington Street
• Paramount Boulevard, from S. Western Street to I-40
• Amarillo Boulevard, from N. Eastern Street to Heather Street
of all single-family parcels are zoned for commercial use of all single-family parcels are zoned for heavy commercial or industrial use of these these parcels are located within existing Neighborhood Plan boundaries, indicating that the Neighborhood Planning initiative could be a useful tool for stabilizing these areas (see Chapter 8 for more details).
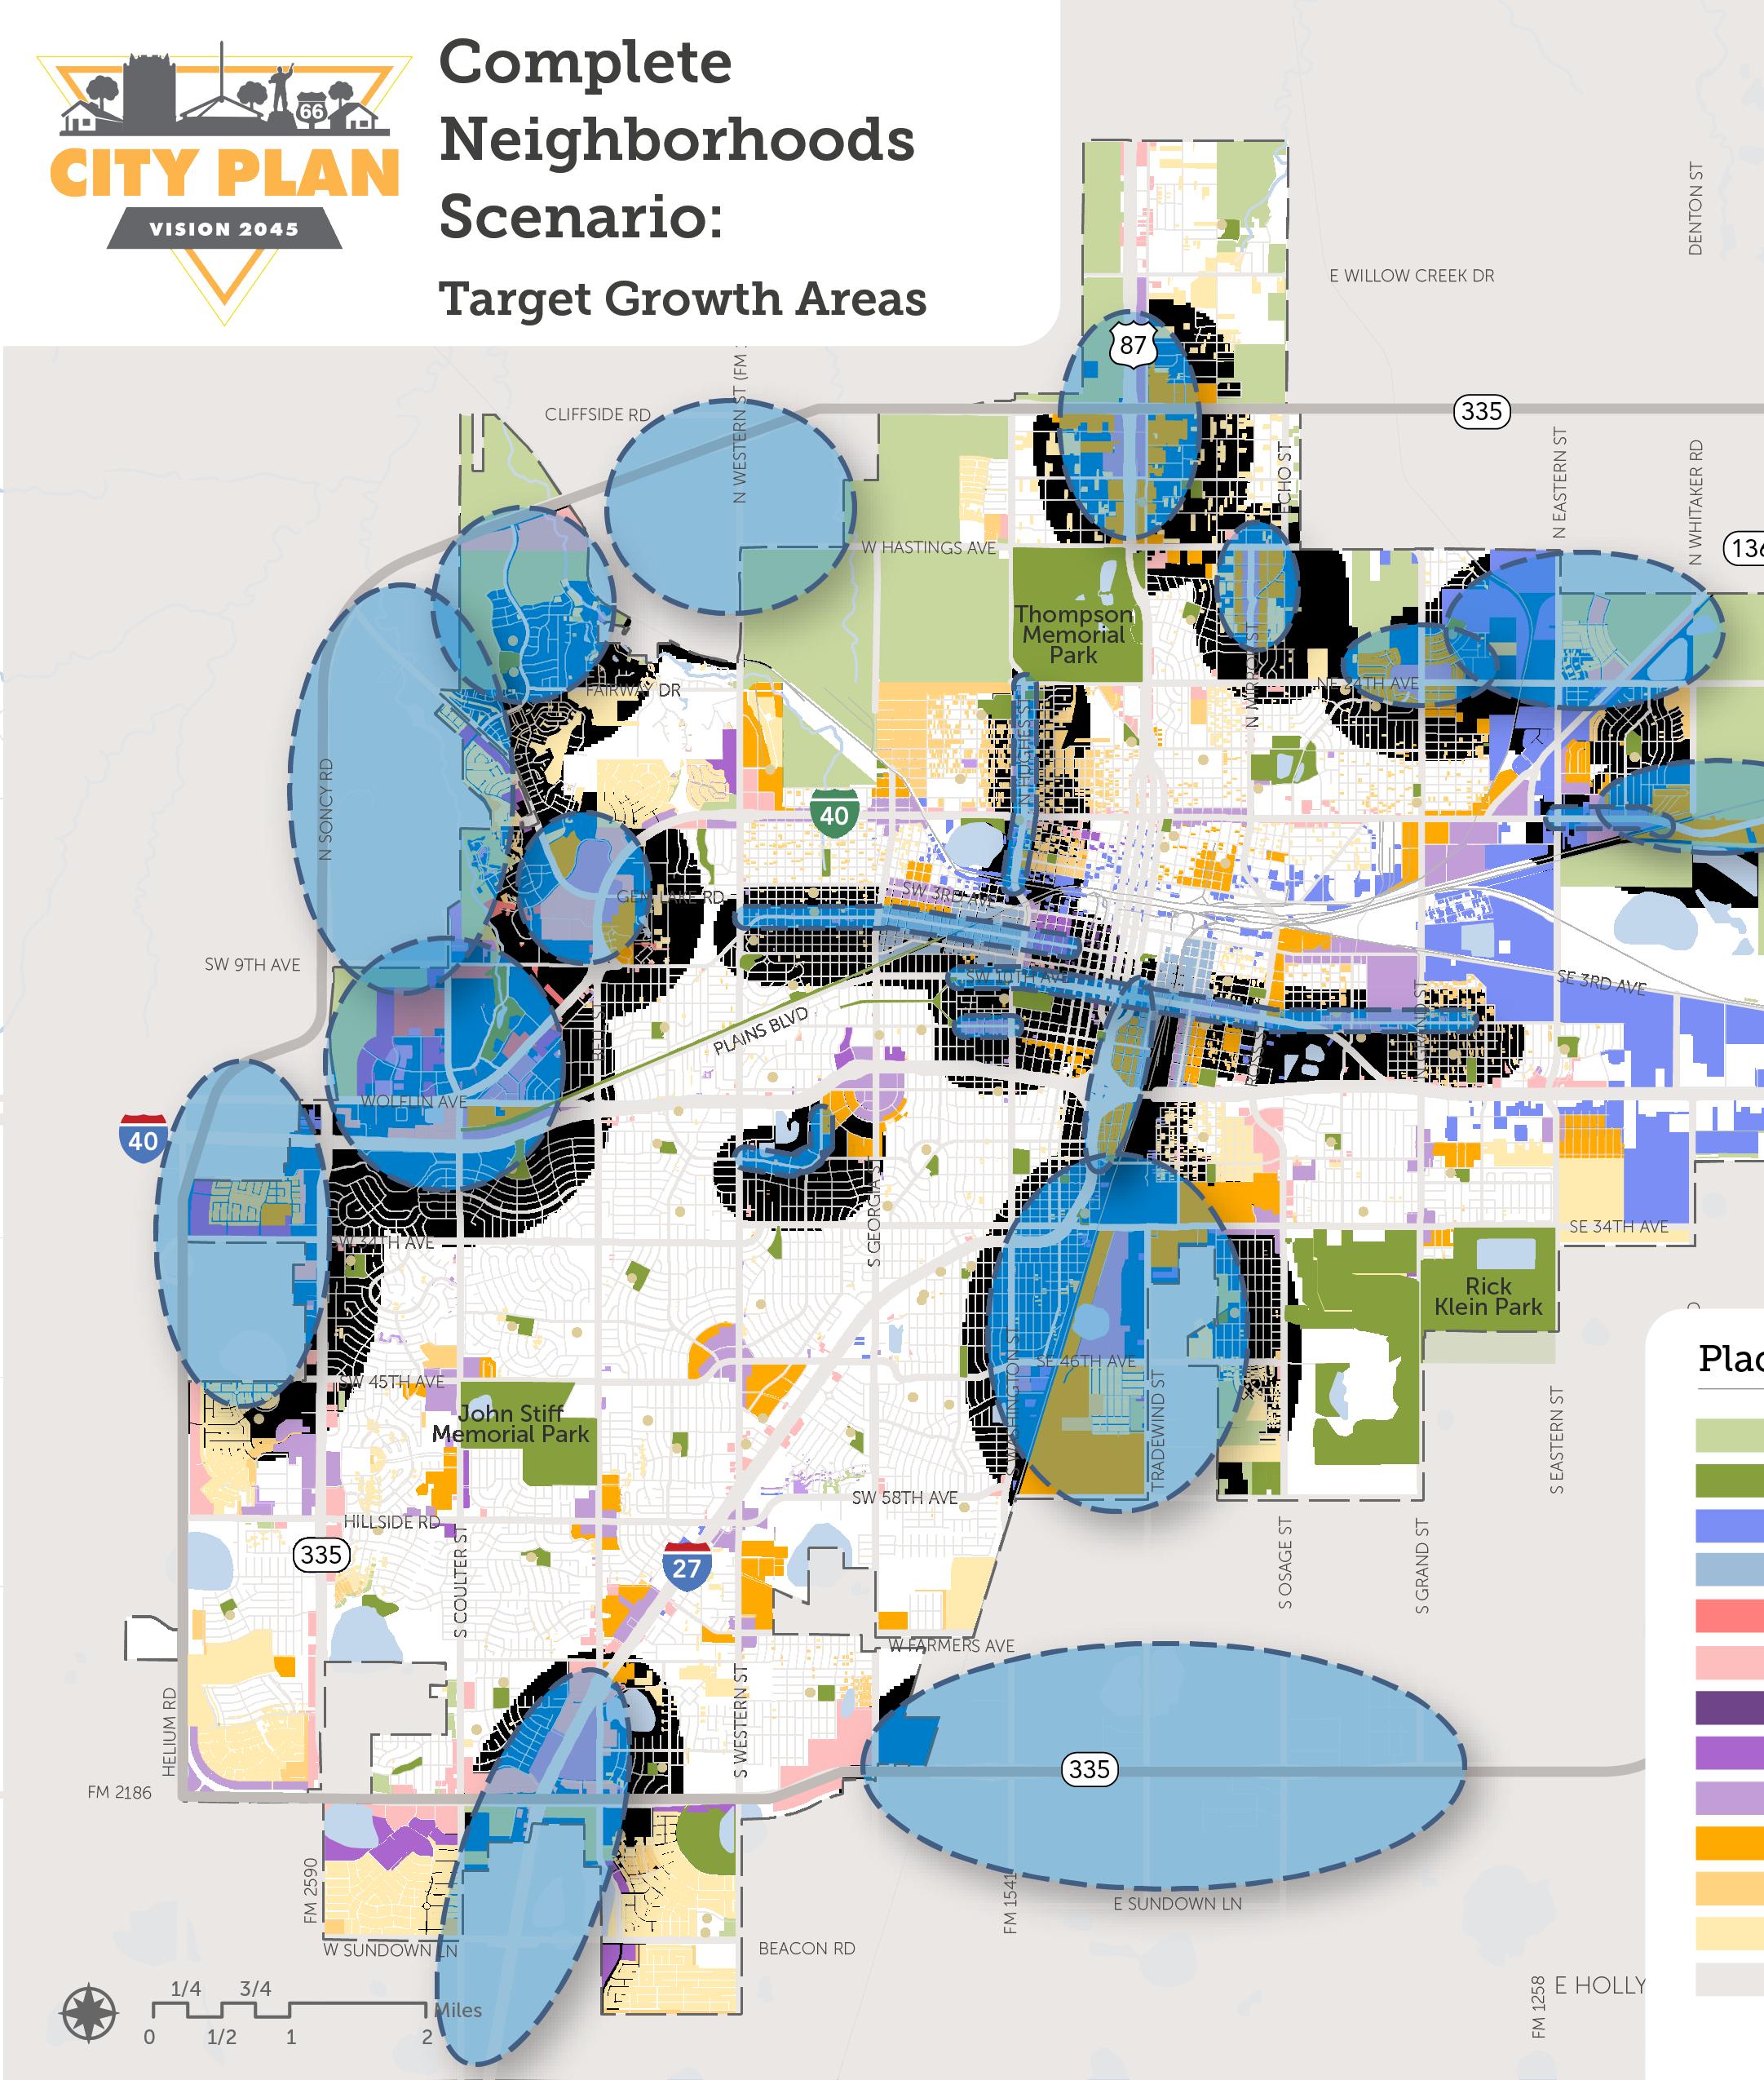
Finding Synergy
These three opportunities for growth and community enhancement - vacant and undeveloped land, corridors and centers, and neighborhood stabilization - often work in concert. For example, development on vacant properties that are integrated or adjacent to a commercial corridor may catalyze further reinvestment and redevelopment. The Targeted Growth Areas map to the left illustrates the combined characteristics of these three distinct opportunities and collectively represents the areas that are suited to accommodate the greatest amount of growth and forward-looking change in Amarillo.
Fiscal Considerations
Land use policies and the pattern of growth within Amarillo can have a major impact on the fiscal health of the community. The City’s ability to provide services and infrastructure for citizens can be hampered by land use policies that create inefficient service delivery and land use patterns that are more costly to serve. The major impacts that land use and growth have on the City’s fiscal health were identified to guide land use scenarios. A fiscal impact model was built to analyze the fiscal impact of the future land use plan. This section provides an overview of this analysis and the major findings/ considerations identified.
Amarillo Fiscal Context
The City of Amarillo has an overall budget of $531 million for the 2023/2024 fiscal year. This budget contains 11 separate funds with the largest two funds being the General Fund, which is used for on-going operations of the city for most services, and the capital improvement projects fund. These two funds are the most directly impacted by land use policies and by the vision provided in this comprehensive plan.
The General Fund was the primary focus of the fiscal impact analysis given its direct tie to land use policy and its importance in fiscal health. The city’s General Fund budget for fiscal year 2023/2024 was $250.6 million.
Major Revenue Sources
Taxes charged by the City of Amarillo generate the largest portion of General Fund revenues with sales tax and property tax being the biggest and accounting for 56% of General Fund Revenue.
Property Tax (current rate of $0.39195 per $100 of taxable value) accounts for 23% of General Fund revenue. Property tax collected by the city has two portions. A portion is used to fund on-going operations and maintenance while the remainder is dedicated to repaying debt issued as part of large capital improvement bond packages. Sales Tax (current rate of 2.0%) is the city’s largest revenue source and generates $77 million per year, accounting for 33% of General Fund Revenue.
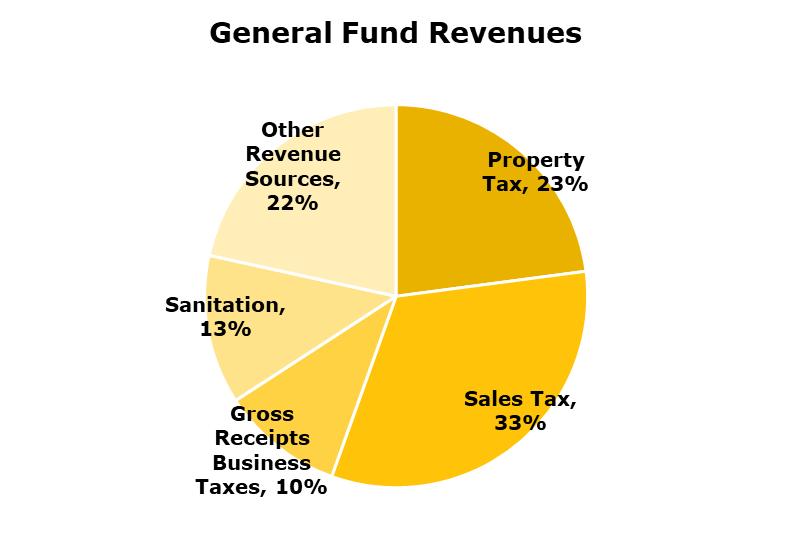
Major Expenditures Sources
Public safety services account for the largest portion of the General Fund expenditures. Police services account for 24% and Fire account for 17%. Other large expenditure categories for the city include support services (17%) which includes human resources and city facilities management, leisure services (11%) which include parks and recreation services, transportation (9%) which includes street maintenance and transit services, and utility services (9%), which includes trash collection.
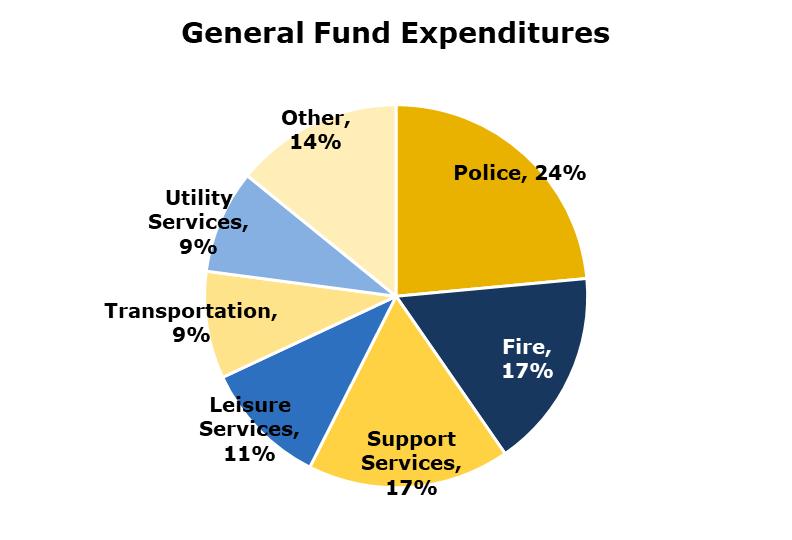
Sanitation (trash collection) is the only service with an ample cost recovery mechanism in the General Fund, which means city revenues are split among these important services through a discretionary budgeting process. Ensuring that the city is growing in a manner that allows for efficient provision of services and limits underutilized infrastructure is important, especially for a city with lower tax rates.
Land use policies and the future land use plan can impact the cost of providing services for most of these major expenditure categories. In particular, fire, transportation, and leisure services are major categories for Amarillo where land use decisions can have big impacts on fiscal health.
Fiscal Impact Analysis Approach
A fiscal impact model was built to support the development of the comprehensive plan. The fiscal impact model evaluated the impacts of forecasted growth on the City’s General Fund to ensure the envisioned land use pattern is not creating undue and unattainable fiscal challenges for the community to achieve. The methodology used to assess fiscal impacts on the city are illustrated in the graphic below.
Growth forecasts for the city were developed during the plan process. These forecasts for new jobs and households in the city over the next 20 to 30 years are allocated by land use category to estimate impacts on the city.
• Annual revenues generated by forecast growth are estimated based on specific case studies to estimate property tax and sales tax revenue and using average revenue factors for other revenue sources.
• Annual expenditures are estimated based on the impact of new jobs and households that need services provided. For major expenditures, direct impact case studies are developed that analyze the specific impact on these departments’ growth will have. For indirectly impact expenditures (such as city administration departments), average cost factors per person were applied.
• Net fiscal impacts are estimated by comparing estimated annual revenue generated by new development in the city over the plan horizon compared to the estimated expenditure increases needed to provide services to new residents and workers.
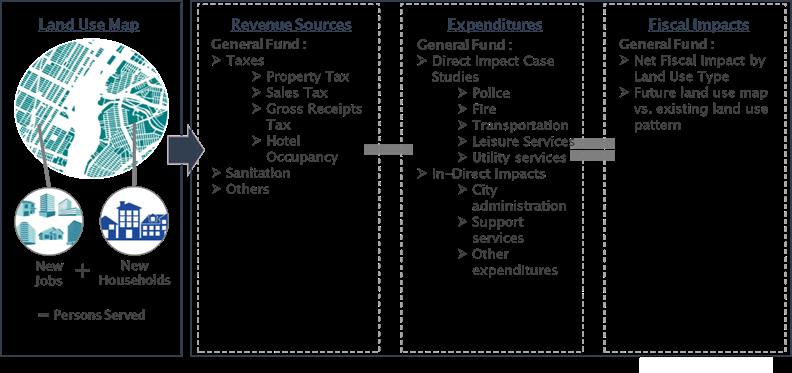
Land Use Fiscal Impact Considerations
The fiscal impact analysis of the preferred land use plan within the comprehensive plan did not identify any major fiscal impact concerns and does not generate a net fiscal negative impact on the city. However, the analysis did identify several factors that impact fiscal health driven by land use policies that have been addressed within this plan and should continually be addressed in future plans and policy decisions.
Land Use Factors Impacting Fiscal Health
The land use pattern that is directed within the Comprehensive Plan will impact future fiscal health of the community. The two major factors that influence fiscal impacts are the location of development and the density of development.
• Location – Generally, greenfield development on the edge of the community will generate a greater fiscal impact primarily due to the creation of new infrastructure (e.g. new streets and new parks) needed to serve the development that becomes the responsibility of city to maintain. New buildings within already developed areas can more often rely on existing infrastructure and services and not expand the city’s network.
• Density – The density of development also impacts fiscal health. Denser development than the suburban, lower density housing found in many Amarillo neighborhoods is more beneficial to the city as more people can be served per mile of roadway or acre of park, for example. One major impact, however, from greater density can be generated when an area experiences a major shift in land use (e.g. industrial to residential) and/or a significant increase in density. Supporting denser development and redevelopment of lower density uses in existing portions of the city likely will also necessitate investment in upgrading or building new streets, sewer lines, and other amenities to support higher density development and more walkable land use patterns.
City Services Most Impacted by New Development
There are four major services provided by the City of Amarillo that were found to be most impacted by new developments. Specific considerations for these services are provided below.
• Street Maintenance – The City of Amarillo maintains a network of over 1,000 miles of streets and 11,000 streetlights. The ongoing maintenance of this infrastructure is a significant portion of annual costs to the city. Denser land use patterns that allow these streets and lights to serve more people per mile of road are more beneficial. An increase of the overall density of housing on the edges of the city, through a greater mixture of housing types, can support a more efficient land use pattern.
• Fire Service – The City of Amarillo serves the community using 13 fire stations spread throughout the city with fire apparatus that respond to over 22,000 calls for service per year. The location of new development relative to the location of existing fire stations is an important fiscal consideration. Two main factors drive the need for new fire stations and new fire apparatus. First is the response time to a call for service that is achievable. New development that is outside of the city’s target response times can drive the need for a new station and/or dilute the quality of service to existing areas. The city’s stations currently are well located to support future growth and the city has been investing in replacing aging stations in the central portions of the community to adjust to changing needs. The second consideration is the utilization of existing fire crews. If calls for service levels become too high in certain areas, then additional staffing and likely apparatus are needed to support growth in these areas. No major concerns were identified for existing areas of the city based on the proposed land use plan.
• Parks and Recreation – New residents added to the community will increase the needs for park and recreation services within the community. However, the city already maintains 55 parks and over 2,400 acres of parks. In many areas, there are adequate existing facilities and/or parkland to accommodate growth. Maintaining and reinvesting in these facilities becomes a greater challenge in many areas. The city requires new developments to provide parkland to offset impacts on park needs from new developments. However, often the city does not need/want additional parkland to meet needs. Updating of the city’s approach to parkland dedication is needed to right size requests and needs.
• Water and Wastewater – The City of Amarillo operates a water and wastewater utility that provides services to property owners within the City. The city provides service to all property within the city and to areas outside the city limits when all standards and conditions are met and the cost to extend services is paid for by the applicant. The availability of water and sewer service is a major driver of where development can occur. The city should continue its policy of providing service to areas outside their city limits on a case-by-case basis with no guarantee of service unless explicitly granted. The City should also monitor and request seeking consent from the city for approval of any water or wastewater districts within the ETJ.
Public Funding/Financing Considerations
The policy of the city is to require that new development pay its own way by providing the infrastructure it needs to support development. However, being able to finance new development can be challenging in various areas of the city and support mechanisms are needed to allow for projects to pay for improvements over time or allow for the city to proactively invest in areas to spur development. Also, the city’s low tax rates require it to use creative and innovative strategies to maintain adequate levels of service and reinvest in the community. Specific policy directives are provided in the comprehensive plan calling for the use of public financing tools and strategies. Policies included:
• The use of value capture tools, such as Tax Increment Reinvestment Zones (TIRZ) and Public Improvement Districts (PIDs), to redirect investment into new growth areas.
• The continued use of innovative pilot investment tools and programs, such as the sidewalk costshare pilot program, allows for the city to partner in reinvestment with property owners and private developers.

Making Places: Neighborhoods
& Districts

Current Conditions
Objectives for Future Neighborhoods & Districts
Housing Goals & Recommendations
Employment Areas & Economic Development Goals & Recommendations
Current Conditions
Housing production in Amarillo has generally kept pace with population growth over the last decade, with an annual growth rate of 1.1% between 2010 and 2021. However, Amarillo’s housing stock is relatively homogenous and outdated – with single family homes making up almost 80% of all units and almost half of all homes built more than 50 years ago. Nearly two thirds of Amarillo residents own their home, while about a third are renters. Furthermore, recent housing development has largely maintained the status quo, not significantly adding to Amarillo’s diversity of housing options.
Amarillo’s oldest neighborhoods in the central core were developed between 1889 and 1940. The next ring of development was more suburban in nature in the 1950’s and 60’s in the post World War II era. Since then, as evidenced by the map below, most housing development has occurred at the periphery, expanding outward into undeveloped areas. In fact, some areas in central and
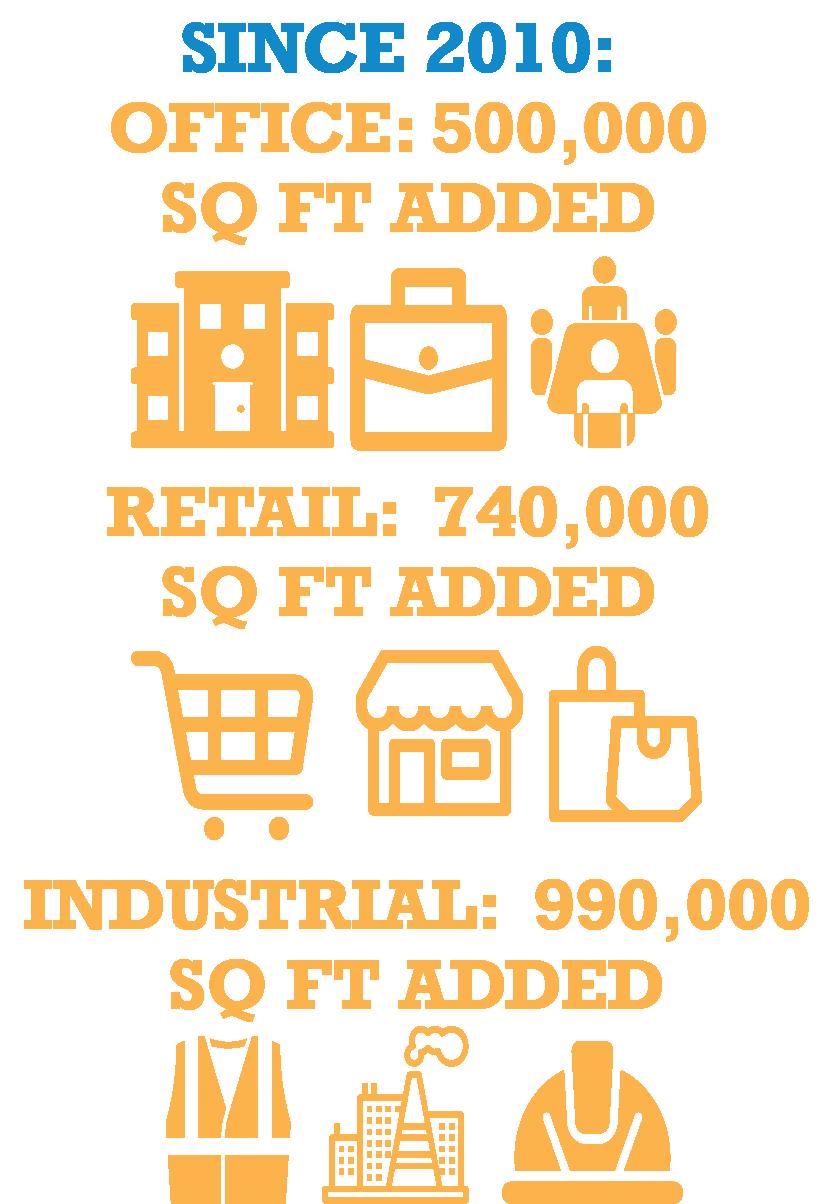
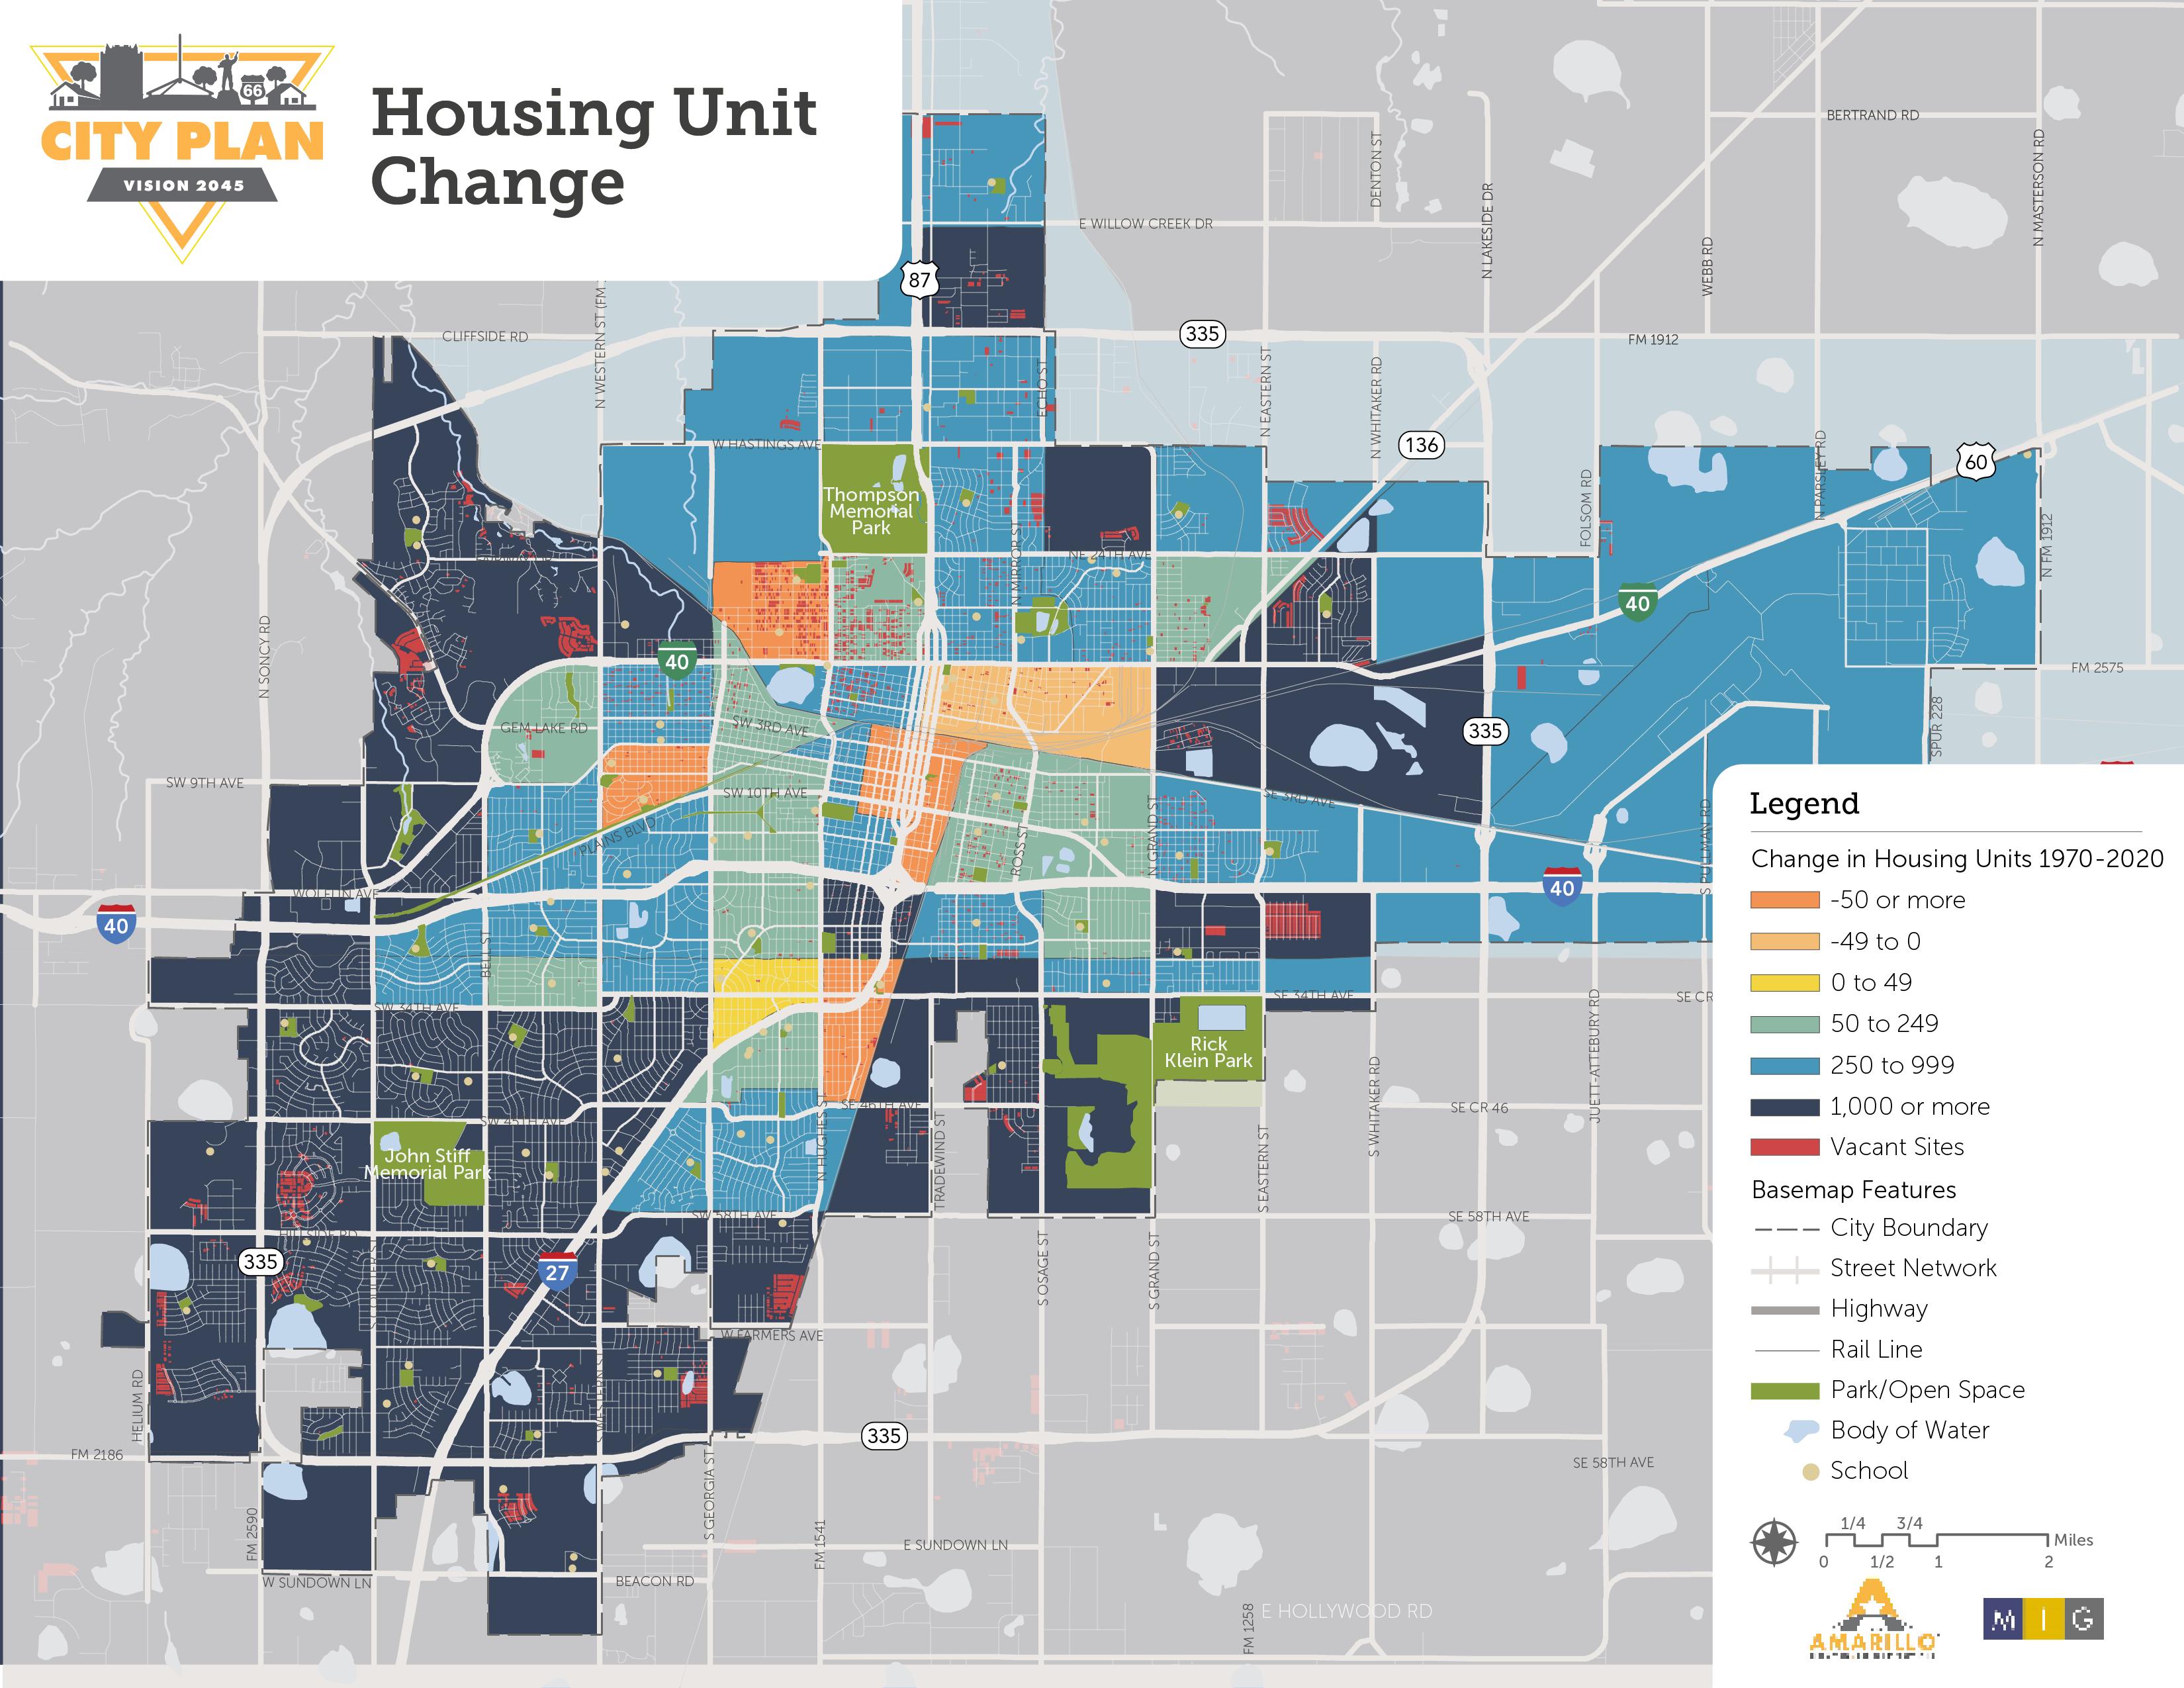
northern Amarillo lost housing units and population over the last 50 years and have not revitalized since. This map also illustrates the concentrated pockets and broad dispersion of vacant unimproved properties that offer potential opportunity for new housing development in Amarillo, including central neighborhoods and the urban core.
As with most growing communities in the U.S., Amarillo has experienced increasing housing costs and decreasing housing affordability over the last decade, with the median home price rising about 70%, reaching $220,000 in 2023, while incomes have not kept pace. Amarillo’s lack of diverse housing types contributes to this challenge, limiting the options and choices available for a community with diverse housing needs.
The map below illustrates recent development activity in Amarillo (2010-2022), including multifamily residential, retail, office, and industrial. Most commercial development has occurred in the southern and western areas of the city, especially near major interstates. This development indicates areas of growth and new investment, reflecting Amarillo’s continual advancement. In the coming decades, Amarillo’s uninhibited land area will continue to offer extensive opportunity for strategic investment and new growth but should be carefully guided.
CITY LIMITS: 5,167 (78%)
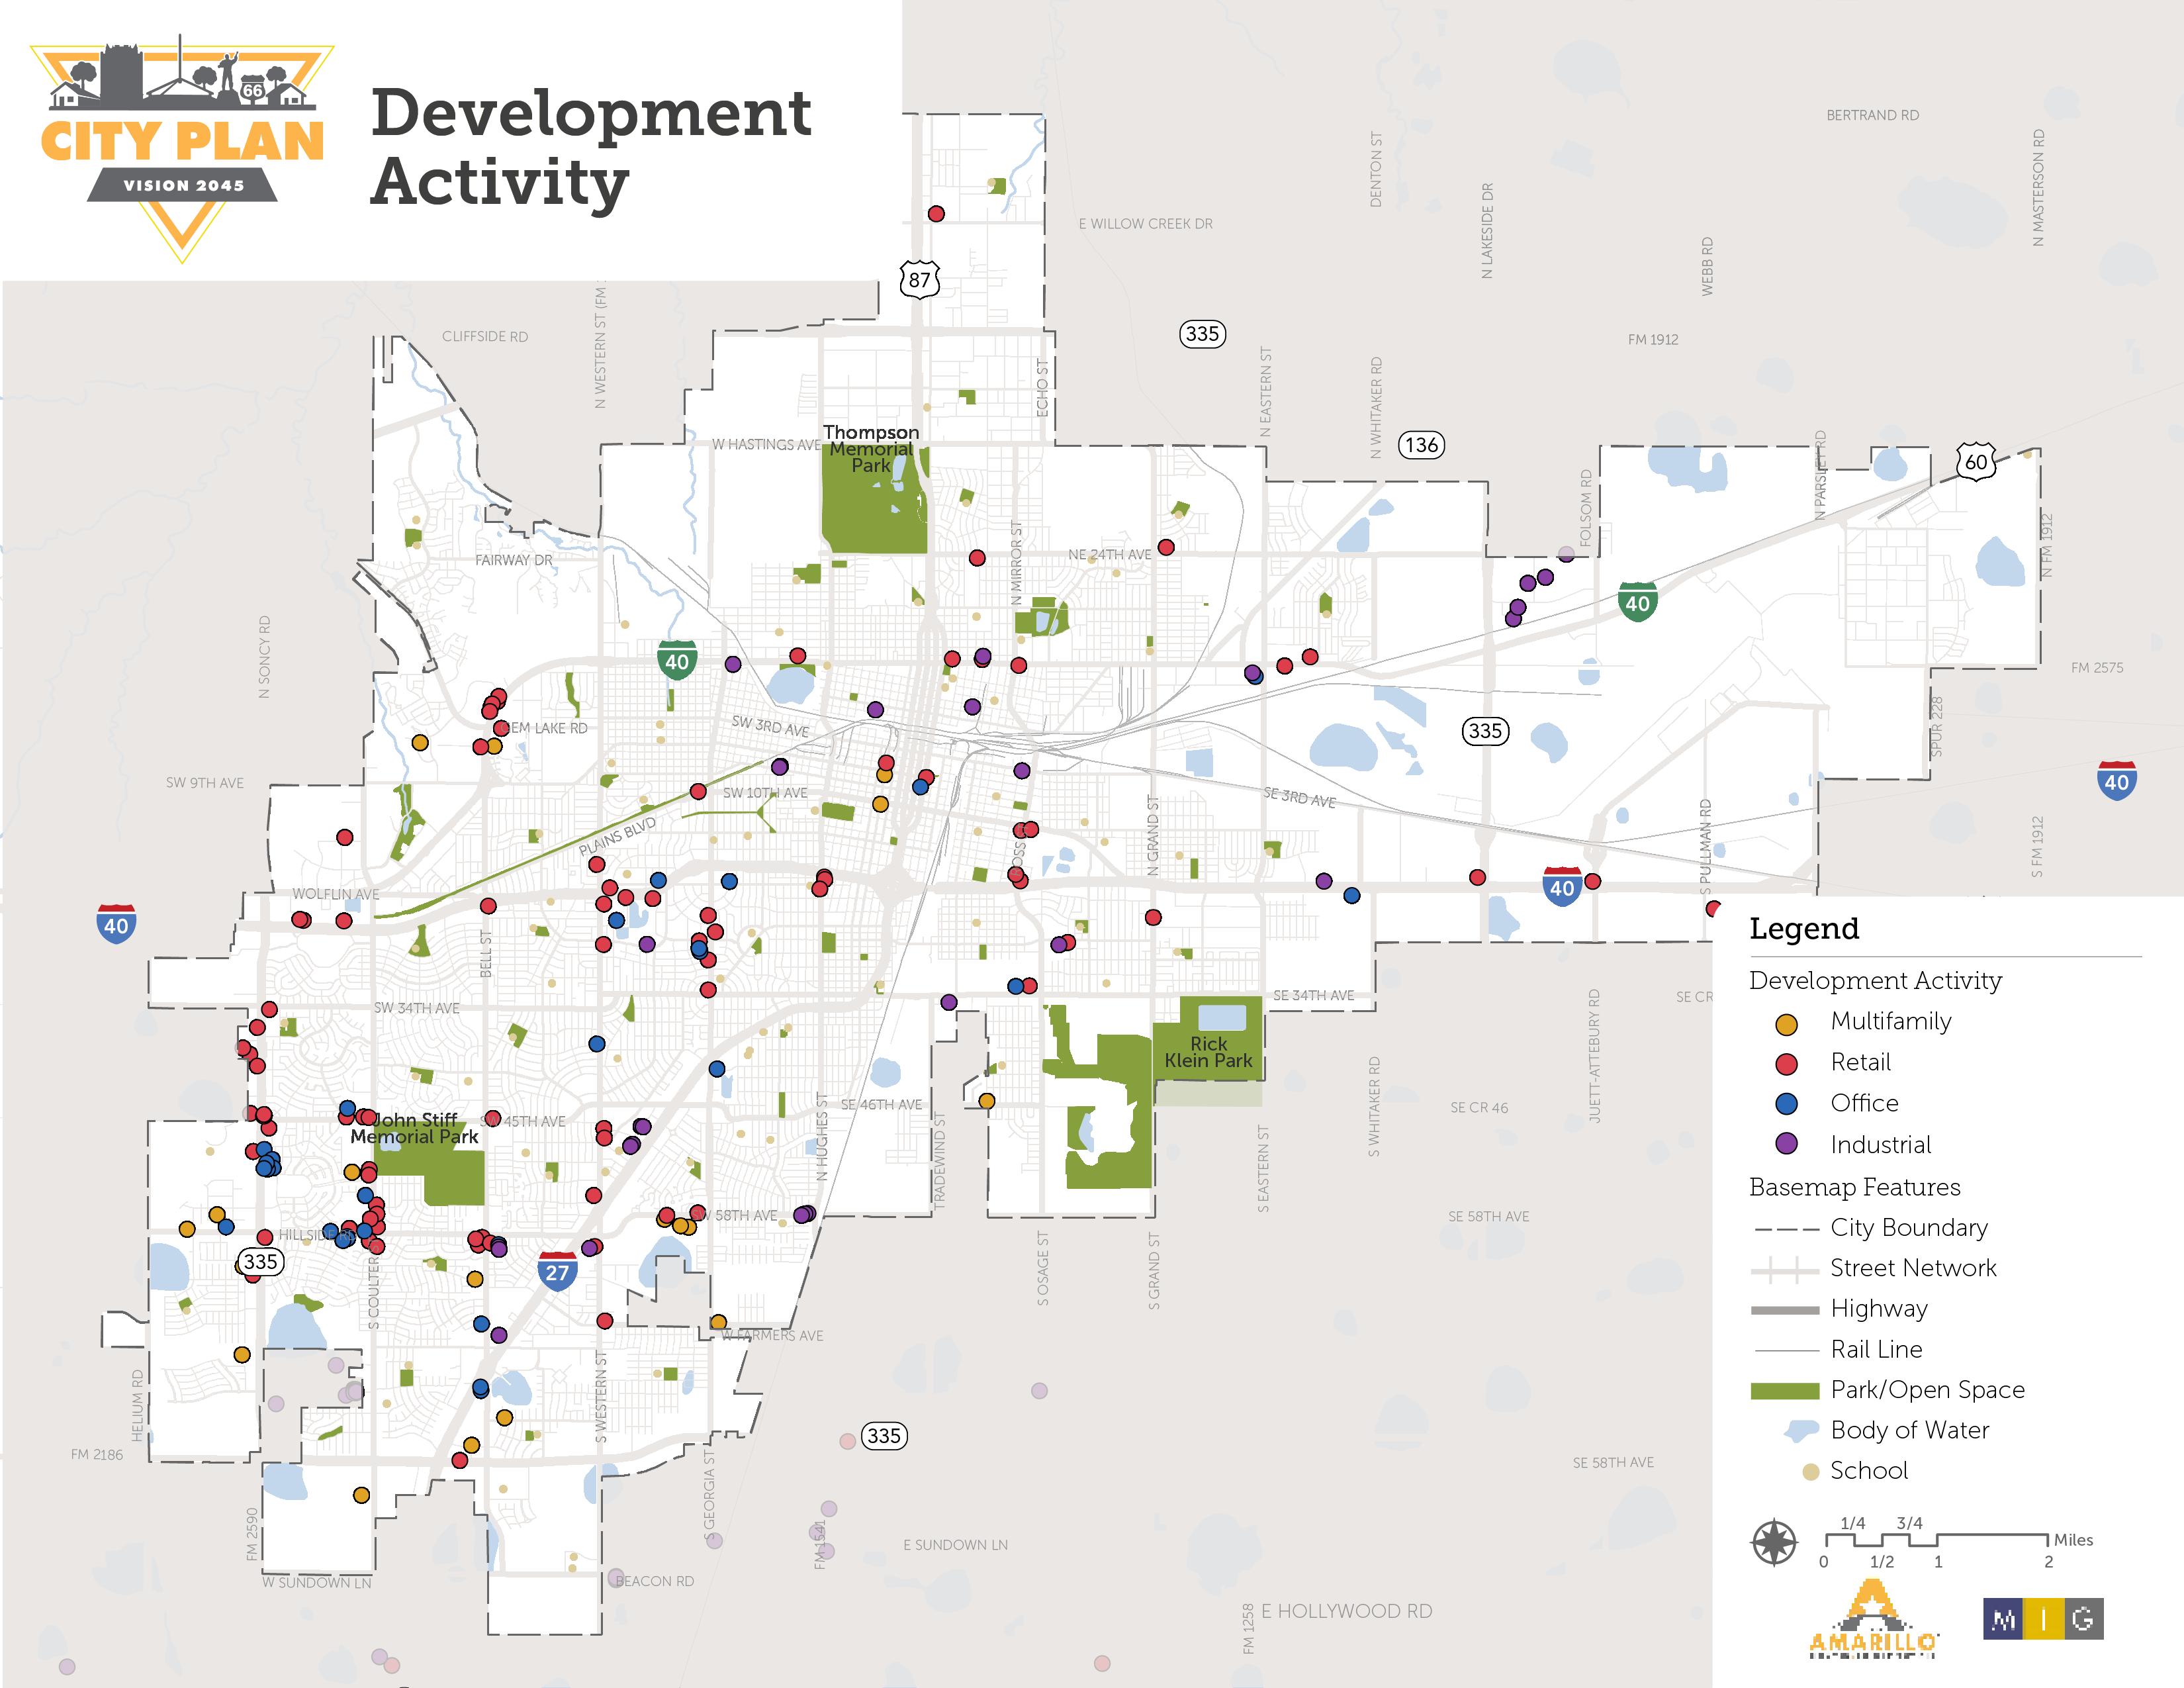
Extraterritorial Jurisdiction: 1,491 (22%)
As of February 2022 (City of Amarillo)
Objectives for Future Neighborhoods & Districts
One of the greatest challenges in community development today is to pair available housing options and available job opportunities within close proximity to each other. When residents can live close to where they work, there are multiple benefits. First, residents spend less time commuting, which in turn gives them more personal time each day to do things such as exercise, spend time with friends and family, volunteer, or enjoy Amarillo’s activities and restaurants. Second, it supports multi-modal transportation objectives through shorter driving distances and/or greater ability to walk, bike, or take public transportation. Of course, there are many additional co-benefits, such as the potential for more active lifestyles and greater social interaction at the neighborhood scale. Additionally, these characteristics help attract new talent by increasing quality of life.
However, it is also important to account for incompatible land uses and the benefits of clustered economic activity. The priorities and conditions for advanced manufacturing are vastly different from home life, but both are equally important to Amarillo. Housing and economy are two sides of the same coin, requiring a coordinated and strategic approach to support core industries and foster emerging or new industries, while simultaneously expanding housing options to meet the needs of all workers and households – including variety in style, size, location, and cost.
The Neighborhoods & Districts (N&D) goals and recommendations in this chapter focus on these needs, challenges, and objectives. They expand upon the Complete Neighborhoods Scenario to provide more nuanced guidance to foster a thriving economy, expand housing choice, and improve accessibility through strategic land use, investment, partnerships, and creative funding programs.
Housing Goals & Recommendations
N&D Goal 1
Create opportunities for a greater diversity of housing options in both established and newly developing areas of Amarillo.
Amarilloans expressed a desire for more types of housing development, to expand options for different household sizes, stages of life, household income levels, and a combination of rental and ownership options.
Recommendations
1. Promote housing in areas with existing or planned infrastructure necessary to support development.
2. Reduce regulatory barriers to ensure housing development keeps pace with employment growth through improvements in permitting and review processes.
3. Allow for middle density housing options in all neighborhood place types and expand the diversity of middle density housing options that are allowed by-right.
4. Ensure new infill housing in existing neighborhoods is designed and scaled to fit the neighborhood context.
5. Allow for medium and high density housing in commercial and industrial areas transitioning into mixed use places through the application of community mixed use and innovation mixed use place types.
6. Encourage high density residential development in locations near major transportation/transit routes and in close proximity to job centers (Place Types with 25-50 jobs per acre).
N&D Goal 2
Ensure Amarillo residents and the regional workforce have access to affordable and attainable1 housing options.
Amarilloans expressed concerns about maintaining affordability across all types of households to ensure opportunities for all household incomes and to prevent involuntary displacement.
Recommendations
1. Support and prioritize the development of affordable housing projects in locations near transportation routes and jobs.
2. Maximize the impact of housing funds through partnerships with private and non-profit housing partners.
3. Use financing tools, such as Tax Increment Reinvestment Zones (TIRZ) and Public Facilities Corporations (PFC), to fund and incentivize development of new housing products in targeted reinvestment areas.
N&D Goal 3
Revitalize and encourage infill housing and reinvestment in existing neighborhoods.
Throughout the community engagement and input process, Amarilloans expressed a strong desire for public and private reinvestment in older portions of the community.
Recommendations
1. Encourage private investment in housing and businesses through the Neighborhood Empowerment Zone Incentive Program by clearly communicating opportunities and eligibility rules.
2. Continue to pilot reinvestment tools and programs, such as the sidewalk cost-share pilot program, that allow the City to partner in reinvestment.
3. Support and expand programs that encourage reinvestment in existing homes and neighborhoods, foster the stabilization of transitional neighborhoods, and support home ownership.
4. Direct capital improvements and the use of incentives to improve and upgrade infrastructure and public amenities in underserved neighborhoods and targeted vacant and undeveloped areas.
5. Utilize value capture tools, such as improvement districts and tax increment financing, that capture the additional tax value generated by new development to help fund improvements.
6. Support the creation and efforts of community development organizations that can lead focused reinvestment efforts in neighborhoods through use of tools and powers not available to the City.
1 Affordable housing refers to income-restricted, subsidized housing, while attainable housing refers to housing that is affordable to lower income households, occurring naturally within the housing market.
Infill Development
Infill development provides the opportunity to utilize vacant or underdeveloped parcels within areas that are generally already largely developed. Rather than promoting outward development, infill development promotes fiscally responsible reinvestment and allows the introduction of uses that can enhance and strengthen communities.
The infill development graphic illustrates the transformation of an underutilized half block site into a residential community. The site is maximized with a variety of housing types including a duplex, quadplex, and attached condominiums, which helps expand middle density housing options in the downtown area.
FUTURE
CURRENT
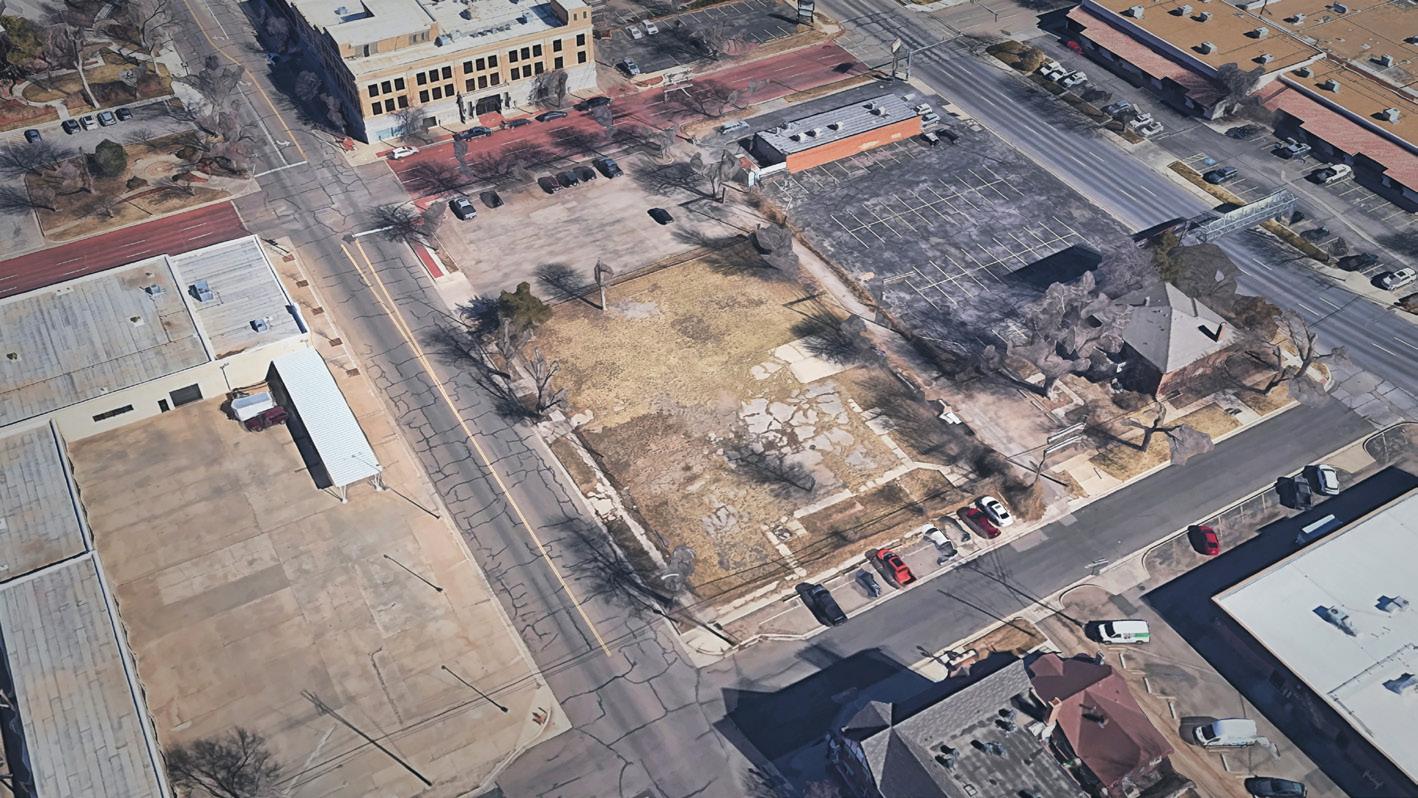
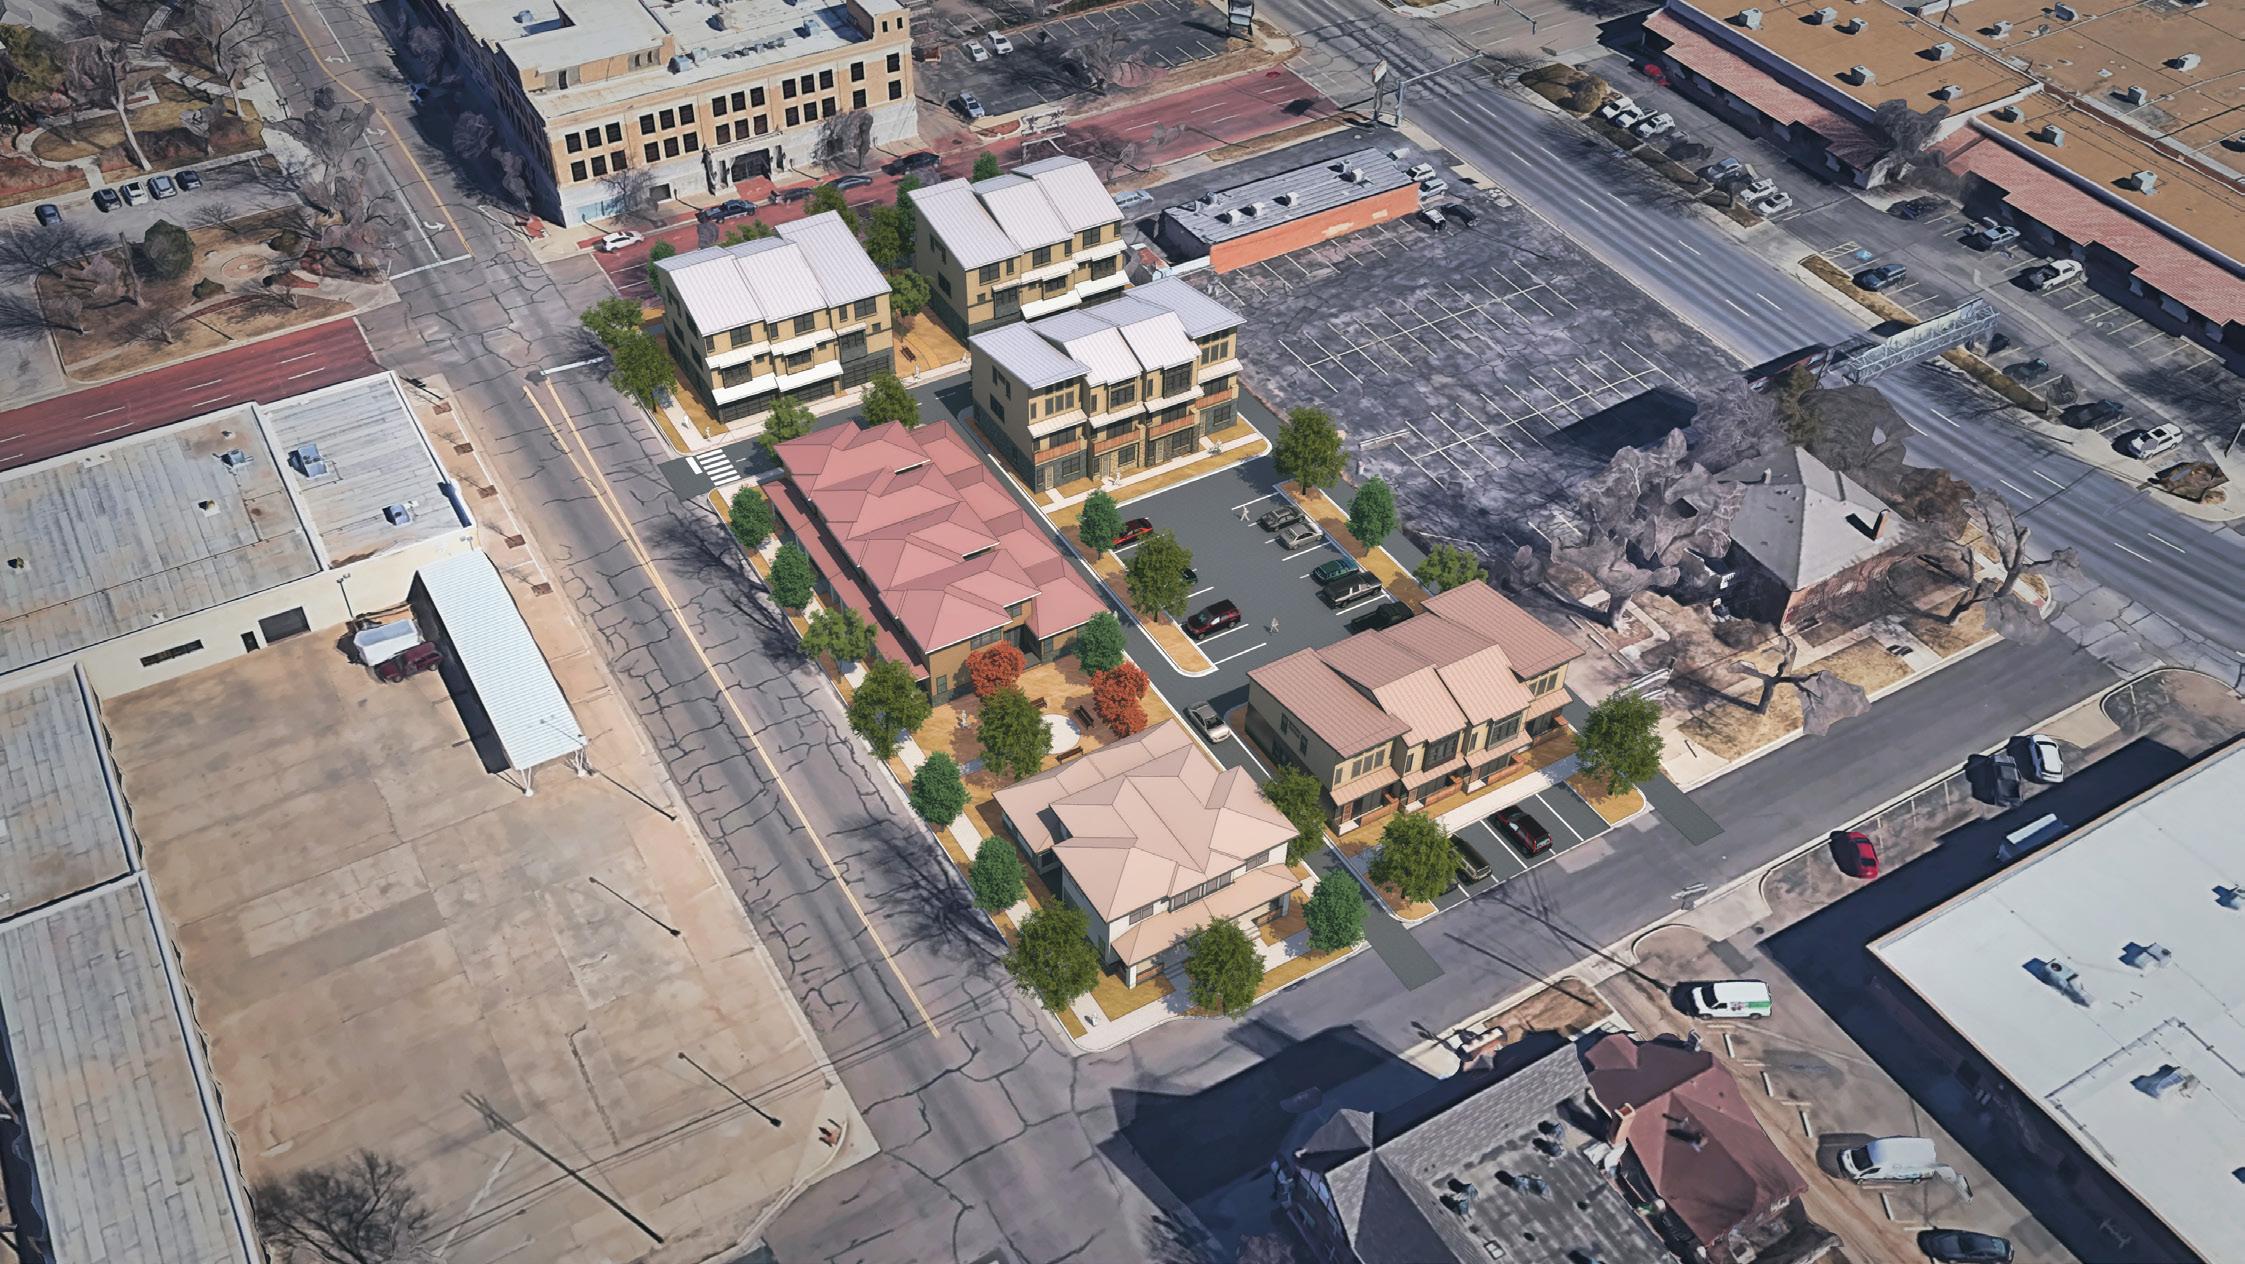
CASE STUDY: 209 N MADISON STREET SMALL SINGLE-FAMILY HOMES
City Plan recognizes the challenges of a successful infill program in Amarillo. Past plans have recommended infill as a strategy as well, but little development has occurred. This case study highlights a major feasibility challenge:
Small-scale single-family homes that are both complimentary in neighborhood character and affordable to an average Amarillo family are likely infeasible without assistance from the public sector or non-profit housing partners.
This case study investigates the development of two subsidized, income-restricted affordable ownership single-family homes on two adjacent vacant lots in the North Heights Neighborhood Plan area. Key takeaways include:
• First, the property would need to be rezoned to allow for single-family residential development, even though other single-famly homes exist on the same block and in the surrounding neighborhood.
• Despite significant cost-saving assistance from the City (fees and land), the units wouldn’t be affordable to many households currently living in the area. These units would only be affordable to households making $74,900+.
• Without cost-saving assistance from the City (fees and land), and/or if infrastructure improvements were necessary, this project would likely be infeasible as subsidized, income-restricted affordable housing.
• Construction loan financing is typically provided using land as equity. In this case, the builder would need special approval conditions.
• As a project meant for affordable homeownership, home buyer education, downpayment assistance, and financing would also need to be provided through a nonprofit (e.g. community housing development corporation).
Land Use
Existing Zoning Industrial (I-1)
Complete Neighborhoods Scenario Place Type Neighborhood Medium (NM)
Unit Type & Size
Lot Acreage 0.2
Lot Dimensions 60’ x 140’
Number of Units 2
Home Size 1,200 SF
Construction Costs
Land Acquisition
$0 (owned by CoA, provided to builder through developer agreement). Land estimated at $2.95 SF
Construction Cost $135 SF / $162,000
Interest Carry
Profit/Contingency
$8,000
$15,000 per unit
Permitting $0 (rezoning ($816) and building ($738) fees waived through NEZ)
Infrastructure
Financing
Sale Price
None needed - 2” water line & 6” sewer line adequate
$185,000 / $154 SF
Qualifying Income $60,000 YR
Down Payment $6,475
Closing Costs
$6,000
Monthly Mortgage (30 yr at 6.625%) $1,163
Monthly Taxes & Insurance
$661
Total Monthly Payment $1,874
Median Family Income (site location Census Tract) $44,820
Monthly Payment
Affordable to Median Family Income Household $1,120
CASE STUDY:209 N Madison Street Small single-family homes

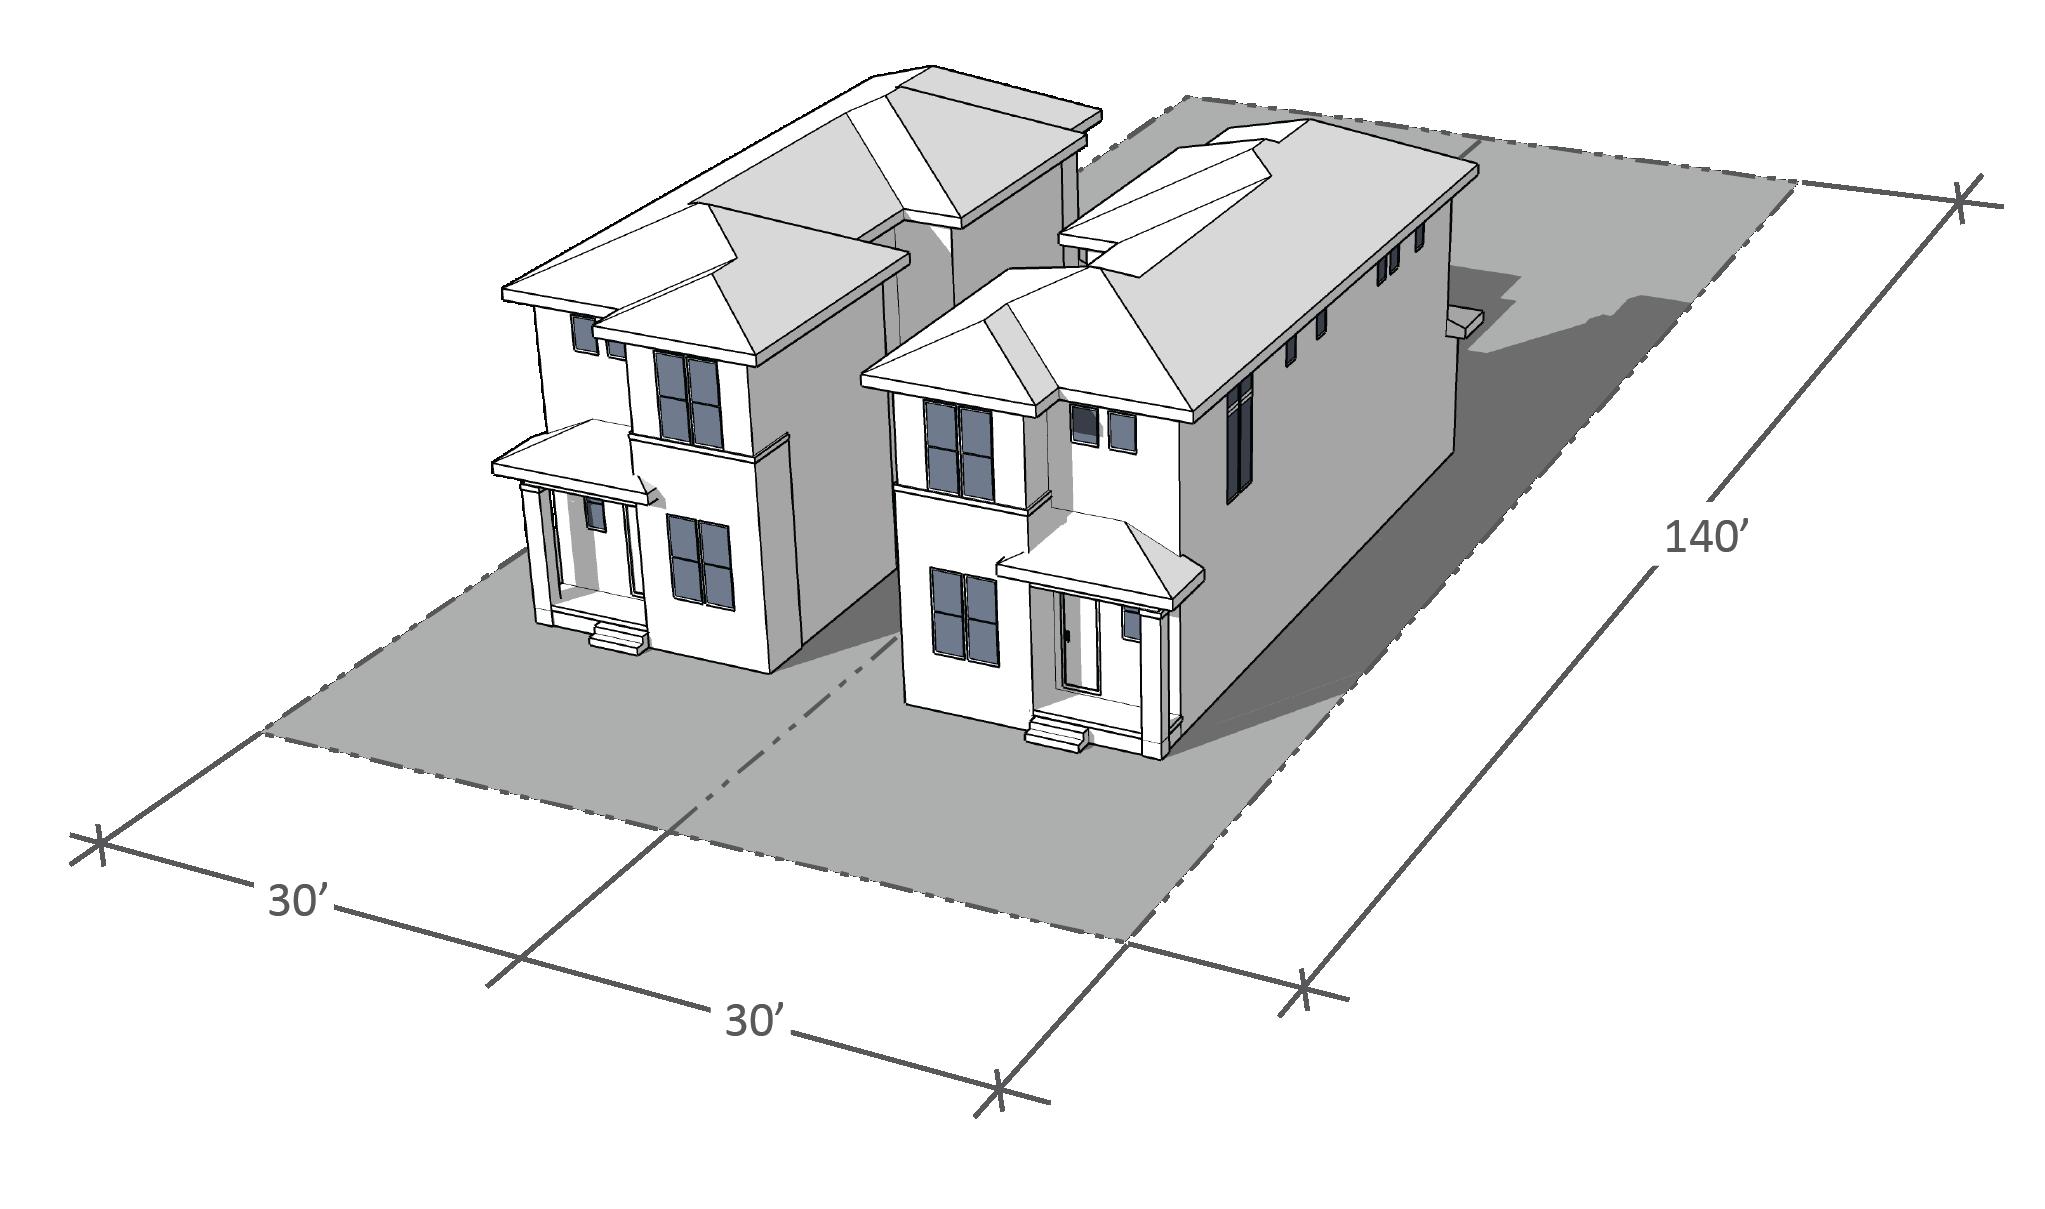
Employment Areas & Economic Development Goals & Recommendations
N&D Goal 4
Support the growth of the region’s economic strengths to expand economic opportunities for all residents.
Considering projected growth for the region, Amarilloans expressed a desire to ensure employment opportunities in Amarillo keep pace with expected population increases.
Recommendations
1. Support the attraction and retention of businesses in the region’s focus industries including agriculture, life sciences, manufacturing, food processing, and energy.
2. Grow Amarillo as a destination for outdoor recreation and entertainment through investments in recreation amenities, access to attractions, and new entertainment destinations.
3. Facilitate the growth of Amarillo as the regional destination for health care, retail trade, and logistics.
4. Provide opportunities and resources for entrepreneurship.
5. Promote continued research and education in agtech and veterinary medicine in order to spur new business formation and attract investment.
6. Maximize City and AEDC owned land to strategically develop around Rick Husband International Airport as an important employment center in East Amarillo.
N&D Goal 5
Grow Amarillo as a leading community for applied education and workforce development.
Key stakeholders in the planning process prioritized workforce development as an important component of a larger business attraction, retention and growth strategy.
Recommendations
1. Expand programs and partnerships with education partners (Independent School Districts, Amarillo College, West Texas A&M University, Texas Tech University Health Sciences Center) that provide workforce education and training programs that support the region’s industry strengths.
2. Continue to invest in improving the attractiveness of living and working in Amarillo to support workforce attraction and retention.
3. Utilize economic development tools and incentives to direct investment and job opportunities to underserved and underemployed populations.
N&D Goal 6
Invest in creation and growth of a variety of economic place types.
Amarilloans prioritized a diversity of development to accommodate a diverse array of employers over the next 20+ years.
Recommendations
1. Invest in infrastructure projects that support the growth of the city’s manufacturing and logistics districts.
2. Protect manufacturing and logistics districts from encroachment of incompatible uses.
3. Attract investment into the Center City through use of incentive tools and public-private partnership programs and opportunities.
4. Provide support for property owners and developers reinvesting in older and historic buildings in the Center City to attract and facilitate growth of economic activity and housing.
5. Support the transition of older, outmoded industrial areas and commercial/retail centers into mixed use place types by allowing a greater diversity of uses in these areas.
6. Allow for and support the growth of neighborhood “main street” business districts.
7. Use value capture tools, such as Tax Increment Reinvestment Zones (TIRZ) and Public Improvement Districts (PIDs), to redirect investment into employment place types.
Innovation Retrofit
The direct benefits of retrofitting buildings can include added functionality, efficiency, and sustainability. Additionally, retrofitting projects have the opportunity to revitalize their communities by providing services and transforming the built environment. Often these can occur in partnership with local education institutions.
FUTURE
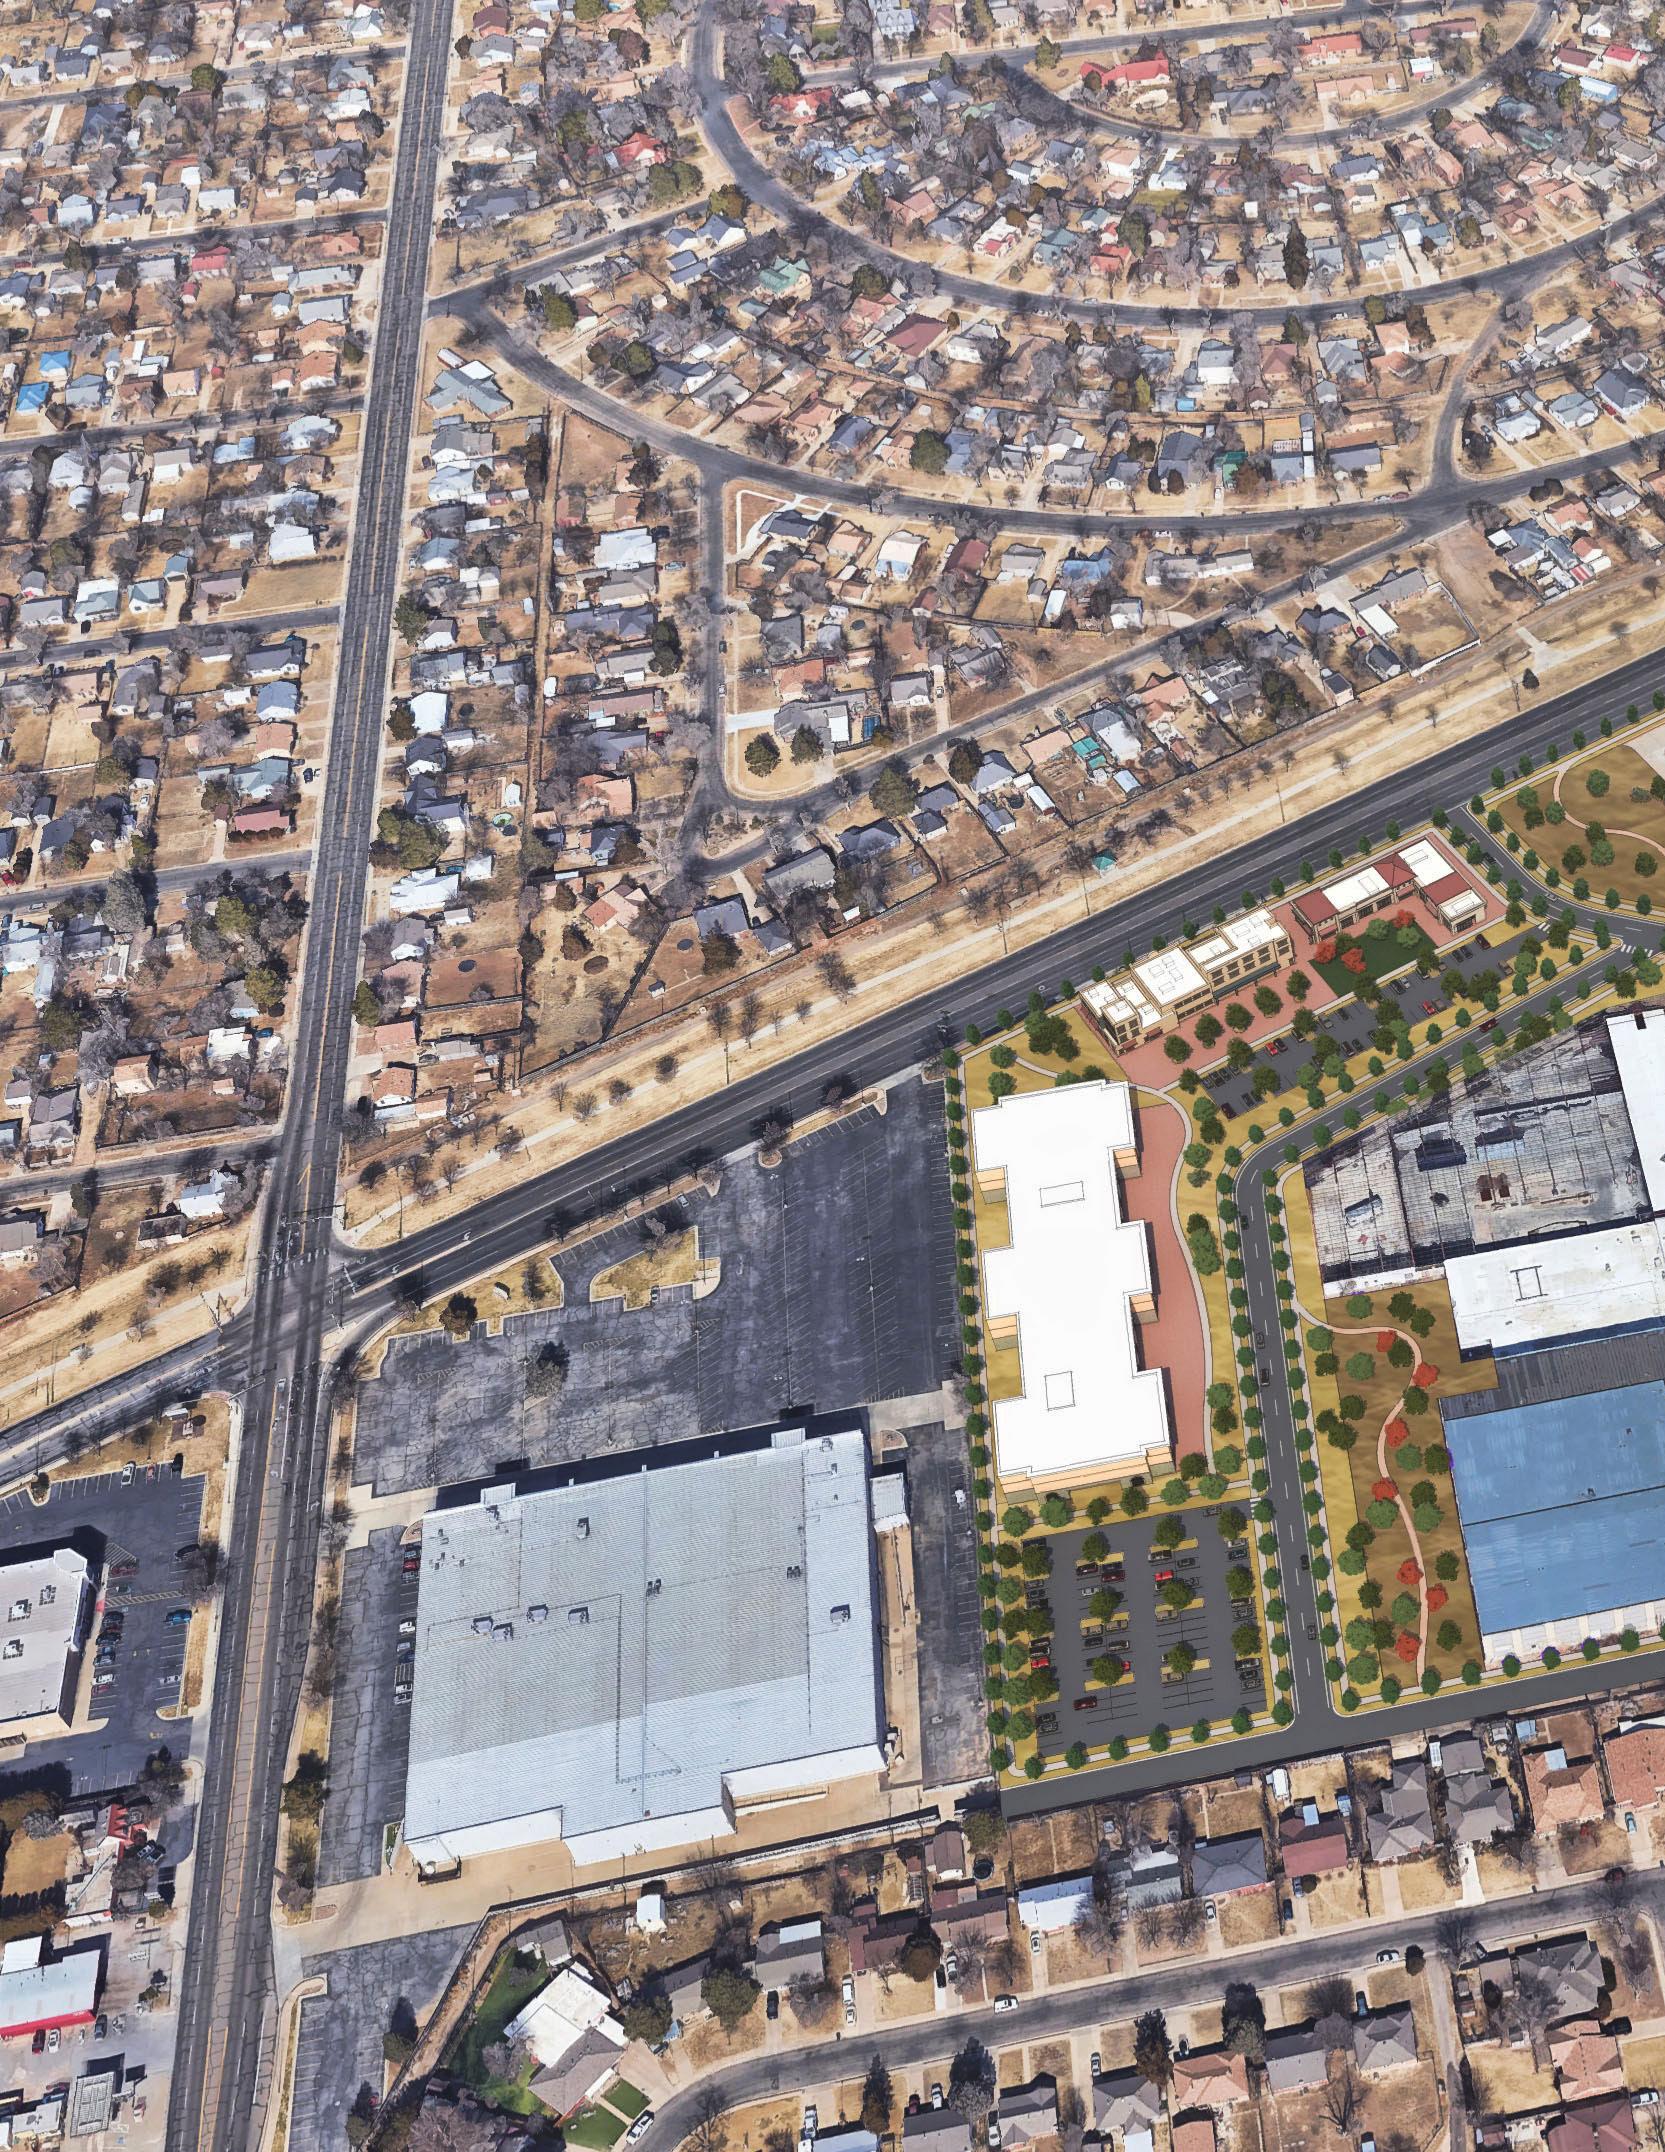
CURRENT
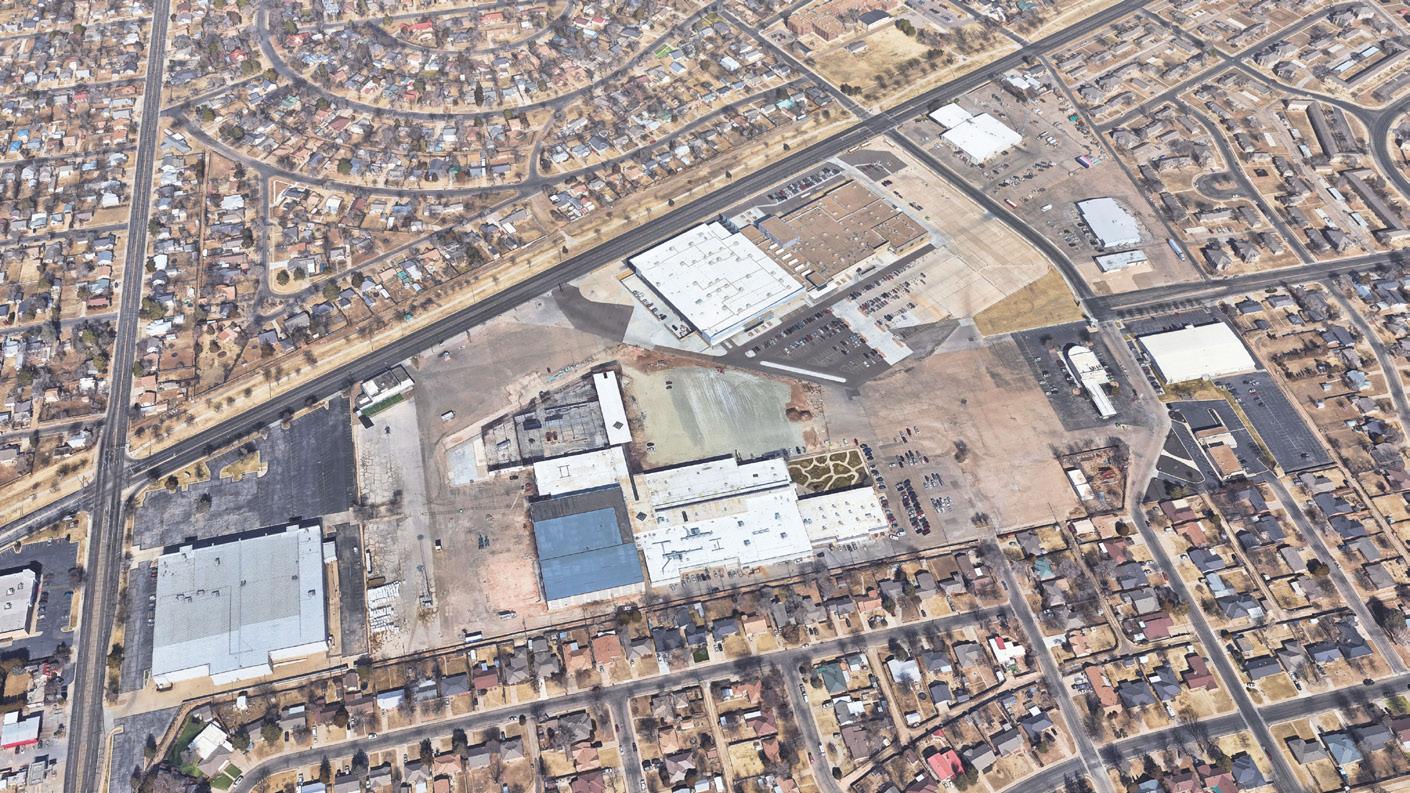
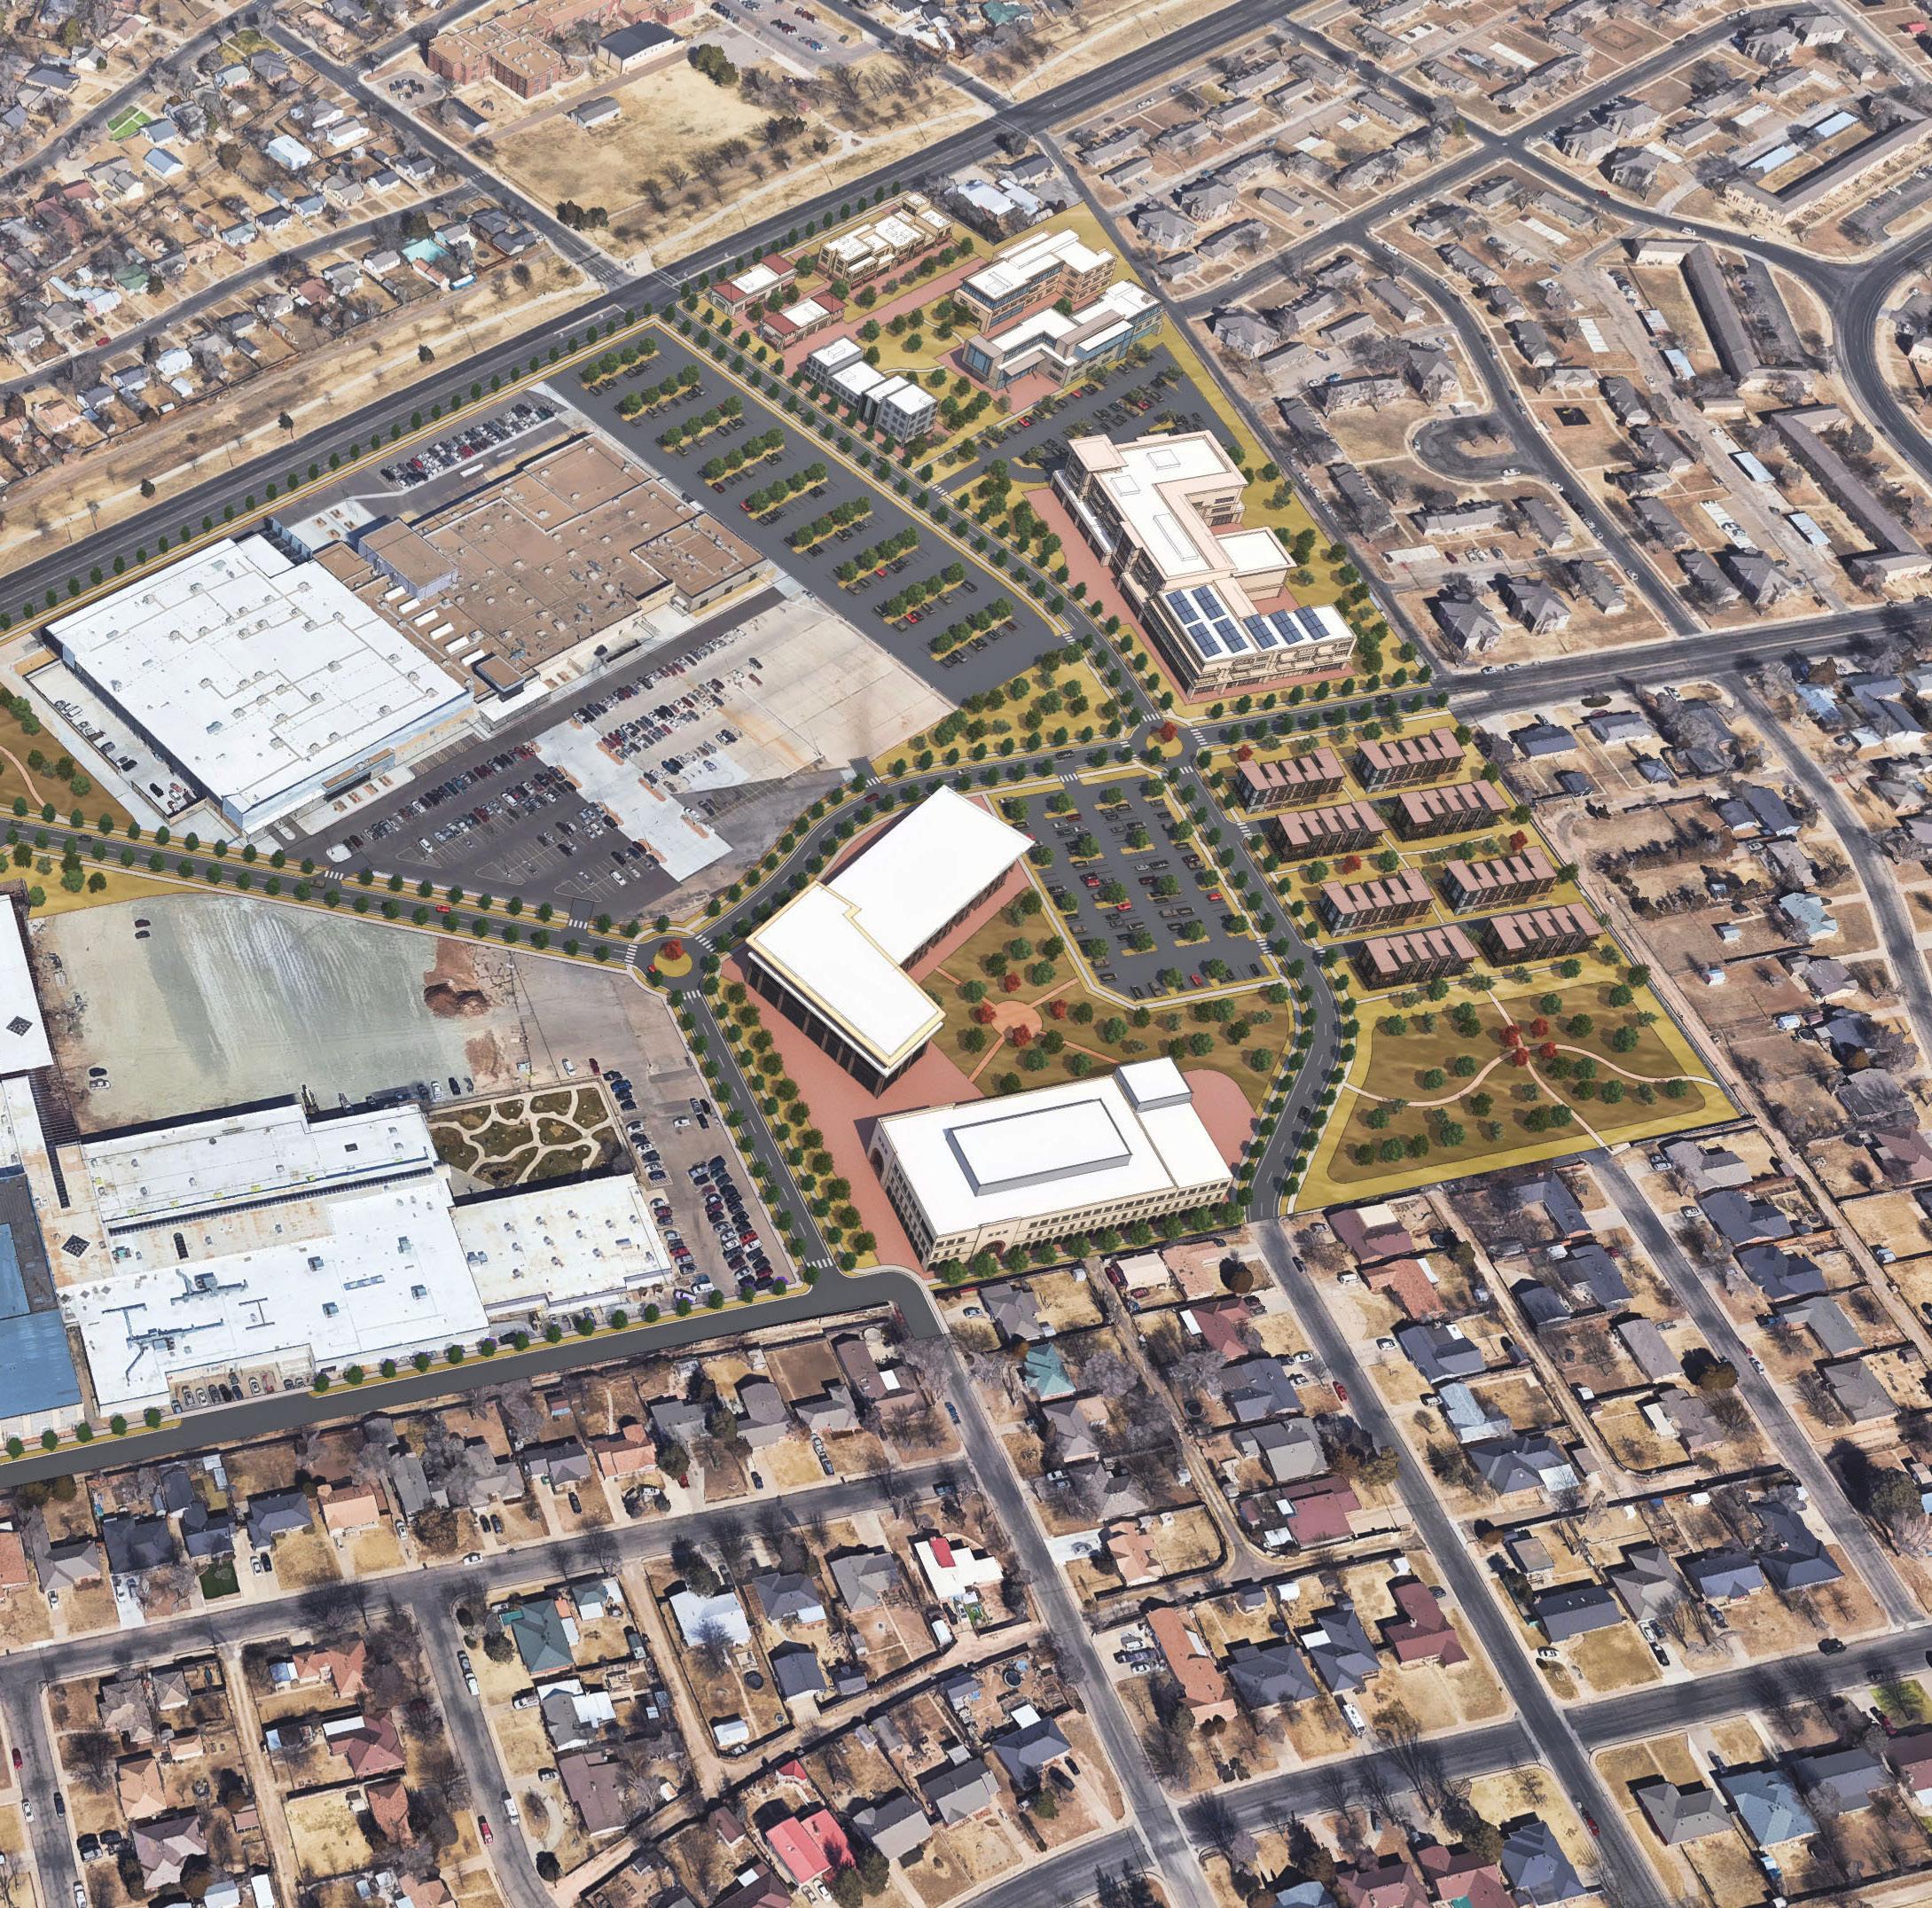
The Amarillo Art Institute and AmTech Career Academy are located west of downtown Amarillo, on the site of the city’s first mall. Some of the original buildings have since been retrofitted into their existing uses and currently provide the community with educational services. Building on the momentum of these two community resources, the graphic re-imagines the site into an innovative campus. The site allows for additional campus related buildings, innovation mixed-use type development, retail, housing, and multiple opportunities for open space.
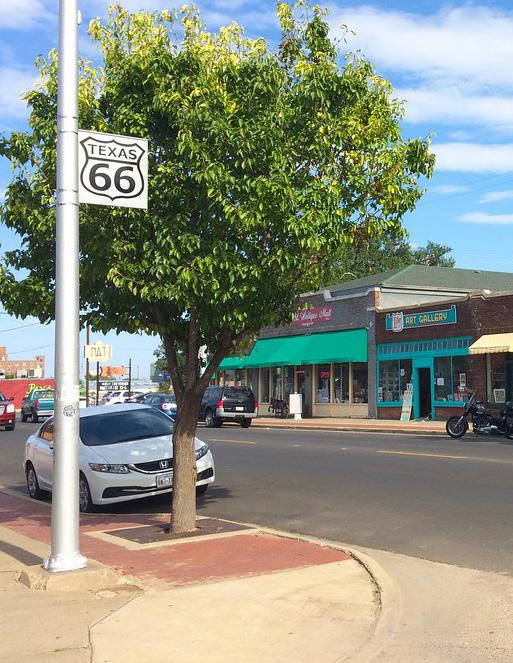
Community Character
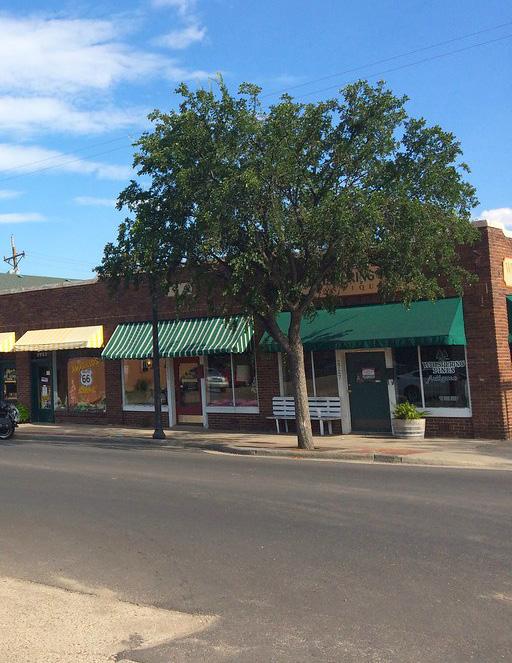
Current Conditions
Objectives for Future Character
Compatibility, Adjacency & Transitions Goals & Recommendations
Identity & Design Goals & Recommendations
Current Conditions
The City of Amarillo has three distinctive development contexts: urban, suburban, and rural.
Urban area characteristics include density, activity, pedestrian-friendly streets where space is framed by buildings with minimal to zero setback, easy pedestrian access to businesses, reliance on vertical development, and on-street parking. Amarillo’s urban type development is mostly found in the downtown area or along select major corridors.
Suburban areas around the city include characteristics such as irrigated lawns, landscaped or maintained turf expanses, single-family detached residential neighborhoods, wider streetscapes, and surface parking in most commercial developments. Commercial development within these areas tends to be auto-oriented.
Rural areas on the edge of Amarillo are wide open landscapes, with views infrequently interrupted by buildings. Rural areas in Amarillo typically include low density development and single-family, detached homes with ample privacy. Rural areas generally have high open space ratios and minimal building coverage.
Amarillo’s identity and image directly correlates to the City’s economic anchors and investment areas. A few notable areas in the city include the Harrington Regional Medical Center and the surrounding district, Amarillo’s two airports, the downtown, Amarillo’s college campuses, the Tri-State Fairground area, and the City’s two interstate highway corridors with adjacent hospitality areas. Other corridors and nodes around the city, such as Soncy Road where shopping services are concentrated, are also points for economic activity.
Railroads and interstates/highways, including I-27, I-40, and the Historic Route 66, are an integral part of the community that have aided in connecting Amarillo to important destinations. Given that these major transportation routes run through the community, creating high visibility for incoming travelers, community image and character have always been a high priority for Amarillo. Large footprint commercial development and hospitality uses tend to be clustered along the interstate highways, which influences the identity of these major corridors and creates a pattern of dependence on interstates to reach commercial centers.
Objectives for Future Character
Community character encompasses physical design and relationships in the built environment that make a space feel comfortable, interesting, unique, accessible, and beautiful – or the opposite. The facets of community character are primarily directed and realized through land use regulations, design standards, and placemaking. These tools provide guidance for both public and private realm components of a place, including building placement and orientation, architectural details, transparency and ground-level variation, streetscapes, landscaping, lighting, signage, pedestrian infrastructure, and transitions between different land uses and building types or densities.
By intentionally and strategically utilizing these tools within the specific context of Amarillo’s various districts and neighborhoods, the City can preserve areas with an established character that residents value, revitalize areas that have been neglected, mitigate incompatibilities, and clarify, elevate or reimagine areas that currently lack a specific identity or character.
The Community Character (CC) goals and recommendations in this chapter focus on these challenges and objectives. They expand upon the Complete Neighborhoods Scenario to provide more nuanced guidance for compatible and transitional relationships between adjacent Place Types as well as built form and design for private development and public spaces across different Place Types.
Compatibility, Adjacencies & Transitions Goals & Recommendations
CC Goal 1
Promote complete neighborhoods protected from, but connected to, nearby districts and corridors.
Perhaps the clearest theme heard throughout community engagement was the strong desire for more complete neighborhoods with daily needs and services nearby.
Recommendations
1. Update zoning code and development standards to introduce:
a. Overall compatibility and desired land use transitions.
b. Introduce Neighborhood Mixed Use Development as a way to smooth transitions between residential neighborhoods and heavy commercial or industrial areas.
c. Site development standards for transition areas such as parking location, building heights, landscaping, screening, and sidewalk connectivity.
d. Residential Zoning Districts that maintain and stabilize existing neighborhoods.
e. Integration of neighborhood amenities that are walkable from inside and outside of subdivisions.
f. Options to utilize drainage and retention areas as pedestrian connections internal and external to subdivisions.
g. Nodes of higher-density and amenity-rich development that provide recognizable concentrations of activity and improvements.
2. Promote the revitalization of historic commercial corridors and “main streets” and the introduction of new “main streets”, primarily through the Neighborhood Stabilization Strategy.
3. Transition auto-oriented commercial development at intersections into walkable, mixed-use places.
Transitional Buffers
Within Amarillo, there are several instances where single-family neighborhoods abut industrial uses. Having incompatible uses next to each other can often present undesirable conditions in the built environment. These areas present an opportunity to establish transition buffers, where higher density housing and mixed-use developments are between industrial and neighborhood residential areas.
The transitional buffer graphic shows how existing industrial properties could be retrofitted into innovation and community mixed-use type developments and how higher density housing can protect singlefamily homes from more intense uses. The introduction of these uses help create areas of activity that can be more easily accessed by adjacent neighborhoods.
FUTURE
CURRENT
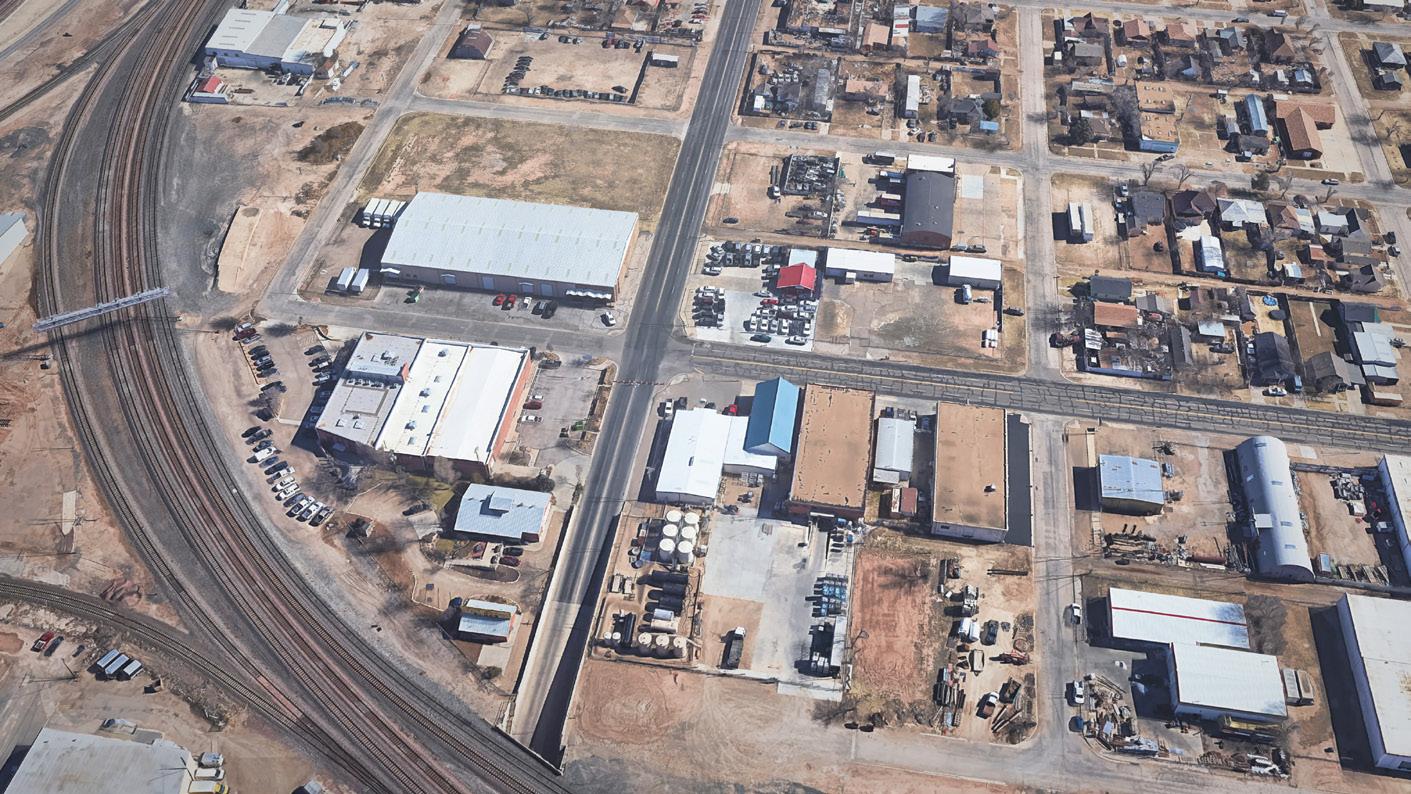
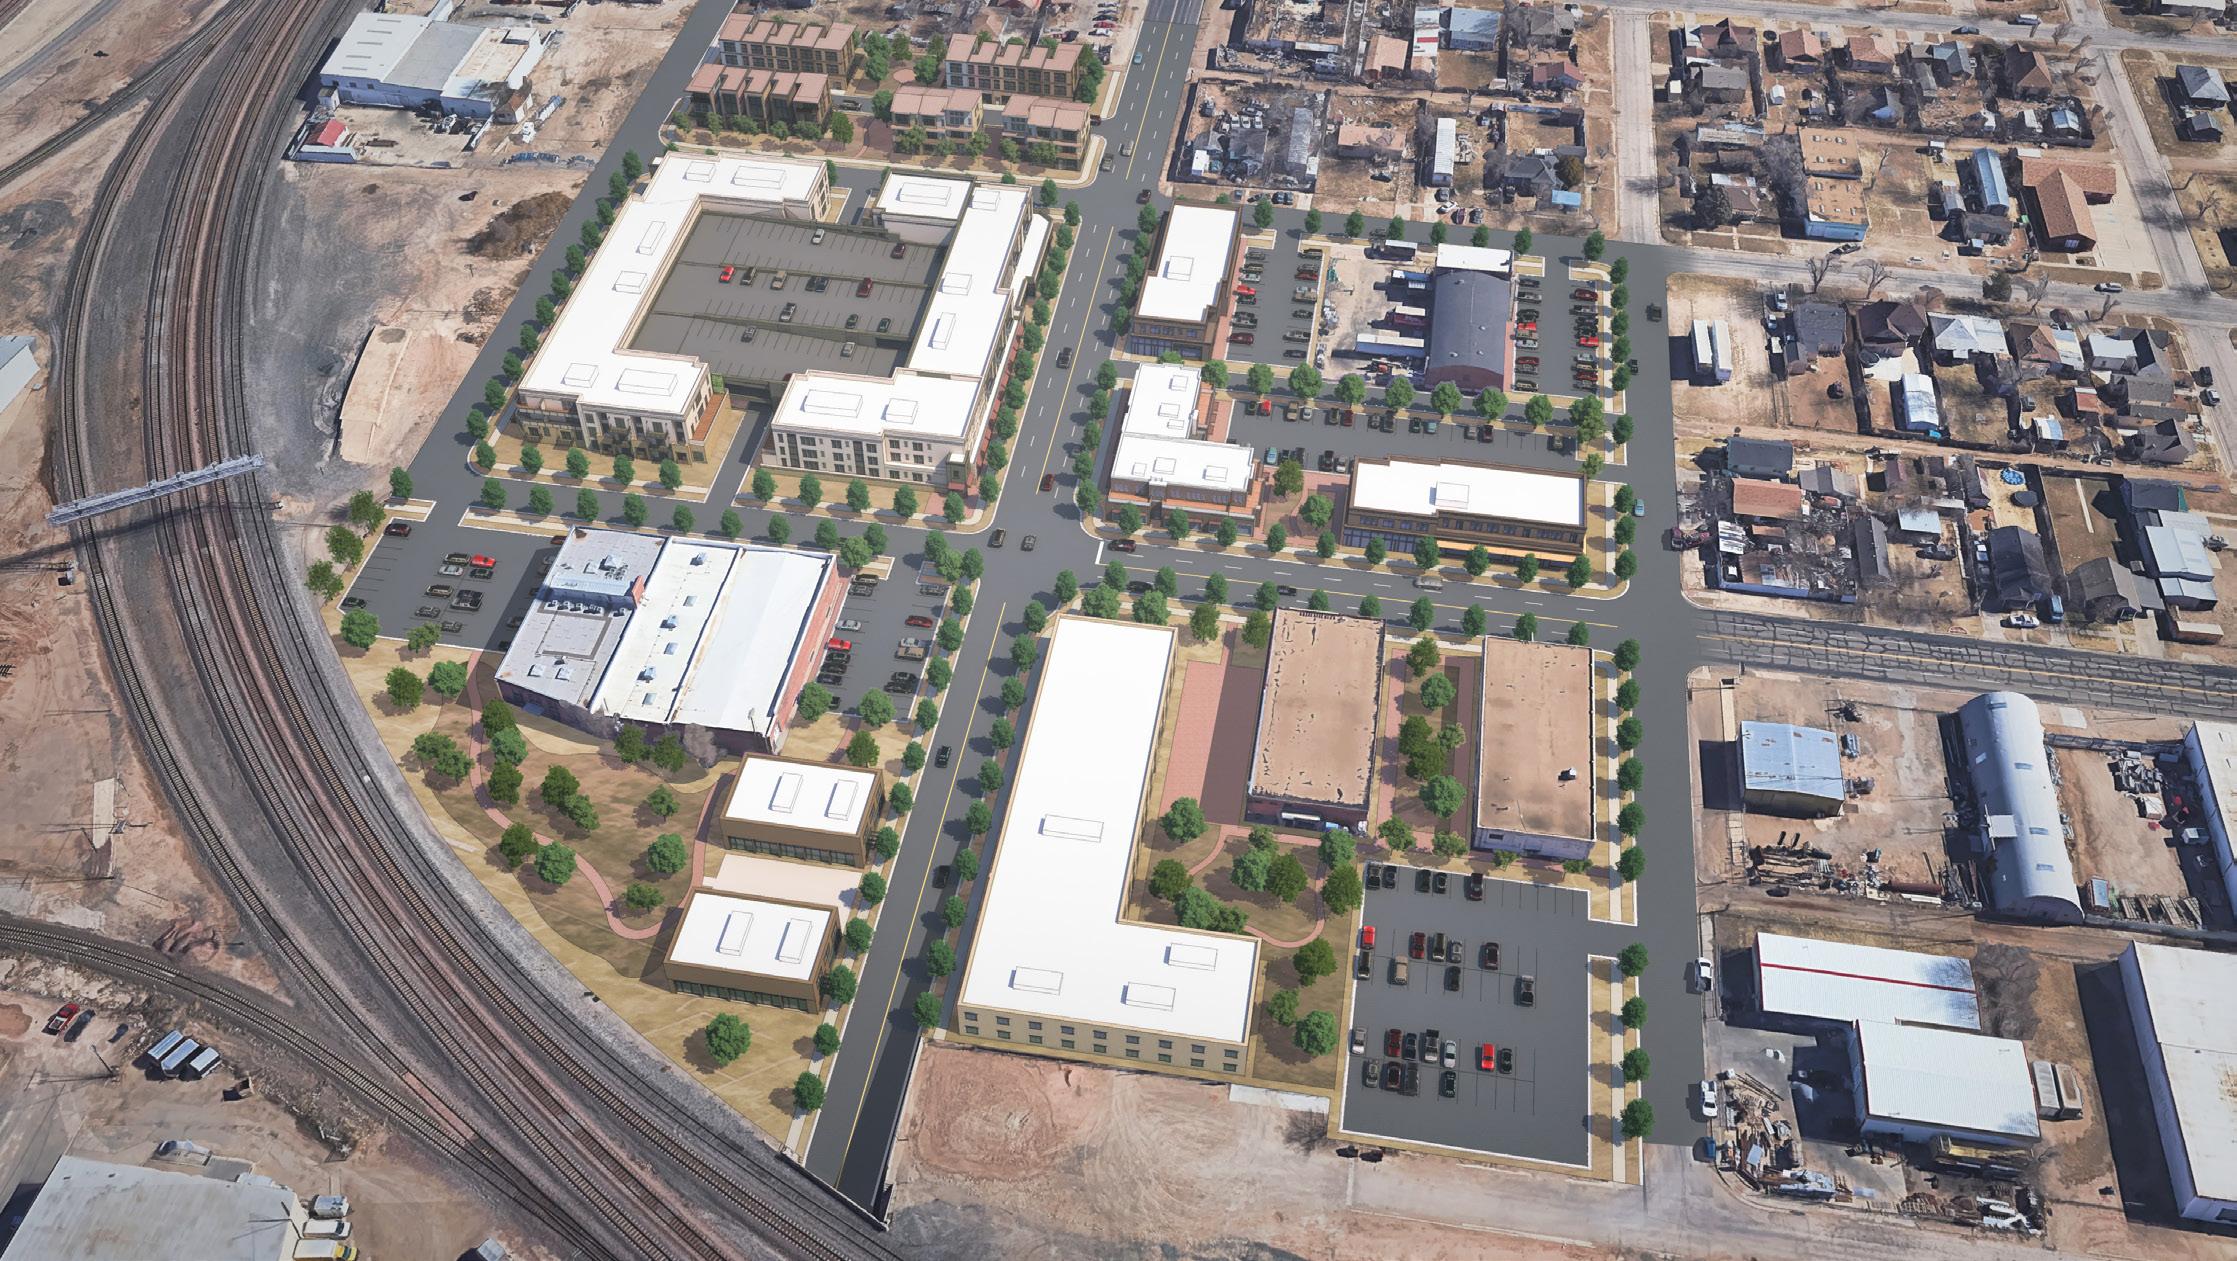
CC Goal 2
Revitalize older neighborhoods and commercial corridors by promoting compatible infill development.
Amarilloans across the entire community expressed a strong desire to help facilitate revitalization of older residential and commercial areas.
Recommendations
1. Update city codes and development standards to:
a. Adjust hierarchical zoning to eliminate introduction of new residential in industrial and heavy commercial areas, and the reverse condition of the introduction of new industrial and heavy commercial in neighborhoods.
b. Establish/strengthen compatibility standards (e.g., height, hours of operation, parking) where more intense uses occur near established residential neighborhoods.
2. Implement an opt-in process in partnership with neighborhood organizations for zoning changes as part of the Neighborhood Stabilization Strategy.
3. Bolster and proactively advertise incentive programs that support residential and commercial rehabilitation.
4. Continue to develop and implement Neighborhood Plans to ensure that localized needs and circumstances are addressed.
5. Promote mixed use development and middle density housing along older auto-oriented commercial corridors.
6. Prioritize review for infill and revitalization projects.
CC Goal 3
Protect economic anchors and key employment areas.
While protection of existing neighborhoods was the community’s top priority, Amarilloans also expressed a strong desire to ensure existing employment areas continue to be great places to maintain and grow businesses.
Recommendations
1. Update zoning code and development standards to:
a. Minimize residential encroachment into more traditional employment areas and areas with industrial and heavy commercial uses.
b. Facilitate innovation areas that intentionally allow and encourage a mix of lighter, creative employment uses, entertainment, services, and housing.
2. Maintain large areas to accommodate large format manufacturing and logistics as well as larger campus development (e.g., business headquarters, medical, and higher education uses).
3. Provide opportunities for missing middle and higher density neighborhoods near job centers and employment areas.
4. Incentivize small pockets of interspersed neighborhood-serving business development by marketing small business programs to neighborhoods.
Commercial Corridor & Arterial Infill
The revitalization of commercial corridors can create conditions that convert underutilized or vacant storefronts into areas that spur economic growth and can lead to thriving communities. As commercial corridors become well-established, they have the opportunity to provide a variety of retail options to residents, increase jobs in the community, add housing options, and improve physical surroundings through the use of public space.
The arterial infill graphics depict two options of development that could be introduced along major arterials. One option shows the preferred placement of commercial and retail uses. These are located closer to the major arterial with activated storefronts facing
FUTURE: Commercial
both the road and parking area. Parking is tucked away behind the buildings creating an enhanced urban environment for both vehicles and pedestrians. An open space or stormwater retention area helps create a buffer between commercial use and the existing residential neighborhood.
Another option illustrates how higher density housing could be incorporated along major roads. High density multifamily development is located closest to the major road, granting it higher visibility and access. Medium density townhomes, located between the existing residential neighborhood and the higher density housing, serve as a transitional buffer and provide additional housing options.
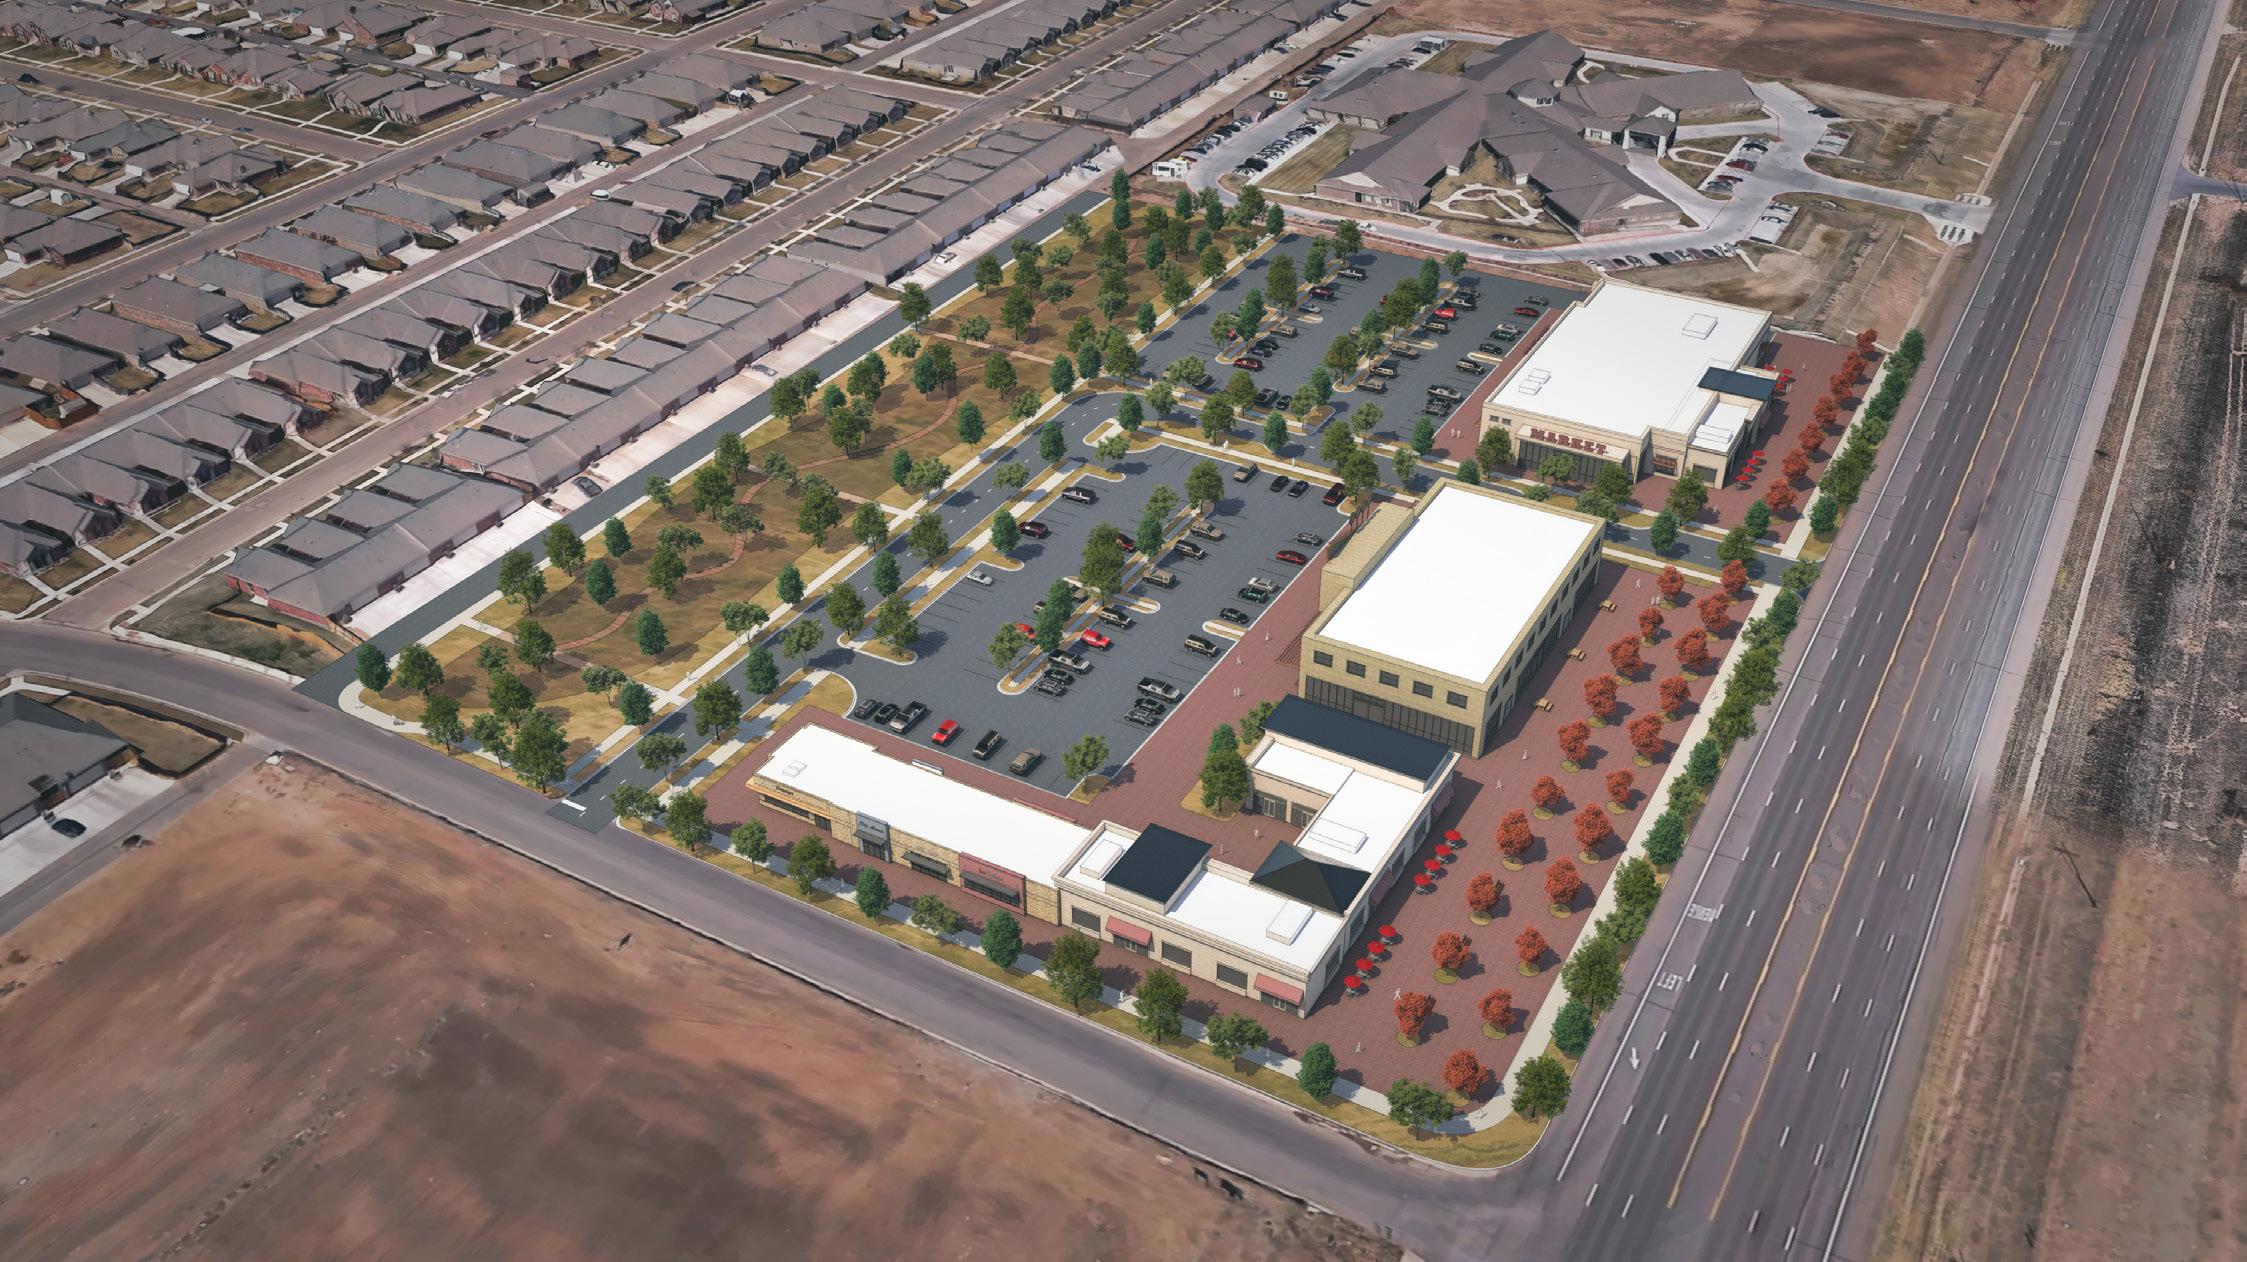
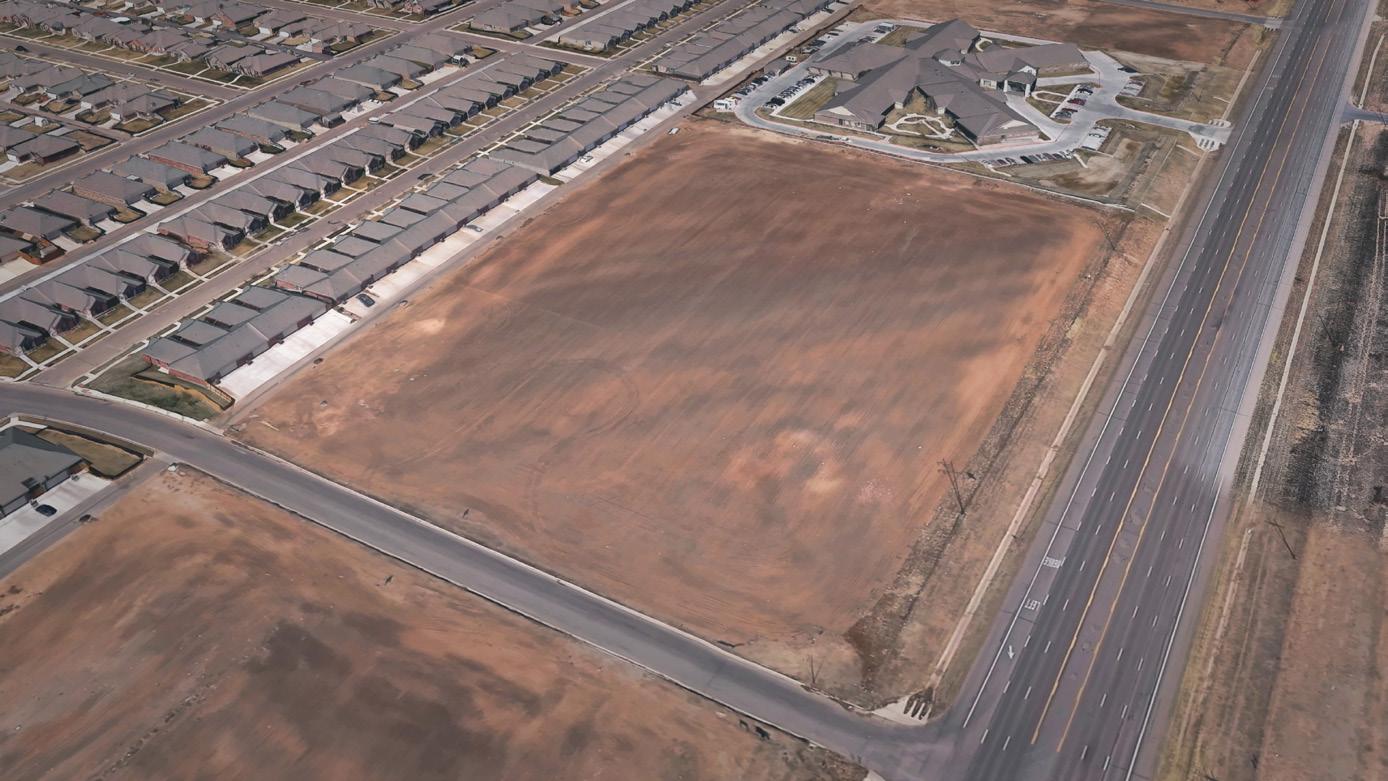
FUTURE: Residential
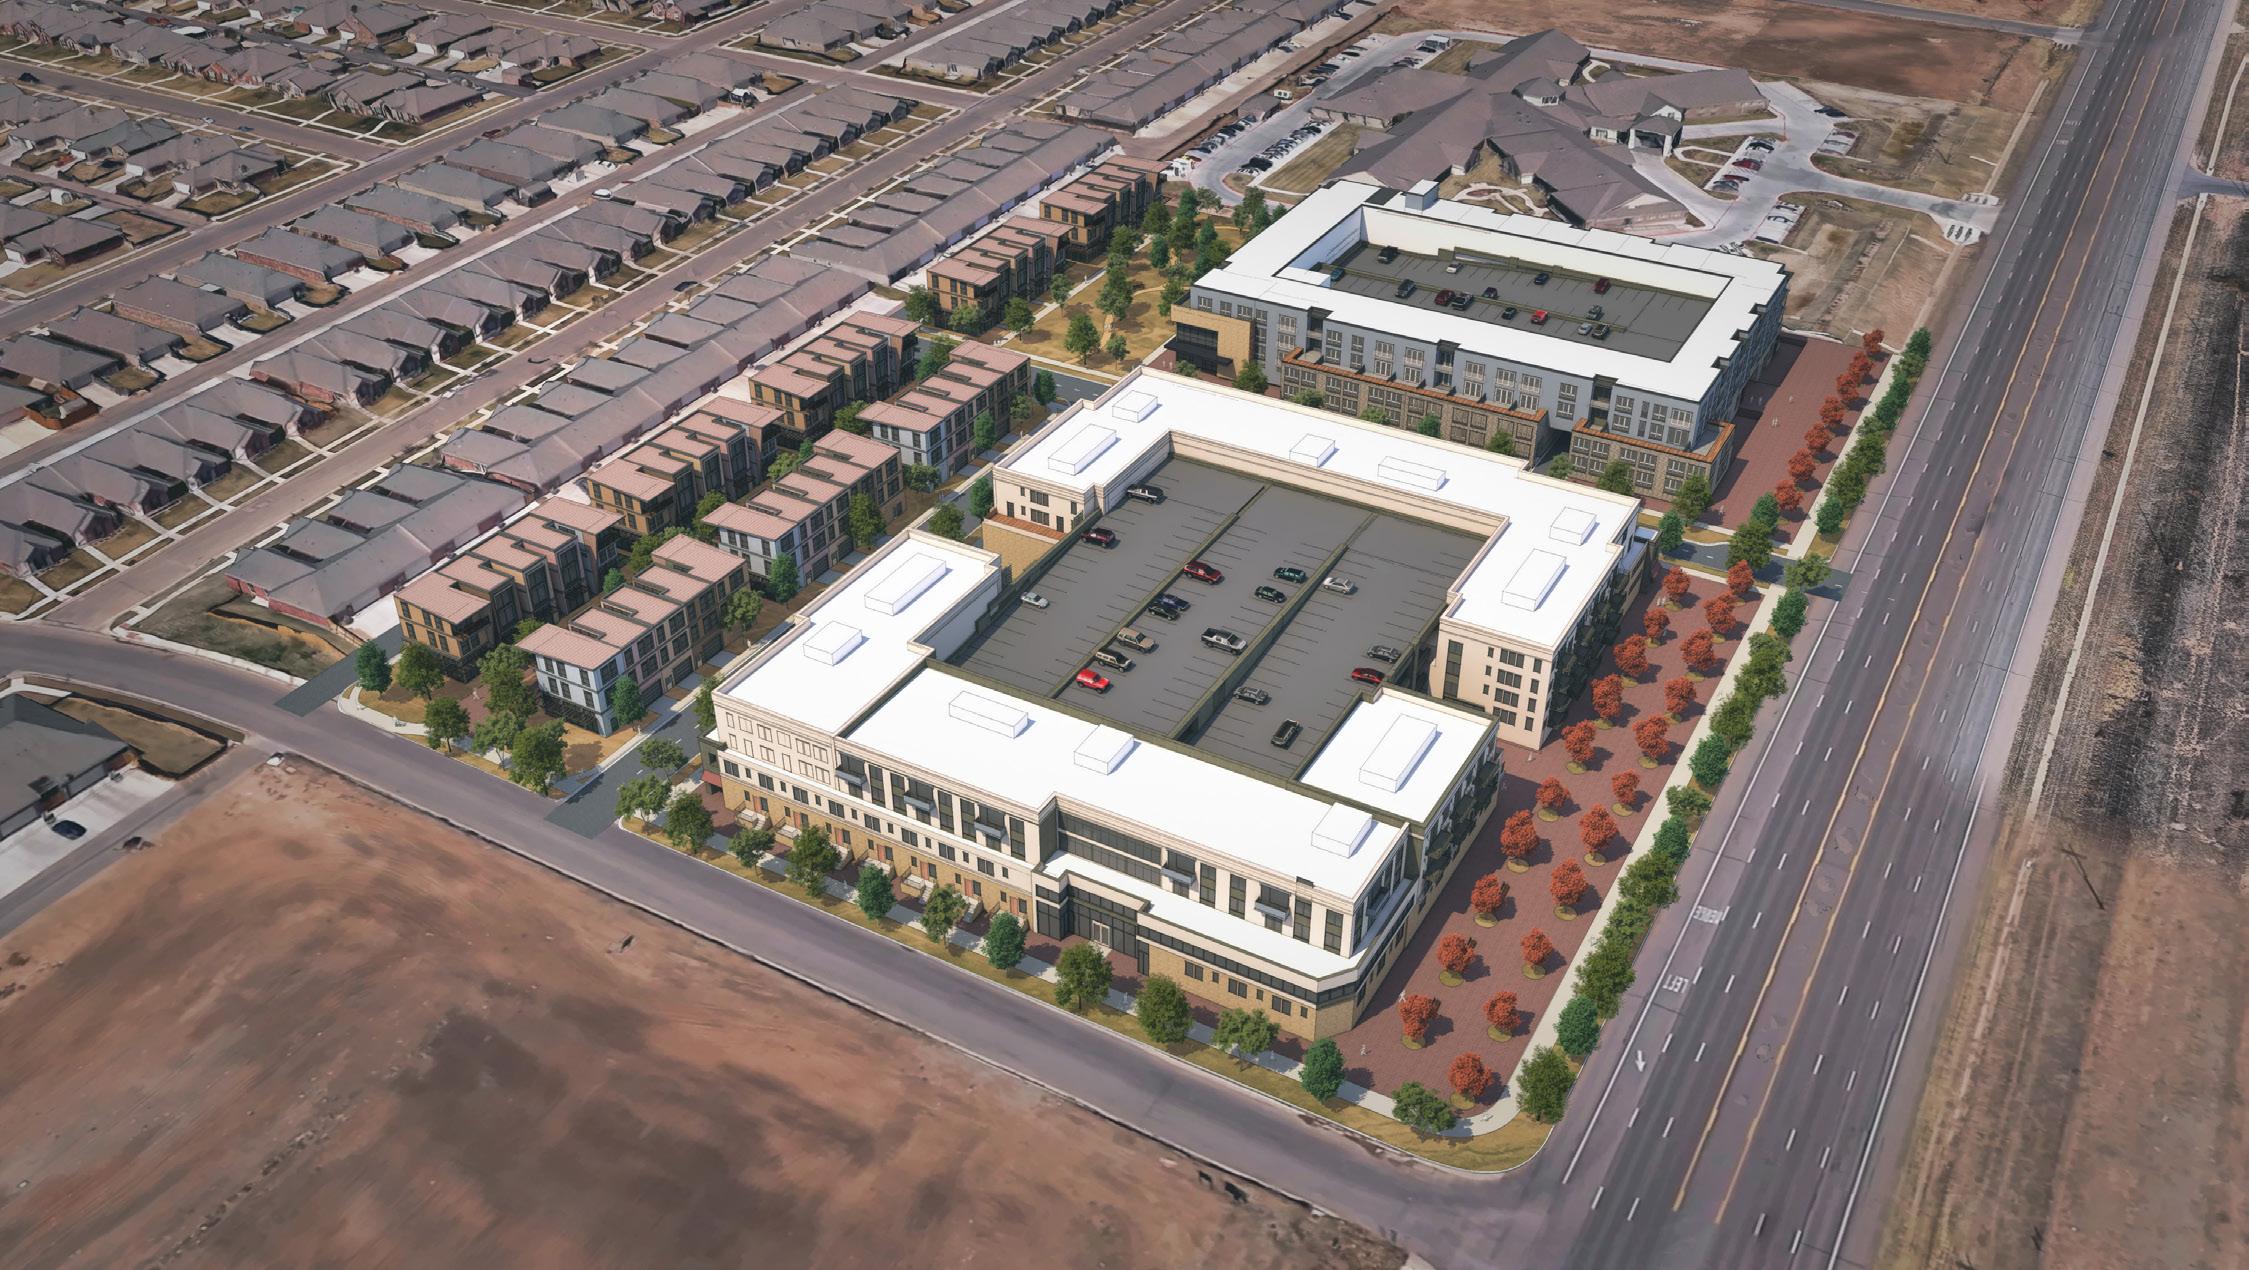
Identity & Design Goals & Recommendations
CC Goal 4
Promote community aesthetics and image.
Amarilloans reiterated desires expressed in the last Comprehensive Plan to beautify the community..
Recommendations
1. Create or update design guidelines and standards for:
a. Downtown
b. Route 66 corridor
c. Highway corridors
2. Update street design standards to require or promote buffered sidewalks, street trees, pedestrian lighting, furnishings, etc.
3. Develop a public-private partnership strategy for improving aesthetics of buildings and signage along highways.
4. Bolster programs for façade improvements.
5. Promote the use of design elements that help mitigate sound pollution along major corridors and highways.
6. Identify and enhance priority gateways and corridors (streetscape improvements, public art, lighting, signage, etc.).
7. Utilize signage, entry monuments, banners, etc. to promote and celebrate individual neighborhood identity and pride.
8. Conduct neighborhood character studies throughout the city and consider implementing neighborhood overlays to preserve unique neighborhood characteristics and ensure compatible development.
FUTURE: Setbacks & Entrances
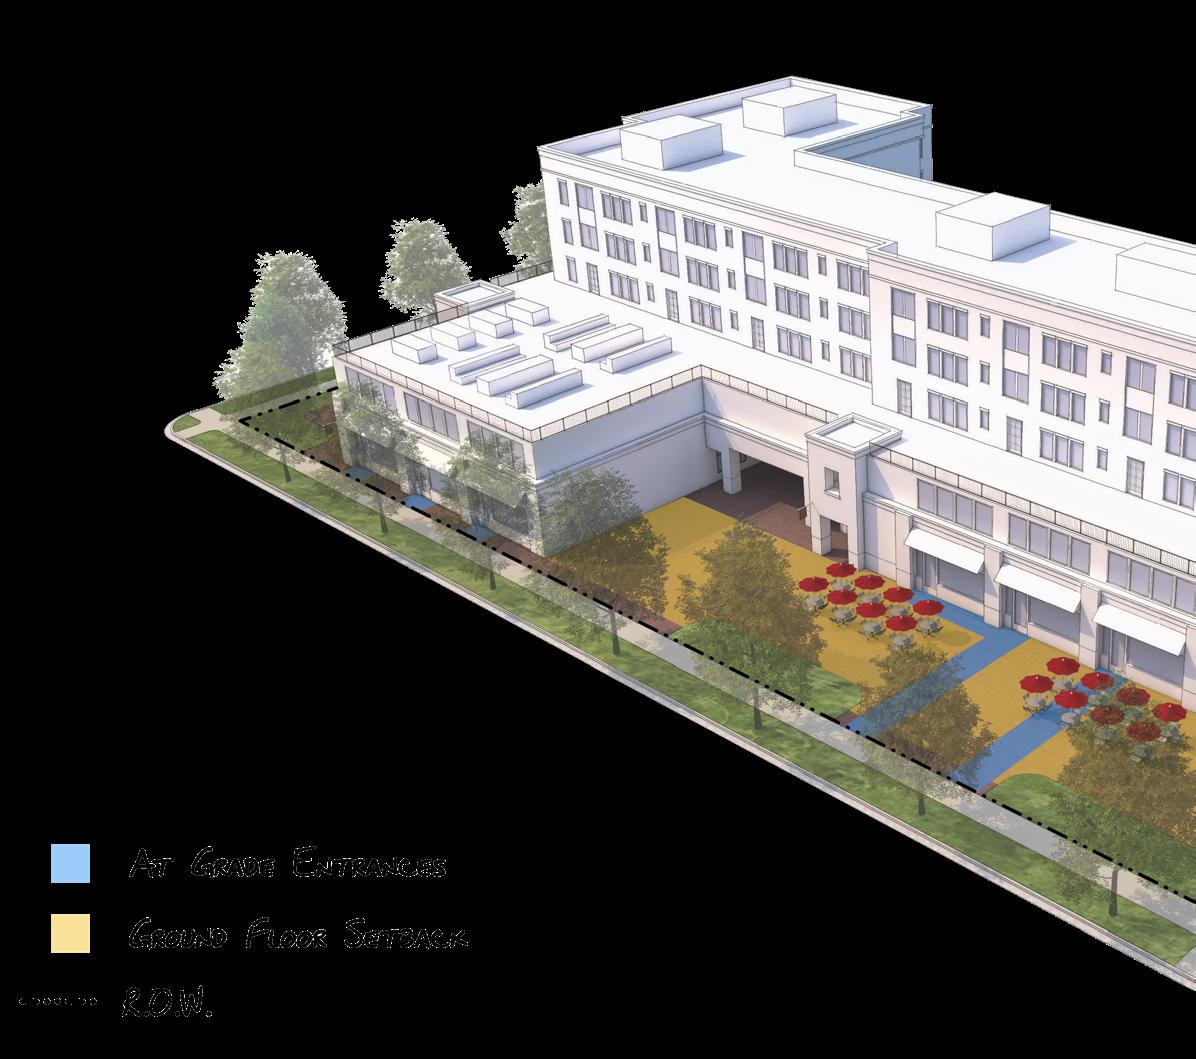
FUTURE: Height & Columns
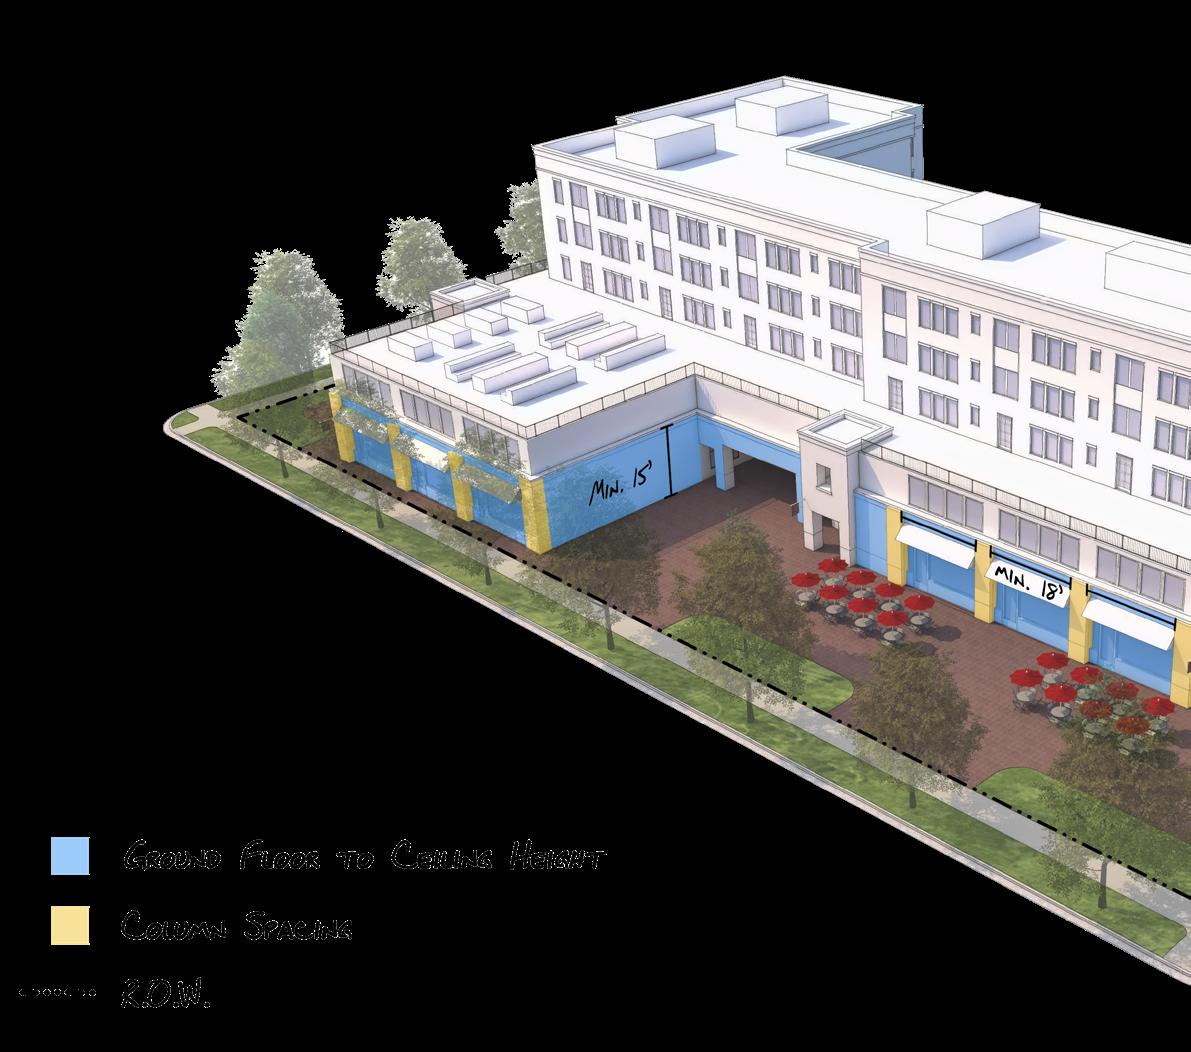
Entrances
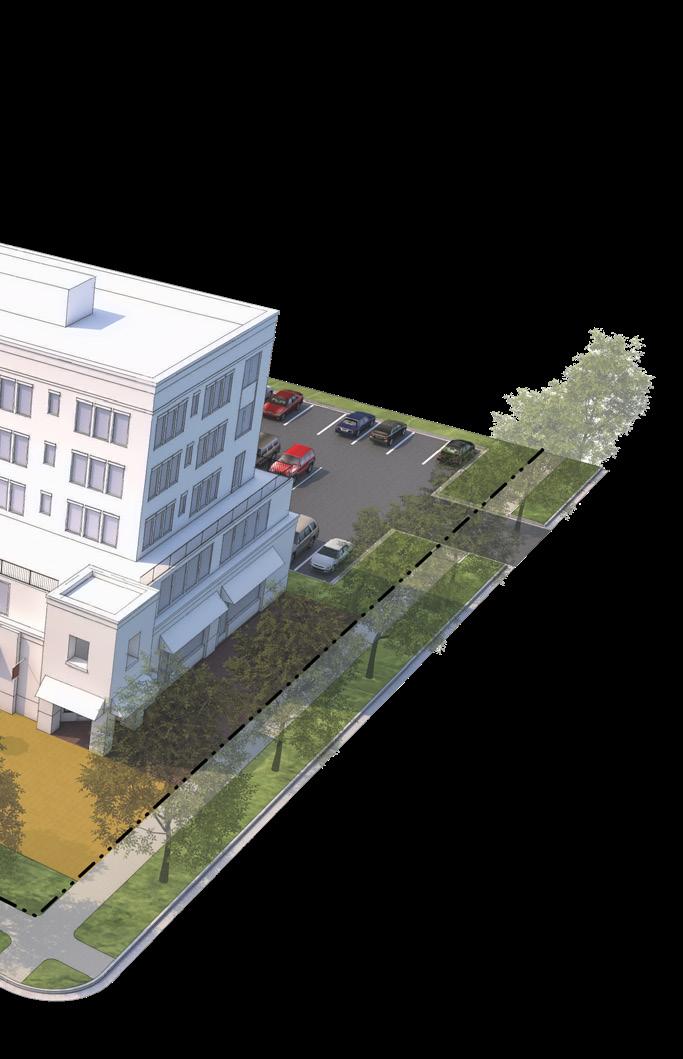
Ground Floor Design & Flex Space
The following diagrams help illustrate design considerations for flexible ground floor spaces. The creation of flexible ground floors allows these spaces to be adapted to other uses throughout the lifespan of the building. Specifically, these diagrams show the possibility of converting residential ground floor units into commercial spaces once the market demand is sufficient to help support commercial retail development.
FUTURE: Awnings & Transparency
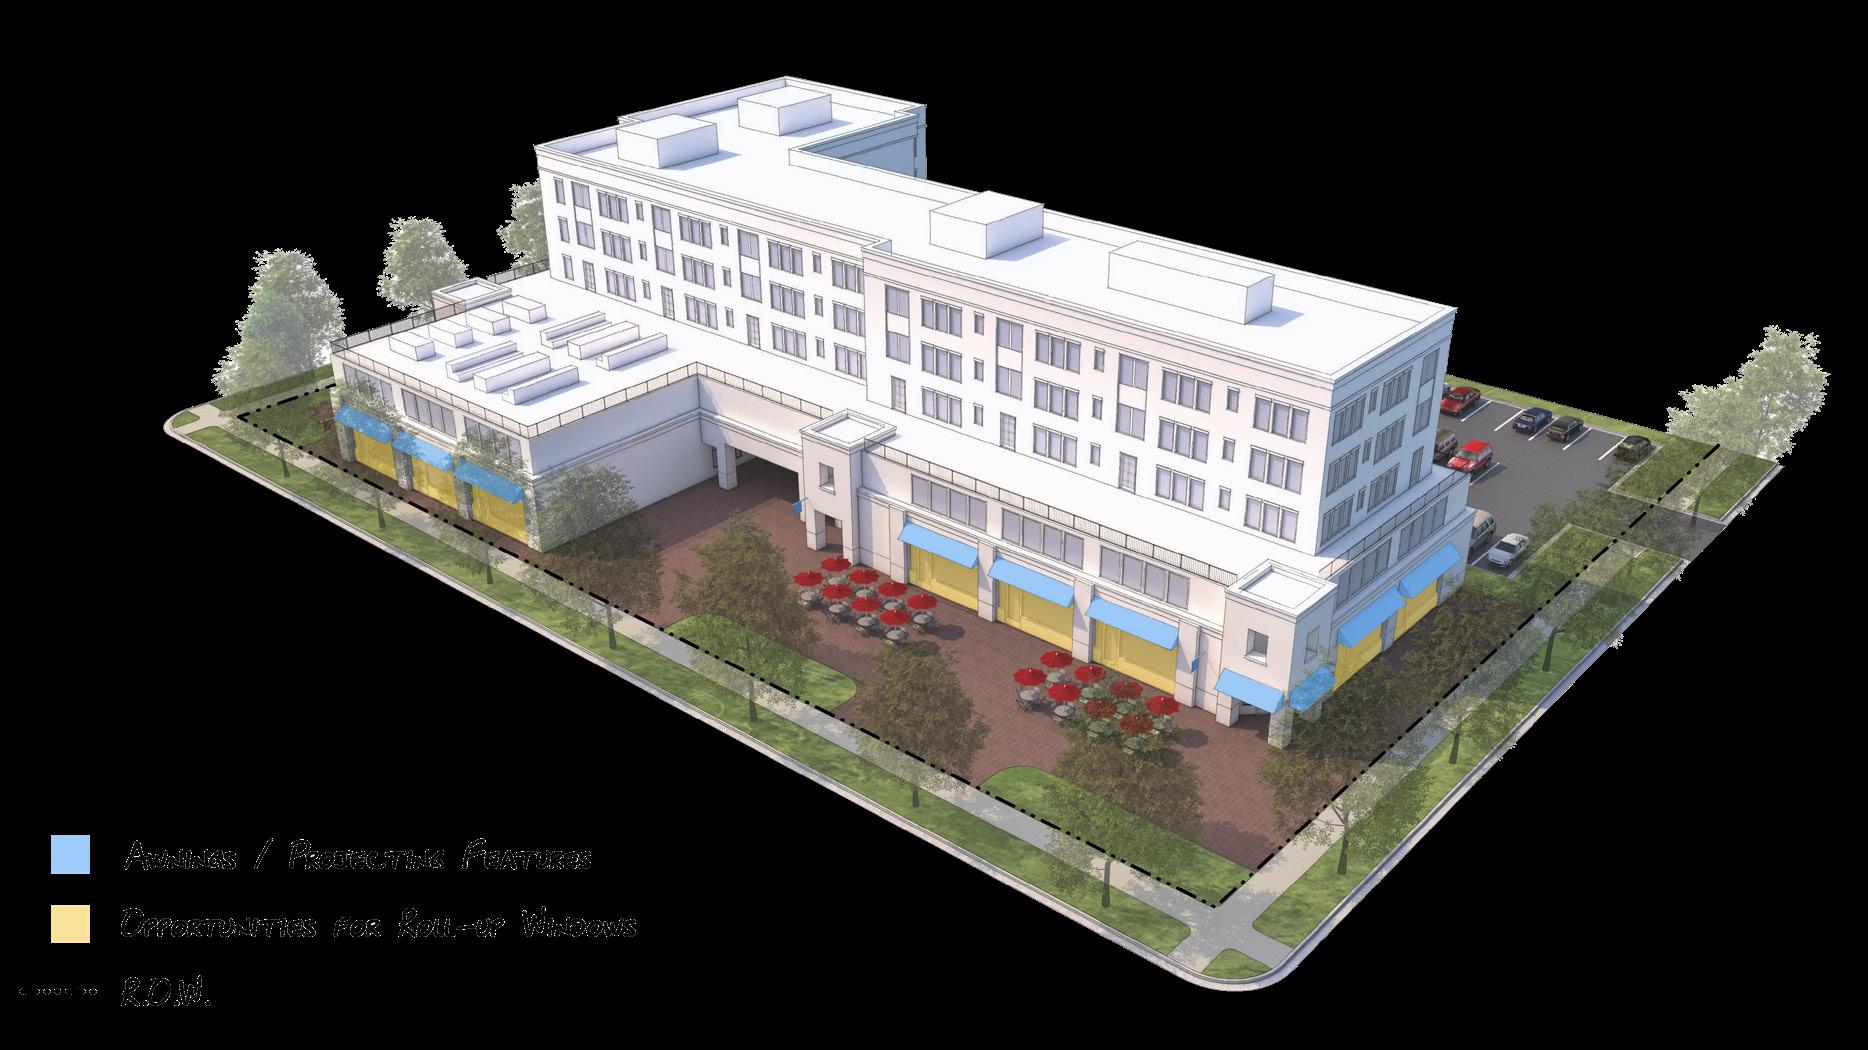
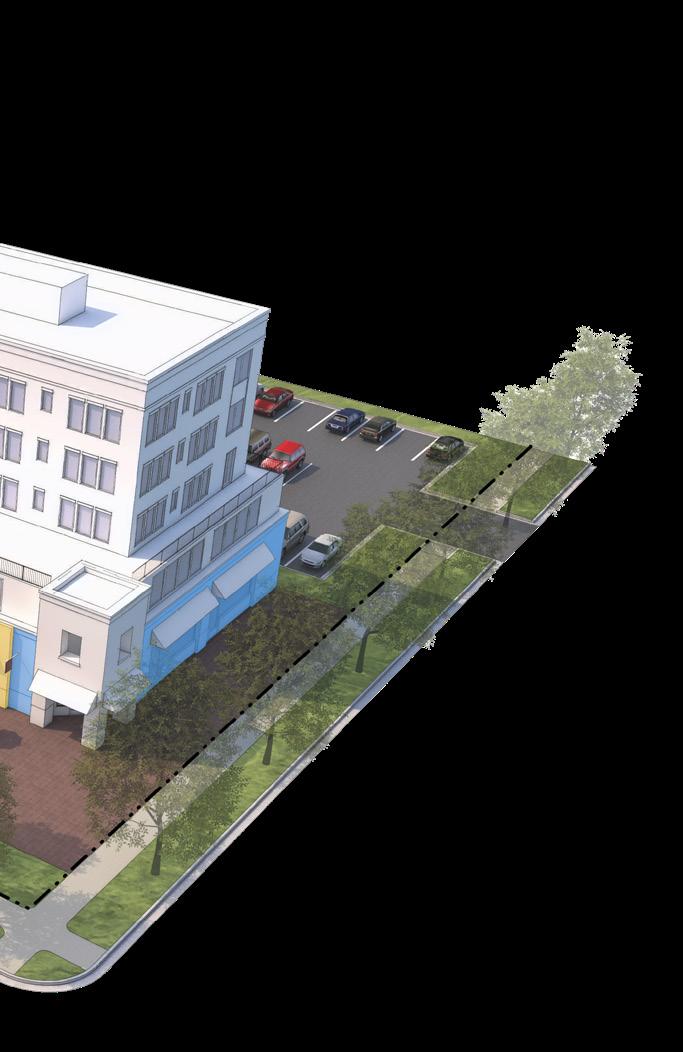
Design elements to consider when creating flexible ground floors include the following:
• At Grade Entrances
• Ground Floor Setbacks
• Ceiling Height
• Column Spacing
• Space for Awnings/ Projecting Features
• Opportunities for Rollup Windows
Mobility
Current Conditions
Objectives for Future Mobility Infrastructure
Mobility Goals & Recommendations
Current Conditions
Amarillo’s street network is mostly structured around block grids that follow the section lines, with smaller, more traditional blocks in the urban core and northern neighborhoods and larger or more curvilinear blocks in surrounding suburban areas. Major highways and thoroughfares cut across these grids along irregular paths, contributing to directional skews or transitions in the block pattern. In general, Amarillo’s grid system lends itself to a relatively walkable environment within neighborhoods, but safety, connectivity, and congestion remain challenges and high priorities for Amarillo.
Public transportation in Amarillo is provided by Amarillo City Transit (ACT), offering fixed-route bus service and on-demand paratransit service. While these routes provide decent service to and from downtown, transit connections between neighborhoods and across districts are limited.
The state, through the Texas Department of Transportation (TxDOT), owns and maintains the freeway system, including I-40, I-27, US 87, and Loop 335; select major arterials including Amarillo Boulevard (I-40 Business), Historic Route 66 (SH 279), Fritch
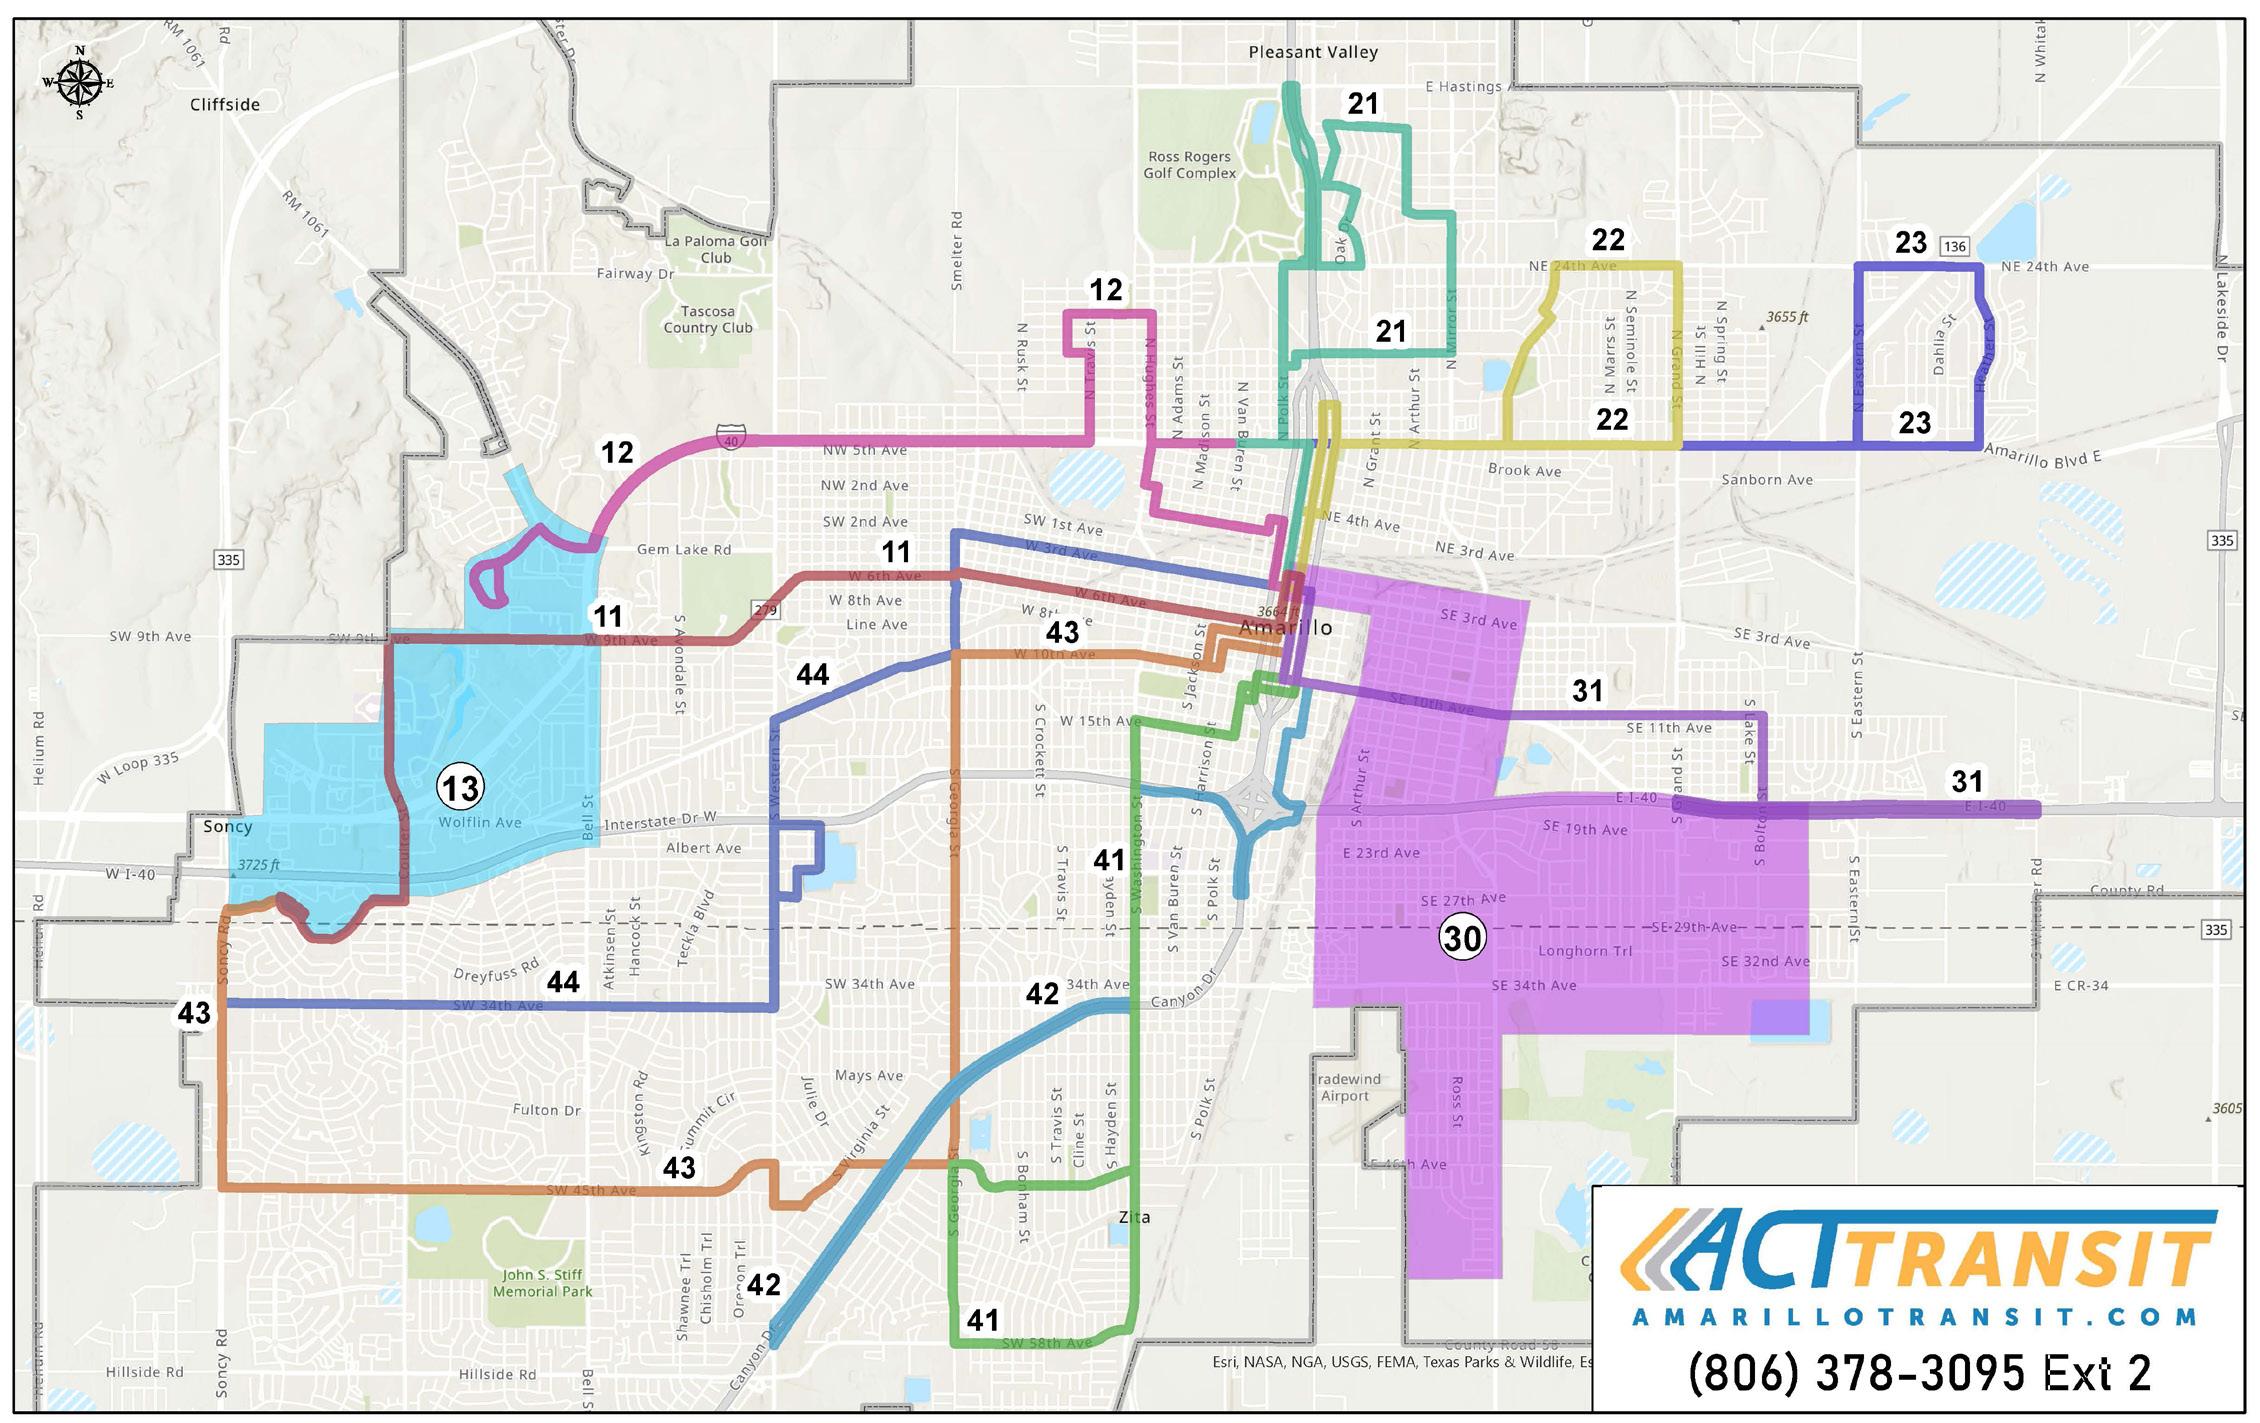
Highway (SH 136), the Broadway/Hughes corridor (FM 2196), the South Washington corridor (FM 1541), and the Tee Anchor/SE 10th corridor (Loop 395). The Metropolitan Planning Organization (MPO) plays a critical role in regional transportation planning to secure and allocate federal funding across priority projects through 3-year fiscally-constrained Transportation Improvement Plans (TIP) and 20-year unconstrainted Metropolitan Transportation Plans (MTP).
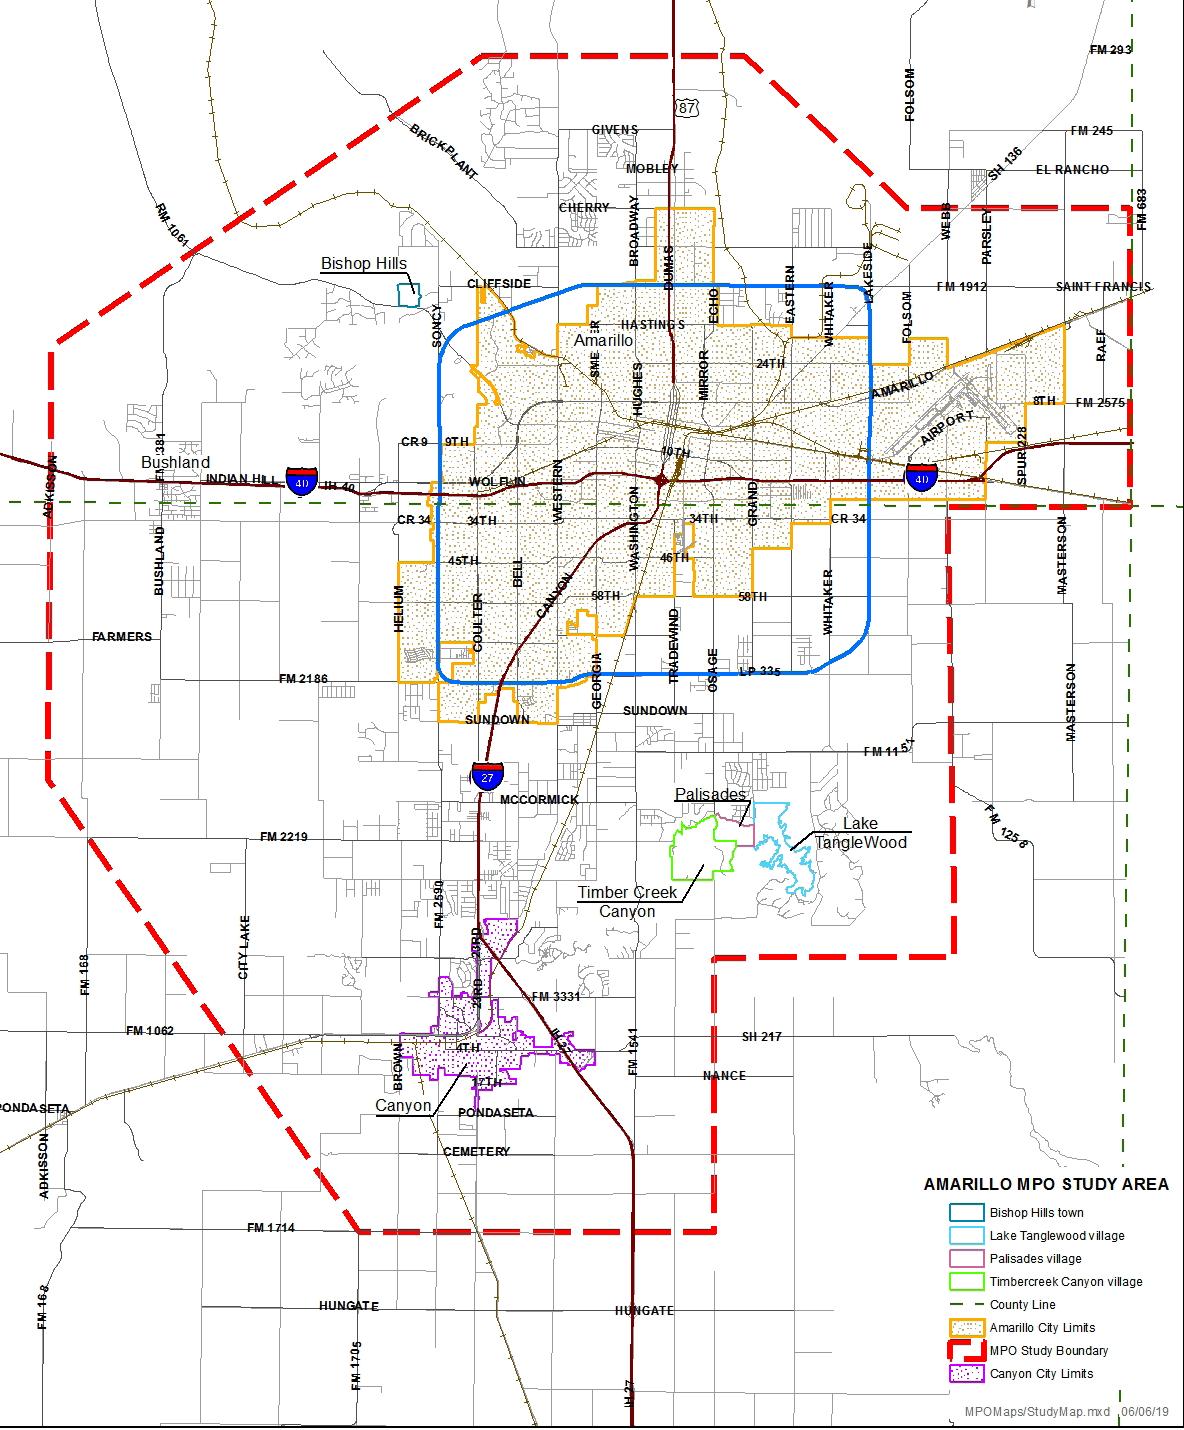
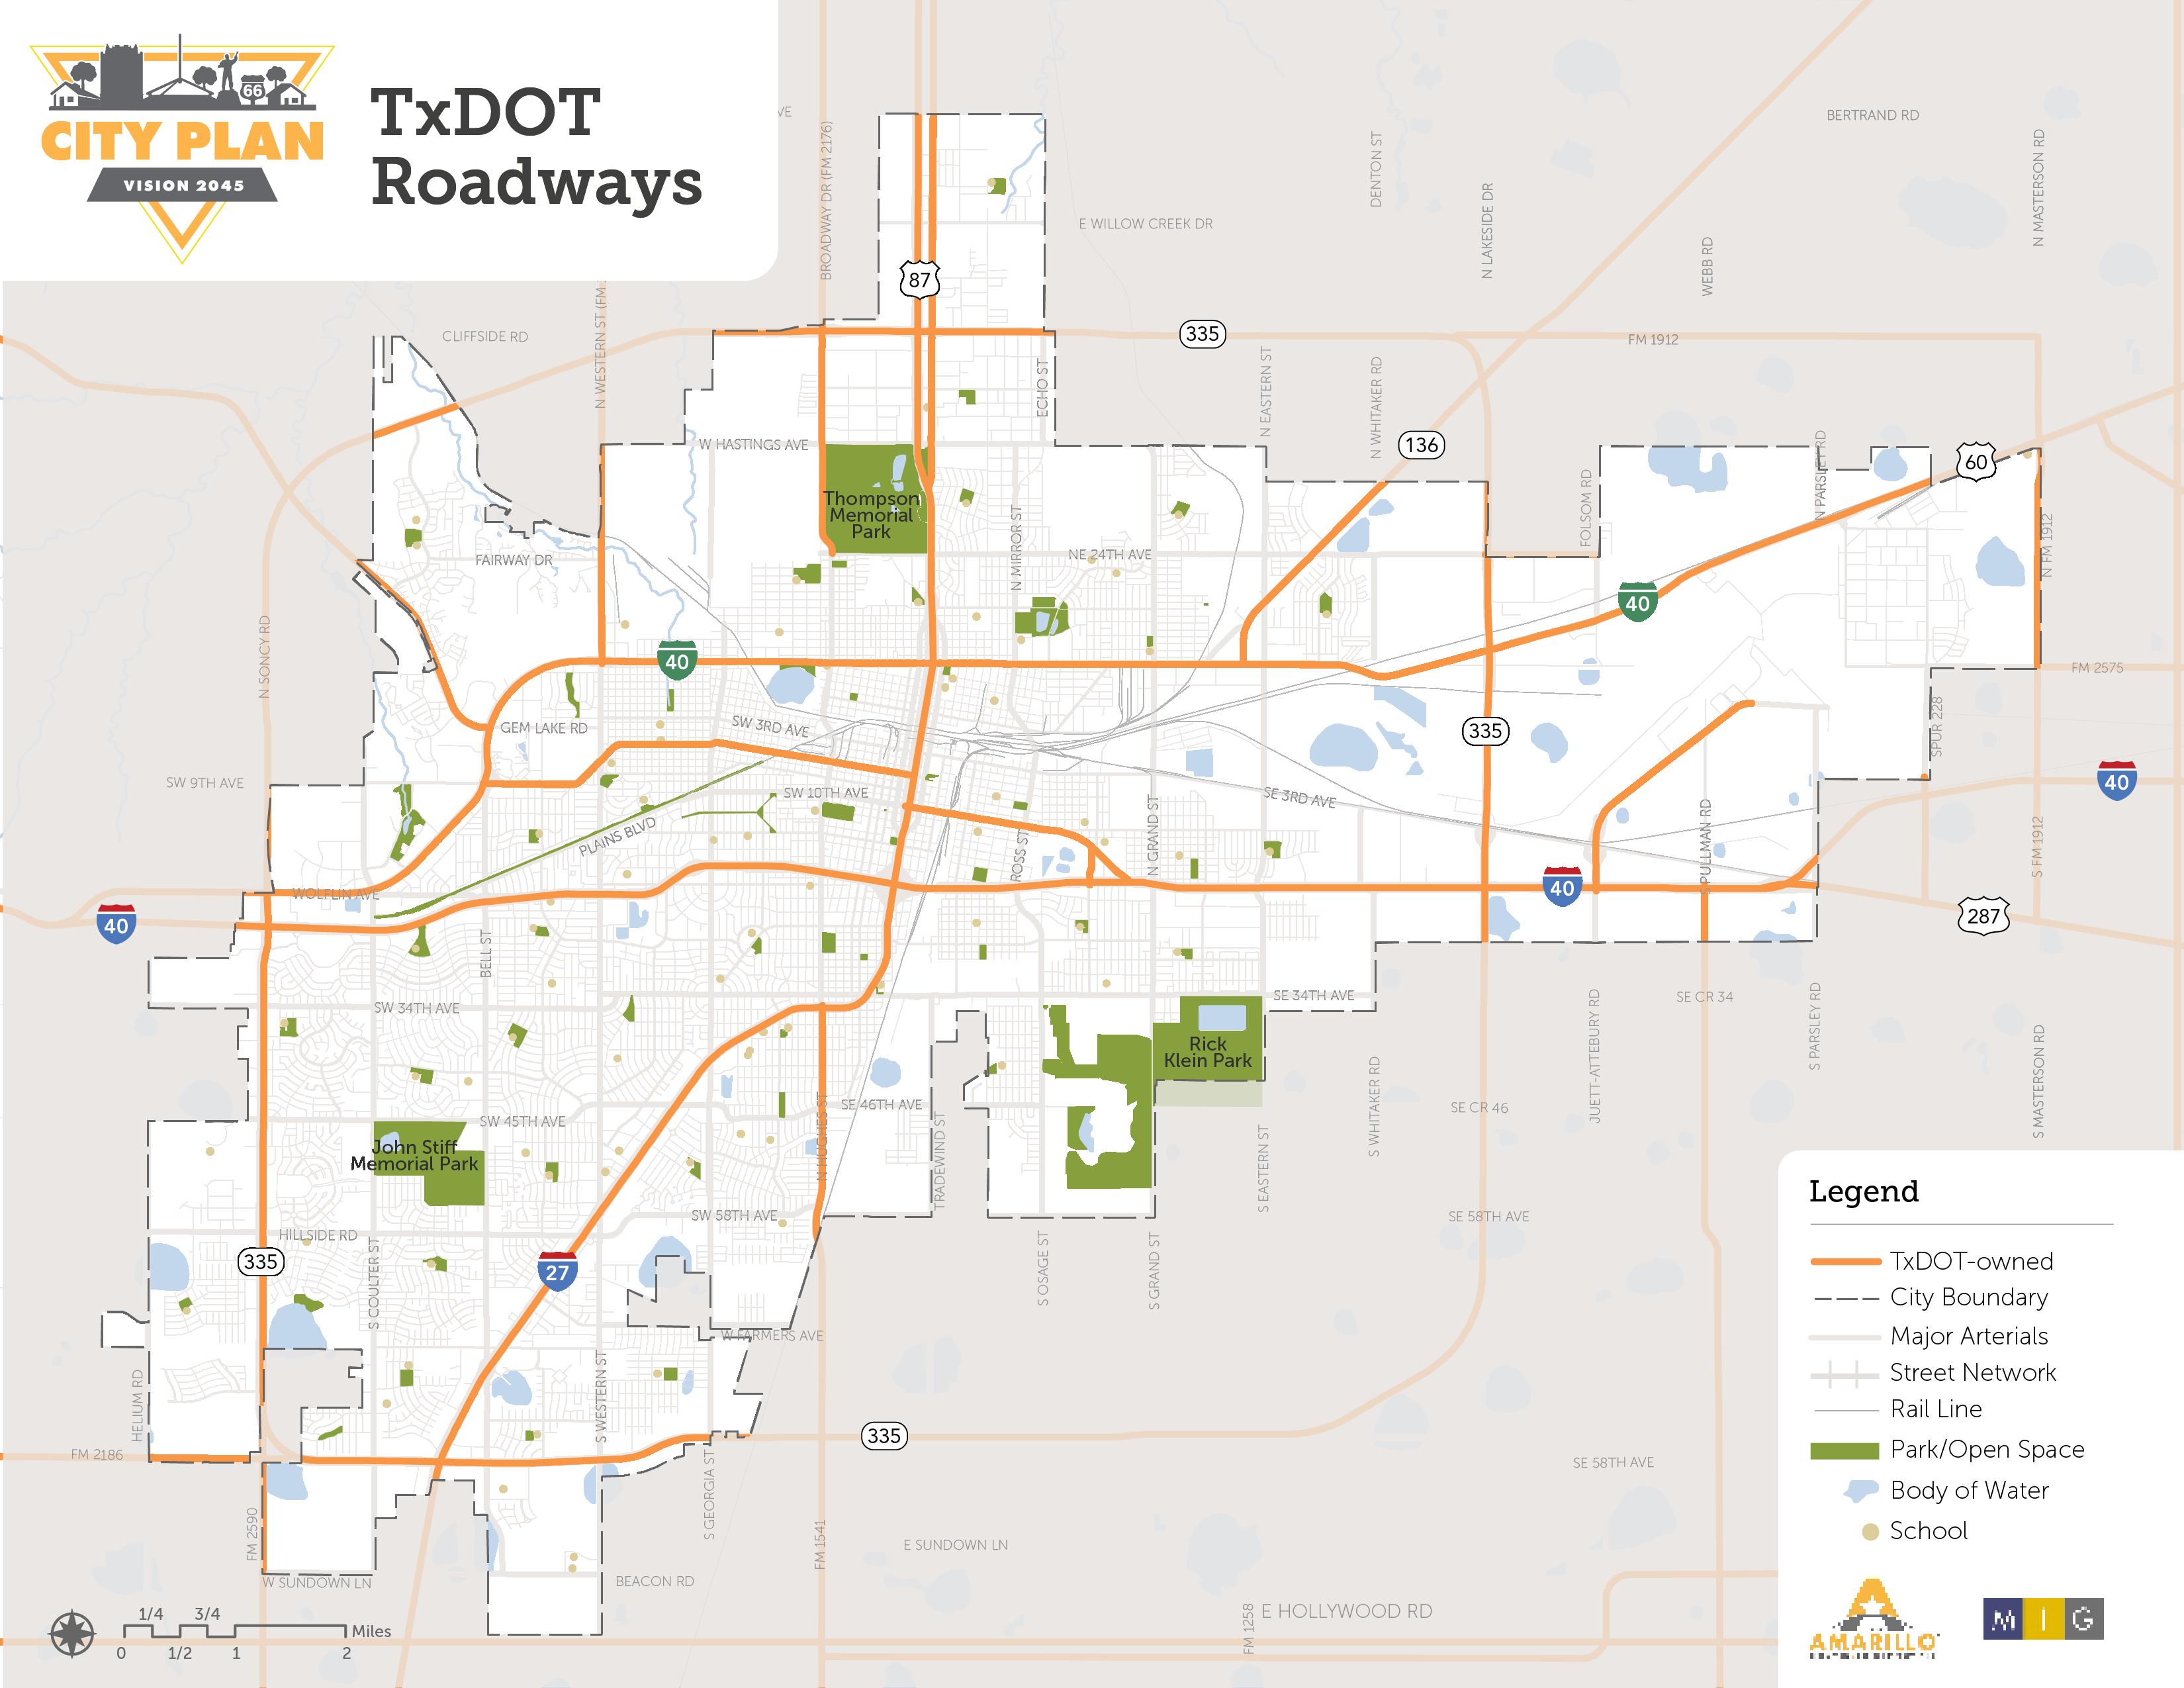
MPO Area
To meet Amarillo’s infrastructure needs, the City must address the further challenge of an extensive local funding gap, driven by state regulation on sales tax paired with low property taxes and service fees. These conditions have left Amarillo with compounding deferred maintenance and ever-growing funding deficits, reducing the City’s ability to support growth projects. Infrastructure funding is allocated to priority projects through five-year Capital Improvement Plans (CIP).
In 2021, Amarillo established the Partnership for Development Progress (PDP), a task force dedicated to identifying and facilitating “sustainable and predictable funding source(s) to increase lots available for development without putting development costs on Amarillo property taxpayers”. The PDP report inventories current infrastructure conditions, needs, and costs for drainage, streets, water, and sewer. Primary recommendation initiatives include the creation of a streets enterprise fund, the prioritization of street work based on pavement condition, and the creation of a process for developers to pay for new street infrastructure, either directly or through an impact fee, with the City then taking over maintenance. The PDP report provides valuable guidance for long-term planning needs and fiscal policy.
Future Need
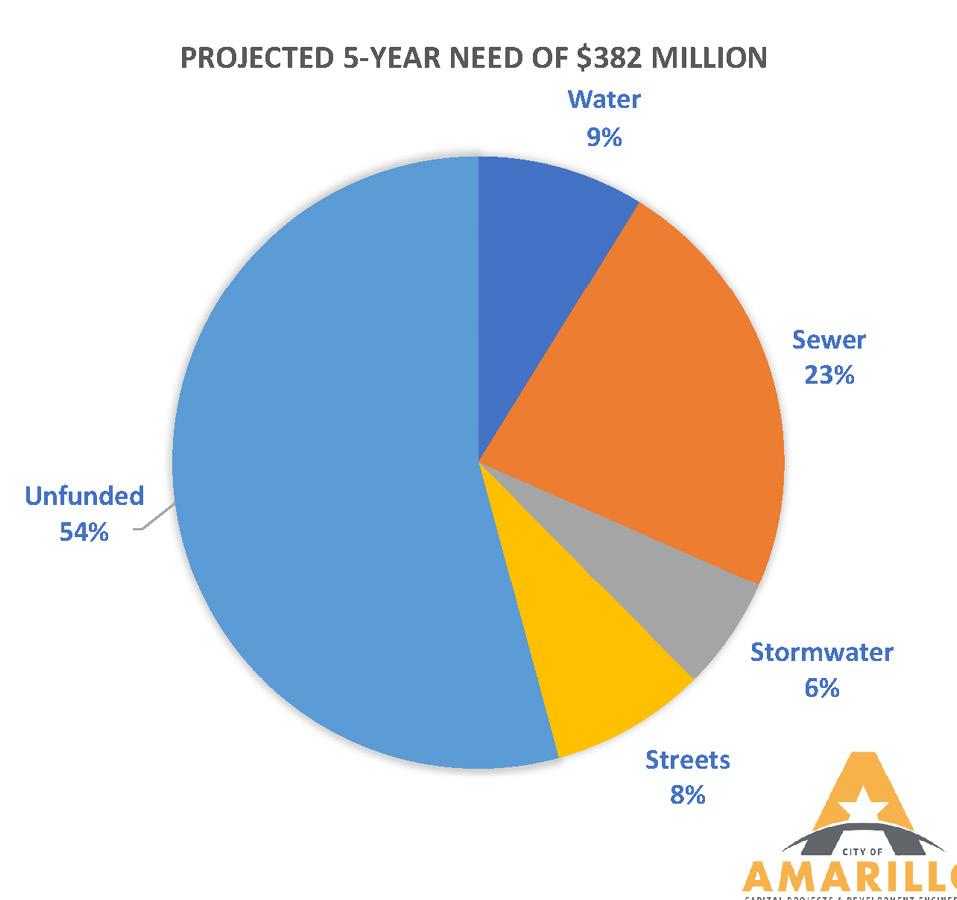
Current Deficits
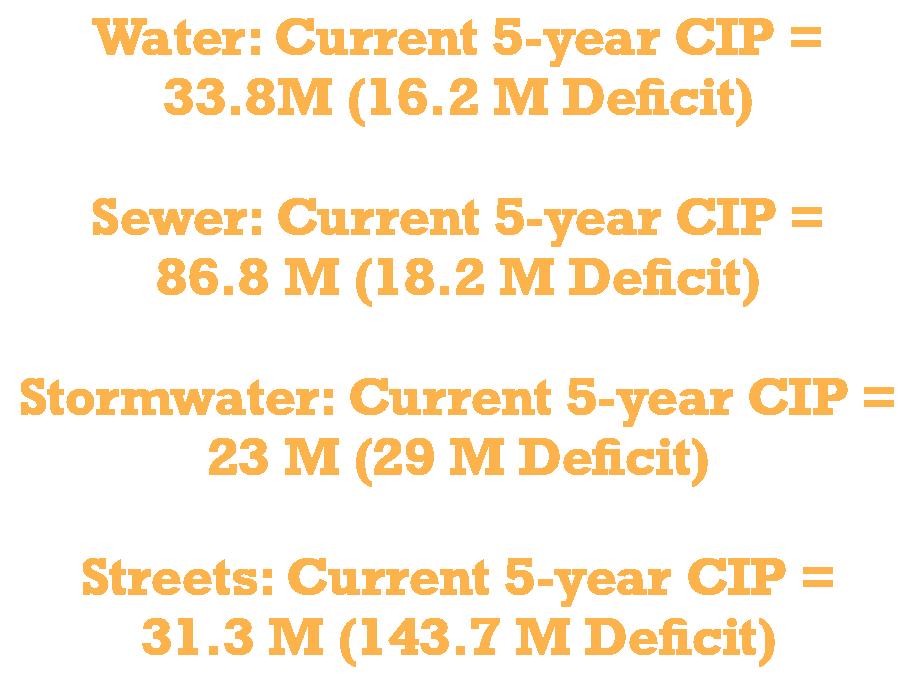
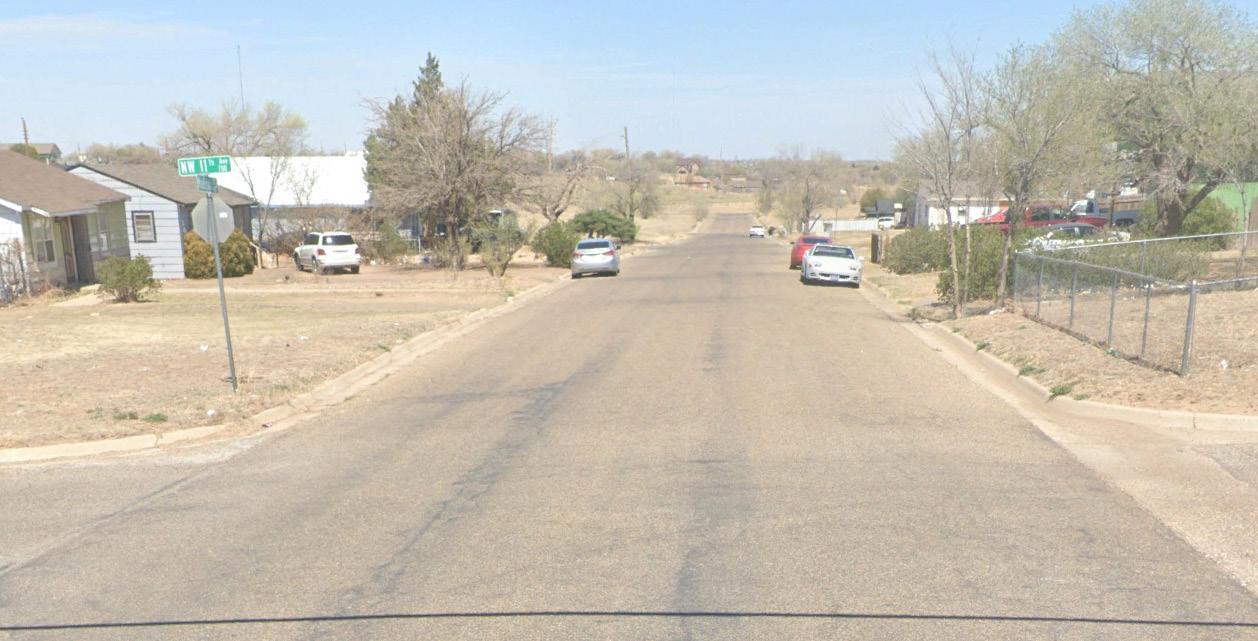
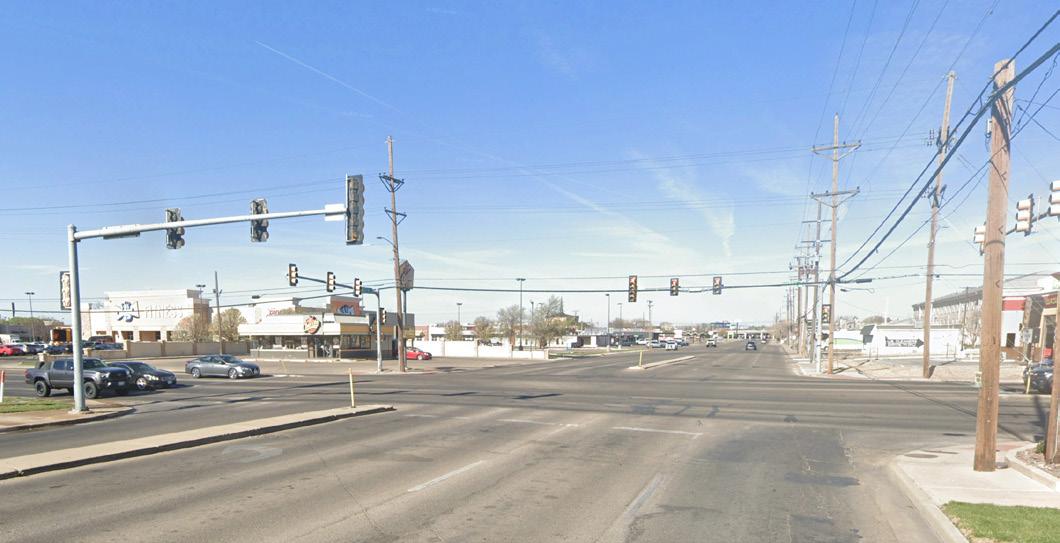
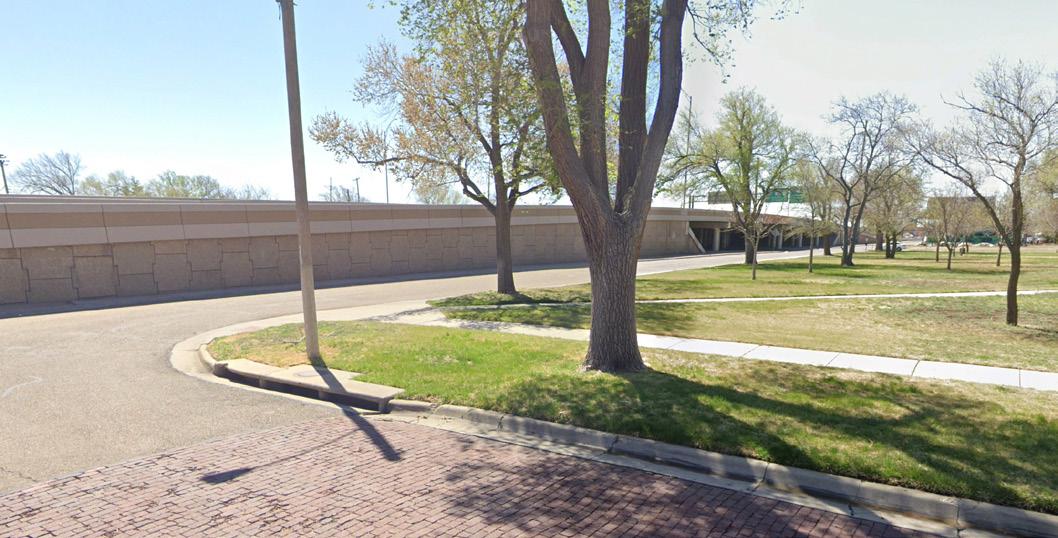
Objectives for Future Mobility Infrastructure
Historic development patterns across the United States and in Amarillo have depended upon and prioritized private vehicular transportation, including road expansions and peripheral greenfield development. This has meant significantly less investment occurred in services and infrastructure for alternative modes, such as walking, biking, or public transit. Apart from increasing traffic congestion, these standards have produced outcomes that reduce quality of life and harm natural and human environments. Today, residents are typically spending more sedentary time commuting and more money on transportation costs than they did in 2010, sometimes contributing to a household cost burden. While City Plan recognizes that private vehicles will continue to be an important mode of movement, the objectives and policies that guide Amarillo’s future focus on the creation of a more holistic mobility network which improves safety, connectivity, access, health, and choice for the Amarillo community.
As discussed in Chapter 3, land use regulations play a significant role in increasing proximity between homes and daily needs, such as jobs, education, childcare, services, and entertainment. Intentional and strategic investment, standards, and regulations for street infrastructure and transit service also play a critical role in diversifying mobility options.
The Mobility (M) goals and recommendations in this chapter are focused on these needs, challenges, and objectives. They expand upon the Complete Neighborhoods Scenario to provide more nuanced guidance for improving safety, comfort, connectivity, and convenience for pedestrians and cyclists as well as identifying specific Place Types and locations where enhancements and improvements are most needed or appropriate.
Mobility Goals & Recommendations
M Goal 1
Ensure pedestrian safety and walkability at major intersections.
Amarilloans expressed a strong desire to increase walkability in select areas as opposed to community-wide, including at intersections of major roadways where most commercial development is currently located.
Recommendations
1. Enhance pavement markings and improve general visibility of pedestrian infrastructure.
2. Prioritize mixed use centers and desired activity nodes.
3. Reinforce options to park once and access multiple destinations.
4. Implement traffic calming measures at select locations.
Intersection Improvements
This graphic shows how minor low-cost improvements can be gradually increased to support future development. Phase 1 depicts enhanced crosswalks at major intersections and the implementation of pedestrian refuge islands. Phase 2 shows pedestrian improvements in parking areas to provide access to existing development. Phase 3 illustrates how a final preferred development configuration with enhanced streetscapes and safety. New commercial spaces are placed close to streetfronts and major intersection corners and parking areas are tucked behind these buildings. In addition, safe sidewalks and walking paths are provided to improve connectivity within developments and from adjacent neighborhoods.
CURRENT
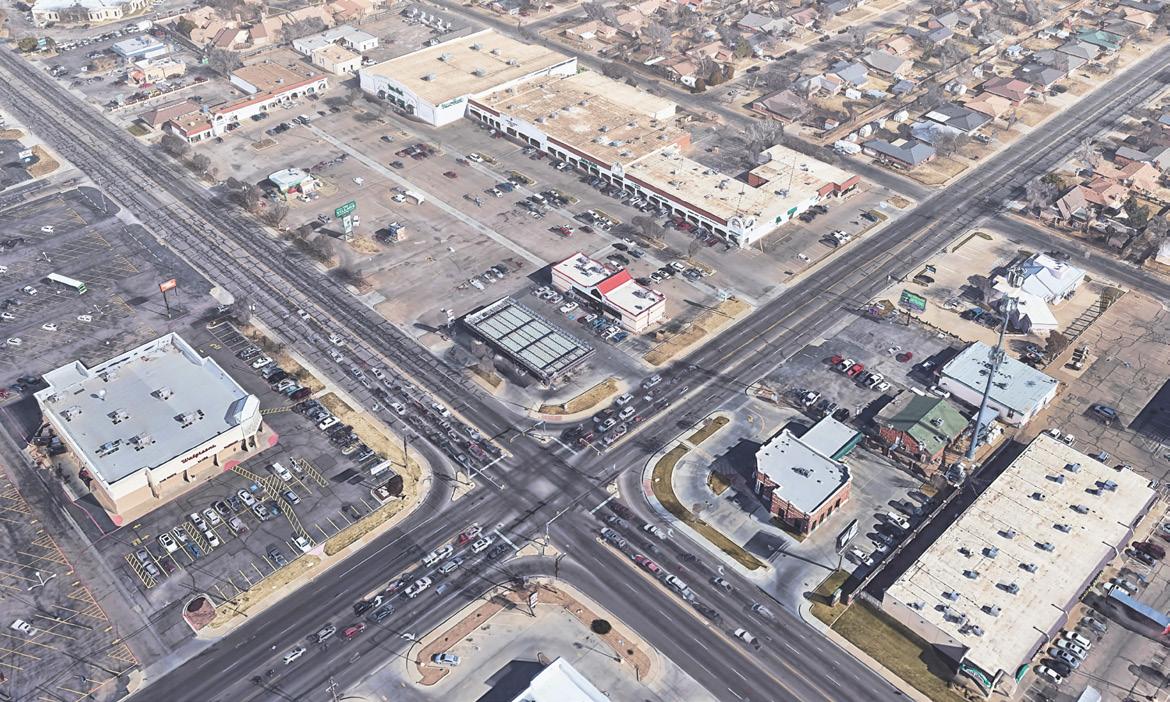
FUTURE: Phase 1 (crosswalks)
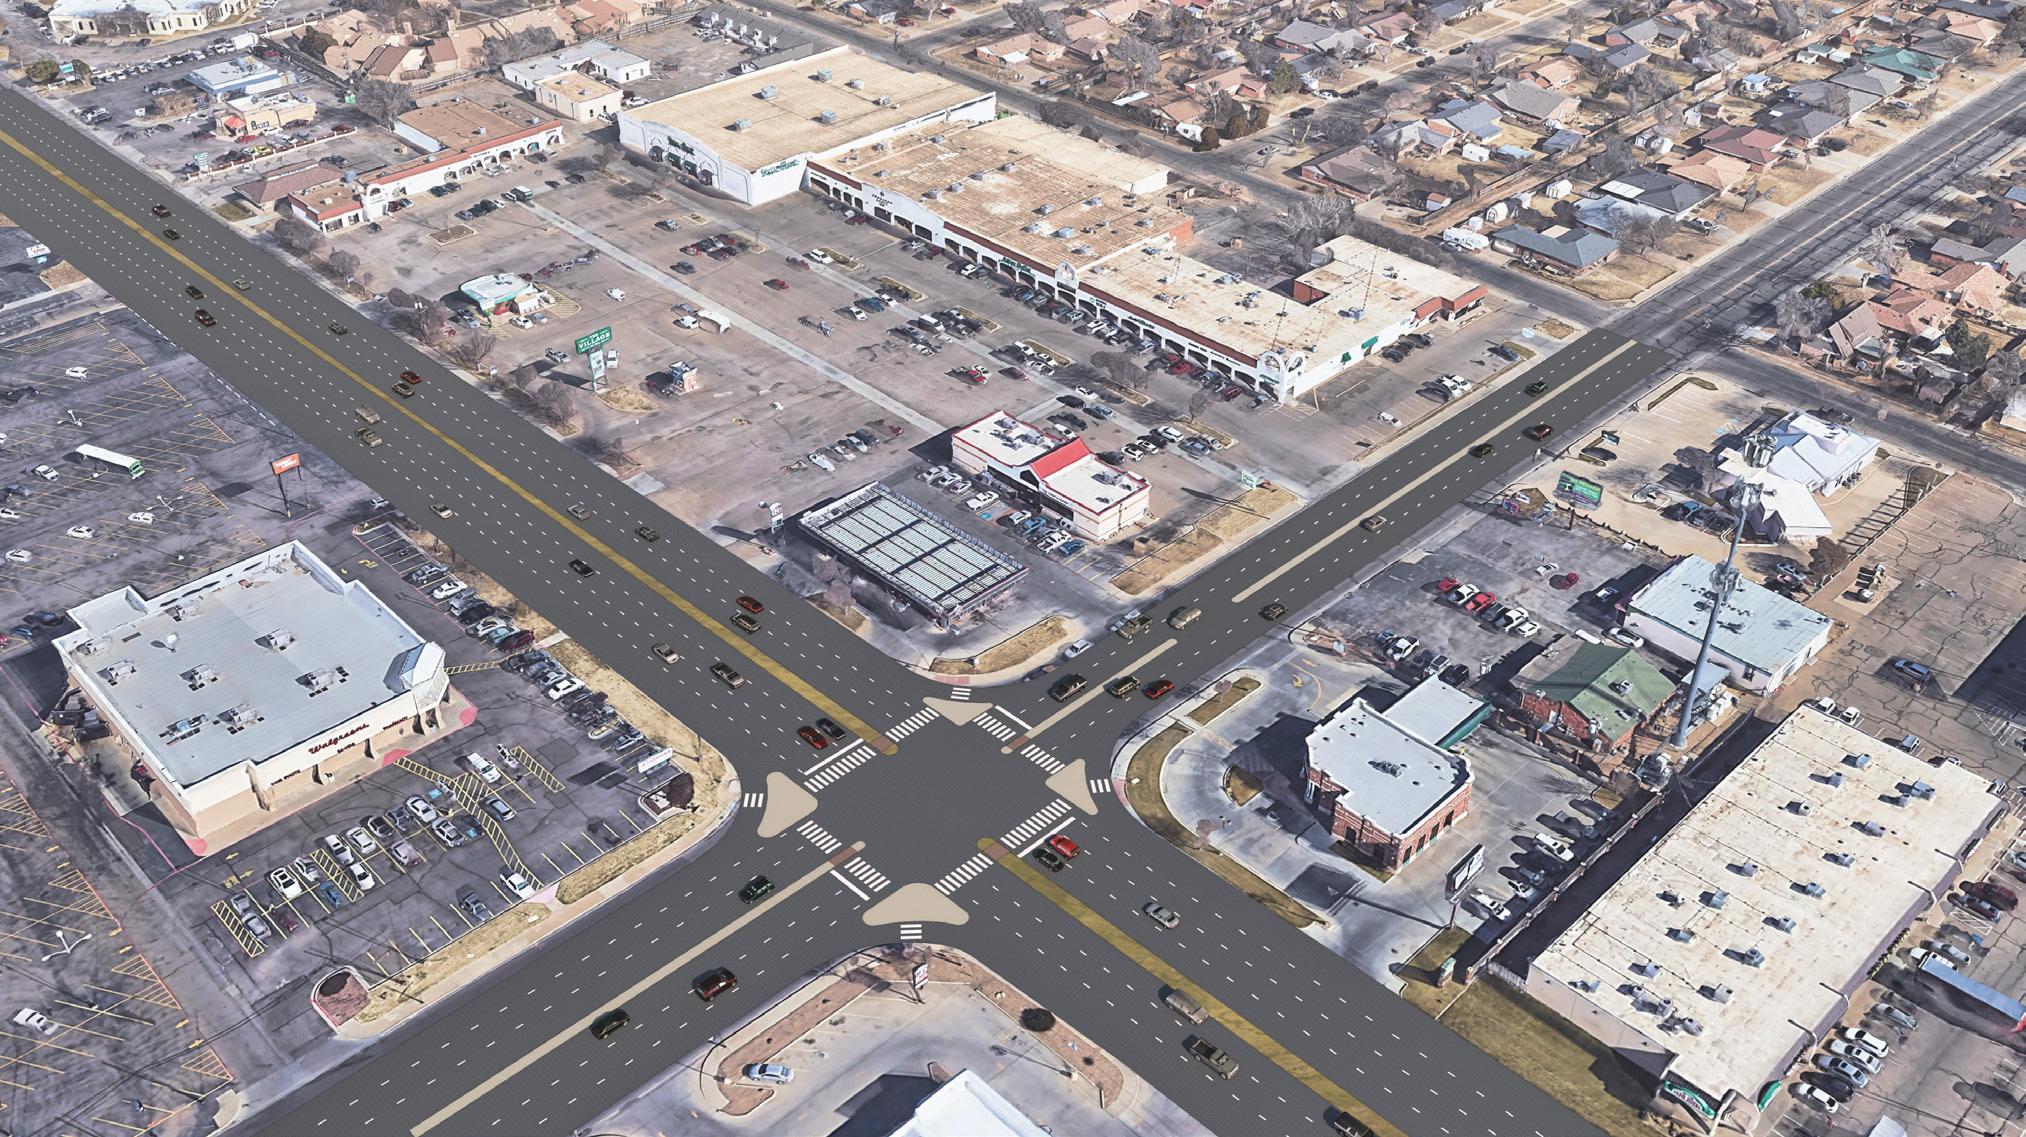
FUTURE: Phase 2 (pedestrian connections)
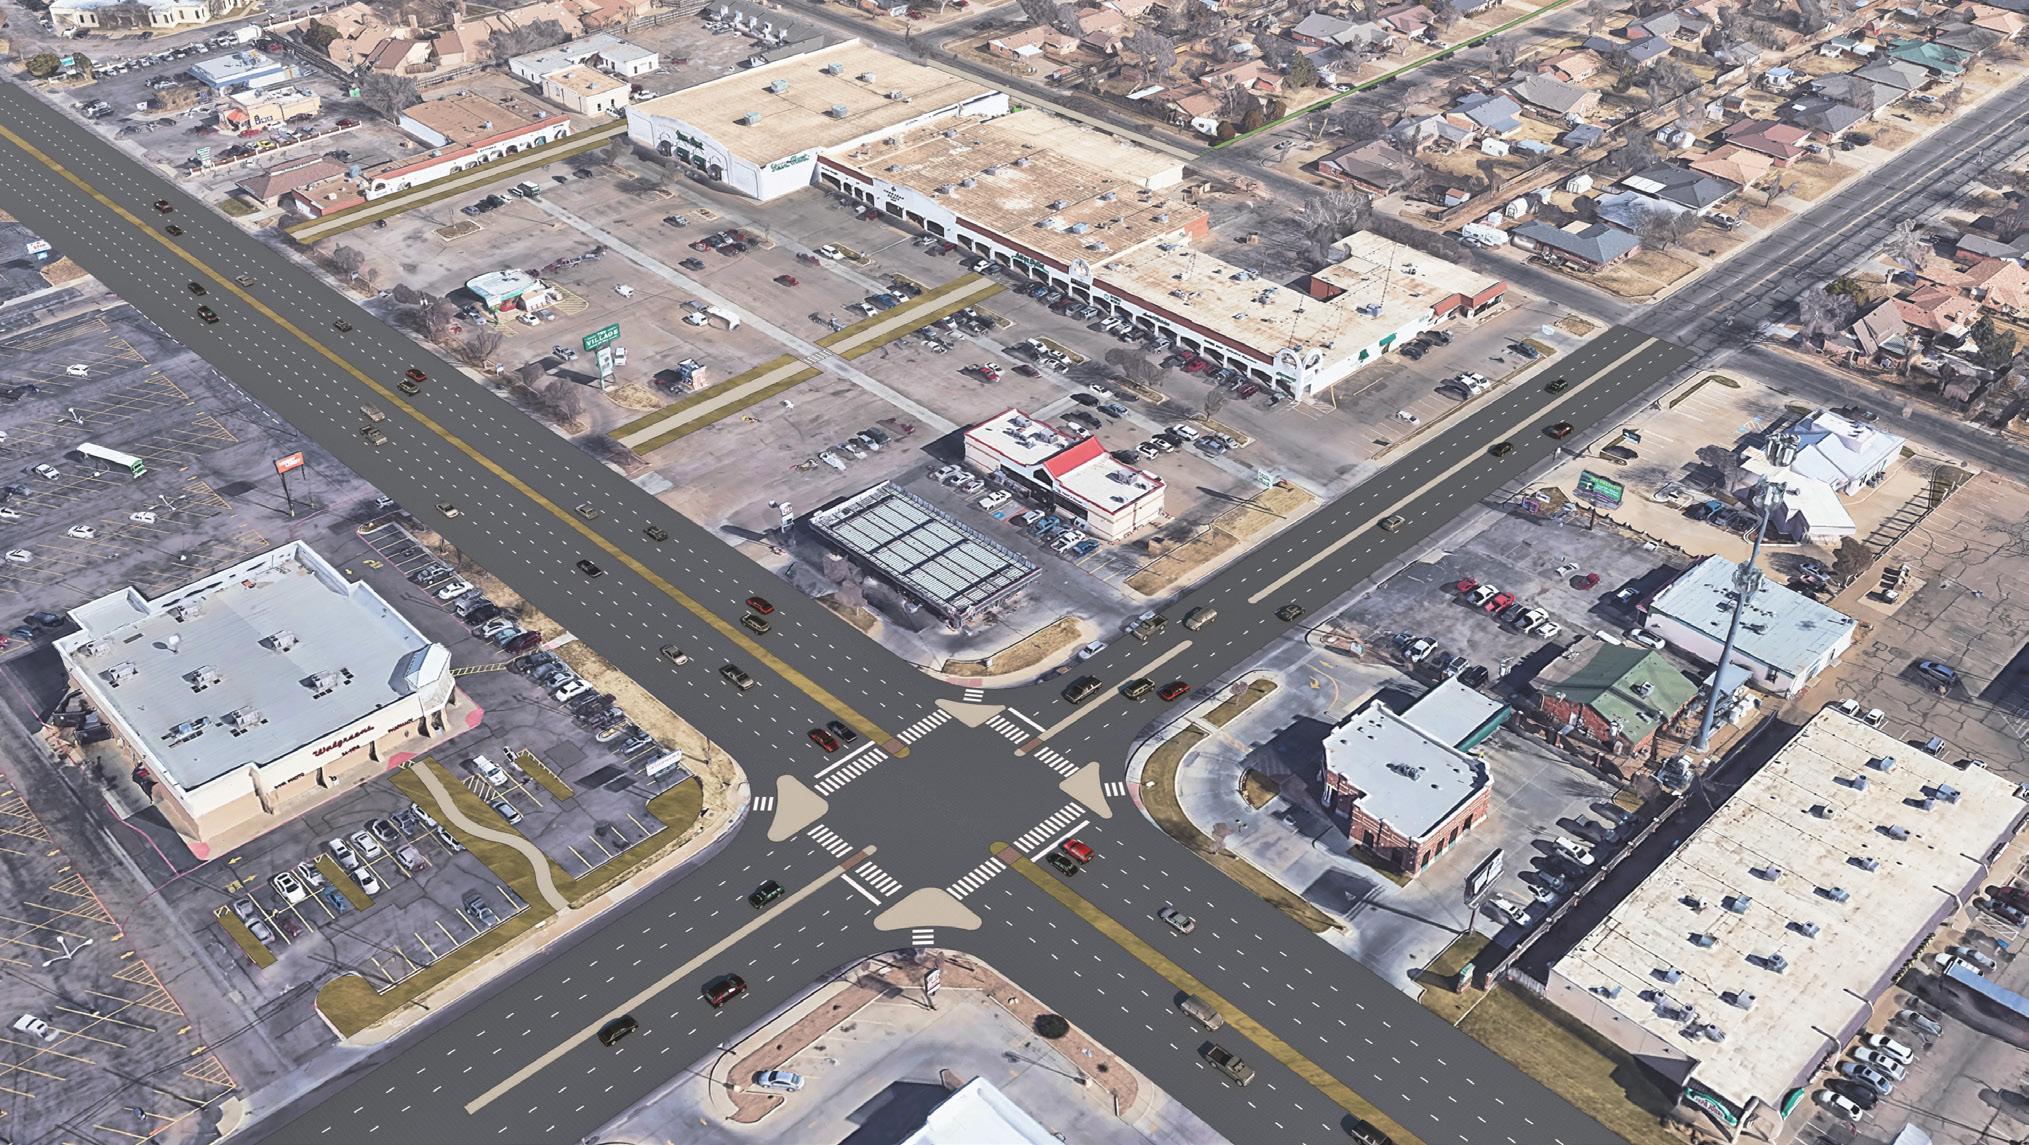
FUTURE: Phase 3 (new development)
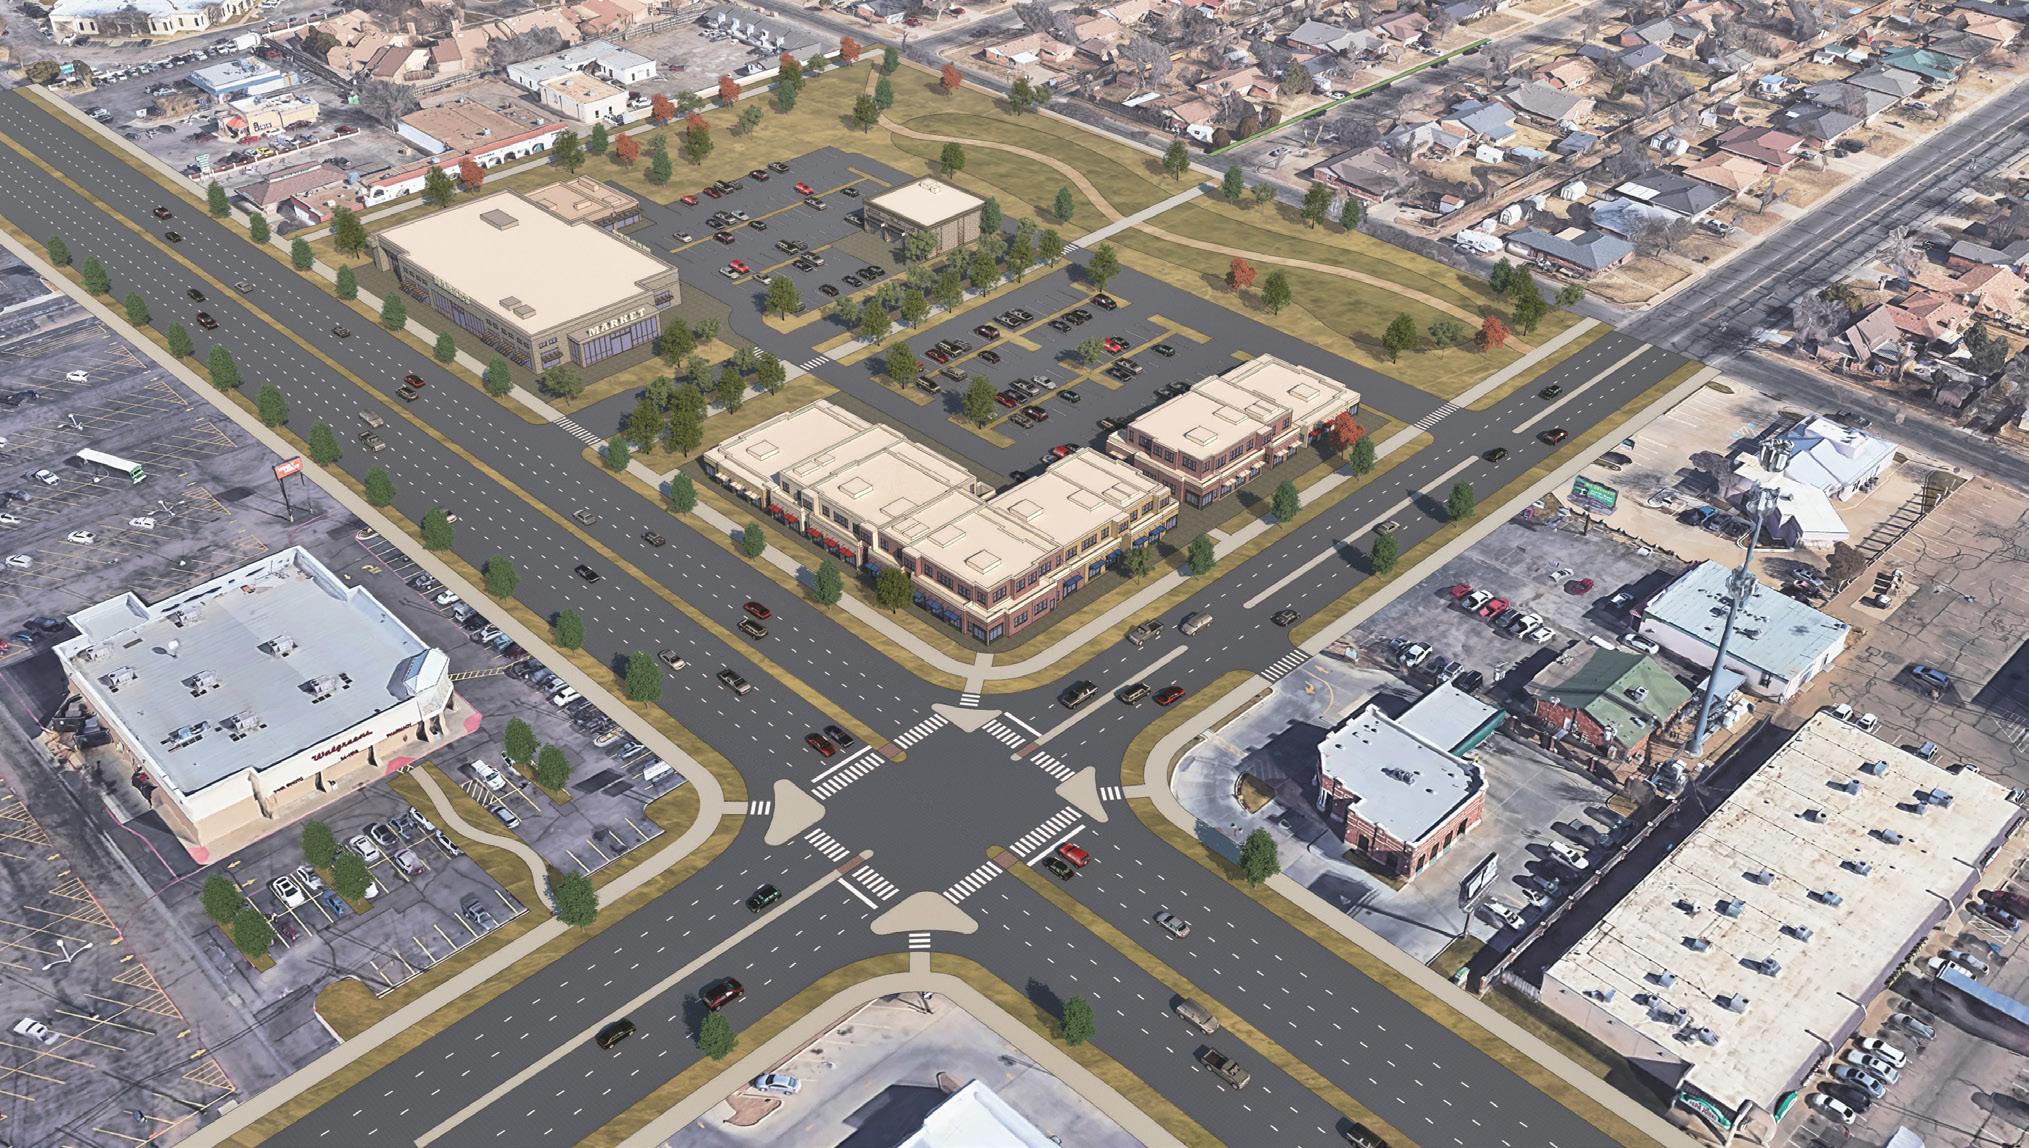
M Goal 2
Improve the quality of Amarillo’s pedestrian infrastructure.
Amarilloans voiced concerns about the conditions of aging sidewalks, crosswalks and trails, as well as a strong interest in improving existing pedestrian infrastructure.
Recommendations
1. Create an inventory of traffic signal pedestrian elements.
a. Pilot this in locations downtown (Taylor Street, Fillmore Street, Pierce Street, Buchanan Street)
2. Create a sidewalk maintenance/repair schedule, particularly along major roadways.
3. Develop a funding program similar to utility maintenance program.
a. Explore the potential for special districts and/or developer participation protocols.
4. Develop a prioritization plan and budget for increased illumination along sidewalks.
M Goal 3
Improve sidewalk connectivity to and within commercial and mixed use areas.
To help implement the Complete Neighborhoods Scenario, Amarilloans prioritized pedestrian connectivity to and within existing and future commercial and mixed use areas.
Recommendations
1. Prioritize improvements along arterials including:
a. 34th, 45th, and Hillside Avenues at major intersections.
b. North-south connections, especially across I-40 (e.g. Coulter, Bell, Western, and Georgia Streets).
c. Highway-style strip commercial (e.g. Business I-40 East, Dumas Highway).
d. Identify roadways with limited crossing opportunities (e.g. Hastings Avenue, Amarillo Boulevard, Soncy Road).
2. Develop or modify regulations to require improvements to existing sidewalks or the provision of new sidewalks as infill and redevelopment occurs in commercial and mixed use areas and in older neighborhoods where current exemptions apply.
3. Maintain a sidewalk gap inventory in the Neighborhood Plan areas and use resident input to prioritize routes within Neighborhood Low, Medium and High areas to connect with nearby commercial and mixed use Place Types.
4. Ensure geographic equity of improvements, especially for East and North Amarillo.
Neighborhood Connectivity
Enhanced connectivity between commercial areas and residential neighborhoods promotes walkable communities and the use of other multimodal transportation options. This provides residents with access to services and other businesses without needing to use a car as their main mode of transportation.
As illustrated in the neighborhood connectivity graphic, elements that could be implemented to enhance connectivity include:
• Enhanced visible crosswalks
• Improved sidewalks and pedestrian walkways
• Pedestrian activated signals
• Increased lighting
Additionally, the graphic shows how an underutilized alley could be transformed into an activated walkway with opportunities for public art, increased tree canopy, and retrofitted commercial spaces.
FUTURE
CURRENT
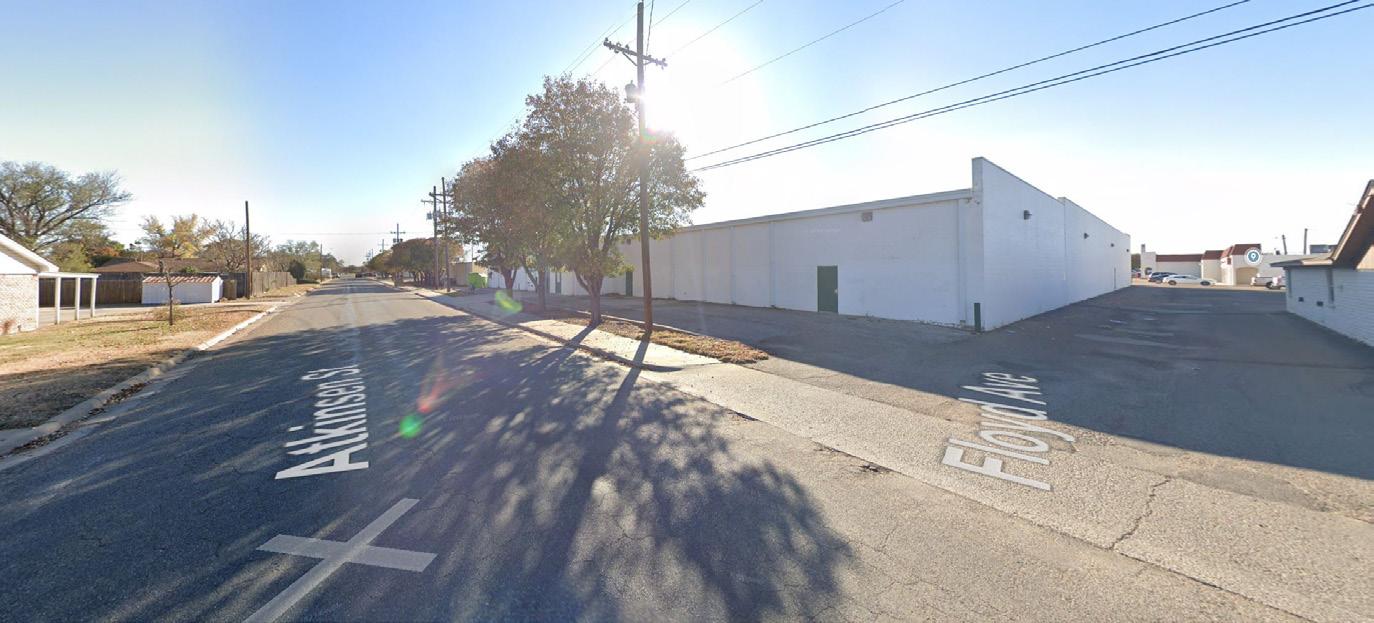
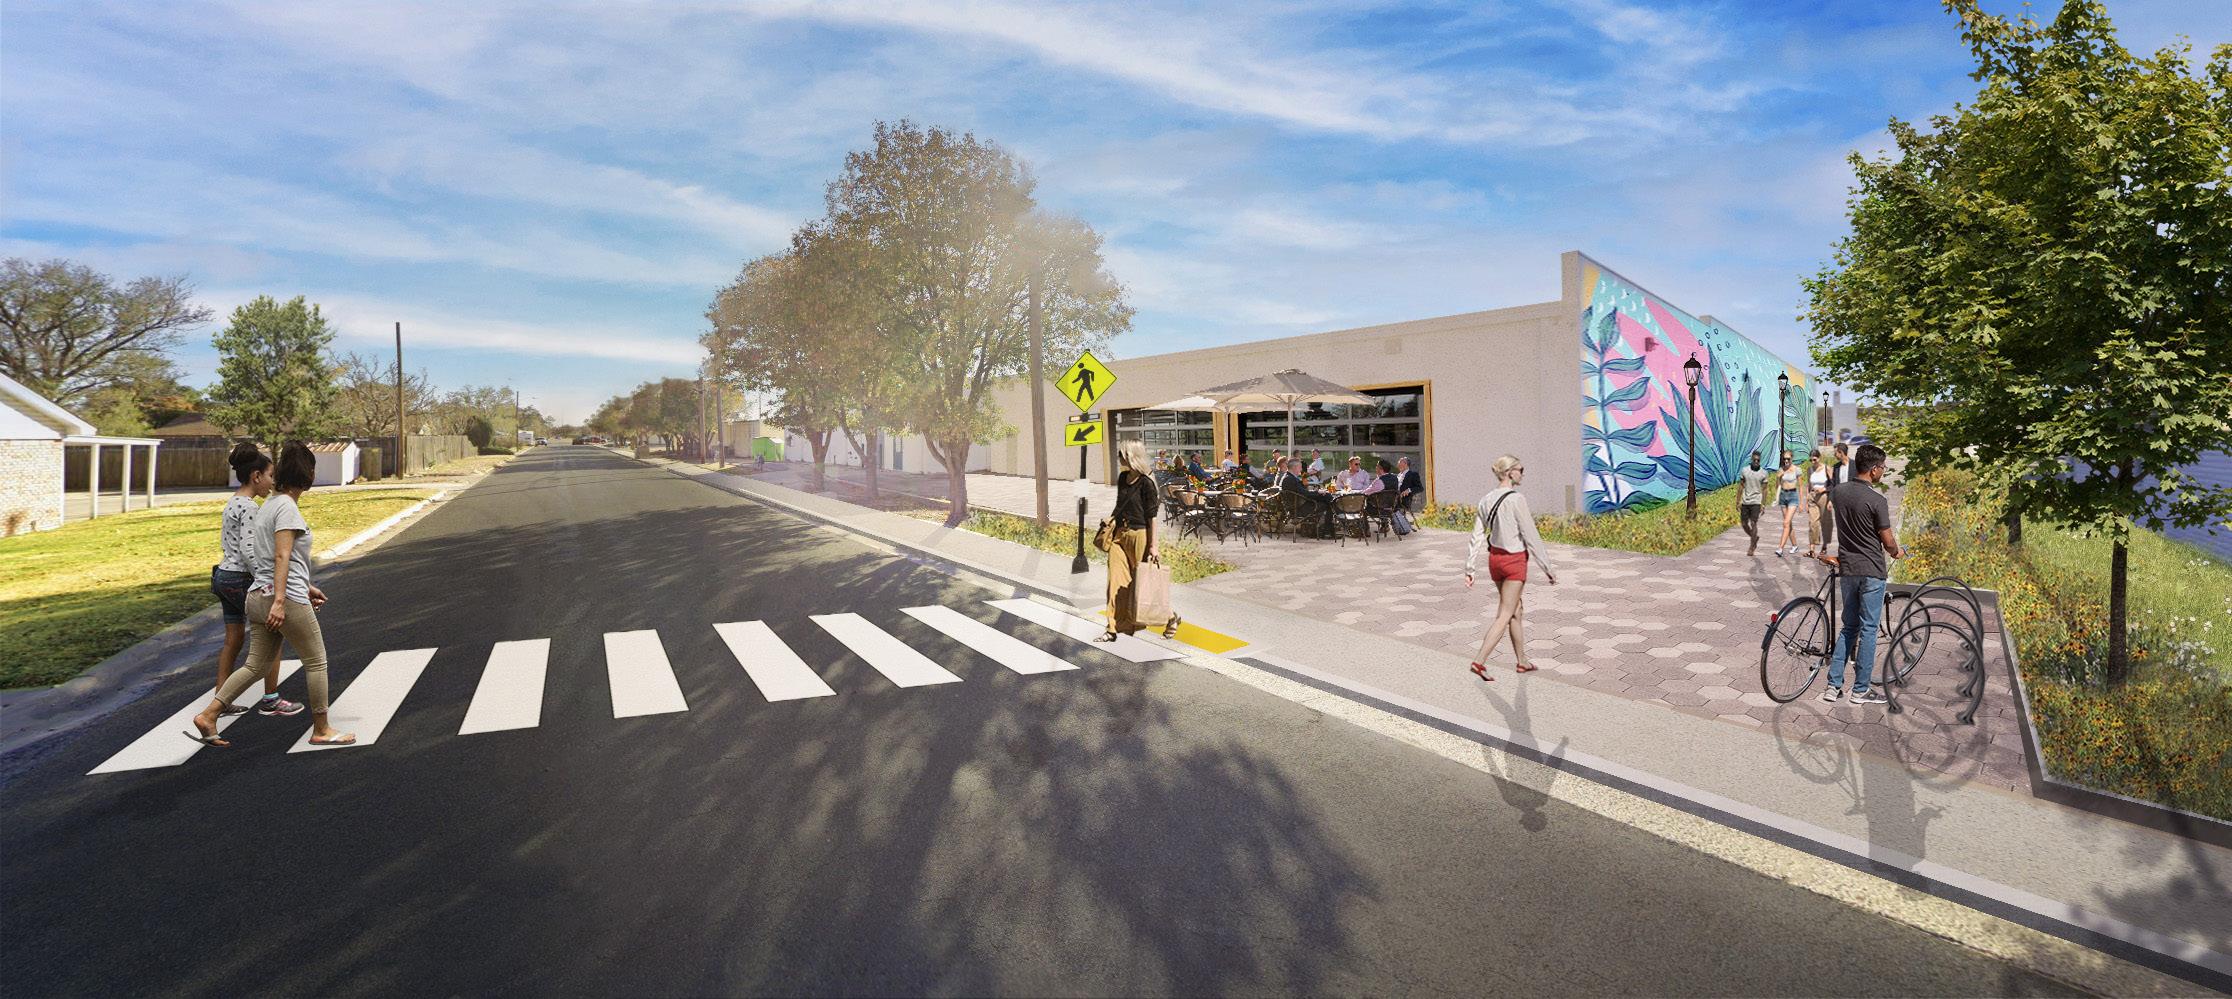
M Goal 4
Improve sidewalk connectivity to parks and schools.
Another destination prioritized by Amarilloans for enhancements to safety, comfort and overall walkability include schools and parks.
Recommendations
1. Develop a gap analysis to inform Capital Improvement Program (CIP) projects including:
a. Pilot park connectivity improvements to John Stiff Park and Thompson Park.
b. Pilot school connectivity improvements to Amarillo High School (Bell/Fulton Streets) and West Plains High School (Helium/Arden Roads).
c. Develop an ongoing program to fund connectivity improvements to parks and schools in Neighborhood Plan boundaries.
M Goal 5
Implement policies designed to achieve mobility goals.
As part of the overall mobility element of the Plan, Amarilloans supported advancing policies related to Vision Zero, Complete Streets, data-driven decision making, and intermodal connectivity.
Recommendations
1. Develop street and development standards that emphasize pedestrian safety and mobility including:
a. Adopt a Vision Zero/Safe Streets and Roads for All framework as a City policy.
b. Ensure context-sensitive design is responsive to adjacent land use.
c. Modify street standards to include additional pedestrian curb cuts.
d. Include analysis of traffic calming measures in street work.
e. Develop aesthetic and maintenance standards for prominent crosswalks.
f. Provide development bonuses for increased tree cover and shade (particularly for pedestrians).
g. Coordinate with landscaping and driveway/ parking requirements.
2. Implement coordination protocols with TxDOT and the County to:
a. Ensure incorporation of Complete Streets principles across jurisdictions.
b. Continue safety improvements in Downtown.
c. Create updated design standards for major TxDOT corridors.
3. Select metrics and collect data to both select locations for and gauge the impact of mobility improvements including:
a. Use air pollution and traffic noise data in prioritization.
b. Collect before and after data on traffic volumes/speeds as well as ped/bike activity.
c. Monitor TxDOT Crash Records Information System data on corridors where improvements are made.
4. Communicate pedestrian improvement priorities to ACT for their plans.
M Goal 6
Prioritize and develop improvements for specific roadways identified by the City Plan Stakeholder Committee and the public.
Through the planning process, residents prioritized several key locations for roadway and intersection improvements.
Recommendations
1. 10th Avenue – some improvements already planned, including between Garfield & Ross Streets
2. 15th Avenue – Bivins to Washington
3. Sunset Center – redevelopment is happening
4. Bell Street – I-40 to 34th Avenue
5. Amarillo High School – Bell and Fulton Streets
6. Coulter Street – leading away from 34th into neighborhoods
7. Coulter Street – evaluate/plan for connection between 9th and Tascosa Road
8. 34th Avenue – particularly near commercial areas at Coulter, Bell, and Western Streets
9. 45th Avenue – Western Street to Bell Street
10. Soncy Road – more signals and medians once Loop 335 moves to Helium Road
11. West Plains High School area – TxDOT studying Helium/Arden Road intersection
12. Pedestrian conditions around Amarillo College
13. Connections to Downtown from nearby areas such as Thompson Park
14. Connection between the Rock Island Rail Trail and the Botanic Gardens/Medi Park
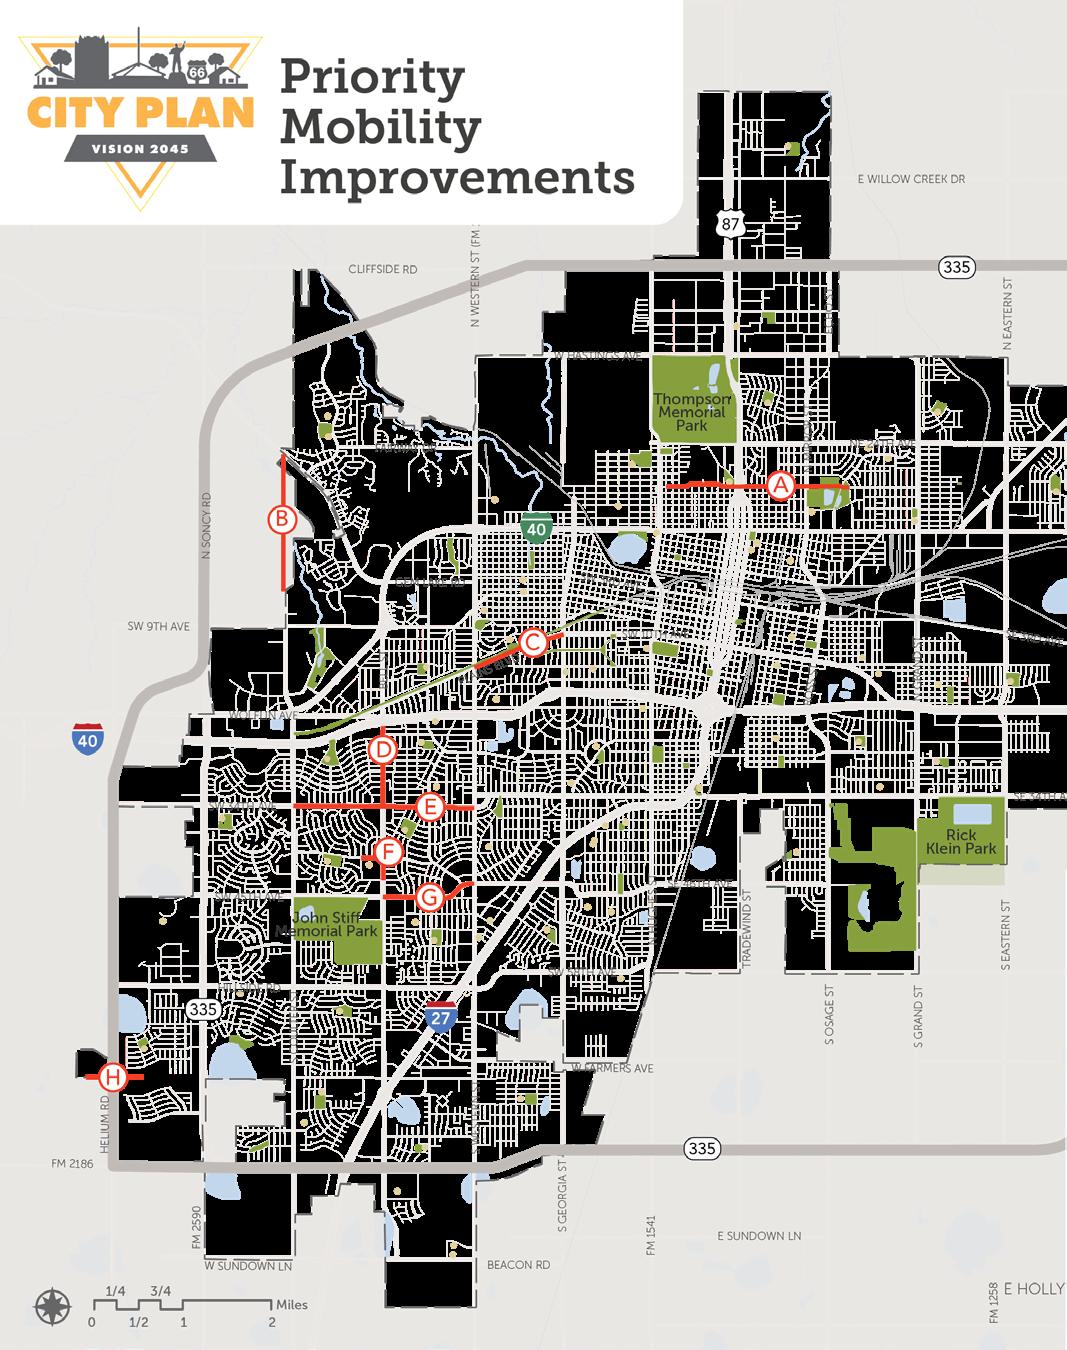
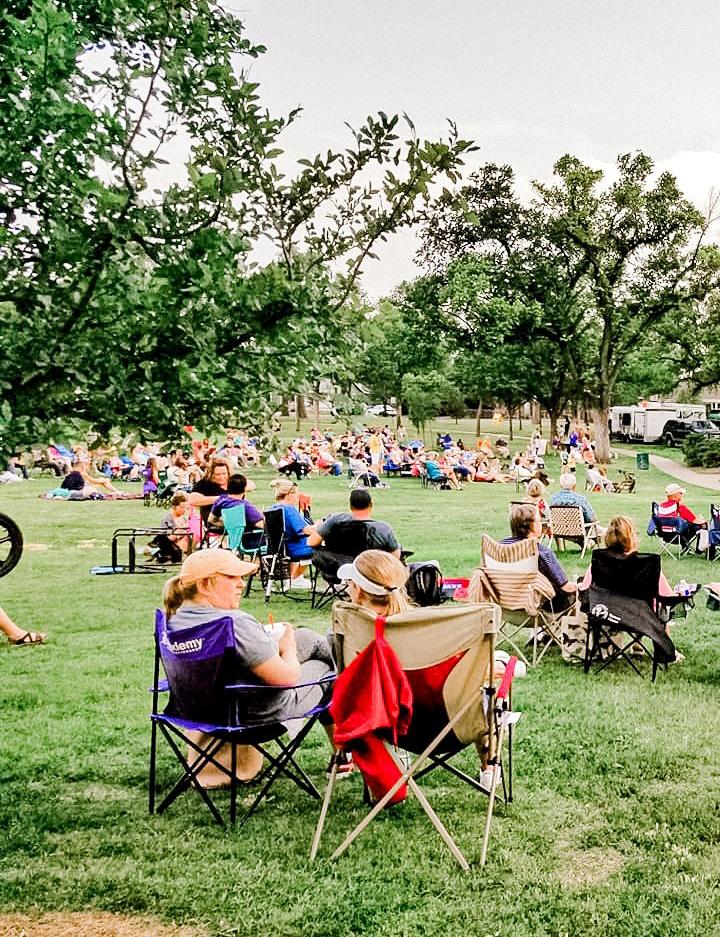
Parks & Cultural Resources
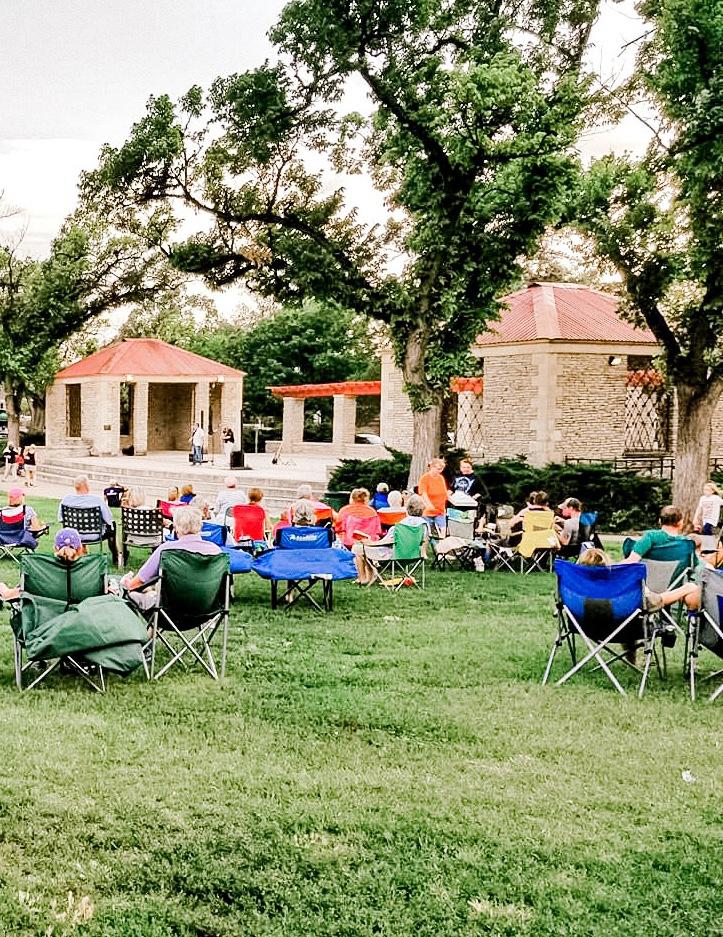
Current Conditions
Objectives for Future Parks & Cultural Resources
Parks & Cultural Resources Goals & Recommendations
Current Conditions
Amarillo has six large regional parks and 46 smaller neighborhood parks, which together comprise approximately 2,400 acres of land. Amarillo residents highly value existing park assets, however residents do not currently have equal access to them. The 2021 Parks and Recreation Master Plan (PRMP) identifies areas where local access to parks and recreational amenities is lacking, as illustrated in the map below. Filling these gaps, improving and enhancing existing resources, and increasing the diversity of activities, offerings, and cultural, historical, and arts-related components are top priorities of the PRMP and other recent plans.
Beyond offering amenities and gathering spaces to local residents, the City also recognizes the beneficial role that parks and cultural resource investment can play in supporting growth and economic vitality.
However, similar to mobility and infrastructure, parks are also underfunded in Amarillo. To achieve the community’s desires and goals for parks, open spaces, green infrastructure, and cultural celebration, residents and City leaders will need to explore and support expanded and innovative funding sources.
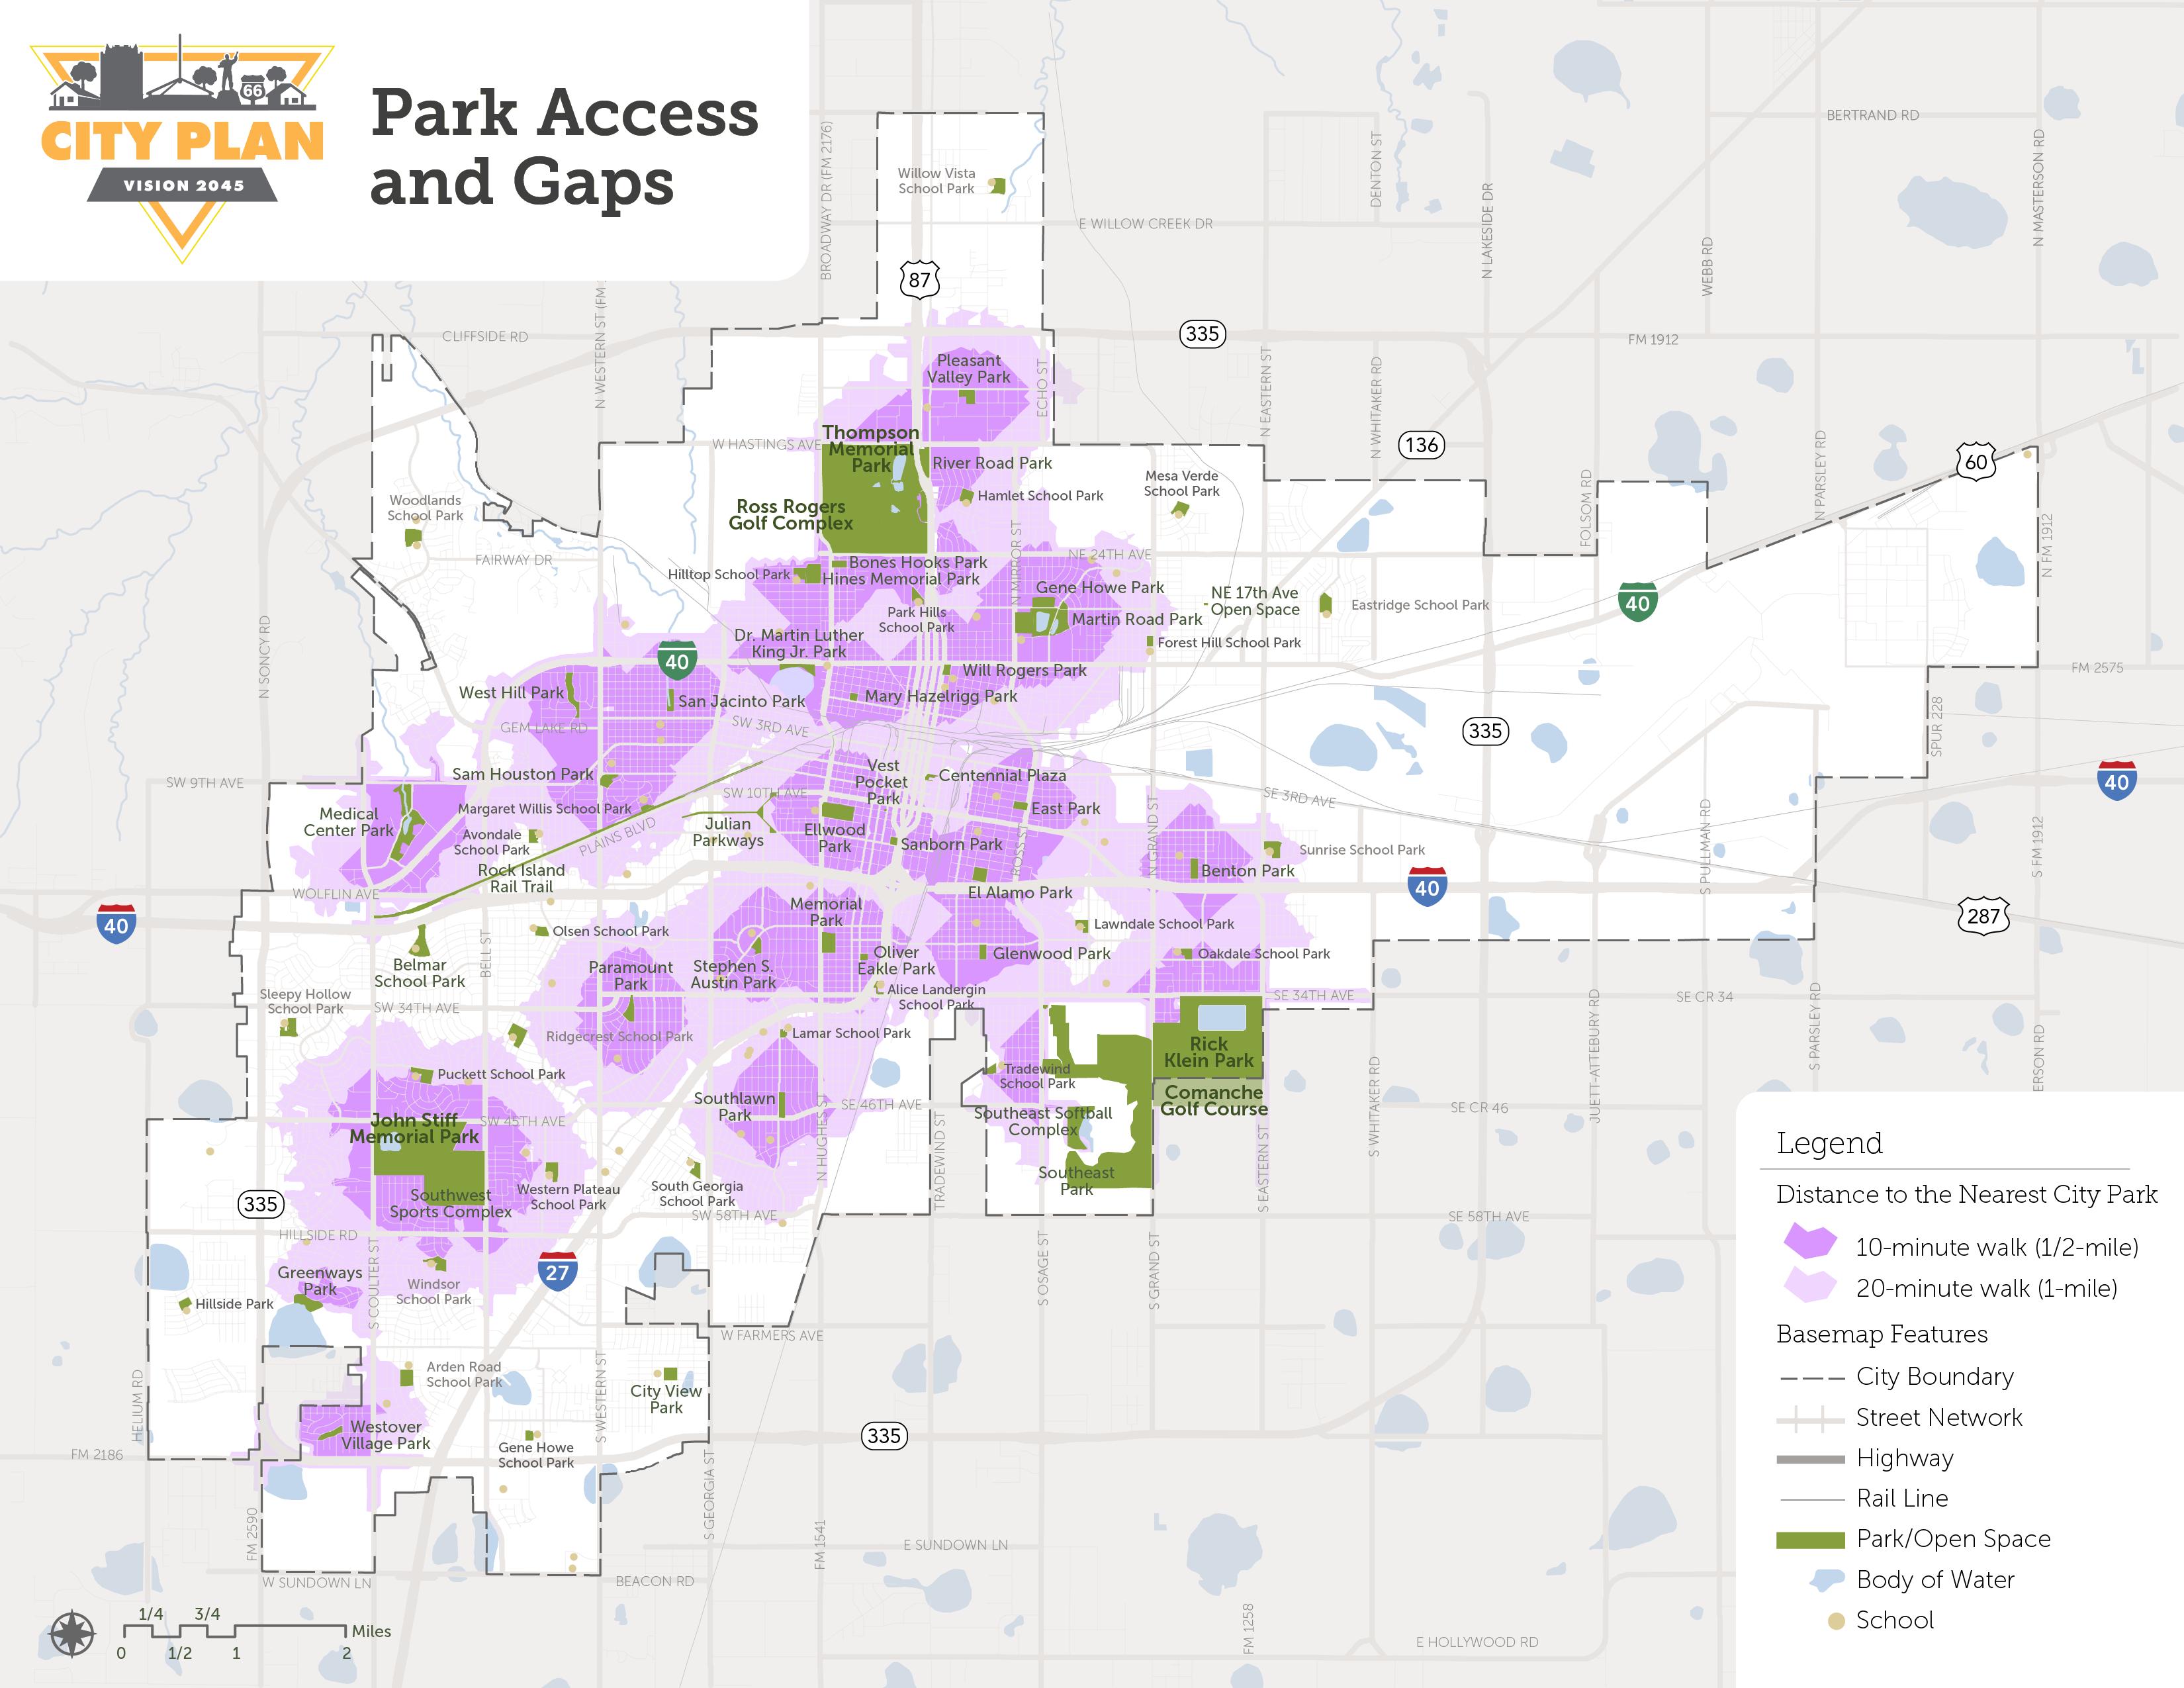
Objectives for Future Parks & Cultural Resources
Opportunities for recreation, entertainment, social gathering, and cultural and artistic representation and celebration contribute to well-rounded, happy communities. These amenities and opportunities help residents feel that they belong, improve social fabric and resiliency, and support health and well-being. In turn, investment in these areas supports economic vitality, growth, and attraction for visitors, businesses, and future residents.
Amarillo has many valuable recreational and cultural assets; however disparities exist in their distribution, quality, access, and cultural inclusivity. Intentional and strategic investments, partnerships, and creative funding programs can support maintenance, enhancement, and the creation of new parks, gathering spaces, public art installations, events, community facilities, and placemaking. This will improve equity, quality of life, and economic advancement in Amarillo.
The Parks & Cultural Resources (P&C) goals and recommendations in this chapter focus on these needs, challenges, and objectives related to Parks and Cultural Resources. They expand upon the Complete Neighborhoods Scenario to provide more nuanced guidance for maintaining and enhancing existing amenities, ensuring that new development incorporates and contributes to community amenities, and elevating Amarillo’s diversity of culture, heritage, and history through meaningful, community-led approaches.
Parks & Cultural Resources Goals & Recommendations
P&C Goal 1
Implement the 2021 Parks and Recreation Master Plan, guided by the following priorities.
Recommendations
1. Strategically Maintain and Manage Assets;
2. Create Context-Sensitive Parks;
3. Ensure Equitable Park Access;
4. Foster Trail Experiences;
5. Promote Health and Fitness;
6. Support Social Gatherings, Events and Programs;
7. Ensure Fiscal and Economic Resilience; and
8. Enrich Amarillo through Quality Services.
P&C Goal 2
Update park land dedication requirements for residential and non-residential development.
Throughout the planning process, Amarilloans expressed an interest in adjusting park land dedication requirements to include more recreation opportunities.
Recommendations
1. Developers shall provide a minimum of 2.2 acres of developed park land per 1,000 residents for neighborhood and community parks or pay fees in-lieu.
2. Explore opportunities to require common open spaces for mixed use and higher-density residential development in targeted locations.
3. Explore a park land dedication and/or a fee in-lieu requirement for non-residential development.
4. Explore acceptance of plazas, enhanced streetscapes, trails, and other hike and bike facilities to fulfill park dedication requirements for residential and non-industrial development.
5. Improve park management to ensure the longevity of trees, vegetation, and other park amenities.
Open Space Dedication
Alternatives to large neighborhood parks exist in the shape of town squares, plazas, pedestrian-friendly main streets, and trails. If designed correctly, these spaces can offer many of the same benefits as large parks without the same land-use intensity and high maintenance costs.
FUTURE: Plazas
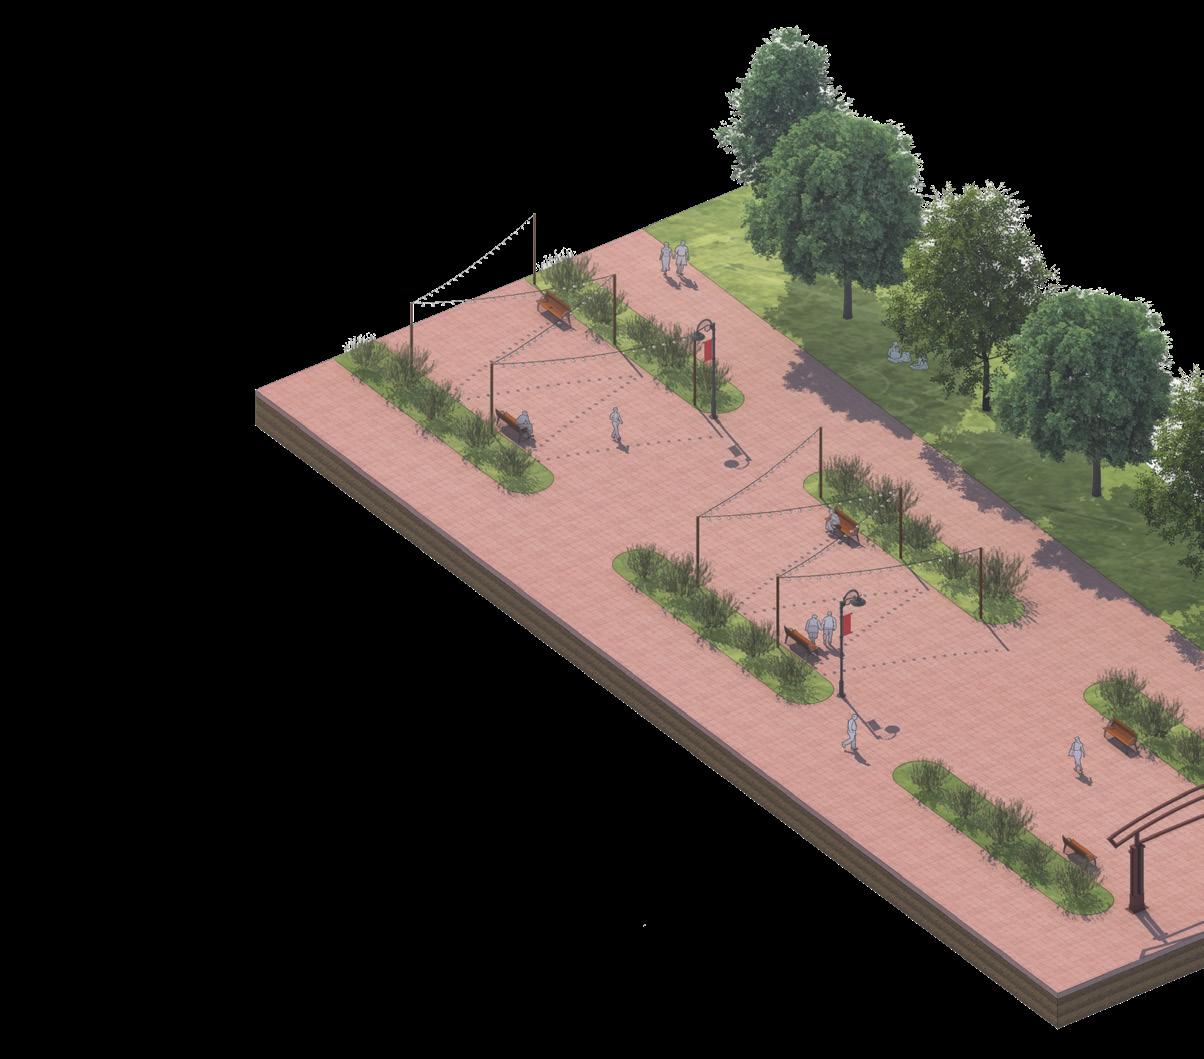
FUTURE: Trails
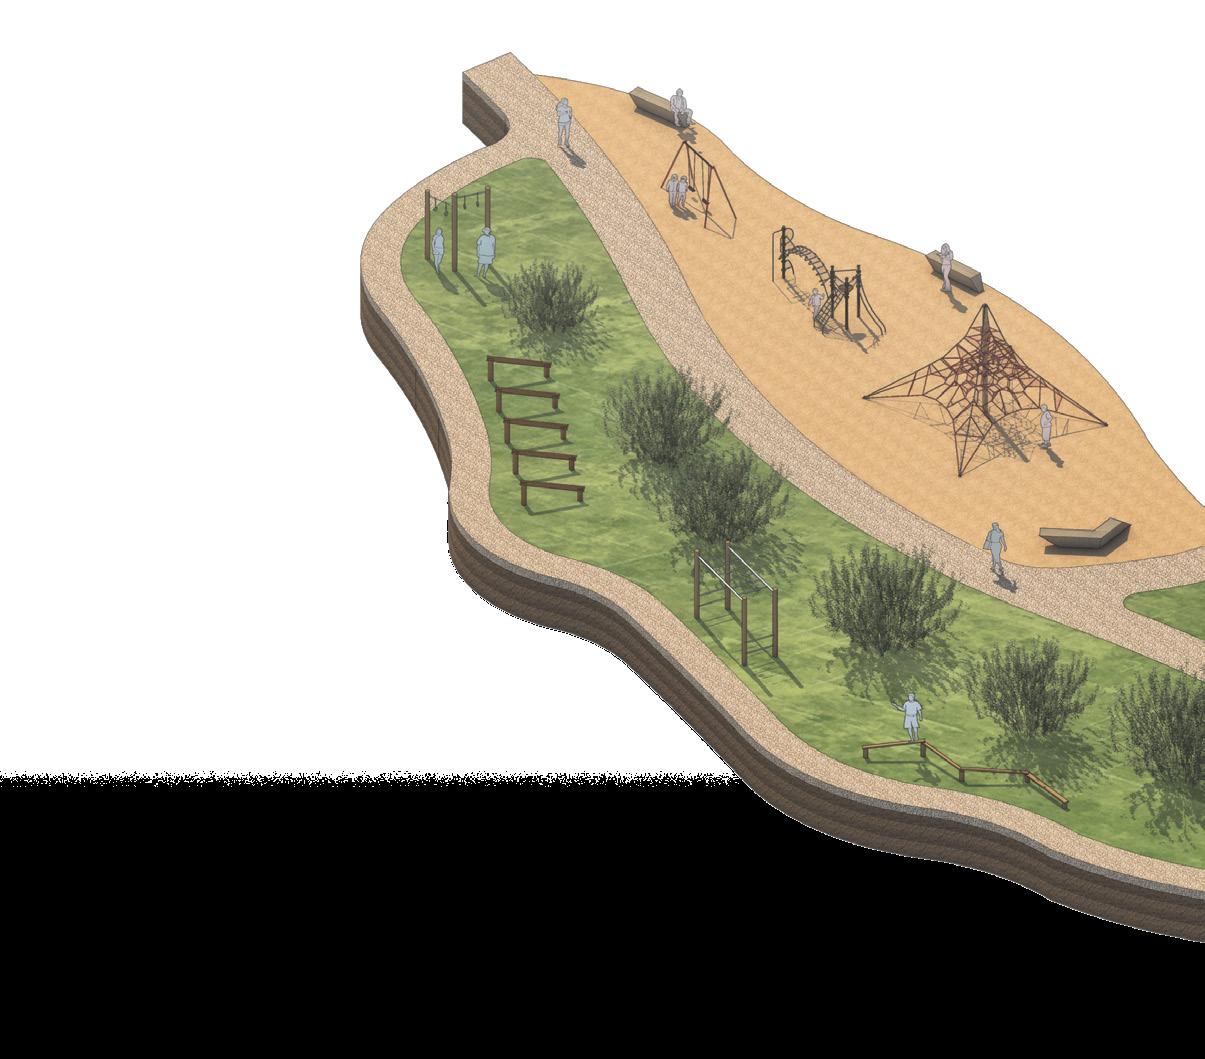
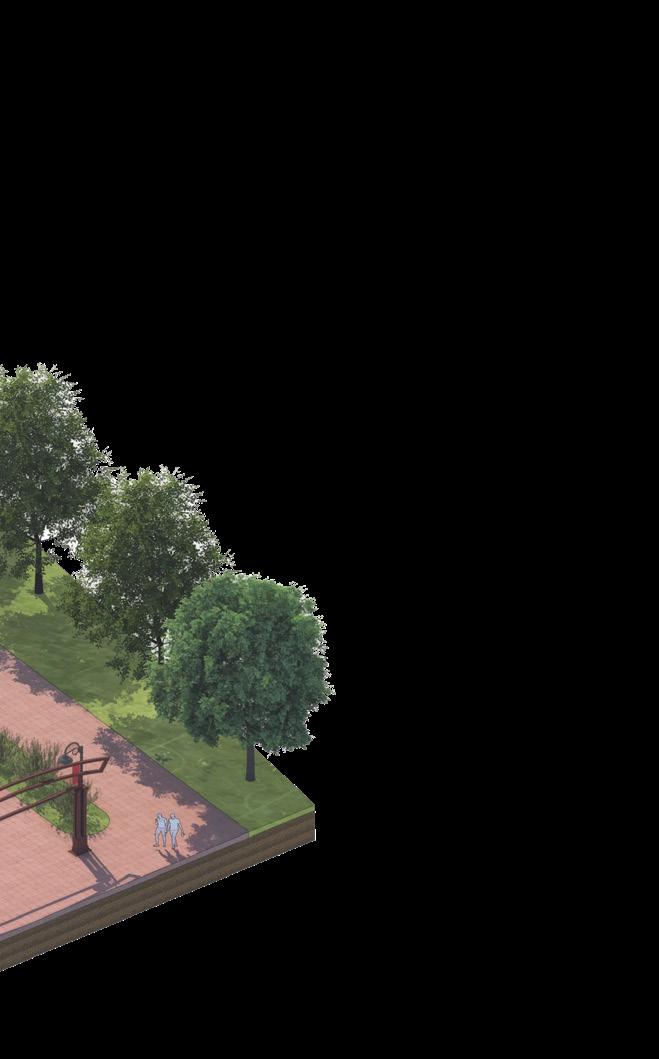
The following graphics help envision how plazas and trails could fulfill the requirement for parkland dedication. Elements within the plaza space include:
• Lighting
• Seating
• Areas for native vegetation
• Gateways or public art
FUTURE: Community Parks
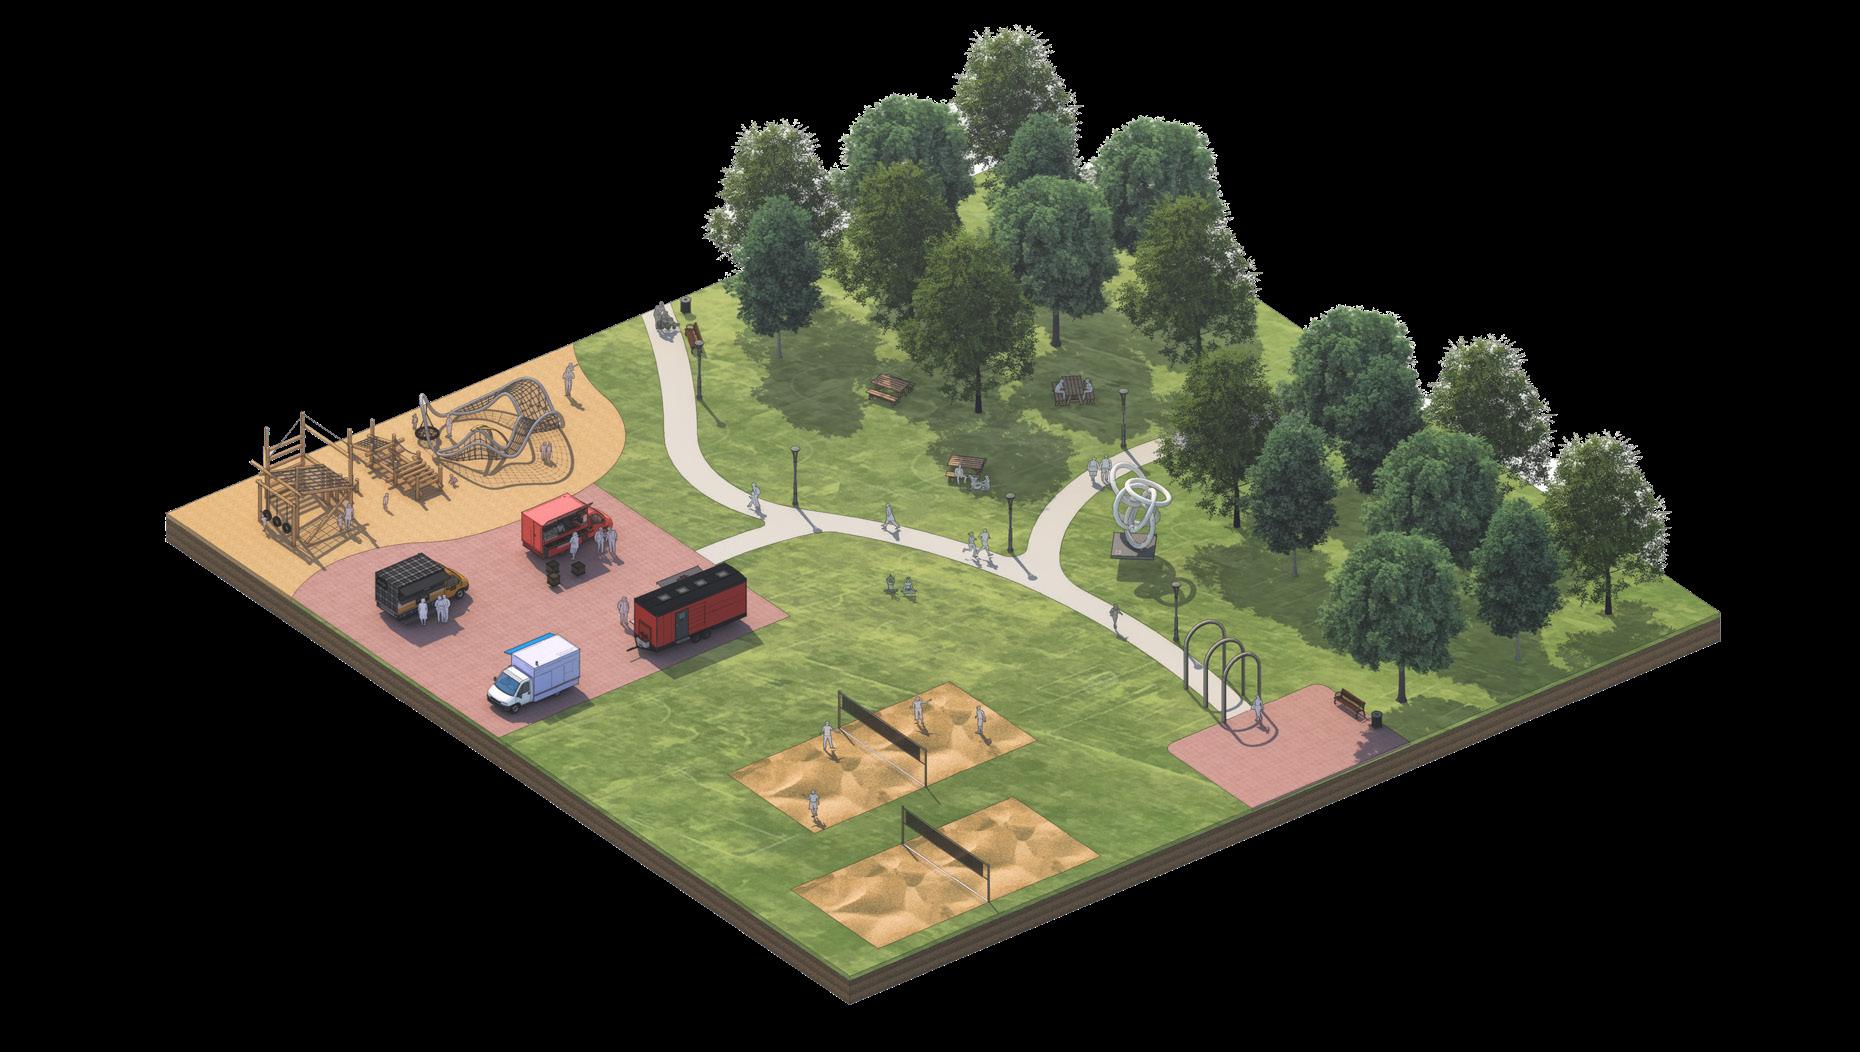
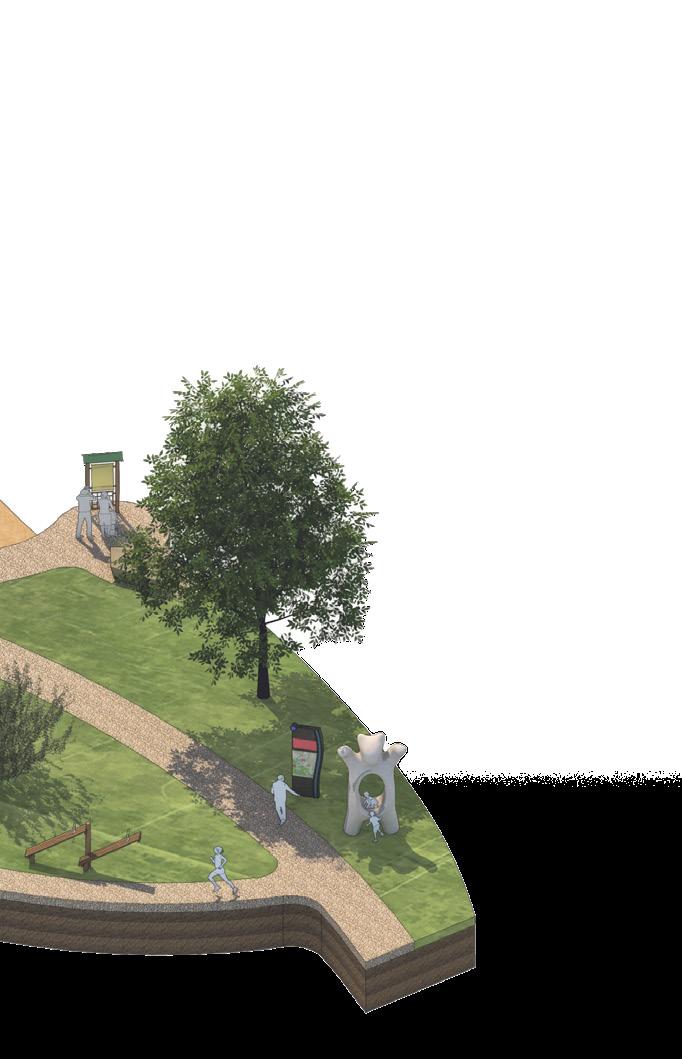
The trail graphic highlights examples of acceptable components such as:
• Exercise equipment area
• Children’s play area
• Public art
• Areas for native vegetation
P&C Goal 3
Increase the number of people in close proximity to Regional Parks and Community Parks.
Amarilloans have communicated the importance of improved access to a robust parks network across all of Amarillo.
Recommendations
1. Promote community and neighborhood mixed use development within, adjacent to, and near Regional Parks through zoning, public-private partnerships, and incentives.
2. Support infill development and the addition of Accessory Dwelling Units (ADUs) in residential areas within close proximity to Regional Parks.
3. Discourage development of additional Neighborhood Parks within ½-mile of Regional Parks and Community Parks in favor of fees in-lieu for improvements to existing parks.
4. Improve connections to Regional Parks for all modes of travel, including pedestrians, cyclists, public transit, and automobiles.
P&C Goal 4
Increase culturally diverse programming, events, and public art throughout Amarillo, especially in Downtown and mixed use place types across the community.
Building on recent planning efforts, Amarilloans expressed a strong desire for more culturally diverse and appropriate programming, events and public art throughout the community.
Recommendations
1. Promote activation of Downtown and mixed use place types throughout Amarillo through increased programming and events.
2. Partner with neighborhood, cultural, and nonprofit groups to co-create culturally diverse programming.
3. Expand the existing public art program to include public art that reflects the cultural diversity of the surrounding neighborhoods.
4. Promote collaboration and engagement across boards and commissions responsible for implementation and management of parks and cultural resources.
P&C Goal 5
Better celebrate and leverage the Route 66 Historic Corridor as a community asset and historic landmark.
Amarilloans take pride in the Route 66 Historic Corridor and expressed a desire for public and private investment to promote and preserve this important community asset.
Recommendations
1. Create a program to help restore and replace iconic signage (including large sculptural signage and neon signage) along Route 66.
2. Increase interpretive signage and other storytelling elements along Route 66.
3. Organize and promote one or more regular community events celebrating the history of Route 66.
4. Develop programs for small business retention and expansion along Route 66.
5. Provide matching grants and other incentives to encourage historically appropriate restoration and rehabilitation of commercial facades along Route 66.
P&C Goal 6
Leverage historic buildings and existing and future community facilities to celebrate Amarillo and its diverse history and cultural heritage.
Amarilloans expressed support for ideas that celebrate historic buildings and use existing (and any potential future) community facilities to tell the story of past and current residents.
Recommendations
1. Implement standards that identify and celebrate historic buildings as cultural assets.
2. Incorporate public art and interpretive elements into the interior and exterior of community facilities to help celebrate and communicate the stories of Amarilloans.
3. Host a diversity of cultural events and programs in community facilities.
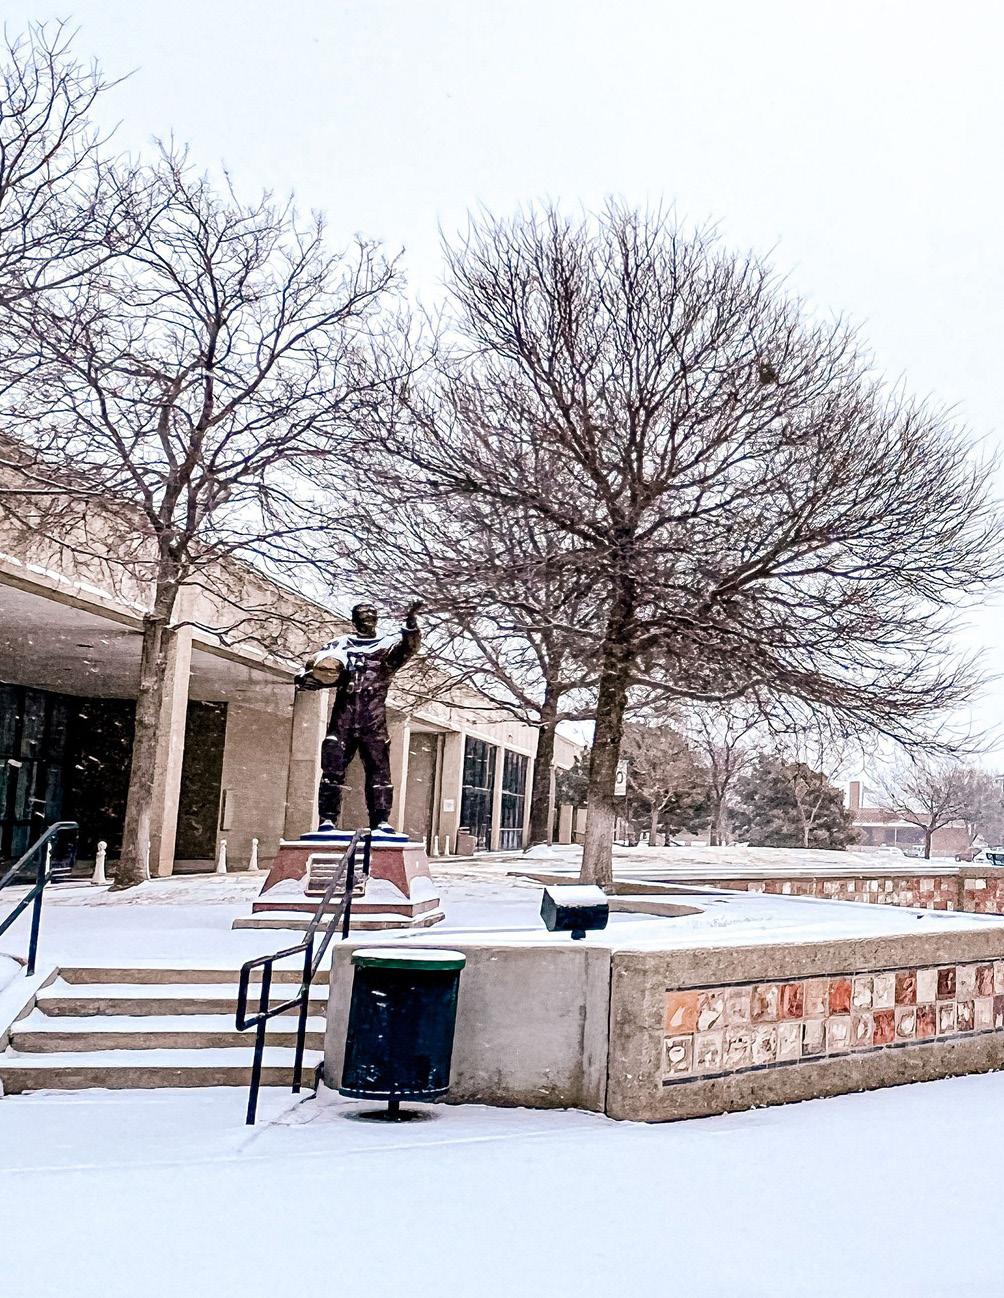
Introduction
Implementation Priorities
Planning Approach
City Plan Amendments & Updates
Implementation Strategy

Alternatives to Parkland Dedication Requirements
Connection to Zoning Code & Development Standards
Intergovernmental Coordination


Introduction
This section clarifies and establishes parameters and priorities for the implementation of City Plan. The Implementation Strategy section includes recommendations for an approach to coordinating and aligning planning in Amarillo; a suggested approach for identifying and prioritizing public projects; guidance for updating the Plan; and a roadmap for tracking progress moving forward.
Implementation Priorities
City Plan identifies five priorities on which to focus implementation efforts for the first five years: zoning code updates to align with the Complete Neighborhoods Scenario, incentives and tools for the redevelopment of older neighborhoods, infrastructure assessment and prioritization, neighborhood planning, and improving safety and connectivity for pedestrians. A list of action items is included below to track progress. At the five-year update of City Plan, it is expected that these items at a minimum will be completed, and a new list of priorities can be developed from the goals and recommendations to guide the next five years.
Short-Term Priority 1 & Action ItemsApplicable Goals
Update Zoning Code & Development Policy Manual to align with City Plan Complete Neighborhoods Scenario.
Applicable Guiding Principles
N&D1; N&D2; N&D3; CC1; CC2; CC3; M3; M5; P&C2; P&C3 1, 2, 4
1. As an administrative update to the City’s Zoning Code, adopt formatting from the 2022 draft revision without changes to development standards; this will establish a clean and clear baseline from which to address future substantive amendments.
2. As part of an annual Future Land Use Map review process, conduct a review with landowners and developers on their plans related to housing and major infrastructure needs.
3. Work with the community to implement Zoning Code revisions to enable more flexibility in constructing and leasing Accessory Dwelling Units (ADUs).
4. Work with the community on zoning code changes including setbacks and uses that will allow the appropriate missing middle housing options in Neighborhood Place Types.
5. Work with commercial developers to adjust site development standards where more intense uses occur adjacent to residential areas including parking, building heights, landscaping, screening and sidewalk connectivity.
6. Modify the Subdivision Ordinance to expedite the approval process and add parkland dedication requirements.
7. Update the City’s Airport Overlay Ordinance to clarify regulations required for development related to wildlife hazards, noise and height
8. Develop template for an Agreement for Public Facilities that contains developer responsibilities for the provision of developed parkland and CoA responsibilities for ongoing maintenance.
9. Update the Schedule of Uses to incorporate mixed-use zoning districts.
Short-Term Priority 2 & Action Items Applicable Goals
Support and expand available tools to encourage reinvestment in older neighborhooods.
N&D1; N&D2; N&D3; N&D4; N&D5; N&D6; CC1; CC2; CC4; M1; M2; M3; M4; M5; P&C4; P&C5; P&C6 1, 2, 3, 5, 6
1. Continue to support existing special funding districts (TIRZs, PIDs, NEZ) and explore opportunities for BIDs.
2. Promote the revitalization of historic commercial corridors and “main streets” through the Neighborhood Stabilization Strategy.
3. Advertise and expand existing façade improvement and home repair programs, particularly for historic preservation and neighborhood stabilization.
4. Create a program to help restore and replace iconic signage (including large sculptural signage and neon signage) along Route 66.
5. Create voluntary design guidelines and pattern books to encourage historically appropriate rehabilitation and new construction for historic commercial corridors
6. Work with Community Development through the Consolidated Plan to understand affordable housing funds available and community needs.
7. Conduct an external assessment of housing needs and policy, developing a coordinated action plan to create a more balanced affordable and attainable housing eco-system in Amarillo.
8. Strategically develop updated incentive programs that deliver quality affordable and attainable housing through private sector partnerships.
Short-Term Priority 3 & Action Items Applicable Goals
Create a comprehensive infrastructure improvement prioritization schedule and implementation strategy (or several, each addressing a specific type of infrastructure) to align funding allocation, such as CIP, TIP, and annual budgets.
Applicable Guiding Principles
N&D3; N&D6; CC1; M1; M2; M3; M4; M6; P&C1; P&C3 5, 6
1. Coordinate annually with Utilities and CIP on the Areas of Targeted Growth and Change.
2. Complete a cost of service assessment for undeveloped land to inform infill policies.
3. Prioritize infrastructure projects for federal grant funding that are consistent with Complete Neighborhoods Scenario.
4. Align Level 2 plans (see page 114 for context) with City Plan for water, wasterwater, streets and drainage.
Short-Term Priority 4 & Action Items Applicable Goals Applicable
Update existing Neighborhood Plans and establish a system for creating new Neighborhood Plan Areas.
All goals, especially CC2; CC4; M3; P&C1; P&C3; P&C4 All
1. Continue to support and fund the Neighborhood Planning Initiative in partnership with Potter County.
2. Establish baseline metrics to guide selection of future neighborhood plan areas and progress for existing plan areas.
3. Align existing neighborhood plans with the Complete Neighborhoods Scenario and Neighborhood Stabilization Strategy.
4. Incorporate infrastucture assessments into existing and future plans.
Short-Term Priority 5 & Action Items Applicable Goals
Improve the safety and quality of Amarillo’s pedestrian infrastructure, focusing on desired activity nodes including commercial and mixed use areas, parks, and schools.
N&D1; CC1; CC2; CC4; M5; P&C6 1, 5
1. Adopt Complete Streets, Vision Zero and Safe Streets and Roads for All policies.
2. Complete pedestrian-friendly intersection improvements for ten priority locations.
3. Develop a safety action plan with a list of prioritized capital projects.
4. Adopt a thoroughfare plan that aligns with City Plan’s Complete Neighborhoods Scenario.
5. Develop a sidewalk gap analysis for neighborhood plan areas and create an ongoing program to fund connectivity improvements.
6. Modify street reconstruction standards to require increased pedestrian infrastructure and amenities along arterials.
7. Develop options for citizen-driven traffic calming programs.
Planning Approach
The following provides further articulation of an approach and hierarchy for aligning and guiding planning efforts in Amarillo. Upon adoption, City Plan is the new overarching policy document that directs the City’s longrange development efforts and the other types of plans critical to realizing the community’s vision and goals. The intent of this more clearly defined hierarchy is to ensure that planning at all levels in Amarillo is completed in an efficient and effective manner with meaningful participation and buy-in from individual residents, neighborhoods, property owners, business owners, partner agencies, major institutions and other key stakeholders. The four planning levels are summarized and described below:
1 Comprehensive City Plan
2 Citywide Strategic, System, and Functional or Action Parks & Recreation Master Plan; Stormwater Master Plan; Arts & Beautification Plan
3 Neighborhood and District Downtown Master Plan; North Heights Neighborhood Plan; Barrio Neighborhood Plan; San Jacinto Neighborhood Plan; Eastridge Neighborhood Plan
4 Specific Corridor Study or Plan; Site Master Plan; Campus Master Plan; Neighborhood Center Plan
Level 1 – The Comprehensive Plan is developed in collaboration with community members, departments across the City, elected and appointed officials, partner agencies, and other community and regional partners to provide the highest policy level guidance for future development and redevelopment, infrastructure improvements and other public investments, transportation and land use connections, and a host of factors contributing to quality of life, affordability, equity and sustainability.
Level 2 – Citywide and Countywide Strategic, System and Functional/Action Plans direct specialized components of city planning and implementation, such as transportation, economic development, parks and recreation, housing, natural resources and sustainability. City-wide plans that address a specific system or topic must align with and support the vision, goals, policies, and place guidance in City Plan.
Citywide plans typically come in two varieties, although variations exist and sometimes the two primary types of plans are combined. Strategic Plans build on the higher-level policy guidance and direction set in the Level 1 Comprehensive Plan and set more specific goals, objectives, policy direction and performance measures/ metrics for a specific topic with consideration for the entire City.
System and Functional/Action Plans are guided by the Comprehensive Plan and applicable Strategic Plans and identify and prioritize a particular type of community investment or service. These plans involve analysis and typically the definition, mapping and listing of specific projects. Most System and Functional/Action Plans also include phasing and funding strategies.
As Strategic, System and Functional/Action Plans are updated in the coming years, there are several ways they can incorporate direction provided by City Plan, including:
• Aligning with and prioritizing the Plan’s vision, guiding principles, goals, and policies
• Utilizing updated projections for population, housing units, and employment
• Basing new and updated infrastructure investments on the Complete Neighborhoods Scenario
• Developing tailored standards and guidelines for various areas of the community utilizing Place Types to inform organization and content
• Evaluating and prioritizing specific projects and programs using the Plan’s objectives and metrics
In addition, Strategic, System and Functional/Action Plans should evaluate, coordinate and incorporate specific direction for systems and topics provided by adopted Area Plans (see below).
Level 3 – Neighborhood and District Plans provide detailed strategies and recommendations regarding land use, neighborhood character, other aspects of built form, transportation, infrastructure, parks, recreation, open space, and facilities for sub-geographies of the City. The purpose of Neighborhood and District Plans is to engage and unite neighborhoods to plan their own communities within a framework that efficiently and effectively uses the resources available to ensure the entire City has neighborhood level input and guidance for more specific localized recommendations.
Level 4 – Specific Plans address smaller scale, targeted geographies and are focused on implementation. They should be guided by higher order plans (Levels 1, 2 and 3 above), but generally focus on further conceptualizing, planning and sometimes designing a specific small geography. Thus, the System and Functional/Action Plans and Area Plans typically provide the relevant guidance and direction for a single large property, a grouping of properties, or a place. Prioritization of Specific Plan efforts should be informed by City Plan’s Complete Neighborhoods Scenario and associated Place Types framework.
Leveraging & Aligning Systematic & Functional Plans
One of the most important outcomes for the City Plan process will be the alignment of the City’s Level 2 plans with the community’s vision for growth. This will result in a coordinated strategy for infrastructure better supporting private investment in the areas where it is planned and desired.
Alignment of these plans requires coordination among the Public Works, Parks, Utilities, and Capital Projects and Development Engineering departments. The following table illustrates the recommended steps towards achieving alignment. The goal is to accomplish this by the 5-year update of City Plan in 2029.
Leveraging & Aligning Neighborhood Plans
Amarillo has four adopted Neighborhood Plans (Level 3). These include the Barrio, Eastridge, North Heights, and San Jacinto Neighborhoods – illustrated in the map to the right. With the adoption of City Plan, these Neighborhood Plans should be updated to align with City Plan’s Complete Neighborhoods Scenario. These Neighborhood Plan updates – as well as any new Neighborhood Plan areas – should also be leveraged to provide more nuanced policy direction at a focused, localized level.
Neighborhood Plans should protect and enhance Amarillo’s neighborhoods by clarifying and uplifting unique character and identity and pinpointing actionable strategies for achieving desired outcomes. Neighborhood
Plans provide a platform for locally specific analysis and meaningful conversation between neighbors that isn’t possible at the comprehensive, city-wide level.
Going forward, all Neighborhood Plans should include the following components:
1. Community engagement strategy and report of methods and findings
2. Existing conditions assessment
a. History
b. Zoning and current land use
c. Demographics
d. Businesses and jobs (as applicable)
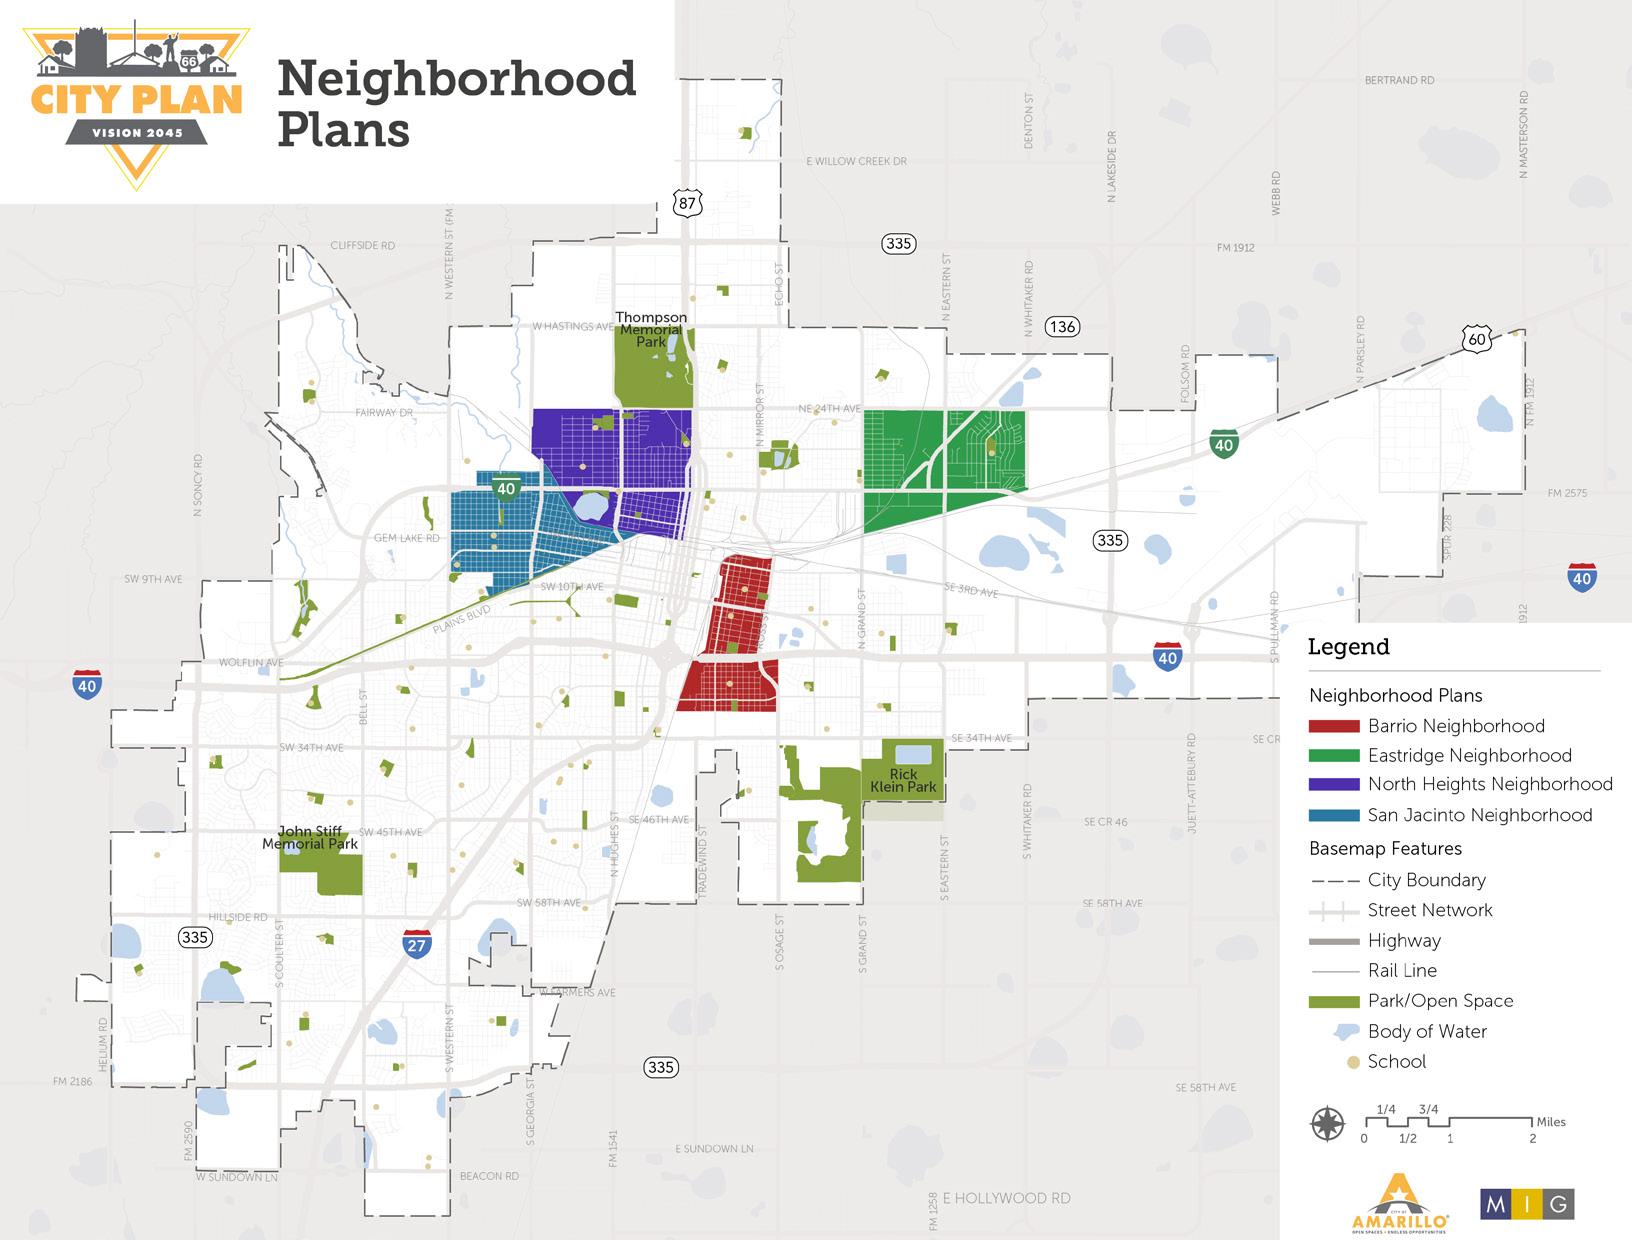
e. Community character and cultural resources
f. Housing
g. Transportation and infrastructure capacity
3. Interpretation and relevance of City Plan Guiding Principles and Goals specific to the neighborhood
4. Neighborhood vision and goals (building from City Plan)
5. Analysis and refinement of City Plan Complete Neighborhoods Scenario and Place Types for the neighborhood
6. Implementation
a. Complete Neighborhoods Scenario relationship to Zoning Code & Development Standards
b. Transformative projects
c. Infrastructure and priorities for CIP
d. Capacity, partnerships, and funding
e. Implementation matrix, including short-term priorities
Updates to the existing Neighborhood Plans will be a critical tool for implementing the Neighborhood Stabilization Strategy as these areas cover much of the land use incompatibilities we see leading to neighborhood decline and disinvestment. Thus, Neighborhood Plan updates should be prioritize before the pursuit of any new Neighborhood Plan area.
The area surrounding Rick Husband Internaltiona Airport in East Amarillo is a high priority location to establish new Neighborhood Area Planning boundaries and proceed with a new planning process for that area. Ultimately, it would be beneficial to have adopted Neighborhood Plans for every area within Amarillo.
When determining Neighborhood Plan area boundaries, the following factors should be weighed and considered:
• Acreage similar to existing Neighborhood Plan areas
• Population similar to existing Neighborhood Plan areas
• Natural dividers such as changes in land use, character, or major roadways
When it comes to prioritizing the development of future Neighborhood Plans, the following factors should be weighed and considered:
• Trends of recent change (e.g. population, demographics, jobs or industries, development, vacancies, etc.)
• Historic trends of inequity (e.g. demographics, infrastructure or amenity investments, environmental justice, access to amenities such as schools, parks, grocery, etc.)
• Vulnerability to displacement (e.g. population living in poverty or housing cost burdened, eviction cases)
• Proposed developments and market conditions
• Proportion of land identified as targeted areas for growth and change (e.g. vacant land, Place Type change, Neighborhood Stabilization properties)
• Community eagerness and champion resident(s) ready to roll up their sleeves
• Strategic groupings of 2-4 Neighborhood Plan areas with similar characteristics, geographic adjacencies or other reasons for conducting the planning process in parallel
City Plan Amendments & Updates
City Plan Vision 2045 is meant to be a living document that is responsive to changing conditions over time. Plan amendments and periodic updates will be necessary to keep the Plan relevant as priorities shift, actions are completed, and new issues and opportunities emerge.
City Plan will reintroduce a Future Land Use Map Amendment process. The intent is to maintain the integrity of the Complete Neighborhoods Scenario, while also allowing for the desired flexibility for future growth patterns that may be impacted by unforeseen circumstances such as market conditions.
Minor Amendments
Minor amendments are encouraged as part of an annual review process by the Planning Department and may be proposed for routine text or graphics changes that do not affect plan goals or policies. Minor amendments are authorized to be approved by the Planning Director who must find that the change is justified because:
• There is a clerical error existing in the text;
• There is evidence that an error exists in the mapped location of a geographical feature, including without limitation, topography, slopes, hydrographic features, wetland delineations, and floodplains;
• The name of a jurisdiction, agency, department, or district by the City, governing board or other governing authority, or other entities is altered; or
• Baseline data or statistical information included in the Plan is out of date and new information is available.
Major Amendments: Five-Year Updates
The Comprehensive Plan should be evaluated for major amendments at least every five years to ensure the Plan remains current and meets the community’s needs. Major amendments may be triggered by the need to:
• Update key data points and re-evaluate trends related to demographics, housing, economic development, growth and development activity, and other important factors;
• Affirm the Plan’s vision, goals, and policies in total or regarding a particular topic or issue; and/or
• Re-evaluate implementation strategies contained in the Plan
A major update to the Plan should include opportunities for involvement by the public, City staff, elected officials, and other relevant or affected stakeholders.
Complete Neighborhoods Scenario
Land Use Map Amendment Process
Amendments to the Future Land Use Map, also referred to in the Plan as the Complete Neighborhoods Scenario Map, are expected to primarily occur as part of the development process for the following applications:
• Annexations
• Preliminary Plans
• Rezonings
Developer-initiated map amendments will be considered and acted on as they arise with these applications. A Future Land Use Map Amendment application will be required as a separate submittal with annexations and preliminary plans. It will be incorporated into the existing rezoning application and review process.
Changes to the Future Land Use Map that are not developer-initiated should be considered through a comprehensive Annual Map Amendment Review. These changes shall be presented to the Planning and Zoning Commission for recommendation to City Council for approval.
The map amendment review for both developer-initiated and the Annual Map Amendment Review shall be guided by the following criteria to avoid site-specific plan changes that may negatively impact adjacent areas and uses or detract from the overall character of the area:
• Consistency with the goals and policies set forth in the Comprehensive Plan, as well as the intent and policies of any applicable small area plans, or other City plans.
• Expanding opportunities for a greater diversity of housing options and/ or economic opportunities for Amarillo residents.
• Compatibility with the surrounding area in terms of land use density and intensity, and the overall mix of land uses.
• Impact on infrastructure provision including water, wastewater, drainage, and the transportation network.
• Impact on the City’s ability to provide, fund and maintain services.
KEY CONSIDERATIONS FOR PROPOSED AMENDMENTS TO THE COMPLETE NEIGHBORHOODS SCENARIO MAP
In addition to the Map Amendment Process criteria above, the following factors should be considered when a Future Land Use Map adjustment is proposed:
Timing: The amendment is necessary immediately as with a particular rezoning request or it can wait to be comprehensively reviewed through the Annual Map Amendment Review.
Scope: The proposed map change is limited to one or few parcels or affects a large area.
Change in Conditions: Specific conditions have changed sufficiently to render the current map designation(s) inappropriate or out of-date. This may include significant changes to population characteristics, area character and building form, property conditions, infrastructure or public services, or market factors initiating a need for more land in a particular Place Type.
Adequate Information: City staff, the Planning and Zoning Commission, and/or City Council have appropriate information to move ahead with a decision. Relevant information may include a utility capacity analysis, potential traffic impacts, other public service implications, and community concerns and input.
Community Input: Opportunities for community input have been provided and concerns raised by residents, property owners, business owners, or other community members have been addressed.
• Impact on environmentally sensitive and natural areas.
• Whether the proposed amendment contributes to the overall direction and character of the community and the surrounding neighborhood or area as described in the Plan.
Alternatives to Parkland Dedication Requirements
COMMENTARY
The draft Parks and Cultural Resources Element of the updated Comprehensive Plan recommends that, “Developers shall provide a minimum of 2.2 acres of developed parkland per 1,000 residents for neighborhood and community parks or pay fees in-lieu.” This section explores possible strategies for the City to explore to supplement this recommendation, based on a review of requirements in other rapidly growing communities. The Amarillo Parks and Recreation Master Plan identifies four categories of parks: regional parks, community parks, neighborhood parks, and other parks. Open space and recreational facilities are included as a subset of these park categories.
Traditional parkland dedication requirements aim to provide residents with sufficient access to recreational space by requiring developers to either dedicate land for park use and/or pay a fee in-lieu of dedication that can then be used by the municipality to construct parks. As communities grow, parkland dedication requirements help prevent the existing park system from becoming overburdened with the addition of new residents. However, continuing to build new parks and expand the system while also ensuring that parks and recreation facilities in older parts of the community are well maintained is a challenge that many communities struggle to balance.
The City is responsible for an extensive parks system with costs far outpacing the budget of The Parks and Recreation Department. While the City of Amarillo has performed well with the amount of parkland allocated throughout the City, maintenance and asset management of public parks was rated as ‘poor/failing’ according to the 2021 Parks and Recreation Master Plan.
Many communities have adopted—or are exploring— new ways to satisfy park and common open space requirements while ensuring residents still have access to quality, outdoor spaces, and recreation. This section outlines a series of options that the City of Amarillo could consider to help augment current parkland dedication goals, based on a review of requirements in other fastgrowing communities in Texas and other parts of the country. These options are intended to:
• Reduce the strain put on the City’s limited financial and staffing capabilities.
• Mitigate future impacts of land becoming scarcer as the population of Amarillo grows.
• Broaden the type of areas that can count toward private common open space to provide greater flexibility for developers to meet land dedication requirements.
• Increase access to high-quality, recreational spaces in underserved areas of Amarillo.
• Tailor parkland dedication and improvements to the recreational needs of residents based locational context and specific neighborhood characteristics, as informed by the Complete Neighborhoods Scenario Map.
Option 1: Public Park Improvement in lieu of Park Development Fees
Park improvements are highly valued by the community as described throughout the Parks and Recreation Master Plan. Additionally, there is a strong desire by residents to see more investment in existing parkland. Increased investment in parks throughout Amarillo was supported by 69% of survey respondents and the top two investment priorities were identified as 1) maintain or replace older park amenities and 2) Expand or improve athletic facilities.
To help address park and recreation needs in established areas of Amarillo and build community support for infill and redevelopment, this option would require a developer to construct improvements to existing parks or recreation facilities in the immediate area of the proposed development in lieu of constructing a new park. This option would only apply in locations where unimproved parkland is not available. Improvements
COMMENTARY
The 2023 Texas State Legislature passed new regulations on how cities may collect parkland dedication (PLD) fees. While House Bill (HB) 1526 does not apply to Amarillo as it stands, the City Attorney would need to review and weigh in on any of the proposed options to ensure they are consistent with state law.
COMMENTARY
While the City would have the option of using fees-in-lieu collected for the types of park improvements outlined here, this option seeks to create a more direct linkbetween infill and redevelopment and the need for neighborhood improvements that serve both existing and new residents. A mechanism for calibrating the value of the “improvement” with the proposed development would be needed.
Additionally, public park improvement in lieu of park development fees would help implement goals within the City Plan’s housing and neighborhood stabilization goals. For example, this option would help implement N&D Goal 3: Revitalize and encourage infill housing in existing neighborhoods; specifically its third recommendation:
Support and expand programs that encourage reinvestment in existing homes and neighborhoods, foster the stabilization of transitional neighborhoods, and support home ownership.
would be tied to the Parks and Recreation Master Plan priorities for that location, as defined in in Table 15: Phased Priority Actions, the needs assessment in Table C-1: Neighborhood-Serving Park Residential Area Gap, and Table C-2: Other Recreation or Greenspace in Gap Areas, or identified in collaboration with the affected neighborhood.
Community Involvement in Identifying Needed Park Improvements
In conjunction with Option 1, the City should establish a process for community involvement associated with proposed infill development or redevelopment. A similar strategy is already identified within the Parks and Recreation Master Plan, which states “Expand efforts to engage community members in the design of new and existing (renovated) parks. Use a mix of online outreach, focus groups with stakeholders, and events at or near the site to garner feedback from the community” (Appendix D, pg. 5). This strategy could be tailored
to require a developer to consult with the surrounding community prior to introducing
COMMENTARY
This option would help address the following goals and objectives in the Parks and Recreation Master Plan:
Goal 2: Create Context-Sensitive Parks
Objective 2.4: Adopt acquisition, design, and development guidelines to guide park renovation and new park development. Coordinate these guidelines with parkland dedication and fee-in-lieu requirements.
Goal 3: Ensure Equitable Park Access
Objective 3.1: Adopt park standards and guidelines that ensure the balanced and equitable distribution of parks and facilities.
Objective 3.4: Provide parks to serve new residential development.
Creating an option for community involvement in identifying needed park improvements would also help implement other recommendations under City Plan’s N&D Goal 3: Revitalize and encourage infill housing in existing neighborhoods; specifically its sixth recommendation:
Support the creation and efforts of community development organizations that can lead focused reinvestment efforts in neighborhoods through use of tools and powers not available to the City.
improvements, which can also be helpful for garnering neighborhood support for the proposed development. Providing avenues for community engagement would be especially important in neighborhoods where the City is targeting redevelopment efforts. The goals and strategies of any applicable neighborhood plan should also be incorporated in the decision-making process. Ultimately, proposed improvements should be approved by the Director of Parks and Recreation.
Option 2: Expanding the Definition of Parkland and Allowing Credit for Private Common Open Space SetAsides
Expanding the definition of parkland dedication requirements to include private common open space and allowing credit for common open space set-asides is a strategy that many fast-growing communities are considering to help address some of the maintenance and parkland distribution challenges that Amarillo is facing. Defining and allowing open space set-asides to count toward the parkland dedication requirement provides two specific advantages: 1) It is a more flexible approach that allows the types of park facilities that are provided to be tailored to surrounding development context and the needs of the immediate community; and 2) Where appropriate, it can be used to relieve the City of the responsibility of maintaining certain facilities. In contrast to public parks that are intended to be accessible to the public, open space set-asides are intended for the use of a development’s residents.
Facility types should be tailored to the locational characteristics of the proposed development, Parks and Recreation Master Plan priorities for the area, and the recreational need of residents. The table beginning on page 123 provides examples of alternative facilities that can help satisfy common open space requirements in different areas of Amarillo, based on Place Type. For example, mixed-use areas like those within the Neighborhood – High and Neighborhood Mixed-Use Place Types may not be near large open spaces, public parks, or greenbelts, or have land available for new parks, so thinking creatively and expanding the type of facility that can count as an open space set-aside is needed.
COMMENTARY
Apopka, Florida and Clark County, Nevada both recently adopted common open space requirements as part of their land use regulations. Similar strategies are also being considered by New Braunfels, Texas, and Addison, Texas as part of major development code updates.
Transfer of Ownership, Management, and Maintenance of Private Common Open Space Set Asides
The ownership, management, and maintenance of private common open space within subdivision communities should be transferred to private entities who would be responsible for the costs associated with maintaining these spaces. Possible options include:
Homeowner’s Associations: Because most subdivision neighborhoods are subject to the enforcement of covenants by Homeowner’s Associations, transferring ownership of common open space set asides in-, adjacent to-, or in close proximity to these neighborhoods to the HOA, (if they are willing to accept responsibility) is an option when a new development is dedicating land for common open space. The HOA would be responsible for managing and maintaining the land for its intended open space purposes. This option would also apply to indoor facilities, such as community rooms.
Civic or Environmental Organizations: Another option would be conveying open space areas to a third-party beneficiary such as an environmental or civic organization that is capable of, and willing to accept responsibility for managing and maintaining the land for open space purposes.
Establishment of easements: Lastly, easements on parts of individually owned lots that include common open space areas can require that areas prohibit any inconsistent future development and be managed consistently with the land’s intended open space purposes.
Park Dedication Distance Considerations
Amarillo should strive to meet the industry standard set by the NRPA and TPL. If a proposed residential development (single family or multi-family) is not within a half-mile distance of an existing park, then the developer should be required to build a new park instead of exercising the fee-in-lieu option. This should be prioritized in “high need” areas where residents have a greater need for parks within walking distance as identified in the Park Access and Gaps analysis of the Parks and Recreation Master Plan. The size of the park and the park classification will depend on the proposed development’s size as described in the ‘Level of Service Guidelines’ within Appendix E Recommended Park Dedication Requirements of the Parks and Recreation Master Plan. While the ‘Level of Service Guidelines’ indicate size requirements for different classifications of parks (e.g. Small Neighborhood Parks in new developments should be approx. 2-3 acres in size), more targeted guidance by the Parks and Recreation staff should be considered for determining what type of park developers should be required to construct. Additionally, the City could allow developers to construct a portion of the required acreage for different classifications of parks and permit any combination of the alternative facilities in the following table to count toward the remaining required acreage. Master Plan identifies priority actions for both ‘Scaled-Back Neighborhood Parks’ and ‘New Parks’ — distance guidelines should be tailored to these priority actions.
COMMENTARY
The Parks and Recreation Master Plan mentions a similar approach of private ownership and maintenance for parkland dedication requirements. Appendix E Recommended Park Dedication Requirements states:
At the applicant’s request, the City may approve compliance through other alternatives as noted in the City’s Dedication Ordinance. For example, improved acreage for Neighborhood Parks may remain in private ownership, by the property owner’s grant of an easement ensuring ongoing maintenance and continued public access to the land for the park purposes.
COMMENTARY
The Parks and Recreation Master Plan includes the following park service distance guidelines for new parks:
• Small Neighborhood Parks should be located not further than one (1) mile from any single-family lot. The City shall strive to provide small neighborhood parks within one-half (1/2) mile from multi-family units on the proposed subdivision plat, as measured along public road or pedestrian ways.
• Large Neighborhood Parks should be located not further than two (2) miles from any lot on the proposed subdivision plat, as measured along public road or pedestrian ways.
• Community Parks (either multi-purpose or special use) should be located not further than four (4) miles from any lot on the proposed subdivision plat, as measured along public roads.
The Parks and Recreation Master Plan notes that only 46% of Amarillo residents live within a 10-minute walk of a park. Providing all residents with a park within a 10-minute walkapproximately one half of a mile - is the industry standard championed by The National Recreation and Park Association (NRPA) and the Trust for Public Land (TPL). The Master Plan notes that Amarillo’s 2012 adopted standard to provide parks within a 20-minute walk - approximately one mile - is partly why the City falls short on meeting the NRPA and TPL standard.
Alternative Facilities for Parkland Dedication
Facility
More Desirable Areas
Parks & Recreation
Facilities
Trails & Greenways
Facilities and areas used for active recreation such as tennis courts, pools, playgrounds, basketball courts, sports complexes, clubhouses, public running tracks,, picnic areas, pocket parks, and Parks and Recreation facilities.
Multi-modal trails (soft and hard surface) and greenways. Trails and greenways can enhance connectivity between neighborhoods, which can improve safety for pedestrians and bicyclists, shorten lengths of trips, and encourage non-motorized transportation.3
NL,1 NM, NH, IN Residents of the proposed development should have direct access to the facility through either a public walkway or road. Features, such as picnic areas, may be restricted for use only to residents of the development.
NL, MN, NH, CMU
To the extent possible, access to trails and greenways should be public.
This option would be most suitable in areas of new development that may be in proximity to areas that support active recreation. If these facilities are introduced in areas of redevelopment, they may be helpful reinvestment strategies for the stabilization of transitional neighborhoods.2
This option would be most appropriate in areas of new development that may be in proximity to suitable areas for trail and greenway construction. According to the Parks and Rec. Master Plan, there is one existing off-street trail in Amarillo, which appears to be disconnected from adjacent residential areas. The lack of trails and greenways represents a prime opportunity to encourage developers to deliver this highly desired amenity.4
*Only Place Types with residential uses were considered for alternative facilities for parkland dedication because of the City’s goal to prevent new residential uses within industrial areas.
**New development includes ‘greenfield’ development on undeveloped land at the edge of the community. Redevelopment includes infill development on vacant lots in established areas of the community or the redevelopment of underutilized or vacant buildings in established areas of the community.
1 The specific location of a development will ultimately guide which facility type is most appropriate. For example, a low-density subdivision closer to the city center may be able to consider facilities found in higher-density areas like courtyards, squares, and plazas.
2 Further clarification is needed to effectively integrate neighborhood stabilization recommendations into the most appropriate alternative facilities for parkland dedication.
3 According to the Parks and Recreation Master Plan, the demand for trails is high and has grown substantially since the beginning of the COVID-19 pandemic. Given over thirty percent of Amarillo residents consider building more trails and paths as a top funding priority, this amenity should be prioritized in appropriate proposed developments.
4 The value of trails and greenways for neighborhood connectivity and accessibility can be seen in The Greenways subdivision. Trails transform what would otherwise be dead-end cul-de-sacs into nodes of connectivity, linking residents to the parkway and the entire neighborhood. Compared to other alternative facilities, trails and greenways would have the greatest impact in implementing the mobility goals outlined in the City Plan.
Alternative Facilities for Parkland Dedication
Facility
Squares, Forecourts, and Plazas
Courtyards, public squares, roof decks and outdoor dining areas within or in close proximity to the development that provide active or passive recreational opportunities.
NM, NH, NMU, CMU, IN
Indoor Community Rooms and Gathering Spaces
Garden Facilities
Indoor community rooms or other gathering spaces within proposed developments.
Neighborhood community gardens or other forms of urban agriculture, such as rooftop gardens, formal plantings or gardens, and gazebos, that provide passive recreational opportunities.
Les Desirable Areas
Natural Resource and Hazard Area
Natural water features like lakes, playas, ponds, rivers, streams, drainageways, riparian buffers, and flood hazard areas.
Standards can ensure facilities provide sufficient recreational opportunity. For example, Amarillo could mandate facilities must meet a certain size, e.g., facilities should be at least 200 square feet, but no more than one acre, in area.
NM, NH, NMU Facilities may be required to contain certain elements to be considered appropriate recreational space (e.g., tables, games).
NL, NM, NH, NMU Size requirements similar to squares, forecourts, and plazas, should be considered for community gardens and formal plantings to help ensure they provide sufficient recreational opportunities.
NL, NM, NH, NMU, CMU, RMU, CP, IN Standards should apply to make these features appropriate open space alternatives. This can include requiring that areas provide access and amenities like pedestrian elements, such as walking paths and benches.
This option would be most suitable in areas of redevelopment that may be within or in proximity to denser residential areas. The Master Plan found that denser residential areas are less likely to have private outdoor space and more need for a neighborhood park. Expanding the type of facilities in these areas can help increase access to recreational space.
This may be appropriate in both new development and redevelopment given the facility is within the proposed development.
Community gardens and formal plantings are likely to be most appropriate in areas of redevelopment. These amenities may be helpful reinvestment strategies for the stabilization of transitional neighborhoods.
Appropriate in both new development and redevelopment.
Alternative Facilities for Parkland Dedication
Facility Type
Description
Management Areas
Treated as Site Amenities
Land area occupied by stormwater management devices including retention and detention ponds and other bioretention devices, and drainage easements when treated as an open space site amenity.
Place Type*
NL, NM, NH, NMU, CMU, RMU, CP, IN
Design & Maintenance Requirements
To qualify, facilities should support passive recreation uses by providing access and amenities like pedestrian elements, such as walking paths and benches. Stormwater management devices without landscaping and amenities, or that are surrounded by fencing, may be eligible for a lower percent credit in satisfying parkland requirements.5
New Development/ Redevelopment**
Appropriate in both new development and redevelopment.
Required
Buffer and Landscape Areas
All areas occupied by required buffers and landscaping, such as landscaped areas, perimeter buffers, vegetative screens, riparian buffers beside interior parking lot landscaping, and planting strips between the sidewalk and street.
NL, NM, NH, NMU, CMU, RMU, CP, IN
Option 3: Parkland Dedications for Commercial Development
Parkland dedications are traditionally implemented for development that includes residential units only. However, cities with strong economic growth are also starting to consider parkland dedication requirements for commercial uses, since employees and businesses also benefit from quality pubic parkland spaces and contribute to increasing needs and impact on level of service.
This alternative facility should be considered lowest priority/ desirability because of their limited ability to support recreational opportunities.
Appropriate in both new development and redevelopment.
As an emerging concept, additional research, community outreach, and due diligence will be necessary to ensure that the pursuit of any such strategy is fair and legal. Per National legal precedent and Texas state law, development impact requirements must prove a rational and proportional nexus between the dedication requirement imposed and the expected impact of the development. While this standard applies to all types of development impact requirements, the calculation
5 As part of their Unified Development Code update, New Braunfels, TX is considering design standards for stormwater management areas to include elements like paths and benches in order for them to qualify for 100 percent credit toward common open space requirements.
CASE STUDY: INTRODUCING FLEXIBILITY TO TRADITIONAL COMMON OPEN SPACE REQUIREMENTS
Apopka, Florida’s Land Development Code features the modifications to standard common open space dedication requirements outlined in Option 2. The City provides a menu of facility types that may be counted toward minimum open space dedication requirements by land use classification. These include:
• Natural Features
• Active Recreational Areas
• Passive Recreation (Including Plantings and Gardens)
• Squares, Forecourts, and Plazas
• Required Landscape Areas and Agricultural Buffer
• Stormwater Management Areas Treated as Site Amenities
• Public Access Easements with Paths or Trails
| APOKA, FL
Apopka’s development code also includes design standards for open space set-aside areas that specify requirements for location, configuration, orientation of adjacent buildings, and prioritization of open space set-aside features. Second, Apopka specifies that the ownership, management, and maintenance of open space set-asides should be through one or more of the following:
• Conveyance to a property owners’ or homeowners’ association.
• Conveyance to a third-party beneficiary such as a civic or environmental organization.
• Establishment of easements on those parts of individually owned lots including open space set-aside areas that require the areas to be managed consistent with the land’s intended open space purposes.
A similar transfer of ownership, management, and maintenance of open space set-asides to private entities is also being done in McKinney, Texas.
CASE STUDY: INTRODUCING COMMERCIAL PARKLAND DEDICATION
In 2022, the City of Austin adopted new parkland dedication requirements for commercial development. The new requirement was based on a robust nexus study, and included:
• impact calculations defined by expected “functional population” = (proposed sqft/employee desnity for use class) x (occupancy of use class) x (operation hours of use class) x (commuter workforce rate)
and documentation processes are not as established for commercial uses as they are for residential, thus necessitating more careful consideration and study.
The City should pursue changes to parkland dedication requirements for residential uses before exploring the possibility of applying parkland dedication requirements
| AUSTIN, TX
• fee in lieu and park development fee options
However, in 2023 the State issued HB1526 that banned parkland dedication requirements for commercial land uses in large cities over 800,000 residents. While this law would not apply to Amarillo, it is possible that the state could choose to extend the law to smaller cities. This new legislation was grounded in concerns that dedication impact requirements may contribute to increased development costs, and thus consumer costs.
to commercial development. The potential strategies presented in Options 2 & 3 may also be considered for commercial development parkland dedication.
Connection to Zoning Code & Development Standards
City Plan’s Complete Neighborhood Scenario provides clear policy direction for future land use and development outcomes. The City’s development and design regulations – found within Title IV of the Code of Ordinances – are the primary tools available for implementing and achieving those outcomes, namely the Zoning Code. These existing regulations and standards already support City Plan’s policies in many ways. However, the addition of new Zoning Districts and minor updates to existing Districts or standards will be necessary to fully align the suite of development options provided within the Zoning Code with the intent of City Plan’s Place Types. Through meaningful public engagement, it will be the City’s responsibility to make these adjustments to the Code. The table provided on the following page illustrates which of the City’s current Zoning Districts can be applied to City Plan’s Place Types and identifies gaps where new Districts or overlay regulations should be created. The City should conduct a more detailed and comprehensive assessment of the Zoning Code to identify any specific conflicts as well as gaps or revisions necessary to bring the existing Zone Districts and City Plan into alignment.
While the City will initiate Zoning Code revisions to ensure alignment with City Plan, the City will not implement top-down changes to the specific zoning designation of individual parcels in Amarillo (i.e. the Zoning Map). Expressed through previous planning efforts, and reiterated through the City Plan process, many property owners and residents in Amarillo value having maximum choice and control when it comes to development potential and zoning changes. Thus, it will be the sole responsibility of individual property owners to voluntarily seek rezoning. City staff, the Planning & Zoning Commission, and the Zoning Board of Adjustment will be responsible for ensuring that any zoning change requests comply with the intent and recommendations of City Plan.
Neighborhood Planning – as described in the first section of this chapter – will serve as a key mechanism and opportunity for residents and property owners to collectively assess the current conditions and future desires for their specific neighborhood. While Neighborhood Plans will not require or dictate zoning changes, these focused planning efforts may help to
clarify or reimagine each neighborhood’s identity and inspire property owners to collectively seek rezoning for both individual and community benefit.
Place Type Zoning Districts
Neighborhood Low (NL) A, R-1, R-2, R-3, MH
Neighborhood Medium (NM) R-3, MH, MD, MF-1
Neighborhood High (NH) MF-2
Neighborhood Mixed Use (NMU) MD, MF-1, O-1, NS, new district or overlay required
Community Mixed Use (CMU) MD, MF-1, O-1, O-2, NS, new district or overlay required
Regional Mixed Use (RMU) MF-2, O-2, GR, CB, HC, new district or overlay required
Commercial (CM) O-1, O-2, GR, CB, LC, HC
Campus (CP) O-2, GR, CB, LC, HC, new district or overlay required
Innovation (IN) MF-2, O-2, GR, CB, LC, HC, I-1, new district or overlay required
Manufacturing & Logistics (ML) I-1, I-2
Parks & Open Space (POS) new district or overlay required to preserve parks and open spaces
Reserve (R) any district but mostly A; new POS district could also be applied
(A more detailed assessment regarding zone district alignment with Place Types is provided in the Appendices).
Regulatory Tools and Incentives
The following strategies are recommended to improve alignment between City Plan and the City’s Zoning Code and Development Standards. Strategies may be mixed and matched based on need and available resources. More detailed recommendations provided in support of specific goals throughout City Plan should be referenced as strategies are implemented.
Reorganize and Reformat Existing Code and Development Policy Manual
Amarillo’s Zoning Code is antiquated and difficult to navigate. When the City initiated a comprehensive overhaul of its Zoning Ordinance and development regulations in 2019, one of the key objectives of the process was to make the Zoning Code more userfriendly. The draft Zoning Code that was brought forward for public review in 2022 represented a substantial effort on the part of the City to establish a modern set of regulations that could be easily understood by staff, elected and appointed officials, the development community, and lay people. A substantial amount of time and resources were invested in this effort.
While the draft Zoning Code was ultimately not adopted in 2022 due to a lack of public support for some of the substantive changes that were proposed, a substantial portion of the draft Zoning Code is comprised of existing regulations. As a first step following the adoption of City Plan, the City should initiate a process to revisit the draft Zoning Code with the intent of removing controversial recommendations and simply adopting a clean, modern, and user-friendly version of what’s on the books today. The successful completion of this process would make the development process more efficient and predictable and lay the groundwork for the future adoption of voluntary measures outlined in this section.
Consider Targeted Code Amendments to Support Neighborhood Stabilization
Encouraging the stabilization of older, single-family neighborhoods in Amarillo that are currently zoned commercial or industrial uses is a key focus of City Plan’s Land Use Framework. In particular, properties zoned Heavy Commercial, Light Industrial-1, and Heavy Industrial-2 are non-conforming and at risk of encroachment. The City is committed to working with neighborhood residents, as well as business and property owners, to document priorities at the neighborhood level and to help develop and implement neighborhood plans. Opportunities to support the implementation of neighborhood priorities within the Zoning Code may include, but are not limited to:
• The adoption of use-specific standards to promote compatible infill development in mixed neighborhoods, or to limit the introduction of new (heavier) uses that may have a negative impact on existing residents.
• Rezoning portions of neighborhoods that are targeted for stabilization, predominantly residential in use and character (despite being zoned commercial or industrial), and where a majority of property owners support a transition from commercial or industrial zoning to residential zoning.
• Establishing residential adjacency standards to address concerns regarding uses, noise, parking, lighting, height and massing transitions (shading), hours of operation, and the siting of trash and HVAC systems where more intense uses are proposed in or adjacent to neighborhoods that are targeted for stabilization.
• Establishing a neighborhood stabilization overlay (template) that addresses common compatibility considerations, but that can be customized through the neighborhood planning process.
Pursuit of any of the options above would be voluntary and would require a collaborative process. The process would be triggered through the adoption of a neighborhood plan (or a neighborhood-initiated request for areas that already have a neighborhood plan in place, and would require support from a majority of the property owners in the area.
Adopt Floating Mixed-Use Zone Districts
Adopting floating or “unmapped” districts is one strategy that communities use to support the implementation of adopted plans and policies in situations where a gap in the existing lineup of districts exists, and where proactive rezonings are not feasible. Several new zone districts were proposed as part of the 2022 draft Zoning Code to fill gaps in Amarillo’s current Zoning Code, and some of these gaps remain based on the Complete Neighborhoods Scenario outlined in Chapter 3, specifically related to mixed-use development in targeted areas, such as along commercial corridors and main streets in Neighborhood Stabilization areas.
Recommendations throughout City Plan encourage compact, walkable, mixed-use development. While a mix of uses is allowed in the current Zoning Code as part of the General Retail (GR), Neighborhood Service (NS) districts, development standards for current districts generally reinforce a more auto-oriented pattern of development.
The City should consider adopting one or more floating mixed-use zone districts that provide opportunities for an integrated mix of uses, while also accommodating variations in the desired scale, mix, and intensity of uses in different parts of the City, and flexibility in development standards. Specific incentives should be identified based on discussions with the development community regarding barriers to the types of development the community desires.
In this instance, the City could offer applicants or property owners the option of rezoning to a floating zone district through a streamlined approval process in exchange for more flexible and permissive development standards, or establish incentives that could be applied using existing zone districts. If the City chooses to develop floating zone districts, proposed updates to existing districts brought forward as part of the 2022 draft Zoning Code (e.g., Neighborhood Service (NS) district) could be used a starting point for discussion.
Establish Regulatory Incentives to Encourage Desired Development Patterns
Many of the corridors and main streets targeted for reinvestment in Amarillo have physical characteristics that may affect the financial viability of desired development patterns. For example, shallow lot depths, small lot sizes, access limitations, and nonconforming buildings or uses—may make it challenging to satisfy existing development standards in the Zoning Code. Communities seeking to encourage infill and redevelopment in targeted areas often choose to develop incentives in the form of alternative development standards to help address the most significant barriers to reinvestment. Potential incentives could include: reduced parking requirements/shared parking allowances for developments that are readily accessible on foot or bike and/or are served by transit, reduced landscaping and screening requirements (e.g., allow use a low ornamental fence to screen surface parking along a constrained corridor instead of wide landscape buffer), and density bonuses for the construction of affordable or workforce housing.6
Such incentives could be offered to projects that involve targeted infill development, larger scale redevelopment (e.g., the redevelopment of vacant or obsolete shopping centers); and/or the adaptive reuse of historic buildings that contribute to the character and legacy of the Amarillo
6 see glossary for definitons of affordable and workforce housing
community. To have a meaningful impact, the use of incentives should be limited to high priority areas, such as in the downtown area, and along commercial corridors and main streets in Neighborhood Stabilization areas.
Intergovernmental Coordination
City Plan was developed with input from various stakeholders, organizations, and agencies that play a role in the day-to-day operations and future planning and policy direction for the community. These partners will also play an important role in the implementation of City Plan. It will be important to continue collaboration across these departments and agencies to ensure City Plan alignment and to maximize resource-sharing, efficiency, and capacity. The following entities will be particularly important for continued partnership and coordination:
• Internal City of Amarillo Departments, Boards & Commissions
• Amarillo School Districts
• Potter and Randall Counties
• Amarillo Metropolitan Planning Organization
• TxDOT
• ACT
• Partnership for Development Progress
• Neighborhood Associations

Appendices

Glossary
Neighborhood Stabilization Analysis
Land Use Scenario Analysis
Fiscal Analysis
Engagement Summary
Existing Conditions Report
Glossary
Accessory Dwelling Unit (ADU)
A structure contained within or separate from the main structure on a single-family or two-family lot that contains separate living quarters, including cooking, sleeping, and bathroom facilities. An ADU can be a separate structure or attached to the primary dwelling (e.g. garage apartment or garden apartment) with its own separate entrance. An ADU may be occupied by extended members of the homeowners’ family (such as a grandparent) or by persons unrelated to the owners or occupants of the main structure on the lot. ADUs can be a relatively inexpensive way to add dwelling units in existing neighborhoods without changing the character.
Affordable Housing
Housing that is subsidized to serve low-income residents for which the market doesn’t naturally provide realistic options.
Attainable Housing
Market-rate housing (not subsidized, not income restricted), that is affordable to a variety of household budgets, including low income households. Attainable housing can also be referred to as “naturally-occurring affordable housing.”
Community Development Corporation
private nonprofit development entities that work to revitalize underserved communities by providing much needed amenities and services including economic development and affordable housing.
Complete Streets
A national movement promoted and managed by Smart Growth America that helps communities improve their transportation networks to serve all users and modes of travel, regardless of age, ability, or circumstance. Complete Streets concepts are implemented locally through the adoption of Complete Streets Policies, Plans, and Ordinances.
Equity
While equality implies treating everyone the same, equity is grounded in the understanding that each community and part of a community faces different challenges and access to various opportunities – oftentimes driven by historical trends of disinvestment and marginalization. Equity requires the adaptation of our policies and actions to address those differences by responding to unique needs, creating inclusivity, and establishing equal access to opportunity.
Goals
Specific statements that target priority outcomes that the community wants to accomplish.
Green (Stormwater) Infrastructure
The use of measures that allow stormwater to be stored on site and slowly infiltrated into the ground, transpirated by plants, or evaporated into the atmosphere, instead of immediately being transported through pipes, drains, and water treatment systems to water bodies or manufactured flood containment systems. Green stormwater infrastructure includes elements such as rain barrels, rain gardens, bioswales, permeable pavement, planting strips, tree lawns, and green roofs.
Greenfield Development
Development that occurs in previously undeveloped areas, usually requiring the extension and creation of new infrastructure, such as roads, water and sewer, and electricity.
Historic Property/Asset
A district, site, building, structure or object significant in American history, architecture, engineering, archeology or culture at the national, state, or local level.
Historic Structure
Any structure that is:
• Listed individually in the National Register of Historic Places (a listing maintained by the Department of Interior) or preliminarily determined by the Secretary of the Interior as meeting the requirements for individual listing on the National Register;
• Certified or preliminarily determined by the Secretary of the Interior as contributing to the historical significance of a registered historic district or a district preliminarily determined by the Secretary to qualify as a registered historic district;
• Individually listed on a state inventory of historic places in accordance with state historic preservation programs that have been approved by the Secretary of the Interior; or
• Individually listed on a local inventory of historic places in communities with historic preservation programs that have been certified either by the Secretary of the Interior or by an approved state program as determined by the Secretary of the Interior.
Horizontal Mixed Use
A pattern of mixed use development where specific uses are contained within individual buildings, but may have differing uses in adjacent buildings. For example, an apartment building next to a storefront retail building.
Housing Affordability
The degree to which available housing options are reasonably affordable to residents. The U.S. Department of Housing and Urban Development (HUD) defines housing affordability as spending less than 30% of household income on housing costs, such as rent, utilities, mortgage, and insurance. Those who spend more than 30% on housing are considered Housing Cost Burdened.
Infill Development
Development that occurs within already developed areas, usually on vacant or underutilized lots, such as parking lots or neglected, abandoned properties. Because this type of development occurs within areas where infrastructure and amenities already exist, it can provide cost-saving benefits.
Low-Rise/Low-Scale Buildings
Describes buildings that are one to two stories tall.
Mid-Rise/Mid-Scale Buildings
Describes buildings that are three to six stories in height – a key feature of middle density/missing middle development.
High-Rise/Large-Scale Buildings
Describes buildings that are seven or more stories tall. This may also refer to shorter buildings that have a large footprint.
Middle Density (or Missing Middle)
Development that is built at moderate density, ranging from one to three stories – usually with minimal setbacks and lot coverage allowances greater than 60% – that supports walkable neighborhoods. Middledensity development can be less costly to serve with infrastructure, such as water and sewer, than lower-density single-family development and often is compatible within or on the fringes of such lowerdensity neighborhoods, particularly along key corridors or intersections. The increased population density of missing middle development supports City’s goal to create walkable neighborhoods that provide housing in a variety of formats, size, and prices as well as easily
accessible neighborhood-serving amenities. Middledensity development fills the gap between subdivisions that are often exclusively single-family detached homes and large, multi-story apartment buildings and large autooriented retail complexes or office parks.
Missing Middle Housing
The residential component of middle density neighborhoods. Missing middle housing includes a range of housing types that are missing in most neighborhoods constructed in the last 70 years because they were prohibited by many zoning ordinances and disfavored by the housing development and financing market. Types of housing that qualify as the missing middle include two-family housing (duplexes), three-family housing (triplexes), four-family-housing (fourplexes), townhouses, cottage homes, smaller two- and threestory apartment buildings, and live-work buildings. This type of housing often supports a variety of different sizes and price points. Individual missing-middle housing projects can be appropriate infill development in existing neighborhoods. They can gently increase density in existing neighborhoods served by utilities without impairing neighborhood identity or charm.
Mixed Use Development
A pattern of development where multiple uses are intermixed – either horizontally or vertically. Mixeduse usually refers to a combination of housing and commercial uses, such as offices, storefront retail or services, and restaurant hospitality.
Multi-Use Path
Pathway infrastructure that is designed as part of a transportation network serving persons walking or using micromobility devices, such as bikes, e-bikes, wheelchairs, and scooters. A multi- or shared-use path may run within or adjacent to a roadway with protection and buffering between vehicle lanes, or it may operate in a completely separate right-of-way. Shared-use paths serve users who are traveling for recreational, employment, or other purposes.
Objectives
The future intentions or desires for a specific topic area.
Public Improvement District (PID)
A designated area in which property owners agree to pay additional taxes to fund public improvements and services within the district.
Placemaking
Placemaking inspires people to collectively reimagine and reinvent public spaces within the community. Strengthening the connection between people and the places they share, placemaking refers to a collaborative process by which we can shape our public realm in order to maximize shared value. More than just promoting better urban design, placemaking facilitates creative patterns of use, paying particular attention to the physical, cultural, and social identities that define a place and support its ongoing evolution.
Policies
Statements that identify how goals can be reached, including the specific intent of the goal direction as it relates to more specific topics or subtopics.
Public Facilities Corporation (PFC)
Nonprofit government or quasi-governmental entities –enabled in Chapter 303 of the Texas Local Government code to acquire, construct, finance or rehab a public facility for public purposes, including affordable housing. PFCs are afforded special tax exemptions and bonding rights to minimize costs.
Safe Streets for All
Safe Streets for All is a national movement and program of the U.S. Department of Transportation that provides guidance and funding for improving the safety of streets and roads for all users. Safe Streets for All is a component of DOT’s National Roadway Safety Strategy, based on a Vision Zero goal.
Sustainability
Systems, policies, and practices that responsibly ensure the long-term viability and success of a given resource, operation, or condition – to meet current needs without sacrificing the ability to meet those needs in the future. Sustainability most commonly refers to financial or fiscal conditions, such as government operations and budgets; environmental conditions, such as local and global ecosystems; and social conditions, such as local economies and service provision, community health, and social cohesion or trust.
Tax Increment Reinvestment Zone (TIRZ)/Tax Increment Financing (TIF)
TIRZs are special district entities created within municipalities or counties to implement the TIF tool –enabled in Chapter 311 of the State of Texas Tax Code. TIF is a financial tool that allows for public investment to encourage private development and economic growth by borrowing against anticipated future tax revenue increases spurred by the initial and any subsequent investment.
Transit-Oriented Development (TOD)
A pattern of higher-density residential, commercial, office, and civic uses with an urban design and highquality support for walking, bicycling, transit use and other forms of non-vehicular transportation, developed near high-performance transit stations. Transit-oriented development (TOD) is often encouraged using special development regulations around transit stations which require a higher-quality public realm, limited parking, and connections to adjoining neighborhoods.
Underserved Areas/Neighborhoods
A community which lacks resource allocation and often has undeveloped or poorly maintained infrastructure and amenities (either public or private). These conditions contribute to diminished development potential and to disparities in access to health care, jobs, recreation, social services, housing, transportation services, food, retail, or other elements of daily life.
Vertical Mixed Use
A pattern of mixed use development where multiple specific uses are combined within a single building. For example, a building’s ground floor may be occupied by storefront retail while the upper stories are occupied by residential units.
Vision Zero
Vision Zero is a national movement that promotes the elimination of traffic-related fatalities.
Workforce Housing
Subsidized affordable housing that targets middle-income workers - generally restricted to households that make 80% to 100% of the Area Median Income.
Neighborhood Stabilization Analysis
Throughout the planning process we had multiple conversations and received many comments regarding the issue of having incompatible land uses next to each other, specifically within downtown and downtown adjacent neighborhoods. While there are multiple factors that may have led to this, the regulation of zoning and land use is likely to have played a major role.
To help resolve the issue, City staff and the consultant team have developed neighborhood stabilization strategies to help alleviate these areas. The proposed outcome of these strategies is to:
• Reduce incompatible adjacent uses.
• Strengthen the sense of place for neighborhoods and employment areas.
• Increase predictability for existing and future property owners.
The areas targeted for stabilization are existing parcels that have a single-family residential use and those that are located in areas zoned for heavy commercial, heavy industrial-2, and light industrial-1. Additionally, we looked at commercial areas of historic importance that could be revitalized as mixed-use districts. This was based not just on the development of the neighborhood stabilization strategy, but also on previous mapping analysis conducted when we began to develop land use growth scenarios. Through that analysis we clearly heard that the community wanted areas with small neighborhood main streets and mixed-use typologies. In summary, these are the areas targeted for the Neighborhood Stabilization Analysis:
• Existing single-family neighborhoods that are zoned heavy commercial, heavy industrial-2, and light industrial-1.
• Commercial areas of historic importance that can be revitalized as mixed-use districts serving nearby neighborhoods.
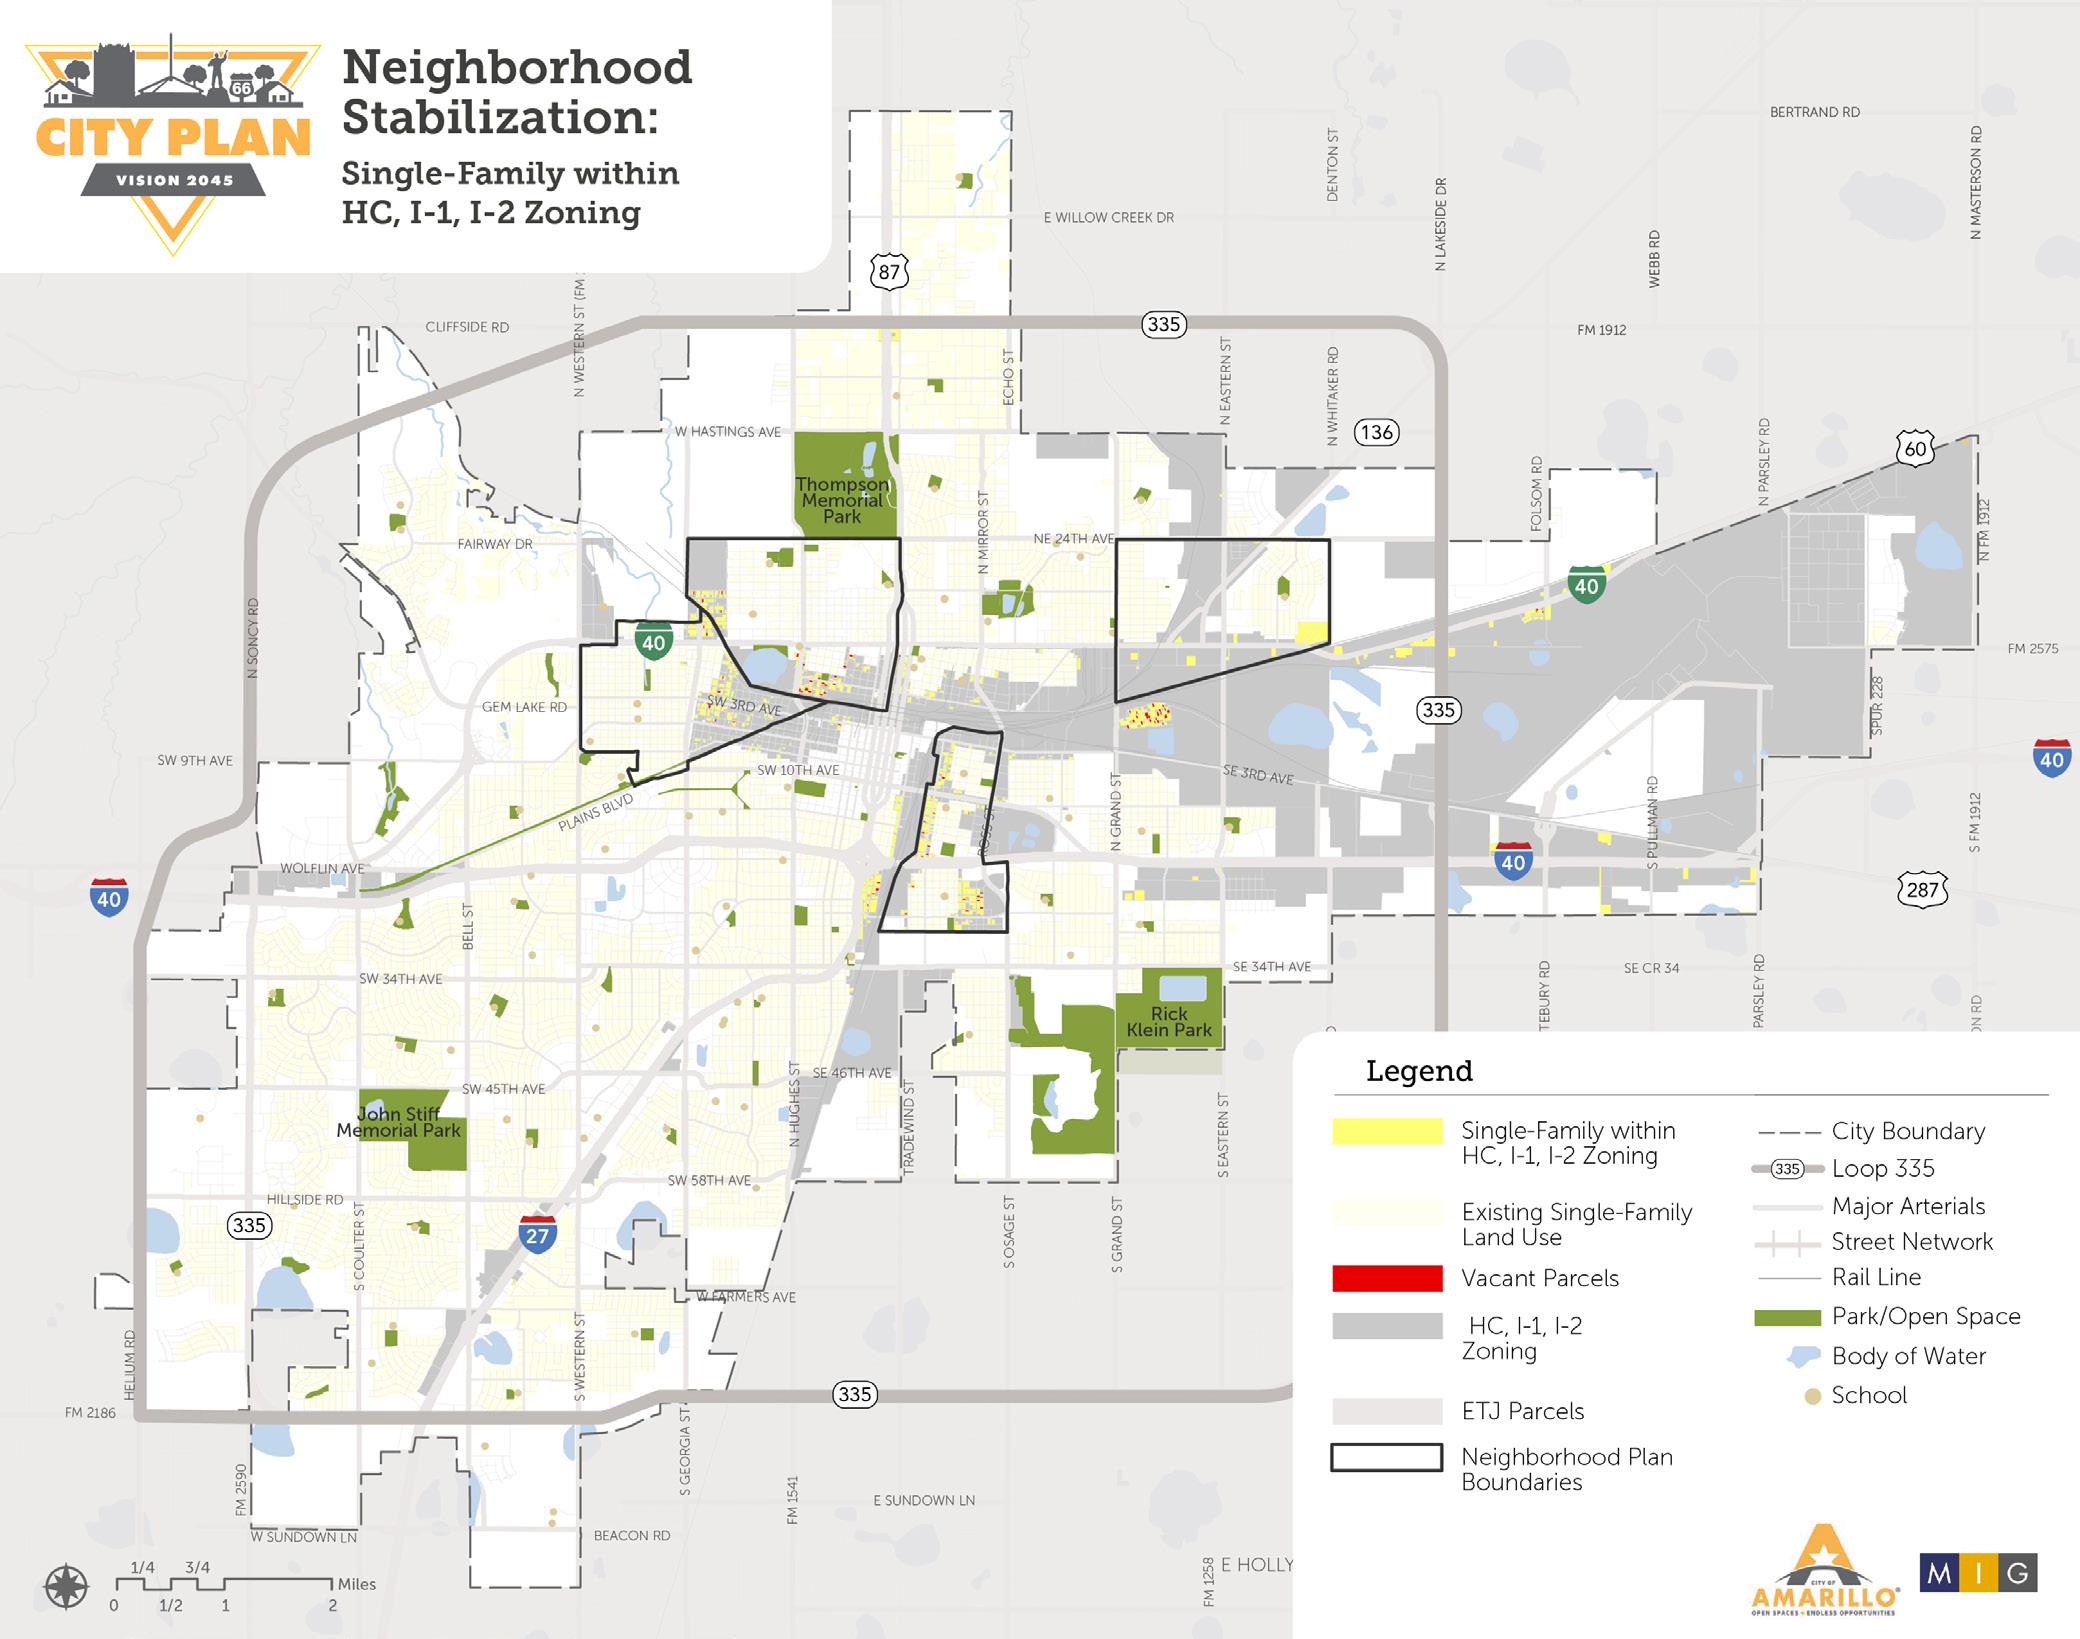
First, we looked at single-family parcels within areas zoned for heavy commercial, heavy industrial-2, and light industrial-1 (illustrated in the lefthand map below). We found that, of the total 14,745 single-family parcels in Amarillo, 3.5% are nonconforming. In other words, 519 single-family parcels are located in industrial or and heavy commercial zoning districts, which do not allow for single-family development.
Building upon this analysis, we looked at how this affected nearby neighborhoods, specifically the Barrio, San Jacinto, Eastridge, and North Heights neighborhoods. The analysis showed that of the 519 non-conforming single family parcels, 66% of these are located within the adopted neighborhood plan boundaries.
The results confirmed the need for zoning and land use strategies that address land use incompatibilities and help stabilize existing neighborhoods. The map below illustrates the analysis conducted.
We then conducted another analysis of single-family parcels. This time we took a broader approach, looking at all commercial zoning districts (illustrated in the map below). The zoning categories analyzed included general retail, neighborhood services, heavy commercial, light commercial, office-1, office-2, industrial-1, and industrial-2. The results showed that 7.5% of all single-family parcels are in commercial zoning districts. This amounts to 1,106 single-family parcels, 44% of which are within an adopted Neighborhood Plan area boundary.
The analysis re-confirmed that the issue of incompatible uses can be resolved incrementally through a neighborhood stabilization strategy.
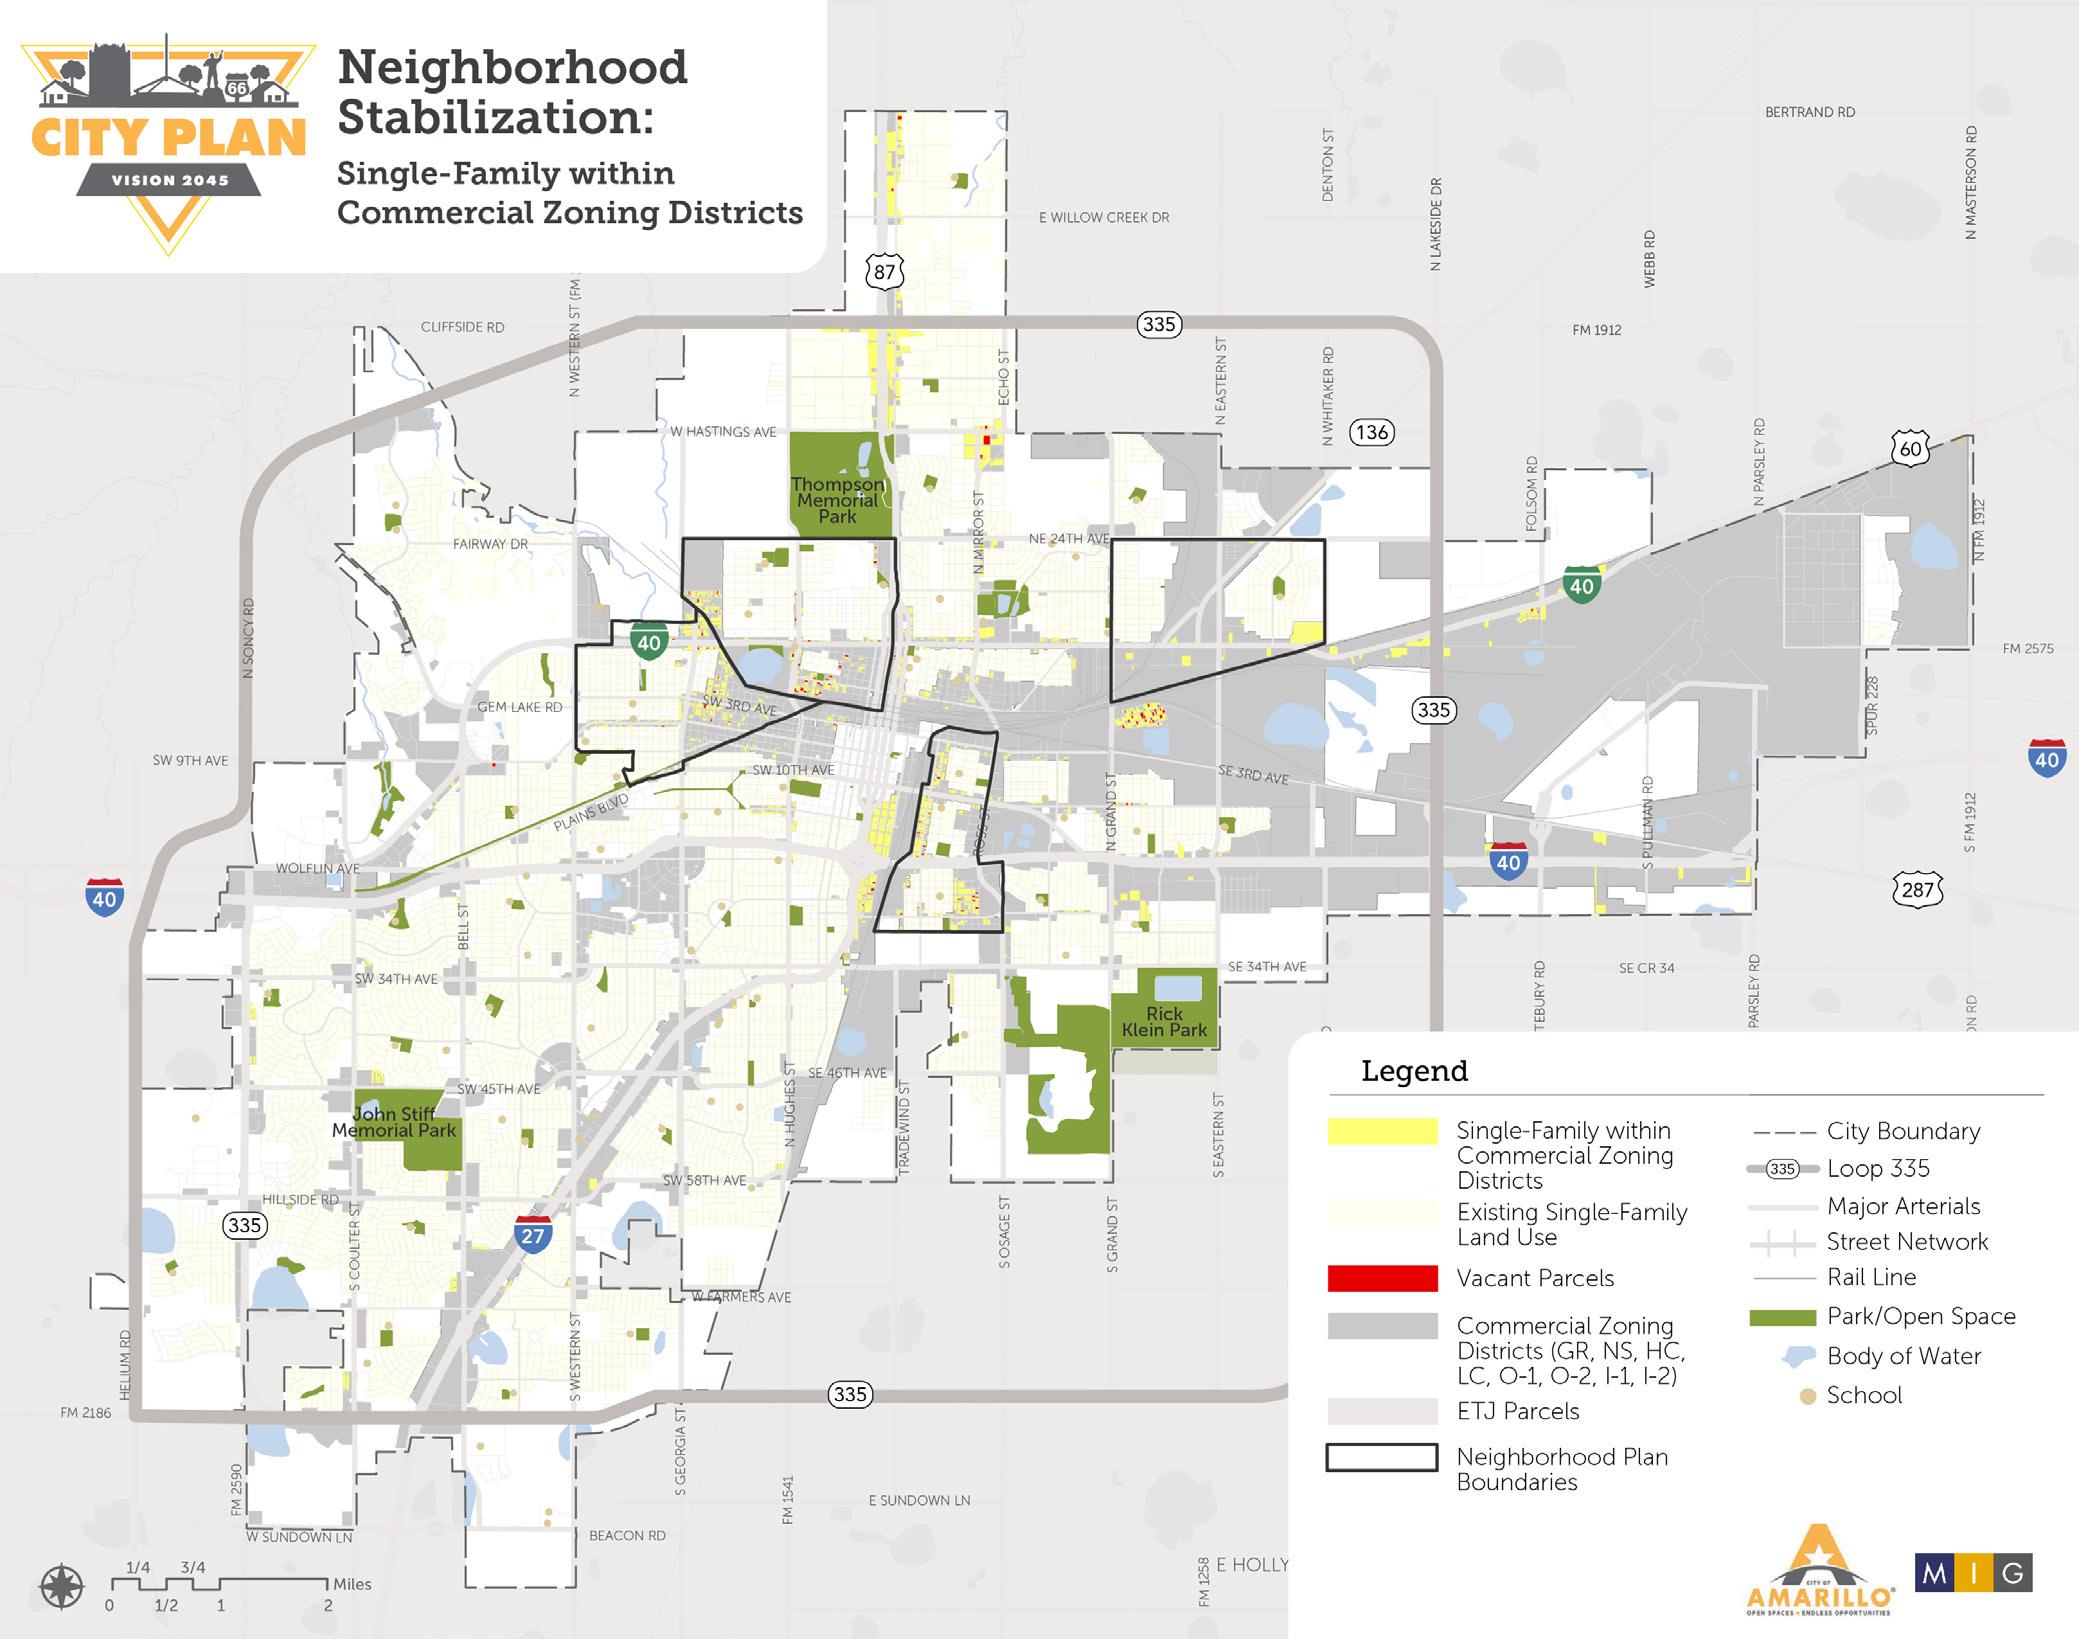
Additionally, we also studied multi-family parcels within commercial zoning districts (illustrated in the map below). We found that, of the total 796 multi-family parcels within the City of Amarillo, 205 of them are zoned within commercial or industrial districts. This equates to about 26% of multi-family parcels.
Together, these findings confirmed the need to define and distinguish residential neighborhoods from employment and economic areas in order to preserve and provide new opportunities for homes, jobs, and economic growth.
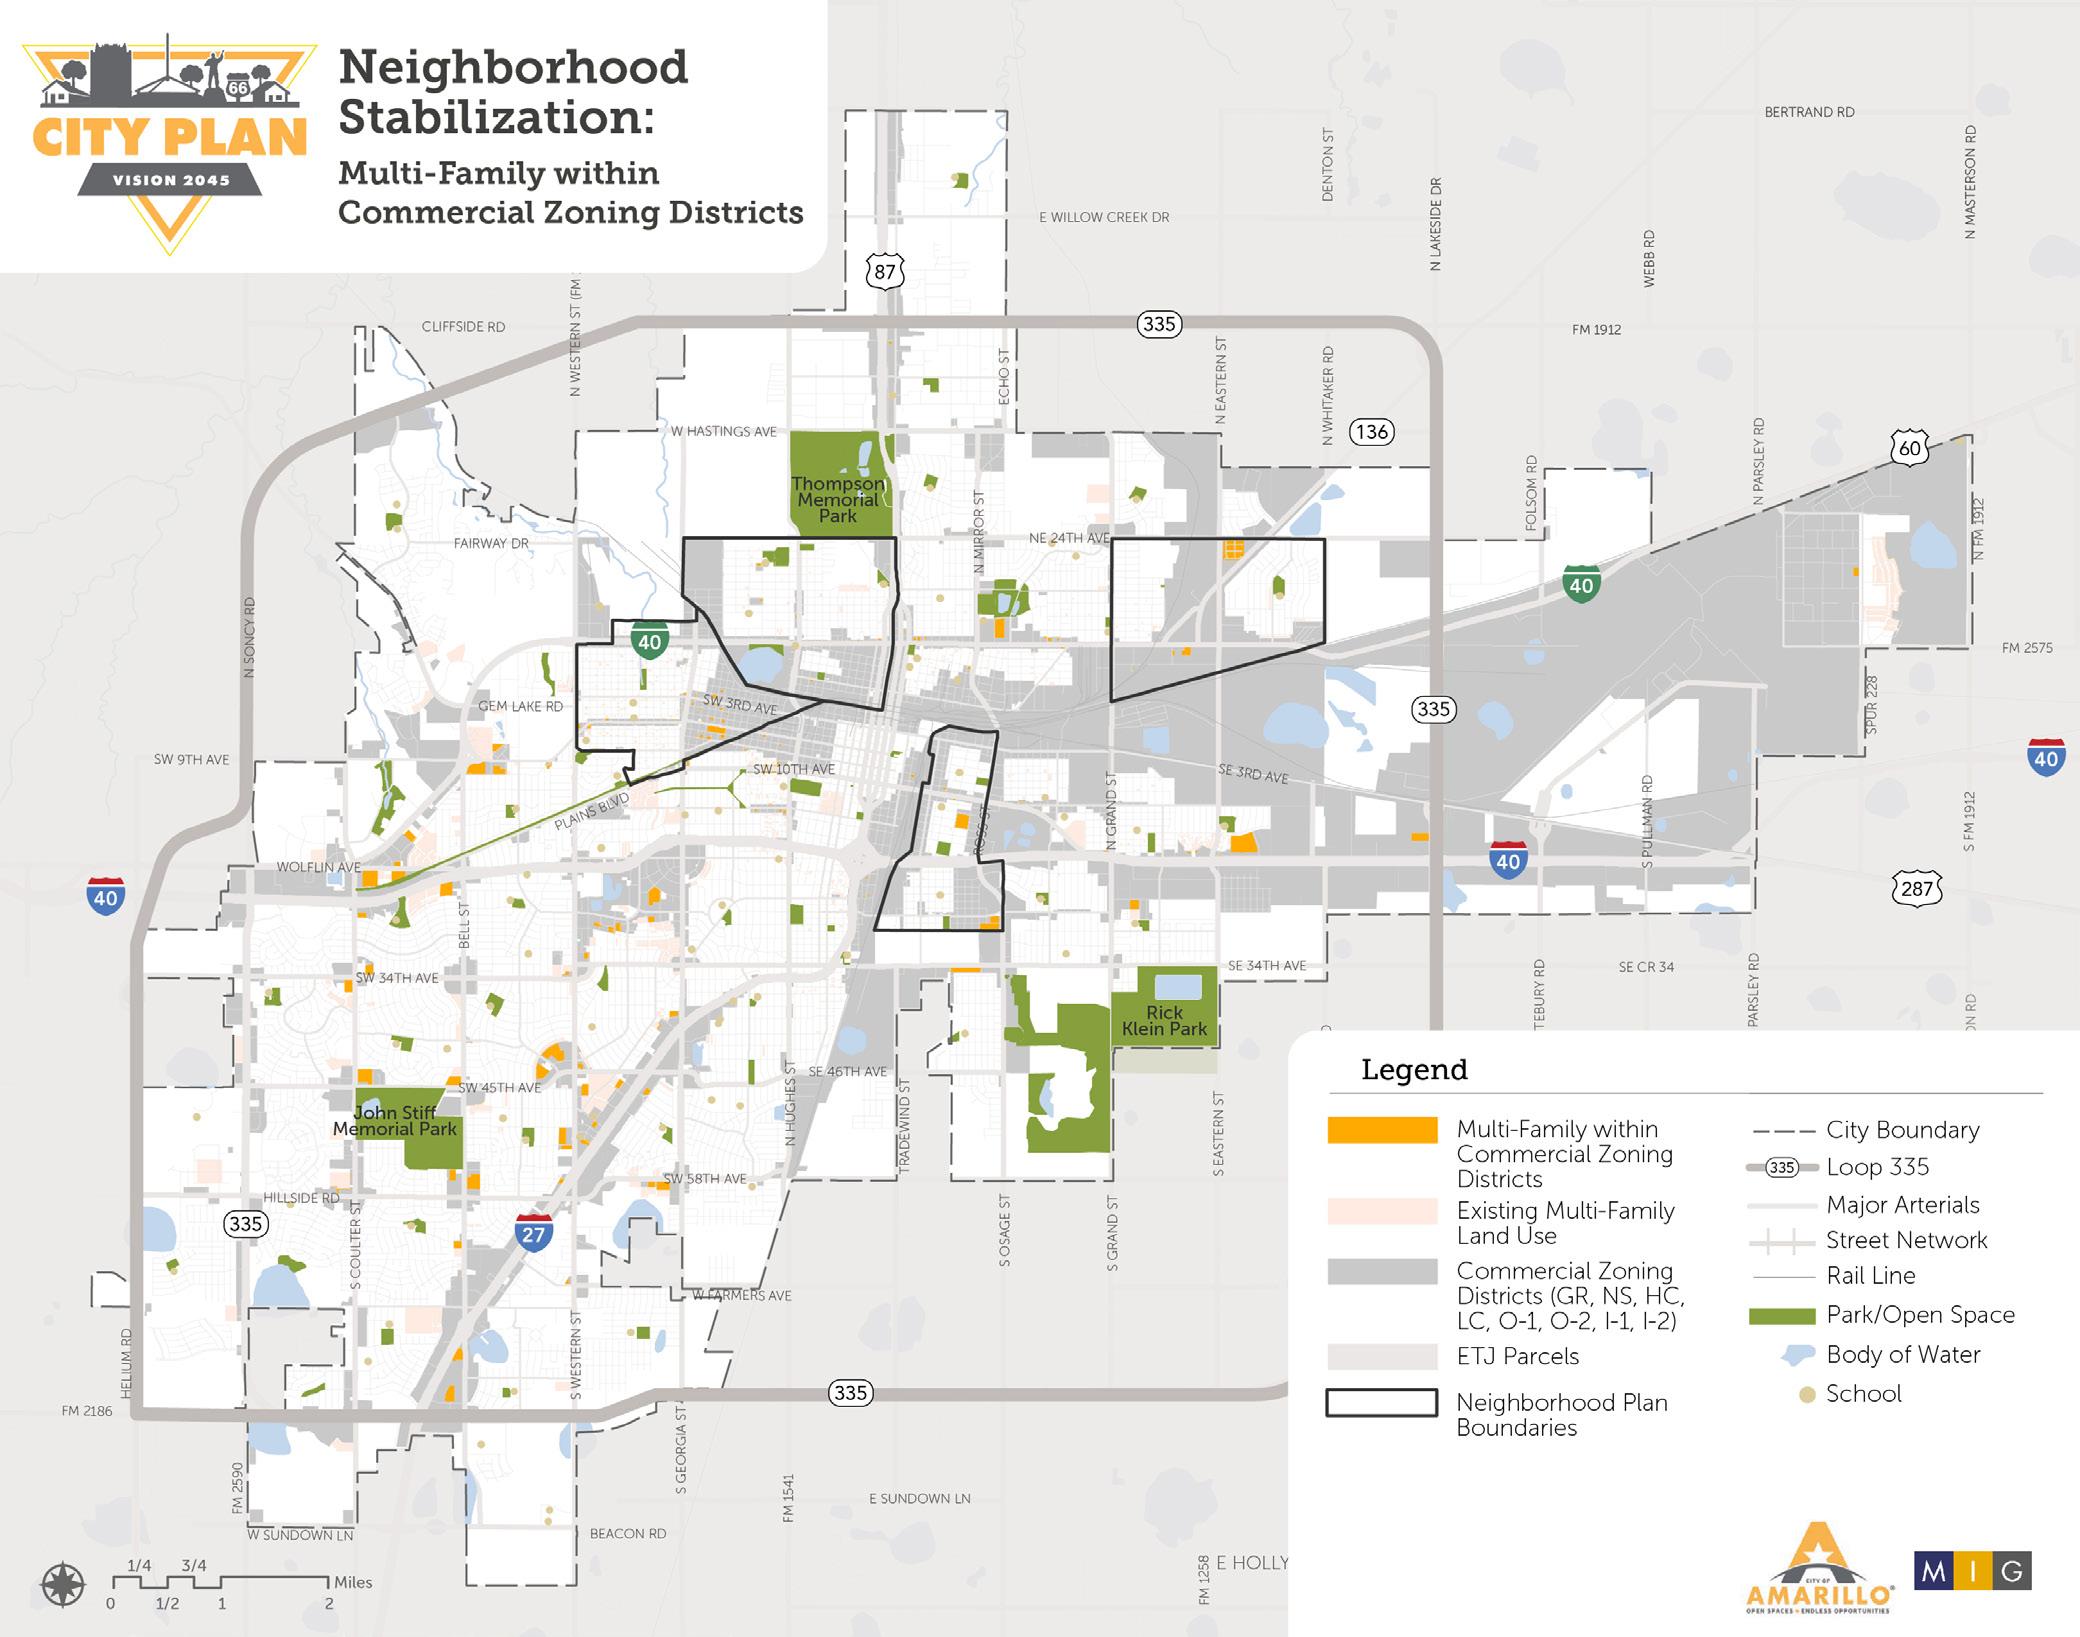
While the first part of the strategy focused on residential uses within incompatible zoning districts, the second part focused on enhancing commercial corridors and neighborhood main streets. This strategy specifically looked at corridors that have existing building footprint and historic buildings that could support a neighborhood main street typology or mixed-use district.
The identified corridors are distributed throughout the older parts of Amarillo, with at least one corridor in each of the Neighborhood Plan areas. Historic commercial corridors serving nearby neighborhoods were identified as high priority locations for land use and zoning changes. The map below illustrates the location and relative distribution of these identified corridors.
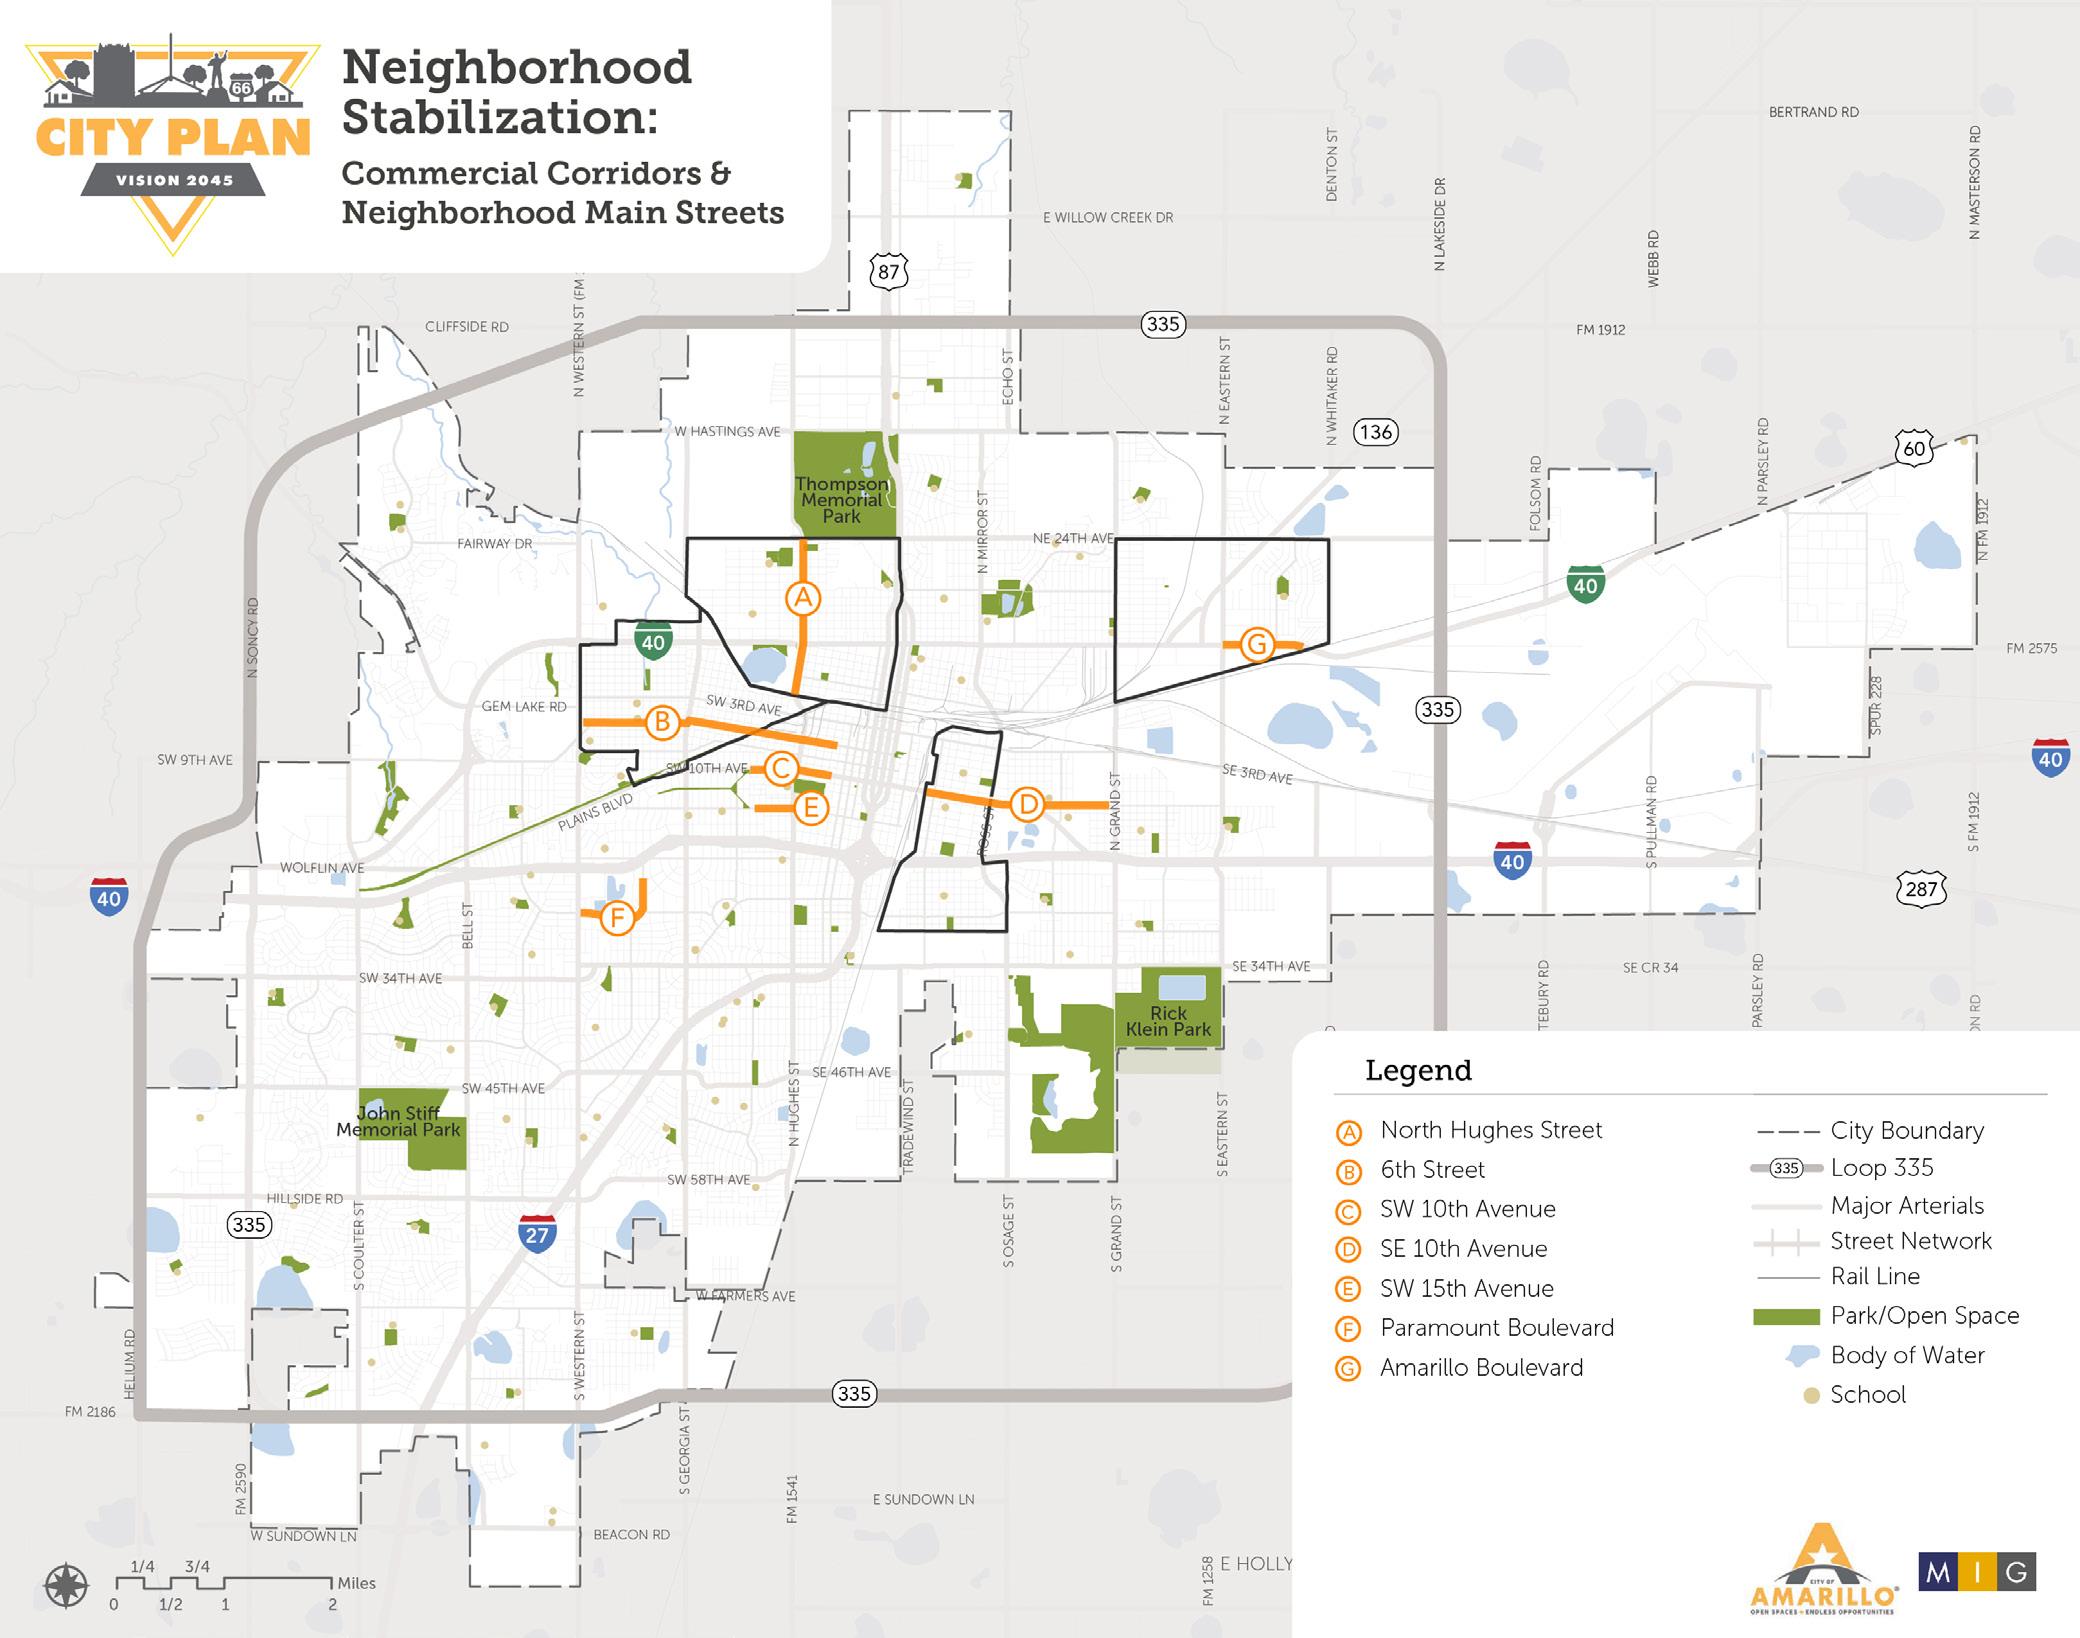
TAKEAWAYS
As part of this analysis, short-term and long-term neighborhood stabilization strategies were developed to help us reach the desired outcome. The strategies are outlined below.
Short-Term:
• Leverage infrastructure planning, design and investments to encourage property owners to voluntarily change land use, zoning or a combination of the two to improve compatibility in an area targeted for stabilization. Infrastructure efforts will include:
• An assessment of water, wastewater, streets and sidewalks to determine needed capital improvements in residential areas; and,
• Design and construction of multi-modal commercial corridors to re-establish neighborhood main streets.
• The city will prioritize grant writing and capital improvement investment in areas where current zoning is consistent with the Preferred Growth Scenario.
• Leverage Neighborhood Planning to encourage property owners to voluntarily change land use, zoning or a combination of the two to improve compatibility in an area targeted for stabilization. Neighborhood planning efforts will include:
• A detailed assessment of individual properties within areas targeted for stabilization to determine property ownership, current use, viability for alternative uses, etc., as well as outreach to identified property owners.
• Demographic analysis of neighborhood areas to assess need.
• Development of Neighborhood Plans will be prioritized for areas that have a high percentage of non-compatible properties in residential use.
Long-Term:
• Adjust the uses allowed in each zoning district to minimize incompatibilities, primarily removing residential from more intensive commercial districts
• Rezone remaining incompatible properties once a high percentage of properties within an area targeted for stabilization have changed land use and/or zoning to improve compatibility
Land Use Scenario Analysis
For the land use scenario analysis, we utilized urban footprint, a software tool used to forecast scenarios and outcomes for communities and cities. The tool allowed us to analyze population, housing, and employment growth based on different alternative scenarios. The process consisted of the following scenarios, which will be discussed in more detail:
• Base Scenario
• Capacity Scenario
• Alternative Scenario
• Areas of Change Overlay
• Undeveloped Land
• Preferred Scenario: Complete Neighborhoods
Base Scenario
To develop a base scenario, we translated each existing zoning designation to a specific “Place Type”. Since Amarillo’s existing zoning is hierarchal, we based the translation on the land use on the ground today, what has been developed nearby, what development has been recently approved, or the general development trends. This allowed us to visualize the existing zoning and current conditions through the mapped Place Types. This gave us a solid understating of existing development patterns.
The place type translation showed a large concentration of manufacturing logistic districts in the eastern portion of the city and surrounding downtown to the east, north and west. We also saw that a typical development pattern in the southwest part of the city consisted of commercial uses at intersections with a park or open space embedded within the larger block unit. This pattern closely follows the guidance of the Neighborhood Unit Concept, which surfaced from previous comprehensive planning efforts. While this does create aesthetically pleasing neighborhoods, it has resulted in a trend where people have to drive to reach key destinations. Another prevalent development pattern that we noticed is the large concentration of commercial use along major corridors.
Capacity Scenario
Utilizing the base scenario as a starting point, we analyzed development growth potential for the city, which assumed that all parcels would be developed to their full entitled capacity. The results revealed the City has the capacity to accommodate a population of 451,542, 308,874 dwelling units, and 411, 692 jobs. These resulting numbers far exceed the actual calculated growth projections anticipated for the City of Amarillo by 2050.
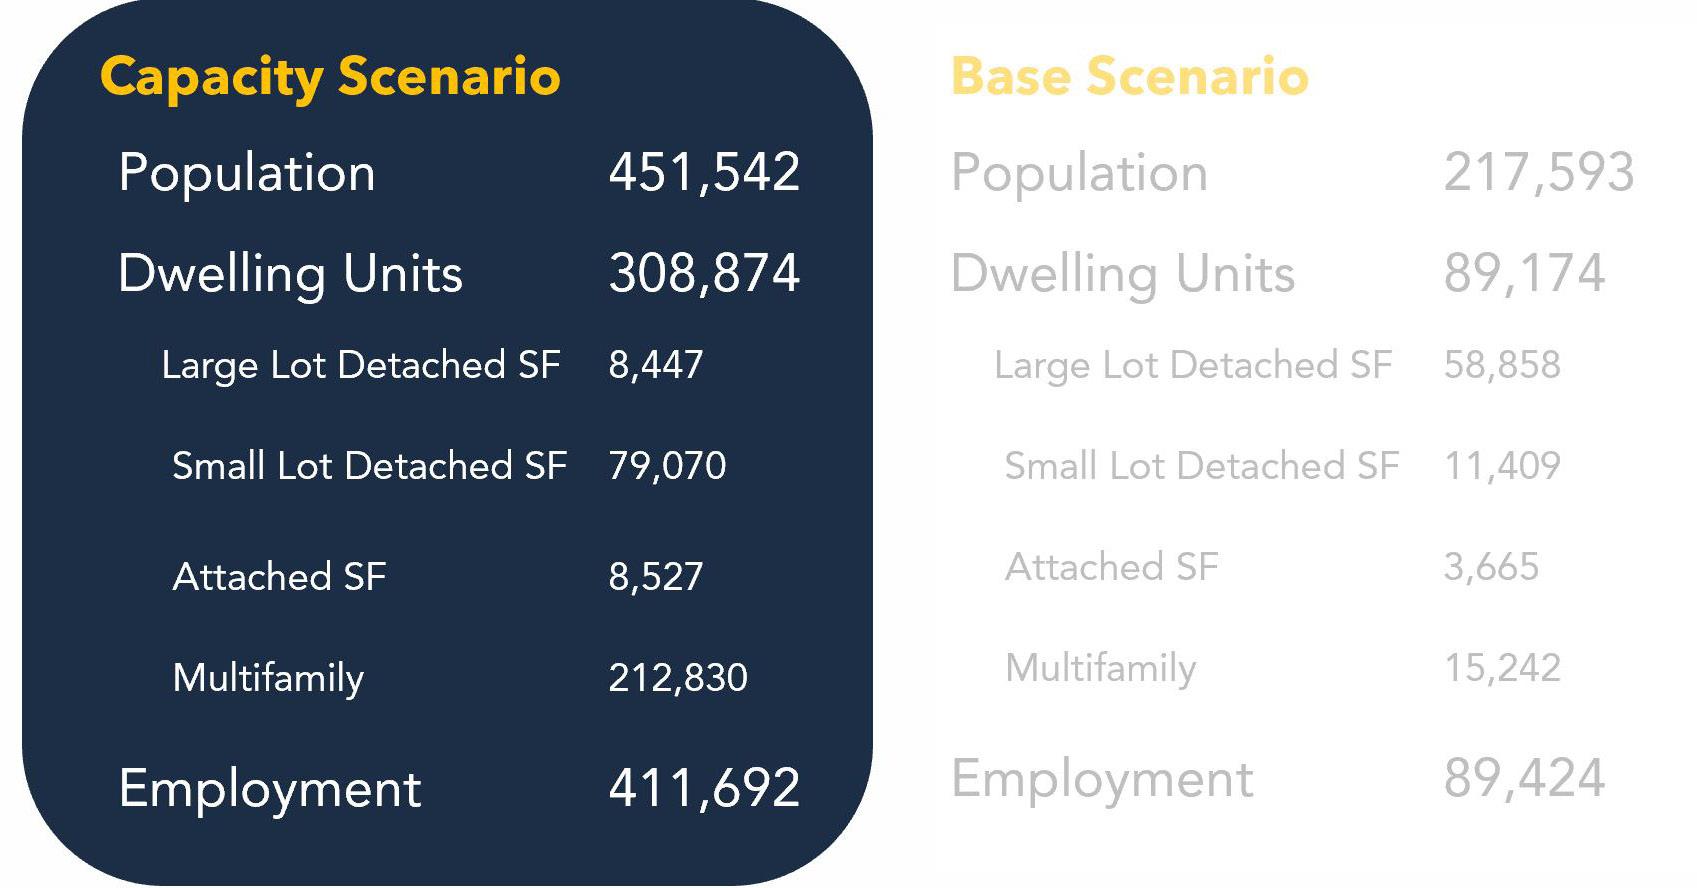
This ultimately showed us that the City is well equipped to manage projected future growth within the city limits. However, given that the calculated growth projections do not indicate a need for all parcels to develop to their full entitled capacity, we also looked at alternative scenarios.
Alternative Scenario - Areas of Change Overlay
Based on community feedback and conversation with the Steering Committee, we analyzed areas where new Place Types could be introduced to better accommodate and fit the preferred growth patterns for the Amarillo. The overlay largely incorporated Innovation, Neighborhood Mixed Use, and Neighborhood High and Neighborhood Medium Place Types.
Alternative Scenario - Undeveloped Land
In this scenario we began by looking at undeveloped land that is currently either agricultural or vacant - both within the City limits and within the ETJ. We focused our assessment of ETJ land to four areas in the north and west. What we found was that, in addition to large undeveloped parcels along the edges and outskirts of the city, there are also many smaller undeveloped parcels within and surrounding downtown.
When we analyzed Place Types for these isolated undeveloped parcels, we confirmed that those parcels could accommodate projected growth. It’s important to note that this analysis also assumed that all parcels would develop to their full entitled capacity. As mentioned before, it’s unlikely that all parcels will develop to their maximum capacity. The table below and map on the following page illustrate the various capacities identified in this scenario.
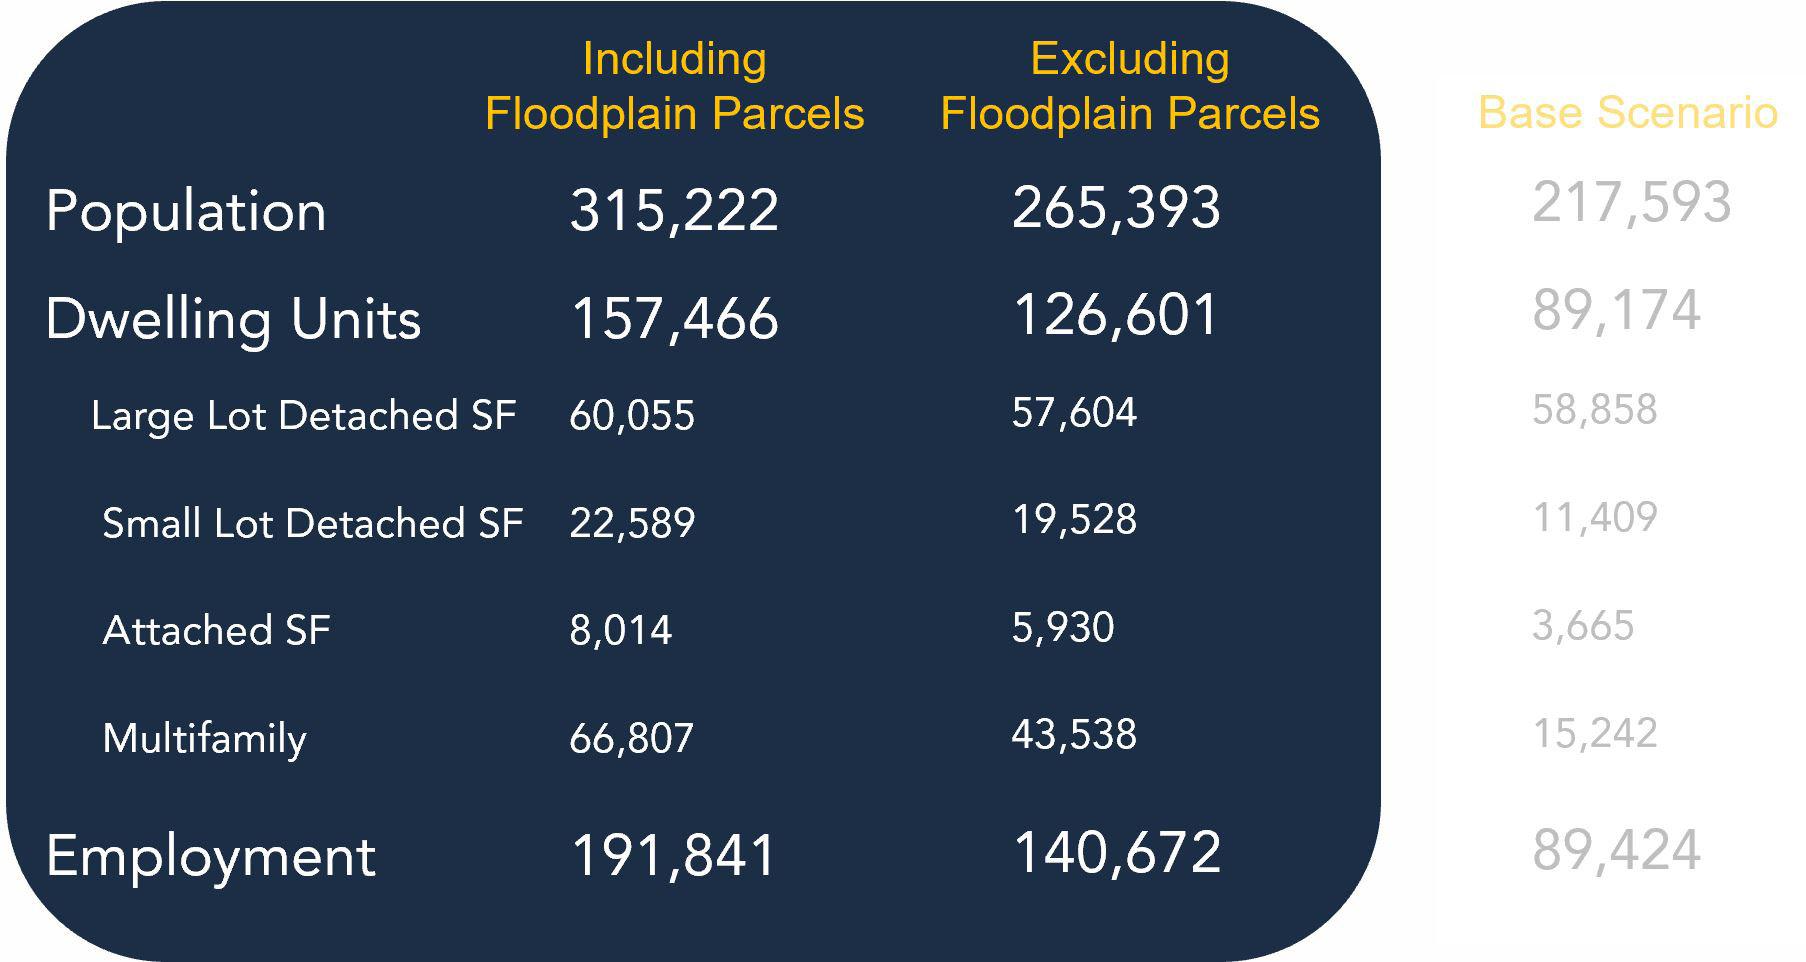
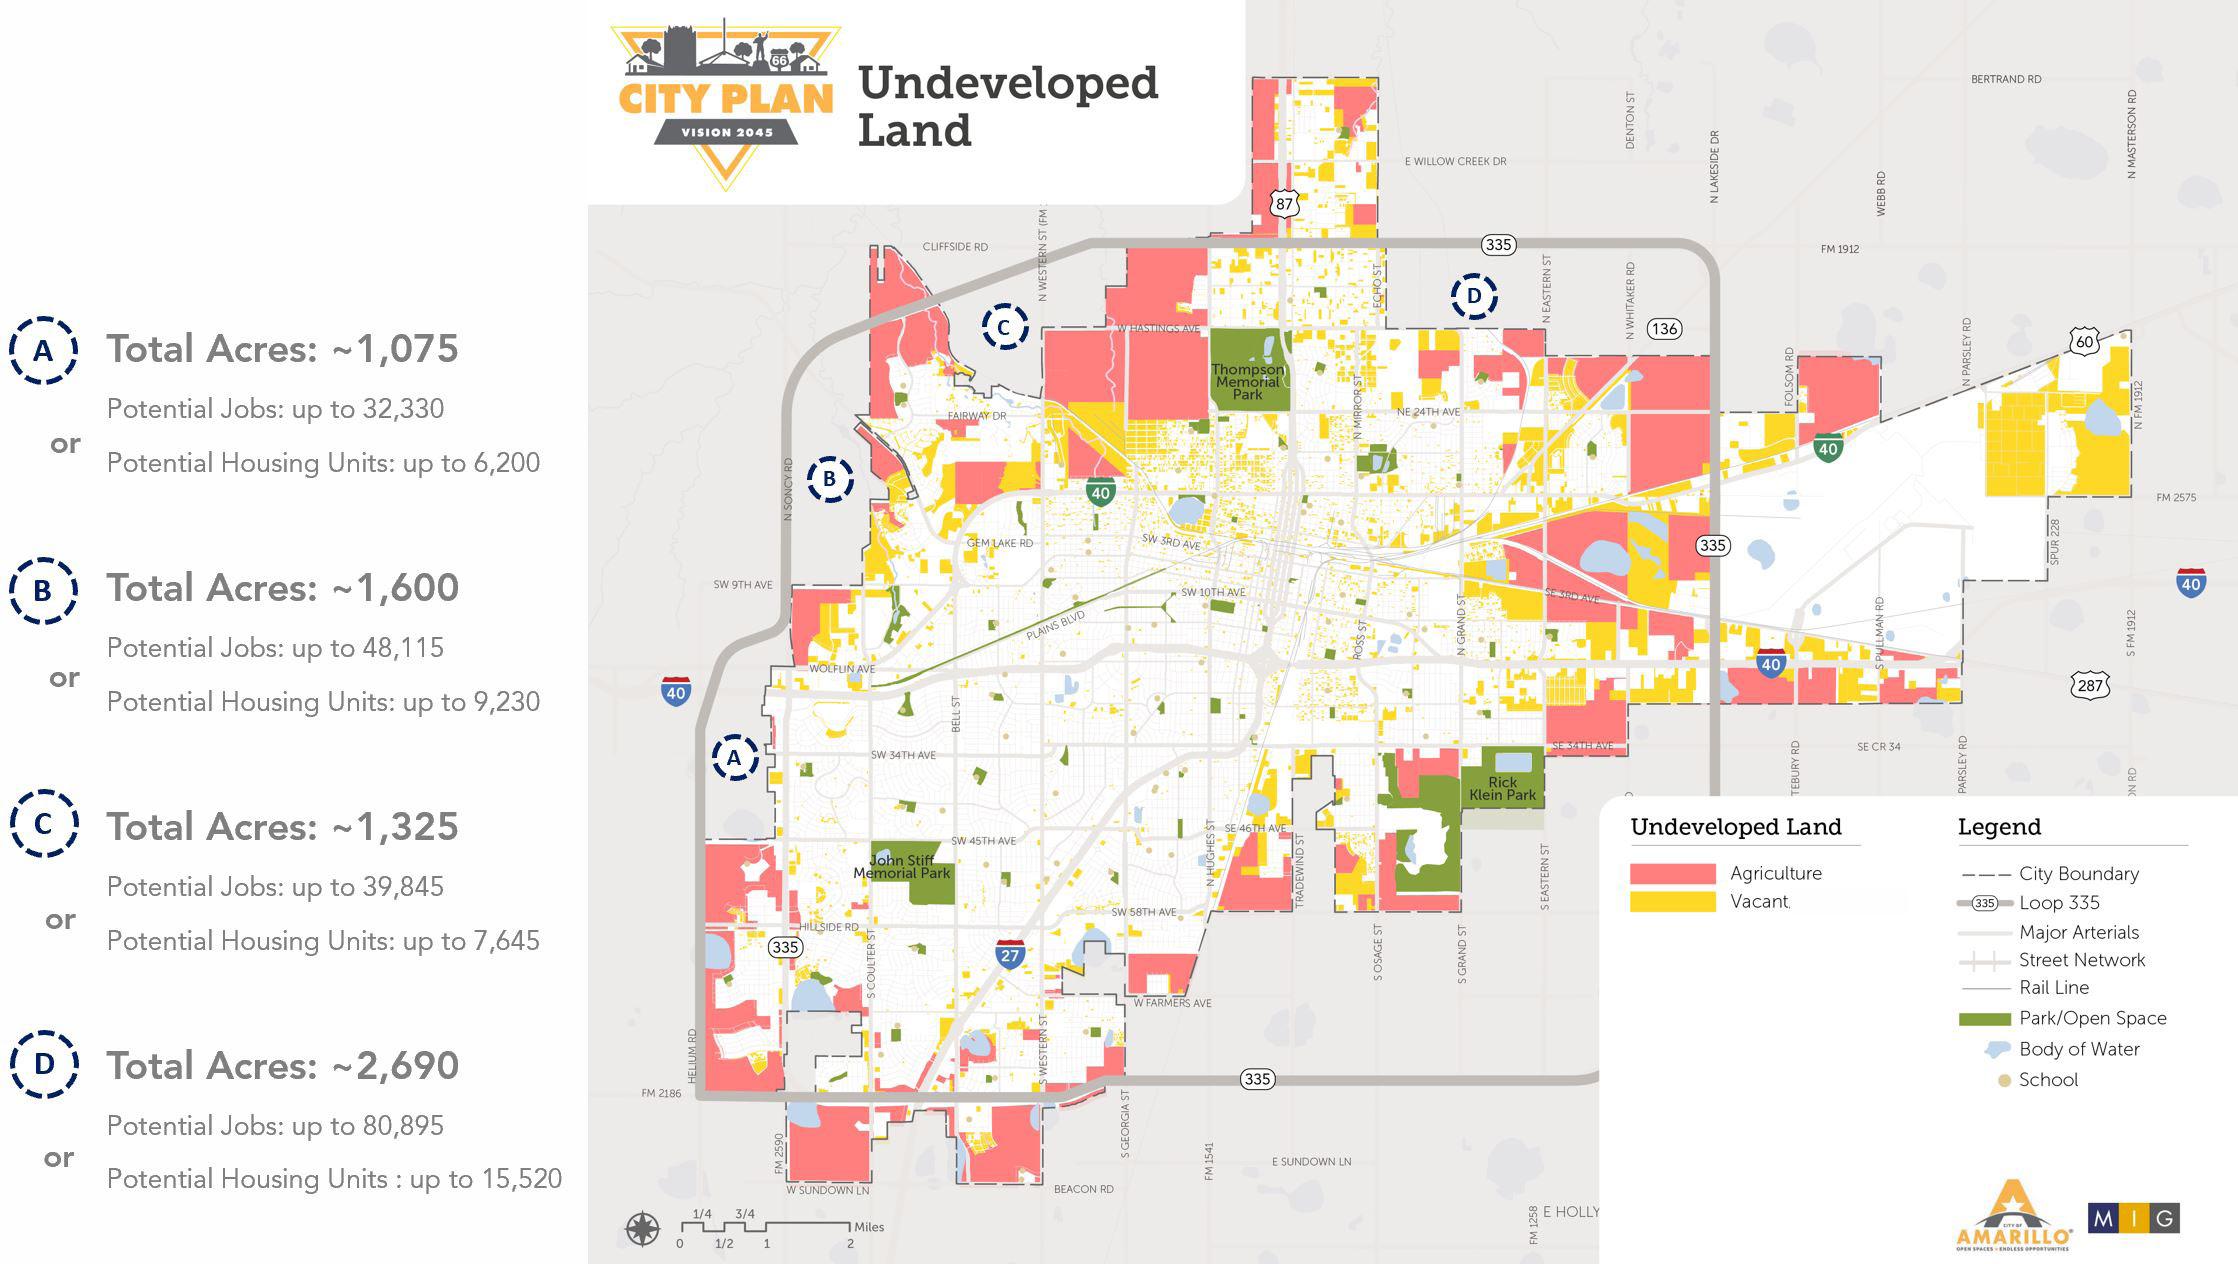
Preferred Scenario - Complete Neighborhoods
This scenario is based on community feedback that was received throughout the planning process as well as lessons learned through the development of prior scenarios. The community clearly let us know that they would like to have more amenities closer to their homes and to ensure that existing neighborhoods are protected, enhanced, and equitably invested in. The general sentiment we received from the community was that they wanted to support existing communities before adding new development at the City’s periphery. This means taking care of existing infrastructure, enhancing available amenities, and promoting new opportunities within already developed areas.
During the process of translating these priorities into a preferred scenario, three existing development patterns surfaced:
• Development Patterns for Older Neighborhoods
• Development Patterns for Existing Newer Neighborhoods
• Development Patterns for New Neighborhoods
Thinking about how each of these development patterns could be enhanced to achieve the community’s stated desires, we tweaked and applied the new Place Types (Areas of Change Scenario) to specific locations throughout the city. The map on the right illustrates those locations, which are mostly concentrated at intersections or along major arterials and highways and around the downtown area.
We confirmed that the Complete Neighborhood scenario could accommodate the projected growth. In fact, we found that it could accommodate more than the projected demand. This scenario has the potential to hold a population of 325,202, increase dwelling units by 168,342, and provide 113,620 jobs. The table to the right provides a summary of these findings.
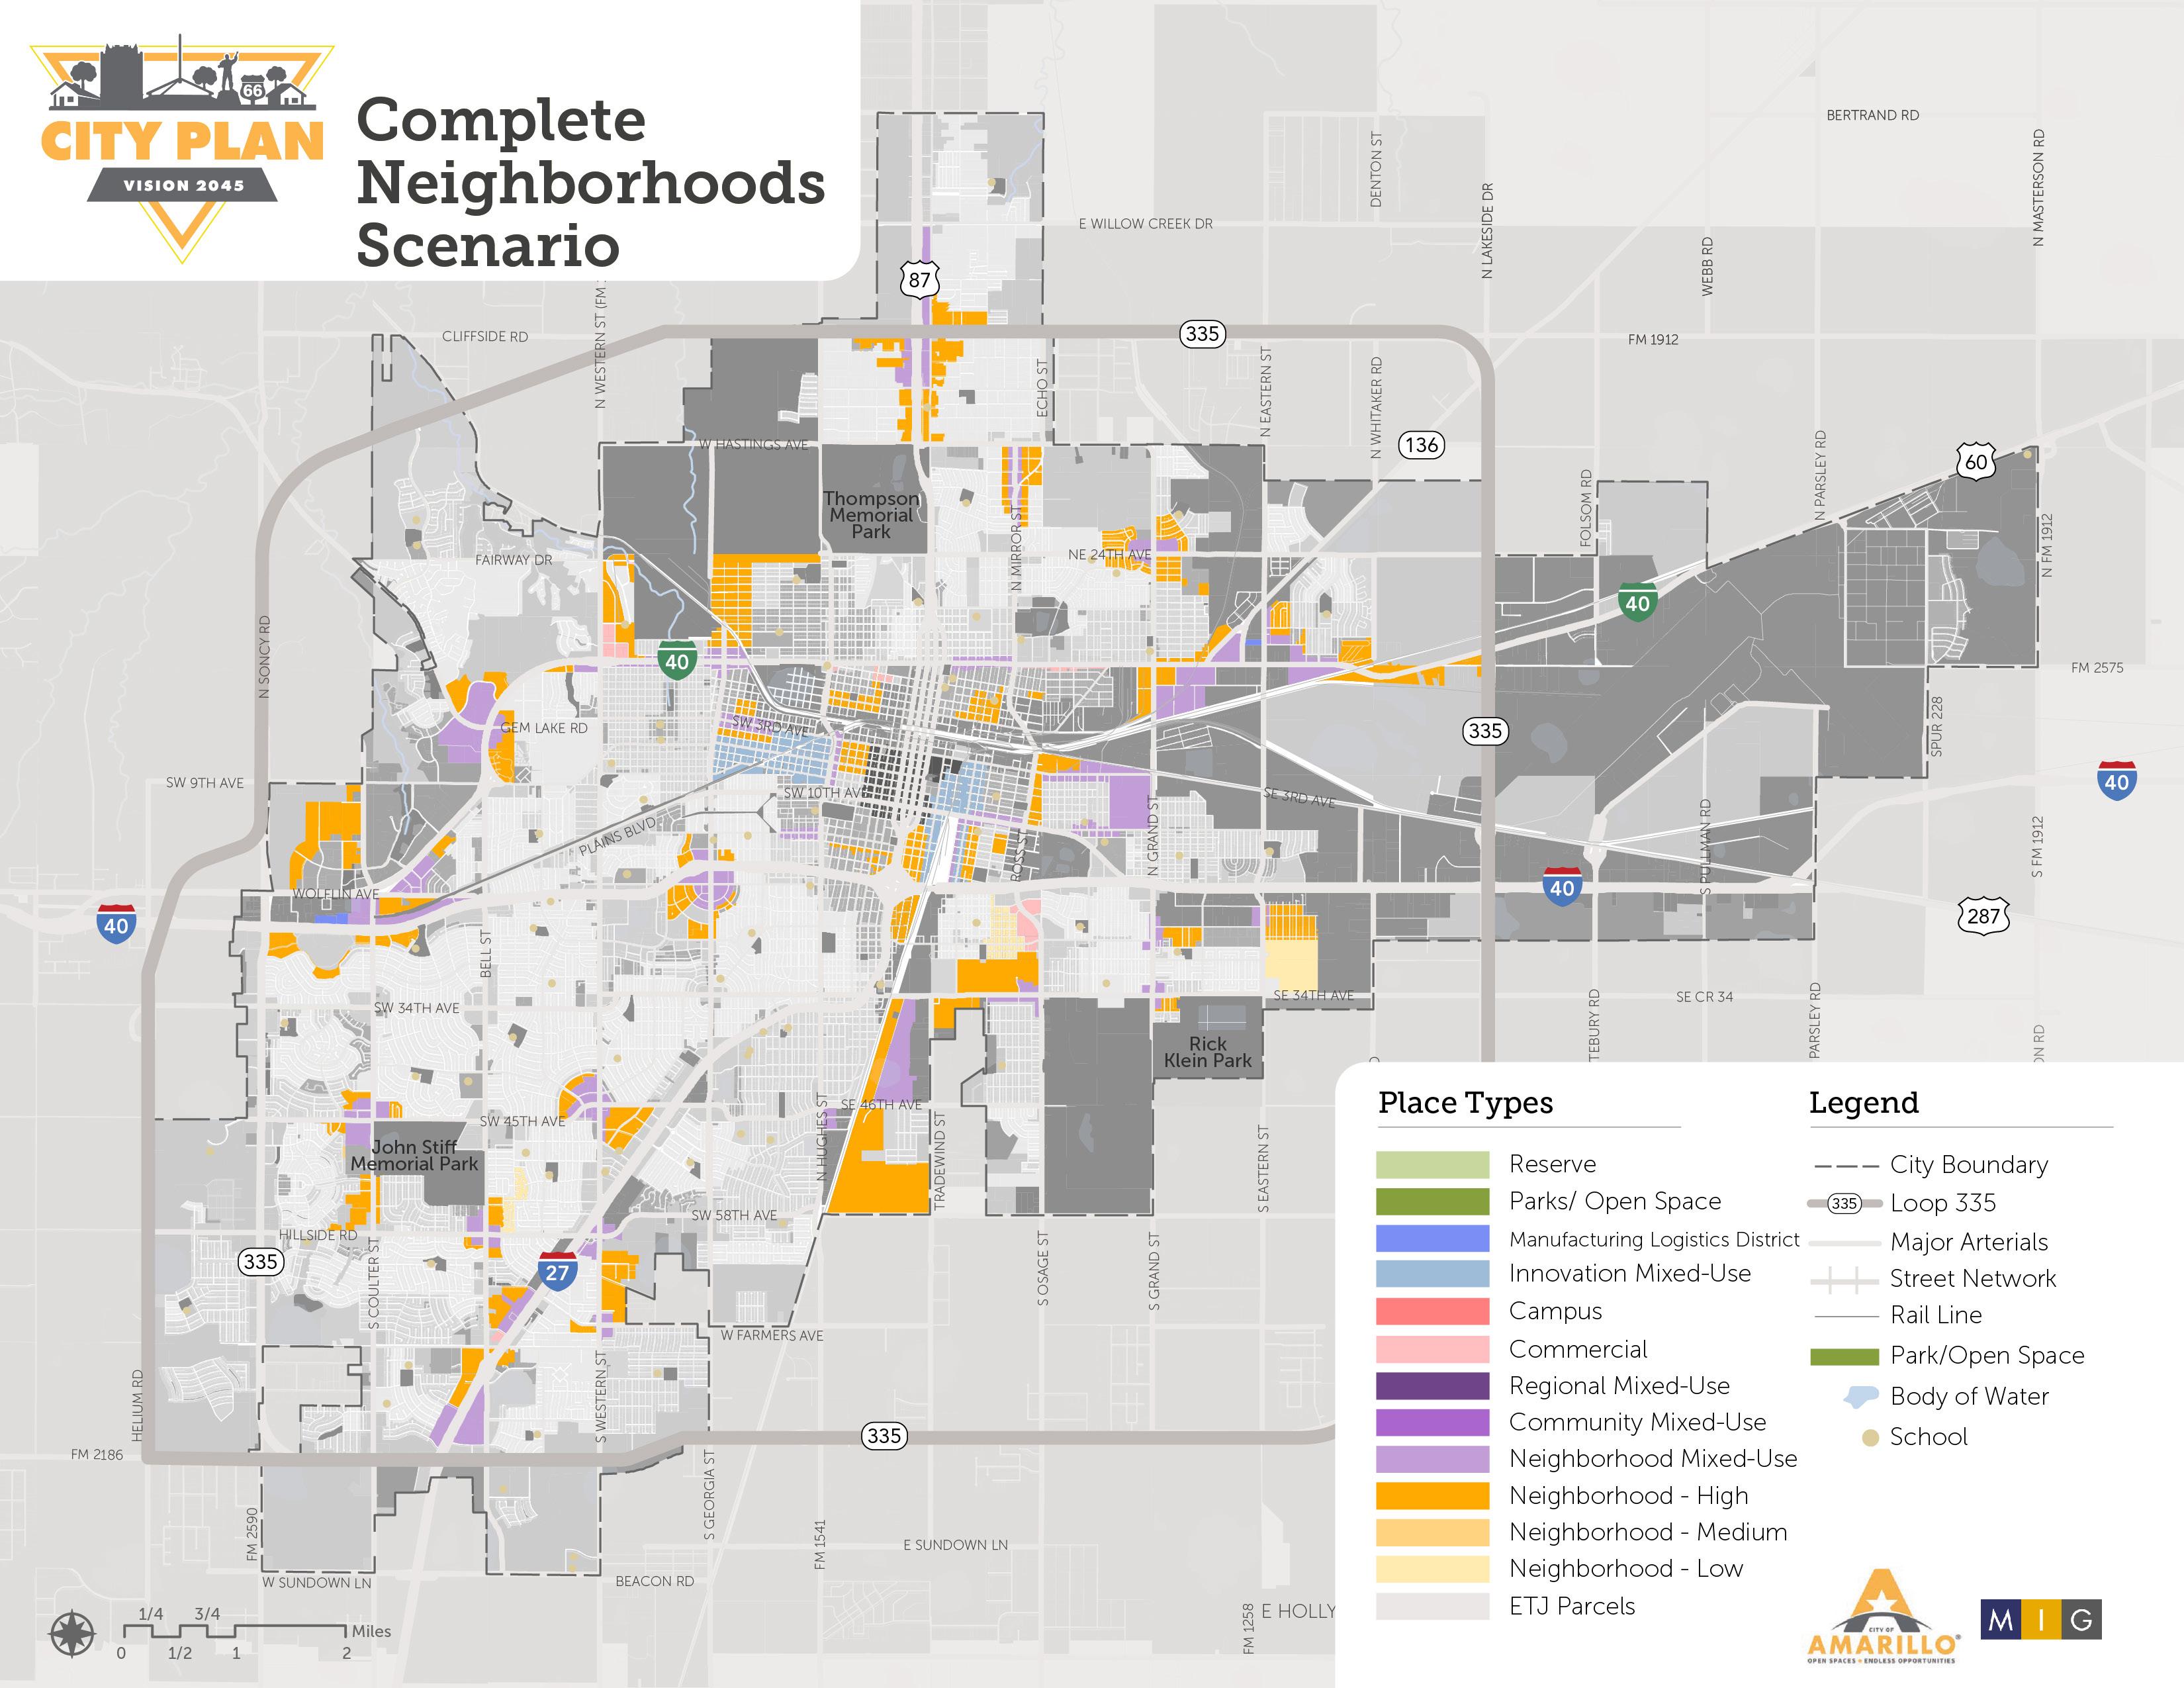
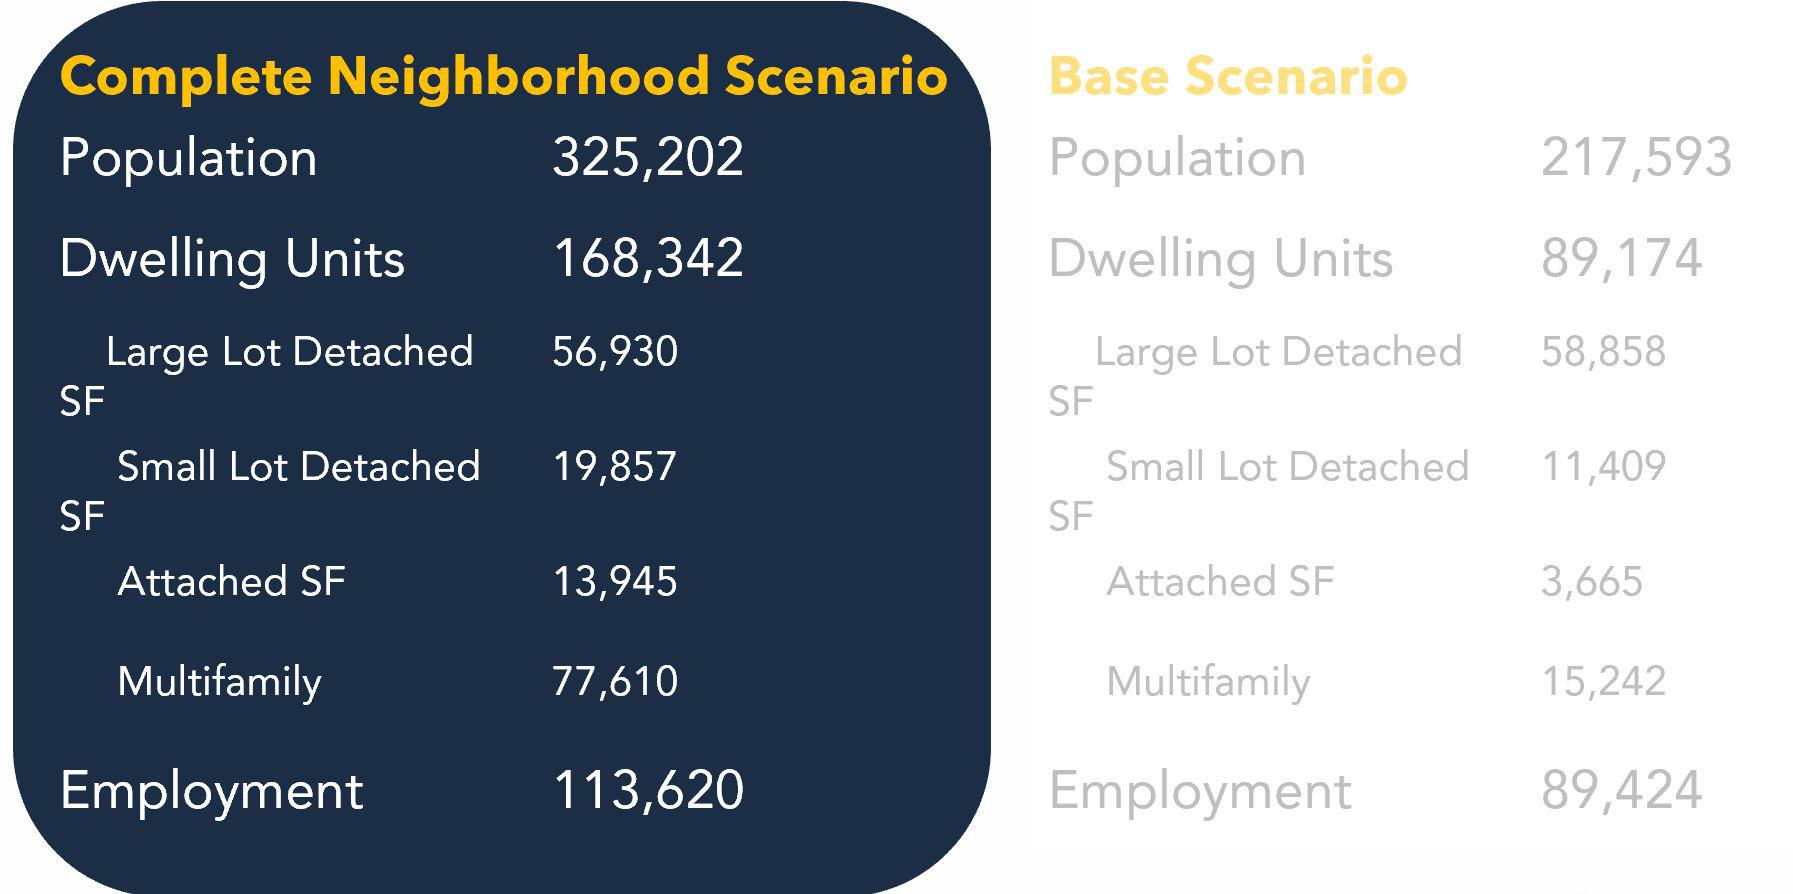

Amarillo City Plan
Prepared for: City of Amarillo; MIG, Inc.
Prepared by: Economic & Planning Systems, Inc.
EPS #223012 June 24, 2024


Introduction and Summary of Findings
Introduction
The City of Amarillo was interested in understanding the fiscal impact of future land use and development patterns as a component of their City Plan Comprehensive Plan process. Economic & Planning Systems (EPS) built a fiscal impact mode for the City of Amarillo The model was used to evaluate the land use scenarios developed for the plan. This report presents the findings of fiscal impact analysis In this report we:
• Summarize the methodology used in the models for each community
• Present the results of the fiscal impact analysis of the preferred growth scenario.
• Summarize policy implications and recommendations
EPS reviewed the major governmental and special revenue funds in the budget for Amarillo and assessed how they are affected by new development, land use changes, or patterns of growth. The major revenues and expenditures that are affected by new development and each major fund were identified, and the impacts of growth on these revenues and expenditures were modeled. EPS used the estimated growth of population, households, and jobs for the city developed for the Comprehensive Plan over the 2050 plan horizon as inputs into the model.
Two growth scenarios were used to estimate fiscal impacts on the City based on the Place Type designations within the preferred Complete Neighborhoods Future Place Type Map. The two scenarios are:
• Scenario A: Forecast Growth – This scenario uses the growth forecasts developed by EPS for the City through 2050 as inputs into the model with an allocation of future households and jobs to each Place Type based on a proportional share of vacant/underutilized land capacity in each Place Type and calibrations based on EPS’s growth forecasts
• Scenario B: Buildout Capacity – This scenario reflects the buildout of existing vacant and underutilized land in the City based on the Place Type Map.
Summary of Findings
The major findings from the fiscal impact analysis that were identified to guide Comprehensive Plan policy are summarized below. Findings specific to each entity are also summarized below.
1. The forecast growth through 2050 in the land use pattern identified in the Complete Neighborhoods Place Type map generates a net fiscal positive annual impact on the City.
The forecast growth in the City of Amarillo through 2050 is estimated to be 22,000 new residential units and 27,000 new jobs. This forecast growth was allocated to vacant and underutilized parcels based on the preferred Complete Neighborhoods Place Type map. The fiscal model estimates this growth scenario produces a small net fiscal positive impact annually on the city of $6.3 million, which equates to 2.7 percent of the City’s annual expenditures.
2. The land use pattern identified in the Complete Neighborhood Place Type map at buildout of current vacant and underutilized parcels also generates a net fiscal positive annual impact on the City.
The estimated development capacity in the City of Amarillo on currently vacant and underutilized parcels allows for 42,740 new residential units and 119,730 new jobs based on the uses and densities prescribed in the Comprehensive Plan. The fiscal model estimates this growth scenario also produces a small net fiscal positive impact annually on the city of $5.0 million, which equates to 2.1 percent of the City’s annual expenditures.
The fiscal impact analysis of the preferred land use plan within the comprehensive plan did not identify any major fiscal impact concerns and does not generate a net fiscal negative impact on the city. However, the analysis did identify several factors that impact fiscal health driven by land use policies that have been addressed within this plan and should continually be addressed in future plans and policy decisions.
Land Use Factors Impacting Fiscal Health
The land use pattern that is directed within the Comprehensive Plan will impact future fiscal health of the community. The two major factors that influence fiscal impacts are the location of development and the density of development.
• Location – Generally, greenfield development on the edge of the community will generate a greater fiscal impact primarily due to the creation of new infrastructure (e.g. new streets and new parks) needed to serve the development that becomes the responsibility of city to maintain. New buildings within already developed areas can more often rely on existing infrastructure and services and not expand the city’s network.
• Density – The density of development also impacts fiscal health. Denser development than the suburban, lower density housing found in many Amarillo neighborhoods is more beneficial to the city as more people can be served per mile of roadway or acre of park, for example. One major impact, however, from greater density can be generated when an area experiences a major shift in land use (e.g. industrial to residential) and/or a significant increase in density. Supporting denser development and redevelopment of lower density uses in existing portions of the city likely will also necessitate investment in upgrading or building new streets, sewer lines, and other amenities to support higher density development and more walkable land use patterns.
City Services Most Impacted by New Development
There are four major services provided by the City of Amarillo that were found to be most impacted by new developments. Specific considerations for these services are provided below.
• Street Maintenance – The City of Amarillo maintains a network of over 1,000 miles of streets and 11,000 streetlights. The ongoing maintenance of this infrastructure is a significant portion of annual costs to the city. Denser land use patterns that allow these streets and lights to serve more people per mile of road are more beneficial. An increase of the overall density of housing on the edges of the city, through a greater mixture of housing types, can support a more efficient land use pattern.
• Fire Service – The City of Amarillo serves the community using 13 fire stations spread throughout the city with fire apparatus that respond to over 22,000 calls for service per year. The location of new development relative to the location of existing fire stations is an important fiscal consideration. Two main factors drive the need for new fire stations and new fire apparatus. First is the response time to a call for service that is achievable. New development that is outside of the city’s target response times can drive the need for a new station and/or dilute the quality of service to existing areas. The city’s stations currently are well located to support future growth and the city has been investing in replacing aging stations in the central portions of the community to adjust to changing needs. The second consideration is the utilization of existing fire crews. If calls for service levels become too high in certain areas, then additional staffing and likely apparatus are needed to support growth in these areas. No major concerns were identified for existing areas of the city based on the proposed land use plan.
• Parks and Recreation – New residents added to the community will increase the needs for park and recreation services within the community. However, the city already maintains 55 parks and over 2,400 acres of parks. In many areas, there are adequate existing facilities and/or parkland to accommodate growth. Maintaining and reinvesting in these facilities becomes a greater
challenge in many areas. The city requires new developments to provide parkland to offset impacts on park needs from new developments. However, often the city does not need/want additional parkland to meet needs. Updating of the city’s approach to parkland dedication is needed to right size requests and needs.
• Water and Wastewater – The City of Amarillo operates a water and wastewater utility that provides services to property owners within the City. The city provides service to all property within the city and to areas outside the city limits when all standards and conditions are met and the cost to extend services is paid for by the applicant. The availability of water and sewer service is a major driver of where development can occur. The city should continue its policy of providing service to areas outside their city limits on a case-by-case basis with no guarantee of service unless explicitly granted. The City should also monitor and request seeking consent from the city for approval of any water or wastewater districts within the ETJ.
Public Funding/Financing Considerations
The policy of the city is to require that new development pay its own way by providing the infrastructure it needs to support development. However, being able to finance new development can be challenging in various areas of the city and support mechanisms are needed to allow for projects to pay for improvements over time or allow for the city to proactively invest in areas to spur development. Also, the city’s low tax rates require it to use creative and innovative strategies to maintain adequate levels of service and reinvest in the community. Specific policy directives are provided in the comprehensive plan calling for the use of public financing tools and strategies. Policies included:
• The use of value capture tools, such as Tax Increment Reinvestment Zones (TIRZ) and Public Improvement Districts (PIDs), to redirect investment into new growth areas.
• The continued use of innovative pilot investment tools and programs, such as the sidewalk cost-share pilot program, allows for the city to partner in reinvestment with property owners and private developers.

Fiscal Modeling Approach
The purpose of a fiscal impact analysis is to estimate the cost and revenue impacts from new development on annual operating budgets and departments in a variety of contexts. The analysis compares the estimated revenues generated by new development to the estimated costs of public services required to serve that development and determines the net fiscal impact (revenues minus expenditures).
Revenues and costs are estimated based on the budgets for each fund and department, and an assessment of potential effects of different types of development on each department or budget category. The revenue sources and expenditures that have the largest impact on the budget and are most directly tied to growth have a specific “case study” developed for them; these case study approaches use specific calculations to determine impact. For example, property tax is based on estimated assessed values multiplied by the applicable tax rates. Other items, such as administrative costs related to residential development, are based on average cost factors (such as “per capita” estimates)
The fiscal impact analysis is based on three main factors:
• Amount and Type of Growth: The amount of residential type (single family detached, single family attached, townhome, and multifamily) and employment type (highway commercial, local commercial, office/institutional, and industrial/distribution) based on forecasts of new jobs and households.
• Location of Growth: For this analysis, location was summarized by future land use. The difference in impacts by development patterns (e.g., number of acres designated, forecast growth, and location) between land uses was estimated. The analysis factored in differing costs related to the location of growth when impactful including presence of fire service, utilities, and the county the new development is located in
• Revenue and Cost: Based on current revenue and expenditure patterns, these are the anticipated revenues and expenditures that will be generated because of new development
Modeling Approach
Our approach to identifying the fiscal impacts based on the amount and type of growth in each scenario varies depending on the community and the governmental fund being analyzed. Through evaluation of the City of Amarillo, EPS developed the following approach to modeling fiscal impacts.
EPS identified the funds that are most directly impacted by new development and where a tangible connection could be made between land use decisions and the revenues and costs within that fund.
The Fiscal Impact Model (FIM) was developed for the Amarillo’s General Fund. For the General Fund, the major revenues and expenditure categories were modeled using either an average cost nexus factor or a specific analysis or “case study” for that revenue or expenditure. For revenues and expenditures that do not have a direct impact from new development or are minor in terms of their total dollar amount, the average cost factor approach is used. The approach used for each major source is described below in this report.
Average Cost Nexus Factors
EPS developed nexus factors that relate the budget item being estimated to the service population or other metric that is best associated with the impact. These factors are outlined below.
• Per Person (Residents) – This factor applies to total residents or population of the city or a given area (e.g., Place Type).
• Persons Served (Residents and Nonresident Employees) – Many services are affected by growth in both residents and employees. The purpose of this factor is to derive a population of persons served within a defined geography. The number of people each use generates is estimated using average person generation factor by use (e.g., average residents per household for single family and multifamily, and the average number of employees per square foot for retail, office, and industrial). Using the persons served approach means each new use will generate a number of people (i.e., one new single family housing unit will generate 2.5 people) which will be used to estimate costs and revenues based on the average cost per person. The persons served factor accounts for residents that are also employed in the city to not double count. The calculation of persons served equals residents plus nonresident employees (i.e., people employed in Amarillo but living outside the city).
• Per Household – This metric assigns the cost of services and revenues generated that are specific to new housing units being built regardless of the number of people living in the unit and/or there is no nexus to impact with nonresidential development.
• Per Unit Measure of Infrastructure – Impacts to the infrastructure networks and systems are sometimes estimated based on a unit measure of that type of infrastructure (e.g., “per centerline mile” or “per streetlight”) for portions of those fund’s expenditures related to maintenance and capital improvements. A new development’s impact will be judged based on the amount of new infrastructure needed to serve the development and the average cost per unit of measure.
Fixed and Variable Cost Adjustments
Directly applying the factors described above to new growth would be equivalent to using the average cost for each item, which can overstate cost impacts. For local governments, whose services are at or near capacity, the average cost method is a generally accepted technique for estimating fiscal impacts. However, many functions still need to be adjusted to account for higher levels of fixed cost and/or a less direct relation to growth. To account for this, “Percent Variable” adjustments were applied to average costs to more accurately capture the cost associated with growth and development. These adjustments range from 0 to 100 percent variability, depending on the category/type of revenue or cost.
A 0 percent variability factors implies that there is no relationship between the cost/revenue category and growth, while 100 percent variability implies a 1-to-1 relationship (i.e., the full cost/revenue increase is a result of growth). For all revenue and expenditure categories either a 0%, 25% or 100% variability factor was used. For example, a department that serves new development but also has significant administrative costs that are not directly related to growth may be modeled as 25 percent variable. In this case, if average cost factors are $20.00 per person, the model would apply a cost of $5.00 per person (applying the 25 percent variability) to population growth to calculate the cost of growth to this department.
The following process and assumptions were used in developing the “Percent Variable” adjustments to average costs.
• Direct Service Categories – These include departments that provide a service that is directly impacted by the rate and amount of new development in the city, such as police services These types of services are estimated to be closely related to growth and increased population and are modeled using the average cost methodology (where costs are 100 percent variable). For the most impactful and directly related expenditure categories, specific case studies are developed that utilize alternative Nexus Factors and/or variable cost assumptions. As previously stated, these case study approaches are outlined below.
• Indirect Cost Categories – Some expenditure categories/departments, such as the City Manager or Engagement and Innovation Services, have a high level of fixed costs regardless of the size of a city. Costs in these types of departments and functions are estimated to be 25 percent variable.
• Functions with No Nexus or Relevance – Some City functions were determined not to have any relationship to real estate development projects and have a 0 percent variability factor, which means they are not estimated or included in the model
Static Model Approach
For this analysis, EPS utilized a static approach to modeling future revenues and costs. This means that we did not use growth or escalation rates for revenues or costs, and estimated impacts in constant dollars. The static model approach is preferred for several reasons First, identifying reliable and accurate growth or escalation numbers for major revenue sources and expenditure items is difficult and may not accurately project likely future conditions. Second, variations in growth or escalations - even minor ones - can cause major differences in costs and revenues that may misrepresent fiscal impacts. Third, cities plan for the long term. Development that is built and at stabilized occupancy has long term fiscal impacts best modeled, in our opinion, in the static end state.

Amarillo General Fund Model
This chapter details the approach and results of modeling the fiscal impact of residential and nonresidential development on the General Fund for the City of Amarillo. It provides an overview of the components of the General Fund that are impacted by new development, outlines the approach to modeling the impact of growth, and reports on findings of the fiscal impact analysis.
A summary of the approach used for the City of Amarillo is provided in Figure 1 This figure identifies the major General Fund revenues and expenditures that were analyzed.
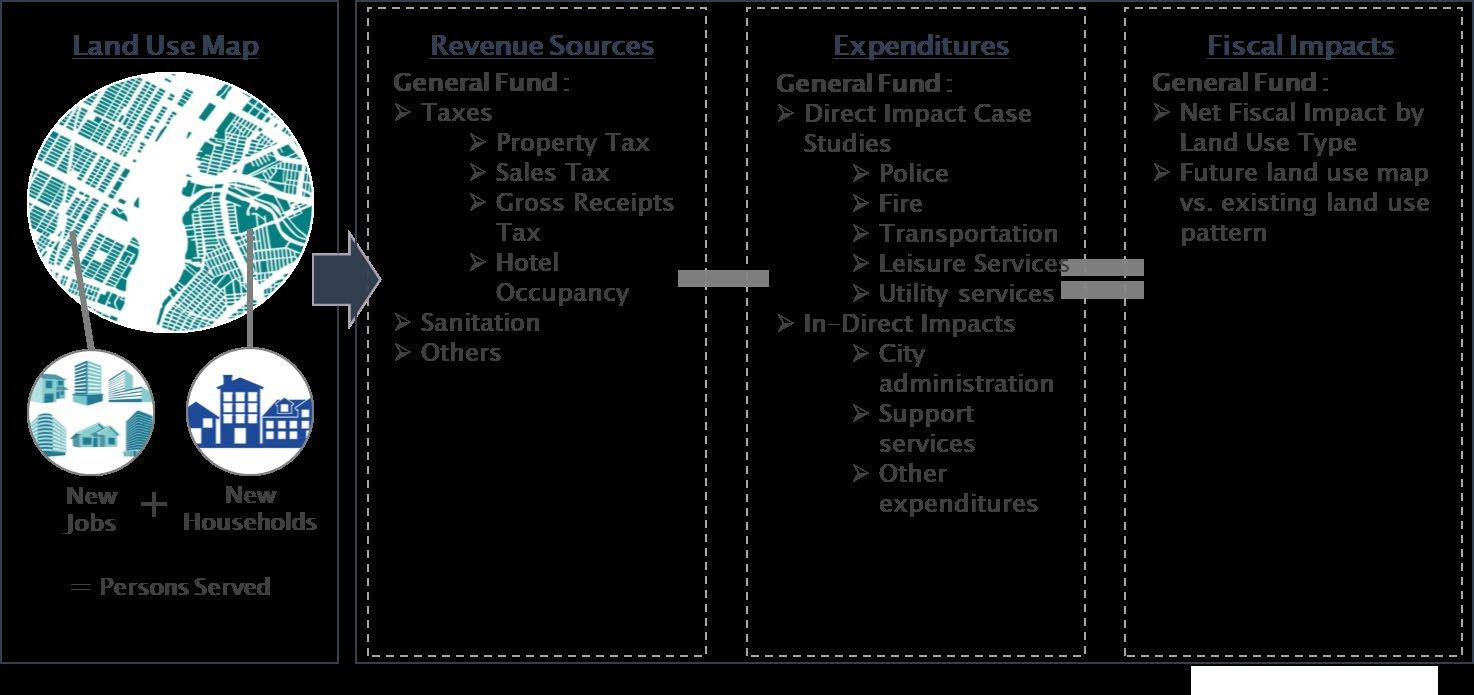
The City of Amarillo has an overall budget of $531 million for the 2023/2024 fiscal year. This budget contains 11 separate funds with the largest two funds being the General Fund, which is used for on-going operations of the city for most services, and the capital improvement projects fund. These two funds are the most directly impacted by land use policies and by the vision provided in this comprehensive plan.
The General Fund was the primary focus of the fiscal impact analysis given its direct tie to land use policy and its importance in fiscal health. The city’s General Fund budget for fiscal year 2023/2024 was $250.6 million.
Figure 1. City of Amarillo Fiscal Impact Model Approach Summary
Revenues
This section summarizes the major revenue sources for the General Fund and outlines the approach to modeling the fiscal impact of growth on each revenue source. There are five major categories of revenues within the General Fund and the percent of revenue per source is shown in Figure 2.
Taxes charged by the City of Amarillo generate the largest portion of General Fund revenues with sales tax and property tax being the biggest and accounting for 56% of General Fund Revenue.
Property Tax (current rate of $0.39195 per $100 of taxable value) accounts for 23% of General Fund revenue. Property tax collected by the city has two portions. A portion is used to fund on-going operations and maintenance while the remainder is dedicated to repaying debt issued as part of large capital improvement bond packages. Sales Tax (current rate of 2.0%) is the city’s largest revenue source and generates $77 million per year, accounting for 33% of General Fund Revenue.
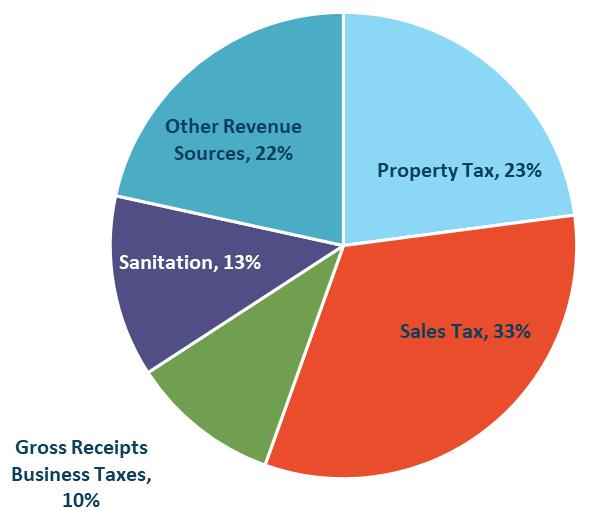
Property Tax
The per-unit property tax revenues generated are summarized in Table 1. As shown, single family detached residential uses generate the highest per-unit
Figure 2. City of Amarillo General Fund Revenues, FY 2023 Budget
annual revenue ($1,091 per unit). Commercial development uses generate the greatest amount of property tax on a square footage basis, at $0.61 per square foot, while industrial uses generate only $0.30. However, industrial uses tend to be larger, and thus may generate a similar amount of tax revenue on a perproperty basis.
Based on these tax generation factors, a growth scenario with more single-family detached housing will generate more property tax revenue, as this housing type has the highest property value and thus generates the highest level of property taxes. However, as the rest of the model will show, it is important to consider the costs to serve various types of growth as well to get a comprehensive picture of the net fiscal impact on the City of new development.
Source: Zillow; CoStar; Economic & Planning Systems
Sales Tax
EPS developed a retail sales flow model to estimate the portion of retail sales generated by residents, nonresident employees, and visitors. The retail sales flow model uses average household incomes and per employee spending factors to estimate the potential spending on retail goods generated by residents and workers in the city. The potential retail spending is distributed by retail store category based on the U.S. Census of Retail Trade (2017) for Texas. The retail spending expenditure potential was then compared to actual sales per store category (3- and 4-digit retail trade NAICS categories) to determine what portion of sales the City of Amarillo captures from residents, nonresident workers, and visitors EPS estimates that Amarillo residents account for 70 percent of sales made in the city. Nonresident workers account for approximately 6 percent, and visitors to the community contribute 24 percent.
Table 1. City of Amarillo Property Tax Revenue per Unit
EPS estimated annual retail spending per resident and per nonresident employee/ worker using the retail sales flow model. The City’s 2.0 percent sales tax rate was then applied to the sales per category to estimate the amount of sales tax revenue an average person or nonresident worker will generate annually. Each new resident is estimated to generate $193 in annual sales tax from retail spending and each new nonresident worker is estimated to generate $63 in annual sales tax revenue, as shown Table 2
Source: Economic & Planning Systems
Table 2. City of Amarillo Resident and Employee Retail Sales Factors
Other General Fund Revenues
Property and sales taxes generate 55 percent of the City’s General Fund revenue. The other revenue sources are important but not as significant to fiscal health. Other revenue sources for the General Fund are:
• Franchise Fees
• Hotel Occupancy Tax
• Sanitation
• Cultural and Recreation Revenue
The modeling approach and factors for each revenue source are shown in Table 3 EPS estimates that each new resident or nonresident employee in the city generates $539 in General Fund revenue annually (in addition to property tax).
$9,074,326
Source: City of Amarillo Proposed Budget Book FY 2023; Economic & Planning Systems Z:\Shared\Projects\DEN\223012-Amarillo TX Comprehensive Plan\Models\[223012-FIM_5-17-24.xlsm]GF - Rev
Table 3. City of Amarillo Other General
Expenditures
This section summarizes the major expenditure sources for the City of Amarillo’s General Fund, outlines the approach to modeling the fiscal impact of growth on each expenditure source, and reports the results of the fiscal impact modeling.
There are seven major categories of expenditures within the General Fund, as shown in Figure 3. Public Safety departments (police and fire) account for the majority of the City’s annual General Fund expenditures (40 percent in 2023 or $96 million). Support services is the third largest expenditure category, at $40.6 million or 17 percent of General Fund expenditures. Other large expenditure categories include (in terms of dollars) are leisure services (e.g. parks, 11 percent), transportation (9 percent), and utility services (9%).
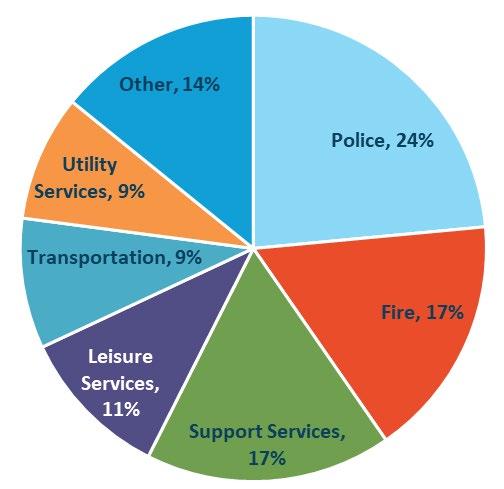
Figure 3. City of Amarillo General Fund Expenditures, FY 2023 Budget
Table 4 provides a summary of the modeling approach used for each major expenditure category. Case studies were developed for three categories and are described below in more detail. An average cost factor with a corresponding variability estimate were used to estimate annual expenditures for the remaining categories. The expected annual expenditures per each new resident or nonresident employee is $307 not including fire, police, and transportation costs
Source: City of Amarillo Proposed Budget Book FY 2023; Economic & Planning Systems Z:\Shared\Projects\DEN\223012-Amarillo TX Comprehensive Plan\Models\[223012-FIM_5-17-24.xlsm]GF - Exp Factors
Table 4. Amarillo General Fund Expenditures – Nexus to Growth and Variability
Police
The Amarillo Police Department has an annual budget of $58.5 million. Most of this budget (89 percent) is for police services that is primarily made up of the cost of personnel. The City has 376 officers and 78 civilian employees providing police services to the community. New development has the biggest impact on the need for patrol officers and investigation-related staff. Generally, as the community grows, the need for additional patrol officers grows as well, with annual calls for service typically used as the measure for the need for personnel.
Given the service characteristics of the Police Department and the impact of growth on service needs, an officer needed per 1,000 persons served factor was developed to incorporate the impacts of increased demand for service from both new residents and new employees/businesses in the city. For the purposes of modeling the impacts of growth on service needs and cost to provide service, expenditure categories for the department are modeled at a 100% variability rate. For every 1,000 new residents or nonresident employees the city generates a demand for 1.38 officers and .29 civilian employees. The annual cost for staffing is estimated to be $199,369 per 1,000 new residents or nonresident employees, as shown in Table 5
Table 5.Amarillo Police Department Cost Allocation Method and Factors
Source: City of Amarillo; Economic & Planning Systems
Z:\Shared\Projects\DEN\223012-Amarillo TX Comprehensive Plan\Models\[223012-FIM_6-24-24.xlsm]CS - E - Police Growth Factors
Fire and Emergency Services
The Amarillo Fire Department has an annual budget of $41 million. Most of this budget (92%) is used for personnel costs, similar to the Police Department. The department uses 13 fire stations (note fire station 14 is under construction) spread throughout the community to provide services. In total, the department has 298 uniformed, full-time firefighters with an additional 5 firefighters added through the 2023 budget. In addition, the department has 10 full-time civilian positions and 1 part-time position. The Fire Department was estimated to have 24,000 calls for service in the 2023 budget.
The Amarillo Fire Department is required to meet certain “level of service” standards, based on call response time, to provide needed services to the
community and maintain insurance ratings. These standards influence station location decisions. Call volume is not uniform across stations, but instead station location is dependent on the surrounding population and employment density, and the ability of the apparatus at that station to respond within the given level of service standard. Because of this nature of service, the impact of new development on Amarillo Fire varies depending on the location and type of growth, which impacts firefighter utilization.
Each fire station has a service area, which is most often defined by the response time of a fire engine from the station. New development that is outside of existing fire service areas for existing fire stations can create significant impacts on response times and often triggers the need for new station and associated fire personnel and capital equipment.
The department strives for a four-minute fire call drive time and an estimated 45 percent of calls achieve this target time. The fire response time potential varies by station but generally a fire engine can cover two miles of a four-minute drive time. Buffers around each fire station were developed that estimate the area that can be reached within a four-minute drive time, shown in Figure 4. In terms of coverage based on drive time, the city has good coverage of urbanized areas within each station’s drive time sheds. However, drive time is not the only factor that is considered in terms of fire station needs and capacity. For example, station 14 that is under-construction is located in the northwest portion of the city and will have a drive time shed that overlaps with other stations, but the need for this station is drive more by utilization of overlapping stations. This is true for stations 8 and 9, which are two of the busiest stations and have drive sheds that overlap with the new fire station.
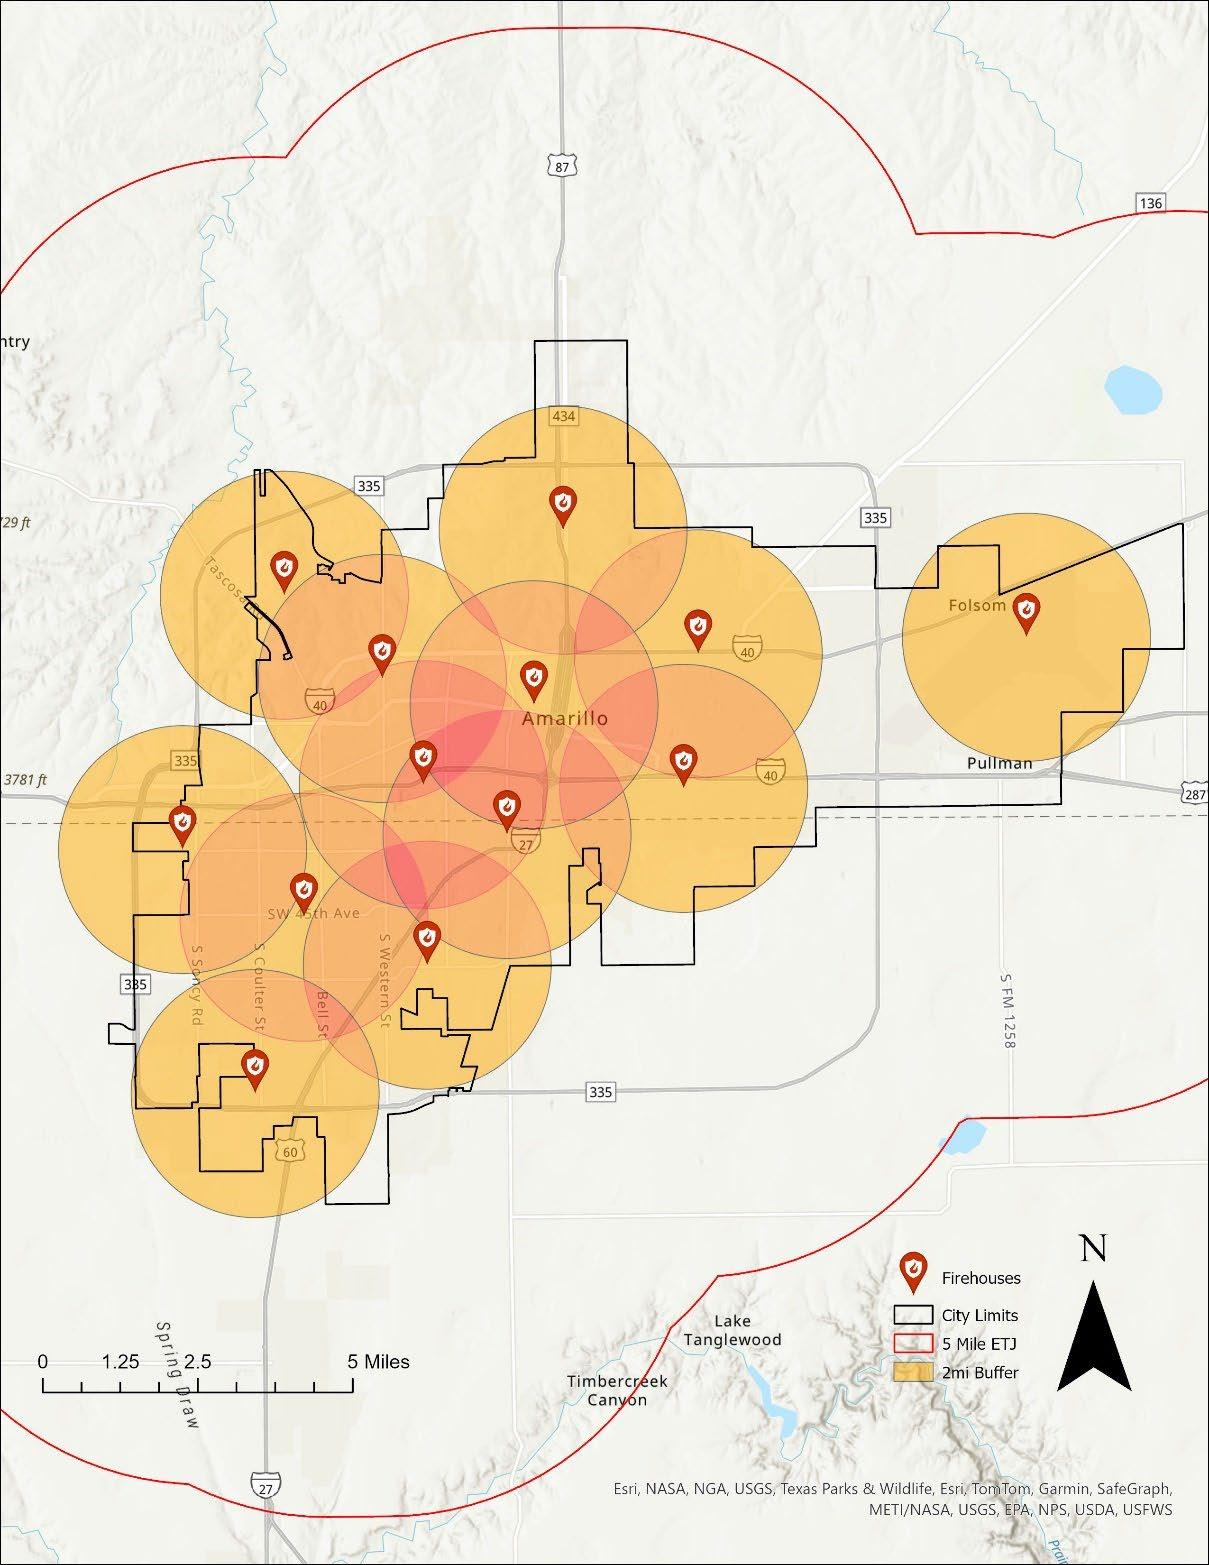
EPS estimated the annual increase in expenditures for fire service generated by a new resident or non-resident worker. Factors for the number of firefighters and administrative staff per 1,000 persons served were developed based on the existing staffing levels and total persons served in the city. These cost factors are applied to new development based on the location of the new development. A new resident or nonresident worker generated by development in existing fire
Figure 4 Amarillo Fire Station 4 Minute Drive Time
service buffers will have an annual cost of service of $151,168 per 1,000 persons served ($151.17 per person served), as shown in Table 6
The annexation of land outside of existing fire station service areas may generate increased costs and impacts on utilization of nearby fire stations which will result in higher cost per person served in these areas. Some of the target growth areas identified in the Comprehensive Plan may impact service for existing stations and could necessitate additional stations and/or apparatus. Specifically, growth areas in the south (along Tradewind St and Highway 335) and on the eastern edge of the city (along I-40) are in areas that are on the edge of existing fire service drive sheds or outside of existing drive sheds.
Table 6. Amarillo Fire Cost Allocation Method and Factors
Source: City of Amarillo; Economic & Planning Systems
Growth Factors
Transportation
Transportation services provided by the City of Amarillo includes the streets department, traffic administration, and transit services. Combined these departments have a budget of $19.4 million. The street department is responsible for maintenance of the streets in the city including annual, on-going pavement maintenance. The City currently maintains 981 miles of paved streets. Traffic administration is responsible for roadway operations including operating and maintaining the City’s inventory of traffic signals and intersections. The city has 389 signalized intersections. Lastly, the city provides transit services (i.e. bus service) to the community.
As shown in Table 7, costs associated with new growth were calculated in three ways. Transit service expenses are estimated on a person resident basis The street department costs are estimated based on the cost per lane mile maintained in the city. Lastly, traffic administration is estimated based on the cost per signalized intersection.
Table 7.Amarillo Transportation Cost Allocation Method and Factors
$19,368,451
Source: City of Amarillo; Economic & Planning Systems Z:\Shared\Projects\DEN\223012-Amarillo TX Comprehensive Plan\Models\[223012-FIM_6-24-24.xlsm]CS - E -Transportation
The demand for traffic signals and paved lane miles was estimated based on the existing presence of signalized intersections and lane miles in the city within developed areas in each Place Types. The number of new lane miles and signalized intersections were estimated based on factor for each Place Type. The forecast growth in the city over the plan horizon is estimated to generate demand for 284 new lane miles and 117 new signalized intersections.
Source: Economic & Planning Systems
Table 8.Amarillo Public Works Scenario Evaluation Findings

Fiscal Impact Inputs and Results
This chapter provides a summary of the development/growth inputs used to model both scenarios. In addition, the net fiscal impacts of each scenario and development in each Place Type are summarized.
Development Inputs
EPS developed a land demand forecast for both housing and employment uses in the community over the plan horizon (2023 to 2050). This analysis allocated forecast new jobs and households between four different housing product types and four employment development types. The number of new households and jobs within these development types were distributed among the future Place type categories based on the land use intent of each category.
Two scenarios were used to illustrate variable impacts of the Place Type map as described previously The two scenarios represent varying amounts of new jobs and households in each Place Type category as the City has more capacity for growth than is forecast to occur by 2050. EPS estimated that there will be demand in the City of Amarillo for 22,000 new housing units by 2050 and 27,000 jobs Table 10 provides a summary of the allocation of these new housing units and nonresidential development for each scenario. Table 9 provides a summary of the allocation of the new housing units and jobs by Place Type for each scenario.
Source: Economic & Planning Systems
Z:\Shared\Projects\DEN\223012-Amarillo TX Comprehensive Plan\Models\[223012-FIM_6-24-24.xlsm]Development Estimates
Table 9.Housing Unit and Job Allocation by Place Type
Table 10 Scenario Growth Allocations by Development Type
Source: Economic & Planning Systems
Z:\Shared\Projects\DEN\223012-Amarillo TX Comprehensive Plan\Models\[223012-FIM_6-24-24.xlsm]Growth by Build
Growth Scenarios Net Fiscal Impacts
EPS compared the estimated annual revenues generated in each scenario to the estimated annual expenditures to estimate the net fiscal impact on the City’s General Fund. Table 11 provides a summary of the results of the evaluation. The Forecast Growth scenario results in a net positive impact on the General Fund of $6.3 million annually, which equates to 2.7 percent of the City’s total expenditures. The Buildout Capacity scenario also has a net positive impact on the General Fund but less than the Forecast Growth scenario. The Buildout Capacity scenario has a net positive fiscal impact is $5.0 million
Amarillo Emergncy Communications Center
Development Services
Emergency Management
Persons Served (PS)
57,927$5$307,656136,270$5$723,746
(PS) 57,927$0$28,624136,270$0$67,337
Persons Served (PS) 57,927$38$2,187,994136,270$38$5,147,152
Persons Served (PS)
$8,756,675
$20,599,663
Amarillo
Fiscal Impact Model
Z:\Shared\Projects\DEN\223012-Amarillo TX Comprehensive Plan\Models\[223012-FIM_6-24-24.xlsm]Development Estimates
Source: Economic & Planning Systems Z:\Shared\Projects\DEN\223012-Amarillo TX Comprehensive Plan\Models\[223012-FIM_6-24-24.xlsm]Growth by Building
Table 4
Nexus to Growth Factors
Amarillo Comprehensive Plan Fiscal Impact Analysis
Park Acreage
Lane Miles
Signalized Intersections
A more specific or
2,403 Park Acreage Maintained by City of Amarillo
981 Lane miles maintained by the City of Amarillo
389 Signalized intersections maintained by the City of Amarillo No revenue or expenditure No Nexus --- No quantifiable nexus to growth
Source: Economic & Planning Systems
Z:\Shared\Projects\DEN\223012-Amarillo TX Comprehensive Plan\Models\[223012-FIM_6-24-24.xlsm]Nexus to Growth
of a
Source: City of Amarillo Proposed Budget Book FY 2023; Economic & Planning Systems
Source: City of Amarillo Proposed Budget Book FY 2023; Economic & Planning Systems
Source: Economic & Planning Systems
Source: Zillow; CoStar; Economic & Planning Systems
Z:\Shared\Projects\DEN\223012-Amarillo TX Comprehensive Plan\Models\[223012-FIM_6-24-24.xlsm]CS - R - Property Tax
Source: City of Amarillo; Economic & Planning Systems
Table 13 Appendix: Lane Miles and Signals Demand Factors
Amarillo Comprehensive Plan Fiscal Impact Analysis
Source: Economic & Planning Systems
Source: Economic & Planning Systems
Source: Zillow; CoStar; Economic & Planning Systems
Source: Economic & Planning Systems
Shopper's Goods
Source: US Census of Retail Trade; Economic & Planning Systems
City of Amarillo Residents

2024 TAMI Award
Communications Planning
Diversity, Equity & Inclusion
Outreach/Campaign
ABOUT CITY PLAN
City Plan — Vision 2045 (Comprehensive Plan) is a groundbreaking, community-driven initiative, a long-term strategic framework sculpted to foster equitable growth, elevate the quality of life, and guide investments in Amarillo over the next two decades. It comprehensively addresses key facets of city life — businesses, homes, sidewalks, and parks — aligning closely with community values spanning quality of life, economic development, housing, neighborhoods, transportation, health and safety, and growth management.
The engagement process was a multifaceted process, delving into complex questions about development patterns, identifying incompatible uses, and cultivating community-driven goals.
The previous Amarillo Comprehensive Plan, adopted over 13 years ago, lacked a robust community engagement component. This resulted in a limited understanding and support from the community, and its implementation was not widespread across city departments.
Updating the plan became crucial to mirror the recent growth and development in Amarillo, ensuring ongoing relevance and adaptability to future unknowns. This comprehensive approach to engagement, signifies a purposeful shift toward a more community-centric process.
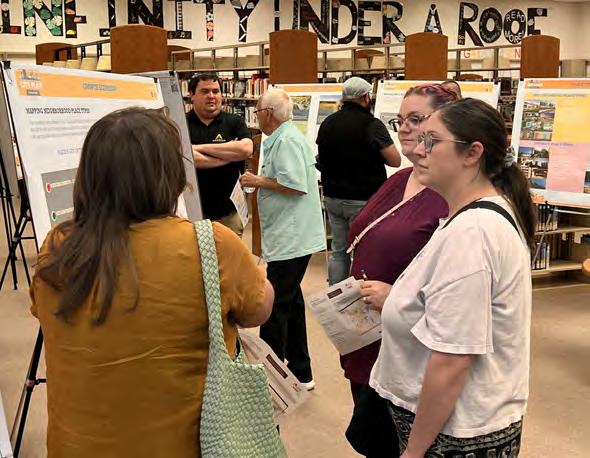
The engagement project team, a collaboration between city staff, MIG, Inc., EPS, Walter P Moore, and Clarion Associates, demonstrates a commitment to inclusive planning. The transparent and open process provided numerous opportunities for community members, even from traditionally underrepresented groups, to contribute, interact, and engage, ensuring inclusivity and comprehensiveness.
Community involvement was integral in shaping the plan — from vision to growth scenarios, policies, and strategies. This approach not only ensured acceptance but also created advocates for the plan. The report emphasizes the community-driven nature of the plan, resonating with the diverse perspectives and priorities of Amarillo’s residents.
Led by city staff and the MIG Team, the design and development of engagement activities, events, and media represent a thoughtful and creative endeavor. This report provides a summary of the approach, activities, key findings, and results, encapsulating the essence of a truly community-driven City Plan.
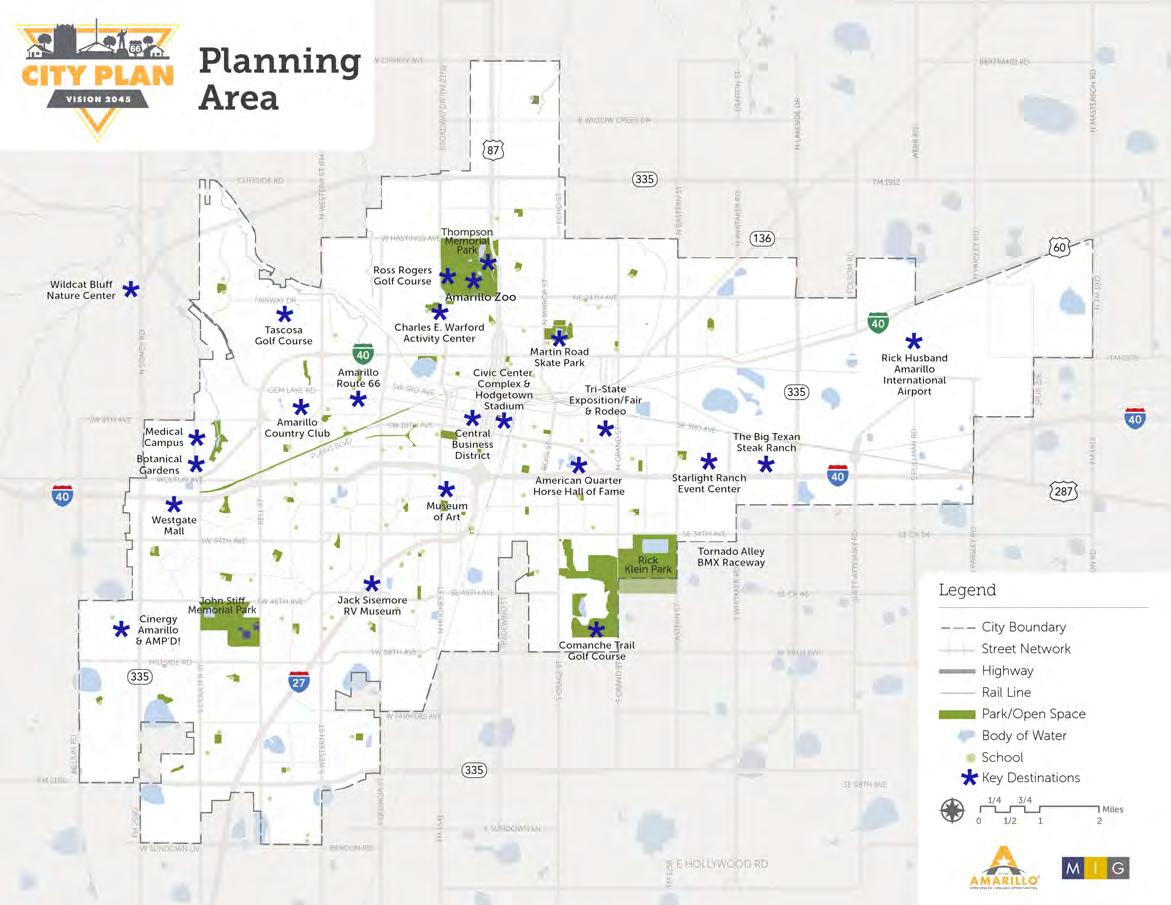
The Plan plays a pivotal role in shaping Amarillo’s future by preserving community values and guiding strategic investments, fostering the city’s vibrancy and enhancing its overall attractiveness.
ENGAGEMENT APPROACH
The engagement strategy for City Plan entailed crafting a strategic communications plan to foster engagement, facilitate tangible interaction to gather specific ideas and priorities, and ultimately secure advocacy from the community for the approval and implementation of the plan.
CITY PLAN PHASES
1 2
3
4
5 Kickoff Vision and Guiding Principles Existing Conditions Planning Elements and Goals Implementation Strategies
ENGAGEMENT OBJECTIVES
The Project Team developed a Public Participation Plan that outlined numerous opportunities for residents, property owners, youth, the development community, business owners, and representatives to shape and provide feedback on City Plan. This plan highlights specific outreach activities designed to seek various viewpoints from the community, with a focus on providing as many opportunities as possible for different demographics to participate and have a voice in the City Plan process.
Key Planning Objectives
• To establish a vision and goal framework for the Plan
• To receive input on Growth Scenarios
• To educate the community on plan elements to be incorporated into City Plan
• To develop sound policy content upon which implementation strategies can be developed
Key Engagement Objectives
• To educate the community on City Plan
• To foster excitement for City Plan
• To establish a community-based vision for the future of Amarillo
• To energize and inform the community about the next steps
• To engage the community and solicit input on plan elements, growth scenarios, and overall City Plan recommendations
• To energize and inform the community
• Gain participation
• Listen
• Garner feedback
• Create advocates

ACTIVE COMMUNITY PARTICIPANTS
OVER 31,000 ENGAGEMENTS
COMMUNITY CONNECTORS
DEVELOPERS STUDENTS REALTORS NEIGHBORHOOD ASSOCIATIONS
FAMILIES
TEENS
COMMUNITY ORGANIZATIONS WORKFORCE LANDOWNERS STAKEHOLDERS
SENIORS
SCHOOL ADMINISTRATORS
HISTORIC NEIGHBORHOODS
BUSINESS LEADERS

•Une
•Sigue
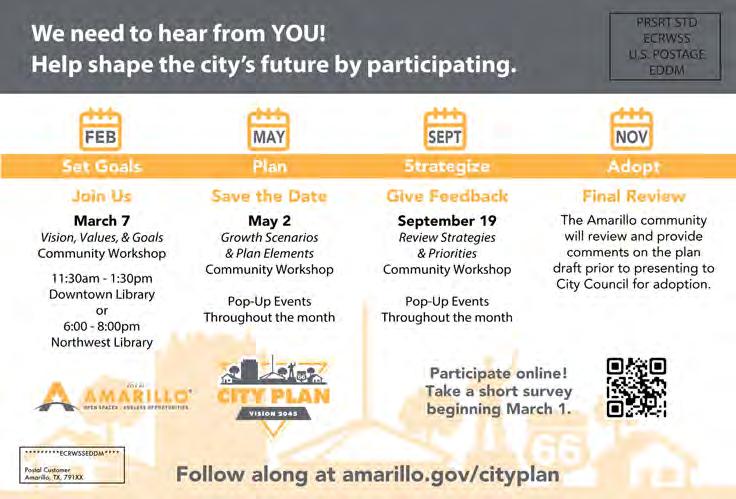
City-Wide Mailer
To introduce City Plan to the community, a bright gold, two-sided postcard was mailed out to every residential address in Amarillo. The card included an overview, timeline, website link, and a call to action on the ways to participate in the City Plan process.
CITY PLAN WEBPAGE
The City Plan webpage, designed to be an informative and engaging platform, played a crucial role in connecting with the community, offering key details about surveys, meetings, and activities. Serving as a dynamic hub for collaboration, it evolved over the process to accommodate changing needs and to ensure residents remained connected and informed. As the community actively participated in shaping Amarillo’s future, the webpage became a vital resource, accumulating thousands of page views, reflecting the community’s keen interest in the city’s development.
6,841
UNIQUE PAGE VIEWS
amarillo.gov homepage ad linking to City Plan page
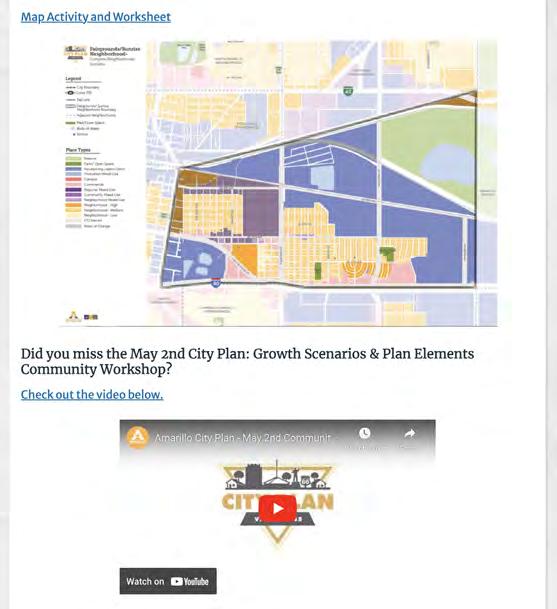
amarillo.gov/cityplan (page updated over time)
STEERING COMMITTEE
The City Plan Steering Committee (CPSC) played a pivotal role in guiding the planning process. Comprised of invited individuals from various sectors including the development and real estate communities, property owners, business owners, residents, and Amarillo ISD, CPSC met eight times throughout the plan process.
This committee served as a consistent stakeholder group, contributing to shaping plan content, reviewing draft materials, guiding community engagement, and informing decision-making from the commencement to the final draft of City Plan – Vision 2045. Members, representing different districts and demographics, provided essential insights into the feasibility and implementation of recommendations. Their candid feedback was crucial. Notably, these committee members were designated as advocates for the adoption of City Plan, underscoring their pivotal role in endorsing the plan’s recommendations at the conclusion of the planning process.
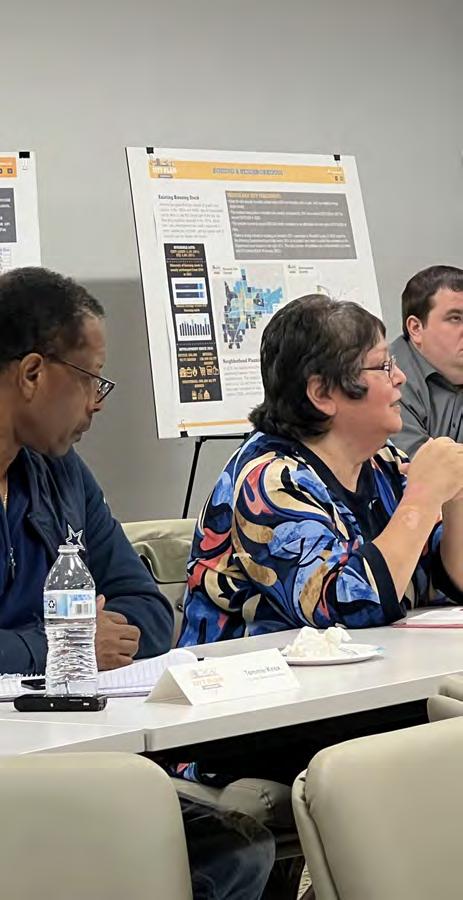
Steering Committee Meetings
November 7, 2022
In-Person
City Plan Introduction and Overview
March 6, 2023 In-Person
Existing Conditions
May 1, 2023
In-Person
Plan Element Intro (Land Use/Community Character/ Future Land Use Palette), Growth Scenarios Input
July 17, 2023
Virtual
Plan Element: Alternative Growth Scenarios, Housing & Neighborhoods (Allocation Exercise)
August 14, 2023
Virtual
Mobility & Parks and Alternative Growth Scenarios
September 18, 2023
In-Person
Preferred Growth Scenarios Draft
November 6, 2023
Virtual City Plan Implementation & Prioritization
Scheduled: January, 2024
Virtual Public Review Draft
COMMUNITY SURVEYS
Our Community Surveys were designed with a primary focus on engaging and representing all areas of Amarillo, ensuring that the majority of the city’s communities had a voice in shaping the comprehensive plan.
Survey #1 – March 1 to May 2
The initial survey aimed to understand the community’s views on the city’s growth, investment in areas and infrastructure, and gather insights on the future vision and top investment priorities. This digital survey was promoted through QR codes, city-wide postcards, website ads, links on the website, social media posts, e-newsletters, emails, direct sharing in neighborhood Facebook Groups, and through distributed flyers and posters.
The digital survey was also available in Spanish and was complemented with a paper survey that was available at five libraries and six senior centers throughout the community.
2,240 RESPONSES
Survey #2 – June 26 to September 18
The second survey’s goal was getting feedback on what the vision and guiding principles for the City Plan should be. The digital survey was available through posted QR codes, website ad, website links, social posts, e-newsletters, emails, shared directly with neighborhoods via Facebook Groups, and on distributed flyers and posters.
474 RESPONSES
Survey #3 – October 16 to November 27
The third survey’s goal was getting preferences on what types of housing people are open to in their neighborhoods. The digital survey was available through website ad, website links, social posts, e-newsletters, and emails.
655 RESPONSES
Survey 1 Topics – Sampling
Amarillo Growth
New Housing Development
Investment in Older Neighborhoods
Vision for Growth
Future Top Priorities
Survey 2 Topics
Does Vision Statement Align With Your Vision
Are the Guiding Principles Aligned with Your Vision
Survey 3 Topic
Review Housing Types and Your Neighborhood Preferences
COMMUNITY WORKSHOPS
The City Plan organized collaborative workshops to share information and gather insights. These sessions were crucial, not just for understanding community goals, but also for integrating them into the comprehensive plan. The collective input played a key role in shaping the plan to genuinely reflect the community’s vision.
Community Workshop #1: Vision, Values, and Goals
March 7, 2023 at 11:30 am–1:30 pm (Downtown Library)
March 7 at 6–8 pm (Northwest Library)
This workshop initiated the City Plan engagement with an introductory overview. Discussions on the fundamental Role of City Plan unfolded, fostering open conversations at various stations. Participants engaged in an exploratory dialogue on the Existing Conditions Report, delving into critical plan elements, such as the History of Amarillo, Growth Management & Capacity, Land Use & Community Character, Housing & Neighborhoods, Parks & Cultural Resources, and Community Mobility & Infrastructure.
Community Workshop #2: Growth Scenarios & Plan Elements
May 2 at 11:30 am–1:30 pm (Downtown Library)
May 2 at 6–8 pm (East Library)
The second workshop provided an overview of past engagements, highlighting the pivotal role of City Plan. The session introduced Place Types and the current city growth scenario. Participants engaged in discussions around Case Studies relevant to Place Types, prioritization preferences for these categories, and identified areas of opportunity and concern within the existing growth scenario.
Community Workshop #3: Review Strategies & Priorities
September 19 at 11:30 am–1:30 pm (Downtown Library
September 19 at 6–8 pm (Northwest Library)
Workshop attendees shared insights, expressed agreement on key proposals, and focused on specific areas to pinpoint strategies and priorities. The dialogue revealed a strong split in housing preferences, with north Amarillo preferring diverse housing options, including Tiny Homes, ADUs, and Multi-family residences, while south Amarillo expressed a preference for Single Family Homes.
OVER 200 PARTICIPANTS
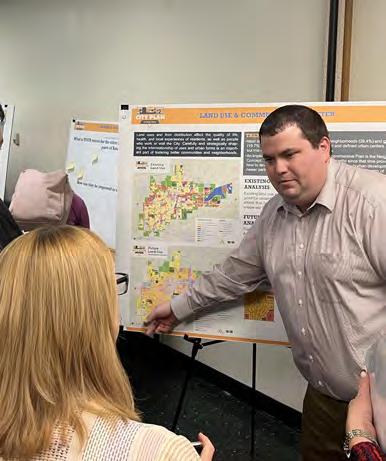
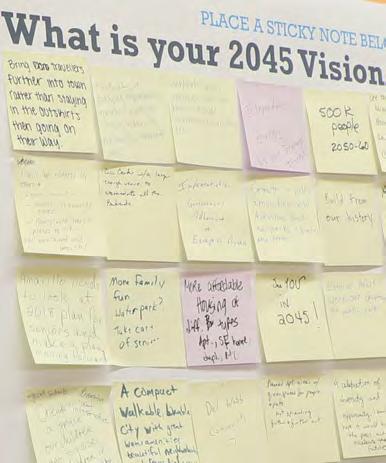
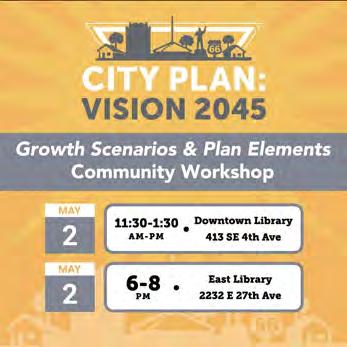
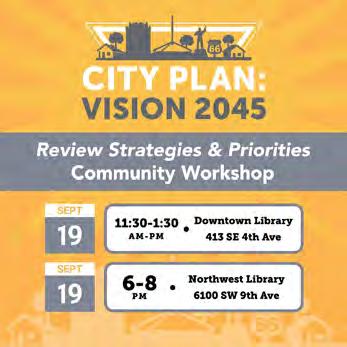
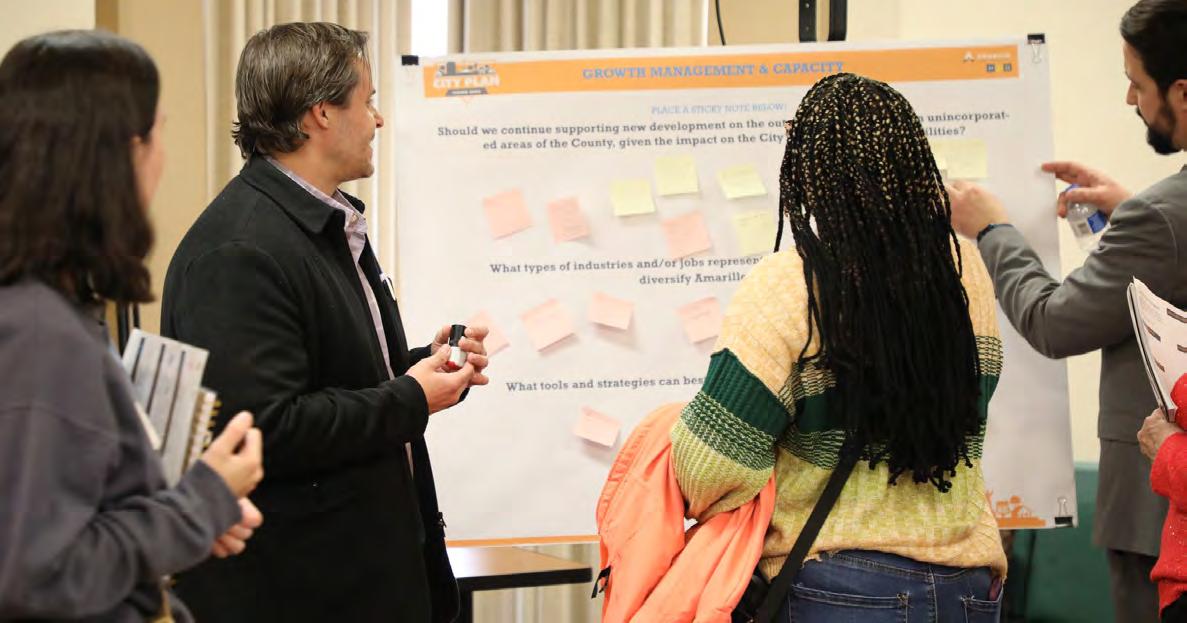
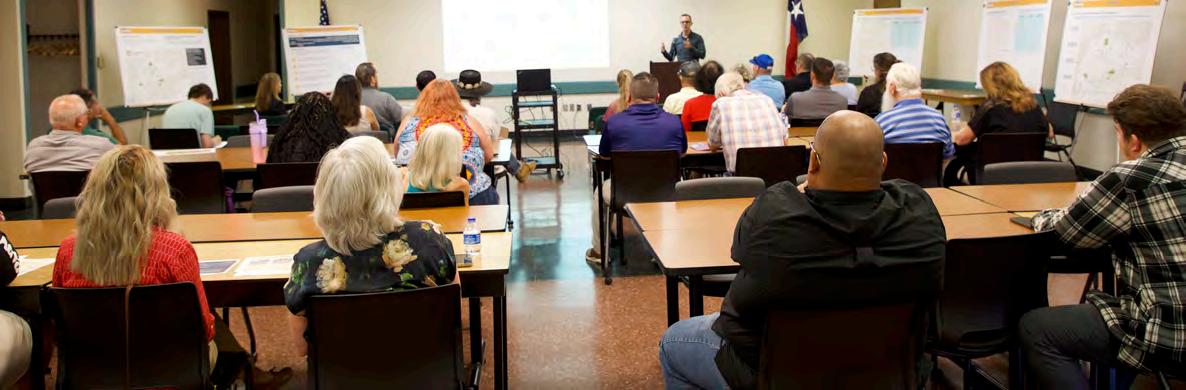
COMMUNITY CONNECTORS
In pursuit of a more inclusive engagement strategy, city staff introduced the Community Connectors plan to foster participatory problem-solving. Amarillo’s vast and diverse landscape was segmented into 67 areas, reflecting the city’s dynamic character spread across 90-plus square miles. Noting eight of those areas included are undeveloped/underdeveloped, but were included due to the completion of development plans in upcoming years. The aim was to establish a Community Connector(s) in each area, serving as a vital link between residents and the city. Through this smaller, actively engaged group, the initiative gained influential and powerful advocates, effectively amplifying the impact of community-driven dialogue. Through community events and four engaging Lunch and Learn sessions, staff recruited enthusiastic individuals to act as Community Connectors. Their role was pivotal in disseminating information about City Plan within their areas and collecting valuable feedback.
This initiative not only achieved our goal of reaching all corners of Amarillo, but also ensured that the City Plan reflects the diverse voices and perspectives embedded in our community. The Community Connector plan will continue to have a positive impact on community engagement even past the City Plan process.
The city received feedback from 54 out of the 67 neighborhood areas in Amarillo identified.
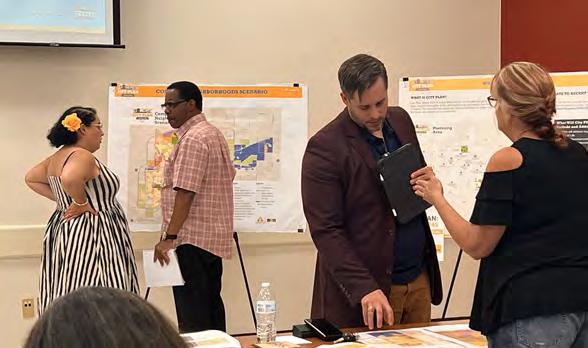
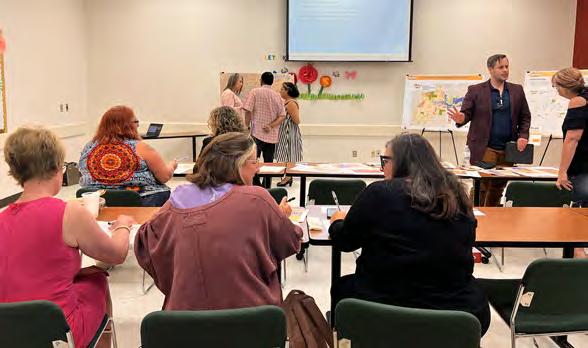
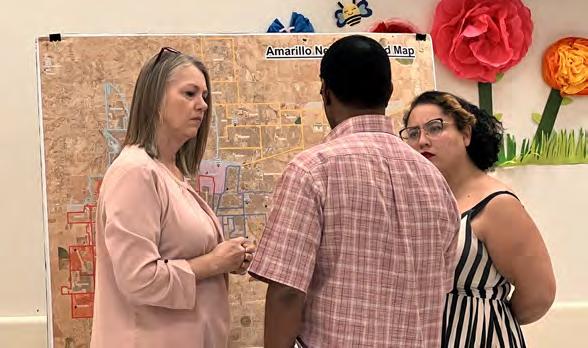
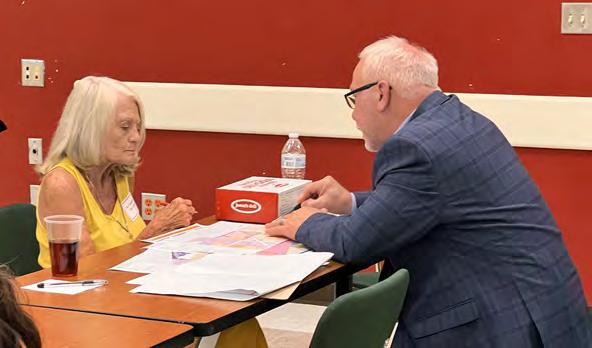
Community Connector Meetings — August
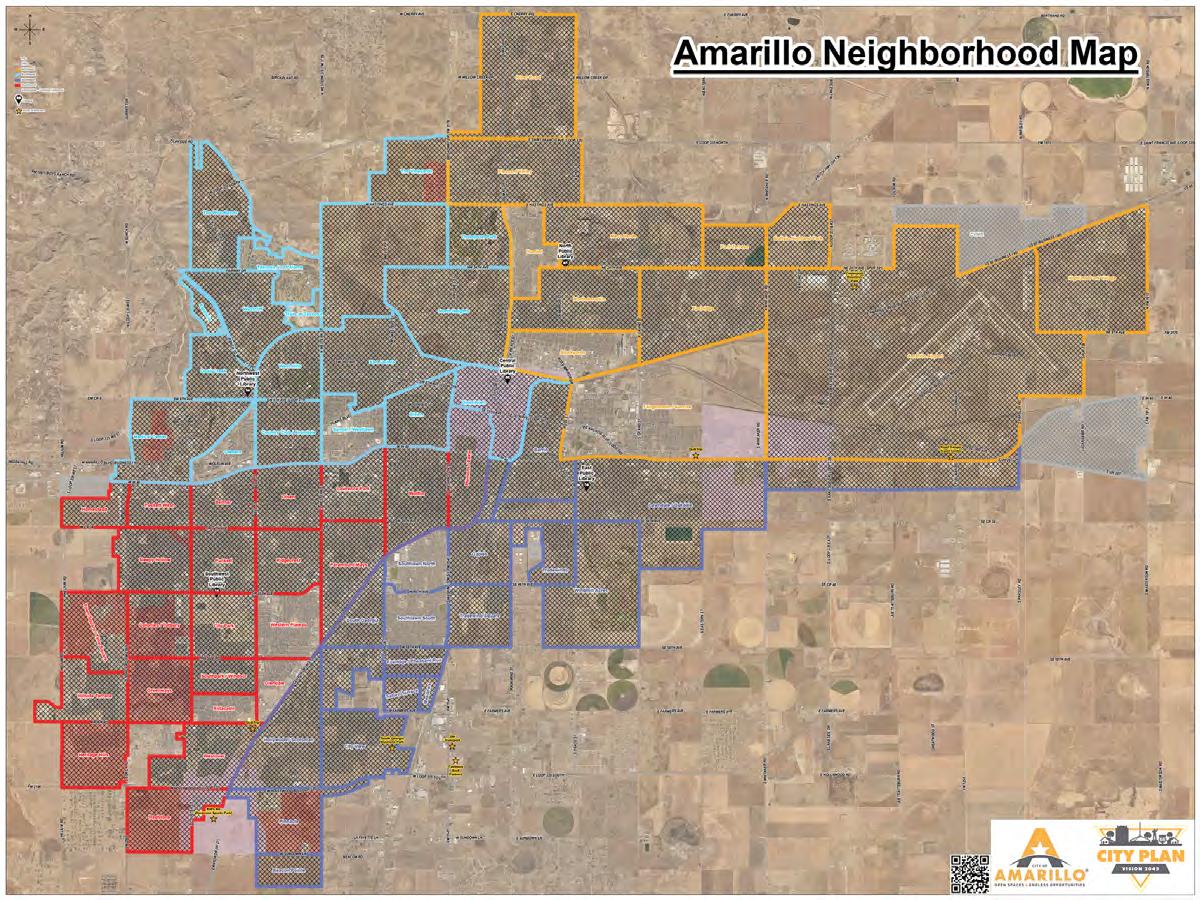
“Together, let’s build a brighter future for Amarillo, where every voice is heard, and every perspective counts.”
Map showcasing areas in Amarillo where feedback was collected and connections forged through engagement and community outreach efforts.
STUDENT ENGAGEMENT
Alongside community outreach, a dedicated student/ youth engagement platform was initiated to involve the next generation in shaping the future of Amarillo. Acknowledging the significance of their voice in a 20-year city plan, a student survey, a novel approach for the City of Amarillo, was introduced.
Despite limited engagement due to student state testing schedules, this effort established valuable connections with school districts. Moving forward, the city’s planning department commits to utilizing these channels continuously, fostering awareness about comprehensive planning and the department’s role. The uniquely crafted student survey, focusing on overarching vision questions, provided crucial insights that informed our understanding of the community’s vision for future investment and growth in Amarillo. This initiative lays the groundwork for ongoing student engagement in the planning process.
STUDENT WEBSITE 256 VIEWS

Video: https://youtu.be/RDk--X_32K8?si=D4HvVDdS7BG-_b-6
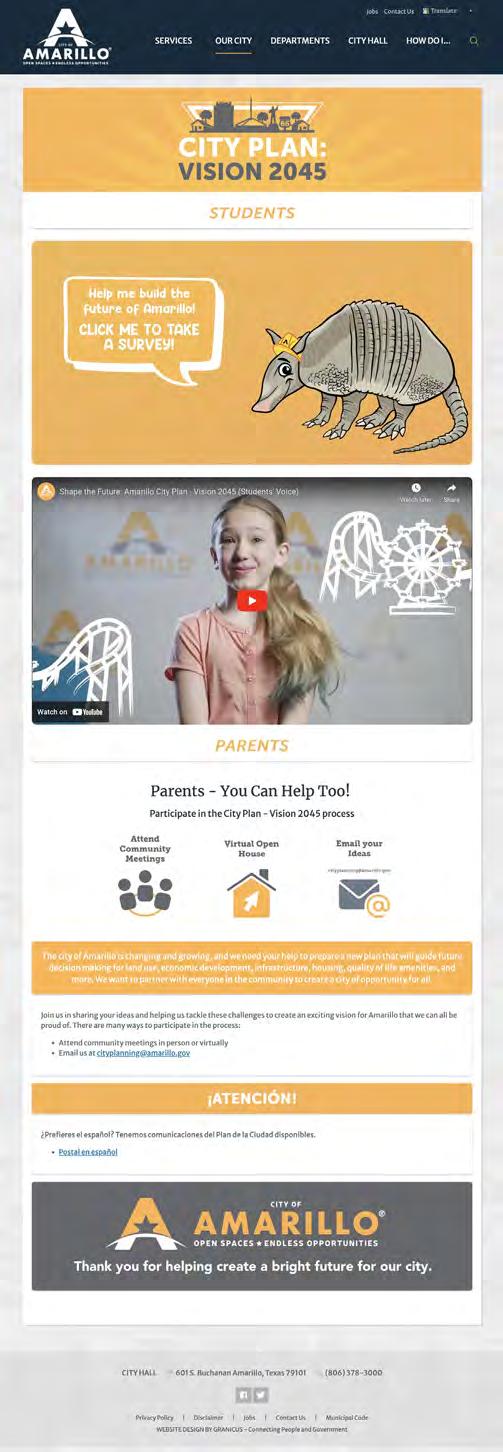
Q1 What type of student are you?
Answered:
Student Survey Highlights
Q7 What are we missing in Amarillo that you think would make city in the future? (Select all that apply)
Answered:
STUDENT SURVEY
128 PARTICIPANTS
SOCIAL MEDIA ENGAGEMENT
Facebook, X/Twitter, Instagram, and LinkedIn
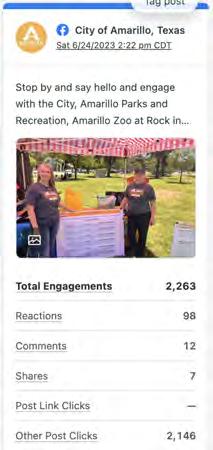
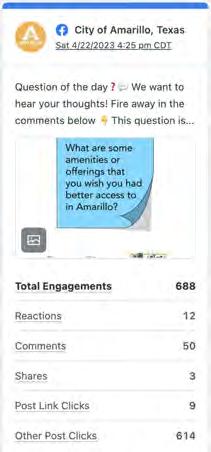
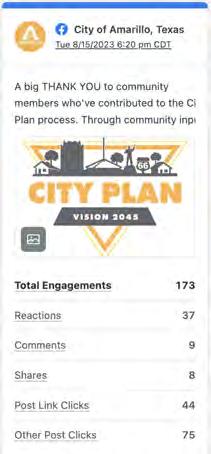
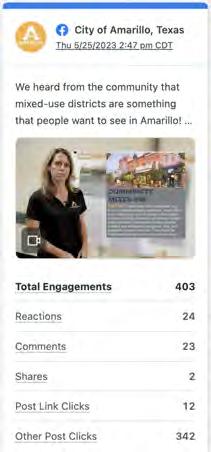


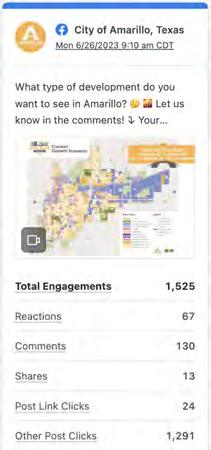


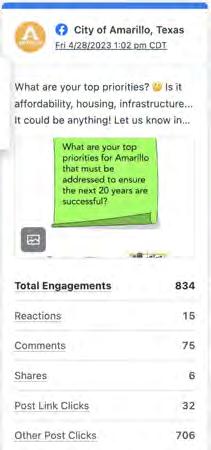
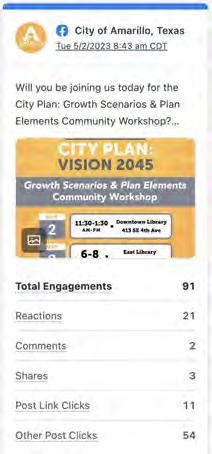


COMMUNITY OUTREACH
Community outreach efforts aimed to go beyond traditional methods, bringing the planning process directly to the people.
The intent was to connect with diverse audiences, engaging with hundreds of individuals and gathering direct feedback from representative groups. This approach ensures that the City Plan is shaped by a collective voice. Those 2023 events and resulting direct engagement/feedback included:
Business Connections – May 18
Attendees: 4,400
Direct feedback: 161 comments
Republican Women Luncheon – presentation – May 18
Attendees: 30 people
First Thursday on 6th Street – June 1
Attendees: 120
Direct feedback: 26 people
Route 66 Celebration – June 10
Attendees: 15,000
Direct feedback: 134 people
Rock in the Park – music festival – June 24
Attendees: 400
Direct feedback: 44 people
AMA-CON – pop culture convention – August 5 and 6
Attendees: 3,500
Direct feedback: 57 people
Community Market – August 26
Attendees: 780
Direct feedback: 31 people
School Superintendents Meetings – November
• Amarillo Independent School District
• Canyon Independent School District
• Highland Park Independent School District
• River Road Independent School District
North Heights Community Meeting – November 30
Attendees: 30 people

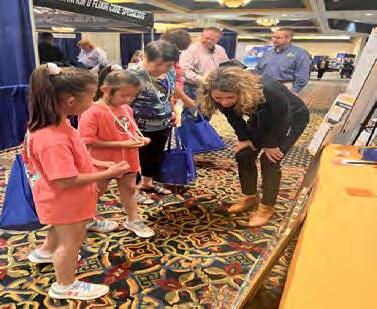
AMA-CON
Reached unique demographic to share the importance of a long-range plan for Amarillo.
Activity: Interactive planning game
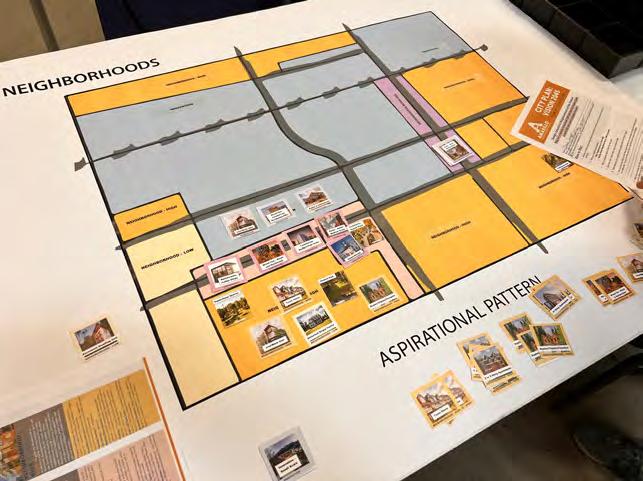
BUSINESS CONNECTIONS
Reached Amarillo businesses, community members to educate and gather feedback.
Activity: Interactive boards
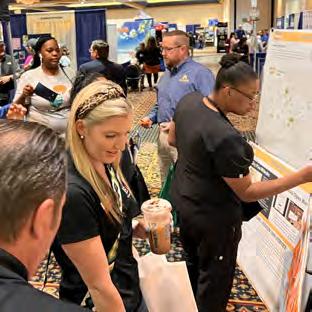
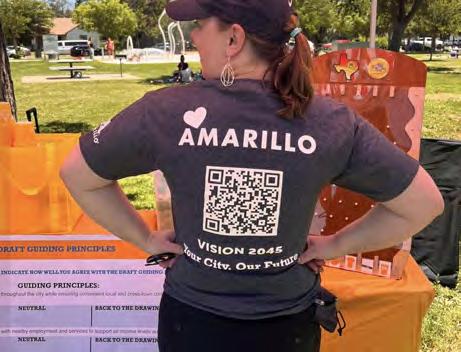
ROCK IN THE PARK
Event for park and rec supporters.
Activity: Vision and guiding principles feedback
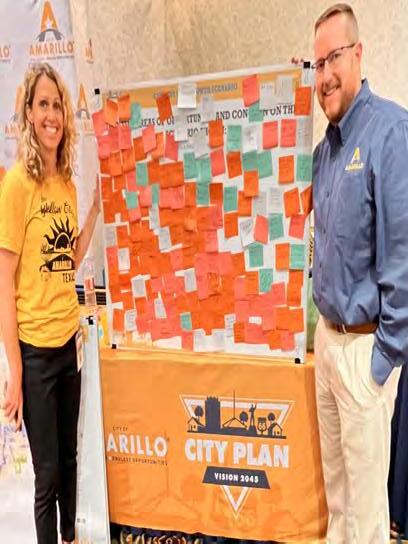
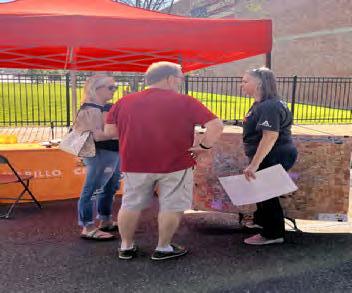
COMMUNITY MARKET
Outreach to community at popular outdoor market to educate and gather feedback.
Activity: Review neighborhood area maps
DEVELOPER OUTREACH
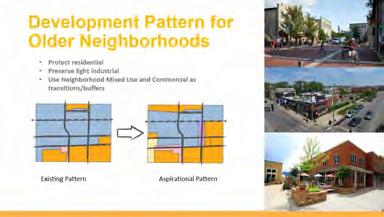
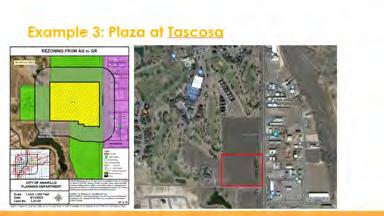
The City Plan team forged a new approach for community engagement on the comprehensive plan by recognizing the pivotal role of local developers and landowners have in shaping Amarillo's landscape. To address past concerns about limited consultation, the team reached out to developers, personally inviting them to participate and share their perspectives.
A breakfast was organized and 17 out of 20 invited developers participated.
Follow-up one-on-one meetings delved deeper into discussions about future plans, the draft map, and specific concerns of each developer. Actively seeking feedback on design, parkland, and map updates fostered stronger relationships with developers.
Feedback led to adjustments, illustrating a genuine commitment by the city to incorporating the perspectives of the development community. The stakeholders, appreciating this open and responsive approach, collectively acknowledged the importance of instituting an annual review process with Planning staff. This plan to incorporate ongoing collaboration ensures that the City Plan not only aligns with the community's vision but also remains adaptive to changing market demands, underlining the significance of these strengthened relationships.
Developers Breakfast – September 19 17 attendees


Developer One-On-One Meetings – October 7 one-on-one meetings


Developer Presentation Slides
VIRTUAL COMMUNITY WORKSHOP
The City Plan team prepared a virtual community workshop that provided an immersive workshop room with all Community Workshop #1 materials, presentations, and activities provided at a physical community open house. Users entered the virtual open house at a sign-in desk and after registration were able to look through background materials and explore exhibits on easels to learn about the project, walk to a screen to watch a video or presentation on the meeting topic, and provide feedback on draft materials and recommendations.
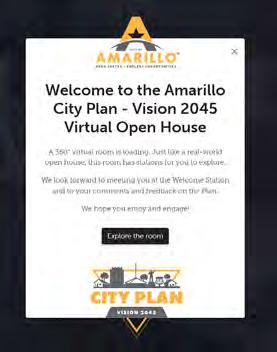
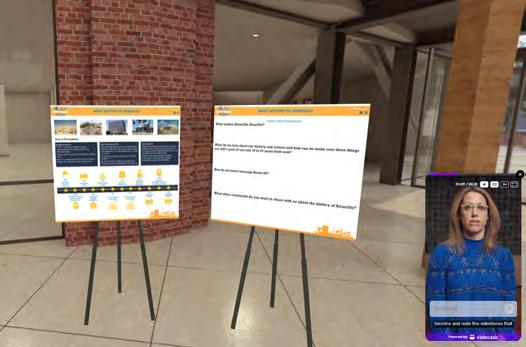

CITY COUNCIL PRESENTATIONS
To maintain transparency and community awareness, the City Plan team delivered comprehensive presentations at three City Council meetings. These sessions were pivotal in keeping the Mayor, City Council members, and the community informed about the progress and developments within the City Plan.
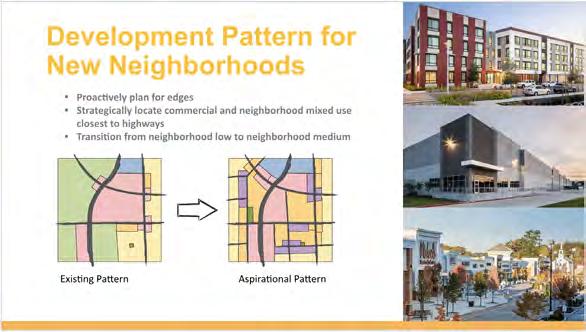
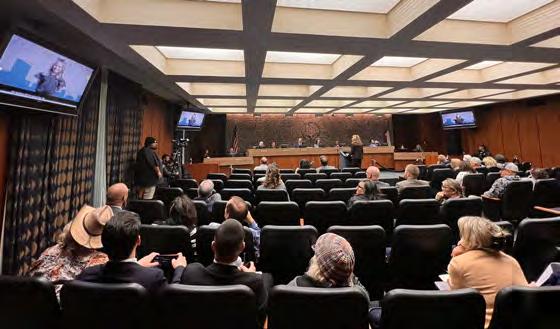
MEDIA COVERAGE
The City of Amarillo utilized diverse channels to disseminate information about City Plan. Local media outlets played an important role in communicating the goals, progress, and opportunities of City Plan to a wide audience. This strategic media outreach ensured that the city’s vision reached a broad and diverse spectrum of Amarillo’s residents, contributing significantly to the success of the engagement process. Press releases were sent throughout the process to media outlets and the city held monthly Media Lunch & Learn events where City Plan engagement was a topic.
Outlets featuring City Plan included:
• AMA Globe-News
• KFDA Channel 10
• KVII Channel 7
• KAMR Channel 4
• KGNC Radio
• Telemundo Amarillo
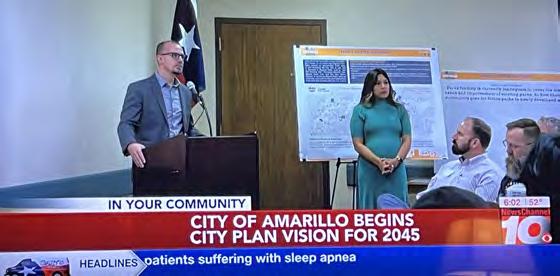


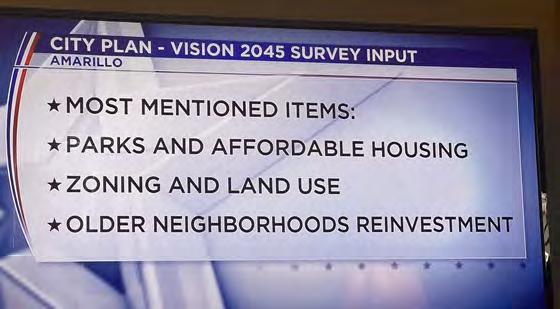
KAMR Channel 4
KAMR Channel 4
Media Lunch and Learn
Monthly meeting with local media to share important city news.
March 1 – City Plan Introduction
April 6 – City Plan Update and Stats on Responses to Survey
September 6 – City Plan Upcoming Community Workshops
November 1 – City Plan Housing Preference Survey
Press Coverage Sampling
City of Amarillo Invited Public to Help Prepare New City Plan
https://www.newschannel10.com/2023/02/28/city-amarillo-invited-public-help-prepare-new-city-plan/
City of Amarillo Starts Long-Range Plan: Vision 2045
https://www.youtube.com/watch?v=PWvt4VVKBlE
Ciudad de Amarillo se prepara para un nuevo plan de visión, valores y metas para el año 2045
https://www.telemundoamarillo.com/video/2023/03/08/ciudad-de-amarillo-se-prepara-para-un-nuevo-plan-de-visin-valores-ymetas-para-el-ao-2045/
Amarillo’s Vision 2045? City Wants Your Help Building City Plan.
https://mix941kmxj.com/amarillos-vision-2045-city-wants-your-help-building-city-plan/
City of Amarillo Starts Long-Range Plan: Vision 2045
https://www.myhighplains.com/news/local-news/city-of-amarillo-starts-long-range-plan-vision-2045/
City of Amarillo Kicks Off City Plan ‘Vision 2045’
https://www.myhighplains.com/news/local-news/city-of-amarillo-kicks-off-city-plan-vision-2045/
La ciudad de Amarillo pide a los residentes que realicen una encuesta en líneala para su “Visión 2045″
https://www.telemundoamarillo.com/video/2023/04/10/la-ciudad-de-amarillo-pide-los-residentes-que-realicen-una-encuesta-enlneala-para-su-visin-2045/
City of Amarillo Invites Public for City Plan Vision Meeting for 2045 https://www.newschannel10.com/2023/03/06/city-amarillo-invites-public-city-plan-vision-meeting-2045/
Amarillo Asking for Feedback from Residents to Create a Long Range Plan for Future https://abc7amarillo.com/news/local/city-of-amarillo-asking-for-citizens-feedback-to-create-a-long-range-plan-for-future-surveyvision-2045-emily-koller-planning-mildred-darton-advocate#
This Weekend Is Your Last Chance To Take Amarillo City Plan Survey
https://mix941kmxj.com/this-weekend-is-your-last-chance-to-take-amarillo-city-plan-survey/
La ciudad de Amarillo invita al público a una reunión de visión del plan de la ciudad para 2045
https://www.telemundoamarillo.com/2023/03/07/la-ciudad-de-amarillo-invita-al-pblico-una-reunin-de-visin-del-plan-de-laciudad-para-2045/
City of Amarillo Gathers Community Input for City Plan
https://www.newschannel10.com/2023/05/03/city-amarillo-gathers-community-input-city-plan-vision-2045/
‘City Plan: Vision 2045’ Public Meetings Set for Tuesday
https://www.myhighplains.com/news/local-news/city-plan-vision-2045-public-meetings-set-for-tuesday/
City of Amarillo Releases Housing Survey
https://www.myhighplains.com/news/local-news/city-of-amarillo-releases-housing-survey-part-of-vision-2045-plan/
DIGITAL & PRINT COMMUNICATIONS
Email Distribution
• 4 City Plan emails: 21,738 subscribers — 2,568 clicks
• 2 employee emails: 1,500 subscribers
• Center City email: 3,900 subscribers
• Amarillo Association of Realtors — targeted email
• Builders Association — targeted email
• City Plan featured in every City of Amarillo e-newsletter
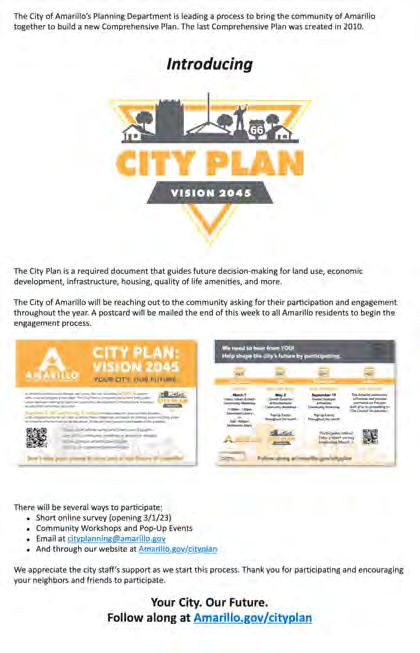
Internal staff email — Introducing City Plan
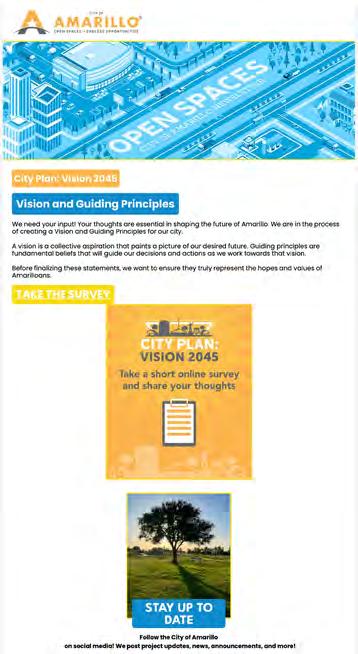
City of Amarillo e-newsletter featured content
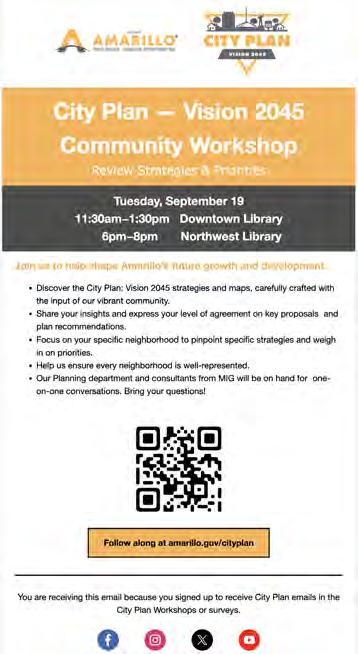
City-wide email City Plan — Community Workshop


PUBLIC REVIEW ENGAGEMENT
With a goal of providing a final opportunity for community input before City Council review, outreach efforts for the City Plan Draft included utilizing local media channels, targeted emails, social media platforms along with in-person meetings and open houses at City of Amarillo Public Libraries.
Online Public Comment Platform – March 5 to April 3
Result – 1,565 views and 72 Comments
Planning and Zoning Meeting
Draft Presentation – March 11
Commission Review and Vote – April 15
Developers Meeting – March 12
Library Open Houses – Direct feedback: 107
North Branch – March 13
Northwest Branch – March 19
Southwest Branch – March 20
East Branch – March 21
City Council Meeting – May 14 – Presentation Scheduled
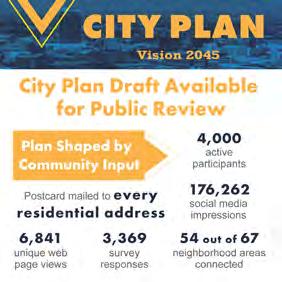
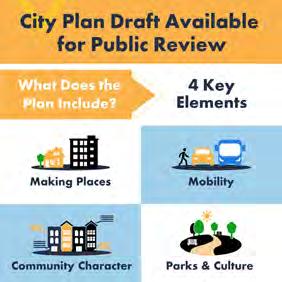
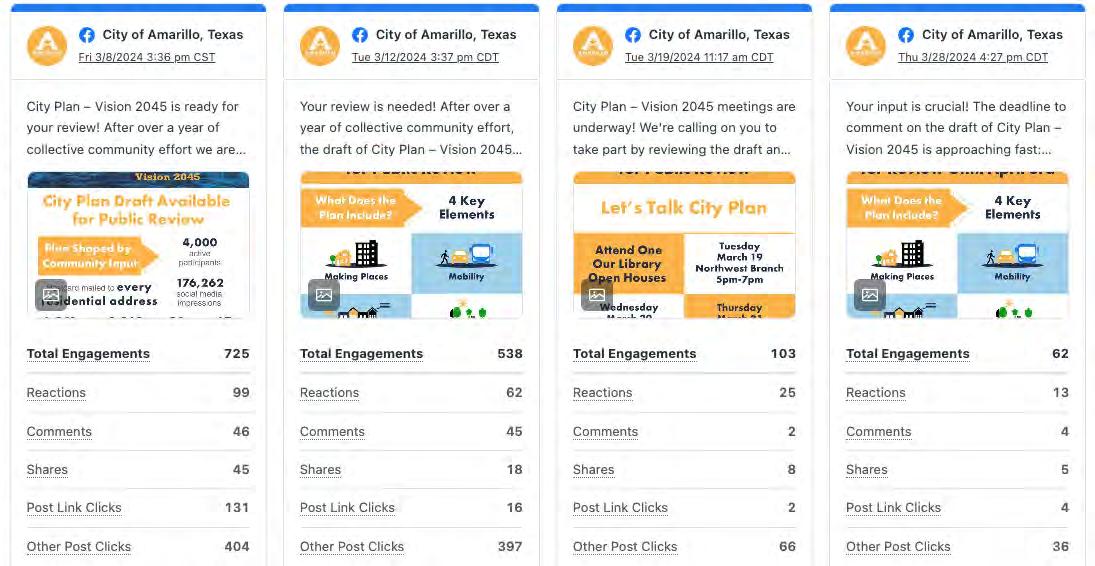
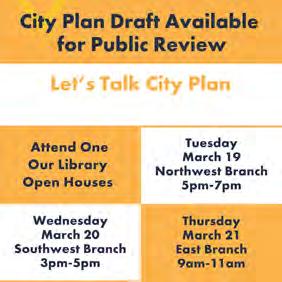
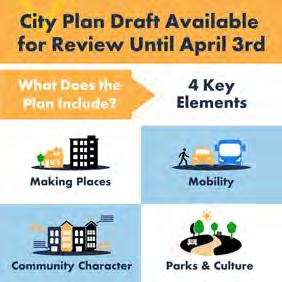
Media Outreach
Media Lunch and Learn – March 6
Monthly meeting with local media to share important city news.
Press Release – March 8
Press Coverage Sampling

https://www.newschannel10.com/2024/03/11/open-houses-scheduled-discuss-draft-city-plan-vision-2045/

https://www.amarillo.com/story/news/2024/03/09/amarillo-area-public-meetings-for-the-week-of-march-11-2024/72896501007/
https://www.amarillo.com/story/news/2024/04/01/amarillo-area-public-meetings-for-the-week-of-april-1-2024/73166585007/
KEY FINDINGS
The City Plan team had a diverse range of community members participate and provide input on how the future of Amarillo should look in the next 20 years. The team analyzed all the community input received and identified key findings and themes from various engagement.
While this document is a summary of engagement, a full and detailed report with comprehensive data and feedback from all meetings and engagement, along with surveys will be available at the conclusion of the City Plan process.
KEY THEMES FOR THE VISION OF AMARILLO
MAINTAIN EXISTING
INFRASTRUCTURE
AMENITIZE PARK SPACES
PROVIDE SAFE COMMUNITY SPACES
INCREASE QUALITY OF LIFE
REVITALIZE OLDER NEIGHBORHOODS
SUPPORT ECONOMIC DEVELOPMENT OPPORTUNITIES
DIVERSIFY & SUPPORT AFFORDABLE HOUSING
COMMUNITY VISION
In 2045, Amarillo is a DIVERSE, VIBRANT, AND FAMILY-FRIENDLY COMMUNITY surrounded by wide-open spaces. The city has reinvested in its infrastructure, neighborhoods, and districts while carefully guiding growth on its edges. This approach has CREATED AMENITIES AND OPPORTUNITIES FOR ALL AMARILLOANS. Amarillo serves as a regional economic hub and national destination that CELEBRATES ITS SMALL-TOWN CHARM, RICH HISTORICAL AND CULTURAL ROOTS, AND STRATEGIC LOCATION. The city offers a unique MIX OF SHOPPING, EMPLOYMENT, HOUSING, ENTERTAINMENT, PARKS, AND OPEN SPACE.
GUIDING PRINCIPLES
• Create a variety of walkable destinations throughout the city while ensuring convenient local and cross-town connectivity for cars, bikes and transit.
• Provide a range of housing opportunities with nearby employment and services to support all income levels and age groups.
• Celebrate cultural and historic assets along key corridors and in specific neighborhoods and districts.
• Encourage a diversity of low- to medium-scale places throughout the city.
• Increase overall quality of life for all residents by promoting safe, clean, and protected neighborhoods with well-amenitized park spaces, goods, and services nearby.
• Prioritize reinvestment in existing infrastructure, neighborhoods, districts, and recreational amenities.
WE’VE HEARD...
“EVERY ACTION MAKES AN IMPACT OF PRESERVING THE HISTORY AND CULTURE OF AMARILLO.”
“GROWTH NEEDS TO BE MANAGED, OF COURSE, BUT BIG VISION GOALS NEED TO BE INVITED ALSO. AMARILLO CAN INVITE BIG VISIONS AND WITH LEADERSHIP IMPLEMENT THESE GOALS.”
“ADDRESS THE NEEDS OF EXISTING PARKS BEFORE INVESTING IN NEW PARKS.” WHAT
“BIG TOWN AMENITIES WITH SMALL TOWN FRIENDLINESS.”
“NEED MORE BALANCED DEVELOPMENT BETWEEN OUTSKIRTS AND WITHIN CITY.”
“IF THE CITY SUPPORTS REVITALIZATION BEYOND DOWNTOWN REVITALIZATION, WE MAY SEE GROWTH IN OLDER NEIGHBORHOODS RATHER THAN EXPANDING NEW NEIGHBORHOODS.”
“ENCOURAGE MULTIUSE DEVELOPMENT WITH NEIGHBORHOODS SO FOLKS CAN WALK AND BIKE TO ACCESS NECESSITY BUSINESS.”
“NEED AFFORDABLE HOUSING AND GROCERY STORE AVAILABLE FOR ALL NEIGHBORHOODS.”
“WORK WITH WHAT WE HAVE TO REVITALIZE AMARILLO.”
“WE NEED MORE SAFE CONNECTIONS TO THE COMMERCIAL AREAS FROM OUR NEIGHBORHOOD. WE WOULD LIKE TO BE ABLE TO WALK TO MORE SHOPS AND RESTAURANTS.”
“CREATE WALKING TRAILS CONNECTING NEIGHBORHOODS.”
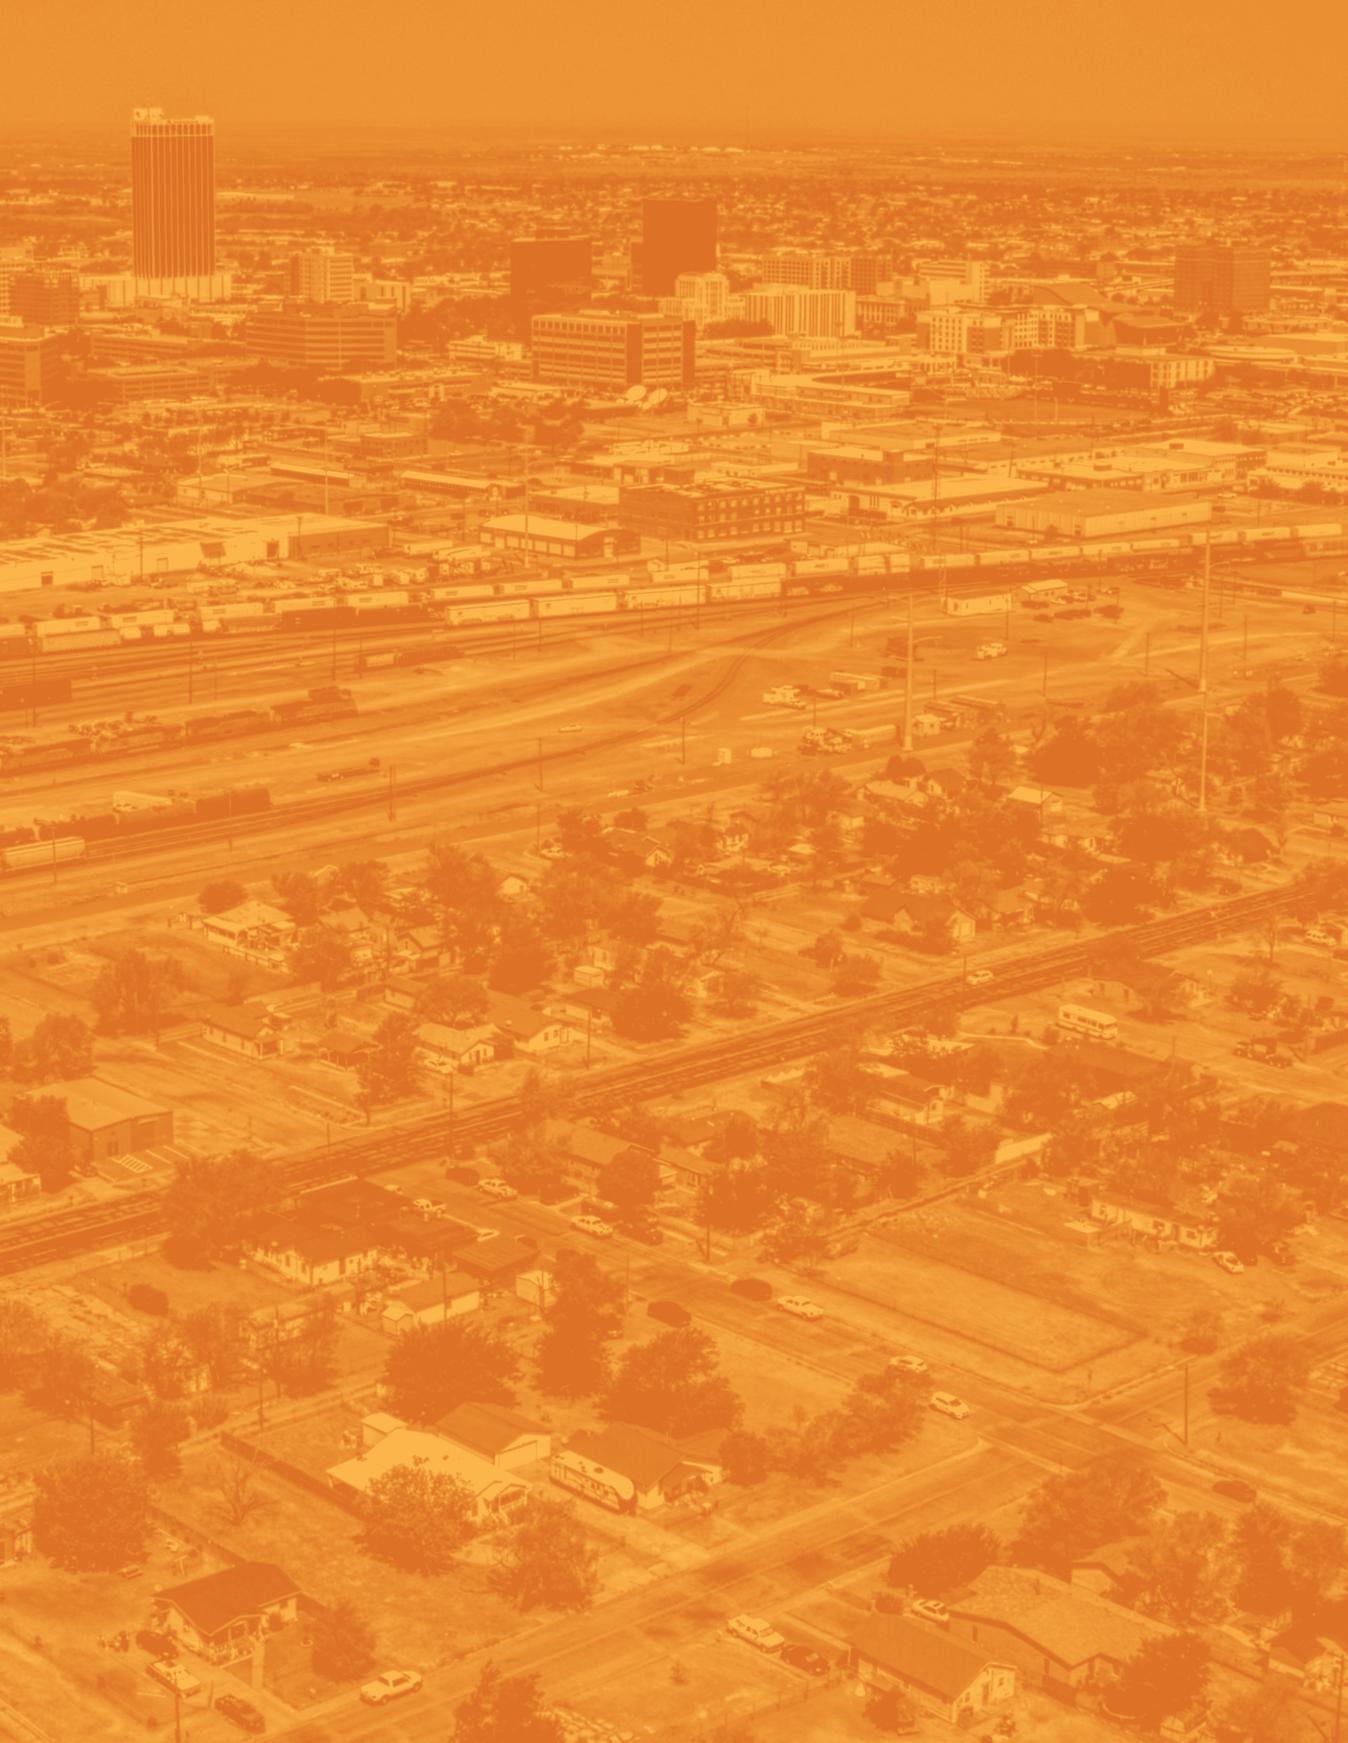
City Plan — Vision 2045
Existing Conditions: Recent Trends and Current Direction

MARCH 16, 2023


What is City Plan?
City Plan — Vision 2045 (City Plan) is a long-range plan that will create a strategic framework to balance equitable growth, quality of life improvements, and public and private investments in our city over the next two decades. City Plan will address topics that impact how people experience and interact with the City, such as where businesses, homes, sidewalks, bike lanes, parks, and much more are maintained, enhanced, and added. It will also look at how our built city can better reflect and advance our community values around topics like quality of life, economic development, housing and neighborhoods, transportation, health and safety, and growth management. The process to create the Plan will tackle difficult questions about the City’s current development patterns and provide an overarching tool for communicating communitydriven goals and policies. Overall, this Plan will help shape the future of the places we visit, play, and live by preserving what’s important to our community and guiding investments that help make Amarillo a vibrant and attractive city.
The existing Amarillo Comprehensive Plan was adopted 13 years ago. The new long-range plan, City Plan, will update the City’s adopted vision and growth policy framework to reflect the current needs and desires of the community. For the long-term success of our City, it is important to embark on creating City Plan. As the City of Amarillo continues to develop and grow, it is crucial to establish a vision that will direct and manage the future investments, growth and development. The planning process will provide guidance on how the City will evolve to take care of the development we have as well as plan for new development to come.
How Does City Plan Relate to Recent Planning Efforts?
City Plan will build on recent planning efforts, including lessons learned from the recent zoning code update process. Typically, zoning code amendments come on the heels of a city’s adoption
of a new comprehensive plan. However, Amarillo’s last Comprehensive Plan was adopted in 2010. In spring 2022 when the recent Zoning Code update was presented, many residents felt they had not been able to participate in the process. City Staff agreed that the final proposed amendments did not have sufficient community input. In addition, some of the final edits to the Zoning Code update were inconsistent with the 2010 Amarillo Comprehensive Plan. City Plan will provide us with an updated community vision for the City and set the stage for a Zoning Code update that is consistent with the community’s vision.
City Plan will also incorporate the Partnership for Development Progress (PDP) Strategic Plan. The PDP guided the City on how Amarillo should address growing infrastructure needs, including necessary operations, maintenance, planning and growth. Primary and Secondary Recommendations from the Strategic Plan will directly inform City Plan’s Community Mobility and Infrastructure Plan Element and help to inform the elements related to Growth Management and Capacity, as well as Land Use and Community Character.
What is this Document and How is it Organized?
City Plan will provide updated and unified policy direction to guide implemenation tools, such as zoning, economic development incentives, and infrastructure and amenity investments. It will outline new strategies for addressing citywide opportunities and challenges. This report begins setting the stage for policies and strategies by looking at Amarillo’s history and existing conditions for the following topics:
• Growth Management and Capacity
• Land Use and Community Character
• Housing and Neighborhoods
• Parks and Cultural Resources
• Community Mobility and Infrastructure
The topics introduced in the Amarillo Comprehensive Plan and City Plan will build and update on each of those elements. As each element is researched, the data, policy, and findings begin to tell a story about recent growth trends and patterns within the City. The data and policies
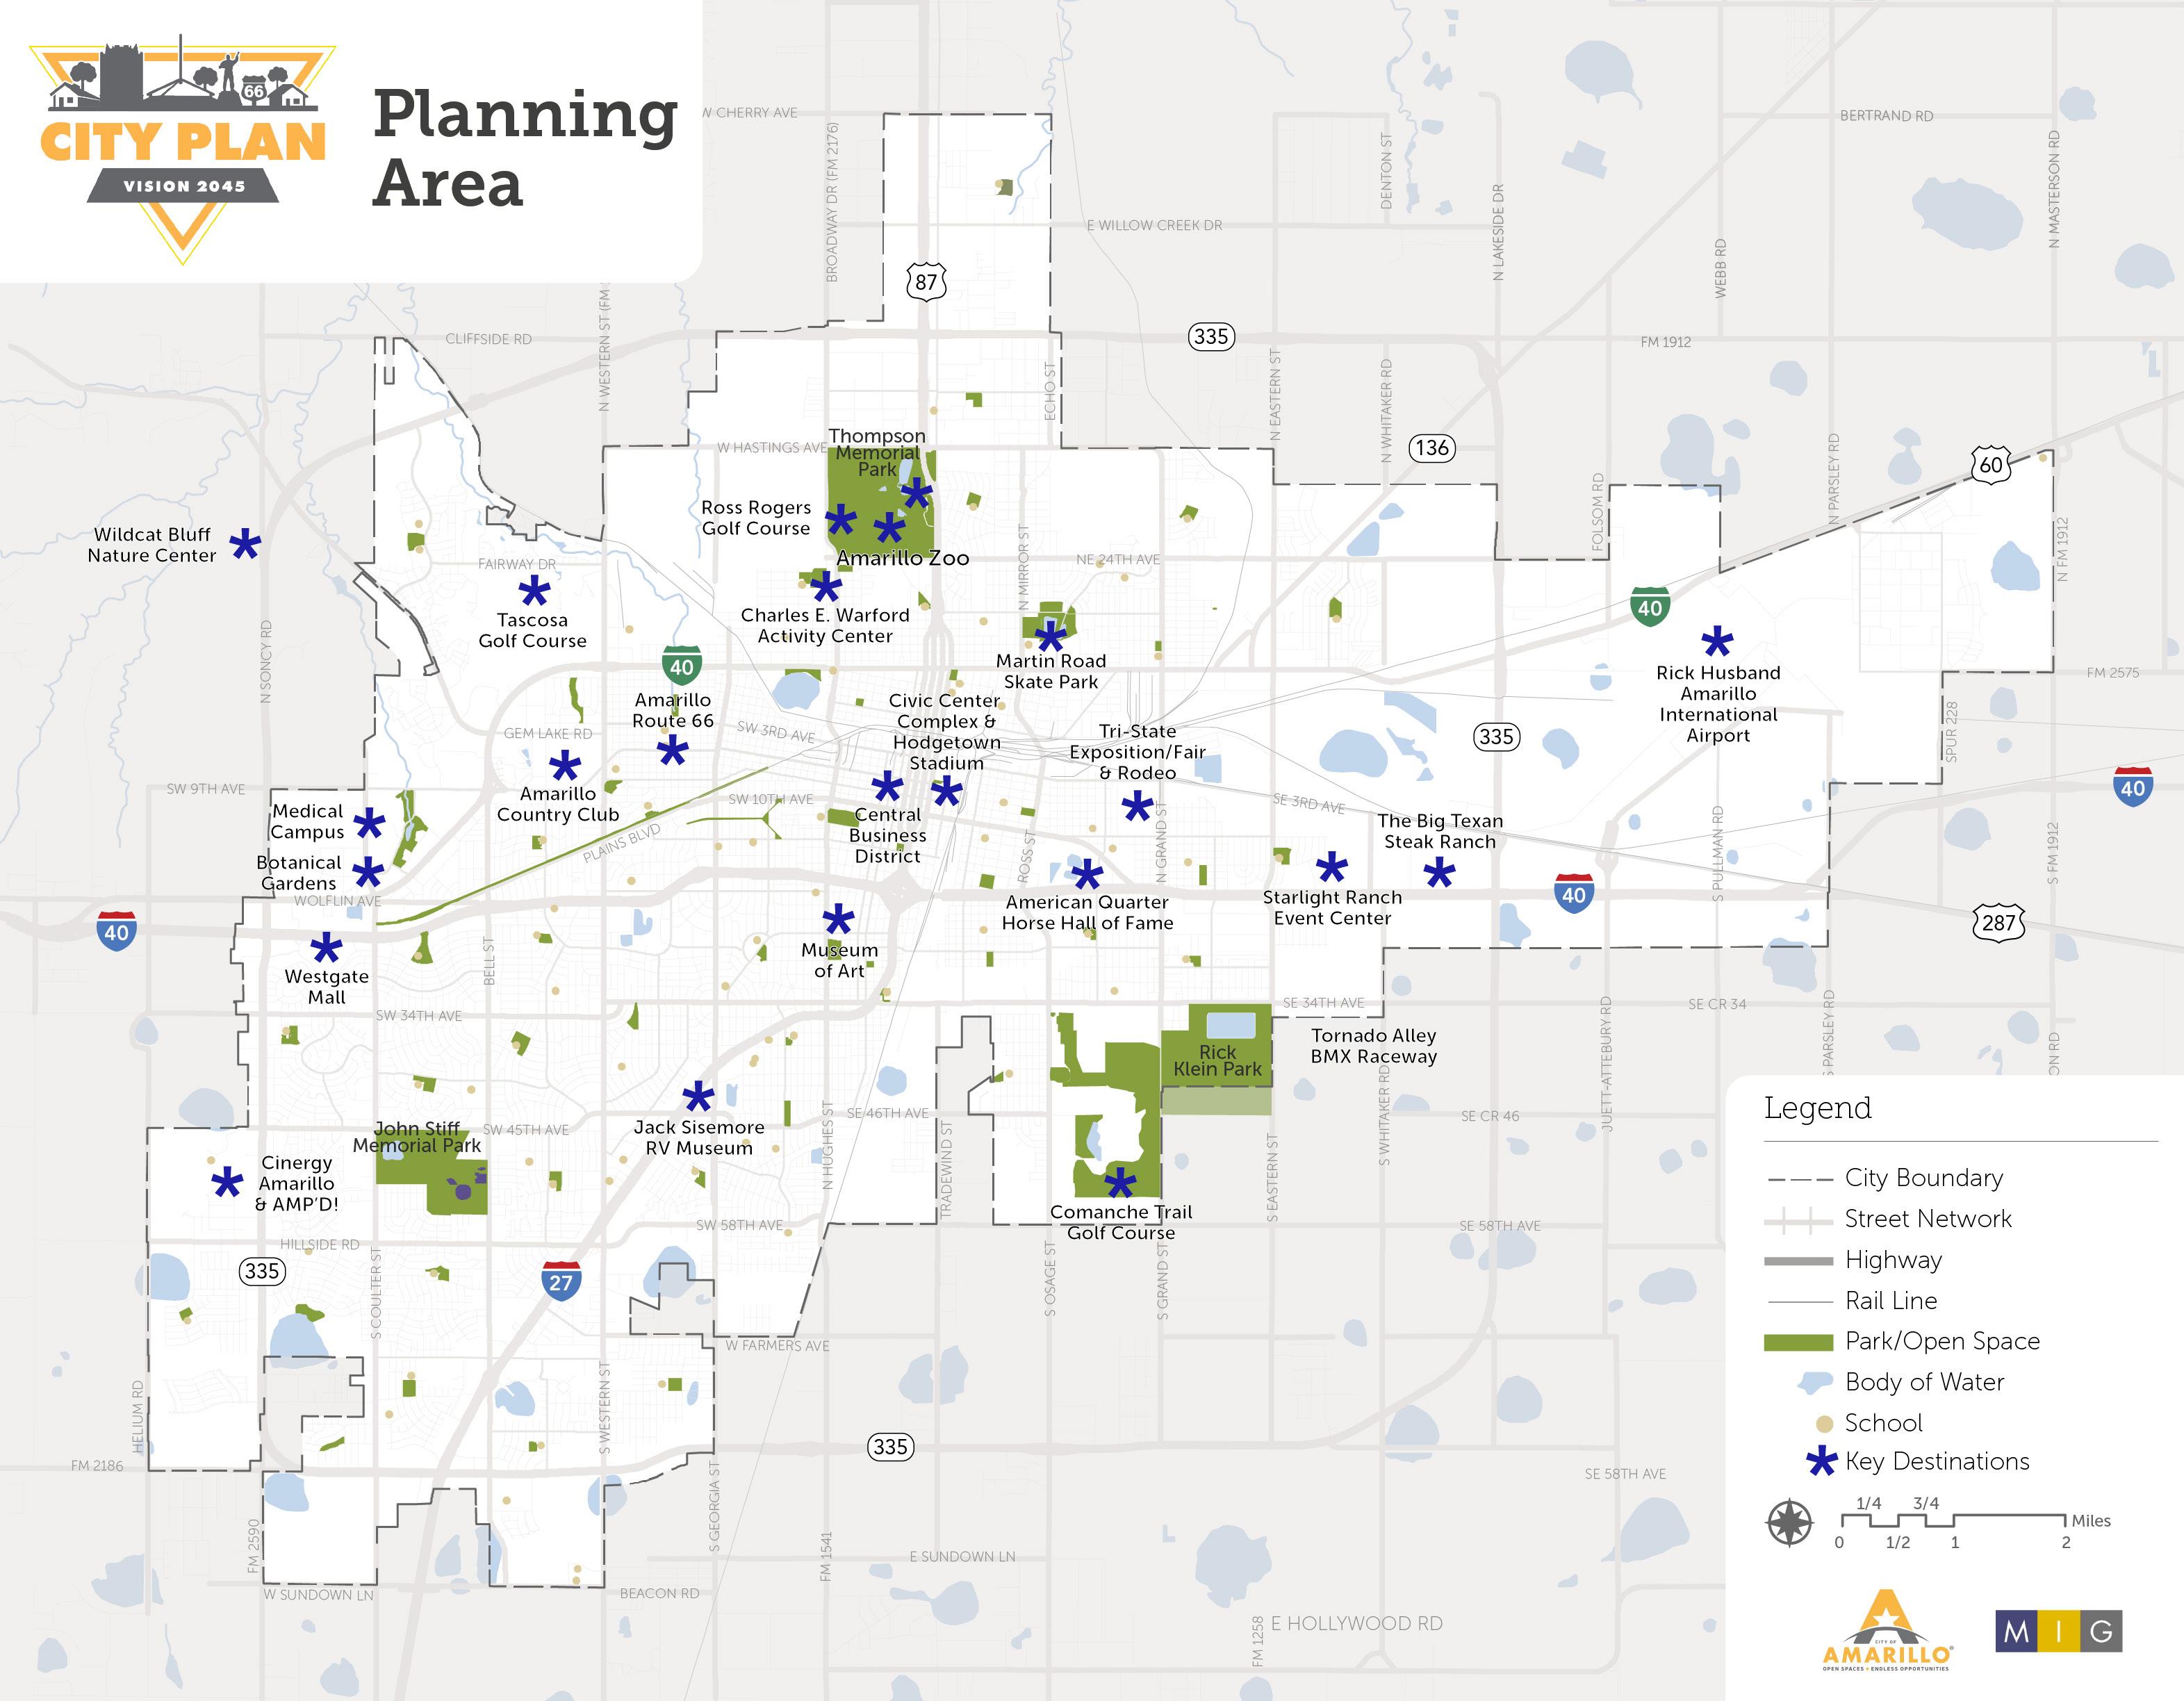
researched for this report were sourced from the Amarillo Comprehensive Plan; Parks and Recreation Master Plan; CDS ResIntel Housing Study; adopted Neighborhood Plan, including North Heights, Barrio, San Jacinto, and Eastridge; the Partnership for Development Progress Strategic Plan; Regional Multimodal Plan; an inventory of businesses in Amarillo; City building permit records; City vacant lots assessment; school district
boundaries; planned transportation projects; City traffic counts; and information gathered during previous zoning code revision efforts. This report sets the stage for each element and provides a summary of the current direction the City is headed in.


BRIEF HISTORY

BRIEF HISTORY OF AMARILLO
Founding
Located in both Potter County and Randall County, Amarillo is situated in a geographically strategic location. It was established as the administrative center upon its founding in 1887. The first railroad freight services arrived that same year the City was founded. Approximately two decades later, Amarillo became the fifth city in the nation to adopt a City Commission and City Manager form of local governance. Since 1913, Amarillo has developed as an economic hub, allowing Amarillo to become one of the largest urban areas in the Texas Panhandle. There are direct highway connections to Oklahoma City in the east, Denver in the north, and Albuquerque in the west and these links to multiple states and the larger region help support the local economy. Amarillo’s community and decision-makers can continue to shape the direction of growth and build on the City’s assets to strengthen its natural and built landscapes for future generations.
Driving Industries
Since its founding in 1887, the City of Amarillo has been one of the top commercial centers for the Texas Panhandle. After it was established, Amarillo became a prime cattle marketing center and the hub for freight movement. The City also became a hub for health and educational services with the establishment of St. Anthony’s Hospital in 1901 and West Texas State College in 1910. Amarillo quickly became a key retail trade center for the Panhandle area, the State of Texas, as well as the surrounding multi-state area. By 1915, Amarillo began establishing itself as a natural resource hub. Gas and oil were both found in Amarillo, leading the City to add a zinc smelter, oil refineries, and oil-shipping facilities. In 1928 Amarillo established the United States Helium Plant, due to the high helium content near gas fields.
In 1942, the Amarillo Army Air Base was established resulting in a sudden spike in population. The base was in use for over twenty years. With the growth of large industries, Amarillo opened its international airport, increasing traffic from visitors and business opportunities. By the 1980’s, the City’s airport was serving five major airlines, and the Santa Fe and Burlington national railroad freight was serving the region. City Plan will consider the historic and existing industries in Amarillo and address opportunities to strengthen these while identifying new and burgeoning opportunities.
1,442

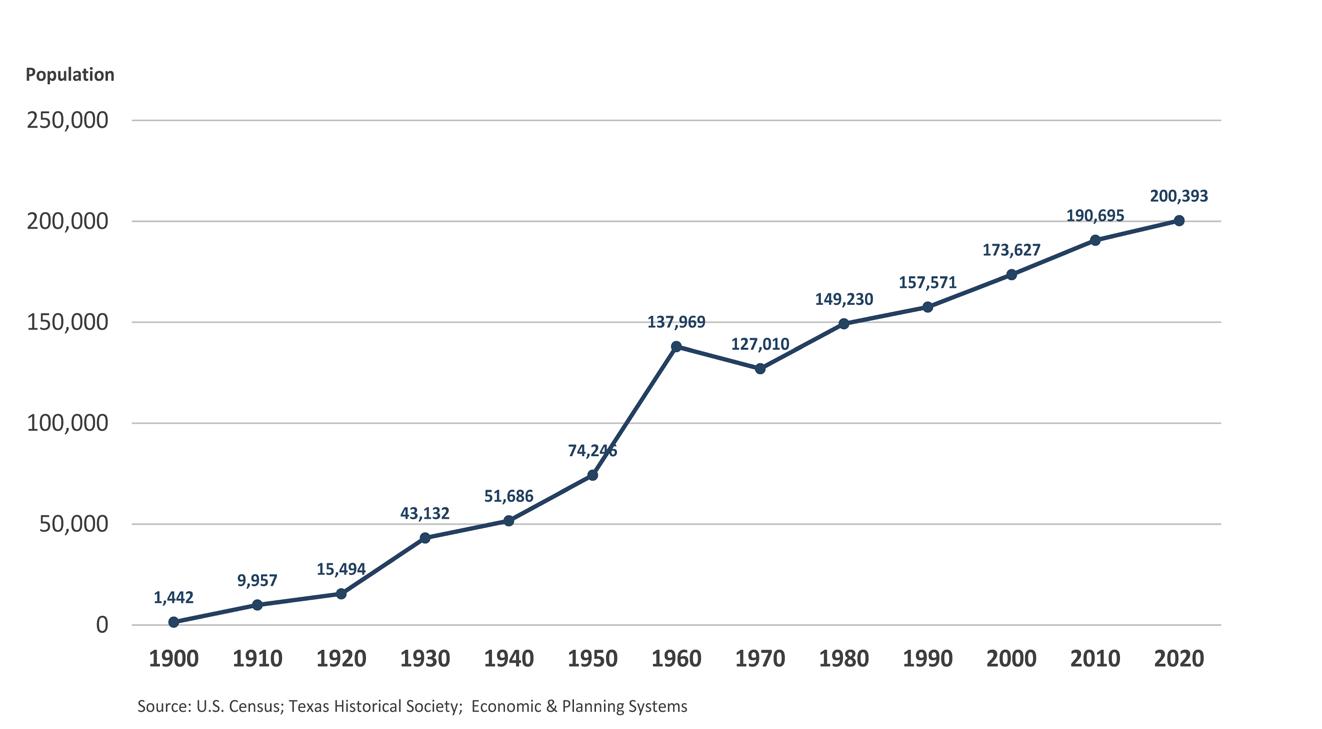
Figure 1. Historic Population of Amarillo by Decade, 1900 to 2020
200,393

Eras of Development
Establishment Era: Ellwood Park was established as the City of Amarillo’s first city park in the 1890s. In 1901, Amarillo opened the St. Anthony’s Hospital, representing the first medical center in the Panhandle region. Positioning itself to become the region’s leader in education and medicine, the City also founded the West Texas State College in 1910. By this time, the city’s population had reached almost 10,000 residents.
Peak Development Era: The largest population growth in Amarillo occurred between 1930 and 1960, when the Amarillo Army Air Base was established, and the international airport was opened. By 1960, many organizations and corporations moved their headquarters to Amarillo and, the population reached over 130,000 residents. Population continued to increase in both Potter County and Randall County. By 1970, the Army Air Base was closed, and Amarillo’s population decreased for the first time. Nevertheless, the community continued to build significant infrastructure, such as a municipal building, a civic center, and High Plains Baptist hospital.
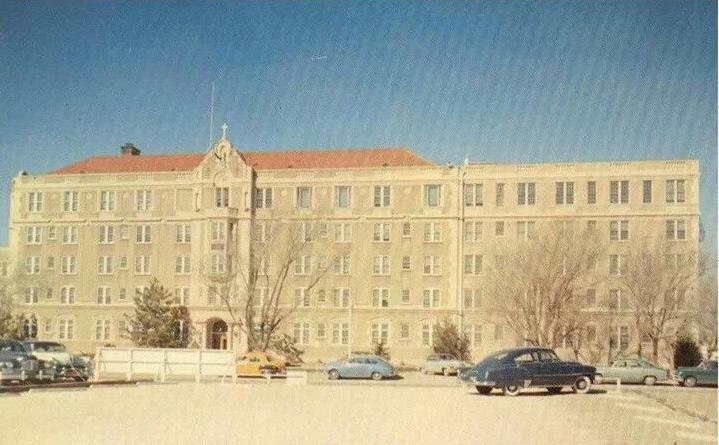
Future Growth: With the 1980 and 2010 Comprehensive Plans, Amarillo continues to envision the continued evolution of the city through public participation and policy. Renewal of shopping and consumer services in additional areas of the city (not only southwest Amarillo) and development at and near Harrington Regional Medical Center are identified economic opportunities for Amarillo in the coming decades. Greenway development in areas such as Southwest Amarillo, have the potential to increase in value while also providing entertainment and outdoor amenities for the community.
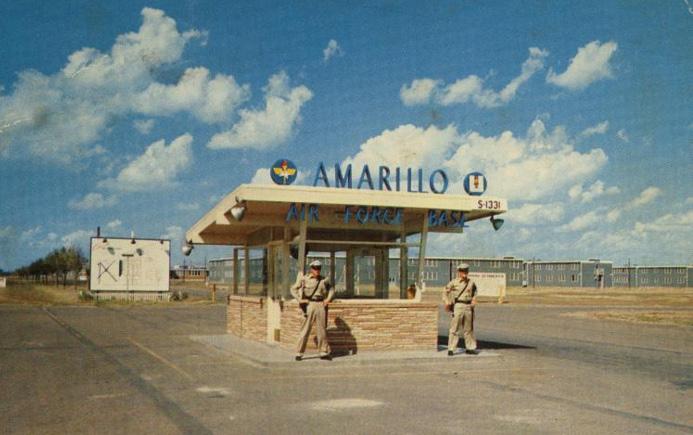
BRIEF HISTORY OF AMARILLO
Current Brand and Identity
The City of Amarillo’s image and identity were a key topic in the 1980 Comprehensive Plan and continue to be emphasized in recent years. Policies and regulations are intended to help guide new areas of development, areas that require redevelopment, infill areas, as well as more rural areas. A crossroads community such as Amarillo, requires attention to major corridor entrances (ex. along I-27, I-40 corridors and US Highway 87 and 287). Visitors and potential investors largerly form their impression of Amarillo based off their drive into and through town on the interstate. The City’s aesthetic image and identity remains an ongoing topic of improvement for Amarillo.


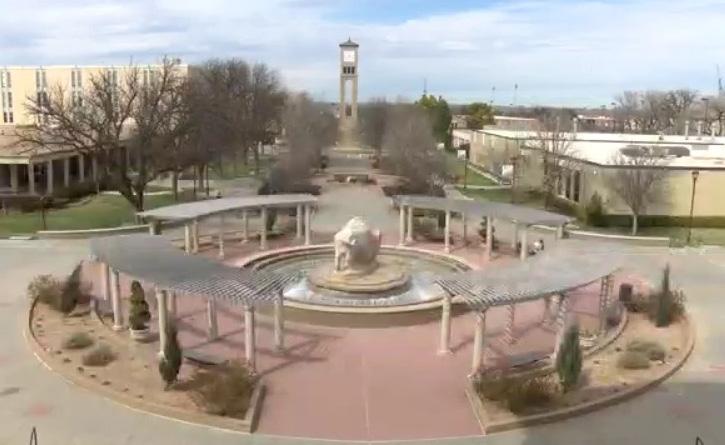
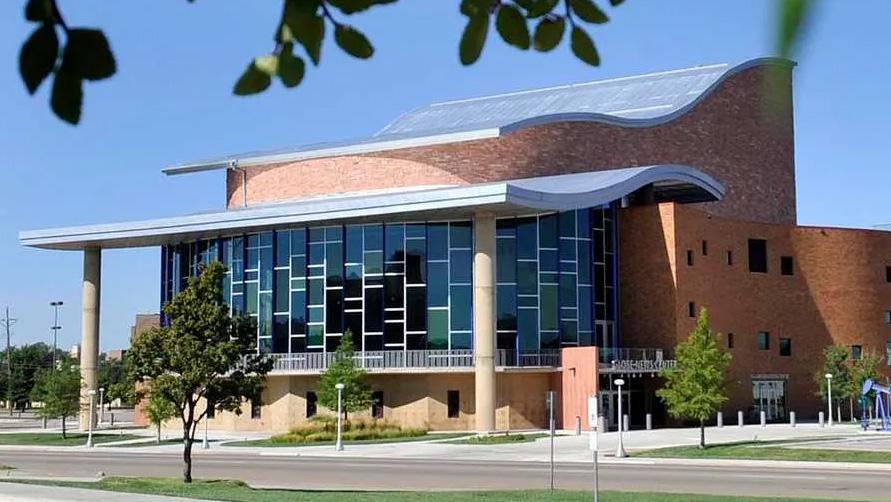
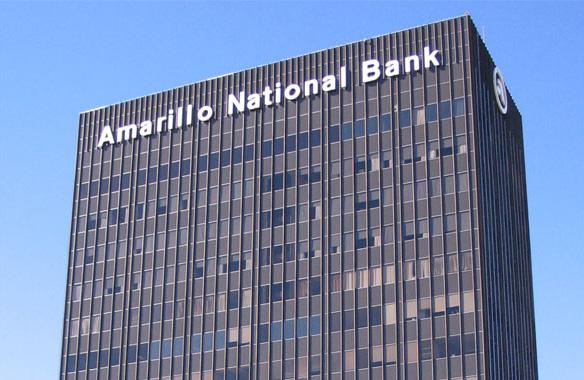
GROWTH MANAGEMENT & CAPACITY
GROWTH MANAGEMENT & CAPACITY
Existing Population and Projections
In 2021, the population of Amarillo was approximately 201,000. The population of Amarillo has steadily grown over the past two decades. Between 2000 and 2021, Amarillo added nearly 27,000 residents, which represents a growth rate of 16 percent, or 0.7 percent annually. As previously stated, the population growth over the last decade was slower, with Amarillo adding 10,000 residents and growing at a rate of 0.5 percent annually.
Over the past two decades, Potter County and Randall County have grown at different rates, with the population of Randall County growing by 1.5 percent annually from 2000 to 2021, while the population of Potter County grew by 0.1 percent annually. Potter County declined in population between 2010 and 2021. Amarillo’s population growth has therefore mostly occurred in Randall County, particularly on the southwestern side of Amarillo.
While the population of Amarillo has grown over the past two decades, it has grown at a significantly slower rate than Texas as a whole. As shown in Figure 2, the population of Texas grew by 41 percent since 2000, a rate approximately 2.5 times faster than that of Amarillo.
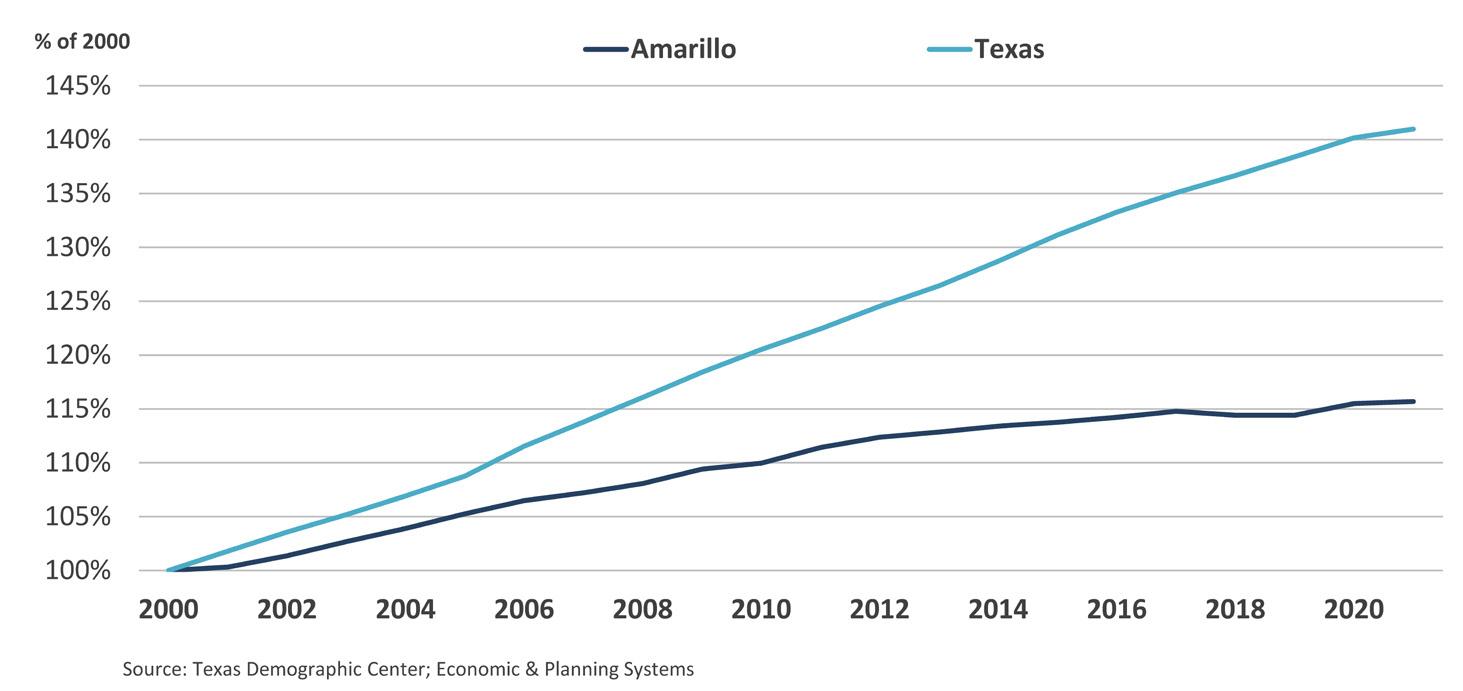
Texas: 41% Growth
Between 2000 to 2021


Amarillo: 16% Growth
Between 2000 to 2021
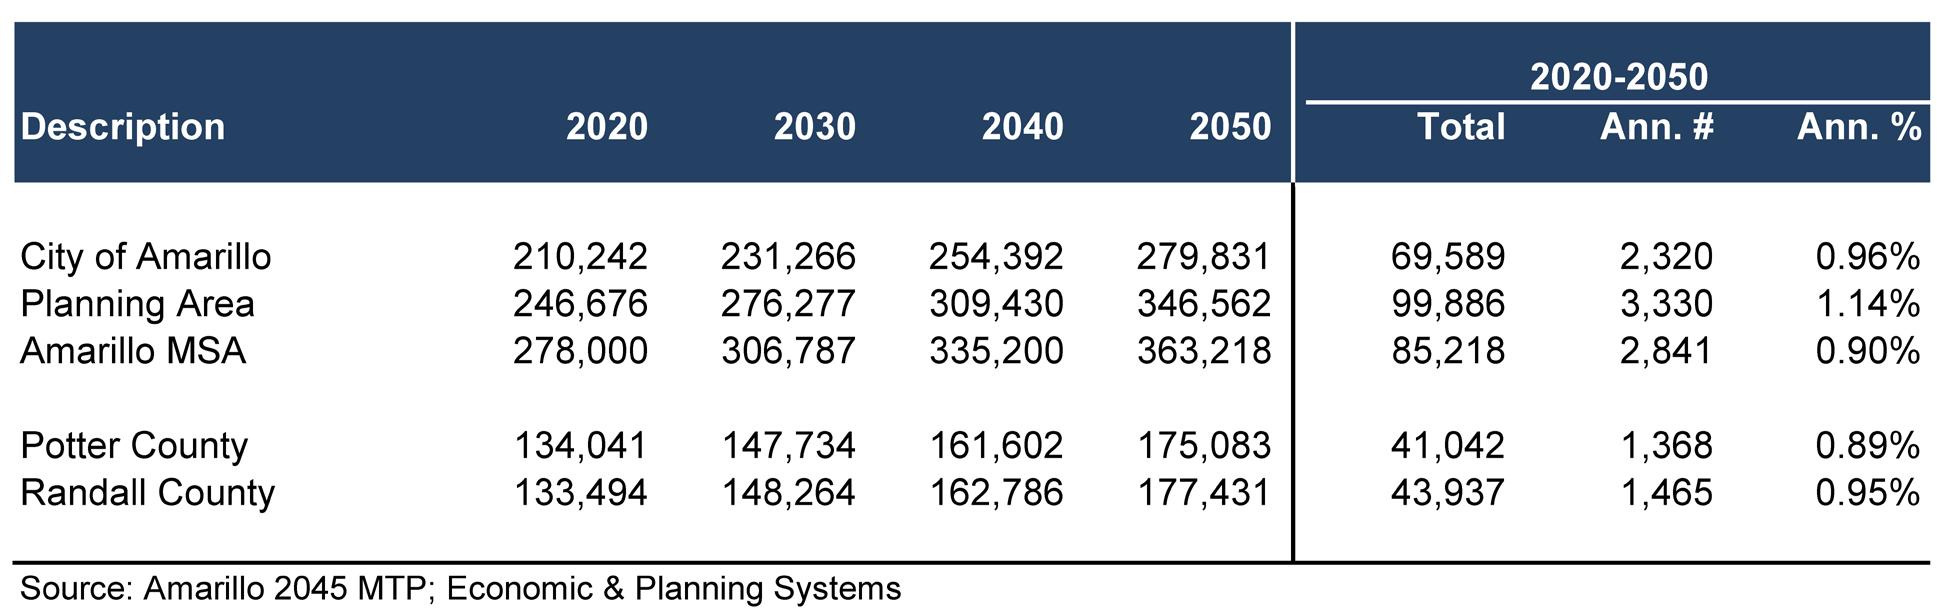
Figure 2. Population, Indexed, Amarillo and Texas, 2000-2021
Table 1. Amarillo MSA Population Forecast, 2020-2050
The Amarillo Metropolitan Planning Organization forecasts the City of Amarillo to grow at annual rate of 0.96 percent over the next 30 years, as shown in Table 1. This is a faster rate of growth for the City than it has experienced over the past two decades.
In Amarillo, the median age was 36.1 in 2021, up from 33.6 in 2010, and slightly higher than the median age in Texas of 35.4. As shown in Figure 3, 16 percent of the population in Amarillo is above the age of 65, which is higher than the State of Texas a whole. Fifty percent of Amarillo’s population is between the ages of 25 and 64, which represents the prime working population and slightly lower than the state percentage.
As of 2021, the population of Amarillo is 77 percent White, 7 percent Black, and 4 percent Asian, as shown in Figure 4. Thirty four percent of Amarillo’s population is of Hispanic or Latino origin, which is a lower concentration than found statewide (40 percent). The racial and ethnic makeup of Amarillo is less diverse than Texas.
In Amarillo, the median household income in 2021 was $55,174, compared to $67,321 in Texas as a whole. Sixteen percent of Amarillo’s population is below the poverty line, while 14 percent of the population statewide is below the poverty line.
34% of Population is of Hispanic or Latino Origin in Amarillo
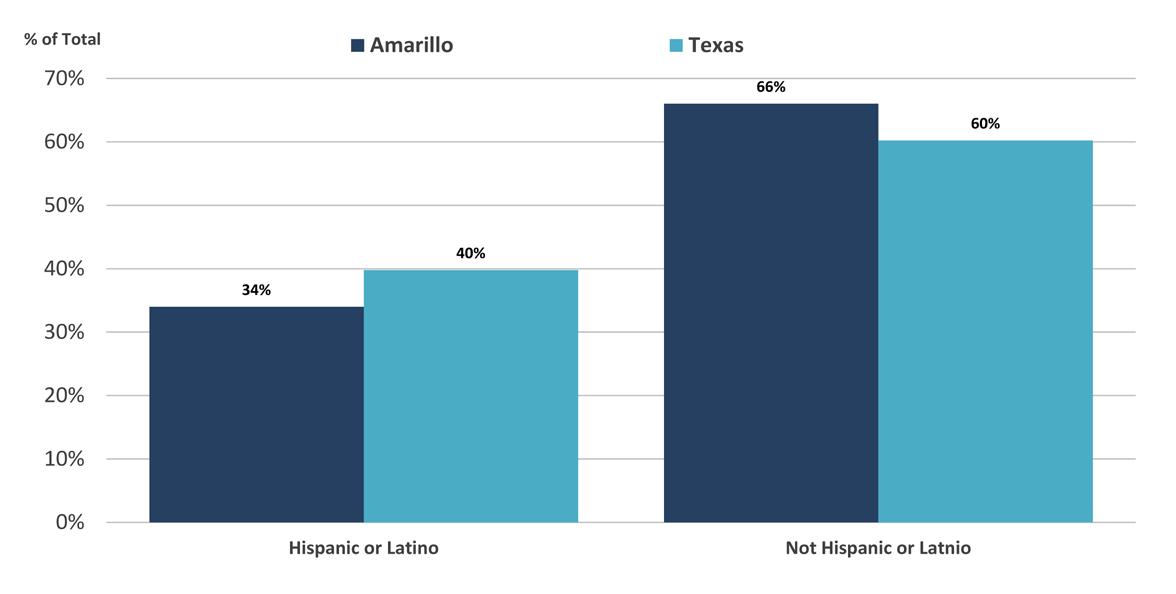
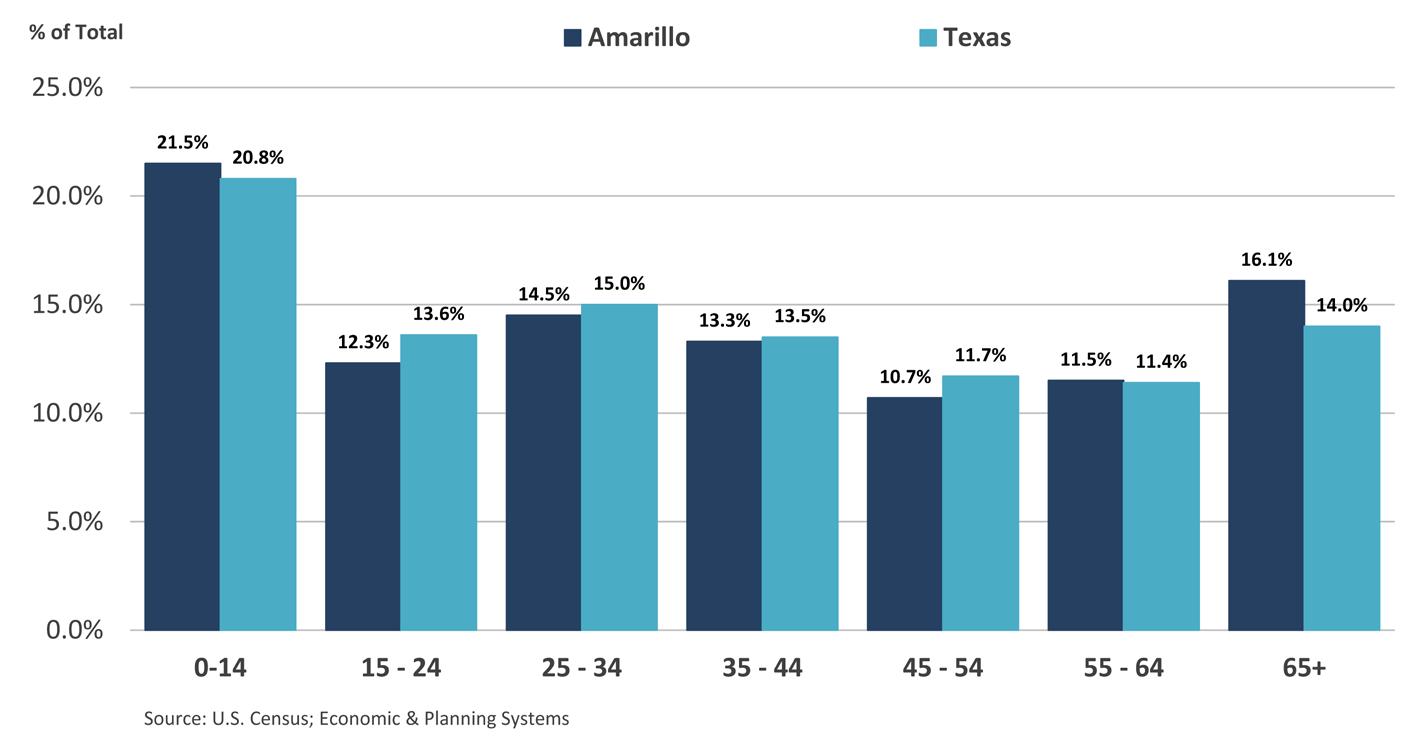
Median Age: 36.1 in Amarillo
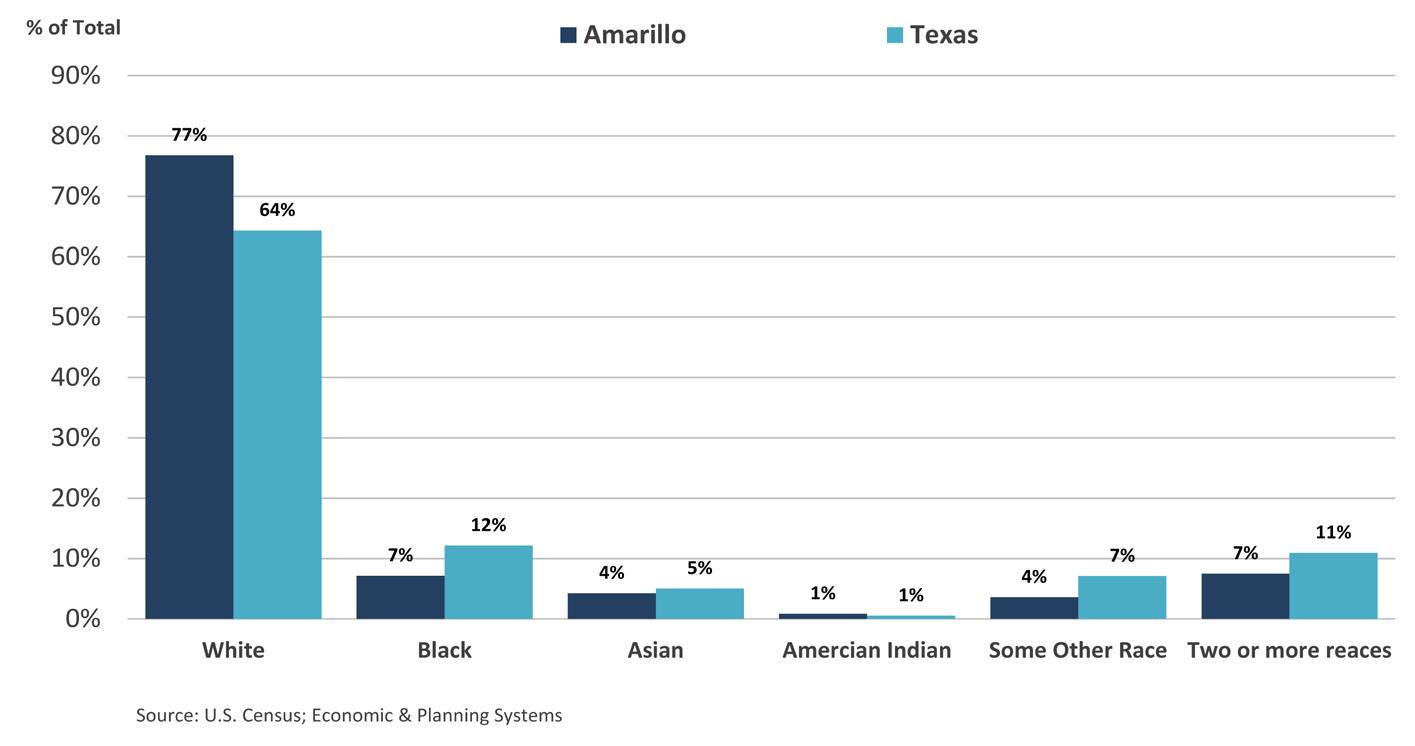
77% White Population in Amarillo
Figure 3. Population by Age Group, Amarillo and Texas, 2021
Figure 4. Population by Race, Amarillo and Texas, 2021
Figure 5. Hispanic or Latino Origin Population, Amarillo and Texas, 2021
GROWTH MANAGEMENT & CAPACITY
Existing Jobs and Trends
Employment in the Amarillo metropolitan statistical area (MSA) has gradually grown by 14,500 jobs in the last two decades, or 690 jobs annually. The change in employment represents an increase of 14 percent, or 0.6 percent annually, as shown in Figure 6. This indicates that employment has been outpacing population growth in the City. As of 2021, the total Amarillo MSA wage and salary employment was 116,572 jobs.
Amarillo MSA Total Employment:
116,572
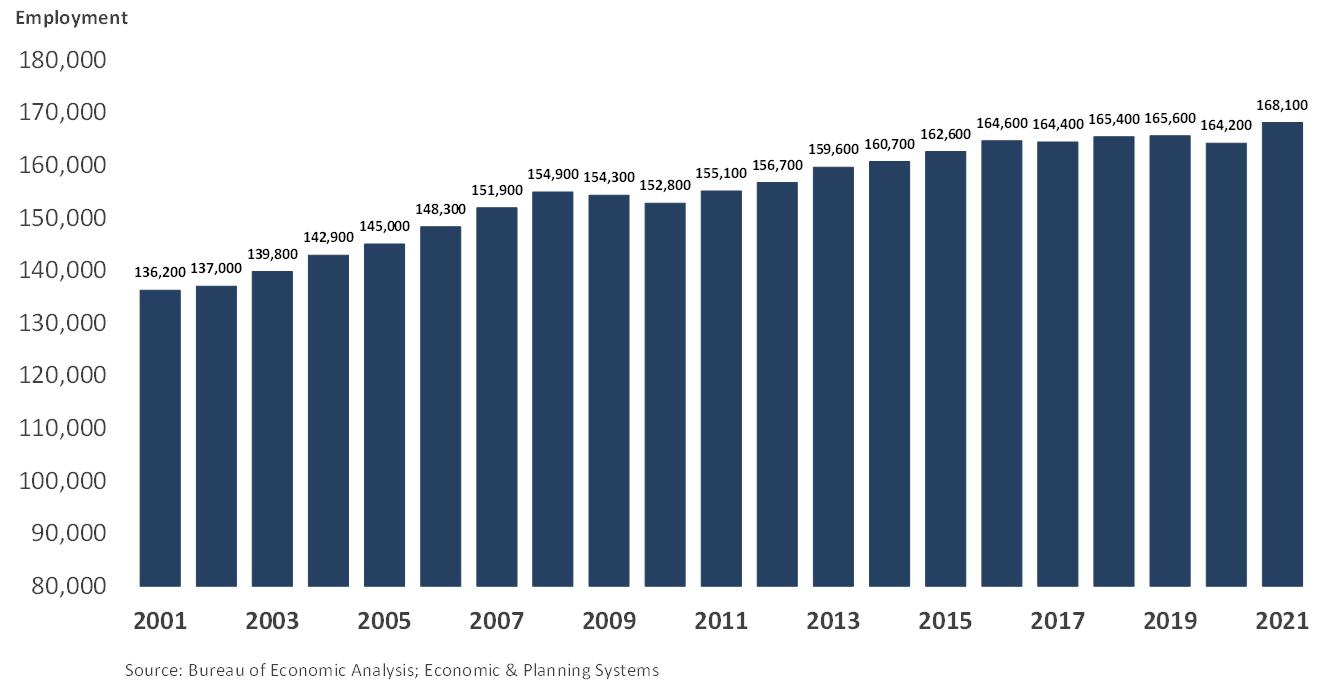
Figure 6. Total Employment, Amarillo MSA, 2001-2021
The economic base of the Amarillo metro area is diversified across several sectors. Among wage and salary employment, the largest sectors in the Amarillo MSA include Health Care, Retail Trade, Manufacturing, Accommodation and Food Services, and Educational Services, as shown in Figure 7. Between 2010 and 2021, the sectors to experience the most growth include Accommodation and Food Services, Construction, Retail Trade, and Transportation and Warehousing, as shown in Figure 8.
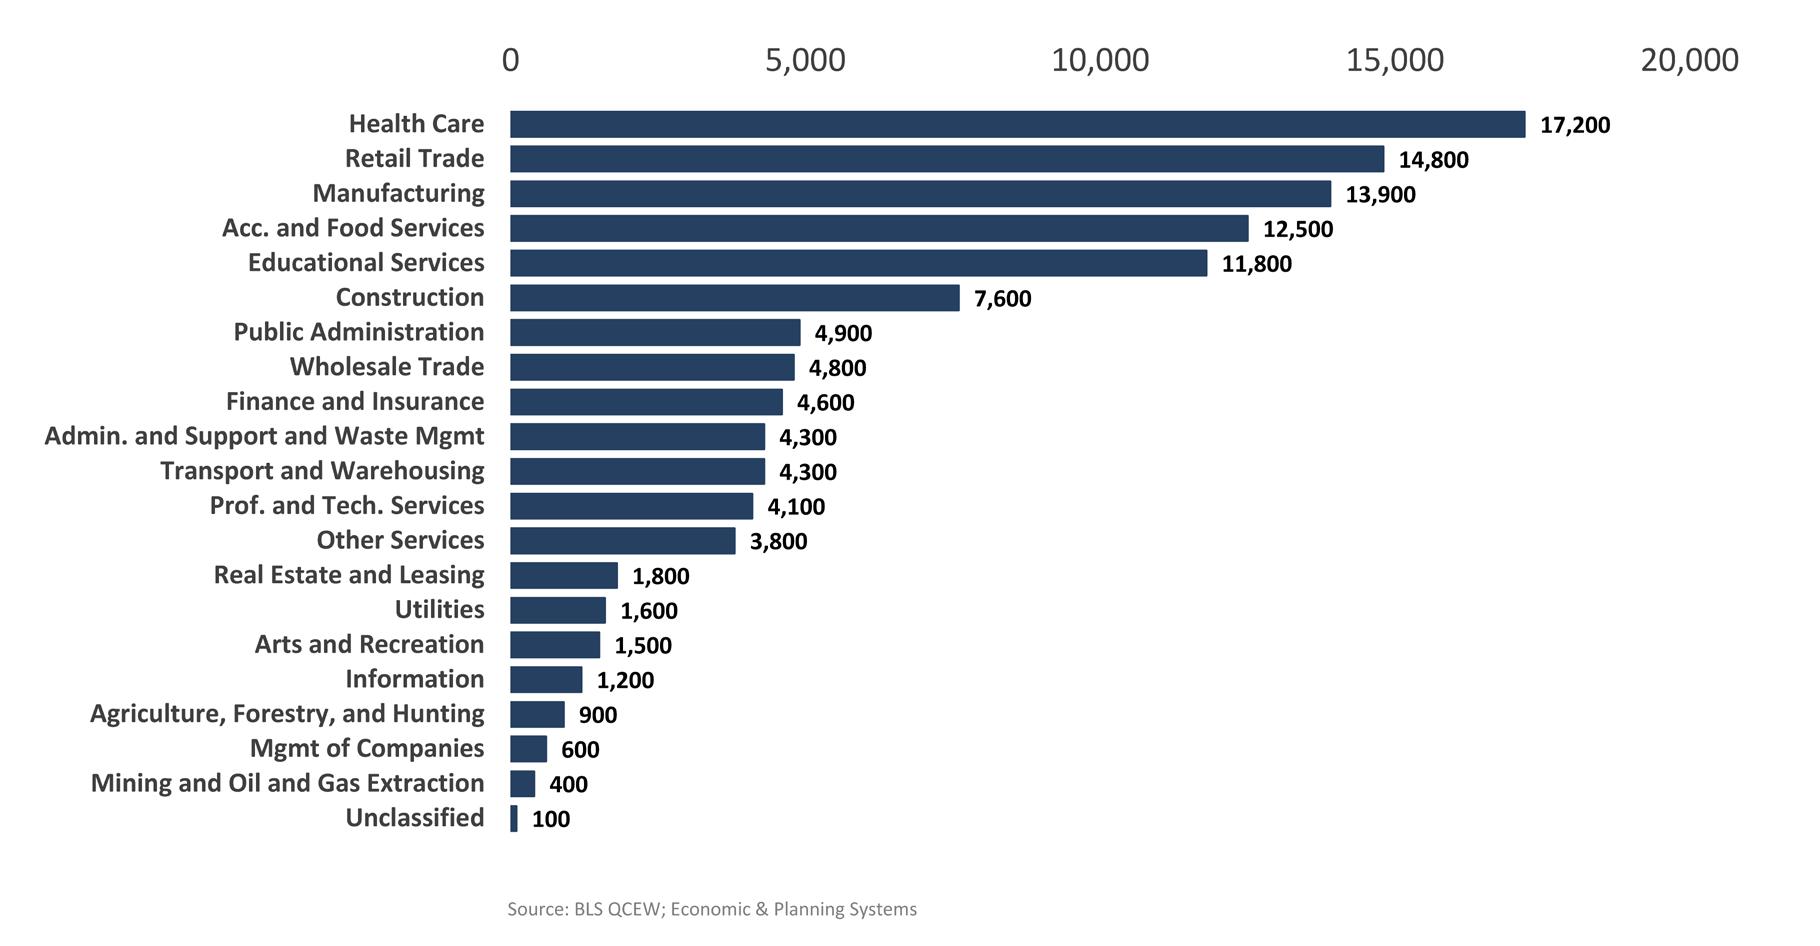
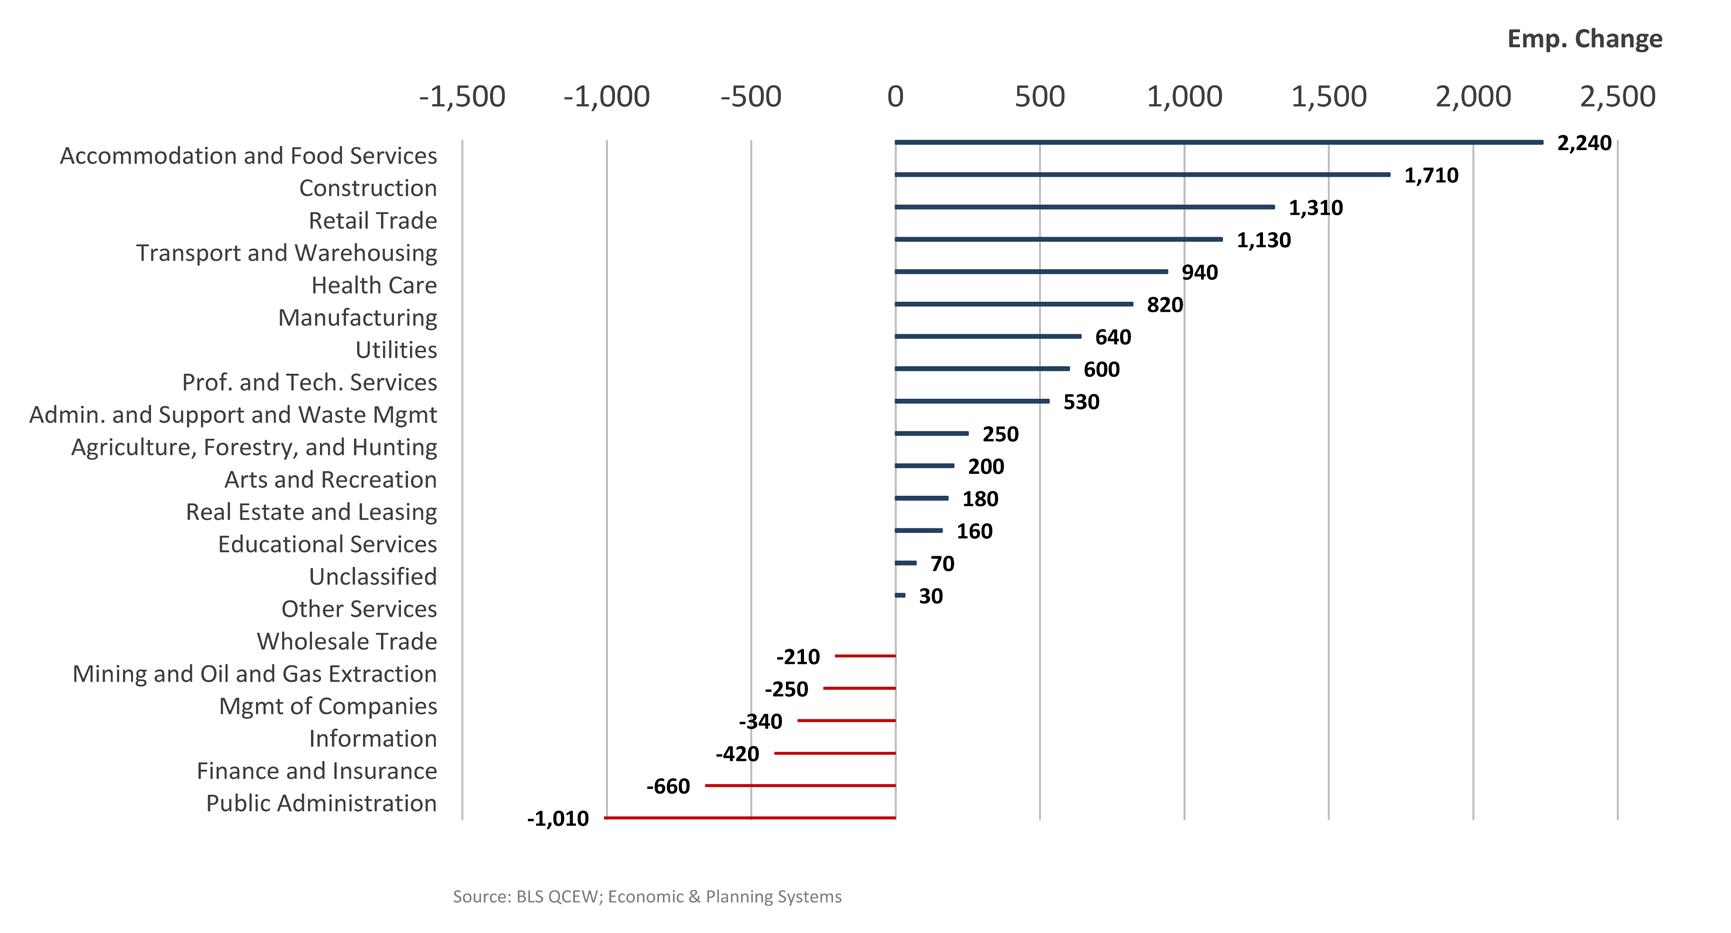
Healthcare is top sector in Amarillo for wage and salary
Largest employment growth in the Accomodation and Food Services sector
Figure 7. Wage and Salary Employment by Sector, Amarillo MSA, 2021
Figure 8. Employment Change by Sector, Amarillo MSA, 2010-2021
GROWTH MANAGEMENT & CAPACITY
Current Policies & Regulations Directing Growth
Align Amarillo Economic Development Strategic Plan
In 2017, Amarillo released a comprehensive economic development strategy. Align Amarillo Economic Development Strategic Plan outlined key economic development goals and associated strategies and tactics to achieve those goals. The goals include:
• Amarillo is a leader in applied education – preparing residents for the jobs of the future and supplying employers with a hard-working, highly-skilled workforce.
• Amarillo is an attractive city – with infrastructure, planning, and support systems in place that make it easy for businesses to grow and residents to get around.
• Amarillo is a global center for agricultural and life science research –recognized for its pioneering spirit and culture of entrepreneurship.
• Amarillo is a family-friendly community – rooted in Western heritage, but offering modern housing, cultural, and recreational options for all ages.
• Residents of Amarillo celebrate their community, and Amarillo is recognized as a top destination for businesses and skilled workers and their families.
Downtown Amarillo Strategic Plan
In addition, the City produced a Downtown Amarillo Strategic Action Plan in 2019 aimed at elevating the economic and cultural prominence of Downtown Amarillo in the region, as Downtown had experienced a lack of investment activity over the previous few decades. The plan emphasizes that the health of Downtown Amarillo is central to the City’s overall economic health and its quality of life. The plan formulates a set of goals to improve the vibrancy of Downtown. Some of these goals include:
• Attract new residential and office development
• Attract diversified retail and a grocery store
• Continue efforts to rehabilitate historic buildings
• Modernize the Civic Center complex
• Develop a security plan to ensure safety
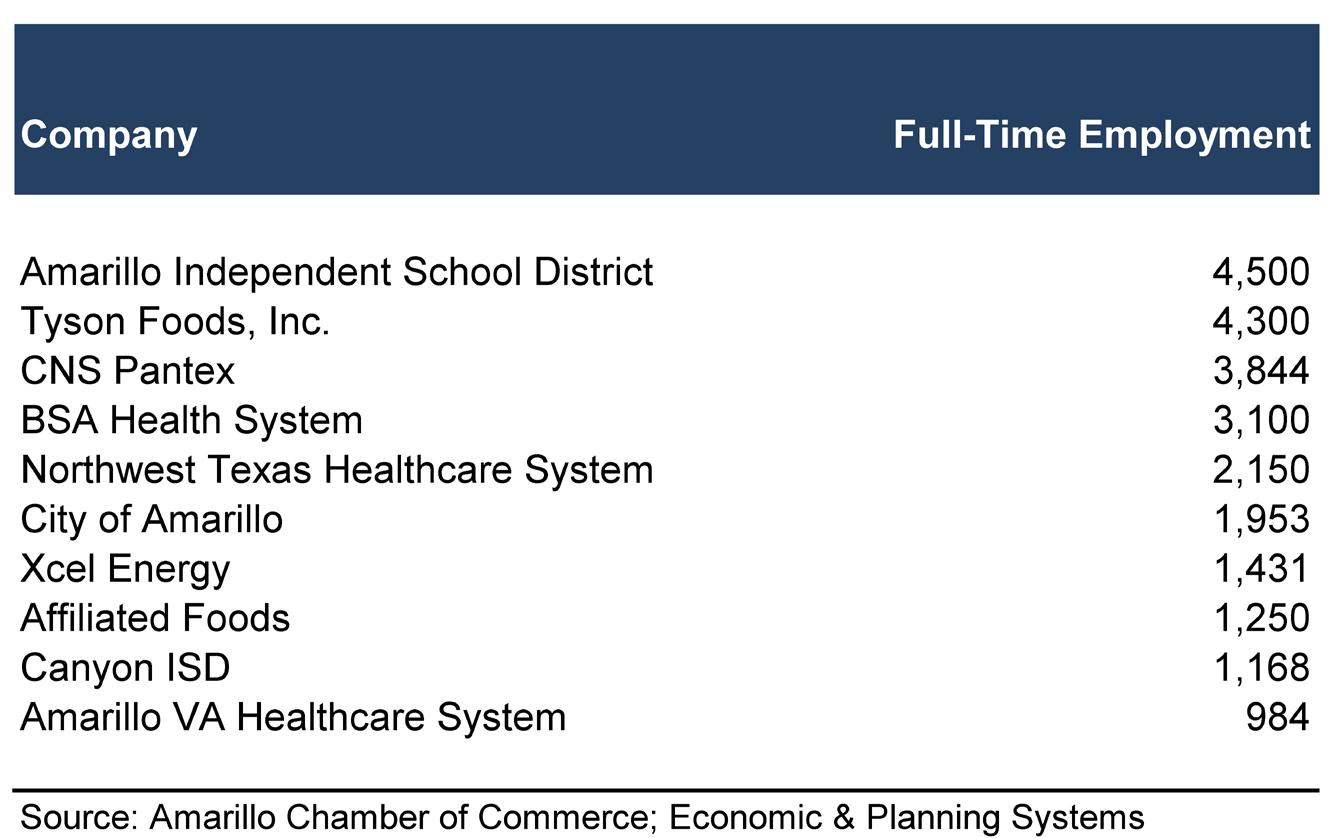


Table 2. Top Employers, Amarillo Area Top Employers in Amarillo:
Amarillo ISD
The City of Amarillo’s Zoning Ordinance is one of the primary tools used to implement the Comprehensive Plan — with a particular emphasis on the Land Use & Community Character element. Existing zoning and development regulations are codified in Title IV of the Amarillo Code of Ordinances: Building Codes, Development, and Zoning. Title IV includes six stand-alone chapters:
• Chapter 4-2: Signs
• Chapter 4-6: Platting and Subdivision Improvement and Maintenance
• Chapter 4-7: Manufactured Homes and Recreational Vehicle Parks
• Chapter 4-9: Airport Height Hazard and Zoning Regulations
• Chapter 4-10: Zoning
• Chapter 4-11: Landmarks and Historic Preservation
Although a major revision of the subdivision regulations was completed in 2015, the remainder of the City’s regulations range in age from
the late 1960s (Zoning) to the early 1990s and early- mid-2000s. The City initiated a major overhaul of the code in 2019, with a focus on the implementation of the 2010 Comprehensive Plan. Key priorities for the Zoning Ordinance Revisions effort were to reduce incompatibilities, protect neighborhood character, support opportunities for more diverse housing options, and reduce the need for updates to the Future Land Use map. A draft of the updated Zoning Code was released for public review in early 2022. Based on public input received, the decision was made to postpone the Zoning Ordinance Revision process until the current comprehensive plan update process, City Plan — Vision 2045, is completed.
TRENDS AND KEY TAKEAWAYS:
• The city of Amarillo grew slowly, but steadily, over the past decade by approximately .5% adding about 1,000 people per year. The counties; however, are experiencing more change with Potter County declining 2% over the past decade and Randall County increasing 14%.
• Amarillo is adding more jobs than people per year, averaging 1,600 jobs annually.
• The unemployment rate remains consistently one of the lowest in the state and the nation at 2.6% compared to Texas at 3.8% (December 2022).
• The City Limits currently comprises 105.13 square miles and Amarillo has a population per square mile of about 1,907 people. Compared to other similar sized Texas cities, we have 32% more land area on average and 32% fewer people. This means we have less revenue to cover more area.

LAND USE & COMMUNITY CHARACTER

LAND USE & COMMUNITY CHARACTER
Existing Land Use
Existing land use and development plans provide a starting point for understanding past planning efforts that have shaped and continue to shape the City of Amarillo. Land uses and their distribution affect the quality of life, health, and local experiences of residents, as well as people who work or visit the City. Carefully and strategically shaping the interrelationship of uses and urban forms is an important part of fostering better communities and neighborhoods. This analysis of existing land use distribution in Amarillo is based on Potter-Randall Appraisal District (PRAD) data.
Residential Land Uses
Making up the largest land use category of 31 percent, residential uses are found throughout Amarillo. Single family, or low-density residential uses, make up the bulk of the residential category (16,438.7 acres). Medium density residential uses (more than one unit per development/lot) can also be found in various parts of the City, but are generally clustered along major arterial roads on the west end of the City, such as Wolfin Avenue, Plains Boulevard, and S. Western Street; medium density residential uses make up 961.5 acres or 1.7 percent of all land use in the City.
Commercial and Industrial Land Uses
Commercial areas within the City make up 20 percent of all land use (11,419.8 acres). Most commercial land uses are located along major roadways, such as the Historic Route 66, S. Western St, Bell Street, and S. Coulter Street, and along highways such as Interstates 40 and 27.
Existing Land Use
The majority of industrial land can be seen located in the central and easternmost parts of the City, where a wide variety of facilities and warehouses, such as produce suppliers, meat packaging facilities, and agricultural producers can be found. The largest facility by acreage being the Ben E. Keith Foods West Texas facility, followed by Vaughn Concrete Products, both of which are located in the northeast part of the City. Industrial land uses make up 2.2 percent (1,297.9 acres) of all land uses in Amarillo.
Open Space Land Uses
Parks and open space, collectively, make up about 27 percent of the total land use in Amarillo (2,573.0 acres of park uses and 13,223.6 acres of open space). Some of the largest park land uses include Southeast Park, John Stiff Memorial Park, Thompson Park, and Gene Howe Park. Open space land uses include cemeteries, lakebeds, and other undeveloped areas of land.
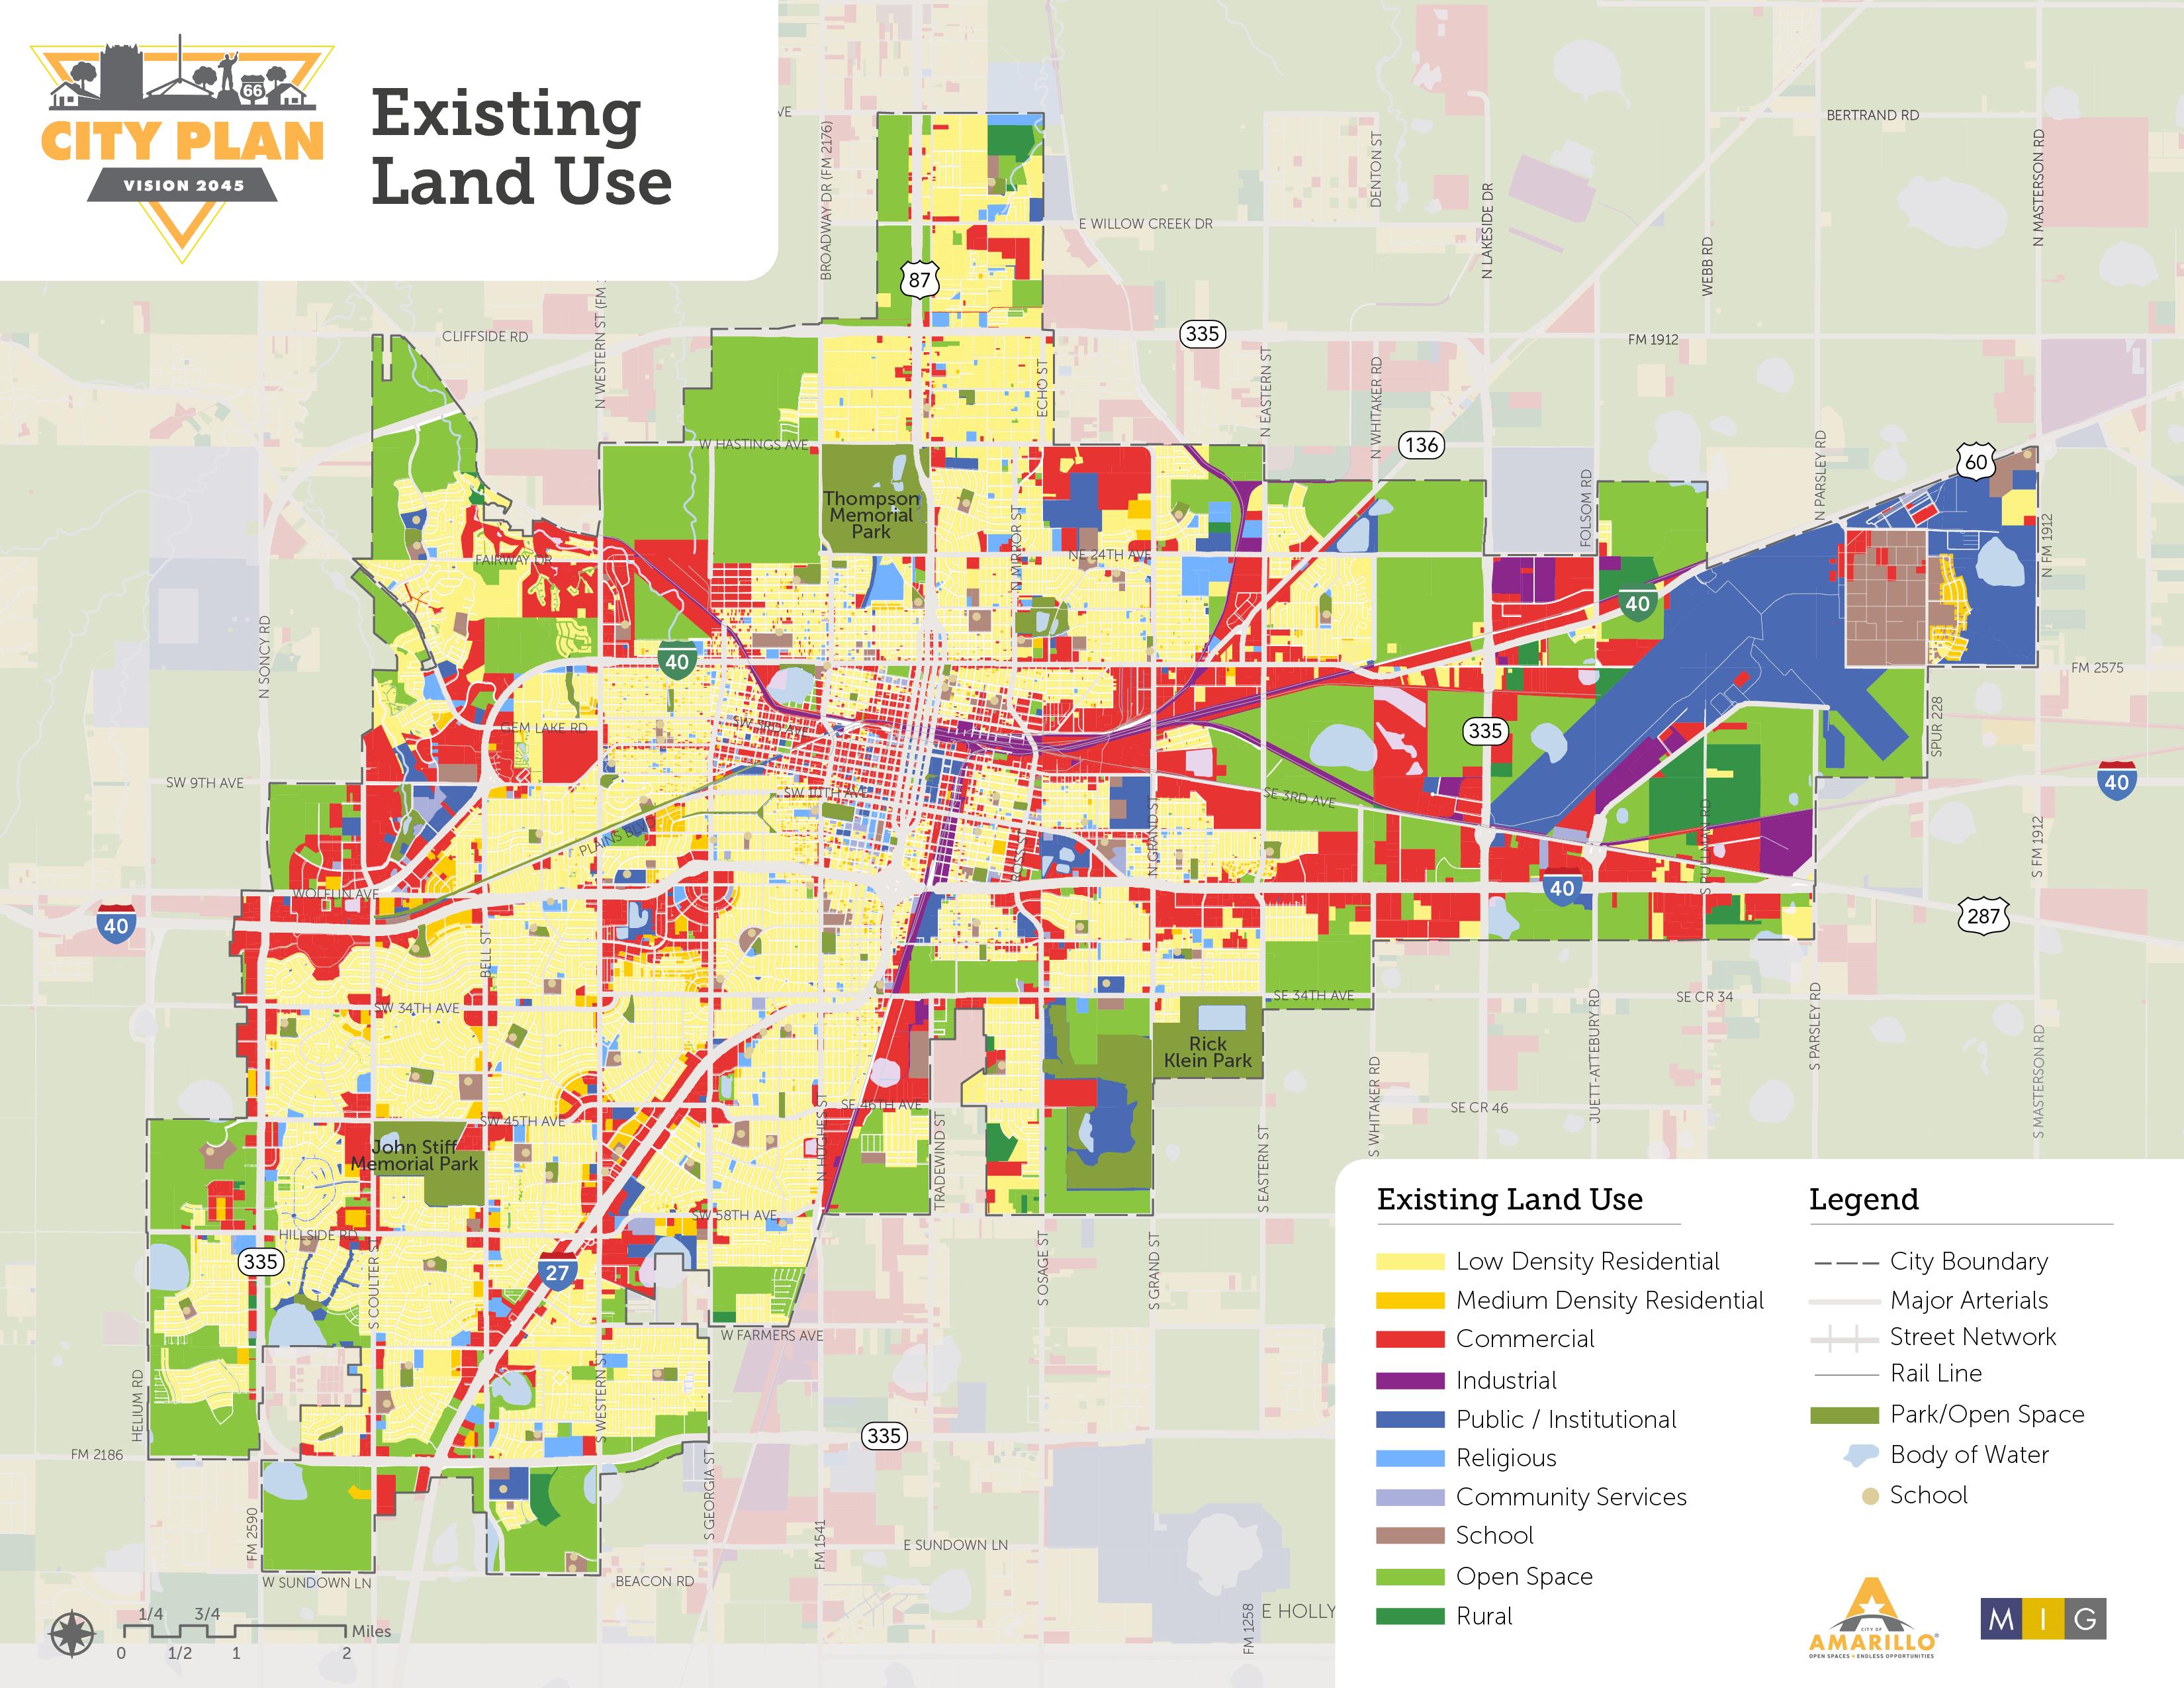
LAND USE & COMMUNITY CHARACTER
Public/ Institutional Land Uses and Community Services
Public/Institutional land uses include government offices, libraries, and utilities. The total land developed for public/institutional uses is 7,098.3 acres (or 12.3% of total land uses). While community services make up a total of 302.8 areas (0.5% of total land uses), this includes community centers, daycares, and homeless resource centers, such as that of the Faith City Mission on N. Tyler Street. Major educational facilities within the city include Texas Tech University on the west part of the City, Amarillo College (in the central and west parts of the city), as well as the West Texas A&M University Amarillo Center in the downtown area, offering a great workforce connection to local employers.
Other Land Uses and Vacant Land
Other land uses include sites, such as parking lots and vacant/undeveloped lands. A greater portion of vacant properties are located primarily in singlefamily residential areas in the central part of the City.
2010 Comprehensive Plan Summary
The 2010 Comprehensive Plan for Amarillo outlined four major themes that were derived from the concerns and hopes of residents, public and private leaders, as well as key community stakeholders and investors. These themes included:
• A City of Strong Neighborhoods
• Neighborhood and Commercial Revitalization in Older Areas of Amarillo
• Protection of Economic Anchors and Investment Areas
• Community Aesthetics and Image
Considering the current distribution of land uses across the City, it becomes apparent that the City has indeed focused on protecting and revitalizing economic and commercial areas. However, the cohesive planned future land use of the 2010 plan, shown on page 27, is not consistent with the current/existing land use. The table on page 26 demonstrates how each Future Land Use category was allocated. There is a clear target to create distinct and defined urban and urban center areas, which included more mixed-use, high-density residential, and live/work units, but instead these areas largely consist of predominantly commercial and public/institutional uses, as well as a few single-family residential lots. Other uses, such as industrial, general residential, and general commercial, are consistent with the existing land uses.
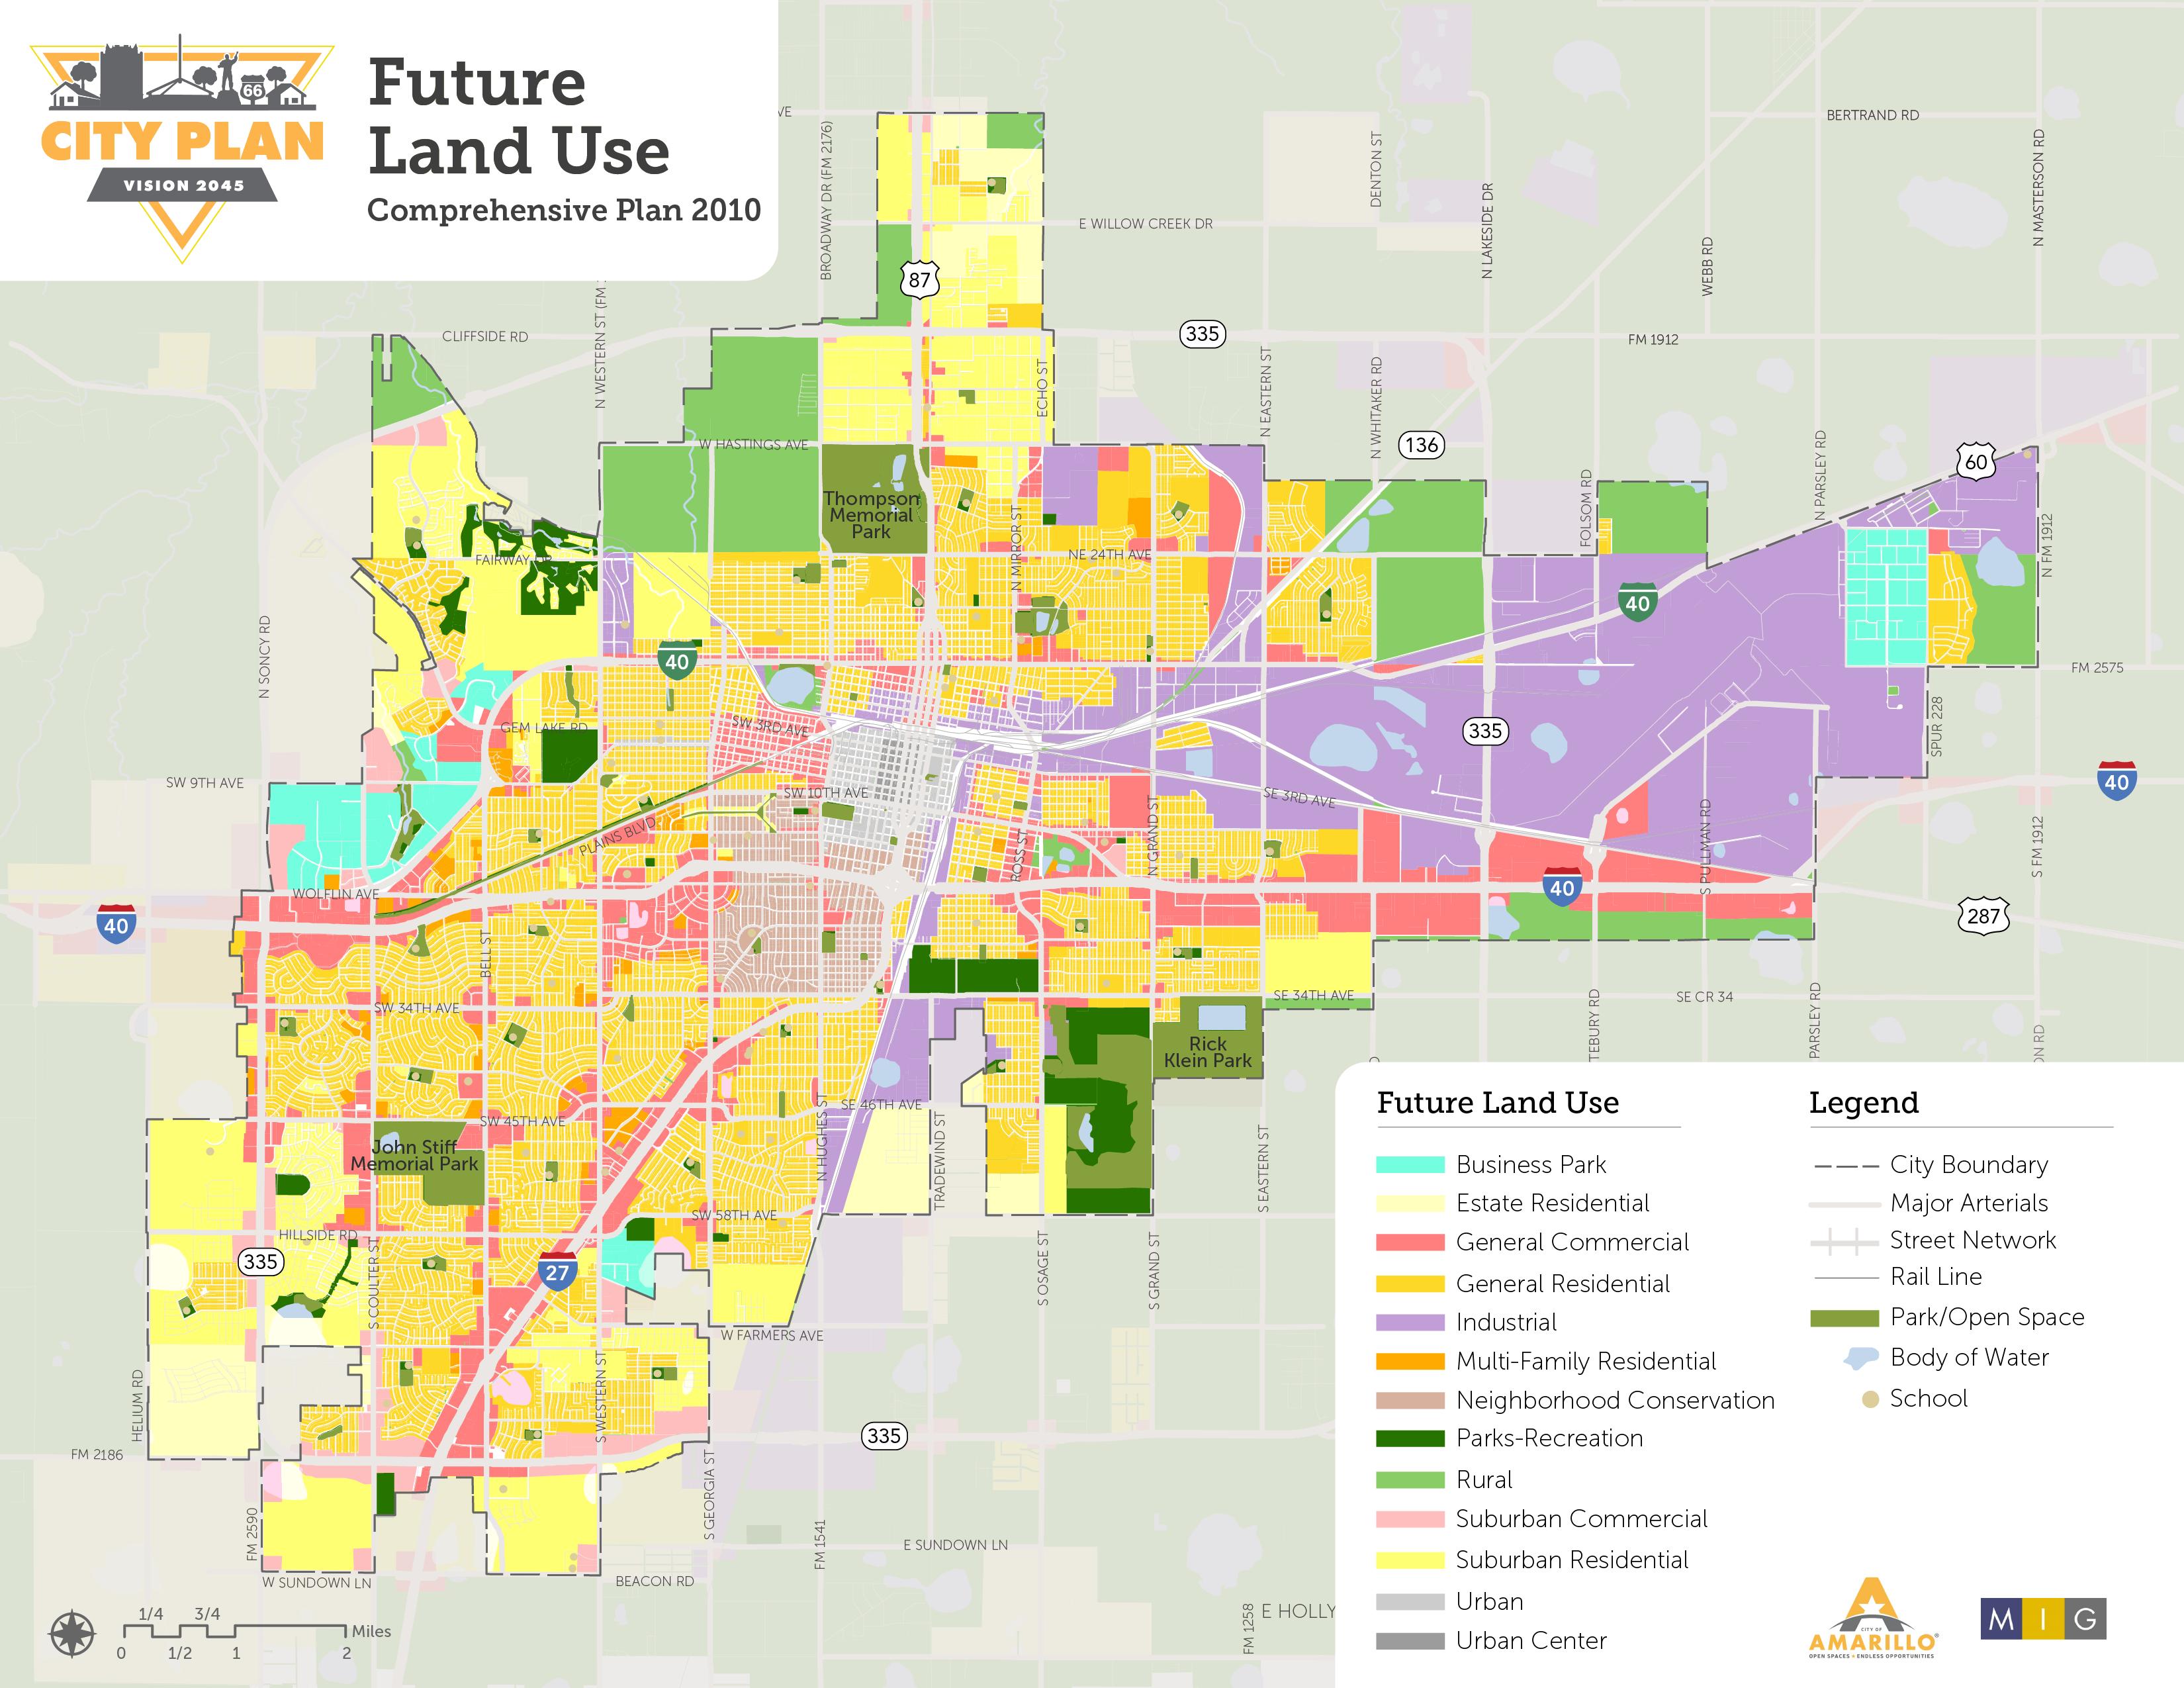
LAND USE & COMMUNITY CHARACTER
Community Character
The City of Amarillo looks to community character for an appropriate approach to future land use planning and growth. A character-based approach is integral to later formulating standards that support the desired community character, regardless of development type, construction type, and land use pattern.
The City of Amarillo has three main character identities and distinctive development characters: urban, suburban, and rural. The characteristic of the urban fabric is dense, active, pedestrian friendly streets, access to businesses, and is reliant on vertical development and street parking (e.g., Downtown Amarillo, Polk Street). Suburban areas around the city include characteristics such as irrigated lawns and turf areas, landscaping, single-family detached residential neighborhoods, and surface parking as a prominent feature in most developments. Rural areas on the edge of Amarillo have wide open landscapes, with views infrequently interrupted by buildings. Rural areas in Amarillo typically include low density development and private, detached homes.
Amarillo’s identity and image directly correlates to the City’s economic anchors and investment areas.
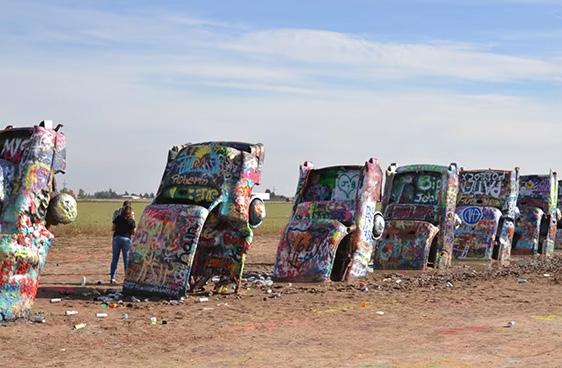
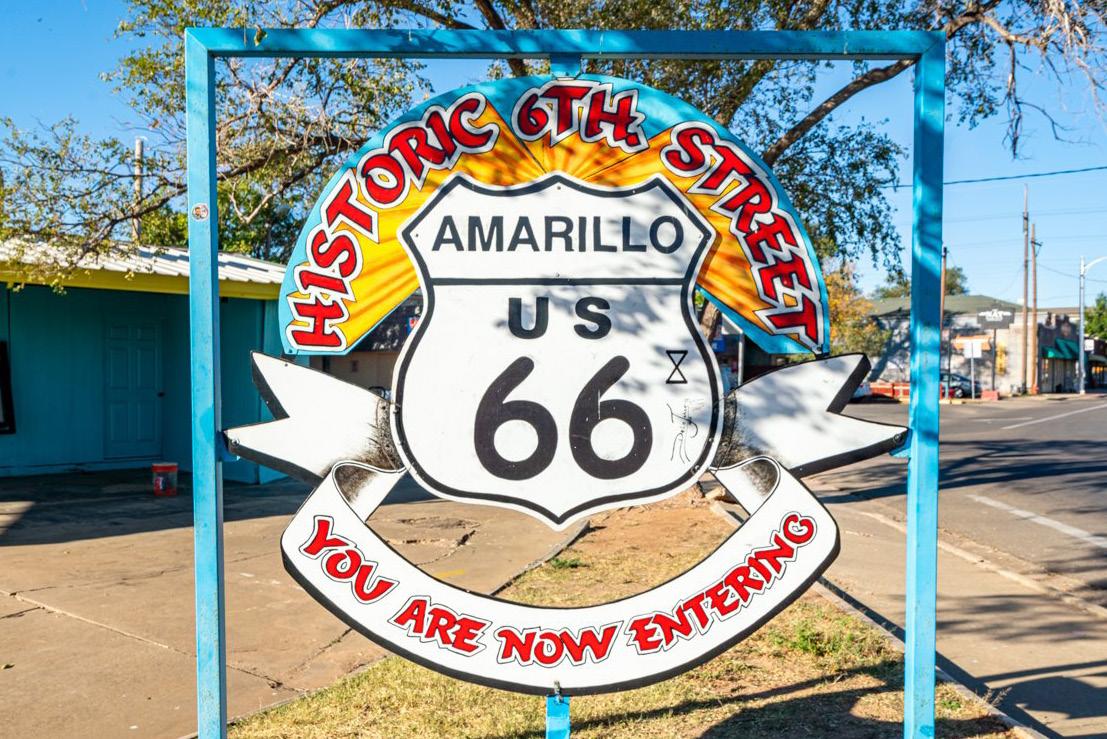
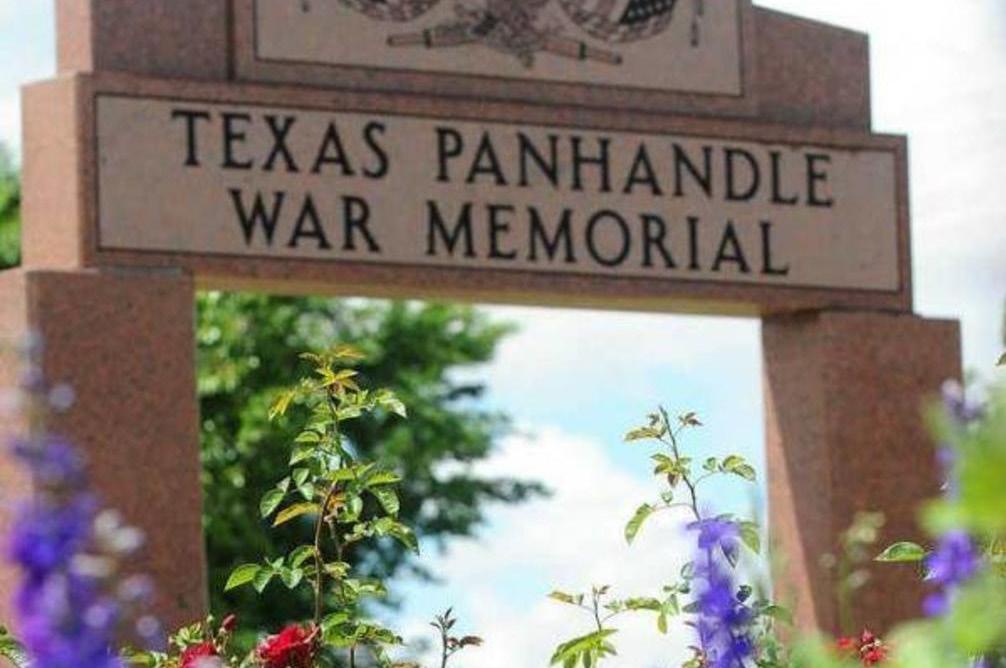
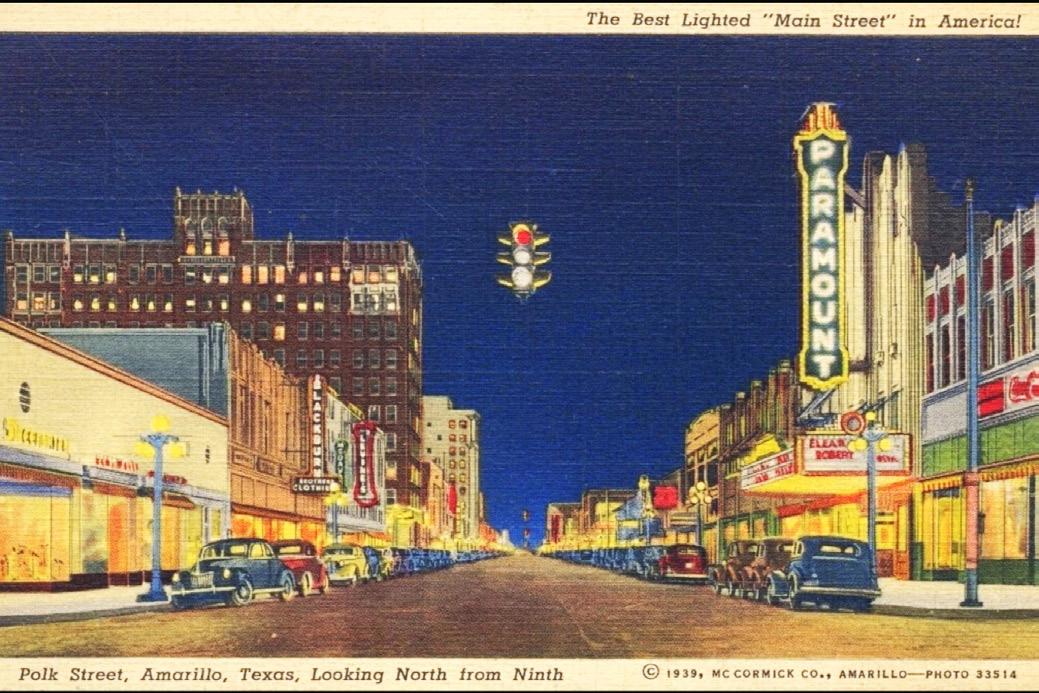
A few notable areas in the City include the Harrington Regional Medical Center and the surrounding district, Amarillo’s two airports, the downtown, Amarillo’s college campuses, the Tri-State Fairground area, and the City’s two interstate highway corridors with adjacent hospitality areas. Other corridors and nodes around the City where shopping services are focused are also points for economic activity.
Rural areas generally have high open space ratios, minimal building coverage, and very low-density development. The Urban character type is mostly found in the downtown area of Amarillo. Some of the elements that of Urban development include vertical development, spaces framed by buildings, zero and minimal building setbacks, and on street parking.
Railroads and interstate highways, including the Historic Route 66, have also aided in connecting Amarillo to important destinations. Given the access to railroads and highways, community character has always been a forefront issue for Amarillo residents. Additionally, large footprint commercial development and hospitality uses tend to be clustered along the interstate highways. This creates a pattern of dependence on interstates to reach commercial centers.
Neighborhood Unit Concept
An implementation success from the 1980s Comprehensive Plan is the Neighborhood Unit Concept. This has shaped new development in Amarillo since that time providing guidance on how to develop one-mile sections. The NUC locates lower-density housing types in the interior, centered around a neighborhood park and/or elementary school campus; larger commercial and institutional uses at the neighborhood edges and major intersections; and attached and multi-family housing and small-scale office uses providing a transition from the interior to the more intensive perimeter uses. This has resulted in a suburban development type for the newer parts of Amarillo, but the concept is more difficult to apply to the older parts of the city.
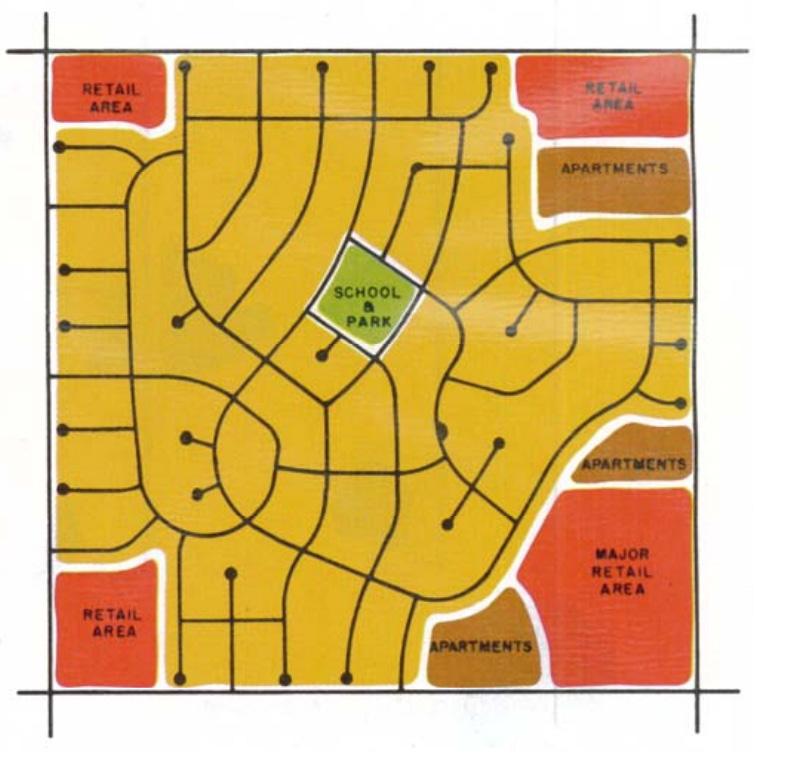
TRENDS AND KEY TAKEAWAYS:
• Most of Amarillo is developed as single-family neighborhoods (28.4%) and general commercial (19.7%). The 2010 plan calls for creating distinct and defined urban centers with a mix of uses, but this development type is not yet taking place.
• An implementation success from the 1980s Comprehensive Plan is the Neighborhood Unit Concept. This has shaped new development in Amarillo since that time providing guidance on how to develop one-mile sections. This has resulted in a suburban development type for the newer parts of Amarillo, but the policy is difficult to apply in the older parts of the city.


HOUSING & NEIGHBORHOODS

HOUSING & NEIGHBORHOODS
Overview of Existing Housing Stock
In 2021, Amarillo had approximately 90,000 housing units. Between 2010 and 2021, the housing stock grew by 10,000 units, or 900 units annually, which represents an average annual growth rate of 1.1 percent. Among occupied units, 60 percent were owner-occupied while 40 percent were renter-occupied. The percent of owner households versus renter households has not changed significantly in recent decades.
The housing stock in Amarillo is relatively old. Almost half of all units are more than fifty years old, while 75 percent of units are more than thirty years old, and only 11 percent are less than 10 years old, as shown in Figure 9.
Most of the housing stock in Amarillo consists of single-unit homes, which represent 79 percent of all housing units, as shown in Figure 10. By comparison, structures with 2-4 units comprise 4 percent of the housing stock, structures with 5-20 units comprise 9 percent, and structures with more than 20 units comprise 7 percent of the housing stock.
75% of Housing Units are more than 30 years old
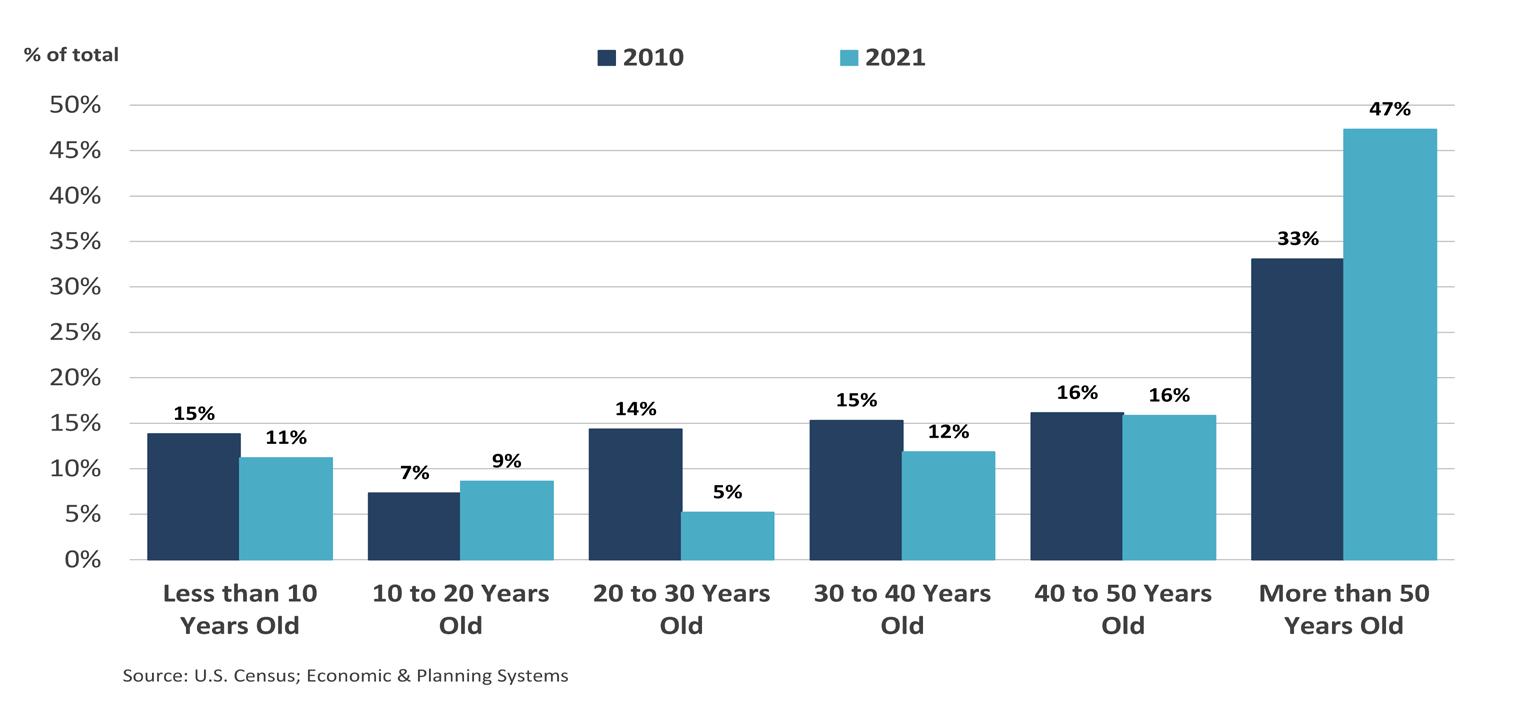
Amarillo has experienced periods of boom and bust in terms of growth as evidenced by population changes post World War II. There was significant development of housing in what is now the central part of the City in the 1950s and 1960s followed by a period of population decline in the 1970s. New development from that point on occurred on the edges of the city in greenfield areas and the central part of Amarillo experienced a loss in population and housing units. This loss of housing in the central part of the City has not been regained in some areas. The Housing Unit Change map shows the change in housing units by Census Tract (note the boundaries are 1970 Census Tracts) in the Amarillo area from 1970 to 2020. Also shown on the map are vacant and unimproved lots, which illustrates the higher concentrations of small, vacant lots in some of the central Amarillo neighborhoods.
Diversity of housing stock from 2010 to 2021 is nearly unchanged
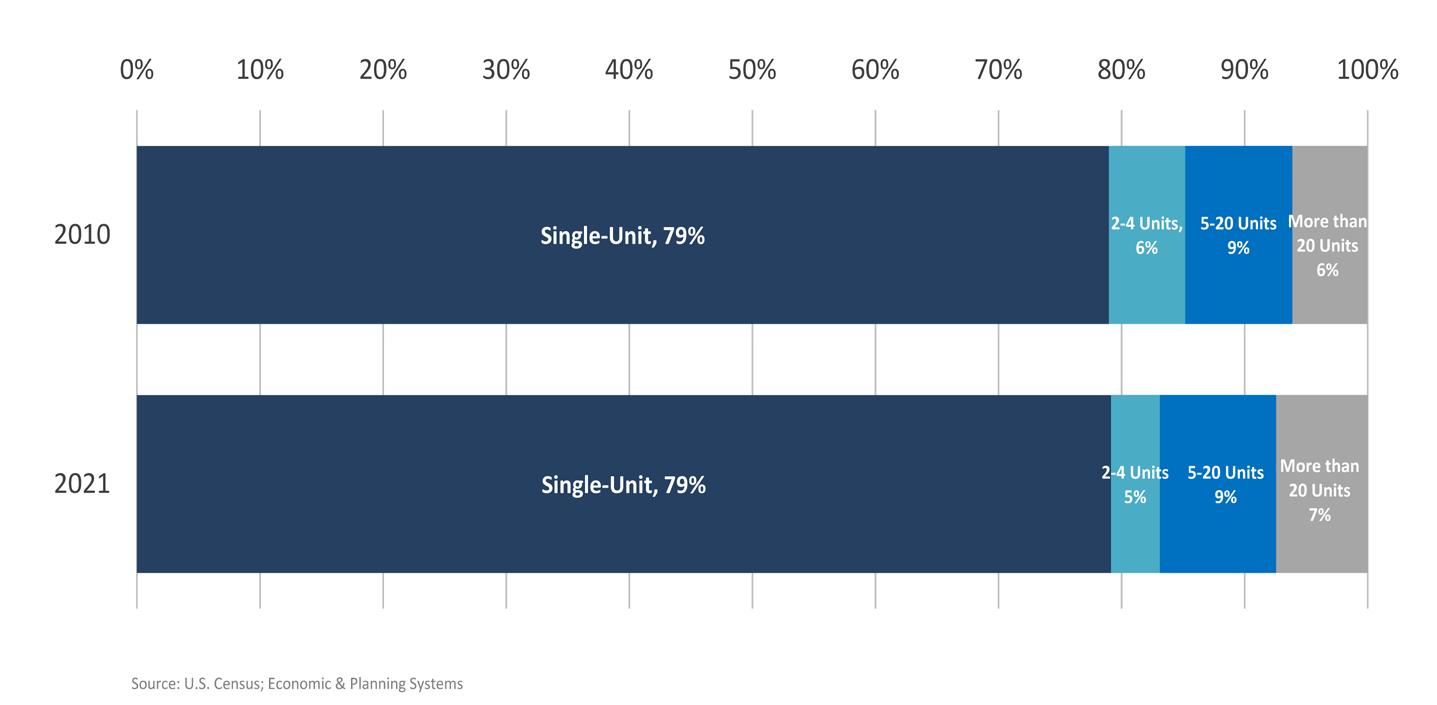
Figure 10. Housing Stock by Units in Structure, Amarillo
Figure 9. Housing Stock by Age, Amarillo
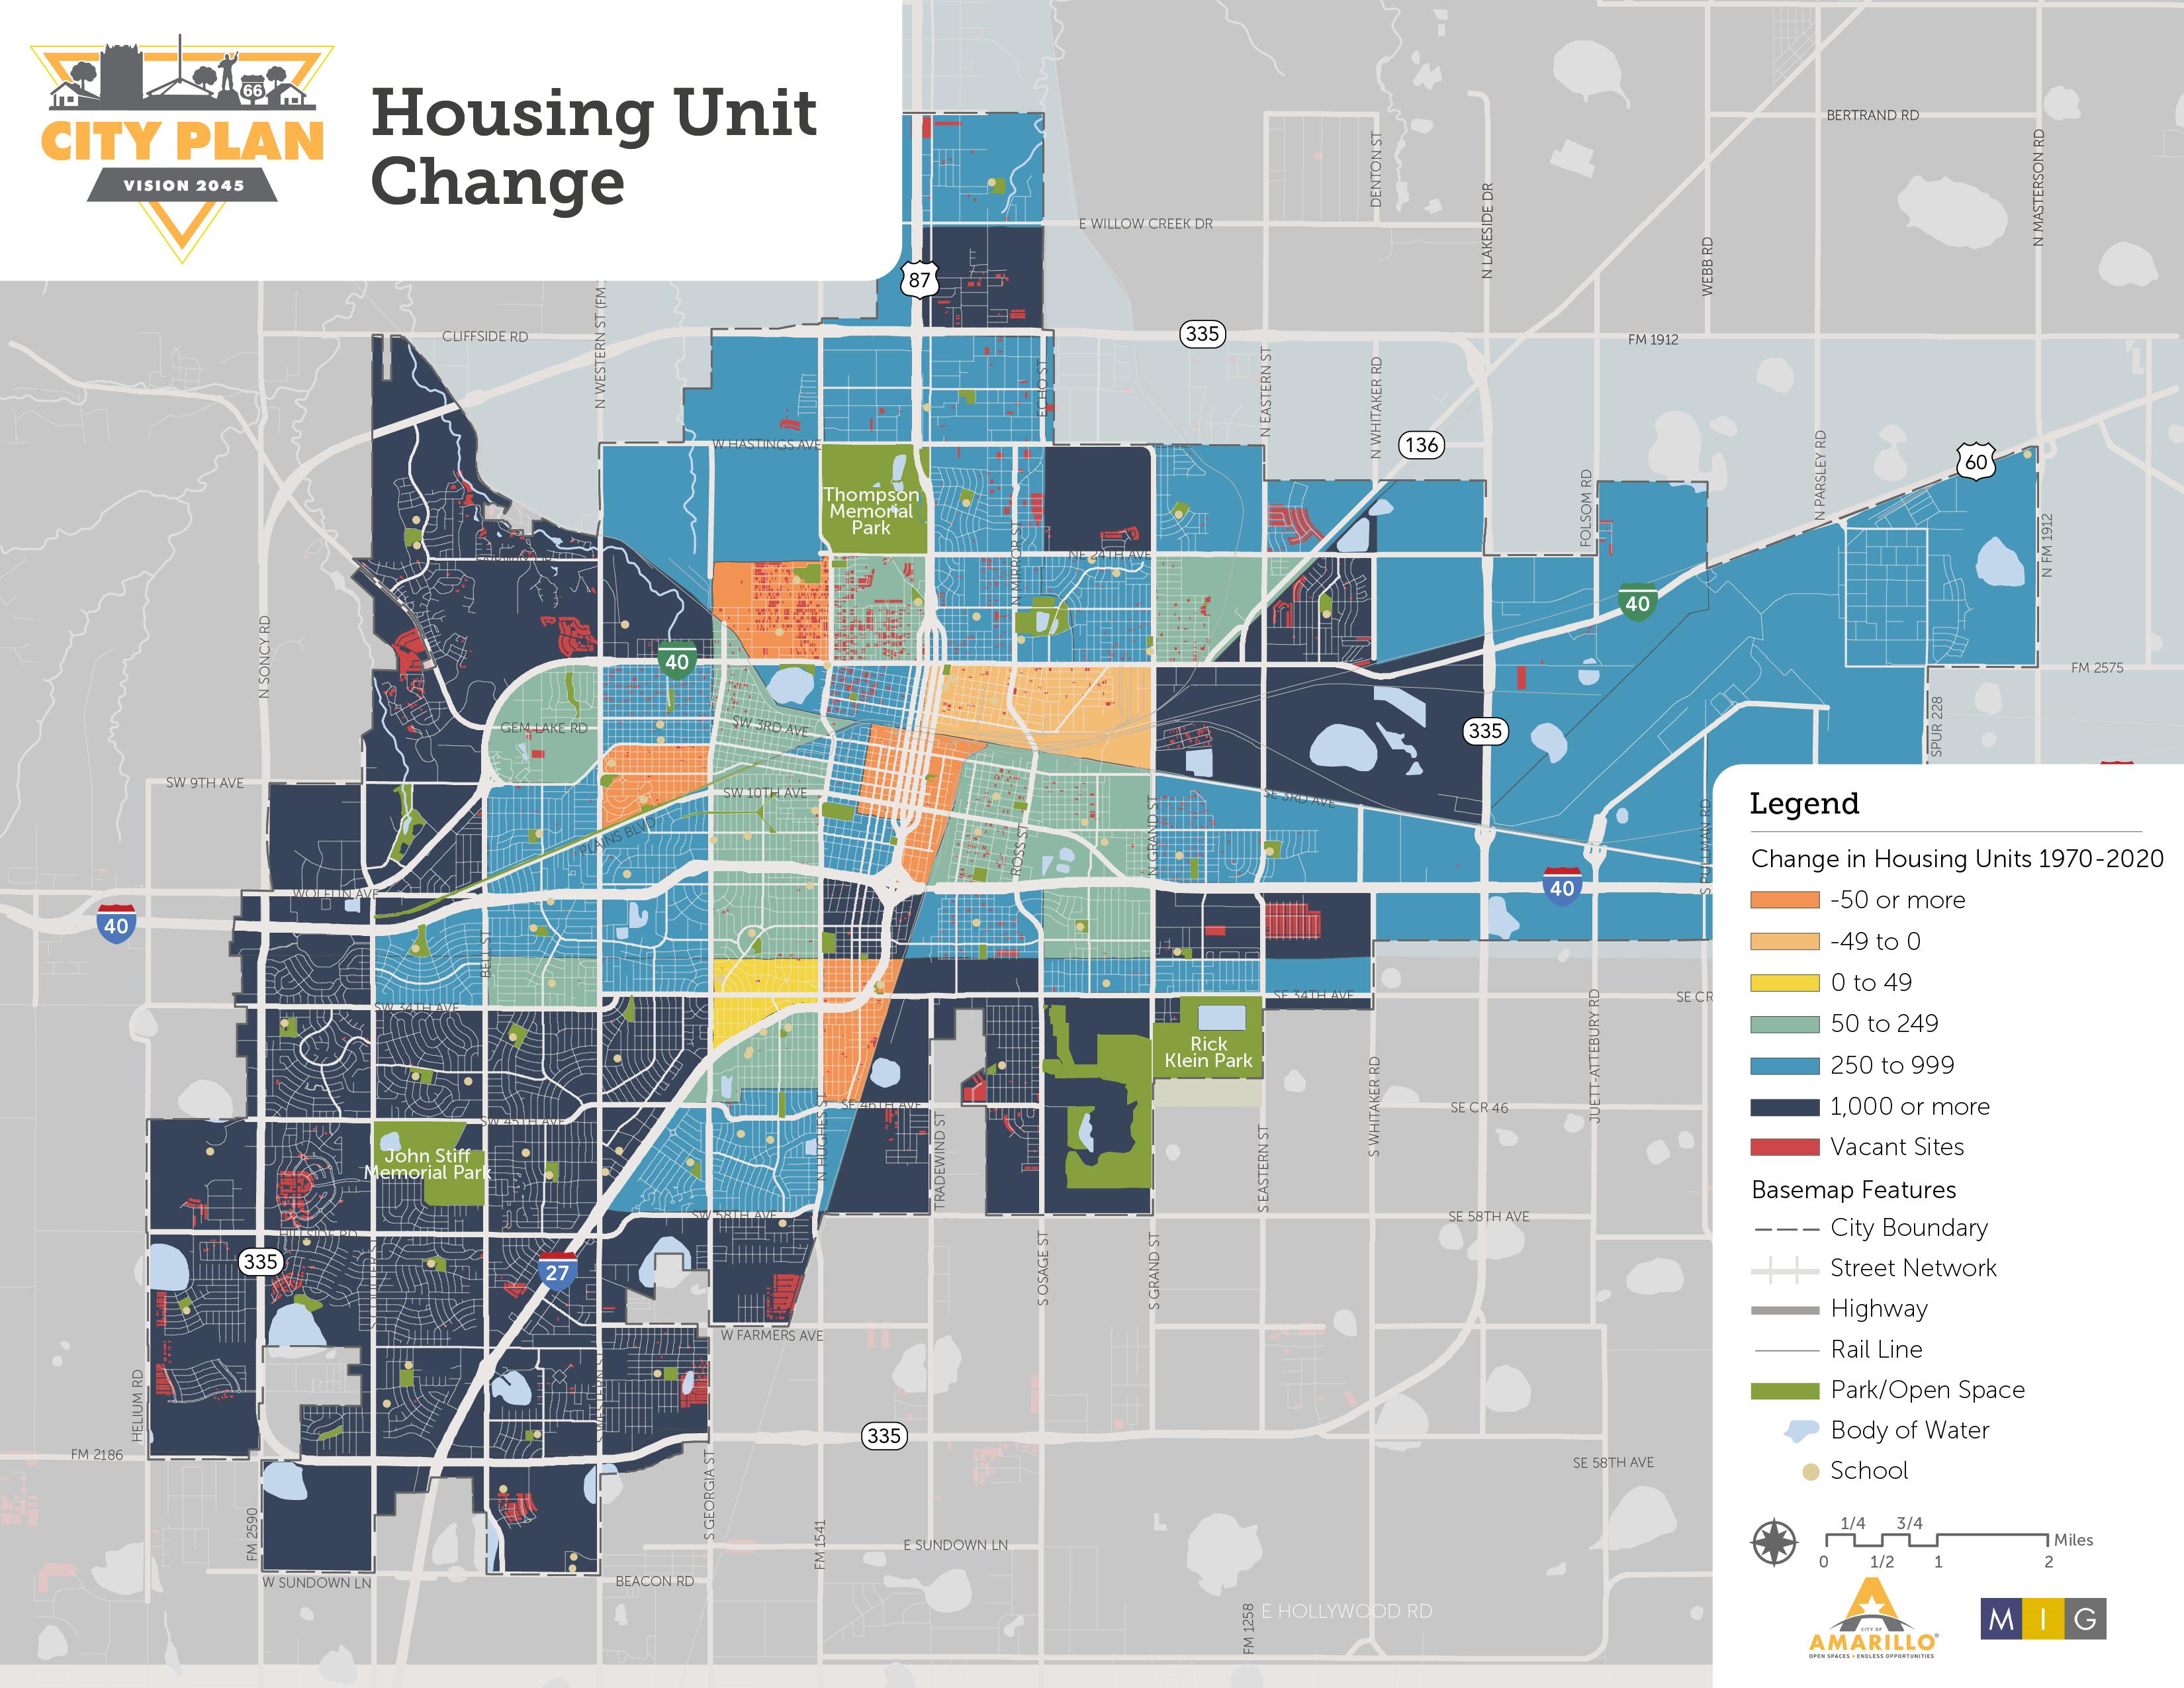
HOUSING & NEIGHBORHOODS
New Development
New residential construction activity in Amarillo has been stable over the past decade. As shown in Figure 11, Amarillo has issued permits for 7,564 units between 2010 and 2021, which represents an annual average of 630 units. Most of the units delivered have been for single-unit homes, which comprised 87 percent of all units permitted during this time.
Between 2010 and 2022, much of the new commercial development in Amarillo has occurred on the southern and western sides of the City, especially near the major interstates, as shown in the Development Activity map. Over that period, Amarillo experienced 500,000 new square feet of office development, 740,000 new square feet of retail development, and 990,000 new square feet of industrial development.
2010 Comprehensive Plan Summary
According to the U.S Census Bureau, the population projection for Amarillo in 2040 is estimated to reach 255,680 residents. With the continuously growing population, the need for diverse housing options becomes imperative. The 2010 Comprehensive Plan highlights housing issues and priorities for the City of Amarillo and envisions elements that “contribute to quality and sustainable neighborhoods, both in new construction and in the City’s oldest residential areas”. The plan examines issues and needs and builds on successful outcomes from previous plans to develop comprehensive key planning themes.
The key planning theme from the 2010 Comprehensive Plan for the City of Amarillo is to ensure that there is an adequate variety of housing available in neighborhoods that are desirable places to live. An ongoing challenge for
Annual average is 630 new housing units
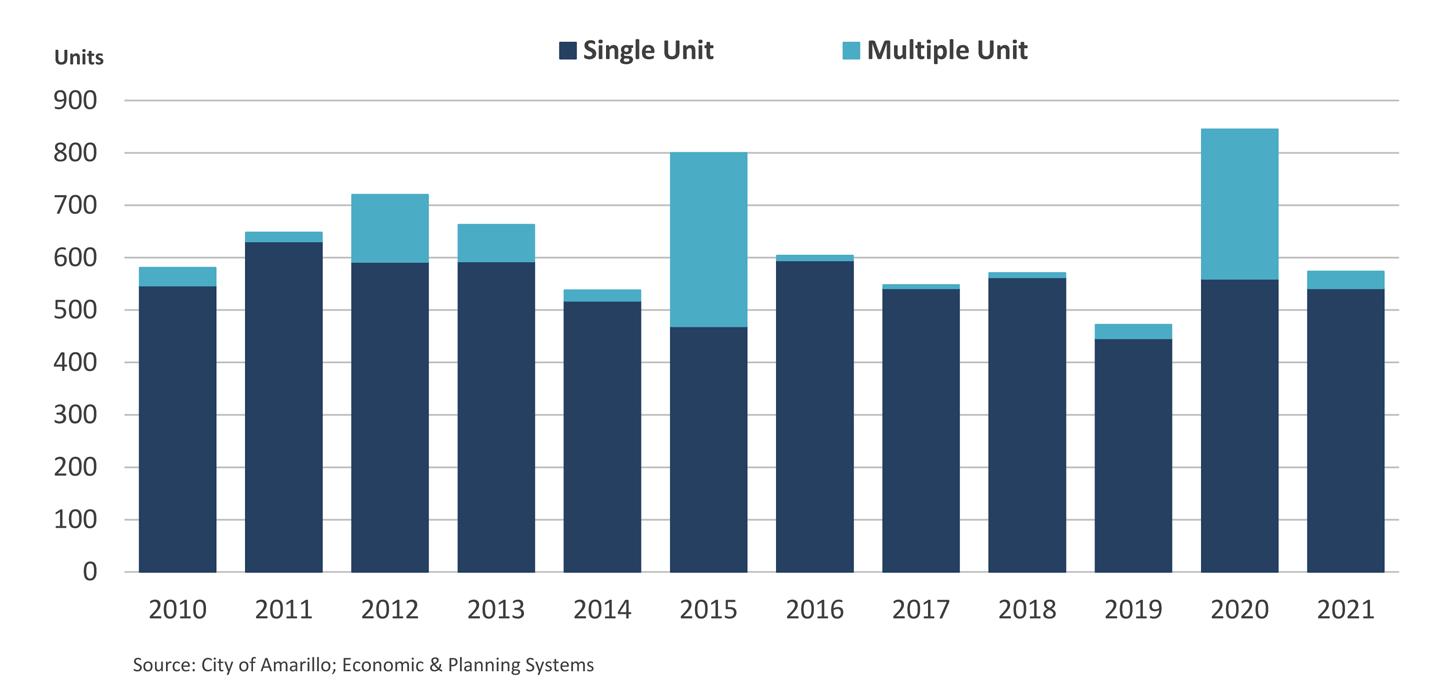
the City of Amarillo has been enhancing neighborhood quality and sustainability in its lowest-income areas. The following themes emerged as priorities for the Housing and Neighborhood element in the plan:
• Variety and Balance
• Quality and Sustainability
• Neighborhood Integrity
The goal of obtaining a variety and balance of housing options is important to the community to support the needs of residents as they progress through life. The 2010 Comprehensive Plan’s housing trends data identified townhomes and garden homes becoming a necessary option for the City. The Comprehensive Plan also notes the need for multi-family housing developments to accommodate new residents, a growing medical employment industry, the retirement community, and opportunities for downtown living.
Quality housing and neighborhoods are vital for the growth of Amarillo. Creating livable communities for residents with amenities and open space and better connection to commercial areas is essential. Enhancing neighborhood quality in lower income areas will encourage neighborhood stability. It’s important to note that nearly
Figure 11. Residential Building Permits, Amarillo, 2010-2021
74% of Amarillo’s housing was built before 1980, which is a contributing factor to homes needing maintenance. The City of Amarillo understands the importance of preserving established neighborhoods and historic sites. While code enforcement can help mitigate some of the issues of aging communities, the Comprehensive Plan encourages the City to collaborate with stakeholders and partners to support and revitalize local neighborhoods and incorporate significant sites into neighborhood design.
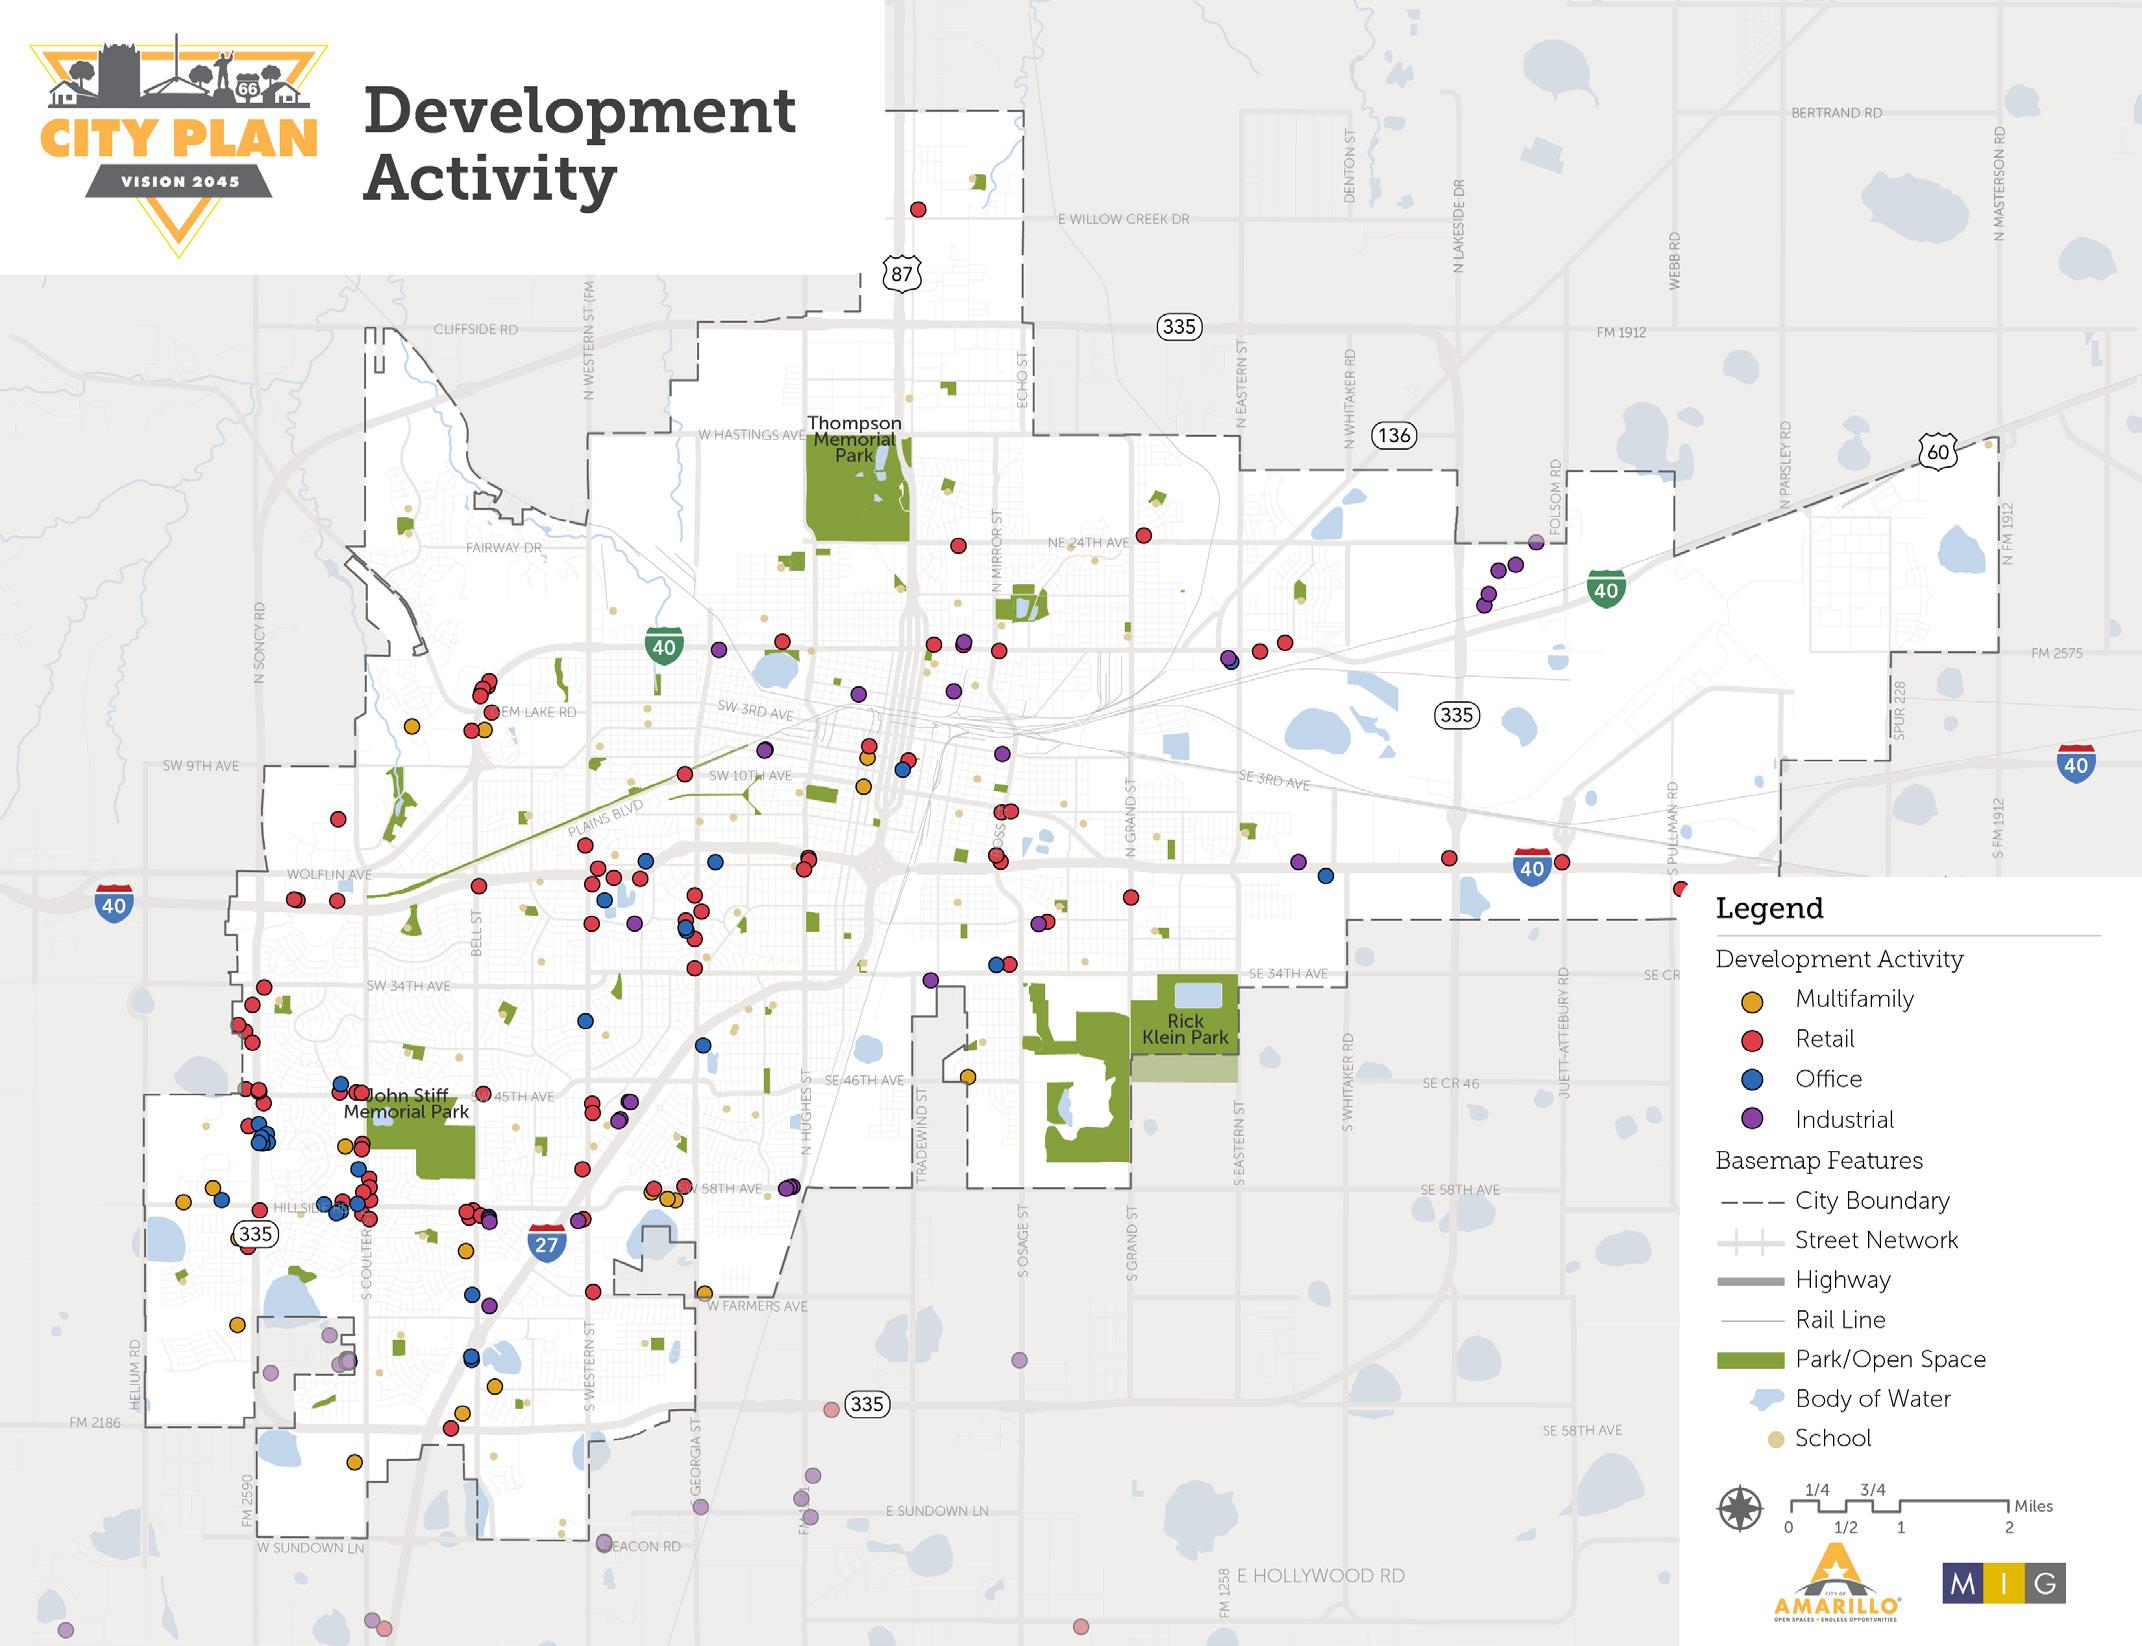
BUILDABLE LOTS: CITY LIMITS: 5,167 (78%)
Extraterritorial
Jurisdiction: 1,491 (22%)
Source: February 2022, City of Amarillo Building Permit and Recorded Plat Data
SINCE 2010:
OFFICE: 500,000 SQ FT ADDED
RETAIL: 740,000 SQ FT ADDED
INDUSTRIAL: 990,000 SQ FT ADDED
HOUSING & NEIGHBORHOODS
Neighborhood Planning Initiative
Through the development of BluePrint for Amarillo in late 2015, neighborhood planning emerged as one of five top priorities. In 2016, the Neighborhood Planning Initiative was established and has resulted in assisting select neighborhoods with future planning and development by addressing community goals and desires and outlining necessary steps to reach those initiatives. As part of this process, North Heights Neighborhood, the Barrio Neighborhood, San Jacinto Neighborhood, and Eastridge Neighborhood were identified as the Neighborhood Planning Initiative’s first priorities and were selected as target areas for further investigation. Summaries of each neighborhood plan are presented below.
Guiding principles were developed for each plan to ensure consistency in decision making. These principles should also be considered when making future land use decisions in the City Plan planning process. They generally focus on health, stability, and functionality of the neighborhood area.
The phasing and implementation identified necessary coordination between City Council, Boards/ Commissions, staff, city department budgets, capital improvement projects, outside agencies and organizations, and neighborhood action. Each of these is an important element to the implementation of the plans. For the San Jacinto and Eastridge Plans, priority long-term projects are outlined and serve as key components in transformative projects for each neighborhood.
North Heights, 2017
North Heights Neighborhood Plan was the first area plan that was developed from the list of target areas identified through the 2016 Neighborhood Planning Initiative. A lack of affordable housing, limited city resources, lack of infrastructure improvements, and public safety were some of the neighborhood concerns that catapulted this neighborhood as a priority area.
In 2017, 45-60 percent of the residents in the southern portion of the neighborhood were below the poverty level and 35 percent of residences in the western central portion were vacant. Additionally, at the time of the study, the area was largely deficient of quality sidewalks, significantly impacting safe pedestrian access.
Given the issues and areas of concern that the community expressed, the neighborhood engagement process centered around three common priority areas that included maintaining a strong and vibrant neighborhood, economic development/redevelopment, and improving transportation and mobility systems.
The following are primary items and goals that were determined to be most important to the future of the neighborhood by its residents and other interested citizens.
• Maintain a strong, vibrant neighborhood
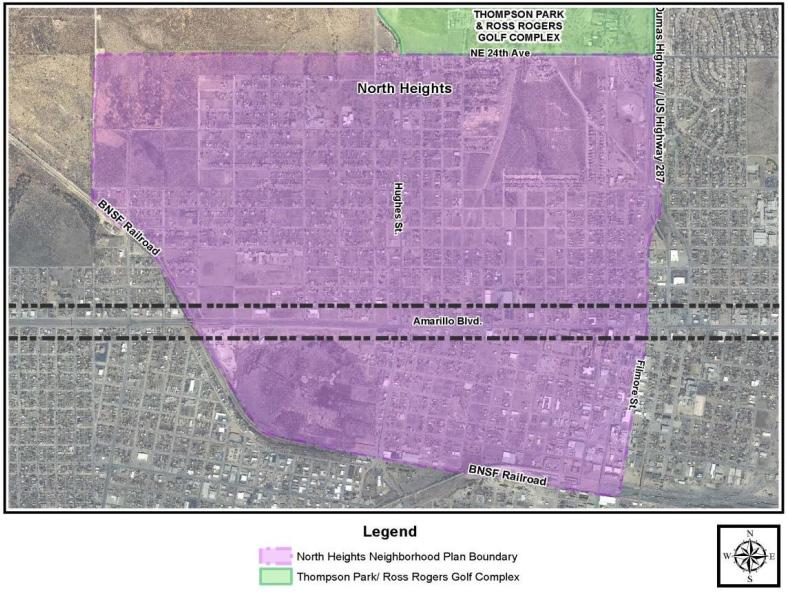
• Create a neighborhood comprised of high-quality, well maintained, mixed income housing that accommodates families and individuals
• Address neighborhood character/quality of life
• Create a safe neighborhood environment
• Economic development/ redevelopment
• Encourage greater economic diversity and growth in quality jobs while building on local strengths
• Improve transportation and mobility systems
• Improve public rights-of-way facilities
HOUSING & NEIGHBORHOODS
El Barrio, 2018
El Barrio was selected as one of the priority areas due to concerns with crime, lack of investment, and lack of maintenance. While there are a few vacant parcels within El Barrio, some are dated, unoccupied, or in need of demolition. Further analysis is needed to better comprehend the useable building stock within the neighborhood. Most of the neighborhood is comprised of single family residential, however, 28 percent of the land uses are commercial consisting of mostly of services, retail, and offices. An important aspect of the neighborhood includes its location and proximity to downtown, Interstate 40 East, and railroad activity to the West.
Like the North Heights Plan, this document outlines the overall challenges and opportunities of the Barrio Neighborhood. The following themes and goals were identified as most important to the future of the neighborhood:
Infrastructure
• Improve inadequate alleys
• Introduce opportunities for multi-modal transportation
Neighborhood Identity & Amenities
• Incorporate culture & history
• Establish gateways
• Better define & feature the neighborhood
• Increase social capital & investment
Neighborhood Health
• Establish more health care opportunities
• Promote better nutrition
Non-Residential Development & Maintenance
• Improve aesthetics of non-residential areas
• Updated land use framework
• Leverage infill development
• Introduce business education & mentoring
• Maintenance of existing developments
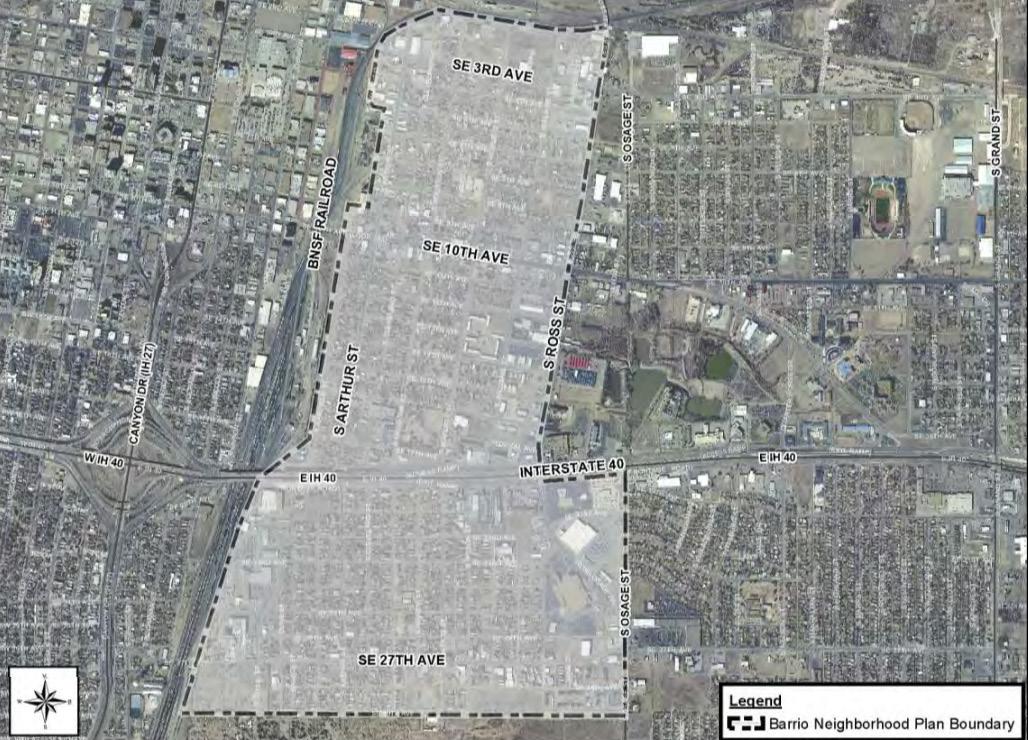
Neighborhood Safety
• Maximize crime prevention efforts
• Improve partnership with law enforcement
• Address traffic safety
Residential Development & Maintenance
• Improve aesthetics of residential areas
• Increase development potential in the neighborhood
• Maximize neighborhood appeal to new residents
San Jacinto, 2020
Over the course of approximately one year, the San Jacinto Neighborhood Plan was developed. The 2016 Neighborhood Planning Initiative identified San Jacinto as one of the priority areas due, in large part, to concerns with crime and poverty. In 2020, San Jacinto’s household median income was significantly less than Amarillo’s median income. Nearly 35 percent of its residents were at or below the poverty threshold of $25,048 for a 4-person household. Additionally, more than half of the homes were renter-occupied, which resulted in the neighborhood becoming a transient and unsettled community.
Between 2017 and 2018, San Jacinto became one of Amarillo’s highest crime neighborhoods with a high number of repeat criminal offenders living in the area. Common crimes reported in the neighborhood included weapon offenses, trespassing, and assault and sex offenses.
In addition to crime and poverty, the community mentioned the need for infrastructure improvements, better housing stock, and increased access to good quality and healthy food options. Community assets that were identified throughout the planning process included the historic neighborhood characteristics, diverse population, locally owned businesses, and outdoor public spaces. Opportunities emerged across the following vision and goals:
• Clean and Safe
• Economic Development
• History and Culture
• Housing
• Nature and Environment
• Community Building
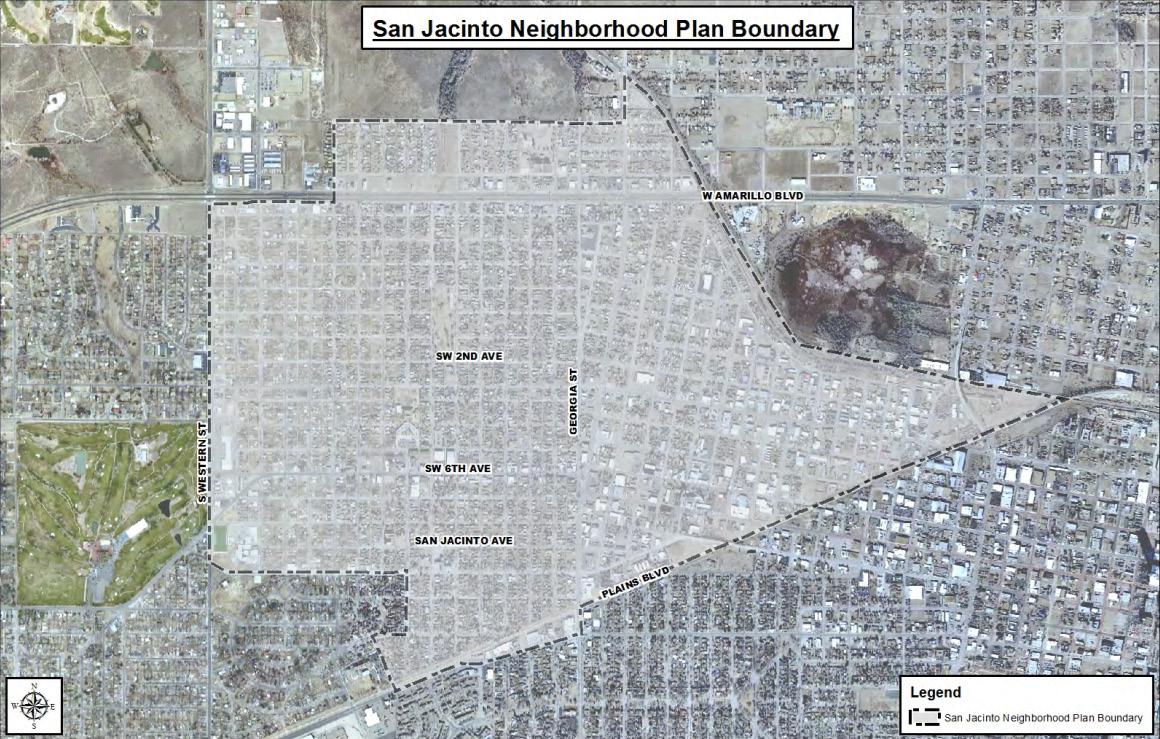
This plan identifies three key projects that are pivotal for improving the neighborhoods livability and economic health and will help set the stage for future initiatives. The first transformative project centers around reducing crime and improving neighborhood safety by increasing police patrolling and creating a neighborhood safety task force to address safety concerns. The second transformative project includes forming a 6th Street Public Improvement District that aims to enhance the experience along San Jacinto’s primary commercial corridor and help execute emerging projects. The third transformative project focuses on fi xing the housing crisis in the neighborhood. The creation of a neighborhood-serving organization would be needed to improve existing housing conditions, increase housing type diversity, and expand homeownership opportunities.
HOUSING & NEIGHBORHOODS
Eastridge, 2022
The Eastridge Neighborhood is one of the priority areas due, in large part, to concerns about the overall condition of the neighborhood as well as its integration and connection to the larger city. The Eastridge Neighborhood is an incredibly diverse community that’s comprised of people with different backgrounds and cultures. Throughout the planning process, Eastridge neighborhood residents mentioned the desire for physical space and opportunities to celebrate their cultures.
Another important theme identified during the planning process was the need for better employment opportunities. Currently, while the meatpacking industry provides stable incomes for residents, they provide no means for upward mobility, which contribute to unstable home environments. Those factors, combined with a lack of a general support system to help with community integration, result in a repetitive cycle of in and out migration for the refugee community in Amarillo.
The physical deterioration of the Eastridge neighborhood results from economic and social challenges. This plan addresses improvements to the physical conditions of the neighborhood and identifies projects and partnerships that can improve the economic and social conditions as well. Additionally, the Eastridge Neighborhood Plan outlines two transformative projects that would set the stage for the neighborhood’s future. They aim to address economic opportunity and housing within the neighborhood. The goal of the first transformative project is to break the cycle of no upward mobility by creating new economic opportunity. Strategies to achieve this goal include
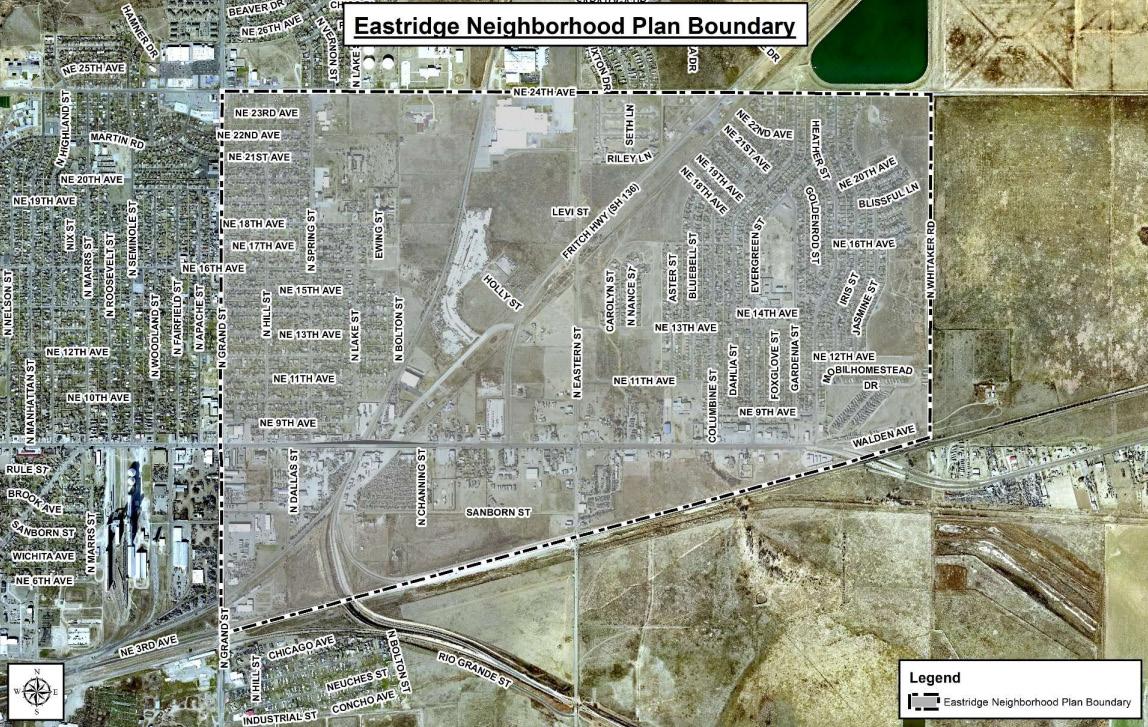
supporting small businesses, using urban agriculture as an economic development catalyst, and creating opportunities for Eastridge residents to work at nearby major employers. The second transformative project targets improving housing conditions. Strategies include establishing a target revitalization area, exploring options to improve owner and renter occupied housing, leveraging new commercial development to facilitate quality home construction, and educating residents about code requirements and the enforcement process.
The following is a list of all goals that were identified by the community as priority items:
• break the cycle of no upward mobility by creating new economic opportunity,
• put the pride back by improving housing conditions,
• create safer places and spaces by reducing crime,
• build community by changing perception, and
• enhance neighborhood quality of life with public improvements and beautification.
TRENDS AND KEY TAKEAWAYS:
• Over the last decade, Amarillo added about 630 new housing units a year, with the majority being single-family.
• The median home price in Amarillo has steadily increased by 70% from around $127,000 in 2011 to around $215,000 in 2022.
• The median income is around $56,000, which correlates to an affordable for-sale price of $175,000 or less.
• There is strong interest in building in Amarillo’s ETJ, especially in Randall County. A 2022 study by the Planning Department found that nearly 25% of all platted and ready to build lots, that were reviewed by the Department, were located in the city’s ETJ. The total number of buildable lots in the Amarillo city limits and ETJ totaled 6,658 (February 2022).
PARKS & CULTURAL
PARKS & CULTURAL RESOURCES
Existing Park System
There are 52 park sites within the City of Amarillo’s Park System, six of which are Regional Parks. Parks account for approximately 2,400 acres of land throughout the City. 53% of park land is dedicated to Regional Parks, such as John Stiff Memorial Park, Thompson Memorial Park, Medical Center Park, and Rick Klein Athletic Complex. In addition to Regional Parks, there are community parks and facilities and neighborhood-scale parks and amenities within the Park System.
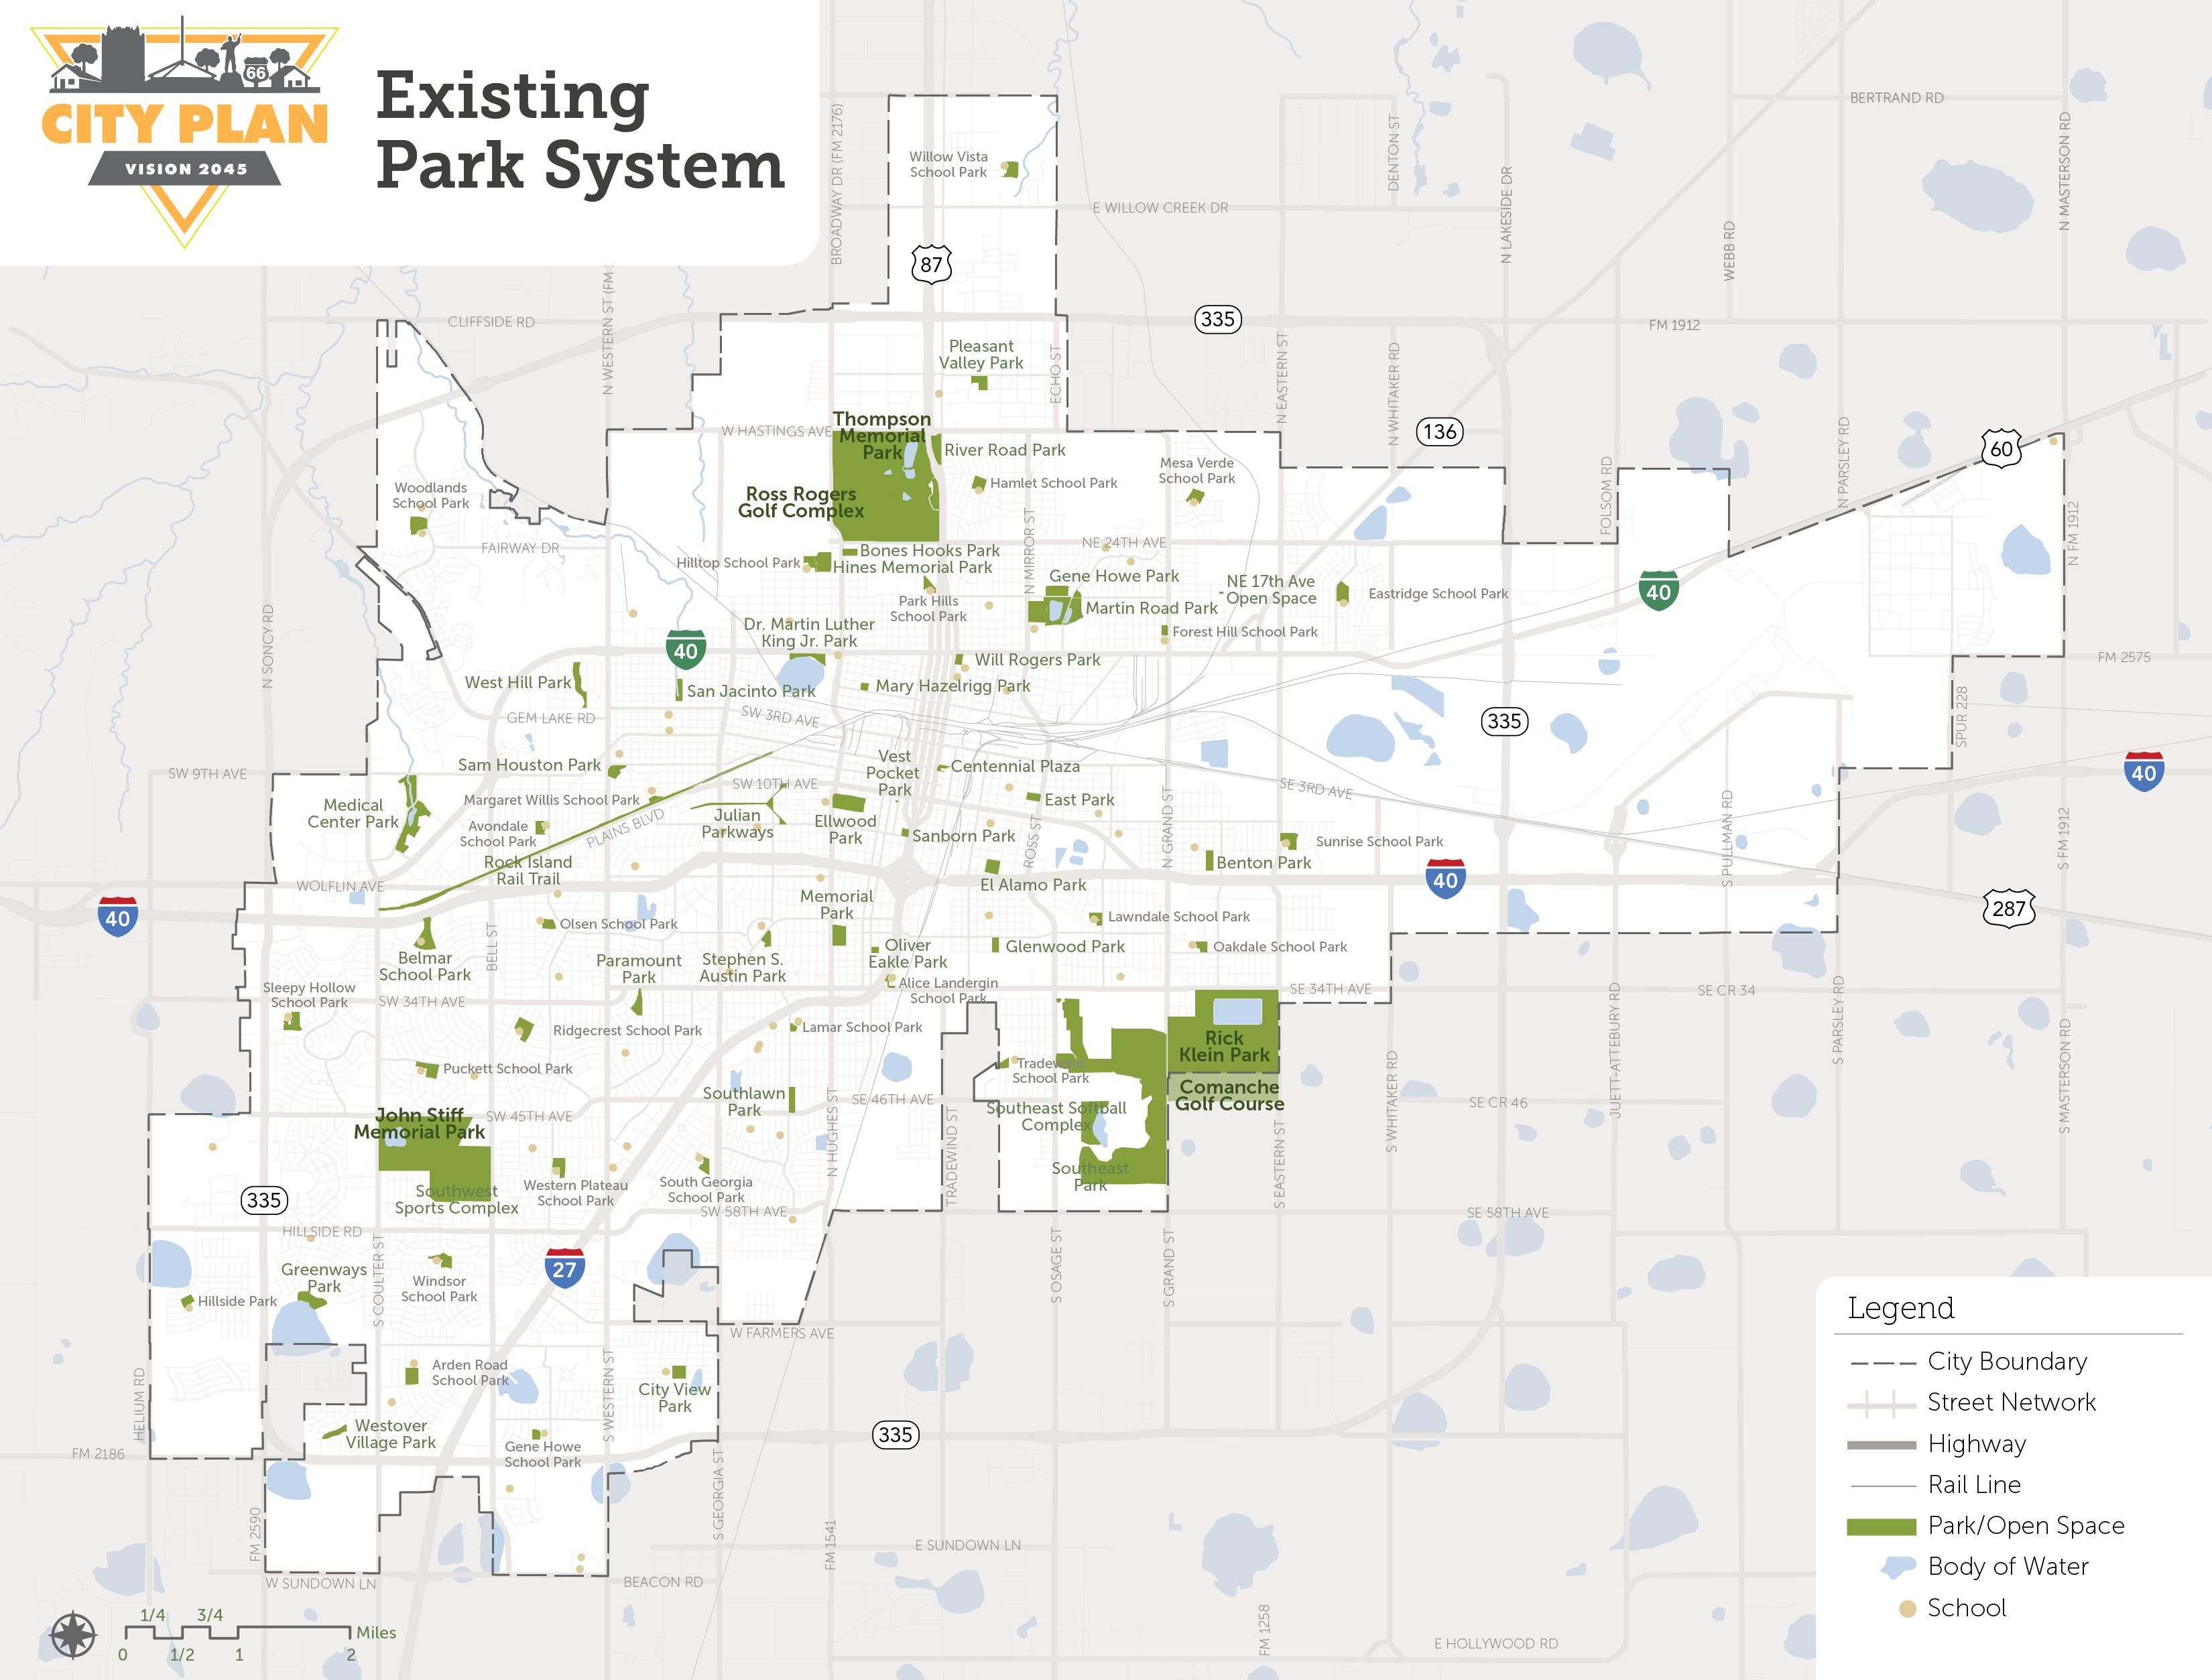
Existing Park & Cultural Resources Plans and Studies
Comprehensive Plan (2010)
According to the City of Amarillo Comprehensive Plan (2010), community members identified local parks and recreation as their most valued amenity within the City. The general direction and goals of the plan prioritizes open spaces, leisure recreation, relief from the urban environment, flood control and habitat protection, as well as enhancing the City’s historic sites and structures to allow locals, visitors, and newcomers to maintain connections to the City’s past. The plan offers examples of successful implementation as well as ongoing challenges from past planning practices regarding preservation and land use.
The 2010 Comprehensive Plan encourages thoughtful public engagement around the issues and choices facing the City of Amarillo. Local planning is a critical step and allows for a greater measure of growth and development, rather than reacting to changes. The plan encourages residents, stakeholders, and local officials’ involvement in collaborating with one another to determine the vision for their community. The plan references parks, culture, and arts as an essential part of a healthy and sustainable community. Parks are a “key trade center” to the City, serving a wider population, not only locals. Adequate funding for timely development, acquiring enough land and suitable sites for neighborhood park development, opportunities to preserve and enhance more locations for environmental, aesthetic, and recreational value are some of the issues and needs from the past that are still relevant today, even after years of growth and change in the community.
Future Vision Blueprint for Amarillo (2018)
The Future Vision Blueprint for Amarillo (2018) provides a strategic vision and priorities to accomplish the objectives of embracing culture, arts, and recreation. The City of Amarillo’s residents prioritize celebrating their diverse neighborhoods through unique experiences that highlight art, entertainment, and recreation. The plan suggests continued partnership with key partners to promote tourism and community events and festivals. The Beautification and Public Arts Advisory Board was established through this plan to provide recommendations on seventeen programs that promote and further the beautification of Amarillo and establish and preserve public art throughout the City.
Public Arts and Beautification Plan (2021)
The Public Arts and Beautification Plan outlines short-term implementatiom strategies and actions to create an arts and beautification program for the City. The Plan was developed in conjunction with the Amarillo Parks and Recreation Master Plan and reflects the feedback and priorities shared by the community throughout the engagement process. The plan defines Art as “a form of creative communication that includes fine, graphic, visual, cultural, performing, and literary arts.” This is balanced by the initiative to beautify the City with “elements and projecs that contribute to community aesthetics, particularly in public spaces.” Overall, the plan identifies four strategies to successfully provide arts and beautification on a citywide level. These strategies include:
• Create and initiate a sustainable arts and beautification program.
• Initiate projects to inspire and grow community and partner involvement and support for the arts, fostering high-profile Board involvement.
• Foster community beautification through projects and partnerships.
• Identify longer-term strategies to refine and sustain the City’s arts program and beautification program.
Implementation of the three-year action plan is based on realistic parameters and goals, including the set annual allowance. The first year of the action plan targeted emerging projects, such as the Mural Grant Project, to enhance the City’s appearance, increase employment opportunities in the arts, raise awareness and appreciation of the value of art, and create civic pride while also encouraging tourism.
PARKS & CULTURAL RESOURCES
Parks and Recreation Master Plan (2021)
The Parks and Recreation Master Plan (2021) prioritizes services, amenities, and facilities within the City of Amarillo’s parks system to foster safe, inclusive, enjoyable, and comfortable parks for the community. The plan emphasizes the importance of public engagement and the community’s input throughout the process. Community feedback revealed priorities for improvements to existing parks, increasing the number of walking and biking trails, and adding a variety of outdoor recreation and opportunities for play. A variety of programming and events that better reflect Amarillo’s
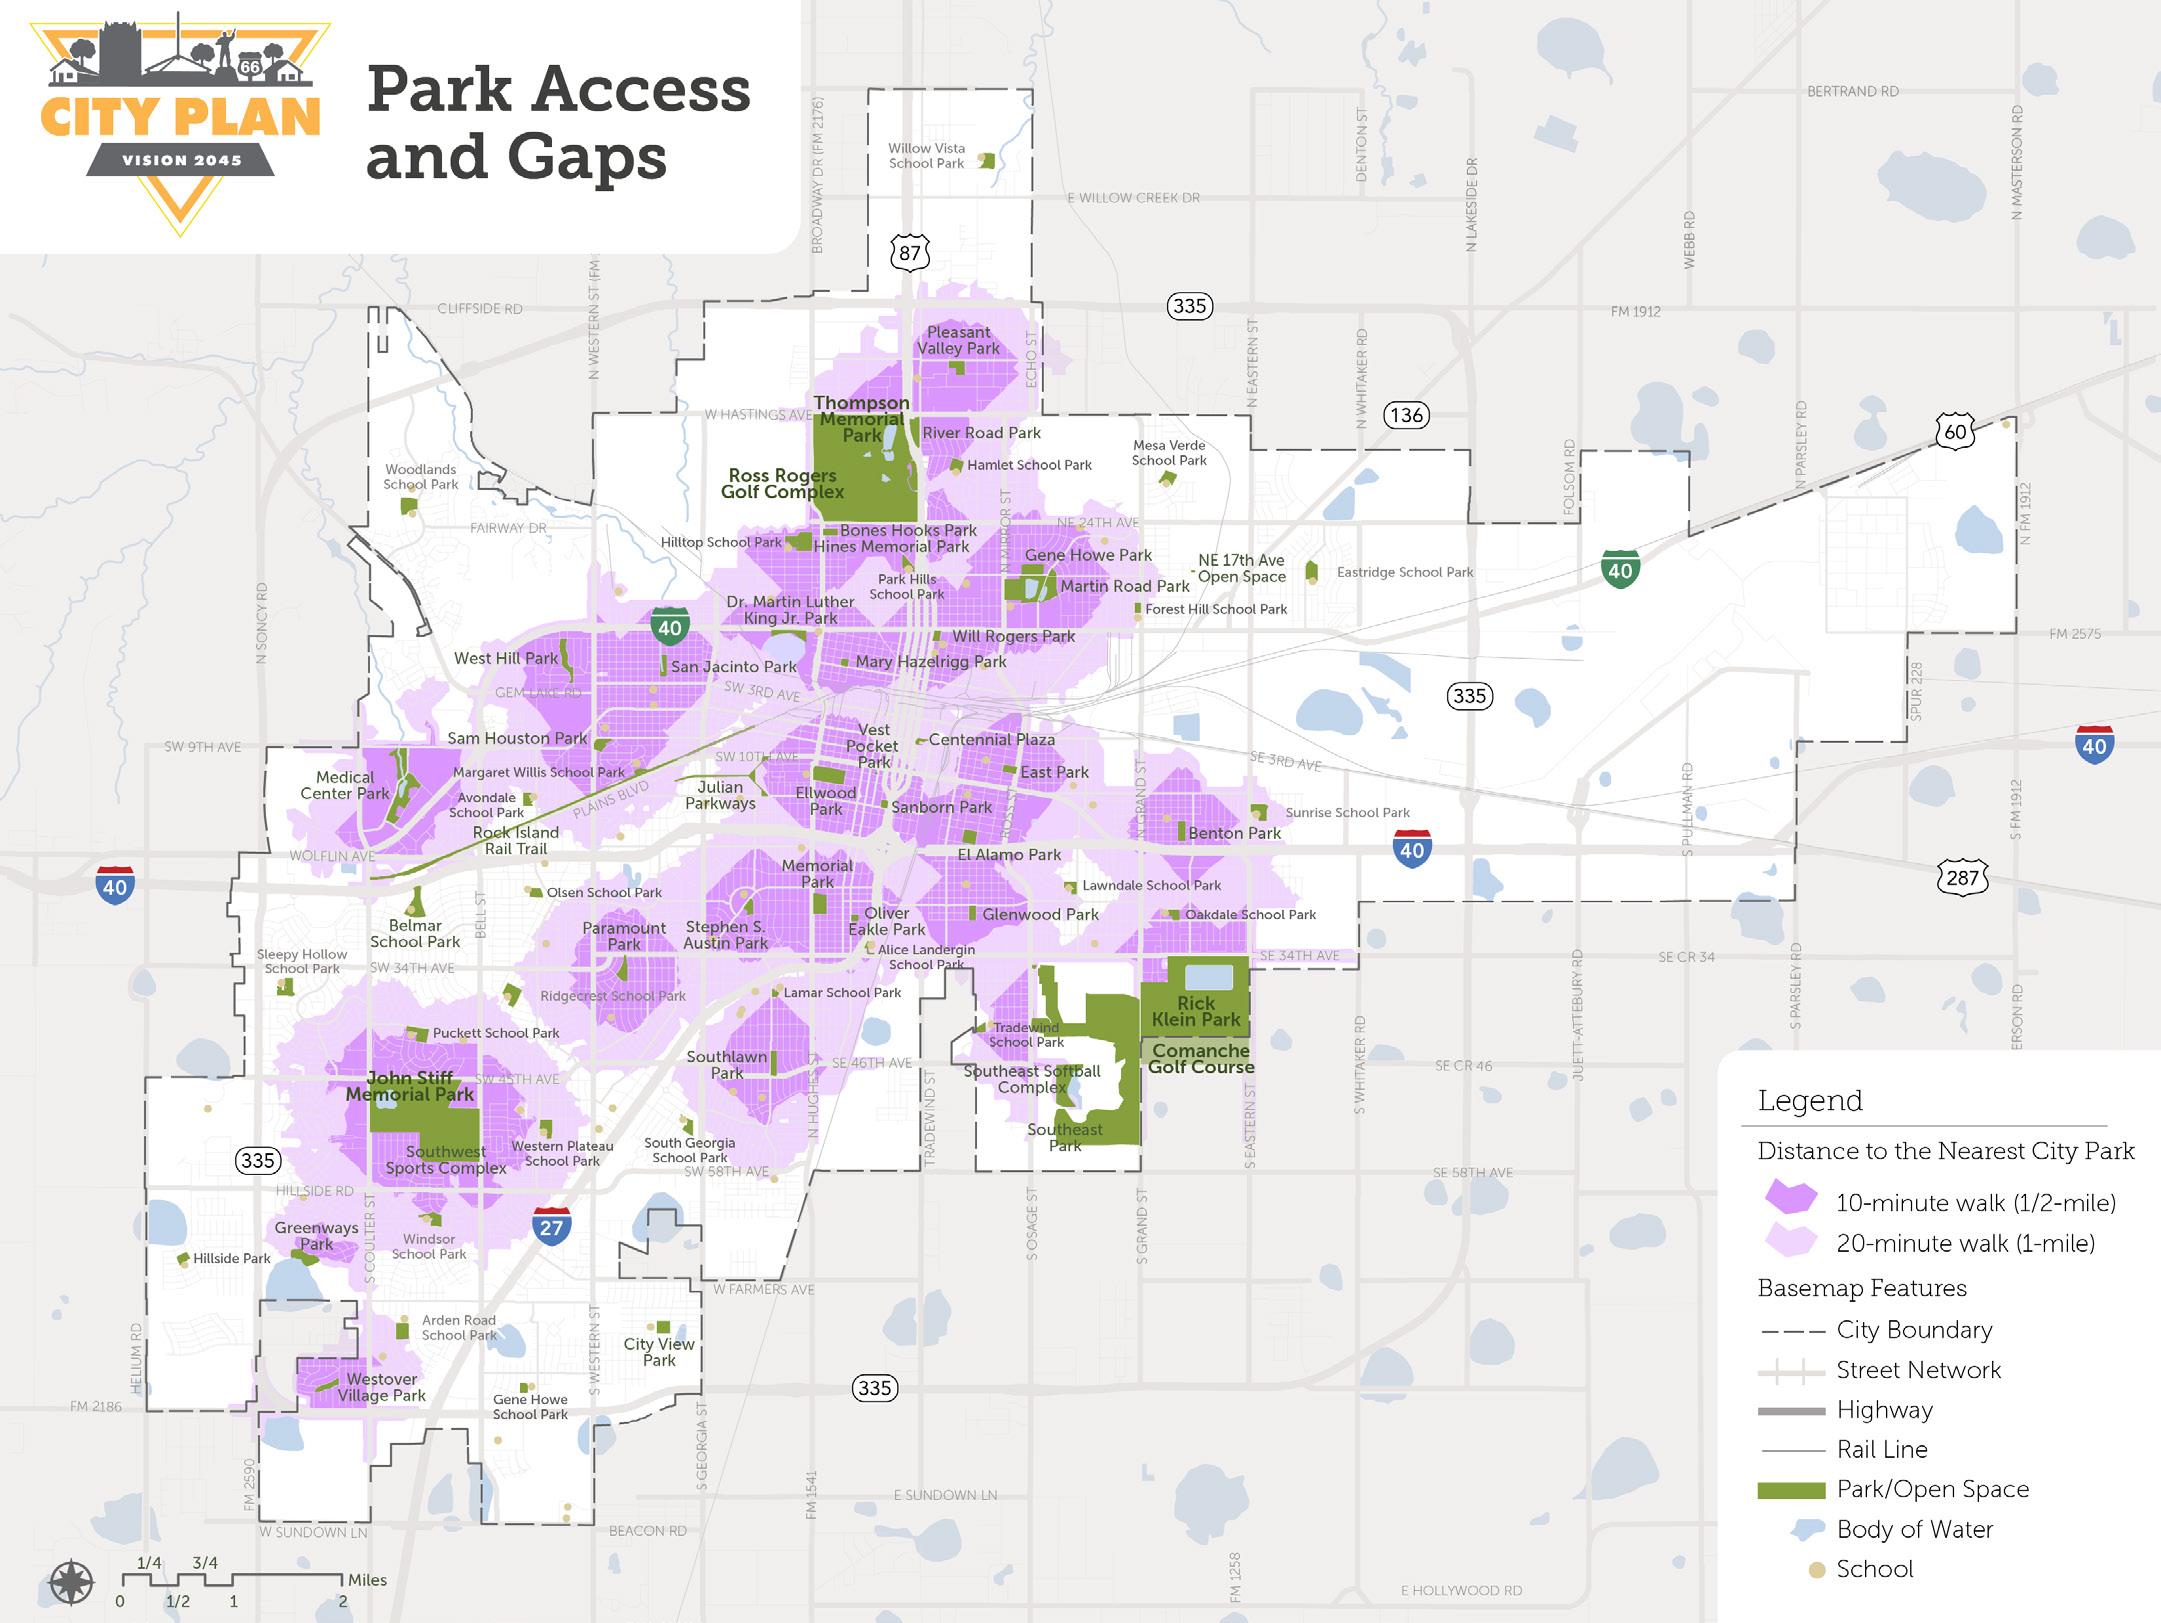
diversity, heritage, culture, and natural environment were also priorities for the public. The Parks and Recreation Master Plan includes a realistic action plan for the City of Amarillo to allocate resources where needed most to support the City’s parks and recreation’s evolving needs. The action plan is reflective of thorough analysis of the City park system, such as park access and gaps based on the location of existing City parks and 10- to 20- minute walkshed to each park. Strategies for prioritizing key projects and allocating funds through the investment strategy are outlined in the plan. In-depth facility inventory and condition assessments, mapping analysis illustrating high need areas, and future goals and objectives guide are also included.
2010 Comprehensive Plan Summary
The City of Amarillo is committed to upgrading parks and recreation systems throughout the City. The 2010 Comprehensive Plan illustrates the City’s progress since the previous version of the plan in 1980. The City has completed five of the eight proposed projects, contributing to 69 parks and special use facilities. The City’s objectives to build on a strong park system, enhance the downtown through local heritage initiatives and tools, and clustering cultural and entertainment assets continue with the adoption of the 2021 Parks and Recreation Master Plan, emphasizing the preservation and quality of open space, year-round leisure and recreational opportunities, and the conservation of native habitat and wildlife. New and amended City ordinances and department hiring strategies are also in alignment with the 2010 Comprehensive Plan’s objectives.
TRENDS AND KEY TAKEAWAYS:
• In the recently completed Parks Master Plan process, 69% of residents who completed the survey said they would support an increased level of investment in Parks.
• Top funding priorities for Amarillo citizens include: playing, walking/biking, competitive sports, and casual recreation.
• The investment priorities for parks are to: 1.) Maintain or replace older park amenities; 2.) Expand or improve athletic facilities; 3) Add new parks in underserved areas; and 4.) Add more variety in existing parks.
COMMUNITY MOBILITY & INFASTRUCTURE
COMMUNITY MOBILITY & INFRASTRUCTURE
History of Infrastructure
Funding for Capital Investments
Like most Texas municipalities, Amarillo relies primarily on general fund money to fund capital improvements. There are limited impact fees, such as the water/sewer tap fees, but most infrastructure funding comes from the City’s sales tax and property tax. The City collects 2% sales tax; this, combined with the State’s 6.25 percent rate, means the constitutional cap of 8.25 percent has been reached, and there is no availability for special districts or other increases in that rate. The City of Amarillo’s property tax rate, approved in September 2022, is 40 cents per $100 of assessed value. Although this is higher than nearby Lubbock’s (34.77 cents), it is low in comparison to similar-sized Texas cities. For comparison, in the DFW area, the similarly-sized cities of Denton, Grand Prairie, and Plano, have property tax rates of 64, 59, and 47 cents, respectively. Cities typically have higher tax rates with increasing size and budget complexity; Houston’s is 63 cents per $100 and Dallas is 78. (Source: hdavidballinger.com/texasproperty-tax.php)
Inadequate Funding for Maintenance and Operations
Based on various studies between 2012 and 2022, including utility plans and condition reports, it is estimated that the City has a backlog of $382 million in maintenance, rehabilitation, repair, and replacement projects, of which the five-year CIP only addresses a little less than half ($175 million, or 46%). Much of this maintenance has been deferred for many years, and its cost is competing with growth and expansion for the available funding.
Water: Current 5-year CIP = 33.8M (16.2 M Deficit)
Sewer: Current 5-year CIP = 86.8 M (18.2 M Deficit)
Stormwater: Current 5-year CIP = 23 M (29 M Deficit)
Streets: Current 5-year CIP = 31.3 M (143.7 M Deficit)
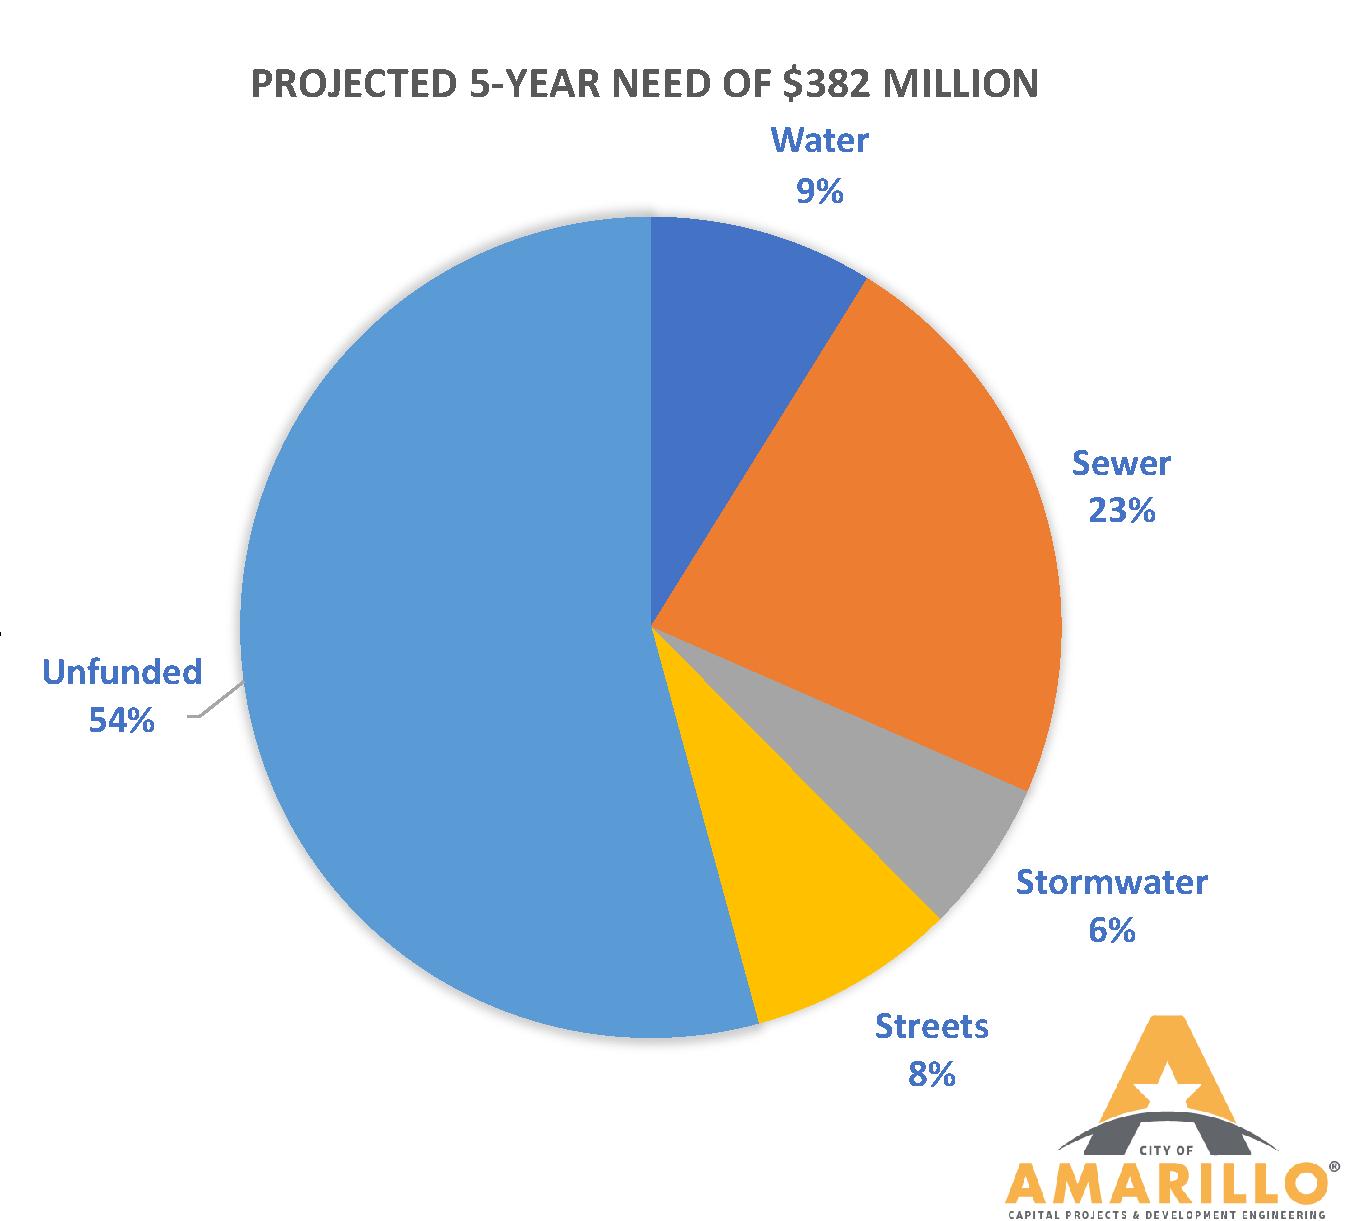
Partnership for Development Progress
The Partnership for Development Progress (PDP) was started in 2021, with a vision of assisting the City in finding a “sustainable and predictable funding source to increase lots available for development without putting development costs on Amarillo property taxpayers.” The problem, as identified by the PDP, is essentially that the City’s belowaverage tax rate, but above-average cost-sharing in infrastructure, has left the City unable to fund other improvements that development necessitates. In particular, deferred maintenance needs are becoming more and more urgent and leaving little funding available for growth, following the current pattern. In particular, street and roadway needs have been identified at over four times the current $31 million CIP.
The PDP created a system of tiered recommendations tied to funding of all basic infrastructure for necessary operations, maintenance, planning, and growth. The first priority is to communicate to citizens the underfunded state of infrastructure and proposed solutions. This focused mainly on four areas of infrastructure: drainage, streets, wastewater, and water (supply).
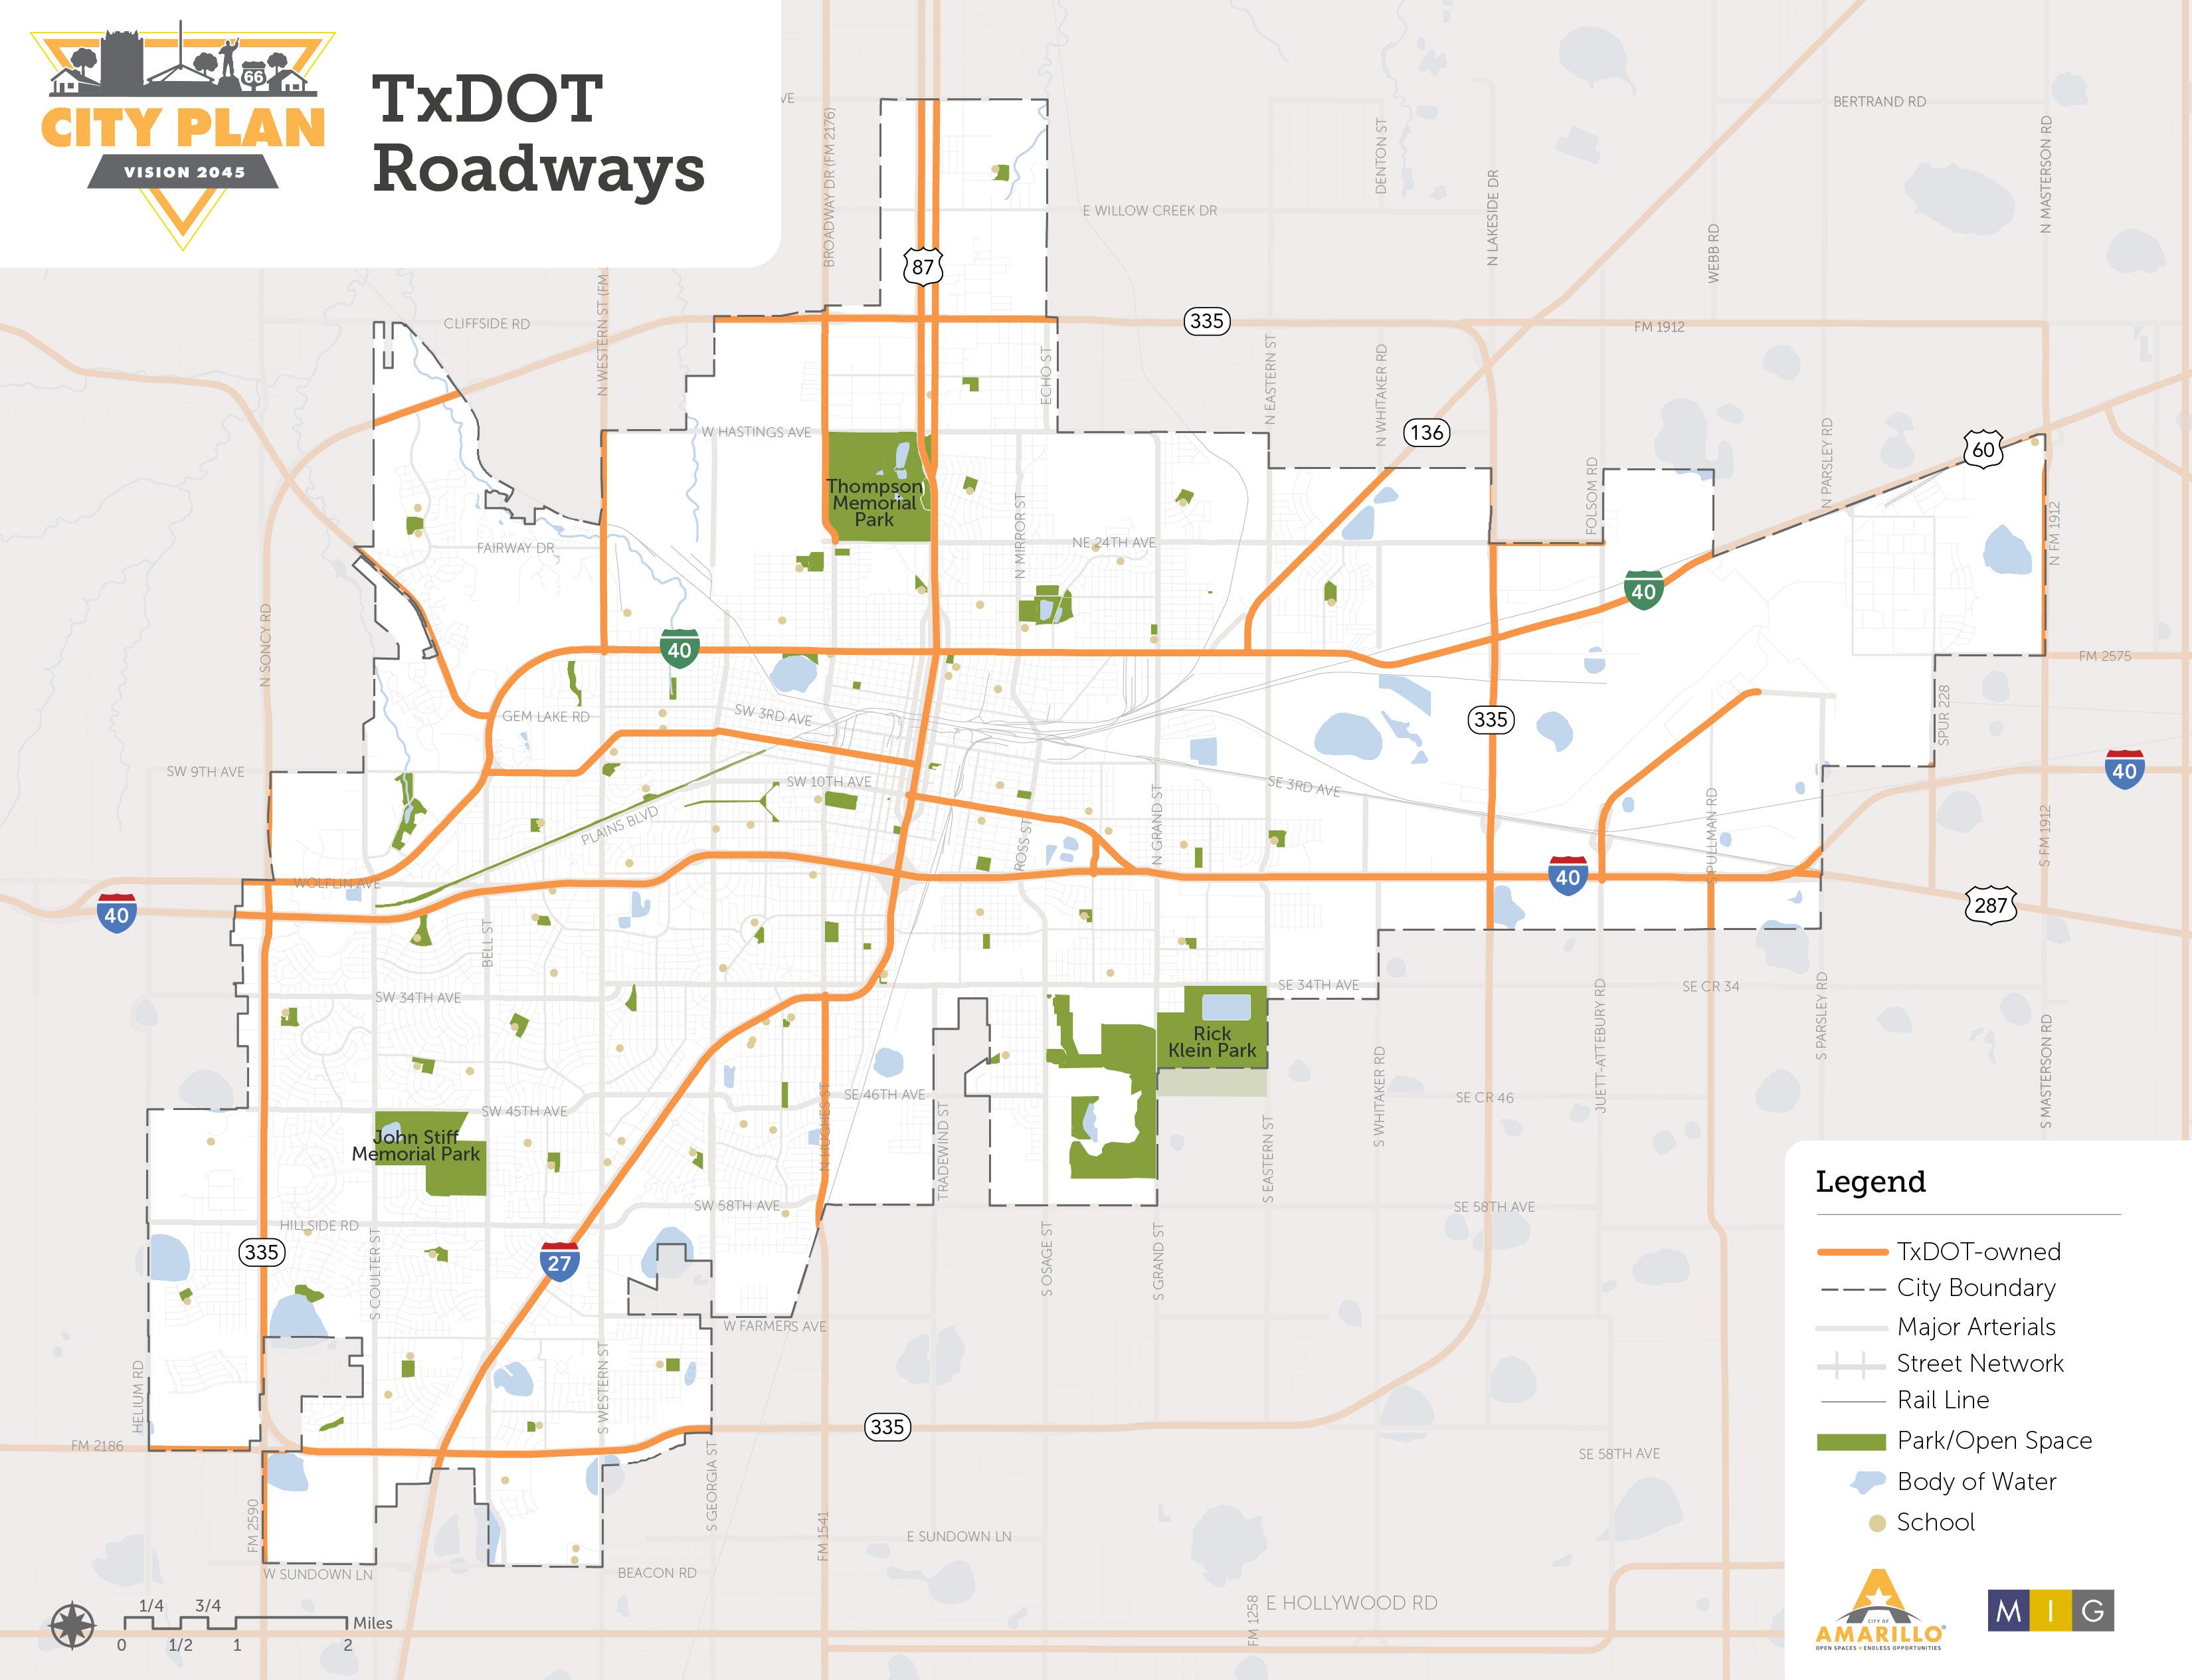
COMMUNITY MOBILITY & INFRASTRUCTURE
Primary priorities were developed for these four areas, with activities to be addressed immediately and in the short-term. Generally each group revolved around ensuring each infrastructure enterprise fund is self-sustaining, ensuring development pays a fair share of infrastructure costs, and develop a plan to address critical maintenance needs.
Specific elements of these primary priorities include the creation of a streets enterprise fund, the prioritization of street work based on pavement condition, and the creation of a process for developers to pay for new street infrastructure, either directly or through an impact fee, with the City then taking over maintenance.
Finally, secondary recommendations are also presented for the drainage, streets, wastewater, and water areas, detailing long-term planning needs, including fiscal policy (both for utility rates and for allocation of tax revenue), closer examination of annexations with an eye to partnerships with developers, and studying the establishment of Public Improvement Districts and similar entities.
Responsible Parties and Players
City of Amarillo
The City is responsible for the majority of roadways in the City’s boundaries, including their associated sidewalks, signage, striping, signals, lighting, etc. The PDP inventories 1,032 centerline miles of roadways and 273 sets of traffic signals. Note that this does not include roadways belonging to TxDOT within the city limits, including the Interstates and several other major arterials, except that the City does maintain traffic signals along TxDOT roadways.
TxDOT – Amarillo District
The state, through the Texas Department of Transportation (TxDOT), owns and maintains the freeway system, including I-40, I-27, US 87, and Loop 335; select major arterials, including Amarillo Boulevard (I40 Business), Fritch Highway (SH 136), and the Washington/Hughes/ Broadway corridor (FM 2196 and FM 1541). TxDOT’s Amarillo District covers 17 counties surrounding and north of Amarillo.
Amarillo MPO
The Metropolitan Transportation Organization (MPO) does not own or maintain infrastructure directly, but is responsible for programming Federal transportation funding in the region, allocating said Federal dollars to City, County, and State projects in their 3-year Transportation Improvement Program (TIP) and 25-year Regional Transportation Plan (RTP). Note that programming by the MPO is necessary only for projects to receive Federal assistance; the City is able to fund projects on their own without MPO participation. Priority projects in the MPO’s plans are listed in a subsequent section.
Private
In Amarillo, as in most cities throughout Texas, infrastructure in new subdivisions is constructed by the developer in advance of home construction. Utilities and roadways must be constructed to City standards, but they are generally deeded to the City after completion, for ongoing maintenance. There can be limited retention of infrastructure by homeowner associations within gated communities, but these are not common compared to the quantity of infrastructure transferred to the City.
Overview of Current Conditions
The Partnership for Development Progress (PDP) has undertaken an assessment of the various types of City infrastructure, in support of financial estimates for ongoing maintenance and repair, and the consequent planning for how to fund these activities. All figures are from the PDP’s Recommendations report, of August 15, 2022.
Drainage
The current Capital Improvement Project (CIP) budget devotes roughly one-third of its $23.1-million Drainage budget to each of the three categories of growth (new capacity), maintenance (meaning smallerscale work), and Rehabilitation/Repair/Replacement (referred to as “RRR” Capital, and tracked separately from “maintenance” projects). Still, the PDP estimates that this is only about one-half of the amount needed, based on the 2019 Drainage Utility Master Study.

COMMUNITY MOBILITY & INFRASTRUCTURE
Streets
Similar to the drainage category, Amarillo’s current CIP budget divides the Streets budget roughly into thirds for growth, maintenance, and RRR. However, the PDP estimates the CIP budget of $31.7 million is barely one-tenth of the needed amount, mostly due to two issues: the poor condition of many roadways, and inflation in construction costs.
Less than 10 percent of the City’s streets were assessed as “good” condition on the Pavement Condition Index in 2017, and nearly 50 percent were assessed as “satisfactory.” Additionally, roadway repair costs, mainly for materials, increased as much as 195 percent between 2017 and 2022. Overall, costs for the same work more than doubled in that five-year period.
Sewer/Wastewater
The current CIP budget also divides funding for Sewer work roughly into thirds for growth, maintenance, and RRR. Unlike the other three categories of Drainage, Streets, and Water, Sewer is relatively well-funded, with the $86.7-million budget covering about 90% of the estimated needed work. Also, the two major treatment plants have considerable spare capacity comparing current operations to permitted amounts. Still, there is a lot of major work on the horizon, with 70% of the sewer pipes being at least 60 years old, as of 2022. One simple recommendation here is to coordinate needed roadway improvements with sewer work as much as possible, in order to reduce construction costs.
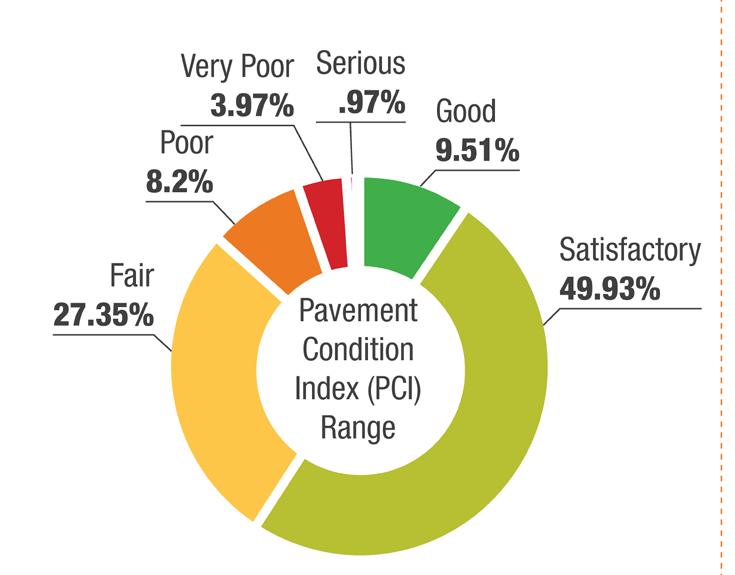
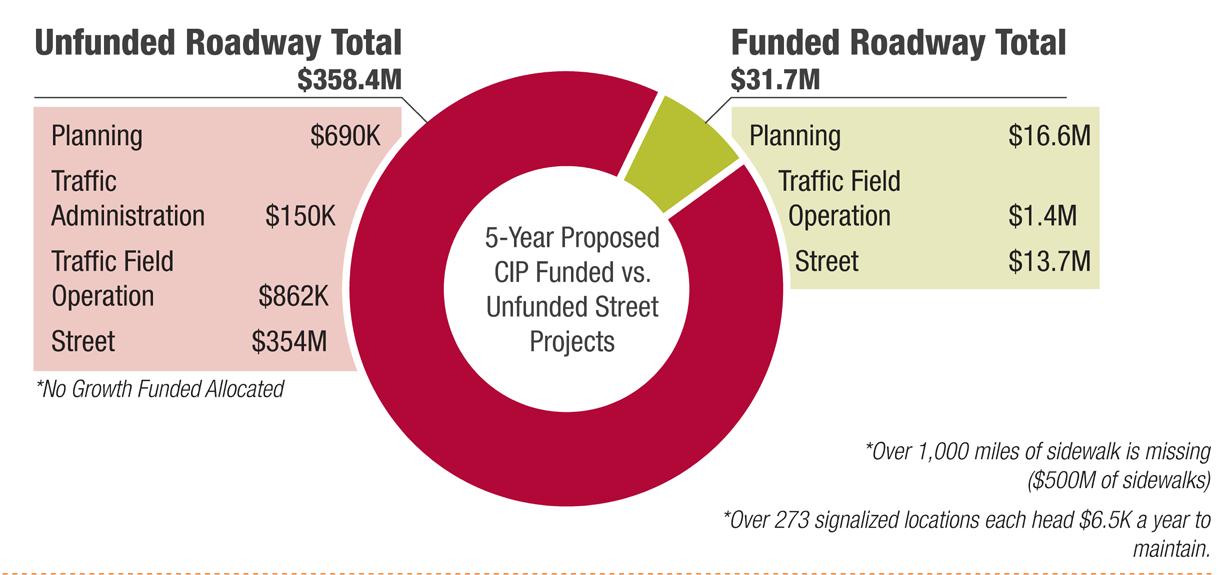
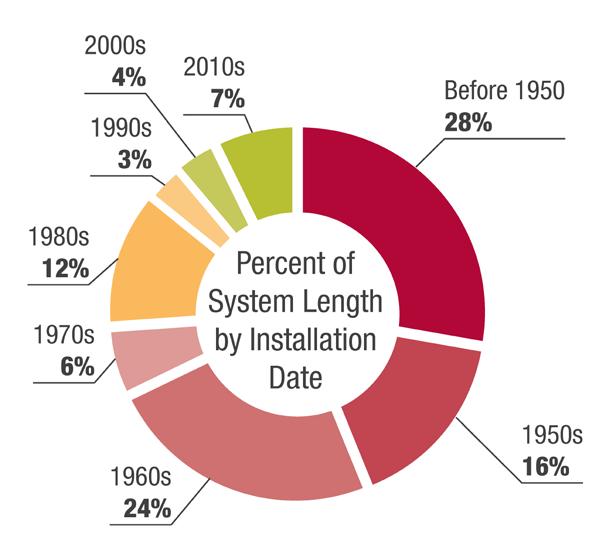
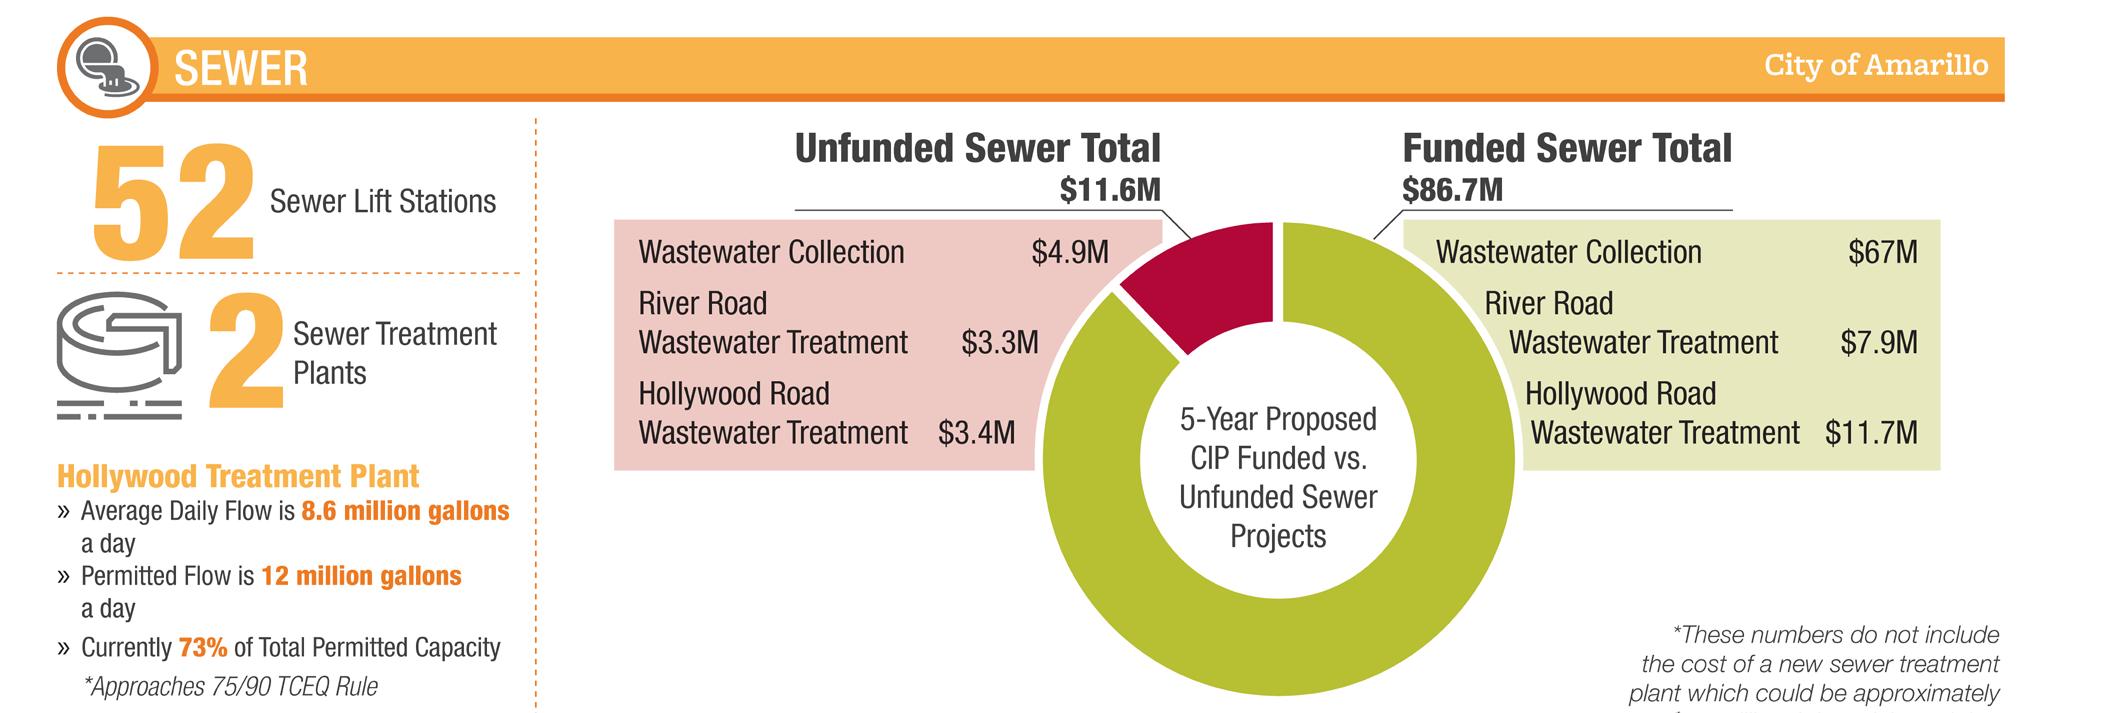
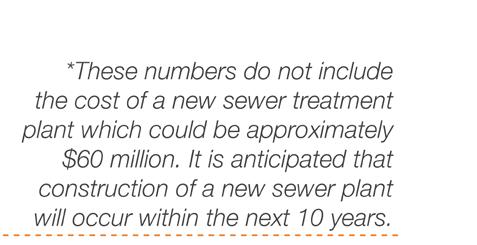
Water
The final category, Water, also sees the current CIP budget divided roughly into thirds for growth, maintenance, and RRR. However, like Drainage and Streets, the amount allocated is not sufficient to cover the identified need, with the $33.8-million dollar budget less than a quarter of the needed amounts.
Waterlines in Amarillo on average are newer than sewer lines, per the Comprehensive Water System Master Study of 2022. However, over half the piping mileage is 50 or more years old, dating from the 1970s or earlier.
Current Major Projects
Capital Improvement Plan / Community Investment Program (CIP)
The CIP calls out strategies and broad funding categories, as noted in the Overview of Current Conditions section above. For example, it notes that street reconstructions will be prioritized based on the Pavement Conditions Index data collected in 2017. Individual projects are called out in the City budget, and highlights of these are listed below. Although many of these do coordinate well with the PDP goals, including
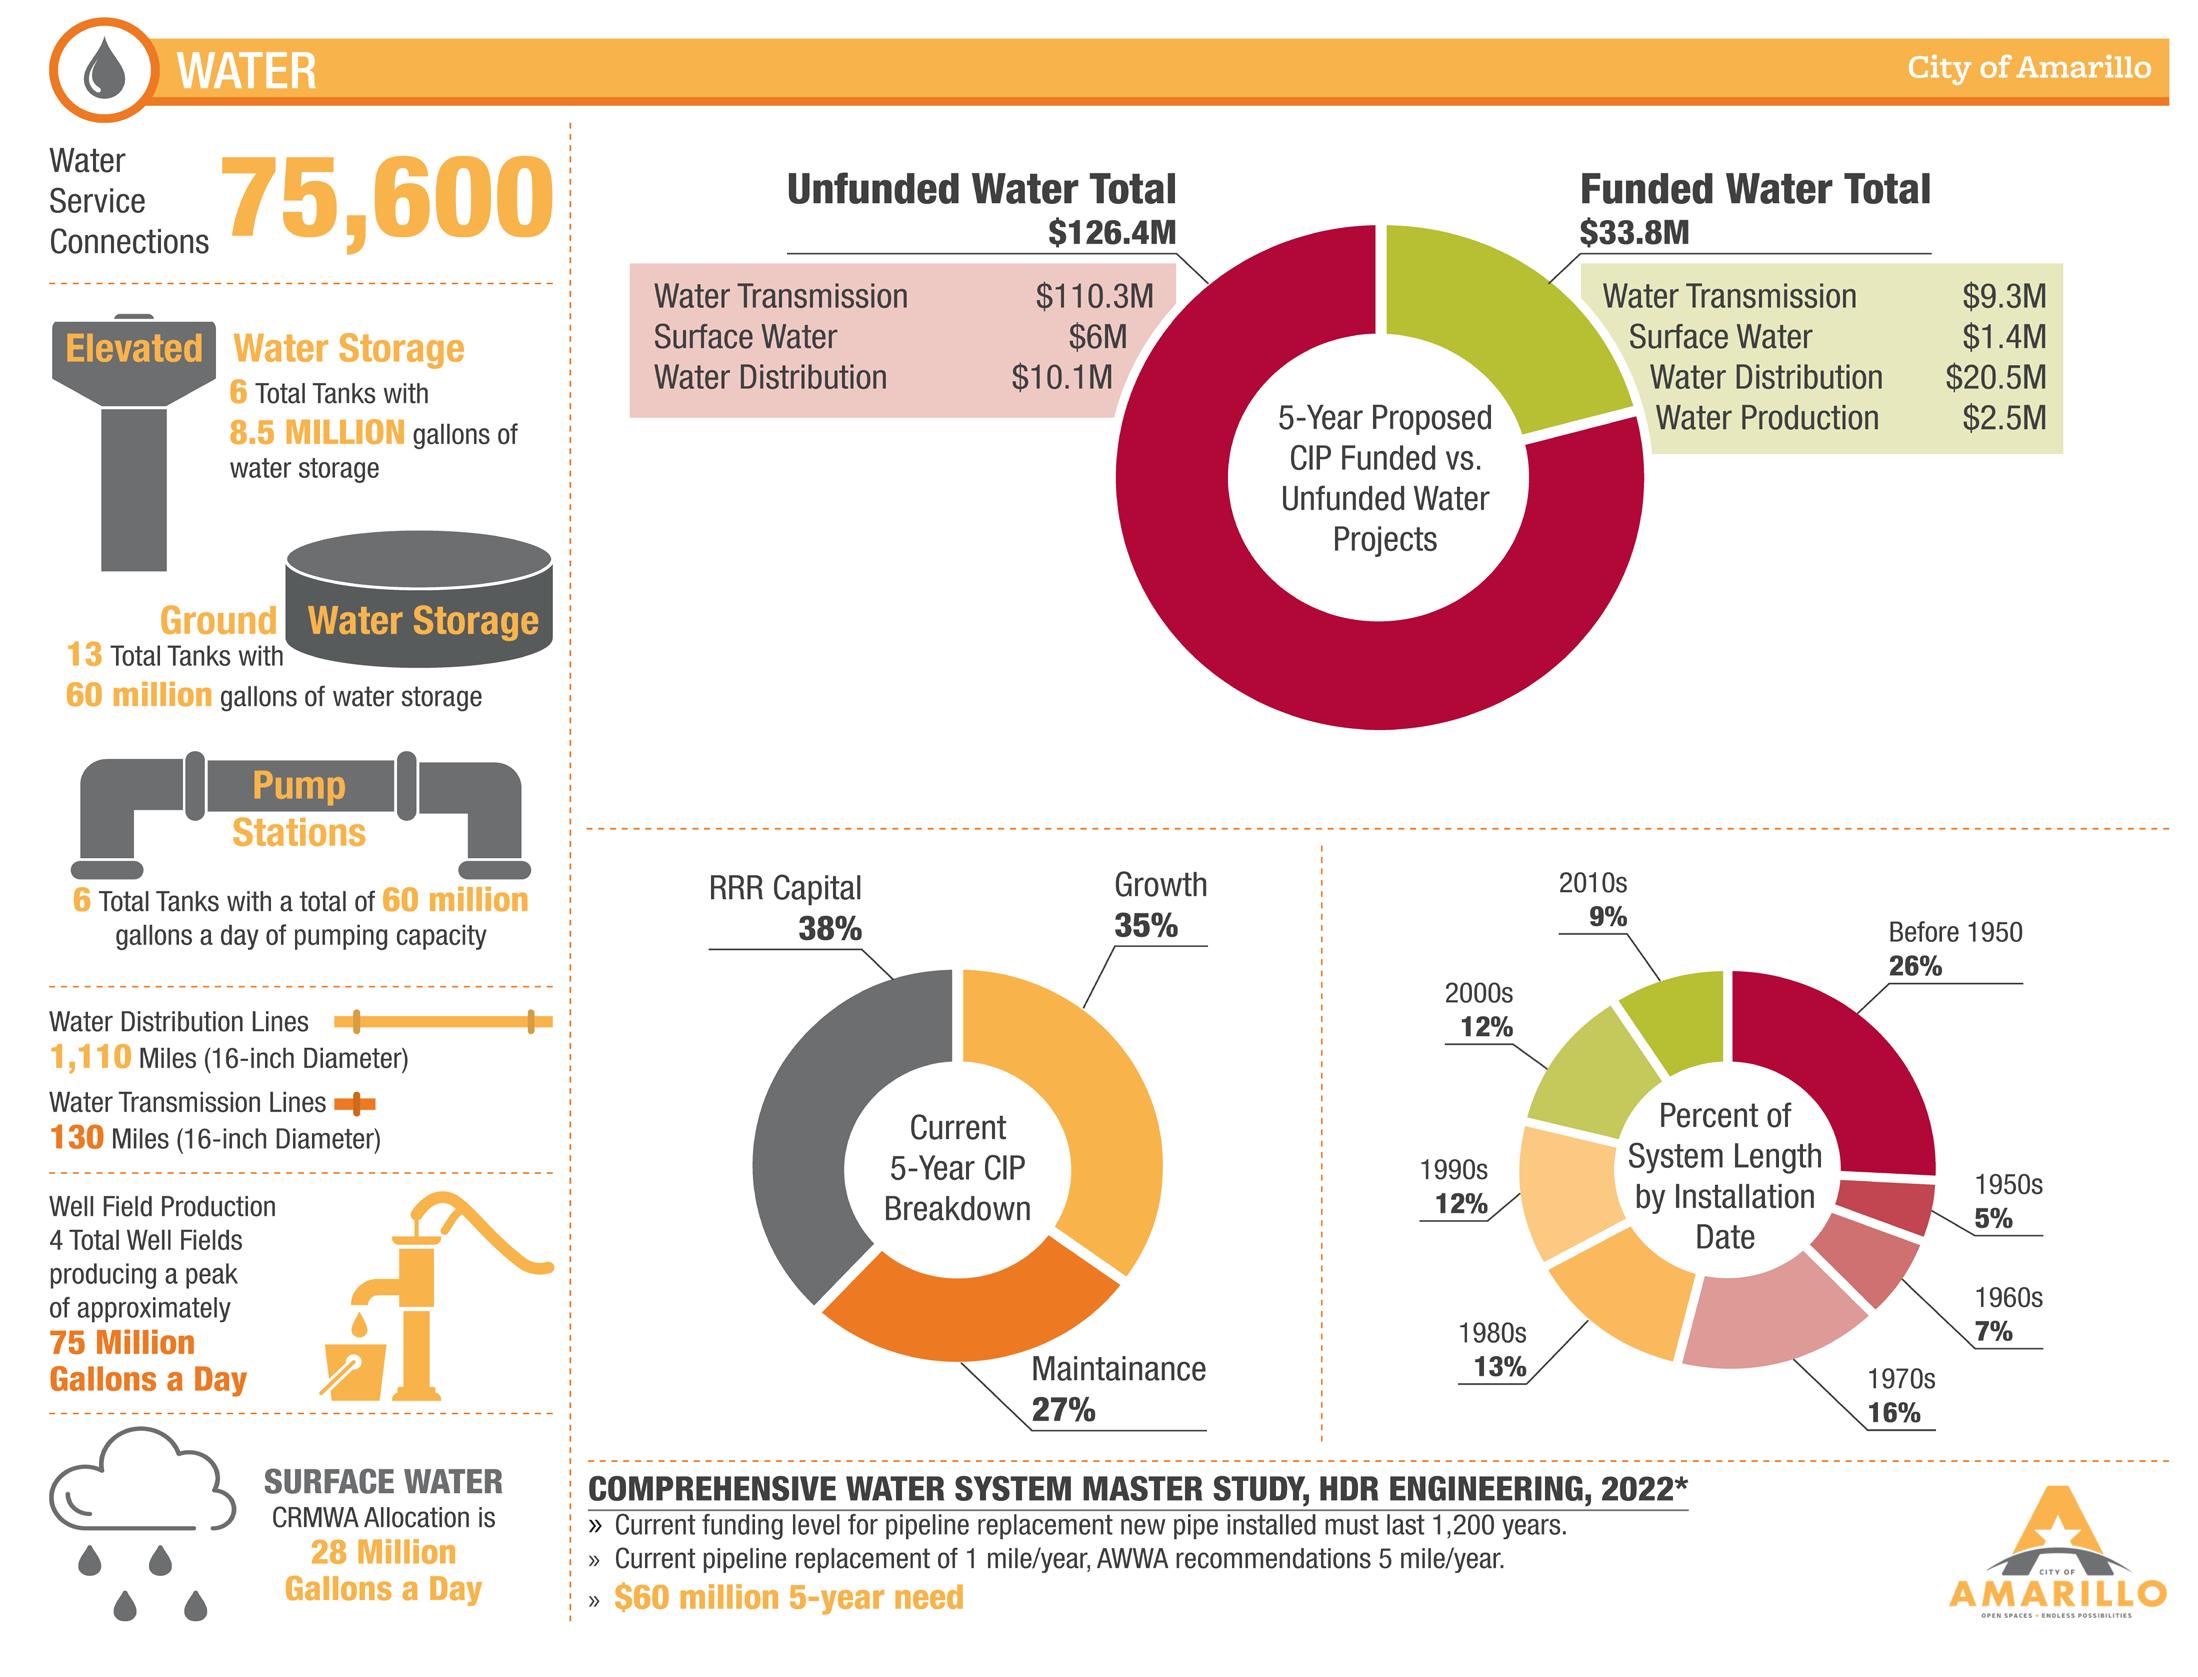
COMMUNITY MOBILITY & INFRASTRUCTURE
addressing long-standing maintenance backlogs, a goal of City Plan is that its recommendations will align with, and be better reflected by, the projects selected in the CIP. One potential means to show this is for the budget to specifically call out information as to which City Plan goals each CIP project addresses. Also, the budget lists CIP projects by the responsible department, some of which, such as Planning, may cover one or more infrastructure types.
Selected CIP projects:
• “Complete Streets” Reconstruction of North Hughes from NW 3rd to NW 24th - $10,080,000
• Traffic Signal System Improvements (replacement of endof-life equipment) - $1,000,000
• Various Street Resurfacing - $2,337,000
• Water Rights Expansion (securing water supply sources)$18,000,000
• Water System Expansion (City share of new waterlines)$500,000
• Wastewater Main Upsizing on River Road and St. Francis - $2,500,000
• Wastewater Interceptor near NE I-40 - $26,171,000
• Citywide Water Main Replacement (including allotment for emergency repairs) - $4,950,000
• Wastewater Master Study - $1,500,000
• Wastewater System Expansion (City share of new wastewater lines) - $500,000
• Citywide Wastewater Main Rehabilitation (including allotment for emergency repairs) - $3,450,000
• Downtown District Drainage Improvements - $5,000,000
• Arterial Roadways with Storm Sewer Improvements:
• 34th Avenue from Helium to Soncy - $414,000
• Bell Street from Hollywood to Sundown - $273,000
• Coulter Street from Hollywood to Sundown - $1,805,500
• Georgia Street from Burk to Hollywood - $357,500

Plans and Studies
Amarillo MPO Transportation Improvement Program (TIP) & Rural Transportation Improvement Program (RTP)
The MPO’s list of Priority Projects is exclusively focused on the major highways and freeways that belong to TxDOT, including widening multiple sections of I-40 and I-27 from 4 to 6 lanes. Other projects relate to the continuing upgrades of Loop 335 to a full freeway, along with its relocation on the west side, from Soncy Road one mile west to the Helium Road corridor. Other Federal funding is allocated to Amarillo City Transit for operating expenses and capital costs of new vehicles.
Corridor projects in the TIP within the City include East Amarillo Boulevard and East 10th Avenue, both TxDOT roadways. Additionally, approximately a dozen intersection improvements are programmed.
The MPO’s Policy Committee has adopted various performance measures designed to quantify improvements to safety (reduced rates of injuries and fatalities) and the system itself (percent of roads and bridges in good condition). This is something the City will need to monitor, especially with their existing issues of funding infrastructure maintenance and repair.
2019 Regional Multimodal Plan
The recent Regional Multimodal Plan consolidated and integrated the recommendations from three previous efforts, the 2010 Hike and Bike Master Plan, the 2012-2017 Regionally Coordinated Transportation Plan, and the 2016 Transit Master Plan. The plan referenced proposed major thoroughfares, a proposed bicycle network, pedestrian focus areas, proposed express transit routes to West Texas A&M and the Amarillo airport, and select intersection improvements. The City intends to adopt the thoroughfare plan contained in the 2019 Regional Multimodal Plan as the official thoroughfare plan. The effort is ongoing at the time of this City Plan effort.
2010 Comprehensive Plan Summary
Mobility concerns expressed by the public, as listed in the 2010 plan, focused on intersections with congestion or safety concerns, many of which are being addressed in the TIP. Safety concerns were noted on corridors with heavy freight and truck traffic, particularly the I-40 frontage roads. Pedestrian and bicycle advocates also noted the need to continue improving conditions for non-motorized transportation. Other roadway projects moving forward include the relocation of Loop 335 west from Soncy Road, to allow it to be developed as a full freeway.
TRENDS AND KEY TAKEAWAYS:
• The current funding for basic infrastructure is not able to fully fund the necessary maintenance, operations, planning, and growth for the City of Amarillo. The projected five-year funding need for water, sewer, streets and drainage is $382 million, of that 54% is currently unfunded.
KEY QUESTIONS FOR THE PLANNING PROCESS
KEY QUESTIONS FOR THE PLANNING PROCESS
Introduction:
• What is your 2045 Vision for Amarillo?
• What do we love about our history and culture and how can we make sure those things are still a part of our City 10 to 20 years from now?
Growth Management & Capacity:
• Should we continue supporting new development on the outskirts of the City and in unincorporated areas of the County, given the impact on the City’s budget, traffic, and utilities?
• What types of industries and/or jobs represent the best opportunities to grow and diversify Amarillo’s economy?
• What tools and strategies can best help take advantage of those opportunities?
Land Use & Community Character:
• Infill development, or building in areas that are already developed rather than building in new, undeveloped areas, has been identified by multiple plans and strategies over the years. We continue to see most new construction in Southwest Amarillo and little progress with infill. What policies and programs are needed to make this type of development easier?
• What do we love about our history and culture and how can we make sure those things are still a part of our City 10 to 20 years from now?
Housing & Neighborhoods:
• What is the community’s vision for the older neighborhoods in the central parts of Amarillo?
• How can they be improved or even reimagined?
Parks & Cultural Resources:
• Parks funding is currently inadequate to cover the maintenance and improvement of existing parks, so how should the community plan for future parks in newly developed areas?
Community Mobility & Infrastructure:
• Several plans discuss making Amarillo more walkable, which means making it easier for people to walk, bike, or use public transportation, instead of driving. But this might mean making driving a little less convenient in some areas. Would improving the walkability, bike, and transit travel in Amarillo be worth making driving less convenient?
• What are the major transportation investments that are necessary to not just keep up with development, but to serve existing areas and guide and shape growth?
• What growth strategy will allow Amarillo to keep up with necessary maintenance of existing infrastructure while also adding new infrastructure to support new development?
• How do we better leverage Route 66?