Figure 29
Tried to Lose Weight in Past 12 Months
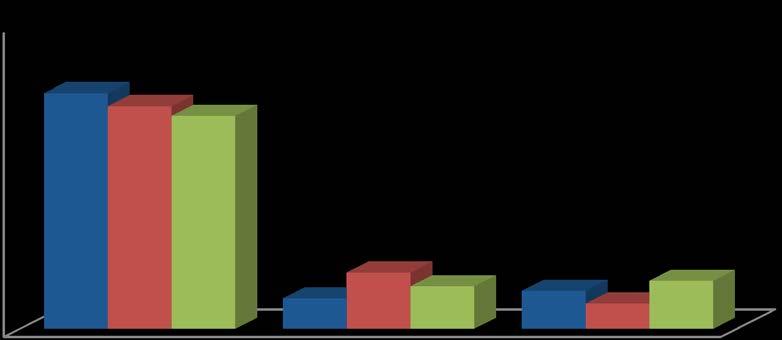
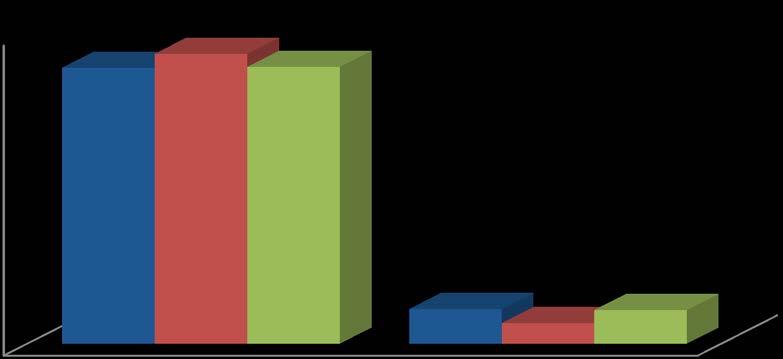
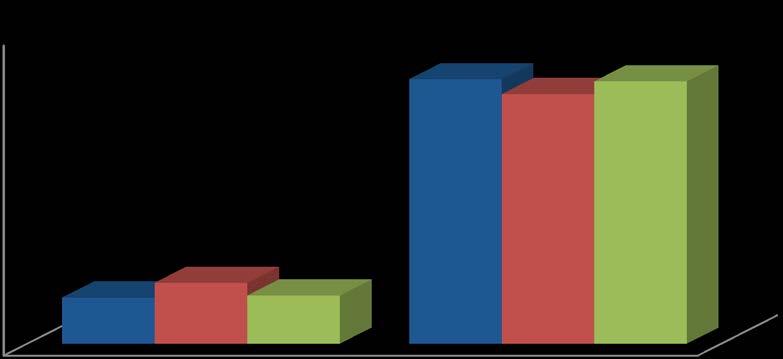
• Respondents were asked if they had tried to lose weight in the past 12 months. As shown in Figure 29, 45.5 percent of the respondents answered “yes.”
• The percentage of respondents who reported trying to lose weight in the past 12 months was higher among respondents age 55 to 64, female respondents, respondents with a college degree or more, and respondents whose income was $75,001 to $100,000 (see Table 48).
Selected Demographics
Table 49
Method Used to Lose Weight
eating habits (didn’t eat late at night, ate several small meals a
a weight loss program such as Weight Watchers, Jenny Craig, Tops or Overeaters
Followed a special diet such as Dr. Atkins, South Beach, other high protein or low carbohydrate diet, cabbage soup diet, Ornish, Nutrisystem,
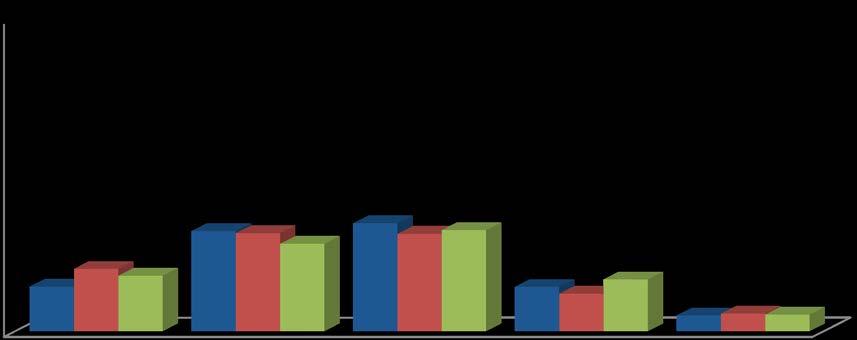
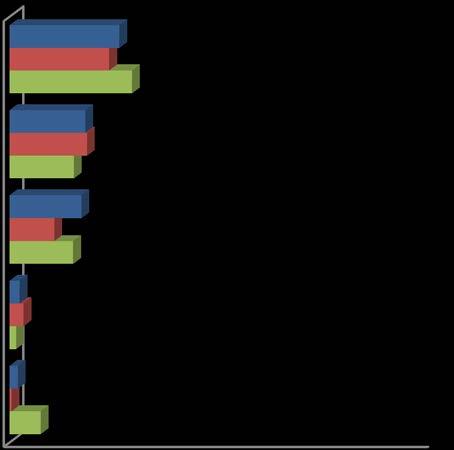
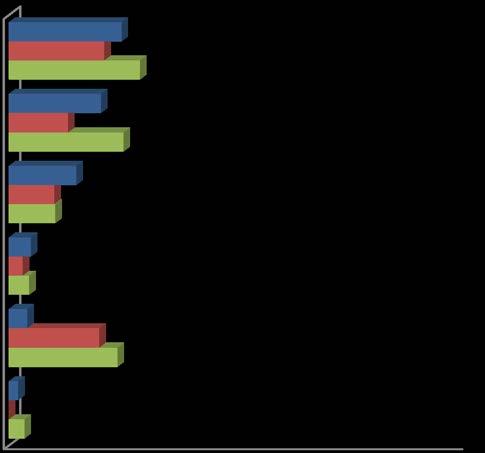
• Respondents who indicated they had tried to lose weight during the past 12 months were asked what method they used to lose weight. As shown in Table 49, 55.5 percent reported exercising and 30.0 percent said they ate less food. Fifteen percent changed their eating habits
1 Because each of these methods was asked as a separate question, the percentages will not total to 100.0 percent.
Figure 30
Been Told You Have Diabetes
Table 50 “At Risk” Comparisons: Diabetes
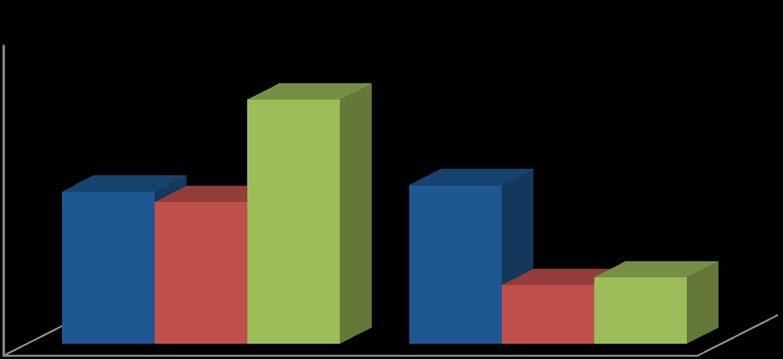
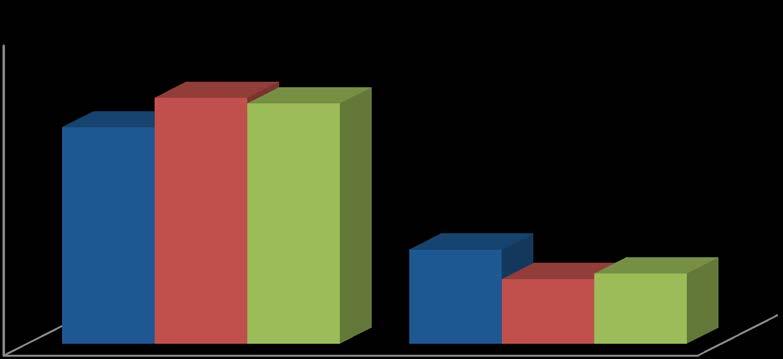
• All respondents were asked if a doctor had told them they had diabetes. As shown in Figure 29, 10.7 percent of the respondents said they had (this excludes women who had gestational diabetes only).
• A comparable percentage of the 2013 ADH service area respondents had been told they had diabetes when compared to 2010 Nationwide (8.7 percent) and 2010 Texas (9.7 percent) data (see Table 50).
• As shown in Table 51, the percentage of respondents who were at risk of diabetes increased as the age of the respondent increased, and was higher among Hispanic respondents, and respondents without children under 18 living in the household.
• Women who had ever been told they had diabetes were asked if they had been told they had diabetes when they were pregnant. Four (0.4 percent) of the 48 respondents answered “yes.” These four women were not included in the “at risk” percentage.
• When asked if they had ever been told by doctor they had pre-diabetes or borderline diabetes, 4.8 percent of the 711 respondents without diabetes answered “yes.” The percentage was 8.6 among African American respondents (see Table 52).
Table 51 Have Diabetes
Table 52
Have Pre-Diabetes or Borderline Diabetes By Selected Demographics
Figure 31
Been Told You Had a Heart Attack
Table 53
“At Risk” Comparisons: Heart Attack
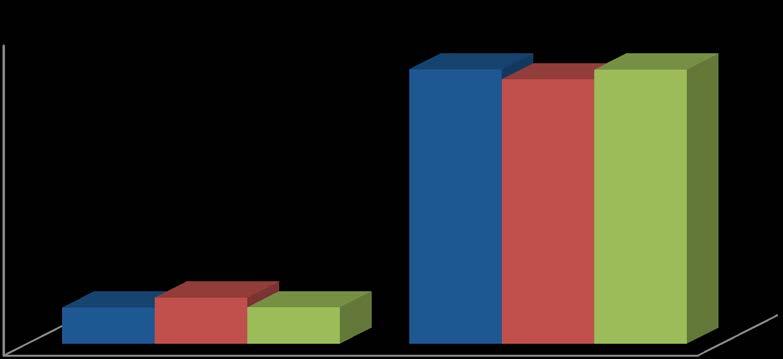
• Respondents were asked if a doctor, nurse, or other health professional had ever told them they had had a heart attack. As shown in Figure 31, 4.0 percent of the respondents indicated they had had a heart attack.
• The percentage of ADH service area 2013 respondents who were at risk because they were told they had a heart attack was similar to Nationwide 2010 and Texas 2010 respondents (see Table 53).
• The percentage of respondents who had been told they had had a heart attack increased as the age of the respondent increased (see Table 54).
Table 54
Been Told You Had a Heart Attack
Selected Demographics
Figure 32
Been Told You Had Angina or Coronary Heart Disease Table 55
“At
Risk” Comparisons: Angina or Coronary Heart Disease
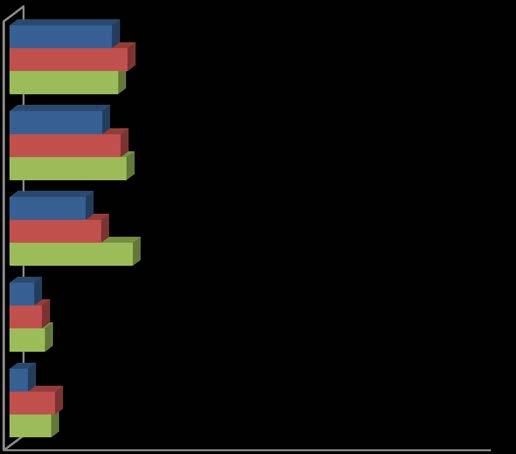
• Respondents were asked if a doctor, nurse, or other health professional had ever told them they had angina or coronary heart disease. Four percent answered “yes” (see Figure 32).
• The percentage of respondents who were at risk because they had angina or coronary heart disease was similar among ADH service area 2013 respondents, Nationwide 2010 and Texas 2010 respondents (see Table 55).
• The percentage of respondents who had been told they had angina or coronary heart disease increased as the age of the respondent increased (see Table 56).
Had Angina or Coronary Heart Disease
Selected Demographics
Figure 33
Been Told You Had a Stroke
Table 57
“At
Risk” Comparisons: Stroke
• Respondents were asked if a doctor, nurse, or other health professional had ever told them they had a stroke. As shown in Figure 32, 2.4 percent of the respondents indicated they had been told they had a stroke.
• The percentage of respondents who were at risk because they had a stroke was similar among ADH service area 2013 respondents than Nationwide 2010 and Texas 2010 respondents (see Table 57).
Figure 34
2013 (n=797) 2010 (n=598) 2007 (n=598)
Been Told You Had Asthma Table 58
“At
Risk” Comparisons: Currently Have Asthma
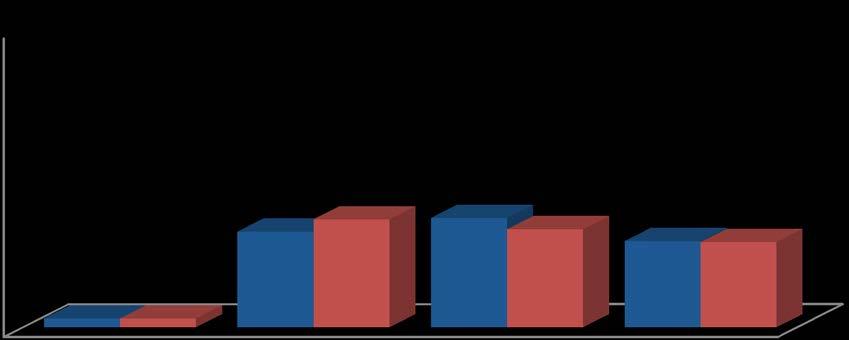
• Respondents were asked if a doctor, nurse, or other health professional had ever told them they had asthma. As shown in Figure 34, 14.8 percent of the respondents had been told they had asthma.
• When asked if they still had asthma, 69 of the 118 respondents who had ever been told they had asthma answered “yes” (58.7 percent). This equals 8.7 percent (“at risk”) of all 797 respondents who answered the questions (see Table 58). This is higher than the Texas percentage (7.4 percent) but lower than the nationwide percentage (9.0 percent) in 2010
• As shown in Table 59, the percentage of respondents who had ever been told they had asthma varied by age and was higher among respondents that completed the interview in English.
• The percentage of respondents who reported they currently had asthma was higher among female respondents, and respondents with an income less than $15,001 to $25,000 (see Table 60).
Table 59
Figure 35
Smoked at Least 100 Cigarettes in Entire Life
Table 61
“At
Risk” Comparisons: Smoked at Least 100 Cigarettes in Entire Life
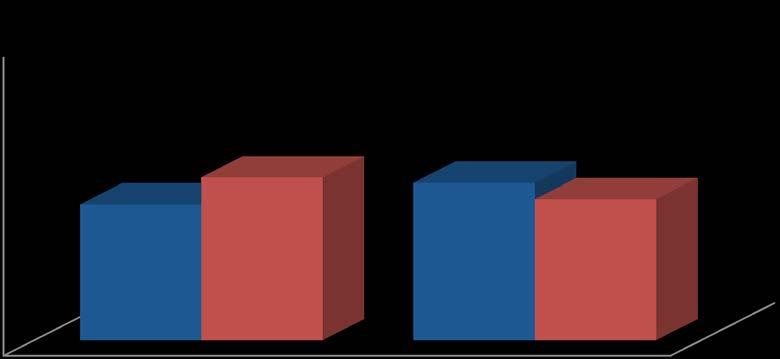
• Respondents were asked if they had smoked at least 100 cigarettes (5 packs) in their life time. As shown in Figure 35, 42.2 percent reported having smoked at least 100 cigarettes in their life.
• The percentage of ADH service area 2013 respondents who are “at risk” appears lower than the Nationwide 2009 respondents and similar to Texas 2009 respondents (see Table 61)
• Smoking at least 100 cigarettes in their life (“at risk”) decreased as education and income increased and was higher among respondents age 65 to 74 (see Table 62).
1 The Nationwide and Texas 2009 comparison data for this question was found at: http://www.dshs.state.tx.us/chs/brfss/query/ brfss_dbquery2.asp.
Selected Demographics
Age of respondent
Currently Use Chewing Tobacco (n=797)
• Respondents were asked if they currently used chewing tobacco, snuff, or snus every day, some days or not at all. As shown in Figure 36, 3.6 percent use chewing tobacco (2.4 percent) every day while (1.2 percent) use chewing tobacco some days.
Table 63
“At Risk” Comparisons: Smoke Every Day or Some Days
• Respondents who had smoked at least 100 cigarettes in their entire life were asked if they still smoked every day, some days or not at all. As shown in Figure 37, 41.0 percent of them still smoked every day while 14.8 percent smoked some days. Fortyfour percent no longer smoked cigarettes.
• An “at risk” person is defined as one who has smoked at least 100 cigarettes in their entire life and still smokes every day or some days (184 respondents/797 total = 23.1 percent) (see Table 63) The percentage at risk appeared to be greater in the ADH service area 2013 compared to Nationwide and Texas 2012.
• The percentage of respondents at risk due to smoking every day or some days generally decreased as the age of the respondent increased, education and income increased, and was higher among male respondents and respondents who completed the interview in English (see Table 64).
Figure 38
Tried to Quit Smoking in Past 12 Months
• Respondents who were still smoking either every day or some days were asked if, in the past 12 months, they had stopped smoking for one day or longer because they were trying to quit smoking. As shown in Figure 38, 55.6 percent of these respondents answered “yes.”
Driving after Drinking (n=794)
• Respondents were asked how many times they had driven when they had had perhaps too much to drink, during the past 30 days. As shown in Figure 39, 1.6 percent, 13 respondents, reported driving after drinking too much.
• Among the 13 respondents who stated that they had driven after drinking too much, 71.5 percent reported doing it one or two times. Two had driven after drinking too much 5 times. One respondent reported 10 times and another reported 25 times. The median response was two times
Figure 40
Ever Had a Mammogram
2013 (n=405) 2010 (n=357) 2007 (n=371)
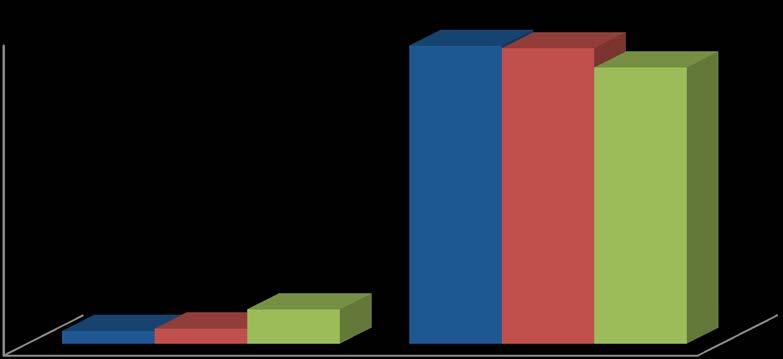
• Female respondents were asked if they had ever had a mammogram, an x-ray of each breast to look for breast cancer. As shown in Figure 40, 64.9 percent of the female respondents reported having had a mammogram.
• As shown in Table 65 the percentage of the female respondents who had ever had a mammogram generally increased as the age of the respondent increased, and was higher among respondents of “other” ethnicity, and respondents with income $75,001 to $100,000
Figure 41
Time Since Last Mammogram
Table 66
“At Risk” Comparisons: Time Since Last Mammogram (Women age 40+ and no mammogram in past 2 years)
• Female respondents of all ages who reported having had a mammogram were asked how long it had been since they got their last one. As shown in Figure 41, 78.1 percent reported having a mammogram either within the past year (59.2 percent) or within the past two years (18.9 percent).
• W omen over 40 what never had a mammogram or had not had one within the past two years were classified as “at risk” When only female respondents age 40 and older were asked how long it had been since they got their last mammogram, 26.8 percent of them reported that it had been longer than 2 years (see Table 66).
• As shown in Table 67, the percentage of female respondents who had a mammogram more than 2 years ago generally increased as age increased and was higher among respondents of “other” ethnicity.
Since Last Mammogram
Selected Demographics
Figure 42
Ever Had a Pap Test
• Female respondents were asked if they had ever had a Pap test, a test for cancer of the cervix. As shown in Figure 42, 92.0 percent of those respondents answered “yes.”
• The percentage of female respondents who reported ever having had a Pap test increased as education, age, and income increased and was higher among white respondents (see Table 68).
Table 68 Ever Had a Pap Test By Selected
Demographics
Figure 43
Time Since Last Pap Test
Table 69
“At Risk” Comparisons: Time Since Last Pap Test (Women age 18+ and no Pap in past 3 years)
• Female respondents who reported having had a Pap test were asked how long it had been since they got their last one. As shown in Figure 43, 67.5 percent of those respondents reported they had gotten their last Pap test within the past year (50.1 percent) or within the past 2 years (17.4 percent).
• W omen who had never had a pap test or had not had one within the past three years were classified as “at risk.” The percentage of at risk women is higher for ADH service area 2013 respondents than Nationwide 2010 and Texas 2010 respondents (see Table 69).
• The percentage of female respondents over 18 years of age who were at risk because they had not had a Pap test in the past three years increased as the age of the respondent increased, and was greater among respondents that completed the interview in English and those with children under 18 living in the household (see Table 70).
Table 70
At Risk Women 18+ and No Pap Test in Past 3 Years
Selected Demographics
Figure 44
Ever Had a Prostate-Specific Antigen Test
2013 (n=380) 2010 (n=238) 2007 (n=222)
• Male respondents were asked if they had ever had a Prostate-Specific Antigen (PSA) test, a test for prostate cancer. As shown in Figure 44, 32.0 percent of those respondents answered “yes.”
• The percentage of the male respondents who reported ever having had a PSA test generally increased as the age of the respondent, education and income increased, and was higher among African American respondents, respondents without children under 18 living in the household, and respondents who completed the interview in English (see Table 71).
Table 71
Ever Had Prostate-Specific Antigen (PSA) Test By Selected Demographics
Figure 45
Time Since Last PSA Test
• Male respondents who reported having had a PSA test were asked how long it had been since they had the test. As shown in Figure 45, 82.2 percent of those respondents indicated they had a PSA test within the past year (67.6 percent) or within the past 2 years (14.6 percent).
Figure 46
Had Prostate Cancer
• Male respondents who had ever had a PSA test were asked if they had ever been told by a doctor, nurse, or other health professional that they had prostate cancer. As shown in Figure 46, 11.7 percent of those respondents answered “yes.”
Figure 47
Ever Been Tested for HIV
• Respondents were asked if they had ever been tested for HIV, including testing fluid from their mouth (not counting tests as part of a blood donation). As shown in Figure 47, 35.7 percent indicated they had been tested for HIV.
• The percentage of respondents who reported being tested for HIV generally decreased as the age of the respondent increased and decreased as income increased. Percentages were higher among female respondents, African American respondents, respondents with children under 18 living in the household and respondents living in Potter County (see Table 72).
• Fifty-six percent of those who had been tested for HIV were tested from between January, 2010 to March 2013 (see Table 73).
Table 73
HIV Test
Table 74
Provider of Last HIV Test
• Respondents who had been tested for HIV were asked where they had their last HIV test. As shown in Table 74, 33.8 percent of those respondents got their HIV test from a health department clinic. Thirty-two percent got their test from a private doctor or HMO office.
Figure 48
Respondent is Caregiver for Elderly Person
• When asked if they were a family caregiver for someone that is elderly (age 65 or older), 10.2 percent of the respondents answered “yes” (see Figure 48).
• The percentage of respondents who reported they were a caregiver for an elderly person was higher among respondents age 65 to 74, those without children under 18 living in the household, and respondents whose income is $15,001 to $25,000 (see Table 75).
Respondent is Caregiver for Elderly Person
Selected Demographics
Have children under 18 in household
Figure 49
Family Member Has Significant Memory Problems
• Respondents who reported being a family caregiver for someone elderly were asked if that elderly person had significant memory problems that cause the respondents, concern. As shown in Figure 49, 38.3 percent of those respondents indicated that the person did have significant memory problems that caused concern.
Table 76
Specific Caregiver Needs Not Being Met
• Respondents who were caregivers were asked to identify specific needs that are not being met where they wish they could have assistance. As shown in Table 76, 30.5 percent of these respondents needed financial support. Nineteen percent needed emotional support. Thirty-one percent required no support.
V. CONCLUSIONS
In February and March 2013, the Survey Research Center conducted a health survey and needs assessment of the residents of the service area. Data collected from this survey was compared where possible to findings of the 2011 Texas and Nationwide Behavioral Risk Factor Surveillance System surveys. Other years for Texas and Nationwide finding were used when 2011 was not available
Eighty-one percent of the service area respondents reported their state of health was either excellent (14.3 percent), very good (32.0 percent) or good (34.5 percent). Nineteen percent reported their health was either fair (14.2 percent) or poor (5.0 percent) and were considered “at risk.” In general, respondents with lower education and income and those between the ages of 35 and 44 were more likely to be at risk. Fifty-two percent of the respondents reported getting a checkup even though they felt healthy. Over three-quarters (77.5 percent) of those had gotten a checkup within the last 12 months.
Seventy-three percent of the respondents had some kind of health care coverage. Twenty-seven percent did not and were considered “at risk.” Sixty-two percent of those with coverage had health insurance through someone’s work or union. Twenty-one percent had Medicare. Sixty-four percent of the respondents had a single personal doctor, while 4.7 percent reported they had more than one personal doctor. Twenty-three percent of the respondents reported needing to see a doctor in the past 12 months but did not because of cost. Seventythree percent of respondents reported their spouse or partner had health insurance while 89.8 percent of those with children under 18 living in the household reported their child had health insurance. Forty percent of the children with insurance had Medicaid or public aid. However, 3.5 percent of the children had CHIPS.
When asked the type of health care they would most likely use, 51.5 percent of the respondents said a doctor or HMO. A doctor or HMO (63.4 percent) was also the most likely provider respondents would use if their child needed health care. Respondents expressed the most common problem experienced with health care received for their child was the long wait (25.8 percent). Meanwhile, the most common reason that prevented children from getting needed health care was lack of transportation (24.6 percent).
Forty-nine percent of the respondents had gotten a flu vaccine in the past 12 months. When 26.9 percent of the respondents with children were told within the past 12 months that their child needed vaccinations, 88.9 percent of those respondents reported their child had gotten the vaccinations. Forty-six percent of those went to a private health care provider for the immunizations.
Twelve percent of respondents reported that an adult in their household had sought mental health care in the past two years. Respondents were more likely to use a private provider (62.4 percent) than TPMHMR (19.4 percent) or the J.O. Wyatt Clinic (8.5 percent) for mental health care.
Seventy percent of the respondents indicated they participated in physical activities or exercises in the past month. Using height and weight, the Body Mass Index was calculated. 61.4 percent of respondents were either overweight (34.4 percent) or obese (27.0 percent). Less than half of all respondents had tried to lose weight in the past 12 months (45.5 percent).
Eighty-two percent reported that they drive a motor vehicle almost every day, while 8.8 percent drive a motor vehicle a few days a week. Respondents were asked how often they read emails or text messages while driving. Seventy-three percent of respondents reported they never read mails or text messages while driving. Seventy-six percent responded that they
never send emails or text messages while driving. The respondents were asked if the state or the city had a law banning texting or emailing while driving. Sixty five percent of the respondents indicated the city had a law banning texting or emailing while driving, 21.3 percent of those respondents reported both the state and the city had a law banning texting and emailing while driving.
Respondents were asked if they had ever had certain examinations. Sixty-five percent of female respondents reported having had a mammogram. Twenty-seven percent were “at risk” because they were age 40 or older and had not had a mammogram within the past two years. Ninety-two percent of female respondents reported having a Pap test. Thirty percent were “at risk” because they had not had a Pap test within the past three years. Thirty-two percent of male respondents reported having a Prostate-Specific Antigen test and 82.2 percent of them had the test within the past two years. Thirty-six percent of all respondents been tested for HIV and 56.1 percent of those respondents had been tested since January 2010 Thirty-four percent of those that had been tested for HIV got tested at a health department and 32.0 percent went to a private doctor.
Forty-two percent were at risk because they had smoked at least 100 cigarettes and they continued to smoke every day or some days. Fifty-six percent of these respondents had stopped smoking for one day or longer in the past 12 months because they were trying to quit. The number of times respondents reported driving after they had had perhaps too much to drink in the past 30 days was 3.1.
The data in this report can be used as a benchmark for the community compared to National and Texas surveys. It can also be used as a benchmark for future survey comparisons.
Appendix a: survey instrument
RANDALL AND POTTER COUNTY NEEDS ASSESSMENT 2013
Hello, my name is ______. Amarillo's Public Health Department is conducting a survey of area residents and I would like to talk with the person in the household age 18 or older who had the most recent birthday.
(TO RESPONDENT) The Health Department is conducting a survey to assess health care issues and needs. I want to stress that this survey is being conducted by the Amarillo Public Health Department and not by a candidate for political office. The questions that I want to ask you will take only a few minutes and your answers will be useful to the city staff and commission. All of your answers will be kept confidential. The survey will take about 10 to 15 minutes to complete. This project has been approved by the UNT Institutional Review Board. If you have any questions about the study you may call 800-687-7055
<<INTERVIEWER: IF YES, PRESS 1 TO CONTINUE WITH ENGLISH SURVEY PRESS 2 TO CONTINUE WITH SPANISH SURVEY IF NO, PRESS CNTRLEND
SKP QSKIP1
NOTE: A SUBSAMPLE WILL RECEIVE THE FOLLOWING INTRODUCTION SO THAT AN ADEQUATE NUMBER OF MALE RESPONDENTS BETWEEN THE AGES OF 18 TO 65 ARE INCLUDED.
Q: INTRO2 **********************************************
Hello, my name is ______. Amarillo's Public Health Department is conducting a survey of area residents and I would like to talk with a MALE in the household age 18 to 65 with the most recent birthday.
(INTERVIEWER: IF MALE IS NOT AVAILABLE, SCHEDULE A CALLBACK) (IF NO MALE IN THE HOUSEHOLD, TERMINATE INTERVIEW)
(TO RESPONDENT) The Health Department is conducting a survey to assess health care issues and needs. I want to stress that this survey is being conducted by the Amarillo Public Health Department and not by a candidate for political office. The questions that I want to ask you will take only a few minutes and your answers will be useful to the city staff and commission. All of your answers will be kept confidential. The survey will take about 10 to 15 minutes to complete. This project has been approved by the UNT Institutional Review Board. If you have any questions about the study you may call 800-687-7055
<<INTERVIEWER: IF YES, PRESS 1 TO CONTINUE WITH ENGLISH SURVEY PRESS 2 TO CONTINUE WITH SPANISH SURVEY IF NO, PRESS CNTRLEND
Questions used for weighting:
CELL1. Are we speaking with you on a cell phone? (IF NO SKP CELL5)
CELL2. Are you driving or doing anything that requires your full attention right now? (IF YES, ASK; "When would be a better time to call you? Who should we ask for?)
CELL3. Before we begin, I want to make sure this is a good time for you to talk and that you are in a safe and private place to use your cell phone. If at any point you want to go to another room or if you want to use a different phone where I could call you back, just let me know. (IF NO, SKP ALTNUM)
CELL4. In your household, are you also reachable by a landline phone in addition to this or any other cell phones you may have? INTERVIEWER: “YES” WILL INCLUDE VOICE-OVER INTERNET PROTOCOL (VOIP) AVAILABLE FROM CABLE COMPANIES. (SKP TO Q1)
CELL5. In addition to this landline phone are you also reachable by a cell phone in your household?
1. What is your zip code?
1.79012 13. 79108
2. 79015 14. 79109
3. 79016 15. 79110
4. 79042 16. 79111
5. 79091 17. 79114
6. 79101 18. 79118
7. 79102 19. 79119
8. 79103 20. 79121
9. 79104 21. 79124
10. 79105 22. OTHER (TERMINATE)
11. 79106 88. DON’T KNOW/NOT SURE (TERMINATE)
12. 79107 99. REFUSED (TERMINATE)
1A. What county do you live in? 1. Potter 2. Randall 3. Other county (terminate)
2. Would you say that in general your health is
1. Excellent 2. Very good 3. Good
4. Fair 5. Poor
8. DON’T KNOW/NOT SURE 9. REFUSED
3. Do you have any kind of health care coverage, including health insurance, prepaid plans such as HMOs, or government plans such as Medicare?
1. Yes
2. No
8. DON’T KNOW/NOT SURE
9. REFUSED If ans > 1 skp Q4
3A. Is your health insurance primarily:
1. Health insurance through someone's work or union (includes HMO)
2. Health insurance bought directly by yourself or family
3. Medicare, a government plan that pays health care bills for people aged 65 and over and for some disabled people
4. Medicaid or public aid
5. Insurance through JO Wyatt or a District Clinic
6. Other, ______________
8. DON’T KNOW/NOT SURE
9. REFUSED
4. Do you have ONE person you think of as your personal doctor or health care provider?
1. Yes (SKIP TO Q5)
2. No
8. DON’T KNOW/NOT SURE (SKIP TO Q5)
9. REFUSED (SKIP TO Q5)
4A. Is there more than one, or is there no person who you think of as your personal doctor or health care provider?”
1. Yes, more than one
2. No person thought of as personal doctor
8. DON’T KNOW/NOT SURE
9. REFUSED
5. Was there a time in the past 12 months when you needed to see a doctor but could not because of cost?
1. Yes
2. No
8. DON’T KNOW/NOT SURE
9. REFUSED
6. Does your spouse or partner have health insurance?
1. YES (ASK 6A)
2. NO
3. DOES NOT HAVE A SPOUSE OR PARTNER (SKIP TO Q7)
8. DON’T KNOW/NOT SURE
9. REFUSED
6A. Is that insurance primarily:
1. Health insurance through someone's work or union (includes HMO)
2. Health insurance bought directly by yourself or family
3. Medicare, a government plan that pays health care bills for people aged 65 and over and for some disabled people
4. Medicaid or public aid
5. Insurance through a District Clinic
6. Other, ______________
8. DON’T KNOW/NOT SURE
9. REFUSED
7. Do you have any children age 18 or younger living in your household?
1. YES
2. NO (SKIP TO 9)
8. DON’T KNOW/NOT SURE
9. REFUSED
8. Do you have health insurance for your children?
1. YES (ASK 7A)
2. NO (SKP Q9)
8. DON’T KNOW/NOT SURE (SKP Q9)
9. REFUSED(SKP Q9)
8A. Is that insurance primarily:
1. Health insurance through someone's work or union (includes HMO)
2. Health insurance bought directly by yourself or family
3. Medicare, a government plan that pays health care bills for people aged 65 and over and for some disabled people
4. Medicaid or public aid
5. Insurance through JO Wyatt or a District Clinic
6. Other, ______________
8. DON’T KNOW/NOT SURE
9. REFUSED
9. If you or an adult member of your household are in need of healthcare which of the following would you most likely use?
1. Private doctor
2. J.O. Wyatt or District Clinic
3. Hospital Emergency Room
4. Urgent Care Center
5. Other (SPECIFY)
6. Would not use any source
8. DON’T KNOW/NOT SURE
9. REFUSED
10. Some people visit a doctor or clinic for a checkup even though they are feeling healthy. Have you ever done that for yourself?
1. YES (ASK 10A)
2. NO
8. DON’T KNOW/NOT SURE
9. REFUSED
10A. Was your most recent checkup
1. Less than 12 months ago
2. Less than 2 years ago
3. Longer than 2 years ago
8. DON’T KNOW/NOT SURE
9. REFUSED
11. If a child living with you needed health care which of the following would you most likely use?
1. Private Doctor
2. J.O. Wyatt or District Clinic
3. Hospital Emergency Room
4. Urgent Care Center
5. Other
6. Would not use any source
8. DON’T KNOW/NOT SURE
9. REFUSED
(IF Q7 > 1 SKIP TO Q13)
12. Have you or an adult in your household sought health care for a child from that source within the past two years?
1. YES (ASK 12A-B)
2. NO (ASK 12C)
8. DON’T KNOW/NOT SURE
9. REFUSED
12A. Would you say the care your child received there is generally excellent, good, fair, or poor?
1. Excellent
2. Good
3. Fair
4. Poor
8. DON’T KNOW/NOT SURE
9. REFUSED
12B. Did you experience any of the following when you sought health care f or your child?
12C. Did any of the following reasons prevent you from getting health care for your child?
13. How long has it been since you last visited a dentist or a dental clinic for any reason? Include visits to dental specialists, such as orthodontists.
Read only if necessary:
1. Within the past year (anytime less than 12 months ago)
2. Within the past 2 years (1 year but less than 2 years ago)
3. Within the past 5 years (2 years but less than 5 years ago)
4. Five or more years ago
5. Never
8. DON’T KNOW/NOT SURE
9. REFUSED
14. If you or an adult member of your household are in need of dental care which of the following would you most likely use?
1. Private Dentist
2. J.O. Wyatt Dental Clinic
3. Hospital Emergency Room
4. Regence Health Network or RHN
5. Other (SPECIFY)
6. Would not use any source
8. DON’T KNOW/NOT SURE
9. REFUSED
15. A flu shot is an influenza vaccine injected into your arm. During the past 12 months, have you had a flu shot?
1. Yes
2. No
8. DON’T KNOW/NOT SURE
9. REFUSED
15a. During the past 12 months, have you had a flu vaccine that was sprayed in your nose? The flu vaccine that is sprayed in the nose is also called FluMist™.
1. Yes
2. No
8. DON’T KNOW/NOT SURE
9. REFUSED
If Q7 > 1 skip to Q17
16. Has a doctor, nurse, medical assistant, or school representative told you within the past 12 months that one of your children needed vaccinations?
1. YES (ASK 16A)
2. NO
8. DON’T KNOW/NOT SURE
9. REFUSED
16A. Did your child receive the vaccinations?
1. YES (ASK 16B)
2. NO
8. DON’T KNOW/NOT SURE
9. REFUSED
16B. Where did you go to get you children immunized?
1. Northwest Womens’ and Childrens’ Clinic
2. Health Department
3. Private healthcare provider
4. Pharmacy
5. Other, ________________
8. DON’T KNOW/NOT SURE
9. REFUSED
17. How tall are you without shoes?
1. ENTER HEIGHT
8. DON’T KNOW/NOT SURE
9. REFUSED
18. How much do you weigh without clothes or shoes? (If you are currently pregnant, how much did you weigh before your pregnancy?)
1. ENTER WEIGHT
8. DON’T KNOW/NOT SURE 9. REFUSED
19. Do you consider yourself now to be . . . [If you are currently pregnant, what did you consider yourself to be before you were pregnant?]
1. Overweight
2. Underweight
3. About the right weight
8. DON’T KNOW/NOT SURE
9. REFUSED
20. During the past 12 months, have you tried to lose weight?
1. YES
2. NO
8. DON’T KNOW/NOT SURE
9. REFUSED IF (ANS > 1) SKP Q22
21 How did you try to lose weight? CODE ALL THAT APPLY
1. ATE LESS FOOD (AMOUNT SWITCHED TO FOODS WITH LOWER CALORIES
2. ATE LESS FAT
3. ATE FEWER CARBOHYDRATES
4. EXERCISED
5. SKIPPED MEALS
6. ATE “DIET” FOODS OR PRODUCTS
7. USED A LIQUID DIET FORMULA SUCH AS SLIMFAST OR OPTIFAST
8. JOINED A WEIGHT LOSS PROGRAM SUCH AS WEIGHT WATCHERS, JENNY CRAIG, TOPS, OR OVEREATERS ANONYMOUS
9. FOLLOWED A SPECIAL DIET SUCH AS DR. ATKINS, SOUTH BEACH, OTHER HIGH PROTEIN OR LOW CARBOHYDRATE DIET, CABBAGE SOUP DIET, ORNISH, NUTRISYSTEM, BODY-FOR-LIFE
11. TOOK DIET PILLS PRESCRIBED BY A DOCTOR
12. TOOK OTHER PILLS, MEDICINES, HERBS, OR SUPPLEMENTS NOT NEEDING A PRESCRIPTION
13. STARTED TO SMOKE OR BEGAN TO SMOKE AGAIN
14. TOOK LAXATIVES OR VOMITED
15. DRANK A LOT OF WATER
16. ATE MORE FRUITS, VEGETABLES, SALADS
17. ATE LESS SUGAR, CANDY, SWEETS
18. CHANGED EATING HABITS (DIDN’T EAT LATE AT NIGHT, ATE SEVERAL SMALL MEALS A DAY)
19. ATE LESS JUNK FOOD OR FAST FOOD
20. OTHER (SPECIFY
88. DON’T KNOW/NOT SURE
99. REFUSED
22. During the past month, other than your regular job, did you participate in any physical activities or exercises such as running, calisthenics, golf, gardening, or walking for exercise?
1. Yes
2. No
8. DON’T KNOW/NOT SURE
9. REFUSED
23. How often in the past 12 months would you say you were worried or stressed about having enough money to buy nutritious meals? Would you say you were worried or stressed---
1 Always 2 Usually 3 Sometimes 4 Rarely 5 Never
7. NOT APPLICABLE
8. DON’T KNOW/NOT SURE 9. REFUSED
24. INTERVIEWER: KEY GENDER OF RESPONDENT
1. FEMALE
2. MALE
25. Have you ever been told by a doctor that you have diabetes?
1. Yes (ASK 25A) 2. No (GO TO Q25B)
8. DON’T KNOW/NOT SURE (GO TO Q26)
9. REFUSED (GO TO Q26)
(IF Q24 > 1 SKIP TO Q26)
25A. “Was this only when you were pregnant?”
1. Yes (GO TO Q26) 2. No
8. DON’T KNOW/NOT SURE (GO TO Q26) 9. REFUSED (GO TO Q26)
25B. Have you ever been told by a doctor that you have pre-diabetes or borderline diabetes?
1. Yes 2. No
8. DON’T KNOW/NOT SURE 9. REFUSED
26. Has a doctor, nurse or other health professional ever told you that you had a heart attack, also called a myocardial infarction?
1. Yes 2. No
8. DON’T KNOW/NOT SURE 9. REFUSED
27. Has a doctor, nurse or other health professional ever told you that you had angina or coronary heart disease?
1. Yes 2. No
8. DON’T KNOW/NOT SURE
9. REFUSED
28. Has a doctor, nurse or other health professional ever told you that you had a stroke?
1. Yes
2. No
8. DON’T KNOW/NOT SURE
9. REFUSED
29. Have you ever been told by a doctor, nurse, or other health professional that you had asthma?
1. Yes
2. No (SKIP TO Q30)
8. DON’T KNOW/NOT SURE (SKIP TO Q30)
9. REFUSED (SKIP TO Q30)
29A. Do you still have asthma?
1. Yes
2. No
8. DON’T KNOW/NOT SURE
9. REFUSED
30. Have you smoked at least 100 cigarettes in your entire life? NOTE: 5 packs = 100 cigarettes
1. Yes
2. No
8. DON’T KNOW/NOT SURE
9. REFUSED
Q30A. Do you currently use chewing tobacco, snuff, or snus every day, some days, or not at all? (NOTE: Snus rhymes with “goose‟ (Swedish for snuff) is a moist smokeless tobacco, usually sold in small pouches that are placed under the lip against the gum.)
1 Every day
2 Some days
3 Not at all
8. DON’T KNOW/NOT SURE
9. REFUSED
IF (Q30 > 1 AND Q30A > 2) SKP Q31
30B. During the past 12 months, have you stopped smoking or using tobacco products for one day or longer because you were trying to quit using tobacco?
1. Yes
2. No
8. DON’T KNOW/NOT SURE
9. REFUSED
31. During the past 30 days, how many times have you driven when you’ve had perhaps too much to drink?
_ _ Number of times None
8. DON’T KNOW/NOT SURE 9. REFUSED
IF Q24 > 1 SKIP TO Q34
32. A mammogram is an x-ray of each breast to look for breast cancer. Have you ever had a mammogram?
1. Yes
2. No [Go to Q33]
8. DON’T KNOW/NOT SURE [Go to Q33]
9. REFUSED [Go to Q33]
32A. How long has it been since you had your last mammogram?
Read only if necessary:
1. Within the past year (anytime less than 12 months ago)
2. Within the past 2 years (1 year but less than 2 years ago)
3. Within the past 3 years (2 years but less than 3 years ago)
4. Within the past 5 years (3 years but less than 5 years ago)
5. 5 or more years ago
8. DON’T KNOW/NOT SURE
9. REFUSED
33. A Pap test is a test for cancer of the cervix. Have you ever had a Pap test?
1. Yes
2. No [Go to Q34]
8. DON’T KNOW/NOT SURE [Go to Q34]
9. REFUSED [Go to Q34]
33A. How long has it been since you had your last Pap test?
Read only if necessary:
1. Within the past year (anytime less than 12 months ago)
2. Within the past 2 years (1 year but less than 2 years ago)
3. Within the past 3 years (2 years but less than 3 years ago)
4. Within the past 5 years (3 years but less than 5 years ago)
5. 5 or more years ago
8. DON’T KNOW/NOT SURE
9. REFUSED
IF (Q24 = 1) SKP Q35
34. A Prostate-Specific Antigen test, also called a PSA test, is a blood test used to check men for prostate cancer. Have you ever had a PSA test?
1. Yes
2. No [Go to Q35]
8. DON’T KNOW/NOT SURE [Go to Q35]
9. REFUSED [Go to Q35]
34A. How long has it been since you had your last PSA test?
Read only if necessary:
1. Within the past year (anytime less than 12 months ago)
2. Within the past 2 years (1 year but less than 2 years)
3. Within the past 3 years (2 years but less than 3 years)
4. Within the past 5 years (3 years but less than 5 years)
5. 5 or more years ago
8. DON’T KNOW/NOT SURE
9. REFUSED
34B. Have you ever been told by a doctor, nurse, or other health professional that you had prostate cancer?
1. Yes
2. No
8. DON’T KNOW/NOT SURE
9. REFUSED
35. Have you ever been tested for HIV, including testing fluid from your mouth? Do not count tests you may have had as part of a blood donation.
1. Yes
2. No [SKIP TO Q36]
8. DON’T KNOW/NOT SURE [SKIP TO Q36]
9. REFUSED [SKIP TO Q36]
35A. Not including blood donations, in what month and year was your last HIV test?
NOTE: If response is before January 1985, code “Don’t know.”
_ _ /_ _ _ _ Code month and year
7 7/ 7 7 7 7 Don’t know / Not sure
9 9/ 9 9 9 9 Refused
35B. Where did you have your last HIV test at a private doctor or HMO office, at a counseling and testing site, at a hospital, at a clinic, in a jail or prison, at a drug treatment facility, at home, or somewhere else?
1. Private doctor
2. Counseling and testing site
3. Hospital
4. Health Department Clinic
5. Jail or prison (or other correctional facility)
6. Drug treatment facility
7. At home
8. Somewhere else
88. DON’T KNOW/NOT SURE
99. REFUSED
36. Have you or a member of your household sought mental health care services in the last 2 years?
1. Yes
2. No
8. DON’T KNOW/NOT SURE
9. REFUSED
37. If you or an adult member of your household were/are in need of mental healthcare, which of the following would you most likely use?
1. Texas Panhandle Centers, formerly TPMHMR
2. Private provider
3. J.O. Wyatt Clinic
4. Other
8. DON’T KNOW/NOT SURE
9. REFUSED
(IF Q36 > 1 SKIP TO Q39)
38. Did you experience any of the following when you sought mental health care?
39. Are you a family caregiver of someone that is elderly (age 65 or older)?
1. Yes
8. DON’T KNOW/NOT SURE (SKP Q42)
9. REFUSED (SKP Q42)
40. Does that family member have significant memory problems that causes you concern?
1. Yes
2. No
8. DON’T KNOW/NOT SURE
9. REFUSED
41. Please identify specific needs that are not being met for you as a caregiver that you wish you could have assistance.
1. Medical support
2. Emotional support
3. Financial support
4. Other( please specify)
8. DON’T KNOW/NOT SURE
9. REFUSED
42. How often do you drive a motor vehicle, regardless of whether it is for work or for personal use? Almost every day, a few days a week, a few days a month, a few days a year, or do you never drive? 1 Almost every day (or more)
Few days a week
Few days a month
Few days a year
Never 6 Other (SPECIFY)
8. DON’T KNOW/NOT SURE 9. REFUSED
43 How often do you use seat belts when you drive or ride in a car? Would you say
99. REFUSED
(IF Q42 = 5) SKP Q45
44. I’m going to read a list of activities, and for each I’d like you to tell me how often YOU do each while driving? For each, please tell me if you do the activity [READ 1-5]? How often do you…
1 On all driving trips
2 On most driving trips
3. On some driving trips
4 Rarely
5 Never
8. DON’T KNOW/NOT SURE
9. REFUSED
44A. Talk to other passengers in the vehicle
44B. Eat or drink
44C. Make or accept phone calls
44D. Read, such as a book, newspaper, iPad or Kindle
44E. Read emails or text messages
44F. Send text messages or emails
44G. Interact with children in the back seat
44H. Do personal grooming, such as put on make-up, shave, or look at yourself in the mirror
44I. Adjust the car radio
44J. Change CDs, DVDs, or tapes
45. Does your state or city have a law banning talking on a handheld cell phone while driving? (IF ANS IS YES ASK, “Is that city, state or both?”)
1 Yes, state of Texas
2 Yes, City (Amarillo, Canyon, other)
3 Yes, both
4. No (SKIP TO 47)
8. DON’T KNOW/NOT SURE (SKIP TO 47)
9. REFUSED (SKIP TO 47)
46. Assume that over the next six months someone frequently TALKS on a handheld cell phone while driving. How likely do you think that person would be to receive a ticket for talking on a cell phone while driving?
1. Very likely
2. Somewhat likely
3. Somewhat unlikely
4. Very unlikely
8. DON’T KNOW/NOT SURE
9. REFUSED
47 Does your state or city have a law banning TEXTING OR E-MAILING while driving? (IF ANS IS YES ASK, “Is that city, state or both?”)
1 Yes, state of Texas
2. Yes, City (Amarillo, Canyon, other)
3. Yes, both
4. No (SKIP TO Q49)
98. DON’T KNOW/NOT SURE (SKIP TO Q49)
99. REFUSED (SKIP TO Q49)
48. Assume that over the next six months someone frequently sends text messages or emails while driving. How likely do you think that person would be to receive a ticket for sending text messages or emails while driving?
1. Very likely
2 Somewhat likely
3. Somewhat unlikely
4 Very unlikely
8. DON’T KNOW/NOT SURE
9. REFUSED
49. What is your age?
_ _ Code age in years
8. DON’T KNOW/NOT SURE
9. REFUSED
50. Are you Hispanic or Latino?
1. Yes
2. No
8. DON’T KNOW/NOT SURE
9. REFUSED
51. Which one or more of the following would you say is your race? (Check all that apply)
1. White
2. Black or African American
3. Asian
4. Native Hawaiian or Other Pacific Islander
5. American Indian or Alaska Native
6. Other [specify]______________
8. DON’T KNOW/NOT SURE
9. REFUSED
52. What is the last grade in school you completed?
1. Less Than High School
2. Some High School
3. High School Grad
4. Some College
5. College Grad Or More
8. DON’T KNOW/NOT SURE
9. REFUSED
53. What was your total household income last year?
1. Less than $15,000
2. $15,001-25,000
3. $25,001-50,000
4. $50,001-$75,000
5. $75,001-$100,000
6. Over $100,000
8. DON’T KNOW/NOT SURE
9. REFUSED
INTERVIEWER READ: Thank you very much for your time and cooperation. We believe this project will help city health officials provide better services to all citizens.