

New
Castle County
Community Health Needs Assessment
May 19, 2025

EXECUTIVE SUMMARY
Introduction
This Community Health Needs Assessment (CHNA) was conducted by ChristianaCare Health System (CCHS) to identify significant community health needs and to inform development of an Implementation Strategy to address current needs. ChristianaCare Health System includes two hospital facilities in Delaware: Christiana Hospital in Newark and Wilmington Hospital in Wilmington. Because the two hospitals defined their communities to be the same (New Castle County, Delaware), they are sharing this joint CHNA report.
Christiana Hospital is a 1039-bed teaching hospital that operates Delaware’s only Level I trauma center (certified by the American College of Surgeons) and is the only high-risk delivering hospital in the state (with Level III neonatal intensive care services). The hospital’s campus in Newark is home to two Medical Arts Pavilions offering a wide array of outpatient services.
Wilmington Hospital is a 321-bed hospital facility. A Wilmington landmark since 1890, Wilmington Hospital serves as ChristianaCare’s corporate headquarters and provides high quality hospital services for residents of Wilmington and New Castle County. Wilmington Hospital includes an Emergency Department (Level III trauma center) and helipad with aero-medical transport capabilities and the unique Center for Special Health Care Needs, a primary care practice dedicated to caring for adults with complex medical and social conditions that originated in childhood.
Throughout this report, ChristianaCare Health System or “CCHS” refers to Christiana Hospital and Wilmington Hospital together.
ChristianaCare has a third campus located in Elkton, Maryland. Union Hospital conducted a CHNA that assessed community health needs in Cecil County, Maryland. Additional information on Christiana Care Health System and its three hospital facilities can be found at: https://christianacare.org/about/.
This CHNA has been conducted using widely accepted methodologies to identify the significant health needs of a specific community. The assessment also has been conducted to comply with federal and state laws and regulations.
Community Assessed
For purposes of this CHNA, the community is defined as New Castle County, Delaware. During the year ended June 30, 2023, New Castle County accounted for seventy-four (74) percent of Christiana Hospital’s discharges. Ninety (90) percent of Wilmington Hospital’s discharges were New Castle County residents
The total population of New Castle County in 2023 was 568,543 people.
Substantial variation in socioeconomic conditions exists across New Castle County. For example, the poverty rate in ZIP Code 19801 (where Wilmington Hospital is located) was approximately 30 percent, while the rate in ZIP Code 19701 was 8 percent.1 Recognizing these variations, this CHNA assessed community health needs in two geographic subareas of New Castle County: “Community 1” (ZIP Codes 19801, 19802, 19804, 19805, and 19720) and “Community 2” (all other New Castle County ZIP Codes). Community 1 accounted for thirty-one (31) percent of ChristianaCare discharges in 2023 and Community 2 accounted for forty-seven (47) percent.
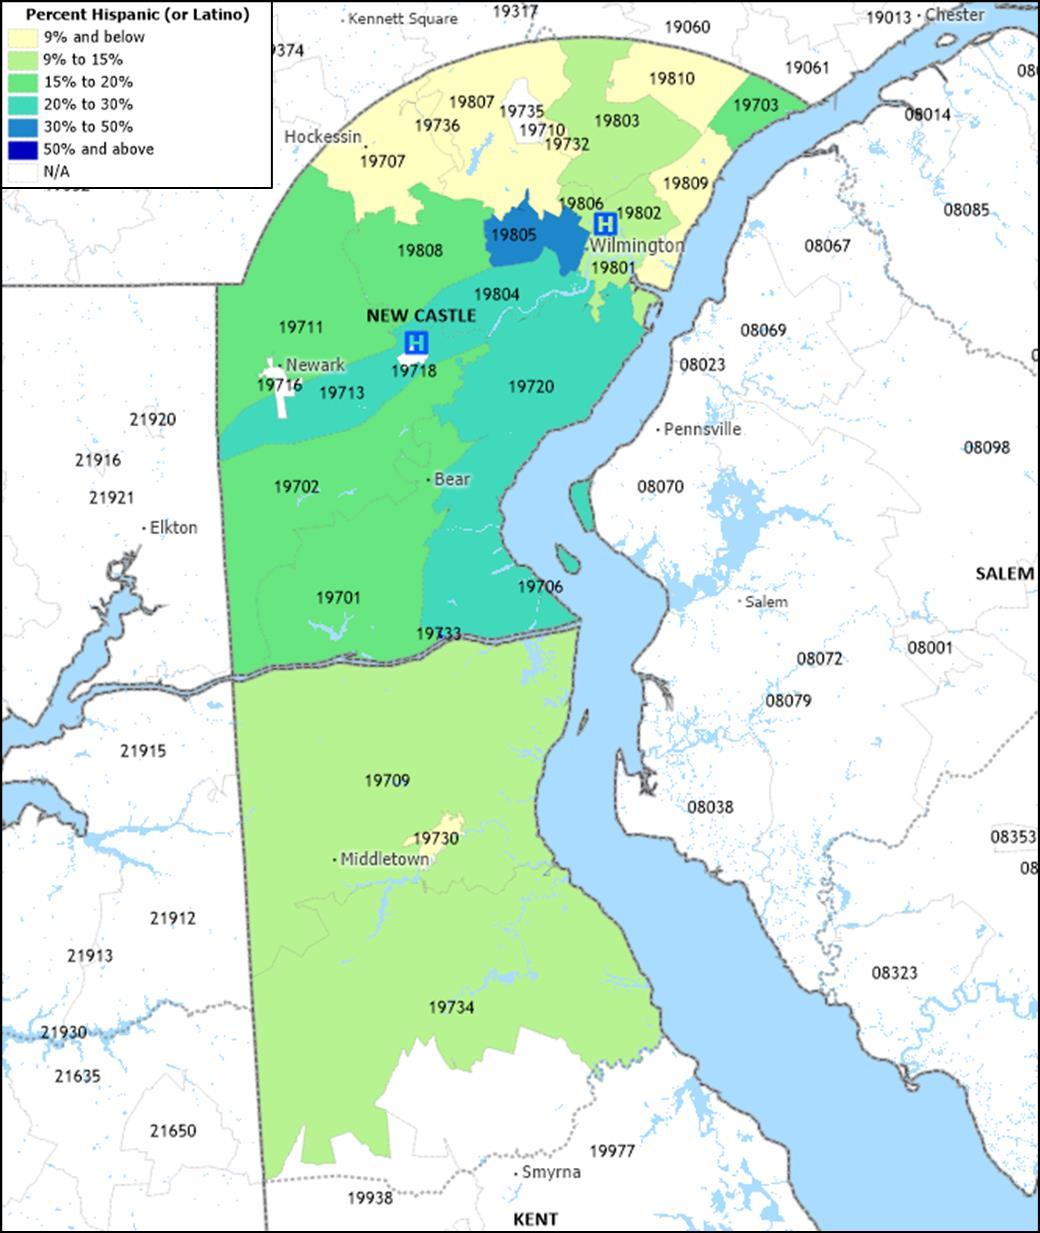
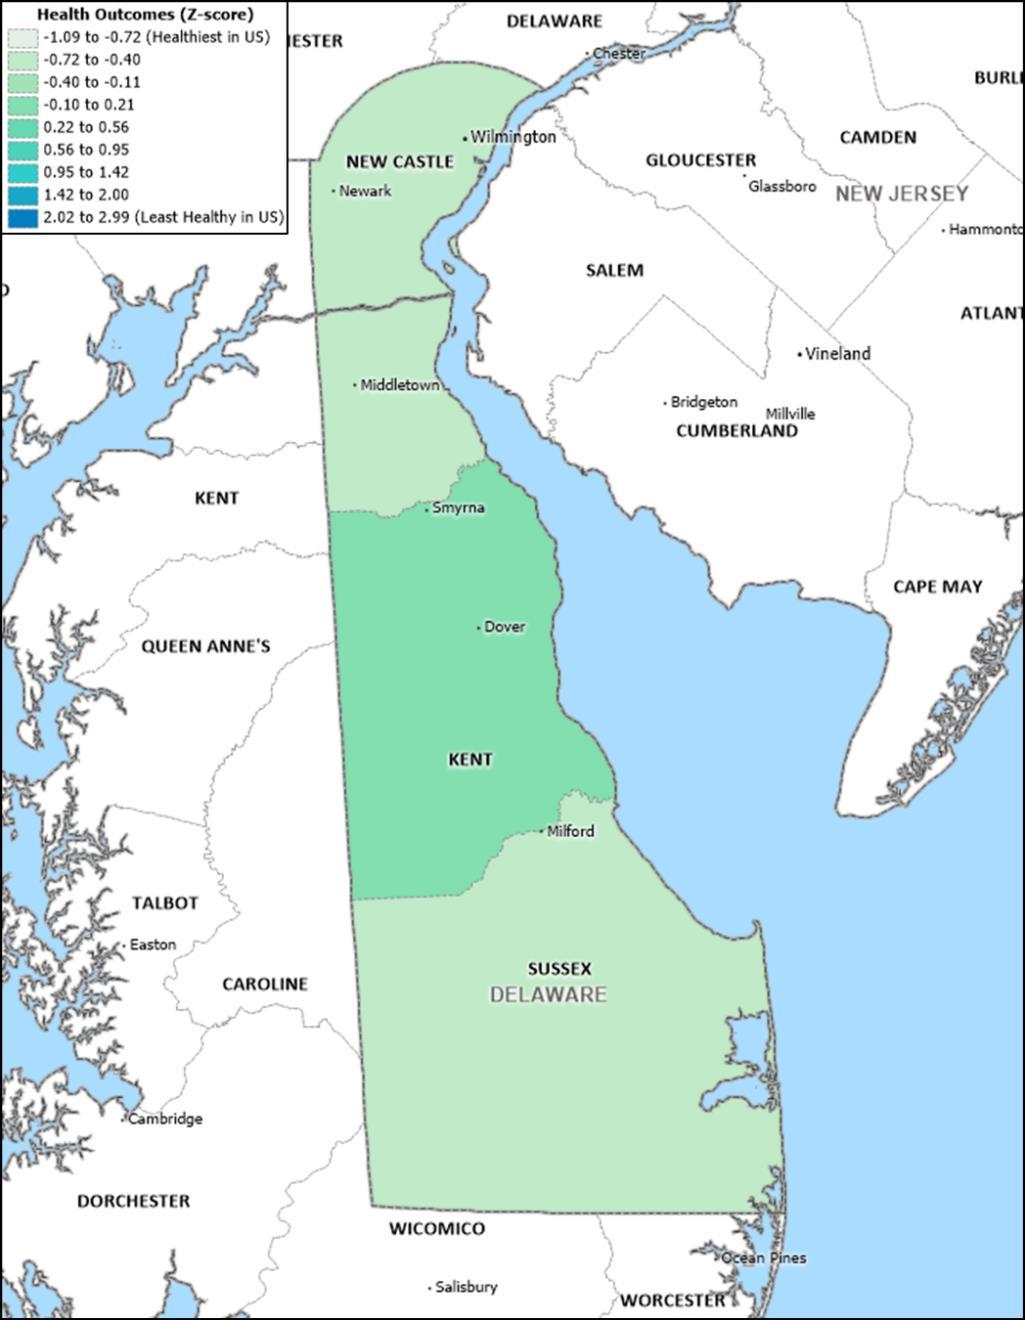
The following map portrays the community assessed by CCHS and the location of the two hospitals, Christiana Hospital (ZIP Code 19718) and Wilmington Hospital (ZIP Code 19801).
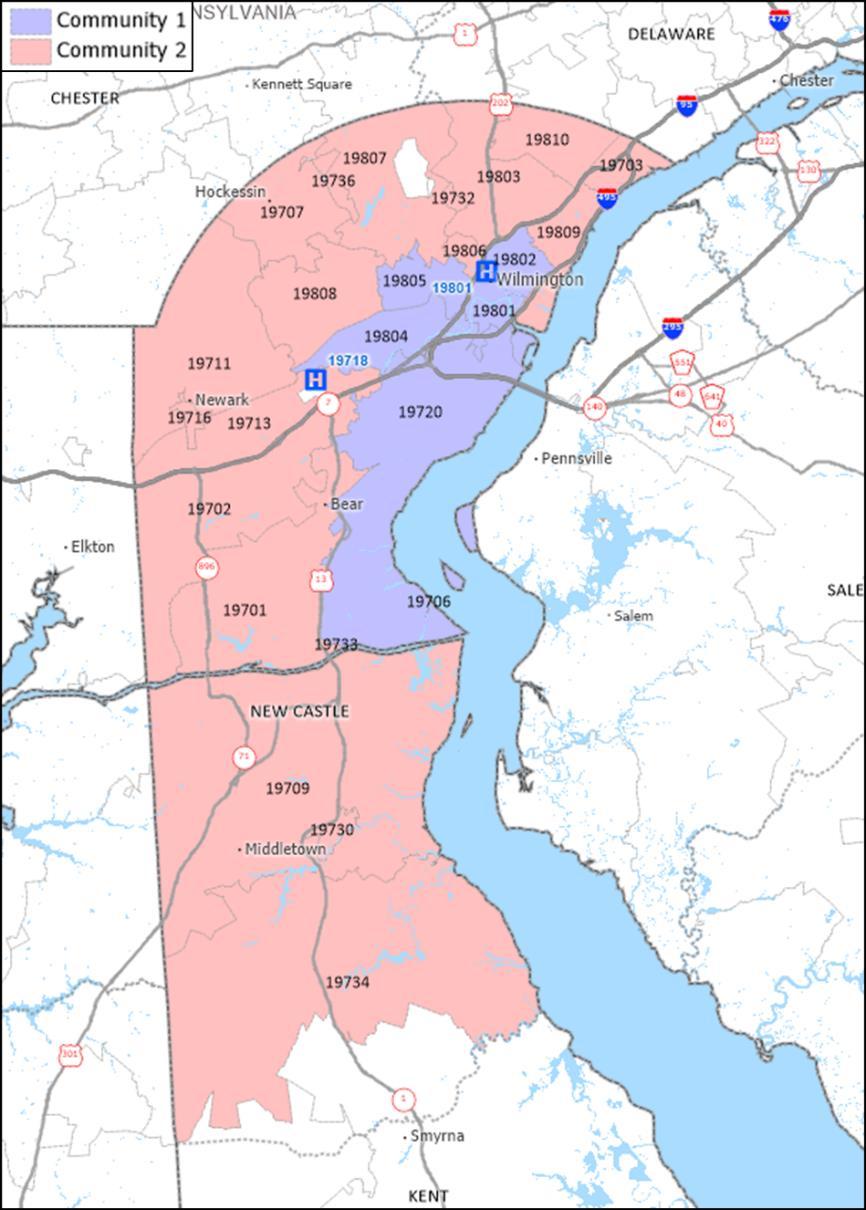
Source: Caliper Maptitude, 2024.
1 United States Census Bureau
Map of New Castle County, ChristianaCare Health System Community
Significant Community Health Needs
As determined by analyses of quantitative and qualitative data, and prioritization by partners and stakeholders representing the broad interests of the community and including individuals with special knowledge of or expertise in public health, the significant health needs in the community served by ChristianaCare Health System in Delaware are:
• Access to Health and Preventive Services
• Chronic Health Conditions
• Health Literacy
• Maternal and Child Health
• Mental Health and Substance Use Disorders
• Social Determinants of Health
• Violent Crime
Significant Community Health Needs: Discussion
Access to Health and Preventive Services
Accessing health and preventive services is challenging for some members of the community, particularly residents who are uninsured or underinsured, have limited financial resources, have limited English proficiency, are living with a disability, and who are members of racial, ethnic, and other minority groups
Secondary data indicate access to health and preventive services as a significant community health need, including the following:
• A greater percentage of Community 1 residents (6.8 percent) were uninsured compared to Community 2 (4.8 percent), New Castle County (5.3 percent), and Delaware (6.0 percent).
• Preventable hospitalizations for Medicare enrollees ranked in the bottom quartile of peer counties.
• The per capita supply of dentists was lower in New Castle County (1,723:1) and Delaware (2,181:1) compared to the overall supply in the U.S. (1,360:1).
• An anticipated growth of 25.4 percent in the population aged 65 years and older between 2024-2034 will likely lead to an increased demand for health services.
• Utilization of preventive services such as cancer screening, cholesterol screening, mammogram, core preventive services in men and women, and compliance with blood pressure medication was lower than U.S. averages in many ZIP Codes.
• “Fair or poor self-rated health status” and “physical health not good for 14 days or more” compared unfavorably in Community 1 compared to New Castle County and U.S. averages.
• Federal designation of the county as a primary care, dental health, and mental health Health Professional Shortage Area (HPSA) for low-income populations of Wilmington, Stanton, and Newark.
• Federal designation of census tracts in Wilmington and Claymont as Medically Underserved Areas (MUAs).
• The most recent Delaware Health Improvement Plan (2023) has prioritized increasing access to health and preventive services.
Community input confirmed access to health and preventive services as a significant need. The primary care shortage is a critical issue, and some specialty care is limited including OB/GYN, neurology, and psychiatry. Healthcare workforce shortages are cited as a significant and growing concern. Other access barriers include cost of care (despite insurance), insurance restrictions and limitations, coordination of care, language barriers, and navigation challenges. Residents are challenged to find providers (doctors and dentists) who accept insurance plans, especially Medicaid, leading to long wait-times and worsening health problems. There is a need for improved cultural sensitivity, language and translation services, especially more educational programs and materials offered in Spanish.
Chronic Health Conditions
Chronic conditions and associated lifestyle factors were identified as significant community health concerns. Chronic conditions, such as heart disease and cancer, are the leading causes of death and disability in the United States and a leading driver of healthcare cost.2
Secondary data indicate chronic conditions are a significant need in New Castle County, including the following:
• Approximately 35.0 percent of New Castle County adults report a body mass index (BMI) greater than 30.0 (obesity), above the state and national average.
• New Castle County’s healthy food environment index ranked in the bottom half of peer counties compared nationally.
• Heart failure, heart disease, cerebrovascular disease, and cancer mortality rates compared unfavorably in the county and state compared to national averages.
• Diabetes, asthma, high blood pressure, and obesity health outcomes measures compared unfavorably in New Castle County to U.S. averages.
• Health risk behaviors indicators for physical activity and adequate sleep compared unfavorably to national averages in many ZIP Codes and were more than 50 percent worse in Community 1 ZIP Codes 19801 and 19802 (Wilmington).
• Health behavior indicators for physical activity, non-school related screen time, obesity, and adequate sleep compared unfavorably for Delaware high school students compared to national averages.
Prevalence of chronic health conditions, such as obesity, diabetes, heart disease, hypertension, and cancers were indicated as significant health concerns by community input participants. Behavioral factors such as sedentary lifestyle and poor nutrition were referenced as contributing factors. Interventions are complicated by limited access to affordable nutritious food, mental health issues, high demand of work and family responsibilities, aging and limited mobility, and generational cycles.
2 https://www.cdc.gov/chronic-disease/about/index.html
Health Literacy
Limited health literacy was identified as a significant community health concern worsening health outcomes and disproportionately impacting residents with lower incomes, lower educational attainment, limited English proficiency, and older adults and racial and ethnic minority populations. In the United States, health literacy is a stronger predictor of a person’s health status than income, employment status, education level, and racial or ethnic population.3
Secondary data indicate health literacy as a significant need in New Castle County, including the following:
• A greater percentage of Community 1 residents (11.6 percent) had less than a high school diploma compared to Community 2 (5.6 percent) and New Castle County (7.5 percent).
• New Castle County ranked in the bottom half of peer counties for percent of adults with a high school diploma or equivalent and in the bottom quartile of peer counites for percent of adults with some college.
• A greater percentage of Community 1 residents (6.0 percent) had limited English proficiency compared to Community 2 (4.9 percent) and New Castle County (5.2 percent).
• Delaware Health and Social Services - Division of Public Health has prioritized improving health literacy in hospital systems, FQHCs, anchor CBOs, health insurance providers, educational pipelines, and consumers statewide.
Community input participants confirmed health literacy as a significant community health need. Participants describe limited health literacy as impacting one’s ability to navigate the healthcare system, choose an appropriate doctor, obtain specialty care, understand and adhere to medical advice and prescription regimens, and make decisions about health behaviors such as nutritional intake.
Maternal and Child Health
Maternal and child health were identified as significant community health concerns and as disproportionately impacting racial and ethnic minority populations and residents with limited financial resources.
Secondary data indicate maternal and child health as significant needs in New Castle County, including the following:
• The proportion of children living in poverty in Community 1 (26.5 percent) was almost three times the proportion in Community 2 (9.2 percent) and almost double the New Castle County proportion (14.5 percent).
• New Castle County ranked in the bottom quartile of peer counties for percent of live births with low birthweight.
• Low birthweight births for non-Hispanic Black residents were significantly higher in New Castle County and Delaware compared to rates for White residents.
3 World Health Organization www.who.int
• Rates for non-Hispanic Black and Hispanic (or Latino) teen mothers giving birth were four times that of non-Hispanic White teen mothers in New Castle County.
• Infant mortality rates for non-Hispanic Black and Hispanic (or Latino) populations have been significantly higher than rates for non-Hispanic White populations in New Castle County and Delaware.
• The most recent Delaware State Health Improvement Plan identified maternal and child health as a priority including prioritizing improvements in teen pregnancy, premature births, low birthweight infants, and preventive services.
Community members providing input into this CHNA identified problems with access to care for women’s health and a critical shortage of OB/GYN providers. Participants cited maternal mortality, low birthweight births, and infant mortality rates as significant, especially amongst Black and Hispanic populations. Participants described a need for substance use treatment for women during pregnancy and post-partum and a need for doulas.
Mental Health and Substance Use Disorders
Mental health status is poor for many community members and the supply of mental health providers and services is insufficient to meet the demand. Substance use is prevalent amongst all ages and demographics and mental health and substance use are often interrelated.
. Secondary data indicate mental health and substance use disorders as significant needs in New Castle County, including the following:
• The percentage of adults reporting “mental health not good for 14 or more days” was above U.S. averages in many ZIP Codes in New Castle County and Community 1 compared unfavorably to the county and national averages.
• Depression rates were higher in several ZIP Codes in Newark and Wilmington compared to U.S. averages.
• New Castle County (51.4 per 100,000) and Delaware (48.9 per 100,000) had significantly higher average rates of poisoning mortality (including drug overdose) compared to U.S. rates (28.5 per 100,000).
• Suicide rates were significantly higher in male populations (19.5 per 100,000) in New Castle County and Delaware (20.8 per 100,000) compared to female populations (5.0 in New Castle County and 4.6 in Delaware) and overall suicide rates (12.0 in New Castle County and 12.4 in Delaware).
• At 21.8 deaths per 100,000 population, the county’s suicide mortality rate was significantly higher than the U.S. average (13.8 per 100,000).
• Binge drinking was higher in many New Castle County ZIP Codes and in Community 2 compared to county and national averages.
• Low-income populations of Wilmington, Stanton, and Newark have been federally designated as a Health Professional Shortage Area (HPSA) for mental health.
• The Delaware Health Improvement Plan has prioritized mental health, access to mental and behavioral health services, and substance use disorders.
Community input identified mental health status, access to mental and behavioral health services, and substance use as pressing community health needs. Participants describe
mental health concerns as widespread and as particularly concerning amongst children and adolescents. The high prevalence of depression, anxiety, social isolation, and history of trauma are noted as significant concerns. Substance use, suicide, and mental health are often intertwined, complicating treatment and recovery. Male suicide rates are especially concerning, and participants stress the need to focus on underlying drivers of substance use and mental health conditions, including adverse childhood experiences and trauma. Gaps exist in treatment options for substance use disorders, specifically related to medication assisted treatment programs, recovery support (such as housing and certified peer workers), and continuity of care.
Social Determinants of Health
Social Determinants of Health (SDOH) are conditions in the environment where people are born, live, learn, work, play, worship, and age that affect a wide range of health, functioning, and quality-of-life outcomes and risks.4 Social determinants of health play an important role in health equity.
Secondary data indicate SDOH as a significant health need in New Castle County, including the following:
• Federally designated low-income census tracts and low-income and low access to healthy food census tracts were concentrated in Claymont, Bear, Newark, Wilmington, and throughout Community 1.
• Delaware residents who identified as LGBT were more likely to be unemployed, uninsured, food insecure, and have low-income compared to those who identified as non-LGBT (straight).
• There was a high prevalence of food insecurity amongst children (18.1 percent), Black residents (17.0 percent), and Hispanic residents (19.0 percent) compared to U.S. overall food insecurity rates (13.5 percent).
• The percentage of households in Community 1 designated as “rent burdened” (spending more than 30 percent of income on housing) was higher than county and state averages.
• The Area Deprivation Index ranked neighborhoods in Community 1, Claymont, Bear, Newark, and Delaware City as having high levels of socioeconomic disadvantage.
• The CDC’s Social Vulnerability Index indicated census tracts with the highest socioeconomic vulnerability were present in Bear, Claymont, Wilmington, Newark, and throughout Community 1.
Community input participants identified SDOH as significant needs adversely impacting health, including poverty, food insecurity, safe and affordable housing, access to transportation, education, and income inequality. Lack of safe and affordable housing is a critical issue with strict qualification criteria and high costs preventing some residents from establishing stable housing. Reliable, affordable forms of transportation are limited, and accessing bus stops and riding the bus can be difficult, especially for older adults and those living with disabilities. Food insecurity is prevalent and access to healthy food is challenging for many residents due to cost.
4 https://health.gov/healthypeople/priority-areas/social-determinants-health
Violent Crime
There are serious short- and long-term health effects from exposure to crime and violence in a person’s community. In adulthood, exposure to violence can lead to poor health outcomes and the connection between adverse childhood experiences (ACEs) and chronic disease and mental health is well established.5
Secondary data indicate violent crime is a significant need in New Castle County, including the following:
• Injury deaths (per 100,000) were higher in New Castle County (96.0) and Delaware (93.5) compared to U.S. averages (80.0).
• Mortality due to assault in New Castle County was above the state rate and was more than 50 percent above the national rate.
Community input confirmed violent crime as a significant community health need especially related to domestic violence, neighborhood violence, and gang related activity. Participants noted that support services for victims and prevention education are needed. Violence in schools, particularly gang related violence, is noted as significant with gang involvement on the rise and starting at earlier ages. Social media and cyber bullying play a role, and participants note that cultural norms foster violence. Many neighborhoods are impacted, with some residents fearful of going outside leading to decreased physical activity and increased mental health issues.
5 https://odphp.health.gov/healthypeople/priority-areas/social-determinants-health/literaturesummaries/crime-and-violence
DATA AND ANALYSIS
Community Definition
This section identifies the community that was assessed by CCHS’s Delaware hospital facilities. The community was defined by considering the geographic origins of the inpatient discharges during the year ended June 30, 2023.
On that basis, the community was defined as New Castle County. The county accounted for 77.3 percent of the CCHS Delaware hospitals’ 2023 inpatient volumes (Exhibit 1).
Exhibit 1: ChristianaCare Health System Inpatient Discharges, 2023
Source: Analysis of ChristianaCare Health System’s Utilization Data, 2023.
The total population of New Castle County in 2023 was approximately 569,000 people, with Community 1 comprising 142,635 residents and Community 2 comprising 425,908 residents (Exhibit 2).
Exhibit
2: Community Population by ZIP Code
Source: U.S. Census Bureau, American Community Survey 5-Year Estimates,
Exhibit 3 presents a map of New Castle County, with ZIP Code boundaries, Communities 1 and 2, and the two hospital campuses identified. Christiana Hospital is in Newark (ZIP Code 19718) and Wilmington Hospital is in Wilmington (ZIP Code 19801).
Exhibit 3: ChristianaCare Health System’s Community

Source: Caliper Maptitude, 2024.
Secondary Data Summary
The following section summarizes principal observations from the secondary data analysis. See Appendix B for more detailed information.
Demographics
Demographic characteristics and trends directly influence community health needs.
The total population of New Castle County in 2023 was approximately 569,000 people. New Castle County’s population is expected to increase 3.4 percent between 2024 and
2034, representing an increase of more than 19,900 people. Among four age cohorts (017, 18-24, 25-64, and 65 and older), the aged 65 and older cohort is anticipated to have the fastest growth rate, 25.4 percent between 2024-2034. This change will likely contribute to greater demand for health services as older adults tend to utilize more services than younger people. Two age cohorts (0-19 and 20-29) have an anticipated decline in population between 2024 and 2034.
Demographic characteristics, such as age, race, ethnicity, education, and income levels, vary across the county.
Over 50 percent of residents in ZIP Codes 19731 (Port Penn) and 19732 (Rockland) were age 65 or older in 2022 while this proportion was under 1.0 percent in ZIP Codes 19717 (Newark) and 19736 (Yorklyn).
Over 40 percent of residents in Community 1 identified as Black or African American and in two Community 1 ZIP Codes (19801 and 19802, both in Wilmington), 70 percent of the population identified as Black or African American. Approximately 25 percent of the population of New Castle County identified as Black or African American and in Community 2 this statistic is 18 percent.
Wilmington ZIP Codes 19733 (Saint Georges) and 19805 (Wilmington) had the highest percentage of population identified as Hispanic (60 1 and 24.6 percent). Approximately 16 percent of the overall population in Community 1 identified as Hispanic; in Community 2, this statistic is about 9 percent.
In 2018-2022, the percentage of residents aged 25 and older without a high school diploma in New Castle County and Delaware was below the national average. New Castle County also had a lower percentage of population living with a disability than both Delaware and the United States. Proportions of residents linguistically isolated were lower in New Castle County compared to the United States average.
Socioeconomic Indicators
Across the lifespan, people who live in impoverished communities have an increased risk for chronic diseases and illness, higher mortality, and lower life expectancy.6
In 2018-2022, 10.5 percent of New Castle County residents lived in poverty, lower than Delaware and U.S. averages (11.1 percent and 12.5 percent); however, poverty rates for Hispanic (or Latino) and Black residents have been well above rates for White residents (15.6 and 15.9, compared to 7.3 percent), in New Castle County. The poverty rate in Community 1 has been more than double the rate for Community 2 (16.5 percent compared to 8.1 percent).
Census tracts identified as low-income and as having an unfavorable Social Vulnerability Index were present in Bear, Claymont, Newark, Wilmington, and throughout Community 1. 6 www.odphp.health.gov/healthypeople.
In 2018-2022, the percentage of children in poverty for Community 1 (26.5 percent) was almost three times the rate for Community 2 (9.2 percent) and significantly higher than the county-wide rate of 14.5 percent.
Disparities in socioeconomic indicators exist for lesbian, gay, bisexual, and transgender (LGBT) communities compared to non-LGBT communities in Delaware and the U.S. In 2019, Delaware and U.S. residents who identified as LGBT were more likely to be unemployed, uninsured, food insecure, and have low-income than those who identified as non-LGBT.
Census tracts federally designated as low-income and low access to healthy and affordable food were present throughout Wilmington and Newark. In 2021, the overall food insecurity rates in New Castle County and Delaware were lower than the national average for all people; however, food insecurity rates for Black and Hispanic (or Latino) residents and for children were comparatively higher.
From 2019-2023, unemployment rates for New Castle County and Delaware have been higher than national rates.
In 2018-2022, the county had a lower percentage (5.3 percent) of the population without health insurance than Delaware (6.0 percent) and the United States (8.7 percent). The share of the population without health insurance in Community 1 was higher (6.8 percent) than Community 2 (4.8 percent), New Castle County (5.3 percent), and the state average (6.0 percent).
In 2022, crime rates in New Castle County were lower than statewide and U.S. rates for all crime types. Crime rates for violent crime, assault, property crime, and larceny theft were higher in Delaware compared to national averages.
The percentage of households designated as rent burdened in New Castle County has been below state and national averages. Over half of Community 1 households were designated as rent burdened and several ZIP Codes including areas of Delaware City, Hockessin, Newark, Odessa, Townsend, and Wilmington had over 50 percent of households rent burdened.
The Area Deprivation Index, published by the University of Wisconsin, School of Medicine and Public Health, identified neighborhoods in Claymont, Newark, Delaware City, Bear, Wilmington, and New Castle as having high levels of socioeconomic disadvantage. This index ranks neighborhoods by level of socioeconomic disadvantage and includes factors for income, education, employment, and housing quality.
In 2018-2022, Wilmington ZIP Codes 19801 and 19805 (both in Community 1) had the highest levels of risk for negative outcomes due to heat in New Castle County. ZIP Code 19801 ranked the highest in Delaware (94th percentile nationally) for risk for high heat vulnerability. ZIP Codes in New Castle, Bear, Newark, and Claymont were also ranked as having comparatively high heat vulnerability.
Other Local Health Status and Access Indicators
Delaware is home to three counties. In the 2024 County Health Rankings, New Castle County was assessed as faring slightly better than the average county in Delaware for Health Outcomes, and Health Factors, and better than the average county in the nation for both. New Castle County compared unfavorably to the United States for 13 of the 33 County Health Rankings indicators.
Community Health Status Indicators (CHSI) compares indicators for each county with those for peer counties across the United States. Each county is compared to 30 to 35 of its peers, which are selected based on socioeconomic characteristics such as population size, population density, percent elderly, per-capita income, and poverty rates.
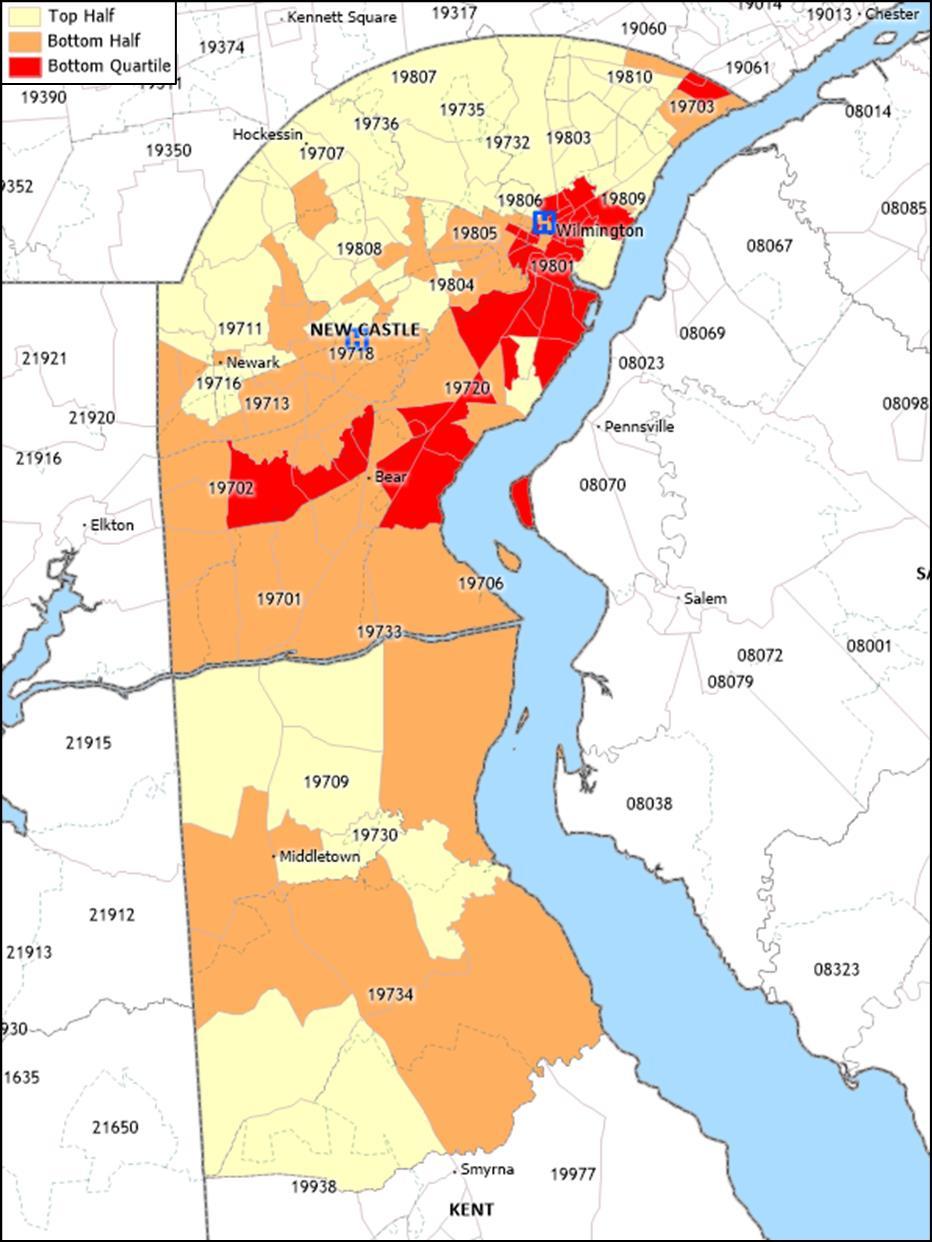
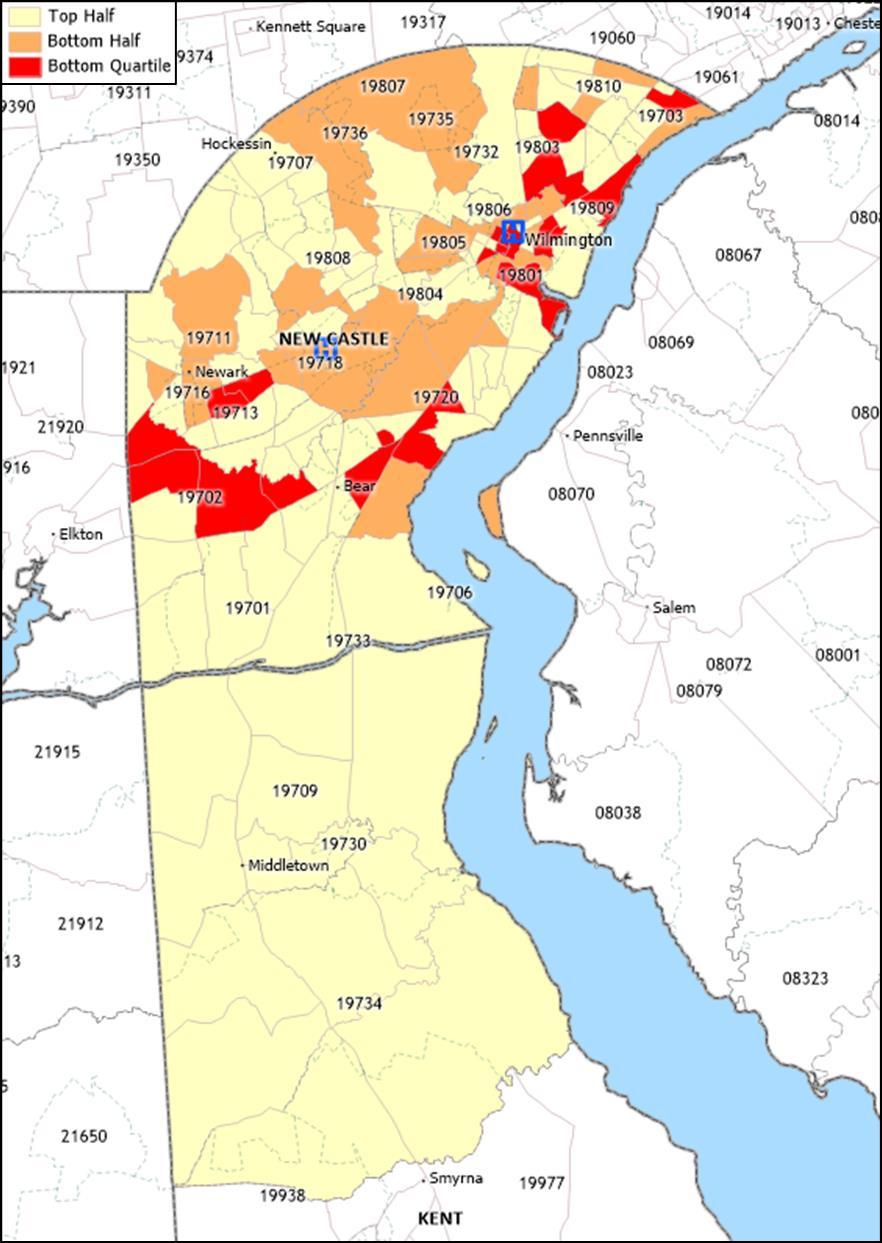
In CHSI, New Castle County ranked in the bottom quartile of peer counties for numerous indicators, including:
• Percent of live births with low birthweight
• Percent of adults with adequate access to locations for physical activity
• Sexually transmitted infections
• Preventable hospital stays
• Percent of adults with some post-secondary education
• Percent of population age 16+ unemployed but seeking work
• Percent of children under age 18 in poverty
• Income equality ratio
• Percent of children that live in single parent household
• Injury mortality per 100,000 population
• Air pollution (fine particulate matter in mcg/cubic meter or PM2.5)
Other secondary data from Delaware Health and Social Services (DHSS), the CDC, Health Resources and Services Administration, and the United States Department of Agriculture, have been assessed. Based on an assessment of the available secondary data, the indicators presented in Exhibit 4 appear to be the most significant in New Castle County.
An indicator is considered significant if it was found to vary materially from a benchmark statistic, such the average value for Delaware, for peer counties, or for the United States. For example, in 2018-2022, there were 51.4 deaths due to poisoning (including drug overdose, per 100,000 population) in New Castle County; there were 28.5 poisoning deaths (including drug overdose, per 100,000 population) in the U.S.
Exhibit 4: Significant Indicators (continued)
Source: Verité Analysis.
When available New Castle County community health data are arrayed by race and ethnicity, significant differences are observed for:
• Poverty rates
• Food insecurity rates
• Poisoning mortality
• Prevalence of low birthweight births
• Teen birth rates
• Infant mortality rates
These differences indicate the presence of racial and ethnic health inequities and disparities.
Medically Underserved Areas and Populations
Medically Underserved Areas and Populations (MUA/Ps) are designated by the Health Resources and Services Administration based on an “Index of Medical Underservice.” In 2025, census tracts designated as medically underserved were present in Community 1 in areas proximate to Wilmington Hospital, and in the northern area of Community 2 (Claymont ZIP Code 19703 and Wilmington ZIP Code 19809).
Health Professional Shortage Areas
A geographic area can receive a federal Health Professional Shortage Area (HPSA) designation if a shortage of primary medical care, dental care, or mental health care professionals is present. Certain types of health facilities also are HPSAs.
• The low-income population of Wilmington/Stanton/Newark have been designated as primary care, dental health, and mental health HPSAs
• Westside Family Healthcare and Henrietta Johnson Medical Center were HPSA designated Federally Qualified Health Centers (FQHC) for primary care, mental health, and dental health.
Findings of Other CHNAs
The 2022-2023 Delaware State Health Assessment (SHA) appraised community needs through a multi-pronged approach by using interviewer-administered surveys, hosting community conversations, and forming a statewide partnership coalition. The SHA identified and prioritized local and statewide strategies that address critical health needs. This data was gathered with four nationally recognized Mobilizing for Action through Planning and Partnerships assessments: forces of change, local public health assessment, community themes and strengths, and community health status. As of October 2023, the Delaware SHIP priorities are:
• Chronic Diseases including heart disease, cancer, and diabetes with recommendations related to system-wide policy change that address the social determinants of health.
• Health in all Policies with recommendations related to incorporating health considerations into decision making across all sectors and policy areas.
• Maternal and Child Health with recommendations prioritizing improvements in teen pregnancy, premature births, and low birth weight infants, education, and increasing access to preventive services.
• Mental Health with recommendations prioritizing improving access to behavioral and mental health services.
• Social Determinants of Health with recommendations to utilize a policy, system, environmental (PSE) approach to address social determinants.
• Social Marketing with recommendations to utilize social marketing as a component of a comprehensive approach to prevent disease, improve health, and gain public support.
• Substance Use Disorder with recommendations to reduce tobacco, tobaccosubstitute, and other substance use.
In 2023, the Delaware Division of Public Health (DPH), under the charge of the Delaware Department of Health and Social Services, and in partnership with ChristianaCare and the University of Delaware Health Sciences, published the Delaware Health Literacy Report to address health literacy deficiencies statewide. Ensuring that patients and loved ones understand health information is vital to positive medical outcomes. Following a study of the health literacy landscape within Delaware, many of the stakeholders coalesced to create the Health Literacy Council of Delaware (HLC) which consolidated proposals and suggestions from the study into the three goals: (1) Operationalize, bolster, and institutionalize the Health Literacy Council of Delaware, (2) Increase urgency and awareness around health literacy across Delaware, and (3) Develop universal and standardized educational strategies that reach individuals, families, providers, and systems of care. Initial emphasis will be placed on hospital systems, FQHCs, anchor CBOs, health insurance providers, educational pipelines, and consumers.
For the federal Title V program, Delaware identifies five-year maternal and child health priorities. The Maternal and Child Health 2020-2025 plan includes priorities for women and maternal health, perinatal and infant health, child and adolescent health, children with special healthcare needs, and cross cutting and systems building.
Community Input Summary
Input was obtained through community partner and hospital staff meetings, focus groups, and key informant interviews conducted between September 2024 and January 2025. A total of 196 individuals provided input, representing over 23 organizations, and included individuals representing the broad interests of the community and those with special knowledge of or expertise in public health. Individuals included representatives from Delaware Health and Social Services (DHSS), hospital staff and providers, representatives of social service and non-profit organizations, and representatives of medically underserved, low-income, and minority populations. Community meetings and focus groups were conducted in-person September 30 to October 2, 2024. Interviews and a hospital staff input meeting were conducted via online video conferences between November 2024 and January 2025.
See Appendix C for a list of community input participant organizations and affiliations.
Community Partner and Hospital Staff Meetings
A community partner meeting and a hospital staff (caregiver) meeting were conducted to obtain input relevant to community health needs in New Castle County.
On September 30, 2024, thirteen (13) individuals, representing 10 organizations, participated in the community partner meeting. These individuals represented non-profit organizations, social service organizations, local businesses, and health clinics. On November 5, 2024, seventy-three (73) caregivers/staff from ChristianaCare’s Center for Community Health & Empowerment participated in the hospital staff meeting. Participants represented a variety of roles and disciplines including administration, community health workers (CHW), navigators, care coordinators, and program coordinators.
Each meeting began with a presentation that discussed the CHNA process and purpose, an overview of secondary data, and a preliminary summary of unfavorable community health indicators. Meeting participants were then asked to choose the “top five” community health concerns, identify access to care issues, and identify geographic areas and/or populations with the greatest unmet needs via an individual online survey. After completion of the individual online survey, meeting participants engaged in a facilitated group discussion of the most significant health needs, barriers to accessing care, underlying issues impacting health and wellbeing, and strengths and resources available in the community.
The table below presents the number and percentage of prioritization votes, from participants who attended community partner and hospital staff meetings, in the selection of “top five” most significant health issues impacting the New Castle County community.
Focus Groups
One hundred and five (105) community members participated in eight (8) focus groups to obtain input relevant to the health needs of certain populations, neighborhoods, and communities within New Castle County. Focus group participants represented Spanish speaking communities,7 formerly unhoused residents, residents of transitional housing, children and adolescents, people living with disabilities, and the LGBTQ community.
Focus groups began with a review of the purpose and goals for the session. Participants were then given a brief description of the meeting format, expectations, and ground rules, including confidentiality. It was explained that for purposes of the CHNA, the “community” is defined as New Castle County; however, for purposes of the focus group discussions, “community” may be defined as a group or population with similar backgrounds, language, or identities.
Questions focused on overall health status, most significant health needs, social factors affecting health, and what is needed from the hospitals and health department to better support residents.
Focus group participants most frequently identified the following as current significant health concerns in the community:
• Access to health and preventive services related to a limited supply of providers, cost of care, insurance barriers and restrictions, and issues with identification and records such as birth certificates.
• Poor mental health status and access to mental and behavioral health providers, including prevalence of depression, anxiety, trauma, suicide, and social isolation.
7 Focus groups were conducted in Spanish and notes were translated to English.
• High prevalence of limited health literacy impacts resident’s ability to navigate the complex healthcare system, understand and adhere to medical advice and prescription regimens, and to make decisions about health behaviors such as nutritional intake.
• Chronic health conditions such as obesity, diabetes, heart disease, hypertension, and cancers.
• Violence and injury, particularly domestic violence, neighborhood safety, and gang related activity amongst youth.
• Social determinants of health such as housing, poverty, educational and employment opportunities, transportation, and food insecurity.
• Substance use disorders including a need for focus on prevention, treatment options for special populations including pregnant women and older adults, and for recovery supports and continuity of care.
Key Informant Interviews
Three interviews were conducted with five representatives from Delaware Health and Social Services - Division of Medicaid & Medical Assistance, Office of the Secretary (Special Populations, Strategic Planning, and Innovation), and Division of Substance Abuse and Mental Health to obtain insight into significant community health issues.
Questions focused on identifying and discussing significant health issues in the community and significant barriers to accessing health resources. Interviewees were asked to discuss the main reasons the health concerns are present, which geographic areas and populations are most impacted, and what strengths and resources exist to address the identified needs.
Interview participants most frequently identified the following as current significant health concerns in the community and Delaware:
• Access to care issues particularly related to an undersupply of primary care providers and certain types of specialty care (OB/GYN, neurology and psychiatry), post-acute care, rehabilitation, long-term care, workforce shortages, and insurance barriers and restrictions.
• Health equity concerns including a need for improved cultural and language sensitivity amongst providers and discrimination and disparities in care provided to racial and ethnic minority populations, LGBTQ population, disability population, and other marginalized groups.
• Limited health literacy specifically related to understanding the importance of and how to care for one’s health, how to choose a good doctor, and medication and care plan adherence.
• Maternal, infant, and child health especially maternal and infant mortality amongst Black and Hispanic populations.
• Mental health concerns including poor mental health status, the interrelationship with substance use, suicide rates, and access to mental health care.
• Nutrition, physical activity, and chronic conditions specifically prevalence and cultural norms around poor nutritional intake, unhealthy lifestyle, and obesity.
• Social determinants of health include shortages of affordable housing, food access, rising unhoused population, poverty, and lack of livable wage employment.
• Substance use especially related a need for a stronger system of care and medication assisted (MAT) programs.
Other Key Findings
The community members and populations with the greatest unmet needs were identified as residents with limited English proficiency or language barriers, Hispanic (or Latino) residents, Black or African American residents, residents with low-income, unhoused or unsheltered residents, people living with disabilities, and members of the LGBTQ community. Participants noted that geographic areas with unmet health care needs include areas in Wilmington, Newark, New Castle, Claymont (Knollwood), Bear, and Delaware City. Disparities are also particularly evident for undocumented residents, older adults, children, and adolescents.
Access to health and preventive services is a significant concern, including access to primary (including pediatricians), specialty, dental, and mental health care. A shortage of OB/GYN and women’s health care was frequently mentioned as a critical concern and as disproportionately impacting residents with lower incomes and unhoused population. Access to care was also noted as particularly challenging for people living with disabilities and their caregivers with neurology and orthopedic care described as especially difficult to access.
Access barriers include cost of care, insurance restrictions and limitations, coordination of care, language barriers, and navigation challenges. Participants note that cost of care, despite insurance (including copays, deductibles, and prescription costs), and lack of transparency of cost are major barriers to accessing health and preventive services. It is often difficult to find doctors and dentists who take insurance, especially Medicaid, leading to long wait-times for appointments (3-6 months) and exacerbated symptoms, compounded health problems, and worse outcomes. The Medicaid population often has high healthcare needs due to previous lack of healthcare and insurance. Some residents experience challenges enrolling in insurance and other benefits and accessing medical care due to lack of identification and records such as birth certificates. Obtaining documentation is complicated by costs, legal issues with records, and a breakdown of family relationships.
Community input participants state a need for improved cultural sensitivity, language and translation services, and ample variety and diversity of healthcare workforce to reflect populations served. There is a need for more educational programs and materials to be offered in Spanish. Participants note that immigrants often need help understanding how to utilize the American healthcare system as it is vastly different than their home country.
Mobile healthcare programs have been successful and a need for more mobile vans, screenings, and resources to offer care in neighborhoods and communities where people live and at accessible times (evenings/weekends) is indicated. Participants note that community health workers (CHWs) have been helpful and there continues to be a need for “warm hand-offs” to help people navigate care post-discharge and to coordinate medical and social services.
Healthcare workforce shortages were frequently discussed as concerning. Nursing shortages are widespread with a particular need for personal care and private duty nurses.
Direct care workforce shortages have been problematic, and positions are difficult to fill due to low wages and limited career paths. The COVID-19 pandemic exacerbated existing workforce shortages as many people retired or left healthcare jobs. The long-term care workforce was especially impacted during the pandemic due to the virus’s disproportionate effect on vulnerable older adults living in nursing homes, and other congregate settings.
Mental health concerns are widespread across all ages and demographics and especially concerning amongst children and adolescents. Participants indicate a lack of resources and professionals in schools to help children with mental health and behavioral issues. Parents have difficulty advocating for their children as they are often dealing with their own mental health concerns and teachers are strained due to staffing shortages. The high prevalence of depression, anxiety, social isolation, and history of trauma are significant concerns with social media use and lingering impacts of the COVID-19 pandemic identified as influential factors. Bullying and cyber bullying are common and referenced as contributing to anxiety and severe mental health issues among school aged children. Suicide rates have been concerning, especially amongst male populations.
Access to mental health care is also a major concern with a lack of providers, and lack of support and resources for available staff and providers. Insurance restrictions limit access preventing individuals from getting the care or frequency of care recommended by providers. There is a particular need for more resources for veterans, mental health providers who speak Spanish, and behavioral health providers for people with intellectual disabilities.
Limited health literacy is identified as a contributing factor to poor health status and negative health outcomes. Low health literacy impacts residents’ ability to navigate the healthcare system, understand insurance coverage and benefits, adhere to medical advice and prescription regimens, obtain specialty care, and make decisions about health behaviors. Community input participants indicate there has been a lack of investment in the education system and the quality of education has declined, impacting residents’ success in long-term educational and employment opportunities.
Prevalence of chronic health conditions, such as obesity, diabetes, heart disease, and hypertension, are indicated as a widespread concern. Behavioral factors such as sedentary lifestyle and poor nutrition were referenced as contributing factors. Interventions are complicated by limited access to affordable nutritious food, mental health issues, high demand of work and family responsibilities, aging and limited mobility, and heredity/generational cycles.
Injury and violence are indicated as problematic, with domestic violence cited as a significant concern leading to poor health outcomes. Participants noted that support services for victims and prevention education are needed. Violence in schools, particularly gang related violence, is also identified as concerning, with gang involvement on the rise and starting at earlier ages. Cultural norms foster violence and social media, and cyber bullying are referred to as contributing factors. Neighborhood violence is also a problem with some residents fearful of going outside leading to decreased physical activity and increased mental health issues.
Social Determinants of Health including low-income, housing insecurity, transportation challenges, and food insecurity create access barriers, compound health conditions, and often lead to adverse outcomes. Participants express that social issues persist because of low wages relative to high costs of living, insufficient education, system issues, and lack of access to good employment opportunities.
Lack of safe and affordable housing is a critical issue with strict qualification criteria and high costs preventing some residents from establishing stable housing. There is a need for better regulation of rental properties to prevent landlords from charging high prices without maintaining housing that is safe, clean, and in good repair. Older residents, lowincome residents, larger families, and people living with disabilities are disproportionately impacted by housing concerns. Claymont’s Knollwood community is noted as particularly affected by substandard housing
There is a lack of reliable, affordable forms of transportation, and many places are challenging to access without a car. Accessing bus stops and riding the bus can be difficult, especially for older adults and people with disabilities or limited mobility
Substance use is prevalent amongst all ages and demographics and is especially concerning amongst youth. Mental health and substance use disorders are often interrelated. Participants identified gaps in treatment and care specifically for women during and after pregnancy, medication assisted treatment programs, recovery supports (housing and certified peer workers), and education and prevention. Tobacco use is reported as a significant concern, especially high vaping prevalence amongst youth and teens.
The top strengths and resources in the community were identified as an established network of community-based organizations and services, public spaces including libraries and community centers, a highly collaborative environment, a strong sense of community, resident’s willingness to help one another, and integration of community health workers.
OTHER FACILITIES AND RESOURCES IN THE COMMUNITY
This section identifies other facilities, clinics, and resources available in the ChristianaCare Health System community that are available to address community health needs.
Federally Qualified Health Centers
Federally Qualified Health Centers (FQHCs) are established to promote access to ambulatory care in areas designated as “medically underserved.” These clinics provide primary medical care and can offer mental health and dental services for lower-income members of the community. FQHCs receive enhanced reimbursement for Medicaid and Medicare services and most also receive federal grant funds under Section 330 of the Public Health Service Act. There currently are six FQHC sites operating in New Castle County (Exhibit 5).
Source: Health Resources and Services Administration, 2024.
Exhibit 5: Federally Qualified Health Centers, 2024
Hospitals
Exhibit 6 presents information on hospital facilities that operate in New Castle County.
Exhibit 6: Hospital Facilities, 2024
Delaware
Other Community Resources
and
A wide variety of health and social service resources are available to assist New Castle County residents. Delaware 2-1-1 provides one central resource for access to the health and human service organizations that offer support in the community. Delaware 2-1-1 is provided by the United Way of Delaware in partnership with Delaware Health and Social Services, ChristianaCare Health System, Always Best Care Senior Services, and Help is Here Delaware.
Delaware 2-1-1 is free, confidential, and easily accessible online at www.delaware211.org or by phone Monday through Friday from 8 a.m. to 9 p.m. Residents can connect with Delaware 211 by call, text, email, or live chat. Services are available in the following categories:
• Crisis Preparedness
• Dental Services
• Education
• Employment and Job Training
• Family Issues
• Financial Assistance
• Food, Clothing, and other Basic Needs
• Healthcare
• Housing and Shelter
• Legal Services
• Mental Health Counseling
• Senior Services
• Transportation
• Volunteer Opportunities
Additional information about these resources and participating providers can be found at: www.delaware211.org
In addition to Delaware 2-1-1, ChristianaCare’s Office of Health Equity (OHE) partners with Unite Us, to provide technology platform that enables impactful social care coordination. Unite Us leverages existing community resources to address social determinants of health. Unite Us eases the process of referrals to community-based organizations and allows for efficient connection between client’s healthcare and social services. Participating providers can view, coordinate, and collaborate on their clients’ care across organizations and types of service. Unite Us connects clients with resources and services in the following categories:
• Benefits navigation
• Clothing and household goods
• Education
• Employment
• Entrepreneurship
• Food assistance
• Housing and shelter
• Income support
• Individual and family support
• Legal
• Mental and behavioral health
• Money Management
• Physical health
• Social enrichment
• Spiritual enrichment
• Sports and recreation
• Substance use
• Transportation
• Utilities
• Wellness
APPENDIX A – OBJECTIVES AND METHODOLOGY
Regulatory Requirements
Federal law requires that tax-exempt hospital facilities conduct a CHNA every three years and adopt an Implementation Strategy that addresses significant community health needs.8 In conducting a CHNA, each tax-exempt hospital facility must do the following:
• Define the community it serves.
• Assess the health needs of that community.
• Solicit and consider input from people who represent the broad interests of that community, including those with special knowledge of or expertise in public health.
• Document the CHNA in a written report that is adopted for the hospital facility by an authorized body of the facility.
• Make the CHNA report widely available to the public.
The CHNA report must include certain information including, but not limited to the following:
• A description of the community and how it was defined.
• A description of the methodology used to determine the health needs of the community.
• A prioritized list of the community’s health needs.
Methodology
CHNAs seek to identify significant health needs for geographic areas and populations by focusing on the following questions:
• Who in the community is most vulnerable in terms of health status or access to care?
• What are the unique health status and/or access needs for these populations?
• Where do these people live in the community?
• Why are these problems present?
Focusing on who is most vulnerable and where they live is important to identifying groups experiencing health inequities and disparities. Understanding why these issues are present is challenging but is important to design effective community health improvement initiatives. The question of how each hospital can address significant community health needs is the subject of the separate Implementation Strategy.
Federal regulations allow hospital facilities to define the community they serve based on “all of the relevant facts and circumstances,” including the “geographic location” served by the hospital facility, “target populations served” (e.g., children, women, or the aged), and/or the hospital facility’s principal functions (e.g., focus on a particular specialty area or
8 Internal Revenue Code, Section 501(r).
targeted disease).”9 Accordingly, the community definition considered the geographic origins of the hospital’s patients and also the hospital’s mission, target populations, principal functions, and strategies.
Data from multiple sources were gathered and assessed, including secondary data10 published by others and primary data obtained through community input. Input from the community was obtained through key informant interviews, community partner and hospital staff meetings, and focus groups. Key informant and community meeting participants represented the broad interests of the community and included individuals with special knowledge of or expertise in public health. See Appendix C for a list of community input participants. Considering a wide array of information is important when assessing community health needs to ensure the assessment captures a wide range of facts and perspectives and to increase confidence that significant community health needs have been identified accurately and objectively.
Certain community health needs were determined to be “significant” if they were identified as problematic in at least two of the following three data sources: (1) the most recently available secondary data regarding the community’s health, (2) recent assessments developed by state and local health departments, and (3) input from community stakeholders who participated in the community meeting, focus group, and/or interview process.
In addition, data were gathered to evaluate the impact of various services and programs identified in New Castle County’s previous CHNA process. See Appendix E.
Data Sources
Community health needs were identified by collecting and analyzing data from multiple sources. Statistics for numerous community health status, health care access, and related indicators were analyzed, including data provided by local, state, and federal government agencies, local community service organizations, and ChristianaCare Health System. Comparisons of benchmarks were made where possible. Findings from recent assessments of the community’s health needs conducted by other organizations (e.g., local health departments) were reviewed as well.
Input from people representing the broad interests of the community was considered through key informant interviews (5 participants), community partner and hospital staff meetings (86 participants), and eight focus group sessions (105 participants). Participants included: individuals with special knowledge of or expertise in public health, local public health departments, hospital staff and providers, representatives of social service organizations, leaders, representatives, and members of medically underserved, lowincome, and minority populations
ChristianaCare Health System posts CHNA reports, and Implementation Plans online at
9 501(r) Final Rule, 2014.
10 “Secondary data” refers to data published by others, for example the U.S. Census and Delaware Health and Social Services. “Primary data” refers to data observed or collected from first-hand experience, for example by conducting interviews.
https://christianacare.org/about/whoweare/communitybenefit/community-healthneeds-assessment/.
Consultant Qualifications
Verité Healthcare Consulting, LLC (Verité) was founded in May 2006 and is located in Arlington, Virginia. The firm serves clients throughout the United States as a resource that helps hospitals conduct Community Health Needs Assessments and develop Implementation Strategies to address significant health needs. Verité has conducted more than 150 needs assessments for hospitals, health systems, and community partnerships nationally since 2012.
The firm also helps hospitals, hospital associations, and policy makers with community benefit reporting, financial assistance policies, program infrastructure, compliance, and community benefit-related policy and guidelines development. Verité is a recognized national thought leader in hospital community benefits, 501(r) compliance, and Community Health Needs Assessments.
APPENDIX B – SECONDARY DATA ASSESSMENT
This section presents an assessment of secondary data regarding health needs in the ChristianaCare Health System. The community is defined as New Castle County, Delaware.
Demographics
Exhibit 7: Change in Community Population by Age Cohort, 2024 to 2034
Source: Delaware Office of State Planning Coordination, The Delaware Population Consortium. http://www.stateplanning.delaware.gov/. Accessed 09/11/2024.
Description
Exhibit 7 portrays the estimated population by age cohort in 2024 and projected to 2034.
Observations
• Between 2024 and 2034, the community’s population is expected to grow by approximately 19,997 people, or 3.4 percent.
• The population 65 years and older is projected to grow much more rapidly (25.4 percent), likely leading to an increased need for healthcare services.
• Two age cohorts (0-19 and 20-29) have an anticipated decline in population between 2024 and 2034.
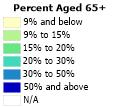
Exhibit 8: Percent of Population – Aged 65+, 2018-2022
Source: U.S. Census Bureau, 2018-2022, American Community Survey 5-Year Estimates, and Caliper Maptitude, 2024.
Description
Exhibit 8 portrays the percentage of the population 65 years of age and older by ZIP Code.
Observations
• In 2018-2022, ZIP Codes 19731 (Port Penn) and 19732 (Rockland) had the highest proportions of residents 65 and older (over 50 percent).
• ZIP Codes 19717 (Newark) and 19736 (Yorklyn) had the lowest proportions (under 1.0 percent).
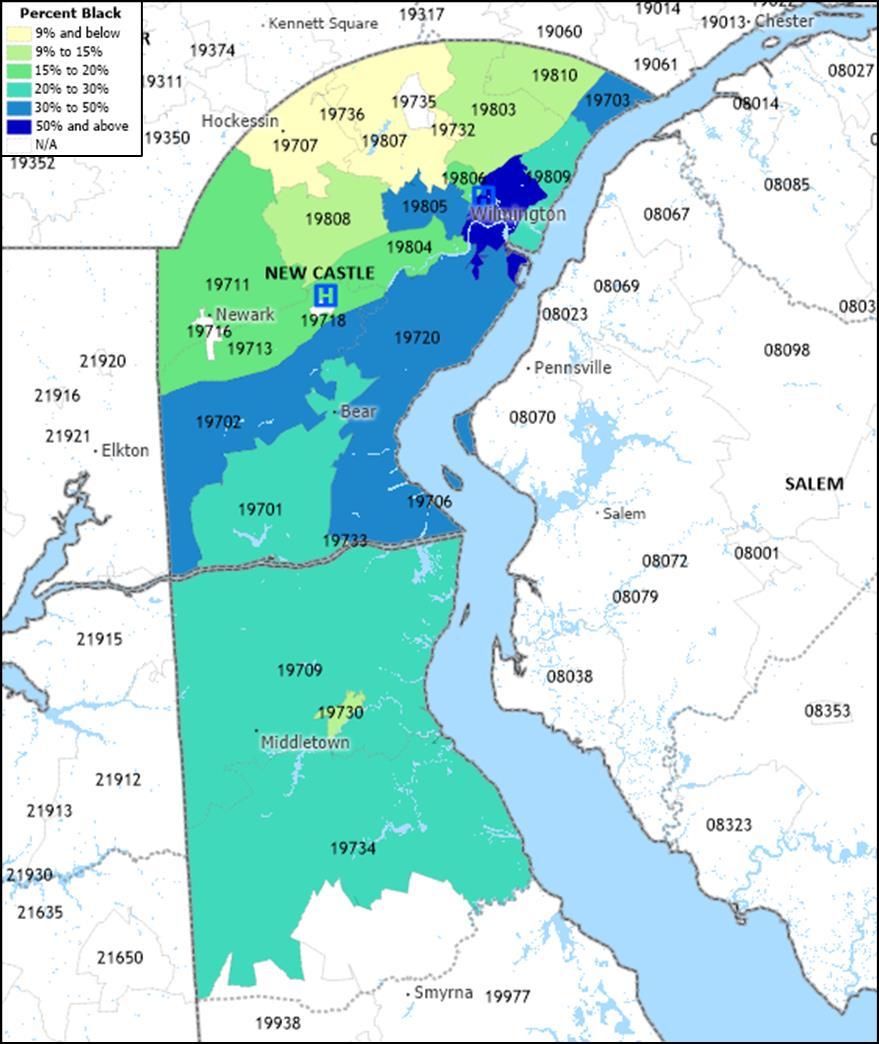
Exhibit 9: Percent of Population – Black, 2018-2022
Source: U.S. Census Bureau, 2018-2022, American Community Survey 5-Year Estimates, and Caliper Maptitude, 2024.
Description
Exhibit 9 portrays the percentage of the population – Black by ZIP Code.
Observations
• In 2018-2022, Community 1 ZIP Codes 19801 and 19802 had approximately 70 percent of the population identified as Black.
• Approximately 46 percent of the population in the combined ZIP Codes of Community 1 identified as Black, while about 12 percent of the combined ZIP Codes of Community 2 identified as Black.
Exhibit 10: Percent of Population – Hispanic (or Latino), 2018-2022
Source: U.S. Census Bureau, 2018-2022, American Community Survey 5-Year Estimates, and Caliper Maptitude, 2024. Description
Exhibit 10 portrays the percent of the population – Hispanic (or Latino) by ZIP Code.
Observations
• In 2018-2022, ZIP Code 19733 (Saint Georges) had the highest proportion of Hispanic (or Latino) residents, 60.1 percent.
• ZIP Code 19805, in the city of Wilmington and Community 1, had the second highest percentage of population identified as Hispanic (24.6 percent).
• Approximately 16 percent of the population in the combined ZIP Codes of Community 1 identified as Hispanic (or Latino), while about 9 percent of the combined ZIP Codes of Community 2 identified as Hispanic (or Latino).
Exhibit 11: Selected Socioeconomic Indicators, 2018-2022
Source: U.S. Census Bureau, 2018-2022, American Community Survey 5-Year Estimates
Description
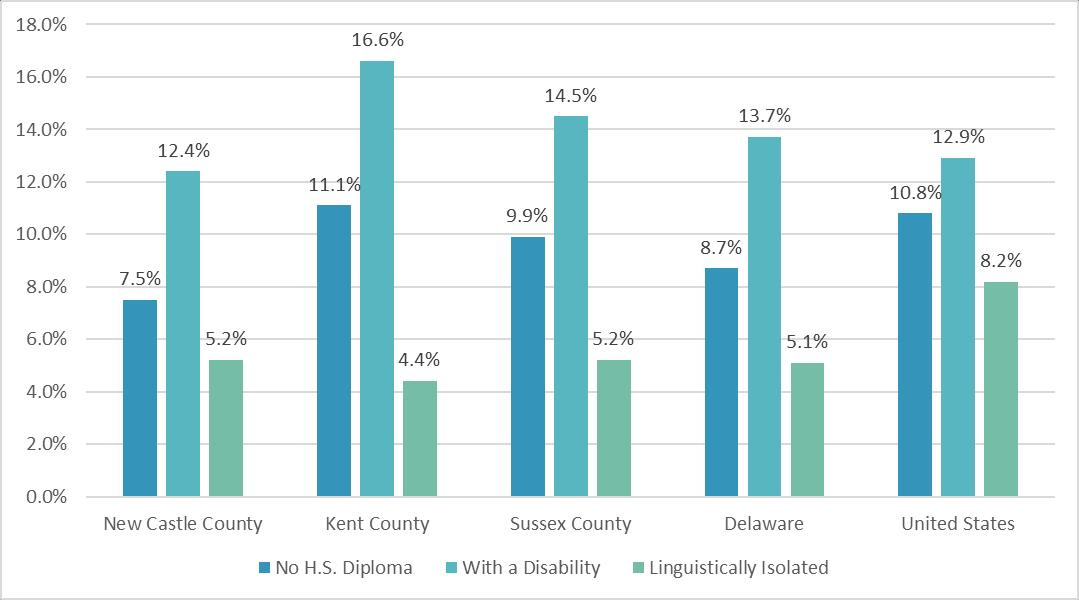
Exhibit 11 portrays the percent of the population (aged 25 years and above) without a high school diploma, with a disability, and linguistically isolated in New Castle County, Kent County, Sussex County, Delaware, and the United States Linguistic isolation is defined as residents who speak a language other than English and who speak English less than “very well.”
Observations
• In 2018-2022, the percentage of residents aged 25 and older without a high school diploma in New Castle County and Delaware was below the national average.
• New Castle County had a lower percentage of population with a disability than both Delaware and the United States.
• The percentages of those linguistically isolated were similar throughout Delaware and lower than the national average in all counties.
Socioeconomic Indicators
This section includes indicators for poverty, food access, unemployment, health insurance status, crime, housing affordability, climate, and “social vulnerability.” All have been associated with health status.
People in Poverty
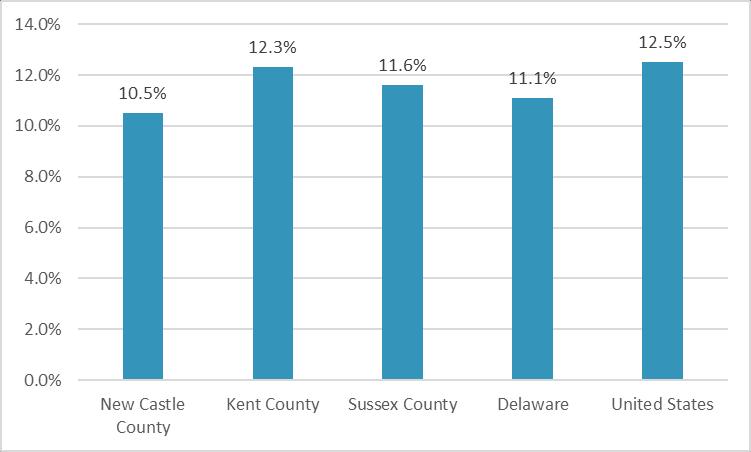
Exhibit 12: Percent of People in Poverty, 2018-2022
Source: U.S. Census Bureau, 2018-2022, American Community Survey 5-Year Estimates
Description
Exhibit 12 portrays poverty rates in New Castle County, Kent County, Sussex County, Delaware, and the United States.
Observations
• In 2018-2022, the poverty rate in New Castle County was below all Delaware counties and United States averages.
Exhibit 13: Poverty Rates by Race and Ethnicity, 2018-2022
Source: U.S. Census Bureau, 2018-2022, American Community Survey 5-Year Estimates
Description
Exhibit 13 portrays poverty rates by race and ethnicity. Light grey shading indicates rates above the U.S average for all races and ethnicities combined (12.5 percent) and dark grey shading indicates rates more than 50 percent above the U.S. average for all races and ethnicities combined.
Observations
• In 2018-2022, a higher proportion of New Castle County Black and Hispanic (or Latino) residents were living in poverty than White residents and residents of all races and ethnicities combined.
• Overall poverty rates in New Castle County and throughout Delaware were lower than the national average.
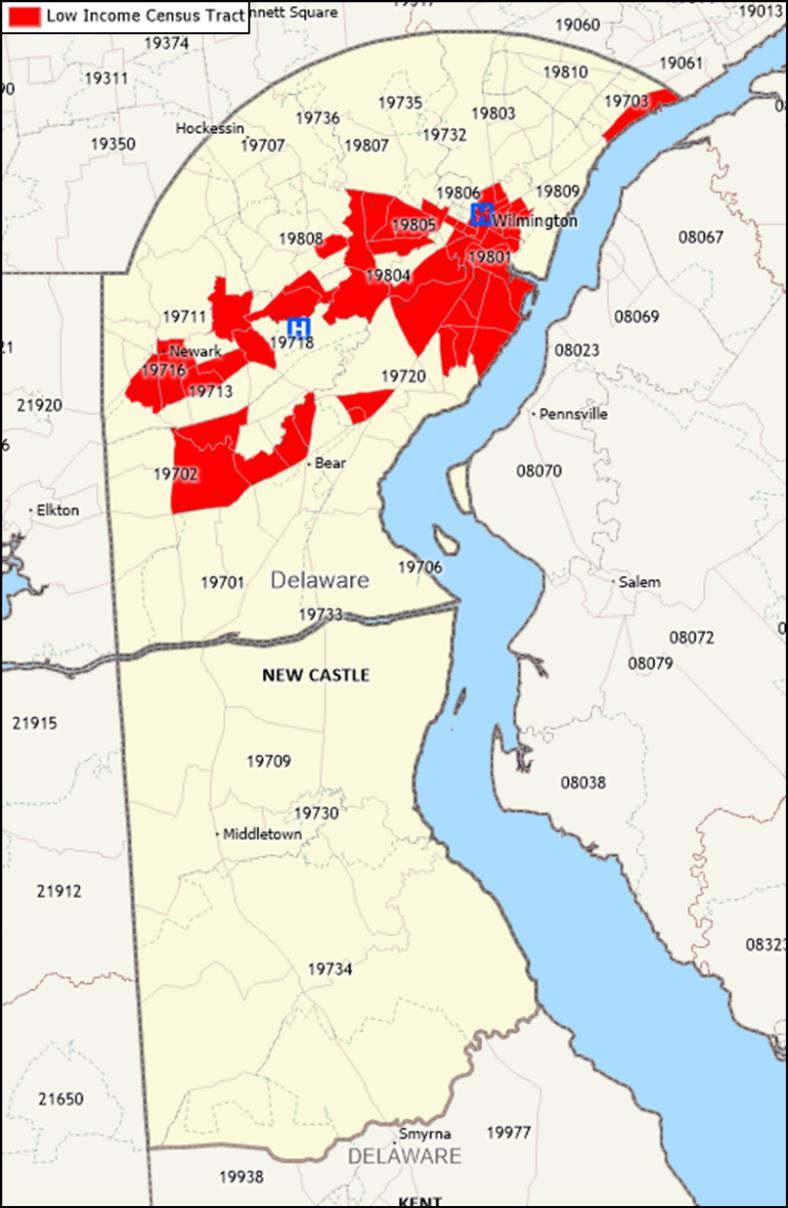
Exhibit 14: Low Income Census Tracts, 2019
Source: U.S. Department of Agriculture, Economic Research Service, 2019 and Maptitude, 2024.
Description
Exhibit 14 portrays the location of federally designated low-income census tracts.
Observations
• In 2019, low-income census tracts were located in Claymont, Bear, Newark, Wilmington, and throughout Community 1.
Exhibit 15: Socioeconomic Characteristics, Community 1 versus Community 2, 2018-2022
Source: U.S. Census Bureau, 2018-2022, American Community Survey 5-Year Estimates
Description
Exhibit 15 illustrates the substantial disparity in socioeconomic indicators between Community 1 and Community 2, compared to overall New Castle County.
Observations
• In 2018-2022, Community 1 had more than double the population living in poverty compared to Community 2 (16.5 percent compared to 8.1 percent) and New Castle County.
• Community 1 had almost three times the proportion of children living in poverty compared to Community 2.
• Community 1 had a significantly higher percentage of residents who identified as a racial and ethnic minority compared to Community 2 and New Castle County.
• Community 1 residents were more likely to be uninsured, have limited English proficiency, have a disability, and were less likely to have a high school diploma than Community 2 residents and New Castle County.
Exhibit 16: Select Socioeconomic Characteristics, Delaware, LGBT vs. Non-LGBT, 2019
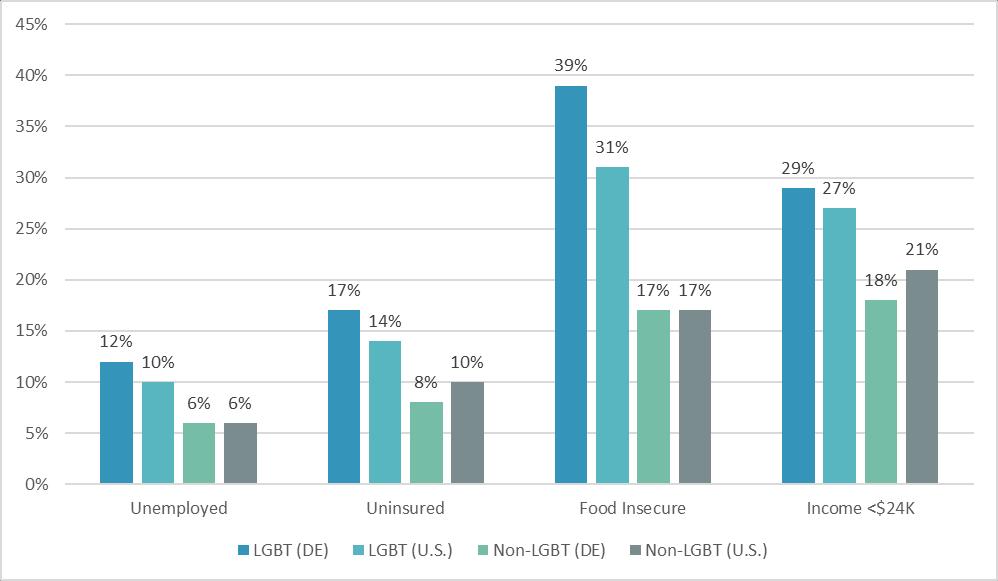
Description
Exhibit 16 presents select socioeconomic indicators for lesbian, gay, bisexual, and transgender (LGBT) communities compared to non-LGBT communities in Delaware and the United States.
Observations
• In 2019, Delaware and U.S. residents who identified as LGBT were more likely to be unemployed, uninsured, food insecure, and have low-income than those who identified as non-LGBT in the state and nationally.
LGBT Demographic Data Interactive, January 2019, Los Angeles, CA: The Williams Institute, UCLA School of Law.
Food Access
Exhibit 17: Food Insecurity by Race and Ethnicity, 2021-2022
Description
Exhibit 17 portrays food insecurity estimates disaggregated by race and ethnicity and overall food insecurity rates for children in the three Delaware counties, Delaware, and the United States. Dark grey shading indicates rates 50 percent or more above the U.S-wide average of 13.5 percent for all persons. Light grey shading indicates rates 0-50 percent above the U.S. average.
Observations
• In 2021, the overall food insecurity rates in New Castle County and throughout Delaware were lower than the national average for all people.
• Food insecurity rates for Black and Hispanic residents were higher in New Castle County and throughout Delaware compared to the U.S.-wide rate for all people.
• Food insecurity rates were higher for children in New Castle County and throughout Delaware compared to the overall food insecurity rate in each county and the U.S.wide rate for all people.
Source: Dewey, A., Harris, V., Hake, M., & Engelhard, E. (2024). Map the Meal Gap 2024: An Analysis of County and Congressional District Food Insecurity and County Food Cost in the United States in 2022. Feeding America. Note: County and state data (2021); national data (2022).
Exhibit 18: Low-Income and Low-Access to Healthy Food Census Tracts, 2019
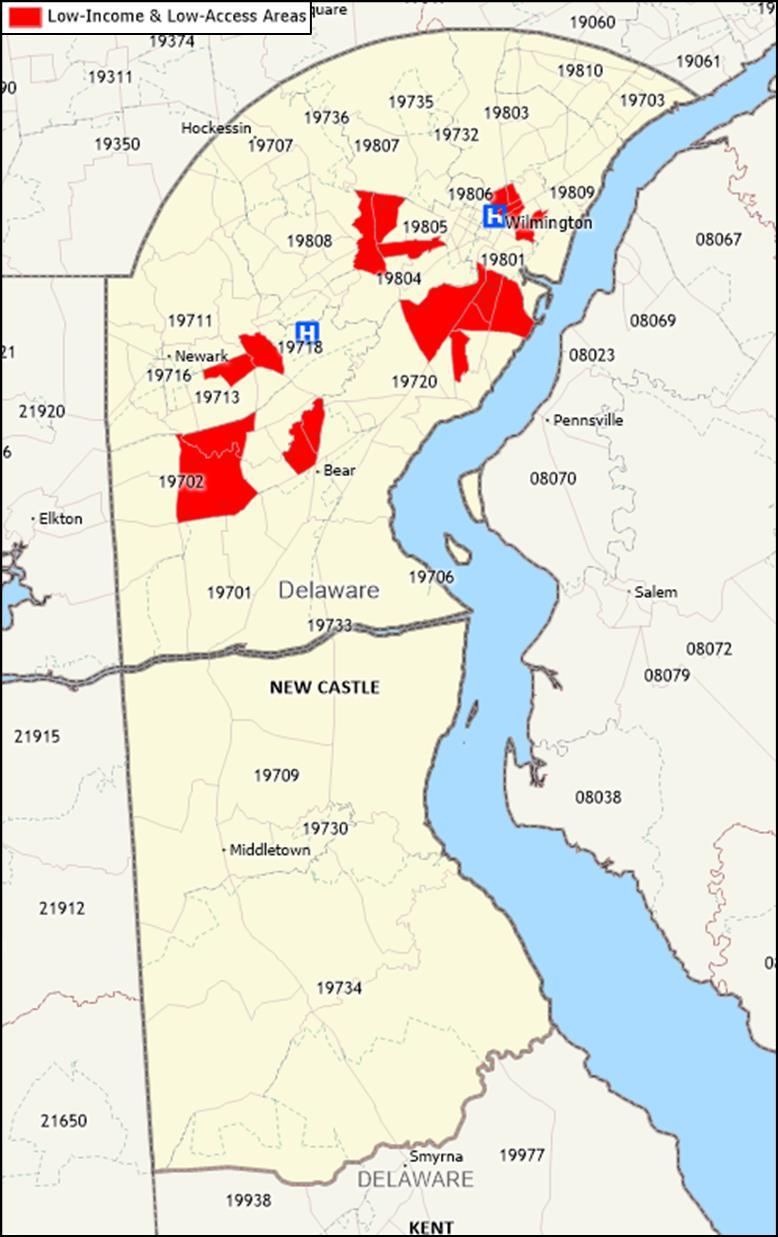
Source: Economic Research Service (ERS), U.S. Department of Agriculture (USDA). Food Access Research Atlas, https://www.ers.usda.gov/data-products/food-access-research-atlas/, 2021 and Caliper Maptitude, 2024.
Description
The U.S Department of Agriculture’s (USDA) Economic Research Service defines areas as low-income and low access by measuring distance to a grocery store or supermarket and the average income of the neighborhood. The USDA defines low access as more than one mile from a supermarket or large grocery store in urban areas and more than 10 miles from a supermarket or large grocery store in rural areas. Limited access to supermarkets, grocery stores, or other sources of healthy and affordable food may make it harder for people to eat a nutritious diet.11
11 https://www.ers.usda.gov/data-products/food-access-research-atlas/about-the-atlas/
Exhibit 18 identifies areas designated as low-income and low access to healthy and affordable food in New Castle County.
Observations
• In 2019, federally designated low-income and low access areas were present in Wilmington and Newark.
Unemployment
Exhibit 19: Unemployment Rates, 2019 to 2023
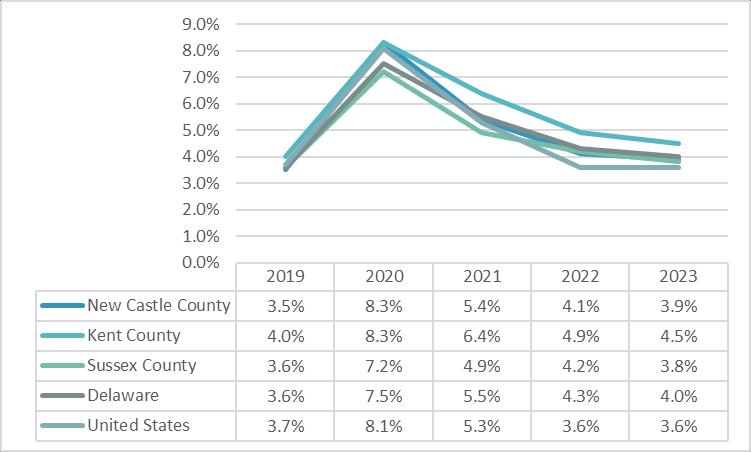
Source: U.S. Bureau of Labor Statistics, 2023.
Description
Exhibit 19 shows unemployment rates for 2019 through 2023 by county with Delaware and national rates for comparison.
Observations
• Unemployment rates rose substantially from 2019 to 2020 due to the COVID-19 pandemic; however, declined steadily from 2020 to 2023.
• In 2023, unemployment rates were higher in New Castle County and Delaware compared to national averages.
Description
Exhibit 20 presents the estimated percentage of the population without health insurance. Light grey shading indicates areas that had a higher percentage uninured than the state average and dark grey shading indicates areas that were more than 50 percent above the state average.
Observations
• In 2018-2022, New Castle County had a lower percentage of the population without health insurance compared to state and national averages.
• At 9.2 percent, the percentage of the population without health insurance in Newark ZIP Code 19713 was more than 50 percent above the state average.
• The proportion of the population without health insurance in Community 1 was higher than Community 2, New Castle County, and the state average; however, lower than the national average.
Crime Rates
Exhibit 21: Crime Rates by Type (per 100,000), 2022
Source: Federal Bureau of Investigation, 2022.
Description
Exhibit 21 provides crime statistics and rates, per 100,000 population, available from the Federal Bureau of Investigation Light grey shading indicates rates above the United States average; dark grey shading indicates rates more than 50 percent above the average.
Observations
• In 2022, crime rates in New Castle County were below Delaware and U.S. averages for all crime types.
• Violent crime, assault, property crime, and larcenty theft rates were higher in Delaware compared to national averages.
Housing Affordability
Exhibit 22: Percent of Rented Households Rent Burdened, 2018-2022
Source: U.S. Census Bureau, 2018-2022, American Community Survey 5-Year Estimates
Exhibit 23: Map of Percent of Rented Households Rent Burdened, 2018-2022
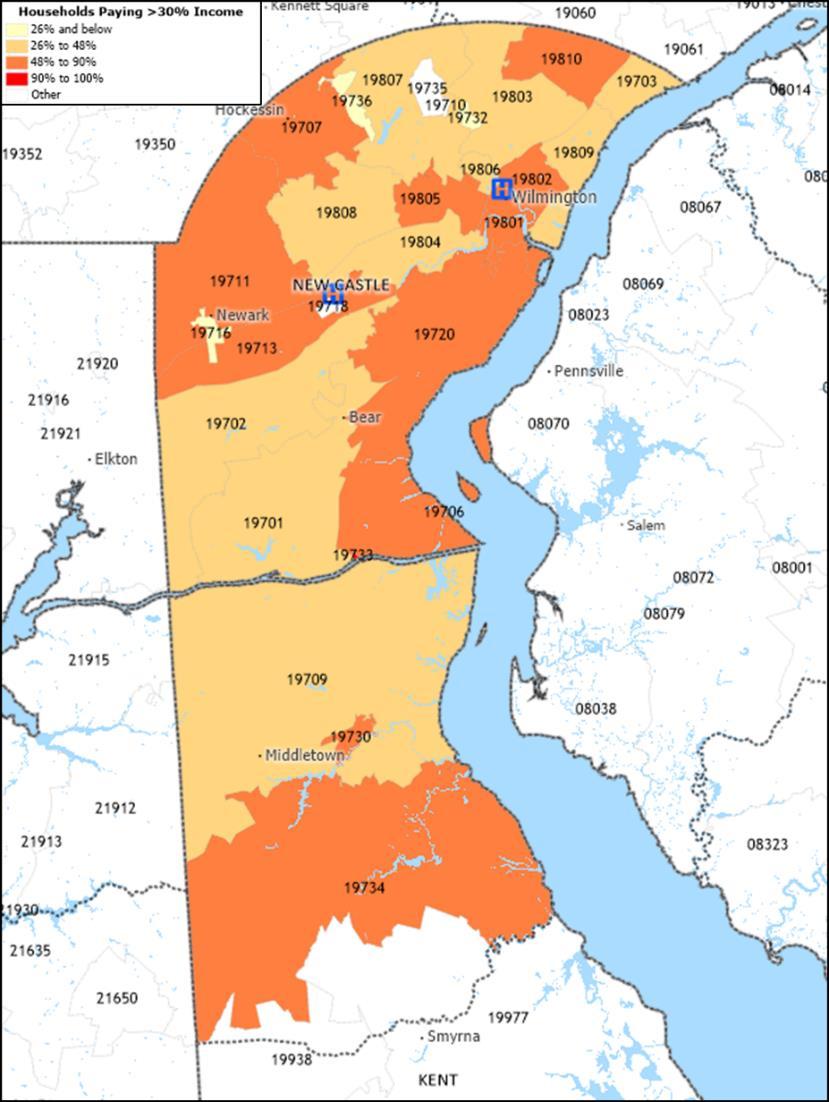
Source: U.S. Census Bureau, 2018-2022 American Community Survey 5-Year Estimates, and Caliper Maptitude, 2024.
Description
The U.S. Department of Housing and Urban Development has defined “rent burdened” households as those spending more than 30 percent of income on housing.12
Exhibits 22 and 23 portray the percentage of rented households that meet this definition. ZIP Codes highlighted in dark orange and red are where over 40 percent of households have been designated as rent burdened.
Observations
• In 2018-2022, over half of the combined Community 1 households were designated as rent burdened.
12 https://www.federalreserve.gov/econres/notes/feds-notes/assessing-the-severity-of-rentburden-on-low-income-families-20171222.htm
• ZIP Codes in Delaware City (19706), Hockessin (19707), Newark (19711), Odessa (19730), Townsend (19734), and Wilmington (19805) had over 50 percent of households designated as rent burdened.
• The percentage of occupied households rent burdened in New Castle County overall was below the state and national average.
Area Deprivation Index
Exhibit 24: Area Deprivation Index by Census Block Group, 2020
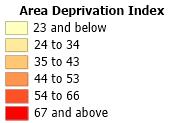
Source: University of Wisconsin School of Medicine and Public Health. Area Deprivation Index, 2021. Downloaded from https://www.neighborhoodatlas.medicine.wisc.edu/, March 21, 2024, and Caliper Maptitude, 2024.
Description
Exhibit 24 presents the University of Wisconsin, School of Medicine and Public Health, Center for Health Disparities Research’s Area Deprivation Index (ADI). The ADI ranks neighborhoods by level of socioeconomic disadvantage and includes factors for income, education, employment, and housing quality.
ADIs are calculated for census block groups in national percentile rankings from 1 to 100. A block group ranking of 1 indicates the lowest level of disadvantage within the nation and an ADI ranking of 100 indicates the highest level of disadvantage.
Observations
• In 2020, neighborhoods that comprise Community 1 (Wilmington and New Castle) had disproportionately higher levels of socioeconomic disadvantage.
• Neighborhoods in Claymont, Bear, Newark, and Delaware City also had comparatively high levels of socioeconomic disadvantage.
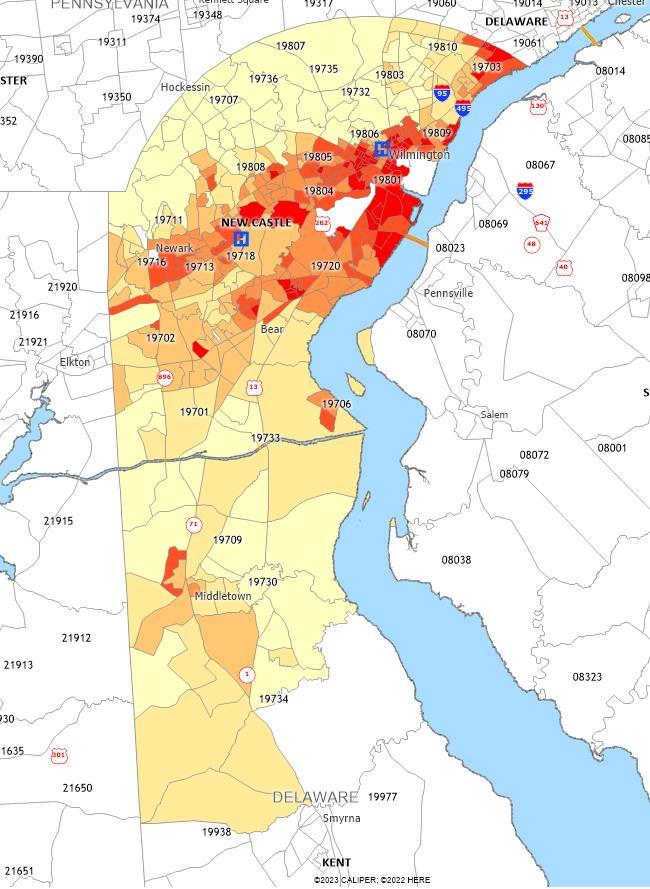
Centers for Disease Control and Prevention Social Vulnerability Index
Exhibit 25: Socioeconomic Status - Bottom Quartile Census Tracts, 2020
Source: Centers for Disease Control and Prevention, 2020, and Caliper Maptitude, 2024.
Description
Exhibits 25 through 28 are maps that show the Centers for Disease Control and Prevention’s (CDC) Social Vulnerability Index (SVI) scores by census tract. Red highlighted census tracts indicate scores that are in the bottom quartile nationally. The SVI is based on 15 variables derived from U.S. census data and grouped into four themes, including Socioeconomic Status; Household Characteristics; Racial & Ethnic Minority Status; and Housing Type & Transportation.
Exhibit 25 identifies census tracts in the bottom half and bottom quartile for “socioeconomic characteristics,” specifically below 150 percent of poverty, unemployment, housing cost burden, no high school diploma, no health insurance.
Observations
• In 2020, census tracts with the highest socioeconomic vulnerability were present in and around Bear, Claymont, Wilmington, and Newark.
• Many of the census tracts were located within Community 1 ZIP Codes.
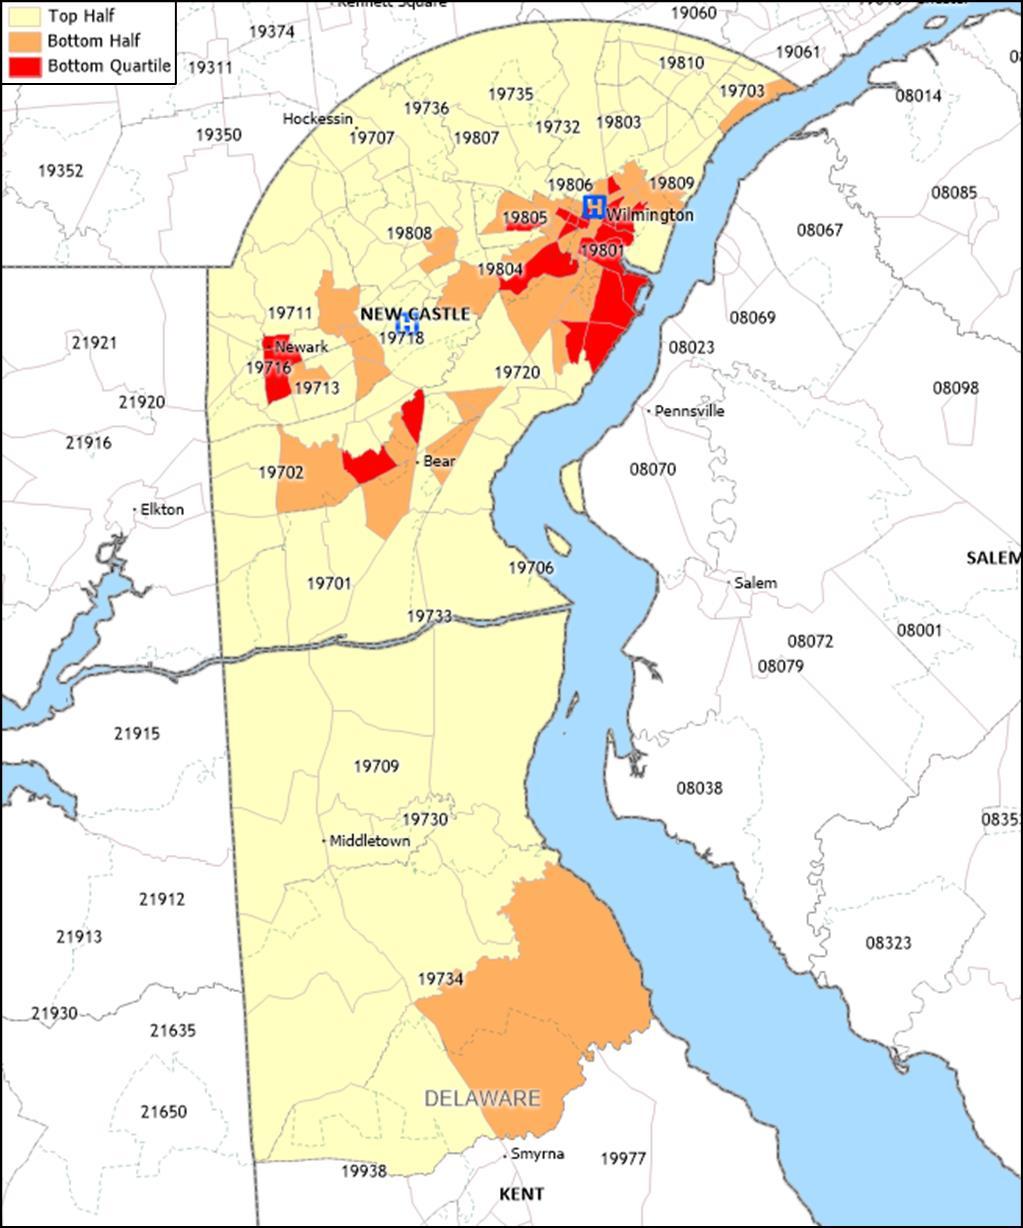
Exhibit 26: Household Characteristics – Bottom Quartile Census Tracts, 2020
Source: Centers for Disease Control and Prevention, 2020, and Caliper Maptitude, 2024.
Description
Exhibit 26 identifies census tracts in the bottom half and bottom quartile nationally for “household characteristics,” specifically percent of people 65 years of age or older, 17 years of age or younger, civilian with a disability, single-parent households, and with Limited English Proficiency (LEP).
Observations
• In 2020, census tracts with the highest household characteristics vulnerability were concentrated in and around Newark, New Castle, Wilmington, and Middletown.
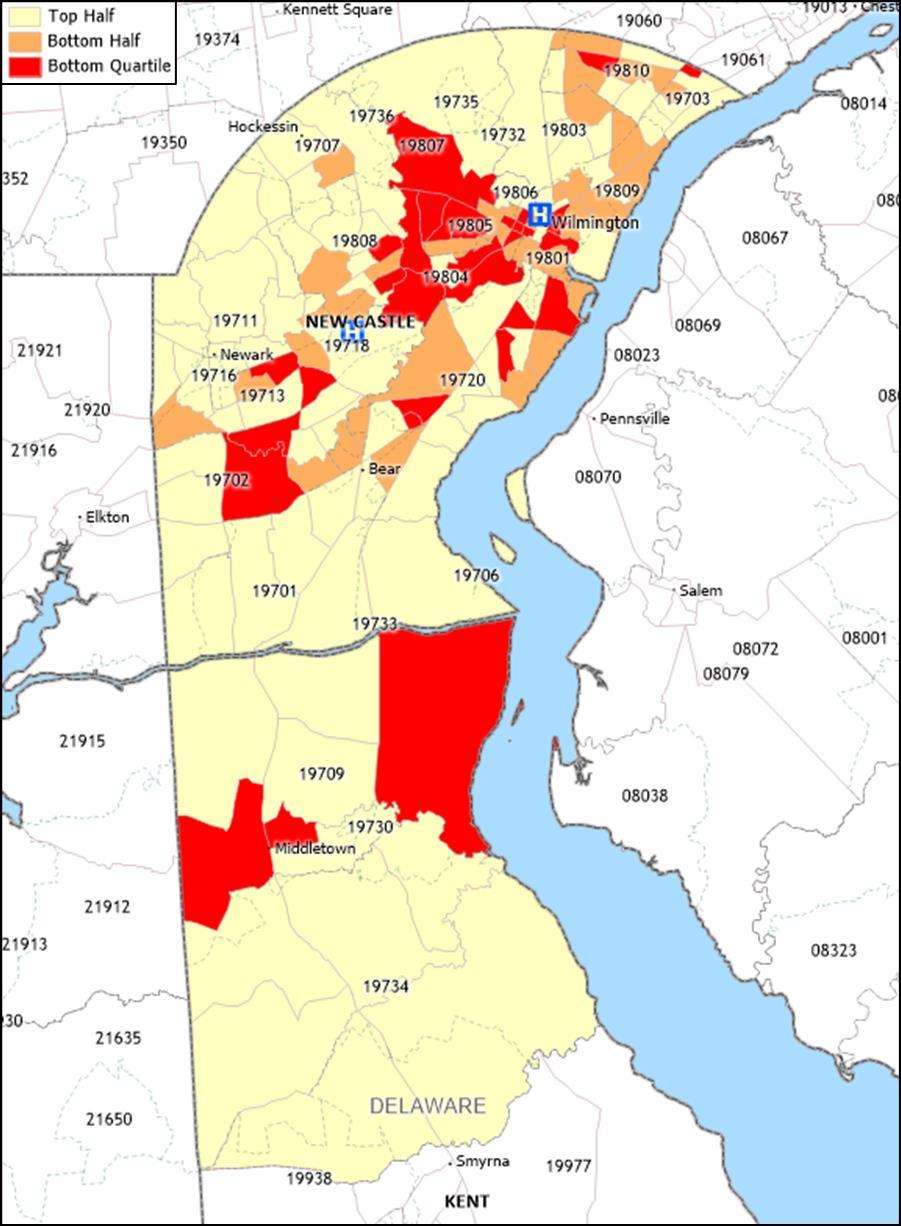
Exhibit 27: Racial and Ethnic Minority Status – Bottom Quartile Census Tracts, 2020
Source: Centers for Disease Control and Prevention, 2020, and Caliper Maptitude, 2024.
Description
Exhibit 27 identifies census tracts in the bottom half and bottom quartile for “racial and ethnic minority status,” specifically percent of people identified as non-White.
Observations
• In 2020, census tracts with the highest racial and ethnic minority status vulnerability were in Claymont, Wilmington, Newark, and Bear.
• Many of the census tracts were located within Community 1 ZIP Codes.
Exhibit 28: Housing Type and Transportation – Bottom Quartile Census Tracts, 2020
Source: Centers for Disease Control and Prevention, 2020, and Caliper Maptitude, 2024.
Description
Exhibit 28 identifies census tracts in the bottom half and bottom quartile nationally for “housing type and transportation vulnerability,” specifically people living in multi-unit structures, in mobile homes, in crowded households, in group quarters, and with no vehicle.
Observations
• In 2020, census tracts designated as vulnerable for housing type and transportation were present in Claymont, Wilmington, Newark, New Castle, and Bear.
Centers for Disease Control and Prevention Heat and Health Index
Exhibit 29: Heat and Health Index by ZIP Code, 2018-2022
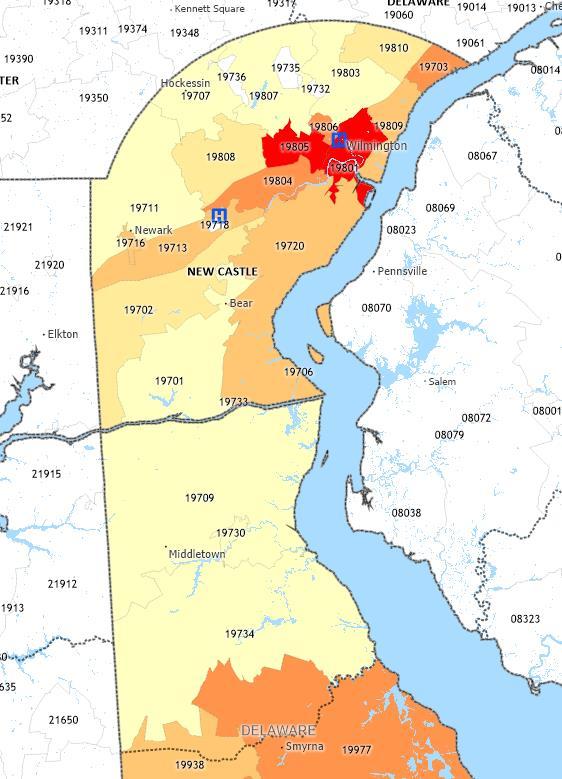
Source: Centers for Disease Control and Prevention, Climate & Health Program, Heat and Health Tracker, 2018-2022. Accessed from: https://ephtracking.cdc.gov/DataExplorer on 09/12/2024, and Caliper Maptitude, 2024.
Description
Exhibit 29 presents the Centers for Disease Control and Prevention’s Heat and Health Index (HHI) by ZIP Code. The HHI ranks ZIP Codes by level of risk for negative outcomes from heat and includes factors for previous experience with heat, pre-existing health conditions, social and demographic characteristics, and natural and built environment characteristics. HHIs are provided in national percentile rankings from 1 to 100, with 1 indicating the lowest level of risk and 100 indicating the highest level of risk.
Observations
• In 2018-2022, Wilmington ZIP Codes 19801 and 19805 (both in Community 1) had the highest levels of risk for negative outcomes due to heat in New Castle County.
• ZIP Code 19801 ranked the highest in Delaware (94th percentile nationally) for risk for high heat vulnerability.
• ZIP Codes in New Castle, Bear, Newark and Claymont also ranked as having comparatively high heat vulnerabiltiy.
Other Health Status and Access Indicators
County Health Rankings
Exhibit 30: County Health Rankings, Health Outcomes, 2024
Source: County Health Rankings, 2024 and Caliper Maptitude, 2024.
Description
Exhibit 30 presents data from County Health Rankings, a University of Wisconsin Population Health Institute initiative funded by the Robert Wood Johnson Foundation that incorporates a variety of indicators to assess “health factors” and “health outcomes” of counties across the United States. The health factors and outcomes are composite measures based on several variables grouped into the following categories: Health
behaviors, clinical care,13 social and economic factors, and physical environment.14 County Health Rankings is updated annually. County Health Rankings 2024 relies on data from 2015 to 2023. Most data are from 2018 to 2022 The exhibit presents “health outcomes” assessments for Delaware counties relative to other counties across the United States.
Observations
• In 2024, New Castle County was assessed as slightly better than the average county in Delaware, and better than the average county in the nation, for the health outcomes measure.
13A composite measure of Access to Care, which examines the percentage of the uninsured population and ratios primary care physicians, dentists, and mental health providers and Quality of Care, which examines preventable hospitalization rates, mammography screening, and flu vaccination rates
14A composite measure that examines Environmental Quality, which measures air pollution and drinking water violations, and Built Environment, which measures severe housing problems and driving alone to work.
Exhibit 31: County Health Rankings Data Compared to State and U.S. Averages, 2024
Source: County Health Rankings, 2024.
Exhibit 31: County Health Rankings Data Compared to State and U.S. Averages, 2024 (continued)
Source: County Health
Description
Exhibit 31 provides data that underlie the County Health Rankings and compares indicators to statewide and national averages 15 Light grey shading highlights indicators found to be worse than the national average; dark grey shading highlights indicators more than 50 percent worse.
Note that higher values generally indicate that health outcomes, health behaviors, and other factors are worse in the county than in the United States. However, for several indicators, lower values are more problematic, including food environment index, percent with access to exercise opportunities, percent receiving mammography screening, percent receiving flu vaccination, high school graduation rate, and percent with some college.
Observations
• The following indicators compared unfavorably to U.S. averages:
o Years of potential life lost before age 75 per 100,000 population
o Percent of live births with low birthweight
o Percent of adults that report a BMI greater than 30
o Percent of adults aged 20 and over reporting no leisure-time physical activity
o Chlamydia rate per 100,000 population
o Per capita supply of dentists
o Preventable hospitalizations
o Percent of adults aged 25-44 years with some post-secondary education
o Unemployment
o Percent of children that live in a household headed by single parent
o Injury mortality per 100,000 population
o Air pollution
o Percent of the workforce that drives alone to work
15 https://www.countyhealthrankings.org/health-data/county-health-rankings-measures
Community Health Status Indicators
Exhibit 32: Community Health Status Indicators, 2024
Source: County Health Rankings and Verité Analysis, 2024
Description: County Health Rankings has assembled community health data for all 3,143 counties in the United States. Following a methodology developed by the CDC, Community Health Status Indicators Project (CHSI), County Health Rankings also publishes lists of “peer counties” so comparisons with peer counties in other states can be made. Each county in the U.S. is assigned 30 to 35 peer counties based on 19 variables including population size, population growth, population density, household income, unemployment, percent children, percent elderly, and poverty rates
CHSI formerly was available from the CDC. Because comparisons with peer counties (rather than only counties in the same state) are meaningful, Verité Healthcare Consulting rebuilt the CHSI comparisons for this and other CHNAs.
Exhibit 32 compares New Castle County to its respective peer counties and highlights community health issues found to rank in the bottom half and bottom quartile of the counties included in the analysis. Light grey shading indicates rankings in the bottom half of peer counties; dark grey shading indicates rankings in the bottom quartile of peer counties. Underlying statistics also are provided.
See Appendix D for a list of New Castle County’s peer counties.
Note that higher values generally indicate that health outcomes, health behaviors, and other factors are worse in the county than in its peer counties. However, for several indicators, lower values are more problematic, including:
• Food environment index,
• Percent with access to exercise opportunities,
• Percent receiving mammography screening,
• Percent receiving flu vaccination,
• High school graduation rate, and
• Percent with some college.
Observations
• New Castle County compared unfavorably to peer counties for fifteen (15) of the 33 benchmark indicators.
• New Castle County ranked in the bottom quartile of peer counties for eleven (11) of the 33 indicators:
o Percent of live births with low birthweight
o Percent of adults reporting no leisure-time physical activity
o Chlamydia rate per 100,000 population
o Preventable hospitalizations
o Percent of adults with some post-secondary education
o Unemployment
o Percent of children living in poverty
o Income equality ratio
o Percent of children living in a household headed by a single parent
o Injury mortality per 100,000 population
o Air pollution
COVID-19
Incidence and Mortality
Exhibit 33: COVID-19 Incidence and Mortality (As of March 10, 2023)
Source: Johns Hopkins University. Accessed via ESRI. Additional data analysis by CARES. 2022.
Description
Exhibit 33 presents data regarding COVID-19 incidence and mortality. Light grey shading highlights indicators found to be worse than the national average
Observations
• As of March 2023, New Castle County experienced a COVID-19 mortality rate lower than Delaware and the United States.
• As of March 2023, there were over 280 deaths due to COVID-19 in New Castle County.
Causes of Death
Exhibit 34: Selected Causes of Death, Age-adjusted Rates (per 100,000
Source: Centers for Disease Control and Prevention, National Center for Health Statistics, Mortality 1999-2020 on CDC WONDER Online Database, released, 2021. Access at wonder.cdc.gov on 4/22/24..
Description
Exhibit 34 provides age-adjusted mortality rates for selected causes of death. Light grey shading indicates rates above U.S. averages, dark grey shading indicates rates more than 50 percent above U.S. averages.
Observations
• In 2020, rates of malignant neoplasms, accidents and unintentional injuries, and heart and cerebrovascular diseases in New Castle County were above national averages.
• Rates of accidental poisoning and exposure to noxious substances, assault, certain conditions originating in the perinatal period, and other diseases of the arteries and arterioles were more than 50 percent worse than national averages.
Exhibit 35: Cancer Mortality, Age-adjusted Rates (per 100,000 population), 2018-2022
Source: Centers for Disease Control and Prevention, 2023.
Description
Exhibit 35 provides age-adjusted mortality rates for selected forms of cancer in 20182022.
Observations
• In 2018-2022, New Castle County’s overall cancer mortality rate was higher than the national average.
• In New Castle County and Delaware, mesothelioma mortality rates were more than 50 percent above the national rate.
• Cancer mortality rates were higher in New Castle County and Delaware compared to United States averages for most cancer types.
Exhibit 36: Poisoning Mortality (per 100,000 population), 2018-2022
Source: Centers for Disease Control and Prevention, National Vital Statistics System, Accessed via CDC WONDER. 20182022.
Description
Exhibit 36 presents the 2018-2022 five-year average rate of death due to poisoning (including drug overdose) per 100,000 population. Dark grey shaded indicates rates more than 50 percent above U.S. rates.
Observations
• Between 2018-2022, New Castle County and Delaware had significantly higher average poisoning mortality rates compared to the U.S.
Exhibit 37: Poisoning Mortality (per 100,000 population) by Gender, 2018-2022
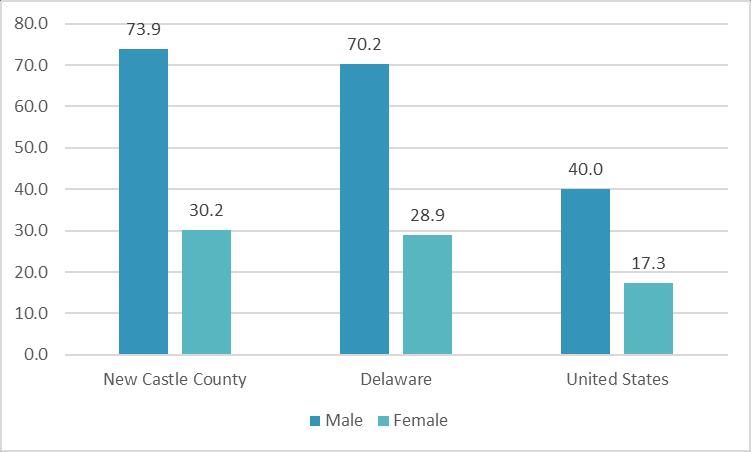
Source: Centers for Disease Control and Prevention, National Vital Statistics System, Accessed via CDC WONDER. 20182022.
Description
Exhibit 37 displays crude mortality rates from deaths due to poisoning (including drug poisoning), per 100,000 population, grouped by gender.
Observations
• In 2018-2022, deaths due to poisoning, including drug overdose, were more than double for males compared to females in New Castle County and Delaware.
• New Castle County male death rate due to poisoning was almost double (1.8 times) that of the U.S.-wide rate for males and 4.6 times the rate of female deaths due to poisoning.
Exhibit 38: Poisoning Mortality (per 100,000 population) by Race and Ethnicity, 2018-2022
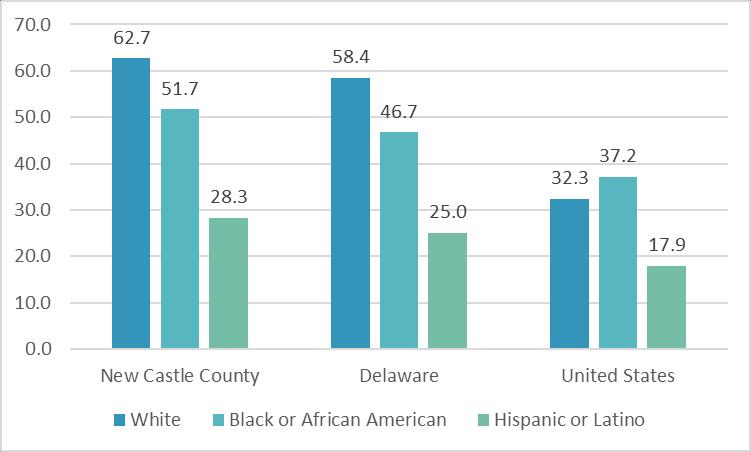
Source: Centers for Disease Control and Prevention, National Vital Statistics System, Accessed via CDC WONDER. 20182022.
Description
Exhibit 38 displays crude mortality rates from deaths due to poisoning (including drug poisoning), calculated per 100,000 population and grouped by combined race and Hispanic origin.
Observations
• Between 2018-2022, deaths due to poisoning, including drug overdose, were significantly higher for White populations in New Castle County and Delaware compared national rates.
• New Castle County and Delaware poisoning mortality rates compared unfavorably to national rates for people of all races and ethnicities.
Exhibit 39: Suicide Deaths (per 100,000 population), 2018-2022
Area
Source: Centers for Disease Control and Prevention, National Vital Statistics System, Accessed via CDC WONDER. 20182022.
Description
Exhibit 39 presents the 2018-2022 five-year average rate of death due to intentional selfharm (suicide) per 100,000 population.
Observations
• Between 2018-2022, suicide rates were lower in New Castle County and Delaware compared to the national average.
Exhibit 40: Suicide Deaths (per 100,000 population) by Gender, 2018-2022
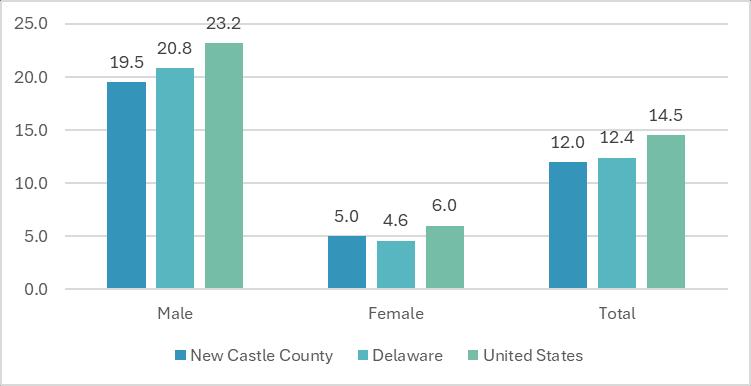
Source: Centers for Disease Control and Prevention, National Vital Statistics System, Accessed via CDC WONDER. 20182022.
Description
Exhibit 40 presents the 2018-2022 five-year average rate of death due to intentional selfharm (suicide) per 100,000 population, grouped by gender.
Observations
• Between 2018-2022, suicide rates were significantly higher in male populations in New Castle County, Delaware, and the U.S. compared to female populations and overall suicide rates for all areas presented.
Communicable Diseases
Exhibit 41: Communicable Disease Incidence Rates (per 100,000 population), 2021-2022
Source: Centers for Disease Control and Prevention, 2022.
Note: Tuberculosis data (2022); all other measures (2021).
Description
Exhibit 41 presents incidence rates for certain communicable diseases. Light grey shading indicates rates that are higher than the national rate.
Observations
• In 2021-2022, New Castle County and Delaware compared unfavorably to the national average for HIV prevalence.
• New Castle County compared unfavorably to state and national averages for chlamydia.
Maternal and Child Health
Exhibit 42: Low Birthweight Births by Race and Ethnicity, 2016-2022
Source: University of Wisconsin Population Health Institute, County Health Rankings. 2016-2022.
Description
Exhibit 42 presents the 2016-2022 average percentage of live births where the infant weighed less than 2,500 grams (approximately 5 pounds, 8 ounces) by race and by Hispanic origin. Light grey shading indicates measures that are above the U.S. average for low birthweight births of all races and ethnicities.
Observations
• Between 2016-2022, New Castle County and Delaware had higher percentages of low-birth weight babies for all races and ethnicities combined compared to the U.S.
• Low birthweight births for non-Hispanic Black residents were significantly higher for all areas presented compared to the U.S. average for low birthweight babies of all races and ethnicities.
Exhibit 43: Number of Births (per 1,000 female population), Age 15-19, 2016-2022 Area
15-19
Source: Centers for Disease Control and Prevention, CDC - National Vital Statistics System. Accessed via County Health Rankings. 2016-2022
Description
Exhibit 43 presents the seven-year average (2016-2022) number of births per 1,000 female population age 15-19 by race and Hispanic origin.
Observations
• Between 2016-2022, average rates for teen mothers giving birth were lower in New Castle County and Delaware for all races and ethnicities combined compared to the U.S.
• Rates for non-Hispanic Black and Hispanic (or Latino) teen mothers giving birth were four times that of non-Hispanic White teen mothers in New Castle County.
Exhibit 44: Infant Mortality Rates (per 1,000 live births) by Race and Ethnicity, 2019-2021
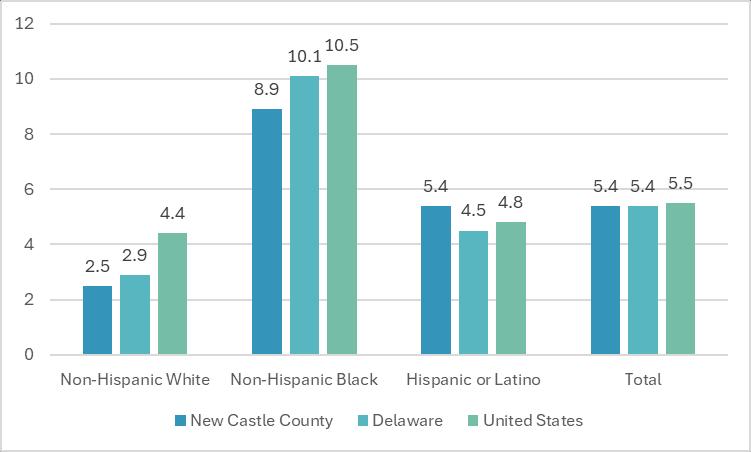
Source: National Center for Health Statistics, National Vital Statistics System, Mortality, 2019-2021.
Description
Exhibit 44 compares infant mortality rates in New Castle County, Delaware, and the United States by race and ethnicity.
Observations
• In 2019-2021, infant mortality rates for non-Hispanic Black populations have been more than three times those for non-Hispanic White populations in New Castle County, Delaware, and the U.S.
• Infant mortality rates for Hispanic (or Latino) populations in New Castle County and Delaware were more than double that of non-Hispanic White populations.
Centers for Disease Control and Prevention PLACES
Exhibit 45: CDC PLACES, Health Outcomes Measure, 2023
Source: CDC, 2023, and Verité analysis
Exhibit 45: CDC PLACES, Health Outcomes Measure, 2023 (continued)
Source: CDC, 2023, and Verité analysis.
Description: Exhibits 45 through 49 present CDC’s PLACES data. PLACES data are derived from BRFSS and are available for every U.S. ZIP Code, census tract, county, and state. Thirty measures are grouped into five categories: Health Outcomes (13 measures), Prevention (10 measures), Health Risk Behaviors (4 measures), Health Status (3 measures), and Disability (7 measures). Light grey shading highlights indicators found to be worse than the national average; dark grey shading highlights indicators more than 50 percent worse.
Exhibit 45 provides data that underlie the Health Outcomes Measure and compares indicators to national averages.16
Observations
• In 2023, eight (8) of thirteen (13) health outcomes indicators for Community 1 ZIP Codes compared unfavorably to New Castle County and U.S. averages, including indicators for all teeth lost 65+, chronic kidney disease, COPD, current asthma, diabetes, high blood pressure, obesity, and stroke.
• All health outcomes indicators for Community 2 ZIP Codes compared favorably to U.S. averages.
• In Wilmington ZIP Code 19801, rates of all teeth lost 65+ and diabetes were more than 50 percent above U.S. rates.
• Current asthma, diabetes, high blood pressure, and obesity rates were higher in New Castle County than U.S. rates.
16 https://www.cdc.gov/places/methodology/index.html
Exhibit 46: CDC PLACES, Prevention Measure, 2023
Source: CDC, 2023, and Verité analysis
Exhibit 46: CDC PLACES, Prevention Measure, 2023 (continued)
Source: CDC, 2023, and Verité analysis.
Description
Exhibit 46 provides data that underlie the Prevention Measure and compares indicators to national averages.
Observations
• In 2023, rates for cervical cancer screening, mammogram, preventive services for men and women, and compliance with high blood pressure medications were comparatively worse in New Castle County than the U.S.
• Community 1 ZIP Codes compared unfavorably to U.S. averages for eight (8) of ten (10) prevention measure indicators.
Exhibit 47: CDC PLACES, Health Risk Behaviors Measure, 2023
CDC, 2023, and Verité analysis.
Description
Exhibit 47 provides data that underlie the Health Risk Behaviors Measure and compares indicators to national averages.
Observations
• In 2023, rates for current smoking, physical inactivity, and sleep compared unfavorably to national rates in New Castle County and Community 1 ZIP Codes.
• Smoking rates were more than 50 percent worse than national averages in Wilmington/Community 1 ZIP Codes 19801 and 19802.
Exhibit 48: CDC PLACES, Health Status Measure, 2023
Source: CDC, 2023, and Verité analysis.
Description
Exhibit 48 provides data that underlie the Health Status Measure and compares indicators to national averages.
Observations
• In 2023, the combined ZIP Codes of Community 1 compared unfavorably to national averages for all three health status measures.
Exhibit 49: CDC PLACES, Disability Measure, 2023
Source: CDC, 2023, and Verité analysis.
Description
Exhibit 49 provides data that underlie the Disability Measure and compares indicators to national averages.
Observations
• In 2023, Community 1 ZIP Codes had comparatively worse disability rates for all types except hearing disability.
• ZIP Codes 19801 and 19802 had disability rates more than 50 percent above U.S. averages for several disability types.
Youth Risk Behavior Surveillance System (YRBSS)
Exhibit 50: Youth Risk Behavior Survey, Delaware High School Students, 2021
Source: Centers for Disease Control and Prevention, 2021, and University of Delaware, 2021.
Description
Exhibit 50 presents The Centers for Disease Control and Prevention’s Youth Risk Behavior Surveillance System (YRBSS) data for Delaware and the United States. YRBSS monitors priority health behaviors and experiences among students nationwide.
Observations
• In 2021, Delaware youth rates of distracted driving, marijuana use, high risk sexual behaviors, and physical inactivity compared unfavorably to U.S. averages.
Medically Underserved Areas and Populations
Exhibit 51: Locations of Medically Underserved Areas, 2025
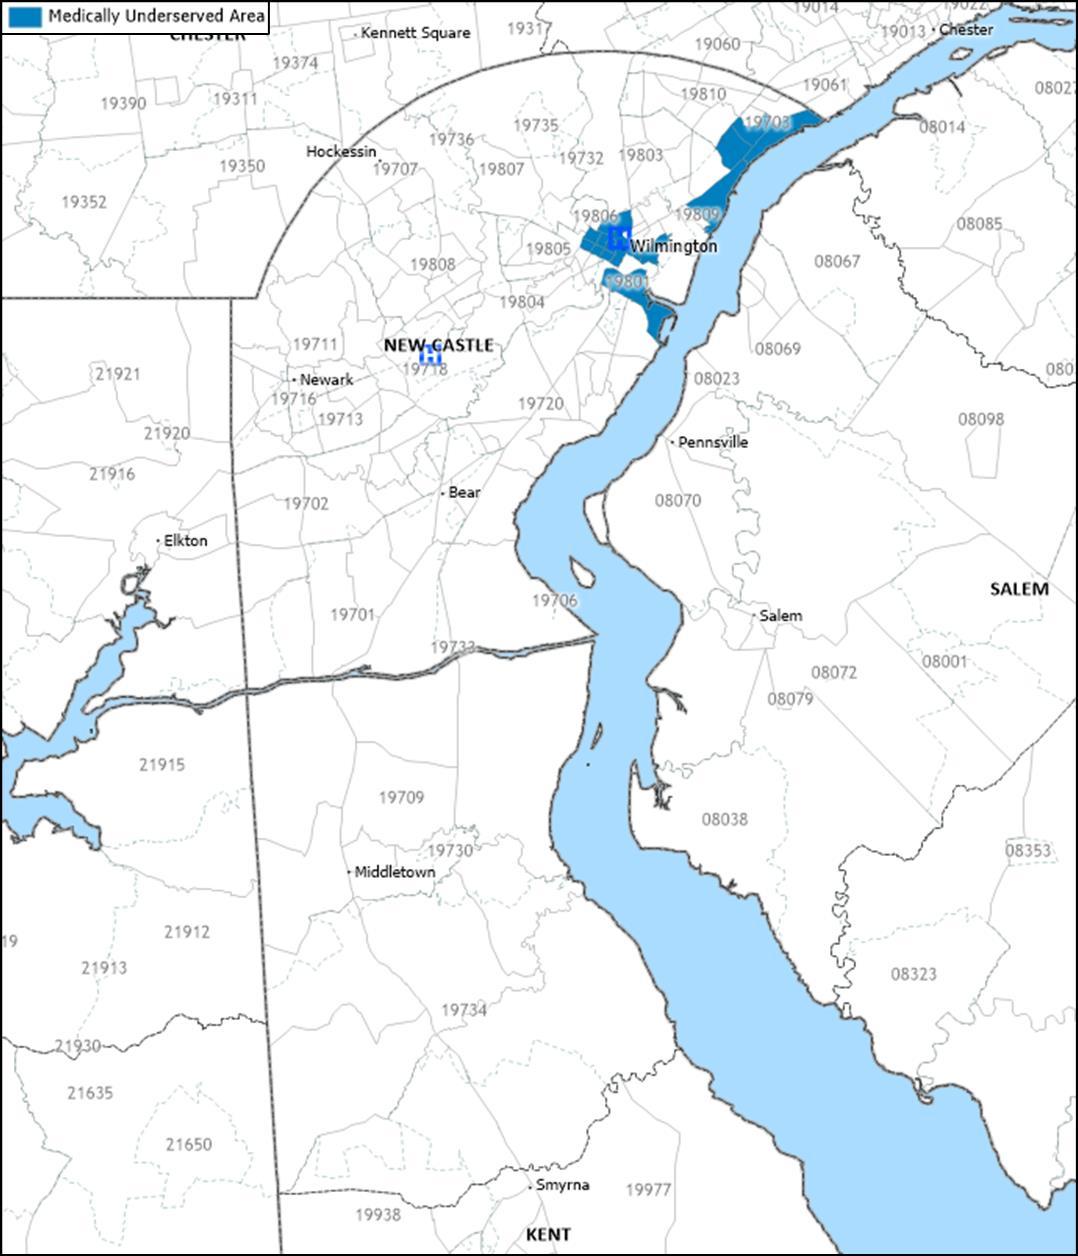
Source: Health Resources and Services Administration, 2025 and Caliper Maptitude, 2024.
Description
Exhibit 51 identifies the location of Medically Underserved Areas (MUAs) and Medically Underserved Populations (MUPs).
Medically Underserved Areas and Populations (MUA/Ps) are designated by HRSA based on an “Index of Medical Underservice.” The index includes the following variables: ratio of primary medical care physicians per 1,000 population, infant mortality rate, percentage of
the population with incomes below the poverty level, and percentage of the population age 65 or over.17 Areas with a score of 62 or less are considered “medically underserved.”
Populations receiving MUP designation include groups within a geographic area with economic barriers or cultural and/or linguistic access barriers to receiving primary care. If a population group does not qualify for MUP status based on the IMU score, Public Law 99-280 allows MUP designation if “unusual local conditions which are a barrier to access to or the availability of personal health services exist and are documented, and if such a designation is recommended by the chief executive officer and local officials of the state where the requested population resides.”18
Observations
• In 2025, census tracts designated as Medically Underserved Areas were present in Community 1 in areas proximate to Wilmington Hospital, and in the northern area of Community 2 (Claymont ZIP Code 19703 and Wilmington ZIP Code 19809).
17 Heath Resources and Services Administration. See http://www.hrsa.gov/shortage/mua/index.html
18Ibid.
Henrietta
Henrietta
Health Professional Shortage Areas
Exhibit 52: Health Professional Shortage Areas (HPSAs), 2025
Description
Exhibit 52 identifies the locations of federally designated primary care, mental health and dental health, Health Professional Shortage Areas (HPSAs).
A geographic area can be designated a HPSA if a shortage of primary medical care, dental care, or mental health care professionals is found to be present. In addition to areas and populations that can be designated as HPSAs, a health care facility can receive federal HPSA designation and an additional Medicare payment if it provides primary medical care services to an area or population group identified as having inadequate access to primary care, dental, or mental health services.
HPSAs can be: “(1) An urban or rural area (which need not conform to the geographic boundaries of a political subdivision, and which is a rational area for the delivery of health services); (2) a population group; or (3) a public or nonprofit private medical facility.”19
Observations
• Westside Family Healthcare and Henrietta Johnson Medical Center were HPSA designated Federally Qualified Health Centers (FQHC) for primary care, mental health, and dental health professionals.
• The low-income populations of Wilmington, Stanton, and Newark have been designated as HPSAs for primary care, dental health, and mental health.
19 U.S. Health Resources and Services Administration, Bureau of Health Professionals. (n.d.). Health Professional Shortage Area Designation Criteria. Retrieved 2012, from http://bhpr.hrsa.gov/shortage/hpsas/designationcriteria/index.html
Findings of Other Assessments
Delaware State Health Improvement Plan, 2022-2023
The Delaware Department of Health and Social Services, Division of Public Health (DPH) completed a state health needs assessment (SHA) of the state of Delaware with support from the University of Delaware Epidemiology Program and the Partnership for Healthy Communities The 2022-2023 SHA, conducted from September 2022 to June 30, 2023, appraised community health needs through a multi-pronged approach by using interviewer-administered surveys, hosting community conversations, and forming a statewide partnership coalition. The assessment was designed to compare Delaware’s health to the health of the nation and to determine the health needs of Delaware residents.
The Delaware SHA identified and prioritized local and statewide strategies that address critical health needs. This data was gathered with four nationally recognized Mobilizing for Action through Planning and Partnerships assessments: forces of change, local public health assessment, community themes and strengths, and community health status. As of October 2023, the Delaware SHIP priorities are:
• Chronic Diseases including heart disease, cancer, and diabetes with recommendations related to system-wide policy change that address the social determinants of health.
• Health in all Policies with recommendations related to incorporating health considerations into decision making across all sectors and policy areas.
• Maternal and Child Health with recommendations prioritizing improvements in teen pregnancy, premature births, and low birth weight infants, education, and increasing access to preventive services.
• Mental Health with recommendations prioritizing improving access to behavioral and mental health services.
• Social Determinants of Health with recommendations to utilize a policy, system, environmental (PSE) approach to address social determinants.
• Social Marketing with recommendations to utilize social marketing as a component of a comprehensive approach to prevent disease, improve health, and gain public support.
• Substance Use Disorder with recommendations to reduce tobacco, tobaccosubstitute, and other substance use.
The Delaware Health Improvement Plan for 2022-2023 can be accessed at www.delawareship.org.
Delaware Health Literacy Report, 2023
In 2023, the Delaware Division of Public Health (DPH), under the charge of the Delaware Department of Health and Social Services, and in partnership with ChristianaCare and the University of Delaware Health Sciences, published the Delaware Health Literacy Report to address health literacy deficiencies statewide. Ensuring that patients and loved ones understand health information is vital to positive medical outcomes. Following a study of the health literacy landscape within Delaware, many of the stakeholders coalesced to
create the Health Literacy Council of Delaware (HLC) which consolidated proposals and suggestions from the study into the following goals and objectives:
• Goal 1: Operationalize, bolster, and institutionalize the Health Literacy Council of Delaware.
o Objective 1: Create the vision and mission and adopt initial core goals and objectives as part of the HCL workflow.
o Objective 2: Establish HLC infrastructure to include the functions and roles that serve the council.
o Objective 3: Develop, sanction, and implement a statewide strategic plan.
• Goal 2: Increase urgency and awareness around health literacy across Delaware.
o Objective 1: Create an awareness campaign that establishes health literacy as a priority in the state.
o Objective 2: Develop and promote potential legislation, as well as organizational policy/processes, to incorporate health literacy awareness, strategies, and practices into educational systems, state systems, anchor organizations, and large CBOs.
o Objective 3: Host a yearly convening to include national advisors.
• Goal 3: Develop universal and standardized educational strategies that reach individuals, families, providers, and systems of care. Initial emphasis will be placed on hospital systems, FQHCs, anchor CBOs, health insurance providers, educational pipelines, and consumers.
o Objective 1: Develop a statewide training system on health literacy that includes hospital systems, FQHCs, anchor CBOs, health insurance providers, educational pipelines, and consumers.
o Objective 2: Identify and promote educational resources that support hospital systems, FQHCs, anchor CBOs, health insurance providers, educational pipelines, and consumers.
o Objective 3: Develop funding pipelines through grants and other resources for partner deployment of health literacy initiatives.
Delaware’s Maternal and Child Health Five-Year Plan, 2020-2025
For the federal Title V program, Delaware conducts a 5-year needs assessment to identify maternal and child health (MCH) priorities. The mission of Delaware MCH Program is to address the needs of women and children, supporting them when and where they are most vulnerable. The seven 2020-2025 MCH priorities for Delaware are as follows:
• Women and Maternal Health
o Goal 1.1: Increase the percentage of women with a birth interval that is greater than 18 months.
o Goal 1.2: Increase the number of Healthy Women Healthy Babies Zone mini grantees who are focused on MCH in high-risk areas.
o Goal 1.3: Increase the number of women receiving a timely postpartum visit.
o Goal 1.4: Decrease disparities in the infant mortality rate between Black and White populations.
• Perinatal and Infant Health
o Goal 2.1: Increase breastfeeding initiation rates in Delaware.
• Child Health
o Goal 3.1: Increase the percentage of children ages 9 to 71 months, who receive a developmental screening using a validated parent-completed screening tool.
o Goal 4.1: Increase the percentage of children, ages 1 to 17, who receive an annual preventive dental visit.
• Adolescent Health
o Goal 5.1: Increase the percentage of adolescent students who are physically active at least 60 minutes a day.
o Goal 6.1: Develop a cross-system partnership and protocols to increase the percentage of adolescents receiving annual preventive services.
• Children with Special Health Care Needs
o Goal 7.1: Increase the percentage of families reporting that their insurance for children and youth with special health care needs is adequate and affordable.
o Goal 7.2: Increase the number of health plans that have member services staff linked to relevant family organizations and programs to meet the needs of children and youth with special health care needs.
• Cross-Cutting/Systems Building
o Goal 8.1: Build MCH capacity and support the development of a trained, qualified workforce by providing professional development opportunities.
o Goal 8.2: All MCH staff will include at least one annual professional development goal in their performance plan to build capacity address community needs.
APPENDIX C – COMMUNITY INPUT PARTICIPANTS
Exhibit 53: Community Input Participant Affiliations
Organization
AIDS Delaware
AmeriCorps National Health Corps
Boys and Girls Club of Delaware
Central YMCA
Child, Inc.
ChristianaCare Center for Special Health Care Needs
ChristianaCare EmpowerU
Claymont Community Center
Delaware Health and Social Services, Division of Medicaid & Medical Assistance
Delaware Health and Social Services, Division of Substance Abuse and Mental Health
Delaware Health and Social Services, Office of the Secretary - Administration
Friendship House
Good Neighbors
Habitat for Humanity of New Castle County
Healthy Communities Delaware
Henrietta Johnson Medical Center
Holy Angels Church
Impact Life
Route 9 Library and Innovation Center
St. Patrick's Center
William Hicks Anderson Community Center
WRK Group - Kingswood
YMCA of Delaware
YWCA Delaware
APPENDIX D – CHSI PEER COUNTIES
County Health Rankings has assembled community health data for all 3,143 counties in the United States. Following a methodology developed by the Centers for Disease Control’s Community Health Status Indicators Project (CHSI), County Health Rankings also publishes lists of “peer counties,” so comparisons with peer counties in other states can be made. Each county in the U.S. is assigned 30 to 35 peer counties based on 19 variables including population size, population growth, population density, household income, unemployment, percent children, percent elderly, and poverty rates Exhibit 54 lists peer counties for New Castle County, Delaware.
Arapahoe County, Colorado
Gilpin County, Colorado
Clay County, Florida
St. Johns County, Florida
Seminole County, Florida
Floyd County, Indiana
Leavenworth County, Kansas
Campbell County, Kentucky
Kenton County, Kentucky
St. Tammany Parish, Louisiana
DeSoto County, Mississippi
Clay County, Missouri
Platte County, Missouri
Strafford County, New Hampshire
Iredell County, North Carolina
Cleveland County, Oklahoma
Washington County, Oregon
Newport County, Rhode Island
York County, South Carolina
Rutherford County, Tennessee
Sumner County, Tennessee
Galveston County, Texas
Hays County, Texas
Henrico County, Virginia
Prince George County, Virginia
Chesapeake City, Virginia
Williamsburg City, Virginia
Clark County, Washington
Jefferson County, West Virginia
Pierce County, Wisconsin
Exhibit 54: CHSI Peer Counties
New Castle County
Pinal County, Arizona
Butler County, Ohio
APPENDIX E – IMPACT EVALUATION
CHNA Activities
ChristianaCare’s Delaware hospital facilities prioritized the following significant community health needs to be addressed in the 2022-2024 Implementation Strategy:
• Access to Health Services,
• Chronic Health Conditions,
• Maternal and Child Health
• Mental Health and Substance Use Disorders,
• Social Determinants of Health, and
• Violent Crime.
All but chronic health conditions were also identified as significant health needs in our 2019 CHNA. These needs are complex and driven by inequities related to poverty and race. While progress can be made addressing each of these areas of need, we cannot expect a simple or immediate fix to such intractable issues.
As will be demonstrated throughout this section, there are no steadfast boundaries between the significant health needs. Our most vulnerable community members have needs in multiple areas. While we categorized each program as addressing a specific need, there will be multiple needs addressed by some of our programs. We also deploy common strategies such as promoting access and addressing social determinants of health to address each area of need. Finally, many of our programs were developed in partnership with community organizations. These partnerships provide comprehensive support for our patients to help them successfully address their needs. We are grateful to our community partners for their service to our communities and their expertise in addressing community needs.
Access to Health Services
ChristianaCare is committed to providing radical convenience so that all our neighbors, including those with the most barriers to accessing health services, can prioritize their health.
ChristianaCare operates 26 school-based health centers (SBHC) throughout New Castle County in elementary, middle, and high schools. An additional 3 SBHC were opened since the completion of our prior CHNA in 2022. The convenience provided by SBHC along with the opportunity to address health issues at the earliest and most preventable stages not only supports access to care, but also health equity. 22 of the 26 SBHC are also served by embedded ChristianaCare Community Health Workers (CHW) who connect students and their families to needed medical services and community resources.
Since 2021, ChristianaCare has operated an on-site primary care office at the New Castle County Hope Center, a former hotel repurposed to serve as an emergency shelter for families and individuals experiencing homelessness. Services include acute illness management, chronic disease management, prenatal care, pediatric and newborn care, and contraceptive management. Since 2023, ChristianaCare has also partnered with the
Hope Center to provide a Medical Respite Program encompassing thirty-six rooms at the Hope Center. These rooms serve patients who do not require care in a hospital setting, but whose complex illnesses make them ineligible for residing at a standard housing shelter. ChristianaCare CHWs also work with these patients to address their social and health needs.
For decades, ChristianaCare’s dental clinic has provided comprehensive care, including oral surgery, restorative dentistry, endodontics, periodontics, pediatric dentistry, prosthetics, implants, and oral medicine for uninsured and underinsured individuals. Every Friday, the dental clinic serves uninsured and Medicaid pediatric patients. Fees at the clinic are kept at a reduced level and only Medicaid is accepted. The residents serving the dental clinic also provide dental service in the community through rotations at affiliated dental clinics at Westside Family Healthcare, a Federally Qualified Health Center, and Delaware Technical Community College. Further, because accessing dental care is such a challenge for residents of New Castle County and the state, caregivers at the Dental Clinic continuously strive for internal improvements to increase access and better serve the community.
In June 2022, ChristianaCare introduced two mobile health services vans supported by a $1 million investment from Barclays. Within the vans, patients may receive adult care, women’s health, pediatrics, vaccines, and more. ChristianaCare partnered with community organizations to routinely station a van at their locations to ensure community members are taking advantage of this resource located in a familiar place. As of 2024, one of our vans is stationed at least once a month on a regular schedule at 6 locations in Wilmington’s 19801 and 19802 zip codes, including across the street from our Wilmington Campus, as well as at 1 location each in New Castle and Claymont. ChristianaCare’s mobile health services are also available downstate on a regular rotation serving Dover twice a month and Laurel once a month. Community members and organizations may also request vans at community events throughout the state.
Location and availability are not the only impediments to accessing health services. To address the complex social barriers inhibiting access to health services, we have employed and significantly expanded our Health Guide and Community Health Worker programs in the last several years. ChristianaCare Health Guides connect patients to health care services and community resources and assist in health insurance and prescription assistance enrollment and financial assistance applications. The Health Guides are based in the Wilmington Hospital and since the writing of the last CHNA, they are now embedded at several ChristianaCare primary care practices. Bi-lingual Health Guides are employed to better serve the needs of our patient populations. The Health Guides also routinely attend community events to provide information and services to the community.
Community Health Workers (CHWs) connect patients to care, they work to address patients’ social needs, and they help patients identify and achieve patient centered goals. CHWs are valuable members of a patient’s care team because our caregivers recognize the outsized role social needs have on health. ChristianaCare utilizes CHWs to address each of the significant health needs prioritized in our 2022 – 2024 Implementation Strategy
Chronic Health Conditions
In partnership with Lutheran Community Services, ChristianaCare has offered the Delaware Food Farmacy since 2021. The Delaware Food Farmacy is a 6-month food as medicine CHW program for primary care patients with diabetes, hypertension, and/or heart failure and food insecurity. Patients receive weekly medically tailored groceries for them and their households, and CHWs assist patients with goal setting and improving dietary knowledge and culinary skills. From its launch in 2021 to January 2025, the Delaware Food Farmacy has provided a total of 195,610 meals to participating patients and their families.
ChristianaCare also created the Healthy Food Delivery program as an intervention for primary care patients who screen positive for food insecurity and are diagnosed with diabetes, hypertension, and/or congestive heart failure. Bi-weekly medically tailored groceries are delivered to patients’ homes by our partner organization Hungry Harvest. Just as with the Delaware Food Farmacy, the patients' entire households are fed through this program.
Our Primary Care CHW program serves ChristianaCare’s primary care patients with Medicaid, Medicare, or uninsured and with diabetes, hypertension, and/or high Emergency Department utilization or at least one inpatient stay. This six-month program utilizes an evidence-based approach to improve health outcomes and increase health literacy.
ChristianaCare’s Women’s Health CHW program also addresses chronic conditions to improve maternal and child health. Pregnant and postpartum patients with chronic disease, mental health and/or substance use issue(s), late/no entry to prenatal care, history of poor birth outcomes, a BMI at/above 30, and/or are at-risk for birth defects are eligible for this program. CHWs work with patients to address their social needs to provide a comprehensive approach to improving health of the mother and child during and after pregnancy.
Maternal and Child Health
Disparities among infant mortality, maternal mortality, and low-birth weights persist in New Castle County and Delaware despite the overall decrease in these rates. ChristianaCare continues to address these disparities through targeted and comprehensive efforts that consider the patients’ health and social needs. ChristianaCare caregivers also lead and participate in statewide collaborative efforts such as the Delaware Healthy Mother and Infant Consortium (DHMIC) and the Maternal Mortality Review Panel and the Fetal & Infant Mortality Review to address maternal and infant mortality.
In addition to the Women’s Health CHW program, ChristianaCare, in partnership with the Delaware Division of Public Health, offers the Home Visiting CHW Program (formerly Health Ambassadors Program). The state funded Home Visiting CHW program addresses infant mortality by serving pregnant people and families with children aged 0 to 5 in targeted high-risk zip codes through connections to health care, social services, home visiting, educational programs, and the promotion of key maternal and child health messaging.
Also in partnership with the Delaware Division of Public Health, ChristianaCare offers the Healthy Women Healthy Babies (HWHB) Program. HWHB enrolls high risk women into preconception, prenatal, and conception care. The current state funded program, HWHB 3.0, has a strong emphasis on the fourth trimester, the 12-week period after the birth of a baby. The ChristianaCare HWHB Healthy Beginnings team is addressing this critical area of women’s healthcare with the addition of a bilingual postpartum Health Educator
In January 2024, ChristianaCare launched the Women’s Health Delaware Food Farmacy, a 6-to-8-month food is medicine CHW program. Like the Primary Care Delaware Food Farmacy, the Women’s Health Delaware Food Farmacy partners with Lutheran Community Services to provide our pregnant patients and their family members with medically tailored groceries that are high in micronutrients critical for a healthy pregnancy. CHWs guide patients and their families through the health, social, and community services systems to foster health and well-being. CHWs also provide nutrition assessment, education, and ongoing support for dietary behavior changes and achieving goals for a healthier pregnancy.
Since 1995, ChristianaCare has also received state funding to offer Alliance for Adolescents Pregnancy Prevention (AAPP) educational programs. Through this program, Delaware youth gain the skills and information to help avoid or reduce involvement in high-risk behaviors, particularly high-risk sexual behaviors, and to promote positive youth development. Since FY2022, ChristianaCare caregivers have provided AAPP education to 2,304 youth in schools and community locations throughout Delaware.
Mental Health and Substance Use Disorders
ChristianaCare created the Behavioral Health CHW Program to serve adults and children and adolescents participating in outpatient behavioral health services and Project Recovery, an outpatient program offering treatment for substance use disorders. Patients who are engaged with those practices, residing in New Castle County, and have discussed at least one social care or community engagement goal are eligible to participate in the program.
ChristianaCare’s Project Engage is an early intervention and referral to substance use disorder treatment program. Project Engage employs peers in recovery to engage with inpatients and patients in the emergency department who are struggling with substance use disorder. The peers use motivational interviewing to empower each patient in the decision-making process, assisting them to take the critical first step to seek help for the substance use disorder. Peers connect these patients to treatment programs and other community resources. Since FY2022, Project Engage peers had a total of 7,469 patient engagements and made 4,081 referrals to treatment.
Since 2021, ChristianaCare’s Center for Community Health and Empowerment has partnered with the New Castle County Police Department (NCCPD) to divert individuals away from the criminal justice system and emergency departments when appropriate and connect individuals to care in the community. Serving with the police in a co-responder model, ChristianaCare mental health professionals respond to 911 calls and officer referrals when mental illness is believed to be a primary factor for police involvement. Additional ChristianaCare caregivers support the NCCPD’s Hero Help Program which addresses substance use disorder by supporting those seeking treatment. These
caregivers respond to non-fatal overdoses, provide outreach in the community, work with individuals to devise a treatment plan and obtain treatment, provide ongoing care management, and address any needs individuals may have that serve as barriers to obtaining treatment.
In March 2024, ChristianaCare launched a new police partnership with the Wilmington Police Department, the Wilmington Partners in Care Program. Like the NCCPD partnership, this program utilizes a co-responder model which pairs trained mental health clinicians with police officers who respond as a team to calls for service and conduct proactive outreach. In December 2024, ChristianaCare also began a new partnership with the Newark Police Department. These partnerships, supported by state, federal, and ChristianaCare funding, allow for effective interventions for community members who may otherwise not have access to the behavioral health services they need. It also provides much needed support to the police who are routinely confronted with the behavioral health needs of the community members.
ChristianaCare’s Community Substance Overdose Support (SOS), created in partnership with New Castle County in 2019, provides outreach to individuals with substance use disorder (SUD) living in New Castle County. SOS accepts self-referrals, internal referrals for ChristianaCare patients, and New Castle County EMS referrals. SOS peers go to individuals’ homes or other community locations and uses motivational interviewing techniques to encourage the individual to enter substance use disorder treatment. The SOS team will help the patient address any barriers to treatment and assist them with enrollment.
Social Determinants of Health
ChristianaCare developed and administers a Social Determinants of Health (SDOH) screening instrument for patients. It is helpful to know the challenges our patients face to better serve them and we strive to address those needs through internal resources and referrals to community resources. In the spring of 2023, ChristianaCare launched the Social Care Connection Center which serves as the umbrella organization for our Medicaid Engagement CHWs, Ambulatory Care Connectors, and Acute Care Connectors. The Medicaid Engagement team consists of CHWs that assist patients who are newly assigned to ChristianaCare to address social care needs and connect them with primary care appointments. These CHWs employ multiple methods to attempt to engage patients including going to the patient’s homes.
In FY2024, ChristianaCare screened 12,227 patients in primary care practices through Tonic, a self-administered SDOH screening. Positive screenings were sent to the Ambulatory Care Connectors for social care support. Acute Care Connectors perform SDOH screening at the bedside and address social care needs that may increase the possibility for readmission. ACCs are highly collaborative and bridge the care patients receive in the hospital with community support and resources. Acute Care Connectors screened 12,144 admitted patients in our two hospitals.
ChristianaCare also utilizes Unite Delaware, an electronic care coordination network to address patients’ social needs. In 2019, ChristianaCare partnered with Unite Us to launch Unite Delaware in our state. It is a free resource for any community-based organization to help connect Delawareans to available resources.
Since 2020, ChristianaCare has partnered with Roundtrip to provide transportation to medical services for eligible patients who have a transportation barrier. Since FY2022, over 40,000 rides have been provided to eligible patients.
ChristianaCare has also partnered with the Delaware Community Legal Aid Society, Inc. (CLASI) since 2015 to offer the Medical Legal Partnership (MLP). The MLP assists primary care patients who are at or below 400% of the Federal Poverty Level (FPL) with the mitigation of civil legal hardships. Patients receive assistance from the MLP to avoid eviction, successfully reinstate benefits, receive accommodation from their employer, and file protection from abuse (PFA) orders among other civil needs.
At ChristianaCare, we recognize that community organizations are serving our communities in ways that will ultimately have a positive impact on health. This is why we launched the Community Investment Fund in 2019 to support their work. Since its launch, ChristianaCare’s Community Investment Fund has provided more than $5.6 million to 64 organizations addressing social, behavioral, and environmental health factors shaping community health.
Violent Crime
In recognition of violence as a public health issue, ChristianaCare launched a Hospital Based Violence Intervention Program (HVIP) in February 2021 to support patients impacted by community violence to reduce recidivism of new and recurring injuries. HVIP employs CHWs who actively follow patients and assist in a magnitude of services postdischarge including follow-up care, connection to community resources, addressing social care needs, and identifying and achieving patient centered goals and outcomes. ChristianaCare also partnered with Nemours Children’s Health so that their eligible patients would have the opportunity to participate in our HVIP.
Since FY2022, ChristianaCare’s Trauma Department caregivers provided Stop the Bleed training to nearly 2,800 individuals at ChristianaCare campuses, schools, and community centers throughout Delaware. Stop the Bleed is a national awareness campaign that empowers bystanders with the knowledge and tools they need to recognize and stop lifethreatening bleeding.
Planning for 2026 and Beyond
At ChristianaCare, we are guided by our values of love and excellence. To be excellent, we seek new knowledge, ask for feedback and are open to change. This new CHNA provides us with the opportunity to once again consider our community needs, how we are effectively addressing those needs, and how we might adapt to better serve those needs which are not being met.