FIRST
Asset prices to push new records Asian Economic Monitor 8 March 2011
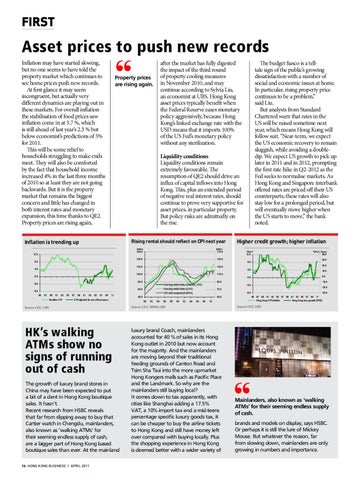
InflationInflation may have started slowing, after the market has fully digested The budget fiasco is a tellAsian Economic Monitor 8 March 2011 but no one seems to have told the the impact of the third round tale sign of the public’s growing property market toCPI roseProperty of for property coolingpolicies measures dissatisfaction with a number of pricesAdjusted What thewhich numberscontinues say: Headline 3.6%y/y in January. one-off government (i.e. Inflation, continued see home prices new records. waivers push on government rates and public housing rental), again. the underling in inflation continues2010, to trendand up, may rising November social and economic issues at home. are rising 3.2%y/y in Chart 5: Imported inflation on the riseto Sylvia Liu, Chart 6:In Rising import prices rising property price At first glance it January. may seem continue according particular, incongruent, but UBS. Hong continues to be a problem,” What theyactually mean: Invery most economies investors watch inflation to assesan theeconomist risk of shifts at in monetary policy. Kong 12.0 75.0 10.0 However, Hong has no out domestic to the peggedtypically exchange rate, rather it when 8.0 said Liu. different dynamics areKong playing in monetary policy due to its commitment asset prices benefit 80.0 imports the US Fed’s monetary policy regardless of local inflation. But 8.0 inflation is still very important to track, 6.0 85.0 these markets. For overall inflation therates Federal Reserve eases monetary But analysts from Standard 4.0 because Hong Kong occasionally experiences persistent, negative real interest that over-stimulate the domestic 90.0 4.0 2.0 the stabilisation of food prices saw policy aggressively, because Hong95.0 Chartered warn that rates in the economy. 0.0 0.0 inflation come in at 3.7 %, which Kong’s linked exchange rate with100.0 the -2.0 US will be raised sometime next 12-month outlook: Inflation is intensifying as we have projected. HKD weakness; rising Chinese inflation; -4.0 105.0 -4.0 -6.0 year, which means Hong Kong will is still ahead of lastasset year’ s 2.3 % means that it imports continued reflation andbut domestic credit expansion should continueUSD to drive the acceleration in both the100%110.0 -8.0 imported and domestic cost pressures. 5.0%Fed’ fromslast year’s 2.3%.policy 115.0 below economist’ s predictions of 5% We expect 2011 inflation to at least-8.0double of thetoUS monetary -10.0 follow suit. “Near-term, we expect 85 87 89 91 93 95 97 99 01 03 05 07 09 11 85 87 89 91 93 95 97 99 01 03 05 07 09 11 (LHS) for 2011. withoutHeadline anyCPIsterilization. the Import USPrice economic recovery to remain Asian Economic Monitor 8 March 2011 Index Import price from China HKD effective exchange rate (import weighted, RHS) This will be some relief to sluggish, while avoiding a doubleSource: CEIC, UBS Source: CEIC, UBS Inflation households struggling to make ends dip. We expect US growth to pick up Chart 1: Inflation is trending up Chart 2: Drivers ofLiquidity the headline CPIconditions meet. They will also be comforted Liquidity conditions remain later in 2011 and in 2012, prompting ChartCPI 7: Wage growth is gradually trending up… Chart 8: …reflecting an improving labour market Contribution to headline (percentage points) 12.0the numbers say: Headline CPI rose 3.6%y/y in January. Adjusted for one-off government favourable. policies (i.e. 4.0% by the What fact that household income extremely The the first rate hike in Q2-2012 as the Percent, inverted scale %YoY waivers on government rates and public housing rental), the underling inflation continues to trend up, rising 14.0 16.0As 14.0 -1.0 increased 4% in the last three months resumption of QE2 should drive an Fed seeks to normalise markets. 8.0 3.0% 3.2%y/y in January. 12.0 12.0 12.0 of 2010 so4.0at least they are not going influx of capital inflows into Hong10.0 1.0 Hong Kong and Singapore interbank 10.0 2.0% What they mean: In most economies investors watch inflation to asses the risk 8.0 of shifts in monetary policy. 8.0 8.0US backwards. But it is the property offered rates are priced off their Kong. This, plus an extended period 6.0 6.0 However, Hong Kong has no domestic monetary policy due to its commitment to the pegged exchange rate, rather it 3.0 1.0% 0.0 4.0 4.0 US Fed’sthe monetary policy regardless of local inflation. But inflation is4.0 stillnegative very important to track, marketimports that the remains biggest counterparts, these rates will also of real interest rates, should 2.0 2.0 5.0 0.0% -4.0 Hong Kong occasionally experiences persistent, negative real interest rates that over-stimulate the domestic because 0.0 0.0for 0.0 concern and little has changed in stay low for a prolonged period, but continue to prove very supportive economy. -2.0 -2.0 -1.0% 7.0 -4.0 -8.0 Food -4.0 Housing Utilities Durable Goods Transport property. Other both interest rates and monetary will eventually move higher when asset prices, in particular -4.0 85 outlook: 87 89 91 Inflation 93 95 is 97 intensifying 99 01 03 as05 we07 have 09 projected. 11 12-month HKD weakness; -2.0% -6.0 rising Chinese inflation; expansion, this time thanks to But policy risks admittedly on-6.0 9.0 85 the US starts to move,” the bank-8.0 Headline CPI and domestic CPI QE2. adjusted for one-off measures should continue to 87 89 91 93 97are 99 01 03 05 07 09 11 Aug-10 Oct-10 Nov-10 Dec-10 Jan-11 87 89 91 93 95 97 99 01 03 05 07 09 11 continued asset reflation credit expansion drive Sep-10 the85 acceleration in 95both the Headline CPI 2.3%. Nominal wage growth imported and domestic cost pressures. last year’s Unemployment rate (LHS) Nominal wage growth (RHS) Property prices are rising again,We expect 2011 inflation to at least double to 5.0% thefrom rise. noted.
Source: CEIC, UBS
Source: CEIC, UBS
Source: CEIC, UBS
Chart 3: The CPI basket
Inflation is trending Chart 1: Inflation is trending upup 12.0
ChartCPI 9: China CPI versus Hong Kong CPI Chart 2: Drivers of the headline Index Contribution to160.0 headline CPI (percentage points) 12.0 4.0% Food, 26.9 140.0
Others, 15.1
8.0 ervices, 16.2
3.0% 2.0%
4.0 0.0 -4.0
1.0% 0.0%
80.0
-8.0 87
89
91
Transport, 9.1
93
Headline CPI
95
97
99
01
03
05
07
09 29.2 11
CPI adjusted for one-off measures Utilities, 3.6
-2.0%
60.0
Food
40.0
Aug-10
110.0 90.0
-4.0 Housing rental index (24mma, LHS)
96 98 00 02 04 Sep-10 Jan-11 Kong inflation 90 92 Oct-10 94 96 Nov-10 98 Hong 00Dec-10 02CPI 04 06 08
06
10
Chart 4: Rising rental should reflect on CPI next year
HK’s walking ATMs show no signs of running out of cash
Index 160.0
16 HONG KONG BUSINESS | APRIL 2011
Food, 26.9
-10.0 -20.0 -30.0 85 87 89 91 93 95 97 99 01 03 05 07 09 11 Hong Kong CPI inflation Hong Kong loan growth (RHS)
UBS 10
UBS 11
Index 170.0
luxury brand Coach, mainlanders accounted for 40 % of sales in150.0 its Hong ervices, 16.2 account 120.0 Kong outlet in 2010 but now 130.0 100.0 for the majority. And the mainlanders 110.0 80.0 are moving beyond their traditional 90.0 rental index (24mma, LHS) feedingHousing grounds of Canton Road and Housing rental index (LHS) 60.0 70.0 CPI rent component (RHS) 29.2 Tsim Sha Tsui into the more upmarket 40.0 50.0 Transport, 9.1 Utilities, 3.6 90 Hong 92 94 Kongers 96 98 00 malls 02 04 such 06 08 as 10 Pacific Place and TheSource: growth CEIC, UBS of luxury brand stores in Source: CEIC, HKMA,the UBS Landmark. So why are the mainlanders still buying local? China may have been expected to put It comes down to tax apparently, a bit of a dent in Hong Kong boutique UBS 10 with cities like Shanghai adding a 17.5% sales. It hasn’t. VAT, a 10% import tax and a mid-teens Recent research from HSBC reveals percentage specific luxury goods tax, it that far from slipping away to buy that can be cheaper to buy the airline tickets Cartier watch in Chengdu, mainlanders, to Hong Kong and still have money left also known as ‘walking ATMs’ for over compared with buying locally. Plus their seeming endless supply of cash, the shopping experience in Hong Kong are a bigger part of Hong Kong based is deemed better with a wider variety of boutique sales than ever. At the mainland Others, 15.1
0.0
Source: CEIC, UBS Source: CEIC, UBS
Source: CEIC, HKMA, UBS
Chart 3: The CPI basket
10.0
0.0
-8.0
08 10 12 50.0 China CPI inflation
Source: UBSCEIC, UBS, Census & Statistics Dept Source: CEIC, UBS CEIC, HKMA, Source:
Source: CEIC, UBS Source: CEIC, UBS Source: CEIC, UBS
20.0
4.0
-4.0
70.0
Other
%YoY, 3mma 40.0 30.0
8.0
130.0
0.0
Housing
%YoY 12.0
150.0
4.0
Housing rental index (LHS) Utilities Durable Goods Transport -8.0 CPI rent component (RHS)
Higher credit growth; higher Chart 10: Higher credit growth; higher inflationinflation
Index 170.0
8.0
120.0 100.0
-1.0% 85
Source: CEIC, UBS
Chart 4:rental Rising rental should reflect reflect on CPI Rising should onnext CPIyear next year
140.0
Mainlanders, also known as ‘walking ATMs’ for their seeming endless supply of cash. brands and models on display, says HSBC. Or perhaps it is still the lure of Mickey Mouse. But whatever the reason, far from slowing down, mainlanders are only growing in numbers and importance.