White Paper i-heat
Efficient, Economical, Improves Wellness, Unique
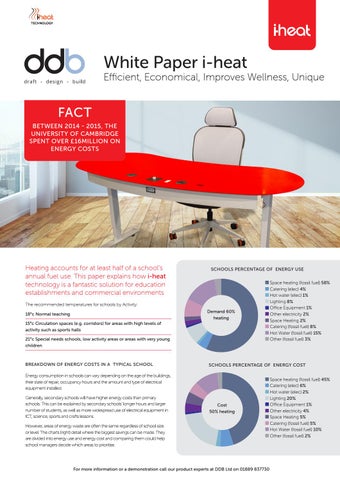
FACT BETWEEN 2014 - 2015, THE UNIVERSITY OF CAMBRIDGE SPENT OVER £16MILLION ON ENERGY COSTS
Heating accounts for at least half of a school’s annual fuel use. This paper explains how i-heat technology is a fantastic solution for education establishments and commercial environments
SCHOOLS PERCENTAGE OF ENERGY USE
The recommended temperatures for schools by Activity: Demand 60% heating
18°c Normal teaching 15°c Circulation spaces (e.g. corridors) for areas with high levels of activity such as sports halls 21°c Special needs schools, low activity areas or areas with very young children
BREAKDOWN OF ENERGY COSTS IN A TYPICAL SCHOOL
SCHOOLS PERCENTAGE OF ENERGY COST
Energy consumption in schools can vary depending on the age of the buildings, their state of repair, occupancy hours and the amount and type of electrical equipment installed. Generally, secondary schools will have higher energy costs than primary schools. This can be explained by secondary schools’ longer hours and larger number of students, as well as more widespread use of electrical equipment in ICT, science, sports and crafts lessons.
Space heating (fossil fuel) 58% Catering (elec) 4% Hot water (elec) 1% Lighting 8% Office Equipment 1% Other electricity 2% Space Heating 2% Catering (fossil fuel) 8% Hot Water (fossil fuel) 15% Other (fossil fuel) 3%
Cost 50% heating
However, areas of energy waste are often the same regardless of school size or level. The charts (right) detail where the biggest savings can be made. They are divided into energy use and energy cost and comparing them could help school managers decide which areas to prioritise.
For more information or a demonstration call our product experts at DDB Ltd on 01889 837730
Space heating (fossil fuel) 45% Catering (elec) 6% Hot water (elec) 2% Lighting 20% Office Equipment 1% Other electricity 4% Space Heating 5% Catering (fossil fuel) 5% Hot Water (fossil fuel) 10% Other (fossil fuel) 2%