2023 Real Estate Market Report
The Metro Area


ABOUT THE REPORT

This report was created to help give home sellers, buyers, and current owners a hyper-local snapshot into our community’s real estate market.
Being a real estate agent and Schumacher Place resident, I take special interest in the day-to-day market activity happening throughout the metro area neighborhoods. Included in this report is a summary of both sales activity for specific price points along with data for each neighborhood, showcasing how the market has changed over the past year.
Looking forward to 2024!
Happy to help, Seth
CAM TAYLOR ~ 2023 REAL ESTATE MARKET REPORT PAGE 2 *DATA SOURCE COURTESY OF COLUMBUS & CENTRAL OHIO MLS
PAGE
OF
MLS
3 *DATA SOURCE COURTESY
COLUMBUS &
CENTRAL OHIO
CAM TAYLOR ~ 2023 REAL ESTATE MARKET REPORT
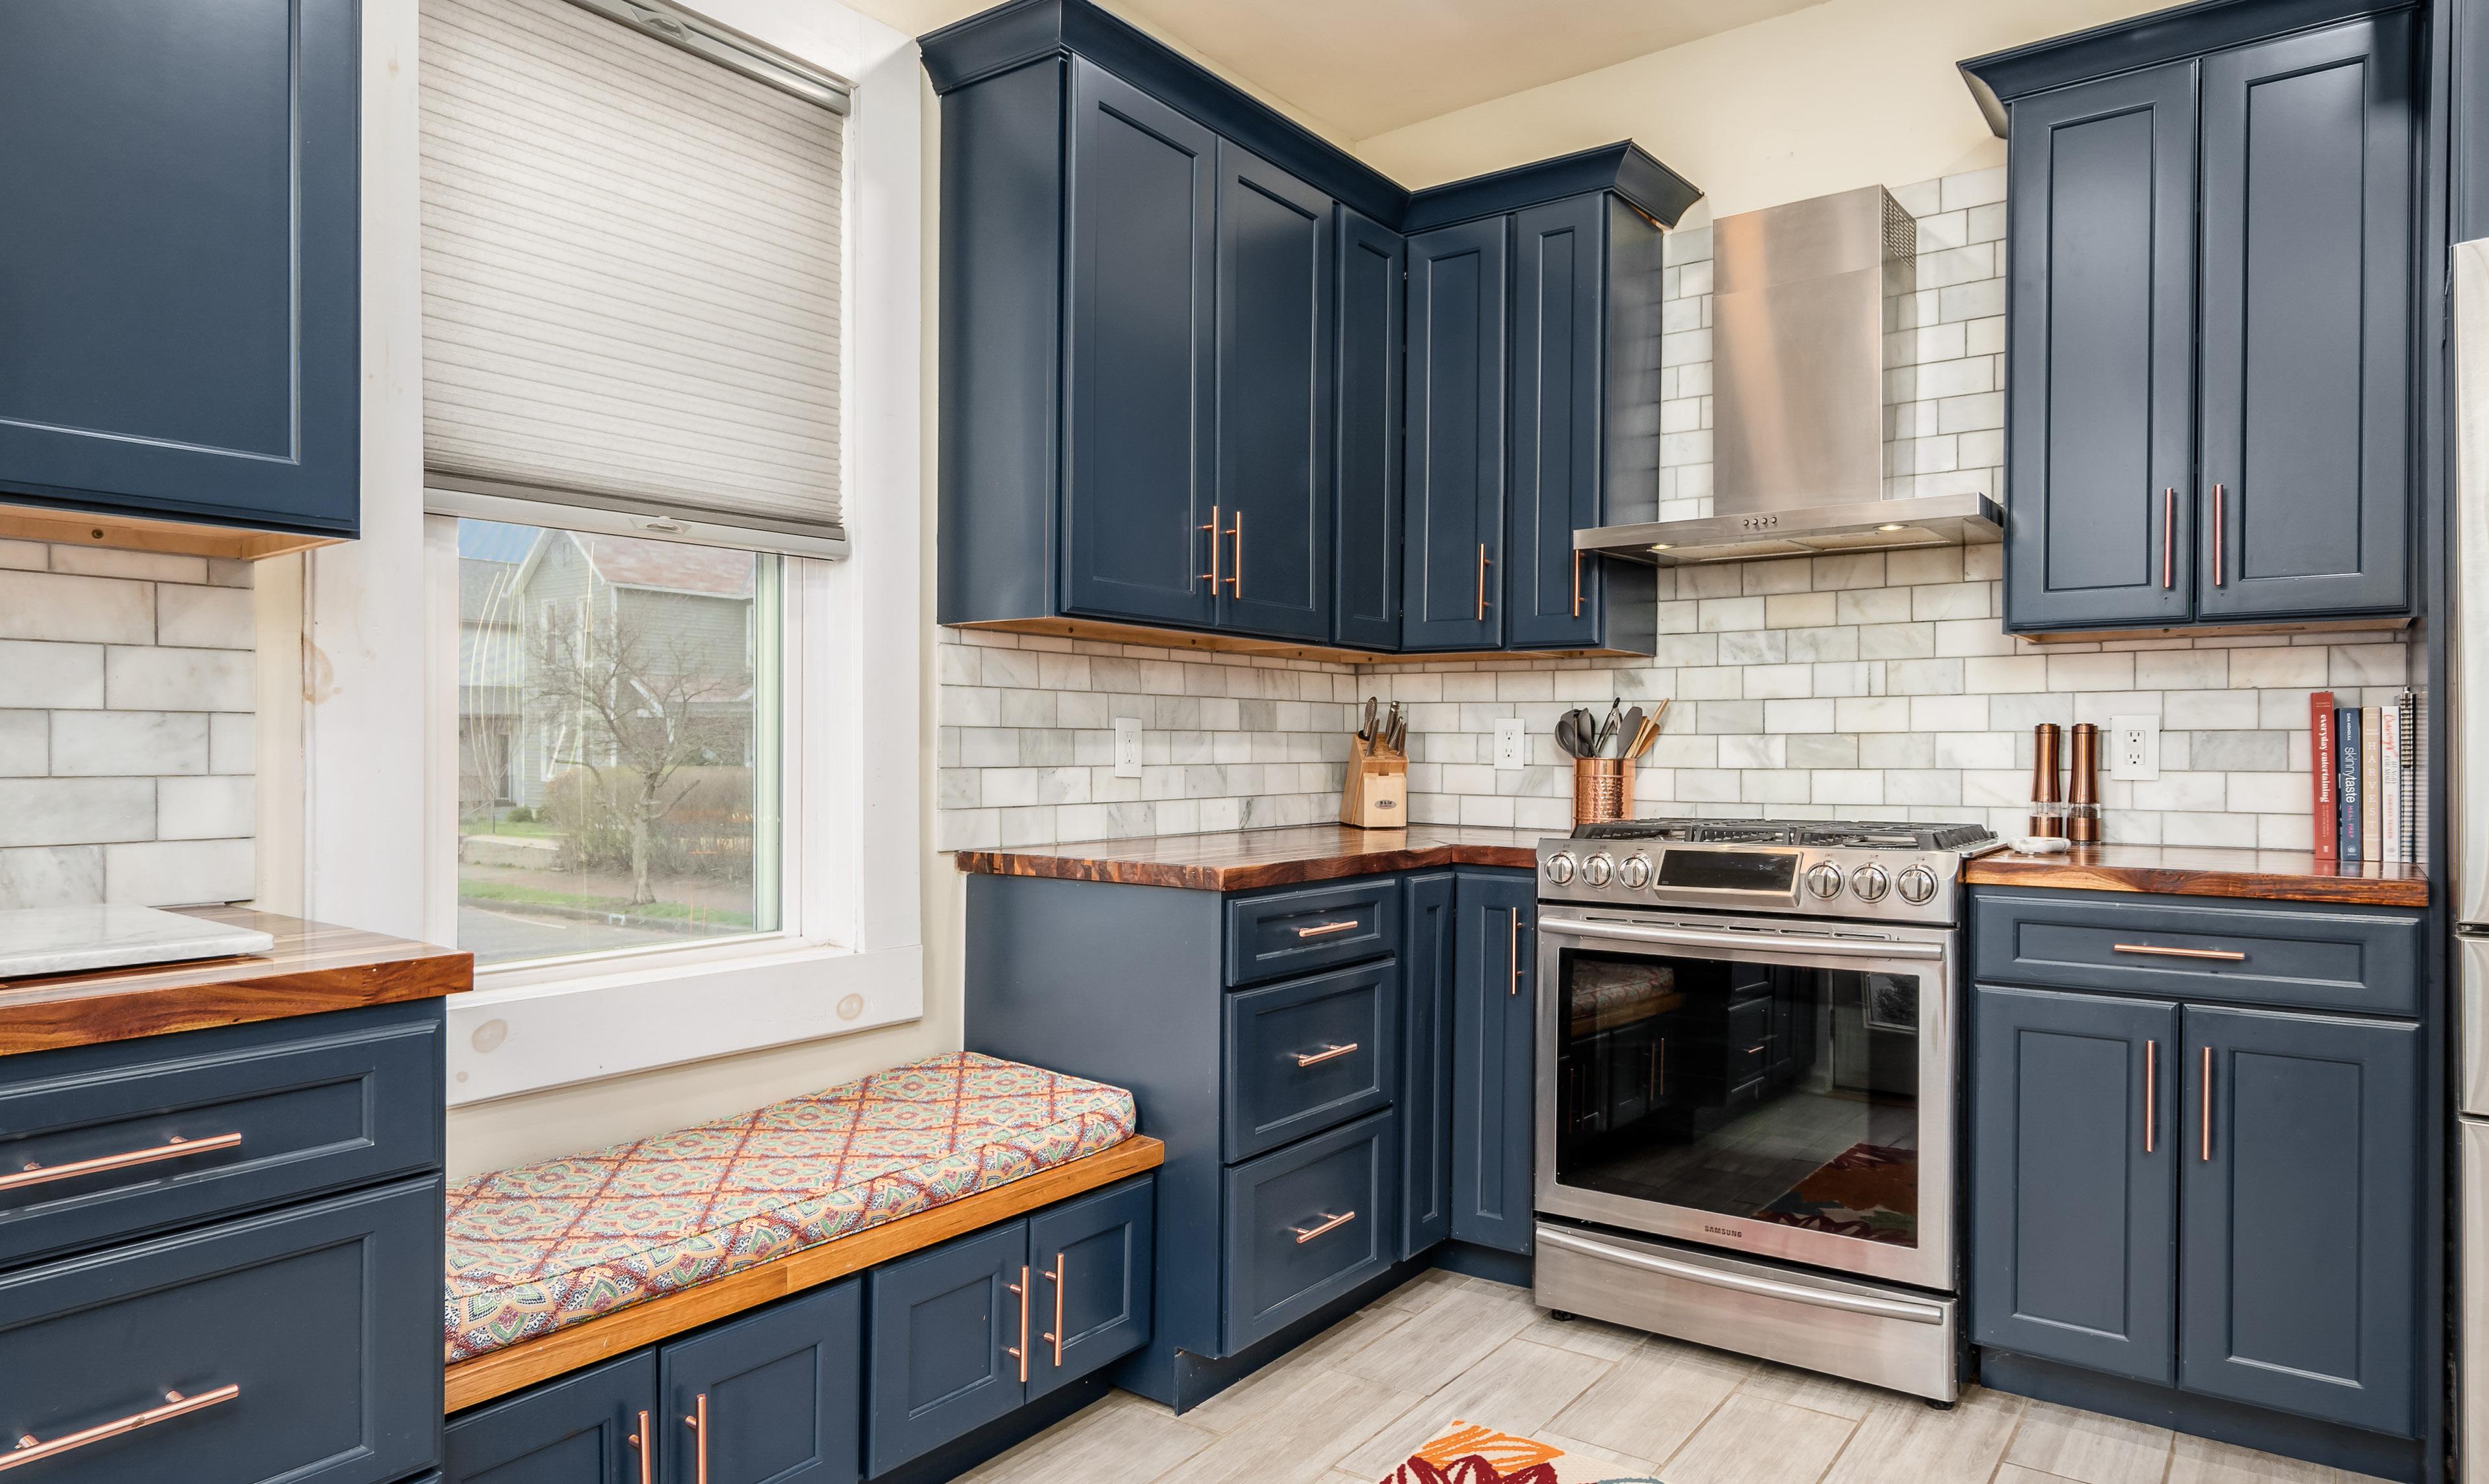
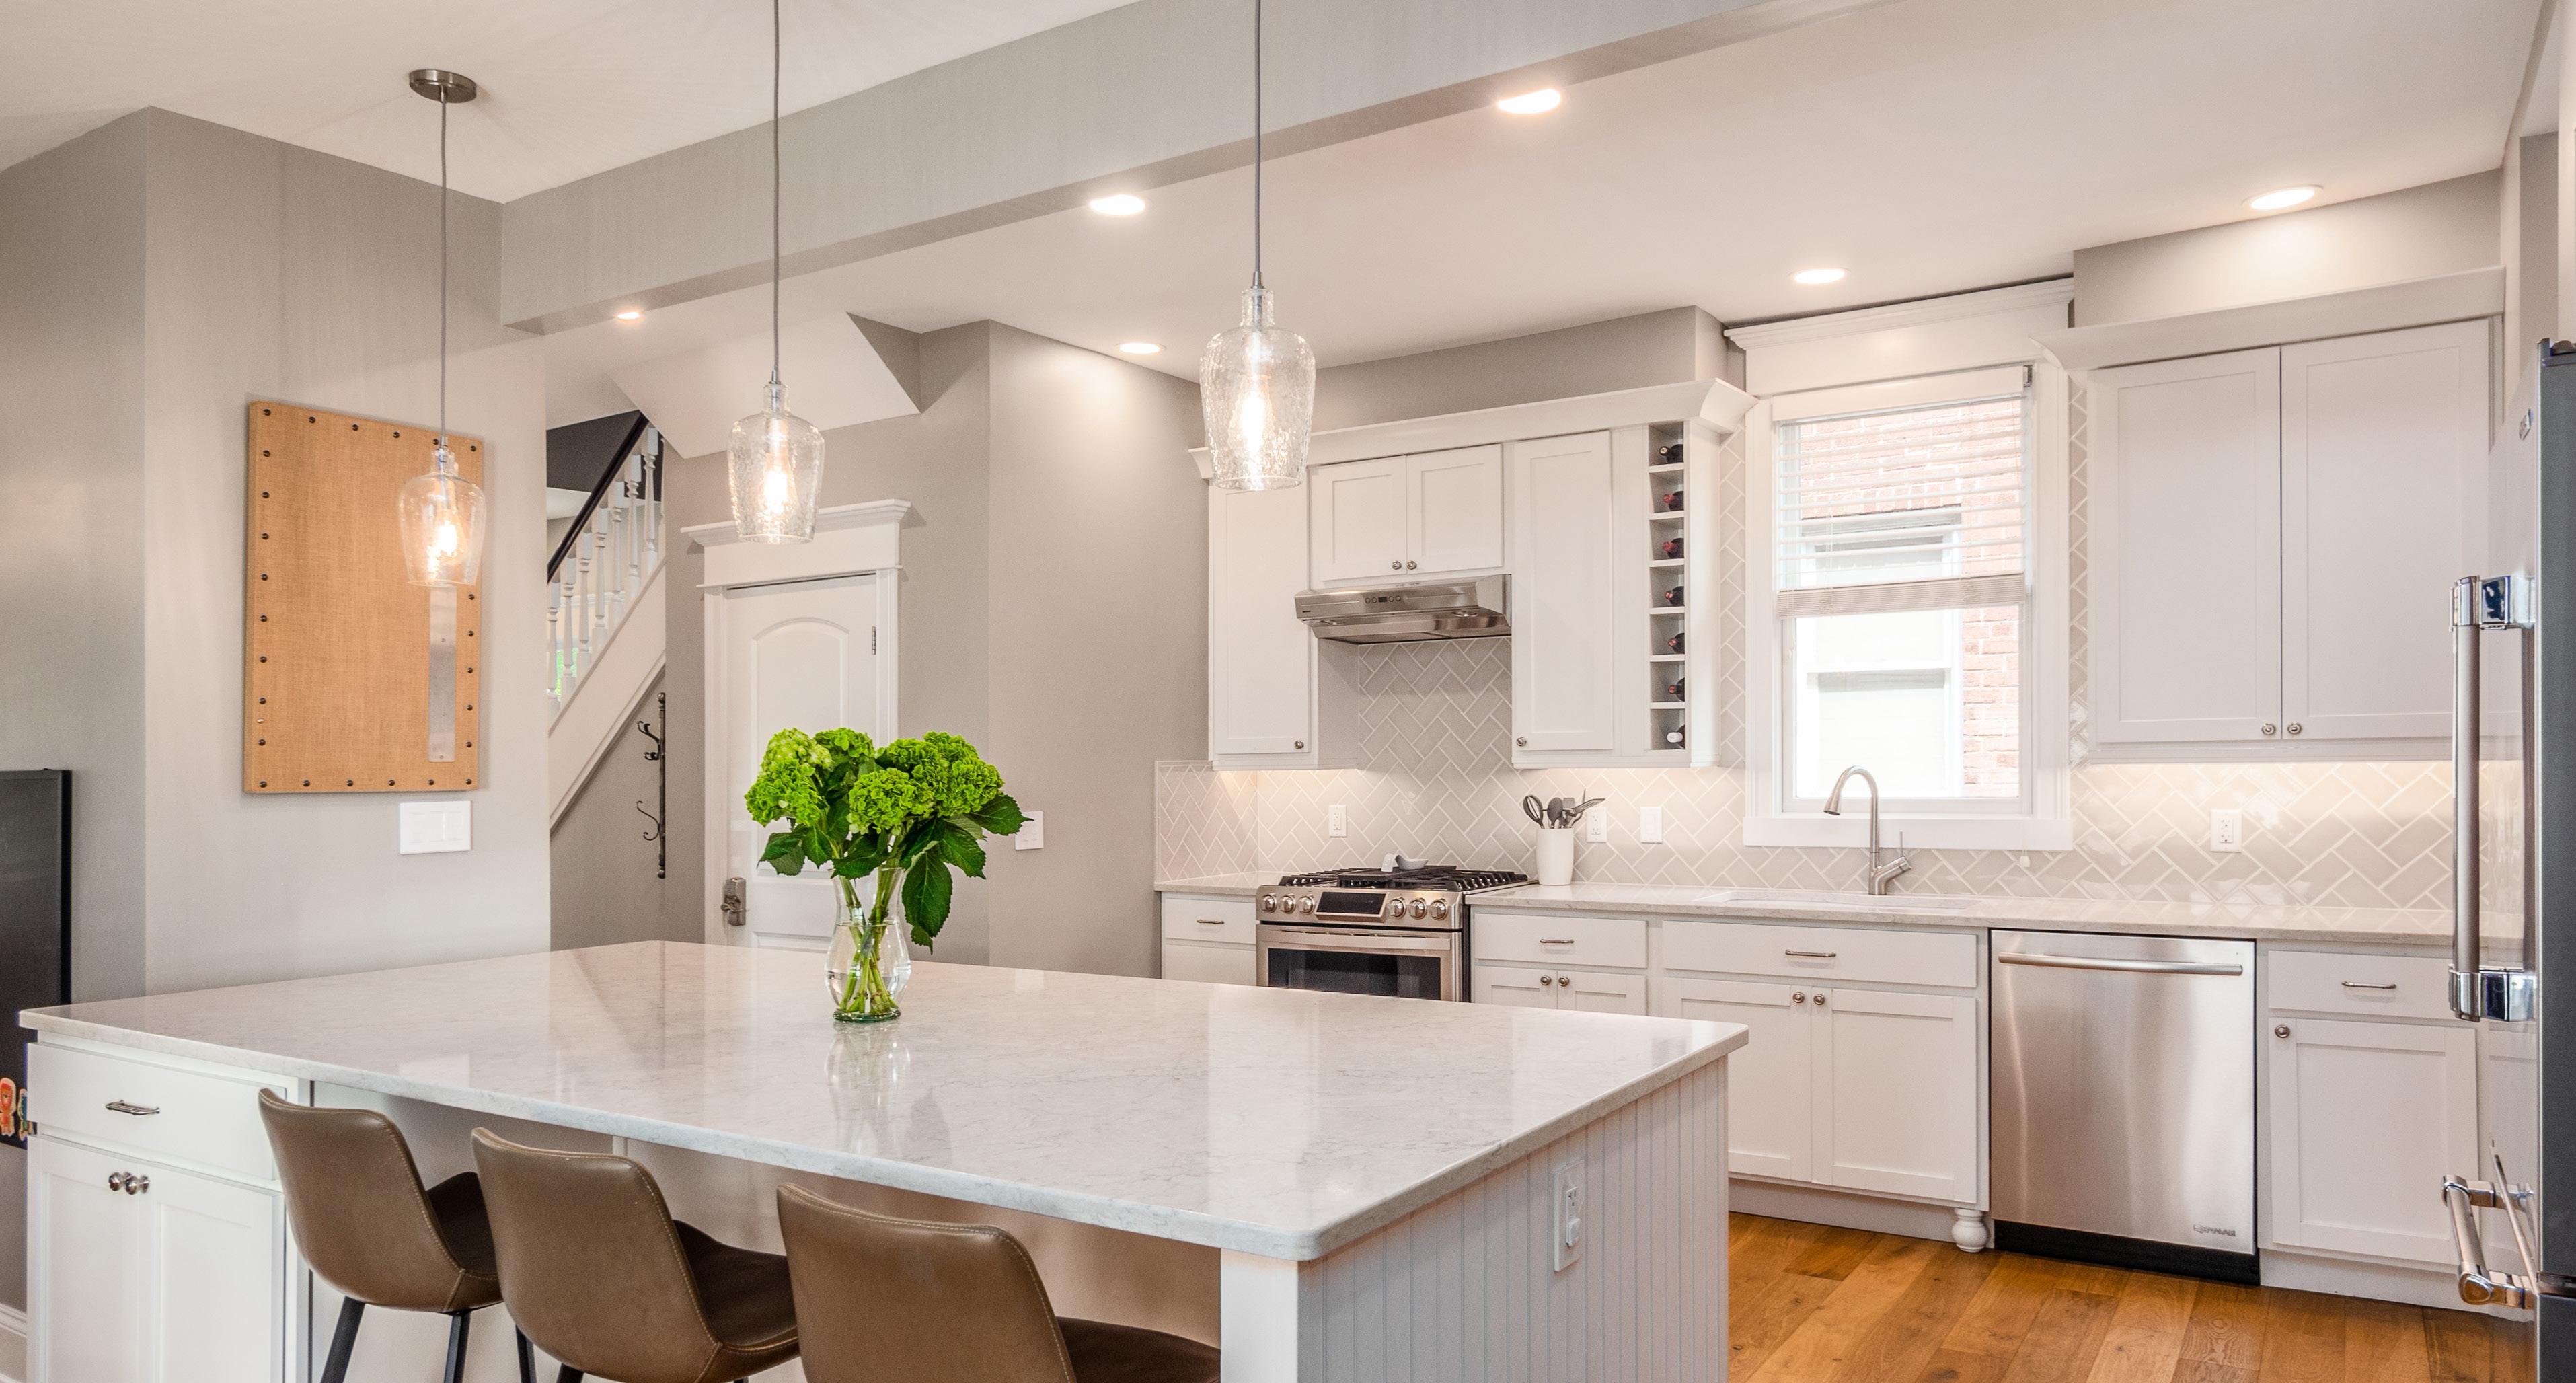
NEIGHBORHOOD SUMMARY
CAM TAYLOR ~ 2023 REAL ESTATE MARKET REPORT PAGE 4 *DATA SOURCE COURTESY OF COLUMBUS & CENTRAL OHIO MLS Number of Sales Average Days on Market Average Price Per SqFt Average Sale Price Median Sale Price Neighborhood Brewery District Arena District Olde Towne East Franklinton NORTH SIDE SOUTH SIDE CENTER CITY EAST SIDE WEST SIDE German Village Downtown Southern Orchards Westgate Clintonville Merion Village River South District Harrison West Short North Schumacher Place Italian Village Victorian Village 21 25 44 103 2023 88 79 67 95 429 118 15 49 30 37 76 54 -51% -60% 22% -22% CHANGE FROM ‘22 -17% -40% -22% -4% -20% 4% 0% -32% -25% -16% -23% -7% 32 77 37 37 2023 17 69 35 22 14 23 35 28 62 26 56 34 16% 49% 13% 34% CHANGE FROM ‘22 -28% 33% 48% 18% 1% 48% -39% -6% 20% -8% -20% 10% $271 $383 $205 $153 2023 $372 $290 $184 $180 $288 $258 $358 $313 $318 $294 $338 $310 -10% 9% -3% 3% CHANGE FROM ‘22 9% 4% 3% 1% 5% -10% 4% 4% 2% -7% 0% 1% $354,290 $693,573 $361,639 $206,710 2023 $637,803 $323,662 $273,081 $251,156 $411,929 $377,560 $750,260 $454,875 $324,548 $467,356 $519,432 $575,691 0% -6% -24% 3% CHANGE FROM ‘22 0% -8% 6% 6% 7% -6% 19% -3% -16% -7% -4% 9% $322,000 $557,500 $368,500 $205,000 2023 $577,250 $259,000 $280,000 $256,000 $395,000 $344,500 $675,000 $420,000 $266,250 $435,000 $465,500 $541,000 4% -15% -22% 11% CHANGE FROM ‘22 14% -5% 8% 7% 6% -7% 63% 8% -24% -1% -8% 10% GRAND TOTAL 1330 -21% 29 5% 1% $404,692 -1% $365,000 4% $273


2023 SALES BY PRICE SEGMENT
(CONTINUED) ~ PRICE SEGMENT 0-$300K ~ ~ PRICE SEGMENT $300K -$500K ~ Neighborhood Neighborhood Number of Sales Number of Sales Average Days on Market Average Days on Market Average Price Per Square Foot Average Price Per Square Foot Average Sales Price Average Sales Price Brewery District Arena District German Village Franklinton Olde Towne East Southern Orchards Clintonville Brewery District Harrison West German Village River South District Victorian Village Downtown Clintonville Italian Village Harrison West Schumacher Place Westgate Franklinton Downtown Merion Village Short North GRAND TOTAL 7 8 4 11 14 38 72 11 8 33 1 7 49 275 2 23 3 76 91 22 31 18 421 $313 $284 $307 $211 $154 $156 $257 $229 $291 $338 $391 $247 $283 $289 $327 $304 $181 $177 $146 $301 $205 $319 $210 52 130 41 31 37 31 19 26 11 20 14 26 60 14 52 39 4 24 38 98 35 65 34 $258,629 $409,675 $235,394 $362,727 $220,079 $197,697 $257,723 $350,700 $265,125 $413,024 $234,900 $247,214 $233,326 $395,513 $280,500 $388,761 $251,167 $232,373 $180,232 $386,236 $233,815 $235,767 $223,964
Neighborhood Number of Sales Average Days on Market Average Price Per Square Foot Average Sales Price Arena District German Village Merion Village Schumacher Place Schumacher Place Brewery District Harrison West Olde Towne East Short North Italian Village Short North Southern Orchards Clintonville Olde Towne East Victorian Village Southern Orchards Merion Village Victorian Village Downtown Italian Village River South District River South District Westgate GRAND TOTAL GRAND TOTAL 9 24 66 23 10 3 14 25 9 24 2 3 75 5 16 26 19 22 5 40 6 1 19 613 216 $337 $368 $265 $297 $314 $327 $339 $234 $300 $381 $295 $262 $312 $204 $276 $216 $302 $327 $280 $309 $321 $358 $192 $281 $326 82 15 16 30 25 9 20 39 57 115 69 117 11 29 23 30 29 54 71 23 30 1 14 24 37 $570,111 $621,600 $372,345 $414,551 $585,400 $590,667 $554,814 $397,240 $377,517 $609,632 $572,500 $533,333 $575,580 $580,000 $431,713 $353,229 $580,474 $617,245 $542,000 $387,333 $411,667 $675,000 $326,287 $389,318 $587,411 Neighborhood Number of Sales Average Days on Market Average Price Per Square Foot Average Sales Price ~ PRICE SEGMENT $500K-$700K ~ ~ PRICE SEGMENT $300K-$500K ~ (CONTINUED) CAM TAYLOR ~ 2023 REAL ESTATE MARKET REPORT PAGE 8 *DATA SOURCE COURTESY OF COLUMBUS & CENTRAL OHIO MLS
$1,033,300 $1,255,000 $1,318,750 $1,150,000 $1,287,106
Neighborhood Number of Sales Average Days on Market Average Price Per Square Foot Average Sales Price Downtown Italian Village Short North Franklinton Merion Village Victorian Village Arena District German Village River South District Clintonville Harrison West GRAND TOTAL 2 7 1 1 2 7 3 20 3 6 4 56 $314 $350 $495 $223 $408 $330 $411 $401 $388 $282 $321 $363 2 54 32 20 9 14 42 12 46 10 26 22 $860,000 $813,062 $950,000 $900,000 $850,000 $860,714 $858,150 $846,847 $866,333 $828,683 $864,749 $848,713 ~ PRICE
$750K-$1M ~ Neighborhood Number of Sales Average Days on Market Average Price Per Square Foot Average Sales Price Downtown Victorian Village German Village Arena District Italian Village Clintonville River South District Schumacher Place GRAND TOTAL 1 2 7 5 3 1 4 1 24 $403 $543 $506 $610 $366 $298 $384 $350 $473 1 11 5 4 21 3 48 11 15 $1,209,162 $1,422,500 $1,385,714 $1,271,294
~ PRICE
~
*DATA SOURCE COURTESY OF COLUMBUS & CENTRAL OHIO MLS CAM TAYLOR ~ 2023 REAL ESTATE MARKET REPORT
SEGMENT
SEGMENT $1M-$2M
PAGE 9

BREWERY DISTRICT
Q1 Q3 Q2 Q4 2023 CHANGE FROM ‘22 Number of Sales 2 4 8 6 20 -50% Avg Days on Market 12 20 50 29 34 88% Avg Price Per SqFt Avg Sale Price $278 $326,250 $285 $278,100 $265 $351,163 $265 $390,150 $270 -12% $345,755 -1%
CAM TAYLOR ~ 2023 REAL ESTATE MARKET REPORT PAGE 11 *DATA SOURCE COURTESY OF COLUMBUS & CENTRAL OHIO MLS ~ CONDOS/ATTACHED UNIT ~
SOUTH VILLAGE
GERMAN VILLAGE
~ SINGLE FAMILY FREESTANDING HOMES ~
UNIT
CAM TAYLOR ~ 2023 REAL ESTATE MARKET REPORT PAGE 12 *DATA SOURCE COURTESY OF COLUMBUS & CENTRAL OHIO MLS
Q1 Q3 Q2 Q4 2023 TOTAL CHANGE FROM ‘22 Number of Sales 11 17 32 13 73 -10% Avg Days on Market 19 20 9 21 15 -39% Avg Sale Price $654,991 $613,029 $765,654 $634,231 $690,032 -4% Avg Price Per SqFt $387 $357 $408 $368 $386 8% Q1 Q3 Q2 Q4 2023 TOTAL CHANGE FROM ‘23 Number of Sales 1 2 10 2 15 -40% Avg Days on Market 11 64 13 14 23 38% Avg Sale Price $349,900 $279,500 $351,548 $665,000 $383,625 3% Avg Price Per SqFt $366 $235 $303 $362 $306 5% ~ CONDOS/ATTACHED
~
MERION VILLAGE
~ SINGLE FAMILY FREESTANDING HOMES ~
CAM TAYLOR ~ 2023 REAL ESTATE MARKET REPORT PAGE 13 *DATA SOURCE COURTESY OF COLUMBUS & CENTRAL OHIO MLS
Q1 Q3 Q2 Q4 2023 TOTAL CHANGE FROM ‘22 Number of Sales 24 26 34 24 108 2% Avg Days on Market 31 18 15 27 22 41% Avg Sale Price $362,941 $407,860 $378,415 $383,271 $383,144 -6% Avg Price Per SqFt $246 $266 $260 $266 $260 -10% Q1 Q3 Q2 Q4 2023 TOTAL CHANGE FROM ‘22 Number of Sales 1 4 2 3 10 43% Avg Days on Market 30 36 49 26 35 119% Avg Sale Price $235,000 $271,750 $494,000 $287,500 $317,250 4% Avg Price Per SqFt $218 $258 $275 $184 $235 -5% ~ CONDOS/ATTACHED
UNIT ~
SCHUMACHER PLACE
~ SINGLE FAMILY FREESTANDING HOMES ~
UNIT
CAM TAYLOR ~ 2023 REAL ESTATE MARKET REPORT PAGE 14 *DATA SOURCE COURTESY OF COLUMBUS & CENTRAL OHIO MLS
Q1 Q3 Q2 Q4 2023 TOTAL CHANGE FROM ‘22 Number of Sales 4 9 9 8 30 -17% Avg Days on Market 40 25 6 50 28 37% Avg Sale Price $485,625 $480,989 $461,000 $457,234 $469,276 -2% Avg Price Per SqFt $286 $277 $313 $311 $298 -6% Q1 Q3 Q2 Q4 2023 TOTAL CHANGE FROM ‘22 Number of Sales 1 0 6 0 7 -13% Avg Days on Market 8 0 19 0 17 -72% Avg Sale Price $355,000 $0 $476,483 $0 $459,129 -22% Avg Price Per SqFt $284 $0 $274 $0 $275 -10% ~
CONDOS/ATTACHED
~
CLINTONVILLE
~ SINGLE FAMILY FREESTANDING HOMES ~
CAM TAYLOR ~ 2023 REAL ESTATE MARKET REPORT PAGE 15 *DATA SOURCE COURTESY OF COLUMBUS & CENTRAL OHIO MLS
Q1 Q3 Q2 Q4 2023 TOTAL CHANGE FROM ‘22 Number of Sales 68 133 129 81 411 -20% Avg Days on Market 32 11 10 13 15 3% Avg Sale Price $372,437 $413,813 $442,077 $426,301 $418,300 6% Avg Price Per SqFt $291 $284 $296 $291 $290 4% Q1 Q3 Q2 Q4 2023 TOTAL CHANGE FROM ‘22 Number of Sales 3 6 8 2 19 -21% Avg Days on Market 3 4 8 11 6 -51% Avg Sale Price $288,000 $258,500 $277,698 $250,000 $270,346 28% Avg Price Per SqFt $240 $221 $233 $244 $1231 27% ~ CONDOS/ATTACHED
~
UNIT
NORTH SIDE
HARRISON WEST
~ SINGLE FAMILY FREESTANDING HOMES ~
UNIT
CAM TAYLOR ~ 2023 REAL ESTATE MARKET REPORT PAGE 16 *DATA SOURCE COURTESY OF COLUMBUS & CENTRAL OHIO MLS
Q1 Q3 Q2 Q4 2023 TOTAL CHANGE FROM ‘22 Number of Sales 3 7 9 4 23 -21% Avg Days on Market 140 33 15 8 36 195% Avg Sale Price $418,967 $502,857 $523,444 $451,250 $490,996 -1% Avg Price Per SqFt $364 $317 $349 $322 $337 3% Q1 Q3 Q2 Q4 2023 TOTAL CHANGE FROM ‘22 Number of Sales 6 6 10 4 26 -40% Avg Days on Market 50 26 6 11 21 -49% Avg Sale Price $341,500 $499,489 $366,875 $570,329 $422,923 -6% Avg Price Per SqFt $284 $291 $291 $314 $293 2% ~ CONDOS/ATTACHED
~
ITALIAN VILLAGE
~ SINGLE FAMILY FREESTANDING HOMES ~
CAM TAYLOR ~ 2023 REAL ESTATE MARKET REPORT PAGE 17 *DATA SOURCE COURTESY OF COLUMBUS & CENTRAL OHIO MLS
Q1 Q3 Q2 Q4 2023 TOTAL CHANGE FROM ‘22 Number of Sales 6 7 7 7 27 -21% Avg Days on Market 16 37 12 15 20 -49% Avg Sale Price $513,000 $548,414 $441,143 $447,700 $486,622 -16% Avg Price Per SqFt $297 $315 $293 $308 $304 -10% Q1 Q3 Q2 Q4 2023 TOTAL CHANGE FROM ‘22 Number of Sales 12 11 18 8 49 -25% Avg Days on Market 87 139 45 37 75 -12% Avg Sale Price $615,917 $618,650 $474,024 $451,179 $537,510 4% Avg Price Per SqFt $347 $409 $348 $321 $357 5% ~ CONDOS/ATTACHED
~
UNIT
SHORT NORTH
CAM TAYLOR ~ 2023 REAL ESTATE MARKET REPORT PAGE 18 *DATA SOURCE COURTESY OF COLUMBUS & CENTRAL OHIO MLS Q1 Q3 Q2 Q4 2023 CHANGE FROM ‘22 Number of Sales 12 5 8 5 30 -25% Avg Days on Market 62 17 26 164 62 20% Avg Price Per SqFt Avg Sale Price $316 $330,421 $360 $392,180 $304 $291,750 $303 $295,300 $318 2% $324,548 -16%
~ CONDOS/ATTACHED
~
UNIT
VICTORIAN VILLAGE
~ SINGLE FAMILY FREESTANDING HOMES ~
UNIT
CAM TAYLOR ~ 2023 REAL ESTATE MARKET REPORT PAGE 19 *DATA SOURCE COURTESY OF COLUMBUS & CENTRAL OHIO MLS
Q1 Q3 Q2 Q4 2023 TOTAL CHANGE FROM ‘22 Number of Sales 2 9 12 6 29 12% Avg Days on Market 98 13 35 20 29 71% Avg Sale Price $660,000 $747,778 $563,158 $627,500 $640,445 2% Avg Price Per SqFt $284 $340 $294 $291 $307 1% Q1 Q3 Q2 Q4 2023 TOTAL CHANGE FROM ‘22 Number of Sales 3 5 11 6 25 -22% Avg Days on Market 22 29 30 76 40 -6% Avg Sale Price $712,633 $518,000 $440,727 $489,750 $500,576 12% Avg Price Per SqFt $315 $378 $302 $280 $313 1% ~ CONDOS/ATTACHED
~
CENTER CITY
ARENA DISTRICT
CAM TAYLOR ~ 2023 REAL ESTATE MARKET REPORT PAGE 20 *DATA SOURCE COURTESY OF COLUMBUS & CENTRAL OHIO MLS Q1 Q3 Q2 Q4 2023 CHANGE FROM ‘22 Number of Sales 5 4 13 3 25 -60% Avg Days on Market 62 73 97 23 77 49% Avg Price Per SqFt Avg Sale Price $354 $579,200 $471 $922,500 $390 $724,879 $289 $443,300 $383 9% $693,573 -6%
~ CONDOS/ATTACHED UNIT ~
RIVER SOUTH DISTRICT
Q1 Q3 Q2 Q4 2023 CHANGE FROM ‘22 Number of Sales 19 19 22 17 77 -40% Avg Days on Market 98 63 59 65 71 43% Avg Price Per SqFt Avg Sale Price $302 $313,984 $289 $313,326 $286 $304,964 $274 $281,297 $288 5% $304,028 -7% Q1 Q3 Q2 Q4 2023 CHANGE FROM ‘22 Number of Sales 2 4 4 5 15 -0% Avg Days on Market 118 43 7 19 35 -39% Avg Price Per SqFt Avg Sale Price $383 $1,040,000 $331 $877,500 $383 $644,750 $351 $616,980 $358 4% $750,260 19% DOWNTOWN
CAM TAYLOR ~ 2023 REAL ESTATE MARKET REPORT PAGE 21 *DATA SOURCE COURTESY OF COLUMBUS & CENTRAL OHIO MLS ~ CONDOS/ATTACHED UNIT ~ ~ CONDOS/ATTACHED UNIT ~
OLDE TOWNE EAST
~ SINGLE FAMILY FREESTANDING HOMES ~
Q1 Q3 Q2 Q4 2023 TOTAL CHANGE FROM ‘22 Number of Sales 4 15 7 7 33 6% Avg Days on Market 95 44 24 31 43 19% Avg Sale Price $356,650 $364,787 $447,929 $333,071 $374,709 -21% Avg Price Per SqFt $180 $200 $182 $182 $190 -8% Q1 Q3 Q2 Q4 2023 TOTAL CHANGE FROM ‘22 Number of Sales 1 2 8 0 11 120% Avg Days on Market 177 6 2 0 118 69% Avg Sale Price $429,000 $321,250 $309,400 $0 $322,427 -29% Avg Price Per SqFt $276 $267 $243 $0 $250 8% ~ CONDOS/ATTACHED
~
UNIT
EAST SIDE CAM TAYLOR ~ 2023 REAL ESTATE MARKET REPORT PAGE 22 *DATA SOURCE COURTESY OF COLUMBUS & CENTRAL OHIO MLS
SOUTHERN ORCHARDS
~ SINGLE FAMILY FREESTANDING HOMES ~
CAM TAYLOR ~ 2023 REAL ESTATE MARKET REPORT PAGE 23 *DATA SOURCE COURTESY OF COLUMBUS & CENTRAL OHIO MLS
Q1 Q3 Q2 Q4 2023 TOTAL CHANGE FROM ‘22 Number of Sales 13 13 25 14 65 -21% Avg Days on Market 55 27 32 31 35 92% Avg Sale Price $336,415 $261,388 $276,984 $234,464 $276,593 5% Avg Price Per SqFt $218 $179 $178 $172 $185 1% Q1 Q3 Q2 Q4 2023 TOTAL CHANGE FROM ‘22 Avg Sale Price 2 0 0 0 2 -50% Avg Days on Market 9 0 0 0 9 -93% Avg Sale Price $158,950 $0 $0 $0 $158,950 24% Avg Price Per SqFt $149 $0 $0 $0 $149 35% ~ CONDOS/ATTACHED UNIT ~
FRANKLINTON
SINGLE FAMILY FREESTANDING HOMES ~
SINGLE FAMILY FREESTANDING HOMES ~
Q1 Q3 Q2 Q4 CHANGE FROM ‘22 Number of Sales 25 27 32 17 101 -21% Avg Days on Market 45 31 43 25 37 37% Avg Price Per SqFt Avg Sale Price $169 $230,780 $160 2023 TOTAL $224,363 $145 $177,044 $138 $196,671 $154 2% $206,298 2% Q1 Q3 Q2 Q4 2023 TOTAL CHANGE FROM ‘22 Number of Sales 22 26 29 17 94 -3% Avg Days on Market 46 14 7 29 22 17% Avg Price Per SqFt Avg Sale Price $165 $245,891 $189 $250,292 $180 $256,867 $191 $260,499 $181 0% $253,136 6%
~
~
CAM TAYLOR ~ 2023 REAL ESTATE MARKET REPORT PAGE 24 *DATA SOURCE COURTESY OF COLUMBUS & CENTRAL OHIO MLS
WESTGATE WEST SIDE
His approach with both buyers and sellers is to use data and market insight as a guide for clients to make informed decisions.
ABOUT SETH
Seth specializes in working with those relocating around the north arc suburbs, the luxury home market, and downtown neighborhoods where he calls German Village home. His interest in residential real estate comes from spending time touring properties with his grandfather who also was a residential agent. His approach with both buyers and sellers is to use data and market insight as a guide for clients to make informed decisions. He likes for clients to have a high level of comfort in their choices by making sure they move at their own pace and being
available for them to capitalize on all opportunities. Being a member at Cam Taylor, Seth quickly achieved the One, Five, Ten and Twenty-Five Million Dollar Club Awards and currently ranks in the top percentile among all agents by sales volume. While earning a business degree from The Ohio State University, he interned with the football team and continues to cheer on the Buckeyes. When not with clients or at the office, Seth enjoys spending time with friends, learning what is new to do in Central Ohio, and openly admits to binge watching reality television.
PAGE 26 *DATA SOURCE COURTESY OF COLUMBUS & CENTRAL OHIO MLS CAM TAYLOR ~ 2023 REAL ESTATE MARKET REPORT
YEAR IN REVIEW
Higher interest rates, longer days on market and reduction in total sales were the themes of the 2023 real estate market in Central Ohio. Common with 2022, sellers and buyers who decided to make a move early in the year mutually benefited. Sellers were able to capitalize on multiple offers and waived contingencies while buyers received lower interest rates compared to those who purchased further into the calendar year.
To help slow inflation, the Federal Reserve continued to increase interest rates as the year progressed. According to Investopdia, 30-year-fixed mortgage rates peaked just below 8.5% in October and was noted by Freddie Mac as being the highest average since 2000. This was approximately a 2.25% increase compared to January mortgage rates and caused a reduction in purchasing power for most buyers. The rise in rates also caused a slowdown in new listings as potential sellers were reluctant to move and give up their current sub 3% interest rates they refinanced into during the 2020 pandemic.
On a positive note, the Metro Area real estate values remained relatively stable and even increased in many areas due to the lack of inventory and influx of relocation buyers needing to purchase regardless of the interest rates.
At the time this report was written in mid February 2024, interest rates had started to trickle down just below 7% and stoked the market from the winter lull.
-Seth

ABOUT CAM TAYLOR
Cam Taylor is a boutique real estate agency providing over fifty years of expertise to sellers and buyers in Central Ohio - primarily the North Arc corridor and villages surrounding Downtown Columbus. We are passionate about providing a refined experience for each client’s specific needs. Being independently owned and operated allows our agents greater resources to provide a high level of service. It also means we directly reinvest our resources to drive value to Columbus, Ohio, and its residents. Since 1968, our clients have kept us updated on the latest changes in their neighborhoods. Not only do we have housing market data at our fingertips, we have real people sharing real experiences about their neighborhoods. We’ve had our thumb on the pulse of Central Ohio for quite some time. It’s our business.
LeadingRE
Our affiliation with other top independent brokerages – through Leading Real Estate Companies of The World® – offers both national and global exposure for your property by marketing to the highest possible number of potential buyers. With 136,000 associates around the world, we expose your property to buyers on six continents. In addition, we receive inbound clients from other affiliates around the globe who are interested in purchasing a home. With a local focus and a national-global view, our associates ensure the best personal attention with the finest access to quality real estate connections.
This network also provides our buyer clients purchasing outside of our market access to the top agencies around the world. We have helped in countless outbound relocation moves and vacation home purchases. Let us connect you to the top agency wherever you may be purchasing!
PAGE 30 *DATA SOURCE COURTESY OF COLUMBUS & CENTRAL OHIO MLS
CAM TAYLOR ~ 2023 REAL ESTATE MARKET REPORT


CONTACT US Seth Janitzki 614-980-7181 seth@camtaylor.com
