68 33 25 7
$'92&$&<
('8&$7,21
7+(
www.cabe.org
SPECIAL ELECTRONIC EDITION
www.facebook.com/ConnecticutAssociationBoardsEducation
-2851$/
&RQQHFWLFXW $VVRFLDWLRQ RI %RDUGV RI (GXFDWLRQ 7KH /HDGLQJ 9RLFH IRU &RQQHFWLFXW 3XEOLF (GXFDWLRQ Vol. 17, No.7
July/August 2013
³2XW RI WKH SXEOLF VFKRROV JURZV WKH JUHDWQHVV RI D QDWLRQ ´ 0DUN 7ZDLQ 1RY
How districts can utilize data to improve student outcomes Mark D. Benigni Thomas W. Giard III Michael S. Grove Mark A. Hughes
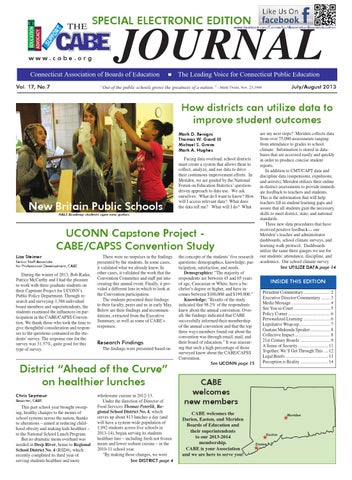
New Britain Public Schools
are my next steps? Meriden collects data from over 75,000 assessments ranging from attendance to grades to school climate. Information is stored in databases that are accessed easily and quickly in order to produce concise student reports. In addition to CMT/CAPT data and discipline data (suspensions, expulsions, and arrests), Meriden utilizes their online in-district assessments to provide immediate feedback to teachers and students. This is the information that will help teachers fill in student learning gaps and assure that all students gain the necessary skills to meet district, state, and national standards. Three new data procedures that have received positive feedbackâ&#x20AC;&#x201D; our Meridenâ&#x20AC;&#x2122;s teacher and administrator dashboards, school climate surveys, and learning walk protocol. Dashboards utilize the same three gauges we use for our students: attendance, discipline, and academics. Our school climate survey See UTILIZE DATA page 14
Facing data overload, school districts must create a system that allows them to collect, analyze, and use data to drive their continuous improvement efforts. In Meriden, we are guided by the National Forum on Education Statisticsâ&#x20AC;&#x2122; questiondriven approach to data use. We ask ourselves: What do I want to know? How will I access relevant data? What does the data tell me? What will I do? What
HALS Academy students open new guitars.
UCONN Capstone Project CABE/CAPSS Convention Study Lisa Steimer Senior Staff Associate for Professional Development, CABE
During the winter of 2013, Bob Rader, Patrice McCarthy and I had the pleasure to work with three graduate students on their Capstone Project for UCONNâ&#x20AC;&#x2122;s Public Policy Department. Through research and surveying 1,386 individual board members and superintendents, the students examined the influences on participation in the CABE/CAPSS Convention. We thank those who took the time to give thoughtful consideration and responses to the questions contained in the studentsâ&#x20AC;&#x2122; survey. The response rate for the survey was 31.57%, quite good for this type of survey.
There were no surprises in the findings presented by the students. In some cases, it validated what we already knew. In other cases, it validated the work that the Convention Committee and staff put into creating this annual event. Finally, it provided a different lens in which to look at the Convention participation. The students presented their findings to their faculty, peers and us in early May. Below are their findings and recommendations, extracted from the Executive Summary, as well as some of CABEâ&#x20AC;&#x2122;s responses.
Research Findings The findings were presented based on
District â&#x20AC;&#x153;Ahead of the Curveâ&#x20AC;? on healthier lunches Chris Seymour Reporter, CABE
This past school year brought sweeping, healthy changes to the menus of school systems across the nation, thanks to alterations â&#x20AC;&#x201C; aimed at reducing childhood obesity and making kids healthier â&#x20AC;&#x201C; to the National School Lunch Program. But no dramatic menu overhaul was needed in Deep River, home to Regional School District No. 4 (RSD4), which recently completed its third year of serving students healthier and more
wholesome cuisine in 2012-13. Under the direction of Director of Food Services Thomas Peterlik, Regional School District No. 4, which serves up about 813 lunches a day (and will have a system-wide population of 1,992 students across five schools in 2013-14), began serving its students healthier fare â&#x20AC;&#x201C; including fresh not frozen meats and lower sodium cuisine â&#x20AC;&#x201C; in the 2010-11 school year. â&#x20AC;&#x153;By making those changes, we were See DISTRICT page 4
the concepts of the studentsâ&#x20AC;&#x2122; five research questions: demographics, knowledge, participation, satisfaction, and needs. Demographics: â&#x20AC;&#x153;The majority of respondents are between 45 and 65 years of age, Caucasian or White, have a bachelorâ&#x20AC;&#x2122;s degree or higher, and have incomes between $100,000 and $199,000.â&#x20AC;? Knowledge: â&#x20AC;&#x153;Results of the study indicated that 98.2% of the respondents knew about the annual convention. Overall, the findings indicated that CABE successfully informed their membership of the annual convention and that the top three ways members found out about the convention was through email, mail, and their board of education.â&#x20AC;? It was reassuring that such a high percentage of those surveyed know about the CABE/CAPSS Convention. See UCONN page 15
INSIDE THIS EDITION President Commentary ........................ 2 Executive Director Commentary ........ 3 Media Message ................................... 4 See You in Court ................................. 5 Policy Corner ...................................... 6 Personalized Learning ........................ 6 Legislative Wrap-up............................ 7 Gautam Mukunda Speaker .................. 8 Collective Impact ................................ 8 21st Century Boards ........................... 9 A Sense of Security ........................... 11 Together, Weâ&#x20AC;&#x2122;ll Get Through This .... 12 Legal Briefs ...................................... 13 Perception is Reality ......................... 14
CABE welcomes new members CABE welcomes the Darien, Easton, and Meriden Boards of Education and their superintendents to our 2013-2014 membership. CABE is your Association and we are here to serve you!
Meriden
â&#x2DC;&#x2026; Easton
â&#x2DC;&#x2026; Darien
â&#x2DC;&#x2026;