-10,3% -9,3%
-6,5% -6,5% -6,5% -6,3% -6,0% -6,0% -6,0% -5,9% -5,9% -5,8% -5,8% -5,6% -7,7% -7,6% -7,0% -6,9% -9,1% -8,7% -8,6% -8,5%
-14,4%-13,8% -19,6% -25,4%
Source: DANE. Directorate of Synthesis and National Accounts. Constant prices based on 2015.
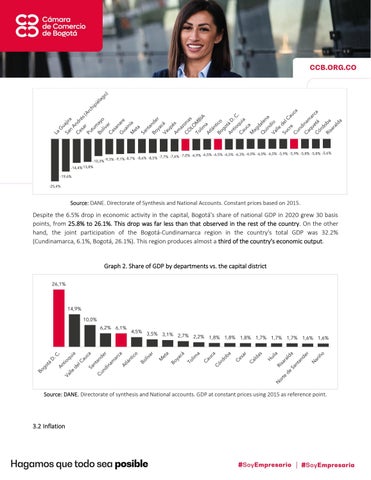
Despite the 6.5% drop in economic activity in the capital, Bogotá's share of national GDP in 2020 grew 30 basis points, from 25.8% to 26.1%. This drop was far less than that observed in the rest of the country. On the other hand, the joint participation of the Bogotá-Cundinamarca region in the country's total GDP was 32.2% (Cundinamarca, 6.1%, Bogotá, 26.1%). This region produces almost a third of the country's economic output.
Graph 2. Share of GDP by departments vs. the capital district 26,1%
14,9% 10,0% 6,2% 6,1%
4,5% 3,5% 3,1% 2,7% 2,2% 1,8% 1,8% 1,8% 1,7% 1,7% 1,7% 1,6% 1,6%
Source: DANE. Directorate of synthesis and National accounts. GDP at constant prices using 2015 as reference point.
3.2 Inflation


