
Published by Published by Volume 30 Number 1 1300 Piccard Drive, Suite LL 14 • Rockville, MD 20850 Winter 2023


Cover
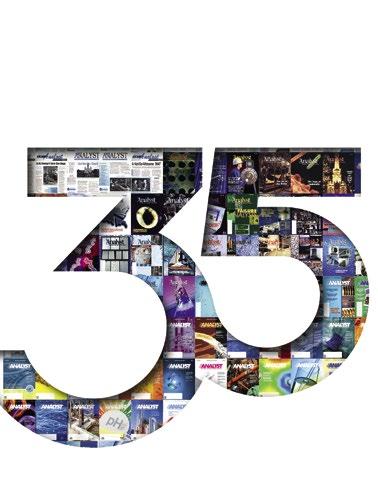
Our special anniversary cover, commemorating 35 years of the Analyst, is compiled from covers throughout the publication's history. Courtesy AWT graphics design team.
Winter 2023
Volume 30
Number 1
8 Celebrating 35 Years of the Analyst
Mike Henley
A look into the early days of the Association of Water Technologies and its signature publication.
12 A Review of Common Water Treatment Rules of Thumb
Robert J. Ferguson, French Creek Software, Inc.
These rules of thumb were developed from a combination of theory and practical experience since the early days of water treatment. They have provided guidelines for generations of water treaters and are still used by those without access to advanced computer modeling. This article updates changes to “rules of thumb” since 2003.
26 Part 2: How Water Conditions Can Impact Steam System Passivation
Loraine A. Huchler, P.E., CMC®, FIMC Part 1, which appeared in the Fall 2022 issue of Analyst, provided a tutorial about the chemistry of iron and iron oxides and commonly accepted hypotheses about mechanisms of corrosion and magnetite formation. Part 2 focuses on more practical aspects of passivation: the effect of system conditions and reducing agents and measurements of corrosion and passivation phenomena.
34 Can Calcium Carbonate Be an Effective Alternative for pH and Alkalinity Control in Activated Sludge Processes?
Chandler Mancuso, Omya Inc.
44 Tagged Polymers as Phosphonate Replacements in Water Treatment Applications
Klin Rodrigues and Jan Sanders, Nouryon Water treaters often use multicomponent formulations, which include polymers and phosphonates to prevent calcium carbonate and calcium phosphate scale formation and provide dispersancy in their systems. With phosphonates in short supply, polymers are being more heavily relied upon to provide scale control. This article will provide information on phosphonate replacement, including field trial data for tagged polymers in both alkaline pH systems and neutral pH/stabilized phosphate systems.
4 Calendar of Events
5 President’s Message
6 Message From the President-Elect
58 Membership Benefits
59 Industry Notes
61 Discovering AWT
64 Making a Splash
65 CWT Spotlight
66 Tales From the Waterside
72 T.U.T.O.R.
82 What’s (Water) on Your Mind?
86 Advertising Index
3 the ANALYST Volume 30 Number 1
1300 Piccard Drive, Suite LL 14
Rockville, MD 20850
(301) 740-1421 • (301) 990-9771 (fax) www.awt.org
2023 AWT Board of Directors
President
Stephen C. Hallier, CWT
President-Elect
Noah Baskin
Secretary
John D. Caloritis, CWT Treasurer
Kyle Rossi, CWT
Immediate Past President
Fred Shurtz Directors
Craig Bodenmiller, CWT
Tammy Faber, MBA
Michelle Lunn
Michael Bourgeois, CWT
Ex-Officio Supplier Representative
Pam Simmons
Past Presidents
Jack Altschuler
John Baum, CWT
R. Trace Blackmore, CWT, LEED AP
Michael Bourgeois, CWT
D.C. “Chuck” Brandvold, CWT
Thomas Brandvold, CWT
Brent W. Chettle, CWT
Dennis Clayton
Bernadette Combs, CWT, LEED AP
Matt Copthorne, CWT
James R. Datesh
John E. Davies, CWT
Jay Farmerie, CWT
Gary Glenna
Charles D. Hamrick Jr., CWT
Joseph M. Hannigan Jr., CWT
Staff
Executive Director
Denise Jackson
Deputy Executive Director
Sara L. Wood, MBA, CAE
Member Services Director
Angela Pike
Vice President, Meetings
Tina Schneider
Meeting Coordinator
Caroline Bentley
Meetings Planner
Tim Foley
Calendar of Events
Association Events
2023 Technical Training Seminars (East)
March 29–April 1, 2023
Omni Pittsburgh Hotel
Pittsburgh, Pennsylvania
2023 Business Owners Meeting
October 3, 2023
Amway Grand Hotel
Grand Rapids, Michigan
Matt Jensen, CWT
Mark R. Juhl
Brian Jutzi, CWT
Bruce T. Ketrick Jr., CWT
Bruce T. Ketrick Sr., CWT
Ron Knestaut
Robert D. Lee, CWT
Mark T. Lewis, CWT
Steven MacCarthy, CWT
Anthony J. McNamara, CWT
James Mulloy
Alfred Nickels
Scott W. Olson, CWT
William E. Pearson II, CWT
William C. Smith
Marc Vermeulen, CWT
David Wagenfuhr
Casey Walton, B.Ch.E, CWT
Larry A. Webb
2023 Annual Convention & Exposition
October 4–7, 2023
DeVos Place Convention Center and Amway Grand Hotel
Grand Rapids, Michigan
2024 Technical Training Seminar (East)
April 17–20, 2024
Cleveland Marriott Downtown at Key Tower Cleveland, Ohio
Continued on page 84
Also, please note that the following AWT committees meet on a monthly basis. All times shown are Eastern Time. To become active in one of these committees, please contact us at (301) 740-1421.
Second Tuesday of each month, 11:00 am—Legislative/Regulatory Committee
Second Tuesday of each month, 2:30 pm—Convention Committee
Second Wednesday of each month, 11:00 am—Business Resources Committee
Second Friday of each month, 2:00 pm—Pretreatment Subcommittee
Second Friday of each month, 10:00 am—Special Projects Subcommittee
Second Friday of each month, 11:00 am—Cooling Subcommittee
Third Monday of each month, 9:00 am—Certification Committee
Third Monday of each month, 3:30 pm—Young Professionals Task Force
Third Tuesday of each month, 3:00 pm—Education Committee
Third Friday of each month, 9:00 am—Boiler Subcommittee
Third Friday of each month, 10:00 am—Technical Committee Quarterly (call for meeting dates), 11:00 am—Wastewater Subcommittee
Other Industry Events
Exhibits and Sponsorships Manager
Brandon Lawrence
Senior Director, Creative Services/Marketing
Jennifer Olivares
Marketing Coordinator
Mary Claire Gordon
Managing Editor
Heather Rigby
Production Manager
Tiffany Ward
Director of Accounting Services
Dawn Rosenfeld
The Analyst Staff
Publisher Denise Jackson
Managing Editor
Heather Rigby
Production Manager
Tiffany Ward
Technical Editor
Michael Henley, mdhenleywater@gmail.com , (303) 324-9507
Advertising Sales Manager
Carol Nettles, carol@adboomadvertising.com
NACE, Corrosion Risk Management Conference, March 19–23, 2023, Denver, Colorado ACS, Spring National Meeting & Expo, March 26–30, 2023, Indianapolis, Indiana WQA, Convention and Expo, April 18–20, 2023, Las Vegas, Nevada Electric Utility Chemistry Workshop, June 6–8, 2023, Champaign, Illinois AWWA, Annual Conference & Expo, June 11–14, 2023, Toronto, Ontario, Canada ACS, Fall National Meeting & Expo, August 13–17, 2023, San Francisco, California
WEFTEC, Annual Technical Exhibition and Conference, September 30–October 4, Chicago, Illinois Ultrapure Micro 2023, October 10–12, 2023, Austin, Texas International Water Conference, November 12–16, 2023, San Antonio, Texas RETA, Annual Convention, November 13–16, 2023, Jacksonville, Florida Cooling Technology Institute, February 4-8, 2024, Houston, Texas
The Analyst is published quarterly as the official publication of the Association of Water Technologies. ©2022 Association of Water Technologies. Materials may not be reproduced without written permission. The articles, studies, and reports in this publication are the works of the respective authors. AWT expressly disclaims any duty to investigate any article, study, report, conclusion, product, service process, procedure, design, or similar offering contained herein. AWT does not warrant that the information in this publication is free from error and does not necessarily agree with the statements or opinions contained herein. The appearance of any technical data, editorial material, or advertisement in this publication does not constitute an endorsement, warranty, or guarantee by AWT. This publication is not a substitute for the competent counsel of a water treatment professional, plumbing professional, mechanical official, or attorney. The user assumes any and all risks of relying on the information in this publication. Authors are responsible for ensuring that the articles are properly released for classification and proprietary information. All advertising will be subject to publisher’s approval, and advertisers will agree to indemnify and relieve publisher of loss or claims resulting from advertising contents. Editorial material in the Analyst may be reproduced in whole or part with prior written permission. Request permission by writing to: Managing Editor, the Analyst, 1300 Piccard Drive, Suite LL 14, Rockville, MD 20850, USA. Annual subscription rate is $100 per year in the United States (4 issues). Please add $25 for Canada and Mexico. International subscriptions are $200 in U.S. funds.
4 the ANALYST Volume 30 Number 1
President’s Message
Leadership Meeting
At the end of last year, the AWT board, committees, subcommittees, task forces, and Related Trade Organization (RTO) liaisons got together to review our goals for 2023. I am pleased to report that work continues on our updated critical outcomes and goals: Thriving Members, Influential Representation, Industry Impact, and continuing our good work with Charity.
The AWT Board of Directors is scheduled to meet in New Orleans in mid-February, where we will be focused on setting priorities and ensuring a positive year of growth success for our organization and its members.
By Steve Hallier, CWT
AWT Training
AWT Tech Training will be held February 21–24 in San Diego, California, and March 29–April 1 in Pittsburgh, Pennsylvania. Every year, the sessions are revised and updated based on feedback received from attendees. Programs include sessions on Sales, RO Training, Fundamentals and Applications, Wastewater (Pittsburgh only), and Water Treatment Training. Sign up now at www.awt.org.
Individual Member Campaign

As you know, our membership voted this past fall, at the annual AWT Convention & Exposition in Vancouver, to add an individual membership category. This new opportunity was launched in early January, and we have had great success! Due to the hard work of our staff and strong marketing efforts, as of this writing we have 48 new individual members of AWT! There is clearly demand for this new membership category, and we are excited about its potential as AWT continues to grow.
Thank you for the opportunity to serve. I can be reached at president@awt.org
5 the ANALYST Volume 30 Number 1
Message From the President-Elect
By Noah Baskin
We are hard at work planning the 2023 AWT Annual Convention & Exposition, October 4–7, in Grand Rapids, Michigan! It is exciting to return to Grand Rapids, which was the site of our very successful 2017 convention. We are certain this year’s will prove to be another memorable event—headquartered at the Amway Grand Plaza, with exhibits at Devos Place.

Educational Programs
The program for the 2023 convention is being developed, and we already have over 40 abstract submissions from which to choose. In addition, we have reached out to members to better understand what sessions they want to see at the meeting. Based on your feedback, we are introducing some new topics and creating sessions to ensure all are up to date on the latest techniques and trends in our industry. Currently, the list of committed 2023 convention exhibitors and sponsors is trending ahead of the past several years.
Golf Tournament and Duckpin Bowling
There will be a great golf tournament this year when we return to Thornapple Pointe Golf Club, which was host to our 2017 event. It is a beautiful location and will prove to be another great day on the course with your
AWT colleagues—and it’s an opportunity to support the Pure Water of the World charity! New this year: We have added a duckpin bowling event for Friday evening (details to come).
Awards Dinner and Program
We are looking forward to our Annual Awards Dinner, to be held on Thursday evening of the convention. Please note that this year, all sessions will end on Friday there will be no programming on Saturday. Be on the lookout for our registration opening announcement in Mid-May!
Visit Grand Rapids
According to their Convention and Visitors Bureau website, Grand Rapids is known as “Beer City USA,” with many breweries and great restaurants for all attendees to enjoy. The autumn colors of Michigan are beautiful, and you may want to extend your stay to experience the huge variety of restaurants, museums, and recreational activities in the area.
As we continue to plan the 2023 Annual Convention & Exposition, I welcome your feedback. I can be reached at nbaskin@towerwater.com. Thank you for the opportunity, and I look forward to serving as your convention chair this year.
6 the ANALYST Volume 30 Number 1
Why choose Quantrol as your Water Treatment equipment supplier?


- Great Products, Great People


- Commitment, to our customers - We got your back.
- Experience, Our sales team averages over 20 years of industry experience.


- Knowledge, of the equipment we offer and how to apply it.

- Accessibility, A real live caring person answers the phone, not a machine.

- Brands, We work with some of the best manufacturers in the industry.
- Stock, 1000’s of items in our Naperville, IL warehouse.
9001 Hanslik Ct. Naper ville, IL 60564 | Tel: 630-355-3330 | info@quantrol.net | www.quantrol.com
Celebrating 35 Years of the Analyst
Mike Henley
Welcome to the 35th year of the Analyst. The Winter 2023 issue also marks the 30th volume of the publication transforming from a newsletter into a four-color magazine (in 1994).

In this special issue, we will take time to celebrate the launch and longevity of the publication, which began three years after the Association of Water Technologies’ founding in 1985. Later this year, we will provide a more in-depth look at the beginnings and history of AWT, which has supported the Analyst through the years.
Why Celebrate?
A trade organization’s newsletter, journal or magazine, or website is a vital element because it provides a means to communicate organizational news, industry developments, technology developments, and useful information for running a business with members. A publication also provides a tool for businesses to advertise products/ services to the trade group.
In short, a magazine can help capture the essential elements of the group and provide guidance for
8 the ANALYST Volume 30 Number 1
the present and future. The past volumes become an important historical archive about the work of the trade group. For AWT, Analyst has become such a vehicle. For the remainder of this article, we will briefly review the start of what became the Analyst, as well as give an overview of article topics over three decades as a magazine.
The Beginnings
The association was started in 1985 by a small number of entrepreneurial water treaters who joined forces over concern about the inability of small water treatment companies to get affordable product liability insurance. As noted on the AWT website, this was a major concern at the time, and the founders felt it threatened the continued existence of small water treatment businesses. The solution of the original AWT founders was to create an insurance program based specifically on the business model of small- and medium-sized, independent water treatment firms.
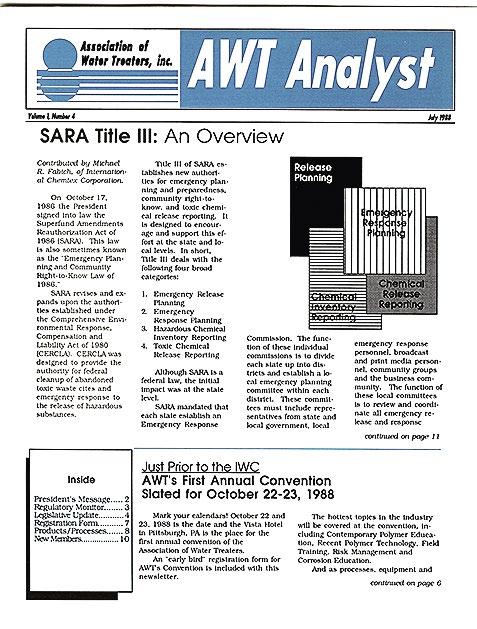
From this start, Analyst was born in August 1987 and simply named a “newsletter.” John Baum, president of Craft Products Co., and son of Ray Baum (the namesake of the AWT’s annual Ray Baum Memorial Water Technologist of the Year Award) reported that volume 1, issue 1 of the first newsletter came out in August 1987 as a four-page, single-fold glossy with a photocopy Application for Membership inside. The first issue listed the Branchemco office address and was sent to a mailing list that included members and potential members.
The second issue came out in October 1987 and had three items:
A Name the Newsletter Contest,
News about the hiring of Association Management Group to provide operating management services for the fledgling AWT,
An announcement of the first AWT business meeting to be held the day before the International Water Conference at the Hilton Hotel in Pittsburgh, on Tuesday, November 3, 1987.
The third issue (March 1988) reported the six final choices for the newsletter’s name: AWT Analyst, Current News, Flow-Line, Treater’s Digest, Treater Reader, and Wavelength. Members voted on their favorite choice. This issue was eight pages long.
The name ”Analyst “ won the contest, so the final issue of volume 1 sported “AWT Analyst,” and announced the first annual AWT conference for October 22-23, 1988, at the Vista Hotel in Pittsburgh.
Paul Puckorius, a consultant with Puckorius & Associates, briefly served as editor of the early issues of the newsletter. After Mr. Puckorius left that role, the AWT board of directors and management staff took over the editorial work. During that time, the board had a publication chair and committee that helped to keep Analyst going and eventually transition to a magazine format.
In 1991, Rob Lederer, AWT’s executive director, became editor and continued until early 1995, when John Schulte, AWT’s new executive director, took over and served through 1999. Cathleen Connolly, and later Laura Ostrander, helped during part of that time as assistant editors. They were assisted by the board of directors and other AWT members in gathering content.
Ben Boffardi, a water treatment consultant, became the technical editor of the journal in 2000 and continued until 2017. He was followed by myself; I joined the Analyst as technical editor in late 2018. Previously, I was editor of the Ultrapure Water Journal for 27 years.
Throughout the Analyst’s history, an important focus for the technical articles has been that they approach their subject technically, educationally, and avoid commercialism—promotion of specific products or services. The aim is for the publication (and the AWT) to be seen as a credible source of information about water treatment technologies.
9 the ANALYST Volume 30 Number 1
Figure 1: Page 1 of the Fall 1988 AWT Analyst.
Figure 2: Cover of the first Analyst magazine published in Spring 1994.
Magazine Format
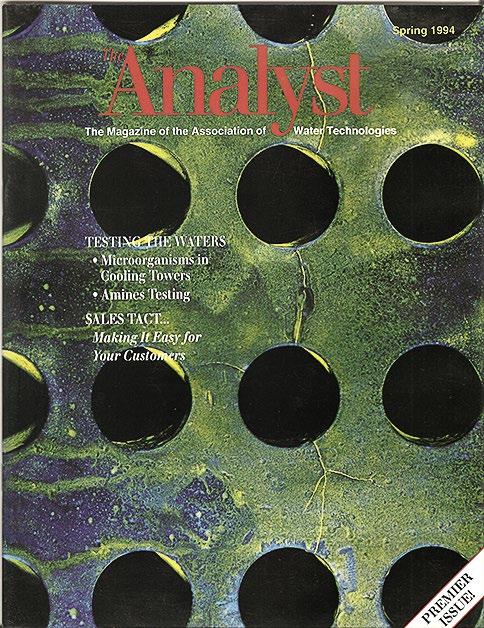
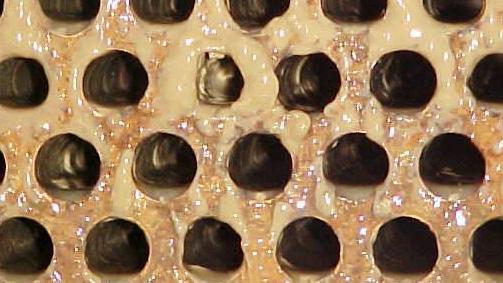
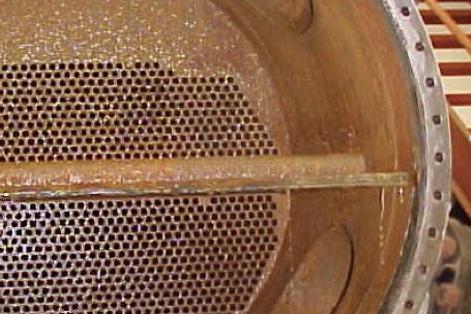
During John Baum’s presidency, the AWT board of directors voted to move the newsletter to a four-color magazine. The Spring 1994 Analyst was the first issue in magazine format. It featured a photo of a boiler tube sheet taken by Tom Laronge, a consultant based in Vancouver, Washington. Titles for articles in the issue included:
Improving the Efficiency of Your Boiler Operation
Neutralizing Amine
Identification and Testing of Microorganisms in Cooling Towers
As a magazine, the Analyst has included the cover tag line, “The Voice of The Water Treatment Industry.” On the cover, the name was all-capitals—ANALYST—but inside the name was spelled with upper and lower case letters— the Analyst. During those years, technical articles were sent to staff and reviewed by board members before publication with the help of Bob Cavano. This process was followed until Dr. Boffardi took over as the technical editor in 2000.
Through the years, the publication has been published quarterly. The fall issue will have both the main journal as well as a Technology Supplement with additional technical articles on water treatment subjects. During the year, other supplements published with Analyst have included a Buyer’s Guide and a Business Supplement.
With the move to digital publishing, AWT has continued to publish the four-color magazine, but now also offers the journal online for members. The very latest issues can be downloaded as a PDF file of the complete issue, while articles in issues from 2018 and before can be downloaded as separate articles.
Magazine Topics
Table A lists subject areas technical articles that Analyst issues carried from 1994 to 2003. Some of the more popular topics during that 10-year period included boilers, cooling water systems, Legionella, corrosion, scaling, and biocides.
Table B lists subject areas covered in the Analyst from 2004 to 2013. Some new topic areas introduced during that time frame included chillers, clarification, guidelines, ozone, water reuse, and dissolved air flotation and related technologies. Popular topics included biocides, boilers, cooling towers, Legionella, monitoring, and reverse osmosis.
Amines
Analyst (1994-2003). Topics
Ion Exchange
Biocides (oxidizing/non-oxidizing) Labs
Biofilms
Boilers/steam systems
Chelants
Chemical cleaning
Legionella
Markets/Marketing/Sales
Metal Finishing
Molybdate
Chemical feed/metering Monitoring
Computer modeling
Controller technology
Cooling towers/systems
Cycles of concentration
Deaeration
Deposits
EPA
Non- Legionella pathogens
Oxygen scavengers
pH/ORP
Phosphonates
Reverse Osmosis/membranes
Scaling
SDS (MSDS) sheets
Filtration Service
Heat exchangers
Heavy metals
Indexes
Inhibitors
Sulfites
System automation
Wastewater
Table C lists article subjects from 2014 to 2022, just prior to the celebration of the 30th volume of the Analyst. New topics addressed included ultrapure water (pharmaceutical and semiconductor water), per- and polyfluoroalkyl substances (PFAS), and greater discussion of reclaim/ reuse water and sustainable treatment.
Also, since 2019, emphasis has been given to expanding the coverage areas of the Analyst. One example has been greater coverage of other water treatment areas that could be of interest to professional water treaters within AWT. Also, there has been the addition of these four columns:
10 the ANALYST Volume 30 Number 1
Celebrating 35 Years of the Analyst continued
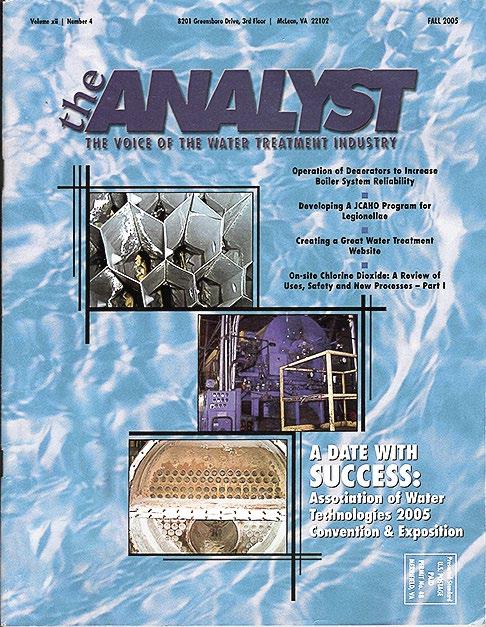
Figure 3: Cover of the Fall 2005 Analyst.
Figure 4: Cover of the Technology Supplement from the Fall 2015 issue.
Table A: Subject Areas of the
Table B: Subject Areas of the Analyst (2004-2013).
Topics
Amines Inhibitors
Amoebae Ion Exchange
Antifoulants Legionella
Biocides Markets
Biofilm Membranes
Boilers/steam
Chemical cleaning
Chemical feed
Microbiocide monitoring
Metals removal
Molybdate
Chillers Monitoring
Clarification
Cleaning
Closed systems
Computers
Organic treatments
Ozone
pH
Polymers
Condensate Reuse
Cooling towers/systems Reverse osmosis
Copper removal
Scaling
Conservation/environmental Sensors
Deaeration
Softeners
Dissolved air flotation Testing
Equipment failures
Failure analysis
Fluorescent technologies
Guidelines
Hardness
Heat exchangers
Tolytriazole
Wastewater
Zero liquid discharge
Plant operation
Plant maintenance
Table C: Subject Areas of the Analyst (2014-2022).
Topics
Amines Membranes
Bacteria Materials of construction
Biocide Metering
Biofilm/biofouling Monitoring
Calcium carbonate
Pharmaceutical water
Chelants Phosphates
Computers Phosphonates
Condensate Polymers
Cooling towers/systems Potable water
Corrosion
Deionization
Failure analysis
Fluorescent technologies
Flow diagrams
Guidelines
Heat transfer
Hydraulic fracturing
Indices
Inhibitors
Ion exchange/EDI
Tales from the Waterside—where long-time water treaters share stories.
Beyond Water…—a series of articles to address real life issues professional water treaters may one day face with helpful suggestions.
Water (What’s) on Your Mind?—a column compiled by James McDonald of on-line discussions from the Industrial Water Treatment interest group on LinkedIn.
Discovering AWT—which provides profiles on AWT member companies that are presented in a way that is educational and non-promotional about each company.
Closing Thoughts
The Analyst has served AWT for 35 years—either as a newsletter or a magazine, but the best is yet to come. Going forward, the quarterly journal aims to remain useful by offering technical content that not only covers the core areas of interest to AWT members but by covering those other water treatment areas that are relevant and could provide new business opportunities for the association.
Acknowledgements
The author would like to thank Angela Pike, AWT; John Baum, Craft Products Co.; and John Schulte, Argentum, for their help in compiling the background information used in this article.
Sources
1. AWT (accessed January 2023). “AWT History,” Association of Water Technologies, Rockville, Maryland, accessible at www.awt.org
2. Baum, J. (January 2023). Personal communication with author.
3. Ketrick, B. (January 2023). Personal communication with A. Pike, AWT.
4. Pike, A. (January 2023). Personal communication with author.
5. Schulte, J. (January 2023). Personal communication with author.
Process controls
Pseudomonas
Pumps
Reclaim water
Reverse osmosis
Scaling
Scale inhibitors
Sustainability/conservation
Troubleshooting
Water sampling
Water testing
Insurance Water usage
Legionella PFAS
Mike Henley provides consulting services through MD Henley & Associates and serves as technical editor of the Analyst. He formerly was editor of Ultrapure Water Journal for 27 years and has been active in several aspects of water treatment and the associated businesses for more than 33 years.
Mr. Henley’s background includes helping with the organization of the technical programs at more than 60 UPW conferences, including Water Executive Forums.

Key words
AWT HISTORY, BIOCIDES, BOILERS, COOLING TOWERS, CORROSION, LEGIONELLA, WATER TREATMENT
11 the ANALYST Volume 30 Number 1
Celebrating 35 Years of the Analyst continued
A Review of Common Water Treatment Rules of Thumb
 Robert J. Ferguson, French Creek Software, Inc.
These rules of thumb were developed from a combination of theory and practical experience since the early days of water treatment and have evolved with technology and as technology adapted to changing industrial processes and environmental restrictions. Rules of thumb have provided guidelines for generations of water treaters. Rules of thumb were considered by many to be “Best Available-Technology” prior to the widespread usage of computer modeling with speciation engines, sophisticated activity calculations, indices based upon free ion concentrations. Rules of thumb are still used by those without access to advanced computer modeling. This article updates changes in the years since the publication of the original “Water Treatment Rules of Thumb: Myth or Useful Tools” was presented at the Association of Water Technologies Fall Meeting in 2003 (1).
Cycles of concentration in cooling systems, and recovery in membrane systems have continued to increase since the original article. This update describes modifications to rules of thumb to keep pace with the evolution of water treatment technology. Scale control in cooling water and membrane systems is emphasized. Scales discussed in the context of evolution from then to now include calcite, various forms of silica and metal silicates, and sulfates, including barium sulfate. Rules of thumb are not a substitute for speciation engine saturation ratio modeling and other advanced indices.
Rules of Thumb
The training courses offered by technical organizations and water treatment service companies include many “rules of thumb” to guide fledging and advanced water treatment chemists in maintaining an effective, well-controlled cooling water or membrane system treatment program. Most of the industry standard rules of thumb are delineated and explained in the AWT Training Manual (2).
Rules of thumb can include simple guidelines like:
Maintain less than 120 parts per million (ppm) of silica as SiO2 in an acid pH control range.

Maintain less than 150 ppm of silica as SiO2 in a neutral pH control range.
Maintain less than 180 ppm of silica as SiO2 in an alkaline pH control range.
13 the ANALYST Volume 30 Number 4
And in recent years, this guide has also become common:
Maintain less than 250 ppm of silica as SiO2 in an alkaline pH control range treated with a silica-specific copolymer.
For stressed calcium carbonate systems, a rule of thumb might have evolved from the following:
Control pH or cycle to a Langelier Saturation Index (LSI) of less than 2.5 in a treated system.
To:
Control pH or cycle to a Calcite Saturation Ratio of less than 150 in a system treated with a simple phosphonate or polymer.
Control pH or cycle to a Calcite Saturation Ratio of less than 200 in a system treated with a copolymer/ terpolymer and stressed calcite phosphonate.
Rules of thumb in use by different service companies might differ due to the experience and target markets involved. For example, a company dealing primarily with high temperature, high-heat flux, low-flow critical systems will probably have lower calcite saturation limits than a company treating primarily HVAC (heating ventilation air conditioning) towers (3-5).
This article focuses on several important topics related to different aspects to the chemical treatment of water, including the scale formation and control of:
Silica
Magnesium silicate
Calcium carbonate
Scaling indices
Sulfate scale
Formulating for treatment synergy
This paper reviews the rules of thumb in comparison more accurate, reproducible, computer modeling. The rules of thumb are limited in applicability between systems and at higher total dissolved solids systems where cooling systems now operate.
1. Silica Rules of Thumb Now and Then
Silica control in cooling and other industrial water systems can be directed at amorphous silica, non-stoichiometric metal silicates like magnesium silicates (MgSiO3), and stoichiometric metal silicate scales like MgSiO3 in higher temperature systems. Silicates can be a sole scale, a crystalline deposit, or an amorphous powder. Silica frequently coprecipitates with scales like calcite. It is of note that silicates are used to harden concrete highways, in much the same manner that they harden carbonate-based scales (5).
Historic treatments and control to prevent silicates were based upon:
Setting silica maximums based upon the pH and temperature.
Choosing a pH range to minimize silica scale and coprecipitation potential.
Totally preventing other scales to prevent coprecipitation.
14 the ANALYST Volume 30 Number 1
A Review of Common Water Treatment Rules of Thumb continued
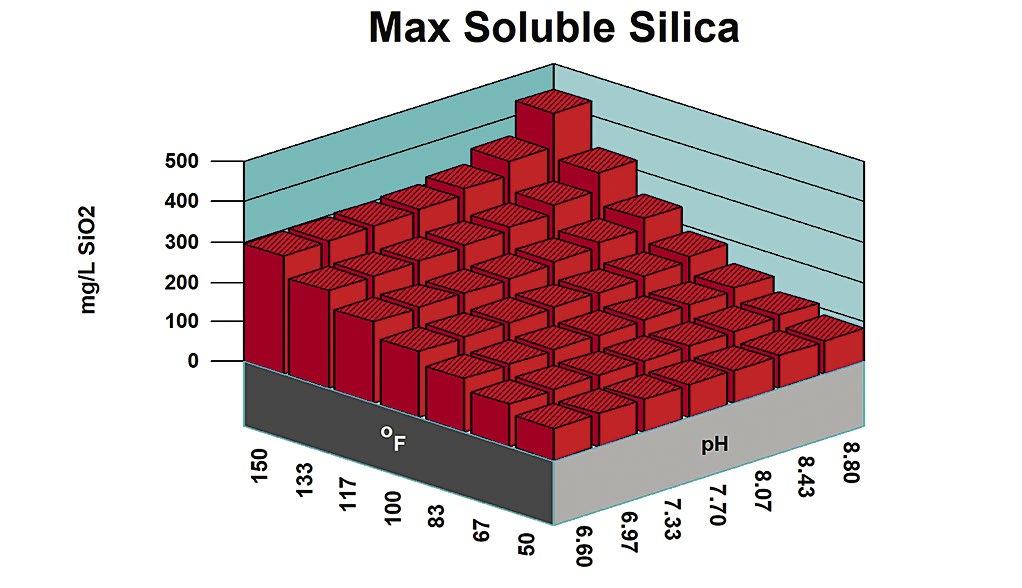
Figure 1: Maximum silica solubility.
Figure 2: Silica saturation ratio acid pH range treatments.
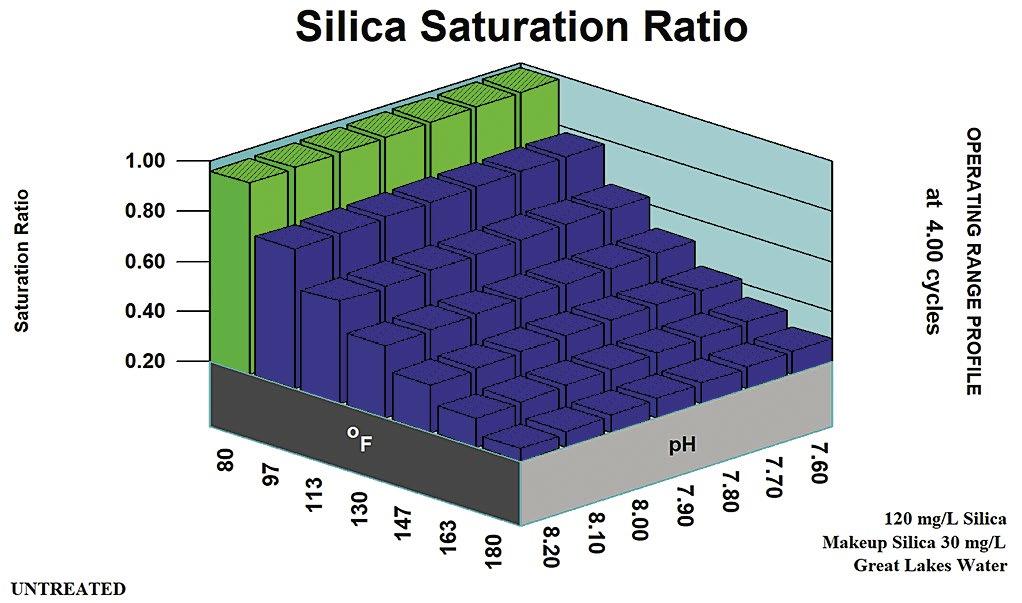
In the days of acid chromate and acid phosphate programs, amorphous silica was at its lowest solubility for cooling water control ranges. A recirculating water silica concentration of 120 ppm was considered a typical SiO2 limit in the pH 6.0 to 6.8 range, where the programs were typically controlled. This equated to 1.0 to 1.2 x Saturation for amorphous silica.
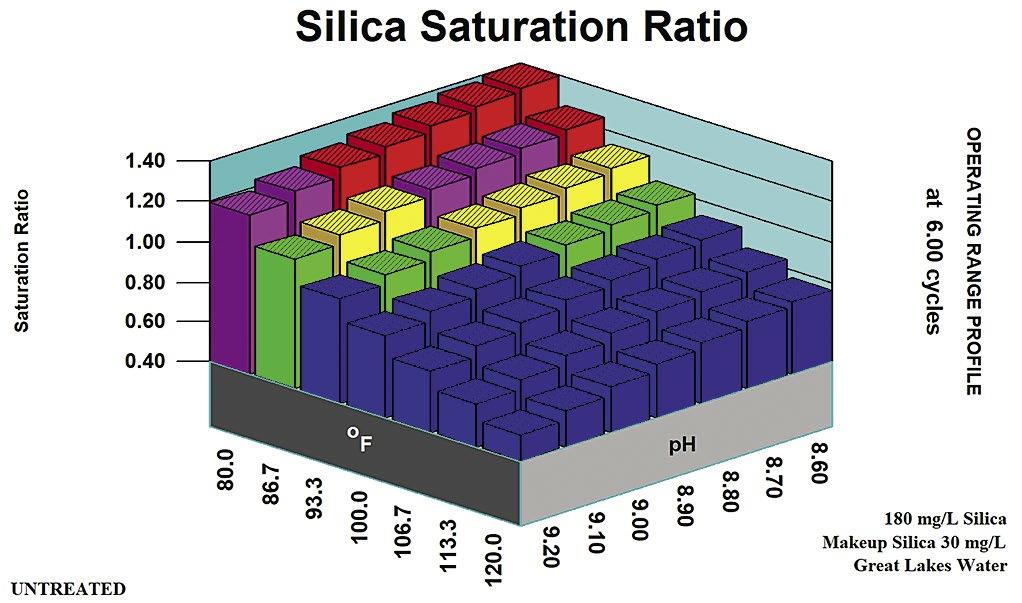
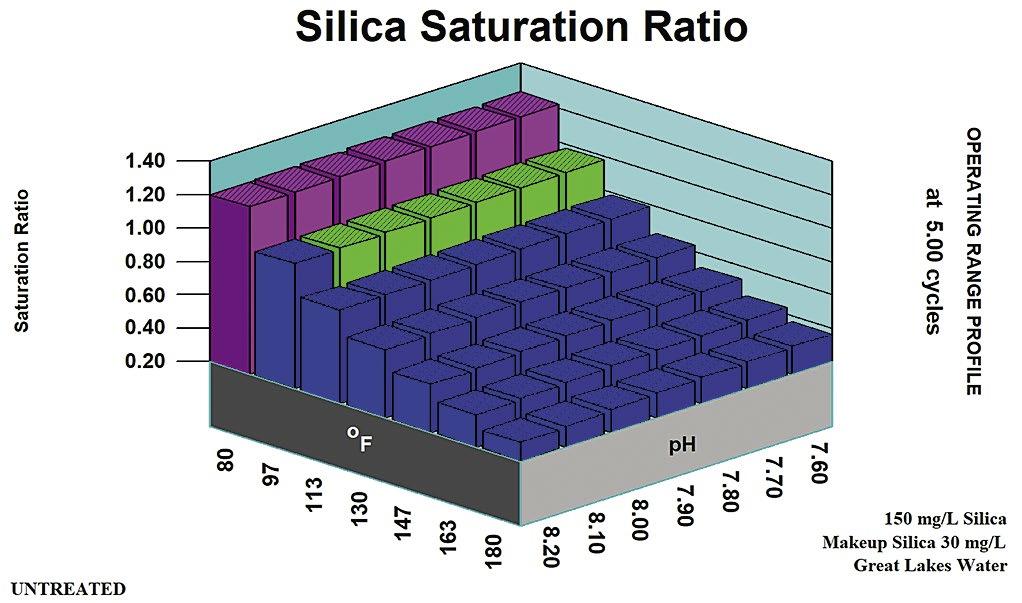
Figure 1 profiles amorphous silica solubility versus pH and temperature. Ranges for typical treatments are noted. Figure 2 shows the silica saturation ratio acid pH range treatments.
Neutral pH phosphate, zinc and low-chromate chrome zinc programs, operated in the range where 150 ppm silica as SiO2 was considered a typical limit in the recirculating water. A recirculating water silica concentration of 150 ppm was considered a typical SiO2 limit in the pH 7.6 to 8.2 range where the programs were typically controlled. This equated to 1.0 to 1.2 x saturation for amorphous silica. Figure 3 shows the silica saturation ratio in the neutral pH range.
In the past, 180 ppm silica as SiO2 was considered the upper limit in the recirculating water for high-pH, low-phosphate and all-organic programs, operated at a pH of 8.6 or higher. A recirculating water silica concentration of 150 ppm was considered a typical SiO2 limit in the pH range above 8.2 where the programs were typically allowed to equilibrate. This limit also equated to 1.0 to 1.2 x Saturation for amorphous silica. Figure 4 presents the silica saturation ratio in the alkaline treatment range of pH 8.6 and higher.
These traditional limits for treatment programs were based upon amorphous silica solubility and did not rely upon copolymer or other inhibitors to extend the upper limit and allow higher cycles of concentration with respect to amorphous silica solubility. In higher pH ranges, and where coprecipitation may occur, other rules of thumb come into play.
A standard method for preventing silica-bearing deposits in many reverse osmosis treatments was inhibitor over kill. Treatments and scale-forming specie concentrations were operated to prevent scales such as calcite, gypsum, magnesite and metal hydroxides. This prevented incorporation of hardening silica into the deposits (6). Maintaining pH below 8.5 can limit co-precipitation with metal hydroxides such as Mg(OH)2 (7).
Treatment with a copolymer has been reported as preventing or reducing adherence of silica-based scales to heat transfer surfaces, easing their removal. A higher non-ionic nonionic character reportedly improves silica control performance of a polymer (6-11). Table A provides a comparison of the rules of thumb for amorphous silica.
15 the ANALYST Volume 30 Number 1
A Review of Common Water Treatment Rules of Thumb continued
Figure 3: Silica saturation ratio in the neutral pH range.
Figure 4: Silica saturation ratio in the alkaline treatment range.
Program Limit pH Range Temperature Comments Acid Chromate Acid Phosphate 120 ppm SiO2 5.8 – 7.2 1.0 x Saturation at 77 oF pH adjustment for CaCO3, Ca3 (PO 4)2 control Alkaline Zinc Alkaline PO 4 150 ppm SiO2 7.2 – 7.6 1.0 x Saturation at 85 oF Phosphonates/Polymers for CaCO3, Ca3 (PO 4)2 control No pH Control 180 ppm SiO2 8.6 – 9.0+ 1.0 x Saturation at 85 oF Phosphonates/Polymers for CaCO3, Ca3 (PO 4)2 control
Table A: Amorphous Silica Rules of Thumb Comparison Summary.
Treated Limits
The application of polymers for silica control has become a common practice in the past 20 years. Increases of control to limits in the range of 2.0 to 2.8 x saturation have been reported. This profile uses amorphous silica as a driving force. Many other forms of silica may be involved as driving forces for silica scale formation and its control (6-10).
Amorphous silica treatment
Stoichiometric magnesium silicate
Silica adsorption/absorption and inclusion in metal hydroxide precipitates (e.g., magnesium hydroxide [Mg(OH)2]).
Other metal silicates including tenacious iron silicates.
Silica inclusion in carbonate and phosphate scales as a coprecipitate and hardener.
Natural forms of higher concentrates such as aluminum lakes.
Clays.
The potential for a myriad of silica scale forms complicates the establishment of limits for the actual scale being controlled, and for a successful application. Rule of thumb limits tend to have an Amorphous silica basis (saturation ratio/or silica concentration) or a derived limit such as a [Mg] x [SiO2] product.
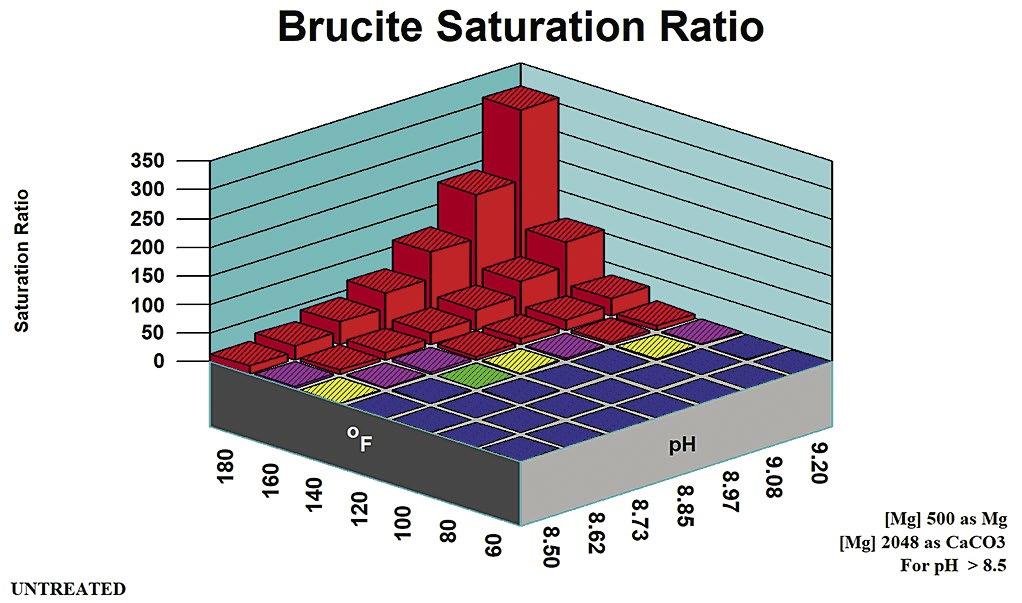
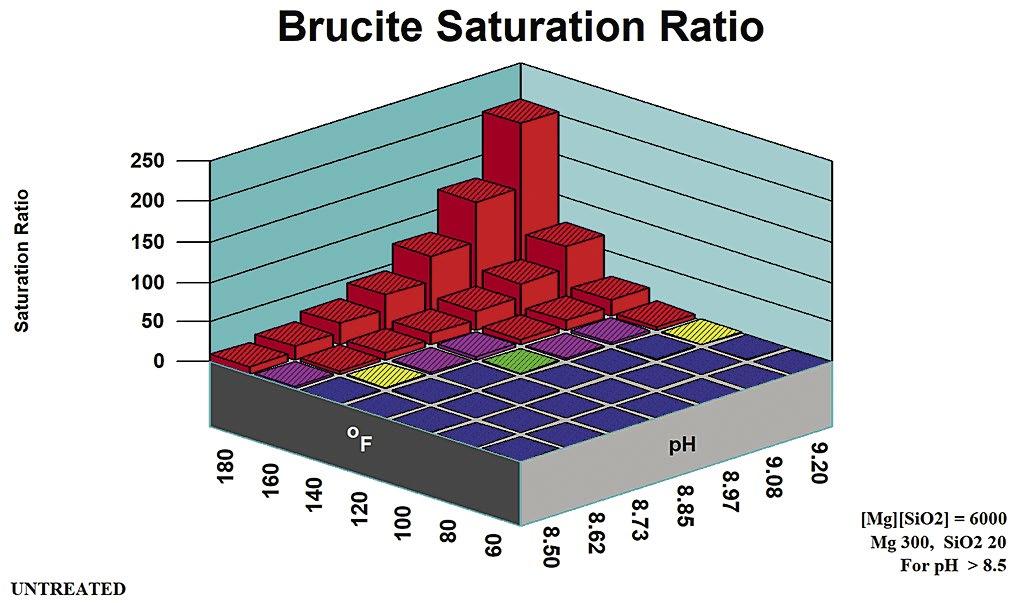
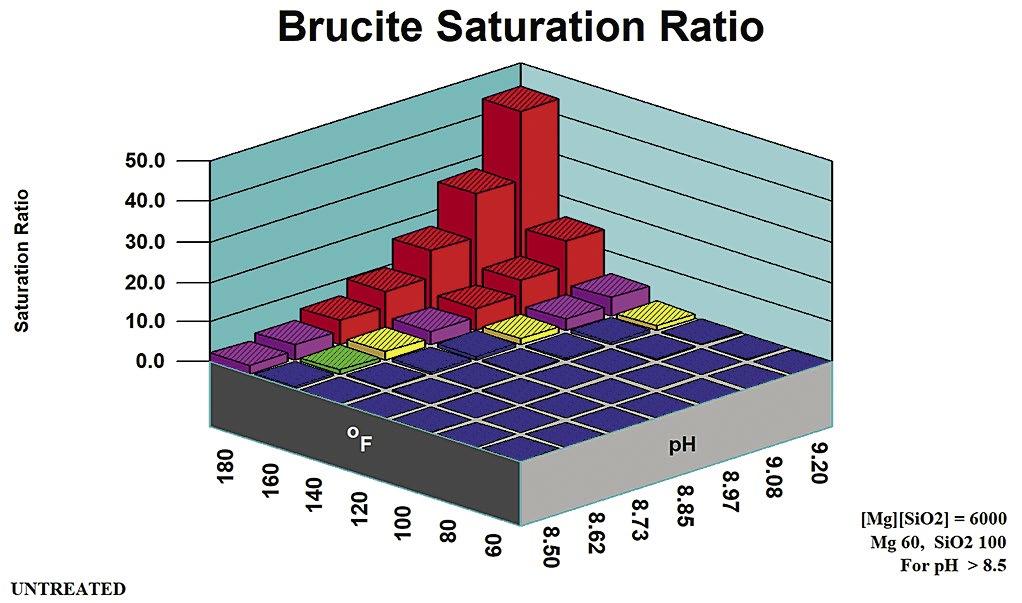
A principal method for minimizing, or preventing alkaline silicate scales such as magnesium silicates, is to maintain a pH below 8.5 (7). The upper pH limit can also be estimated by profiling saturation ratio versus pH for brucite and other metal hydroxides.
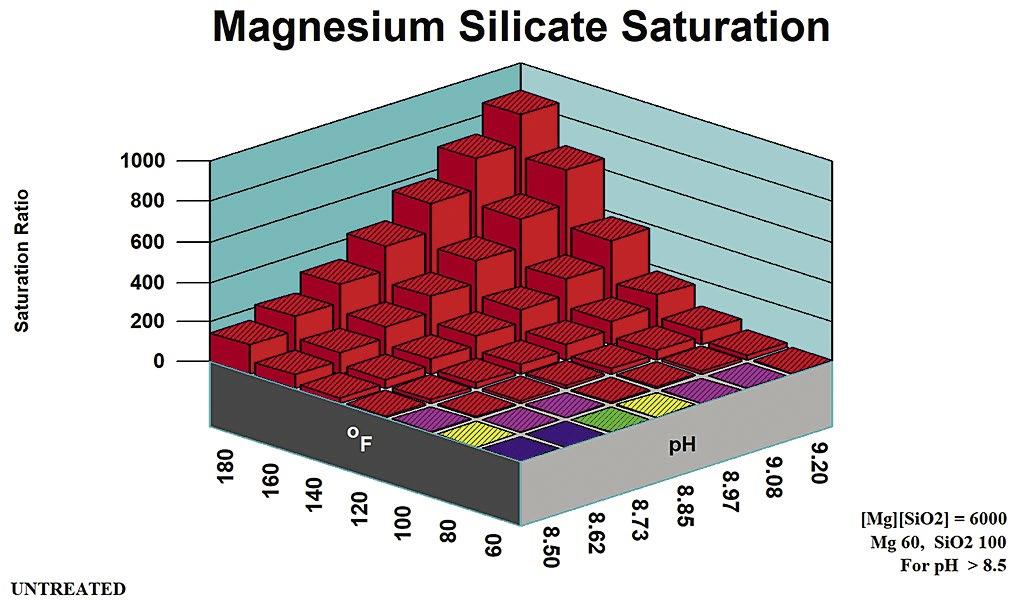
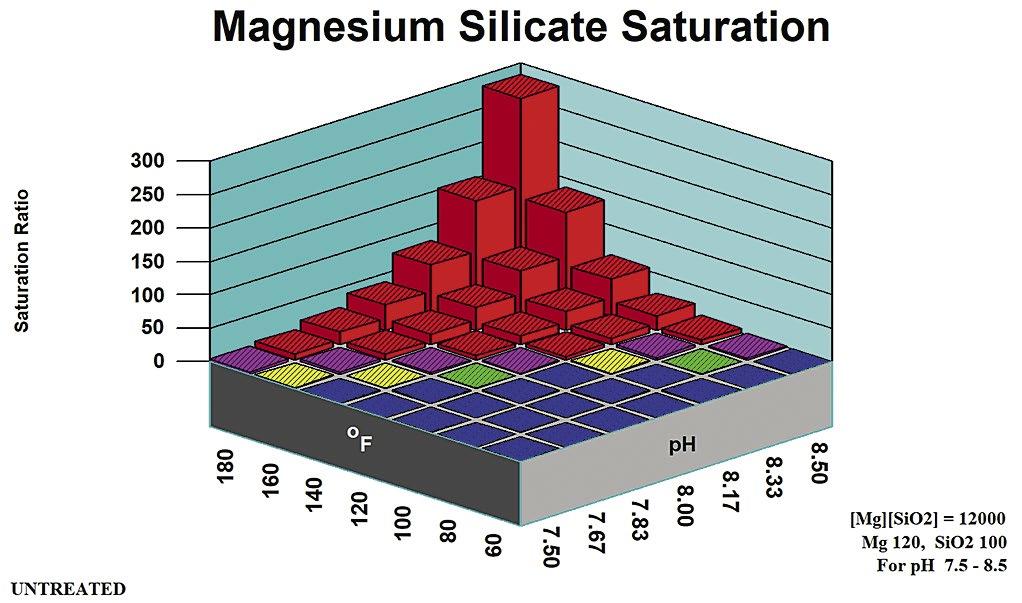
2. Magnesium Silicate Rules of Thumb
Rules of thumb for magnesium silicate are more complex than for other potential scales. They are divided into pH zones, as outlined in Table B. Figure 5 profiles magnesium hydroxide (brucite) solubility as an indicator of co-precipitation Stoichiometric Magnesium Silicate is under the control of [Mg] and {SiO2} concentrations. Magnesium silicate saturation ratio is a direct indicator of scale potential for the stoichiometric form potentials for non-stoichiometric magnesium silicate. Silica adsorbs onto, or is absorbed into, precipitation Mg(OH)2 to form a hard deposit.
Stoichiometric
Magnesium silicate can form in a cooling system via two distinct mechanisms: through the formation of a stoichiometric MgSiO3, and through interaction with precipitating magnesium hydroxide (Brucite) Magnesium silicate (Serpentine0 saturation ratio is used by computer modeling systems for the stoichiometric scale. Brucite saturation ratio (Mg(OH)2) is used in computer modeling to profile non-stoichiometric magnesium silicate potential.
Table B: Stoichiometric Magnesium Silicate Rules of Thumb.
Stoichiometric magnesium silicate expected. Mg(OH)2 undersaturated.
mg/L SiO2
pH > 8.5 [Mg][SiO2] < 6,000
as mg/L Mg, SiO2 as mg/L SiO2
Stoichiometric magnesium silicate expected. Mg(OH)2 undersaturated except at extremes of pH, temperature, Magnesium concentration.
May be supersaturated in Mg(OH)2. Silica adsorption/ adsorption within/upon precipitating brucite {Mg(OH)2 mineral} expected.
Calcium silicate and other metal silicate scales might also be expected in cooling systems at typical cooling water temperature and pH ranges.

A major obstacle to advancing the understanding of silica formation and control is the lack of standardized inhibitor efficacy tests and protocols (8). Many laboratory tests target a single precipitant such as amorphous silica or magnesium silicate and do not represent field conditions and the precipitation/coprecipitation environment.
The rules of thumb providing different product limits for the neutral, alkaline and high pH ranges of operation.
16 the ANALYST Volume 30 Number 1
A Review of Common Water Treatment Rules of Thumb continued
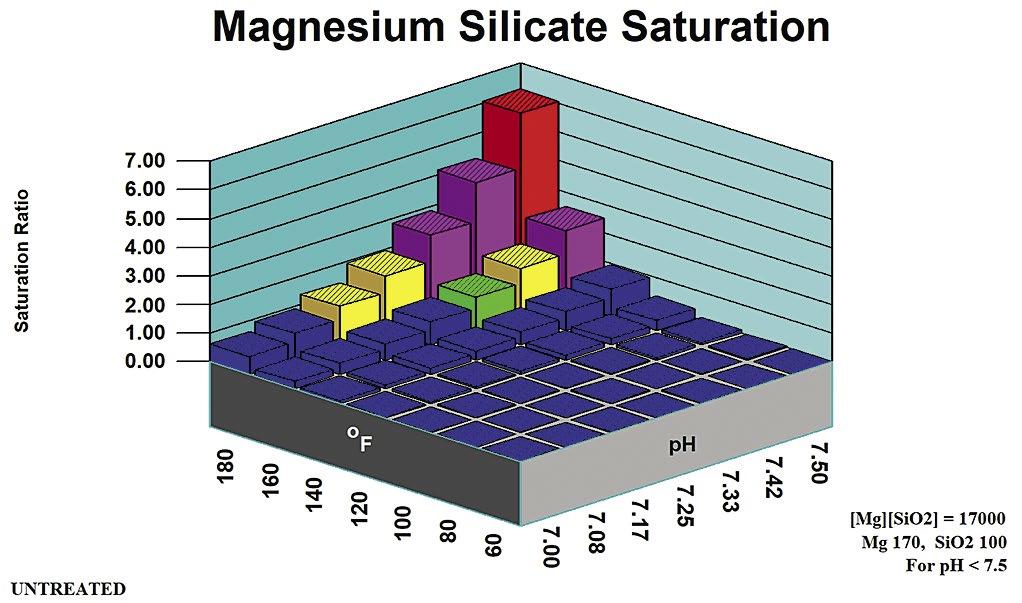
Applicable pH Range Ion Product Limit Comments pH < 7.5 [Mg][SiO2] < 17,000 Mg as mg/L Mg, SiO2 as mg/L SiO2
pH 7.5 – 8.5 [Mg][SiO2] < 12,000 Mg as mg/L Mg, SiO2 as
Mg
Activity product is defined as the product of {Mg} and {SiO2}. Formulas used for the limits calculation and the appropriate pH range for each limit.
Non-Stoichiometric Magnesium Silicate
When non-stoichiometric magnesium silicate forms, silica adsorbs onto, or is absorbed into, precipitating Mg(OH)2 to form a hard deposit. Both brucite (magnesium hydroxide) saturation and silica concentration provide the driving forces for non-stoichiometric magne-
silicate deposition.
17 the ANALYST Volume 30 Number 1
A Review of Common Water Treatment Rules of Thumb continued
Figure 5 profiles the speciation engine saturation ratios in the range covered for the magnesium silicate in the neutral pH range of 7.5 or below.
Figure 8: Brucite saturation ratio in low-magnesium water (60 mg/L).
Figure 9: Brucite saturation ratio in moderate magnesium water (300 mg/L).
Figure 10: Brucite saturation ratio in high magnesium water (500 mg/L).
Figure 5: Magnesium silicate saturation ratio in the neutral pH range treatments.
Figure 6: Magnesium silicate saturation ratio in the alkaline and pH range treatments.
Figure 7: Magnesium silicate saturation ratio in the high-pH range treatments.
sium
3. CaCO3 Rules of Thumb—Then and Now Simple Indices, Ion Association Saturation level, Treated, Untreated
Simple indices are still frequently used as rules of thumb to predict the formation of calcium carbonate scale, to determine maximum cycles of concentration, and to establish a pH control range, despite the availability of more reproducible saturation ratios and indices calculated using a speciation engine. Rules of thumb have also been established for upper limits of common scale inhibitors based upon simple indices. The most frequently used indices in cooling water treatment are those developed by Langelier (12), Ryznar (13), and Brookes and Puckorius (14). This section discusses the advantages and disadvantage of each index and compares them to more rigorous calculated indices such as ion association model saturation indices. Table C lists calcium carbonate (CaCO3) rules based on these common indices.
Simple indices and the more rigorous ion association model saturation levels are both derived from the basic solubility equation (Equation 1).
{Ca}{CO3} = Ksp at equilibrium
Where:
Ca is the calcium activity
CO3 is the carbonate activity
Ksp is the solubility product.
Eq. 1
The simple indices and saturation levels differ in how these properties are calculated. The biggest difference is in the handling of ion pairs, or bound ions.
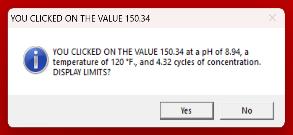
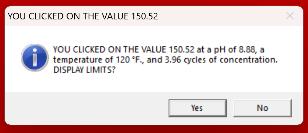
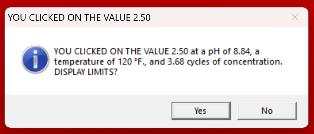
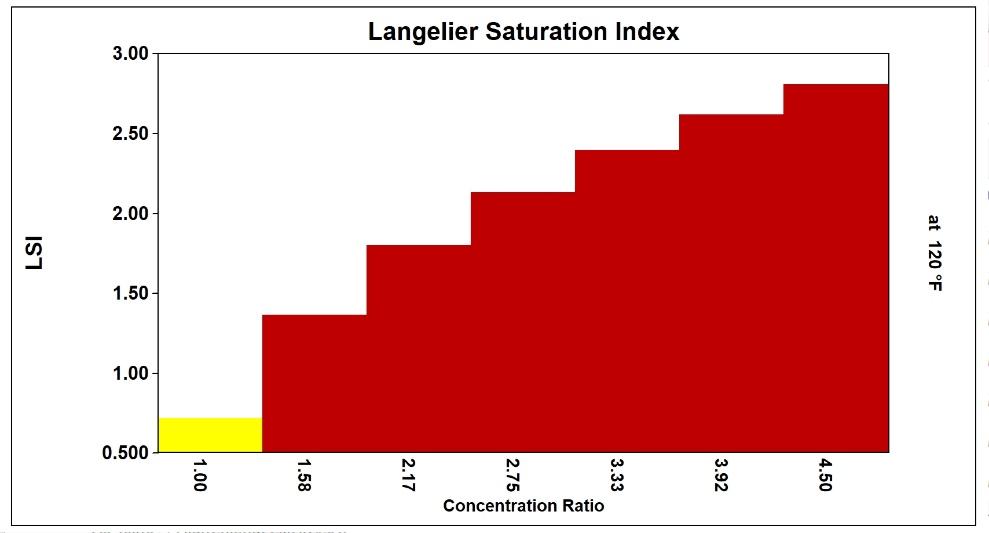
Sulfate, for example, readily forms calcium sulfate aqueous, making some of the calcium unavailable to participate in the formation of calcium carbonate scale. Simple indices, like the LSI, ignore the formation of aqueous calcium sulfate and similar species. As a result, the simple indices tend to exaggerate the scale potential in high-sulfate waters. Rigorously calculated ion association saturation levels are not affected. This phenomena covered extensively in the literature (11-14).
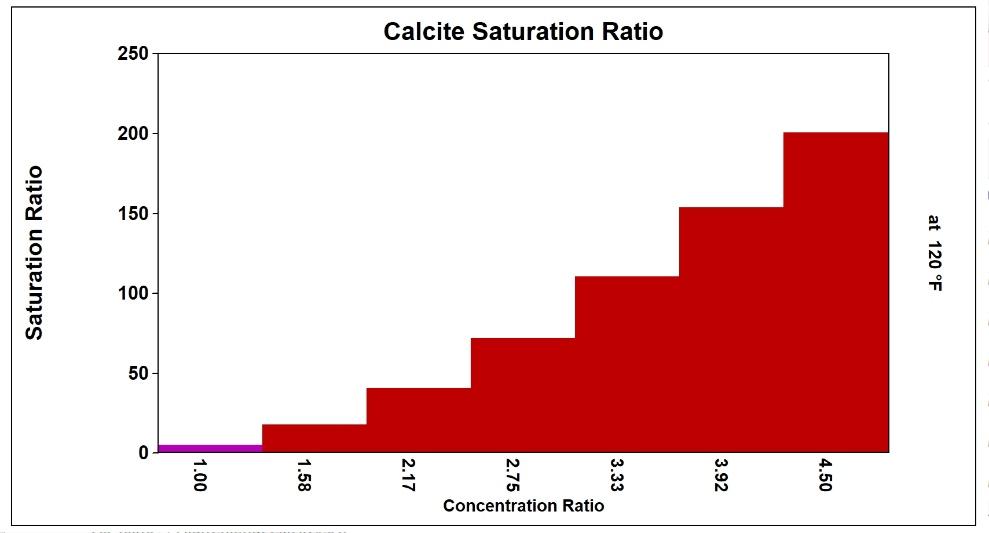
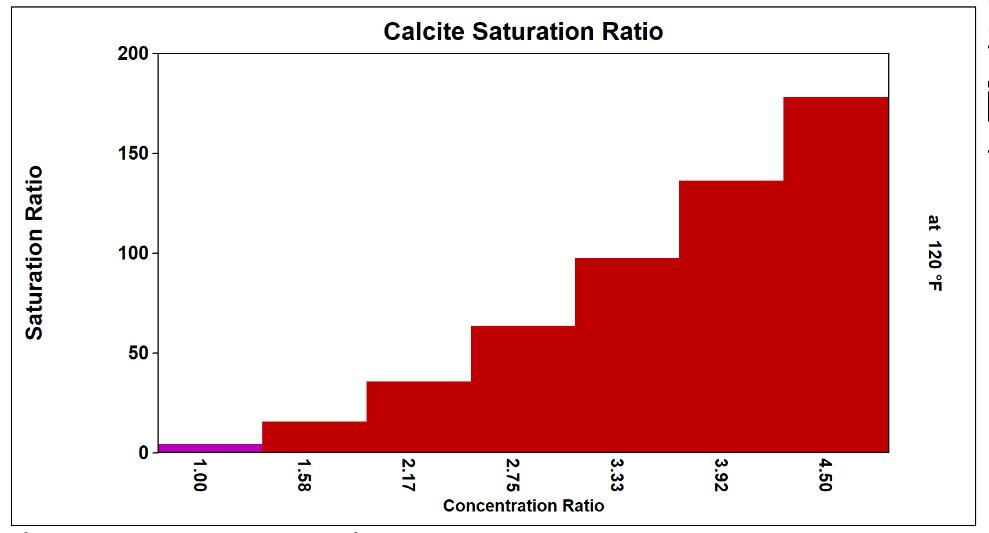
Practically, the use of simple indices can lead to operation at lower than optimum cycle of concentration in high-sulfate waters. Common inhibitors, for example, can prevent calcium carbonate scale formation up to a calcite saturation level of 150, which equates to an LSI of 2.5 in low-sulfate waters. Scale control is lost above these limits. Figure 11 compares the LSI and the calcite saturation level in a high sulfate water. The bound ion effect becomes extremely significant in the high-sulfate example.
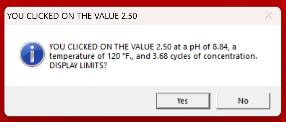
Reliance on the LSI limit of 2.5, rather than the ion association model calcite saturation level limit of 150, would result in operation at 3.5 rather than actual limit of 4.2 cycles, in this case (13).
Similar effects are encountered when comparing calcite saturation level limits to other simple indices such as the Ryznar Stability Index (RSI), and Practical Scaling Index (PSI).
18 the ANALYST Volume 30 Number 1
A Review of Common Water Treatment Rules of Thumb continued
Index Untreated Limit Treated Limit Stressed Inhibitor Limit Comments Langelier Saturation Level 0.0 – 0.2 2.5 3.0 Use alkalinity corrected for noncarbonate (e.g., NH3, CN, PO 4, Si) alkalinity. Ryznar Stability Index 6.0 – 5.8 4.0 3.5 Empirical rearrangement of pH and pHs used to calculate the LSI. Practical Scaling Index 6.0 – 5.8 4.0 3.5 Interpretation similar to Ryznar. Index applicable to NH3 or other alkali contaminated waters. Calculates a pH as if only carbonic acid-based alkalinity present. Calcite Saturation Level 1.2 – 2.5 135 – 150 200 - 225 Index corrects for ion pairing, noncarbonate alkalinity, activity effects. Reproducible results at the same index.
Table C: Calcium Carbonate Rules of Thumb.
Figure 11: Limits comparison as determined by simple indices versus free-ion saturation ratio.
Low Sulfate, High Chloride Make-up


Calcium is mostly free
Calcite Saturation Ratio
150x limit reached at 3.96 cycles


High Sulfate, Low Chloride Make-up


A significant percentage of Calcium is bound

Calcite Saturation Ratio


150x limit reached at 4.32 cycles

L.S.I. 2.50 limit reached at 3.68 cycles
L.S.I. 2.50 limit reached at 3.68 cycles

19 the ANALYST Volume 30 Number 1 A Review of Common Water Treatment Rules of Thumb continued
4. Sulfate Scale Rules, Then and Now
A common rule of thumb would look something like this:
[Ca][SO4] < 500,000 untreated, [Ca][SO4] < 10,000,000 treated
The rule of thumb recommend carrying an ion product [Ca][SO4] of less than 500,000 in an untreated system, or up to 10,000,000 in a system treated with standard inhibitors. Table D compares these limits to ion association model saturation levels for gypsum and anhydrite. Gypsum is the expected form of calcium sulfate scale in cooling systems. Anhydrite is more prevalent at temperatures above those normally encountered in cooling water.
It can be seen that the untreated rule of thumb limit corresponds to an ion association model saturation level of approximately 1 at 120 oF. The treated limit corresponds to a gypsum saturation level of 5 at 120 oF.
Saturation level guidelines for treatment of calcium sulfate are commonly an upper limit of 2.5 X saturation for gypsum, using common scale inhibitors such as AMP, HEDP, and PAA. This corresponds to a [Ca][SO4] product of 2,400,000. The recommended limit for specific calcium sulfate inhibitors such as those in the phosphino carboxylic acid family is 5 X Saturation and corresponds to the 10,000,000 [Ca][SO4] ion product limit.
“Super” inhibitors have raised the upper limit for a treated since the original paper was published. Control up to 8.0 x Saturation has been reported for gypsum.
The rules of thumb for calcium sulfate agree with ion association model saturation levels at 120 oF. As with other rules of thumb, care should be taken in using them at temperatures other than 120 oF. These rules become less reliable as the temperature deviates from 120 oF.
Synergy has been observed between phosphonates and polymers, which raise the upper limit for treated systems
and decrease the inhibitor dosage requirement for equivalent induction time extension (15).
5. Barium Rules of Thumb
Barium sulfate (BaSO4) was rarely considered as a potential scale when the original “Water Treatment Rules of Thumb …” paper was written. Cycles have increased, and water source quality decreased since then. The higher cycles have elevated the 0.019 milligrams per liter (mg/L) of Ba (as Ba) typically found in Lake Michigan water, to a potential scale forming species (16). The use of reuse water, such as reverse osmosis concentrate as a portion of makeup water, has also created a high potential for barite (BaSO4) deposition in reuse applications.
There are no simple ion product rules of thumb ([Ba] x[SO4] < …) or simple indices that have been used by treaters of cooling water. Rules of thumb in use are based upon Ion Association Model Saturation Ratios. Simple inhibitors such as polyacrylic acid (PAA), aminotris (methylenephosphonic acid (ATMP) and other phosphonates have been reported to fail above a Barite saturation ratio of 80. The higher phosphonates such as diethylenetriaminepentaacetic acid (DTMPA) have been observed to have an upper limit above 100x barite saturation when applied in combination with a copolymer. Historically, treatments for barite were common in membrane system applications, and oil field brine chemistry.
Corrosion Inhibitor Guides
Many seasoned water treatment chemists control low-phosphate alkaline cooling water programs in a tricalcium phosphate saturation ratio range of 500 to 1,500 x Saturation.
Control alkaline zinc programs at a pH and zinc concentration so that the total zinc residual is double the soluble zinc (17).
Control alkaline zinc phosphate and zinc pyrophosphate programs so that the recirculating water is saturated, or slightly supersaturated, with zinc phosphate or zinc pyrophosphate.
20 the ANALYST Volume 30 Number 1
A Review of Common Water Treatment Rules of Thumb continued
The training courses offered by technical organizations and water treatment service companies include many “rules of thumb” to guide fledging and advanced water treatment chemists in maintaining an effective, well-controlled cooling water or membrane system treatment program.

There’s a world of difference between a one-size-fits-all toll blender and an experienced custom water treatment blender like QualiChem. Contact us to learn why the blender really does matter… to you and your customers. 800.296.9102 | www.qualichem.com AN ISO 9001:2015 COMPANY Precision Manufacturing Formulatory Expertise Application Support Custom GHS-Compliant Labels and SDSs No Direct Sales
The Blender Matters
6. Formulating for Synergy Rules (Then and Now)

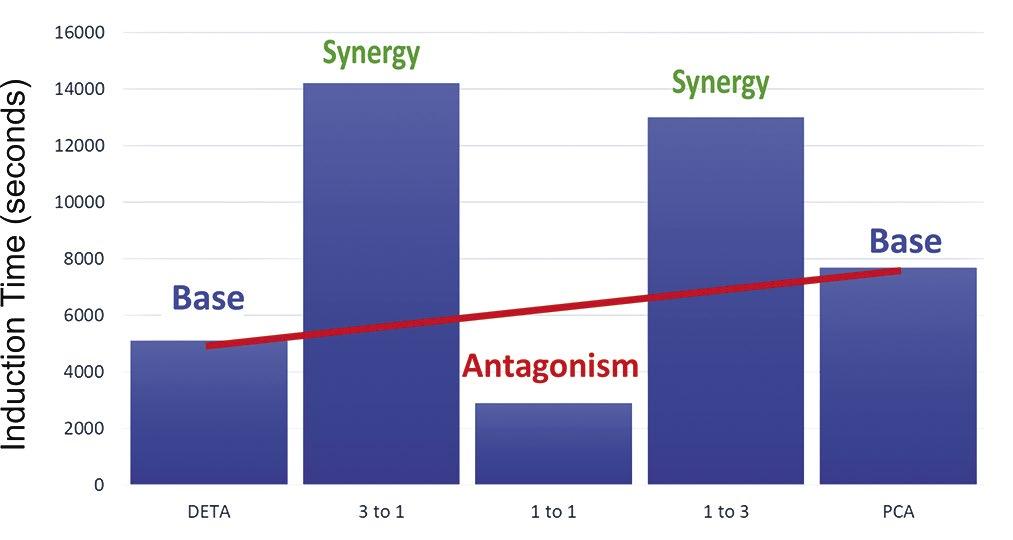
It was observed in the 1970s that blending a phosphonate like 1-hydroxyethylidene-1, 1-diphosphonic acid (HEDP) with a polymer like poly maleic anhydride (PMA) increased the upper limit for calcite control. Above the limit, control would be lost at any inhibitor dosage. The same phenomenon was reported for blends of “super” phosphonates like 2-phosphonobutane-1,2,4-tricarboxylic acid (PBTC) with a polymer like PMA. Since then, the impact combinations of polymer blends on upper limits for control, and induction time extension versus dosage have been refined. Both “synergy,” in the form of an increased upper limit or decreased dosage requirement for an induction time
extension, have been observed as well as their antithesis, “antagonism” in the form of a decreased upper limit, or an increased dosage requirement for induction time extension. The enhancement or competitive effect appears to be dependent upon the ratio of polymer to phosphonate. The sweet spot of 1:3 or 3:1 has been reported for some combinations (16).
The combination of PBTC and PMA demonstrated the most dramatic impact of blending upon the upper saturation limit for calcite, as depicted in Figure 12. As the blend ratio in the test goes from polymer only to phosphonate only, there appears to be a drop in the upper limit at high polymer to PBTC ratios, possibly indicating an antagonistic effect when the polymer is the
22 the ANALYST Volume 30 Number 1
A Review of Common Water Treatment Rules of Thumb continued
primary inhibitor. The upper limit failure point increases to a maximum at a ratio of 3 to 1 of PBTC-to-polymer, with the upper limit of the higher ratios indicating a synergy between the PBTC and lower levels of PMA. This trend has been observed in field applications.
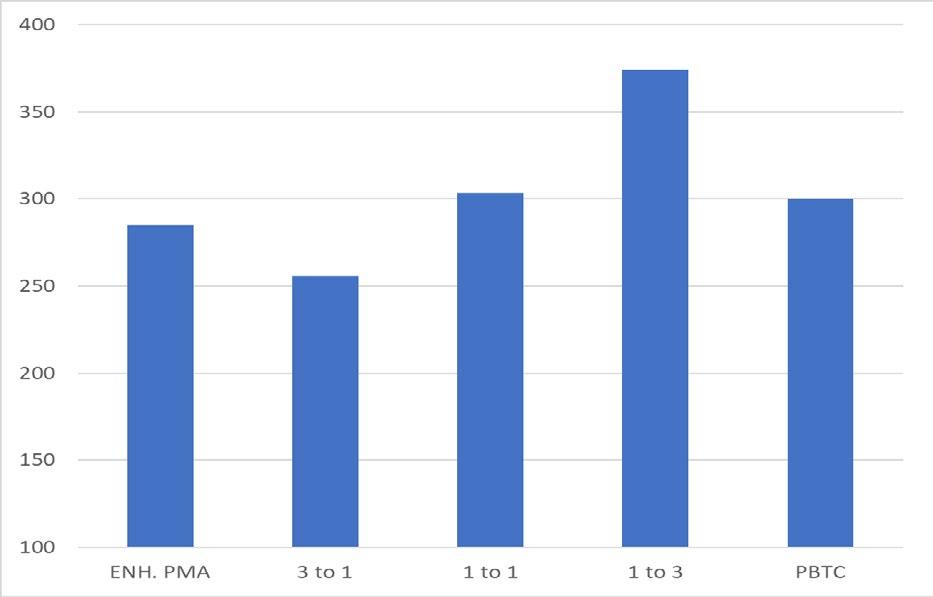

The polymer ot phopshonate ratio also affects the induction time extenion achieved by the combination, as outlined in Figure 13.
Inhibitor models in use at the time of the original paper (2003) were typically correlated to the total inhibitor concentration. Common models have evolved to correlations to the active, dissociated form of the scale inhibitor since then (18).
Summary
Rules of thumb on different aspects of water treatment have provided useful guidelines for generations of water treaters. Significant advances have been made in the evaluation of scale potential and inhibition for most scales since the original paper. Dosage models have advanced to the point where formulation have been tailored for synergy and antagonism with respect to upper limits for control, and with respect to the minimum effective dosage for induction time extension. Advanced computer modeling must be employed to evaluate synergy and antagonism, and their impact upon upper limits and induction time. Silica (and silicate) scale formation and control remain the least understood and possibly the most complex water treatment technologies. Although significant advances have been made, further work is mandatory if the process of silica-based scale formation and inhibition is to be understood to the degree of other economically significant scales. The simple ion product rules of the past have all been superseded by rules based upon more sophisticated, reproducible, and universal free-ion saturation ratios and indices.
23 the ANALYST Volume 30 Number 1
A Review of Common Water Treatment Rules of Thumb continued
Base Base Antagonism Synergy Saturation Ratio Upper Limit Neutral
Figure 12: Impact of polymer-to-phasphonate ratio upon calcite saturation ratio limit for enhanced PMA and PBTC levels.
Figure 13: Impact of polymer-to-phosphonate ratio upon induction time extension for gypsum.
References
1. Ferguson, R.J. (2003). ”Water Treatment Rules of Thumb: Useful Facts or Myth?”, the Analyst
2. Freedman, A.J.; Cotton, I.; Hollander, O.; Boffardi, B. (2001). Technical Reference and Training Manual (TR&TM), original edition, Association of Water Technologies, Rockville, Maryland.
3. Ferguson, R.J. (September 2020). “Interpreting and Applying Scale Indices and Saturation Ratios to Identifying and Solving Water Treatment Challenges,” 2020 Association of Water Technologies virtual conference.
4. Ferguson, R.J. (August 18, 2020). “Interpreting Indices in Context and Setting Limits,” Webinar, available at https://vimeo.com/451309283
5. Ferguson, R.J. (November 2020). “Modeling Mineral Scale Precipitation Mass in Industrial Systems,” Paper No. IWC 20-73, 81st International Water Conference (2020 virtual meeting).
6. Ferguson, R.J. (2019). “Tailoring Scale Prediction Models to a Specific Application: Reverse Osmosis,” Paper No. 201913238, CORROSION/2019, National Association of Corrosion Engineers, Houston, Texas.
7. Gill, J. (June 2021). Personal communication with article author.
8. Young, K.L. (June 2021). Personal communication with article author.
9. Zibrida, J.F. (June 2021). Personal communication with article author.
10. Standish, M. (June 2021). Personal communication with article author.
11. Gover, W.R. (June 2021). Personal communication with article author.
12. Langelier, W.F. (1936). “The Analytical Control of AntiCorrosion Water Treatment,” Journal of the American Water Works Association 28(10), pp. 1500-1621.
13. Ryznar, J.W. (April 1944). “A New Index for Determining Amount of Calcium Carbonate Scale Formed by Water,” Journal of the American Water Works Association 36(4)
14. Brookes, M.; Puckorius, P. (September 1983). “Get a Better Reading on Scaling Tendency of Cooling Water,” Power, pp. 79-81.
15. Ferguson, R.J. (1991). “Computerized Ion Association Model Profiles Complete Range of Cooling System Parameters,” Paper No. IWC-91-47, 52nd International Water Conference, Pittsburgh, Pennsylvania.
16. Ferguson, R.J.; Freedman, A.J.; Fowler, G.; Kulik, A.J.; Robson, J.; Weintritt, D.J. (1994). “The Practical Application of Ion Association Model Saturation Level Indices to Commercial Water Treatment Problem Solving,”, American Chemical Society Annual Meeting, Division of Colloid and Surface Chemistry Symposia, Scale Formation and Inhibition, Washington, D.C.
17. Ferguson, R.J.; Young, K.L.; Glover, W.R. (November 2018). “The Practical Application of Ion Association Speciation Models to Mineral Scale Formation and Control in High-Ionic Strength Membrane Systems,” Paper No. IWC 18-08, 79th International Water Conference, Phoenix, Arizona.
18. Ferguson, R.J. (February 2020). “Tailoring Scale Prediction Models to a Specific Application: Cooling Water, Paper No. TP-19-20, Annual Cooling Technology Institute Conference. Houston, TX.
19. Ferguson, R.J. (November 13-17, 2011). “Mineral Scale Prediction and Control at Extreme TDS,” Paper No. IWC 11-77, 72nd International Water Conference, 72nd Annual Meeting, Orlando, Florida.
20. Ferguson, R.J.; Standish, C.; Young, K.L.; Glover, W.R. (2020). “In Search of Synergy: Inhibitor Synergy and Antagonism in Scale Control,” Paper No. C2020-14538, prepared for Corrosion/2020, National Association of Corrosion Engineers, Houston, Texas.
21. Ferguson, R.J.; Ferguson, B.R. (2010). “The Chemistry of Strontium and Barium Scales,” Association of Water Technologies annual conference.
22. Ferguson, R.J. (November 10-12, 1993). “Developing Corrosion Inhibitor Models,” Presented at WaterTech '93, Houston Texas.
23. Ferguson, R.J. (February 9-12, 2015). “The Impact of Inhibitor Speciation on Efficacy: pH, Ionic Strength, and Temperature Impact,” presentation at the 2015 Cooling Technology Institute Annual Conference, New Orleans, Louisiana.

Glossary of Abbreviations
1. ATMP = aminotris (methylenephosphonic acid)
2. Barite, barium sulfate = BaSO4
3. Ba = barium
4. CaCO3 = calcium carbonate
5. CN = cyanide
6. DTMPA = diethylenetriaminepentaacetic acid
7. HEDP = 1-hydroxyethylidene-1, 1-diphosphonic acid
8. LSI = Langelier Saturation Index
9. mg/L = milligrams per liter
10. Mg(OH)2 = magnesium hydroxide
11. MgSiO3 = magnesium silicate
12. NH3 = ammonia
13. PAA = polyacrylic acid
14. PBTC = 2-phosphonobutane-1,2,4-tricarboxylic acid
15. PMA = poly maleic anhydride
16. PO4 = phosphate
17. ppm = parts per million
18. PSI = Practical Scaling Index
19. RSI = Ryznar Stability Index
20. Si = silicon
21. SiO2 = silica
Robert J. Ferguson is the president of French Creek Software, Inc., a company he co-founded in 1989. His professional career includes positions with Nalco, Apollo, Mogul, Calgon, Chemlink, and Baker. Mr. Ferguson began modeling mineral scale formation and its control in 1974. Software he has developed is used for modeling cooling water, reverse osmosis, and oil field chemistry. He is proud to be a Ray Baum Water Technologist of the Year honoree, first AWT Innovation Award honoree, first Process Cooling Innovation Award recipient, and a Ben Franklin Technology Center Innovation award winner. Mr. Ferguson was educated at the U.S. Naval Academy and the University of Minnesota and received a B.S. in biochemistry and microbiology. Mr. Ferguson can be contacted at robferguson@frenchcreeksoftware.com .
Key words
BARIUM SULFATE, CO-PRECIPITATION, CALCITE, CALCIUM CARBONATE, HIGH CYCLES, INHIBITORS, LIMITS, SCALING, SILICA
24 the ANALYST Volume 30 Number 1
This paper was presented at the AWT 2021 Annual Conference, which was conducted September 22-25, 2021, in Providence, Rhode Island.
A Review of Common Water Treatment Rules of Thumb continued
Celebrating its 25th year of innovation, AMSA, Inc. introduces

BCP® 6010 is Specifically Designed to:
• Maintain a clean cooling water system with a continuous dosing product
• Readily integrates into an existing treatment program
• Use with continuous oxidizing biocide programs for improved biofouling control
• Enhance yellow metal corrosion inhibition
BCP® 6010 effectively maintains heat transfer surfaces & piping cleanliness
BCP® 6010
Minimizes:
• Biofilm buildup
• MIC (microbially influenced corrosion) & under-deposit corrosion
• Development of hosting sites for Legionella
• Accumulation of debris in cooling towers
Maximizes:
• Biocide efficiency
• Heat Transfer
• Inhibitor chemical performance
Fouled heat exchangers
Call us to learn how to use BCP® 6010. AMSA, Inc.® 4714 S. Garfield Rd. Auburn, Michigan 48611 Tel: (989) 662-0377 Fax: (989) 662-6461 sales@amsainc.com www.amsainc.com Introducing BCP® 6010 – ‘Ready to Use’ Continuous Cleaning Chemistry BCP®6010 ®
Part 2: How Water Conditions Can Impact Steam System Passivation
 Loraine A. Huchler, P. E., CMC®, FIMC, MarTech Systems, Inc.
(Editor’s note: This article is the second of a two-part series. Part 1 appeared in the Fall 2022 Analyst.)
Part 2
Part 1 provided a tutorial about the chemistry of iron and iron oxides and commonly accepted hypotheses about mechanisms of corrosion and magnetite formation. Part 2 focuses on more practical aspects of passivation: the effect of system conditions and reducing agents and measurements of corrosion and passivation phenomena.
The Effects of System Conditions
The environmental condition of a specific system determines whether corrosion or passivation (controlled corrosion) occurs. There are several categories of environmental effects: mechanical, thermal, and chemical. Several sources of mechanical stresses can affect the integrity of the oxide layers. The mechanism of flow-assisted corrosion (FAC) or erosion-corrosion may occur when high-velocity flows, especially in condensate circuits, causes erosion of the existing magnetite or ferrous oxide outer layer. The removal of ferrous oxide prevents the conversion to magnetite under future, favorable environmental conditions. The kinetics of flowassisted corrosion process increases below a threshold concentration of dissolved oxygen.
European practitioners often intentionally increase the concentration of dissolved oxygen to match the local mass transfer coefficient to the eroding surface to inhibit the erosion-corrosion processes (1). Mechanical effects can also result from unrelieved stresses created during the manufacture or repair of steel. These stresses physically disrupt the protective metal oxide layers, creating sites where corrosion may occur.
The temperature of the system strongly influences the rate of passivation. As described by the Schikkor reaction (Equation 12 in Part 1), magnetite formation occurs through a reduction reaction at temperatures above 50 to 100 °C (122 to 212 °F). When the system temperature is too low, the formation of magnetite is imperceptibly slow, if it occurs at all.
Thermal effects can occur in conjunction with mechanical stresses. For example, a rapidly changing steam load causes temperature fluctuations in the boiler system metallurgy. This phenomenon, known as thermal
cycling, causes rapidly changing heat transfer rates and surface temperatures, resulting in the expansion and contraction in the steel tubes. Predictably, the steel substrate expands and contracts at a rate that is different than that of the iron oxide layers, causing exfoliation. Particularly in superheaters, these thermal cycles can induce excessive growth of oxide layers (including magnetite) and subsequent exfoliation (2).
There are also chemical effects that can contribute to corrosion. All oxide layers, including a protective magnetite layer, have some porosity. When boiler water diffuses through the magnetite layer to the iron layer as illustrated in Equation 1.
The consumption of the water molecules that have diffused through the magnetite layer results in a localized concentration of any other species in the surrounding solution. These ionic species (hydrogen ions, hydroxides, sodium ions, chlorides, carbonates, nitrates, sulfates, phosphates, and dissolved oxygen) create an electrochemical potential that allows large currents to flow through a highly conductive magnetite layer, initiating localized corrosion (3). As shown in Figure 1, upsets in boiler water chemistry such as excessive caustic concentrations can cause this type of corrosion. When this type of corrosion occurs in an area with high residual stress, such as a crevice, it is known as stress corrosion cracking (SCC). Upsets in boiler water chemistry that result in pH depression may also cause corrosion through the creation of an electrochemical cell (see Figure 2).
European researchers developed “Oxygen Treatment” for high-pressure boiler systems that requires precise control of very low concentrations of dissolved oxygen and ionic contaminants in the boiler feedwater to convert iron and iron oxides to magnetite. Failure to strictly control the
27 the ANALYST Volume 30 Number 1
+
2O → Fe3O4 + 4H 2 Eq. 1
3Fe
4H
There are also chemical effects which can contribute to corrosion. All oxide layers, including a protective magnetite layer, have some porosity.
concentrations of ionic species and dissolved oxygen will result in non-protective oxides. Equation 2 shows that the reaction of oxygen with iron produces hematite, a less protective oxide than magnetite. This reaction also produces hydrogen that decreases the pH of the aqueous solution, increasing the rate of corrosion.
feedwater system. Creating and maintaining a protective magnetite oxide layer requires a very low and very consistent concentration of dissolved oxygen to create the optimal thermodynamic conditions in the boiler feedwater system. The performance of oxygen scavengers depends on several parameters: the reducing power of the scavenger, the kinetics of the reaction (e.g., temperature, pH, reactant concentrations), the catalyst, and the reaction time.
Similarly, dissolved oxygen can react with magnetite (Fe3 0 4) and produce lepidocrocite, a very porous and non-protective iron oxide (Equation 7 in Part 1). Oxygen scavenger chemicals may improve control of concentrations of dissolved oxygen in the boiler feedwater.
The Effects of Reducing Agents
The purpose of reducing agents, more commonly known as oxygen scavenger chemicals, is to reduce, but not eliminate, the concentration of dissolved oxygen in the boiler
Oxygen scavengers react with dissolved oxygen through a reduction reaction. Corrosion by dissolved oxygen is an oxidation reaction. Thus, the electrochemical (thermodynamic) measure of these reactions, or the redox potential, can be measured to determine which reactions are favored. The redox potential of an oxygen scavenging reaction is known as the reducing power of an oxygen scavenger and is one of several factors controlling the rate of reaction and subsequent reduction in the rate of corrosion.
28 the ANALYST Volume 30 Number 1
2Fe + 2H 2 0 + ½02 → Fe2 03 + 4H+ Eq. 2
Part 2: How Water Conditions Can Impact Steam System Passivation continued
Figure 1: Caustic corrosion (Electric Power Research Institute. EPRI CS-3945. Manual for Investigation and Correction of Boiler Tube Failures. ©1985. [Reprinted with permission.])
Figure 2: Hydrogen corrosion (Electric Power Research Institute. EPRI CS-3945. Manual for Investigation and Correction of Boiler Tube Failures. ©1985. [Reprinted with permission.])
Overfeed of oxygen scavengers can prevent the formation of a non-porous, adherent magnetite layer. Researchers have proven that one oxygen scavenger (hydrazine) will interact with iron and iron oxides to form magnetite; however, the results are less conclusive with other reducing agents (4, 5).
The kinetics of the oxygen scavenging reaction determines the rate of reaction. Adjusting temperature, pH, catalyst, and the concentration of the reactants and products will change the kinetics. As temperatures decrease, the reaction rate of all oxygen scavengers decreases. Reductions in the reaction rate increases the dissolved oxygen concentration and the subsequent corrosion rate because boiler feedwater systems have a fixed residence time. Kinetics also control the rate of magnetite formation. At temperatures below 100 °C (212 °F), the rate of magnetite formation decreases dramatically. Thus, the rate of reaction or kinetics is another factor directly limiting corrosion and increasing magnetite formation.
Options for optimizing the kinetic conditions include addition of a catalyst, change the system temperature or pH, selection of an alternate scavenger that has a higher rate constant, an increase in the concentration of scavenger to increase the dissolved oxygen reaction rate with scavenger, or a decrease in the concentration of dissolved oxygen to reduce the reaction rate with iron and iron oxides. Changing system conditions to improve the reaction kinetics will change the electrochemical potential (thermodynamics) to a certain degree. The laws of thermodynamics, however, are inviolable: system changes that improve the kinetics cannot overcome unfavorable thermodynamics.
The presence of an oxygen scavenger, consistently low concentrations of dissolved oxygen, and subsequent reduction in the corrosion rate seems like a reasonable definition of passivation; however, the evidence is mostly indirect. As described earlier, the Pourbaix diagram in Figure 2 (in Part 1) shows the thermodynamic conditions that favor the conversion of the iron oxides to magnetite. Figure 3 shows that in the presence of the oxygen scavenger hydrazine the electrochemical potential increases, thereby improving the thermodynamic condition or driving force that favors the conversion of iron oxides to magnetite. Straub has documented the
reaction of hydrazine with ferric oxide and its hydrated forms to form magnetite (Equation 3) (6). This reaction can occur in the presence of dissolved oxygen if the electrochemical potential and pH of the system is in the region where the Pourbaix diagram predicts the formation of magnetite.
12FeO(OH) + N2H4→ 4Fe3O4 + 8H 2O + N2 Eq. 3
The reaction rate of Equation 3 may depend on the crystal structure and the degree of hydration of the oxide. In other words, the kinetic conditions control the rate of conversion of the oxide. Under the correct conditions, the reduction of hematite to magnetite is rapid above 140 °C (284 °F) (6). Researchers have not proven that the magnetite formed in the presence of hydrazine is always protective in a boiler system. However, given favorable thermodynamic conditions, these observations support the conclusion that passivation can occur due to the presence of hydrazine.
Thus, the primary role of oxygen scavengers is to reduce the concentration of dissolved oxygen and limit oxygen-related corrosion. The secondary role is to enhance the conversion of iron oxides to magnetite, directly or indirectly. Oxygen scavengers are especially
29 the ANALYST Volume 30 Number 1
Figure 3: Potential-pH diagram, 200 °C with hydrazine (Reprinted from Corrosion Science, Volume 10, H. E. Towsend, 343 (1970) with permission from Pergamon Press Ltd., Headington Hill Hall, Oxford OX3 OBW, UK.)
Part 2: How Water Conditions Can Impact Steam System Passivation continued
important in areas of the boiler where dissolved oxygen is present or the rate of magnetite conversion is not optimal due to temperature, such as the condensate and feedwater systems. These scavengers are not as important in some areas of the system, such as the boiler drum that have no dissolved oxygen and/or operate at high temperatures (e.g., above 140 °C [284 °F]).
Measurement of Corrosion/ Passivation Phenomena
There are several measurement methods for corrosion/ passivation phenomena for laboratory and boiler systems. The laboratory methods include measuring the chemical composition, physical configuration, and electrochemical characteristics of the oxide layers both in situ and ex situ. The field methods include global system measurements of the corrosion and passivation reaction products of the iron/water system and in situ evaluation of corrosion rates.
Researchers generally agree that an oxide layer's resistance to corrosion is partially dependent on the nature of the crystalline structure. The more perfect the lattice, the more protective the film. There are a variety of techniques to evaluate the crystalline structure and chemical composition of oxide films. These techniques use samples removed from the boiler or from a boiler-simulated system (ex situ). Electron diffraction (7-9) is a common method to determine the specific oxides of iron and the crystalline structure of oxide films. The primary limitation of electron diffraction is the inability to discriminate between magnetite and gamma-hematite; however, the integrity of the crystalline structure can be qualitatively evaluated (10)
Ellipsometry is an optical method that evaluates the integrity of an oxide layer. This technique uses the change in the state of polarization of light reflected from a surface to indirectly measure the thickness and crystalline structure of the oxide layer. Researchers have conducted extensive studies of optical spectra of a variety of iron oxide films (11). This surface measurement can also be used in varying aqueous system conditions or in situ to evaluate the time- and temperature-dependent changes in the oxide layer thickness. While this method can distinguish the type of oxide (e. g., Fe3O4, Fe2O3), it cannot verify that the oxide layer is protective against corrosion.
Potentiodynamic polarization is a method that evaluates the resistance to electron flow (current) as a function of a
change in the electrochemical potential. Electron flow is critical to the corrosion process. Therefore, the higher the resistance to electron flow, the more limited or polarized the rate of the corrosion reaction (Reference 12 in Part 1). Thus, the rate of change of the current correlates to the degree of oxide layer protection (i.e., the oxide thickness and integrity).
A typical scan of a perfectly passivated surface is shown in Figure 4 (12). In the region labeled active, the behavior of the material is identical to the base metal. No oxide film is present and metal dissolution (corrosion) will occur. As the potential is increased, the current and hence the corrosion rate peaks rapidly and falls at the boundary of the passive region. This initial oxidation corresponds to the formation of an oxide layer that is protective against further oxidation (corrosion) as the potential increases through the passive region. As the potential increases through the transpassive region, the oxide layer is no longer a physical barrier to corrosion and the corrosion rate will increase (12). As the potential is increased further oxygen evolution will occur on the outside of the film (2). Thus, the higher the potential required to enter the transpassive region, the more protective the oxide. Researchers often use potentiodynamic polarization in conjunction with ellipsometry to characterize the protectiveness of the oxide layer (11).
30 the ANALYST Volume 30 Number 1
Part 2: How Water Conditions Can Impact Steam System Passivation continued
Figure 4: Potentiodynamic polarization curve, perfectly passivated surface [reprinted with permission from M. Nagayama and M. Cohen, Journal of Electrochem., Volume 109, 781 (1962)]).
The dynamics of the growth of oxide layers has been studied using electron diffraction, X-ray emission techniques, and ellipsometry (13). Other techniques for measuring the chemical and crystalline structure of oxide films include Auger and LEED-Auger spectroscopy, and ESCA (electron spectroscopy for chemical analysis). An in-situ technique, Mossbauer spectroscopy, has also been applied to the study of crystalline structures of protective oxide films (14, 15)
These studies of oxide layers focus on changes relative to a set of standard conditions because these methods are performed under laboratory conditions. Passivation phenomena in aqueous solutions with high ionic concentration is a common use of these laboratory studies. As with all laboratory studies, researchers should cautiously extrapolate the laboratory results to specific boiler systems.
All the laboratory methods measure the nature and integrity of the oxide layer and evaluate the degree of protection or passivation. In contrast, all the field measurements are direct measurements of system corrosion rates and indirect measurements of the completeness of passivation. Field methods that are very familiar to boiler operators include measurements of particulate iron, soluble iron, hydrogen and corrosion coupons.
The measurement of aqueous dissolved hydrogen concentrations has been used as evidence of active corrosion because many corrosion reactions will liberate hydrogen, reduce the pH, and create an electrochemical corrosion cell or pit (Equations 4 and 5).
aqueous phase. Consequently, hydrogen concentrations are not a reliable method to measure corrosion rates.
The method to measure particulate or insoluble iron concentrations require filtering a standard volume of water through a 0.45-micrometer filter. Boiler manufacturer Babcock and Wilcox developed standard charts that correlate the color of the iron oxides on the filter to the type of oxide (e.g., magnetite, hematite, or a mixture of these oxides).
The methods to measure soluble iron concentrations include colorimetric or spectroscopic techniques (e.g., atomic absorption (AA), inductively coupled plasma (ICP)). Sample preparation such as acid digestion will allow direct measurement of total iron concentrations by these methods. The difference between the total and soluble iron concentrations is the concentration of insoluble iron. Guidelines from the American Society of Mechanical Engineers (ASME) (16, 17) or the Electric Power Research Institute (EPRI) (18) provide specification limits for the concentration of soluble iron and sampling methods.
As described earlier, corrosion is a localized phenomenon. Measurements of soluble iron, particulate iron, and hydrogen evaluate global or system parameters. Therefore, very limited conclusions can be made regarding the specific location of corrosion when using these methods.
However, the reliability of measurements of hydrogen evolution is in serious doubt because hydrogen can evolve from the conversion of hematite to magnetite in the absence of dissolved oxygen. In addition, the parent metal can absorb hydrogen instead of remaining in the
The last field method to evaluate the degree of corrosion within a specific system is a corrosion coupon. The ideal configuration is a bypass rack that allows flow control. The coupons should match the materials of construction in the boiler system (e.g., iron, copper). The purpose of the coupon test will determine the specific locations of each bypass rack. Coupon tests are semi-quantitative tests because they lack the mechanical and thermal stresses experienced by the boiler system. The ideal purpose of corrosion coupons is to evaluate relative corrosion rates or changes in corrosion rate over time.
31 the ANALYST Volume 30 Number 1
3Fe + 6H 2O → 3Fe(OH)2 + 3H 2 Eq. 4 2Fe3O4 + H 2O → 3Fe2O3 + H 2 Eq. 5
Part 2: How Water Conditions Can Impact Steam System Passivation continued
In addition, the parent metal can absorb hydrogen instead of remaining in the aqueous phase. Consequently, hydrogen concentrations are not a reliable method to measure corrosion rates.
Conclusions
Passivation has many definitions, including: the measurement of electrochemical potential, the reduction of iron oxides, the oxidation of an iron substrate, the absence of corrosion, and the indirect measurement of soluble and insoluble iron oxide concentrations. Most of the passivation mechanisms postulate the formation of a protective iron oxide film, usually magnetite. However, the detection of the presence of magnetite by these analytical methods is not sufficient evidence that passivation has occurred.
The formation of a protective magnetite layer depends on the thermodynamic state (electrochemical potential) of the boiler system; the rate of oxide formation is dependent on the kinetics. Improving the thermodynamics and, consequently, the kinetics, requires changing the conditions of the system (temperature, pH, dissolved oxygen concentration) and/or by adding a reducing agent. Both laboratory and field techniques measure the electrochemical potentials and the thickness and integrity of iron oxide layers with some limitations.
The definition of corrosion is the destruction of a metal by chemical or electrochemical reaction with its environment. Corrosion descriptions include the location (or geometry) and causes: mechanical, operational, thermal, and chemical. Like passivation, the rate of corrosion depends on the thermodynamic state of the boiler system and the kinetics depend on the system conditions. The addition of oxygen scavengers in boiler systems to reduce corrosion does not necessarily create thermodynamic conditions that are more favorable for passivation. The most common corrosion measurement techniques are soluble and insoluble iron oxide concentrations, corrosion coupons, and direct examination of metal surfaces. Predicting corrosion based on measurements of dissolved hydrogen is a challenge because hydrogen can evolve during the formation of magnetite from an iron substrate and the parent metal can adsorb the hydrogen.
Passivation is a very complex phenomenon with many unknowns. Each of the various definitions of passivation is appropriate to a specific set of circumstances or observations. The challenge is to define and measure passivation phenomena that has wide acceptance and application to boiler systems.
References
1. Woolsey, I.S.; Bignold, G.J.; DeWhalley, C.H.; Garbett, K. (1986). Water Chemistry for Nuclear Reactor Systems, BNES, London, 4, p. 337.
2. Dooley, R.B. (1978). Corrosion of Steam/Water-Side Boilers, Metals Handbook, ninth ed., vol. 13, Corrosion, Metals Park, Ohio, ASM International, p. 992.
3. Field, E.M.; Stanley, R.C.; Adams, A.M.; Holmes, D.R. (1963). Proceedings of the Second International Congress on Metallic Corrosion, p. 820.
4. Schmidt, E.W. (1984). Hydrazine and its Derivatives Preparation, Properties, Applications, J. Wiley & Sons, New York, New York, p. 828.
5. ACS (1987). "Hydrazine in Power Plant Circuits," American Chemical Society, Washington, D.C.
6. Straub, F.G. (1957). Combustion, 34.
7. Cohen, M. (1952). Journal of Physical Chemistry, 56, p. 451.
8. Cohen, M. (1974). Journal of the Electrochemical Society, 121, p. 191.
9. Foley, B.L.; Kruger, J.; Bechtold, C.J. (1967). Journal of the Electrochemical Society, 114, p. 936.
10. Szklarska-Smialozska, Z. (1986). Pitting Corrosion of Metals, National Association of Corrosion Engineers, Houston, Texas.
11. Chen, C.T.; Cahan, E.; Yeager, E. (1979). “Passivation Studies of Iron, Nickel and Their Alloys by In Situ Ellipsometry and Ex Situ ESCA Techniques,” Office of Naval Research, Arlington, Virginia, Project NR 359-451.
12. Leidheiser, H. (1996). Corrosion Control by Organic Coatings, National Association of Corrosion Engineers, Houston, Texas.
13. Brundle, C.R. (1977). Surface Science., 66, p. 581.
14. Simmons, B.W.; Kellerman, E.; Leidheiser, H. (1973). Corrosion Science, 69, p. 227.
15. O'Grady, W.E.; Bockris, J.O.M. (1973). Surface Science, 38, p. 249.
16. ASME (1994). “Consensus on Operating Practices for the Control of Feedwater and Boilerwater Chemistry in Modern Industrial Boilers,” CRTD, vol. 34, American Society of Mechanical Engineers, New York, New York.
17. ASME (2006). “Consensus on Operating Practices for the Sampling and Monitoring of Feedwater and Boilerwater Chemistry in Modern Industrial Boilers,” CRTD, vol. 81, American Society of Mechanical Engineers, New York, New York.
18. EPRI (2020). “Comprehensive Cycle Chemistry Guidelines for Fossil Plants, Technical Report Number 3002016985, Electric Power Research Institute (EPRI), Palo Alto, California.
Loraine Huchler is the founder and president of MarTech Systems, Inc., a firm that assesses and manages risk in water-related utility systems. Her work includes optimizing the performance of the water treatment service provider and the assets in water circuits in hot water/steam and chilled/condenser water in large-scale corporate and university campuses and manufacturing facilities. She also provides technology feasibility studies, water conservation and water reuse studies, technical training and serving as an expert witness in patent infringement and equipment failure litigation. Ms. Huchler has a B.S. in chemical engineering from the University of Rochester (New York) and is licensed as a Professional Engineer and has earned the accreditation of Certified Management Consultant®. Ms. Huchler can be contacted at huchler@martechsystems.com .

Keywords
BOILERS, CORROSION, PASSIVATION, POWER
32 the ANALYST Volume 30 Number 1
Part 2: How Water Conditions Can Impact Steam System Passivation continued


11335 Lewis Braselton Blvd. Braselton, GA 30517 770-978-1443 (Fax) 770-978-4165 info@biosourceinc.com www.biosourceinc.com 2021 Supplier of the Year • Biocides (oxidizing & non-oxidizing) • Polymers, azoles, phosphonates, sod. molybdate • Repacking (all drum sizes and pails available) • Regulatory and technical assistance Having Product Availability Issues? Let us help you piece it all together. IN BUSINESS SINCE 1991.
Can Calcium Carbonate Be an Effective Alternative for pH and Alkalinity Control in Activated Sludge Processes?
 Chandler Mancuso, Omya, Inc.
34 the ANALYST Volume 30 Number 1
pH and Alkalinity Control of Activated Sludge
Activated sludge is one of the most commonly used wastewater treatment processes for municipal wastewaters as well as industrial wastewaters with high organic and nutrient loadings. One of the most influential control parameters governing the overall efficiency and effectiveness of the activated sludge process is pH. The ideal pH range for activated sludge systems is understood to be 6.5 to 8.0 (1). This range has been established in part because nitrifying bacteria are the most metabolically efficient in this pH range, optimizing ammonium removal rates. Additionally, the optimal pH for biological oxygen uptake, which governs how efficiently microbes can degrade organic matter, is stated to be 7.0 to 7.5 (2).
Chronically low pH encourages the growth of fungi and filamentous bacteria in the system. The proliferation of these types of organisms can lead to bulking sludge and poor settling rates. This can in turn reduce hydraulic capacity, compromise effluent quality, or increase the load on downstream filtering equipment due to solids carryover (3). The pH of the wastewater also affects the surface charge of the sludge particles in suspension, so variable pH can lead to inconsistent polymer performance in the flocculation and sludge dewatering stages of the system (4). Variable pH can also affect the performance of products used for coagulation and phosphorus precipitation as these reaction mechanisms are usually pH dependent (5). Lastly, depending on the materials present in the system, chronically low pH can accelerate corrosion rates (6).
The alkalinity and pH of the wastewater are interdependent, and alkalinity plays a significant role in the management of system operations as well. Alkalinity is defined as the acid neutralizing capacity of the wastewater. The alkalinity in activated sludge

35 the ANALYST Volume 30 Number 1
Chronically low pH encourages the growth of fungi and filamentous bacteria in the system. The proliferation of these types of organisms can lead to bulking sludge and poor settling rates.
should be at least 70 to 80 milligrams per liter (mg/L) as calcium carbonate (CaCO3) to ensure the pH is consistently sustained within the optimal range despite influent variability (7). Alkalinity can also influence other key processes in the wastewater system. For example, alkalinity can have an impact on the coagulation, flocculation, and phosphorus removal capabilities of additives commonly used for these purposes (8, 9).
Some activated sludge systems require alkalinity supplementation through chemical addition. The demand for supplemental alkalinity can come from numerous sources. Some wastewaters treated using activated sludge, particularly industrial wastewaters, are inherently acidic and require pH adjustment prior to biological treatment. Many chemistries used for coagulation, clarification and nutrient addition, such as ferric chloride, aluminum sulfate, and phosphoric acid, are highly acidic and reduce pH and alkalinity. Therefore, high dosages of these types of products may necessitate additional chemical treatment for pH and alkalinity control (10). The nitrification process, the biological oxidation of ammonium to nitrite and ultimately nitrate, consumes significant amounts of alkalinity and is the main cause of low pH and alkalinity in activated sludge systems. In the first stage of nitrification, ammonium is converted to nitrite by Nitrosomonas bacteria. This process is shown in Equation 1. 2NH4 +
Following the generation of nitrite, Nitrobacter bacteria further oxidize nitrite to nitrate, according to the chemical reaction in Equation 2.
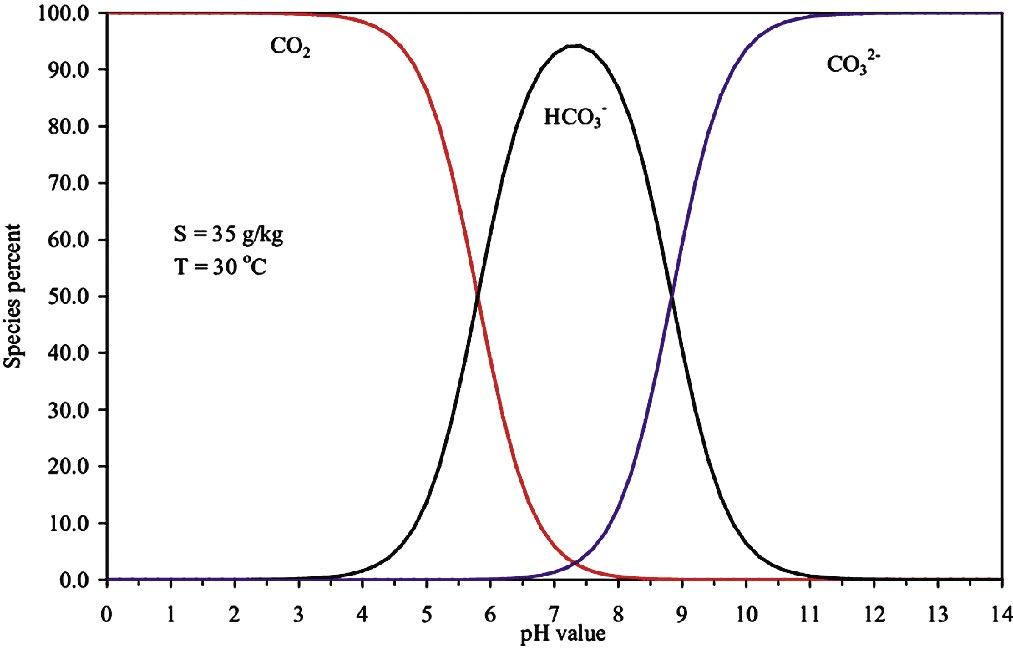
The oxidization of ammonia to nitrite includes hydrogen ions in the reaction product, increasing acidity in the wastewater (11). As a result, approximately 7.14 mg of alkalinity as CaCO3 is consumed for every mg of oxidized ammonia (12). Municipal wastewaters generally contain 20 to 40 mg/L of ammonia (NH4 +) with a pH close to neutral (13). The need for supplemental alkalinity in municipal wastewaters is more common in geographic regions where water sources are low in alkalinity as the wastewater may not have enough background alkalinity to neutralize the acidity produced by nitrification. Industrial wastewaters can contain significantly higher concentrations of ammonia and therefore may require alkalinity supplementation even if alkalinity in the influent is high (14). Examples of industries that commonly produce wastewater high in ammonia and/ or acidity are food and beverage, pharmaceuticals, and chemical manufacturing.
Carbonate Chemistry and Equilibrium Dynamics
Since the bicarbonate ion is the dominant source of alkalinity in activated sludge wastewaters, it is critical that the principles and equilibrium reactions that govern carbonate chemistry in aqueous environments are understood. Bicarbonate is in equilibrium with other carbonate species as a function of wastewater pH, shown in Figure 1 (15).
Carbonic acid can be described as a weak acid. When introduced into water, some of the carbonic acid molecules ionize and liberate free hydrogen ions into the water. The acid dissociation values (Ka) displayed in Figure 2 are acid dissociation constants and describe the
36 the ANALYST Volume 30 Number 1
+ 3O2 → 2NO2- + 4H+ + 2H 2O Eq. 1
2NO2- + O2 → 2NO3- Eq. 2
Figure 1: Carbonate equilibria as a function of pH.
Can Calcium Carbonate Be an Effective Alternative for pH and Alkalinity Control in Activated Sludge Processes? continued
If the concentration of one of the chemical species involved in the reaction changes, the concentrations of the other species involved in the reaction must also change in order for equilibrium to be restored.
extent to which carbonic acid ionizes in water (16). Since carbonic acid has two protons, it has two Ka values. The reaction quotient (Q) is the instantaneous mathematical result of a reaction equation. If the value for Q equals the value of Ka for a given reaction equation, the system is in equilibrium. These Ka values are constant; therefore, if the concentration of one of the chemical species involved in the reaction changes, the concentrations of the other species involved in the reaction must also change in order for Q to once again equal Ka and allow equilibrium to be restored (17).
equilibrium concentration for aqueous carbon dioxide can be established via Equation 3 (18, 19):
Here is a summary of all of the equilibrium equations (Equations 4 through 9) involved in aqueous carbonate equilibria:
As an example, if the pH of a water in equilibrium with bicarbonate and carbonic acid is increased, the concentration of hydrogen ions decreases. This would cause the reaction quotient to be lower than that of Ka1. The system will react to this imbalance by increasing the concentration of bicarbonate and decreasing the concentration of carbonic acid to re-align the reaction quotient with the dissociation constant. This explains why you see the relative amount of bicarbonate increasing proportional to carbonic acid at higher pH values in Figure 3.
Calcium Carbonate Reactions
In pure water, calcium carbonate solubility is highly limited and understood to be around 15 mg/L at 25 °C. However, the presence of dissolved carbon dioxide greatly enhances the solubility of calcium carbonate by opening the following reaction pathway as shown in Equation 10 (20):
CaCO3(s) + CO2(g) + H2O(l) → Ca(HCO3)2(aq) Eq. 10
The presence of dissolved carbon dioxide is inevitable in activated sludge systems because the respiration of aerobic microorganisms follows the reaction illustrated in Equation 11 (21).
Organic Carbon + O2 →
Energy + CO2 + H 2O + Residue Eq. 11
Another equilibrium reaction to consider is the equilibrium between carbon dioxide in the aqueous phase and carbon dioxide in the gaseous phase, governed by Henry’s Law. Henry’s law states that the amount of gas dissolved in a liquid is proportional to the partial pressure of that gas above the liquid. Since carbon dioxide can be found in our atmosphere, a partial pressure is exerted on the wastewater exposed to open air, and an
Therefore, the wastewater chemistry in activated sludge systems liberates the solubility of calcium carbonate up to its saturation point, which is defined by multiple parameters that make up predictive saturation indexes such as the Langelier Saturation Index (LSI). The act of adding calcium carbonate to activated sludge systems leads to a direct increase in bicarbonate alkalinity and decrease in carbon dioxide, which will shift the equilibrium reaction to cause hydrogen ion concentration to decrease, hence increasing pH. This is illustrated in Figure 4.
37 the ANALYST Volume 30 Number 1
��������& �������� ��������$ (���������������� ) ↔ �������� # (���������������� ) + ���������������� ��������$ (���������������� ) ��������& �������� ��������$ (���������������� ) ↔ �������� # (���������������� ) + ���������������� ��������$% (���������������� ) ��������& �������� ��������$ (���������������� ) ↔ �������� # (���������������� ) + ���������������� ��������$ (���������������� ) ��������& �������� ��������$ (���������������� ) ↔ �������� # (���������������� ) + ���������������� ��������$ (���������������� )
Figure 2: Acid dissociation constants and equations for carbonic acid at 25 °C.
��������$
⌊��������& �������� ��������$ ⌋ = 4.45�������� 10 ' ��������!& = [�������� # ][���������������� ��������$& ] ⌊���������������� ��������$ ⌋ = 4.69�������� 10 ""
Figure 3: Illustration of how the equilibrium reaction changes in response to increased pH.
��������!" = [�������� # ][����������������
]
(aq)] = KCO2P(CO2) Eq. 3
[CO2
CaCO3(s) ↔ Ca 2+(aq) + CO32-(aq) Eq. 4 CO2(g) ↔ CO2(aq) Eq. 5 CO2(aq) + H 2O ↔ H 2CO3(aq) Eq. 6 H 2CO3(aq) ↔ H+(aq) + HCO3-(aq) Eq. 7 HCO3-(aq) ↔ H+(aq) + CO32-(aq) Eq. 8 H 2O ↔ H+ + OH Eq. 9
Can Calcium Carbonate Be an Effective Alternative for pH and Alkalinity Control in Activated Sludge Processes? continued
An additional factor involved in activated sludge systems is that the air being introduced to supply the microorganisms with oxygen is also stripping excess carbon dioxide from the water and bringing the system closer to equilibrium with the atmosphere. This causes the equilibrium reaction to shift left, further reducing hydrogen ion concentration and increasing pH. However, some alkalinity is consumed in this process as equilibrium is re-established.
material comes with advantages and disadvantages in comparison to calcium carbonate and the other materials on the market today.
Safety: Sodium hydroxide is notoriously hazardous due to the risk of serious chemical burns in the event of direct exposure. Lime also comes with handling concerns due to its high pH. Magnesium hydroxide and calcium carbonate have the benefit of being non-corrosive materials with an overall low-risk safety profile.
Cost volatility: The significant volatility of sodium hydroxide price and availability that has been demonstrated in the U.S. market in recent years can create challenges for consumers (22). Calcium carbonate, lime, and magnesium hydroxide are typically characterized by more consistent product availability and better price stability.
Because there are constant inputs and outputs of various chemical species impacting these equilibrium equations, the conditions in activated sludge systems are eternally dynamic, and modelling them with high levels of specificity proves difficult. However, the overall result of adding calcium carbonate to activated sludge wastewater yields a decrease in carbonic acid and hydrogen ion concentrations along with an increase in bicarbonate alkalinity, making it an effective material for pH and alkalinity control in these systems.
Maintenance requirement: Lime and magnesium hydroxide slurries are typically a challenge to store and feed reliably due to their instability. Calcium carbonate slurries are found to be much more stable than lime or magnesium hydroxide slurries, reducing the labor intensity required to maintain the storage and delivery system. Since sodium hydroxide is supplied as a solution, feed is very reliable with the right equipment.
Overdose protection: Excessive doses of lime or sodium hydroxide can take the wastewater pH far beyond the ideal range, introducing the risk of compromising the health of the microbial community. Magnesium hydroxide can only achieve a maximum pH of about 9.0, so while risk of extreme pH overdose events is eliminated, some microbial communities are less metabolically efficient beyond pH 8.0. Due to its limited solubility and direct supplementation of bicarbonate alkalinity, calcium carbonate can only achieve a pH of about 8.0 before the product ceases to dissolve, providing maximum overdose protection.
Comparison of Materials for Alkalinity Supplementation
The primary materials currently used for pH and alkalinity control in activated sludge applications are sodium hydroxide, magnesium hydroxide, and lime. Each
Impact on struvite development: Some wastewater matrices and treatment processes can favor the deposition of struvite, a mineral comprised of magnesium, ammonia and phosphorus, which can cause clogged pipes and damage to equipment (23). Magnesium hydroxide supplements the wastewater with one of the ingredients for struvite, increasing the likelihood of deposition.
38 the ANALYST Volume 30 Number 1
Figure 4: Illustration of how the equilibrium reaction changes in response to CaCO3 addition.
��������!" = [�������� # ][���������������� ��������$ ] ⌊��������& �������� ��������$ ⌋ = 4.45�������� 10%' ��������!& = [�������� # ][���������������� ��������$& ] ⌊���������������� ��������$ ⌋ = 4.69�������� 10 ""
Figure 5: Illustration of how the equilibrium reaction changes when dissolved CO2 is stripped.
��������!" = [�������� # ][���������������� ��������$ ] ⌊��������& �������� ��������$ ⌋ = 4.45�������� 10 ' ��������!& = [�������� # ][���������������� ��������$& ] ⌊���������������� ��������$ ⌋ = 4.69�������� 10 ""
Figure 6: Illustration of the overall equilibrium shift when CaCO3 is added to activated sludge.
Can Calcium Carbonate Be an Effective Alternative for pH and Alkalinity Control in Activated Sludge Processes? continued
Process stability: Calcium carbonate is the most effective material at improving process stability, namely due to its dissolution dynamics and delivery of bicarbonate alkalinity. Magnesium hydroxide is likely to offer more process stability than lime and sodium hydroxide, but its stability tends to be poorer than calcium carbonate in the target pH range for activated sludge systems.
Impact on sludge properties: High dosages of sodium hydroxide are known to negatively impact floc integrity as the sodium ions are understood to interrupt the agglomeration of floc particles. On the other hand, lime, magnesium hydroxide, and calcium carbonate are capable of improving floc integrity by supplying divalent cations that have the capacity to bridge flocs together as well as add density to the flocs (24).
Table A summarizes the comparison between calcium carbonate and active materials on the market.
Case Study of a Full-Scale Application
A paper mill in the southeast United States employs an aerated lagoon to remove methanol from their fouled condensate wastewater in accordance with their air permit requirements. The fouled condensate wastewater contains 50 to 60 mg/L of ammonia on average, so the plant is required to provide supplemental alkalinity to neutralize the acidity produced by ammonia nitrification. The plant was using a blended slurry of lime and magnesium hydroxide for this purpose. The target pH range in the lagoon is 6.5 to 8.0, and the target alkalinity is >100 mg/L as CaCO3
Despite the use of an alkalinity supplement, the plant was experiencing periodic pH depressions as low as 4.5 standard units (S.U.) in the lagoon. The conditions in the lagoon were prone to changing rapidly due to
variable influent wastewater characteristics, and the low pH would significantly inhibit methanol biodegradation rates, threatening non-compliance with their air permit. The plant personnel were looking for a solution to provide enhanced stability to the pH and alkalinity levels in the lagoon so that harsh pH deviations could be eliminated.
Bench testing on a sample of the wastewater indicated that a specialty calcium carbonate product A could help protect the system against harmful pH swings, so the customer elected to test this product as a substitute to the blended lime/magnesium hydroxide slurry during a 5-week trial. A high-solids slurry of the treatment was delivered in bulk truckloads and off-loaded into the system on pre-determined dates, emulating the dosing method used for the blended slurry. During the 5-week trial period, stability of the lagoon pH and alkalinity greatly improved when compared to the five weeks leading up to the trial. Alkalinity and pH remained within the target range for the entire duration of the trial, harmful alkalinity and pH oscillations were avoided, and effective methanol removal was consistently maintained. The results are shown in Figure 7.
39 the ANALYST Volume 30 Number 1
Variable CaCO3 Mg(OH)2 Ca(OH)2 NaOH Safety Non-hazardous Non-hazardous Hazardous Hazardous Cost Volatility Low Low Low High Maintenance Requirement Low High High Low Overdose Protection Best Good Poor Poor Impact on Struvite Development None Enhances None None Impact on Process Stability Best Good Poor Poor Impact on Floc Integrity Positive Positive Positive Negative
Table A: Holistic Comparison of pH and Alkalinity Control Products.
Can Calcium Carbonate Be an Effective Alternative for pH and Alkalinity Control in Activated Sludge Processes? continued
The nitrification process, the biological oxidation of ammonium to nitrite and ultimately nitrate, consumes significant amounts of alkalinity and is the main cause of low pH and alkalinity in activated sludge systems.
Conclusion
Calcium carbonate should be considered as an option for activated sludge processes that are in need of supplemental alkalinity. The conditions present in activated sludge systems pair nicely with the dissolution and equilibrium dynamics associated with calcium carbonate, allowing for its successful implementation into these systems.
A number of benefits associated with calcium carbonate in comparison to traditional materials have been described, and case study data has validated its performance in a challenging industrial application. There are a couple of instances where calcium carbonate may not be suitable for an activated sludge application. First, if the deliberate intention is to keep the pH above 8.0 for suppression of
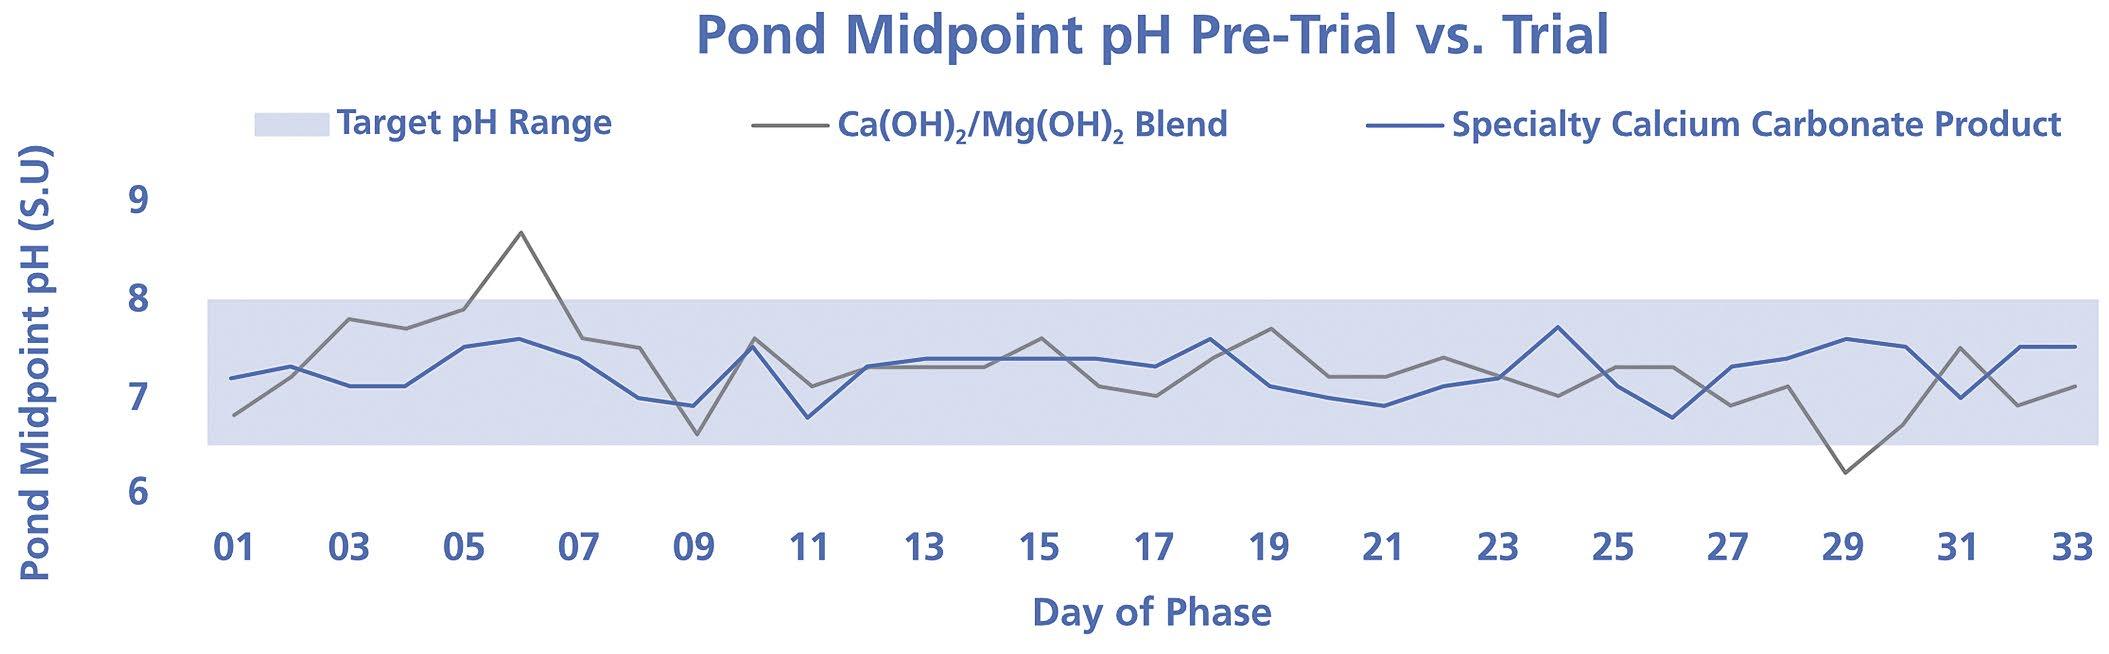
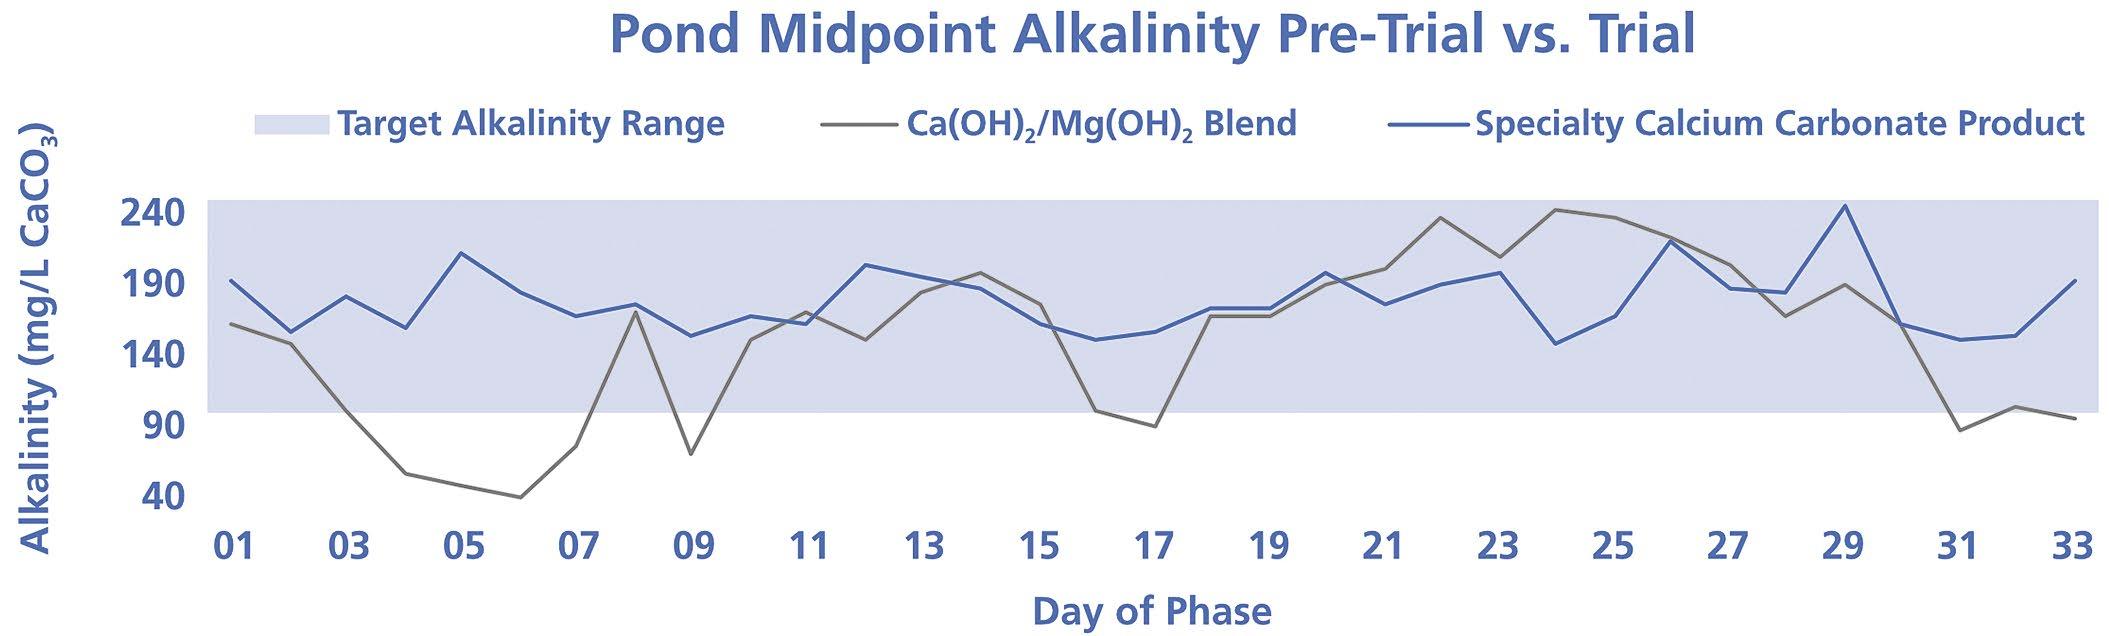
sulfide gas generation or another purpose, the desired pH will not be achievable with calcium carbonate.
Additionally, even with the assistance of dissolved carbon dioxide, unique wastewater matrices may not allow for enough calcium carbonate dissolution to reach pH or alkalinity targets. While activated sludge systems appear to be the most natural fit for calcium carbonate, other wastewater treatment designs, particularly those including aeration such as membrane bioreactor (MBR), moving bed biofilm reactor (MBBR) and fixed-bed bioreactor (FBBR), are also viable designs for calcium carbonate. More experimentation, modelling and application will help uncover the utility of calcium carbonate in the wastewater treatment industry.
The primary materials currently used for pH and alkalinity control in activated sludge applications are sodium hydroxide, magnesium hydroxide, and lime.
40 the ANALYST Volume 30 Number 1
Can Calcium Carbonate Be an Effective Alternative for pH and Alkalinity Control in Activated Sludge Processes? continued
Figure 7: Comparison of mid-point pH and alkalinity before and during the trial test of the specialty calcium carbonate treatment.
References
1. Baldwin, D.D.; Campbell, C.E. (2001). “Short-Term Effects of Low pH on the Microfauna of an Activated Sludge Wastewater Treatment System,” Water Quality Research Journal 36(3), pp. 519–535, accessible at https://doi.org/10.2166/wqrj.2001.028.
2. State of Michigan Department of Environmental Quality (2019). “Activated Sludge Process Control,” State of Michigan. https://www. michigan.gov/-/media/Project/Websites/egle/Documents/Programs/ WRD/Operator-Certification/activated-sludge-manual. pdf?rev=18ceb928163f4dac8689e2f34dd365ae
3. IRWA (2015). Filamentous Bacteria Identification and Process Control: A Simple Approach. Iowa Rural Water Association, Newton, Iowa, accessible at https://www.iowaruralwater.org/tools_tips/toni_glymp/Filaments.pdf.
4. Tichenor, G. (July 2018). Polymer Technical Training Manual. SNF Holding Co., Riceboro, Georgia.
5. Mancuso, C.; Jamison, M.; Zaporski, J.; Yang, Z. (2021). “Effects of Coagulant Morphology and Chemical Properties on Soluble Reactive Phosphate Removal in Corn Ethanol Wastewater,” Water Environment Research 93(11), pp. 2589–2597, accessible at https://doi.org/10.1002/wer.1609
6. Woyciechowski, P.; Łukowski, P.; Szmigiera, E.; Adamczewski, G.; Chilmon, K.; Spodzieja, S. (2021). „Concrete Corrosion in a Wastewater Treatment Plant – A Comprehensive Case Study,” Construction and Building Materials, 303, 124388, accessible at https://doi.org/10.1016/j.conbuildmat.2021.124388
7. Evans, M.; Sober, G. (Dec. 9, 2020). “How Alkalinity Affects Nitrification,” California Water Environment Association, Oakland, California, accessible at https://www.cwea.org/news/how-alkalinity-affects-nitrification/
8. Ye, C.; Wang, D.; Shi, B.; Yu, J.; Qu, J.; Edwards, M.; Tang, H. (2007). “Alkalinity Effect of Coagulation with Polyaluminum Chlorides: Role of Electrostatic Patch,” Colloids and Surfaces A: Physicochemical and Engineering Aspects, 294(1-3), pp. 163–173, accessible at https://doi.org/10.1016/j.colsurfa.2006.08.005
9. Banu, R.J.; Do, K.U.; Yeom, I.T. (2007). ”Phosphorus Removal in Low-Alkalinity Secondary Effluent Using Alum,” International Journal of Environmental Science & Technology 5(1), pp. 93-98, accessible at https://doi.org/10.1007/bf03326001
10. Wisconsin Department of Natural Resources. (January 2009). Advanced Phosphorus Removal Study Guide, State of Wisconsin, https://dnr.wi.gov/regulations/opcert/documents/wwsgphosphorusadv.pdf
11. EPA (August 2002). Nitrification, Distribution System Issue Paper, U.S. Environmental Protection Agency, Office of Water, Washington, D.C., accessible at https://www.epa.gov/sites/default/files/2015-09/documents/ nitrification_1.pdf
12. Bagchi, S.; Biswas, R.; Nandy, T. (2010). “Alkalinity and Dissolved Oxygen as Controlling Parameters for Ammonia Removal through Partial Nitritation and ANAMMOX in a Single-Stage Bioreactor,” Journal of Industrial Microbiology & Biotechnology 37(8), pp. 871–876, accessible at https://doi.org/10.1007/s10295-010-0744-3
13. Bioscience, Inc. (March 2016). “Nitrification (Ammonia Oxidation) in Wastewater Treatment Plants,” white paper, Bioscience, Inc. (now known as Monera Technologies Corp.), Allentown, Pennsylvania, accessible at https://www.bioscienceinc.com/wp-content/uploads/2016/03/Nitrification-Ammonia-Oxidation-in-Wastewater-Treatment-Plants-1.pdf
14. Sica, M.; Duta, A.; Teodosiu, C.; Draghici, C. (2013). “Thermodynamic and Kinetic Study on Ammonium Removal from a Synthetic Water Solution Using Ion Exchange Resin,” Clean Technologies and Environmental Policy 16(2), pp. 351–359, accessible at https://doi.org/10.1007/s10098-013-0625-3
15. Yuen, Y.T.; Sharratt, P.N.; Jie, B. (2016). “Carbon Dioxide Mineralization Process Design and Evaluation: Concepts, Case Studies, and Considerations,” Environmental Science and Pollution Research 23(22), pp. 22309–22330, accessible at https://doi.org/10.1007/s11356-016-6512-9
16. Libretexts (Nov. 3, 2020). E1: Acid Dissociation Constants at 25°C, Chemistry LibreTexts accessible at https://chem.libretexts.org/Ancillary Materials/Reference/Reference_Tables/Equilibrium_Constants/ E1%3A_Acid_Dissociation_Constants_at_25C
17. Libretexts (July 28, 2021). 8.2: Chemical Equilibrium, Chemistry Libretexts, retrieved August 10, 2022, from https://chem.libretexts.org/ Bookshelves/Introductory_Chemistry/Book%3A_Chemistry_for_Allied_ Health_(Soult)/08%3A_Properties_of_Solutions/8.02%3A_Chemical_ Equilibrium
18. Libretexts (Feb. 17, 2021a). Henry’s Law. Chemistry Libretexts, retrieved August 10, 2022, from https://chem.libretexts.org/Bookshelves/Physical_ and_Theoretical_Chemistry_Textbook_Maps/Supplemental_Modules_ (Physical_and_Theoretical_Chemistry)/Physical_Properties_of_Matter/ Solutions_and_Mixtures/Ideal_Solutions/Dissolving_Gases_In_Liquids%2C_Henry’s_Law
19. Libretexts (June 9, 2022). 39.5: Gas Exchange across Respiratory Surfaces— Gas Pressure and Respiration, Biology Libretexts, retrieved August 10, 2022, from https://bio.libretexts.org/Bookshelves/Introductory_and_General_Biology/Book%3A_General_Biology_(Boundless)/39%3A_The_ Respiratory_System/39.05%3A_Gas_Exchange_across_Respiratory_Surfaces_-_Gas_Pressure_and_Respiration
20. Science Learning Hub (2007). Carbonate Chemistry, retrieved Aug. 10, 2022, from https://www.sciencelearn.org.nz/resources/469-carbonate-chemistry#:%7E:text=Calcium%20carbonate%20has%20a%20 very,temperature%20of%20the%20water%20decreases
21. University of Tennessee (November 2004). Aerobic Treatment of Wastewater and Aerobic Treatment Units, accessible at http://onsite.tennessee.edu/ Aerobic%20Treatment%20&%20ATUs.pdf.
22. Bowen, B. (July 2022). “U.S. Caustic Soda Contracts Firm Amid Snug Supply and Good Demand,” Independent Commodity Intelligence Services,” (www.icis.com).
23. Fattah, K.P.; Chowdhury, F.L. (2015). “Early Detection of Struvite Formation in Wastewater Treatment Plants,” Journal of Environmental Engineering and Science 10(1), pp. 19–25, accessible at https://doi.org/10.1680/jees.14.00015
24. Novak, J.T.; Love, N.G.; Smith, M.L.; Wheeler, E.R. (1998). “The Effect of Cationic Salt Addition on the Settling and Dewatering Properties of an Industrial Activated Sludge,” Water Environment Research 70(5), pp. 984-996, accessible at https://doi.org/10.2175/106143098x123318
Endnotes
A The specialty calcium carbonate product referenced in the text is known as Omya Optical®. It is made by Omya AG, which is based in Oftringen, Switzerland.
Chandler Mancuso’s educational background includes a bachelor’s degree in environmental science and a master’s degree in chemistry, both from Oakland University in Rochester, Michigan. He has also earned his Certified Water Technologist and LEED Green Associate designations, and in 2020, Mr. Mancuso was selected for Water and Waste Digest’s 2020 Young Professionals Award. He has delivered technical presentations at several industry conferences and published numerous technical papers in industry journals. He now works for MacDermid Envio Solutions as WaterCare Business Manager and has more than 5 years of research and application experience in wastewater treatment, specializing in chemical treatment applications. When this paper was written, Mr. Mancuso worked for Omya Inc. For questions regarding the technology discussed in this article, please contact Jarrod Massam at jarrod.massam@omya.com

Key words
ALKALINITY CONTROL, ACTIVATED SLUDGE, CALCIUM CARBONATE, WASTEWATER
41 the ANALYST Volume 30 Number 1
This article was presented at the AWT’s annual Conference that was conducted in Vancouver, B.C., September 21-24, 2022.
Can Calcium Carbonate Be an Effective Alternative for pH and Alkalinity Control in Activated Sludge Processes? continued


Tagged Polymers as Phosphonate Replacements in Water Treatment Applications
Abstract
 Klin Rodrigues and Jan Sanders, Nouryon
Abstract
Water treaters often use multicomponent formulations, which include polymers and phosphonates to prevent calcium carbonate and calcium phosphate scale formation and provide dispersancy in their systems. With phosphonates in short supply, polymers are being more heavily relied upon to provide scale control. Water treaters can benefit from the ability to detect active polymer to ensure their systems are well protected when formulation changes are necessary. Using fluorescent-tagged polymers, water treaters can determine the amount of available polymer and ensure that there is enough polymer to control scale, even when system upsets or disruptions result in stressed conditions. Unlike conventional polymers, tagged polymers provide constant feedback, whether the polymer is working or not, thus reducing guesswork. This article will provide information on phosphonate replacement, including field trial data for tagged polymers in both alkaline pH systems and neutral pH/stabilized phosphate systems.
Background
Formulations and w ater t reatment s ystems. There is a shortage of phosphonates in the marketplace. The goal of this article is to help encourage the replacement of phosphonates in water treatment systems with tagged polymers and explain how to monitor these tagged polymers to verify that these phosphonate free formulations are working and to provide a warning when system upsets occur to prevent scale and other deposits from being formed. To understand a possible solution to replacing phosphonates, we need to delve into the types of formulations and systems typically used in cooling tower systems. Cooling tower systems typically operate in the range of pH 7 to 9. These formulations and systems can be divided into two areas.
Stabilized phosphate treatments or neutral pH treatments. These systems typically operate in the pH range of 7 to 7.8 (lower end of the pH range) and have a corrosive tendency and a milder calcium carbonate scaling tendency. Under these corrosive conditions, relatively high levels of phosphate (5 to 10 parts per million (ppm)) are often used to inhibit corrosion. In these systems, calcium phosphate deposit control or stabilizing phosphate is generally of greater importance.
We will refer to these systems as stabilized phosphate or neutral-pH programs. In these systems, phosphonates
can be removed from the formulation and a good calcium carbonate polymer should be enough to control carbonate scale. We recommend a formulation that does not contain phosphonate and has a tagged polymer that is multifunctional; it primarily provides stabilization of phosphate, zinc and iron dispersancy, and controls carbonate scale as a secondary benefit.
Zero phosphate or alkaline treatments. These systems typically operate at the higher end of the pH range of 7.8 to 9, where conditions are less corrosive, and lower levels of phosphate or zero phosphate formulations are often used. Calcium carbonate scale control tends to be of greater importance in the higher pH, “alkaline” treatment programs. Even in these systems, phosphate can be present at low levels in makeup water, and as the water is cycled up, 1 to 3 ppm phosphate in makeup water can easily become 10 to 20 ppm phosphate in the cooling tower without any addition from the formulation. These systems may have both calcium carbonate and calcium phosphate scaling tendencies, especially as pH is increased. However, in these systems the tendency to form calcium carbonate scale is stronger compared to the tendency to form calcium phosphate scale. Therefore, we would recommend a formulation that does not contain phosphonate and a combination of tagged calcium carbonate polymer and untagged calcium phosphate polymer.
Mechanisms of scale control by polymers and phosphonates. Polymers control scale by threshold inhibition as well as crystal growth modification. Polymers also provide dispersancy for scale, silt, dirt and other insoluble material in cooling systems. In contrast, phosphonates provide threshold inhibition for carbonate scale and do not provide dispersancy or phosphate scale control.
Threshold inhibition is the best mechanism for scale control since it completely prevents scale from being formed. Crystal growth modification typically occurs after the threshold inhibition mechanism has been overcome and is a secondary—and not the preferred mechanism for—scale control, since the scale has already started to form, and it is a gamble whether they will adhere to the heat transfer surfaces or not. There are certain studies showing the efficacy of a polymer system using longer induction time. However, the residence time in the cooling systems is hours to days, which is orders of magnitude longer than induction time experiments that
45 the ANALYST Volume 30 Number 1
are measured in minutes in the lab. Therefore, induction time measurements in the lab may not be a good measure of polymer performance in the field. The true measure of efficacy of any polymer (especially in the field) is whether the filtered Ca (soluble calcium) is greater than 80-90% of the unfiltered Ca (total calcium) showing that scale (both calcium carbonate and calcium phosphate) is being controlled and not deposited on the cooling surfaces.
Tagged
Conventional systems use a combination of inert tracers such as para toluene sulfonic acid (PTSA) (1, 2) and untagged polymers. The inert tracers monitor the dosing of formulations into water treatment systems and the untagged polymers are used for scale control. While inert tracers can help water treaters monitor how much formulation is being added and maintained in their systems, these tracers do not indicate how much of the untagged polymer is being consumed. Different components in the formulation are depleted at different rates, and the use of an inert tracer does not provide an accurate picture of how much active polymer is available to provide scale control and dispersancy in the system.
Initially, PTSA (represented by the diamond) indicates the amount of untagged polymer (represented by the squiggly lines) or formulation as it is dosed in Figure 1a
and 1b. However, as the untagged polymer is consumed, PTSA remains at the same level (or concentration) and gives the same fluorescent signal, and it cannot account for untagged polymer consumption as illustrated in Figure 1c. Therefore, inert tracers do not indicate true polymer consumption in the treated water.
There are two main types of tagged polymers that are designed to minimize scale, distinguished by two types of fluorescent monomers. For the purposes of this paper, they will be referred to as Tagged Polymer A and Tagged Polymer B. Tagged Polymer B is based on a hydrophobically modified untagged polymer, which is discussed in previous papers (3, 4). The detailed descriptions of these monomers and polymers can be found in patent applications: WO Patent No. 2019025305A1 (5), U.S. Patent No.
Table B: Comprehensive Comparison of Tagged Polymer A and Tagged Polymer B and Systems Where They Can Be Used.
Tagged Polymer A Tagged Polymer B
Systems Recommended for light industrial Strongly recommended for heavy industrial (could also be used in light industrial)
System complexity Simple systems Complex systems with upsets
Formulation changes Replace PTSA and untagged polymer with tagged polymer Used in conjunction with PTSA. Replace untagged polymer with tagged polymer
Fluorometer Uses the same fluorometer as PTSA (PTSA fluorometer should be calibrated with a polymer standard)
Monitoring for formulation feed control
Control for cycles of concentration
Monitor tagged polymer only
Control cycles of concentration by normal means such as conductivity
Needs a new fluorometer (capital investment)
Monitor tagged polymer and PTSA.
Control cycles of concentration by normal means such as conductivity
46 the ANALYST Volume 30 Number 1
Polymers
Tagged Polymers as Phosphonate Replacements in Water Treatment Applications continued
Figure 1: 1a (left): Polymer with PTSA; Figure 1b (center): Polymer with PTSA as measured by fluorescence (initially); Figure 1c (right): Polymer with PTSA as measured by fluorescence (at equilibrium).
Polymers Detectors, Ex/Em wavelengths Phosphate scale Carbonate scale Dispersancy Comments Treatment programs Tagged Polymer A PTSA detectors 365/410 +++ +++ +++ Excellent for phosphate stabilization as well as carbonate scale control. Best for stabilized phosphate or neutral pH programs Tagged Polymer B New polymer detector 410/470 (Pyxis SP 350P) ++ ++++ +++ Excellent for calcium carbonate
control and dispersancy
Table A: Performance of Polymers for Different Scales.
scale
Best for zero or low phosphate, alkaline pH programs
+++
++
Note: ++++ best,
good,
acceptable, + poor.
11,208,408 B2 (6). Furthermore, additional information on Tagged Polymers A and B were described in previous presentations and accompanying papers (7, 8). The relative efficacy of these polymers for carbonate scales and dispersancy is listed in Table A. The detectors needed to use these polymers in the field are also listed in Table A.
Tagged Polymers A and B are detailed in Table B.
The main difference between Tagged Polymer A and Tagged Polymer B is that Tagged Polymer A is used by itself (without PTSA) and uses the same fluorometers as PTSA and therefore does not require the purchase of new detectors (Figure 2). Tagged Polymer A is better suited for light industrial systems. Tagged Polymer B is used in conjunction with PTSA and therefore does need an additional fluorometer. Tagged Polymer B is better suited for heavy industrial systems.
Upsets, disruptions and interferences. One of the main advantages of using a tagged polymer is the continuous feedback because it tells you when the polymer is working. As illustrated in Figure 3a, the polymer signal is in a control band showing that the polymer signal is in the expected range. This indicates there is enough
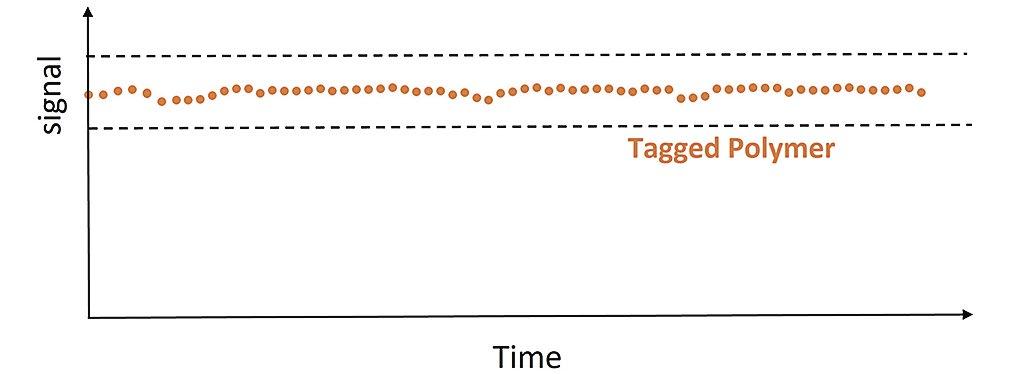
polymer in the system to prevent scale and other deposits from adhering to the heat transfer surfaces.
However, upsets or disruptions are likely to occur in most water treatment systems. In this case, the polymer signal will start to drop (Figure 3b), indicating an increased polymer demand.
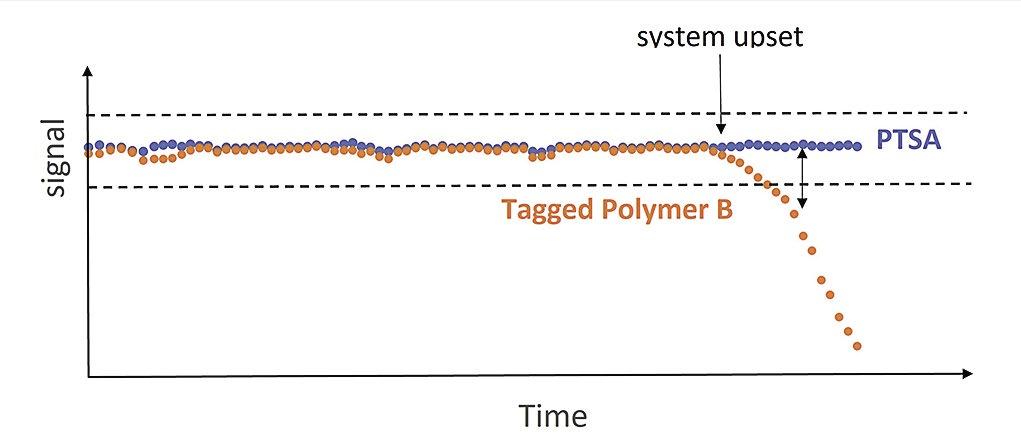
This drop in signal indicates a system upset the root cause of which needs to be determined and corrected to prevent deposition from occurring. This is exemplified in Case Study 1 where numerous, albeit small, mechanical issues occurred over a span of several months. These issues caused an increase in polymer demand and a drop in polymer signal. In each case the root cause was determined, and corrective action was taken to prevent scaling and deposition.
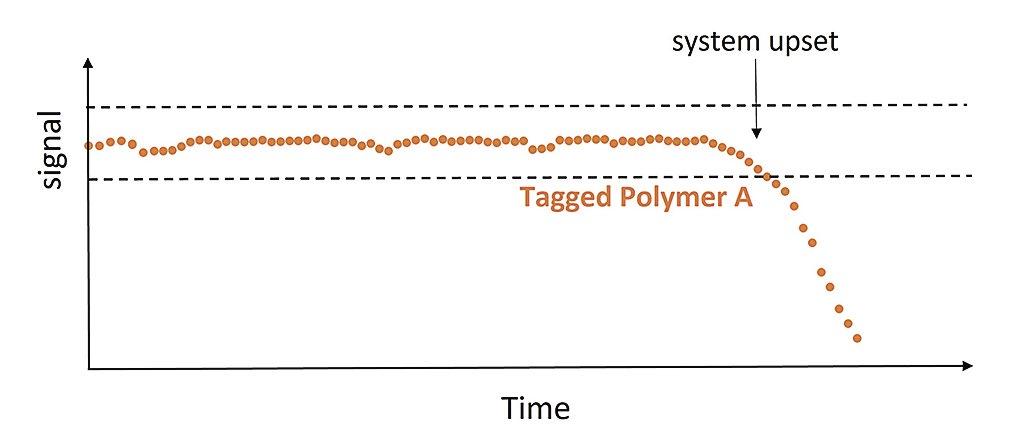
When using an untagged polymer, there is no polymer signal and, therefore, no visibility to determine if there is an upset in the system as depicted in Figure 3c.
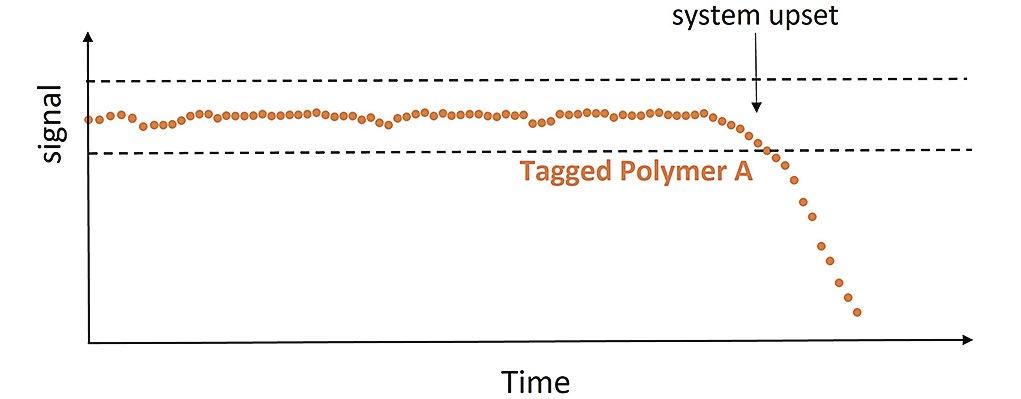
47 the ANALYST Volume 30 Number 1
Tagged Polymers as Phosphonate Replacements in Water Treatment Applications continued
Figure 2: 2a (top): Illustration of Tagged Polymer A controlled by a polymer signal band with an upper and lower limit. Figure 2b (bottom): Illustration of Tagged Polymer B controlled by delta with the signal between Tagged Polymer B and PTSA.
Note: In this article, all polymer concentrations are as active polymer and not polymer product. In addition, ppm and milligram per liter (mg/L) may be used interchangeably.
Figure 3: (a) (top graph): Illustration of polymer signal in a system where scaling and deposition is under control. Figure 3b (middle graph): Illustration of polymer signal in a system where a system upset is occurring. Figure 3c (bottom graph): Illustration of a lack of polymer signal using an untagged polymer.
To reiterate, a tagged polymer produces a signal that indicates it is working when it is in the control band. When the tagged polymer signal drops below the lower limit of the control band, it indicates there is an upset in the system which needs to be immediately corrected to prevent deposition from occurring.
Factors Affecting Polymer Consumption
Upsets or disruptions will occur in most systems due to a variety of reasons and are hard to predict and therefore, to control. Upsets or disruptions impacting a system can include the following:
Hardness and phosphate levels can fluctuate widely in city water sources leading to increased polymer demand that cannot be predicted. Tagged polymer systems can prevent underdosing or overdosing polymer.
Iron can decrease polymer performance, especially in its soluble form. Cavano (9) states that this is especially true of polymaleic acid (PMA) type polymers.
pH of system starts to increase due to acid pump failure or other reasons, leading to an increase in scaling tendency and polymer demand. If a tagged polymer is used, the control system will feed additional polymer.
Hot spots increase scaling potential for many systems. Tagged polymer systems may account for the additional polymer demand.
Chlorine or hypochlorite is widely used, but can lower the scale control performance of polymers, especially at higher levels (2 to 8 ppm as free chlorine).
Polymer dosing Scattolini et al. (10) point out that both underdosing and overdosing of the polymers used as deposit control agents is detrimental. It is important not to underdose the polymers since this can cause scale formation, resulting in failure of critical equipment. However, overdosing leads to increased costs.
Observations
Moriarty and coworkers (11) point out that there are many other variables that can affect polymer consumption in the system at any point in time. For example, heat loads can vary by time of day and by season. Furthermore, they point out that it is nearly impossible
to theoretically predict the polymer demand and upset conditions may occur without any prior indication. If the polymer dosage is based on a worst-case scenario, it will result in overdosing. Therefore, it is critical to measure the active amount of polymer in the system, especially in systems with severe and variable stresses. Most importantly, they point out that system stresses resulting in increased polymer consumption precede significant performance losses. This gives the operator a chance to respond to the lower amount of polymer and prevent system failures using proper corrective actions. These corrective actions could include a change in polymer dosage, and/or a change in operating conditions such as reduced cycles of concentration or changes in pH.
LSI and pH
If a system is operating at high Langelier Stability Index (LSI), the edge of the polymer’s ability to control scale, any upset (small or large) in the system can take the system over the scaling boundary and cause precipitation. Examples of these upsets could include an increase in the load on the system, change in the makeup water with regards to iron or phosphate, and upward drift in the system’s pH. It is well known that polymers are susceptible to higher levels of iron (11). Therefore, even small (ppm) levels of iron from corrosion products can cause these upsets or disruptions. Similarly, an increase in system pH by 0.1 to 0.2 can cause an increase in LSI from 2.3 (normal operating LSI) to 2.5. LSI is logarithmic, so in this example, the system has gone from 200 times calcite saturation at LSI 2.3 to 316 times calcium carbonate saturation at LSI 2.5. This minor change in pH will cause a large upset in the system. If the polymer is untagged, the upset will not be detected, and the system will be negatively impacted by bulk precipitation of scale.
LSI and Phosphate Scale
Another issue with relying on LSI is the interference (9) from phosphate. Even in a zero-P system, phosphate can be introduced into the cooling systems from the makeup water since many municipalities use it. Calcium phosphate is several orders of magnitude less soluble than calcium carbonate and therefore will form scale first, making the LSI calculation meaningless (12) and more importantly dangerous, since it may lull the operator into a false sense of security.
48 the ANALYST Volume 30 Number 1
Tagged Polymers as Phosphonate Replacements in Water Treatment Applications continued
Tagged polymers overcome these issues because one is measuring the active polymer whose signal decreases when the system reaches an LSI at which the polymer does not perform. Therefore, these tagged polymers have a built-in security system that raises an alarm at the appropriate time.
LSI claims and comparisons between different studies. Frayne (13) has cautioned about exaggerated and misleading LSI claims in product literature and brochures. Most suppliers will claim that their polymer is the best polymer as a replacement for phosphonate in water treatment formulations. Data will be presented showing the polymers working at high LSI. There are different equations to estimate LSI and these equations can give different LSI numbers. Therefore, LSI numbers are not absolute but depend on the method or equation used to calculate them. Unfortunately, most LSI numbers reported in literature, presentations and outputs from software programs do not detail the equations used for their estimation. Therefore, it is difficult to compare LSI between different studies. Furthermore, these LSI numbers may not account for disruptions that can occur in the field, some of which are described above.
Shortages of Raw Materials
Recent supply chain disruptions have driven the need to identify new raw materials for water treatment formulations. Transitioning to new formulations can be simplified, especially with the continuous monitoring provided by fluorescent tagged polymers. This powerful tool allows water treaters to read the fluorescent signal to determine if the current amount of polymer is sufficiently protecting the system against scaling. When the system is under control, the water treaters can avoid overdosing with polymers, and when it is not, they will receive early indications of disruptions enabling a proactive response. Ultimately, tagged polymers deliver a higher level of assurance than untagged polymers.
Effect of system stress on tagged polymer signal.
Kalakodimi et. al (14), studied Tagged Polymer B as a deposit control agent (DCA) in a zero-phosphate system in combination with PTSA as an inert tracer. In their pilot cooling tower study, the pH of the system was steadily increased to cause calcium carbonate precipitation (Figure 4). As the pH was increased, the tagged polymer and the PTSA signal were measured.
Figure 4: Effect of calcium carbonate precipitation on the measured tagged polymer concentration. The pilot study used 7.5 ppm active polymer tagged with monomer B and 100 parts per billion (ppb) PTSA.
In addition, the filtered (F) and unfiltered (UF) calcium levels were also measured. The UF is the total calcium in the system and the higher the recovery of F versus UF, the better the carbonate scale control.
As shown in Figure 4, calcium carbonate began to form at a pH of approximately 9.6. One will note that the tagged polymer and PTSA signals began to deviate from each other around pH 9.4, giving an early warning that scale formation is about to start. This deviation is a clear indication of an upset in the system and corrective action needs to be taken to prevent scale formation. In addition, this article demonstrated that Tagged Polymer B can be used up to an LSI of 2.9. The authors point out that relying on the PTSA reading only (as is the current practice) would not have alerted the water treater to the carbonate scaling event. Most importantly, this study emphasizes the point that under normal conditions the polymer signal will be in the expected range, indicating that the polymer is controlling scale as confirmed by the high ratio of filtered to unfiltered calcium.
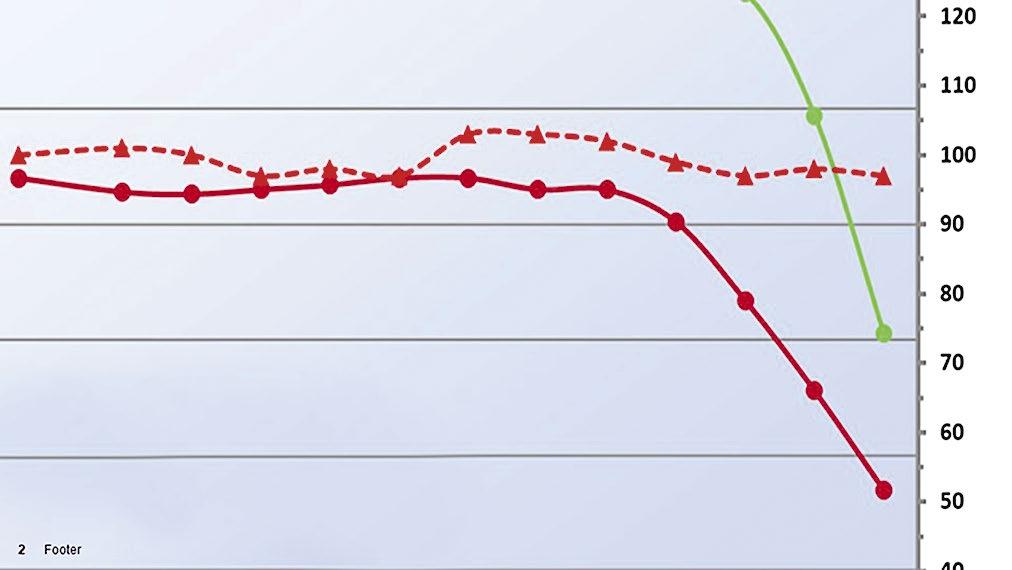
Field Data
Tagged polymers have been used by one large water treatment company for over 20 years, especially in stabilized phosphate systems, with results having been documented in a previous AWT paper (15) and in several publicized field studies. Recently, another large company (16) has started to utilize this technology.
A new generation (5-8) of tagged polymer technology is now available to the general marketplace and is being used in several process cooling towers at small-to-large
49 the ANALYST Volume 30 Number 1
Tagged Polymers as Phosphonate Replacements in Water Treatment Applications continued
industrial facilities in the United States as well as in smaller comfort cooling systems. The field data presented in Table C is a portion of the data available, with some information omitted to protect confidentiality. The included case studies illustrate the additional benefit provided by measuring the active polymer in the system. Changes in polymer concentration can give additional information on the scaling stress on the system. A drop in polymer signal indicates increased polymer consumption and steps should be taken to identify and correct the system disruption in order to prevent bulk scale precipitation. Additional polymer can be automatically added by the system controller to address minor disruptions until the source of the problem can be identified and corrected. Even if the system does not have an interference or upset, the steady polymer signal is assurance that the cooling system is under control and protected from scaling.
Case Study 1
The first case study was conducted in a large facility which has a relatively large cooling tower with six bays. The system operated at alkaline pH and incorporated Tagged Polymer B in the formulation. The details of the cooling tower are in Table C.
Here is a summary of the details related to this large cooling tower.
Alkaline pH system which operated in the range of pH 8.5 to 9
Formulation was phosphonate and phosphate free (P free)
Chlorine oxidizing biocide
Makeup water was prefiltered well water
• Typical conductivity 120 to 135 micromhos per centimeter (µmho/cm)
• Iron <0.25 ppm (due to filters)
• pH 6.6 to 7.4
Conductivity, pH, ORP, PTSA, and tagged polymer –continuous measurement
Field engineer goes to site once a week to collect data and monitor the systems
Iron, total and free chlorine, and micro counts
Cycles of concentration were controlled by conductivity in the range of 650 to 800 µmho/cm
Typically run at 5 to 6 cycles of concentration
Formulation fed on PTSA signal – Tagged Polymer signal detects upsets
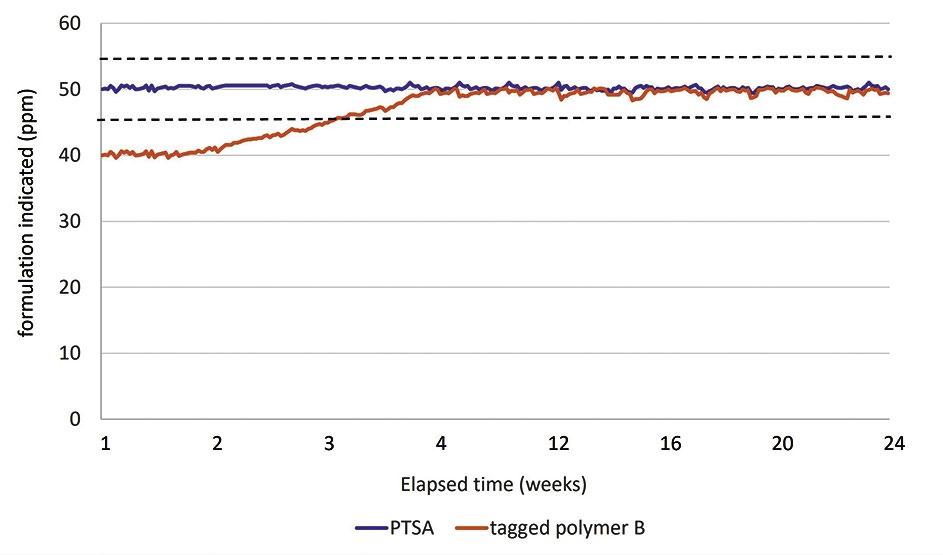
For the purposes of this case study, the first week after the switch over from the old formulation is designated as Week 1 and the subsequent weeks are designated as Weeks 2, 3, 4, etc.
Conductivity, pH, oxidation reduction potential (ORP), PTSA, and tagged polymer were measured continuously by the controller. Other parameters such as iron, total and free chlorine and micro counts were measured once a week when the field engineer was on site. The makeup water was analyzed once a week at the same time. The towers were being fed off well water (treated through pre-filters) directly to the tower basin.
The original formulation containing PMA (untagged) was switched to a formulation containing Tagged Polymer B without phosphonate at Week 1. Initially the Tagged Polymer B signal was low and did not fall within the control band of 45 to 55. The polymer signal started to increase and reached the midpoint of the control band at Week 4 (Figure 5).
It appears that there was fouling due to the relatively poor scale control performance of the previously used PMA-based formulation. This fouling consumed the Tagged Polymer B formulation leading to the
50 the ANALYST Volume 30 Number 1
Tagged Polymers as Phosphonate Replacements in Water Treatment Applications continued
Figure 5: Tagged Polymer B and PTSA signal over 24 weeks in a large cooling tower in an alkaline pH system of Case Study 1.
Case Study Recirculation Rate (gpm) Delta T (°F) Evaporation (gpm) Makeup (gpm) Blowdown (gpd) 1 28,880 11 270 347 110,880
Table C: Details of the Water Consumption and Temperature Deltas of This Cooling Tower.
lower-than-expected polymer signal initially (orange line in Weeks 1 through 4 in Figure 5). After the residual fouling was addressed and cleanup was complete, the Tagged Polymer B signal (orange) started to track the PTSA signal (blue) and was around the midpoint of the 45 to 55 control band (Weeks 5 to 24 in Figure 5).
System disruptions/Equipment issues. The pH, iron and conductivity of the makeup water (after pre-filtration) is detailed in Table D. The pH of the makeup water was consistent as were the hardness and total dissolved solids as measured by conductivity.
The makeup water conductivity was relatively consistent week to week, varying between 123 to 132 µmhos/cm (Table D). The conductivity target for this tower was set to the 650 to 800 µmho/cm range, in which it operated most of the time (Figure 6). This translated to 5.0 to 6.5 cycles of concentration.
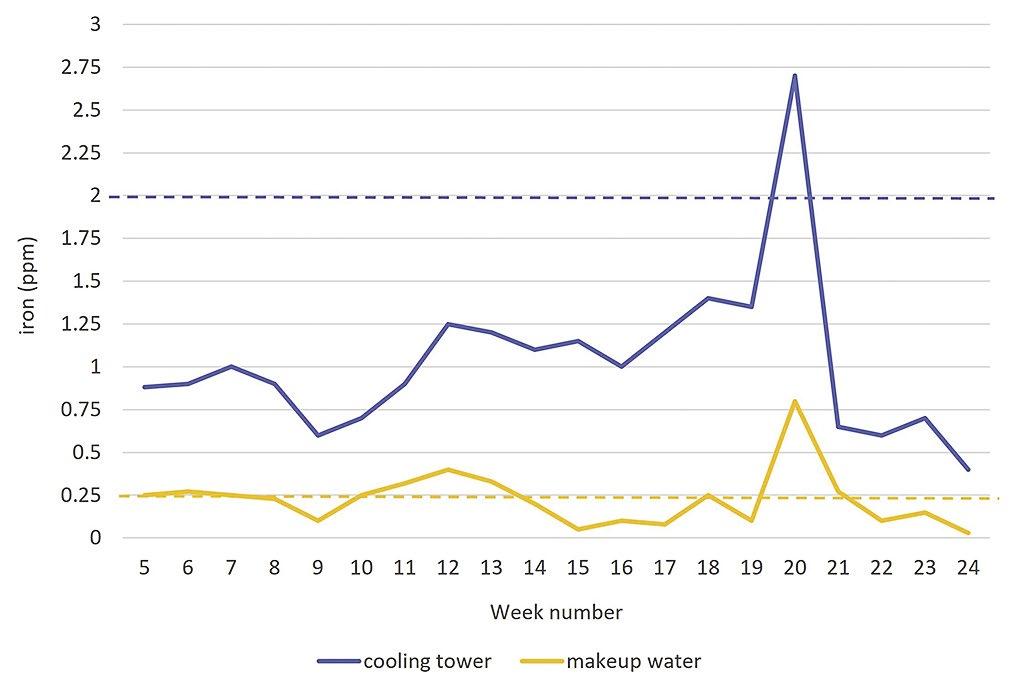
However, during Week 18, the blow down system malfunctioned, which resulted in a conductivity spike above the 800 µmho/cm set point. The root cause was a failed solenoid valve in the blowdown system that
led to higher cycles of concentration and increased polymer demand by the system. The field engineer reported that the polymer signal started to drop when the conductivity increased while the PTSA signal was in the expected range as illustrated in Figure 3b. This indicated that the higher conductivity was causing an increase in scaling tendency and therefore an increased polymer demand, resulting in the drop in polymer signal. The problem was temporarily fixed by manual blow down until the valve could be replaced. This illustrates the point that the tagged polymer buys time until the system disruption can be rectified. The iron (Fe) in the makeup water was targeted to be less than 0.25 ppm after filtration and the iron in the cooling towers was targeted to be less than 2 ppm. As mentioned above, iron may precipitate out polymers from the system, increasing the polymer demand. However, even if some precipitation occurs, the drop in tagged polymer signal will trigger the controller to increase formulation feed, increasing the amount of polymer in the system to account for higher iron levels.
The iron levels in the makeup water and the cooling tower are depicted in Figure 7.
51 the ANALYST Volume 30 Number 1
Tagged Polymers as Phosphonate Replacements in Water Treatment Applications continued
Week Number 6 7 8 9 10 11 12 13 14 15 16 17 18 19 20 21 22 23 24 pH 7.4 7.05 6.9 7 6.8 7 6.8 6.8 6.8 6.6 7.4 6.9 7 6.8 Makeup water conductivity (µmhos) 128 132 123 127 128.5 129 131 133 130 129 130 128 123 127 131 Fe (ppm) in makeup water 0.27 0.25 0.23 0.1 0.25 0.1 0.12 0.03 0.2 0.05 0.1 0.08 0.06 0.1 0.4 0.27 0.1 0.15 0.03
Table D: Make-up Water pH, Iron and Conductivity.
Figure 6: Conductivity (µmho/cm) of the cooling tower in Case Study 1 over 24 weeks.
Figure 7: Iron/Fe (ppm) levels in makeup and cooling tower in Case Study 1 over 24 weeks.
The iron level in the makeup water was 0.8 ppm during Week 20 (Figure 7). It was determined at the next weekly visit by the field engineer that the iron removal prefilter was not working during the previous week. As a result, the iron level in the cooling towers was abnormally high and in the 2.7 to 2.8 ppm range (Figure 7) during Week 20. The field engineer did report that the tagged polymer signal started to drop as the iron increased, indicating that the higher level of iron was increasing the polymer demand as illustrated in Figure 3b. The filter issue was corrected, the system was back under control, and the polymer signal then tracked the PTSA signal.
The field engineer indicated that there was no change in corrosion performance, as evidenced by the corrosion coupons, once the system switched to the Tagged Polymer B formulation.
Case Study 2
The second case study was conducted in a large facility in a large cooling tower with four bays. The cooling tower operated at alkaline pH and incorporated Tagged Polymer B in the formulation. The details of the cooling tower are in the Table E.
A summary of the details of this cooling tower are as follows:
Alkaline pH system which operated in the range of pH 8.5 to 8.8
Formulation was phosphonate and phosphate free (P free)
Chlorine oxidizing biocide
Makeup water
• Typical conductivity 125 to 135 µmho/cm
• pH 6.7 to 7.3
Conductivity, pH, ORP, PTSA, and tagged polymer –continuous measurement
Field engineer goes to site once a week to collect data and monitor the systems
Iron, total and free chlorine, and micro counts
Cycles of concentration were controlled by conductivity in the range 600 to 750 µmho/cm
Formulation fed on PTSA signal – tagged polymer signal detects upsets
The free chlorine for this tower during the time that Tagged Polymer B was used in the formulation is
depicted in the Figure 8. The goal was to maintain at least a 0.2 ppm of free chlorine and ideally between 0.2 and 1 ppm. However, as this chart shows the free chlorine levels are in the 4 to 7 ppm range (see for example Weeks 5, 7, 10, 14, 18, 20 and 23) mainly due to chronic issues with the chlorine addition system.
Despite these spikes in free chlorine levels (Figure 8), the controller data showed a steady polymer signal (as illustrated in Figure 3a) for Weeks 5 to 24 even when the chlorine levels were high in Weeks 5, 7, 10, 14, 18, 20, and 23. This indicated that the polymer signal during these time periods was consistent and did not go down when high levels of chlorine were in the system. This is important as the use of chlorine is commonplace and does not impact the demand of tagged polymer.
The field engineer indicated that they did not detect any change in corrosion performance when switching over to the formulation that contained Tagged Polymer B and during the entire period that this formulation was used in this tower.
Case Study 3
Tagged Polymer A was used in a mid-sized evaporative tower used for comfort cooling using a stabilized phosphate. The cycles of concentration were controlled by conductivity in the range 1,150 to 1,200 µmho/cm.
52 the ANALYST Volume 30 Number 1
Tagged Polymers as Phosphonate Replacements in Water Treatment Applications continued
Case Study Recirculation Rate (gpm) Delta T (°F) Evaporation (gpm) Makeup (gpm) Blowdown (gpd) 2 14,400 8 98 126 40,320
Table E: Details of the Cooling Tower’s Water Consumption and Temperature.
Figure 8: Free chlorine (ppm) levels in cooling tower in Case Study 2 over 24 weeks.
This tower has a history of significant variability of phosphate levels in the makeup water from the city, which combined with the phosphate from the formulation had caused calcium phosphate scaling issues in the past. The trial used existing monitoring and feed equipment. The formulation for the trial did not contain any phosphate since there was enough phosphate in the system from the makeup water. Tagged Polymer A replaced PTSA and a premium untagged (phosphate inhibiting) polymer in the new stabilized phosphate formulation. The existing PTSA fluorometer was calibrated with a 10-ppm polymer solution and was used to monitor the polymer. Stabilized bromine was added to the system as a slug every day.
The fluorometer (polymer signal) reading for a period of time from the controller in the cooling tower is shown in Figure 9. The steady polymer signal shows that the change in phosphate levels in the makeup water did not lead to a decrease in polymer level. Thus, polymer levels were high enough (15 to 17 ppm) to address this level of phosphate variability in the makeup water.
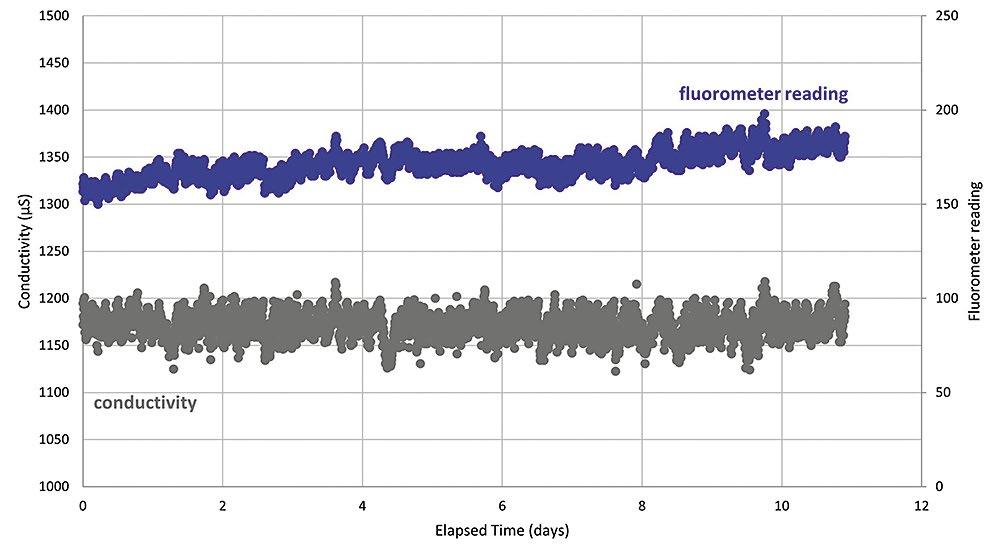
Samples of the makeup water and the cooling tower water were taken at intermediate times during the trial. Several parameters were measured on the samples, including fluorescence (to monitor active polymer) and filtered and unfiltered phosphate to determine the level of phosphate scale control.
Analysis of the makeup water shows that the phosphate in the makeup water varied between 1 to 2.8 ppm over the five months (Table F). The cycles of concentration were 8 and therefore the total phosphate in the system varied between 8 and 22 ppm just from the makeup
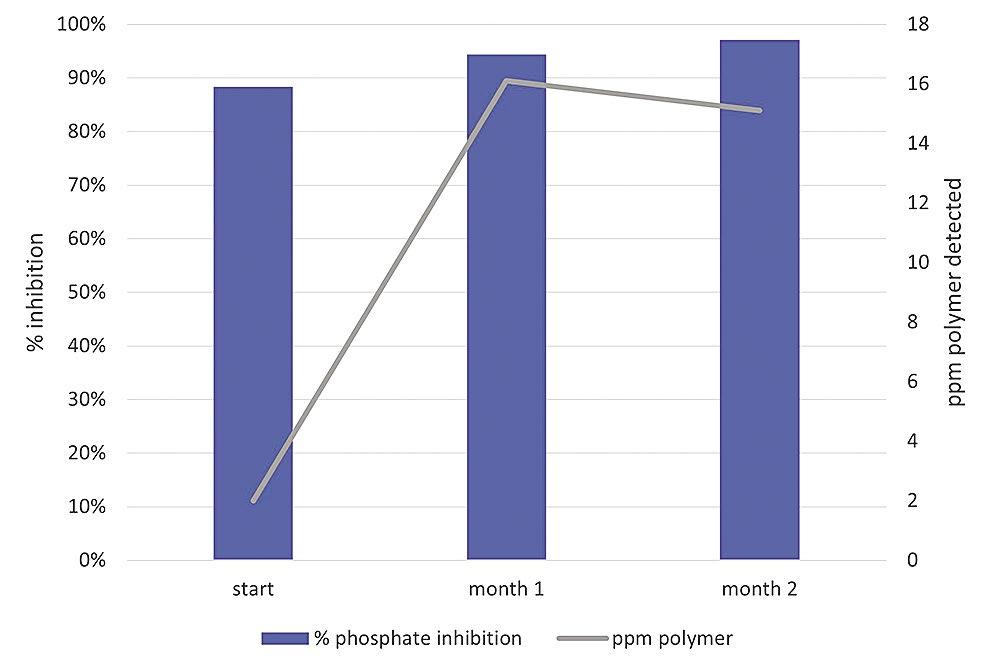
water, with the pH of the makeup varying 7.3 to 7.9. However, the pH in the tower widely varied from 7.5 to 9.2 in these samples (Table F), which is a large variation in pH. Therefore, it appears that the pH was not well controlled and the periods where the pH was high (8 to 9.2) would lead to increased scaling tendencies.
The large amount of phosphate and large variability in pH may explain why this tower had scale fouling in the past.
The phosphate inhibition numbers (calculated by dividing filtered phosphate by unfiltered phosphate of Table F) were above 90% (Figure 10), demonstrating that the tower is under control. This was significant because scale formation had occurred in the past due to the fluctuations in phosphate from makeup water and high pH levels in the tower. Nevertheless, the amount of polymer added was enough to control the phosphate scale as shown by the steady level of polymer and as
53 the ANALYST Volume 30 Number 1
Tagged Polymers as Phosphonate Replacements in Water Treatment Applications continued
Figure 9: Conductivity and polymer signal for Tagged Polymer A using a stabilized phosphate system in a midsize cooling tower.
Time Sample source pH Conductivity (µS/cm) Phosphate (ppm) Unfiltered Filtered Start makeup 7.3 154.4 1.8 1.4 tower 9.2 1,151 9.4 8.3 Month 1 makeup 7.4 152 2.3 1.7 tower 8.1 1146 10.7 10.1 Month 2 makeup 7.0 158.9 1.8 1.3 tower 7.5 1,208 10.4 10.1 Month 5 makeup 7.9 174 1 0.8 tower 8.4 1,126 7.9 7.5
Table F: Makeup Water and Tower Readings in Case Study 2.
Figure 10: Percentage of phosphate inhibition (blue columns) calculated by dividing filtered phosphate by unfiltered phosphate. Fluorometer readings (gray line) show tagged polymer levels in the cooling tower at the beginning and after month 1, 2, and 5 of the trial.
read by the controller in Figure 9 (blue dots) and in spot checked samples in Figure 10 (gray line). If the polymer was not in control of the scale, the polymer signal would have decreased. The combination of steady and constant polymer signal supplemented with the phosphate inhibition data clearly shows that the system is in control under conditions of failure in the past.
Additional Field Data
Blackmore (17) conducted field trials for both Tagged Polymers A and B in small facilities, which provides a good industry expertise perspective. The trials were conducted on 300-ton or smaller cooling towers over a period of 22 weeks. The formulations used in these trials were proprietary and it is not clear if a phosphonate was present in these formulations. It is presumed that the inhibitor program was stabilized phosphate or neutral pH, since sulfonated copolymers that are typically used in these systems were used in this study and the study reported levels of 7 to 19 ppm of total inorganic phosphate.
This study confirmed that when the stress on the system was amplified by increasing the iron to 1.1 ppm, the PTSA signal was constant but the tagged polymer signal decreased. Furthermore, the corrosion rates for both mild steel and copper were found to be acceptable. Blackmore’s data indicate that both types of polymers perform well in the field and found no difference between the tagged polymers and the previously used untagged polymer in the areas of scale control, corrosion control, stability, and
Table
Ingredients in existing stabilized phosphate formulation
Sodium phosphate
Zinc chloride
Tolyltriazole
AA/AMPS or terpolymer
Phosphonate
blendability. It is up to the operator to decide which type of polymer they need to use in their formulations. The conclusion of this study was: “The ability to test both product addition (PTSA signal) and active polymer can provide more data about the treated system allowing the water treater to make better decisions (18).”
Formulations
Formulation changes for stabilized phosphate or neutral pH programs. For stabilized phosphate formulations operating at a neutral pH, the phosphonate will be removed from the formulation. The untagged phosphate inhibiting polymer (normally AA/AMPS) and PTSA in the formulation is replaced by Tagged Polymer A (Table E). Phosphate scale is the major issue in these systems, and therefore it is important to detect the level of the tagged polymer that inhibits phosphate scale which can be done using Tagged Polymer A. Tagged Polymer A is also a good calcium carbonate scale control polymer and should prevent carbonate scale formation in these neutral pH systems. For formulations containing Tagged Polymer A, the same detectors used to detect PTSA can be used, and it is important that PTSA be removed from the formulation. This will potentially reduce the blending complexity of using PTSA and possibly the cost of the formulation.
This type of simplified approach was recommended by Frayne (18), who was correct in predicting this as a way of the future: “When formulating for any particular problem, it is often useful to mix a primary and backup
Ingredients in Tagged Polymer A stabilized phosphate formulation Comments
Sodium phosphate
Zinc chloride
Tolyltriazole
Tagged Polymer A
Phosphonate
PMA PMA
Anodic corrosion inhibitor
Cathodic corrosion inhibitor
Provides copper corrosion protection
Tagged Polymer A is good for phosphate scale which is the major scale in stabilized phosphate treatments
Carbonate scale is not a major issue in stabilized phosphate treatments and can be controlled by Tagged Polymer A
Tagged Polymer A has a secondary benefit of carbonate scale control
PTSA PTSA Track the polymer and the formulation using the Tagged Polymer A signal
Tagged Polymer A signal verifies all scale is under control
Sodium hydroxide Adjusts pH of the formulation Water Water
Sodium hydroxide
54 the ANALYST Volume 30 Number 1
Tagged Polymers as Phosphonate Replacements in Water Treatment Applications continued
G: Product Formulation for Using Phosphate as a Corrosion Inhibitor.
Note:
Tagged Polymer A is a single polymer that can replace phosphonate, PMA, and PTSA in a stabilized phosphate formulation, but it does not contain these ingredients.
inhibitor together. This does not mean, however, that the formulation package must, of necessity, contain a great many chemistries, as a specific chemistry may be primary in one effect secondary in a minor effect, and tertiary in still another effect. Thus, by careful selection and mixing of vendor blends, we can provide synergistic inhibitor effects with only a very limited number of chemistries. This aids simplicity, reduces inventory costs, and is likely to be the way of the future.”
The primary benefit of Tagged Polymer A is phosphate, iron, and zinc stabilization as well as dispersancy with the secondary benefit being calcium carbonate scale control. The polymer signal would decrease if the polymer was consumed by either the primary or secondary benefit or mixture of the two. Therefore, it makes this polymer very suitable for phosphonate replacement in these stabilized phosphate or neutral pH systems. Finally, these changes make the formulation simpler while giving the water treater the ability to track multiple actives such as carbonate (PMA and phosphonate) control agents and phosphate scale control agents and dispersants (AA/AMPS or terpolymer) by simply tracking one active polymer.
Formulation changes for alkaline pH systems. For formulations used in alkaline pH systems, the carbonate scale control polymer (typically some version of PMA) in the formulation is replaced by Tagged Polymer B (Table G). Carbonate scale is the major issue in these systems, making it important to detect the level of the tagged polymer that inhibits carbonate scale. Tagged Polymer B is a superior carbonate inhibitor to PMA and the formulator should see a boost in carbonate inhibition performance. This assertion is verified in actual field conditions, as described in Case Study 1 above.
If phosphonates are available, then one could use them in these alkaline pH system formulations since the calcium carbonate scaling tendency is high. The water treater has options to use a regular amount of phosphonate or lower the amount of phosphonate or not use any phosphonate at all since the signal of the tagged polymer will confirm that it is working even in these modified formulations. Furthermore, as mentioned above, Tagged Polymer B is strongly recommended because of the advantage of monitoring a key active component in the system.
Conclusions
As mentioned in the introduction, the goal of this paper is to provide data that suggests tagged polymers are viable replacements for phosphonates in water treatment systems. Tagged polymers enable monitoring of water treatment systems to provide early warning of system upsets and to ensure that the phosphonate-free formulation is working (i.e., protecting the system from scale and deposit formation).
Case studies have been shown for both alkaline pH and neutral pH systems where:
Monitoring of tagged polymers verify that these phosphonate-free formulations are working, which cannot be done by the untagged polymer currently being used.
Demonstrating that if the polymer signal is in a control band, the system is controlling scale and deposits.
If the polymer signal is dropping, this provides a warning that system upsets are occurring and that corrective action needs to be taken to prevent scale and other deposits from being formed.
Tagged Polymer B is excellent for carbonate scale. Takes the place of both PMA and phosphonate and its signal verifies that scale is under control
or terpolymer Takes care of any phosphate from the makeup water PTSA PTSA Used for troubleshooting
AA/AMPS or terpolymer
Tolyltriazole Tolyltriazole Provides copper corrosion protection
55 the ANALYST Volume 30 Number 1
Tagged Polymers as Phosphonate Replacements in Water Treatment Applications continued Table
Existing Formulation Tagged Polymer B Formulation Comments Phosphonate Phosphonate
H: Product Formulation Alkaline pH Systems.
PMA Tagged Polymer B
AA/AMPS
Sodium
Water
Sodium hydroxide
hydroxide Adjusts pH of the formulation Water
Monitoring key active ingredients, such as polymer for scale control and dispersancy, is imperative to maintaining water treatment system operations. The more proactive water treaters can be in taking corrective action, the greater the chance of reducing system downtime. Therefore, the ability to not only measure active polymer but to also have continuous insight to these data through remote monitoring of the fluorescent tagged polymer creates a powerful tool for water treaters and their customers. When the system is under control, the fluorescent signal of the tagged polymer will reveal if the current amount of polymer is sufficiently protecting against scaling, which can help reduce overdosage. In the case of any disruptions, tagged polymers provide early indicators so water treaters can act proactively, delivering a higher level of assurance than untagged polymers. Fluorescent tagged polymers allow the system to be managed through remote monitoring, with simpler formulations, and by using the right amount of polymer.
Acknowledgments
The authors would like to thank the following individuals for their contributions to this publication: Mr. Jobie Jones and Mr. Sajal Pantha for polymer synthesis, Mr. Steve Leuty for applications, and Mr. Ray Post for discussions and feedback.
References
1. Sawada K. (1997). “The Mechanisms of Crystallization and Transformation of Calcium Carbonates,” Pure and Applied Chemistry 69(5), pp. 921-928.
2. Dominique J.; Tobler, J.D. (2016). “Effect of pH on Amorphous Calcium Carbonate Structure and Transformation,” Crystal Growth & Design, 16, pp. 4500-4508.
3. Rodrigues, K.A.; Sanders, J. (Sept. 26-29, 2018). “The Role of Hydrophobic Modifications of Polymers for Scale Control,” AWT 2018 Conference, Orlando, Florida, Association of Water Technologies, Rockville, Maryland.
4. Rodrigues, K.A.; Vanderhoof, M.; Sanders, J. (Sept. 11-14, 2019). “Non-phosphorus/non-P based Scale Inhibitors for Calcium Carbonate Scale Control,” AWT 2019 Conference, Palm Springs, California, Association of Water Technologies, Rockville, Maryland.
5. Rodrigues, K.A.; Bailey, A.J.; Jones, J.L.; Winkenwerder, W.A.; Band, E.I. (2019). “Water Soluble Pyranine Polymers and Method of Making,” Patent No. WO 2019025305A1.
6. Rodrigues, K.A. (December 2021). “Method of Controlling Scale in Aqueous Systems,” U.S. Patent No. 11,208,408 B2.
7. Rodrigues, K.A.; Sanders, J. (Sept 30-Oct 2, 2020), “Fluorescent Tagged Polymers for Scale Control and Dispersancy,” AWT Virtual 2020 conference, Association of Water Technologies, Rockville, Maryland.
8. Rodrigues, K.A.; Sanders, J. (Sept. 23-25, 2021). “Fluorescent Tagged Polymers in Water Treatment Applications,” AWT 2021 Conference, Providence, Rhode Island, Association of Water Technologies, Rockville, Maryland.
9. Cavano, R. (2008). “Developing Cooling Water Treatments, Parts 1-4,” The Analyst
10. Scattolini, J.L.; Zhang, E; Buentello, K.E. (March 2001). “A Quantitative Polymer Method for Cooling Water Applications,” Paper No. NACE01447, CORROSION 2001, Houston, Texas.
56 the ANALYST Volume 30 Number 1
Tagged Polymers as Phosphonate Replacements in Water Treatment Applications continued
11. Moriarty, B.E; Rasimas, J.P; Young, P.R.; Hoots, J.E. (March 2001). ”Methods to Monitor and Control Scale in Cooling Water Systems,” Paper No. NACE-01450, CORROSION 2001, Houston, Texas.
12. Puckorius, P. (April 2019). “Predicting Calcium Carbonate Scaling Accurately,” Process Cooling, accessible at https://www.process-cooling. com/articles/89674-predicting-calcium-carbonate-scaling-accurately.
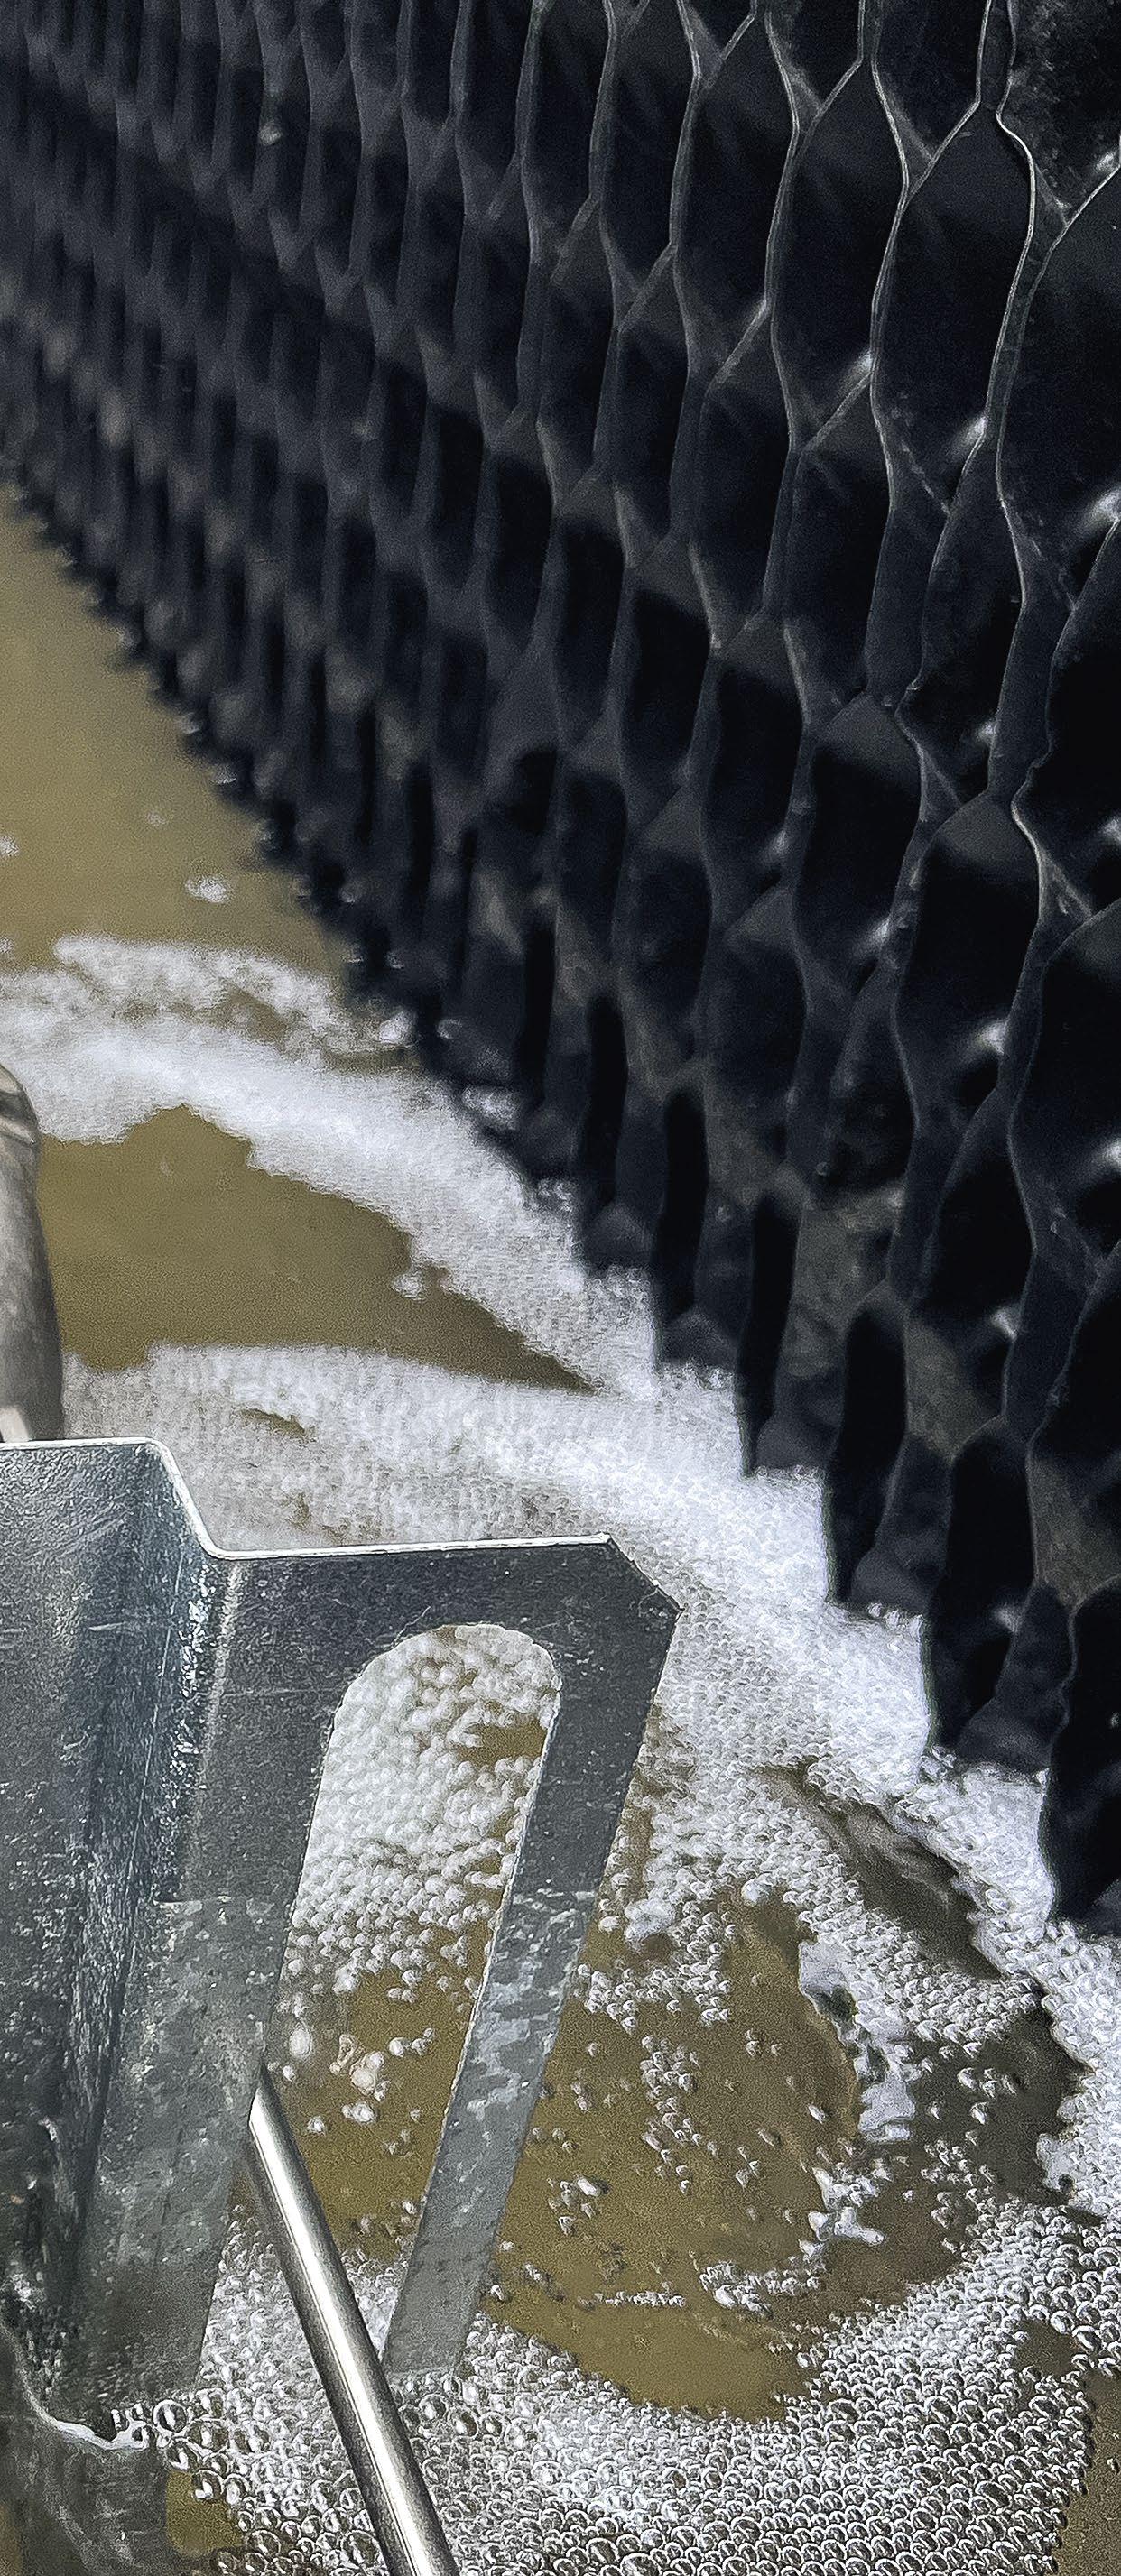
13. Frayne, C. (Summer 2009). “Organic Water Treatment Inhibitors: Expansion of Current Guidelines, Myths, Misinformation, and the Next Generation of Novel Chemistries, Part I,” The Analyst 16(3).
14. Kalakodimi, R.P.; Post, R.M. (Feb 9-13, 2020). “Advances in Monitoring and Control of Cooling Systems Chemistry,” CTI, Paper No: TP20-14, Cooling Technology Institute, Houston, Texas.
15. Reggiani, G.; Young, P. (n.d.). TRASAR® Technology- A Review and Comparison,” AWT document, Association of Water Technologies, Rockville, Maryland.
16. ChemTreat (March 30, 2021). “Detecting System Stress and Scale at a Chemical Plant with QuadDetect™ Tagged Polymer,” ChemTreat Inc., Richmond, Virginia, accessible at https://www.chemtreat.com/detectingsystem-stress-and-scale-at-a-chemical-plant-with-quaddetect-taggedpolymer/
17. Blackmore, T. (Sept. 22-25, 2021). “Field Trials and Observations of Tagged Polymers,” AWT 2021 Conference, Providence, Rhode Island, Association of Water Technologies, Rockford, Maryland.
18. Frayne, C. (2009). “Part 2: Organic Water Treatment Inhibitors: Expansion of Current Guidelines, Myths, Misinformation, and the Next Generation of Novel Chemistries,” The Analyst 16(4)
Klin Rodrigues, Ph.D., is a principal scientist in the Polymer Product Chemistry Group at Nouryon. He has been with Alco Chemical/AkzoNobel/Nouryon for more than 26 years. Dr. Rodrigues has authored over 30 technical papers and holds more than 75 U.S. patents. He holds a doctorate in Polymer Science and a master’s degree in chemical engineering from the University of Akron. He earned his bachelor’s in chemical engineering from the Indian Institute of Technology Bombay (India). Dr. Rodrigues can be contacted at klin.rodrigues@nouryon.com .

Jan Sanders is a senior researcher with Nouryon. She has a bachelor’s degree in chemistry from the University of Tennessee at Chattanooga and has worked in various roles for Nouryon and its predecessors over the past 24 years. Ms. Sanders has experience with design and synthesis of polymers and their use in water treatment and oilfield applications. She has five granted patents and has co-authored several technical publications.

Key words
CARBONATE SCALE, DEPOSIT CONTROL, FLUORESCENCE, PHOSPHATE SCALE, PHOSPHONATES, PHOSPHONATE REPLACEMENT, POLYMERS, PTSA, SCALING, TAGGED POLYMERS
57 the ANALYST Volume 30 Number 1
This paper was presented at the AWT’s 2022 annual conference that was conducted September 21-24, 2022, in Vancouver, B.C.
Tagged Polymers as Phosphonate Replacements in Water Treatment Applications continued
Membership Benefits

AWT Benefit Comparison Chart
listed in "Find an Industry Supplier"
Listed as Primary in "Find a Water Treatment Vendor"
Listed as staff in "Find a Water Treatment Vendor " at Discretion of Owner
Listed as either primary or staff in "Find an Industry Supplier"
58 the ANALYST Volume 30 Number 1
Benefit WTC Business Owner Non-Business Owner WTC Company Member Supplier Member Individual Member EDUCATION Technical Training Seminar Discounts Online Training Discounts Free Members Only Webinars Safety Training access Networking/Access Business Owners Meeting Invitation Annual Convention and Exposition - Attend Annual Convention and Exposition - Exhibit AWT Exchange Company listed
Water Treatment Vendor"
Can purchase AWT Advertising LinkedIn PUBLICATIONS Discounted bookstore publications Complimentary Analyst subscription Complimentary AWTGram subscription CAREER ADVANCEMENT CWT Program Discounts Young Professionals Group Access
in "Find a
Company
AquaPhoenix Acquires CHEMetrics
HANOVER, Pennsylvania – On October 25, 2022, AquaPhoenix Scientific, LLC announced that it has acquired CHEMetrics, Inc., which is based in Midland, Virginia.
CHEMetrics manufactures water analysis test kits and instrumentation that utilizes self-filling reagent ampoules for increased simplicity, speed and safety in water quality testing. The organization has served the industrial water, petroleum refining, chemical process, food and beverage, power generation, and other water treatment industries since 1969.
"We have been a distributor of the CHEMetrics line of test kits for nearly two decades,” said Frank Lecrone, III, CEO of AquaPhoenix. “Adding their team’s knowledge and industry-leading products to the AquaPhoenix family will give our customers even more options for effective water management.”
The acquisition of CHEMetrics is a part of the AquaPhoenix strategy of acquiring businesses that align with its core competencies. “We’re delighted to begin a new chapter in the 53-year history of our company,” says CHEMetrics’ president, Bruce Rampy.
Purolite Opens New Facility
KING OF PRUSSIA, Pennsylvania – On December 5, 2022, Purolite celebrated the opening of its new pharmaceutical manufacturing facility. The 74,000-squarefoot plant, which is expected to create 75 new jobs, will produce ion exchange resins for vital healthcare development and pharmaceutical APIs to meet the growing demand for existing and future applications and therapies.
Located just blocks from the Purolite global headquarters, the facility hosts two FDA and cGMP compliant clean rooms. These rooms are sterile, with smooth and impervious surfaces. They each have independent HVAC systems to control volume, pressure, supply and exhaust, temperature and humidity of airflow.
Purolite was acquired by Ecolab, a global leader in water, hygiene, and infection prevention solutions, in December of 2021.
59 the ANALYST Volume 30 Number 1
Industry Notes
Cortec Adds Boiler Dragon FO
ST. PAUL, Minnesota – On September 9, 2022, Cortec Corp. expanded its line of boiler layup “animals,” announcing the addition of their Boiler Dragon FO—a special version of Boiler Dragon designed specifically for dry layup of large high-pressure steam systems.
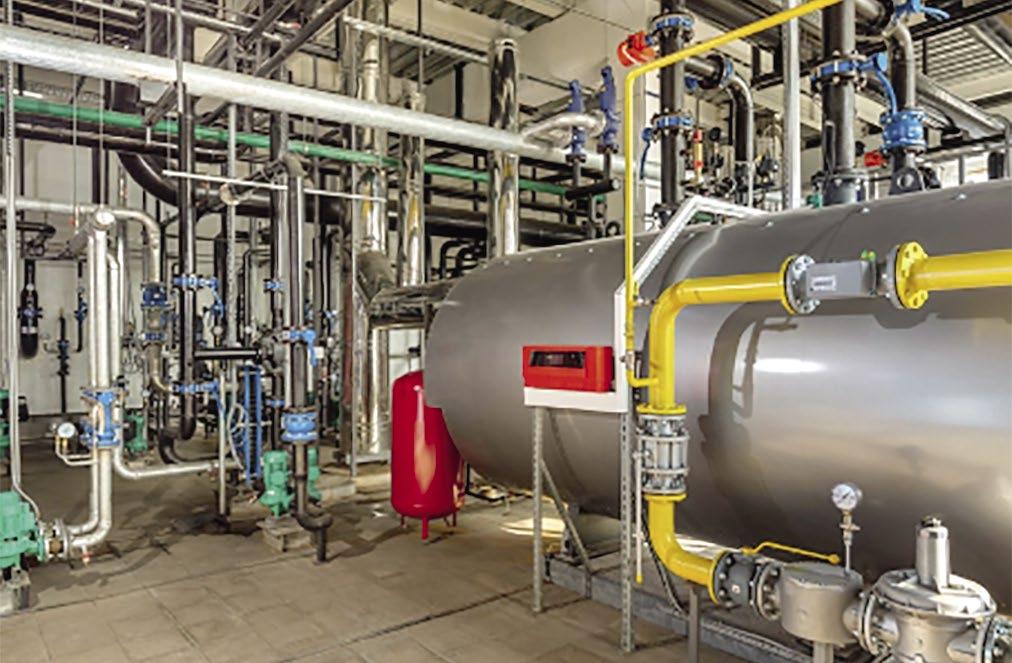
Boiler Dragon is a ready-to-use waterborne vapor phase corrosion inhibiting fogging fluid. The new Boiler Dragon™ FO (ferrous-only) caters directly to high purity requirements of high-pressure steam systems—like those common at power plants. Because high-pressure steam systems do not contain yellow metals, Boiler Dragon FO omits the yellow metal inhibitor, leaving one less chemical to interfere with steam purity or feedwater quality. As Scott Bryan, CWT, (Cortec Technical Sales and Product Manager – Water Treatment) explains, “[W]hen they bring [the boiler] into service, they don’t have to do any extra steps to remove the product or clean it, or do anything else to take that [Boiler Dragon FO] chemistry out of the boiler before bringing it back into service.”
Corrosion is one of the biggest enemies of achieving a full boiler service lifetime, and layup is often the period of greatest vulnerability. Whether the boiler system is laid up for maintenance reasons or seasonal shutdown, corrosion that occurs while the boiler is idle can cause problems at startup and ultimately reduce service life through the deterioration of critical components. Applying vapor phase corrosion inhibitors that protect the entire enclosure and do not need to be removed upon startup can have a huge ROI by reducing downtime in the short run and extending service life in the long run.
Pulsafeeder Expands Pulsatron MP Features
ROCHESTER, New York – Pulsafeeder, has built psig upon their Pulsatron MP Series. A true microprocessor-controlled instrument delivering precise and accurate metering control, the equipment now features an optional 4-20mA output signal that provides a remote indication of pump speed.
Users can now remotely confirm the pump’s speed is adjusting to process parameters and more accurately estimate chemical usage over time. The pump transmits a 4-20mA signal proportional to the actual speed of the unit and is factory calibrated for easy installation in the field.
Standard features include automatic control via 4-20mA or 20-4 mA inputs, an external pace function with a stop feature, and a graphical LCD display with support for English, French, German, and Spanish languages. With models capable of flows ranging between 3 gpd (0.5 lph) and 504 gpd (79.5 lph) and pressure ranges from 20 psig (1.3 bar) to 300 psig (21 bar), and a turndown ratio of 1000:1, this new feature provides more utility to users.
60 the ANALYST Volume 30 Number 1
Industry Notes continued
Discovering AWT
AquaPhoenix Scientific
860 Gitts Run Road
Hanover, PA 17331
866-632-12916
Website: www.aquaphoenixsci.com

Company History
AquaPhoenix was founded in 2003 by Frank Lecrone, III. The company got its start as a test kit and reagent manufacturer, exclusively supplying the industrial water treatment market. The true origin of AquaPhoenix can be traced back to Hawk Creek Laboratory, which was started by Frank’s father in 1980; prior to that, Frank’s father was president of Taylor Technologies Inc., creating a long history in the water treatment industry.
Current Business
AquaPhoenix is still focused on the industrial water treatment market and has continued to expand its manufacturing and distribution capabilities. Acquisitions of other companies—CHEMetrics, H2trOnics, General Treatment Products, Innovative Waters, and AMT Scientific—has allowed AquaPhoenix to diversify its product line beyond test kits and reagents to include chemical feed and control equipment and data management software for industrial water systems.
Key product categories include test kits, reagents, calibration solutions, water treatment control panels, pump skids, cellular modems, reporting software and more. The firm also distributes meters, test kits, lab supplies, pumps, controllers, sensors and accessories from many of the industry's leading suppliers. These include Hach, Myron L, Fisher Scientific, LaMotte, Oakton, Pyxis, 3M, Walchem, Prominent, Grundfos, Blue-White, and Pulsafeeder.
Business Location
AquaPhoenix is based out of Hanover, Pennsylvania, with nearly 300,000 square feet of warehouse and manufacturing space. Other locations across the United States include Midland, Virginia; Grand Prairie, Texas; and Brea, California. AquaPhoenix ships products worldwide for its customers.
Recognition and Involvement
AquaPhoenix has partnered with AWT and its members since 2004, and the association members remain its primary market. In 2010, AquaPhoenix was named the AWT Supplier of the Year. Frank Lecrone, III, and Tom Tinney serve as AWT technical trainers, and John Steel holds a CWT.
Top Executives
Frank Lecrone, III, CEO; Jeff Geiman, COO; John Olon, CFO; Brian Katarski, vice president of sales and marketing; and Matt Miller, vice president of industrial technology.
61 the ANALYST Volume 30 Number 1
AquaPhoenix’ warehouse in Hanover, Pennsylvania.
HC Info
113 Cherry St. #79999
Seattle, WA 98104-2205
206-494-0267
Website: www.hcinfo.com
Company History
Founded in 1995, HC Info spent its first 20 years providing consulting and training to prevent and solve Legionella problems; they also rendered expert opinions in litigation related to Legionnaire’s Disease. The company went on to develop a cloud-based application for water management plans and training. After the app was released in January 2016, the number of users grew so rapidly that the company phased out of consulting to focus strictly on supporting the software.
Current Business
HC Info provides a cloud-based, software-as-a-service application used for water management programs, building water quality analytics, and training. The software has more than 11,000 users.
Facility managers and infection control professionals use the software to manage the risk of Legionella , and other pathogens, to ensure the safety of people in their buildings while complying with standards and regulations. Water treatment companies, engineering firms, consultants, industrial hygiene firms, and other companies that are authorized and trained HC Info partners, use it to
set up water management plans and water quality data analytics for their facility customers. Health departments use it, too—primarily for training. Various professionals take online courses in the software to earn ASSE/ IAPMO/ANSI Standard 12080 Legionella certification.
Although all of HC Info’s revenue is from software subscription sales rather than services, the company has a team dedicated to providing support at no charge to its partners and end users.
Business Locations
HC Info is based in Seattle; however, all team members work remotely from various states.
Recognition and Involvement
HC Info has been an AWT member for more than 10 years. The company was named AWT’s Supplier of the Year (2019).
Top Executives
Matt Freije, founder and CEO; David Swiderski, senior technical strategist; Nate Thompson, senior software engineer.
62 the ANALYST Volume 30 Number 1 Discovering AWT continued
HC Info’s Matt Freije (right) receives the 2019 Supplier of the Year Award from AWT president David Wagenfuhr (left).
Houghton Chemical Corp.
52 Cambridge St.
Allston, MA 02134
617-254-1010
Website: www.houghton.com
Company History
Houghton Chemical is a third-generation, family-owned and run business, entering its' 95th year. The corporate headquarters is in Boston, and the company has been an integral part of the neighborhood fabric for 63 years. It is not only the owners that have made the company a family but all the loyal, caring, and hardworking people who have contributed to the longevity and success of the business.
Current Business
Houghton is in the business of formulating glycol-based heat transfer fluids, automotive antifreeze solutions, specialty packaging, blending and storage, and recycling and disposal of spent glycol. Water treatment companies regularly find their customers have heat transfer needs as an adjunct to their treatment business, like the geothermal heating for the buildings in Yosemite Park (California), the heating and air-conditioning at John Deere manufacturing in Illinois, the ice-skating rink at Rockefeller Center, a thermal storage plant in Arizona, the chillers at Boston Beer Company (brewers of Samuel Adams), or the heating and air conditioning of many large office and manufacturing plants.
Business Locations
Houghton owns and operates warehouses in Massachusetts, New Jersey, and Pennsylvania with contracted blending and storage in Pittsburg, Chicago, and Seattle. The company’s service area includes all of North America, Latin America, the Caribbean, Europe, and China.
Recognition and Involvement
Over the years, Houghton has received a number of different awards. On a national level, they have been named AWT’s Supplier of the Year (2002), and earned the National Association of Chemical Distributors’ Chemical Product Steward Award (1998) and ASTM Fellows Award (2002). Regional honors include the Massachusetts Manufacturing Award (2022), the Allston Civic Association Lifetime Community Service Award (2022), the Charles River Watershed Citizen Activist Award (2017), the VAC Distinguished Citizen Award for Employment Opportunities for Individuals with Disabilities (2003), and the Small Business of the Year in Boston (2001).
Top Executives
Bruce E Houghton, president; Sol Sandperl, vice president of sales; and Nadya Avanesova, vice president of operations.
63 the ANALYST Volume 30 Number 1 Discovering AWT continued
Storage tanks at Houghton Chemical's Boston-area facility.
Making a Splash
Christopher Fox
Watertech of America Inc. Greenfield, WI

What can you tell us about yourself?
I am a Christian husband and father of five. Our two oldest are already grown and married. My wife, Cathy, and I live in the Milwaukee area with our three remaining kids. We enjoy watching them play sports, taking walks with our lab Luna, and caring for our eight Cinnamon Queens (chickens). I have been a Watertech of America employee and team member for the past seven years. My passion for solving water treatment challenges by collaborating with customers, using our creativity, and knowledge of biology/chemistry and equipment keeps me busy.
What prompted you to start volunteering with AWT?
Our director of sales, Jeff Freitag, thought I would be an asset to AWT as an instructor. Jeff contacted Bruce Ketrick, who subsequently called my friend and colleague Kevin Cope—also an AWT instructor, who then called me and gregariously asked if I would be interested in becoming a member of the team. As they say, the rest is history!
What has been the most rewarding thing about volunteering?
In my case, instructing younger AWT members has allowed me to share the more than 30 years of experience I have accumulated. It’s seeing the student’s interest, enthusiasm, and knowledge of wastewater treatment build over the course. I always ask them, “Are you okay?” Realizing there is so much to learn and comprehend in a few short days.
How has volunteering improved your professional career?
When you can tell an audience you are a wastewater treatment instructor on a national level for the AWT they tend to look at you with a whole NEW level of trust and confidence.
Why would you encourage others to become a volunteer?
The water treatment industry has been good to me and my family. It’s important to share your knowledge and experience with others, and give back to our industry and community.
Tell us about a current project you or your committee is working on?
The Wastewater Treatment Sub Committee is gearing up for training sessions in Pittsburg this year. We have been focusing our time preparing for this highly anticipated event.
What is a past project that your committee produced that you feel has had the greatest impact on AWT and why?
I would say the “hands on” jar testing section we do as part of the wastewater training has the greatest impact on students. They have so much fun competing with one another while learning. The energy and enthusiasm generated on this day is contagious. I think all the instructors would agree this is our favorite training experience.
How have you been able to utilize the expanded business connections you’ve made while volunteering?
I have been able to make new friends and renew old friendships. It’s always nice to have fellow instructors to reach out to for technical advice if a need should arise.
64 the
30 Number 1
ANALYST Volume
Matt Oberholfer

Summit Laboratories Inc. Denver, CO
What prompted you to obtain your CWT and when did you begin the process by taking the exam?
I wanted to obtain my CWT to validate the training and experience I have in the water treatment industry. I took the CWT exam in August of 2022.
What advice would you give those thinking about taking the exam?
My advice for those thinking about taking the exam would be to sign up through the CWT website and get it scheduled. Once you have a set date to take it, I think the studying and preparation becomes easier, and you will be pushed more by the deadline.
What was the most difficult aspect of the exam?
The most difficult aspect of the exam is probably that there will be questions you don’t know the answers to and not allowing that to rattle you during the exam. For the tough questions, it’s best to skip them and come back at the end.
How did you prepare for the exam?
I prepared for the exam by taking the online quizzes that are available for members on the AWT website. I also went through the training material received at AWT classes and the AWT Technical Reference and Training Manual. Finally, the practice exam is very useful for preparation.
Why do you feel this credential was important to have?
The CWT credential is important to have for two reasons: First, it increases your credibility with customers and will speed up the process of developing trust with the customer. Second, on a professional development level, it confirms the knowledge base and skills you have developed in your career.
What are the advantages of having the CWT designation?

The advantage of having the CWT designation is that it validates your knowledge and experience with customers. It can also be a conversation starter about the resources of the AWT organization and how membership is an advantage for your company as well.
How has your CWT improved your professional career?
I’ve only had my CWT for a few months, so I can’t really say in the short term there has been a huge change. I definitely have more confidence to pursue larger customers and do more at my current employer by helping out with product development and trialing.
What has been your greatest professional accomplishment?
I’m not sure about one specific accomplishment. I would say helping customers is the most fulfilling part of this career, especially going into places without proper water treatment that have spent a lot of money on unnecessary maintenance. Working with them to implement a proper treatment program, and fixing the problems they were having, is the best part of this career to me.
What do you think are the most prominent issues facing the water industry today?
I would say customer knowledge about water treatment, and about their own systems, is an issue. It’s important as a water treater to educate the customer on the purpose of the water treatment programs we run and to get their buy-in for on-site testing etc.

65 the ANALYST Volume 30 Number 1 CWT Spotlight
How MF Became a Practical Replacement for a Pretreatment Clarifier
 Brad Buecker, Buecker & Associates
During my time as the chemistry supervisor at a coalfired power plant, the lab staff and I faced an interesting problem. The makeup pretreatment equipment, and particularly the raw water clarifier, for an 800-megawatt (MW) supercritical unit was failing. During our efforts to replace the clarifier, we learned more than one lesson, which I will highlight in this article.
The Original Pretreatment System
The clarifier, whose primary function was particulate removal from a lake water supply, had for years protected the original ion exchange demineralizers for steam generator high-purity makeup water. Approximately a decade before I became plant chemist, the makeup system had been retrofitted with a reverse osmosis (RO) unit. The system had the following basic configuration (Figure 1).
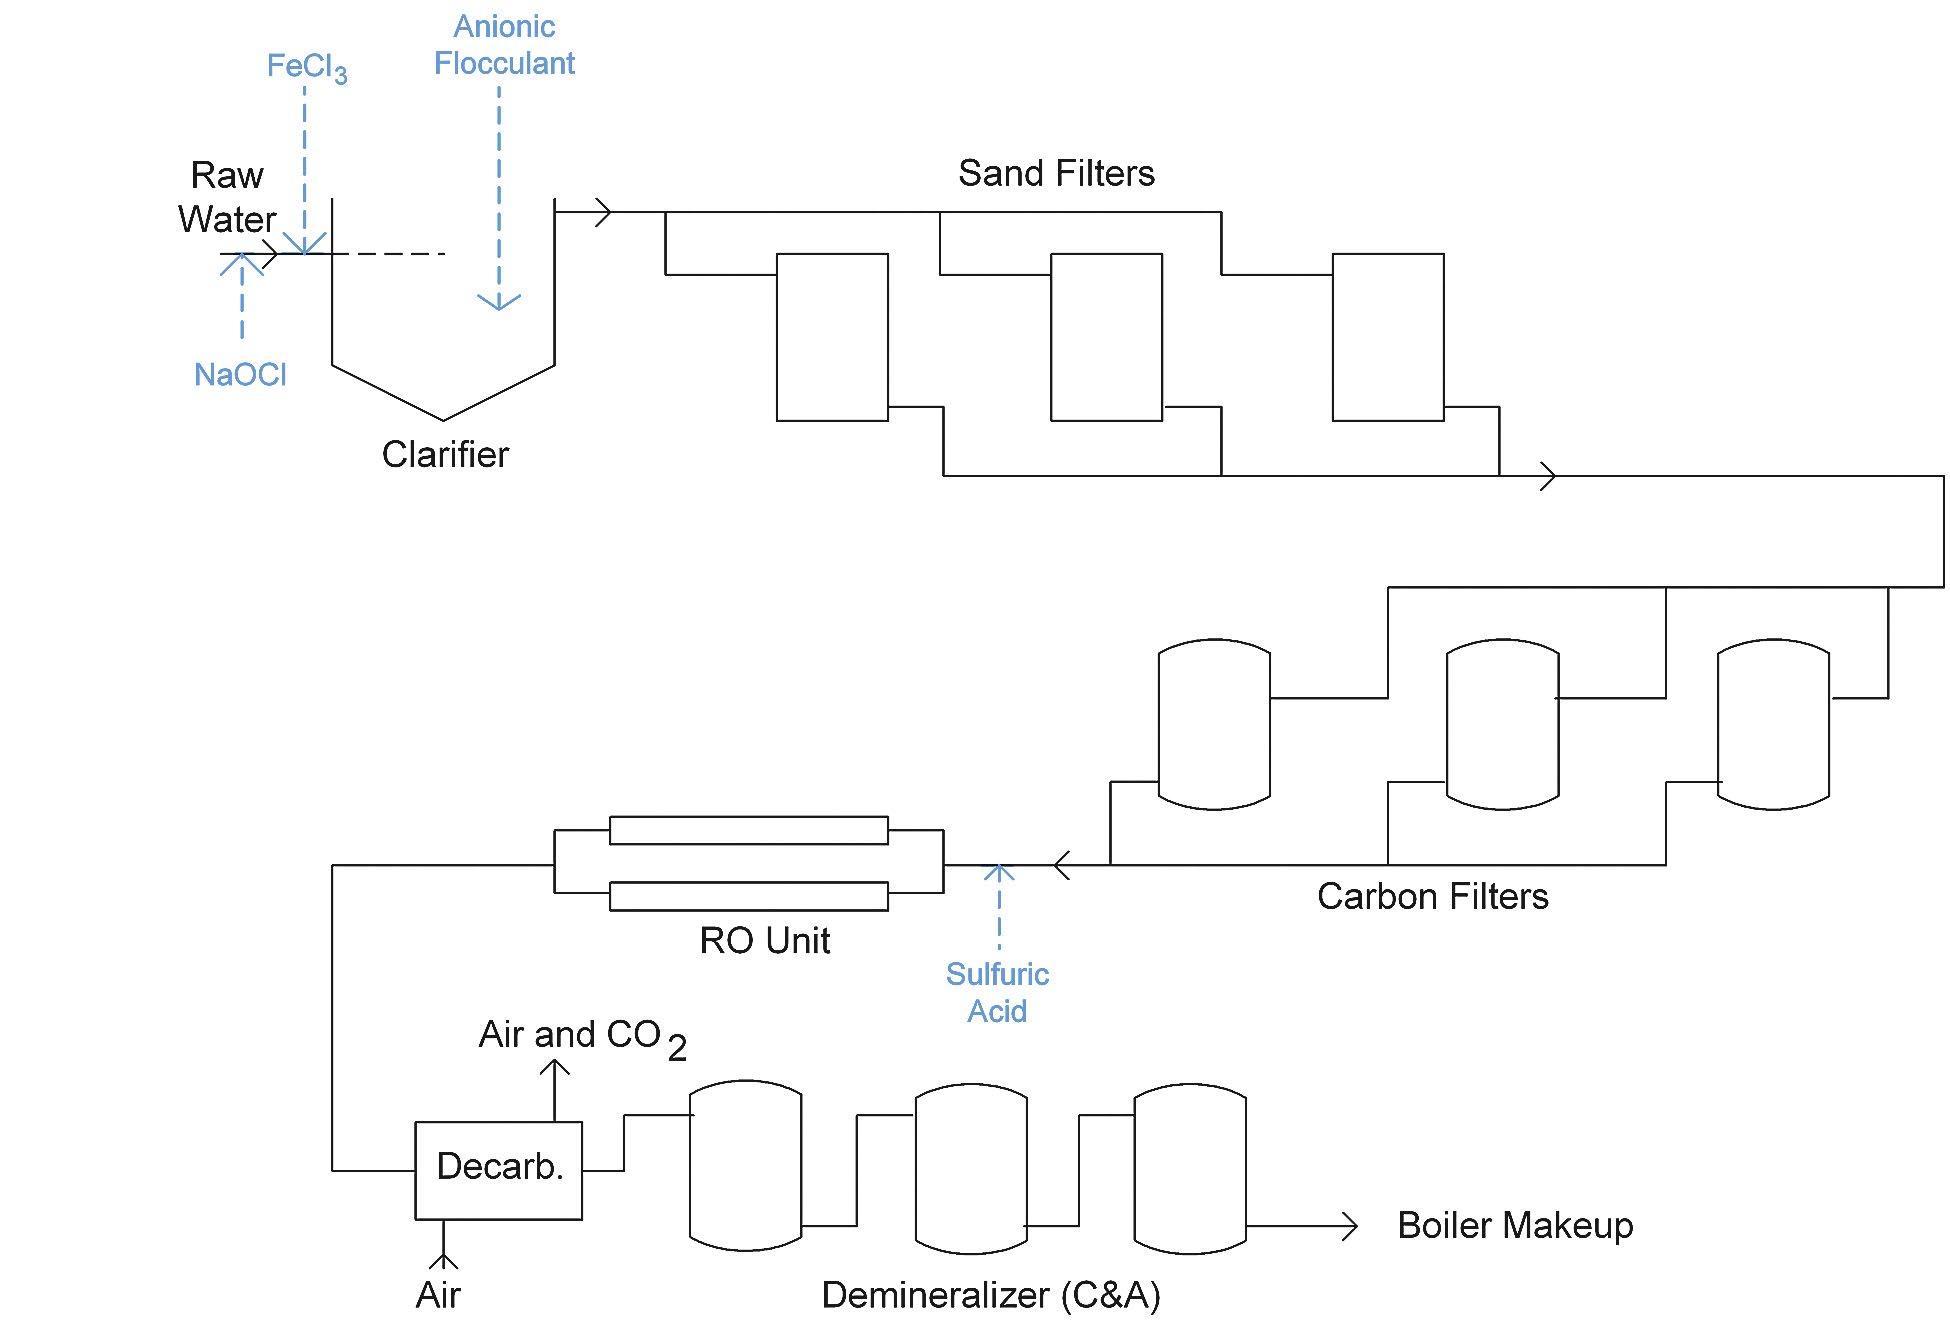
66 the ANALYST Volume 30 Number 1
Tales From the Waterside
Figure 1: Unit 1 makeup system process flow diagram (PFD) prior to autumn 2004.
The RO (along with a later-retrofitted forced-draft decarbonator) proved excellent in reducing load and extending run lengths on the demineralizer. However, before addressing the clarifier replacement with a microfilter, it is worth noting the changes we made to alleviate another problem.
The RO had originally been designed with cellulose acetate (CA) membranes, and this material was still the choice when I arrived. Unlike thin-film composite (TFC) membranes (which have now become the standard), CA membranes benefit from a small chlorine concentration to control microbiological fouling, as microbes will attack and degrade CA membranes. (Microbes will foul membranes regardless of type.) Unfortunately, the previous lab management did not understand this issue, and had not bypassed the carbon filters. Activated carbon filters remove chlorine within the top few inches of the bed, and so the remainder of the bed serves as an excellent incubator for those microbes that survive the biocide. The lab staff told me that they had been replacing membranes every 1.5 to 2 years due to microbiological fouling (confirmed by membrane autopsies), and sure enough, some recently removed membranes provided direct visual evidence (Figure 2).
The near-term answer was to bypass the carbon filters so that the CA membranes would start seeing the small concentration of chlorine coming from the clarifier and sand filters. Bypassing the carbon beds stopped the flow of microbes from that source.
Although carbon filter bypass eliminated the membrane microbiological fouling issues, it did so at the cost of some particulate filtration. Daily analyses of the clarifier/multi-media filter effluent indicated a minimum turbidity of 0.3 nephelometric turbidity units (NTU), which sometimes would rise to 1 NTU during upset conditions. Typically, the lab staff had to replace the RO cartridge filters every two to three weeks due to particulate accumulation from the feed. Unfortunately, I did not perform any silt density index (SDI) tests on the clarifier effluent to ascertain what would have been valuable information correlating the turbidity to the SDI.
As we began to investigate potential clarifier replacements, serendipity arrived. A major microfilter (MF) manufacturer approached us with an offer for a threemonth, full-scale test of a 300-gallon per minute (gpm) unit, with the only cost being shipping charges. The MF would provide enough production to meet the steam generator makeup needs. The only stipulation was that if we decided not to keep the MF after the trial, we would pay to have it shipped back. Technical information and charts such as that in Figure 3 already told us that MF would remove most particulates from a water stream.
Naturally, a major question was, “How difficult will it be to set up the equipment, even on a temporary basis?” Per discussions with the manufacturer and review of the installation and operation procedures, it appeared that installation would be straightforward, so we said, “Let’s go for it!” And indeed, the plant mechanical and electrical groups had the MF set up and ready to go within two days.
MF Test Period
The manufacturer stated that the microfilter would remove particles down to 0.1 micrometer in size and produce an effluent turbidity of less than 0.1 NTU. Within an hour after system start-up, effluent turbidity levels had dropped to a range of 0.027 to 0.036 NTU,
67 the ANALYST Volume 30 Number 1
Figure 2: Microbiological fouling in the membranes.
Photo by Brad Buecker.
Tales From the Waterside continued
Within an hour after system start-up, effluent turbidity levels had dropped to a range of 0.027 to 0.036 NTU, where they consistently remained for years.
where they consistently remained for years. (Hint: We decided to keep the MF.) We found that the cartridge pre-filters ahead of the RO, which normally had to be replaced every two to three weeks, now lasted for months. I do not recall the exact impact the improved RO feed made regarding RO cleaning frequency, but I do know that the interval between cleanings was several months. The MF performance was so good and the unit so reliable that we purchased it, installed it in a permanent location, and retired the clarifier/sand filters. Figure 4 shows the complete unit.
Figure 5 shows an example of a pressurized design, where each module contains thousands of spaghetti-like, hollow-fiber membranes.
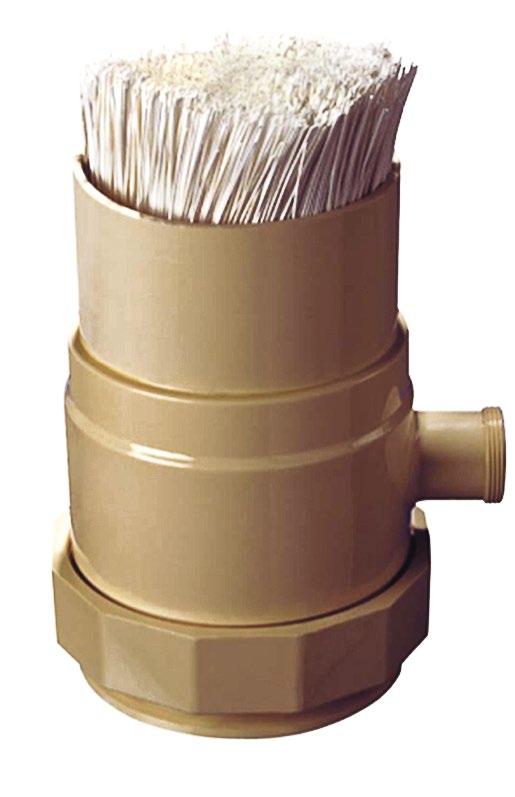
This MF process operates via a combination of crossflow and dead-end filtration, in which the raw water flows parallel to the membrane surface, but the collected particulates must be periodically removed via an air enhanced backwash process. Water that passes through the membranes and is purified is known as permeate. Not all water moves through the membranes, as a small portion must flow along the surface to carry away suspended solids. This stream is known as the reject. The membranes in this design are configured such that the raw water flows from outsideto-in, with the reject passing along the outside surface of the fibers.
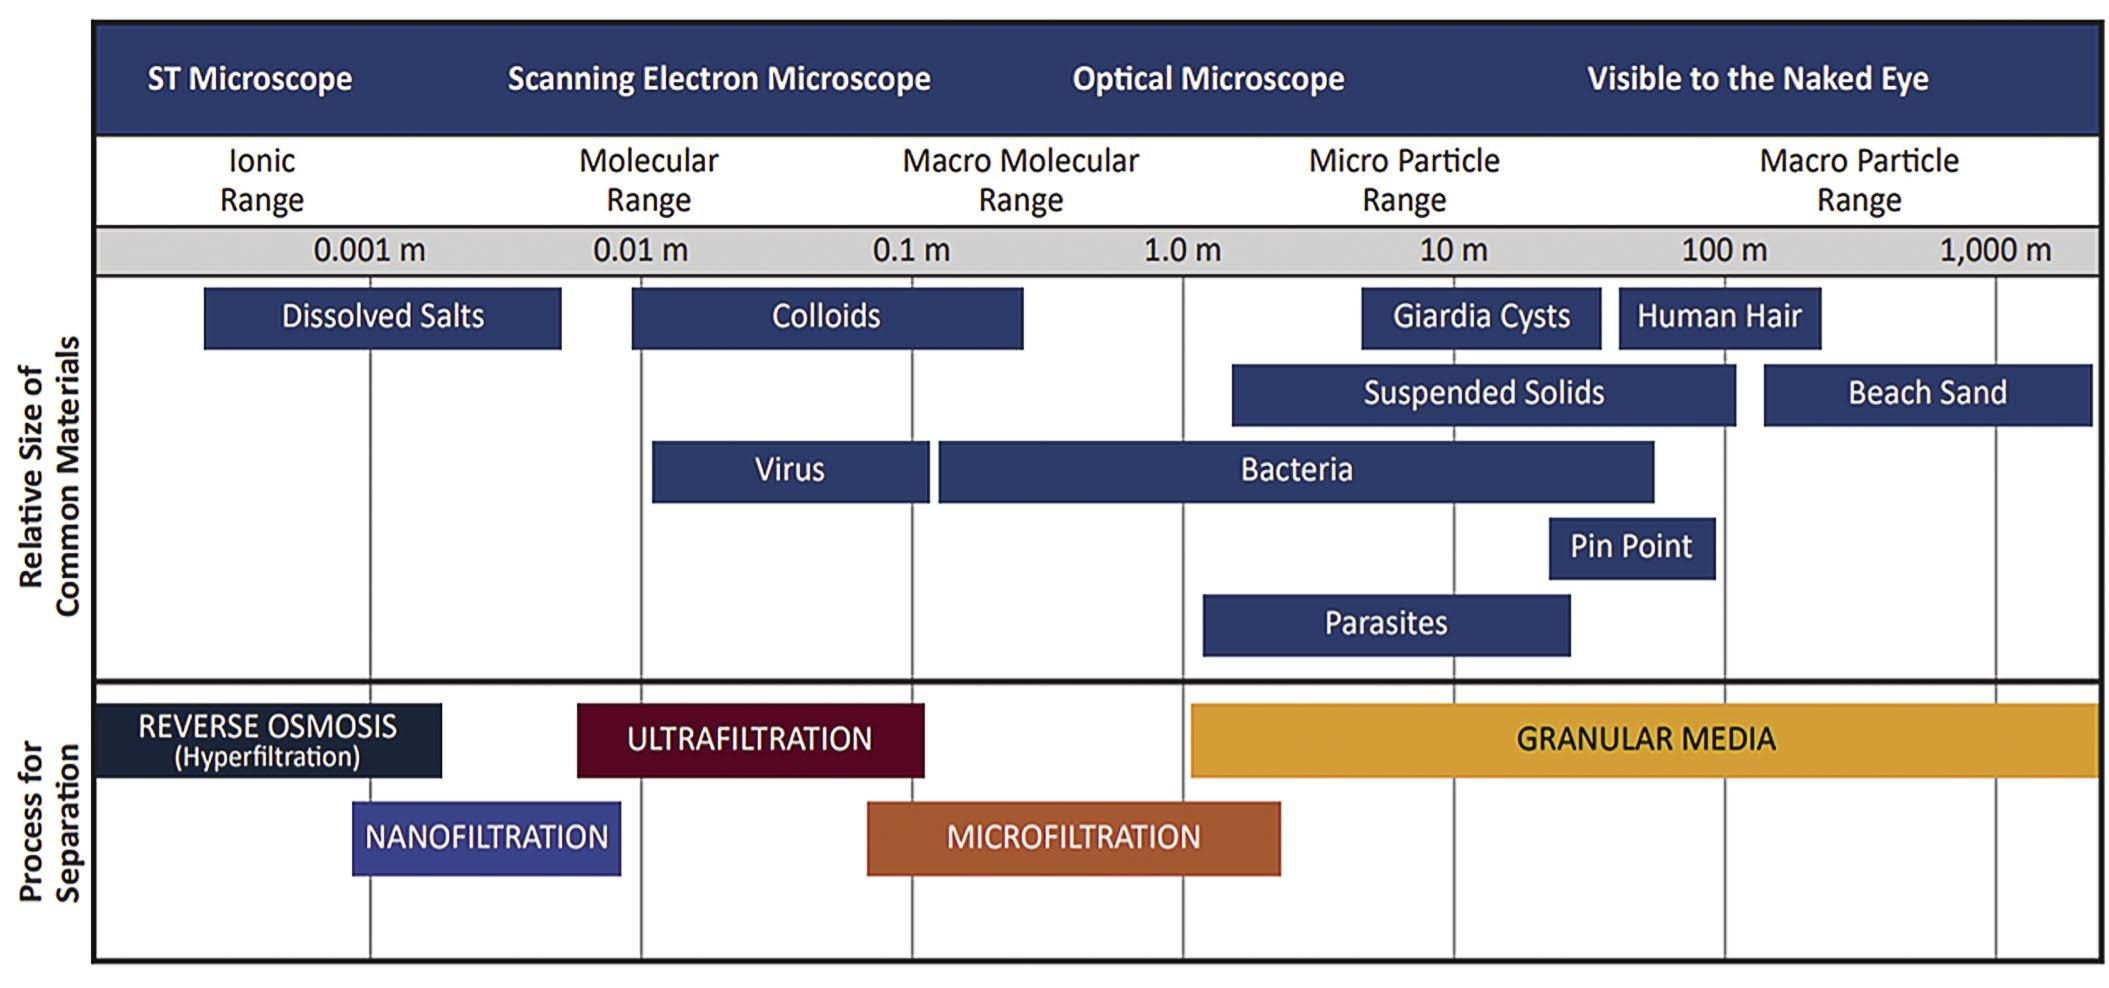
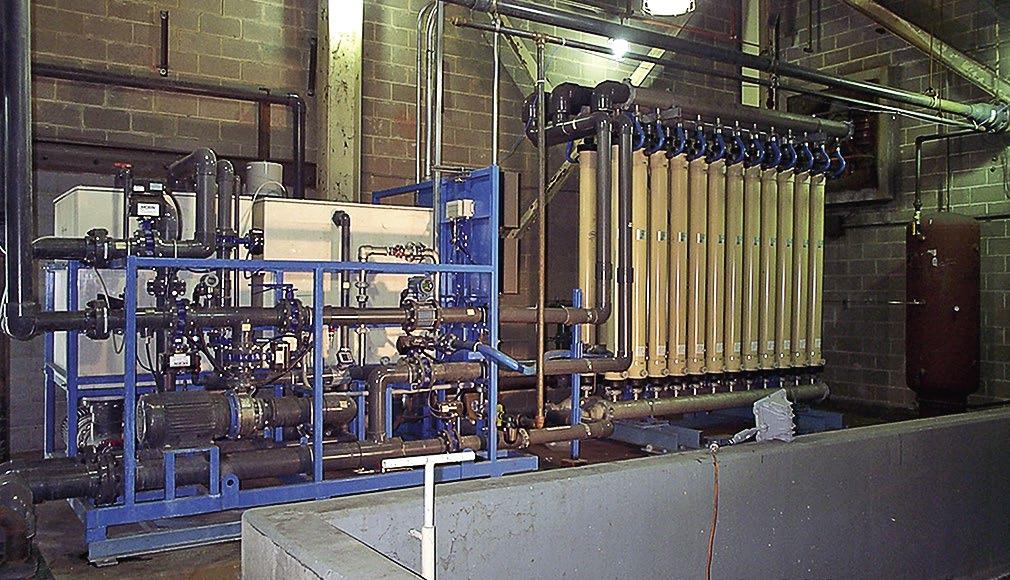
68 the ANALYST Volume 30 Number 1 Tales From the Waterside continued
Figure 4. Microfilter skid, including the 24 modules required to produce 300 gpm of filtered RO feed water. The inlet feed water holding tank, with forwarding and backwash pumps, is on the left.
Photo by Brad Buecker.
Figure 3: The capabilities of the standard filtration technologies. Ultrafiltration (UF) systems are now commonly specified as part of the makeup system for steam generating units, but in the author’s opinion, UF may be a bit of overkill for some applications.
Illustration courtesy of ChemTreat, Inc.
Figure 5. Cutaway view of a pressure vessel showing the hollow-fiber membranes.
Illustration courtesy of the Pall Corp.
Results and Lessons Learned
We encountered one problem during initial testing. On several occasions, the microfilter inlet strainer plugged with rust particles that broke loose from the very old makeup water supply line. To solve this problem, we installed a dual-compartment basket strainer ahead of the unit to minimize plugging issues (Figure 6).
With a simple 90° rotation of the valve handle, flow can be switched to either side of the filter. It is then easy to remove the fouled basket for cleaning.
Care must be taken with these systems, however, as a massive influx of debris can cause a large increase in differential pressure that causes failure of the strainer baskets.

Reimagining the chemistry of water treatment.
Solugen’s AcquaCore™ bio-based additives give formulators latitude to use fewer phosphonates, phosphates, and azoles without sacrificing performance of water treatment chemistry. Formulations using AcquaCore™ can reduce calcium phosphate scaling and improve corrosion inhibition in both commercial and industrial cooling tower applications. It’s chemistry that improves your environmental profile with locally supplied, cost-effective, bio-based ingredients.
To learn more, visit us at solugen.com/water or contact us at waterexpert@solugen.com

69 the ANALYST Volume 30 Number 1
Figure 6. Dual-compartment strainer ahead of the microfilter. Note the pressure gauges on the strainer inlet and outlet to monitor differential pressure.
Photo by Brad Buecker.
Figure 7. Strainer basket failure due to a sudden incursion of debris.
Tales From the Waterside continued
Photo by Brad Buecker.
Basket failure occurred on two occasions when the inlet water feed was switched to a pump that had no rough screen ahead of the suction. The debris that entered the strainer included dead fish, vegetation, and even discarded plastic wrappers. After plant maintenance personnel installed a screen on the raw water makeup influent line, the basket failures ceased.
Don’t Forget to Regularly-Schedule Off-Line Cleanings
MF membrane pore sizes are larger than those of RO membranes, and corresponding inlet pressures are much lower than in RO units. Typical membrane inlet pressures on this system ranged from 10 to 20 pounds per square inch gauge (psig). The minimal pressure requirement allows membrane construction of durable materials, in this case polyvinylidene fluoride (PVDF).
When warm weather began to arrive during the first year of operation, we found that even with regular air scrub/reverse flushes, membrane differential pressures (in manufacturer’s language, the trans-membrane pressure [TMP]), began to gradually increase. So, we started treating the raw water feed with a small but continuous dosage of sodium hypochlorite to maintain a 0.2 to 0.5 parts per million (ppm) chlorine residual in the membrane permeate. This worked well for the membrane cleanliness, and the gradual TMP rise ceased for several months. The unit operated so well that we essentially did not have to touch it for long periods. In fact, when some visitors from another power plant asked to view the unit, I had to sweep away many cobwebs because we had had no need to physically tinker with the unit for months.
However, we learned that without regular offline cleanings every two to three months, the membranes would become clogged, which then required considerable effort to restore performance. The cleaning process we first utilized involved a stepwise procedure of treatment with a warm (100o F), dilute sodium hydroxide (1%) and sodium hypochlorite (500 ppm) solution, a rinse with filtered water, cleaning with a warm citric acid solution (0.5%), and then another rinse. Cleaning takes approximately eight hours. As I recall, we increased the chemical concentrations by perhaps double for subsequent cleanings.
Later models of these units were equipped with chemically enhanced backwash (CEB) systems that automatically inject cleaning chemicals into the backwash water, perhaps every eight or ten cycles. Regardless, periodic offline cleanings are still important.
Conclusion
The microfilter proved to be an extremely reliable machine for producing low turbidity makeup water in the described application. Even if the clarifier had not needed replacement, we calculated a three to four-year return on investment (ROI) due to chemical and maintenance cost savings. The ROI essentially dropped to near zero from the fact that the MF turned out to be a drop-in solution to replace the old clarifier.
Brad Buecker is president of Buecker & Associates, LLC, consulting and technical writing/marketing. Most recently he served as senior technical publicist with ChemTreat, Inc. He has more than four decades of experience in or supporting the power industry, much of it in steam generation chemistry, water treatment, air quality control, and results engineering positions at two coal-fired power plants. His work also included 11 years with two engineering firms, Burns & McDonnell and Kiewit, and he also spent two years as acting water/wastewater supervisor at a chemical plant. Mr. Buecker has a B.S. in chemistry from Iowa State University with additional course work in fluid mechanics, energy and materials balances, and advanced inorganic chemistry. He has authored or co-authored more than 250 articles for various technical trade magazines, including the ANALYST, Industrial Water Treatment, and Ultrapure Water Journal. Mr. Buecker has also written three books on power plant chemistry and air pollution control. He is a member of the ACS, AIChE, AIST, ASME, NACE (now AMPP), and the Electric Utility Chemistry Workshop planning committee. He may be reached at beakertoo@aol.com .

Keywords
MICROFILTRATION, POWER GENERATION, PRETREATMENT, REVERSE OSMOSIS
70 the ANALYST Volume 30 Number 1
This column is based in part on a presentation given by the author at the 26th Annual Electric Utility Chemistry Workshop, which was conducted May 9-11, 2006, in Champaign, Illinois.
Tales From the Waterside continued
WEST February 21–24, 2023 Doubletree Mission Valley San Diego, CA EAST March 29–April 1, 2023 Omni William Penn Pittsburgh, PA and Applications ASSE/lAPMO/ANSI10290 T r ia ingn RO/Ultrafiltra t i o n aSel s Water T r emtae ewater Treatme R A F Wt S A F R ASSE/lAPMO/ANSI 10280 Training Fundamentals and Applications RO/Ultrafiltration S W Wt Sales Water Treatment Wastewater Treatment CATEGORIES Perform at a higher level in your water treatment career. Visit www.awt.org/technical-training-2023 to reserve your spot today. REGISTRATION IS NOW OPEN !
What Are Important Principles and Applications of Ion Exchange Resins?
Zhendong Liu, Ph.D., and Firuza Mir, Lanxess Corp.
Introduction
The discovery of zeolite in soil as a natural ion exchange material can be dated back to the 1800s. The first synthetic aluminosilicate zeolite was invented by Robert Gans in 1905 for water softening applications. Since then, sulfonated coal and phenol formaldehyde-based resins have been developed for water demineralization, but their performance was not reliable. It was not until 1940, when the first styrene/divinylbenzene (DVB) based resin was invented by Gaetano Frank D’Alelio, that ion exchange resin (IX) found its way to widespread applications, such as food, catalysis, mining, chlor-alkali, drinking water, power, semiconductor, pharmaceutical and emerging contaminants removal.
In the original development of IX resins, three companies made great contributions by pioneering new manufacturing processes, novel functionalities/structure/ morphology, and efficient operational vessel design. For instance, Rohm and Haas Co.A introduced the first weakly acidic cation (WAC) resin in 1948. Bayer A.G.B and Rohm and Haas invented the phase extension polymerization technique for making macro porous resins. Bayer also designed the first packed bed (WS) for counter current IX operation in 1963. Dow Chemical Inc.C introduced the uniformly distributed resin beads in 1988. The registered trade names of these pioneering companies—Lewatit (Lanxess), and Amberlite™ and Dowex (DuPont), are well known in the IX industry.
IX Manufacturing Process
Approximately 95% of the commercial IX resins are based on polystyrene co-polymer crosslinked with divinylbenzene. The crosslinker is necessary because otherwise the polymer beads would be very fragile. Sometimes a porogen (a temporary organic solvent used to help create pores) was added to generate large pores in the resin bead to enhance IX kinetics and reduce organic fouling. Functional groups are then attached to the
polymer backbone to make the resin either cationic or anionic. Finally, resin beads are conditioned/converted to various ion forms. At the molecular level, Figure 1 shows a typical manufacturing process for producing a strongly basic anion resin.
There are two major IX manufacturing processes based on the desired product particle size distribution (PSD):
Hetero-disperse (HD) IX beads. As its name indicates, HD beads have a broader PSD. The manufacturing process of HD resins is based on suspension polymerization in a stirred batch tank where the water, monomer, crosslinker, initiator, porogen and other additives are mixed together at certain temperature and stirring speed. After the reaction is complete, the beads are filtered out, then a functional group is attached ,and the resin is finally rinsed and packaged. A typical manufacturing process diagram is shown in Figure 2:
72 the ANALYST Volume 30 Number 1 Technical Updates, Tips, or Reviews T.U.T.O.R.
Figure 1: Synthesis of a typical strongly basic anionic resin.
Mono-disperse (MD) IX beads. The reactant mixture passes through many uniform holes on a vibrating nozzle plate, forming emulsion droplets with almost identical sizes, which then further polymerize into solid beads. After filtration and functionalization, the beads are rinsed and conditioned, and finally packaged. These resin beads have uniform PSD, which has significant performance advantages over the HD resins. This process is illustrated in Figure 3.
Weak acid cation (WAC): WAC resin has a weak acid functional group (e.g., carboxylic acid), which is more difficult to deprotonate (with a lower or higher pKa value). As SAC, it can be in either H or Na form. The H form WAC is normally used for dealkalinization, while the Na form is mainly used for removing hardness ions or heavy metals to significantly low levels. WAC resins have much higher total capacity than SAC resins.
Strong base anion (SBA): SBA resin has a quaternary ammonium functional group. Its hydroxide (OH) form is a strong base. The ammonium group on the resin backbone typically is trimethylamine (Type 1 SBA), or in some cases dimethylethanolammonium (Type 2 SBA). Type 1 SBA has relatively higher basicity than the Type 2 SBA resin, and is more stable at higher temperature, while Type 2 SBA is easier to regenerate and often has higher operating capacity.
Weak base anion (WBA): WBA resin has a tertiary amine functional group, which acts as a weak base. It is normally available in free-base form, or a combination of free base and a smaller portion of strong-base (quarternary amine) group. The free-base sites on WBA can only remove strong acids but are not capable of removing anions of the corresponding weak acids, such as carbonate, bicarbonate, silicates, or borates.
Chelating resin:

IX Resin Types
Based on their functional groups and charges, IX resin can be grouped into the following categories:
Strong acid cation (SAC): SAC resin has a strong acid functional group (e.g., sulfonic acid), which can deprotonate very easily (with a higher acid dissociation constant, or lower pKa [acid dissociation constant] value). It is often in either the hydrogen (H) or sodium (Na) form. SAC in H form is normally used for deionization, while that in Na form is mainly used for softening.
Chelating resin has chelating function groups, such as iminodiacetic acid (IDA), amino methyl phosphonic acid (AMPA), thiourea and bis-picolylamine. These chelating groups have strong affinity to certain metal ions (e.g., copper, nickel, mercury, lead, and cobalt). For instance, IDA resins have much higher selectivity on divalent alkaline earth ions (calcium and magnesium) than monovalent alkali sodium or lithium ions, which makes this type of resin very useful in removing trace amounts of hardness from highly concentrated brines.
Approximately 95% of the commercial IX resins are based on polystyrene copolymer crosslinked with divinylbenzene.
Representative functional groups of the above mentioned major IX are shown in Figure 4.
73 the ANALYST Volume 30 Number 1 T.U.T.O.R. continued
Figure 2: Hetero-disperse IX resin manufacturing process.
Figure 3: Monodisperse IX resin manufacturing process.
IX Operation
IX system operation is quite straightforward. IX resin is installed in a vessel (also called a column) equipped with an inlet flow distributor and an outlet collector or drain support. Feed water is fed from the inlet through the resin bed, then exits from the outlet as purified water after the resin captures the target species. As operation continues, resin becomes increasingly loaded with ionic contaminants until “breakthrough” when the target species start to “leak” above a pre-set concentration level (a.k.a. end point).
Finally, the resin is “exhausted,” and the concentrations of the inlet/outlet target species are essentially the same. At the end point, the vessel needs to be taken out of commission for backwash and regeneration of IX resin. The backwash helps to remove the fine particles/broken IX beads and prevent the resin bed from channeling or building up high-pressure drop. The purpose of the regeneration is to restore the resin’s loading capacity, and the chemicals used during the process are called regenerants. Depending on various applications, the regenerants could be acids (e.g., hydrochloric acid or sulfuric acid), bases (e.g., sodium hydroxide), or salts (e.g., sodium chloride brine).
Based on the flow directions of feed water and regenerants, IX can be operated as either co-current or countercurrent. Co-current means the same flow directions between the feed water and regenerant, while counter-current refers to opposite flow directions between these two. The counter-current operation can be further divided into a conventional counter-current with block flow, and an improved design of counter-current with a packed bed.
Co-current operation. Figure 5a (far left image) illustrates how this type of operation works. Feed water comes from the top and purified water exits from the bottom of vessel. After resin reaches the end point, regeneration starts with regenerants introduced from the same port on the top and the waste is collected at the bottom. There is about 80-100% space above the resin bed (called free board) for backwash. This configuration is simple with lower initial capital investment and backwash capability. It is best suited for feed streams with high total suspended solids (TSS) or high potential of accumulating biomass, broken IX beads and precipitated materials. However, the leakage of the target species is high due to insufficient regeneration of the resins near the effluent port. Its chemical consumption for regeneration is also much higher.
74 the ANALYST Volume 30 Number 1 T.U.T.O.R. continued
��������& �������� ��������$ (���������������� ) ↔ �������� # (���������������� ) + ���������������� ��������$ (���������������� ) ����������������$ [�������� # , ����������������# ] �������� ��������& [�������� # , ����������������# ] �������� ��������& ��������(����������������$ )&
Figure 4: Representative functional groups of major IX types.
a. SAC (Strong Acid Cation)
b. WAC (Weak Acid Cation)
c. WBA (Weak Basic Anion)
CH2-N-(CH3 )3+[OH-, Cl-]
CH2–N– CH2 – CH3OH CH3 CH3
––
d. SBA (Strong Basic Anion)
H2 C H2 C H2 C H2 C N H2 C H2 C H2 C N H2 C H2 C NH N H N H C COO H2SO4 COO P O O O Type 1 Type 2 N N Na + Na + Na + Na + ––––SH
e. Chelating resins
Counter-current with block flow. As shown in Figure 5b (center), feed water flows from top down, while the regenerant chemical flows bottom up and exits from a collector port located approximately in the middle of the vessel. There is a block flow (either by water or air) from the top to hold the bed in place to avoid disturbing the polishing zone. Similar to the co-current operation, there is an 80-100% free board on top of the resin bed for block water and periodic backwash. This design results in much lower leakage of the target species due to the well-regenerated polishing zone, and the regenerant chemical consumption is significantly reduced. However, the needs for block flow and a regenerant collector port require more hardware and piping, which brings more complexity to the system. In addition, the water consumption and wastewater volume are both high.
Counter-current with packed bed. Counter-current packed bed technology was first developed by Bayer A.G. during the 1960-70s. Figure 5c (right side) illustrates a typical packed bed design which uses an upward service flow and a downward regeneration. The vessel is fully packed with resins except 5-10% freeboard plus resin swelling. The packed bed design allows full utilization of vessel space, smaller footprint, low ion leakage, low water and regenerant chemical consumption, lower pressure drop, higher service flow velocity, outstanding and consistent water quality. The
packed bed does need an external tank for periodic backwashing, but the investment is well spent considering the excellent backwashing quality of an external tank, and its additional uses for transferring/installing/ storing resins. There is also a variant packed bed design called “UPflow COunter-current Regeneration (UPCORE),” which uses a downward service flow and upward regeneration. This process was developed by Dow Chemical.
75 the ANALYST Volume 30 Number 1 T.U.T.O.R. continued
Figure 5: Operation of IX vessels.
a. Standard co-current
b. Counter-current, block flow
c. Counter-current, packed bed
Figure 6: Difference in PSD between HD and MD resins (optical images).
IX Resin Key Parameters
PSD and uniformity coefficient (UC). As mentioned previously, IX can be made either HD with a wide PSD or MD with a nearly uniform PSD. UC is defined as d60/d10, where D60 is the screen size at which 60% of the volume of resin passes through, and D10 refers to the screen size at which 10% of the volume passes through. The smaller the UC, the narrower the PSD. Typically, a mono-dispersed resin bead has a UC ≤ 1.2. Figures 6 and 7 show the comparison in PSD between HD and MD resins.
Matrix and structure. Commercial IX resins for water purification are based on either styrene/DVB (majority) or acrylics as the matrix. In the previous parts of the article, the manufacturing process of the styrene-based resin has been discussed in great details. The acrylic-type resins are often manufactured from acrylonitrile, methyl acrylate, methyl methacrylate or acrylic acid monomers. Acrylic resins play a vital role in many applications. SBA, WBA and WAC resin types can all be made by acrylics. Compared to Styrene/DVB IX, acrylic resins are generally more hydrophilic, easier to clean or regenerate, and more resistant to organic fouling, but they are less stable at higher temperatures.
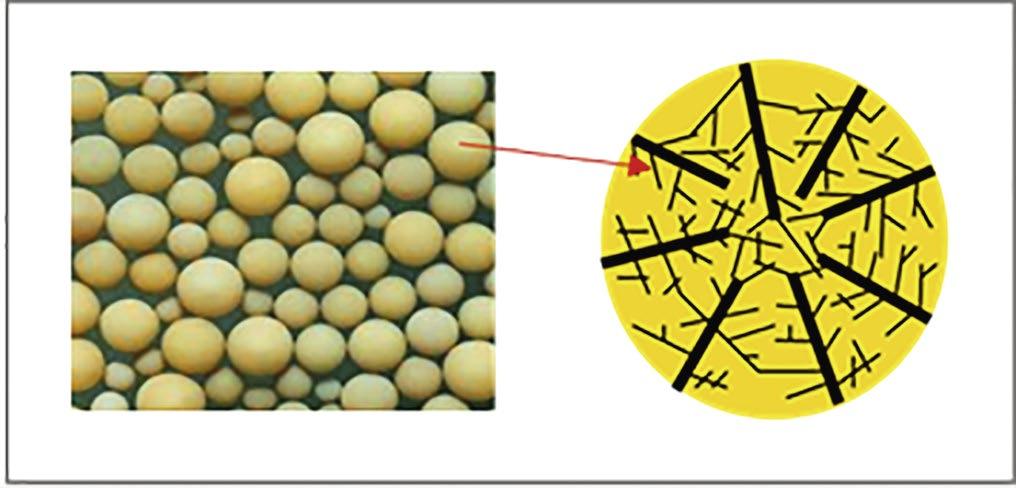
The IX structure of both types of resins can be either gel or macroporous. The gel structure is characterized with many uniform micro pores (up to 2 nanograms). These pores are the openings or voids among the resin polymer chains. The uniform pores give gel resin a crystalline like structure, which makes the resin transparent. Macro porous resin was developed with a goal to create artificial large pores (50 to 1,000 nanometers) in the polymer matrix by adding a porogen (phase extender) into the polymerization reaction. Once polymerization is complete the porogen is removed leaving macropores in the polymer structure. Compared to gel type resin, macroporous resin is opaque, less flexible, has
MD resin beads have many performance advantages over the HD resin, including lower pressure drop, very low content of fines (so blockage of filter nozzles is minimized), homogeneous exhaustion and regeneration, low rinse water requirement, high physical stability and generally higher operating capacity (assuming the same starting total capacity for the HD and MD resins).
76 the ANALYST Volume 30 Number 1
Volume (%) particle size (mm) (a) 100 80 60 40 20 0 0.3–0.45 0.45–0.55 0.55–0.65 0.65–0.85 0.85–1.0 1.0–1.15 ■ HD MD ■ ◆ ◆ ◆ ◆ ◆ ■ ■ ■ ■ ■ ■ ■ 120 100 80 60 40 20 0 0 0,5 1 1,5 Volume (%) particle size (mm) (b) ■ ◆ HD MD
Figure 7: PSD of HD and MD resins. Note: (a)in bar diagram and (b)in line plots.
T.U.T.O.R. continued
Figure 8: Gel (top picture) and Macroporous (bottom picture) resins and their microstructures.
faster adsorption kinetics, is more resistance to organic fouling and easier to regenerate. Gel-type resin normally has higher total capacity. Figures 8 and 9 compare the microstructures and appearance of the gel and macroporous type resins.
Crosslinking and water retention (WR). % crosslinking is the percentage of crosslinker in monomer mixture during polymerization. For the same type of resins made with the same raw materials and manufacturing process, the higher crosslinking resins are generally stronger, more resistant to degradation under an oxidizing environment, have higher total capacity and ionic selectivity. The % crosslinking for a SAC resin is about 2 to 20%, while that for an SBA resin is around 4-8%. WR is the amount of water (expressed as a percentage of the wet weight) retained within and on the surface of a fully swollen and drained ion exchange resin. For the same type of resins, an increase in WR often indicates the resin has been exposed to oxidizing agents such as chlorine, ozone, and others, resulting in a de-crosslinking of the polymer matrix.
The increase in WR is usually accompanied by a loss of both total and operating capacity per unit volume of resin. A decrease in WR may be the result of organic fouling. Macroprous and low-crosslinking resins often have higher WR. The relationship among % crosslinking, total capacity and WR (% moisture) for a set of SAC resins (made by the same manufacturing process) are illustrated below in Figure 10. With increasing % crosslinking, the WR of the resin decreases while the total exchange capacity in equivalents per liter (eq/L) increases. The sodium form of
the SAC resin has a lower WR than the H form resin at the same % crosslinking because the latter is more hydrophilic. It holds more water and swells more than the Na form.
IX selectivity. The primary function of IX is to exchange ions. Selectivity among ions makes the exchange possible and beneficial. Table A shows the ionic selectivity of many species on typical SAC (different % crosslinking) and SBA resins (Type 1 and Type 2). It can be seen that the higher the SAC crosslinking, generally the higher the selectivity. Multivalent ions usually have higher selectivity. For the same group of ions, the larger the crystal ionic radii, the higher the selectivity, as shown by Cs+ > Rb+ > K+ > Na+ > Li+ and I- > Br- > Cl- > F-. In softening applications, calcium ions can be preferentially absorbed onto a SAC resin by replacing the sodium ions, due to their higher selectivity. For drinking water, an SBA resin can selectively remove nitrate ions over chloride ions. It should be noted
77 the ANALYST Volume 30 Number 1
Figure 10: The correlation among % crosslinking, total capacity and WR (% moisture) of SAC resins.
T.U.T.O.R. continued
Figure 9: Macroporous resin and its enlarged structures.
Temperature
causes high absorption kinetics, but sometimes causes more desorption (e.g., CO2 gas on WBA resins)
situation, could cause more, or less target species adsorption
that when the lower selectivity ions (e.g., sodium and chloride in the previous examples) are in much greater abundance in the solution, they can reverse the process and replace the favorable ions (i.e., calcium and nitrate). This is called regeneration of the exhausted resins.
Total and operating capacity. The total capacity is an indicator for the total available functional groups on the resin, while the operating capacity is the actual achievable exchange capacity during the operation under distinct and defined conditions. The operating
capacity is practically more important and is related to many factors, such as the total capacity, regenerant dosage, feed concentration, specific flow rate, ionic loading rate, competing ions, temperature, end point, fouling, and pH, among others. The table below summarizes the effects of different factors on the IX operating capacity.
As an example, Figure 11 exhibits the effect of a regenerant (HCl) dosage on the operating capacity of a SAC resin. It shows that higher HCl dosages increase the
78 the ANALYST Volume 30 Number 1
DVB Crosslinking Base Strengths Ion 4% 8% 10% 16% Ion Type 1 Type 2 Li+ 0.76 0.79 0.77 0.68 OH - 1.0 1.0 H+ 1.00 1.00 1.00 1.00 Benzene Sulfonate 500 75 Na+ 1.20 1.56 1.61 1.62 Salicylate 450 65 NH4+ 1.44 2.01 2.15 2.27 Citrate 220 23 K+ 1.72 2.28 2.54 3.06 I - 175 17 Rb + 1.86 2.49 2.69 3.14 Phenoate 110 27 Cs+ 2.02 2.56 2.77 3.17 HSO 4 - 85 15 Ag+ 3.58 6.70 8.15 15.60 ClO3 - 74 12 Ti+ 5.08 9.76 12.60 19.40 NO3 - 65 8 UO22+ 1.79 1.93 2.00 2.27 CN - 28 3 Mg2+ 2.23 2.59 2.62 2.39 HSO3 - 27 3 Zn2+ 2.37 2.73 2.77 2.57 BrO3 - 27 3 Co2+ 2.45 2.94 2.92 2.59 NO2- 24 3 Cu2+ 2.49 2.93 3.15 3.03 Cl - 22 2.3 Cd2+ 2.55 2.95 3.23 3.37 HCO3 - 6 1.2 Ni2+ 2.61 3.09 3.08 2.83 IO3 - 5.5 0.5 Ca2+ 3.40 4.06 4.42 4.95 Formate 4.6 0.5 Sr2+ 3.56 5.13 5.85 6.87 Acetate 3.2 0.5 Pb2+ 5.03 7.80 8.92 12.20 F - 1.6 0.3 Ba2+ 5.40 8.70 9.42 14.20 HSiO3 - <1.0 <1.0
Table A: Selectivity among Different Ion Species on Typical SAC and SBA Resins.
Factors If the factor is higher Effect on operating capacity Total Capacity Provides more potentially available absorbing sites Higher operating capacity Regenerant dosage Generates more available absorbing sites Higher operating capacity Feed concentration Provides more target species for absorption Higher operating capacity Specific flow rate Target species have less time for absorption Lower operating capacity Ionic loading rate More species will be absorbed Higher operating capacity Competing ions More competition with target species for adsorption Lower operating capacity End point concentration of target species Allows more time for adsorption Higher operating capacity Fouling Makes more sites unavailable for adsorption Lower operating capacity
higher operating
T.U.T.O.R. continued
Table B: Effect of Different Factors on IX Resin Operating Capacity.
Generally,
Generally
capacity, but sometimes lower operating capacity pH Depending on the species and specific
Could be either higher or lower
resin operating capacity. High operating capacity often results into high throughput and long cycle time. It is a very important parameter for IX process calculation, design, and simulation.
Industrial demineralization. The purity of boiler feed water is crucial in steam production for both thermal heating and power generation. If untreated, impurities such as chloride, silica and iron crud in water can cause serious problems (corrosion and scale formation).
WAC, SAC, WBA, SBA and mixed-bed resins are commonly used to demineralize make-up water and polish the returned condensate for successful steam generation. In nuclear power plants, ion exchangers are important components in the chemical and volume control system (CVCS) that manages water volumes and dissolved constituents in the cooling circuits. With the aid of selective ion exchangers, both radioactive and non-radioactive ions can be removed from the process water and the wastewater flow. The water in spent fuel pool also passes through ion exchangers for treatment.
Key IX Applications
Since 1940, IX manufacturing processes have been continuously improved and matured. New resin structures and functionalities are synthesized and applied to growing areas. The widespread uses of uniform resin beads and novel operational design greatly improved IX performance. Today, IX has found uses in numerous municipal and industrial practices. The following sections provide an overview of several key applications.
Drinking water. Clean and good-tasting potable water is the most essential part of a healthy lifestyle. There is an increasing demand for drinking water purifying systems across households, restaurants and other establishments directly at the point of use (POU), providing both an additional barrier of protection against contaminant intrusion as well as for achieving higher-quality taste. SAC and WAC resins have long been successfully used for softening and dealkalization of potable water in POU systems (e.g., cartridge filter applications). WAC resins can effectively remove toxic metals such as lead and cadmium from drinking water. Recently, some emerging anion contaminants, such as per- and polyfluorinated alkyl substances (PFAS), perchlorate and selenate, became an increasing concern. Some special SBA resins have been proven very successful in reducing them to non-detectable levels.
Food and health. IX purification is a well-established process in the food, beverage, nutrition, and health industries. An important application in the food industry is the processing of sugar. The large-scale production of crystal and liquid sugar would hardly be economically feasible without food-grade IX resins.
SBA, SAC, WAC, and WBA are widely used in the purification of raw sugar by removing both color and ash. For starch-based sweeteners, IX resins are used for ash removal and chromatographic separation of fructose and glucose. IX systems also play a decisive role in ensuring product quality in processing fruit juices, gelatin, whey, wine, amino acids, organic acids, heparin, and pectin. In pharmaceutical and drug applications, IX is extensively used in purifying raw materials and functioning as active ingredients/excipients in the final products.
Microelectronics. Ultrapure water (UPW) is indispensable for processing semiconductor wafers, flat panel displays, and photovoltaic devices. As technology advances into smaller nodes, the requirement for UPW is even more stringent. Highly purified single and mixed-bed resins are used to produce UPW water. Special catalyst-loaded WBA/SBA resins are used for deoxygenation and the removal of trace hydrogen peroxide. Chelating resins are increasingly used to remove copper and other metal species from fab wastewater, and WAC resins are installed in front of high-efficiency reverse osmosis (HERO) membranes to remove alkalinity and hardness ions.
79 the ANALYST Volume 30 Number 1
Figure 11: The effect of HCl dosages on the operating capacity of a SAC resin.
T.U.T.O.R. continued
Mineral processing. Resins with special chelating functional groups can strongly bind certain metal ions. With the aid of chelating IXs, metals can be directly extracted from ore leachates. For instance, metals like copper, nickel, and cobalt can be recovered more efficiently and ecologically by IX. By playing selectivity at different pH levels, ion exchangers can remove the impurities in nickel and cobalt concentrates to produce high-purity metals. These metals are used to make key cathode materials of lithium-ion batteries for electrical vehicles. In addition, chelating resins are widely used to remove hardness ions (calcium [Ca] and magnesium [Mg]) from lithium brine; purify copper electro-refining bath; treat incineration plant scrubber wastewater; and recycle value metals from electroplating waste streams. Special SBA resins can be employed to extract uranium, and SAC resins can recover rare earth metals.
Chemical processing. SAC resins in the H from are successfully used for catalysis applications such as bisphenol A production, phenol purification, manufacturing of biodiesel and certain ethers, esterification, and ester hydrolysis. WBA resins can capture carbon dioxide (a greenhouse gas) from air. Essential chemicals such as sodium hydroxide, chlorine gas, and hydrogen gas are needed in the production of materials and liquids such as polyvinyl chloride (PVC), paper, cellulose, disinfectants, bleach, and aluminum compounds. These are obtained from chloralkali electrolysis of sodium chloride brine. Chelating resins have proven records of success under extreme conditions, such as the treatment of highly concentrated hot brines for chloralkali electrolysis. They reliably remove alkaline earth or heavy metal ions and protect the electrolysis membrane.
Summary
IX is an established separation technology for demineralization, purification, extraction and recovery of various species. With the unique polymeric structure and versatile functional groups, it plays a key role and proved itself as the most viable option in many applications. In the past 100 years, IX has witnessed great technology advancement and fast growth in a lot of industrial sectors. IX provides unique solutions to some toughest emerging challenges in our modern society, including e-mobility, CO2 capture, solar panel/
microchip production, and PFAS remediation. It is also complimentary to many other technologies such as electrodeionization (EDI), reverse osmosis (RO), activated carbon, and solvent extraction by serving as either a pretreatment or polishing step.
IX is everywhere in our daily life, so it is important to keep its manufacturing process sustainable and environmentally friendly. Newly developed IX resins should have a carbon footprint as small as possible. We hope IX manufacturers can take steps to make their resins in an ecologically responsible way.
Bibliography
1. D’Alelio, G.F. (Dec. 26, 1944). “Production of Synthetic Polymeric Compositions Comprising Sulphonated Polymerizates of Poly-vinyl aryl Compounds and Treatment of Liquid Media,” U.S. Patent No. 2,366,007.
2. de Dardel, F. (n.d.). “History of Ion Exchange,” accessible at http://dardel.info/IX/other_info/history.html
3. de Darde, F.; Arden, T.V. (2012). “Ion Exchangers,” Ullmann’s Encyclopedia of Industrial Chemistry, Wiley-VCH Verlag GmbH & Co. KGaA, Weinheim, Germany.
4. Gans, R. (January 1905). German Patent No. 174,097 as relates to Amorphous Silicates (e.g., so-called "amorphous zeolites).
5. Lanxess A.G. (2021). Lewatit® Ion Exchange Resins: Sampling, Testing, and Interpretation, Lanxess, Cologne, Germany.
6. Lanxess A.G. (2022). Product Guide: Portfolio of Lewatit® Ion Exchange Resins and Bayoxide® Iron Oxide Adsorbers, Lanxess, Cologne, Germany.
7. Lanxess A.G. (accessed September 2022). “Find The Right Solution for Your Industry," available at www.lewatit.com
8. Lanxess A.G. (accessed December 2022). “Lewatit® Scopeblue – First Sustainably Produced Ion Exchange Resins,” available at www.lewatit.com
9. Mitsubishi Chemical Industries Ltd. (1982). Diaion, Manual of Ion Exchange Resins II, Revised Edition.
10. Wale, J.; Dally, D. (2019). “Reducing the Environmental Impact for Makeup Water Treatment, Utilizing Modern Packed-Bed Technology,” 39th Annual Electric Utility Chemistry Workshop, Champaign, Illinois.
11. Zaganiaris, E. (2011). Ion Exchange Resins and Synthetic Absorbents in Food Processing, Books on Demand.
12. Zaganiaris, E. (2013). Ion Exchange Resins and Synthetic Absorbents in Chemical Processing, Books on Demand.
13. Zaganiaris, E. (2009). Ion Exchange Resins in Uranium Hydrometallurgy, Books on Demand.
Endnotes
A Rohm and Haas Co.’s IX business is now under DuPont Inc.
B Bayer’s IX business is now under Lanxess A.G.
C Dow Chemical’s IX business is now under DuPont Inc.
80 the ANALYST Volume 30 Number 1 T.U.T.O.R. continued
Zhendong Liu earned a Ph.D. in materials science and mineral engineering from University of California at Berkeley in 2001, and an MBA from University of Delaware in 2010. He has authored 20 peer-reviewed journal articles and holds 22 granted U.S. patents. He has more than 20 years’ experience in specialty chemical industry. Dr. Liu is currently employed by Lanxess Corp. as the head of the technical service and business development for its Liquid Purification Technologies business in the Americas. He can be reached at zhendong.liu@lanxess.com.

Firuza Mir is the regional head for the AMS Region and has been a member of the global management team for Lanxess’ Liquid Purification Technologies business unit since 2009. (Lanxess’ industrial chemicals business was once a part of Bayer AG, prior to a
business restructuring by Bayer.) She began her career in 1995 with Bayer India as a divisional and marketing services manager for the Animal Health and Environmental Services Division. She later joined Bayer’s corporate management team as head of corporate controlling and strategic development for Bayer India. In 2000, she moved to Canada as the controller for the Chemicals and Polymers Division, and later was promoted as the vice president and general manager of Bayer Chemicals. In July 2004, she came to the U.S. as president and general manager of Lanxess Corp. for North American operations of the firm’s Textile Processing Chemicals business unit. Later, in 2009, Ms. Mir took on her current position. Ms. Mir holds a finance degree from the University of Bombay and an MBA from NMINS both in finance and marketing. She is married and has two sons. Ms. Mir can be contacted at firuza.mir@lanxess.com.

Keywords
SANIKILL and SaniWare
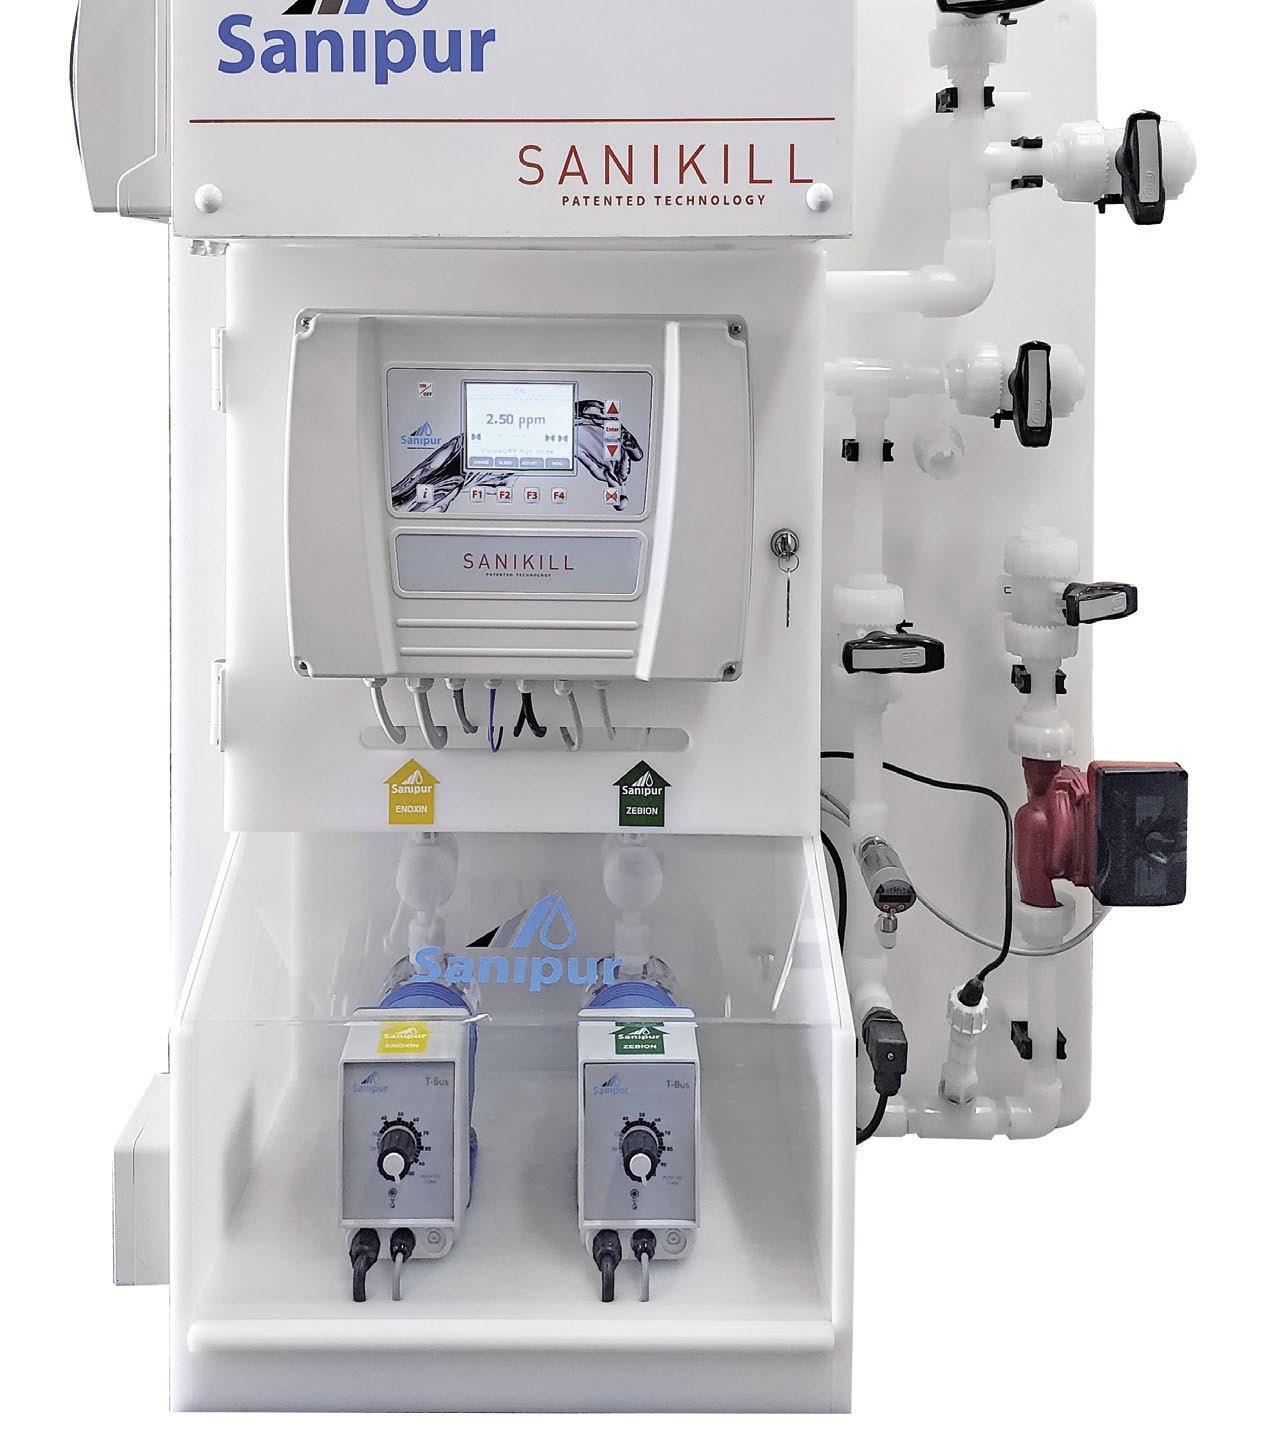
81 the ANALYST Volume 30 Number 1
ANION, CATION, DEIONIZATION, ION EXCHANGE
Treatment and control The patented SANIKILL technology now combined with SaniWare water quality monitoring panels! Expand your OPPORTUNITIES! Visit www.sanipur.com - sales@sanipur.com - 484-351-8702 T.U.T.O.R. continued
What’s (Water) on Your Mind?
From Water Softeners to Cooling Towers
Compiled by James McDonald, Chem-Aqua
Note: The following discussions come from the Industrial Water Treatment interest group on LinkedIn.
Question of the Week
Should the water softener be placed BEFORE or AFTER the reverse osmosis (RO) unit?
Rainer: If you place it after RO, it is not called water softener anymore, but polisher. It is commonly used in applications where "normal" RO water quality is not sufficient as well as kind of a safety in case an RO membrane fails.
Loren: It varies with the situation. Let's go with two examples. We have a hospital with perhaps a load of 5,000 gallons per day. The softener goes before the RO. This is because the softener can be a reasonable size, will need less oversight of the RO, less risk of membrane failure, etc. Now, if I have a plant processing perhaps 100,000 gallons per day (i.e., ethanol or power) you'll want the RO first, the softeners polish the hardness. In a high-volume water situation, should you think you want the softeners first, you'd need softeners the size of New Jersey, an obscene amount of salt for zeolite regeneration and more. Also, the larger plant will have proper oversight (dedicated maintenance staff, DCS, internal unit monitoring, remote monitoring and more) to support the RO. The best way to realize this is to actually size the softener unit for the specific situation: before and after the RO. With this step, the right choice will become clear.
When you visit a prospect (i.e., ethanol or power plant) and if they have the RO before the softener, do not ask
why they do it that way. It will communicate a level of ignorance on your part, and you will not be considered. If you need an excellent book to learn about RO, I'd recommend Reverse Osmosis, A Practical Guide (published by Tall Oaks Publishing, Inc.) by Wes Byrne.
David: The softener should be prior to the RO as far as I'm aware, to help protect the membrane life and impurities from the softening process are removed prior to supplying the outlet, steam boiler, cooling tower, etc.
Josh: Depends if you're trying to protect the RO as the main objective or downstream equipment.
Samuel: Depends on whether the hardness level and the total dissolved solids (TDS) are higher. Then, it is usually before the RO to increase membrane life and reduce OPEX (e.g., clean-in-place, etc.). But if hardness is low and you need high quality feed water for say boiler feed, then you can put softener after RO to polish the permeate. Otherwise, just follow the design specs.
Tran: I think putting the softener system before an RO system is the better choice. In this case, a softener system can pretreat and protect the RO against high levels of total hardness in inlet raw water.
Michael: Softeners using cation resin have the risk of "color throw," which is a charged total organic carbon (TOC). If the softener is before RO, the RO will reject this TOC. If the softener is after the RO downstream processes may be fouled by this TOC—for example, an EDI unit.
82 the ANALYST Volume 30 Number 1
Essam: Before RO (if required) but if the feed TDS is less than 500 parts per million (ppm), After RO (if required) but feed TDS is more than 1,000 ppm or sea water is the feed. The requirement is to reduce the water hardness to enhance RO system efficiency (before RO) or reduce the final hardness of permeate water to use in industrial applications (after RO).
Narayanan: Before the RO, if the Langelier Saturation Index (LSI) value of RO feed water is > 2.5 or higher on the positive side, or the Ryznar Stability Index (RSI) value of RO feed water is < 6.5 (a higher scale-forming tendency), or the water alkalinity is too high (needing more acid to dose). Other factors can include the following:
The sulfate is too high.
When we run the RO projection that the calcium/ magnesium salt saturation level is too high and exceeds recovery and the number of stages to be treated are not possible or need higher antiscalant dosage.
The need for frequent membrane cleaning because of scaling in the last membrane train.
When the RO membrane life is shortened.
After the RO, if calcium and magnesium values are not disturbed in the final stages at the required recovery rate when we run RO projections or calculate the LSI and RSI values.
Dmitri: It depends. If the priority is reduction of concentrate, or the feed water is too hard, then it is better to place the softener ahead. But, if we want to reduce salt consumption or the volume of highly salted discharge water and water is not so hard, then place the softener after the RO.
Question of the Week:
When should an elution study be performed on a water softener?
James: Annually, or when your softener is having issues!
David: I would suggest quarterly, and if the test results indicate weak brine concentration on regen and after a softener service by a third party.
Brett: Should is the key word. Function of time available. Ideally, with enough frequency to see a trend
change. But worst case is when it’s not working, and you've got the troubleshooting hat on.
Question of the Week
What is the difference between measuring free versus total halogen?
John: Free Halogens are the acid radicals, HOCl HCl, HOBr and HBr. The acids react with the alkaline cell wall and burn a hole in it. The organism loses osmotic pressure and can't stop liquid from coming in or going out.
Total Halogen measures the mono, di, and trichloramines. These are a slower acting biocides but will get the job done. Monochloramine in particular is used extensively in hospitals as a secondary disinfectant. Bromamines are a contact killer and highly effective against bacteria and mold.
Chris: The difference between total and free halogen is “combined” halogen. The combined halogens are halogens reacted with organic compounds. (Think nitrogen compounds.) Combined chlorine has much less biocidal properties than free chlorine, but combined bromine still has good biocidal properties. For sanitation and oxidation, you want to have good levels of free chlorine but good levels of total bromine. A great way to measure free and total halogens is through the FAS DPD test method.
Question of the Week
What happens if you mix wastewater too fast for too long after adding flocculant?
Bharath: You will break all the long chains, thus hampering the settling process.
Abdul: Good question. Waste of energy and breakage on bonds.
Lauren: Increased polymer usage (multiple times higher than jar testing recommends) because the polymer "isn't strong enough, we had to crank it up."
Justin: You will either sheer your floc (if it even exists) and/or your polymer will short circuit to other processes
83 the ANALYST Volume 30 Number 1 What's (Water) on Your Mind continued
downstream in your system (filter clogs, etc.). Your floc will probably look like Spock (waving goodbye or disappearing altogether). ;)
Robin: The larger floc formed by the flocculant shears and breaks down.
Mike: I assume the floc if there, shears apart, or you form no floc at all!
Joseph: Destroying big flocs, no good flocculation effect, also depends on the mixer paddles.
Question of the Week
Which chemical products and raw materials could contribute to chloride levels in a cooling tower system?
Ahsan: CaCl 2 (calcium chloride), NaOCl (sodium hypochlorite), Al 2Cl(OH)5 (aluminum chlorohydrate).
Javed: Sodium hypochlorite contributes to chloride levels in cooling tower.
Muhammad: 1. Zinc chloride. 2. PAC. 3. Ferric chloride. 4. Sodium hypo chloride. Other components as well; however, still some big complex using hydrochloric acid (HCL) in cooling tower to neutralize the alkalinity.
Further, if any customer is using soft water in cooling water circuit, then they have good traces of chloride from the makeup water.
John: BCDMH (bromochlorodimethylhydantoin).
Srivastava: Mainly sodium hypochlorite.
Nikolay: PAC (polyaluminum chloride).
Steve: Chlorine or sodium hypochlorite added as a biocide. Although sulfuric acid is more common, hydrochloric acid can also be used to control the pH. Chloride containing coagulants used in the pretreatment of cooling tower makeup.
Moderator James McDonald, PE, CWT, is a director of technology & marketing with Chem-Aqua. He holds an M.S. in chemical engineering and is a Ray Baum Memorial Water Technologist of the Year award winner (2013). Mr. McDonald also chairs the Association of Water Technologies (AWT) Technical Committee. Mr. McDonald can be reached at James.McDonald@chemaqua.com

Keywords
BIOCIDES, FLOCCULATION, MAINTENANCE, REVERSE OSMOSIS, SOFTENING, WASTEWATER
2024 Annual Convention and Exposition
September 10–13, 2024
Louisville Convention Center and Omni Louisville
Louisville, Kentucky
2025 Technical Training Seminars (West)
February 25–28, 2025
Doubletree Mission Valley
San Diego, California
2025 Annual Convention and Exposition
November 12–15, 2025
The Broadmoor Hotel
Colorado Spring, Colorado
2026 Annual Convention and Exposition
September 16–19, 2026
Oklahoma Convention Center and Omni Hotel
Oklahoma City, Oklahoma
2027 Annual Convention and Exposition
September 8–11, 2027
Cleveland Convention Center
Cleveland, Ohio
84 the ANALYST Volume 30 Number 1 What's (Water) on Your Mind continued
Association Events continued from page 4
Series MP
4-20mA Output
Factory calibrated for easy installation in the field
Remotely confirm the pump’s speed is adjusting to your process parameters
The Pulsatron Series MP is a true microprocessor-controlled instrument delivering precise and accurate metering control. Packed with standard features, the Series MP includes automatic control via 4-20mA or 20-4 mA inputs, an external pace function with a stop feature, and a graphical LCD display with support for English, French, German, and Spanish languages. With models capable of flows ranging between 3 GPD (0.5 LPH) and 504 GPD (79.5 LPH) and pressure ranges from 20 PSIG (1.3 BAR) to 300 PSIG (21 BAR), and a turndown ratio of 1000:1, there is a Pulsatron MP Series pump to fit your process perfectly.
Provides a remote indication of pump speed


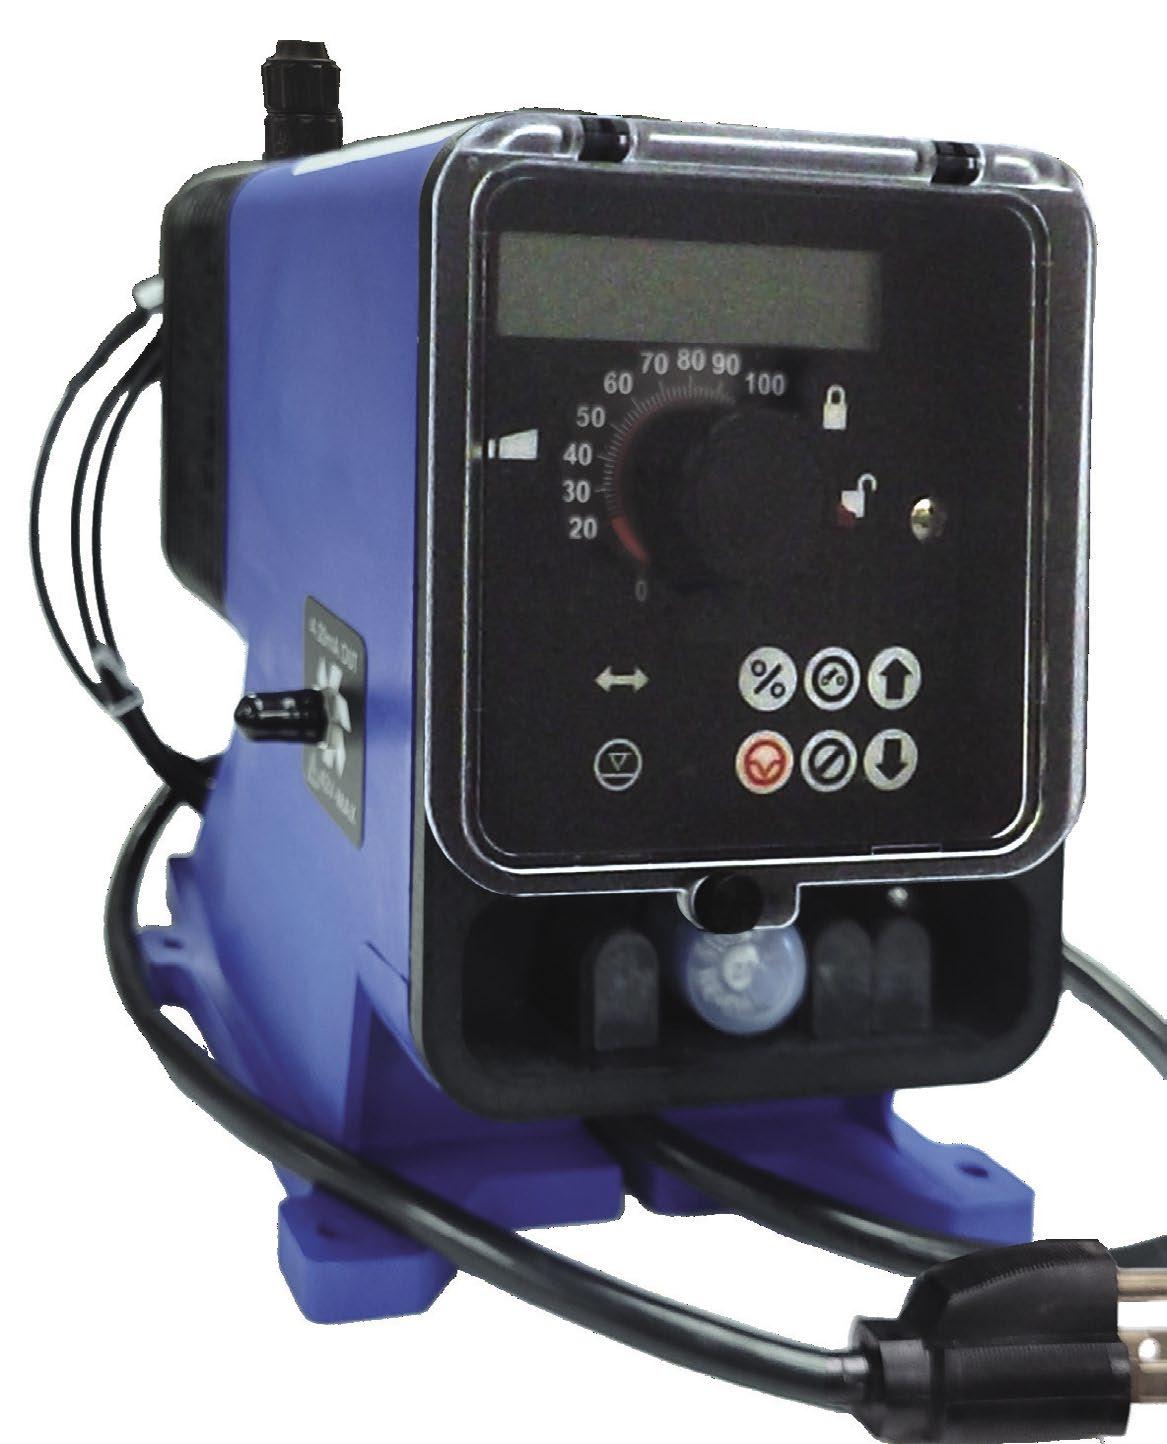
More accurately estimate chemical usage over time
4-20mA Output
NEW
A Pulsatron pump for any Application www.pulsafeeder.com Phone: 941-575-3800


86 the ANALYST Volume 30 Number 1 Advertising Index 25 AMSA 33 Bio-source, Inc. 86 CHEMetrics 2 Enviromental Safety Technologies 42 Myron L Company 85 Pulsafeeder 21 Qualichem, Inc 7 Quantrol 81 Sanipur US 19 Scranton Associates 69 Solugen, Inc 88 Special Pathogens Laboratory 87 Walchem Iwaki America WATER TESTING SHOULD BE SIMPLE That’s why our self-filling ampoules are PREMIXED, PREMEASURED and PRECISE We provide test kits for Low Range Dissolved Oxygen, Ammonia, Chlorine, DEHA, Filming Amines, Hardness, Hydrazine, Iron, Molybdate, Ozone, PAA, Phenol, Phosphate, Sulfide and more. +1.540.788.9026 | www.chemetrics.com


Special Pathogens Laboratory checks all the CDC boxes for comprehensive, accurate, reliable results. Right Lab. Best Test. ASSE 12080 CERTIFICATION TRAIING SAVE $200! USE CODE: AWT-DISCOUNT Nationally accredited and accredited for Legionella testing Retains Legionella isolates for case investigations Gold standard ISO test method; Complete identification SPECIALPATHOGENSLAB.COM | 877.775.7284 A Pace ® Laborator y
WHO DOES YOUR LEGIONELLA TESTING?
