How Can Water Treaters Benefit From Recent Peer-Reviewed Data on Legionella Testing Methods?
Can Oxygen and Ozone Improve Safety and Lessen Wastewater Treatment Equipment Damage?

Why Boilers Foam and How to Prevent It Lessons Learned From Legionella: When the Worst Happens—A Case Study From the UK
Can Monochloramine Offer a Long-Term Solution for Controlling Legionella and Waterborne Pathogens in a Healthcare Facility?
Published by Volume 30 Number 2 1300 Piccard Drive, Suite LL 14 • Rockville, MD 20850 Spring 2023 the ANALYST The Voice of the Water Treatment Industry Volume 30 Number 2 Spring 2023
Factory calibrated for easy installation in the field
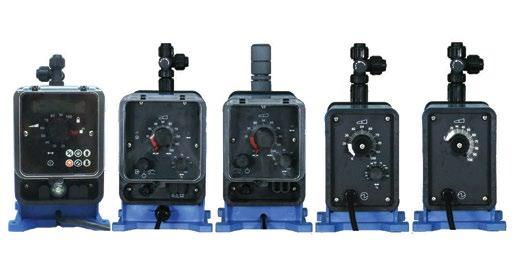
Series MP
4-20mA Output
The Pulsatron Series MP is a true microprocessor-controlled instrument delivering precise and accurate metering control. Packed with standard features, the Series MP includes automatic control via 4-20mA or 20-4 mA inputs, an external pace function with a stop feature, and a graphical LCD display with support for English, French, German, and Spanish languages. With models capable of flows ranging between 3 GPD (0.5 LPH) and 504 GPD (79.5 LPH) and pressure ranges from 20 PSIG (1.3 BAR) to 300 PSIG (21 BAR), and a turndown ratio of 1000:1, there is a Pulsatron MP Series pump to fit your process perfectly.
Provides a remote indication of pump speed


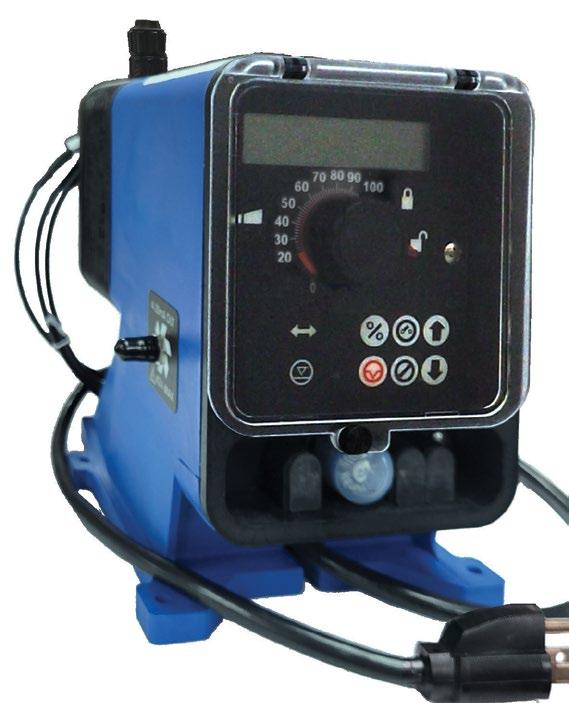
More accurately estimate chemical usage over time
4-20mA Output
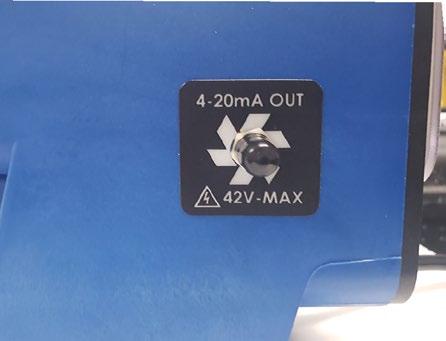
Remotely confirm the pump’s speed is adjusting to your process parameters
NEW
A
for any Application www.pulsafeeder.com Phone: 941-575-3800
Pulsatron pump
12
How Can Water Treaters Benefit From Recent Peer-Reviewed Data on Legionella Testing Methods?
Jeff Bates, IDEXX Laboratories
Water treaters are primary actors in the fight against waterborne disease due to their role managing premise plumbing systems and Legionella risk. Unfortunately, guidance on Legionella risk management is often limited or unclear, especially around interpreting the results of environmental Legionella sampling. A key contributing factor is the fact that traditional Buffered Charcoal Yeast Extract (BCYE) methods for Legionella detection, such as ISO 1131 and the CDC method, are inaccurate and highly variable. To address these challenges, new methods for Legionella detection have been introduced. Both PCR and liquid culture methods have been extensively studied in peer-reviewed literature. The available research demonstrates that PCR can be effectively used as a negative screen to rule out the presence of Legionella in the case of a negative PCR result. Eleven peer-reviewed studies also demonstrate that liquid culture is more sensitive than traditional BCYE methods, and there is strong evidence that liquid culture provides more consistent results than BCYE methods. These findings may be the basis for improved guidance in the future. In the meantime, water treaters can use these insights to benefit from these new methods, provide better risk management to their customers, and ultimately better protect public health.
22 Can Oxygen and Ozone Improve Safety and Lessen Wastewater Treatment Equipment Damage?
Greg Bock and Paul Tturgeon, Anue Water Technologies Inc.
Wastewater systems have long been subject to issues with odor and corrosion, which is understandable given the nature of what they carry. The odor is the driving force behind implementing controls for these systems. However, corrosion is the issue with the greatest potential for environmental harm and real systemic and economic damage. This damage can arise in the form of burst pipes and other equipment and system failures. Failures of this type require the repair and replacement of system materials and equipment. They also have the potential to expose the environment to unpredictable releases of hazardous waste that can be difficult, if not impossible, to contain or recover.
30 Why Boilers Foam and How to Prevent It
Louis Godbout and Simina Alungulesa, TGWT
In a steam boiler, salts present in the feedwater are concentrated as water is evaporated. This creates many challenges. Even if the most problematic salts, namely those that are responsible for scaling (calcium, magnesium, silicates, etc.), are well controlled and removed from the feed water by ion-exchange resins, reverse osmosis, or other methods, other ions may be present (sodium, potassium, chlorides, sulfates, and others) that will accumulate in the boiler and lead to foaming and carryover once certain critical concentrations are reached.
46 Lessons learned From Legionella: When the Worst Happens—A Case Study From the UK
John Sandford, CWT, SMS Environmental Ltd.
The control of Legionella bacteria is tightly regulated in the U.K. and has been since an outbreak of Legionnaires’ disease in the English Midlands in Stafford District Hospital in 1985. The Badenoch Report commissioned by the U.K. government to investigate this outbreak cited figures of 101 cases Legionnaires’ disease and resulted in 28 fatalities caused by an evaporative cooling system. So, for the first time Legionnaires’ disease was seen as a significant public health issue that required an appropriate regulatory response. Since then, regulation has become onerous to the extent of being selfdefeating in terms of the public health issue and now the biggest risk is not from Legionnaires’ disease per se, but from a criminal enforcement action from the HSE.
56 Can Monochloramine Offer a Long-Term Solution for Controlling Legionella and Waterborne Pathogens in a Healthcare Facility?
Janet E. Stout, Ph.D., Special Pathogens Laboratory, and David Pierre, LiquiTech
The four technologies that provide a residual disinfectant and have historically been considered for disinfection of building water systems to control Legionella include: supplemental chlorination, chlorine dioxide, monochloramine, and copper-silver ionization. We previously performed independent field evaluations of all currently used disinfection methods for Legionella control in building water systems. This includes the first independent evaluation of a monochloramine installation on a hospital hot water system in the United States (1). From 2011 to 2014, the hospital hot water system was monitored for a total of 29 months (a 5-month baseline sampling period and 24 months post disinfection). A significant decrease in Legionella species percent positivity was observed without adverse microbial or chemical consequences.
3 the ANALYST Volume 30 Number 2 Cover A cooling tower at night, taken from the top of the Peabody Hotel in Memphis, TN while attending the Cooling Technology Institute in late January 2023.
Mike Henley. 4 Calendar of Events 5 President’s Message 7 Message From the President-Elect 8 Our Readers Write 63 Membership Benefits 64 Discovering AWT 67 Making a Splash 69 Tales From the Waterside 73 Beyond Water 77 T.U.T.O.R. 82 What’s (Water) on Your Mind? 86 Advertising Index Spring 2023 Volume 30 Number 2
Photo credit:
1300 Piccard Drive, Suite LL 14
Rockville, MD 20850
(301) 740-1421 • (301) 990-9771 (fax) www.awt.org
2023 AWT Board of Directors
President
Stephen C. Hallier, CWT
President-Elect
Noah Baskin
Secretary
John D. Caloritis, CWT
Treasurer
Kyle J. Rossi, CWT
Immediate Past President
Fred Shurtz
Directors
Craig Bodenmiller, CWT
Tammy Faber, MBA
Michelle Lunn
Michael Bourgeois, CWT
Ex-Officio Supplier Representative
Pam Simmons
Past Presidents
Jack Altschuler
John Baum, CWT
R. Trace Blackmore, CWT, LEED AP
Michael Bourgeois, CWT
D.C. “Chuck” Brandvold, CWT
Thomas Brandvold, CWT
Brent W. Chettle, CWT
Dennis Clayton
Bernadette Combs, CWT, LEED AP
Matt Copthorne, CWT
James R. Datesh
John E. Davies, CWT
Jay Farmerie, CWT
Gary Glenna
Charles D. Hamrick Jr., CWT
Joseph M. Hannigan Jr., CWT
Staff
Executive Director
Denise Jackson
Deputy Executive Director
Sara L. Wood, MBA, CAE
Member Services Director
Angela Pike
Vice President, Meetings
Tina Schneider
Meeting Coordinator
Caroline Bentley
Meeting Planner
Tim Foley
Calendar of Events
Association Events
2023 Business Owner’s Meeting
October 3, 2023
Amway Grand Hotel
Grand Rapids, Michigan
2023 Annual Convention and Exposition
October 4–7, 2023
DeVos Place Convention Center and Amway Grand Hotel Grand Rapids, Michigan
2024 Technical Training Seminar (East)
April 17–20, 2024
Cleveland Marriott Downtown at Key Tower
Cleveland, Ohio
2024 Annual Convention and Exposition
Matt Jensen, CWT
Mark R. Juhl
Brian Jutzi, CWT
Bruce T. Ketrick Jr., CWT
Bruce T. Ketrick Sr., CWT
Ron Knestaut
Robert D. Lee, CWT
Mark T. Lewis, CWT
Steven MacCarthy, CWT
Anthony J. McNamara, CWT
James Mulloy
Alfred Nickels
Scott W. Olson, CWT
William E. Pearson II, CWT
William C. Smith
Marc Vermeulen, CWT
David Wagenfuhr
Casey Walton, B.Ch.E, CWT
Larry A. Webb
September 10–13, 2024
Louisville Convention Center and Omni Louisville Louisville, Kentucky
2025 Technical Training Seminars (West)
February 25–28, 2025
Doubletree Mission Valley
San Diego, California
2025 Annual Convention and Exposition
November 12–15, 2025
The Broadmoor Hotel
Colorado Spring, Colorado
2026 Annual Convention and Exposition
September 16–19, 2026
Oklahoma Convention Center and Omni Hotel
Oklahoma City, Oklahoma
2027 Annual Convention and Exposition
September 8–11, 2027
Cleveland Convention Center
Cleveland, Ohio
Also, please note that the following AWT committees meet on a monthly basis. All times shown are Eastern Time. To become active in one of these committees, please contact us at (301) 740-1421.
Exhibits and Sponsorship Manager
Brandon Lawrence
Marketing Manager
Mary Claire Gordon
Editorial Services Manager
Heather Rigby
Production Manager
Tiffany Ward
Director of Accounting Services
Dawn Rosenfeld
The Analyst Staff
Publisher
Denise Jackson
Managing Editor
Heather Rigby
Production Manager
Tiffany Ward
Technical Editor
Michael Henley
(303) 324-9507. Email: mdhenleywater@gmail.com
Advertising Sales Manager
Carol Nettles
carol@adboomadvertising.com
Second Tuesday of each month, 11:00 am—Legislative/Regulatory Committee
Second Tuesday of each month, 2:30 pm—Convention Committee
Second Wednesday of each month, 11:00 am—Business Resources Committee
Second Friday of each month, 2:00 pm—Pretreatment Subcommittee
Second Friday of each month, 10:00 am—Special Projects Subcommittee
Second Friday of each month, 11:00 am—Cooling Subcommittee
Third Monday of each month, 9:00 am—Certification Committee
Third Monday of each month, 3:30 pm—Young Professionals Task Force
Third Tuesday of each month, 3:00 pm—Education Committee
Third Friday of each month, 9:00 am—Boiler Subcommittee
Third Friday of each month, 10:00 am—Technical Committee
Quarterly (call for meeting dates), 11:00 am—Wastewater Subcommittee
Other Industry Events
Electric Utility Chemistry Workshop, June 6–8, 2023, Champaign, Illinois
AWWA, Annual Conference & Expo, June 11–14, 2023, Toronto, Ontario, Canada
ACS, Fall National Meeting & Expo, August 13–17, 2023, San Francisco, California
WEFTEC, Annual Technical Exhibition and Conference, September 30–October 4, Chicago, Illinois
Ultrapure Micro Conference, October 10-12, 2023, Austin, Texas
RETA, Annual Convention, November 13–16, 2023, Jacksonville, Florida
Cooling Technology Institute, February 4-8, 2024, Houston, Texas
USA. Annual subscription rate is $100 per year in the U.S. (4 issues). Please add $25 for Canada and Mexico. International subscriptions are $200 in U.S. funds.
4 the ANALYST Volume 30 Number 2
The Analyst
Water Technologies. Copyright
Materials
reproduced without written permission. Contents of the articles are the sole opinions of the author and do not necessarily express the policies and opinions of the publisher, editor or AWT. Authors are responsible for ensuring that the articles are properly released for classification and proprietary information. All advertising will be subject to publisher’s approval, and advertisers will agree to indemnify and relieve publisher of loss or claims resulting from advertising contents. Editorial material in the Analyst may be reproduced in whole or part with prior written permission. Request permission by writing to: Managing Editor, the Analyst, 1300 Piccard Drive, Suite LL 14, Rockville, MD 20850,
is published quarterly as the official publication of the Association of
2023 by the Association of Water Technologies.
may not be
President’s Message
It has been a busy period at AWT. In February, I was fortunate to attend our AWT Tech Training Seminar in San Diego, CA. I joined a great group of registered attendees and trainers, and I was thrilled to be there with other colleagues to engage in education and networking for a couple of days. I am pleased to report that attendance was up for both of our Training Sessions, with the west coast hosting 143 registrants. Our east coast event in March hosted a large group of 261 attendees in Pittsburgh, PA—both very successful events! It is especially rewarding for me to see so many young people attending the training seminars, gaining the expertise to become future leaders in our industry. I would like to thank all the hardworking trainers and volunteers who dedicated their knowledge, time, and expertise to make these seminars so valuable for those who attend.
CWT
Speaking of education, if you are not already a Certified Water Technologist (CWT), now is the time to make a plan to become certified. The CWT designation is the definitive standard in the water treatment industry. This credential gives you the credibility you need and deserve to enhance your career in water treatment. Please feel free to visit our AWT website for more information at www.awt.org
Individual Members
Our newest membership category is growing each month. Since January, we have welcomed over 56 new individual members to AWT. This new group of members are becoming engaged in AWT and happy to be a part of our organization. We surpassed our initial membership goal for the year and are now striving to bring in 100 new individual members by the end of 2023. If you have any questions about this new category, please feel free to reach out to our Director of Membership, Angela Pike at apike@awt.org.
By Steve Hallier, CWT
2023 Annual Conference
I am looking forward to welcoming all of you to the great state of Michigan to kick off our AWT Annual Conference and Exhibition on October 4–6, 2023 at DeVos Place and the Amway Grand Plaza Hotel in Grand Rapids. We have an amazing line-up of educational sessions, exhibitors, and lively social functions that are sure to be a great time! I truly enjoy being able to network with my fellow AWT water treaters, learn about new technology, and meet with EVERY supplier we have… all under one roof! Also, a big “thank you” to all our sponsors, who help make this event one that you can’t miss!

AWT Leadership
The Board of Directors have been very focused on refining our strategic plan and will continue that charge at our upcoming Board meeting in May in Amelia Island. Our nominations process is in full swing, and we are grateful to all those who nominated a colleague to be vetted as a future AWT leader. It is so rewarding to get involved in AWT, and we encourage anyone who is interested to do so. We are tackling many topics at our Board meeting, including ANSI certification, membership growth, and the election of new Board members. It is an honor to serve as your President and, as always, I welcome any feedback you want to share with me at steve@wetsolutionsinc.com
5 the ANALYST Volume 30 Number 2


11335 Lewis Braselton Blvd. Braselton, GA 30517 770-978-1443 (Fax) 770-978-4165 info@biosourceinc.com www.biosourceinc.com 2021 Supplier of the Year •Biocides (oxidizing & non-oxidizing) • Polymers, azoles, phosphonates, sod. molybdate • Repacking (all drum sizes and pails available) •Regulatory and technical assistance Having Product Availability Issues? Let us help you piece it all together. IN BUSINESS SINCE 1991.
Message From the President-Elect
By Noah Baskin
I am happy to report that registration is now open for the 2023 AWT Annual Convention and Exposition, October 4–6, 2023, in Grand Rapids, Michigan! This year’s convention is truly shaping up to be a fantastic event that you will not want to miss!
The convention committee has been busy working on many details to ensure we provide you with another great conference in Grand Rapids. By every measure— conference registration, program planning, exhibitor engagement and others, we are far ahead of where we have been at this same time over the past several years. We are looking forward to dynamic sessions, educational exhibits, and fun networking events. Some of the scheduled events include a return to the popular Founders Brewery and a closing night networking party involving a new sport for AWT: Duckpin bowling!
AWT Business Owners Meeting (BOM)
The AWT Business Owners Meeting will again be held in conjunction with our Annual Convention and Exhibition, this year on Tuesday, October 3rd. Our focus this year is “intentional growth.” Our main speaker, Ryan Tansom, is an expert at growing businesses like ours, and he’ll have great information to share that
will benefit all of our business owners. The Business Resources Committee has worked hard to put together a great program that also includes Scott Hackworth focusing on “Leasing vs. Buying Decision-making,” which we know will be very interesting for those who attend. Other panels will concentrate on improving your marketing programs and creating performance metrics for managers to drive successful results. As an AWT Business Owner, you will not want to miss this meeting!

Silent Auction
It is always so rewarding to support our charity partner, Pure Water for the World (PWW), at our conference each year. They do such incredible work in Honduras and Haiti, and they make a difference in peoples’ lives every day. We will be having a silent auction again this year to support this important cause and help raise money for PWW’s critical mission.
Join Us!
Please plan to join us in Grand Rapids! Simply put, it will be great to be back together in person without any pandemic restrictions this year. We want to make this a record-setting event in Grand Rapids! Please add this conference to your calendar and register today. And, as always, I welcome any feedback. I can be reached at nbaskin@towerwater.com. Thanks for the opportunity to serve you and I look forward to hearing from you!
7 the ANALYST Volume 30 Number 2
Editor’s note: We welcome letters from our readers and may occasionally publish them in the magazine if they meet our general guidelines. They are as follows: Letters should be written respectfully, and they should focus on the content of the magazine or matters facing the Association of Water Technologies. We will make an attempt, when appropriate, to solicit a response from an author (if the letter is in response to an article) or a member of the AWT staff or board. We cannot guarantee a response to every letter received. We reserve the right to refuse a letter written in bad faith; additionally, we reserve the right to edit any letter and response for length, clarity, and grammar.
For consideration, letters may be sent to Mike Henley, technical editor, at mdhenleywater@gmail.com
Please note that the letters and responses do not necessarily reflect the opinions, beliefs, or stances of the Association of Water Technologies or its staff and board.
PCR Thermocycler, and an online, automated, cloud-based test device, BioAlert, that provide the concentration of Legionella pneumophila (all sero groups) within an hour after sampling and testing. There are several peer-reviewed papers documenting the results of lab and field cooling tower studies that included Legionella test results from two of these devices (and spread plate culture), including “Can Onsite qPCR Testing Improvement Management of Legionella Infections from Cooling Towers?” (Summer 2021 edition of the Analyst and presented at the 2021 AWT Conference, Providence, RI), “Managing Legionella using an Innovative Bacterial Control System and Rapid Genetic Legionella Testing,” (TP 22-24, February 2022, Cooling Technology Institute Annual Conference, Houston, TX) and “An Innovative, Online, Automated Field qPCR Legionella Test Device,” (IWC 22-67, November 2022, International Water Conference, Orlando, FL).
Editor,
The article “How Changes in Water Management Programs Could Present New Opportunities for Water Treaters” (Matt Freije, HC Info) in the Spring 2022 edition of the Analyst reported that a very low percentage of facilities are fully implementing comprehensive Water Management Programs (WMPs). The author makes a compelling case for developing methods and technology to simplify the implementation of WMPs such as automated data acquisition, notifications, reporting, documentation, and corrective actions. And the author correctly makes a case for more frequent test results by asserting that “Getting test results only once or twice a year, or even monthly, is not enough.” I agree!
The most significant issue is the author’s statement, “With current technologies and cost, Legionella testing cannot be performed automatically or frequently.” It’s simply not true. There are at least three field qPCR technologies for Legionella , Genomadix Cube (formerly Spartan BioCube), Biomeme’s Franklin™ Real-Time
These papers provide important insights about the value of more-frequent field qPCR Legionella tests to achieve the objectives of a WMP. During periods of frequent testing, researchers confirmed that the interactions of multiple factors were extremely complex and beyond their ability to predict the changes in the concentration of Legionella bacteria. Researchers learned that the concentration of Legionella in the cooling water could increase rapidly during specific events such as the application of an algaecide. By analyzing the trend of frequent test results during a variety of operating conditions, researchers were able to identify the risk factors for the proliferation of Legionella and use this real-time, site-specific information to update the WMP. Without frequent, real-time testing, it’s impossible to accurately assess the risk of exposure to and infection by Legionella bacteria, much less implement the proper and effective corrective action in a timely manner.
During this study, the use of frequent, automated, field qPCR test results allowed researchers to validate the

8 the ANALYST Volume 30 Number 2
Our Readers Write
efficacy of the biocide treatment program to control the concentration of planktonic Legionella bacteria and, more importantly, control the proliferation of Legionella bacteria in the sessile phase. Maintaining consistently low concentrations of planktonic Legionella bacteria eventually results in an unsustainable number of mature, viable organisms capable of proliferation.
This study confirms that the inherent high bias of the qPCR test results compared to culture test results had no impact on the selection of the appropriate corrective action. In addition, timely test results decreased the delay in implementing corrective action, significantly reducing the risk of proliferation of Legionella bacteria and the risk of Legionellosis infections. These outcomes make an on-line, automated qPCR field test a valuable tool to design and successfully implement a WMP in both domestic and evaporative cooling water systems. Researchers encourage water treatment professionals to recommend -and owners and operators to use–a field qPCR field Legionella test technology to minimize the legal, reputation and health and safety risks of Legionella bacteria in water systems.
Sincerely,
Loraine Huchler, President, MarTech Systems, Inc. Loraine,
The sentence that you quoted was in reference to the first sentence of the section: “Monitoring parameters that can be measured continuously, automatically, and inexpensively can fill in gaps left by the following limitations of Legionella testing.”
Although some Legionella test methods produce results within an hour, they cannot be performed as continuously, automatically, and inexpensively as tests for temperature, disinfectant, and other water quality parameters that can be measured with sensors and reported to cloud storage without a human collecting or analyzing a sample.
I apologize for the confusion. I should have written a clearer sentence, something like this: With current technologies, the
incoming water supply to a building cannot be monitored for Legionella with a sensor at frequent (e.g., 15-minute) intervals and automatically reported to a cloud application without human involvement, as can several water quality parameters at a reasonable cost.”
Matt Freije, CEO, HC Info Editor,
In the article, “Is Testing for Legionella pneumophila or Legionella Species Better for Routine Monitoring?” (Jeff Bates) in the Spring 2022 Analyst, the author provides a thorough synopsis of the current diagnostic evidence and results of field studies to demonstrate the need (or lack thereof) for testing for Legionella pneumophila (or Legionella species) in water systems. The author’s conclusion for testing Legionella pneumophila is strongly supported by the cited, underlying data. In his article, the author discusses the virtues of a liquid culture test compared to the standard spread plate culture test. He also asserts that, “It is critical for water treaters to align their programs and practices with the latest scientific thinking, data, and conclusions.”
I agree, there is an urgent need for more rapid Legionella testing methods with fewer false negative. It is well known that spread plate culture techniques are prone to false negatives due to degradation of samples during transport to the laboratory, the unacceptably long time required for a lab culture, and the inability to detect Viable-But-NotCulturable (VBNC) Legionella in the lab culture.
It was surprising that the author overlooked a more recent development in testing: a field qPCR test for Legionella launched in 2018. In our study published in the Summer 2021 Analyst, “Can Onsite qPCR Testing Improvement Management of Legionella Infections from Cooling Towers?” we included our test results from the field qPCR device, the Genomadix Cube (formerly the Spartan Cube), and from the spread-plate culture. The field qPCR test eliminated the risk of changes in the viability of microbes during transit and provided the concentration of Legionella pneumophila (all serogroups) in less than an hour after collecting a sample.
9 the ANALYST Volume 30 Number 2 Our Readers Write continued
Researchers used the qPCR test results to validate the efficacy of the biocide treatment program in minutes, mitigating any proliferation of Legionella during the seven-day wait for the results of a liquid culture and a seven-to-fourteen-day wait for the results of a spread plate culture.
The qPCR test results are often higher than the culture results due to the detection of VBNC bacteria. Not only can VBNC bacteria cause Legionellosis, VBNC bacteria can thrive and may have an increased resistance to physical, chemical, biocide and antibiotic stresses, allowing them to reproduce. The presence of VBNC Legionella bacteria detected by a qPCR test should be treated as a future risk of Legionella proliferation when the environmental conditions change. This study demonstrates that the inherent high bias of the qPCR test results as compared to culture test results had no impact on the corrective action, and that the timely test results decreased the time to implement corrective action, thus reducing the risk of both bacterial proliferation and Legionellosis infections.
Sincerely,
Loraine Huchler, president, MarTech Systems, Inc. Loraine,
Thank you for your thoughtful commentary. Unfortunately, discussing qPCR testing was beyond the scope of the article on whether Legionella testing should focus specifically on Legionella pneumophila or all culturable Legionella species. This is mentioned in the first paragraph in the section “Methodological Considerations,” where I point out that the AWT suggests that a culture-based test may be preferred for validating water management plans.
That said, I enthusiastically and wholeheartedly agree that qPCR testing is a useful tool for water treaters. This is discussed in detail in this issue of the Analyst , in the article “How can Water Treaters Benefit from Recent Peer-Reviewed Data on Legionella Testing Methods?” As outlined in that article, qPCR testing has been demonstrated to be an effective “negative screen” for Legionella . Additional
details can be found in the article itself.
Unfortunately, addressing on-site qPCR specifically was beyond the scope of that article as well. As outlined in a footnote, in that piece I focus on methods that have been extensively reviewed in academic peer-reviewed literature or included in standards documents such as ASHRAE Guideline 12. After re-reviewing your article and one of its academic peer-reviewed references, I am happy to comment on the use of on-site qPCR here.
As mentioned above, qPCR is a valuable tool to provide a negative screen, and that also appears to be the case with on-site qPCR. As outlined by ASHRAE Guideline 12, this is because “...viable organisms that may be able to cause infection cannot be differentiated from nonviable, dead Legionella.” This appears to also be the case with on-site qPCR. In the journal article by Dr. Shaimaa Ahmed and colleagues, titled “Validation and in-field testing of a new on-site qPCR system for quantification of Legionella pneumophila according to ISO/TS 12869:2012 in HVAC cooling towers,” (Reference 8 in your 2021 Analyst article) 21% of samples tested positive with on-site qPCR, but tested negative by culture. While the paper attempts to explain why that may not be due to dead or extracellular DNA, it is not convincingly substantiated. It suggests that the on-site PCR system removes extracellular DNA, and that a manuscript demonstrating that fact is “in process.” I have not been able to find that article in the academic literature but would be happy to review it once published. Even if this were the case, dead cells would potentially still generate false positive results and cause unnecessary and inappropriate actions to be taken, despite there being no risk to public health.
If there are findings in the data presented in your 2021 Analyst article that would contribute to the field’s understanding of the use of on-site qPCR to address Legionella risk, I strongly encourage you to submit those to an academic peer-reviewed journal so they may be counted among the latest scientific thinking, data, and conclusions. Additionally, I am always available to discuss how to help water treaters better reduce Legionella risk, hopefully at an AWT event in the near future!
Best regards,
Jeff Bates Senior Marketing Manager, IDEXX Water
10 the ANALYST Volume 30 Number 2 Our Readers Write continued

There’s a world of difference between a one-size-fits-all toll blender and an experienced custom water treatment blender like QualiChem. Contact us to learn why the blender really does matter… to you and your customers. 800.296.9102 | www.qualichem.com AN ISO 9001:2015 COMPANY Precision Manufacturing Formulatory Expertise Application Support Custom GHS-Compliant Labels and SDSs No Direct Sales
The Blender Matters
How can Water Treaters Benefit From Recent Peer-Reviewed Data on Legionella Testing Methods?
 Jeff Bates IDEXX Laboratories
12 the ANALYST Volume 30 Number 2
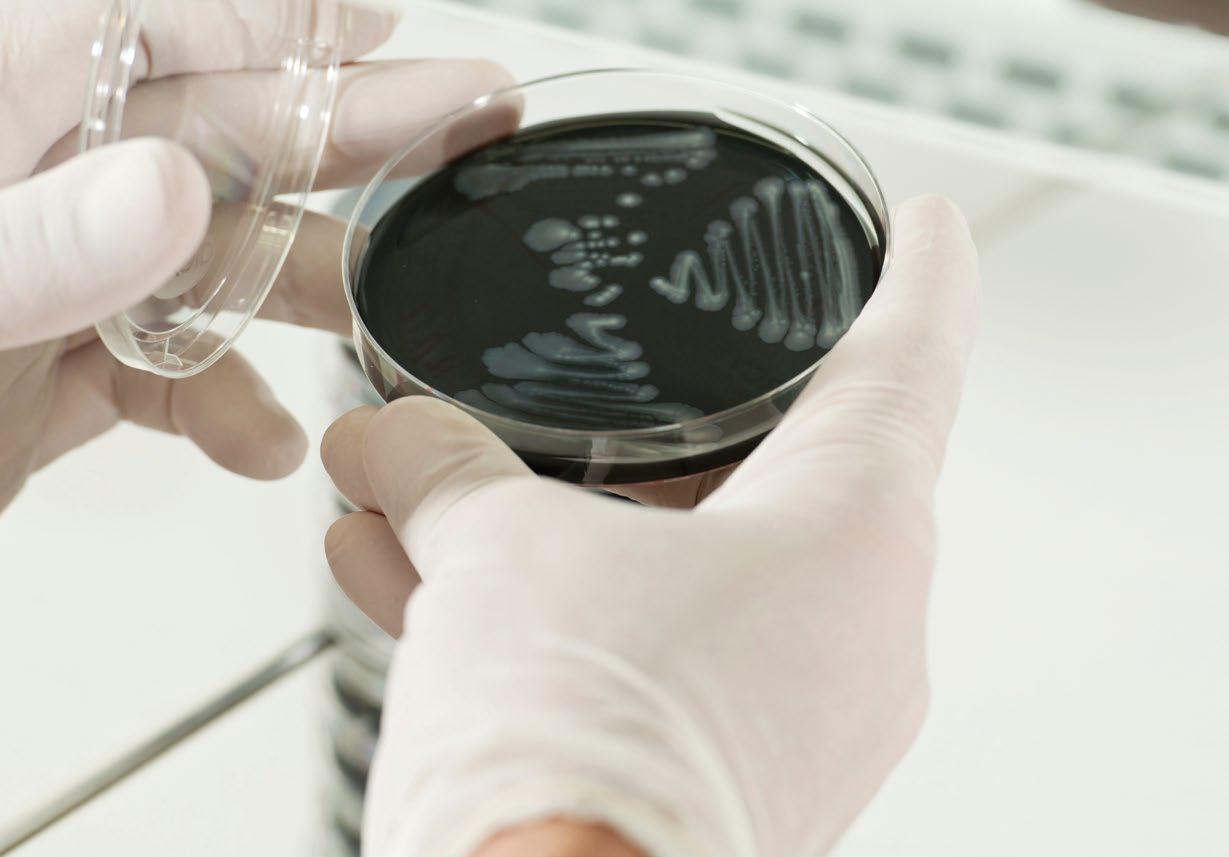
Scientist hands with agar petri dish containing legionella bacteria.
Executive Summary
Water treaters are primary actors in the fight against waterborne disease due to their role managing premise plumbing systems and Legionella risk. Unfortunately, guidance on Legionella risk management is often limited or unclear, especially around interpreting the results of environmental Legionella sampling. A key contributing factor is the fact that traditional Buffered Charcoal Yeast Extract (BCYE) methods for Legionella detection, such as ISO 1131 and the CDC method, are inaccurate and highly variable. To address these challenges, new methods for Legionella detection have been introduced. Both PCR and liquid culture methods have been extensively studied in peer-reviewed literature. The available research demonstrates that PCR can be effectively used as a negative screen to rule out the presence of Legionella in the case of a negative PCR result. Eleven peer-reviewed studies also demonstrate that liquid culture is more sensitive than traditional BCYE methods, and there is strong evidence that liquid culture provides more consistent results than BCYE methods. These findings may be the basis for improved guidance in the future. In the meantime, water treaters can use these insights to benefit from these new methods, provide better risk management to their customers, and ultimately better protect public health.
Introduction
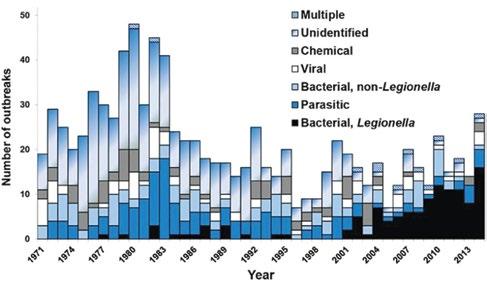
Building owners and facility managers increasingly look to water treaters to manage Legionella risk. The general public is becoming more educated on Legionella , in part due to the well-documented increases in the recorded incidence of Legionnaires’ disease around the world. Perhaps more important and troubling is that the overall number of waterborne disease outbreaks in the U.S. is increasing due to Legionella (Figure 1). After many years of decline in waterborne illnesses driven by improvements in drinking water regulation and operation, Legionella , and other biofilm-associated pathogens, are driving increases in hospitalizations and deaths in the U.S., with an estimated annual cost of $2.39 billion in 2014 (1).
While there are environmental consultants and other industry players that address Legionella r isk in premise plumbing, customers look to water treaters, almost by default, to manage this risk. Anecdotally, many water treaters now require their customers to test for Legionella or waive any claim to liability if they decide not to do so. Water treaters are now perhaps the primary line of defense against Legionella, a nd therefore against increases in waterborne disease in the U.S.
Guidance on Testing for Legionella
Despite this important role of protecting public health, water treaters consistently contend with incomplete and unclear guidance on how to best manage Legionella risk and control Legionella growth. These challenges are especially pronounced with respect to testing for Legionella
The water treatment industry is generally aligned that testing for Legionella in both cooling towers and premise plumbing is best practice for reducing risk. The AWT’s 2019 position statement on Legionella outlines that, although water management teams can decide whether to perform environmental sampling as part of a water management plan, “Legionella testing is the only direct or “active” way (currently) to validate [water management] program effectiveness” (3). Unfortunately, guidance from
13 the ANALYST Volume 30 Number 2 How Can Water Treaters Benefit From Recent Peer-Reviewed Data on Legionella Testing Methods?
Figure 1: Etiology of reported drinking water associated outbreaks in the United States (n = 298) by year, 1971 to 2014.
Source: Reference 2, NASEM (2020).
the Centers for Disease Control and Prevention (CDC) is less clear— it suggests that routine testing may be beneficial in facilities that are unable to consistently meet control limits (4). A water treater might only realize that most facilities fall into this category after seeking out experts or through experience in the field.
Guidance on how to interpret Legionella test results is also confusing. The CDC aims to provide a multifactorial approach based on Legionella concentration, changes in concentration, and extent of positivity. Unfortunately, the CDC’s complex, footnote-heavy chart simply boils down to a handful of factors that suggest poor control of Legionella. There is little to no discussion of the intersection between concentrations, growth, extent, and type of Legionella. If Legionella is shown to be poorly controlled, readers are instructed to perform a complex set of tasks that ends in “considering” whether remedial treatment is needed (4). This leaves many water treaters and their customers without a clear sense of how to interpret results or best mitigate risk.
In the Technology Supplement to the Fall 2017 Analyst, M. Freije (5) provided additional guidance on interpreting results, noting these factors to consider: 1. “breakdown of findings” (e.g., where samples were collected or whether they were pre- or post-flush); 2. equipment-specific remediation; and 3. occupant susceptibility. He provides a strong framework for interpreting results, including examples of how the different factors may interact. Interpreting results is inherently a complex task, however, and specific guidance on every factor and every interaction goes beyond the scope of an Analyst article. While Freije’s article is a good start, water treaters looking for clear guidance on interpreting Legionella test results must still seek out other experts or learn through experience.
The inability to provide clear guidance on testing for Legionella and interpreting Legionella test results is an outcome of several factors, including lack of definitive data on the infectious dose of Legionella and susceptibility of potential hosts (6). Deficiencies in
traditional methods for detection of Legionella (e.g., Buffered Charcoal Yeast Extract (BCYE) or spreadplate methods) are also a major contributor to unclear guidance. As outlined by the EPA:
Despite a number of published procedures for the detection of Legionella in water samples, standard culture methods remain limited by their sensitivity and unreliability in detecting a wide range of Legionella spp. on a consistent basis…
These limitations make interpreting results difficult. Logically, test results that are inaccurate and inconsistent are difficult to interpret. Unfortunately, BCYE-type spread-plate results (often referred to as “traditional” or “standard” culture) have been shown to be both inaccurate and inconsistent.
BCYE Culture Challenges
Perhaps the clearest demonstration of those shortcomings is a study performed by researchers at the CDC in 2011 (7). Samples with known concentrations of Legionella were sent to 20 CDC Environmental Legionella Isolation Techniques (ELITE) laboratories to evaluate laboratory limits of detection as well as the accuracy of Legionella counts. The samples that were distributed were either positive (seeded with Legionella), negative, or “variable.” Variable samples were either seeded with low levels of Legionella or contained high levels of competing bacteria in addition to Legionella.
The study uncovered two key findings. First, CDC ELITE laboratories A using spread-plate culture methods incorrectly identified 37% of variable samples as negative. This is a significant rate of false negatives, especially considering these variable samples approximate real-world samples. Practically, this data suggests that monitoring facilities or cooling towers with spread-plate culture methods may provide a false sense of security and inaccurately characterize risk.
The second key finding was that when laboratories identified samples as positive, they underestimated
14 the ANALYST Volume 30 Number 2 How Can Water Treaters Benefit From Recent Peer-Reviewed Data on Legionella Testing Methods? continued
“Despite this important role of protecting public health, water treaters consistently contend with incomplete and unclear guidance on how to best manage Legionella risk and control Legionella growth.”
the amount of Legionella in positive samples by over ten-fold, or 1.25 logs, with more than a thousand-fold variability, or 3.57 logs. This level of inaccuracy once again highlights that monitoring with spread-plate culture methods can underestimate true Legionella risk. It is also important to highlight the implications of such a high level of variability. If results can be so variable, it becomes more obvious why no federal agency or standards organization is willing to provide concrete guidance based on those results.
The CDC study evaluated the different factors that could have led to such a high rate of false negatives and such extreme variability in results. The researchers evaluated sampling protocol, treatment, incubation, and experience level as possible factors influencing accuracy and consistency. Ultimately, the CDC found that none of these factors explained the inaccuracy and inconsistency seen in results, and that “the observed variability in enumeration by both U.S. and E.U. laboratories is probably due to the inherent inconsistency in assessing a sample by culture techniques.” In this case the researchers refer specifically to BCYE spread-plate culture methods.
The findings in the 2011 CDC study are corroborated by other studies. Boulanger and Edelstein (8) found that spread-plate methods recovered a maximum of 53% of Legionella, and Díaz-Flores et. al. (9) found that 20% of samples evaluated by spread-plate culture were inconclusive, “making effective risk management impossible.” A smaller study of inter-lab variability by Freije (5) demonstrated between 120% and 145% variability in results between different laboratories, with 22% of samples categorized as over 10 colony forming units per milliliter (CFU/mL) by one lab and under 10 CFU/mL by another.
This poor method performance and the resulting difficulty in interpreting testing results can have a real impact on water treaters. Meaningful risk to customers and water treaters alike can go unaccounted for, and Legionella remediation can be stymied by poor or inconsistent results. Given these consequences, water treaters may rightly ask, “could improved methods lead to more clarity when interpreting Legionella results?”
Several new methods for the detection of Legionella have been introduced, promising to address certain
challenges associated with traditional BCYE spreadplate culture testing methods. To understand the impact these technologies could have, discerning water treaters will look to peer-reviewed literature to understand the performance of these new methods. While the discussion below is not an exhaustive review of all new Legionella methods, it summarizes research on key technologies that have been extensively studied and referenced in Legionella guidance, including ASHRAE Guideline 12B (10).
Legionella Detection by PCR
One technology that has been extensively proposed as a potential way to improve environmental sampling of Legionella is molecular detection or polymerase chain reaction (PCR) technology. PCR tests isolate and replicate specific sequences of DNA. Tests can be designed to detect Legionella species, Legionella pneumophila , and/or L. pneumophila SG1, and measuring the replication process provides a relative measurement of the amount of DNA in the original sample. A key advantage of the test is that it can be performed in a matter of hours vs. the days required to culture Legionella.
Because PCR has been so extensively proposed as a Legionella test, an exhaustive literature review is beyond the scope of this article. However, several studies have demonstrated that PCR has a high negative predictive value for Legionella (11-14), meaning that samples that are negative by PCR are highly likely to be negative by culture. Certain studies have demonstrated 100% negative predictive value, meaning that all samples negative by PCR analysis were also negative by culture (11), but others did not reach that mark (12), and the figure has varied by water type, reaching as low as 70% for potable water in one study (13). However, in general, using PCR as a negative screen and confirming any positives with a culture test appears to be an accepted practice. It is recommended by the CDC (4), and successfully used by the New York Department of Health (15).
PCR is often recommended for use in conjunction with culture testing and not as a standalone test. A key reason is that PCR routinely returns more positive results than a culture. In a review of 28 studies, Whiley et al. (16) found that 72% of PCR results were positive for
15 the ANALYST Volume 30 Number 2 How Can Water Treaters Benefit From Recent Peer-Reviewed Data on Legionella Testing Methods? continued
Legionella , while only 34% were positive by culture. In an especially stark example, drinking water samples in New York City were tested by both PCR and liquid culture. Eighty-five percent of those samples were positive for Legionella by PCR, but only 2.8% were positive by culture (17). Several studies have acknowledged that one factor in increased PCR positivity is that the technology detects DNA from dead and non-viable Legionella cells. A culture confirmation is recommended in order to discern whether a positive result represents viable Legionella that may pose a health risk, or dead Legionella that has been successfully remediated.
Researchers have been working to overcome this obstacle for several years. They have focused on eliminating positive results due to non-viable Legionella with two compounds: propidium monoazide (PMA) and ethidium monoazide (EMA). In brief, both substances penetrate the membranes of dead cells, but not living cells. PMA and EMA then bond with the DNA in those cells when exposed to light. DNA that bonds with PMA or EMA will not provide a positive PCR result, so PCR combined with a PMA or EMA treatment has been evaluated to measure only viable Legionella. These compounds have been extensively evaluated for this purpose, with studies dating back to at least 2006 (18).
Unfortunately, a review of these studies does not lead to a definitive conclusion. Using PMA and EMA to eliminate DNA from non-viable Legionella from a sample assumes that viability correlates with whether the membranes of the cell can be penetrated by these compounds, but this has not been well studied. Certain studies have suggested that EMA can penetrate some cells with intact membranes, and that only PMA should be used for determining viability (19). Another study, however, found that EMA provided better results for Legionella specifically (20).
Both substances require a light source to bond to DNA, but high levels of suspended solids or other biomass could keep light from reaching the entire sample (19). This may be a possible explanation for a study that found that EMA reduced the number of Legionella positives in bathing water, but not in cooling tower water (21), which is notoriously dirtier and more turbid. Other studies did not find significant differences between detection of untreated and heat-treated samples when using PMA,
suggesting the compound may not be able to completely discriminate between live and dead bacteria (22). In general, the field has not yet aligned on the use of PMA or EMA for detecting viable Legionella ; even studies that returned impressive results still advocate that PCR should be confirmed with culture (20). Whether EMA and PMA can be used with PCR to detect only viable Legionella appears to require additional research.
This lack of definitive data is highlighted by the Veteran Health Administration’s (VHA) decision to allow PCR for use only as a negative screen. As stated in VHA Directive 1061 (23):
If a water is negative by PCR, then further processing of that sample by culture is not required and the sample can be considered “negative for Legionella detection”… For samples that are Legionella-positive by PCR, the following requirements apply: The PCR-positive water sample must be processed by a culture method (in accordance with laboratory selection criteria) to confirm living Legionella are in the sample. While some PCR tests claim ability to differentiate between living and dead Legionella , such designations are not sufficiently reliable and use of the PCR result to determine that the Legionella are living is not permitted.
Other aspects of PCR tests for Legionella that require more study are the impacts of inhibition on test results. PCR reactions may be adversely affected by substances in a Legionella sample, and PCR studies have detected measurable inhibition in up to 46% of samples (12).
Additionally, PCR provides a result in genomic units (GU). While several studies have tried to correlate GUs to CFU action limits, cutoff values have varied by matrix and laboratory (13, 24, 25), making uniform guidance impossible.
Despite these challenges, it is well acknowledged that PCR testing can greatly simplify and accelerate Legionella testing when used as a negative screen, as described above. Additionally, there is at least one ongoing study on whether different compounds can enhance PCR to only detect viable Legionella , and water treaters should review any future research with an eye towards how PCR could impact the field of Legionella testing.
16 the ANALYST Volume 30 Number 2 How Can Water Treaters Benefit From Recent Peer-Reviewed Data on Legionella Testing Methods? continued
Legionella Detection by Liquid Culture
Another method that has been introduced for Legionella detection is liquid culture, also referred to as the most probable number (MPN) method or the bacterial enzyme method. In this method, the sample is combined with a reagent containing nutrients to promote L. pneumophila growth, selective agents to suppress growth of non-Legionella organisms, and a substrate. Actively growing strains of L. pneumophila use this substrate to produce a brown color indicator that signals a positive result.
This greatly simplifies testing when compared to traditional BCYE spread plate methods. In brief, BCYE spread plate methods require the analyst to use his or her judgement to choose from several sample treatments, from filtration, to acid and heat treatments, which may reduce Legionella recovery. The output from these treatments are then plated on solid media, and again the analyst must choose between different formulations. Suspected Legionella colonies are then confirmed via streaking on additional solid media. Liquid culture testing maintains the benefits of culture testing, but significantly simplifies the process by culturing bacteria in a liquid medium, as described above.
In order to provide a quantitative result, the liquid culture test is performed by pouring the mixed reagent and sample into an incubation tray with 96 wells. The wells are physically separated from each other so that each well contains a separate reaction. Positive wells are used to estimate the number of viable bacteria in a sample: an MPN result. MPN results are equivalent to results in CFUs (26). Tests based on MPN results are used around the world and are accepted by regulators in over 50 countries. As of the writing of this paper, there is only one commercially available liquid culture test for L. pneumophila: the Legiolert test.
Liquid culture has been extensively compared to traditional methods for Legionella detection in peerreviewed literature. To date, there have been 11 studies
that directly compare the performance of traditional methods to the liquid culture method in environmental samples (27-37). While the specific method compared varies slightly across these studies, all compared methods were based on BCYE spread-plate procedures, including the protocol sometimes referred to as the CDC Method (although the CDC does not endorse any specific method). The most frequently compared method was ISO 11731. ISO 11731 is likely the most common BCYE method used worldwide and is stipulated for use in several global regulations and in the state of New York.
Each of these studies evaluated liquid culture against the BCYE method in real-world, routine environmental samples, eliminating any bias or impact associated with laboratory-grown Legionella , which often behave very differently than Legionella that grow “in the wild.” In total, the studies evaluated 2,085 samples across seven countries in North America, Europe, and Asia. A total of 20 labs participated across studies and included researchers from the U.S. Environmental Protection Agency (EPA), the Italian Ministry of Public Health, and major Legionella testing labs in the U.S., including EMSL. The studies were published in 10 different scientific journals with an average impact factor of 3, generally meaning they are well-respected publications. Four of the studies applied the rigorous criteria set out in ISO 17994: Requirements for the comparison of the relative recovery of microorganisms by two quantitative methods (38).
The primary finding of nearly all studies was that liquid culture is a more sensitive and accurate method for detecting L. pneumophila than BCYE methods, including ISO 11731. Ten of the 11 studies ran statistical analyses to determine whether the liquid culture method was statistically more sensitive than traditional methods. Nine of those ten studies found liquid culture approaches to be more sensitive in at least one type of water or with at least one statistical test.
All studies found that the liquid culture method had at least equivalent sensitivity to BCYE methods across all water types and statistical tests, and none of these
17 the ANALYST Volume 30 Number 2 How Can Water Treaters Benefit From Recent Peer-Reviewed Data on Legionella Testing Methods? continued
“Another method that has been introduced for Legionella detection is liquid culture, also referred to as the most probable number (MPN) method or the bacterial enzyme method.”
studies found BCYE methods to be more sensitive. While a complete meta-analysis of these studies is beyond the scope of this article, the liquid culture approach identified 1,083 positive samples in the studies where this data was made available, while traditional methods only identified 918. In multiple studies, the liquid culture method identified certain samples that were above relevant action limits, when the traditional method returned a negative result. These examples represent instances where monitoring with traditional methods would have left building occupants at risk and where liquid culture appropriately identified that risk. When taken together, the studies demonstrate that liquid culture is a more sensitive and accurate test for L. pneumophila than traditional, BCYE-based methods.
Several studies provided possible explanations of why liquid culture may provide a more accurate result than traditional BCYE methods. Many researchers have identified interference from non-Legionella organisms as a key challenge in reading BCYE plates, especially in non-potable samples. Because liquid culture isolates each individual reaction, interference is minimized, and counts are more accurate. Researchers from the EPA analyzed 15 samples where L. pneumophila could not be identified due to overgrowth of non-Legionella bacteria on BCYE plates. Liquid culture found high concentrations of L. pneumophila in those same samples. This is important as it indicates that there can be serious Legionella risk that is missed when plates are overgrown with non-Legionella organisms, a relatively common occurrence.
The studies also highlighted that many of the treatments involved with BCYE methods that aim to minimize the growth of non-Legionella bacteria also likely reduce overall Legionella counts. And finally, the studies point out that because Legionella is a waterborne bacteria, it may grow better in a liquid medium than it does on solid agar plates, as has been found with certain other bacteria (39, 40). The exact mechanisms of improved sensitivity and accuracy have not been adequately studied, but the above explanations for the improved performance of liquid culture are certainly logical given what is currently known about Legionella and the two test methods.
Seven of the studies referenced in this article provided measurements of the specificity of the liquid culture method for L. pneumophila —in other words, whether
or not the method produces false positives. All studies found that the liquid culture method had acceptable specificity, between 96% and 100% (27-29, 33-35, 37) All microbiological methods produce some level of false positives, including BCYE-based methods (41). Despite this fact, all study authors suggested that liquid culture is sufficiently specific for the purposes of Legionella detection. As stated by researchers from the EPA, “In the present study, there was no evidence of interference by non-target microorganisms when using the [liquid culture] method” (28).
Another peer-reviewed paper also attempts to add to the body of knowledge on the specificity of liquid culture, authored by researchers from Special Pathogens Laboratory (42). In this study, sterile water was inoculated with laboratory-cultured pathogens at various concentrations and tested by liquid culture. Some of these tests resulted in false-positive results. Unfortunately, this study has little relevance for water treaters or water management team decision-makers, as laboratorycultured pathogens in sterile water are well recognized to behave differently than pathogens in environmental samples collected from building plumbing, cooling towers, and other relevant sources. There is a large body of peer-reviewed literature that demonstrates a low false-positive rate in liquid culture in environmental samples (27-29, 33-35, 37), which is significantly more relevant than limited experiments in sterile water. The paper also conflicts with other studies- for example, the NF Validation performed by the Association Française de Normalisation (AFNOR) found no cross-reactivity of one of the pathogens included in the study by Hirsch et. al., despite the bacteria being present at higher levels (43).
As detailed previously, consistency in results is at least as critical as accuracy when water treaters interpret Legionella results. Unfortunately, standard practices for comparing two methods, especially by ISO 17994, focus primarily on sensitivity and specificity, and not consistency. There is therefore limited peer-reviewed data on whether the liquid culture method provides more consistent results than traditional spread-plate methods. The liquid culture method does, however, eliminate many of the sources of variability in BCYE methods. Concentration, pretreatment(s), media formulation, and subjectivity in results interpretation all have the potential to be significant sources of variation in BCYE
18 the ANALYST Volume 30 Number 2 How Can Water Treaters Benefit From Recent Peer-Reviewed Data on Legionella Testing Methods? continued
methods. Liquid culture eliminates all those sources of variability with one set procedure for potable water and one for non-potable water, combined with objective results interpretation. Indeed, liquid culture achieved the best possible measure of repeatability in its ISO 13843 validation report. While further study could provide additional insights, it is highly likely that liquid culture provides significantly more consistent results than traditional BCYE methods.
Finally, two of the studies of liquid culture evaluated the test against traditional ISO methods not only for the detection of L. pneumophila , but also for the detection of Legionella species. The liquid culture test is specific to L. pneumophila, the primary pathogen that causes Legionnaires’ disease and does not detect non-pneumophila species. Despite this fact, two studies found liquid culture to be statistically equivalent to ISO 11731 for the detection of all Legionella species (29, 37). These findings demonstrate that liquid culture is so superior for the detection of L. pneumophila that it maintains equivalence with traditional methods even when non-pneumophila positives are included in the positive count of the traditional methods.
A detailed discussion of the importance/non-importance of detecting non-pneumophila Legionella species is beyond the scope of this article but has been covered in various publications (44-46). Monitoring exclusively for L. pneumophila has been accepted by public health officials in at least 4 countries, however, this continues to be a topic of debate in many others. As outlined by researchers from the Ministry of Public Health in Italy, “routinely monitoring only for the most pathogenic species of a bacteria is already an established practice. For example, Pseudomonas aeruginosa is routinely monitored, rather than all species of Pseudomonas ” (22).
It is important to note that the liquid culture method’s improvements in sensitivity, accuracy and consistency come with all the standard benefits of any culture test. As discussed above, MPN and CFU results are interchangeable, and an MPN result can be directly evaluated against an action limit in CFUs. Additionally, the liquid culture method produces in a viable isolate that can be saved and further tested for serotype or genetic sequence, immediately or in the future. This further testing can be critical in identifying whether a
cooling tower, building, or other water feature was or was not the source of an outbreak or infection. The New York Department of Health specifically identified the liquid culture method as “essential” for the isolation of clinically relevant strains (15)), and liquid culture has been shown to have improved performance for obtaining isolates in outbreak investigation (47).
Closing Thoughts
As demonstrated here, an in-depth review of peerreviewed literature can provide a wealth of insights and can deepen a water treater’s knowledge of microbial methods and Legionella in general. Even more important, water treaters can act on these insights to improve service to their customers, and therefore better protect public health. Two primary insights from the above research are:
1. PCR can provide an effective negative screen.
2. Liquid culture provides more accurate and consistent results than traditional BCYE-based methods of Legionella detection.
Knowing that PCR testing can provide a rapid negative screen allows water treaters to work together with their laboratory partners to quickly rule out Legionella risk, in the case of a negative result. PCR testing can also be used after a Legionella remediation to evaluate whether it was successful, potentially allowing a customer to reopen a building sooner than would otherwise be possible. Positive results can be confirmed with a culture test prior to taking any additional actions. In general, using PCR as a negative screen can deliver more immediate peace of mind to a water treater’s customers and can quickly rule out risk.
Knowing that liquid culture provides more accurate and consistent results than BCYE-based Legionella detection methods such ISO 11731 also has important implications. Water treaters that work with their laboratory partners to monitor Legionella risk in their customers’ facilities with liquid culture are more likely to avoid the false negative results associated with traditional spread-plate methods, and therefore more likely to provide an accurate characterization of risk. In the case of a retest or multiple rounds of testing associated with a remediation, liquid culture can eliminate the variability associated with spread-plate testing, providing more insight into what is happening within water systems, and more confidence in results.
19 the ANALYST Volume 30 Number 2 How Can Water Treaters Benefit From Recent Peer-Reviewed Data on Legionella Testing Methods? continued
Additionally, using a liquid culture method to detect and quantify Legionella risk can eliminate one of the important causes of incomplete guidance around interpreting Legionella test results. In the long term, this should ultimately lead to improved guidance from experts and governmental organizations. For example, increased confidence that a negative result is a true negative could enable more reliance on that result as a measure of risk. Lower variability in results could allow water treaters to interpret any increase in Legionella concentrations as a true indication of increased risk, and not just an anomaly created by method variability. Updating guidance, however, is usually a long process and water treaters that understand the most recent research can benefit from these findings well in advance of adjustments to guidance.
Despite their critical role in protecting public health, water treaters routinely contend with incomplete or confusing Legionella guidance. This is due to several gaps in the science of when and how Legionella infections occur, as well as the use of highly variable and inaccurate BCYE test methods. Researchers are constantly advancing the state of knowledge around Legionella and Legionnaires’ disease. At the same time, water treaters now have less variable, more accurate methods at their disposal, and water treaters can look to peer-reviewed literature for insights on how those new methods can enable better Legionella risk management. Those who act on those insights will provide better service, and ultimately better protect their customers and the public.
References
1. Collier, S. A.; Deng, L.; Adam, E.A.; Benedict, K.M.; Beshearse, E.M.; Blackstock, A.J.; Bruce, B.B.; Derado, G.; Edens, C.; Fullerton, K.E.; Gargano, J.W.; Geissler, A.L.; Hall, A.J.; Havelaar, A.H.; Hill, V.R.; Hoekstra, R.M.; Reddy, S.C.; Scallan, E.; Stokes, E.K.; Yoder, J.S.; Beach, M.J. (2021). “Estimate of Burden and Direct Healthcare Cost of Infectious Waterborne Diseases in the United States.” Emerging Infectious Diseases 27(1), pp. 140-149, accessible at doi.org/10.3201/eid2701.190676.
2. National Academies of Sciences, Engineering, and Medicine (NASEM) (2020). Management of Legionella in Water Systems, The National Academies Press, Washington, D.C., accessible at doi.org/10.17226/25474
3. Association of Water Technologies (2019). Legionella 2019: A Position Statement and Guidance Document, AWT, Rockville, Maryland, available from www.awt.org/pub/?id=035C2942-03BE-3BFF-08C3-4C686FB7395C
4. Centers for Disease Control and Prevention (January 13, 2021). ”Toolkit for Controlling Legionella in Common Sources of Exposure, ”CDC, January 13, 2021, available from www.cdc.gov/legionella/downloads/Control-Toolkit-All-Modules.pdf
5. Freije, M. (2017). ”Interpreting Legionella Test Results: Case Studies Illustrating Key Criteria,” the Fall Analyst Technology Supplement.
6. U.S. Environmental Protection Agency (2016). “Technologies for Legionella Control in Premise Plumbing Systems: Scientific Literature Review,” U.S. EPA, Washington, D.C., available from www.epa.gov/ground-water-and-drinking-water/technologies-legionella-control-premise-plumbing-systems
7. Lucas, C.E.; Taylor, T.H., Jr.; Fields, B.S. (2011). “Accuracy and Precision of Legionella Isolation by U.S. Laboratories in the ELITE Program Pilot Study,” Water Research 45(15), pp. 4428-4436, accessible at doi.org/10.1016/j.watres.2011.05.030
8. Boulanger, C. A.; Edelstein, P. H. (1995). Precision and accuracy of recovery of Legionella pneumophila from seeded tap water by filtration and centrifugation. Applied and Environmental Microbiology 61(5), pp. 1805–1809, accesible at .
9. Díaz-Flores, Á.; Montero, J.C.; Castro, F.J.; Alejandres, E.M.; Bayón, C.; Solís, I.; Fernández-Lafuente, R.; Rodríguez, G. (2015). “Comparing Methods of Determining Legionella spp. in Complex Water Matrices,” BMC Microbiology, 15, 91, accessible at doi.org/10.1186/s12866-015-0423-7.
10. The American Society of Heating, Refrigerating and Air-Conditioning Engineers (ASHRAE) (2020). GUIDELINE 12-2020 — Managing the Risk of Legionellosis Associated with Building Water Systems., available from www.techstreet.com/ashrae/standards/guideline-12-2020-managing-the-risk-of-legionellosis-associated-with-building-water-systems?product_id=2111422#jumps.
11. Collins, S.; Jorgensen, F.; Willis, C.; Walker, J. (2015). “Real-Time PCR to Supplement Gold-Standard Culture-Based Detection of Legionella in Environmental Samples,” Journal of Applied Microbiology, 119, pp.1158-1169, accessible at doi.org/10.1111/jam.12911
12. Guillemet, T.; Lévesque, B.; Gauvin, D.; Brousseau, N., Giroux, J.-P.; Cantin, P. (2010). ”Assessment of Real-Time PCR for Quantification of Legionella spp. in spa Water,” Letters in Applied Microbiology, 51, pp. 639-644, accessible at doi.org/10.1111/j.1472-765X.2010.02947.
13. Lee, J.V.; Lai, S.; Exner, M.; Lenz, J.; Gaia, V.; Casati, S.; Hartemann, P.; Lück, C.; Pangon, B.; Ricci, M. L.; Scaturro, M.; Fontana, S.; Sabria, M.; Sánchez, I.; Assaf, S.; Surman-L.S. (2011). “An International Trial of Quantitative PCR for Monitoring Legionella in Artificial Water Systems,” Journal of Applied Microbiology 110(4), pp. 1032-1044, accessible at doi.org/10.1111/j.1365. 2672.2011.04957.
14. Yaradou, D.F.; Hallier-Soulier, S.; Moreau, S.; Poty, F.; Hillion, Y.; Reyrolle, M.; André, J.; Festoc, G.; Delabre, K.; Vandenesch, F.; Etienne, J. Jarraud, S. (2007). “Integrated Real-Time PCR for Detection and Monitoring of Legionella pneumophila in Water Systems,” Applied and Environmental Microbiology 73(5), pp. 1452-1456, accessible at doi.org/10.1128/AEM.02399-06.
15. Wroblewski, D.; Saylors, A.; Haas, W.; Cummings, K.; Cukrovany, A.; Connors, J.; Thompson, L.; Dickinson, M.; Baker, D.; Morse, M.; Smith, G.; Dziewulski, D.; Zartarian, M.; Savage, B.; Gowie, D.; Musser, K.; Mingle, L. (2022). “The Use of Culture, Molecular Methods and Whole Genome Sequencing to Detect the Source of an Outbreak of Legionnaire’s Disease in New York State,” International Journal of Infectious Diseases, 116, pp. S96-S97, accessible at doi.org/10.1016/j.ijid.2021.12.227.
16. Whiley, H.; Taylor, M. (2016).”Legionella Detection by Culture and qPCR: Comparing Apples and Oranges,” Critical Reviews in Microbiology 42(1), pp. 65-74, accessible at doi.org/10.3109/1040841X.2014.885930.
17. Omoregie, E.; Szczerba, A.; Novak, J.; Rubinstein, I.; Chuang, Y.; Wu, J.; Wang, J.; Kretz, C.; Hughes, S.; Capetanakis, A.; Freud, S.; Rakeman, J.L. (2022). “Legionella Monitoring in the New York City Water Distribution System 2017 to 2019,” AWWA Water Science, e1272, accessible at doi.org/10.1002/aws2.1272.
18. Hein, I.; Flekna, G.; Wagner, M.; Nocker, A.; Camper, A.K. (2006). “Possible Errors in the Interpretation of Ethidium Bromide and PicoGreen DNA Staining Results from Ethidium Monoazide-Treated DNA,” Applied and Environmental Microbiology 72(10), pp. 6860–6862, accessible at doi.org/10.1128/AEM.01243-06.
19. Fittipaldi, M.; Codony, F.; Adrados, B.; Camper, A.K.; Morató, J. (2011). “Viable Real-Time PCR in Environmental Samples: Can all Data be Interpreted Directly?” Microbial Ecology 61(1), pp. 7–12, accessible at doi.org/10.1007/ s00248-010-9719-1
20. Chen, N.-T.; Chang, C.-W. (2010), “Rapid Quantification of Viable Legionellae in Water and Biofilm Using Ethidium Monoazide Coupled with Real-Time Quantitative PCR,” Journal of Applied Microbiology, 109, pp. 623-634, accessible at doi.org/10.1111/j.1365-2672.2010.04678.x.
21. Inoue, H.; Takama, T.; Yoshizaki, M.; Agata, K. (2015). “Detection of Legionella species in Environmental Water by the Quantitative PCR Method in Combination with Ethidium Monoazide Treatment,” Biocontrol Science 20(1), pp. 71-74, doi.org/10.4265/bio.20.71.
22. Scaturro, M.; Fontana, S.; Dell’eva, I.; Helfer, F.; Marchio, M.; Stefanetti, M.V.; Cavallaro, M.; Miglietta, M.; Montagna, M.T.; De Giglio, O.; Cuna, T.; Chetti, L.; Sabattini, M.; Carlotti, M.; Viggiani, M.; Stenico, A.; Romanin, E.; Bonanni, E.; Ottaviano, C.; Franzin, L.; Ricci, M.L. (2016). “A Multicenter Study of Viable PCR Using Propidium Monoazide to Detect Legionella in Water Samples,” Diagnostic Microbiology and Infectious Disease 85(3), pp. 283–288, accessible at doi.org/10.1016/j.diagmicrobio.2016.04.009.
23. Veterans Health Administration (2021). VHA Directive 1061: “Prevention of Health Care-Associated Legionella Disease and Scald Injury from Water Systems,” Washington, D.C., available from www.va.gov/vhapublications/ViewPublication.asp?pub_ID=9181
24. Joly, P.; Falconnet, P.A.; André, J.; Weill, N.; Reyrolle, M.; Vandenesch, F.; Maurin, M.; Etienne, J.; Jarraud, S. (2006). “Quantitative Real-Time Legionella PCR for Environmental Water Samples: Data Interpretation,” Applied and Environmental Microbiology 72(4), pp. 2801–2808.
20 the ANALYST Volume 30 Number 2 How Can Water Treaters Benefit From Recent Peer-Reviewed Data on Legionella Testing Methods? continued
25. Delgado-Viscogliosi, P.; Solignac, L.; Delattre, J.M. (2009). “Viability PCR, a Culture-Independent Method for Rapid and Selective Quantification of Viable Legionella pneumophila Cells in Environmental Water Samples,” Applied and Environmental Microbiology, 75, pp. 3502-3512, accessible at doi.org/10.1128/AEM.02878-08.
26. International Organization for Standardization (2021). ISO 6107:2021: “Water Quality – Vocabulary,” available from www.iso.org/standard/67643.html.
27. Barrette, I. (2019). “Comparison of Legiolert and a Conventional Culture Method for Detection of Legionella pneumophila from Cooling Towers in Québec,” Journal of AOAC INTERNATIONAL 102(4), pp. 1235-1240, accessible at doi.org/10.5740/jaoacint.18-0245.
28. Boczek, L.A.; Tang, M.; Formal, C.; Lytle, D. Ryu, H. (2021). “Comparison of Two Culture Methods for the Enumeration of Legionella pneumophila from Potable Water Samples,” Journal of Water Health 19(3), pp. 468–477, accessible at doi.org/10.2166/wh.2021.051.
29. Checa, J.; Carbonell, I.; Manero, N.; Marti, I. (2021). “Comparative Study of Legiolert with ISO 11731-1998 Standard Method-Conclusions from a Public Health Laboratory,” Journal of Microbiological Methods, p. 186, accessible at doi.org/10.1016/j.mimet.2021.106242.
30. Inoue, H.; Baba, M.; Tayama, S. (2020). “Evaluation of Legiolert for Quantification of Legionella pneumophila from Bath Water Samples,” Biocontrol Science 25(3), pp. 179-182, doi.org/10.4265/bio.25.179.
31. McCuin, R.M.; Bartrand, T.A.; Clancy, J.L. (2021). “Legionella pneumophila Recovery Using Legiolert and a Traditional Culture Method,” AWWA Water Science, e1228, accessible at doi.org/10.1002/aws2.1228.
32. Monteiro, S.N.; Robalo, A.M.; Santos, R.J. (2021). “Evaluation of Legiolert™ for the Detection of Legionella pneumophila and Comparison with Spread-Plate Culture and qPCR Methods,” Current Microbiology, 78, pp. 1792–1797, accessible at doi.org/10.1007/s00284-021-02436-6.
33. Petrisek, R.; Hall, J. (2018). “Evaluation of a Most Probable Number Method for the Enumeration of Legionella pneumophila from North American Potable and Non-Potable Water Samples,” Journal of Water and Health 16(1), pp. 25-33, doi.org/10.2166/wh.2017.118.
34. Rech, M.M.; Swalla, B.M.; Dobranic, J.K. (2018). “Evaluation of Legiolert for Quantification of Legionella pneumophila from Non-Potable Water,” Current Microbiology, 75, pp. 1282-1289, accessible at doi.org/10.1007/s00284-018-1522-0.
35. Sartory, D.; Spies, K.; Lange, B.; Schneider, S.; Langer, B. (2017). “Evaluation of a Most Probable Number Method for the Enumeration of Legionella pneumophila from Potable and Related Water Samples,” Letters in Applied Microbiology, 64, pp. 271-275, accessible at doi.org/10.1111/lam.12719.
36. Scaturro, M.; Buffoni, M.; Girolamo, A.; Cristino, S.; Girolamini, L.; Mazzotta, M.; Sabattini, M.A.; Zaccaro, C.; Chetti, L.; Laboratory, M.A.; Bella, A.; Rota, M.C.; Ricci, M.L. (2020). “Performance of Legiolert Test Versus ISO 11731 to Confirm Legionella pneumophila Contamination in Potable Water Samples,” Pathogens, 9, accessible at doi.org/10.3390/pathogens9090690.
37. Spies, K.; Pleischl, S.; Lange, B.; Langer, B.; Hübner, I.; Jurzik, L.; Luden, K.; Exner, M. (2018). “Comparison of the Legiolert™/Quanti-Tray® MPN test for the Enumeration of Legionella pneumophila from Potable Water Samples with the German Regulatory Requirement Methods ISO 11731-2 and ISO 11731,” International Journal of Hygiene and Environmental Health 221(7), pp. 1047-1053, accessible at doi.org/10.1016/j.ijheh.2018.07.006.
38. International Organization for Standardization (2014). ISO 17994: “2014 Water Quality Requirements for the Comparison of the Relative Recovery of Microorganisms by Two Quantitative Methods,” available from www.iso.org/standard/56617.html.
39. Ahn, Y.; Kim, J.M.; Ahn, H.; Lee, Y.; Li Puma, J.J.; Hussong, D.; Cerniglia, C. E. (2014). “Evaluation of Liquid and Solid Culture Media for the Recovery and Enrichment of Burkholderia cenocepacia from Distilled Water,” Journal of Industrial Microbiology and Biotechnology 41(7), pp. 1109–1118, accessible at doi.org/10.1007/s10295-014-1442-3.
40. Nosho, K.; Yasuhara, K.; Ikehara, Y.; Mii, T.; Ishige, T.; Yajima, S.; Hidaka, M.; Ogawa, T.; Masaki, H. (2018). “Isolation of Colonization-Defective Escherichia coli Mutants Reveals Critical Requirement for Fatty Acids in Bacterial Colony Formation,” Microbiology, 164, pp. 1122-1132.
41. 41. Borges, A.; Simões M.; Martínez-Murcia, A.; Saavedra M. J. (2012) “Detection of Legionella spp. in Natural and Man-made Water Systems Using Standard Guidelines,” Journal of Microbiology Research 2(4), pp. 95-102.
42. 42. Hirsh, M., Baron, J. L., Mietzner, S., Rihs, J. D., & Stout, J. E. (2021). Cross-reactivity of the IDEXX Legiolert method with other Gram-negative bacteria and waterborne pathogens leads to false-positive assay results. Letters in applied microbiology, 72(6), pp. 750–756, accessible at doi.org/10.1111/lam.13469.
43. Association Française de Normalisation (AFNOR) (2019). “The Method Legiolert/Quanti-Tray* Legiolert for Water Analysis Is Granted NF Validation by AFNOR Certification as an Alternative Method to the Standards ISO 11731 and NF T90-431 for Enumeration of Legionella pneumophila in Drinking Water and Industrial Water, Under the Certificate number: IDX 33/06-06/19, available from nf-validation.afnor.org/wp-content/uploads/2019/09/Synt-33-06-06-19_en.pdf.
44. Walker, J.T.; McDermott, P.J. (2021). “Confirming the Presence of Legionella pneumophila in Your Water System: A Review of Current Legionella Testing Methods,” Journal of AOAC INTERNATIONAL 104(4), pp. 1135–1147, accessible at doi.org/10.1093/jaoacint/qsab003.
45. Roka, E.; Vargha, M. (2020). “Expert Opinion on the Equivalence of Legiolert as an Alternative Method for the Analysis of Water,” Expert Opinion Report No: 22331-1, National Public Health Centre, Hungary.
46. van der Wielen, P.; Wierenga, W.; Oesterholt, F.; Oostdijk, A.; van der Werff, A. (2021). “Met recht naar een doeltreffender legionellapreventie. KWR and Berenschot,” (With right to a more effective legionella prevention. KWR and Berenschot), available from open.overheid.nl/repository/ronl-d2695abf-d88e-4e42-ad99-31d38403cdb9/1/pdf/ bijlage-1-rapport-met-recht-naar-een-doeltreffende-legionellapreventie.pdf.
47. Matthews, S., Trigui, H., Grimard-Conea, M., Vallarino Reyes, E., Villiard, G., Charron, D., Bédard, E., Faucher, S., & Prevost, M. (2022). Detection of Diverse Sequence Types of Legionella pneumophila by Legiolert Enzymatic-Based Assay and the Development of a Long-Term Storage Protocol. Microbiology spectrum, 10(6), e0211822, accessible at doi.org/10.1128/spectrum.02118-22.
Endnotes
A. ACDC ELITE Program: This program allows laboratories to test their Legionella isolation techniques against a set of standardized samples. The CDC ELITE Program identifies laboratories that are able to isolate (grow and identify) Legionella from a water sample using a traditional BCYE culture method. Earning an ELITE Certificate does not guarantee that at other times a laboratory will be able to isolate Legionellae from every sample in which they are present, because the ability to find Legionella in a sample can be affected by the quality of the sample the laboratory receives.
B. Other environmental testing methods may be an appropriate component to a Water Treater’s testing plan but have not been extensively covered in peer-reviewed literature. For example, lateral flow technology may provide a very fast presence absence result as an on-site test but has not been extensively studied by the field.
C. As of the writing of this article, there is only one commercially available liquid culture test for L. pneumophila: the Legiolert test, which is available from IDEXX Laboratories, Inc. (Westbrook, ME).
Jeff Bates is the strategic marketing manager for Premise Water at IDEXX. In his role, he is responsible for promoting testing for waterborne pathogens in premise plumbing systems globally and the IDEXX culture tests Legiolert and Pseudalert. He holds a bachelor’s degree in environmental studies from Middlebury College and received his MBA from the Darden School of Business at the University of Virginia. Mr. Bates can be contacted at Jeff-Bates@idexx.com
Keywords: CDC, COOLING WATER, LEGIONELLA, MONITORING, REGULATIONS

21 the ANALYST Volume 30 Number 2
Can Water Treaters Benefit From Recent Peer-Reviewed Data on
continued
How
Legionella Testing Methods?
This paper was presented at the AWT’s 2022 Conference, which was conducted Sept. 21-24, 2022, in Vancouver, B.C., Canada.
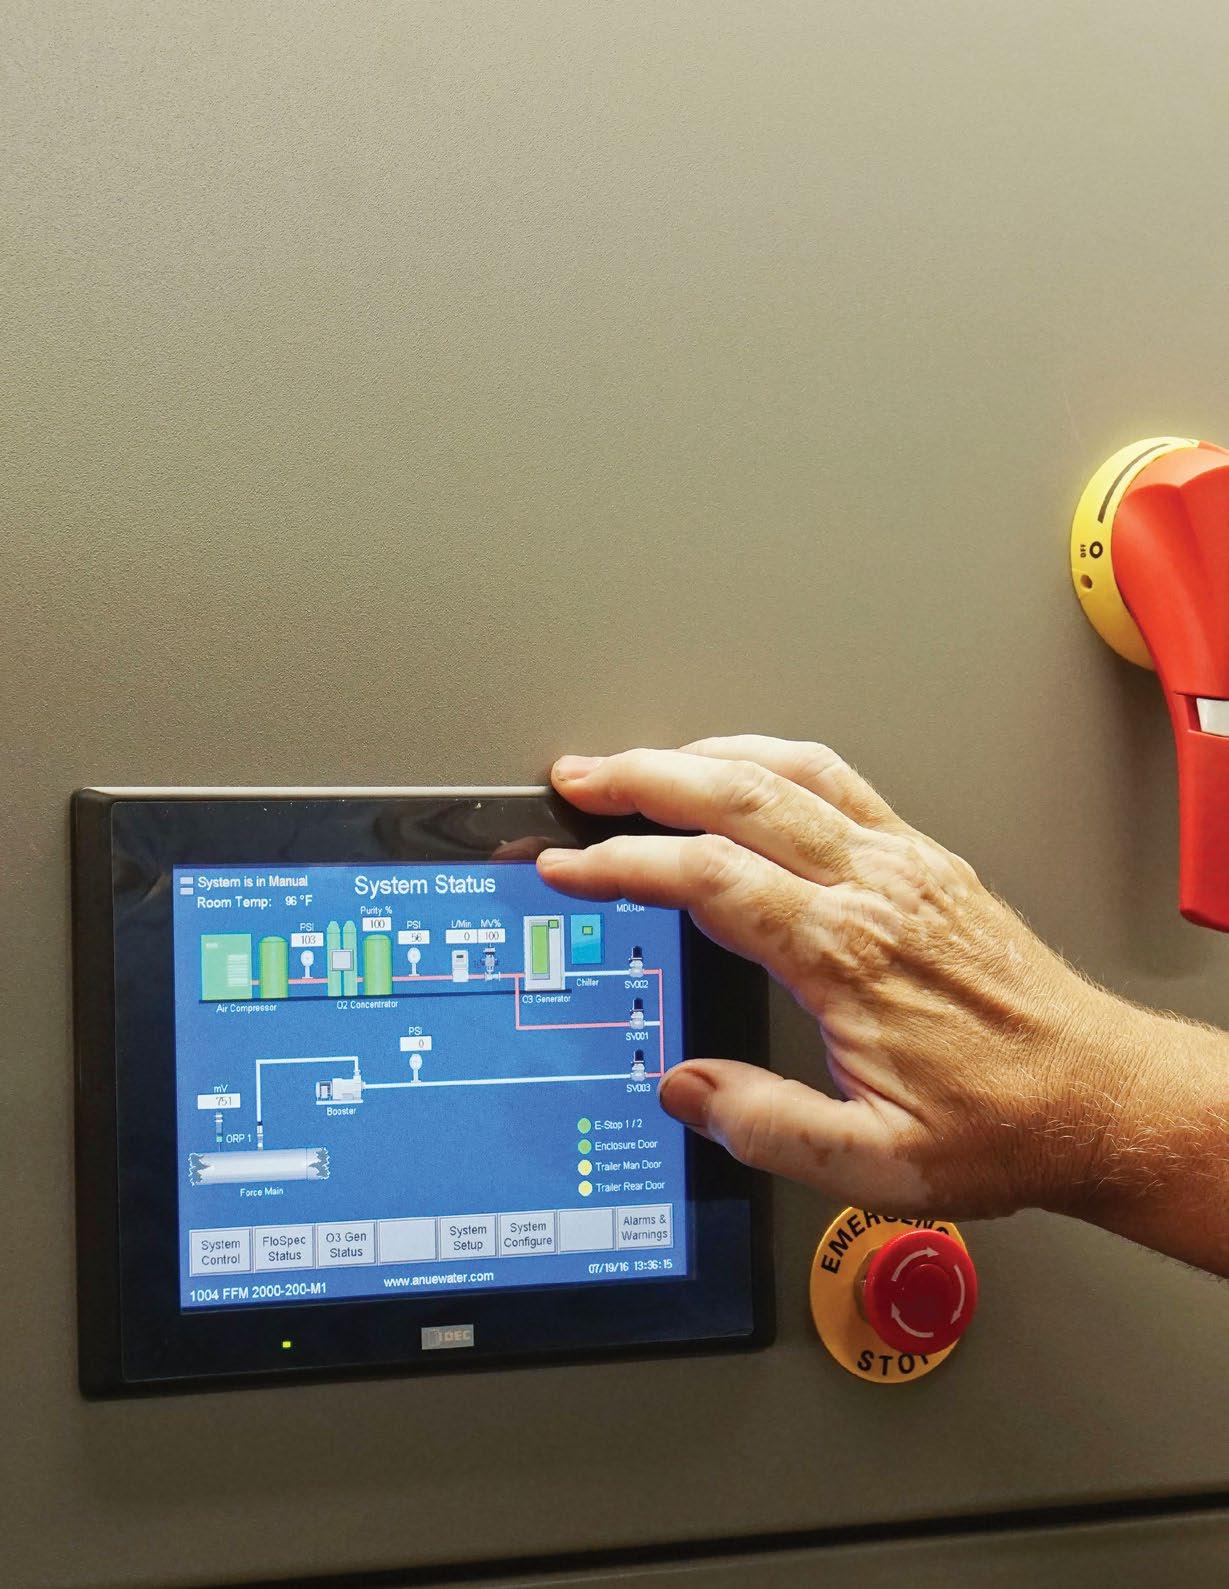
22 the Analyst Volume 30 Number 2 Can Oxygen and Ozone Improve Safety and Lessen Wastewater Treatment Equipment Damage?
Greg
Bock
and Paul Turgeon Anue Water Technologies, Inc.
Wastewater systems have long been subject to issues with odor and corrosion, which is understandable given the nature of what they carry. The odor is the driving force behind implementing controls for these systems. However, corrosion is the issue with the greatest potential for environmental harm and real systemic and economic damage. This damage can arise in the form of burst pipes and other equipment and system failures.
Failures of this type require the repair and replacement of system materials and equipment. They also have the potential to expose the environment to unpredictable releases of hazardous waste that can be difficult, if not impossible, to contain or recover.
and is corrosive to certain metals. It is heavier than air, meaning it can accumulate in wells, manholes and other similar locations that do not have much ventilation. The effect it can have on humans, at varying concentrations relative to ambient air, is shown in Table A.
Corrosion Caused by H2S
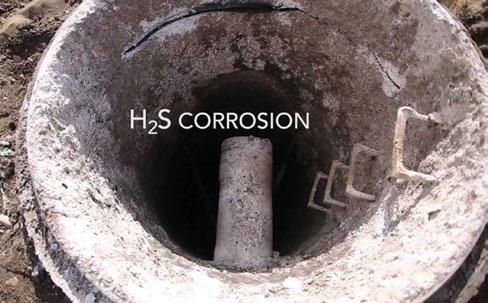
A major contributor to odor and corrosion in industrial systems is hydrogen sulfide (H 2 S) and its associated compounds. Some industrial wastewater contains sulfur compounds, which provide the molecular basis for the generation of H 2 S. H 2 S arises from the combination of anaerobic conditions and the presence of sulfites and sulfates in conjunction with colonies of microorganisms present on the inner walls of all sewer line collection systems, referred to as the slime layer. Sulfate-reducing bacteria (SRB) will use these compounds in the absence of free oxygen (O2) for metabolism. These bacteria do not use the sulfur component, and it is available to react with water, specifically free protons (H+), which results in the generation of H 2 S.
Following its generation, H 2 S can be released into the atmosphere and find its way to receptors through junctions of the atmosphere and collection system, at which point it is an odor concern. H 2 S is a colorless gas that has a characteristic rotten egg odor, is highly toxic,
Table A: H2S health effects at different concentrations. Concentration (ppm)
0.1 to 3
3 to 10
10 to 50
50 to 100
100 to 300
300 to 500
500 to 1,000
1,000 to 2,000
Physiological Effect
• Odor threshold
• Offensive odor
• Headache
• Nausea
• Throat and eye irritation
• Eye injury
• Conjunctivitis
• Respiratory tract irritation
• Olfactory paralysis
• Pulmonary edema
• Imminent threat to life
• Strong nervous system stimulation
• Apnea
• Immediate collapse with respiratory paralysis
• Risk of death
H 2 S becomes a corrosion issue when it contacts moist concrete or steel, among other metals, in the presence of oxygen, even at very low gaseous concentrations. Conditions such as these are common in the headspace of some pipes and other areas where the collection system has easy access to atmospheric oxygen. Bacteria in these areas convert the H 2 S into sulfuric acid, which then begins a destructive reaction with the infrastructure.
Historically, control of odor and/or corrosion has been implemented through either vapor-phase techniques, where the headspace of a system is treated, or liquidphase techniques, where treatments target the liquid flow. Vapor-phase treatments like scrubbers do not provide corrosion control. Some of the liquid-phase techniques offer corrosion control.
The most common method of inducing liquid-phase treatment, or directly treating the wastewater, inside the collection system, has been by dosing chemicals into the systems. A constant and continuous dose of chemical is fed from a large reservoir with a small pump into
23 the ANALYST Volume 30 Number 2 Can Oxygen and Ozone Improve Safety and Lessen Wastewater Treatment Equipment Damage? continued
the collection system, typically at a manhole or pump station. These chemicals are meant to react with the odor-causing compounds present in the wastewater or cease their formation and/or release from solution.
Conventional Control Options
The conventional classes of reactions used to control H 2 S are:
Oxidation: Chemical oxidation of H 2 S is accomplished through use of a compound with a high oxidation potential, called an oxidant, such as hydrogen peroxide or sodium hypochlorite (bleach).
Sulfide scavengers (iron salts): Chemicals that interact with H 2 S and sequester, or scavenge, the sulfur into a relatively insoluble form, such as ferric chloride and ferrous chloride, can be used to remove sulfur from the cycle entirely.
pH adjustment: Because of the way that its ions dissociate in the aqueous phase, the release of H 2S from wastewater will not occur if the pH is at 9 or above.
Oxygen Source/Sulfate Substitute
In an anaerobic environment, the microbiology in a collection system will use oxygen from a nitrate (NO3) ion more readily than from a sulfate (SO4) ion. As a result, benign nitrogen is released rather than H 2 S. Chemicals like calcium or sodium nitrate are commercially available and can be used for this purpose. They can be expensive, though, and they feed and grow the SRB layer, potentially requiring a higher volume for treatment over time.
Upon cessation of treatment, the amount of H 2S can be even worse than before. Excess moisture will build up, requiring increased clean-out cycles because the addition of the waxes used to stabilize the nitrate molecules can be encountered downstream in the collection system. In addition, U.S. Environmental Protection Agency (EPA) and state environmental regulations also include nitrate concentrations on discharge limitations.
Real-time, active monitoring of wastewater H 2 S levels is seldom carried out, so enough chemical—such as calcium nitrate and ferric salts—to control peak H 2 S values is typically added on a constant basis. By treating
peak values with chemicals like calcium nitrate and ferric salts, the likelihood is very high that excess nitrate will be present and actively added to the wastewater. This condition will require additional denitrification processes to lower nitrate levels, or the wastewater utility could face fines. Either option can be very expensive.
An issue with all chemicals is that, to introduce them to a collection system, a bulk quantity must be stored nearby. To ensure that chemicals are always available for treatment, continued deliveries to the bulk storage tank must be made. To avoid adverse effects to the environment, engineered controls—such as secondary containment and leak monitoring—must be designed, implemented, and maintained.
Ideally, a successful treatment of wastewater odor and system corrosion would:
Prevent sulfide production,
Quickly eliminate sulfides that are present,
Not pose any danger to life or the environment,
Not harm the collection system, and
Create no additional treatment challenges downstream.
In addition, the treatment solution must be cost effective. One answer is introducing ozone and oxygen into wastewater systems to control odor and corrosion.
Ozone has long been used in water treatment, dating back to at least the late 19th century in France, where it was primarily utilized for the disinfection and polishing of drinking water (1). In Europe, ozone treatment of water is a common process (2). Matthews, et al. (3) also discusses the use of ozone and oxygen to control H 2 S. Ozone’s environmental sustainability and relative safety versus chemical systems have established it as a favored current and future technology. The controlled use of ozone as a treatment does not produce harmful byproducts that could contaminate or damage the environment or ecology.
Typically, the only byproducts from its reaction are O2 and inert oxides. In recent years, interest in its use to treat wastewater has led to the development of new and sustainable (green) technology for odor and corrosion control in wastewater collection systems.
24 the ANALYST Volume 30 Number 2 Can Oxygen and Ozone Improve Safety and Lessen Wastewater Treatment Equipment Damage? continued
Why choose Quantrol as your Water Treatment equipment supplier?


- Great Products, Great People


- Commitment, to our customers - We got your back.
- Experience, Our sales team averages over 20 years of industry experience.


- Knowledge, of the equipment we offer and how to apply it.
- Accessibility, A real live caring person answers the phone, not a machine.


- Brands, We work with some of the best manufacturers in the industry.
- Stock, 1000’s of items in our Naperville, IL warehouse.
9001 Hanslik Ct. Naper ville, IL 60564 | Tel: 630-355-3330 | info@quantrol net | www quantrol.com
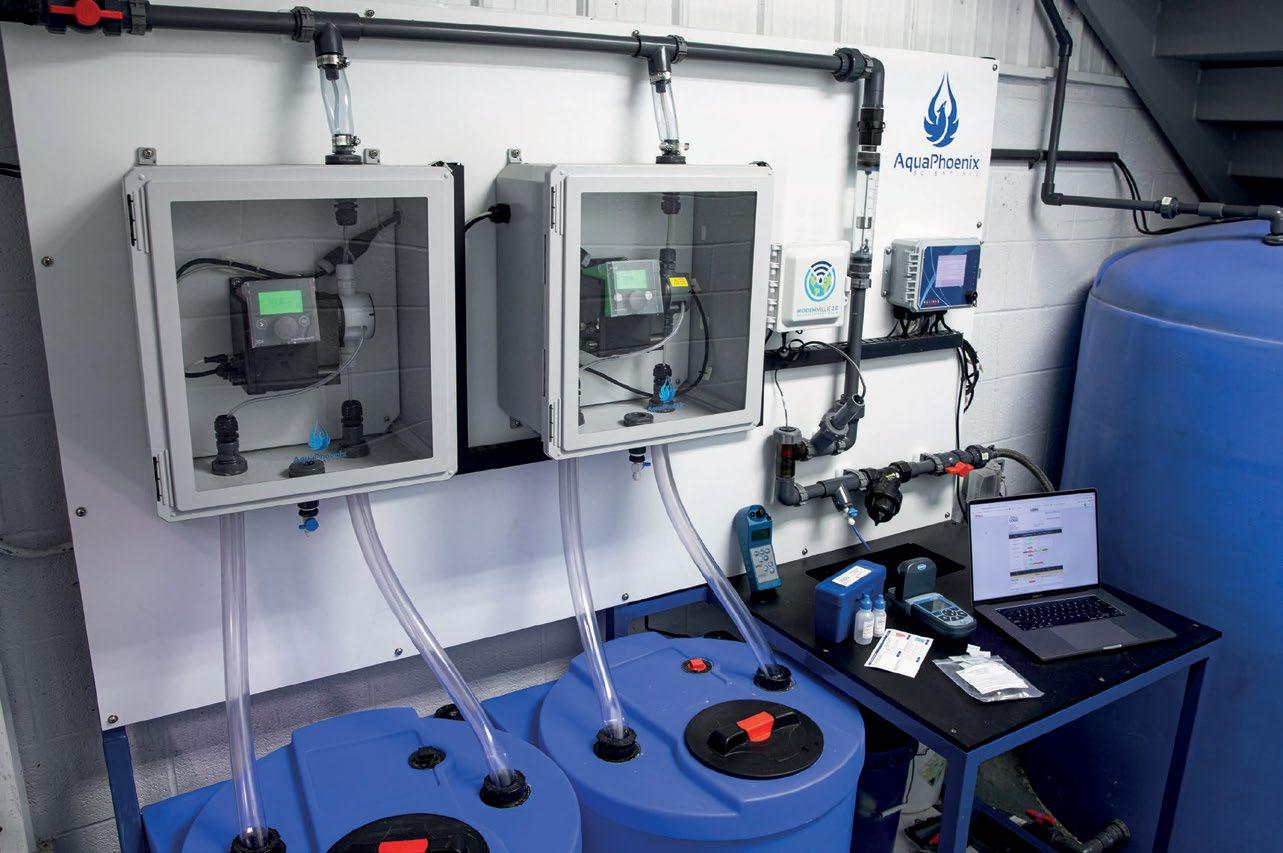
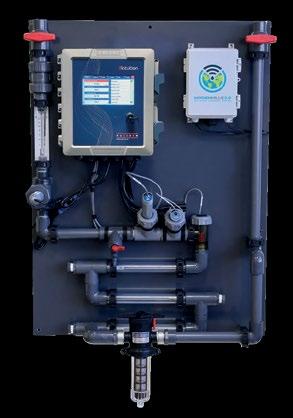
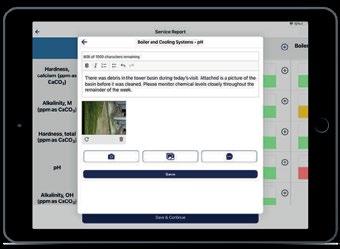

Manage all aspects of your water treatment service and consulting. By integrating your equipment with software and technology, you have the ability to capture important information about critical parameters, systems and installations. Our team of industry professionals is here to help you save time and improve efficiency in the field. TESTING PRODUCTS & SUPPLIES FEED & CONTROL EQUIPMENT DATA & REPORTING SOFTWARE Where Water and Technology Meet® Now Part of the AquaPhoenix Family Contact our team to integrate your systems today! 866-632-1291 | www.aquaphoenixsci.com
Ozone is a special, naturally occurring form of atmospheric oxygen. Instead of two oxygen atoms it has three, represented by its chemical formula O3. This third oxygen atom makes it a highly reactive molecule with very high oxidation potential. In fact, it has the highest oxidation potential of any commercially available molecule and the fourth highest overall with an oxidation potential of 2.07 volts (V). Above it, in terms of oxidation potential, are atomic fluorine (F•, 2.87 V), the hydroxyl radical (•OH, 2.86 V) and atomic oxygen (O•, 2.42 V). Ozone can be generated by exciting a flow of oxygen with sufficient electrical or optical energy. This will cause a certain amount of oxygen atoms to split and recombine with other O2 molecules nearby. This is represented in Equation 1:
Eq. 1
Under typical treatment conditions, using a relatively pure oxygen stream and a corona discharge chamber that uses a high-voltage electrical arc, this reaction can produce up to 9 to 12 percentage by weight (wt%) ozone (4), although typically output is in 1 to 9 wt% ozone (5). The remainder of the stream is left as oxygen. The concentration is limited to this range because of the reaction shown in Equation 2:
Eq. 2
As ozone concentrations rise above this concentration, the destruction reaction (Eq. 2) becomes more frequent, returning greater quantities to O2 and maintaining this equilibrium. This instability is also the reason ozone cannot be stored and must be generated immediately before application.
Because of its extreme instability and high oxidation potential, ozone is powerful and indiscriminate in terms of reactivity with other chemical species. Ozone has been shown to be an effective treatment for the destruction of volatile organic compounds; removal of metals, total suspended solids and organic carbon; and significant reductions to chemical oxygen demand.
In freshwater, the half-life of ozone is typically 10 to 20 minutes, but in wastewater, ozone has been documented
as being entirely consumed within 8.6 seconds (6). This is because of the extreme amount of potential reactants present in wastewater, including H 2 S. The simple structure of H 2 S makes it an easy target for oxidation by ozone. In addition to its high oxidation potential, ozone’s unique structure tends to create free radicals, chemical species that have unbonded electrons making them highly reactive, especially in water. Not only is the benefit of ozone’s direct reaction with different chemical species realized, but also as part of these reactions, additional free radicals, which can be even more reactive than ozone, can form. Additionally, radicals tend to create additional radicals as they react, in what is termed a free radical chain reaction.
These additional reactions are indirect effects of ozone (2). With the source of ozone generation being ambient air, it is the ultimate in sustainable and green chemical treatment. The current technology for producing ozone has benefited from more than 45 years of ongoing development, resulting in cost-effective and robust operation. Using little more than an oxygen separator, a corona discharge chamber, and some compressors and other electrical components, on-site generation of ozone is relatively simple and safe.
Because of the way ozone is produced, oxygen is necessarily going to be part of the treatment gas cocktail when using ozone. This is beneficial because oxygen is also an oxidizer. Aside from its ability to assist in oxidation, its primary benefit is increasing the dissolved oxygen (DO) concentration of the wastewater, encouraging the growth of aerobic bacteria, which do not create compounds that are odorous, corrosive, or otherwise harmful to collection systems. It also eliminates the ability of SRB to produce sulfides, either by removing the SRB entirely or promoting the growth of aerobic species that will oxidize any sulfides before they are able to enter the wastewater stream (7).
Using Oxygen and Ozone for Treatment
In terms of a robust and green method of treatment and prevention of odor and corrosion in collections systems, the combined forces of oxygen and ozone work well together. Oxygen is widely available, making up roughly 21% of the atmosphere, and as has already been seen, it is easily converted to ozone. The generation and infusion of these two gases into wastewater collection systems has
27 the ANALYST Volume 30 Number 2 Can Oxygen and Ozone Improve Safety and Lessen Wastewater Treatment Equipment Damage? continued
3��2 + ������������ → 2��3
2��3 → 3��2
proven to be a clean, safe, and cost-effective treatment. One benefit is the powerful destructive effects of ozone on H 2 S, quickly converting it to sulfites and sulfates on contact. As a product of this reaction, oxygen is generated. This in turn adds more power to the oxygen portion of the treatment gas cocktail, which provides secondary treatment by significantly increasing DO, and allows for better utilization of infused treatment gases.
Because of these indiscriminate and powerful oxidizing characteristics, concern is sometimes raised regarding the possibility of ozone attacking the wastewater infrastructure itself.
Conclusion
The formation of H 2 S is both dangerous and corrosive to the infrastructure and those who maintain the infrastructure. Chemical treatments can disrupt the formation of H 2 S gas but have limitations of chemical storage, handling, residual chemical going to the waste treatment facility and the annual cost. It is clear that the use of oxygen and ozone can be effective and safe for the environment without precipitation on the pipe internals or leaving unnecessary chemical residuals downstream in the waste treatment facility. With current technology, highly concentrated oxygen and ozone can be generated on site for easy and convenient infusion into a waste stream, ensuring an aerobic environment to hinder the formation of H 2 S, while protecting the infrastructure and the people who maintain the systems.
References
1. Beltran, F.J. (2003). Ozone Reaction Kinetics for Water and Wastewater Systems, CRC Press, Boca Raton, FL.
2. Lenntech (1998). “Water Disinfection Application Standards (for EU),” available at www.lenntech.com.
3. Matthews, A.; et al (2010). “Control of Hydrogen Sulfide Buildup in Force Mains Using Ozone and Oxygen,” Proceedings of the Water Environment Federation, WEFTEC 2010: Session 101 through Session 112, pp. 7591-7611(21).
4. Drago, J.A. et al. (2010). “Municipal Wastewater Ozonation Practice in the United States: Past, Present and Future,” Ozone: Science & Engineering 32(1), pp. 43-55.
5. Plasma Technics, Inc. (2011). “Plasma Block Product Line, Product Detail,” accessible at www.plasmatechnics.com.
6. Terry, P.A. (2010). “Application of Ozone and Oxygen to Reduce Chemical Oxygen Demand and Hydrogen Sulfide from a Recovered Paper Processing Plant,” International Journal of Chemical Engineering, Article ID 250235.
7. U.S. Environmental Protection Agency (1985). “Odor and Corrosion Control in Sanitary Sewerage Systems and Treatment Plants,” Design Manual, EPA/625/185/018, Cincinnati, OH, office.
Greg Bock is VP general manager at Anue Water Technologies. Mr. Bock has 37 years of specialty water experience, having served as a division manager for Zee Water. He also held management-level positions with GE Water/ Betz Dearborn earlier in his career. Mr. Bock studied electronic engineering and business administration at Temple University and is a Six Sigma Green Belt. Mr. Bock can be contacted at gbock@anuewater.com.
Paul Turgeon is CEO of Anue Water Technologies. Mr. Turgeon has also served on the boards of U.S. Water, Anue Water Technologies, CCR, Versaflex, and MFG Chemical. In 2006, Mr. Turgeon purchased the industrial water business of Chemtura Corp., with partners and private equity, creating BWA Water Additives, which was later sold to Berwind Corp. He holds a B.S. in chemical engineering from the University of Toronto and an MBA from Emory University.

Keywords: CORROSION, ODOR, OXYGEN, OZONE, WASTEWATER

28 the ANALYST Volume 30 Number 2 Can Oxygen and Ozone Improve Safety and Lessen Wastewater Treatment Equipment Damage? continued
AMSA’s newest product provides continuous cleaning to promote maximum heat exchange!


BCP®6010
BCP® 6010 Cleans, Protects & Boosts
Keep Systems Clean: A low level of AMSA’s smart designed molecules making up BCP® 6010 are always present in the system, first penetrating, and then releasing organic deposits from system surfaces.
Protect Surfaces: BCP® 6010 first cleans, and then continues to provide cleaned surfaces to prevent the initial stages of biofilm formation.
Boost Biocide Effectiveness and Corrosion Inhibition: BCP® 6010 goes to surfaces, penetrates, and breaks up the organic deposits, allowing biocides to penetrate into the biofilm, killing the bacteria protected within its tough matrix.
In addition, continuously cleaning surfaces with BCP® 6010 limits the opportunity for MIC (Microbially Influenced Corrosion), and gives corrosion inhibitor chemicals greater access to metal surfaces, as AMSA chemistry is a film former, key to surface protection.
AMSA, Inc.® 4714 S. Garfield Rd. • Auburn, Michigan, USA • 48611 Tel: (989) 662-0377 Fax: (989) 662-6461 sales@amsainc.com www.amsainc.com ®
Why Boilers Foam and How to Prevent It
30 the ANALYST Volume 30 Number 2
Louis Godbout, and Simina Alungulesa, TGWT
Background

In a steam boiler, salts present in the feedwater are concentrated as water is evaporated. This creates many challenges. Even if the most problematic salts, namely those that are responsible for scaling (calcium, magnesium, silicates, etc.), are well controlled and removed from the feed water by ion-exchange resins, reverse osmosis, or other methods, other ions may be present (sodium, potassium, chlorides, sulfates, and others) that will accumulate in the boiler and lead to foaming and carryover once certain critical concentrations are reached.
This fact limits the efficiency of the boilers, as a high proportion of the salt-laden water must be purged or “blown down” to reduce the concentration of these salts. This practice not only incurs energy costs, as the purged water is water that has been heated, but also costs of the supply, treatment and heating of the make-up water that must replace it.
Even though steam boilers are still, in many ways, at the heart of our industrial civilization, the phenomenon of foaming and carryover at high concentrations of salts has been subject to many misconceptions and erroneous explanations, such as “soapiness” due to high alkalinity or other surface-tension effects. This is not surprising, as the true explanation, presented here, is a water “anomaly” that involves the inhibition of bubble coalescence, which has been a subject of serious scientific study only since 1993.
Thus, organizations such as the American Society of Mechanical Engineers (ASME) or the American Boiler Manufacturer Association (ABMA) make recommendations as to the maximum conductivity allowed in boilers (a gross means of evaluating the salt concentration, without consideration of the types of ions involved) based on empirical historical observations, rather than on a scientific basis. Certain countries have even gone further than recommendations and enacted legislation to ensure that these limits are respected, again on purely empirical grounds.
The discovery of the relationship between bubble coalescence inhibition and foaming is explored in
this article to understand why tannin-based water treatment products can reduce or eliminate carryover in such circumstances. We will also explain why typical antifoam agents are not always useful and can often be detrimental when used to reach higher cycles of concentration. Finally, we will present a hypothesis as to how tannins function as antifoams and give examples of the gains in energy efficiency and greenhouse gas reduction that they can achieve.
Introduction
Foaming in boilers has been observed and has caused problems ever since boilers have been in use, that is, since the Industrial Revolution (1–5). The true physicochemical phenomenon that is its root cause is the inhibition of bubble coalescence at high concentrations of certain salts. Boaters who navigate both seas and freshwaters usually notice how much foamier the wake of their boats is in saltwater, but only in the first half of the 20th century was this phenomenon first studied. Unfortunately, these pioneering investigations were flawed in many ways (2-14). Inhibition of bubble coalescence was described more precisely in the 1960s and 1970s (15, 16) and more fully and fundamentally since the 1990s with competing theoretical explanations still being proposed to this day (17-49) and are even discussed on YouTube (youtu.be/mkBnZA8B_BM)!
Further studies have examined how this phenomenon affects the environment, for instance the oxygenation of the oceans (42) and the creation of small particles of seawater salts that serve as nuclei for the formation of rain clouds (50). The environmental impact of having small bubbles created in our ocean by wave action turns out to be of crucial importance to the biosphere. However, to date, the only envisaged potential application for industrial use has been for mining and mineral concentration processes that involve flotation (51–66) and desalination (67, 68). Its importance in steam production has been ignored even though preventing this phenomenon can greatly improve the efficiency of boilers.
Quite incredibly, the entire water treatment business for boilers as well as the steam equipment manufacturers
31 the ANALYST Volume 30 Number 2 Why Boilers Foam and How to Prevent It continued
have completely ignored these advances and still misunderstand why a boiler foams when the conductivity of the boiler water surpasses a certain level. Empirical guidelines have been established, for instance by the ASME and the ABMA, but one needs only peruse current boiler operator manuals, or course materials destined for power engineers, or various instructional websites of large water treatment companies, to discover that any explanation given to justify these is profoundly misguided and contrary to our recent scientific understanding.
Typically, the phenomenon is ascribed to high alkalinity or to the “soapiness” of highly alkaline solutions. It is also described as, or presumed to be, a foam accumulating at the surface of the boiler water. However, by verifying the surface tension values of solutions of salts that will accumulate as typical boiler waters are concentrated, one realizes that not only is there no decrease in surface tension (as a soap or surfactant would create), but, in fact, an increase. As well, observation of the bulk of the solution inside a foaming boiler clearly shows that the entire water mass is filled with small bubbles, rather than simply an accumulation of bubbles at the surface of the water, though both can certainly be seen under certain circumstances.
As mentioned, the first serious studies of foaming in boilers were done in the 1920s. For this purpose, C.W. Foulk of Ohio University constructed an experimental boiler with viewing ports (2) (Figure 1). He would spend 20 years elaborating a “Theory of Liquid Film Formation” (6) and would build various apparatus to explain his observations on bubbles and develop his theory (8). His early observations of bubbles in boilers were not precise, as he would alternate between descriptions of smaller bubbles being produced as salt concentrations increased (incorrect) and a transition from coalescing to non-coalescing bubbles that leads to smaller bubble size (correct). In 1931, he and his colleague Miller described and used a pumped air apparatus that he dubbed the Dynamic Foam Meter (7) that was to inspire quite a few similar devices used to study bubble coalescence, including our own muchimproved versions. Strangely enough, although Foulk’s interest had started as an inquiry into foaming in boilers, he did not seem to have envisaged using his apparatus for practical purposes, such as optimizing boiler
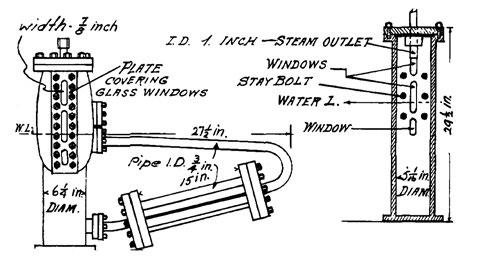
performance or developing boiler antifoam formulations. This was to be done later, by scientists at the Dearborn Chemical Co. (now a part of Veolia).
There was a concerted effort in the 1940s and 1950s at Dearborn to develop antifoam chemicals. Long before any scientific study of foaming in boilers, many substances were recommended that were presumed to have an antifoam effect. Unfortunately, most of them, and notably the widely recommended Castor oil, would only work momentarily and after a short time would create a worsening of the foaming as they were degraded into surfactants. Two Dearborn scientists, Denman and Gunderson, discovered a variety of emulsified amines, fatty acid diamides, triamides, and others, which had the desired effect. Some had some commercial success, but unfortunately their properties waned quickly in boilers and were limited (69-90) in their applications. As we will see, most antifoams can be problematic.
These Dearborn scientists used tannins in their experiments as an adjuvant to create their dispersions of diamides and triamides and noted a clear synergistic effect as noted in the box under this paragraph (73). Unfortunately, they did not further explore the antifoam effects of tannins per se, even though tannin-treated boilers were historically known to foam much less. It is this effect of tannins, well-known to us and to all users of tannins, which motivated our work.
“It has been found that certain tannins are important synergistic substances that aid the polyamide compounds to ‘cut in’ effectively to inhibit foam formation, particularly in magnesium-containing and in ‘low-solids’ waters. The maintenance of higher alkalinity in such boiler water is also helpful.”—From L. Gunderson and W. Denman, Reference 73.
32 the ANALYST Volume 30 Number 2 Why Boilers Foam and How to Prevent It continued
Figure 1: Foulk’s experimental boiler with windows and his observations of the foamy mass of boiler water. From: Reference 5 (Foulk and Ryznar (1939).
Understandings (and Misunderstandings) of Carryover
Like most handbooks and courses for power engineers and other water-treatment specialists, we will delve into the reasons for carryover, but rather than divide the topic into three categories, which are namely: 1. “Priming”; 2. “Contamination”; and 3. “High conductivity/ High TDS (total dissolved solids).” We will replace the last one with “inhibition of bubble coalescence”. As we will show, this will give us a better understanding of the true nature of this last type of carryover and will suggest avenues for surpassing traditional operating parameters.
Priming
Variations and especially sudden demands for steam leads to lower pressure, a rapid expansion of gases (Boyle’s Law) and a surge of boiling. (Unbalanced boilers connected to the same header is also a common cause.) Keep in mind that expansion of gases is more rapid than a phase transition from water to steam, so that having a high percentage of steam in the boiler’s water mass makes it more susceptible to priming. Also, sudden boiling depends on the presence of nucleation sites. However, as the rate of formation of vapor nuclei is proportional to e (Euler’s number) to the power of - σ 3, where σ is the surface tension, any increase in the surface tension should be detrimental to a surge in boiling.
Moreover, as the force required to create a bubble in a liquid is proportional to σ3/2, again, any increase in the surface tension should be detrimental to a surge in boiling (91). Knowing that an increase in TDS leads to an increase in surface tension in typical boiler water. This raises the question: Why should this lead to more susceptibility to priming rather than less, as physics would lead us to believe? As we will see, these
considerations are important in understanding how priming is linked to inhibition of bubble coalescence.
Contamination
If surface-active substances enter the boiler, they will reduce the surface tension and create stable bubbles that accumulate and build up on the surface until they are sucked into the steam line. Very small amounts of surfactants are necessary. Also, as we’ve just seen, a decrease in surface tension should make the boilers more susceptible to surges of boiling, as there should be more nuclei and less pressure needed to create bubbles. Frequently, the contamination comes from vegetal or animal oils and greases that will be readily saponified in the high temperature and high pH of the boiler water. What is often not considered is that at high cycles and thus long residence times, most boiler polymers (including antifoams), will degrade, sometimes into small surface-active fragments. The physical phenomena are the same as those in a soap bubble, as illustrated in Figure 2.

Consequences of Small Bubble Sizes
Explanations of why high TDS leads to carryover are found throughout the technical literature and abound with nonsense and contradictions. As we keep emphasizing, contrary to surfactants, the accumulation of salts typically found in boilers leads to an increase, not a decrease, in surface tension. Inhibition of bubble coalescence is a better way to describe this type of carryover, especially as high TDS does not necessarily lead to carryover.
Among the many scientific articles that have explored the subject (17-49), the one that first established this was Craig et al.’s 1993 article (18). He discovered that not all
33 the ANALYST Volume 30 Number 2 Why Boilers Foam and How to Prevent It continued
Figure 2: Stabilization of bubbles by surfactants. Images from Wikipedia.
ion pairs will lead to inhibition of coalescence, as seen in Figure 4. Based on experiments, he could classify each cation or anion as being an α (alpha) or a β (beta) type. Similar pairs, αα and ββ, will lead to inhibition as they are concentrated, but an αβ pair or an βα can be concentrated without ever causing inhibition! For instance, a highly concentrated (high TDS), highly conductive solution of sodium acetate will not inhibit bubble coalescence, whereas a solution of NaCl will. This is illustrated in Video 1. Figure 3 shows a screenshot of the inhibition of bubble coalescence as shown in the video. The weblink to the video is given in the figure caption.
Many theories have been proposed to explain this, but none are unanimously considered to be valid and to agree completely with the data. Developing a model has been a challenge for many reasons. Firstly, because it took some time to agree on how to measure the “Critical Coalescence Concentration” (CCC), which is a transition rather than a precise value, in view of the various methods and apparatus used. (Shown in Figure 4, right, and Figure 5.) Secondly, because combinations of α and β ions pose extra difficulties. Luckily, regarding α ions, the most commonly found in boilers, experiments have shown that the phenomenon can be understood best not in terms of concentrations or conductivities, but in terms of ionic strength, as seen in Figure 6 which shows data from a more precise measurement of bubble sizes by an image analysis technique.
Providing water treatment solutions, not just chemicals
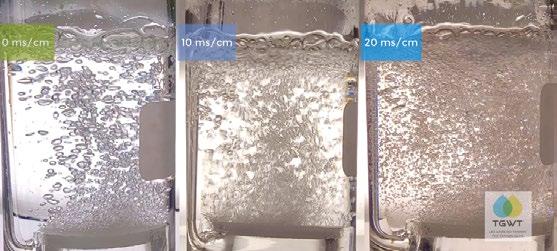
When it comes to water treatment, each business has unique needs and challenges. Our in-house technical professionals utilize our global network to devise innovative solutions and procure the most effective product for each situation.

Our broad product portfolio and services grant you peace of mind, so you can focus on your core business.
brenntag.com
34 the ANALYST Volume 30 Number 2 Why Boilers Foam and How to Prevent It continued
Figure 3: Screenshot from Video 1 that shows the inhibition of bubble coalescence as a function of conductivity ( youtu.be/eahLMMVbFyM ).
Various means of measuring the CCC of solutes include Turbidimetry, microscopic observations of pairs of bubbles, and gas holdup. One companyA has developed its own instruments (patent pending) to better simulate boiler conditions, using boiling water and steam rather than air or gas bubbles, production of uniform bubbles at a hot metal surface and detection of bubble size by three different means. The far-left image in Figure 6 is based on Reference 28 (Henry, et al.); the middle image is based on Reference 31 (Christenson, et al.), while the right image is from Reference 46 (Sujan and Raj).
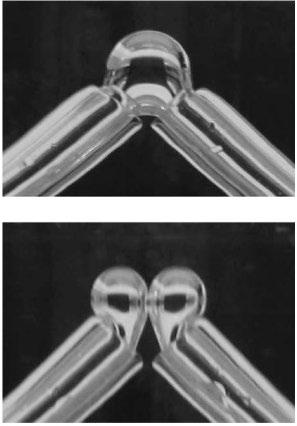
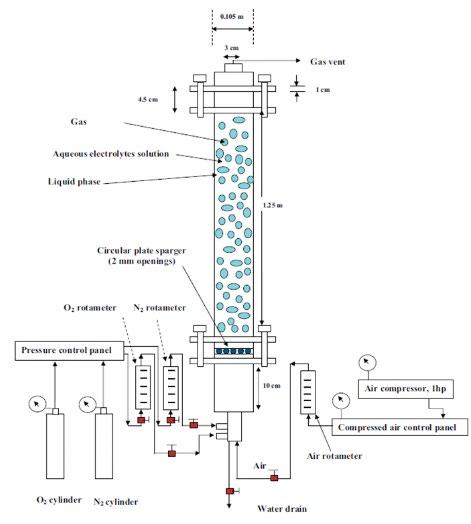
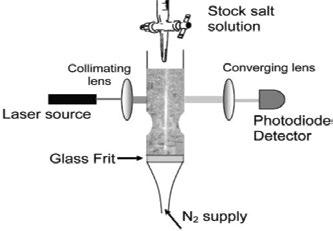
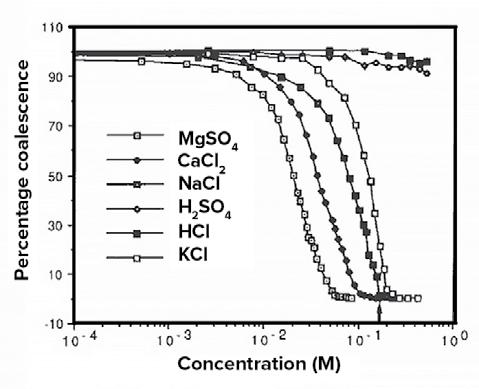
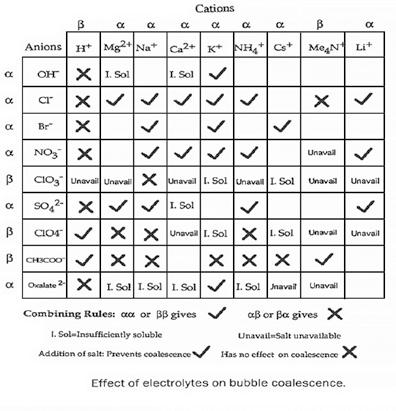
35 the ANALYST Volume 30 Number 2 Why Boilers Foam and How to Prevent It continued
Figure 4: Only certain ion pairs will lead to inhibition of coalescence. Different salts have different “critical” concentrations at which this occurs, with doubly charged ions showing a lower concentration. From: (Craig, V., et al.), Reference 18.
Figure 5:
Now that we have a better idea as to how inhibition of bubble coalescence occurs, we must see what the consequences of small bubbles in a boiler are. The first consequence is that the rising speed of the bubble will be reduced. (See Video 2, Figure 7.) An approximation would be the terminal speed of a spherical bubble, which is proportional to the square of its radius. This is illustrated in Equation 1:
v = (2/9)ρgR2/μ
Eq. 1
Where:
g is the gravitational acceleration (m/s2)
R is the radius of the spherical particle (m)
ρ is the difference in density between the gas and the liquid (kg/m3)
μ is the dynamic viscosity (kg/m*s)
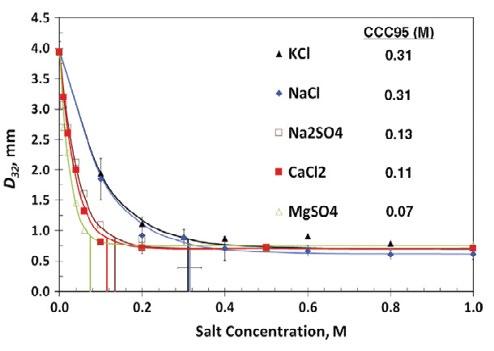
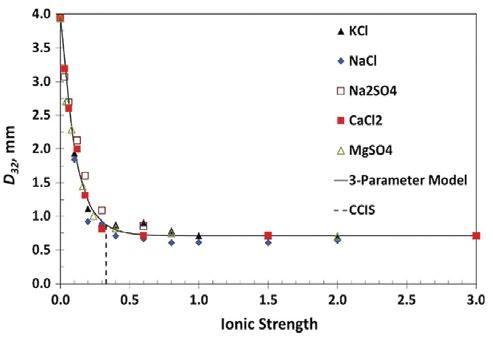
v is the velocity (m/s)
(N.B.— Notice that in high-pressure boilers the difference in density between the steam and the water is greatly reduced and thus, so is the rising speed. This may exacerbate the propensity to carryover, though the lower viscosity may compensate.)
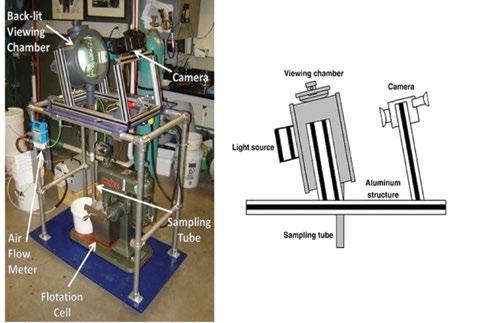
Given a certain output of steam produced, a transition from large-to-small bubbles has a very deleterious effect. Many more and much smaller bubbles will be rising to the surface more slowly, so that a greater proportion of steam will be transiting through the boiler water, resulting in an increased gas holdup (Figure 9). This
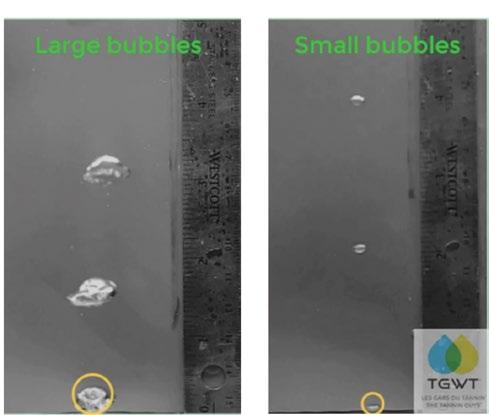
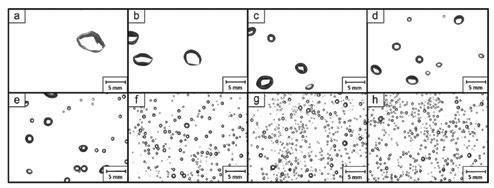
36 the ANALYST Volume 30 Number 2 Why Boilers Foam and How to Prevent It continued
Figure 6: Top right: The McGill University bubble sampler apparatus designed to photograph bubbly water samples with bubbles in a single plane of focus. Top left: Such images allow for image analysis and determination of bubble size distributions. Bottom left: The CCC varies greatly according to the salt used. Bottom right: A model can be accurately fitted if the ionic strength of each salt is used instead of its concentration. Moreover, this model will work with mixtures of salts, as long as they are all of the α type. Top images from Reference 45 (Sovechles and Waters); bottom images from Reference 40 (Quinn, et al.).
Figure 7: Video 2 screenshot: Speed of bubble rise in relation to bubble size ( youtu.be/qyDuj7S6vx8).
foamy mass will be more susceptible to rapid expansion with very small variations in pressure, thus making priming more likely. In addition, it will also give false level readings on sight glasses because the density of the foamy water is much lower than that of the bubble-free water in the sight glass.
The second important consequence of having small bubbles is that these will eject droplets of boiler water as they burst at the surface. We know that the pressure differential between the inside and outside of a spherical bubble is inversely proportional to its radius as shown in Equation 2 (Laplace’s Law):
Pi–Po = 2σ/R
Eq. 2
Where:
σ is the surface tension (N/m)
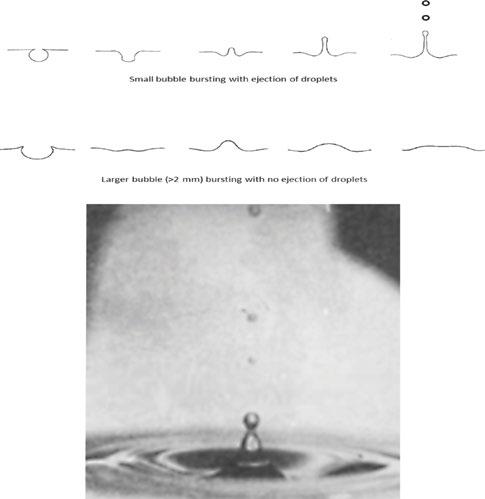
P is the pressure (subscript i indicates inside, o is outside) (Pa or N/m2)
R is the radius (m)
Very small bubbles have extremely high pressures and will eject droplets when they burst. Then, as small droplets have a low terminal falling speed, it takes only a weak steam flow to carry them in the steam lines. (The same equation for the rising bubbles speed will apply for the terminal speed of a falling drop.) This was first seen in high-speed photography images taken decades ago (Figure 9). It can also be felt (and smelled, and tasted, and heard) when you are drinking a beverage with fine bubbles.
A third and final consequence of having small, slowly rising bubbles, is that for a given volume of steam their numbers will be extremely high. An example can illustrate this:
Let us assume that a 4-millimeter (mm) bubble is reduced to several 0.5-mm bubbles when inhibition occurs. We can easily calculate how many of smaller bubbles will hold the same quantity of steam. Since the volume is proportional to the cube of the radius, but the pressure inside bubbles increases inversely with the radius, you would need 64 of the smaller bubbles to contain the same amount of steam as in the large one. Of course, the distribution in bubble sizes is not narrow. As can be seen in our videos, a range of very small bubbles are formed. Because of their extremely slow rising speed, these will be caught in downward currents in the turbulent boiler water and will not easily reach the surface.
Their presence in large numbers has another extremely deleterious effect. They will act as the nucleation sites, or more precisely as precursors to larger bubbles that can easily form when a drop in the pressure of the boiler lowers the boiling point. The phase transition from water to steam will be greatly facilitated and carryover will ensue with much lower pressure drops.
37 the ANALYST Volume 30 Number 2 Why Boilers Foam and How to Prevent It continued
CaCl2- 2H2O 27.5 L/m Concentration, C (mol/L) 1.8 1.6 1.4 1.2 1.0 0.00 0.05 0.10 0.15 0.20 0.25 0.30 Gas holdup Na2SO4 MgSO4 7H2O NaCl
Figure 8: Gas holdup increases as various salts reach their CCC. The important changes (up to 70% for CaCl2) vary also according to the rate of gas transiting through the water. Source: Reference 46 (Sujan and Vyas).
Figure 9: Top: The authors’ rendering of the profile of a small versus a large bubble bursting. Bottom: High-speed photograph of a jet of small droplets being ejected from a small bubble bursting at the surface of water. Source: Kientzler, C. F., et al. (1954). “Photographic Investigation of the Projection of Droplets by Bubbles Bursting at a Water Surface,” Tellus 6.1, pp. 1-7.
The phenomenon is analogous to the decompression of dissolved gases. If you shake a bottle to create swarms of bubbles, it will spurt when you open it, because you have more nucleation sites. (See Figure 10, which shows a screenshot from Video 3.)
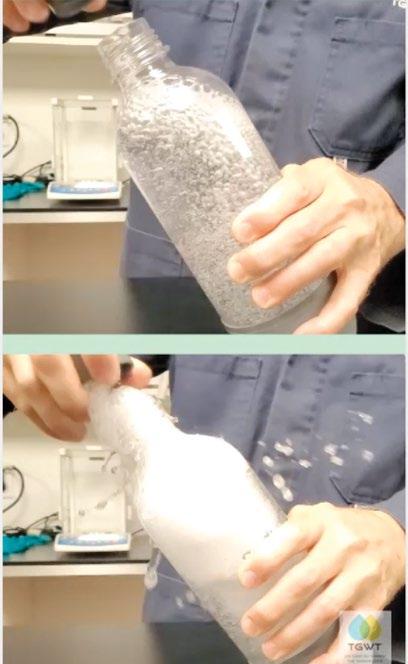
3. Finally, the presence of a large number of small bubbles that can serve as nucleation sites when pressure drops occur.
It is worth mentioning that bubble coalescence does not only affect boiler performance in terms of carryover but may very well impact heat transfer across the boiler heating surfaces. As previously stated, steam bubbles will rise in boiler water until they attain a terminal velocity when the drag and buoyancy forces balance out. If the bubble size decreases due to the coalescence inhibition effect of ions present in the water, the drag force becomes dominant and the terminal velocity decreases. The drag force is further increased by the crowding effect of an increased number of smaller bubbles at the boiling surface. This leads to an increase in the residence time of bubbles near the metal surface and therefore a delay in their detachment and outflow into the bulk water, subsequently causing the vapor-generation rate to exceed the vapor-removal rate (92). Ultimately, this can create an insulating layer that can cause overheating of the metal surface, which could lead to disastrous consequences.
Strategies for Reaching High Cycles
Exceeding recommended limits can be extremely profitable and environmentally beneficial, but few dare to do so. When exploring this possibility, one should keep in mind that even the biggest players in the field of water treatment have put things in perspective regarding the ASME and ABMA recommendations:
“These guidelines should not be considered absolute. Some systems cannot tolerate operation at these concentrations; others operate continuously at significantly higher concentrations.”
To recap, inhibition of bubble coalescence in a boiler will occur when the total ionic strength of the boiler water reaches a critical value (the CCC) as long as the ions are of the α type (as most ions found in boilers are). At this point, the presence of small bubbles increases the likelihood of carryover through three paths:
1. An increase in the gas holdup volume due to the slow rise of bubbles.
2. A large number of salty boiler water droplets are being ejected by the bursting of small high-pressure bubbles.
Our improved understanding of the phenomena immediately suggests possible strategies:
Reduction of Ionic Strength
Reducing boiler chemicals that will add to ionic strength is a sure shot, but the gains are likely limited. We know that doubly or triply charged ions contribute much more to the ionic strength, because this varies with the square of the charge, as shown in Equation 3:
38 the ANALYST Volume 30 Number 2 Why Boilers Foam and How to Prevent It continued
Figure 10: Video 3 screenshot: The effect of increased nucleation sites due to inhibition of bubble coalescence ( youtube.com/shorts/IcQWVMeXhbg).
Source: Chapter 16 (Steam Purity) from the Veolia Water Technologies and Solutions’ Handbook of Industrial Water Treatment. Accessible at www.watertechnologies.com/handbook/chapter-16-steam-purity.
Eq. 3
Where: I is the ionic strength
b is the molality of ion i

z is its charge
Thus, we could increase our cycles by avoiding doubly charged ions such as sulfate (SO42)- (the reaction product of sulfites) or phosphate (HPO42) using different boiler chemistries that do not generate such ions.
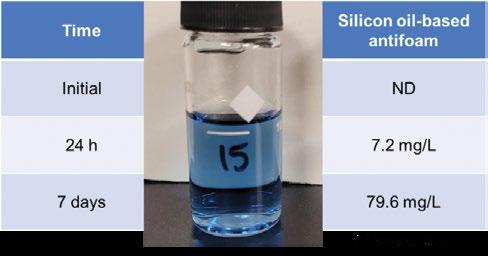
Antifoams
Many antifoams will succeed in preventing the inhibition of coalescence, as seen in Figure 11. However, the most used boiler antifoam products, polyglycols and PGME (propylene oxide ethylene oxide polymer mono butyl ether), such as Dow’s UCON™, and hydrophobic silica particles in silicone oils, such as Dow’s Xiameters™, can only be used in low cycles or low-pressure boilers and with continuous feed. This is because, like the polyamides of the 1950s, they degrade readily at the high pH, temperature, and pressure of boiler water. At best, they lose their antifoam properties as the retention time increases with higher cycles, at worst, their degradation products are themselves surfactants that foam. (See Figure 12, and Figure 13 with screenshots from Videos 4 and 5.)
Use of Tannins and Their Mode of Action
The starting point of our investigation into carryover was an attempt to understand why tannins have an antifoam effect. This has been observed time and again in systems that exceed the usual guidelines. (As well as in the lab, see Figure 14 that has a screenshot for Video 6.)
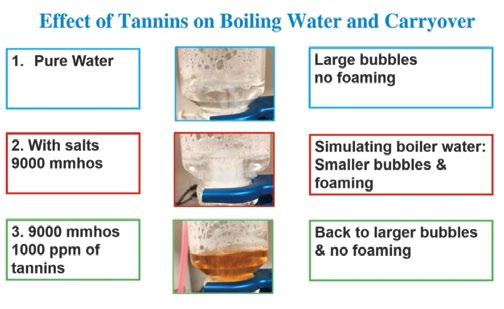
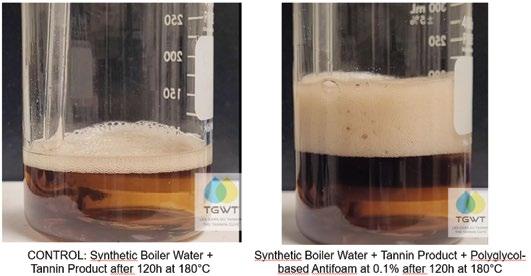
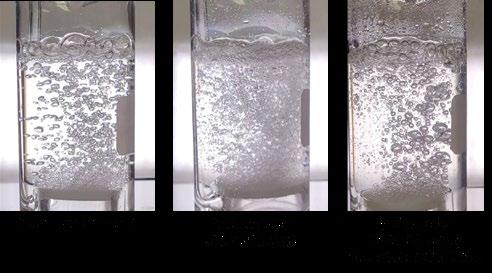
39 the ANALYST Volume 30 Number 2 Why Boilers Foam and How to Prevent It continued
Figure 11: A silica/silicone oil antifoam prevents the inhibition of coalescence.
Figure 12: A sample of a silica/silicone oil antifoam has degraded into silicates (as indicated by the blue color, after exposure to boiler conditions, high pH, temperature, and pressure. Needless to say, the antifoam no longer functions.
Figure 13: Screenshots from Videos 4 and 5 that show the effect of antifoam degradation on boiler water foaming (Control: Video 4: youtube.com/shorts/ GZ1aI5ACeYM ) and Video 5: (Experiment: youtube.com/shorts/7VlTeCGUp_w )
Figure 14: Video 6 screenshot: The effect of tannins on bubble size. ( youtu.be/kkNdixtk9to).
Our understanding of inhibition of coalescence led us to explore two hypotheses:

1. The tannate anion, like most organic anions, is probably a β -type anion, and its presence prevents the inhibition of coalescence due to the α-type cations and anions. This initially seemed the most plausible hypothesis, as tannins in solution exist as tannate ions that are more and more charged as the pH is increased. We cannot discount that this plays a role, but our experiments showed that it is not the primary mechanism.
2. Tannins form particles of the right size and hydrophobicity to act as antifoam particles. We verified this in experiments in a small boiler (Figure 15.) that indicates that the antifoam action of tannins manifests itself clearly only in the presence of calcium (Ca 2+) or magnesium (Mg2+) ions, with which they form complexes. (Figure 16). As pointed out previously, this had been noted for Mg2+ ions by Gunderson and Denman (73) in 1948.
Conclusion
Examples of Savings through High Cycles of Concentration with Tannin-Based Treatments
As always, shedding light on the physical and chemical processes in boilers opens avenues that can improve performance. We would therefore like to conclude with two case studies of savings achieved with higher cycles. These are a large pulp and paper mill (Figure 17) and a hospital (Figure 18), where we have tracked the savings accrued over the years, ever since a tannin treatment that allows for higher cycles began to be used. This enabled the end users to save on water (make-up and blowdown), energy (fuel costs), and reduce their carbon dioxide (CO2) emissions, all the while continuing to protect their equipment.
15:
Conditions: 125 to 150 pounds per square inch (psi) (353 to 366°F). Carryover simulations were done using NaCl/NaOH to reach the CCC at a threshold conductivity of 7,000 to 8,000 microsiemens per centimeter (µs/cm) and physically by increase the steam demand. Tannins were effective at a level of 8 ppm in preventing carry-over at the moment of injection as well as after ~20 hours of operation, and beyond conductivities of 10,000 µs/cm. Ca2+ ions were dosed using a solution of CaCl2
For instance, over the course of almost 14 years of tannin treatment, the CHUS Fleurimont Hospital (in Sherbrooke, Quebec, Canada) was able to save a total of $430,000 (all monetary figures in Canadian $) while running at 100 to 150 cycles of concentration, and maintaining a condensate return conductivity of 10 to 20 µ s/cm. In another case study, the Cascades Cabano pulp and paper mill (in Témiscouata-sur-le-Lac, Quebec, Canada) implemented tannins for more than 11 years and realized $2,760,00 in overall savings while running at 100 to 200 cycles of concentration and maintaining a condensate return conductivity of 5 to 10 µ s/cm.
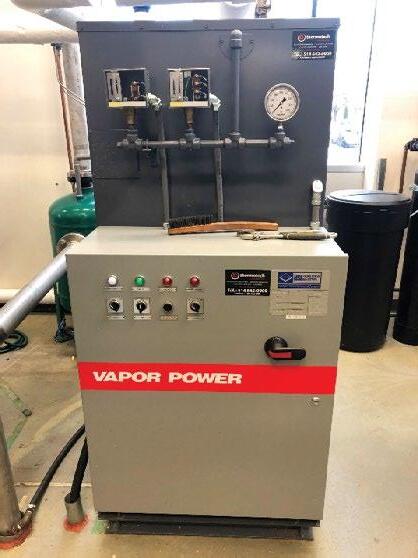
40 the ANALYST Volume 30 Number 2 Why Boilers Foam and How to Prevent It continued
Figure
This small electric boiler allowed us to perform simulations.
Figure 16: Possible mechanism of antifoam action of a soft solid calcium tannate particle illustrated in (a) or (d). Given the adequate size, as the solid particle finds itself in the liquid interface between two steam bubbles (Step 1), it will form a bridge between them (Step 2). At that point, due to its hydrophobicity, it will make the liquid de-wet the particle surface (Step 3) thus perforating the bubbles. Source: Bergeron, V.; Walstra, P. (2005). “7 – Foams,” Fundamentals of Interface and Colloid Science, Lyklema, J., Academic Press. 5: 7.1-7.38.
These two examples along with many others illustrate how tannins can prevent carryover at higher boiler water conductivities. This research helped the authors understand the scientific complexities behind the bubble coalescence inhibition phenomenon while helping to show the antifoaming properties of tannins.
References

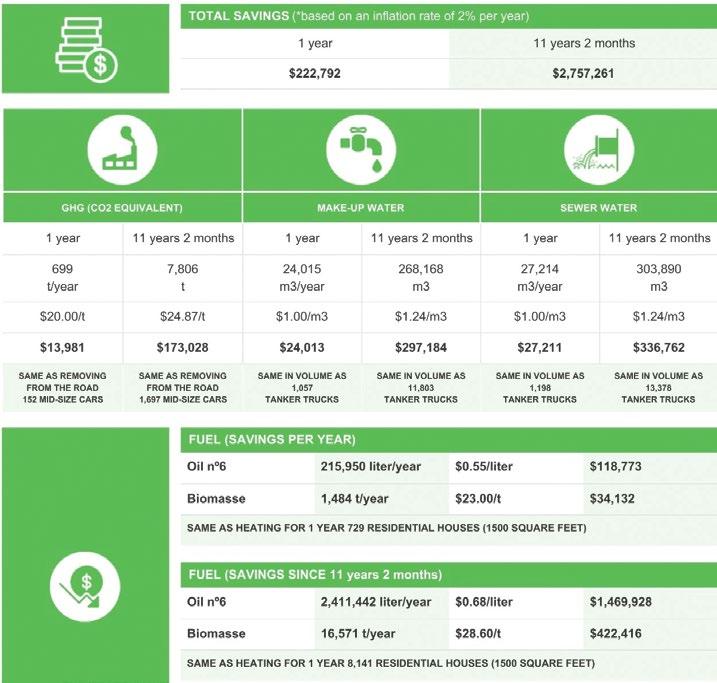
1. Haswell, C.H. (1905). “Foaming of the Water in a Steam Boiler and Its Effect,” Scientific American 92(5), p. 99.
2. Foulk, C. (1924). “Foaming of Boiler Water,” Industrial & Engineering Chemistry 16(11), pp. 1121-1125.
3. Foulk, C.W.; Groves, K. (1933). “Foaming and Priming of Boiler Water,” Industrial & Engineering Chemistry 25(7), pp. 800-803.
4. Foulk, C. (1936). “Suspended Solids in the Foaming and Priming of Boiler Water,” Journal of the American Water Works Association 28(4), pp. 528-536.
5. Foulk, C.W.; Ryznar, J.W. (1939). “Foaming of Boiler Water,” Industrial & Engineering Chemistry 31(6), pp. 722-725.
6. Foulk, C. (1929). “A Theory of Liquid Film Formation,” Industrial & Engineering Chemistry 21(9), pp. 815-817.
7. Foulk, C.W.; Miller, J. (1931). “Experimental Evidence in Support of the Balanced-Layer Theory of Liquid Film Formation,” Industrial & Engineering Chemistry 23(11), pp. 1283-1288.
8. Foulk, C.; Barkley, J.E. (1943). “Film Formation by Pure Liquids,” Industrial & Engineering Chemistry 35(9), pp. 1013-1016.
9. Cassel, H.M. (1944). “Physical Aspects of Foaming in Steam Generation,” Journal of Applied Physics 15(12), pp. 792-798.
10. Schnurmann, R. (1929). “Die Grösse von Gasblasen in Flüssigkeiten (The Size of Bubbles in Liquids),” Zeitschrift für Physikalische Chemie (Journal of Physical Chemistry) 143(1), pp. 456-474.
11. Schnurmann, R. (1937). “Über die Größe von Gasblasen in Flüssigkeiten (About the size of gas bubbles in liquids),” Kolloid-Zeitschrift (Colloid Journal) 80(2), pp. 148-151.
12. Schnurmann, R. (1939). “Antifoaming Devices,” Industrial & Engineering Chemistry 11(5), Analytical Edition, pp. 287-288.
41 the ANALYST Volume 30 Number 2 Why Boilers Foam and How to Prevent It continued
Figure 17: Savings in fuel, greenhouse gas emissions, make-up water and sewer water at a large pulp and paper mill.
Figure 18: Savings in fuel, greenhouse gas emissions, make-up water and sewer water at a large university’s teaching hospital.
13. Schnurmann, R. (1939). “The Size of Gas Bubbles in Liquids and its Effects on the Rate of Dissolution of Metals in Liquids with Hydrogen Evolution and on Priming of Boiler Feed Water,” Journal of the Indian Chemical Society, London, 58, p. 172.
14. Schnurmann, R. (1943). “On the Size of Gas Bubbles in Liquids,” Navy Department, David W. Taylor Model Basin.
15. Marrucci, G.; Nicodemo, L. (1967). “Coalescence of Gas Bubbles in Aqueous Solutions of Binorganic Electrolytes,” Chemical Engineering Science 22(9), pp. 1257-1265.
16. Lessard, R.R.; Zieminski, S.A. (1971). “Bubble Coalescence and Gas Transfer in Aqueous Electrolytic Solutions,” Industrial & Engineering Chemistry Fundamentals 10(2), pp. 260-269.
17. Craig, V.S. Ninham, B.W.; Pashley, R.M. (1993). “The Effect of Electrolytes on Bubble Coalescence in Water,” The Journal of Physical Chemistry 97(39), pp. 10192-10197.
18. Craig, V.; Ninham, B.; Pashley, R. (1993). “Effect of Electrolytes on Bubble Coalescence,” Nature, 364(6435), p. 317.
19. Hofmeier, U.; Yaminsky, V.; Christenson, H. (1995). “Observations of Solute Effects on Bubble Formation,” Journal of Colloid and Interface Science 174(1), pp. 199-210.
20. Christenson, H.; Yaminsky, V. (1995). “Solute Effects on Bubble Coalescence,” The Journal of Physical Chemistry 99(25), pp. 10420-10420.
21. Craig, V.S. (2004). “Bubble Coalescence and Specific-Ion Effects,” Current Opinion in Colloid & Interface Science 9(1-2), pp. 178-184.
22. Marčelja, S. (2004). “Short-Range Forces in Surface and Bubble Interaction,” Current Opinion in Colloid & Interface Science 9(1-2), pp. 165-167.
23. Mucha, M.; et al. (2005). “Unified Molecular Picture of the Surfaces of Aqueous Acid, Base, and Salt Solutions,” ACS Publications.
24. Marcelja, S. (2006). “Selective Coalescence of Bubbles in Simple Electrolytes,” The Journal of Physical Chemistry B 110(26), pp. 13062-13067.
25. Jungwirth, P.; Tobias, D.J. (2006) “Specific Ion Effects at the Air/Water Interface,” Chemical Reviews 106(4), pp. 1259-1281.
26. Ribeiro, C.u.P.; Mewes, D. (2006). “On the Effect of Liquid Temperature Upon Bubble Coalescence,” Chemical Engineering Science 61(17), pp. 5704-5716.
27. Ribeiro, C.u.P.; Mewes, D. (2007). “The Effect of Electrolytes on the Critical Velocity for Bubble Coalescence,” Chemical Engineering Journal 126(1), pp. 23-33.
28. Henry, C.L.; et al. (2007). “Ion-Specific Coalescence of Bubbles in Mixed Electrolyte Solutions,” The Journal of Physical Chemistry C 111(2), p. 1015-1023.
29. Ribeiro, C.u.P.c. (2008). “On the Estimation of the Regime Transition Point in Bubble Columns,” Chemical Engineering Journal 140(1), pp. 473-482.
30. Karakashev, S.I.; et al. (2008). “Anomalous Ion Effects on Rupture and Lifetime of Aqueous Foam Films Formed from Monovalent Salt Solutions up to Saturation Concentration,” Langmuir 24(20), pp. 11587-11591.
31. Christenson, H.; et al.(2008). “Electrolytes that Show a Transition to Bubble Coalescence Inhibition at High Concentrations,” The Journal of Physical Chemistry C 112(3), pp. 794-796.
32. Craig, V.; Henry, C. (2010). “Inhibition of Bubble Coalescence by Salts and Sugars,” Australian National University.
33. Yaminsky, V.V.; et al. (2010). “Stability of Aqueous Films between Bubbles. Part 1: The Effect of Speed on Bubble Coalescence in Purified Water and Simple Electrolyte Solutions,” Langmuir 26(11), pp. 8061-8074.
34. Yaminsky, V.V.; et al. (2010). “Stability of Aqueous Films between Bubbles. Part 2: Effects of Trace Impurities and Evaporation,” Langmuir 26(11), pp. 8075-8080.
35. Del Castillo, L.A.; Ohnishi, S.; Horn, R.G. (2011). “Inhibition of Bubble Coalescence: Effects of Salt Concentration and Speed of Approach,” Journal of Colloid and Interface Science 356(1), pp. 316-324.
36. Nguyen, P.T.; et al. (2012). “The Influence of Gas Velocity, Salt Type and Concentration on Transition Concentration for Bubble Coalescence Inhibition and Gas Holdup,” Chemical Engineering Research and Design 90(1), pp. 33-39.
37. Katsir, Y.; Marmur, A. (2014). “Rate of Bubble Coalescence Following Quasi-Static Approach: Screening and Neutralization of the Electric Double Layer,” Scientific Reports, 4, p. 4266.
38. Katsir, Y.; Marmur, A. (2014). “Rate of Bubble Coalescence Following Dynamic Approach: Collectivity-Induced Specificity of Ionic Effect,” Langmuir 30(46), pp. 13823-13830.
39. Quinn, J. (2014). “Bubble Behaviour in Frother and Inorganic Salt Solutions,” McGill University Libraries (Montreal).
40. Quinn, J.; et al. (2014). “Critical Coalescence Concentration of Inorganic Salt Solutions,” Minerals Engineering, 58, pp. 1-6.
41. Firouzi, M. (2014). “Drainage and Stability of Foam Films during Bubble Coalescence in Aqueous Salt Solutions,” The University of Queensland, School of Chemical Engineering.
42. Katsir, Y.; Goldstein, G.; Marmur, M. (2015). “Bubble the Wave or Waive the Wubble: Why Seawater Waves Foam and Freshwater Waves Do Not?” Colloids and Interface Science Communications, 6, pp. 9-12.
43. Firouzi, M.; Howes, T; Nguyen, A.V. (2015). “A Quantitative Review of the Transition Salt Concentration for Inhibiting Bubble Coalescence,” Advances in Colloid and Interface Science, 222, pp. 305-318.
44. Orvalho, S. (2015). “Bubble Coalescence: Effect of Bubble Approach Velocity and Liquid Viscosity,” Chemical Engineering Science, 134, pp. 205-216.
45. Sovechles, J.M.; Waters, K.E. (2015). “Effect of Ionic Strength on Bubble Coalescence in Inorganic Salt and Seawater Solutions,” AIChE Journal 61(8), pp. 2489-2496.
46. Sujan, A.; Vyas, R.K. (2018). “Estimation of Transition Concentration of Aqueous Mixtures of Single and Binary Electrolytes for Bubble Coalescence Inhibition,” Chemical Papers, pp. 1-21.
47. Dudek, M.; et al. (2019). “Microfluidic Method for Determining Drop-Drop Coalescence and Contact Times in Flow,” Colloids and Surfaces A: Physicochemical and Engineering Aspects, p. 124265.
48. Gong, S.; et al. (2019). “A Theoretical Model for Bubble Coalescence by Coupling Film Drainage with Approach Processes,” Chemical Engineering Science
49. Duignan, T.T. (2021). “The Surface Sotential Explains Ion Specific Bubble Coalescence Inhibition,” Journal of Colloid and Interface Science, 600, pp. 338-343.
50. Blanchard, D.C.; Syzdek, L.D. (1988). “Film Drop Production as a Function of Bubble Size,” Journal of Geophysical Research: Oceans 93(C4), pp. 3649-3654.
51. Tavera, F.; Gomez, C.; Finch, J. (1996). “Novel Gas Hold-Up Probe and Application in Flotation Columns,” Transactions of the Institution of Mining and Metallurgy. Section C. Mineral Processing and Extractive Metallurgy, 105.
52. Tavera-Miranda, F.J. (1996). “Flow Cells to Measure Electrical Conductivity : Use in Estimating Gas Holdup in Flotation Systems,” McGill University Libraries (Montreal).
53. Tavera, F.; Gomez, C.; Finch, J. (1998). “Conductivity Flow Cells for Measurements on Dispersions,” Canadian Metallurgical Quarterly 37(1), pp. 19-25.
54. Tavera, F.; Escudero, R. (2002). “Gas Hold-Up and Solids Hold-Up in Flotation Columns: On-Line Measurement Based on Electrical Conductivity,” Mineral Processing and Extractive Metallurgy 111(2), pp. 94-99.
55. Gomez, C.; Finch, j. (2002). “Gas Dispersion Measurements in Flotation Machines,” CIM Bulletin 95(1066), pp. 73-78.
56. Gomez, C.; Cortes-Lopez, F.; Finch, J. (2003). “Industrial Testing of a Gas Holdup Sensor for Flotation Systems,” Minerals Engineering 16(6), pp. 493-501.
57. Gomez, C.O.; Finch, J.A. (2007). “Gas Dispersion Measurements in Flotation Cells,”. International Journal of Mineral Processing 84(1), pp. 51-58.
58. Vinnett, L.; et al. (2018). “An Image Analysis Approach to Determine Average Bubble Sizes Using One-Dimensional Fourier Analysis,” Minerals Engineering, 126, pp. 160-166.
59. Hernandez Aguilar, J.R. (2004). “An Imaging Technique for Sizing Bubbles in Flotation Systems,” McGill University Libraries (Montreal).
60. Schwarz, S.; Alexander, D. (2006). “Gas Dispersion Measurements in Industrial Flotation Cells,” Minerals Engineering 19(6), pp. 554-560.
61. Leiva, J.; et al. (2010). “Estimation of the Actual Bubble Surface Area Flux in Flotation,”. Minerals Engineering 23(11-13), pp. 888-894.
62. Vinnett, L.; Contreras, F.; Yianatos, J. (2012). “Gas Dispersion Pattern in Mechanical Flotation Cells,” Minerals Engineering, 26, pp. 80-85.
63. Vinnett, L.; Alvarez-Silva, M. (2015). “Indirect Estimation of Bubble Size Using Visual Techniques and Superficial Gas Rate,” Minerals Engineering, 81, pp. 5-9.
64. Vazirizadeh, A. (2015). “The Relationship Between Hydrodynamic Variables and Particle Size Distribution in Flotation,” Materials Science
65. Vazirizadeh, A.; Bouchard, J.; del Villar, R. (2015). “On the Relationship between Hydrodynamic Characteristics and the Kinetics of Column Flotation. Part I: Modeling the Gas Dispersion,” Minerals Engineering,74, pp. 207-215.
42 the ANALYST Volume 30 Number 2 Why Boilers Foam and How to Prevent It continued
66. Vazirizadeh, A.; Bouchard, J.; Chen, Y. (2016). “Effect of Particles on Bubble Size Distribution and Gas Hold-Up in Column Flotation,” International Journal of Mineral Processing, 157, pp. 163-173.

67. Francis, M.J.; Pashley, R.M. (2009). “Thermal Desalination Using a Non-Boiling Bubble Column,” Desalination and Water Treatment 12(1-3), pp. 155-161.

68. Shahid, M.; Pashley, R.M. (2014). “A Study of the Bubble Column Evaporator Method for Thermal Desalination,” Desalination, 351, pp. 236-242.
69. Denman, W.L. (1942). “Method of Treating Waters, Including Boiler Waters and Compositions Therefor,” U.S. Patent No. 2,304,805, United States Patent Office, Washington, D.C.
70. Gunderson, L.O. (1943). “Method of Conditioning Water,” U.S. Patent No. 2,328,551, U.S. Patent Office, Washington, D.C.
71. Gunderson, L.O. (1945). “Method of Conditioning Water,” U.S. Patent No. 2,366,727, U.S. Patent Office, Washington, D.C.
72. Denman, W.L. (1946). “Method of Treating Waters, Including Boiler Waters, and Composition Therefor,” U.S. Patent No. 2,410,543, U.S. Patent Office, Washington, D.C.
73. Gunderson, L.; Denman, W. (1948). “Polyamide Foam Inhibitors,” Industrial and Engineering Chemistry 40(8), pp. 1363-1370.
74. Gunderson, L.O. (1948). “Method of Conditioning Water,” U.S. Patent No. 2,442,768, U.S. Patent Office, Washington, D.C.
75. Gunderson, L.O. (1949). “Method of Inhibiting Foaming in Steam Boilers,” U.S. Patent No. 2,485,378, U.S. Patent Office, Washington, D.C.
76. Gunderson, L.O. (1949). “Method of Inhibiting Foam Formation in an Aqueous Gas-Liquid System,” U.S. Patent No. 2,461,730, U.S. Patent Office, Washington, D.C.
77. Gunderson, L.O. (1950). “Amide Composition,” U.S. Patent No. 2,528,274, U.S. Patent Office, Washington, D.C.
78. Gunderson, L.O. (1950). “Method of and Composition for Inhibiting Foaming in Steam Boilers,” U.S. Patent No. 2,485,378, U.S. Patent Office, Washington, D.C.
79. Gunderson, L.O. (1950). “Prevention of Foaming in Steam Generation,” U.S. Patent No. 2,493,453, U.S. Patent Office, Washington, D.C.
80. Gunderson, L.O. (1950). “Method of Inhibiting Foaming in Steam Boilers,” U.S. Patent No. 2,528,273, U.S. Patent Office, Washington, D.C.
81. Gunderson, L.O. (1952). “Method and Composition for Inhibiting Foam in Aqueous Systems,” U.S. Patent Office, Washington, D.C.
82. Gunderson, L.O. (1952). “Prevention of Foaming in Steam Generation,” U.S. Patent No. 2,600,361, U.S. Patent Office, Washington, D.C.
83. Gunderson, L.O. (1952). “Prevention of Foaming in Steam Generation,” U.S. Patent No. 2,583,771, U.S. Patent Office, Washington, D.C.
84. Gunderson, L.O. (1952). “Method of Inhibiting Foam Formation in Steam Generation,” U.S. Patent No. 2,596,925, U.S. Patent Office, Washington, D.C.
85. Gunderson, L.O. (1952). “Acid and Quaternary Salts of Polyamides,” U.S. Patent No. 2,583,772, U.S. Patent Office, Washington, D.C.
86. Gunderson, L.O. (1953). “Compounds for Altering Surface Characteristics of Liquids,” U.S. Patent No. 2,630,439, U.S. Patent Office, Washington, D.C.
87. Gunderson, L.O. (1953). “Method of Inhibiting Foaming in Water,” U.S. Patent No. 2,647,088, U.S. Patent Office, Washington, D.C.
88. Gunderson, L.O. (1953). “Compounds for Altering Surface Characteristics of Liquids,” U.S. Patent No. 2,630,440, U.S. Patent Office, Washington, D.C.
89. Denman, W. (1954). “Foaming in Boilers,” Industrial & Engineering Chemistry 46(5), pp. 992-994.
90. Denman, W.L. (1955). “Method of Inhibiting Foam Formation in Steam Generating Systems,” U.S. Patent No. 2,727,867, U.S. Patent Office, Washington, D.C.
91. Cheng, L.; Mewes, D.; Luke, A. (2007). “Boiling Phenomena with Surfactants and Polymeric Additives: A State-of-the-Art Review,” International Journal of Heat and Mass Transfer 50(13), pp. 2744-2771.
92. Raza, M.Q.; Kumar, N.; Raj, R. (2018). “Wettability-Independent Critical Flux during Boiling Crisis in Foaming Solutions,” International Journal of Heat and Mass Transfer, 216(Part A), pp. 567-579
Endnote
ATGWT is the company mentioned in the text that has developed its own instruments (patent pending) to simulate boiler conditions.
Louis Godbout worked as a research assistant and academic associate at McGill University’s Pulp and Paper Research Center for more than 20 years, before joining TGWT in 2016. He was one of the pioneers in the field of nanocrystalline cellulose research. He developed several patents and published many articles on these materials as well as on the fundamental structure of the native cellulose crystal, the most abundant natural polymer. He is the Director of R&D and Innovation at TGWT, where he pursues the development of industrial applications of tannins. Mr. Godbout has also been active in the field of scientific education. He may be contacted at lgodbout@tgwt.com
Simina Alungulesa obtained her bachelor’s and master’s degree at McGill University in chemical engineering. As a graduate researcher, she focused on biological wastewater treatment and ozonation. She joined TGWT in 2021 as a research scientist and is part of the R&D and Innovation team. Ms. Alungulesa may be contacted at salungulesa@tgwt.com
Keywords: BOILERS, BOILER WATER, ECONOMICS, FOAM, OPERATIONS, STEAM, TANNINS, CARRYOVER
43 the ANALYST Volume 30 Number 2 Why Boilers Foam and How to Prevent It continued
This paper was presented at the AWT’s 2022 Conference, which was conducted Sept. 21-24, 2022, in Vancouver, B.C., Canada.


Lessons Learned from Legionella: When the Worst Happens—A Case Study from the UK
 John Sandford,
Environmental
“Experience is the hardest kind of teacher—it gives you the test first and the lesson afterwards.”
On Jan. 11, 2012, a 95-year-old male died from Legionnaires’ disease in a supported living care home. For five weeks prior to his death, he had been a resident of the home recovering from a fractured leg and a stroke. The building was owned and operated by the local city council in the county of Berkshire in the United Kingdom. It had no evaporative cooling system, no stored domestic water on site, and the deceased’s room contained no shower. The domestic water system was fed directly from the local water utility company.
To give some clarity to U.S. readers, the city council in this case is analogous to an incorporated city council in the United States. It has directly elected officials and has responsibilities for providing services such as schools, housing, social care, planning, building regulation, waste disposal, and all the functions associated with local government.
46 the Analyst Volume 30 Number 2
CWT SMS
Ltd.
– Oscar Wilde
This is a case study not of the source of the Legionella that caused the resident’s death, although never proved, this probably came from the care home water system. This is a story of how the incident was investigated and prosecuted by the Health and Safety Executive (HSE) and, especially, the impact on the Engineering Manager—who had responsibility for the control of Legionella bacteria in the building. His is a story that is now often used and misused by many U.K. training organizations on how not to do things. These are organizations who weren’t involved in the case and got all their information from the media.
It’s my contention that the law surrounding the management of Legionella in the U.K. is so onerous and so complex that it has become counterproductive and damages individuals who are professional, diligent, and law-abiding but are ill-equipped to defend themselves against a rapacious regulator when they are enforcing, and often misapplying, the law. All this without any improvement in public health.
This contrasts with the U.S., where there are some regulatory requirements, such as Local Law 77 in New York City and New York State Public Health Law, where sections of ASHRAE 188 are used to inform legislation. ASHRAE 188 is not prescriptive but gives an appropriate framework to manage Legionella in artificial water systems. This lack of prescriptive advice has been a source of criticism from some building managers (1). I believe that this really is a case of being careful of what you wish for. ASHRAE 188 gives an excellent framework for competent water safety groups and water treaters to follow. If competent individuals and teams apply it, it will give a good proportionate risk-based approach that will protect public health.
UK Legal Framework
The control of Legionella bacteria is tightly regulated in the UK and has been since an outbreak of Legionnaires’ disease in the English Midlands in Stafford District Hospital in 1985. The Badenoch Report (2) commissioned by the U.K. government to investigate this outbreak cited figures of 101 cases Legionnaires’ disease and resulted in 28 fatalities caused by an evaporative cooling system. So, for the first time Legionnaires’ disease was seen as a significant public health issue that required an appropriate regulatory response.
Since then, regulation has become onerous to the extent of being self-defeating in terms of the public health issue and now the biggest risk is not from Legionnaires’ disease per se, but from a criminal enforcement action from the HSE.
Health and Safety law in the U.K. is underpinned by the Health and Safety at Work Act 1974 (HSWA), which is what is known as an “enabling act,” meaning the government can now very easily bring in subordinate regulations called “secondary legislation,” which is law created by ministers (or other bodies) under powers given to them by an Act of Parliament. It is used to fill in the details of Acts (primary legislation). These details provide practical measures that enable the law to be enforced and operate in “daily life” (3). It can also enable the HSE to publish what are called Approved Codes of Practice (ACoP). ACoPs hold special legal status (4), which means that in themselves they are not law; however, they can be used by the HSE to illustrate what an organization should do to comply with the law.
The control of Legionella bacteria in water systems comes under a complex hierarchy of law, ACoP, and guidance. I have listed it in summary form below, showing the relevant legislation and guidance. It is by no means comprehensive there are other regulations and guidance that apply to Legionella control, but below are the main statutes that the HSE will generally use to enforce the law surrounding Legionella:
1. Health and Safety at Work Act 1974—Primary Legislation
Control of Substances Hazardous to Health 2002 (COSHH)—Secondary Legislation
The Management of Health and Safety at Work Regulations 1999—Secondary Legislation
Notification of Cooling Towers and Evaporative Condensers Regulations 1992—Secondary Legislation
Reporting of Injuries, Diseases and Dangerous Occurrences Regulations 2013—Secondary Legislation
Others
2. L8 (4th Edition) Legionnaires’ disease: The Control of Legionella Bacteria in Water Systems: Approved Code of Practice and guidance on regulations—ACoP
HSE HSG 274 Part 1: The Control of Legionella Bacteria in Evaporative Cooling Systems—Guidance
47 the ANALYST Volume 30 Number 2 Lessons Learned from Legionella : When the Worst Happens—A Case Study from the UK continued
HSE HSG 274 Part 2: The Control of Legionella Bacteria in Hot and Cold-Water Systems—Guidance
HSE HSG 274 Part 3: The Control of Legionella Bacteria in Other Risk Systems—Guidance
Department of Health (HTM 04-01) Safe Water in Healthcare Premises, Parts, A, B, C, and DO8— Guidance in Healthcare
Others
There are at least 58 species of Legionella bacteria, of which at least 25 have been shown to cause human disease (5). The World Health Organization (WHO) (6) states that “the primary Legionellae associated with outbreaks of disease from these systems appear to be L. pneumophila serogroup 1” and some countries and jurisdictions will concentrate on Legionella pneumophila serogroup 1. However, the HSE’s view is that all Legionella bacteria have the potential to cause harm and hence they do not distinguish between any species and the ACoP and all guidance documentation only mention ‘Legionella bacteria’ (7).
Another key difference between the U.S. and the U.K. is whereas Local Law 77 is specific to evaporative cooling systems, the U.K. law applies to all engineered water systems within a facility.
The sheer body of law and copious guidance is overwhelming, and although guidance and the ACoPs in and of themselves are not law, because of the authoritative source they come from, namely the HSE, they are very persuasive in the courts to the extent that they become de facto law.
In addition, from Oct. 1, 2012, new regulations enabled the HSE to levy a Fee for Intervention (FFI) if in the HSE’s view an individual or organization had committed a material breach of the law (8). This is a fee charged to cover the cost of an HSE inspector’s time for them to complete their investigation. The HSE do not need to apply to the courts to charge this fee; they merely need to issue what is called a “Notification of Contravention.” These fees are updated periodically and as of the time of this article the fees are US$203 per inspector per hour. This is the equivalent of the police charging for their time but without ever having to definitively prove guilt but just for questioning a suspect.
Duty Holder and Responsible Person
In the U.K. there are specific legally defined roles when it comes to Legionella control. The first is known as the “Duty holder” (9). Duty Holders are usually the building owners, landlords, CEOs of organizations and can sometimes even be the organization itself. They have a legal duty to ensure that Legionella risks are managed, risk assessments are completed, and water safety plans are in place and to ensure adequate budgets are available to facilitate good Legionella control.
The second legally defined role is that of a “Responsible Person” (RP), who is appointed by the Duty Holder. The RP’s position is usually a middle manager, and their primary duty is to “ensure that all operational procedures are carried out effectively” (10). Both roles come with legal duties and liabilities.
HSE inspectors are given wide-ranging powers under Section 20 of the 1974 HSWA (11), which includes the power to interview someone under caution and instigate enforcement actions and prosecutions in a criminal court.
Guilty Until Proven Innocent
In the U.K., as in the U.S. and Canada, the normal burden of proof in a criminal case is “beyond all reasonable doubt” (12). However, Section 40 of the 1974 HSWA imposes a reverse burden of proof when it comes to health and safety issues and what is “reasonably practicable.” This seems against natural justice and yet the reverse burden of proof survived a challenge in the Court of Appeal (13). It is hardly surprising that individuals and will often just plead guilty when a case is brought against them, even when, as in this case, the parties involved had done all that was reasonably practical to prevent anyone becoming ill and indeed should have been held up as an example of how things should be done. Nonetheless, in January 2016 the city council in Berkshire pleaded guilty to health and safety breaches, and they accepted charges without any sort of legal fight. This was based on evidence presented by the HSE that was thought inaccurate and unfair by the people involved in the case (14).
“Why let the facts get in the way of a good story?”— Responsible Party
48 the ANALYST Volume 30 Number 2 Lessons Learned from Legionella : When the Worst Happens—A Case Study from the UK continued
The Case
My company had a contract with the city council to help manage Legionella on their sites for about 10 years. After the resident had died, several of my colleagues and I were interviewed by the HSE, we attended the coroner’s inquest, and we were heavily involved in trying to remedy the Legionella issue at the care home, the outcome of which fundamentally changed the operation of the company.
The person who the council had deemed to be the “Responsible Person” (for the remainder of this report referred to by the initials RP) was the engineering manager who had worked at the city council for many years and was responsible for, among other things, gas safety, mechanical, and electric works and Legionella control works across most of the council’s corporate, commercial and care home properties. In November 2012, when the resident died, the HSE also deemed him to be the RP, despite this position not being detailed in any council policy, or him ever being formally notified or accepting the position in writing.
As things would run their course over the next few years, I realized that although we had both been involved in the case, I had never actually sat down and discussed the case from his point-of-view—even though in the aftermath of the resident’s death he really was in the eye of the storm. So, I asked if I could sit down and interview him, to get his side of things and report them as he saw them. This seemed fitting because some time had passed since the resolution of the case. This we did on May 10, 2022.
The RP was notified of a suspected case of Legionnaires’ disease on Friday, October 19, 2012, at 4.30 PM. He quickly arranged for Legionella samples to be taken from the entire water system at the care home. Both pre-flush without disinfection (15) and post-flush with disinfection samples were taken and these samples were analysed using the culture method (16). Legionella pneumophila serogroup 1 was recovered from a wash hand basin (WHB) mixer tap in the resident’s room using the pre-flush no disinfection sample type. The count recovered was 100 colony forming units per liter (CFU/L), which is the metric used in the U.K.—this is equivalent to 0.1 CFU/mL. All other samples from the water system, both pre-flush and post-flush, came back as not detected. No Legionella bacteria were recovered
from the resident’s kitchenette sink immediately adjacent to the WHB. Therefore, although the source of the Legionella bacteria that caused the resident’s illness was never definitively confirmed, it was highly probable that it came from the wash hand basin in the resident’s room, even though the level of Legionella detected was very low.
The care home had been fully refurbished in 2011 with most of the plumbed water system replaced. There was no evaporative cooling system, there was no stored water, the building’s domestic hot and cold-water system was supplied via safe drinking water from the local water company and the resident’s room didn’t have a shower. The resident couldn’t use the services in his room as he had been admitted to the home suffering from a stroke and had fractured his leg. Whilst in the care home, he had one-to-one care and all personal washes had been bed-baths.
During the immediate days after being notified of the case of LD, the RP arranged to have point-of-use legionella filters installed on each shower and faucet (17) to manage the immediate risk. Then on 22/10/2012 the RP attended a meeting with the council’s legal department and senior officers to discuss the case.
He said during the meeting that the thing he found most striking was that the first question he was asked was “What is Legionella? ” This he found frustrating as part of his role had been to provide training, which all the attendees of the meeting had previously been offered but had declined.
When I asked how the RP felt at that time, he said his immediate thoughts were obviously with the resident who was ill, and he was very concerned for his welfare. However, despite the case and positive Legionella count from his room, he felt he’d organized all the right things, the risk assessment, the written scheme of control, training and indeed the subsequent sampling that he had done without being instructed to do so, and that had been done prior to an entire system disinfection.
He was confident that he would not be personally liable and that both he and the council had “done all the right things.”
49 the ANALYST Volume 30 Number 2 Lessons Learned from Legionella : When the Worst Happens—A Case Study from the UK continued
JS: “The 21st of December? The shortest day of the year.”
RP: “Well, it was the longest day of my life!” –Interview (Reference 14).
When the Worst Happens
When I asked the RP if he could remember the actual date the resident died, it was obvious it was seared into his memory as he immediately replied “November 1st, 2012.” He said the death just totally undermined any confidence he had previously had. By this stage, an HSE investigation had begun and after a period of almost two months from the date of the fatality, the RP was called to the civic centre on December 21, 2012, to be interviewed by the HSE. On entering the meeting there were no pleasantries or formal introductions, he was just asked to confirm his name. Then began what he calls the longest day of his life. After confirming his name, the HSE advised him that the interview was to be conducted under caution: “You do not have to say anything. But it may harm your defence if you do not mention when questioned, something, which you later rely on in court. Anything you do say may be given in evidence ” (18).
All the RP could think about was the well documented Barrow-in-Furness outbreak of Legionnaires’ disease that had occurred a few years earlier.
In August 2002, seven members of the public died and 180 people suffered ill-health because of an outbreak of Legionella at a council-owned arts and leisure facility in the town centre of Barrow-in-Furness, Cumbria, U.K. (19). The source of the outbreak was tracked back to a cooling tower in the arts and leisure facility and in that case both the council and the responsible person were charged with manslaughter. All the RP could now think about was did the same fate await him?
The RP reports that at this time everything changed. He had no legal representation in the meeting, he was interviewed for 8.5 hours with very little break and during the meeting the HSE made it very clear that they wanted to pursue a prosecution. An interview transcript of 26 pages was compiled by the investigators—this transcript was read back to him after the interview, and it was again read out at the coroner’s inquest that occurred in May 2013. However, to this day, the RP has never seen or been offered a copy for his own records,
despite his request to have one. Between that meeting and the coroner’s inquest, the cloud of a potential criminal charge, up to and including manslaughter, hung over the RP.
The RP told me that the worst thing was that the HSE never seemed to be interested in justice or the actual root cause of the case; their only motive seemed to be bringing around a successful criminal prosecution, and preferably a prosecution that included both the council and the RP himself.
“Investigations have identified flaws, (in the scheme of control) but it is not possible to see from the evidence that these flaws contributed directly to (the resident’s) death.” –Coroner (May 14, 2013)
Coroner’s Inquest
On May 14, 2013, a coroner’s inquest was held. During this inquest, the RP gave 2.5 hours of what the coroner would later describe as ‘impressive’ evidence and he received a thanks from the son and family of the deceased resident—none of which was reported in the media.
The coroner’s function is to establish four things:
1. Who died?
2. When they died?
3. Where they died?
4. How/why they died.
The key point here was Point 4. Had the coroner ruled that the death was potentially due to criminal negligence, the inquest would have adjourned at that time, the case would be handed over to the police for a criminal investigation. However, the coroner returned what was called a ‘narrative verdict’ stating the following (Reference 20):
“Tests confirmed that the strand of Legionnaires’ found in the wash basin of [the deceased’s] room is the same type, that is not particularly common, found in his urine sample, supporting the view that on the balance of probability the tap was the source of the Legionnaires’.” and that “Investigations have identified flaws, in particular in regard to training, staff recordkeeping and audit-taking but it is not possible to see from the evidence that these flaws contributed directly to [the resident’s] death.”
50 the ANALYST Volume 30 Number 2 Lessons Learned from Legionella : When the Worst Happens—A Case Study from the UK continued





The narrative verdict meant that the HSE could no longer pursue a manslaughter case against the RP. However, the council would still be pursued for the health and safety breaches of the lack of recorded training and the gaps in the control scheme when the caretaker was away, even though it was highly unlikely that these flaws had led directly to the fatality.
The RP was left sorrowful because of the resident’s death but relieved that he could now put this all behind him.
“I have been through two years of records in forensic detail, and I have a couple of questions.” – HSE Summer 2014
Aftermath
In 2014, over a year after the coroner’s inquest, the HSE contacted the RP again and it became apparent they were still pursuing a case against the council and looking for some more evidence from the RP.
The RP said he got a call out-of-the blue from the HSE inspector, and she said “I have been through two years of records in forensic detail, and I have a couple of questions, the water temperature in Flat 32 was x but 3 months later it was a different temperature. Why was this?” To which the only possible answer the RP could give was “I don’t know?”
My belief is poor understanding from the regulator on the concept of risk, which in turn has led to the boundary between hazard and risk becoming blurred.
Hazard versus Risk
The health and safety law is specific in the U.K., it should all be about managing risk. You should complete a risk assessment and then implement control measures if they are necessary. These controls should be proportionate and commensurate with the degree of risk. However, the copious amounts of regulation, ACoPs and guidance mean that everyone, both organizations and enforcement officers, are not discussing risk, they are discussing hazard. Legionella is found everywhere in our water systems (21). It is always there, but what we should be doing is assessing what is an actual risk to public health in a specific installation or application.
The Canadian Centre for Occupational Health and
Safety (22) gives a good definition of both terms:
Hazard: A hazard is any source of potential damage, harm or adverse health effects on something or someone, in this case that would be the presence of Legionella bacteria
Risk: Risk is the chance or probability that a person will be harmed or experience an adverse health effect if exposed to a hazard. Thus, the risk here is someone being exposed to that Legionella bacteria and becoming ill.
The HSE Does Not Have to Prove Harm
The HSE will state that their role is to enforce health and safety law and they only must prove risk of harm and not that any harm occurred.
This was established in a case between the HSE and the Science Museum in London in 1993 (23). An HSE inspection of the evaporative cooling towers at the Science Museum noted that Legionella bacteria had been isolated in the system. Based on this the HSE successfully prosecuted the Science Museum under Section 3 of the Health and Safety at Work Act 1974. The Science Museum appealed the verdict stating that no one had become ill or had been exposed to the bacteria. The Museum lost their appeal with the Judge ruling that the HSE did not have to prove harm or that anyone had been exposed to the bacteria, it was sufficient that bacteria were there. The HSE did not have to prove any actual harm, just risk of harm (23).
The presence of Legionella bacteria is always going to present a risk from harm. This means the HSE often has no incentive to do any actual root cause analysis, and this has had the unintended consequence of moving us from managing risk, to managing hazard.
WHO states that “Legionellae are ubiquitous in natural and artificial water environments worldwide.” (21). Ubiquitous, meaning present, appearing, or found everywhere. Therefore, if you go down the route of trying to eradicate all Legionella , this is an expensive, difficult, and ultimately futile thing to attempt—equivalent of China’s Zero Covid Policy, which has been a disaster both economically and crucially to people’s welfare and wellbeing (24) and is an example of the outcomes you get when you manage hazard and not risk.
52 the ANALYST Volume 30 Number 2 Lessons Learned from Legionella : When the Worst Happens—A Case Study from the UK continued
The weight of regulation and guidance that surrounds the management of legionella bacteria in the U.K. and the attitude of the HSE, means organizations are implementing written schemes of control that are hazard based, onerous and costly without ever moving the needle on the risk meter.
The U.K. HSE are effectively implementing a Zero Legionella Policy.
Council Prosecuted
Although no case was brought against the RP individually, the HSE did pursue a case against the council and in January 2016 the council pleaded guilty to breaches of health and safety law under Section 3 of the Health and Safety at Work Act and were fined £100,000 ($115,000 USD) with £20,000 ($23,000 USD) costs (25). This penalty did not include the fee for intervention that was charged for the investigation itself, which was approximately £30000 ($34,000 USD).
The RP had no idea that the case had gone to court and some of the things the council pleaded guilty to were based on evidence that was materially incorrect. However, as all the evidence against the council was accepted without challenge, it has now become a matter of what the RP describes as “established historic fact.”
From this moment on the RP’s sense of relief changed to an emotion of burning injustice.
To add insult to injury, as the RP still retains responsibility for Legionella control on many sites, he must attend routine mandatory Legionella update training where, on more than one occasion, this very case has been a component of the training course on “how not to do things.” However, training providers just have the media and the final court case as information sources and have no real understanding of what happened or indeed what the actual failure was that led to the death of the resident, but as the RP said during our interview: “Hey, why let the facts get in the way of a good story?”
I can speak from my own personal involvement in the case that the information sources used by both the media, training providers, and indeed the evidence presented by the HSE during the court case was, for the most part, materially incorrect and did nothing to
improve our management of Legionella in plumbed water systems. But as the evidence presented by the HSE was unchallenged by the council, it has become established fact and a matter of public record.
The Unexamined Exposure Route
The British Standard for Legionella risk assessment states there is a five-step chain of events required for someone to contract Legionnaires’ disease (26) and any risk assessment should evaluate each step to fully understand and properly evaluate risk. The chain of events normally comes in this order, according to the Risk Assessment document:
1. Contamination. The presence of Legionella bacteria in the water supply.
2. Amplification. An assessment of the conditions and whether they are likely to support Legionella growth, including temperature, water change rate, nutrients, materials of construction, and areas where the existing water is not replaced with fresh water.
3. Transmission. An assessment of whether droplets or aerosols are likely to form and spread.
4. Exposure. An assessment of the risk that droplets or aerosols will be inhaled (or contaminated water aspirated).
5. Susceptibility of individuals exposed. An assessment of the nature of the exposed population. Taking account of their vulnerability to Legionella infection.
The two main flaws in the written scheme of control that the HSE accurately identified in this case were:
Training was given to staff but and was not properly recorded.
The building caretaker was responsible for flushing little-used outlets/taps/faucets/showers etc and this flushing did not take place when the caretaker was absent (the HSE’s definition of little-used is an outlet not used for a period equal to or greater than seven days) (27).
As the coroner recorded in the inquest of May 2013, neither of these flaws were shown to contribute to the resident getting and succumbing to Legionnaires’ disease. No actual proper investigation was undertaken to definitively prove the transmission and exposure
53 the ANALYST Volume 30 Number 2 Lessons Learned from Legionella : When the Worst Happens—A Case Study from the UK continued
route of the legionella bacteria. The HSE will point out that this is not their role. As regulator their role is the enforcement of health and safety law—the organization that would have been responsible for investigating the source and the route of infection would have been Public Health England (PHE) (now the U.K. Health Security Agency), but no investigation took place as it was one sporadic case and not an outbreak, which would have triggered an intervention from PHE.
The RP believes that the deceased was exposed to Legionella bacteria during his out-patient trips to the local hospital. An alternate theory was that it did come from the facilities in the resident’s room with the transmission and exposure pathway being a medical device such as a nebulizer.
As far back as 1991, nebulizers were recognized as a mode of transmission for Legionnaires’ disease (28). The testing that was completed in the resident’s room isolated Legionella bacteria from the domestic hot water in the wash hand basin (WHB) in the bedroom. However, no Legionella bacteria were isolated from the kitchen sink faucets in the same flat. There is a belief that the residents’ incapacity meant the faucets in the WHB were in fact little-used, as care givers were probably using the flat kitchen sink for ease of use because of the bigger activity space between the faucet and sink, rendering the smaller WHB subject to, at best, intermittent and sporadic use.
In addition, there is anecdotal evidence from the care staff that the deceased had used a nebulizer during his stay at the care home to deliver medication.
These widely used medical devices have a mouthpiece or mask and a medication cup which require washing between uses and regular disinfection (29). A potential transmission and exposure route could have been nebulizers cleaned in the WHB, which was immediately adjacent to the resident’s bed, and not dried properly before the next use. This is a potential way to deliver an infectious dose right into the airways of the resident who was obviously susceptible.
There is often a working assumption that water outlets in occupied rooms are always in use, and hence these outlets may not be subject to control measures such
as regular flushing. Flushing is an excellent way of reducing the number of Legionella bacteria, but when this is not happening, if someone washes their hands or rinses some equipment in the outlet concerned, they and anyone else in the room could be exposed to large numbers of aerosolized Legionella bacteria. If that medical device is something like a nebulizer that perhaps isn’t dried properly it becomes a foreseeable and perhaps even probable route of infection. This at the very least warranted further investigation as it could help prevent future infections.
It should also be remembered that often it is just the maintenance and facilities teams that are deemed to require Legionella training. The nursing and caring staff may work for a completely different organization and just deliver care in the home and thus are often a gap in any control scheme.
Neither an investigation of the hospital the resident visited as an out-patient, or a detailed root cause analysis of the transmission and exposure pathway took place in this case, and this was a lost opportunity. The flaws identified by the HSE do not explain the actual exposure route that would have led to the death of the resident, and this lack of an investigation is a failure in public health.
Conclusion
Many colleagues from abroad look to the U.K. as a model on how Legionella is managed, due to the regulatory framework and the large amount of associated guidance on almost every type of water system. The original U.K. law was goal based, directing organizations and individuals to complete an assessment of a specific water system, and the risk it presented in exposing vulnerable people to Legionella bacteria. As it stands, the HSE only needs to prove risk of harm and does not have to do a proper root cause analysis on any case of Legionaire’s disease that they investigate.
Consequently, this means they often stipulate overly complicated and sometimes even inappropriate control measures, and they will take some form of action against organizations and individuals who do not follow the copious amounts of guidance to the letter. Effectively, this makes the ACoP and guidance de facto law. Yet these actions, without investigating actual transmission and exposure routes, do nothing to improve public health
54 the ANALYST Volume 30 Number 2 Lessons Learned from Legionella : When the Worst Happens—A Case Study from the UK continued
outcomes, and damage well-meaning individuals who may have made a simple mistake that opens them up to potentially life-changing criminal prosecutions and materially damages their long-term wellbeing.
My advice to my colleagues in the AWT is to always ensure the competence of those involved in Legionella control works and adopt ASHRAE 188 as it is a proportionate risk-based document that will protect public health without inflicting the collateral damage and unnecessary cost that the law in the UK is inadvertently imposing.
References
1. Blackmore, T. (2021). “Scaling Up H2O Podcast Ep. 203,” available from scalinguph2o.com/2021/07/16/203-the-one-with-our-across-the-pondlegionella-expert-john-sandford/ [Accessed: 23/05/2022].

2. Badenoch, J. (1986). “First Report of the Committee of Inquiry into the Outbreak of Legionnaires’ Disease in Stafford in April 1985,” Committee of Inquiry, Sir John Badenoch (chairman), (London: HMSO, 1986), pp. 14–17.
3. UK Parliament (2022). “What is Secondary Legislation?” available online from : www.parliament.uk/about/how/laws/secondary-legislation/ (accessed May 17, 2022).
4. UK Government Archives (1974). “Health and Safety at Work etc. Act 1974,” Section 16, available online from www.legislation.gov.uk/ukpga/1974/37/ section/16, (accessed May 18, 2022).
5. Special Pathogens Laboratory (2020). “Legionella species,” available from specialpathogenslab.com/legionella-species/ (accessed May 30, 2022).
6. WHO (2007). “Legionella and the Prevention of Legionellosis Section, p. xxii, available from apps.who.int/iris/bitstream/handle/10665/43233/ 9241562978_eng.pdf?sequence=1&isAllowed=y (accessed May 20, 2022).
7. Smith, D. (2022). “HSE Activity Update,” LCA Conference Roadshow 2022 (May 26, 2022), London.
8. HSE (2022). “What is Fee for Intervention?” available from www.hse.gov.uk/fee-for-intervention/what-is-ffi.htm (accessed May 18, 2022).
9. HSE (2013). “L8 Legionnaires’ Disease the Control of Legionella Bacteria in Water Systems, ACoP, paragraph 2, p. 5, available from www.hse.gov.uk/pubns/priced/l8.pdf (accessed May 18, 2022).
10. HSE (2013). “L8 Legionnaires’ Disease the Control of Legionella bacteria in water systems, ACoP, paragraph 51, p. 15, available from www.hse.gov.uk/pubns/priced/l8.pdf (accessed May 19, 2022).
11. HSWA (1974). Health and Safety at Work etc. Act 1974, Section 20, Powers of Inspectors.
12. Wikipedia (2022). “Reasonable Doubt,” available from en.wikipedia.org/wiki/Reasonable_doubt#United_States, (accessed May 18, 2022).
13. Davies v. Health and Safety Executive (2002). EWCA Crim 2949, Court of Appeal on 18th December 2002 (reported at [2003] IRLR 170).
14. Responsible Party (2022). Unpublished interview conducted by J. Sandford with the Responsible Party (May 10, 2022).
15. British Standard 7592 (2008). “Sampling for Legionella Bacteria in Water Systems,” Code Of Practice (British Standard) HSE.
16. Alpha Scientific, part of the Adey Group, 688 Stirling Road, Slough SL1 4ST In-house Method AM-06 UKAS Accredited.
17. Pall-Aquasafe™ Filters 0.2-μm sterilizing-grade filter, supplied by Pall Corp.
18. HSE (u.d.). “Interviewing Suspects,” paragraph 19, available from www.hse.gov.uk/enforce/enforcementguide/investigation/witness-questioning. htm#:~:text=The%20caution%20must%20be%20in,may%20be%20given%20 in%20evidence.%22 (accessed May 19, 2022).
19. 19. HSE (2006). “Report of the Public Meetings into the Legionella Outbreak in Barrow-in-Furness,” August 2002, available from www.hse.gov.uk/legionnaires/ assets/docs/barrowreport.pdf (accessed May 19, 2022).
20. Berkshire Live (2013). “Care Home Wash Basin Was source of Legionella,” available from www.getreading.co.uk/news/local-news/care-home-wash-basinsource-legionella-4189161 (accessed May 19, 2022).
21. WHO (2007). “Legionella and the Prevention of Legionellosis Section 2.1, p. 29, available from apps.who.int/iris/bitstream/handle/10665/43233/9241562978_eng. pdf?sequence=1&isAllowed=y (accessed May 20, 2022).
22. Canadian Centre for Occupational Health and Safety (2020). “Hazard and Risk,” available from www.ccohs.ca/oshanswers/hsprograms/hazard_risk.html (accessed May 20, 2022).
23. R v Board of Trustees of the Science Museum (1993) 3 All ER 853, [1993] 1 WLR 1171, [1993] ICR 876.
24. Yuan, Li (April 13,2022). “China’s ‘Zero Covid’ Mess Proves Autocracy Hurts Everyone,” New York Times, available from www.nytimes.com/2022/04/13/ business/china-covid-zero-shanghai.html (accessed May 21, 2022).
25. SHP (2016). “Council Sentenced after Legionella Death,” available from www. shponline.co.uk/in-court/reading-borough-council-sentenced-after-legionella-death/ accessed May 23, 2022).
26. The British Standards Institution (2019). BS 8580 Part 1: “Water Quality – Risk Assessments for Legionella Control – Code of Practice, BSI Standards Limited. London, England.
27. HSE (2014). HSG274 Legionnaires’ Disease Part 2: “The control of Legionella Bacteria in Hot- and Cold-Water Systems,” Table 2.1, p. 33, available from www.hse.gov.uk/pubns/priced/hsg274part2.pdf (accessed May 23, 2022).
28. Mastro, T.D.; Fields, B.S.; Breiman, R.F.; Campbell, J.; Plikaytis, B.D.; Spika, J.S. (March 1991). “Nosocomial Legionnaires’ Disease and Use of Medication Nebulizers,” The Journal of Infectious Diseases 163(3), pp. 667–671.
29. American Lung Association (2019). “How to Properly Clean a Nebulizer,” available from youtu.be/TevhZlJzfiM {Online Video) (accessed May 23, 2022).
John Sandford joined the water industry in 1990 and is the owner/founder of SMS Environmental Ltd., a company that was formed in 2001 and now employs more than 200 people and operates from sites across the U.K. Mr. Sandford has an M.S. degree in water and wastewater engineering from Cranfield University and a B.Sc. (hons) in building processes from BCUC. Mr. Sandford is currently the only U.K.-Based Certified Water Technologist (CWT). He holds a Diploma in Occupational Health and Safety and is a Chartered Health and Safety Practitioner and is listed on the U.K.’s Occupational Safety & Health Consultants Register. In 2020, he was elected to the Council of the Water Management Society (WMSoc) (the U.K. equivalent of the AWT) where he sat on the Technical Committee, and later the Membership Committee and was guest editor of the WMSoc Journal Waterline for the Summer 2021 edition. He may be contacted at j.sandford@sms-environmental.co.uk
Keywords: ANALYSIS, BACTERIA, BUILDING
WATER, COOLING TOWERS, Legionella, REGULATIONS, WATER QUALITY MONITORING
Disclaimer
The content and opinions expressed in this article are based on the author’s personal experiences and/or professional training.
55 the ANALYST Volume 30 Number 2 Lessons Learned from Legionella : When the Worst Happens—A Case Study from the UK continued
This paper was presented at the AWT’s 2022 Conference, which was conducted Sept. 21-24, 2022, in Vancouver, B.C., Canada.
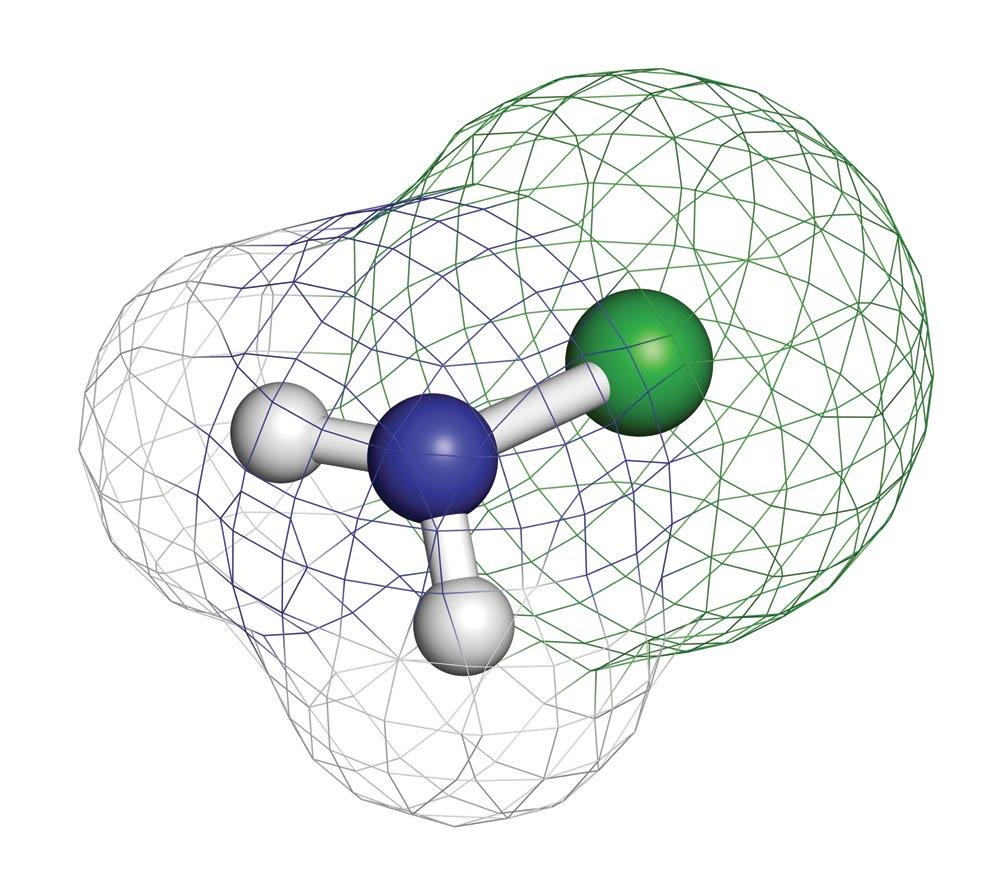
56 the ANALYST Volume 30 Number 2 Can Monochloramine Offer a Long-Term Solution for Controlling Legionella and Waterborne Pathogens in a Healthcare Facility?
Janet E. Stout, Ph.D., Special Pathogens Laboratory David Pierre, LiquiTech
To reduce the amplification of Legionella in building water systems, particularly those serving a susceptible population such as healthcare facilities, supplemental disinfectants are often necessary. In order to effectively evaluate the efficacy of disinfection, an evaluation should follow a four-step approach:
Demonstrate in vitro efficacy.
Anecdotal experience of efficacy in individual hospitals.
Peer-reviewed controlled studies of prolonged duration documenting efficacy and prevention of Legionnaires’ disease.
Confirmatory reports from multiple installations with a prolonged duration of follow-up.
The four technologies that provide a residual disinfectant and have historically been considered for disinfection of building water systems to control Legionella include: supplemental chlorination, chlorine dioxide, monochloramine, and copper-silver ionization.
We previously performed independent field evaluations of all currently used disinfection methods for Legionella control in building water systems. This includes the first independent evaluation of a monochloramine installation on a hospital hot water system in the United States (1). From 2011 to 2014, the hospital hot water system was monitored for a total of 29 months (a five-month baseline sampling period and 24 months post disinfection). A significant decrease in Legionella species percent positivity was observed without adverse microbial or chemical consequences.
The objective of this evaluation was to extend the follow up period to 10 years post disinfection. As part of the long-term evaluation, we wanted to understand the ongoing effectiveness of Legionella control and to determine if there were any additional impacts on the building water systems, such as impact on other waterborne pathogens or overall water quality.
Methods
The study was conducted at a 500-bed hospital in Pittsburgh, Pennsylvania, the same site as our previous evaluation. The monochloramine system (SANIPUR) was installed and operation began in September 2011. The unit has is made up of a proprietary precursor
chemical mix of ammonia and chlorine fed using a metering pump into the hot water supply to the building. An analyzer on the hot water return line is used to monitor the system. Since September 2011, the monochloramine system has been operated and monitored by the water treatment professional with oversight by the water safety team. The target monochloramine and free-ammonia levels in distal outlets at the facility is 2.0 to 3.0 parts per million (ppm) and <0.50 ppm, respectively.
The control efficacy of Legionella as well as other opportunistic pathogens by the on-site monochloramine disinfection had been evaluated for a relatively shorter term right after the system was put into operation (1). The present study continued to evaluate this system for an extended period of up to 121 months (September 2011 to October 2021) since the initial operation of monochloramine disinfection.
Ten rounds of post-disinfection sampling were performed between June 2014 and October 2021. A total of 20 to 31 samples were collected during each microbiological monitoring event. Monitoring locations included the incoming cold water, hot water return, and representative distal outlets. Sample collection from distal outlets was performed by collecting first draw hot water for microbiologic analysis followed by a one-minute flush and collection of hot water for chemistry analysis. Sample collection from the incoming cold water and hot water return was performed after a one-minute flush from the sample valve.
Microbiologic samples were analyzed by Special Pathogens Laboratory for Legionella , Heterotrophic Plate Count (HPC), Pseudomonas, Acinetobacter, Stenotrophomonas, and non-tuberculous Mycobacteria using standard laboratory procedures. Aqueous chemistry samples were analyzed by a third-party laboratory for metals (iron, calcium, magnesium, zinc, lead, copper, and manganese). Metals samples were collected in acid preserved bottles.
Physicochemical monitoring was conducted at the incoming cold water, hot water return line, and the first distal site post the monochloramine injection. Free chlorine, total chlorine, monochloramine, and free ammonia were measured in the field using a using a
57 the ANALYST Volume 30 Number 2 Can Monochloramine Offer a Long-Term Solution continued
Hach DR/900 colorimeter (from June 2014 to January 2015) and a Hach SL1000 colorimeter (February 2015 to October 2021). Water temperature was measured using a Thermapen Mk4 thermometer.
Results
Table A provides data that shows control of Legionella without significant changes in the control of other waterborne bacteria.
Legionella
Legionella pneumophila serogroup 1 was detected during a single sampling event (October 2015), while blue-white fluorescing Legionella species were detected during two of the sampling events (October 2015, February 2016). The October 2015 sampling event showed the highest distal site positivity (DSP) at 15%, which is well below the 30% threshold for evaluating risk of disease. The distal site positivity during the February 2016 sampling was
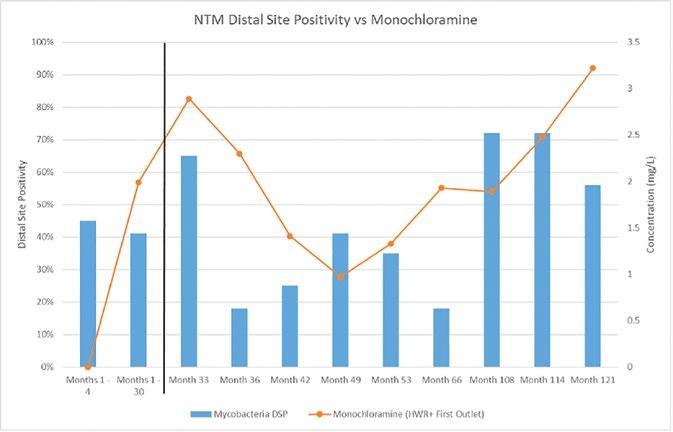
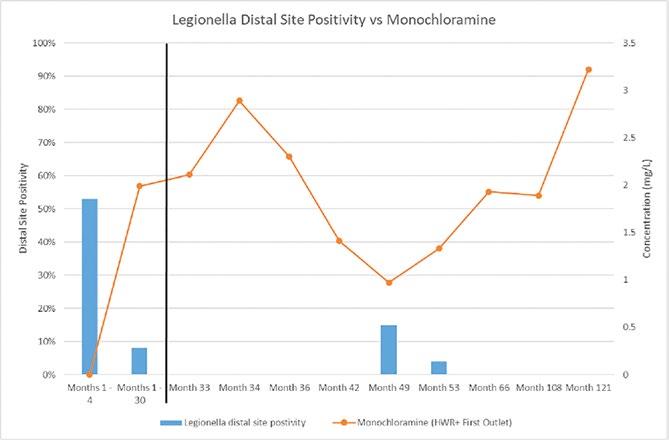
58 the ANALYST Volume 30 Number 2 Can Monochloramine Offer a Long-Term Solution continued
Microbial Baseline
(1st Evaluation by Duda) (2nd Evaluation) Months 1–4 Months 1–30 Month 33 Month 34 Month 36 Month 42 Month 49 Month 53 Month 66 Month 108 Month 114 Month 121 Months 33–121 Average HPC, average CFU/mL 14,047 2,123 - - - 8,022 2,122 3,473 7,504 9,524 - 2,277 5,487 Legionella species 53% 8% 0% 0% 0% 0% 15% 4% 0% 0% - 0% 2% Pseudomonas aeruginosa 0% 0% - - - 4% 4% 0% 0% 7% - - 3% Stenotrophomonas maltophilia 0% 1% - - - 8% 11% 0% 0% 0% - - 4% Acinetobacter species 0% 0% - - - 0% 0% 0% 0% 0% - - 0% Nitrifying bacteria 0% 0% - - - - - - 0% 0% - - 0% Mycobacteria 45% 41% 65% - 18% 25% 41% 35% 18% 72% 72% 56% 45%
Table A: Microbiologic Monitoring Shows Legionella Control Without Significant Changes in Other Waterborne Pathogens
Post Disinfection
Figure 1: Average monochloramine concentration (HWR) and First Outlet) and Legionella distal site positivity. Months 1-4 were prior to monochloramine treatment.
Figure 2: Average monochloramine concentration (HWR and First Outlet) and NTM distal site positivity. Months 1-4 were prior to monochloramine treatment.
4%. Concentrations during those sampling periods averaged 1.5 colony forming units per milliliter (mL) and 10 CFU/mL, respectively. Legionella was not detected in the other seven sampling events.
Figure 1 presents the average monochloramine concentration at the hot water return (HWR), and the first outlet, and the Legionella positivity.
Non-Tuberculous Mycobacteria (NTM)
NTMs were detected during all nine of the sampling events conducted for NTM . The average distal site positivity was 45%, ranging from 18% to 72% DSP. Multiple species were identified throughout the evaluation period, including M. gordonae, M. avium, M. llatzerense, M. lentiflavum, M. paragordonae, and M. gadium. Figure 2 shows the average monochloramine concentration and the NTM distal site positivity.
Other Microbiologicals
Water samples were collected for HPC culture analysis during six of the sampling events. There was a reduction in HPC post-treatment. The average baseline HPC concentration at the distal outlets was 14,047 CFU/mL before monochloramine treatment and was reduced to 5,487 CFU/mL post-treatment (Figure 3).
Water samples were collected for Pseudomonas aeruginosa culture in five sampling events. Pseudomonas was not identified during baseline but was identified in three post-disinfection sampling events. Distal site positivity ranged from 4% to 7% with only one or two locations positive for Pseudomonas, respectively. Overall, the average distal site positivity of post-disinfection sampling events was 3%. Stenotrophomonas maltophilia was not identified during baseline and identified in three of the five postdisinfection sampling events. In the three positive sampling events, distal site positivity ranged from 1% to 11%. Overall, the average distal site positivity of postdisinfection sampling events was 4%. Acinetobacter was not detected during any of the sampling events.
Water samples were tested for nitrifying bacteria during baseline sampling, the initial evaluation and two sampling events in this evaluation. Nitrifying bacteria were not detected during any of the sampling events (Figure 4).
Physicochemical and Other Water Quality Data
Monochloramine data was collected during each of the sampling events. We calculated the average concentration by averaging the concentration of the first distal outlet and the hot water return, to represent near and far points in the water system. The average concentration range was from 0.97 milligrams per liter (mg/L) to 3.22. The overall average throughout the entire evaluation was 2.05 mg/L throughout the ten sampling events. Free ammonia was also measured from the HWR and first distal site with an overall average of 0.14 mg/L. Various metals were collected throughout the evaluation (Table B). Most were at or below the limit of detection.
Discussion
The sampling results from this evaluation demonstrate that monochloramine installed on the potable hot water system is an effective long-term method for Legionella control. There was no evidence of proliferation of other waterborne pathogens. The monochloramine system kept Legionella distal site positivity below 30% for the entirety of the 10-year evaluation. Most importantly, no cases of healthcare-acquired Legionnaires’ disease have been identified since applying monochloramine to the hospital hot water system. Furthermore, no significant changes in other waterborne pathogens were observed compared to baseline sampling (Months 1–4).
These results are consistent with results an EPA study and an Italian study (2, 3). Studies on municipal water treatment with monochloramine have shown similar effectiveness against Legionella (4, 5).
Attaining zero Legionella in a building water system is unrealistic and is unnecessary to mitigate the risk of disease. Legionella was not detected in seven of the sample events but was detected at months 49 and 53. This coincided with the lowest average monochloramine concentrations. This study and others have suggested that the target goal for monochloramine should be 2.0 mg/L to 3.0 mg/L.
HPC bacterial counts are used by some water safety and management specialists as an indicator of a wellmanaged building water system. A target of 500 CFU/ mL is often used as an indicator of a poorly managed water system. This study as well as others have shown
59 the ANALYST Volume 30 Number 2 Can Monochloramine Offer a Long-Term Solution continued
that HPC counts are often well above this target despite effective water treatment. Monochloramine did decrease the average concentration of HPC from 14,047 CFU/ mL to 5,487 CFU/mL; however, the average HPC concentration remained well above 500 CFU/mL. This metric can be used to trend water treatment effectiveness, but not as an indicator of the presence of other waterborne pathogens or effectiveness of a water management program in controlling Legionella.
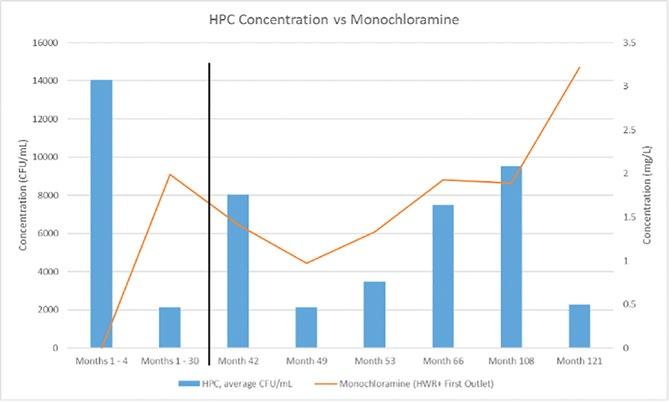
Metals concentrations (iron, calcium, magnesium, zinc, manganese, lead, and copper) did not increase after the application of the monochloramine. Unlike some stronger oxidants such as chlorine or chlorine dioxide, monochloramine application presented a low concern for accelerated corrosion. No disinfection by-product testing was performed in this study. The aforementioned EPA study showed no water quality
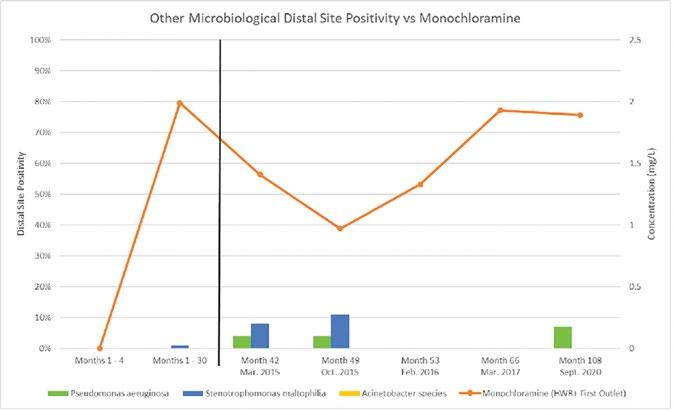
60 the ANALYST Volume 30 Number 2
Baseline Post Disinfection (1st Evaluation by Duda) (2nd Evaluation) Months 1–4 Months 1–30 Month 33 Month 34 Month 36 Month 42 Month 49 Month 53 Month 66 Month 108 Month 114 Month 121 Months 33–121 Average Monochloramine (HWR+ First Outlet), mg/L 0.00 1.99 2.11 2.89 2.30 1.41 0.97 1.33 1.93 1.89 2.48 3.22 2.05 Free ammonia, (HWR+ First Outlet), mg/L 0.00 0.61 - - - 0.08 0.26 0.36 0.04 0.03 0.08 0.15 0.14 Iron - - - - - - - <0.030 - 0.16 - 0.12 <0.030 Zinc - - - - - - - - - - - 0.06 0.06 Manganese - - - - - - - - - - - <0.010 <0.010 Lead - <0.0025 <0.0025 - <0.0025 - - <0.0010 <0.0025 <0.010 <0.010 <0.010 <0.0025 Copper 0.83 0.23 <0.1 - 0.10 - - 0.07 0.08 0.09 0.09 0.09 0.09 Silver 0.15 0.34 0.02 - 0.02 - - 0.03 0.02 0.02 0.02 - 0.02 Can Monochloramine Offer a Long-Term Solution continued
Table B: Physicochemical Parameter Monitoring Results
Figure 3: Average monochloramine concentration (HWR and First Outlet) and average distal site HPC concentration. Months 1-4 were prior to monochloramine treatment.
Figure 4: Average monochloramine concentration (HWR and First Outlet) and distal site positivity for other waterborne pathogens. Months 1-4 were prior to
changes or known unintended consequences after monochloramine addition including increases in lead and copper, iron and disinfection by-products including NDMA (3).
Conclusions
This evaluation was performed to assess the long-term effects and efficacy of a monochloramine installation on a hospital hot water system. We demonstrated that monochloramine provided long-term control of Legionella without detrimental impacts on the building water system including proliferation of other waterborne pathogens or accelerated corrosion of the building water system.
Monochloramine did not impact NTM growth in the plumbing system, with the overall distal site positivity relatively unchanged from initial baseline NTM positivity (45%). This has significant implications for water safety programs. Many assume that implementation of a water safety program to mitigate Legionella risk will also reduce the risk of other waterborne pathogens. Risk of disease from all waterborne pathogens cannot be solved with water treatment alone.
When considering installation of monochloramine, consider water quality, system physical conditions and constraints, and the need for control of other waterborne pathogens. All should be considered by the operator prior to selecting any treatment method. A successful installation should consider:
Completing a baseline assessment of the water system, including Legionella positivity, evaluation of plumbing systems, chemistry, understanding system operation, and determining permitting needs.
Developing a water safety and management plan to manage Legionella risk and establish operating limits, monitoring requirements, and corrective actions for the supplemental disinfection system.
Implementation of the water management program including validation through environmental testing for Legionella to demonstrate efficacy.
Evaluating results with the water safety team and adjusting the program based on findings.
Throughout the evaluation, we observed fluctuation of monochloramine concentrations, stressing the importance of maintaining a robust operation and maintenance program. No supplemental disinfection system can be treated as “set it and forget it.” For monochloramine, we would recommend maintaining 2.0 to 3.0 mg/L as the control limits for monochloramine. When monochloramine levels were lower than the 2.0 mg/L, positive Legionella results were observed, albeit still under the recommended 30% distal site threshold.
Additional peer-reviewed studies are needed to expand on this evaluation and the long-term impact of monochloramine on building water systems and other waterborne pathogens.
Acknowledgement
This study was self-funded by Special Pathogens Laboratory. The authors would like to thank the facility team at the facility where the study was conducted.
References
1. Duda, S.; Kandiah, S.; Stout, J.; Baron, J.; Yassin, M.; Fabrizio, M.; . . . Rogers, D. (2014). “Evaluation of a New Monochloramine Generation System for Controlling Legionella in Building Hot Water Systems,” Infection Control and Hospital Epidemiology 35(11), pp. 1356-1363, doi:10.1086/678418.
2. Lytle, D.A.; Pfaller, S.; Muhlen, C.;0 Struewing, I; Triantafyllidou, S.; White, C.; Hayes, S.; King, D.; Lu, J.; (February 2021). “A Comprehensive Evaluation of Monochloramine Disinfection on Water Quality, Legionella, and Other Important Microorganisms in a Hospital,” Water Research, 2021 Feb 1;189:116656. doi: 10.1016/j.watres.2020.116656. Epub 2020 Nov 18. PMID: 33249307; PMCID: PMC8133025.
3. Kool, J.L.; Carpenter, J.C.; Fields, B.S.; (January 1999). “Effect of Monochloramine Disinfection of Municipal Drinking Water on Risk of Nosocomial Legionnaires’ Disease,” Lancet, 3;353(9149):272-7. doi: 10.1016/S01406736(98)06394-6. PMID: 9929019.
4. Moore, M.R.; Pryor, M.A.; Fields, B.; Lucas, C.E.; Phelan, M.A.; Besser, R.E. (2006). “Introduction of Monochloramine into a Municipal Water System: Impact on Colonization of Buildings by Legionella spp.,” Applied and Environmental Microbiology, 72, pp. 378-383.
5. Marchesi, I.; Paduano, S.; Frezza, G.; Sircana, L.; Vecchi, E.; Zuccarello, P.; Oliveri-Conti, G.; Ferrante, M.; Borella, P.; Bargellini, A. (August 2020). “Safety and Effectiveness of Monochloramine Treatment for Disinfecting Hospital Water Networks,” International Journal of Environmental Research and Public Health 17(17), p. 6116, doi: 10.3390/ijerph17176116. PMID: 32842654; PMCID: PMC7503937.
61 the ANALYST Volume 30 Number 2 Can Monochloramine Offer a Long-Term Solution continued
Janet E. Stout, Ph.D., is executive VP and founder of Special Pathogens Laboratory, A Pace® Laboratory, and research associate professor at the University of Pittsburgh Swanson School of Engineering in the Department of Civil and Environmental Engineering. An infectious disease microbiologist, Dr. Stout is recognized worldwide for pioneering research in Legionella. Her expertise includes detection, prevention, and control strategies for Legionnaires’ disease in building water systems. Dr. Stout has shared her more than 30 years of research in book chapters and more than 100 articles published in peer-reviewed medical and scientific journals. She advances the mission to End Legionnaires’ disease by speaking and serving on numerous industry committees, including the ASHRAE Legionella standard SSPC 188, Guideline 12-2020 and Proposed Standard 514. Additionally, Dr. Stout initiated the development of the first professional qualifications standard, the ASSE Standard 12080 Professional Qualifications Standard for Legionella Water Safety and Management Personnel, and teaches the first, virtual online certification education course certifying more than 500 professionals to date. Dr. Stout may be contacted at jstout@specialpathogenslab.com

David Pierre is Director of Water Safety Programs at LiquiTech .He is an expert in New York City and State regulations for Legionella risk management and ANSI/ASHRAE Standard 188. An ASSE/IAPMO/ANSI 12080 Certified Legionella Water Safety Specialist, Mr. Pierre has overseen the development of more than 200 water safety and management plans and risk assessments for healthcare, hospitality, commercial, and industrial facilities. His background includes an understanding of the physical conditions for Legionella and waterborne pathogens in premise plumbing and cooling towers. He may be contacted at dpierre@liquitech.com

Keywords: BACTERIA, BIOCIDES, BUILDING WATER, CHLORINE, HEALTHCARE, Legionella , PATHOGENS
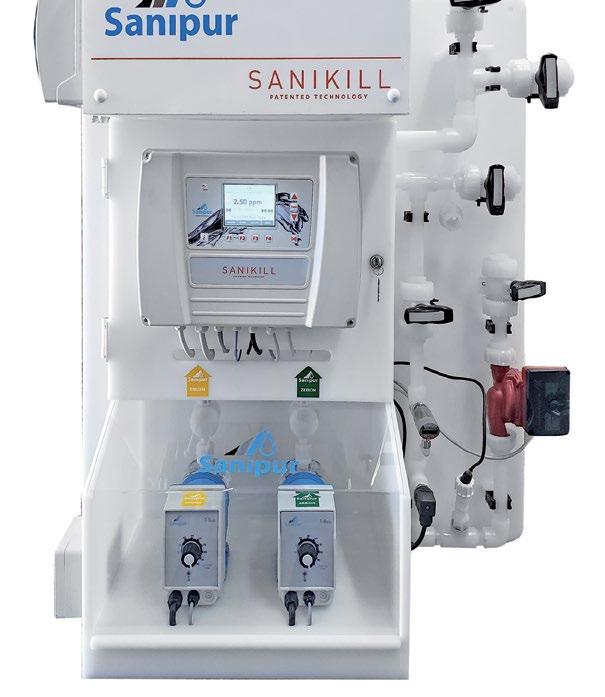
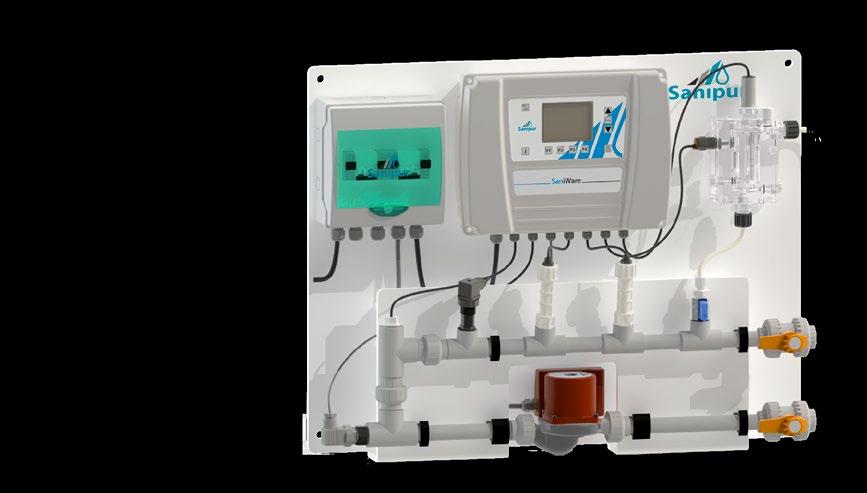
62 the ANALYST Volume 30 Number 2
This paper was presented at the AWT’s 2022 Conference, which was conducted September 21-24, 2022, in Vancouver, B.C., Canada.
Can Monochloramine Offer a Long-Term Solution continued SANIKILL and SaniWare Treatment and control The patented SANIKILL technology now combined with SaniWare water quality monitoring panels! Expand your OPPORTUNITIES! Visit www.sanipur.com - sales@sanipur.com - 484-351-8702
Membership Benefits
AWT Webinars
The Association of Water Technologies provides webinars that pair the convenience of online training with live instruction, and Q&A opportunities. Topics covered include technical and business matters that are required to be successful in today’s water treatment field. Webinars are recorded, so you can always take advantage of the knowledge offered. Some currently available include:
Cooling Tower FAQs – A Series of Solutions: Parts 1–4

Business Webinar: Using a SWOT Analysis to Advance Your Business

Applications of Calcium Hypochlorite in Cooling Towers
Introduction to Government Regulations and Water Treatment Part 2—DOT and EPA
Visit www.awt.org/members-section/webinars to view them!
63 the ANALYST Volume 30 Number 2
Discovering AWT
Bio-Source, Inc.
11335 Lewis Braselton Blvd., Ste. B-140
Braselton, GA 30517
770-978-1443
www.biosourceinc.com
Company History: Bio-Source was founded by John Lyle in 1991 as a wholesale chemical distribution company, with an initial primary focus on biocides for the industrial water treatment industry. The business was later expanded to also carry specialty polymers and other raw materials used in cooling water and boiler water inhibitor packages.
Current Business: Bio-Source’s core business remains within industrial water treatment; however, the company also operates in the metalworking, oil and gas, and RO/filtration sectors. The firm carries a full line of oxidizing microbicides such as bromine (BCDMH) tablets, stabilized (liquid) bromine, sodium bromide, chlorine-based solid chemistries, peracetic acid, and liquid chlorine dioxide. Bio-Source also carries a full line of non-oxidizers, such as isothiazolin, DBNPA (in solution and solids), glutaraldehyde, TTPC, THPS, bronopol, and quats. The firm’s raw material lines consist of scale and corrosion inhibiting polymers, azoles, phosphonates, sodium molybdate, and amines. Biocides are available in all package sizes, with the option to sell under the manufacturer’s label or private label. There are no direct sales to end users.

Business Locations: Bio-Source is based outside of Atlanta in Braselton, GA, and has its main warehouses in Tennessee, Texas, and California. Through these locations, the firm supplies water treatment chemistries to regional blenders and individual water treatment companies throughout the United States, the Caribbean, and South America.
Recognition and Involvement: Bio-Source joined AWT 30 years ago and was named the 2021 Supplier of the Year.
Top Executives: John Lyle, president; and Shaun Dorethy, vice president.
64 the
Volume 30 Number 2
Inside the Bio-Source warehouse in Memphis, TN.
ANALYST
Cortec Corp.
4119 White Bear Parkway
Saint Paul, MN 55110
800-426-7832 or 651-429-1100
www.cortecwatertreatment.com
Company History: Cortec started in October 1977 out of the home of Boris Miksic, a Croatian emigrant, who recalls coming to the U.S. with $37. Since then, Cortec has grown into a multimillion-dollar company with a global reach in some of the most corrosive environments in the world. The company’s strong, decades-long commitment to environmental responsibility has inspired Cortec to use biodegradable and biobased raw materials where possible.
Current Business: Cortec’s primary business is corrosion control and metal protection. Its water treatment products primarily focus on the preservation of boilers and cooling water systems during layup, but also include products for operating systems. On the wastewater side, Cortec’s subsidiary, Bionetix, makes bioaugmentation products that contain microorganisms and nutrients to speed the natural degradation process in a wastewater
treatment plant. In addition to water treatments, other Cortec products include packaging materials, coatings, concrete additives, lubricants, and rust removers.
Business Locations: Headquartered in Saint Paul, MN, they have four other U.S. plants in Minnesota, Wisconsin, and Florida. Cortec also has international operations in Croatia, Singapore, and Quebec. Its distributors also reach 100 nations worldwide.
Recognition and Involvement: Cortec has been an AWT member for more than 17 years. Scott Bryan, CWT, their water treatment technical sales manager, currently serves as the chairman of AWT’s Produced Water Taskforce.
Top Executives: Boris Miksic, CEO; Caleb Pheneger, COO; Angie McGillivray VP Finance–Controller; and Cliff Cracauer, EVP Sales and Marketing.
65 the ANALYST Volume 30 Number 2 Discovering AWT continued
Aerial shot of Cortec’s world headquarters in St. Paul, Minnesota.
North Metal & Chemical Co.
609 E. King Street
York, PA 17403
717-845-8648
www.northmetal.net
Company History: In 1921, Dr. H.B. North founded a chemical company to produce pure metal compounds, initially in lab quantities. Focusing on molybdenum and tungsten compounds as we scaled up to producing at an industrial volume, the company supported the U.S. war efforts from World War II through Vietnam.
Current Business: During the last three decades of the 20th century, molybdates were the company’s sole focus, and they became the largest manufacturer of sodium molybdate in North America. As water treaters were forced to reduce use of molybdates, agricultural use began to grow. This was driven by the U.S. EPA’s misguided move to lower molybdenum discharge to far below the soil requirement for healthy crop development. As water treaters reduced use of molybdate, demand to start servicing them with other water treatment
products increased. NMC added neutralizing amines, phosphonates, triazoles, and polymers. Shipping volume of these “other” industrial water treatment products now exceeds molybdate pounds produced.
Business Locations: For most of their 101-year history, NMC only stocked material in their York, PA, manufacturing facility. NMC started warehousing material near the West Coast (currently near Phoenix) in 2017 and hopes to add a Texas warehouse later in 2023. Though they generally limit shipments to the Western Hemisphere, some products are sent across the Atlantic.
Recognition and Involvement: NMC became members within the first couple of years of AWT forming, accepting supplier membership at a time when every water treater used sodium molybdate.
Top Executives: Jeff Hammel, great grandson of Dr. North, is the current president. Sarah Lynam, greatgreat-granddaughter of the founder, is the product director. Dave Fitzgerald is general manager and VP.
66 the ANALYST Volume 30 Number 2 Discovering AWT continued
Pictures showing aspects of North Metals' business: Left: Inside the warehouse; Top right: Staff preparing to unload a trailer of empty fiber drums; Bottom right: Company headquarters in York, PA.
Making a Splash
Victoria Smith Technical Director at Water Engineering, Inc.


What prompted you to start volunteering with AWT?
I decided to begin volunteering with AWT on the Cooling Water Sub-Committee so that I could further my personal development as a technical team member and resource. I have been fortunate to work for and among industry experts in my career, in professional quality assurance, manufacturing management and water treatment/chemical engineering. It was time for me to be an active player in the technical training of new water treaters. Additionally, my company is extremely supportive of my role with the sub-committee.
What has been the most rewarding thing about volunteering?
Seeing that I can assist someone by clarifying a challenging issue is very rewarding. When the light bulb goes off for a person who has been struggling with a situation, it is extremely rewarding to be a part of the clarity of purpose.
How has volunteering improved your professional career?
I believe that everyone comes to a point in their life and career where they realize that they have benefited from senior persons along their career path. I came to the realization that a few of my mentors were extraordinary. They invested time in me because they saw potential. I have been successful in my acquisition of knowledge, due in part to my mentors; AWT is an excellent resource as a modern form of mentoring, and I want to be part of it!
Why would you encourage others to become a volunteer?
I have made time in my personal and professional life to be a volunteer. I can tell you that I’m surprised at how fulfilling it is! It has brought me a new regard for successful time management and spurred on my personal goals.
Tell us about a current project you or your committee is working on?
I have been a part of the webinars for Cooling Tower Systems. This was a unique method of engaging people, specifically junior water treaters. The webinar is set-up like a podcast, with the ability of the panel to field questions on a variety of topics. There are so many variables for any water system, and it can be very confusing as an apprentice. Our webinar series is very relaxed and an easy listen. Rather than lecturing, it is formatted as a conversation, which is receiving excellent feedback. It is an approachable method of learning for a new generation of water treaters.
What is a past project that your committee produced that you feel has had the greatest impact on AWT and why?
In my research for client solutions, I routinely use AWT guidance documents in recommendations to clients. All the available guidance documents on cooling systems are sometimes the only specific information that can be found as independent experts, and not sponsored by a company. This is imperative when offering unbiased recommendations.
How have you been able to utilize the expanded business connections you’ve made while volunteering?
The activity with AWT has been a very good means of expanding my network of contacts. By participating in the webinar series, I feel so comfortable with our team. It’s a great thing to make new contacts outside of your own organization.
67 the ANALYST Volume 30 Number 2

Art Freedman: Physical Chemist, Teacher, Researcher, Pioneer, Consultant, Musician
 Rob Ferguson French Creek Software
My water treatment journey began in 1974, when I reported to Dr. Arthur J Freedman at 180 North Michigan Avenue in Chicago, Nalco’s corporate headquarters. At the time, I did not realize that Art would become a mentor, consultant, technical sounding board, coauthor, and most of all, a dear friend for the decades that followed. I would like to recall a few insights learned from Art.

Art created an extraordinary training program for me. The depth of this program is typical of the thoroughness that Art directed at problem-solving and potential business opportunities. The program consisted of:
Weekly one-on-one sessions, including directed reading assignments that ranged from introductory chapters of the company handbooks to technical literature from Green, Ryznar, Hatch, and Ralston; Langelier; and to the literature of the time—including many of Art’s papers.
Assignments in the Research and Development Laboratories as a “helper” and as a participant in shortand long-term projects.
Specific marketing projects from inception through commercialization.
Field trips with district reps.
While others were learning to use a Langelier Index table or slide rules, Art sent me to the blackboard during one of our weekly sessions and directed me to “derive the Langelier Index.” This was followed by discussions of its applicability, limits, and ways to improve it. Art viewed water treatment through the lens of physical chemistry and passed that on through these sessions and guidance on technical projects.
Art introduced me to the world of technical programming through one of these assignments, which eventually became a major part of my position at Nalco and a lifelong career: the creation of water treatment computer modelling programs. I was assigned to work under the technical programming group headed by Dr. Harold Patzelt and Dr. Arpod Elo III. They granted me the third highest mainframe access in support of the development of water treatment modeling programs. Art made sure that his “students” had access to the tools needed to complete their tasks.
Programming assignments included the development of a program to calculate water treatment performance in utility water treatment applications. Art asked for the end result and left the implementation up to me. This was well before management by objective and was during
69 the ANALYST Volume 30 Number 2
Early in Art’s career when working for Standard Oil Inc. (Indiana).
Tales From the Waterside
the initial industry efforts to digitize water treatment applications. The first programs monitored condenser performance via cleanliness and fouling factors and estimated the impact of fouling on heat rate. These programs were used to document the improvement in cleanliness after the feed of a biodispersant, and its impact upon heat rate and fuel costs. They proved that fuel savings and maintenance of design production generation capability would pay for the treatment costs with a high return on investment (ROI). Similar programs were later used to estimate the ROI for surface condenser scale control treatment approaches.
Art didn’t limit his mentoring to technical matters. I recall his fatherly advice before my first International Water Conference, when he said, “Don’t drink around the executives. There is nothing wrong with ginger ale.”
Recollections from Others
Bob Cunningham, P.E., a principal consultant with Arthur Freedman Associates, Inc. (currently operated by Art’s son Peter) and president of International Water Consultants, Inc., described the teaching ability that Art demonstrated in our many sessions in this this way: “He had the rare ability of taking highly complex concepts and reducing them to everyday language that other people could understand,” Mr. Cunningham recalled. “I’ve worked with many people in our field, and the difference between them and Art is that he was the whole package. He was a very good communicator, but he also had a complete grasp of the ever-changing science and technology.”
Mike Henley, technical editor of the Analyst, remembers Art’s wide-ranging knowledge of water treatment, which extended well beyond his deep understanding of boiler and cooling water treatment. One time while at dinner during a conference, Art told of a time when a pharmaceutical company hired him to determine the source of organics contaminating a stainless-steel storage tank holding pharmaceutical-grade water. This was after consultants with high-purity water backgrounds had failed to solve the mystery. Art spent time observing the facility’s treatment system and noticed a maintenance worker cleaning and dusting the tank and adjacent equipment with a cloth. He spoke with the worker and found out the cloth had a cleaning solvent on it. As it turned out, the solvent fumes had been entering
the tank’s vent and were the source of the organic contaminant in the storage tank.
Early Life
Born in Brooklyn and raised in Larchmont, N.Y., Art attended New York University, where he earned a bachelor’s degree in chemistry in 1945, and later a master’s and a doctorate degree in chemistry.
From 1948 to 1954, he was a research associate, working on the analytical applications of radiochemistry at the Los Alamos Scientific Laboratory in New Mexico. Art later worked at the Massachusetts Institute of Technology.
In 1954, he moved to the Chicago area and began working for Standard Oil Co. (Indiana) (now Amoco). As a senior project supervisor, he was responsible for the development of water and process-side scaling and water corrosion test instrumentation. During his time at Standard Oil, he helped in the development of the “Corrosometer” and “Corrater,” both patented devices used in measuring corrosion rates.
After leaving Standard Oil in 1959, Dr. Freedman worked as the marketing manager for Nalco Chemical Co. in Chicago. At Nalco, he was instrumental in the development of the still widely used alkaline and all-organic scale and corrosion control technology.
In 1981, Art and several colleagues founded Arthur Freedman Associates, Inc. When asked for consulting

70 the ANALYST Volume 30 Number 2 Tales From the Waterside continued
Art Freedman in his office while with Nalco.
recommendations, I would always recommend Art and his team of water treatment consultants when a thorough, technically accurate, and practical engineering approach was requested.
Art was presented with the Ray Baum Memorial Water Technologist of the Year Award in 2000 for his service to the water treatment industry by the Association of Water Technologies (AWT) at its national conference in Honolulu.
Art’s ability to train and develop future water treatment chemists undoubtedly is one of the high points of his legacy.

Musician
Art also enjoyed music and was a French horn artist in local symphonies, both as a teacher and as a director. It is rumored that he taught one of his sons to play jazz on a French horn. Perhaps, many years from now, Art’s heavenly symphony will have an opening for a lower brass player who also worked in water treatment.
In Closing
Art Freedman had a major impact on water treatment technology and the industry, through his direction of the development of new technology, nurturing of some of the first digital cooling water applications, and through those he introduced to the art of curing the aqueous ills of mankind. His broad interests and contributions are reminiscent of a modern-day renaissance man. Art is missed by many in the industry and those whose lives he touched as a mentor, teacher, friend and musician.
Author’s note: Some material presented in this article was derived from Art’s 2015 obituary.
Robert J. Ferguson is the president of French Creek Software, Inc., a company he co-founded in 1989. His professional career includes positions with Nalco, Apollo, Mogul, Calgon, Chemlink, and Baker. In addition to being a water treater and student of Arts, Rob Ferguson is a euphonium and tuba player who is a regular at the New Orleans Traditional Jazz Camp. What he lacks in musical ability is made up for by unbridled enthusiasm.
We provide test kits for Low Range Dissolved Oxygen, Ammonia, Chlorine, DEHA, Filming Amines, Hardness, Hydrazine, Iron, Molybdate, Ozone, PAA, Phenol, Phosphate, Sulfide and more.
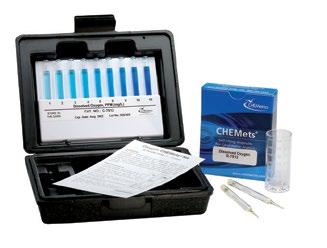

71 the ANALYST Volume 30 Number 2 Tales From the Waterside continued
BE
That’s why our self-filling ampoules are PREMIXED, PREMEASURED and PRECISE
WATER TESTING SHOULD
SIMPLE
www.chemetrics.com
+1.540.788.9026 |
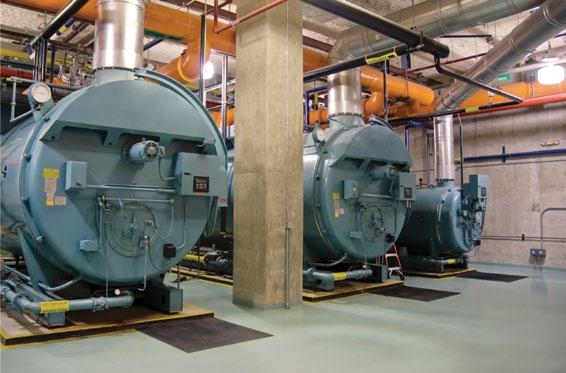

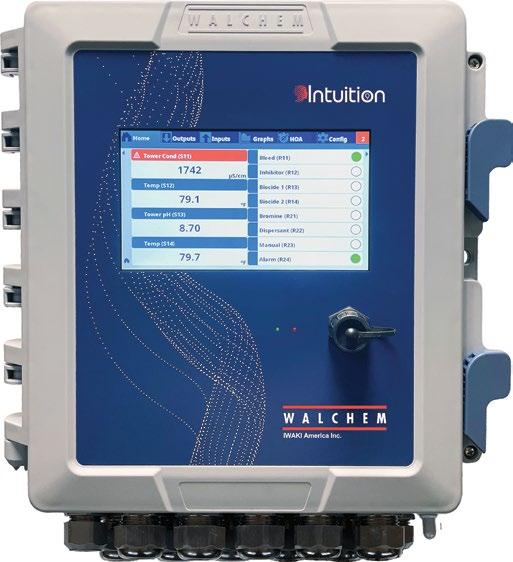
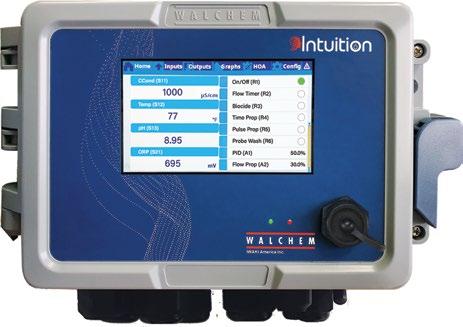
Intuitive Programming with Tap and Swipe on our New Color Touchscreen! WALCHEM.COM
When Is it Time to Become the Advocate?
Mike Henley, MD Henley & Associates
Vulnerability is a life condition we all seek to avoid, and we seek to keep our independence, even to the very end of life—if possible. A related reason is because we don’t want others to take advantage of us, or worse, endanger our wellbeing. Yet, as our loved ones (family members and good friends we care about) age, that is exactly what can happen. So, what to do?
When loved ones become more vulnerable, you can just let the status quo run its course. But this can sometimes have tragic outcomes where the vulnerable individual may:
• Have a serious accident while living alone.
• Become the victim of a swindler preying on vulnerable people and end up losing most or all of their life savings.
• Receive poor or inappropriate care in a hospital, assisted living, or skilled nursing home, where in theory, the loved one should be safer and free of such worries.
The alternative scenario is that one or more people enter the picture to watch out for that person.
In this article, we will examine what it means to take on the role of an advocate for a vulnerable family member of friend. This article will include some personal experiences where I, and other family members, acted as an advocate or had to learn to take on that role. Please note: Much of the commentary will be based on experiences with older individuals. However, vulnerability knows no age limit—anyone, from all age groups, infants to the elderly, can be vulnerable.
On Being an Advocate
The online Cambridge Dictionary offers the following definition for advocate: “To speak for, support, or represent a person or group of people who may need extra help or protection.” This meaning very well fits the vision of the type of advocate I’m writing about.
Sometimes, one will come upon a situation that demands immediate action. For example, you discover someone has been tricking a relative into giving them money, or it is no longer safe for the person to live alone anymore. It is commendable to step in and help. And, yes, that is the time to begin taking action.

That said, from personal experience, one will be more effective in the long run if you can show that you are trusted to act on behalf of the other person. The best tool is to be listed as a Power of Attorney (POA) in a will or trust by the at-risk person. POAs can act in two primary ways: helping with financial matters or in healthcare situations. A will lists the POAs in each section. To be in this place takes advanced planning and agreement by the vulnerable person that you are trusted and your help is welcome. When the time of need arises, being listed as a POA makes it much easier to act—whether the issue involves healthcare decisions, or financial matters such as ensuring bills are being paid or stopping a scam artist.
For the remainder of this article, we will look at places where one could provide support or protection for a loved family member or friend. Areas we will review will include:
73 the ANALYST Volume 30 Number 2
Beyond Water
Theft of money or other goods
Making life changes
Healthcare
Medical emergencies are often the first time when it becomes obvious that a loved one needs you to be their advocate.
A favorite story involves our Uncle Ted. One Wednesday night, at dinnertime in late February 2008, we received a phone call from the emergency room at a local hospital, where the caller informed us that “they were done checking Uncle Ted, and he was ready to come home from the ER.”
We didn’t know he was at the ER!
Shocked, I inquired about what was happening and learned that he had come to the ER earlier that day.
Later, we learned that he had gone to the ER by city bus—not by ambulance, was complaining of bad congestion, and had a cough. His doctor had suggested a hospital visit, hoping he would be admitted. We did not know about this at all. Uncle Ted had recently turned 90 but was still living independently and still wanted to be in charge. He had recently lost his wife of 63 years and was mourning her loss. He did plan to move to assisted living and had a place in mind, but it would be on his terms, not someone else’s.
So, I went to get him and take him home. I learned that the ER doctor had determined he did not need to be hospitalized. But this non-medical person wondered about the wisdom of that decision. So, he went home and stayed alone because, at the time, our home was not set up in a way that we could have him stay overnight with us. I left him at his retirement community condominium and prayed that he would be okay.
The next day, I contacted his doctor, and arranged for an appointment that Friday. I took time from work and went to see him on Thursday and determined that while he needed a thorough exam that is best in a hospital, that he would be okay until the next day.
On Friday, we went to his doctor, who agreed he needed to go to the hospital. After the appointment, we drove to St. Joseph’s Hospital, and he was admitted per his doctor’s instructions. He did get better, but this incident began a three-year “Adventures with Uncle Ted.” In this case, all went smoothly because of a will that named me as POA for healthcare and financial matters. Shortly afterward, my wife and I, and other family members, acted, and he was moved into the assisted living apartment he had chosen for a brief time before it was determined he needed to be in assisted-living group home where the care was more appropriate for his needs. Early in this time, we emptied his condo to prepare it for sale. Some items went to different family members or were donated to charity. The proceeds from the sale of his condo financed his care for the remainder of his life.
In his final years, he had more medical emergencies and late-night ER runs. During that time, we took Uncle Ted to many medical appointments. But we also had fun. Each of his last birthdays became an event with a birthday party attended by relatives and his fellow residents in the Serenity House where he resided. I was grateful for help from my own and extended family. In the end, Uncle Ted went on hospice care, and passed away in April 2011.
Lessons learned: The importance of having already arranged for someone to be responsible to help with your medical and financial oversight. The value of going into the exam room with the patient so you understand their health conditions.
Speaking Up
We most certainly had times of speaking up for Uncle Ted, but the more poignant examples come from my mother. A medical emergency also brought us into her life as advocates. One Sunday morning in early November 2014, she had to go to the hospital, and fortunately did get admitted for further examination. However, after three days, she was released and came to begin living in our home, a decision we made as it was obvious it was no longer appropriate for her to live alone.
Her 92nd birthday was two days after leaving the hospital. So, my wife, son, daughter, and I took her to dinner. At the restaurant, she began to feel dizzy and lightheaded again, so an ambulance was called, and she
74 the ANALYST Volume 30 Number 2 Beyond Water continued Healthcare
Financial
returned to the same hospital ER. My daughter and I were with her in the ER room. After some exams, the nurse came in and announced that they did not determine any problems. Therefore, since “they had records from her recent hospital stay and if she could get up and walk, she could go home.”
However, we spoke up and said this decision made no sense, and that we wanted her admitted because it was obvious something wasn’t right. The ER staff relented, and she was admitted. Two days later, they took X-rays and did an ultrasound, and found she had a pulmonary embolism. As a result, she remained in the hospital a few more days and was placed on a blood thinner. Had we not spoken up, no treatment would have occurred, which could have led to more serious consequences. But, as a result of those two hospital experiences, the next time she had a medical emergency, we insisted that she be taken to a different, more trusted (by us) hospital.
Lessons learned: It is important to speak up and seek alternate care options, especially if you question the decisions of the medical staff. In a medical emergency, it is okay to insist on a different hospital you prefer, especially if you doubt the care at the closer hospital the ambulance might normally go to.
Financial Matters
When both my parents were still living independently, a cousin offered some sage advice: have them add your name to their checking account. She explained that should something happen to their health, it would then still be possible to ensure bills were paid.
My cousin was the daughter of my dad’s older brother and was in the process of advocating and watching over her dad’s care. Overall, she had spent many years caring for her mom and dad, and at that point had learned a lot about this subject.
That advice has been very helpful, making those situations much simpler on the financial side.
Theft of Money or Goods
Now we will move to a sad story with an important lesson.
In the mid-1990s, one of my mom’s sisters (Aunt Fay) was involved in a serious car accident. She did recover,
but as a result of the injuries could not return to her work as a nurse’s aide. She did continue to volunteer at the hospital, which actually created this sad story.
Our aunt met a man at the hospital, Leroy, who befriended her. He began to visit at her apartment in the Capitol Hill neighborhood in Denver, and pretty soon began asking for money for “bills” he had to pay, and she complied since she was lonely and liked the attention. Aunt Fay had her retirement money, so she began to draw from it to give to LeRoy for his purported “needs.” By the time we found out (1997), much of the retirement money was gone, and she was now writing credit card checks to satisfy his requests and had created a credit card debt of around $30,000 spread onto four cards.
Around that time, I actually had the chance to meet LeRoy with Aunt Fay. We met briefly where he lived, and it was obvious he was nervous. We asked when he would start repaying the money he had taken and offered a vague promise of “soon.” This was before cell phones were in use, so it was not possible to easily call the police but not having them come is my one regret.
Shortly after that time, a team of relatives became involved, and we took the following actions:
We had her stop seeing LeRoy and took steps to have her move. Initially, she briefly stayed in our home before going out to stay with an aunt at her farm in eastern Colorado. The goal was to keep LeRoy away from her.
We contacted the credit card companies and cancelled the accounts and spoke with them about the stolen money.
We had to have her file for bankruptcy to resolve her financial problems.
We tried to work with the district attorney’s office, but it ended up they could do little because she had been willingly giving the money.
After this situation, Uncle Ted and Aunt Delene (his wife) took on the role of POA. Aunt Fay’s health later changed, and she had to move into a nursing home. They oversaw her care until her passing in 2007.
Lessons learned: The importance of being alert as to how a loved one is doing, and not being afraid to ask
continued on page 85
75 the ANALYST Volume 30 Number 2 Beyond Water continued
Real & Business Property and Business Interruption –All States & Canada
Zero Compromise on Unmerited Claims Against You
Claims are adjusted using advisors that include: Adam Green, Baker Donelson; Jay Farmerie, Cyrus Rice; Dr Janet Stout, Special Pathogens Laboratory and others.
Insurance carriers occasionally pressure AWT Members to settle unmerited claims. This happens when carriers don’t quickly or thoroughly enough, investigate the true responsibility for an ‘occurrence’. Or, when carriers don’t understand water treatment sufficiently to mount a powerful defense. To counter this, WaterColor has retaken control of the claims process for its AWT clients. All claims are immediately and thoroughly investigated to determine liability. If the treater, consultant or supplier is responsible, the damages, claim and investigation costs are quickly paid. Otherwise, we defend you vigorously in consultation with among others, AWT Members Jay Farmerie, Janet Stout and Adam Green.
From Corrosion to Contamination, from Legionella to Leaks, WaterColor has for almost 40 years, enthusiastically investigated and defended its AWT clients’ claims. No longer is there a need to be pressured by carriers into settling unmerited claims.
WaterColor’s competitive AM Best A rated offerings include:
• A Combined Single Policy for General, Professional, Pollution, Products and Umbrella Liability
• Property, Stock, Tools & Equipment, & Business Interruption
• Commercial Auto & Hired & Non-Owned Auto
• Umbrella Limits available up to $30m
• No Contaminants Exclusions e.g. PFAS, Bacteria, Viruses, and other Pathogens, Mold, Lead, Corrosives, etc.
• Affirmative Legionella coverage
• Pollution: On-site, Off-site & in Transit, up to $25m
• New York Labor Law up to $20m
• Fraudulent Funds Transfer and Cyber Ransom
for a quick quote call 256-260-0412 or email karen @ watercolormanagement com

WaterColor’s clients include:
• Industrial and Commercial Water Treatment Firms

• Servicers of Boilers and Cooling Systems
• Sellers and Servicers of Water Treatment Equipment
• Manufacturers, Blenders and Distributors of Water Treatment Chemicals
• Manufacturers of Pumps and Water Treatment Equipment
• Water and Wastewater Testing Laboratories

• Consultants, Scientists & Engineers
Self-Issued Certificates of Insurance are available 24/7
WaterColor Management www.watercolormanagement.com
for a quick quote call
or email karen @ watercolormanagement com
256-260-0412
Liability Premiums are Flat and Non-Auditable
New
What Is the Value of Treatment Manuals?
Mike Henley MD Henley & Associates
Manuals are important in our modern world. Hopefully, they help owners to better understand using their car/ truck, machine, or other device. Sadly, they can also be a source of frustration when poorly written.
This word has several meanings and can be both a noun or an adjective. For the purposes of this article, the online Cambridge Dictionary (1) offers a useful definition for manuals: “A book that gives you practical instructions on how to do something or how to use something, such as a machine.”
It is important to note that there are several synonyms that have the same or similar meaning to manual. Examples
include bible, guidebook, handbook, compendium, and reference. For the balance of this article, we will also use synonyms, to avoid overuse of “manual.”
For the professional water treater, manuals are available to help users maneuver the labyrinth of issues that arise when running or servicing water systems for boilers, cooling towers, and other water treatment applications. Sometimes these books are on single topics, and other times they offer a more comprehensive approach, providing an overview of multiple areas. Table A lists examples of a few of the many guidebooks that are available that touch on different aspects of water treatment.
77 the ANALYST Volume 30 Number 2 Technical Updates, Tips, or Reviews T.U.T.O.R.
Title Source/Author Water Treatment Areas? Year Technical Reference & Training Manual (TR&TM) AWT General water treatment, boiler water, cooling water, wastewater, drinking water, treatment technologies, regulatory issues. 2022 The Nalco Water Handbook Nalco (now an Ecolab Company) General industrial water, including technologies and treatment applications. 2009 The Nalco Guide to Cooling Water Systems Failure Analysis Nalco (now an Ecolab Company) Cooling water systems. 1993 Handbook of Industrial Water Treatment Veolia Water Technologies & Solutions General industrial water treatment. Manual is available online. n.d. Water Treatment Principles and Design James M. Montgomery, Consulting Engineers, Inc. Drinking water. 1985 Drew Principles of Industrial Water Treatment Ashland Chemical (now Solenis) General industrial water, including boilers (including steam and high-pressure), cooling water—open and closed systems 1994 Steam: Its Generation and Use, 42nd edition Babcock & Wilcox Includes a section on requirements for boiler water. 2015 ABMA-Boiler 402 Boiler Water Quality Requirements and Associated Steam Quality for ICI Boilers American Boiler Manufacturers Association Boiler water. 2012 Reverse Osmosis: A Practical Guide for Industrial Users, 2nd edition Wes Byrne, published by Tall Oaks Publishing RO system operation. 2002 Basic Principles of Water Treatment Cliff Morelli, published by Tall Oaks Publishing General water treatment. High-Purity Water Preparation for the Semiconductor, Pharmaceutical, and Power Industries Dr. Theodore H. Meltzer, published by Tall Oaks Publishing Inc. Ultrapure water treatment for microelectronics, pharmaceutical, and power plant applications. 1993 Electronics Grade Water Preparation Dr. Avijt Dey and Gareth Thomas, published by Tall Oaks Publishing Inc. Semiconductor water treatment. 2023 Boiler Water Treatment Principles and Practice, Volumes 1 and 2 Colin Frayne, Chemical Publishing Co. Boiler water treatment. 2002 Cooling Water Treatment Principles and Practice Colin Frayne, Chemical Publishing Co. Cooling water treatment. 1999
Table A: Examples of Water Treatment Manuals and Handbooks
In Table A, we have limited the examples to some more well-known guidebooks that have been published that focus on specific end-use applications or technologies— chemicals, equipment, ion exchange, and membranes (e.g., reverse osmosis, and others). Please note that some of these manuals have been published by water business companies—like Nalco, Drew Chemical (now known as Solenis), and Veolia Water & Solutions, while others in this list have been written by subject matter experts in the field or by trade organizations—like the AWT or the American Boiler Manufacturers Association.
The Association of Water Technologies has participated in this arena through its Technical Reference & Training Manual (TR&TM), which was first published in 2001. The second edition came out in 2009, and the third edition was published in the fall of 2022. The middle part of this article will examine the role standards and guideline books play in water treatment. The final section of this article will focus on the TR&TM, which is just under 1,000 pages and came out in the Fall of 2022.
However, before we launch, it is important to distinguish between a standards document and a manual.
Standards Versus Simple Guidelines
A standards document lays out instructions and requirements a water treater is required to follow when preparing water for a particular use. A good example is the United States Pharmacopeia and the National Formulary (USP-NF), published by the United States Pharmacopeial Convention Inc. in Rockville, MD. The purpose of the USP-NF is to protect public health through monographs (compendia) that provide standards to ensure the purity of drugs, supplements, healthcare devices, and certain consumer products requiring the pharma-grade waters (e.g., over-the-counter products like moisturizing eye drops, toothpaste, cosmetics, and others). These requirements touch on many different areas beyond water treatment (2). The U.S. Food and Drug Administration enforces the standards set forth in the USP-NF
The USP-NF does not prescribe the design of pharmaquality water treatment plants, but for particular types of water (e.g., Water for Injection [WFI]) it does list particulars such as conductivity, total organic carbon, bacteria, and endotoxins. Table B shows the water quality requirements for WFI as set forth by the USP (3).
The production of pharmaceutical grades of water and the allowable treatment technologies are also touched on in the USP-NF. For example, For example, before 2009, treatment systems making WFI were requred to include thermal distillation to ensure control of bacteria. Then in 2009, the Japanese Pharmacopoeia (JP) also allowed for the use of reverse osmosis and ultrafiltration, a move that allowed for WFI water loops to run at ambient temperatures. The USP then followed suit, and the European Pharmacopoeia came on board in 2016 (4), meaning two types of treatments could be used.
Table B: USP Water Quality Attributes for WFI
table of equivalent acceptable conductivity/temperature points.
Source: Reference 3.
In summary, for regulated industries, regulated industries, a treatment system must follow specific protocols for treating water. These protocols may dictate acceptable treatment technologies or allow for Best Available Technology(ies) (BAT)—a term commonly associated with the U.S. Environmental Protection Agency (EPA), which is known to prescribe allowable treatments when it is the regulator overseeing certain types of types of water treatment or environmental cleanup. At other times, there is leeway allowed for how the water is treated, so long as it meets particular water quality specifications.
Treatment Handbooks
In other cases, industrial trade groups may publish treatment guides, but they will not have the force of law like the USP as prescribed by a law passed by the U.S. Congress. Two examples are the power and semiconductor industries. In each, one will see variety in the design of water treatment plants, but the various configurations still aim to produce water that meets particular quality parameters and is able to be used as needed in the plant.
Manuals, on the other hand, not only seek to help users achieve particular water quality standards, they also serve to educate the reader about water chemistry itself,
78 the ANALYST Volume 30 Number 2
Parameter Requirement
TOC
Conductivity* <1.3 µS/cm @ 25°C
500 ppb Bacteria <10 CFU/100 mL Endotoxins <0.25 IU/mL
*Note: The conductivity values listed in the table come from a
so that they better understand problems water may cause, and how to address those matters. For example, understanding water hardness, the problems it may cause, and how water softening can help. Or alkalinity and acidity in water, and ways the pH level can be adjusted.
Manuals also will help teach readers about how treatment chemicals can adjust the water chemistry to minimize problems. For instance, the use of biocide microbial control or ways to stop scaling or corrosion. On the equipment side, manuals should educate the user on how treatment technologies work and their practical applications. For instance, ion exchange or reverse osmosis to remove dissolved solids as needed for boiler water treatment.
In summary, manuals often will address these kinds of subjects:
Water quality and the concerns that should be addressed.
How water quality can impact the system and treatment equipment using the water (e.g., cooling tower, boiler, etc.).
Treatment technologies or approaches appropriate for particular end-user applications (chemicals, equipment).
Troubleshooting.
TR&TM
The remainder of our conversation will briefly review the third edition of the TR&TM. Like the earlier editions, the latest TR&TM provides the user with a handbook that covers a wide range of topics useful to the members of the AWT, and professional water treaters in general. The 3rd edition was updated by a committee that included members from the AWT technical committees. Their work included reviewing existing chapters and making changes as needed to the text so that the manual is relevant to 2023 and beyond. Work also was done as necessary to improve the resolution of figures in each chapter. Where possible, new photos and drawings were brought into the chapters, or drawings and graphs were redone by graphic artists to update each chapter. Likewise, tables that were inserted images were redone so they could be typeset to make them more readable.
Mechanical features of the complete manual were also reworked. These included section numbering, and
numbering for Figures, Tables, Equations, and Examples. The chapter number begins the numbering sequence on these features. For example: 2.1.0 Introduction (Chapter 2, Section 1.0); Figure 3-5 (Figure 5 in Chapter 3); and Equation 4-4 (Equation 4 in Chapter 4). This was done throughout the manual to bring consistency and allow for a simple way for a reader to provide citations that can be easily found by a colleague.
References were also updated and expanded in the different chapters to provide users with additional sources to help learn more about a topic. This work also included the listing of trade organizations useful for research work.
Manual Chapters Overview
Briefly, we will examine the content of the chapters.
Introduction and Chapters 1 and 2
This part of the manual contains educational information on water chemistry and background on chemical treatments used to adjust water chemistry, as well as external treatment equipment used to physically remove water contaminants. Examples of the latter include activated carbon, cartridge and membrane filters, membrane systems, electrodeionization, and ion exchange.
Chapters 3, 4, 6 and 7
From there, TR&TM Chapters 3, 4, 6, and 7 examine water treatment for boilers, cooling water, wastewater, and drinking water. The aim of each chapter is to offer the reader useful background about the needs in each water use application and practical knowledge about the respective needs for each type of water treatment and information about common treatment approaches. As appropriate, relevant regulations are also touched on in these chapters.
Chapter 5
This chapter provides an overview of regulations that impact a company in the water business. Regulations like the EPA oversees like the Clean Water Act are addressed as needed in other chapters. Some issues touched on include the following:
Worker safety and personal protection equipment,
Transporting of hazardous materials and driver safety,
79 the ANALYST Volume 30 Number 2
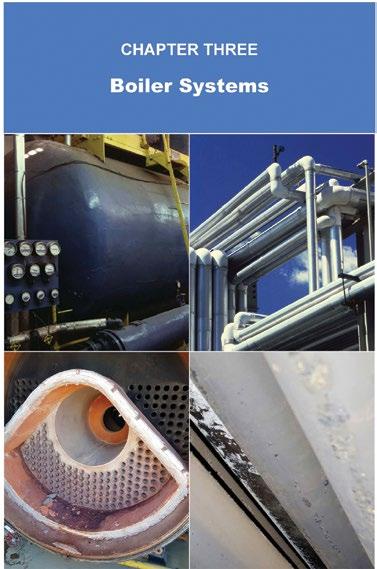

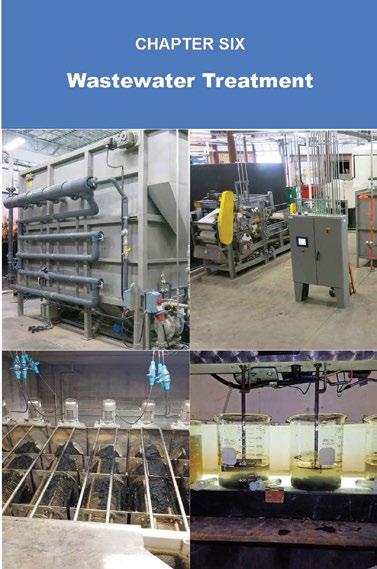
80 the ANALYST Volume 30 Number 2
Figures 1 through 4 show the Manual’s cover, and the covers for Chapters 3, 4, and 6.
Figure 1: TR&TM manual cover.
Safety Data Sheets, and
Record keeping.
Chapter 8
This is a new chapter in the manual and focuses on other areas of water treatment not covered in the earlier chapters. Topics addressed by the chapter include ultrapure water (semiconductor, pharmaceutical, and power), industrial water treatment, residential and light-commercial uses, food and beverage, and natural resources water (e.g., mining and produced water). The aim is to briefly introduce other water market areas and to offer basic explanations of the water quality needs and technologies that might be used. Chapter 8 also provides listings on different trade organizations involved with the different types of water uses it covers.
Final Thoughts
A water handbook’s focus is to help educate the reader— both about water itself and then how to treat the water for a specific application. That can simply involve adjusting the water chemistry through chemicals to make it less likely to cause fouling, scaling, corrosion, or to control microorganisms. On the other side, a manual can also address treatments used to physically remove dissolved or particulate contamination. Guidebooks will also address regulatory requirements, but from the standpoint of informing the reader about them and where to find the published standards that must be followed.
Conversely, water treatment standards as set forth by regulators such as the FDA or the EPA must be followed, and those who violate them can be subject to fines and other penalties.

The TR&TM is a manual published by the AWT that offers the user nearly 1,000 pages examining general water treatment for commercial/institutional, HVAC, and industrial applications. The newly updated handbook is written and designed in such a way that is technical, educational, and non-commercial.
References
1. Cambridge Dictionary (n.d.). “The Meaning of Manual in English,” The Cambridge Dictionary, accessed at dictionary.cambridge.org/dictionary/english/manual (April 2023).
2. Kameyama, Y.; Matsuhama, M.; Mizumaru, C.; Saito, R.; Ando, T.; Miyazaki, S. (2019). “Comparative Study of Pharmacopoeias in Japan, Europe, and the United States: Toward the Further Convergence of International Pharmacopoeial Standards,” Chemical and Pharmaceutical Bulletin (Tokyo) 67(12), pp. 1301-1313, doi: 10.1248/cpb.c19-00621. PMID: 31787657.
3. Evoqua Water Technologies (n.d.). “Water for Injection (WFI): Providing High Quality Pharmaceutical Water to Meet Industry Needs and Global Regulations,” accessible at www.evoqua.com/en/markets/applications/water-for-injection-wfi/
4. Henley, M. (February 2017). “Changing Currents: What Water Treatment Advancements Mean for Pharma?” PDA Letter, pp. 26-28.
Mike Henley is a Water Industry Consultant with MD Henley & Associates. As a part of his work, he serves as the technical editor of the Analyst. Mr. Henley has been in the water industry for more than 33 years and was the editor of the old Ultrapure Water Journal for 27 years, and during that time also helped to organize technical programs for more than 60 conferences. He may be contacted at mdhenleywater@gmail.com.
Keywords: BOILERS, COOLING WATER, COOLING TOWERS, DRINKING WATER, ENVIRONMENTAL, EPA, REGULATIONS,
81 the ANALYST Volume 30 Number 2
Uniphos Uniphos, Inc. 1011 West Lake Street Suite 210 Oak Park, IL 60301 Phone: 708 445-1294 • Fax: 708 445-1394 • Email: gcollias.uniphos@sbcglobal.net A US-based company helping North American water treatment chemical companies, blenders, and distributors. Our technical representatives have more than 25 years experience in water treatment chemicals. C M Y CM MY CY CMY K Uniphos 2020.pdf 1 4/23/2020 3:57:49 PM
What’s (Water) on Your Mind?
Should a Carbon Filter be Placed Upstream or Downstream of the Water Softener?
 By Compiled by James McDonald, Chem-Aqua
Note: The following discussions come from the Industrial Water Treatment interest group on LinkedIn.
Question of the Week
When required, should a carbon filter be placed upstream or downstream of the water softener? Why?
Andy: Oh—a controversial question. Yes, normally it would be before a BX; however, I have also been asked to put them after to allow chlorine into the BX, before the feed into medical equipment! So, it will also depend on levels of chlorine present in the feedwater.
Haritha: The carbon filter should be placed before a water softener because it will remove chlorine from the water, which is good for the softener resin’s life span.
Pankaj: A carbon filter will remove organic matter, which is one of main causes of softener resin fouling and efficiency loss.
Victor: Downstream.
John: Upstream, especially in municipal water using chloramines for disinfecting. Chloramines can turn softener resin to mush in just a few years.
Hemant: Upstream. Chlorine removal prevents decrosslinking of the softener resin and removal of organics, which can foul the resin. Both improve the functioning of the softener resin as well as increasing the resin life.
Mehdi: The carbon filter should be installed prior to the water softener. This extends the softener life by removing
chlorine before the softener and makes for great clean water.
Cesar: A carbon filter must be installed before a softener unit. It removes chlorine and protects the softening resins of the oxidation effect.
Babatunde: A carbon filter should be installed upstream to remove chlorine and extend the softener lifespan.
Question of the Week
What are some weird or unexpected items you have found inside valves, membrane housings, softener heads, pipes, etc. when you opened them up?
Dave: Hair nets, gloves, safety goggles, and a screwdriver one time.
Larry: A work boot in the strainer.
Mike: A bird skeleton on the tube sheet of a shell-andtube exchanger. It was a big bird.
Sandesh: Metal welding parts in a membrane housing.
David: Peanut shells plugging a shell and tube heat exchanger. The toughest material on the planet. Impermeable to any acid. It was caused by operators on break tossing them in the cooking tower sump.
Keith: Shovel, 4x4 piece of wood, dead eel, and heavy gauge plastic outer wrap from bottled water.
Mike: A small tree growing inside a large cooling tower at a mall. The tower had about 15 inches of scale in
82 the ANALYST Volume 30 Number 2
bottom to hold it up. The tower fan blades kept branches trimmed.
Lauren: A 6-foot long 2x4 at the end of a combined sewer at the lift station.
Dorian: A giant piece of carbon.
Mindy: An empty beer can and empty pack of cigarettes in a very large valve. Apparently, someone on a roof used the vent stack as a trash can. Maybe the person didn’t actually drink the beer on the roof at work and just found an empty beer can in his/her pocket?
Oliver: Mussels in the sand filter. Not very original but what a sad life!
Trace: Toy army man.
Kevin: While I was stationed on the Battleship New Jersey, we were steaming in the Indian Ocean and the four main condensers started losing vacuum and increasing in temperature. The exchangers were getting plugged by eels. Pulling dead, rotten, half-cooked eels out of the condenser by hand is something I will never forget, and it haunts me 30 years later.
Cory: A large religious candle.
Edward: Dead baby turkey and squirrels inside the basin of a BAC forced draft tower.
Michael: An entire nest of ladybug bodies clogging a strainer before a brand-new heat exchanger.
Question of the Week
Can a SAC (strongly acidic cation) softener resin remove ammonia? Is it used for this purpose often?
Muhammad: Ammonia is removed preferentially to sodium by cation resin but is displaced by calcium and magnesium. Therefore, a single softener will remove ammonia during the initial part of its cycle but will then release the ammonia as it becomes exhausted with hardness.
in a packed column might be used to reduce ammonia levels in cooling water at an ammonia plant, I tried this approach around 25 years ago in several lab studies. Column plugging is a problem if small mesh size zeolite is not removed mechanically using screens.
Mike: The H (hydrogen) form will work better; a softener will only work if there are no other competing ions than sodium (Na) or lithium (Li).
Question of the Week
Where does the rule of thumb “rinse three times” come from?
Adam: It is accepted that one rinse removes 90% of the contamination in a container. Therefore, one rinse would leave potentially 10% residual. The next rinse removes 90% of that resulting in 1% residual, and the third rinse takes it down to 0.1% residual or 99.9% contaminant free. Further rinsing would have diminished effectiveness. For more trace testing, additional rinsing may be required. And there are obviously exceptions to the rule.
Austin: It is an analytical chemistry lab technique, where your standard deviation really mattered! Triple rinse all glassware. That’s where I learned it at least.
Chris: It is interesting to see that a seasoned professional does the triple rinse without even knowing why they are doing it. However, I kept dedicated sample bottles in my test kit: pure water/condensate, makeup/city water, boiler water, and cooling water. My plants also had dedicated sample bottles. It reduces contamination and greatly improves accuracy. Don’t believe that it is okay to use a sample bottle for cooling water one time and to use it for condensate. Even after triple-rinsing you will find poor results.
Jo Anna: I’m unsure of its origin, but I can tell you that I fill my drinking cup of water the same way—triple rinse!
Denis-Francois: By doing it that way, you can remove contamination to some orders of magnitude higher than by using the same quantity of water in one go.
Paul: Can the water be acidified slightly to convert ammonia to the ammonium ion? Some resins might remove the ammonium ion. Zeolites of proper mesh size
Brian: Note, your rinse water should be of similar or higher purity than the sample being collected so as not to
83 the ANALYST Volume 30 Number 2
potentially leave residue from the rinse water that could impact the sample.
Question of the Week
How is softener resin made?
Denis-Francois: By polymerization of styrene and di-vinyl benzene (with some catalyst and tension active ingredients) in a closed reactor with adequate stirring. Water is used as the continuous phase and the monomers’ droplets are dispersed by stirring. By heating the reactor with steam, polymerization will occur and make the droplets harden and you’ll get polystyrene (PS) beads. The PS beads will be then functionalized (sulfonic groups) in another reactor using oleum at temperatures over 100°C. Now, many suppliers propose calibrated beads made by jetting technology.
Ivey: Softener resin, also known as ion exchange (IX) resin, is a polymer that is used to remove ions from water in a process known as IX. The resin is made from a crosslinked polymer matrix, which is typically made from polystyrene, and functionalized with an IX group, such as a sulfonic acid or quaternary ammonium group.
The production process for softener resin typically involves the following steps:
Polymerization
Functionalization
Crosslinking
Granulation
Quality control
Once the softener resin is produced, it can be used in a variety of applications, including water softening, deionization, and purification.
Question of the Week
What is the definition of Industrial Water Treatment?
Boone: To me, I ask myself, what is a facility there to do? If the primary function of the facility/company is to make money doing something other than treating water, then I call it “industrial water treatment.” Whether it be refining oil, producing chemicals, making electricity, baking bread, or taking care of patients: if they use water and need to treat it, then they need an industrial water treatment professional to help them out. I had an old
refinery manager tell me “My job is to boil oil. That’s my expertise. Your job is to treat water, that’s your expertise and that’s why we partner with you.”
Paul: Here are some examples:
Minimizing heat exchanger corrosion and minimizing fouling of heat exchangers by calcium and iron deposits and microbiological slime masses.
Minimizing fouling and corrosion of boiler tubes.
Treating wastewaters to meet discharge permit requirements.
Reusing blowdown water from cooling towers and boilers if it is economical to use membrane filtration techniques.
Arshad: Post-industrial water treatment is a process where we can achieve certain parameters for water that is safe to discharge in the environment. Parameters can vary. Some common parameters are chemical oxygen demand/biological oxygen demand (COD/BOD), total dissolved solids (TDS), color, odor, and oil/grease and dissolved oxygen.
Common treatment processes are physical removal of contaminants by chemical flocculation or anerobic or aerobic processes followed by tertiary treatment that can include filtering and oxidation. For zero discharge, RO and evaporators are common options used.
Winnie: Industrial water treatment is the key to protecting our world’s environment, and to achieving clear, safe water to be discharged into the environment.
Jaswant: An industrial water treatment system treats water so it can be used for a given use, whether for consumption, manufacturing, or even disposal.
Zahid: Industrial water treatment is the process of treating and purifying water used in industrial processes, such as manufacturing, power generation, and chemical processing. The purpose of industrial water treatment is to remove impurities, contaminants, and other unwanted substances from the water in order to ensure that it is safe and suitable for use in industrial processes. Industrial water treatment may involve various processes such as filtration, chemical treatment, sedimentation, disinfection, and other physical and chemical methods to achieve the desired water quality. The specific water
84 the ANALYST Volume 30 Number 2 What's (Water) on Your Mind continued
treatment processes and technologies used depend on the source and quality of the water, the intended use of the water, and the regulatory requirements of the industry.
Dan: A system that is important enough to make people think about the chemistry and equipment options, which usually requires onsite support. If there is a failure, somebody is fired and/or sued due to loss of big $$$$. IMO, all other systems are either commercial, institutional, or residential.
James: I asked the new AI ChatGPT chatbot, and it replied: “Industrial water treatment refers to the process of purifying and enhancing the quality of water used in industrial processes. The goal of industrial water treatment is to provide water that is free of impurities and contaminants that can cause damage to equipment, reduce process efficiency, and harm the environment. The process typically involves a series of treatments, including physical, chemical, and biological methods, to remove contaminants and make the water safe for industrial use.
Industrial water treatment is necessary for many types of industrial processes, including boilers, cooling towers, heating and air conditioning systems, and process water systems. The specific water treatment methods used will depend on the type of industrial process, the type and concentration of contaminants present in the water, and the desired end product.
Examples of common water treatment methods include filtration, ion exchange, reverse osmosis, chlorination, and ozone generation. The water treatment process is carefully monitored and controlled to ensure that water quality standards are met and that the process is safe and environmentally sustainable.”
Moderator James McDonald, PE, CWT, is a director of Technology & Marketing with Chem-Aqua. He holds an M.S. in chemical engineering and is a Ray Baum Memorial Water Technologist of the Year award winner (2013). Mr. McDonald also chairs the Association of Water Technologies (AWT) Technical Committee.
Keywords: ACTIVATED CARBON, CATION RESIN, INDUSTRIAL WATER TREATMENT, ION EXCHANGE, SOFTENING
continued from page 75
important questions. Even when others who care are seeing them regularly, that individuals can come into their lives who are looking for opportunities to take advantage and steal from vulnerable people.
Conclusions
It is important to respect the desires of a family member or close friend to live alone. However, those special people in our lives can reach a place of being vulnerable. At that point, they will need at least one, and preferably more advocates in their lives to protect them, to ensure they receive appropriate healthcare, that their finances are property managed, and that nobody is taking advantage of them.
Disclaimer
The content of this article is based on the authors’ personal experiences. It is not intended to be professional advice. Readers with questions should seek the advice of a professional in healthcare or of a licensed attorney to address their specific situation.
Beyond Water… is a column in the Analyst to address life issues that members of the AWT face in addition to their important work in the water treatment business. We welcome contributions from readers. If you have an idea for an article, please feel free to send your suggestion to Mike Henley at mdhenleywater@gmail.com. We welcome your input.
Mike Henley is a Water Industry Consultant with MD Henley & Associates. As a part of his work, he serves as the technical editor of the Analyst. Mr. Henley has been in the water industry for more than 33 years and was the editor of the old Ultrapure Water Journal for 27 years, and during that time also helped to organize technical programs for more than 60 conferences. He may be contacted at mdhenleywater@gmail.com . ©2023, MD Henley & Associates.
85 the ANALYST Volume 30 Number 2
+ pH Panels


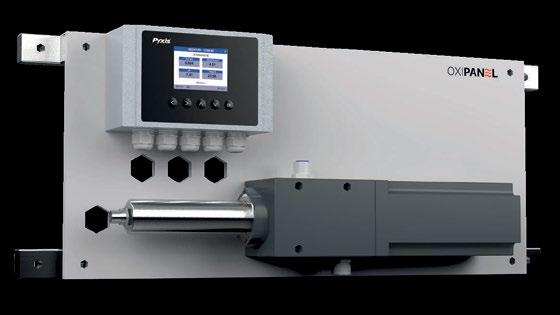

86 the ANALYST Volume 30 Number 2 Advertising Index 29 AMSA 26 AquaPhoenix 6 Bio-source, Inc. 34 Brenntag North America 71 CHEMetrics 87 Enviromental Safety Technologies 68 Metal Samples Company 44 Myron L Company 88 North Metal 2 Pulsafeeder, Inc. 86 Pyxis 11 Qualichem, Inc 25 Quantrol 62 Sanipur US 51 Special Pathogens Laboratory (pace) 81 Uniphos 72 Walchem Iwaki America 76 Water Color Management
F-Cl ClO2 Br Our OXIPANEL™ Series provides real-time oxidizer + pH & temperature measurement while continuously brushing the sensor head for wildly accurate readings in the most challenging applications. Learn More
Self-Brushing Oxidizer
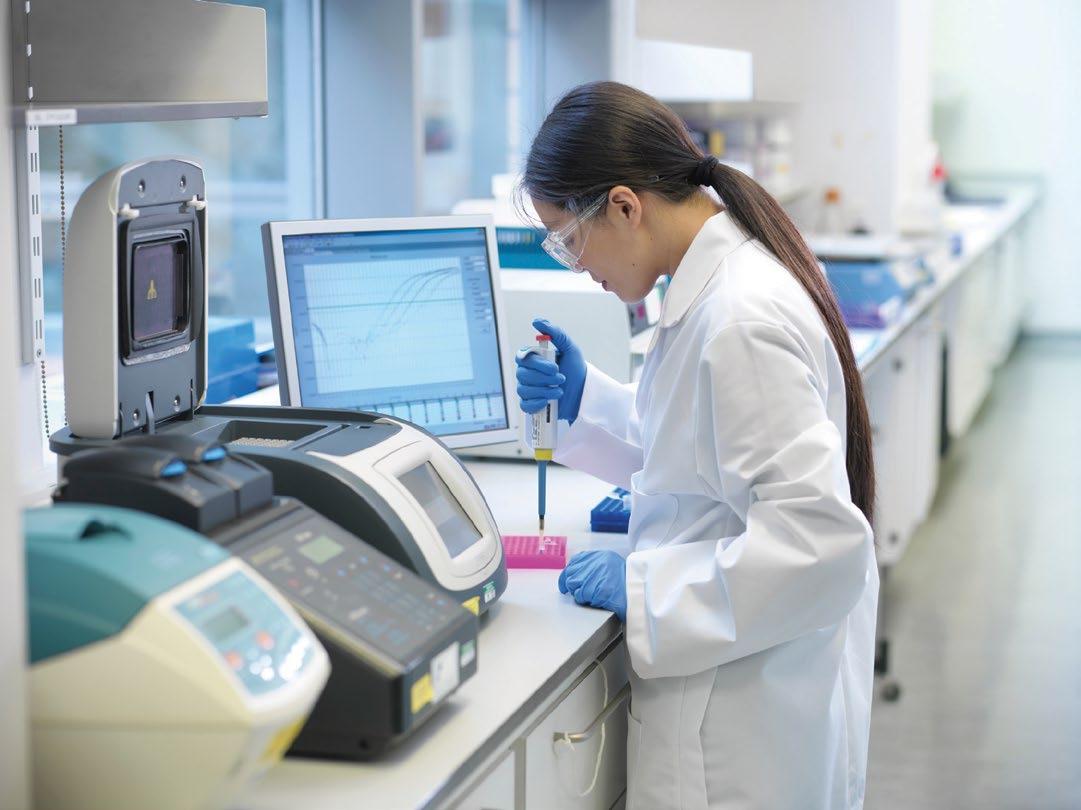





 Jeff Bates IDEXX Laboratories


 John Sandford,
Environmental


 Rob Ferguson French Creek Software


 By Compiled by James McDonald, Chem-Aqua


