
HPSI’S 2024 COST OUTLOOK
Dear Valued Members,
I am pleased to present HPSI’s Cost Outlook with projections to help inform your budget for the remainder of the year and into 2024. As we navigate the ever-changing landscape of the supply chain, it is our priority to keep you updated on the economic factors that impact your business.
While inflationary pressures have eased from the peak levels seen throughout much of 2022, inflation is still above pre-pandemic historical averages, and we expect they will remain there well into 2024. There are several forces that are influencing inflation, these include, but are not limited to, measures implemented by the Federal Reserve, strong labor market conditions, food demand, and costs associated with raw materials.
At HPSI, we remain committed to working with our suppliers to meet your needs — both on supply assurance and on pushing back against inflation. Forecasting prices in such a dynamic environment is inherently challenging, but rest assured that HPSI is steadfast on keeping you informed and providing leading-edge insights to help you manage your business.
QUESTIONS?
Please contact your dedicated Purchasing Consultant directly.
TELL US WHAT YOU THINK
We value your feedback and want to hear what you think about this year’s Cost Outlook. Please take a minute to complete this brief survey.
Our team of sourcing professionals have demonstrated exceptional expertise and dedication over the past three years, and we extend our heartfelt gratitude to them.
As you delve into this publication, we hope you find the information and insights valuable for your operations. We remain focused on supporting your success.
Thank you for choosing HPSI as your trusted supply chain partner.
Best regards,
Dean Hansen Managing Director, Supply Chain Greg Perron Managing Director, Supply Chain

AUGUST 2023 © 2023 HPSI PURCHASING SERVICES, LLC, AN AVENDRA GROUP COMPANY. ALL RIGHTS RESERVED.
TABLEOFCONTENTS


DOWNLOADABLE VERSION AVAILABLE Use the Download icon on the top left of the web page.
Disclaimer: Predicting the future carries a certain amount of risk. While every effort has been made to ensure accuracy, the information presented here is predictive and not intended to be taken as fact. This material is furnished for informational purposes only, is subject to change without notice, and should not be construed as a commitment by HPSI or our suppliers. While HPSI and Avendra have made every effort to supply complete and accurate information, Avendra assumes no responsibility or liability for errors or inaccuracies that may appear herein. Avendra, LLC © 2023

Executive Summary Macro Trends High-Level Inflation Overview by Category United States Economic Outlook Commodities Short & Long-Term Outlook 04 08
EXECUTIVE SUMMARY MACRO TRENDS
While inflationary pressures have eased from the peak levels seen through much of 2022, there remain risks that keep the inflation outlook elevated and above pre-pandemic historical averages.
Leading factors that have contributed to the build of the outlook for the year ahead:
Aggressive measures implemented by the Federal Reserve and central banks globally to cool inflation off historic highs are expected to continue until core indicators return closer to target levels near two percent.


Even with the central banks’ actions meant to slow economic activity to curb price growth, labor market conditions remain strong with job growth continuing. The unemployment rate remains near historic lows, keeping consumer spending solid even in the current inflationary environment.
Food demand, after removing inflation effects (i.e., on a unit volume basis), has slowed or declined through early 2023. The sharpest falls have been in retail food sales. Foodservice sales are beginning to dip below year-ago levels in the past month or two based on USDA food expenditure data.
Costs associated with key raw material inputs, fuel, freight, and ocean shipping have dropped from peak levels as supply, labor, and trade-related stresses ease. We see this in the year-on-year producer price index changes with input cost inflation in some industrial sectors nearing or falling below 0% as of May 2023.
Extreme weather and drought remain significant factors for U.S. and global crop production this season. Years of unfavorable weather conditions will keep fruit and vegetable supply used in further processed produce limited into 2024. Weather has also impacted U.S. and world sugar output, driving sugar prices to an 11-year high.

4 © 2023 HPSI PURCHASING SERVICES, LLC, AN AVENDRA GROUP COMPANY. ALL RIGHTS RESERVED.
EXECUTIVE SUMMARY MACRO TRENDS
Five foods to watch:
MEATS POTATOES
• Based on USDA forecasts through June, total red meat and poultry production in 2024 will decline for the first time in a decade, led by a 5% reduction in annual beef output this year.
• Cyclical declines in the beef cattle herd and elevated feed costs factor into reduced beef supply through 2024 with per capita beef availability expected to fall to historic low levels.
• Over time, pork and poultry prices are expected to follow beef prices as consumer demand shifts toward less expensive proteins.
• Although U.S. potato plantings are expected to increase, five straight years of production declines and adverse weather conditions in the Pacific Northwest growing regions have strained processing potato supply.
• Demand for frozen potatoes at home and abroad remains strong even as potato costs surge to multi-year highs.

TOMATO PRODUCTS SWEETENERS

• A widening global sugar deficit has driven sugar prices to an 11-year high.
• Declining output from key producers in Asia and a reduction in sugar beet production in Europe have fueled supply concerns.
• The USDA has projected year-on-year declines in domestic sugar beet acres and sugar imports, keeping inventories tight through the remainder of 2023 and into 2024.
• Declines in planting area, expansion of drought conditions, and worsening water shortages all factored into the lowest processing tomato production since 2017, driving market prices to multi-year highs.
• As demand remains solid and processing tomato inventories fall, USDA prices for key raw material used in production of sauces, ketchup, and juices have risen 50% from year-ago levels.

• Although the production outlook has improved with expanded plantings and drought relief in California growing areas, higher prices for tomato products are expected until the new crop is harvested later this year.
FRUITS & FRUIT JUICES

• Orange juice futures have surged as Florida orange production this season is expected to be the smallest since 1937 based on current USDA projections. Historically, 95% of Florida’s orange output is utilized in juice production.
• Apple production in top producing state Washington is expected to fall to a 16-year low this season due to unfavorable growing conditions.
While underlying cost trends support a lower food inflation outlook relative to previous peak levels, risks have emerged that could limit further drops toward pre-pandemic annual average inflation rates between 2%-3%.
5 © 2023 HPSI PURCHASING SERVICES, LLC, AN AVENDRA GROUP COMPANY. ALL RIGHTS RESERVED.
HIGH-LEVEL INFLATION OVERVIEW BY CATEGORY
For budgeting and planning purposes, the following is a high-level summary of expected inflation in key purchasing categories and suggestions to help mitigate price increases. While these estimates are intended to provide budgeting guidance on broad categories, some specific items will experience higher or lower price changes than indicated below.
INFLATION CATEGORY INFLATION PROJECTION MITIGATION
Food & Beverage
Inflation has eased, but we‘re still far from normal inflation levels. Expect mid-single digit inflation in the Food & Beverage category for Q4 2023 and into 2024. Protein markets, while improving, are still strained (especially beef). Seafood is a good option. Grain markets have eased but remain volatile. The threat of a potential recession still looms and may put downward pressure on prices, but with each passing month, this becomes less likely.
Disposables (paper, resins, towels, tissue)
Expect sporadic disruptions across the industry and inflation of 3%-5% into 2024 as supply chain disruptions have stabilized. Demand remains robust in the F&B to-go packaging categories, along with a continued, heightened interest in more sustainable options. These challenges will continue to put price pressure on all raw materials in the category including resins, paper, fiber products and pulp.
Smallwares & Equipment
We do not expect to see any significant price increases for the remainder of 2023. We expect annual price increases for 2024 in the range of 5%-7% instead of the unpredictable fluctuations we have had in the past few years. Although manufacturer fill rates have improved, they are still less consistent than pre-Covid. However, this is expected to change in the next 6-12 months, resulting in better fill rates across the industry.
Administrative / Office Supplies
Expect moderate increases in the range of 0%-3% for the remainder of 2023 (based on contractual safeguards).
Plan for 4%-5% increases in 2024.
Adjust menu items, downsize items/portions, be flexible with protein and produce choices, and/or adjust menu prices as needed. Continue working with your master food distributor to optimize deliveries and enhance drop size. Keep an open line of communication with fresh food distributors to reduce supply issues, especially for large events.
Communicate with distribution for available alternatives.
So far in 2023, we have noticed an increase in capital equipment demand. To prevent any service disruption, it‘s advisable to plan for extended lead times.
Adjust shipping modes (overnight to 2-day saver), institute controls on office supply orders and utilize the highly leveraged core items.
6 © 2023 HPSI PURCHASING SERVICES, LLC, AN AVENDRA GROUP COMPANY. ALL RIGHTS RESERVED.
HIGH-LEVEL INFLATION OVERVIEW BY CATEGORY
For budgeting and planning purposes, the following is a high-level summary of expected inflation in key purchasing categories and suggestions to help mitigate price increases. While these estimates are intended to provide budgeting guidance on broad categories, some specific items will experience higher or lower price changes than indicated below.
INFLATION CATEGORY INFLATION PROJECTION MITIGATION
Textiles (linens, towels)
The textiles category has seen stability over the past six months, including some targeted reductions in cost. Cotton remains below $1/lb and we expect it to remain stable. The fall harvest will be a large factor in the quantity and quality of material available for 2024, but a strong crop is expected. Cotton demand remains high across all business segments and hospitality is seeing increased activity in textile transitions and new program adoptions. In the U.S. and Canada, the expected 2024 increase is 0%-3%.
For more detail, please see the category-level forecasts by geography.
Systemwide textile supply health is strong. Members are encouraged to increase par on terry and sheeting, when possible, to assure product availability and drive customer satisfaction. Please plan larger purchases through your distributor sales representative.
Freight/fuel surcharges: Contracts are designed to protect our members and mitigate against significant increases. However, due to the current environment, surcharges may be unavoidable as some contracts permit such surcharges. If members receive an unexpected fuel surcharge from an HPSI-contracted supplier, please contact your Purchasing Consultant so that we can address it with the supplier.
7 © 2023 HPSI PURCHASING SERVICES, LLC, AN AVENDRA GROUP COMPANY. ALL RIGHTS RESERVED.
USAECONOMY
• Job growth has been strong, but slowed in June. Nonfarm payrolls increased by 209,000 for the month, the slowest growth in 30-months. The unemployment rate remains low at 3.6%.
• Business activity growth decelerated in June as manufacturing output dropped sharply and demand for services cooled. S&P Global’s Flash US Composite PMI™ decreased to a reading of 53.0 from 54.3 in May. Manufacturers reported the sharpest fall in new order activity in six months, pointing to weak demand impacting the sector looking ahead.
• Consumer sentiment rebounded in June as survey participants became more confident on the inflation outlook. Based on preliminary survey data, the University of Michigan reported its consumer sentiment index rose to a reading of 63.9 from 59.2 in May. Optimism markedly improved on both short-term and long-term economic prospects. Year-ahead inflation expectations dropped to the lowest level in more than two years.
• Retail sales rose for a second consecutive month in May as consumers pressed forward with spending on goods despite persistent high inflation. May retail sales increased 0.3% for the month, led by a 2.2% rise in building material and equipment sales and a 1.4% rise in automobile sector sales. Sales in food services were up 0.4% for the month.
• Energy prices were generally higher through June as additional OPEC+ production cuts and declining U.S. inventories worked against a weakened global demand environment. Gasoline and diesel prices were up slightly for the month. Stronger gains were seen in natural gas prices, but the market remains sharply below price averages reported this time last year.
• On top of previous output reduction commitments, Saudi Arabia announced an additional oil production cut of 1 million barrels per day (bpd) starting in July. Officials stated the latest cut was necessary to restore balance in global oil markets and indicated the decrease would continue for at least a month. OPEC+ also agreed to an extension of the announced production cuts from April 2023 through the end of 2024.
• National average freight rates decreased in June as truck demand remained weak. Spot market volumes for van and reefer freight have dropped to the lowest levels in seven years entering June, according to DATiQ Analytics.

8 © 2023 HPSI PURCHASING SERVICES, LLC, AN AVENDRA GROUP COMPANY. ALL RIGHTS RESERVED.
KEY CONSIDERATIONS FOR 2023-2024 BUDGETING / Market Conditions in USA
Short term refers to the expectation for the remainder of 2023 relative to current prices. Long term refers to the expectation for calendar year 2024 (through June) relative to current prices.
COMMODITY OUR EXPECTATION IS...
FOOD & BEVERAGE – SHORT AND LONG TERM CHANGES ARE RELATIVE TO CURRENT PRICES
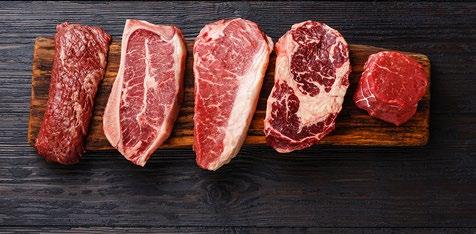
Ground/burgers: 4%-7%
Ribeye: 5%-8%
Tenderloin: 5%-8%
Striploin: 5%-8%
BEEF
Ground/burgers: 6%-9%
Ribeye: 7%-12%
Tenderloin: 7%-12%
Striploin: 7%-12%
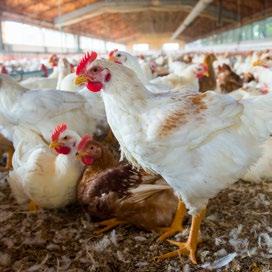
Chicken: 2%-4%
Turkey: 2%-4%
POULTRY
Chicken: 3%-6%
Turkey: 4%-7%
4%-7%
PORK
3%-8%
PASTEURIZED CRABMEAT
12%-14%
SHORT TERM: Ground beef and burger prices are expected to increase due to lower cattle supply and continued high price of feed. Ribeye, tenderloin and strip loin prices are expected to increase due to lower cattle supply as cattle are being held back to replenish future stock. Demand has been seasonally steady, but the lack of supply is being met with bullish retail and bearish foodservice sales.
LONG TERM: Ground beef and burger prices are expected to increase in 2024 as reduced cattle supply across the industry is not forecast to increase enough to meet the demand. Ribeye, tenderloin and strip loin prices are due to increase as stock will remain low going into 2024. The price of feed continues to escalate along with consumer demand, with no relief in sight.
SHORT TERM: Chicken prices are expected to increase slightly as demand continues to grow faster than industry supply. Turkey prices will likely decline as supply is forecasted to continue to recover from the avian flu outbreaks over the past two years.
LONG TERM: Chicken prices are expected to continue to increase in 2024 due to increased demand as consumers trade away from high beef prices. Turkey prices are likely to decline as supply is forecasted to continue to recover from the previous avian flu outbreaks in 2022 and 2021.
SHORT TERM: Market prices are currently low, which will lead to less production as a way to increase prices.
LONG TERM: Pork prices are forecasted to increase as demand for Prop 12 and Question 3 products grows in 2024. The industry supply will not expand to meet those needs until 2025.
SHORT TERM: Worldwide demand from importers procuring crabmeat in Southeast Asia is leaving less raw material available. Overall, 2023 production has dropped 28% compared to prior year. Prices are expected to remain high over the next several months.
4%-6%
LONG TERM: For the remainder of 2023 and heading into mid-2024 prices are expected to remain higher than the same period for the prior year.
9 AVENDRA COST OUTLOOK 2024 // USA © 2023 HPSI PURCHASING SERVICES, LLC, AN AVENDRA GROUP COMPANY. ALL RIGHTS RESERVED.
KEY CONSIDERATIONS FOR 2023-2024 BUDGETING / Market Conditions in USA
Short term refers to the expectation for the remainder of 2023 relative to current prices. Long term refers to the expectation for calendar year 2024 (through June) relative to current prices.
COMMODITY OUR EXPECTATION IS...
FOOD & BEVERAGE – SHORT AND LONG TERM CHANGES ARE RELATIVE TO CURRENT PRICES
SHRIMP
2%-4%
2%-4%
FARMED SALMON
2%-4%
2%-4%
SHORT TERM: The market continues to soften due to U.S. sales lacking for larger shrimp, resulting in higher inventories. China has bought smaller-sized shrimp in larger volumes this year. Pricing for smaller-count shrimp is expected to remain flat as a result of normalized inventories.
LONG TERM: Sufficient or even higher inventories will lend to favorable pricing for the long term.
SHORT TERM: As retailers move to promote fresh wild salmon, supplies for farmed salmon are strong and pricing is expected to be favorable.
LONG TERM: Farmed salmon inventories are expected to be favorable, with the normal fluctuations in market prices throughout the year. For the remainder of this year and heading into 2024, expect more favorable pricing than what was recognized during the same period in 2023.
2%-3%
LIQUID EGGS
SHORT TERM: Barring any further avian flu outbreaks, we expect grain prices to moderate through the end of 2023 after a volatile 2022. Grain prices will be dependent on future rainfall (currently there have been drought-like conditions) and geopolitical events. Recently, the soybean market continued to add weather-risk premiums based on concerns about declining crop conditions and below-normal rain forecast for the U.S. corn belt. A factor that may mitigate egg costs is reduced demand due to a potentially slowing economy.
LONG TERM: If we do not carry enough grain crop into next year, we will see elevated prices until October 2024 (assuming a normal growing season next year). The next major WASDE report in August will provide a clearer picture on this year‘s crop, which will affect the rest of this year and into 2024 (carryover). This outlook is based on no further major avian flu outbreaks.
3%-5%
10 AVENDRA COST OUTLOOK 2024 // USA © 2023 HPSI PURCHASING SERVICES, LLC, AN AVENDRA GROUP COMPANY. ALL RIGHTS RESERVED.
KEY CONSIDERATIONS FOR 2023-2024 BUDGETING / Market Conditions in USA
Short term refers to the expectation for the remainder of 2023 relative to current prices. Long term refers to the expectation for calendar year 2024 (through June) relative to current prices.
COMMODITY OUR EXPECTATION IS...
FOOD & BEVERAGE – SHORT AND LONG TERM CHANGES ARE RELATIVE TO CURRENT PRICES
SHORT TERM: Cheese: As markets come off of the April lows of ~$1.50 a pound, we’re facing a slingshot effect as milk production tails off and producers begin to build in anticipation of the holiday season. Projections over the next 4-6 months indicate we’ll be under $2.00 a pound for block cheese again.
Cheese: 18%-22%
Butter: 8%-12%
Fluid Milk: 6%-14%
DAIRY
Cheese: 8%-12%
Butter: 4%-6%
Fluid Milk: 0%-6%
Butter: Forecasters anticipate no reduction in butter demand; and as raw milk prices creep higher into the fall, butter prices will follow. Production will struggle to keep pace, with demand driving market prices back toward $3.00 a pound for bulk butter. As portion control production continues to be an issue, the market as a whole will rise through the end of 2023.
Fluid Milk: As the favorable conditions that supported an abundant spring flush for U.S. dairy farmers abate and both retail and food service demand recover into the fall, dairy prices will steadily climb. A warmer than average summer and a further push for people to return to school and work will further drive demand and apply pressure on producers to manage costs.
LONG TERM: Cheese: With the anticipated El Niño weather pattern and the geopolitical uncertainty as the 2024 election approaches, conditions for favorability are slim. Higher protein costs will also likely apply pressure to domestic dairy herd sizes, which sets us up for an elevated cheese market.
Butter: The four factors to watch for, relative to butter pricing will be: weather, feed costs, production continuity and demand. Capacity continues to be an issue with our supplier partners, therefore we are anticipating the market to remain higher as we move into fall and beyond.
Fluid Milk: Rising animal protein costs, specifically beef, is an “X factor” for raw milk production, along with expected unfavorable domestic weather patterns will result in increased prices for fluid milk. The demand for plant-based alternatives to dairy has flattened, and the American consumer is once again buying real dairy milk and milk byproducts. The longer outlook for fluid dairy is slightly unfavorable. COFFEE
SHORT TERM: While overall supply and demand appear to be relatively in balance, Brazil‘s unwillingness to supply the market has put a strong floor on pricing. Therefore, the Arabica coffee market has supported high prices from tighter supplies. We are in-between seasons with the Brazil crop, so the new crop is not yet available.
LONG TERM: We expect that the market will begin to normalize and appear bearish. Coffee global production for the 2023/24 coffee crop year is expected to be higher than the previous year. Barring any frost at the end of the Brazil winter season, the June 2023/24 Brazil arabica crop should be 5%-8% larger than 2022/23 and the supply and demand outlook will shift to an over-supplied market. Vietnam‘s production should slightly increase from last year, and favorable weather could improve yields, leading to an even larger crop. Expectations of strong droughts in Colombia later this year have led to lower production estimates. The El Niño weather phenomena is producing high temperatures across the country. Global coffee demand for the June 2022/23 coffee crop year is expected to be down 1.5% from 2021/22 coffee crop year, which was generally flat from 2020/21. If inflation weakens and interest rates fall, a recovery in consumption is likely.
1%-2%
2%-5%
11 AVENDRA COST OUTLOOK 2024 // USA © 2023 HPSI PURCHASING SERVICES, LLC, AN AVENDRA GROUP COMPANY. ALL RIGHTS RESERVED.
KEY CONSIDERATIONS FOR 2023-2024 BUDGETING / Market Conditions in USA
Short term refers to the expectation for the remainder of 2023 relative to current prices. Long term refers to the expectation for calendar year 2024 (through June) relative to current prices.
COMMODITY OUR EXPECTATION IS...
FOOD & BEVERAGE – SHORT AND LONG TERM CHANGES ARE RELATIVE TO CURRENT PRICES
SHORT TERM: After reaching an all-time high of $2.959 per pound solid on May 24, 2023, FCOJ futures continue to remain high due to extremely poor crop yields in Florida. The state saw 15.75 million boxes (the lowest number since 1937) compared to peak production of 242 million boxes in 2003/04 (yields have been steadily declining since then), which have created a backwardation in the FCOJ futures market. Demand is expected to continue to decline in response to higher costs.
LONG TERM: FCOJ futures have the lowest open interest of the five soft commodities that trade on the ICE (e.g., coffee had 173,930 contracts compared to 8,472 contracts for FCOJ as of June 23, 2023), which means low liquidity that tends to lead to more volatility and price gaps. The low open interest could cause a significant downside gap during a selloff if USDA‘s 2023/24 season production forecast is closer to normal levels.
SHORT TERM: The recent renewable volume obligations (RVO) announcement by the Biden administration was bearish news for soybean-oil pricing. While there was a slightly higher allocation for the advanced biofuel bucket (soybean oil falls in this category), it was much lower than expected due to volume switching over from ethanol. Other factors that weigh on the short-term price of soybean oil are macroeconomic concerns related to slowing future demand.
LONG TERM: The main factors that will influence the pricing of soybean oil (the main edible oil used in most frying and cooking oils) in 2024 include the RVO obligations set by the EPA, weather and crop conditions, production in other major soybean producing regions and the competition against other edible oils. With the recent RVO announcement, concerns with macroeconomic conditions slowing demand and stable weather conditions expect a moderate decrease in pricing as the bearish factors are slightly stronger than the bullish factors at this time.
SHORT TERM: The outlook for large annual crops like apples and potatoes are mixed. Washington apple yields are currently projected to be nearly 20% larger than last year, with the largest increases on Granny Smith and Honeycrisp. No word yet on the size profile of the fruit. The Idaho potato crop is also projected to be larger than the last few years’ crops, but that increase will be limited due to a shortage of seed. We expect markets to stay higher than the five-year average, but lower than the past few years.
LONG TERM: As with other categories, we expect the inflation in produce will continue to moderate. As always, crops are heavily dependent on the impact of weather, and any disruptions will be communicated through the normal channels.
FCOJ (FROZEN CONCENTRATED ORANGE JUICE) 0%-4%
4%-8%
COOKING OIL 2%-3%
2%-4%
3%-5%
PRODUCE
3%-5%
12 AVENDRA COST OUTLOOK 2024 // USA © 2023 HPSI PURCHASING SERVICES, LLC, AN AVENDRA GROUP COMPANY. ALL RIGHTS RESERVED.
KEY CONSIDERATIONS FOR 2023-2024 BUDGETING / Market Conditions in USA
Short term refers to the expectation for the remainder of 2023 relative to current prices. Long term refers to the expectation for calendar year 2024 (through June) relative to current prices.
COMMODITY OUR EXPECTATION IS...
FOOD & BEVERAGE – SHORT AND LONG TERM CHANGES ARE RELATIVE TO CURRENT PRICES
3%-7%
WHEAT/BAKERY
3%-9%
DISPOSABLES (PAPER, RESINS, TOWELS,TISSUE)
1%-3%
CAPITAL EQUIPMENT & SMALLWARES
3%-5%
No changes
5%-7%
SHORT TERM: Wheat and bakery prices are expected to remain volatile through the end of 2023. Tensions continue to be heightened in Russia and Ukraine, which is a large region for wheat, soybean and corn production. Concerns also remain high due to drought conditions for domestic crops.
LONG TERM: The Russia-Ukraine War and weather conditions continue to be the biggest threats to the category. Stabilization of the category is heavily dependent on the future of Russia and Ukraine and improvement of weather conditions, both domestically and internationally.
SHORT TERM: Prices are expected to remain flat for paper products and disposable gloves. However, the resin market is more likely to fluctuate between 1%-3% due to increased raw material costs.
LONG TERM: Pricing for disposable gloves has returned to pre-pandemic levels and we anticipate relative stability in price points at this level for the next year. Resin will continue to vary due to market conditions throughout the year. Paper is expected to remain stable.
SHORT TERM: Pricing is expected to be stable for the remainder of 2023.
LONG TERM: Annual price increases are expected to level out during the first half of 2024, with projected increases ranging from 5%-7%.
13 AVENDRA COST OUTLOOK 2024 // USA © 2023 HPSI PURCHASING SERVICES, LLC, AN AVENDRA GROUP COMPANY. ALL RIGHTS RESERVED.
KEY CONSIDERATIONS FOR 2023-2024 BUDGETING / Market Conditions in USA
Short term refers to the expectation for the remainder of 2023 relative to current prices. Long term refers to the expectation for calendar year 2024 (through June) relative to current prices.
COMMODITY OUR EXPECTATION IS...
ROOMS OPERATIONS – SHORT AND LONG TERM CHANGES ARE RELATIVE TO CURRENT PRICES
2%-4%
OS&E
2%-4%
SHORT TERM: Favorable raw material and logistics cost inputs should provide pricing stability through the remainder of 2023, with some slight drawbacks on specific product categories. We have no expectations to receive or accept price increases in the current environment.
LONG TERM: Assuming current inflation rates, we should see relative pricing stability across OS&E categories as the cost inputs have settled into normal ranges, albeit have not returned to pre-2020 levels. Global freight, logistics and other raw material cost inputs have stabilized but have the potential for wide swings based on geopolitical and economic events.
0%-3%
TEXTILES & UNIFORMS
0%-3%
SHORT TERM: We expect to see stability with cotton pricing taking us through the fall aligning with the next cotton harvest. Currently cotton is averaging $0.92/lb. Global logistics costs and other raw material cost inputs have stabilized, creating a more secure environment in a large volume import category.
LONG TERM: We do not expect to see large shifts in cotton pricing or availability over the next 12 months that would shift unit pricing beyond a 3% increase. The upcoming late summer and fall cotton harvest will determine the quality and quantity of supply. With favorable weather conditions over the next few months, we will then get a better pulse on the stability of next year’s cotton market. All other global cost inputs in textiles have stabilized and will continue to be monitored monthly or as needed to make necessary adjustments to support pricing stability.
14 AVENDRA COST OUTLOOK 2024 // USA © 2023 HPSI PURCHASING SERVICES, LLC, AN AVENDRA GROUP COMPANY. ALL RIGHTS RESERVED.
KEY CONSIDERATIONS FOR 2023-2024 BUDGETING / Market Conditions in USA

Short term refers to the expectation for the remainder of 2023 relative to current prices. Long term refers to the expectation for calendar year 2024 (through June) relative to current prices.
COMMODITY OUR EXPECTATION IS...
OTHER – SHORT AND LONG TERM CHANGES ARE RELATIVE TO CURRENT PRICES ENERGY
CHEMICALS (INCLUDING SANITIZER)
5%
Natural Gas: 8% Electricity: 2%-6%
No changes
SHORT TERM: Production has slowed since March and North American natural gas and electricity prices are forecasted to increase 5% for the remainder of 2023.
LONG TERM: Modest economic-growth forecasts and stabilizing production will likely lead North American natural gas prices to increase by 8% and electricity prices to increase by 2%-6%.
SHORT TERM: No change in pricing.
0%-4% LONG TERM: HPSI Ecolab members should budget up to a 4% increase.
15 AVENDRA COST OUTLOOK 2024 // USA © 2023 HPSI PURCHASING SERVICES, LLC, AN AVENDRA GROUP COMPANY. ALL RIGHTS RESERVED.