
In 2024,, we saw a general flattening of the real estate market and stabilization of mortgage rates,, which hovered between 6%% and 7% for a 30-year fixed mortgage. Nationally, the volume of real estate sales in the United States (“US”) dropped from a post-COVID high of 6.12 million in 2021 to 4.06 million in 2024 (a 34% decline). 2024 represented the lowest number of US home sales since 1995, at a time when the population of the US was 30% lower. Mortgage rates have remained relatively unchanged thus far in 2025. The number of US home Sales is on track to be slightly lower in 2025 than it was in 2024. A recent report by Inman News indicates that prices have begun to decline in 31 of the 100 largest markets in the US.
The decrease in the number of closings in metro-Atlanta over the past few years has mirrored that of the National market. Total year-to-date single-family home closings in metro-Atlanta through June 2025 were 29,650 as compared to 29,854 through June of 2024 (an overall decline of less than 1%). This suggests the number of sales has stabilized.
The most significant change in the metro-Atlanta market in the last year is the increase in the number of available homes for sale (or “Inventory”). Inventory rises when the number of homes listed outpaces the number of homes sold. The inventory of available homes increased from 16,312 at the end of June 2024 to 21,505 at the end of June 2025, representing a dramatic 32% increase. Higher inventory translates to: more options for Buyers to choose from, longer time on market, and more negotiation by Sellers both on price and in concessions like closing costs and inspection-related repairs.
The average sales price in metro-Atlanta in June 2025, year to date (“YTD”) was $524,374 vs. $514,530 for June 2024. This represents a modest increase in the Average Sales Price of 2%. If inventory continues to rise, prices are likely to soften or decline.
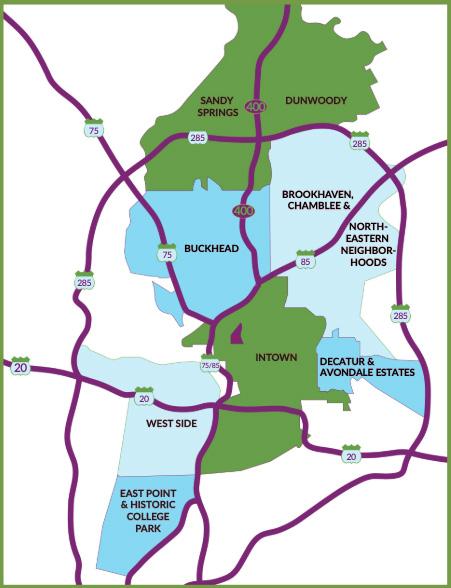
From January to June 2025, there was a noticeable shift away from the vast majority of neighborhoods being a “Seller’s market”. Of the 81 neighborhoods we reviewed, the majority of neighborhoods (49) were still deemed to be a “Seller’s market” (versus 64 in 2024), 13 were deemed balanced (versus 11 in 2024), and 19 were deemed Buyer’s Markets (versus 6 in 2024). We used the measuring stick that six months of available inventory represents a balanced market, meaning 0-5 months of inventory represents a Seller’s market (a market more favorable to sellers in negotiations), and over 7 months of inventory represents a Buyer’s market. This is further evidence that the market is becoming more favorable for Buyers.
The Average Sales Price to Original List Price ratio (“SP/OLP”), a measure of how close to the original asking price a seller is getting, remained high in most neighborhoods, but was lower than in previous years. The degree of negotiation varied by neighborhood. In 10 of the 81 neighborhoods we reviewed, there were virtually no negotiations, with SP/OLP ratios of 100% or slightly over. In 52 of the 81 neighborhoods, there was typical negotiation with SP/ OLP ratios of 95-99%. In 15 of the neighborhoods, there were more substantial negotiations with SP/OLP ratios of 90-95% of the original asking price, and 4 of the neighborhoods were below 90% of the original asking price. The neighborhoods where Sellers negotiated the most were mostly in the West End and East Point areas.
Generally, the Average Days on the Market, the length of time from listing the property until a binding contract, increased in about 2/3rds of the neighborhoods we reviewed, from June 2024 to June 2025.
While it is hard to predict future real estate trends, we want our clients to understand what is happening in the market, so they will understand pricing and how quickly a home will likely sell in the neighborhoods where they live or hope to live. We hope this report will help with that. If you would like a more in-depth analysis of a specific area or want to determine the value of your home, our neighborhood real estate experts are here to help.
We know the Atlanta market. Your neighborhood is our business.
Randal Lautzenheiser, Managing Broker and Owner
Len
Kwilos, Agent and Owner
David Vannort,
Agent and Owner

1. MIDTOWN
2. ANSLEY PARK/ANNEX/SHERWOOD FOREST
3. HOME PARK & ATLANTIC STATION
4. VIRGINIA HIGHLAND
5. MORNINGSIDE & LENOX PARK
6. PONCEY HIGHLAND
7. OLD FOURTH WARD
8. INMAN PARK
9. CABBAGETOWN
10. REYNOLDSTOWN
11. GRANT PARK
12. ORMEWOOD PARK
13 SUMMERHILL
14. CHOSEWOOD
15. PEOPLESTOWN
16. CANDLER PARK
17. LAKE CLAIRE
18. DRUID HILLS
19. EDGEWOOD
20. KIRKWOOD
21. EAST LAKE
22. EAST ATLANTA
23. WOODLAND HILLS
24. LINDRIDGE/MARTIN MANOR


1.
2.
ELEMENTARY
BRANDON ELEMENTARY
3.
4. E
5.
ELEMENTARY
ELEMENTARY
ELEMENTARY


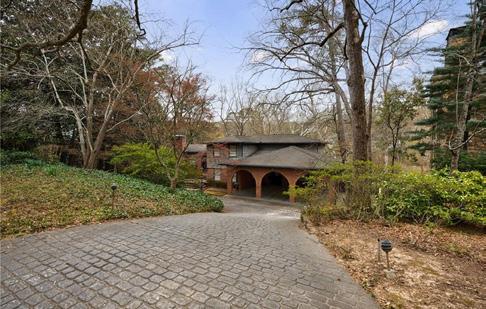


for $2,190,000 on Original List Price of $2,645,000 in 27 days on market. It is a 5 bed/6.5 bath, with 6,706 sq ft at $326.57/sq ft. Built in 1985. Sold 6/13/2025.


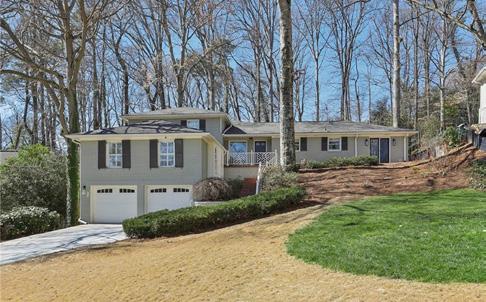
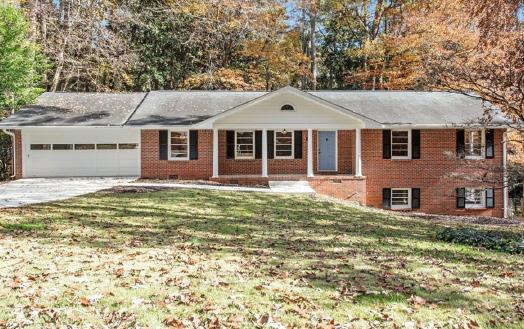
NEIGHBORHOOD SALE 3732 Summitridge Drive, Atlanta, Georgia 30340 Sold for $640,000 on Original List Price of $690,000 in 83 days on market. It is a 4 bed/3 bath, with 2,072 sq ft at $308.88/sq ft. Built in 1963. Sold 6/23/2025.


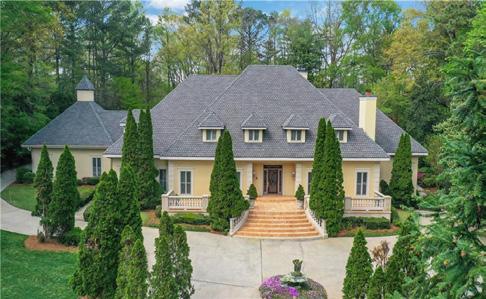
3085 Hudson Way, Decatur, Georgia 30033
for $575,000 on Original List Price of $600,000 in 62 days on market. It is a 3 bed/2.5 bath, with 2,620 sq ft at $219.47/sq ft. Built in 2000. Sold 1/29/2025.
1. SANDY SPRINGS 30328
2. SANDY SPRINGS 30342
3. SANDY SPRINGS 30327
4. DUNWOODY 30338


SALE


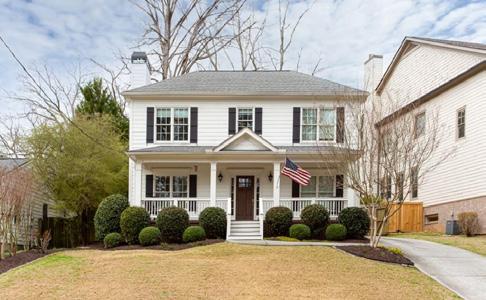
Sold for $330,000 on Original List Price of $350,000 in 13 days on market. It is a 3 bed/2 bath, with 1,196 sq ft at $275.92/sq ft. Built in 1993. Sold 5/5/2025.
1. JEFFERSON PARK
2. COLONIAL HILLS
3. CONLEY HILLS
4. FROG HOLLOW & SEMMES PARK
5. HISTORIC COLLEGE PARK