


During 2024 we saw some stabilization in mortgage rates and in the real estate market. During the 2022-2023 cycle, the Federal Reserve raised interest rates 11 times in 17 months. Mortgage rates climbed from 3.25% in January 2022 to over 7% in late 2023, drastically increasing the monthly cost of financing a home purchase. During 2024 the Federal Reserve made 3 rate cuts (totaling 1%) in the last 4 months of the year. Mortgage rates are expected to remain stable in 2025.
Most notably, the increase in mortgage rates has caused a substantial decline in the number of closed transactions over the past few years. Total single-family home closings in metro-Atlanta in 2024 were 59,641 as compared to 94,096 in 2021 (an overall decline of 37%). The number of closings in 2024 represents a 1% increase over the number of closings in 2023, which would suggest the number of sales has stabilized.
The average sales price in metro-Atlanta in 2024 Year to date (“YTD”) was $513,914 vs. $489,365 for 2023. This represents an increase in Average Sales Price of 5%. This indicates it is still a good time to sell. We are still seeing multiple offers when houses are in good locations and priced appropriately, just not with the frequency and intensity of previous years.
Active inventory of single-family homes in metro Atlanta increased a substantial 37% from 15,426 active listings as of the end of December 2024 as compared to 11,283 at the end of December 2023. The current inventory is still lower than historical inventory levels (e.g. December 2014 the listings were 19,310). If inventory remains low, prices are likely to continue to hold. Inventory has remained low in part because the majority of move-up buyers are hesitant to sell their current homes (with low mortgage rates) to buy a replacement home at a substantially higher mortgage rate. If inventory continues to rise, prices could soften, or decline.
Of the 81 neighborhoods we reviewed, the majority of neighborhoods (70) were still deemed to be a “seller’s market”. We used the measuring stick that six months of available inventory represents a balanced market: meaning 0-5 months of inventory represents a seller’s market (a market more favorable to sellers in negotiations), and over 7 months of inventory represents a buyer’s market. Of the neighborhoods reviewed 8 were “balanced markets” and 3 were “buyer’s markets”.
The Average Sales Price to Original List Price ratio (“SP/OLP”), a measure of how close to the original asking price a seller is getting, remained high in most neighborhoods, but was lower than in previous years. This means that Sellers are having to negotiate a little more than they were in recent years. The degree of negotiation varied by neighborhood. In 6 of the 81 neighborhoods we reviewed there were virtually no negotiations, with SP/OLP ratios of 100% or slightly over - in several of the Intown, Buckhead, and Decatur neighborhoods. In 22 of the neighborhoods, there were more substantial negotiations (mostly in the West side and East Point areas)- with SP/OLP ratios of between 90-95% of the original asking price in 19 of the neighborhoods and below 90% in 3 neighborhoods.
Generally, the Average Days on the Market, the length of time from listing the property until binding contract, increased in most neighborhoods we reviewed, from 2023 to 2024.
While it is hard to predict future real estate trends, we want our clients to understand what is happening in the market, so they will understand pricing and how quickly a home will likely sell in the neighborhoods where they live or hope to live. We hope this report will help with that. If you would like a more in-depth analysis of a specific area or want to determine the value of your home, our neighborhood real estate experts are here to help.
We know the Atlanta market. Your neighborhood is our business.
Randal Lautzenheiser, Managing Broker and Owner
Len Kwilos, Agent and Owner
David Vannort, Agent and Owner


1244
MEDIAN NEIGHBORHOOD SALE
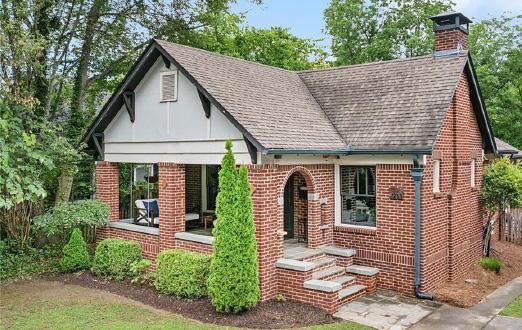
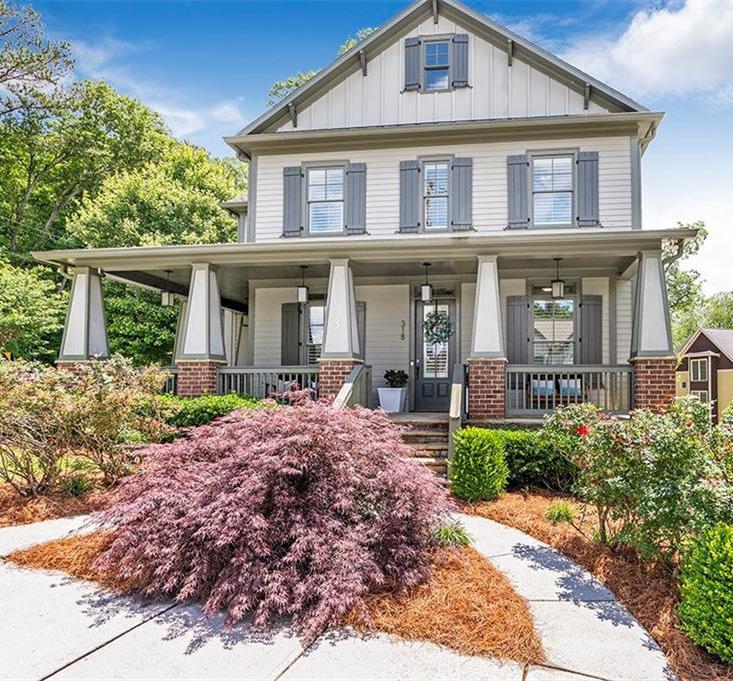
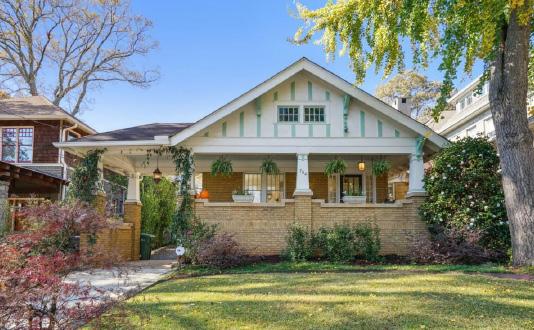
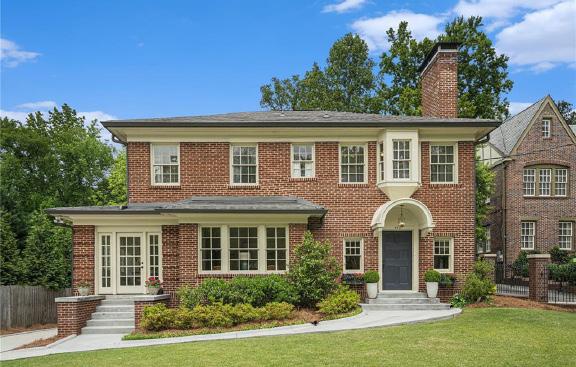
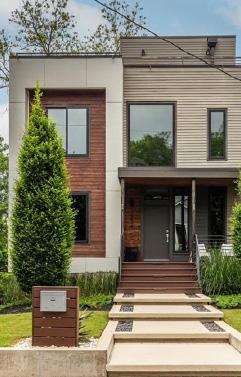
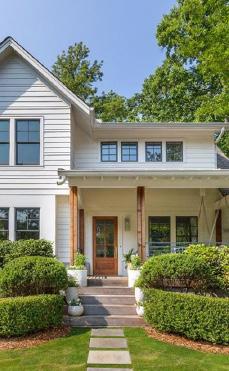
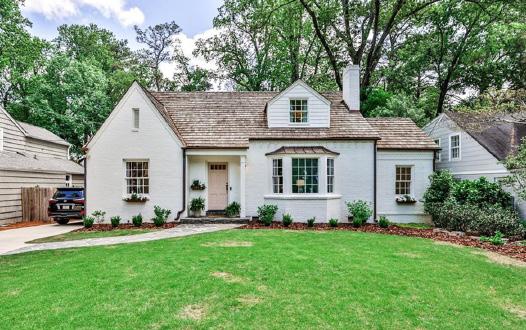
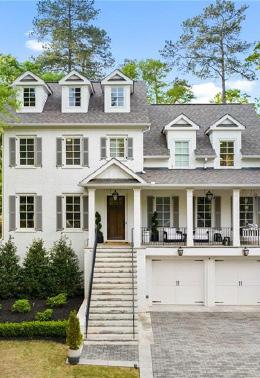
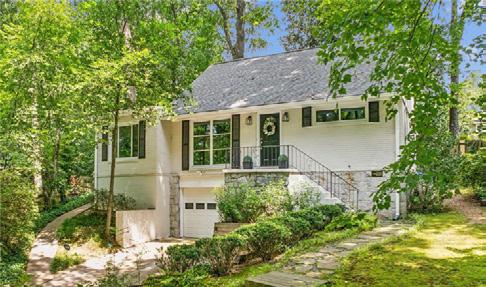
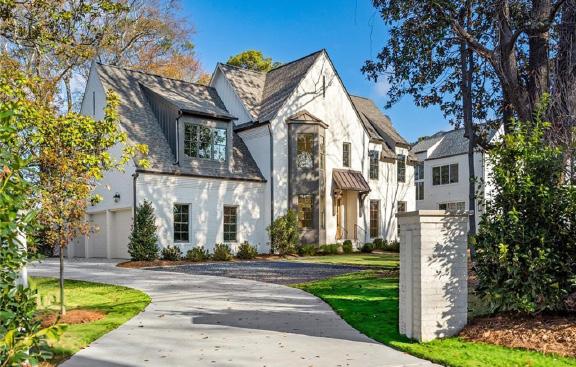
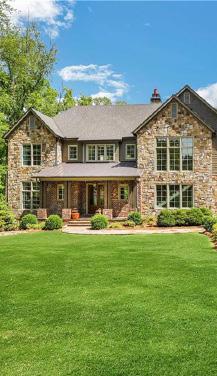
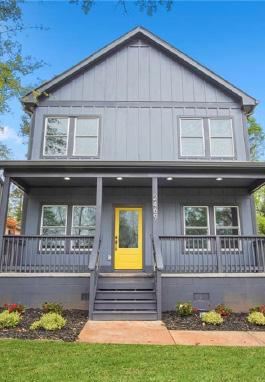
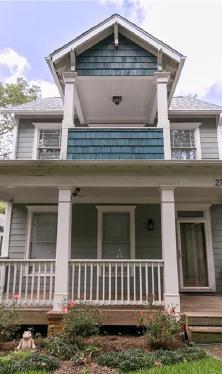
637 Cresthill Avenue NE, Atlanta, Georgia 30306


Sold for $1,185,000 on Original List Price of $1,035,000 in 4 days on market. It is a 3 bed/2.5 bath, with 1,988 sq ft at $596.08/sq ft. Built in 1925. Sold 5/7/2024. MEDIAN NEIGHBORHOOD SALE


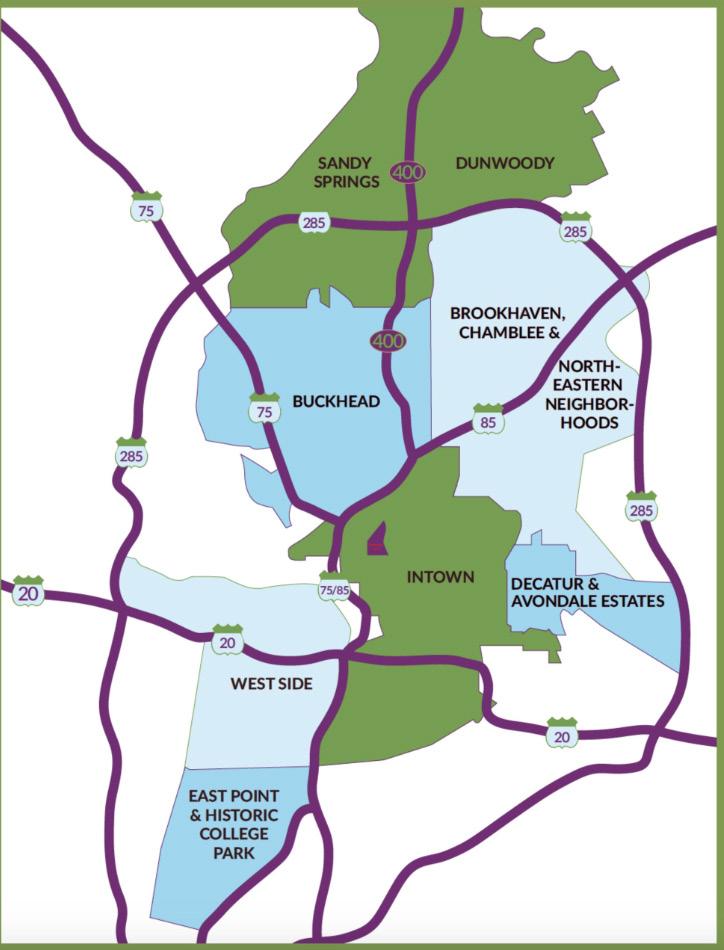
1. BROOKWOOD HILLS
2. LORING HEIGHTS
3. UNDERWOOD HILLS
4. BERKELEY PARK
5. COLLIER HILLS
6. SPRINGLAKE
7. GARDEN HILLS
8. PEACHTREE HILLS
9. PEACHTREE PARK
10. TUXEDO PARK
11. CASTLEWOOD
12. RIDGEWOOD HEIGHTS


1. GARDEN HILLS ELEMENTARY
2. MORRIS BRANDON ELEMENTARY
3. SARA SMITH ELEMENTARY
4. E RIVERS ELEMENTARY
5. JACKSON ELEMENTARY

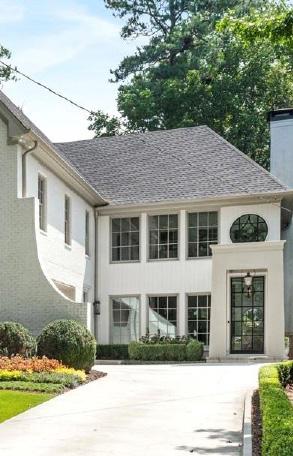

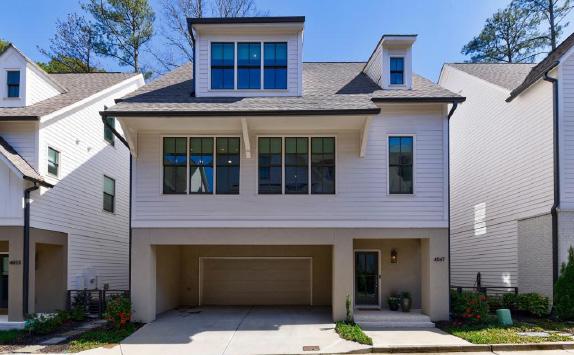


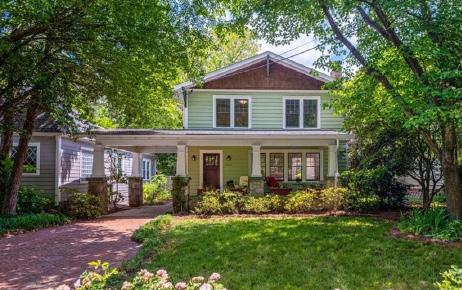
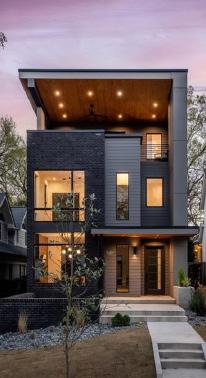
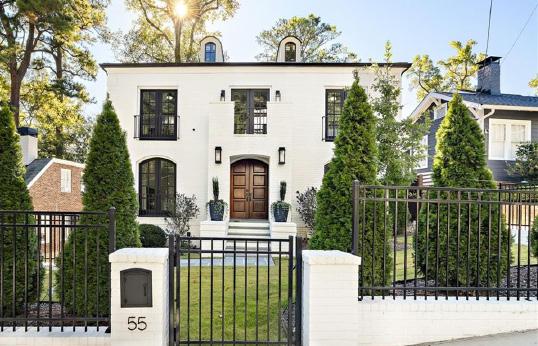
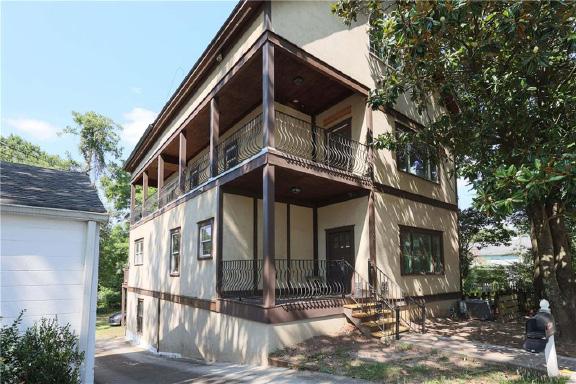
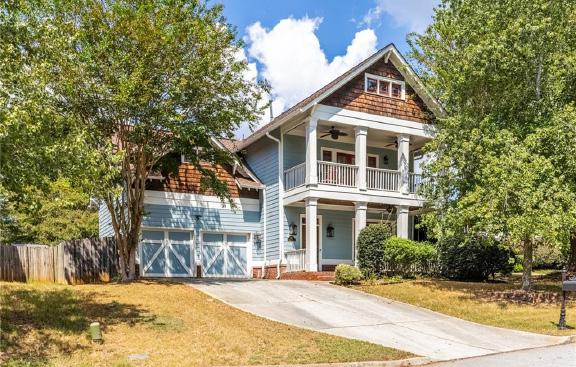
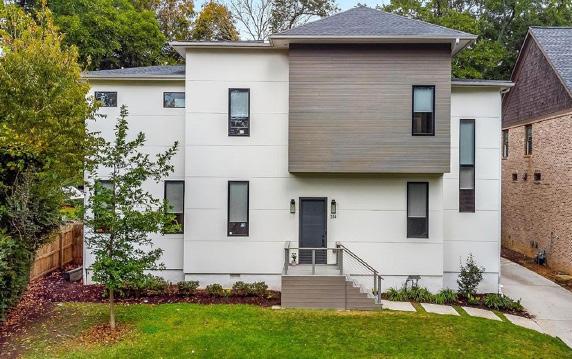
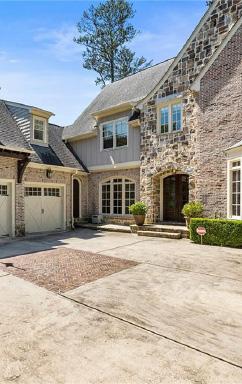
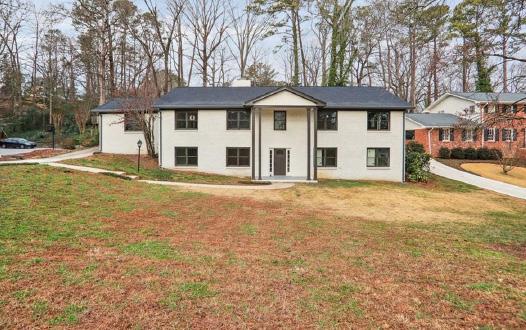
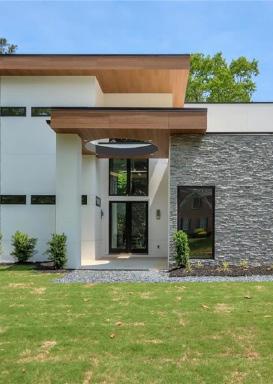
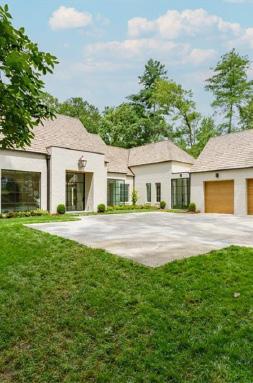
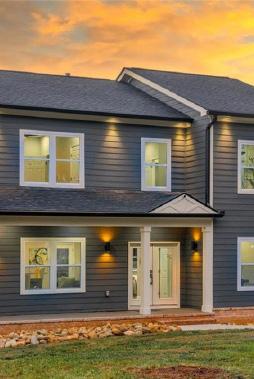
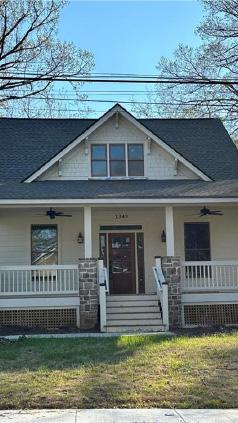
695 Moores Mill Road NW, Atlanta, Georgia 30327 Sold for $2,150,000 on Original List Price of $2,500,000 in 478 days on market. It is a 5 bed/5 full, with 6,679 sq ft at $321.90/sq ft. Built in 2023. Sold 8/14/2024.
1. BROOKHAVEN
2. CHAMBLEE
3. ASHFORD PARK
4. LAVISTA PARK
5. PINE HILLS
6. EMBRY HILLS
7. NORTHCREST


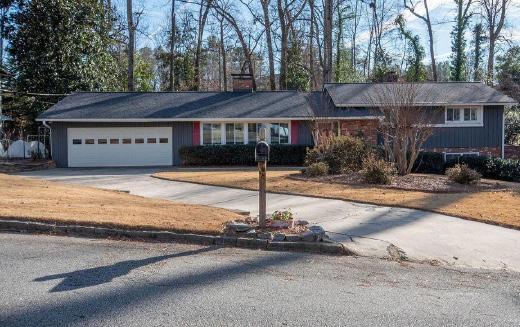
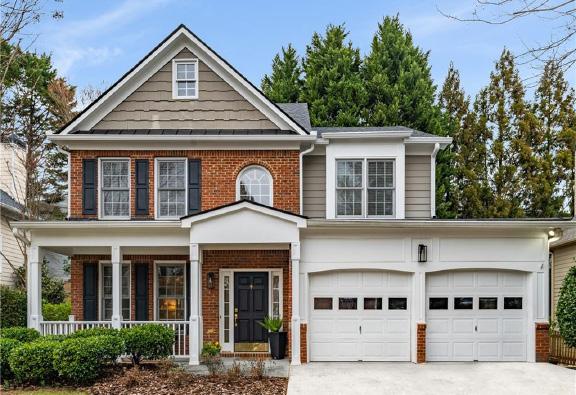
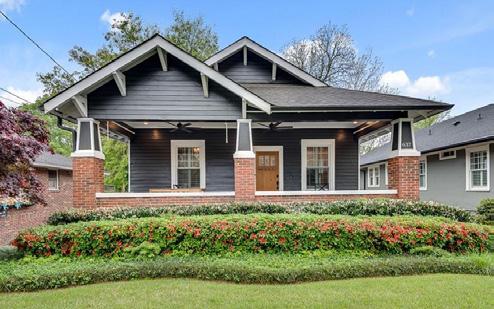
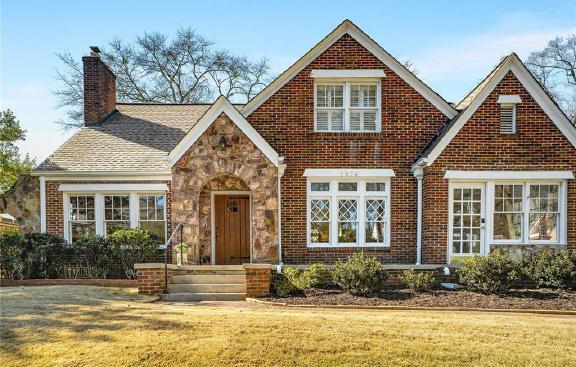
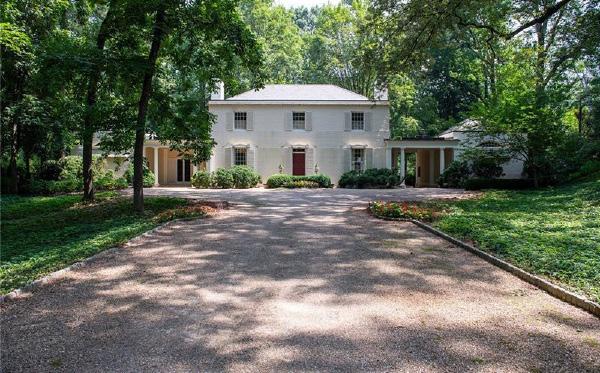
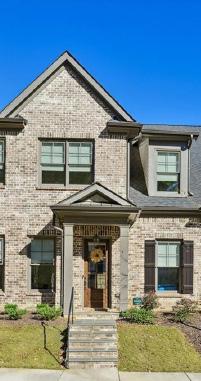
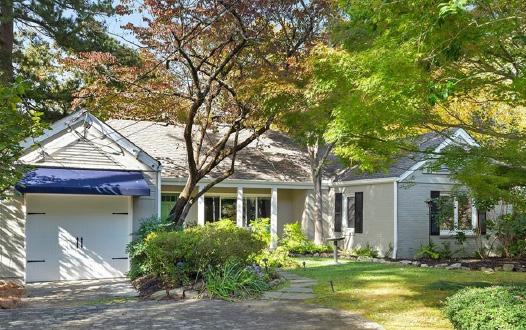
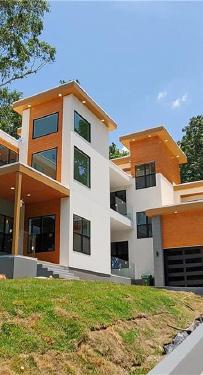
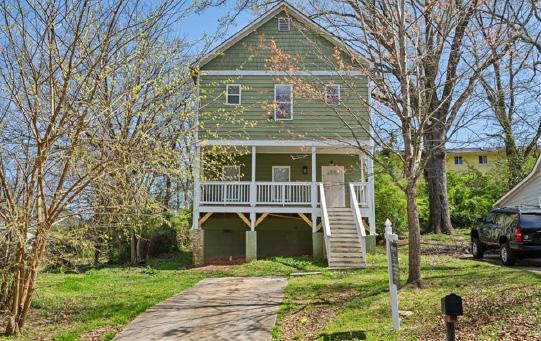
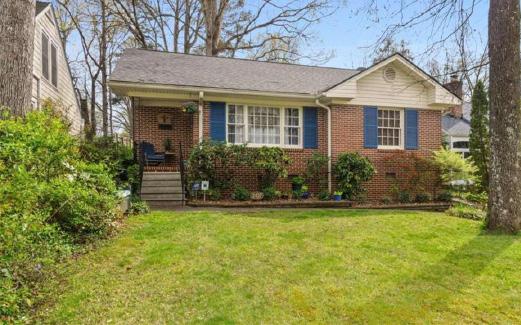
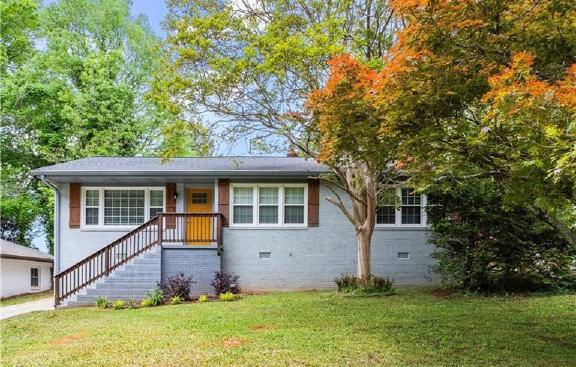
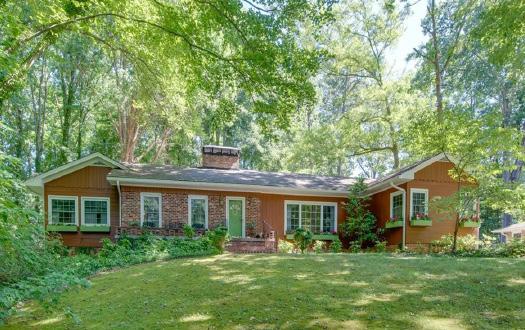
3559 Beachhill Drive, Atlanta, Georgia 30340
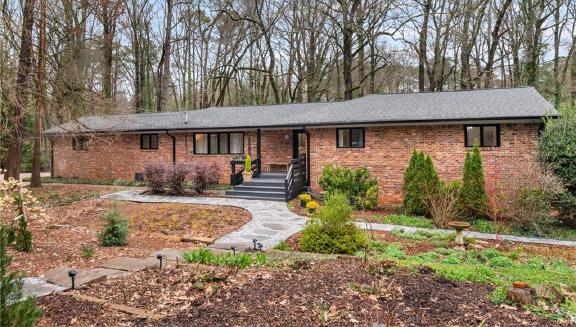
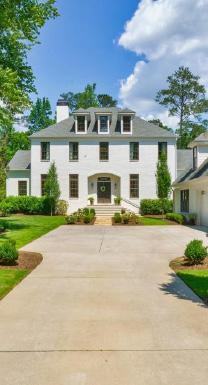
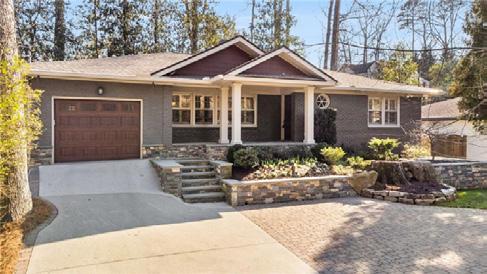
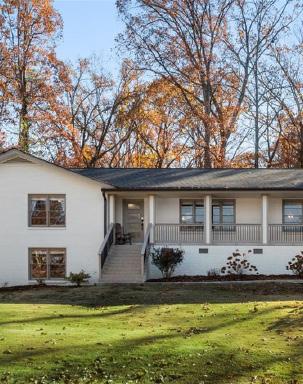
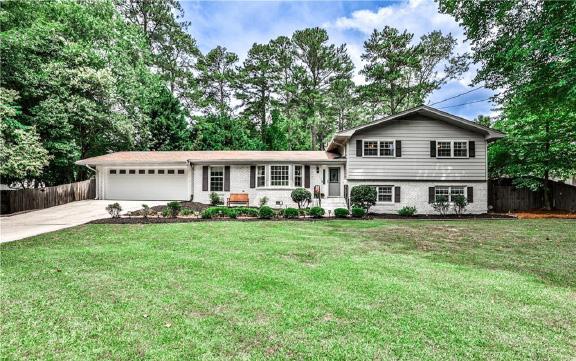
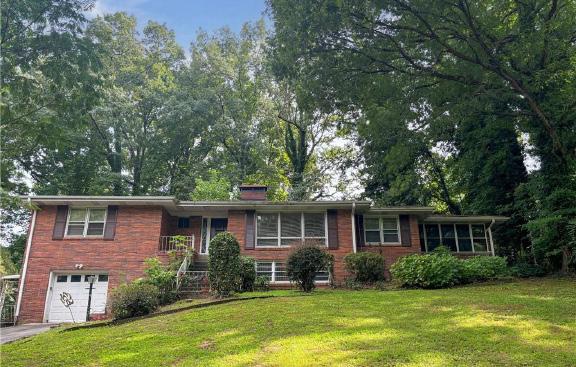
Sold for $625,000 on Original List Price of $600,000 in 3 days on market. It is a 5 bed/4 bath, with 2,806 sq ft at $222.74/sq ft. Built in 1965. Sold 5/31/2024.

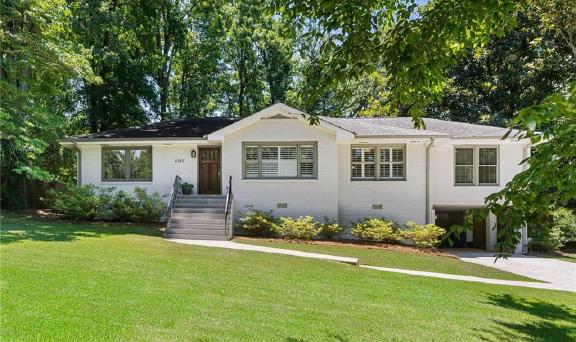

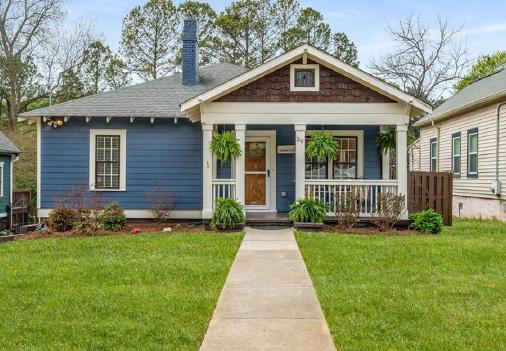
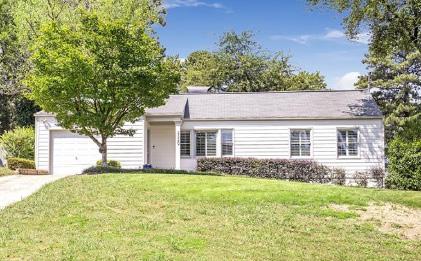
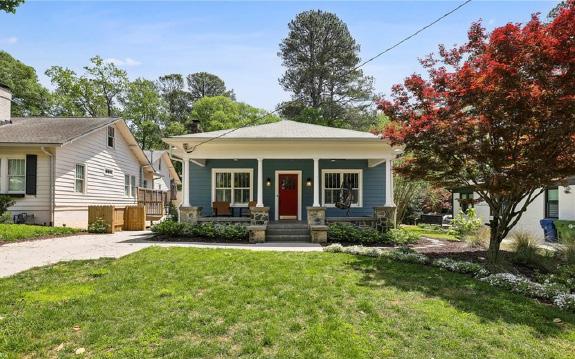
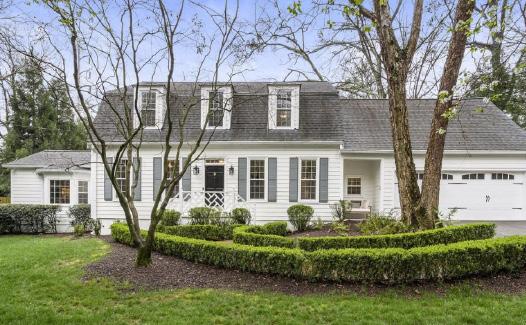
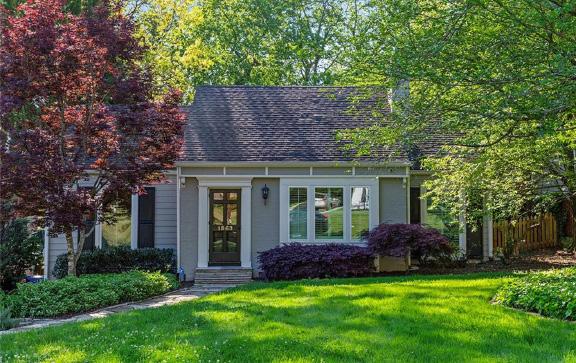
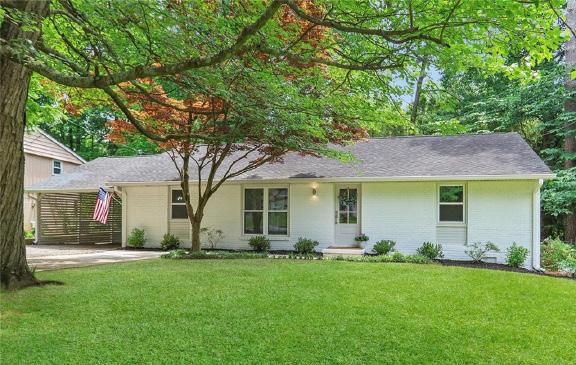
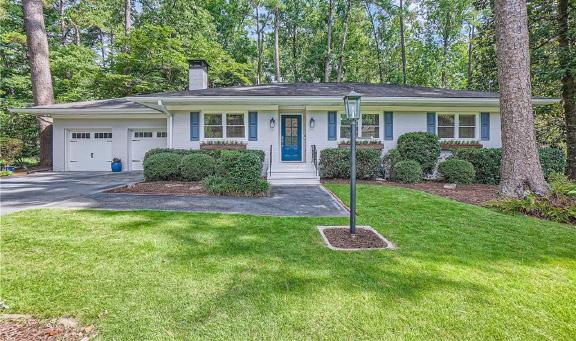
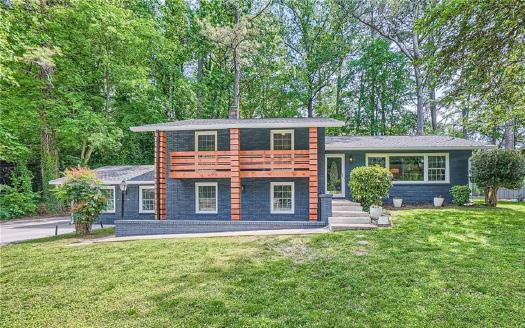
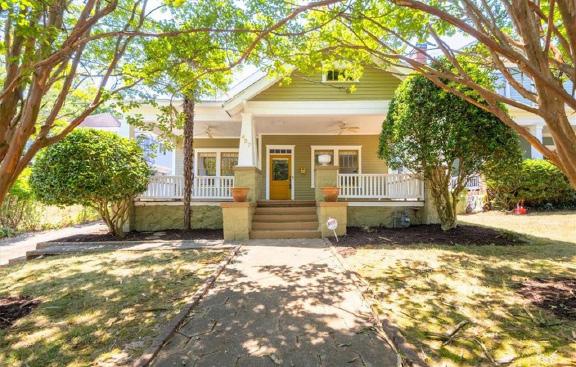
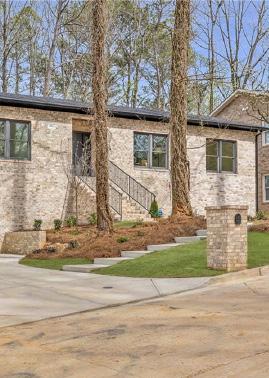
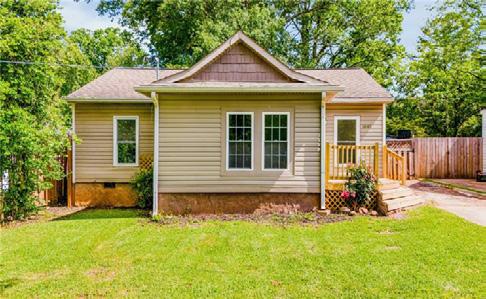
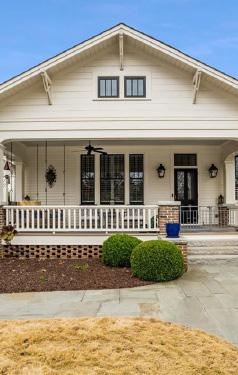
Sold for $579,000 on Original List Price of $599,000 in 1 days on market. It is a 3 bed/2 bath, with 1,880 sq ft at $307.98/sq ft. Built in 1976. Sold 7/12/2024.
1. SANDY SPRINGS 30328
2. SANDY SPRINGS 30342
3. SANDY SPRINGS 30327
4. DUNWOODY 30338

1. WEST END
CAPITOL VIEW 3. ADAIR PARK
PITTSBURGH & MECHANICSVILLE
5. WEST VIEW
6. SYLVAN HILLS
7. OAKLAND CITY
8. VENETIAN HILLS
9. ASHVIEW HEIGHTS
10. COLLIER HEIGHTS
11. DIXIE HILLS
12. CENTER HILL
13. GROVE PARK
14. MOZLEY PARK
15. VINE CITY
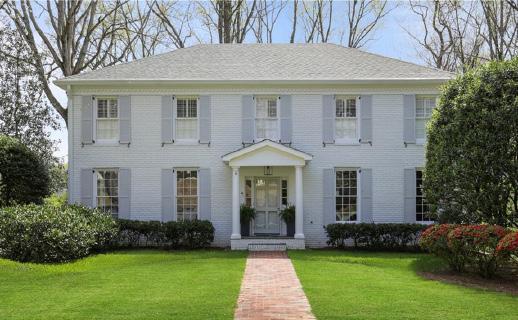
MEDIAN NEIGHBORHOOD SALE
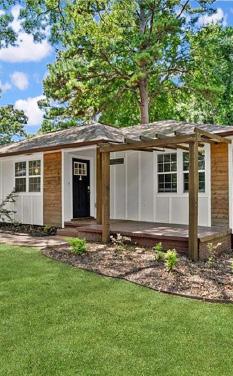
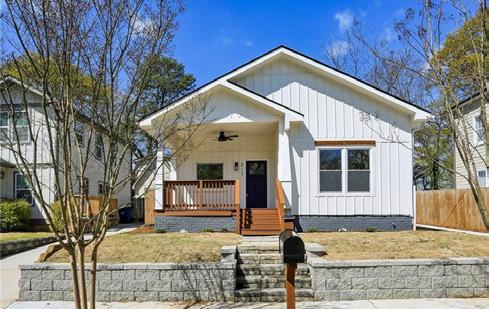

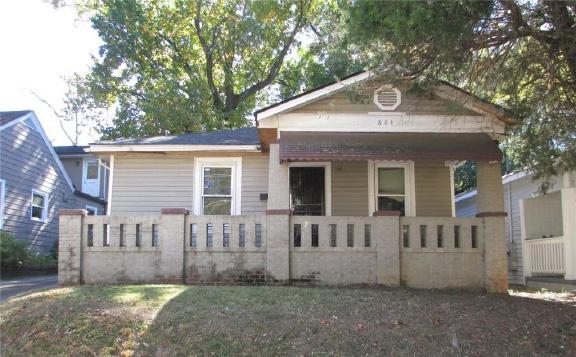
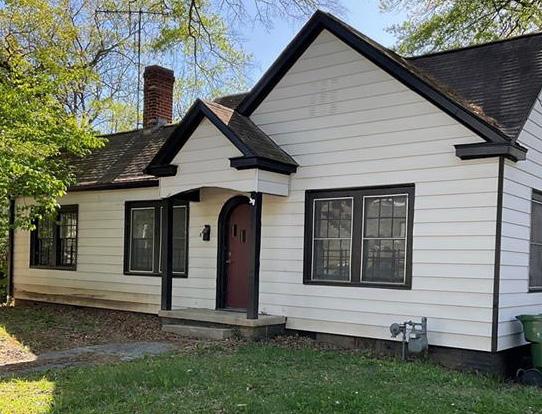
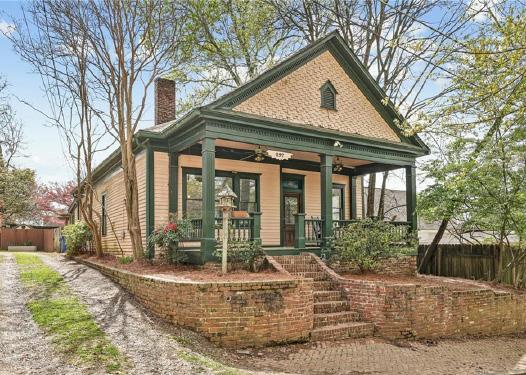
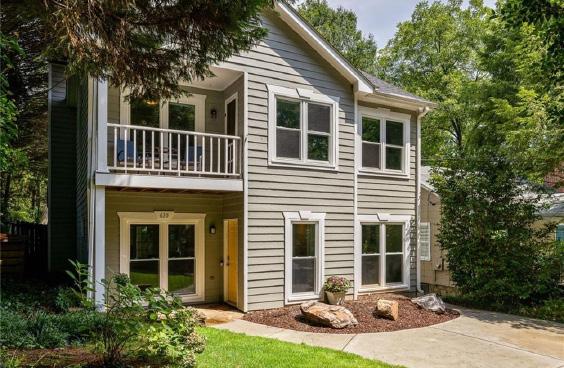
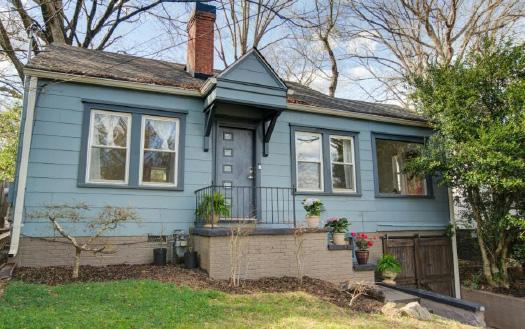
884 Thurmond Street NW, Atlanta, Georgia 30314
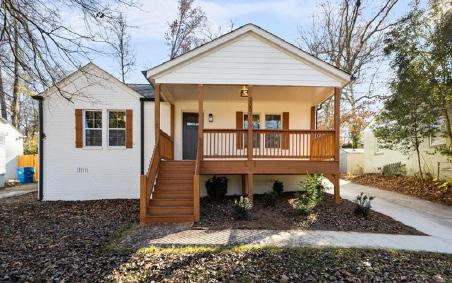
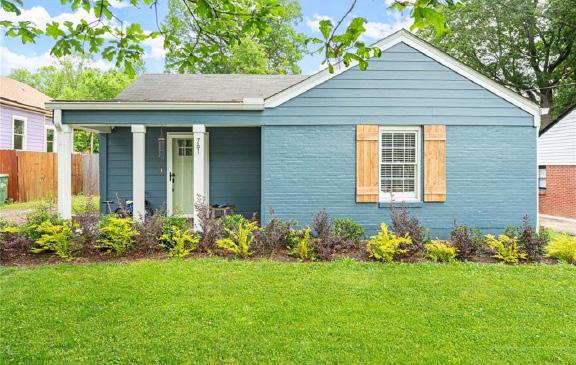
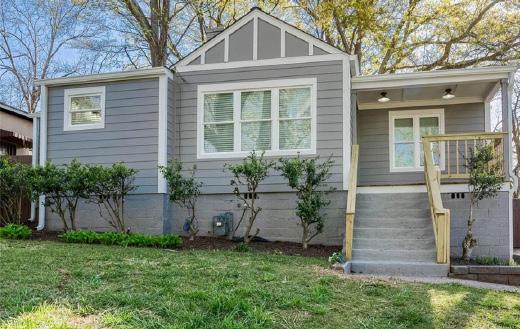
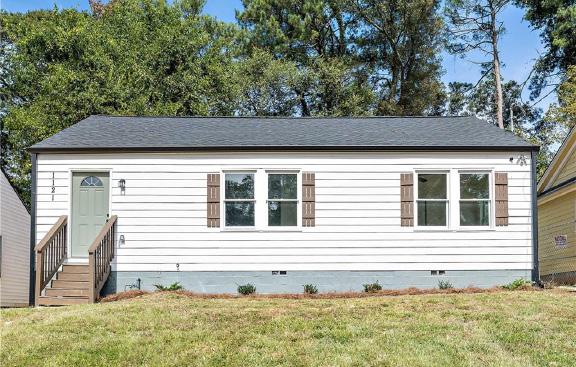
Sold for $170,000 on Original List Price of $199,900 in 128 days on market. It is a 3 bed/2 bath, with 1,219 sq ft at $139.46/sq ft. Built in 1920. Sold 1/31/2024.
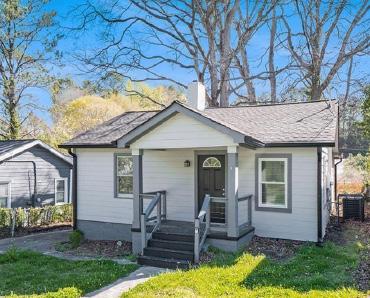
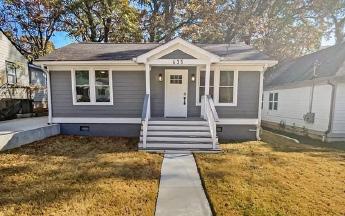
1. JEFFERSON PARK
2. COLONIAL HILLS
3. CONLEY HILLS
4. FROG HOLLOW & SEMMES PARK
5. HISTORIC COLLEGE PARK
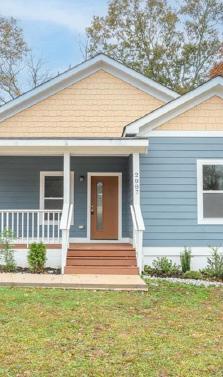
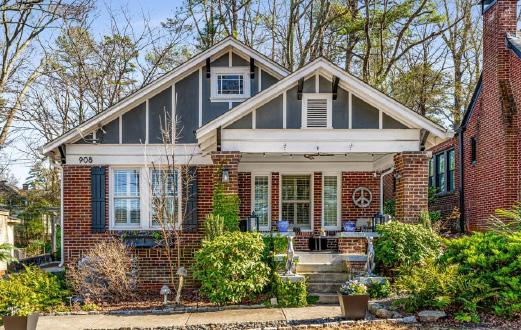
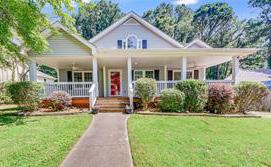
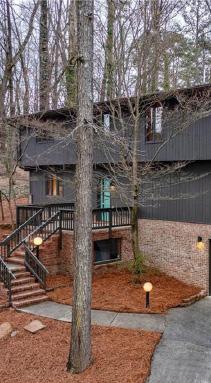
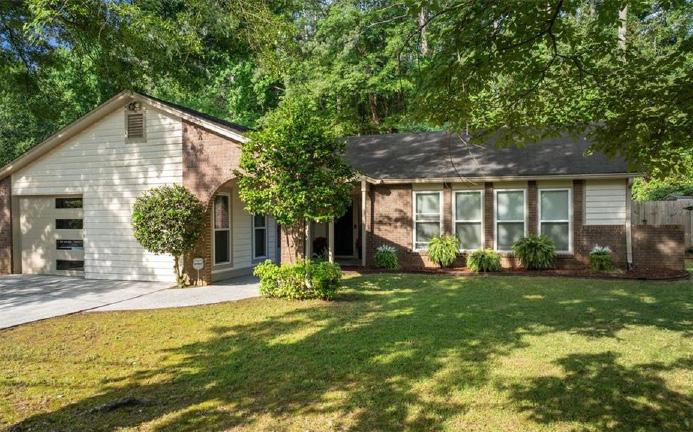
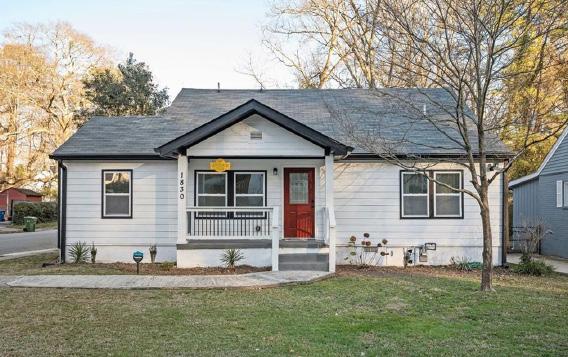
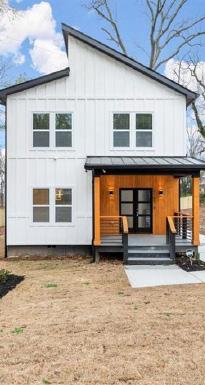
for $460,000 on Original List Price of $460,000 in 15 days on market. It is a 4 bed/2 bath, with 3,086 sq ft at $149.06/sq ft. Built in 1952. Sold 7/29/2024.