INTOWN
MIDTOWN
ANSLEY PARK/ANNEX/SHERWOOD FOREST
HOME PARK & ATLANTIC STATION
VIRGINIA HIGHLAND
MORNINGSIDE & LENOX PARK
PONCEY HIGHLAND
OLD FOURTH WARD
INMAN PARK
CABBAGETOWN
REYNOLDSTOWN
GRANT PARK
ORMEWOOD PARK
SUMMERHILL
CHOSEWOOD
PEOPLESTOWN
CANDLER PARK
LAKE CLAIRE
DRUID HILLS
EDGEWOOD
KIRKWOOD
EAST LAKE
EAST ATLANTA

WOODLAND HILLS
LINDRIDGE/MARTIN MANOR
5


Number of Closings 35 34 High Sale $1,800,000 $2,500,000 Low Sale $535,000 $600,000 Average Sale Price $1,043,980 $1,244,703 Average Original List Price $1,072,220 $1,284,374 Average Days of Market 45 25 Average Sale/Original List Price Ratio 97.60% 98.89% Average Sold Price per Square Foot $352.96 $405.79 Number of Actives December 31 2 7 Months of Inventory 0.69 2.47 MEDIAN NEIGHBORHOOD SALE 831 Durant Place NE, Atlanta, Georgia 30308 Sold for $1,150,000 on Original List Price of $999,000 in 4 days on market. It is a 4 bed/3 bath, with 2,500 sq ft at $460.00/sq ft. Built in 1928. Sold 4/5/2022.
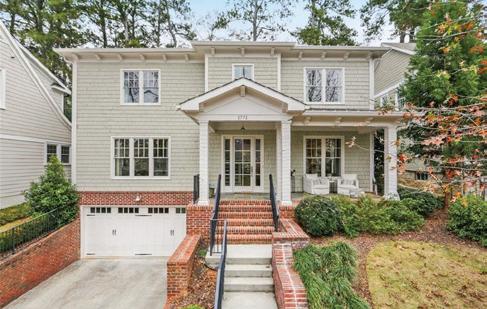
ANSLEY PARK/ANNEX/SHERWOOD FOREST 2021 2022 Number of Closings 41 36 High Sale $3,700,000 $4,000,000 Low Sale $750,000 $495,000 Average Sale Price $1,826,171 $1,821,465 Average Original List Price $1,928,732 $1,870,344 Average Days of Market 74 38 Average Sale/Original List Price Ratio 95.63% 98.05% Average Sold Price per Square Foot $449.89 $453.33 Number of Actives December 31 7 15 Months of Inventory 2.05 5.00 MEDIAN NEIGHBORHOOD SALE 1771 Flagler Avenue NE, Atlanta, Georgia 30309 Sold for $1,651,050 on Original List Price of $1,595,000 in 3 days on market. It is a 4 bed/5.5 bath, with 4,781 sq ft at $345.34/sq ft. Built in 2014. Sold 2/11/2022.
6
MIDTOWN 2021 2022
SELLER’S MARKET
SELLER’S MARKET
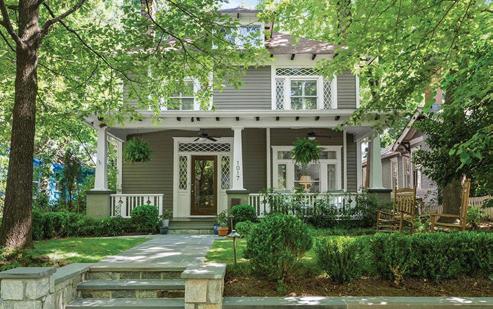

MEDIAN NEIGHBORHOOD SALE 1017 Highland View NE, Atlanta, Georgia 30306 Sold for $1,215,000 on Original List Price of $1,075,000 in 4 days on market. It is a 3 bed/2.5 bath, with 2,869 sq ft at $419.54/sq ft. Built in 1920. Sold 7/14/2022.
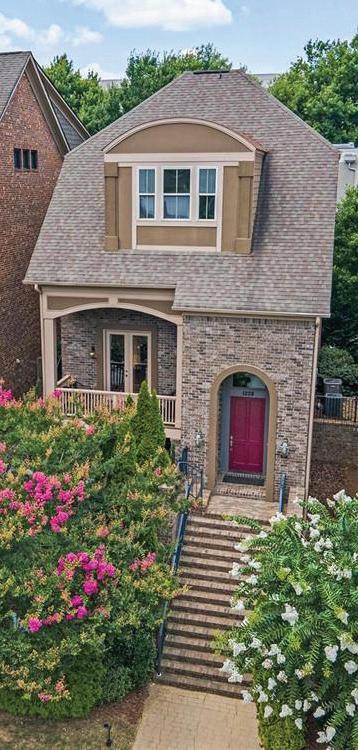
Number of Closings 28 24 High Sale $1,000,000 $1,020,000 Low Sale $257,000 $325,000 Average Sale Price $502,804 $579,200 Average Original List Price $515,021 $582,025 Average Days of Market 18 18 Average Sale/Original List Price Ratio 98.36% 99.39% Average Sold Price per Square Foot $328.09 $322.64 Number of Actives December 31 5 0 Months of Inventory 2.14 0.00 MEDIAN NEIGHBORHOOD SALE 1232 Holly Street NW, Atlanta, Georgia 30318 Sold for $516,499 on Original List Price of $489,900 in 3 days on market. It is a 3 bed/2 bath, with 1,280 sq ft at $403.51/sq ft. Built in 1940. Sold 7/14/2022.
VIRGINIA HIGHLAND 2021 2022 Number of Closings 100 73 High Sale $2,500,000 $3,050,000 Low Sale $502,500 $616,500 Average Sale Price $1,089,205 $1,266,070 Average Original List Price $1,097,358 $1,251,422 Average Days of Market 30 21 Average Sale/Original List Price Ratio 99.44% 101.30% Average Sold Price per Square Foot $397.08 $444.36 Number of Actives December 31 6 10 Months of Inventory 0.72 1.64 SELLER’S MARKET 7
HOME PARK & ATLANTIC STATION 2021 2022
SELLER’S MARKET
MORNINGSIDE & LENOX PARK 2021 2022
Number of Closings 214 148 High Sale $3,300,000 $3,600,000 Low Sale $410,000 $575,000 Average Sale Price $1,161,349 $1,311,764 Average Original List Price $1,190,813 $1,321,906 Average Days of Market 40 30 Average Sale/Original List Price Ratio 97.50% 99.72% Average Sold Price per Square Foot $355.59 $419.01 Number of Actives December 31 9 19 Months of Inventory 0.50 1.54 MEDIAN NEIGHBORHOOD SALE 746 Yorkshire Road NE, Atlanta, Georgia 30306 Sold for $1,195,000 on Original List Price of $1,249,000 in 72 days on market. It is a 5 bed/3 bath, with 2,870 sq ft at $416.38/sq ft. Built in 1925. Sold 6/22/2022. SELLER’S MARKET PONCEY HIGHLAND 2021 2022 Number of Closings 14 16 High Sale $1,350,000 $1,561,000 Low Sale $383,000 $628,000 Average Sale Price $779,607 $1,038,156 Average Original List Price $805,171 $1,028,181 Average Days of Market 46 23 Average Sale/Original List Price Ratio 97.67% 100.95% Average Sold Price per Square Foot $382.99 $402.56 Number of Actives December 31 2 0 Months of Inventory 1.71 0.00 MEDIAN NEIGHBORHOOD SALE 597 Saint Charles Avenue, Atlanta, Georgia 30308 Sold for $1,025,000 on Original List Price of $1,050,000 in 9 days on market. It is a 4 bed/2.5 bath, with 2,366 sq ft at $433.22/sq ft. Built in 1925. Sold 10/3/2022. SELLER’S MARKET 8

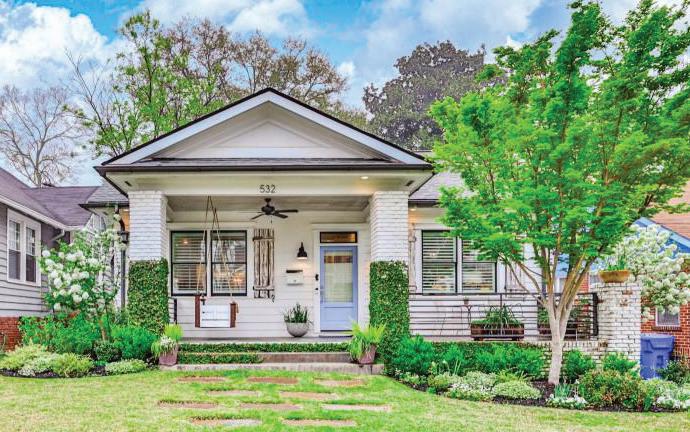

Number of Closings 50 31 High Sale $1,255,000 $1,900,000 Low Sale $389,900 $430,000 Average Sale Price $731,975 $935,397 Average Original List Price $750,846 $965,603 Average Days of Market 35 34 Average Sale/Original List Price Ratio 97.83% 96.79% Average Sold Price per Square Foot $369.73 $408.67 Number of Actives December 31 3 10 Months of Inventory 0.72 3.87 MEDIAN NEIGHBORHOOD SALE 532 Wabash Avenue NE, Atlanta, Georgia 30312 Sold for $850,000 on Original List Price of $835,000 in 4 days on market. It is a 3 bed/2.5 bath, with 2,013 sq ft at $422.26/ sq ft. Built in 1920. Sold 4/28/2022.
OLD FOURTH WARD 2021 2022
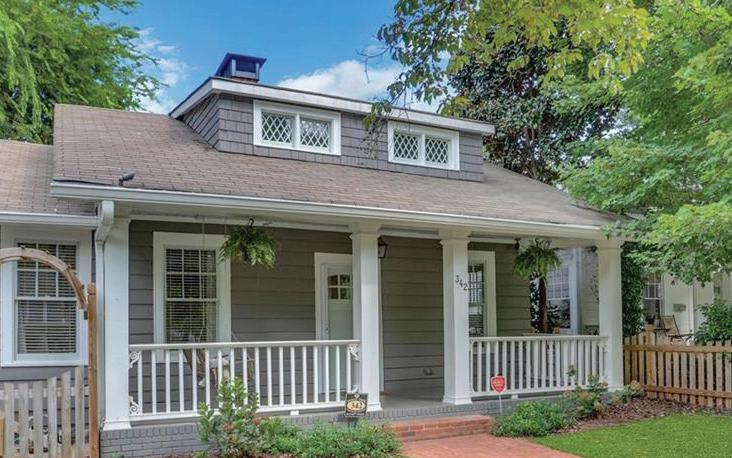
INMAN PARK 2021 2022 Number of Closings 38 19 High Sale $2,200,000 $2,240,000 Low Sale $520,000 $580,000 Average Sale Price $1,076,344 $1,144,737 Average Original List Price $1,101,208 $1,126,626 Average Days of Market 31 10 Average Sale/Original List Price Ratio 98.08% 101.95% Average Sold Price per Square Foot $401.01 $460.83 Number of Actives December 31 0 2 Months of Inventory 0.00 1.26 MEDIAN NEIGHBORHOOD SALE 342 Sinclair Avenue NE, Atlanta, Georgia 30307 Sold for $1,130,000 on Original List Price of $1,099,000 in 45 days on market. It is a 4 bed/3.5 bath, with 2,314 sq ft at $488.33/sq ft. Built in 1920. Sold 9/15/2022. SELLER’S MARKET 9
SELLER’S MARKET
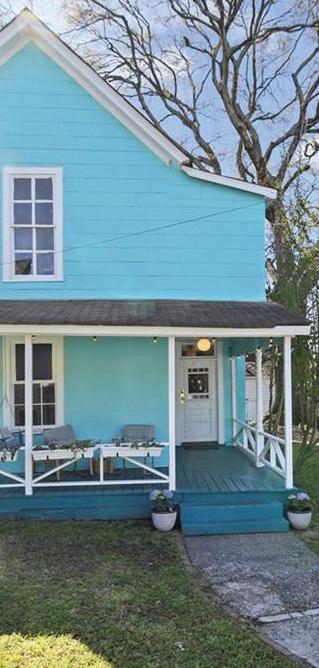
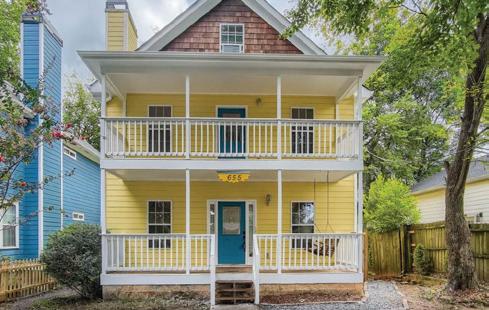
Number of Closings 20 17 High Sale $1,020,000 $800,000 Low Sale $255,000 $395,000 Average Sale Price $595,245 $595,471 Average Original List Price $602,735 $623,512 Average Days of Market 31 44 Average Sale/Original List Price Ratio 98.14% 96.57% Average Sold Price per Square Foot $385.42 $429.05 Number of Actives December 31 1 0 Months of Inventory 0.60 0.00 MEDIAN NEIGHBORHOOD SALE 655 Mcdonald Street SE, Atlanta, Georgia 30312 Sold for $615,000 on Original List Price of $615,000 in 8 days on market. It is a 3 bed/2.5 bath, with 2,520 sq ft at $244.05/ sq ft. Built in 2003. Sold 9/2/2022. REYNOLDSTOWN 2021 2022 Number of Closings 32 24 High Sale $1,175,000 $1,195,000 Low Sale $309,000 $315,000 Average Sale Price $611,181 $632,483 Average Original List Price $608,438 $627,758 Average Days of Market 14 18 Average Sale/Original List Price Ratio 100.15% 100.17% Average Sold Price per Square Foot $373.76 $380.42 Number of Actives December 31 1 4 Months of Inventory 0.38 2.00 MEDIAN NEIGHBORHOOD SALE 245 Wilbur Avenue SE, Atlanta, Georgia 30316 Sold for $599,900 on Original List Price of $599,900 in 5 days on market. It is a 3 bed/2.5 bath, with 1,792 sq ft at $334.77/ sq ft. Built in 2022. Sold 7/18/2022. SELLER’S MARKET SELLER’S MARKET 10
CABBAGETOWN 2021 2022

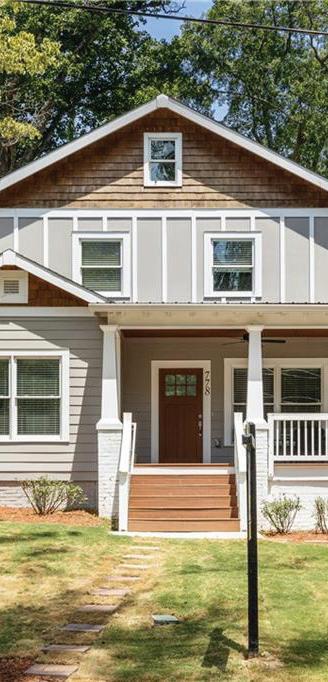
GRANT PARK 2021 2022 Number of Closings 185 130 High Sale $1,635,000 $1,230,000 Low Sale $205,000 $245,000 Average Sale Price $582,271 $650,926 Average Original List Price $577,814 $637,305 Average Days of Market 20 22 Average Sale/Original List Price Ratio 100.71% 101.66% Average Sold Price per Square Foot $324.52 $347.53 Number of Actives December 31 11 9 Months of Inventory 0.71 0.83 MEDIAN NEIGHBORHOOD SALE 778 United Avenue SE, Atlanta, Georgia 30312 Sold for $617,000 on Original List Price of $650,000 in 12 days on market. It is a 4 bed/2 bath, with 1,804 sq ft at $342.02/sq ft. Built in 1924. Sold 12/15/2022.
ORMEWOOD PARK 2021 2022 Number of Closings 118 67 High Sale $1,000,000 $1,400,000 Low Sale $130,000 $295,000 Average Sale Price $535,733 $601,002 Average Original List Price $525,878 $583,291 Average Days of Market 22 15 Average Sale/Original List Price Ratio 101.82% 102.40% Average Sold Price per Square Foot $322.23 $371.22 Number of Actives December 31 3 6 Months of Inventory 0.31 1.07 MEDIAN NEIGHBORHOOD SALE 1045 Emerson Avenue SE, Atlanta, Georgia 30316 Sold for $570,000 on Original List Price of $565,000 in 3 days on market. It is a 3 bed/2 bath, with 1,285 sq ft at $443.58/sq ft. Built in 1945. Sold 4/7/2022. SELLER’S MARKET 11
SELLER’S MARKET

SUMMERHILL 2021
Number of Closings 36 26 High Sale $785,000 $730,000 Low Sale $200,000 $190,000 Average Sale Price $476,649 $519,073 Average Original List Price $485,439 $524,265 Average Days of Market 32 21 Average Sale/Original List Price Ratio 98.20% 98.38% Average Sold Price per Square Foot $263.26 $309.08 Number of Actives December 31 2 4 Months of Inventory 0.67 1.85 MEDIAN NEIGHBORHOOD SALE 179 Little Street SE, Atlanta, Georgia 30315 Sold for $530,000 on Original List Price of $530,000 in 12 days on market. It is a 3 bed/2.5 bath, with 1,472 sq ft at $360.05/sq ft. Built in 2006. Sold 5/4/2022. SELLER’S MARKET CHOSEWOOD 2021 2022 Number of Closings 18 11 High Sale $665,000 $650,000 Low Sale $217,000 $188,000 Average Sale Price $423,314 $445,118 Average Original List Price $421,244 $447,629 Average Days of Market 25 15 Average Sale/Original List Price Ratio 101.95% 97.84% Average Sold Price per Square Foot $260.17 $263.84 Number of Actives December 31 1 1 Months of Inventory 0.67 1.09 MEDIAN NEIGHBORHOOD SALE 559 Federal Terrace SE, Atlanta, Georgia 30315 Sold for $535,000 on Original List Price of $525,000 in 11 days on market. It is a 4 bed/3 bath, with 1,920 sq ft at $278.65/sq ft. Built in 2022. Sold 6/13/2022. SELLER’S MARKET 12
2022
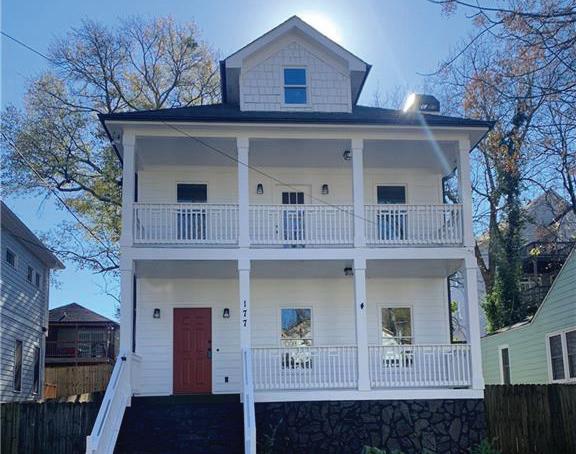
CANDLER PARK 2021 2022 Number of Closings 41 43 High Sale $1,345,000 $1,825,000 Low Sale $395,000 $443,500 Average Sale Price $715,559 $906,448 Average Original List Price $730,949 $880,779 Average Days of Market 23 18 Average Sale/Original List Price Ratio 99.08% 102.35% Average Sold Price per Square Foot $341.57 $398.05 Number of Actives December 31 3 4 Months of Inventory 0.88 1.12 MEDIAN NEIGHBORHOOD SALE 333 Candler Street NE, Atlanta, Georgia 30307 Sold for $859,500 on Original List Price of $949,900 in 23 days on market. It is a 4 bed/3 bath, with 2,558 sq ft at $336.00/sq ft. Built in 1924. Sold 8/9/2022. SELLER’S MARKET PEOPLESTOWN 2021 2022 Number of Closings 31 22 High Sale $610,000 $679,000 Low Sale $175,000 $193,500 Average Sale Price $391,010 $467,496 Average Original List Price $401,348 $458,609 Average Days of Market 30 31 Average Sale/Original List Price Ratio 97.64% 101.42% Average Sold Price per Square Foot $230.90 $296.77 Number of Actives December 31 5 4 Months of Inventory 1.94 2.18 MEDIAN NEIGHBORHOOD SALE 177 Vanira Avenue SE, Atlanta, Georgia 30315 Sold for $504,000 on Original List Price of $499,999 in 123 days on market. It is a 3 bed/2.5 bath, with 1,728 sq ft at $291.67/sq ft. Built in 2005. Sold 2/1/2022. SELLER’S MARKET 13
LAKE CLAIRE 2021 2022
DRUID HILLS
Number of Closings 85 81 High Sale $4,000,000 $4,475,000 Low Sale $460,000 $430,000 Average Sale Price $1,037,408 $1,107,099 Average Original List Price $1,063,171 $1,140,996 Average Days of Market 38 43 Average Sale/Original List Price Ratio 98.54% 97.97% Average Sold Price per Square Foot $317.69 $337.38 Number of Actives December 31 7 12 Months of Inventory 0.99 1.78 MEDIAN NEIGHBORHOOD SALE 1745 Dyson Drive NE, Atlanta, Georgia 30307 Sold for $880,000 on Original List Price of $775,000 in 2 days on market. It is a 4 bed/3 bath, with 2,609 sq ft at $337.29/sq ft. Built in 1954. Sold 2/23/2022. SELLER’S
2021 2022
MARKET
Number of Closings 33 42 High Sale $1,280,000 $1,810,000 Low Sale $330,000 $340,000 Average Sale Price $738,869 $856,995 Average Original List Price $731,024 $862,338 Average Days of Market 15 27 Average Sale/Original List Price Ratio 100.69% 100.41% Average Sold Price per Square Foot $323.92 $379.77 Number of Actives December 31 2 3 Months of Inventory 0.73 0.86 MEDIAN NEIGHBORHOOD SALE 2006 Palifox Drive NE, Atlanta, Georgia 30307 Sold for $770,000 on Original List Price of $735,000 in 2 days on market. It is a 3 bed/3 bath, with 2,284 sq ft at $337.13/sq ft. Built in 1988. Sold 6/1/2022.
14
SELLER’S MARKET
Number of Closings 73 61 High Sale $850,000 $925,000 Low Sale $270,000 $371,000 Average Sale Price $530,358 $581,626 Average Original List Price $527,566 $576,170 Average Days of Market 26 20 Average Sale/Original List Price Ratio 100.62% 101.34% Average Sold Price per Square Foot $312.84 $361.84 Number of Actives December 31 5 9 Months of Inventory 0.82 1.77 MEDIAN NEIGHBORHOOD SALE 23 Montgomery Street NE, Atlanta, Georgia 30307 Sold for $550,000 on Original List Price of $500,000 in 4 days on market. It is a 3 bed/2 bath, with 1,148 sq ft at $479.09/sq ft. Built in 2004. Sold 5/23/2022.
EDGEWOOD 2021 2022
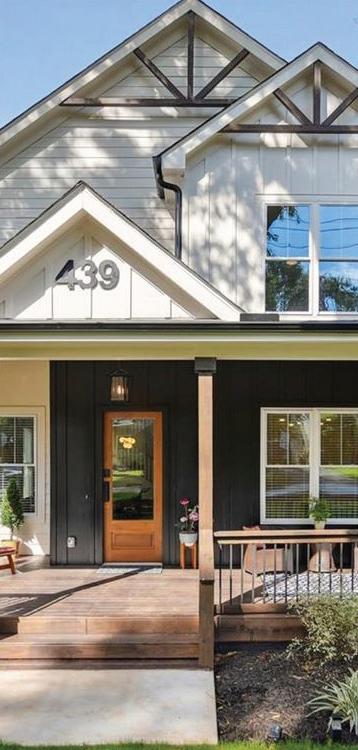
MEDIAN NEIGHBORHOOD SALE 200 Sisson Avenue NE, Atlanta, Georgia 30317 Sold for $670,000 on Original List Price of $650,000 in 3 days on market. It is a 3 bed/2 bath, with 1,494 sq ft at $448.46/sq ft. Built in 1954. Sold 6/10/2022. KIRKWOOD 2021 2022 Number of Closings 161 114 High Sale $1,025,000 $1,350,000 Low Sale $250,000 $193,000 Average Sale Price $586,686 $716,545 Average Original List Price $581,470 $690,079 Average Days of Market 20 17 Average Sale/Original List Price Ratio 101.01% 103.58% Average Sold Price per Square Foot $318.79 $370.56 Number of Actives December 31 8 11 Months of Inventory 0.60 1.16 SELLER’S MARKET 15
SELLER’S MARKET
EAST LAKE 2021 2022
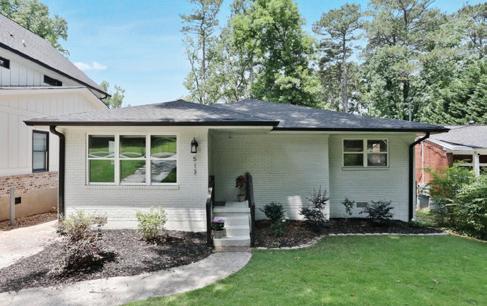
Number of Closings 202 153 High Sale $842,500 $1,300,000 Low Sale $150,000 $163,000 Average Sale Price $418,217 $526,775 Average Original List Price $420,428 $529,847 Average Days of Market 25 27 Average Sale/Original List Price Ratio 99.77% 99.49% Average Sold Price per Square Foot $250.68 $279.37 Number of Actives December 31 21 21 Months of Inventory 1.25 1.65 MEDIAN NEIGHBORHOOD SALE 513 Daniel Avenue, Decatur, Georgia 30032 Sold for $478,500 on Original List Price of $459,000 in 15 days on market. It is a 3 bed/3 bath, with 1,700 sq ft at $281.47/sq ft. Built in 1955. Sold 8/1/2022. SELLER’S MARKET EAST ATLANTA 2021 2022 Number of Closings 265 191 Hig $835,000 $880,000 Low Sale $185,000 $225,000 Average Sale Price $452,530 $510,179 Average Original List Price $451,392 $505,114 Average Days of Market 23 24 Average Sale/Original List Price Ratio 100.29% 100.93% Average Sold Price per Square Foot $272.51 $302.57 Number of Actives December 31 11 8 Months of Inventory 0.50 0.50 MEDIAN NEIGHBORHOOD SALE 1117 OAKFIELD Drive SE, Atlanta, Georgia 30316 Sold for $512,000 on Original List Price of $565,000 in 55 days on market. It is a 3 bed/2.5 bath, with 1,712 sq ft at $299.07/sq ft. Built in 1950. Sold 11/14/2022. SELLER’S MARKET 16
WOODLAND HILLS 2021 2022
Number of Closings 34 27 High Sale $1,482,000 $1,435,000 Low Sale $305,000 $292,000 Average Sale Price $541,035 $618,390 Average Original List Price $541,791 $631,570 Average Days of Market 31 32 Average Sale/Original List Price Ratio 99.85% 97.93% Average Sold Price per Square Foot $320.89 $315.49 Number of Actives December 31 4 3 Months of Inventory 1.41 1.33 MEDIAN NEIGHBORHOOD SALE 1170 Ogilvie Drive NE, Atlanta, Georgia 30324 Sold for $515,000 on Original List Price of $510,000 in 5 days on market. It is a 3 bed/2 bath, with 1,436 sq ft at $358.64/sq ft. Built in 1956. Sold 5/5/2022.
LINDRIDGE/MARTIN MANOR 2021 2022 Number of Closings 32 19 High Sale $900,000 $1,350,000 Low Sale $315,000 $496,000 Average Sale Price $542,159 $626,389 Average Original List Price $550,706 $625,232 Average Days of Market 25 27 Average Sale/Original List Price Ratio 98.29% 100.03% Average Sold Price per Square Foot $304.67 $373.83 Number of Actives December 31 2 2 Months of Inventory 0.75 1.26 MEDIAN NEIGHBORHOOD SALE 1008 Lindridge Drive NE, Atlanta, Georgia 30324 Sold for $565,000 on Original List Price of $595,000 in 12 days on market. It is a 5 bed/3 bath, with 2,550 sq ft at $221.57/sq ft. Built in 1955. Sold 9/8/2022. SELLER’S MARKET 17
SELLER’S MARKET
BUCKHEAD BY NEIGHORHOOD
BROOKWOOD HILLS
LORING HEIGHTS
UNDERWOOD HILLS
BERKELEY PARK
COLLIER HILLS
SPRINGLAKE
GARDEN HILLS
PEACHTREE HILLS
PEACHTREE PARK
TUXEDO PARK
CASTLEWOOD
RIDGEWOOD HEIGHTS
BROOKWOOD HILLS 2021 2022

Number of Closings 16 15 High Sale $2,950,000 $3,400,000 Low Sale $865,000 $650,000 Average Sale Price $1,535,038 $1,672,967 Average Original List Price $1,628,188 $1,805,067 Average Days of Market 44 72 Average Sale/Original List Price Ratio 93.72% 93.78% Average Sold Price per Square Foot $437.42 $463.91 Number of Actives December 31 4 0 Months of Inventory 3.00 0.00 MEDIAN NEIGHBORHOOD SALE 144 Huntington Road NE, Atlanta, Georgia 30309 Sold for $1,412,000 on Original List Price of $1,400,000 in 0 days on market. It is a 4 bed/3 bath, with 3,800 sq ft at $371.58/ sq ft. Built in 1923. Sold 11/30/2022.
LORING HEIGHTS 2021 2022 Number of Closings 29 19 High Sale $1,145,000 $875,000 Low Sale $370,000 $350,000 Average Sale Price $635,897 $615,689 Average Original List Price $652,383 $635,258 Average Days of Market 33 35 Average Sale/Original List Price Ratio 97.48% 97.49% Average Sold Price per Square Foot $362.70 $373.33 Number of Actives December 31 2 1 Months of Inventory 0.83 0.63 MEDIAN NEIGHBORHOOD SALE 374 Hascall Road NW, Atlanta, Georgia 30309 Sold for $615,000 on Original List Price of $649,000 in 50 days on market. It is a 3 bed/3 bath, with 1,835 sq ft at $335.15/sq ft. Built in 1941. Sold 1/21/2022. SELLER’S
19
SELLER’S MARKET
MARKET
UNDERWOOD HILLS 2021 2022
Number of Closings 39 21 High Sale $1,056,000 $725,000 Low Sale $275,000 $280,000 Average Sale Price $573,996 $573,400 Average Original List Price $583,867 $584,843 Average Days of Market 27 29 Average Sale/Original List Price Ratio 98.19% 98.20% Average Sold Price per Square Foot $327.90 $325.15 Number of Actives December 31 1 1 Months of Inventory 0.31 0.57 MEDIAN NEIGHBORHOOD SALE 1748 Springer St NW, Atlanta, Georgia 30318 Sold for $585,000 on Original List Price of $585,000 in 13 days on market. It is a 3 bed/3 bath, with 1,940 sq ft at $301.55/sq ft. Built in 1993. Sold 1/12/2022. SELLER’S MARKET BERKELEY PARK 2021 2022 Number of Closings 16 6 High Sale $1,150,000 $1,275,000 Low Sale $335,000 $440,000 Average Sale Price $538,141 $718,263 Average Original List Price $547,544 $709,919 Average Days of Market 27 6 Average Sale/Original List Price Ratio 98.57% 102.92% Average Sold Price per Square Foot $316.33 $404.84 Number of Actives December 31 0 1 Months of Inventory 0.00 2.00 MEDIAN NEIGHBORHOOD SALE 772 Holmes Street NW, Atlanta, Georgia 30318 Sold for $525,000 on Original List Price of $484,900 in 1 days on market. It is a 2 bed/1 bath, with 1,267 sq ft at $414.36/sq ft. Built in 1930. Sold 6/24/2022. SELLER’S MARKET 20

COLLIER HILLS 2021
Number of Closings 40 29 High Sale $1,335,000 $1,450,000 Low Sale $510,000 $190,000 Average Sale Price $833,733 $873,379 Average Original List Price $839,115 $861,817 Average Days of Market 17 20 Average Sale/Original List Price Ratio 99.44% 100.96% Average Sold Price per Square Foot $375.93 $386.61 Number of Actives December 31 2 2 Months of Inventory 0.60 0.83 MEDIAN NEIGHBORHOOD SALE 332 Golfview Road NW, Atlanta, Georgia 30309 Sold for $825,000 on Original List Price of $825,000 in 12 days on market. It is a 2 bed/2.5 bath, with 1,806 sq ft at $456.81/sq ft. Built in 1940. Sold 7/12/2022.
2022
SPRING LAKE 2021 2022 Number of Closings 38 19 High Sale $1,595,000 $1,975,000 Low Sale $613,500 $600,000 Average Sale Price $1,027,739 $1,172,876 Average Original List Price $1,039,666 $1,122,579 Average Days of Market 21 28 Average Sale/Original List Price Ratio 98.79% 105.01% Average Sold Price per Square Foot $327.53 $397.77 Number of Actives December 31 3 2 Months of Inventory 0.95 1.26 MEDIAN NEIGHBORHOOD SALE 2106 Belvedere Drive NW, Atlanta, Georgia 30318 Sold for $1,160,000 on Original List Price of $999,000 in 1 days on market. It is a 5 bed/3 bath, with 2,718 sq ft at $426.78/sq ft. Built in 1938. Sold 8/5/2022. SELLER’S MARKET 21
SELLER’S MARKET
GARDEN HILLS 2021 2022
Number of Closings 81 45 High Sale $2,050,000 $2,595,000 Low Sale $483,500 $642,750 Average Sale Price $998,561 $1,248,828 Average Original List Price $1,060,043 $1,285,620 Average Days of Market 56 31 Average Sale/Original List Price Ratio 94.95% 97.87% Average Sold Price per Square Foot $338.26 $391.34 Number of Actives December 31 7 5 Months of Inventory 1.04 1.33 MEDIAN NEIGHBORHOOD SALE 2802 Alpine Road NE, Atlanta, Georgia 30305 Sold for $1,195,000 on Original List Price of $1,195,000 in 2 days on market. It is a 4 bed/3.5 bath, with 2,855 sq ft at $418.56/sq ft. Built in 1935. Sold 1/14/2022. SELLER’S
PEACHTREE HILLS 2021 2022 Number of Closings 74 53 High Sale $1,310,000 $1,535,000 Low Sale $400,000 $450,000 Average Sale Price $748,568 $798,894 Average Original List Price $756,354 $788,879 Average Days of Market 29 27 Average Sale/Original List Price Ratio 98.68% 101.46% Average Sold Price per Square Foot $364.04 $414.07 Number of Actives December 31 5 3 Months of Inventory 0.81 0.68 MEDIAN NEIGHBORHOOD SALE 2144 Virginia Place NE, Atlanta, Georgia 30305 Sold for $765,000 on Original List Price of $750,000 in 0 days on market. It is a 2 bed/2 bath, with 1,535 sq ft at $498.37/sq ft. Built in 1942. Sold 6/8/2022.
22
MARKET
SELLER’S MARKET
PEACHTREE PARK 2021 2022
Number of Closings 58 46 High Sale $2,175,000 $2,100,000 Low Sale $565,000 $465,000 Average Sale Price $984,828 $1,011,390 Average Original List Price $1,000,888 $1,017,102 Average Days of Market 39 31 Average Sale/Original List Price Ratio 98.75% 99.82% Average Sold Price per Square Foot $326.25 $375.27 Number of Actives December 31 7 1 Months of Inventory 1.45 0.26 MEDIAN NEIGHBORHOOD SALE 3050 Peachtree Drive NE, Atlanta, Georgia 30305 Sold for $887,300 on Original List Price of $775,000 in 5 days on market. It is a 4 bed/2 bath, with 1,914 sq ft at $463.58/sq ft. Built in 1940. Sold 5/3/2022.
TUXEDO PARK 2021 2022 Number of Closings 30 33 High Sale $8,375,000 $8,000,000 Low Sale $590,000 $720,000 Average Sale Price $2,501,882 $2,829,915 Average Original List Price $2,674,233 $3,023,606 Average Days of Market 102 46 Average Sale/Original List Price Ratio 93.91% 93.75% Average Sold Price per Square Foot $408.53 $490.96 Number of Actives December 31 8 12 Months of Inventory 3.20 4.36 MEDIAN NEIGHBORHOOD SALE 3566 Habersham Road NW, Atlanta, Georgia 30305 Sold for $2,200,000 on Original List Price of $2,250,000, in 7 days on market. It is a 4 bed/4 bath, with 5,043 sq ft at $436.25/sq ft. Built in 2016. Sold 6/8/2022. SELLER’S MARKET 23
SELLER’S MARKET
CASTLEWOOD 2021 2022
Number of Closings 16 15 High Sale $1,980,700 $1,575,000 Low Sale $799,000 $730,000 Average Sale Price $1,238,106 $1,107,400 Average Original List Price $1,276,750 $1,194,933 Average Days of Market 30 10 Average Sale/Original List Price Ratio 97.44% 97.26% Average Sold Price per Square Foot $305.98 $350.46 Number of Actives December 31 0 2 Months of Inventory 0.00 1.60 MEDIAN NEIGHBORHOOD SALE 3075 Rhodenhaven Drive NW, Atlanta, Georgia 30327 Sold for $1,100,000 on Original List Price of $1,195,000 in 8 days on market. It is a 3 bed/2.5 bath, with 3,206 sq ft at $343.11/sq ft. Built in 1954. Sold 5/27/2022. SELLER’S
RIDGEWOOD HEIGHTS 2021 2022 Number of Closings 18 15 High Sale $1,115,000 $1,060,000 Low Sale $415,000 $550,000 Average Sale Price $682,797 $690,733 Average Original List Price $688,150 $687,727 Average Days of Market 17 33 Average Sale/Original List Price Ratio 99.28% 101.47% Average Sold Price per Square Foot $314.36 $340.64 Number of Actives December 31 2 1 Months of Inventory 1.33 0.80 MEDIAN NEIGHBORHOOD SALE 2656 Ridgemore Road NW, Atlanta, Georgia 30318 Sold for $670,000 on Original List Price of $649,900 in 6 days on market. It is a 4 bed/3 bath, with 1,573 sq ft at $425.94/sq ft. Built in 1954. Sold 6/7/2022. SELLER’S
24
MARKET
MARKET
BUCKHEAD BY ELEMENTARY SCHOOL
GARDEN HILLS ELEMENTARY MORRIS BRANDON ELEMENTARY SARA SMITH ELEMENTARY E RIVERS ELEMENTARY JACKSON ELEMENTARY
25
GARDEN HILLS ELEMENTARY 2021 2022
MORRIS BRANDON ELEMENTARY 2021 2022
Number of Closings 203 139 High Sale $2,200,000 $2,750,000 Low Sale $305,000 $207,000 Average Sale Price $881,890 $993,838 Average Original List Price $917,655 $1,007,826 Average Days of Market 49 34 Average Sale/Original List Price Ratio 96.90% 98.85% Average Sold Price per Square Foot $328.18 $365.66 Number of Actives December 31 20 14 Months of Inventory 1.18 1.21 MEDIAN NEIGHBORHOOD SALE 2963 Dale Drive NE, Atlanta, Georgia 30305 Sold for $865,000 on Original List Price of $875,000 in 7 days on market. It is a 3 bed/2.5 bath, with 3,264 sq ft at $265.01/ sq ft. Built in 1948. Sold 8/29/2022. SELLER’S MARKET
Number of Closings 301 187 High Sale $5,500,000 $6,900,000 Low Sale $355,900 $275,000 Average Sale Price $1,310,850 $1,399,456 Average Original List Price $1,360,820 $1,436,861 Average Days of Market 52 43 Average Sale/Original List Price Ratio 97.51% 98.78% Average Sold Price per Square Foot $335.28 $375.70 Number of Actives December 31 21 33 Months of Inventory 0.84 2.12 MEDIAN NEIGHBORHOOD SALE 2787 Margaret Mitchell Drive NW, Atlanta, Georgia 30327 Sold for $1,135,000 on Original List Price of $1,100,000 in 5 days on market. It is a 4 bed/3.5 bath, with 3,366 sq ft at $337.20/sq ft. Built in 1959. Sold 2/7/2022. SELLER’S MARKET 26
SARA SMITH ELEMENTARY 2021 2022

Number of Closings 277 175 High Sale $7,107,531 $5,475,000 Low Sale $360,000 $290,000 Average Sale Price $1,202,524 $1,407,490 Average Original List Price $1,258,096 $1,446,993 Average Days of Market 50 40 Average Sale/Original List Price Ratio 96.35% 98.32% Average Sold Price per Square Foot $303.43 $338.14 Number of Actives December 31 26 23 Months of Inventory 1.13 1.58 MEDIAN NEIGHBORHOOD SALE 4100 Wieuca Road NE, Atlanta, Georgia 30342 Sold for $1,065,000 on Original List Price of $1,050,000 in 10 days on market. It is a 5 bed/4.5 bath, with 4,208 sq ft at $253.09/sq ft. Built in 1954. Sold 3/29/2022.
E RIVERS ELEMENTARY 2021 2022 Number of Closings 265 190 High Sale $4,500,000 $5,999,000 Low Sale $275,000 $280,000 Average Sale Price $930,332 $1,039,963 Average Original List Price $959,912 $1,071,251 Average Days of Market 37 31 Average Sale/Original List Price Ratio 97.83% 99.45% Average Sold Price per Square Foot $364.42 $396.05 Number of Actives December 31 20 9 Months of Inventory 0.91 0.57 MEDIAN NEIGHBORHOOD SALE 1956 Greystone Road NW, Atlanta, Georgia 30318 Sold for $809,000 on Original List Price of $860,000 in 22 days on market. It is a 3 bed/2.5 bath, with 1,674 sq ft at $483.27/sq ft. Built in 1940. Sold 10/24/2022.
SELLER’S MARKET
27
SELLER’S MARKET
Number of Closings 279 208 High Sale $8,375,000 $9,000,000 Low Sale $340,000 $402,500 Average Sale Price $1,802,495 $1,978,019 Average Original List Price $1,931,762 $2,066,808 Average Days of Market 76 44 Average Sale/Original List Price Ratio 94.82% 97.22% Average Sold Price per Square Foot $333.60 $380.30 Number of Actives December 31 39 43 Months of Inventory 1.68 2.48 MEDIAN NEIGHBORHOOD SALE 4137 N Broadland Road NW, Atlanta, Georgia 30342 Sold for $1,560,000 on Original List Price of $1,595,000 in 31 days on market. It is a 5 bed/4.5 bath, with 4,311 sq ft at $361.86/sq ft. Built in 1953. Sold 4/19/2022.
JACKSON ELEMENTARY 2021 2022
28
SELLER’S MARKET
BROOKHAVEN, CHAMBLEE & NORTHEASTERN NEIGHBORHOODS BROOKHAVEN CHAMBLEE ASHFORD PARK LAVISTA PARK PINE HILLS EMBRY HILLS NORTHCREST 29
BROOKHAVEN 2021 2022
MEDIAN NEIGHBORHOOD SALE
2376 Matthews Street, Brookhaven, Georgia 30319 Sold for $781,000 on Original List Price of $775,000 in 0 days on market. It is a 4 bed/3.5 bath, with 2,425 sq ft at $322.06/ sq ft. Built in 1994. Sold 3/16/2022.
MEDIAN NEIGHBORHOOD SALE
1944 Chamdun Way, Chamblee, Georgia 30341 Sold for $538,000 on Original List Price of $585,000 in 105 days on market. It is a 3 bed/2.5 bath, with 2,636 sq ft at $204.10/sq ft. Built in 1989. Sold 10/21/2022.
Number of Closings 652 502 High Sale $5,170,000 $3,080,000 Low Sale $303,000 $260,000 Average Sale Price $816,402 $915,483 Average Original List Price $869,000 $935,849 Average Days of Market 33 27 Average Sale/Original List Price Ratio 98.19% 99.10% Average Sold Price per Square Foot $275.94 $310.47 Number of Actives December 31 38 60 Months of Inventory 0.70 1.43 SELLER’S MARKET CHAMBLEE 2021 2022 Number of Closings 153 119 High Sale $1,198,679 $1,515,000 Low Sale $235,000 $249,900 Average Sale Price $497,898 $587,558 Average Original List Price $502,495 $589,701 Average Days of Market 22 26 Average Sale/Original List Price Ratio 99.23% 99.88% Average Sold Price per Square Foot $246.35 $291.14 Number of Actives December 31 3 13 Months of Inventory 0.24 1.31 SELLER’S MARKET 30

MEDIAN NEIGHBORHOOD SALE 2587 Caldwell Road NE, Brookhaven, Georgia 30319 Sold for $1,232,000 on Original List Price of $1,300,000 in 27 days on market. It is a 4 bed/3.5 bath, with 3,032 sq ft at $406.33/sq ft. Built in 2008. Sold 4/15/2022.
Number of Closings 79 75 High Sale $2,000,000 $2,950,000 Low Sale $320,000 $299,000 Average Sale Price $917,008 $1,160,964 Average Original List Price $928,397 $1,238,921 Average Days of Market 32 28 Average Sale/Original List Price Ratio 98.88% 98.59% Average Sold Price per Square Foot $330.83 $381.25 Number of Actives December 31 9 8 Months of Inventory 1.37 1.28 SELLER’S MARKET LAVISTA PARK 2021 2022 Number of Closings 49 32 High Sale $2,250,000 $2,160,000 Low Sale $460,000 $457,500 Average Sale Price $867,308 $866,722 Average Original List Price $885,498 $877,300 Average Days of Market 29 27 Average Sale/Original List Price Ratio 98.39% 99.27% Average Sold Price per Square Foot $287.86 $318.93 Number of Actives December 31 4 7 Months of Inventory 0.98 2.63 MEDIAN NEIGHBORHOOD SALE 1231 Wildcliff Circle NE, Atlanta, Georgia 30329 Sold for $750,000 on Original List Price of $689,900 in 2 days on market. It is a 4 bed/3.5 bath, with 3,312 sq ft at $226.45/ sq ft. Built in 1991. Sold 5/27/2022.
31
ASHFORD PARK 2021 2022
SELLER’S MARKET
PINE HILLS 2021 2022

EMBRY HILLS 2021 2022 Number of Closings 13 12 High Sale $693,000 $675,000 Low Sale $372,000 $315,200 Average Sale Price $474,269 $468,600 Average Original List Price $467,438 $477,325 Average Days of Market 16 39 Average Sale/Original List Price Ratio 101.51% 98.00% Average Sold Price per Square Foot $197.48 $213.99 Number of Actives December 31 2 0 Months of Inventory 1.85 0.00 MEDIAN NEIGHBORHOOD SALE 3277 Chase Road, Chamblee, Georgia 30341 Sold for $458,000 on Original List Price of $465,000 in 115 days on market. It is a 4 bed/2.5 bath, with 2,238 sq ft at $204.65/sq ft. Built in 1965. Sold 4/22/2022. SELLER’S MARKET
Number of Closings 58 38 High Sale $1,832,450 $3,700,000 Low Sale $360,000 $475,000 Average Sale Price $794,057 $1,284,494 Average Original List Price $837,086 $1,321,629 Average Days of Market 54 41 Average Sale/Original List Price Ratio 96.05% 98.00% Average Sold Price per Square Foot $280.71 $335.14 Number of Actives December 31 5 4 Months of Inventory 1.03 1.26 MEDIAN NEIGHBORHOOD SALE 3296 Ferncliff Place, Atlanta, Georgia 30324 Sold for $855,000 on Original List Price of $750,000 in 4 days on market. It is a 3 bed/3.5 bath, with 2,956 sq ft at $289.24/ sq ft. Built in 1956. Sold 4/25/2022. SELLER’S MARKET 32
MEDIAN NEIGHBORHOOD SALE
3367 Thornewood Drive, Atlanta, Georgia 30340 Sold for $543,000 on Original List Price of $539,900 in 6 days on market. It is a 3 bed/3.5 bath, with 2,024 sq ft at $268.28/ sq ft. Built in 1959. Sold 8/30/2022.
SELLER’S
NORTHCREST 2021 2022 Number of Closings 27 19 High Sale $570,000 $885,000 Low Sale $295,000 $225,000 Average Sale Price $456,689 $541,445 Average Original List Price $437,330 $503,400 Average Days of Market 11 17 Average Sale/Original List Price Ratio 104.68% 106.03% Average Sold Price per Square Foot $224.20 $249.60 Number of Actives December 31 2 3 Months of Inventory 0.89 1.89
MARKET
33
SELLER’S MARKET
WEST SIDE
WEST END
CAPITOL VIEW
ADAIR PARK
PITTSBURGH & MECHANICSVILLE
WEST VIEW
SYLVAN HILLS
OAKLAND CITY
VENETIAN HILLS
ASHVIEW HEIGHTS
COLLIER HEIGHTS
DIXIE HILLS
CENTER HILL
GROVE PARK
MOZLEY PARK
VINE CITY
40
Number of Closings 26 41 High Sale $525,000 $1,200,000 Low Sale $159,000 $200,000 Average Sale Price $344,708 $447,527 Average Original List Price $353,162 $454,988 Average Days of Market 59 28 Average Sale/Original List Price Ratio 97.86% 98.32% Average Sold Price per Square Foot $190.14 $231.30 Number of Actives December 31 3 6 Months of Inventory 1.38 1.76 MEDIAN NEIGHBORHOOD SALE 681 Holderness Street SW, Atlanta, Georgia 30310 Sold for $410,000 on Original List Price of $390,000 in 56 days on market. It is a 3 bed/2 bath, with 1,190 sq ft at $344.54/sq ft. Built in 1925. Sold 2/4/2022.
HISTORIC WEST END 2021 2022
CAPITOL VIEW 2021 2022 Number of Closings 34 54 High Sale $515,500 $595,000 Low Sale $128,000 $180,000 Average Sale Price $306,418 $390,767 Average Original List Price $312,854 $396,302 Average Days of Market 49 24 Average Sale/Original List Price Ratio 98.51% 98.47% Average Sold Price per Square Foot $187.38 $253.67 Number of Actives December 31 3 7 Months of Inventory 1.06 1.56 MEDIAN NEIGHBORHOOD SALE 1381 Graham Street, Atlanta, Georgia 30310 Sold for $400,000 on Original List Price of $400,000 in 5 days on market. It is a 3 bed/2 bath, with 1,110 sq ft at $360.36/sq ft. Built in 1930. Sold 6/15/2022. SELLER’S MARKET 41
SELLER’S MARKET
ADAIR PARK 2021 2022 Number of Closings 33 25 High Sale $660,000 $675,000 Low Sale $168,500 $239,000 Average Sale Price $377,933 $485,932 Average Original List Price $390,948 $499,132 Average Days of Market 46 52 Average Sale/Original List Price Ratio 96.06% 97.33% Average Sold Price per Square Foot $231.74 $266.90 Number of Actives December 31 3 9 Months of Inventory 1.09 4.32 MEDIAN NEIGHBORHOOD SALE 782 lowndes Avenue, Atlanta, Georgia 30310 Sold for $485,000 on Original List Price of $475,000 in 20 days on market. It is a 3 bed/2 bath, with 1,400 sq ft at $346.43/sq ft. Built in 2021. Sold 2/22/2022. SELLER’S MARKET PITTSBURGH & MECHANICSVILLE 2021 2022 Number of Closings 132 89 High Sale $716,000 $900,000 Low Sale $48,000 $69,000 Average Sale Price $273,002 $336,381 Average Original List Price $286,685 $351,102 Average Days of Market 32 39 Average Sale/Original List Price Ratio 95.77% 95.57% Average Sold Price per Square Foot $194.56 $209.96 Number of Actives December 31 6 30 Months of Inventory 0.55 4.04 MEDIAN NEIGHBORHOOD SALE 249 Fletcher Street SW, Atlanta, Georgia 30315 Sold for $329,400 on Original List Price of $324,900 in 0 days on market. It is a 3 bed/2 bath, with 1,250 sq ft at $263.52/sq ft. Built in 1920. Sold 8/24/2022. SELLER’S MARKET 42
SYLVAN HILLS 2021 2022 Number of Closings 85 82 High Sale $528,000 $535,000 Low Sale $98,333 $132,000 Average Sale Price $284,223 $338,850 Average Original List Price $287,616 $345,824 Average Days of Market 34 29 Average Sale/Original List Price Ratio 99.13% 97.76% Average Sold Price per Square Foot $192.97 $229.90 Number of Actives December 31 4 12 Months of Inventory 0.56 1.76 MEDIAN NEIGHBORHOOD SALE 1661 Melrose Drive SW, Atlanta, Georgia 30310 Sold for $337,000 on Original List Price of $379,000 in 64 days on market. It is a 3 bed/2 bath, with 2,000 sq ft at $168.50/sq ft. Built in 1925. Sold 8/9/2022. SELLER’S MARKET
Number of Closings 53 59 High Sale $535,000 $960,000 Low Sale $145,000 $155,000 Average Sale Price $341,418 $422,575 Average Original List Price $348,377 $420,398 Average Days of Market 35 29 Average Sale/Original List Price Ratio 98.43% 99.76% Average Sold Price per Square Foot $206.88 $236.91 Number of Actives December 31 6 12 Months of Inventory 1.36 2.44 MEDIAN NEIGHBORHOOD SALE 1539 Beecher Street SW, Atlanta, Georgia 30310 Sold for $400,000 on Original List Price of $460,000 in 43 days on market. It is a 3 bed/2.5 bath, with 1,638 sq ft at 244.20/sq ft. Built in 2008. Sold 7/13/2022. SELLER’S MARKET 43
WESTVIEW 2021 2022
OAKLAND CITY 2021 2022
Number of Closings 116 82 High Sale $690,000 $630,000 Low Sale $110,000 $155,000 Average Sale Price $311,728 $377,125 Average Original List Price $319,928 $384,736 Average Days of Market 38 36 Average Sale/Original List Price Ratio 97.90% 97.49% Average Sold Price per Square Foot $210.05 $228.48 Number of Actives December 31 12 33 Months of Inventory 1.24 4.83 MEDIAN NEIGHBORHOOD SALE 1005 Oakland Drive SW, Atlanta, Georgia 30310 Sold for $355,000 on Original List Price of $358,900 in 117 days on market. It is a 3 bed/2 bath, with 1,265 sq ft at $280.63/sq ft. Built in 1935. Sold 3/28/2022. SELLER’S MARKET VENETIAN HILLS 2021 2022 Number of Closings 95 58 High Sale $465,000 $575,000 Low Sale $110,000 $100,000 Average Sale Price $261,843 $331,127 Average Original List Price $268,450 $337,267 Average Days of Market 45 29 Average Sale/Original List Price Ratio 97.65% 98.74% Average Sold Price per Square Foot $174.48 $213.07 Number of Actives December 31 8 26 Months of Inventory 1.01 5.38 MEDIAN NEIGHBORHOOD SALE 1881 Bayberry Drive SW, Atlanta, Georgia 30311 Sold for $330,000 on Original List Price of $340,000 in 79 days on market. It is a 3 bed/2 bath, with 1,600 sq ft at $206.25/sq ft. Built in 1952. Sold 4/13/2022. SELLER’S MARKET 44
ASHVIEW
MEDIAN NEIGHBORHOOD SALE 3222 Jamaica Road NW, Atlanta, Georgia 30318 Sold for $285,000 on Original List Price of $275,000 in 76 days on market. It is a 4 bed/3 bath, with 1,440 sq ft at $197.92/sq ft. Built in 1960. Sold 11/18/2022. MEDIAN NEIGHBORHOOD SALE 1061 Ashby Grove SW, Atlanta, Georgia 30314 Sold for $375,000 on Original List Price of $365,000 in 9 days on market. It is a 3 bed/2 bath, with 1,701 sq ft at $220.46/sq ft. Built in 1945. Sold 3/16/2022.
Number of Closings 41 23 High Sale $510,000 $620,000 Low Sale $147,500 $160,000 Average Sale Price $284,329 $359,498 Average Original List Price $291,444 $367,904 Average Days of Market 43 24 Average Sale/Original List Price Ratio 97.68% 96.84% Average Sold Price per Square Foot $195.64 $228.63 Number of Actives December 31 2 5 Months of Inventory 0.59 2.61 SELLER’S MARKET COLLIER HEIGHTS 2021 2022 Number of Closings 59 58 High Sale $389,900 $910,000 Low Sale $94,000 $53,900 Average Sale Price $250,143 $287,716 Average Original List Price $255,385 $303,721 Average Days of Market 34 32 Average Sale/Original List Price Ratio 98.98% 96.17% Average Sold Price per Square Foot $160.87 $195.15 Number of Actives December 31 7 20 Months of Inventory 1.42 4.14 SELLER’S MARKET 45
HEIGHTS 2021 2022
DIXIE HILLS 2021 2022
MEDIAN NEIGHBORHOOD SALE
2201 PANSY Street NW, Atlanta, Georgia 30314 Sold for $245,000 on Original List Price of $239,900 in 23 days on market. It is a 2 bed/2 bath, with 975 sq ft at $251.28/ sq ft. Built in 1950. Sold 3/23/2022.
CENTER HILL 2021 2022
MEDIAN NEIGHBORHOOD SALE
834 NW Woods Dr, Atlanta, Georgia 30318 Sold for $285,000 on Original List Price of $310,000 in 16 days on market. It is a 3 bed/2 bath, with 1,200
at $237.50/sq ft. Built in 1966. Sold 7/20/2022.
sq ft
Number of Closings 55 48 High Sale $375,000 $385,000 Low Sale $55,000 $100,000 Average Sale Price $199,045 $234,785 Average Original List Price $203,209 $245,477 Average Days of Market 25 37 Average Sale/Original List Price Ratio 98.28% 96.00% Average Sold Price per Square Foot $168.69 $203.46 Number of Actives December 31 12 15 Months of Inventory 2.62 3.75 SELLER’S MARKET
Number of Closings 50 61 High Sale $505,000 $538,000 Low Sale $100,000 $115,000 Average Sale Price $242,624 $276,359 Average Original List Price $252,119 $289,043 Average Days of Market 33 34 Average Sale/Original List Price Ratio 96.05% 95.14% Average Sold Price per Square Foot $177.13 $209.61 Number of Actives December 31 7 11 Months of Inventory 1.68 2.16 SELLER’S MARKET 46
GROVE PARK 2021 2022
MEDIAN NEIGHBORHOOD SALE
892 Margaret Place, Atlanta, Georgia 30318
Sold for $250,000 on Original List Price of $305,000 in 12 days on market. It is a 3 bed/2 bath, with 960 sq ft at $260.42/ sq ft. Built in 1948. Sold 3/14/2022.
MEDIAN NEIGHBORHOOD SALE
1677 Martin Luther King Jr Dr NW Atlanta, Georgia 30314
Sold for $395,000 on Original List Price of $395,900 in 42 days on market. It is a 4 bed/3 bath, with 1,900 sq ft at $207.89/sq ft. Built in 1938. Sold 9/23/2022.
Number of Closings 99 84 High Sale $460,000 $550,000 Low Sale $10,000 $90,000 Average Sale Price $231,206 $263,727 Average Original List Price $240,508 $282,724 Average Days of Market 44 31 Average Sale/Original List Price Ratio 95.66% 93.15% Average Sold Price per Square Foot $173.26 $202.70 Number of Actives December 31 7 31 Months of Inventory 0.85 4.43 SELLER’S MARKET MOZLEY PARK 2021 2022 Number of Closings 64 39 High Sale $649,000 $570,000 Low Sale $150,000 $175,000 Average Sale Price $343,903 $387,631 Average Original List Price $348,967 $398,687 Average Days of Market 47 49 Average Sale/Original List Price Ratio 99.01% 97.10% Average Sold Price per Square Foot $201.09 $249.41 Number of Actives December 31 8 13 Months of Inventory 1.50 4.00 SELLER’S MARKET 47
MEDIAN NEIGHBORHOOD SALE
Number of Closings 25 20 High Sale $424,900 $540,000 Low Sale $174,000 $170,000 Average Sale Price $298,972 $363,884 Average Original List Price $308,746 $371,890 Average Days of Market 11 28 Average Sale/Original List Price Ratio 96.36% 96.39% Average Sold Price per Square Foot $201.04 $235.03 Number of Actives December 31 4 3 Months of Inventory 1.92 1.80 SELLER’S MARKET 48
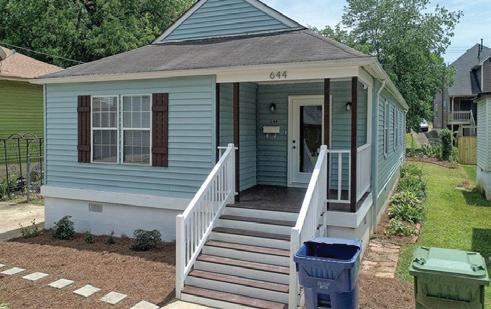
644 Lester Street NW, Atlanta, Georgia 30314 Sold for $385,000 on Original List Price of $389,900 in 7 days on market. It is a 4 bed/2 bath, with 1,350 sq ft at $285.19/sq ft. Built in 1990. Sold 7/6/2022. VINE CITY 2021 2022