MIDTOWN
1010 MIDTOWN 1065 MIDTOWN RESIDENCES LOEWS 1280 WEST 805 PEACHTREE 905 JUNIPER 40 WEST 12TH ABOVE THE FOUR SEASONS ANSLEY ABOVE THE PARK ANSLEY TERRACE AQUA
THE BELVEDERE THE BELVEDERE - LOFTS AT THE BELVEDERE COLONY PARK CITIHOMES COLONY SQUARE - COLONY HOUSE COLONY SQUARE - HANOVER HOUSE
CORNERSTONE VILLAGE - REID BUILDING
CORNERSTONE VILLAGE - LOFT BUILDING
CORNERSTONE VILLAGE - NEW BUILDING COTTING COURT
THE DAKOTA CONDO FLATS THE DAKOTA TOWNHOMES HARPER ON PIEDMONT J-5
LOFTS AT THE PARK I LOFTS AT THE PARK II
LUXE MAYFAIR RENAISSANCE MAYFAIR TOWER METROPOLIS MIDCITY LOFTS ONE MUSEUM PLACE PARC VUE PARK CENTRAL PEACHTREE LOFTS PEACHTREE WALK PIEDMONT CREST PLAZA MIDTOWN REID HOUSE SEVENTH MIDTOWN SIENA AT RENAISSANCE SPIRE TUSCANY TWELVE CENTENNIAL PARK VIEWPOINT VIRGINIA HILL W RESIDENCES
WILBURN HOUSE - NEWER WILBURN HOUSE - HISTORIC WINDSOR OVER PEACHTREE
4

1 1010 Midtown 19 Cotting Court 37 Plaza Midtown 2 1065 Midtown Residences Loews 20 The Dakota Condo Flats 38 Reid House 3 1280 West 21 The Dakota Townhomes 39 Seventh Midtown 4 805 Peachtree 22 Harper On Piedmont 40 Siena at Renaissance 5 905 Juniper 23 J-5 41 Spire 6 40 West 12th 24 Lofts at the Park I 42 Tuscany 7 Above the Four Seasons 25 Lofts at the Park II 43 Twelve Centennial Park 8 Ansley Above the Park 26 Luxe 44 Viewpoint 9 Ansley Terrace 27 Mayfair Renaissance 45 Virginia Hill 10 Aqua 28 Mayfair Tower 46 W Residences 11 The Belvedere 29 Metropolis 47 Wilburn House - Newer 12 The Belvedere - Lofts at the Belvedere 30 Midcity Lofts 48 Wilburn House - Historic 13 Colony Park CitiHomes 31 One Museum Place 49 Windsor Over Peachtree 14 Colony Square - Colony House 32 Parc Vue 15 Colony Square - Hanover House 33 Park Central 16 Cornerstone Village - Reid Building 34 Peachtree Lofts 17 Cornerstone Village - Loft Building 35 Peachtree Walk 18 Cornerstone Village - New Building 36 Piedmont Crest 10 13 14 35 30 41 28 5 16-18 8 36 11-12 27 25 29 39 37 7 6 19 22 23 31 42 1 4 3 33 45 15 9 32 26 24 38 20-21 34 2 43 44 46 47 48 49 40
1280 West 434 1989 $0.53 67 $195,964 97.58% 65 35 $248,557 98.65% 27 805 Peachtree 118 1951 $0.60 21 $382,336 96.02% 54 10 $470,650 100.39% 41 905 Juniper 92 2006 $0.62 8 $570,894 94.87% 106 10 $518,802 98.17% 54 40 West 12th 64 2021 $0.70 23 $1,304,829 101.72% 66 14 $1,749,281 100.99% 36
Above the Four Seasons 91 1992 $0.82 13 $665,192 90.79% 170 4 $1,001,250 98.60% 26
Ansley Above the Park 127 1988 $0.48 8 $443,625 97.69% 28 12 $509,229 96.42% 37
Ansley Terrace 74 1989 $0.42 8 $445,063 97.90% 25 5 $437,000 92.00% 40
Aqua 83 2007 $0.58 10 $869,040 97.94% 107 11 $528,591 96.75% 86
The Belvedere 39 2001 $0.31 3 $451,300 97.72% 46 4 $431,250 100.02% 6
The Belvedere - Lofts at the Belvedere 48 2004 $0.33 3 $290,800 99.28% 15 4 $323,875 102.17% 28
Colony Park CitiHomes 112 1984 $0.43 16 $289,041 99.89% 33 6 $332,417 100.99% 13
Colony SquareColony House 193 1974 $0.71 10 $511,350 92.78% 100 11 $380,539 95.97% 145
Colony SquareHanover House 71 1974 $0.71 8 $463,256 93.57% 68 4 $513,750 93.82% 46
Cornerstone Village - Reid Building 40 of 310 1927 $0.40 2 $240,000 96.60% 83 2 $292,500 104.52% 9
Cornerstone Village - Loft Building 115 of 310 1945 $0.49 25 $229,626 96.04% 57 15 $327,660 100.90% 33
Cornerstone Village - New Building 155 of 310 2001 $0.48 17 $261,694 95.37% 85 20 $274,750 100.74% 21
Cotting Court 60 2001 $0.63 5 $436,600 95.27% 40 6 $642,500 97.76% 53


The Dakota Condo Flats 160 2000 $0.34 12 $481,263 96.63% 58 6 $577,917 100.07% 14
The Dakota Townhomes 2000 $0.34 7 $625,357 96.49% 113 11 $630,391 96.66% 27
Harper On Piedmont 111 2009 $0.35 22 $437,185 99.52% 130 8 $507,220 98.39% 113 J-5 149 2020 $0.39 7 $660,719 99.61% 22 27 $653,864 99.93% 29
Lofts at the Park I 54 2001 $0.33 4 $523,750 96.74% 50 5 $520,400 99.65% 21 Lofts at the Park II 24 2001 $0.37 5 $523,300 95.48% 55 2 $486,250 98.74% 2
6 Midtown Condo Overview
Total Units Year Built HOA/ Square Foot Total Closings Average Sales Price Avg SP/ OLP Total Days on Market Total Closings Average Sales Price Average SP/OLP Total Days on Market
Building
1010 Midtown 425 2008 $0.49 62 $534,704 97.26% 61 49 $626,474 98.13% 30 1065 Midtown Residences Loews 52 2010 $0.83 3 $1,332,167 95.74% 126 6 $1,531,667 92.75% 96
2021 2022
Building
Luxe 112 2008 $0.50 10 $651,200 97.66% 58 7 $699,500 96.86% 27
Mayfair Renaissance 297 2002 $0.48 21 $371,890 95.64% 71 13 $564,462 98.38% 40
Mayfair Tower 323 1992 $0.49 27 $292,237 97.33% 43 18 $325,833 98.15% 13
Metropolis 498 2002 $0.50 51 $315,334 97.77% 48 42 $359,243 98.90% 27
Midcity Lofts 132 2002 $0.44 10 $408,966 94.60% 66 9 $489,628 100.14% 95
One Museum Place 44 2018 $0.74 3 $1,850,000 88.82% 477 3 $1,858,333 92.50% 228
Parc Vue 136 1991 $0.55 15 $316,893 97.93% 48 12 $357,833 102.27% 7
Park Central 397 1999 $0.44 64 $303,519 97.89% 40 29 $333,872 102.70% 19
Peachtree Lofts 210 1951 $0.43 25 $291,048 96.39% 72 19 $305,016 98.82% 22
Peachtree Walk 218 1996 $0.26 25 $272,480 97.39% 32 16 $303,152 101.40% 9
Piedmont Crest 70 2005 $0.44 9 $310,889 97.64% 70 8 $428,125 101.68% 11
Plaza Midtown 418 2006 $0.40 46 $373,233 96.77% 81 41 $389,287 99.61% 18
Reid House 41 1924 $0.77 7 $542,639 91.77% 118 4 $548,936 95.27% 150
Seventh Midtown 21 2016 $0.73 4 $1,203,750 95.62% 99 1 $999,000 95.14% 44
Siena at Renaissance 227 1989 $0.39 14 $246,957 98.01% 42 12 $320,992 99.76% 41
Spire 393 2005 $0.55 64 $360,911 97.54% 43 33 $408,719 97.32% 46
Tuscany 230 1996 $0.42 22 $278,586 98.46% 37 20 $301,718 99.68% 16
Twelve Centennial Park 517 2007 $0.42 62 $302,564 112.23% 63 34 $327,231 99.97% 22 Viewpoint 378 2008 $0.60 61 $425,864 97.98% 75 37 $451,886 97.55% 45 Virginia Hill 53 1990 $0.34 7 $435,714 98.59% 9 1 $325,000 105.18% 102
W Residences 74 2010 $0.69 7 $435,714 98.59% 9 7 $787,857 94.62% 198
Wilburn HouseNewer 37 2002 $0.47 2 $654,500 97.41% 12 2 $590,000 99.98% 7
Wilburn HouseHistoric 32 1911 $0.47 4 $338,500 100.05% 10 4 $471,225 102.11% 9
Windsor Over Peachtree 269 1965 $0.76 33 $188,102 95.41% 74 26 $242,481 98.86% 35
7
on
Total Units Year Built HOA/ Square Foot Total Closings Average Sales Price Avg SP/ OLP Total Days on Market Total Closings Average Sales Price Avg SP/OLP Total Days
Market
2021 2022


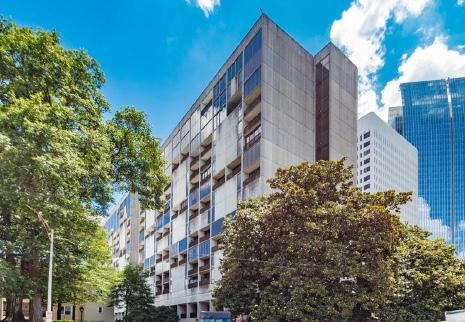
8 NO ACTIVES as of 12/31/2022 1010 MIDTOWN 1080 Peachtree St NE Atlanta, GA 30309 Average Sold Price Per Square Foot: $534.12 Unit Number Square Feet Beds Baths List Date Original List Price List Price List Price per Square Foot 2011 1,564 2 2 11/30/2022 $960,000 $960,000 $613.81 3212 1,196 2 2 12/2/2022 $705,000 $705,000 $589.46 PENDING as of 12/31/2022 Unit Number Square Feet Original List Price Close Date Sold Price Sold Price/ Original List Price Total Days on Market Sold Price per Square Foot 2007 872 $435,000 12/27/2022 $435,000 100.00% 30 $498.85 2701 866 $479,900 9/9/2022 $480,000 100.02% 9 $554.27 3201 866 $439,000 8/19/2022 $439,000 100.00% 0 $506.93 1916 879 $435,000 9/7/2022 $435,000 100.00% 22 $494.88 1414 768 $415,000 12/15/2022 $375,000 90.36% 98 $488.28 July - December 2022 AVERAGE $432,800 98.08% 32 $508.64 January - June 2022 AVERAGE $396,734 99.44% 19 $469.48 CLOSED - 1 BEDROOM July - December 2022
3503 1,505 $999,900 9/9/2022 $999,900 100.00% 42 $664.39
3507 1,677 $1,189,000 7/11/2022 $950,000 79.90% 51 $566.49
2905 1,866 $960,000 10/3/2022 $930,000 96.88% 1 $498.39
2811 1,563 $960,000 7/28/2022 $928,000 96.67% 8 $593.73
1610 1,397 $840,000 11/22/2022 $797,000 94.88% 95 $570.51 1403 1,505 $800,000 11/30/2022 $780,000 97.50% 30 $518.27
1702 1,386 $769,900 9/30/2022 $769,900 100.00% 29 $555.48 3304 1,358 $700,000 12/9/2022 $692,000 98.86% 64 $509.57
2704 1,358 $670,000 8/10/2022 $658,200 98.24% 10 $484.68 904 1,213 $629,900 8/29/2022 $615,000 97.63% 13 $507.01
July - December 2022 AVERAGE $812,000 96.06% 34 $546.85
January - June 2022 AVERAGE $741,647 98.18% 36 $525.47
9
Number Square Feet Original List Price Close Date Sold Price Sold Price/ Original List Price Total Days on Market Sold Price per Square Foot
Unit
CLOSED - 2 BEDROOM July - December 2022

10 1065 MIDTOWN RESIDENCES LOEWS 1065 Peachtree St NE Atlanta, GA 30309 NO ACTIVES OR PENDINGS as of 12/31/2022 Unit Number Square Feet Original List Price Close Date Sold Price Sold Price/ Original List Price Total Days on Market Sold Price per Square Foot 2905 2,289 $1,445,000 10/6/2022 $1,375,000 95.16% 69 $600.70 3203 1,992 $1,225,000 12/14/2022 $1,200,000 97.96% 12 $602.41 July - December 2022 AVERAGE $1,287,500 96.56% 41 $601.55 January - June 2022 AVERAGE $1,327,500 96.61% 162 $579.95 CLOSED - 2 BEDROOM July - December 2022 Average Sold Price Per Square Foot: $601.55

11 1280 WEST
NW
Unit Number Square Feet Beds Baths List Date Original List Price List Price List Price per Square Foot
as of 12/31/2022
Sold Price Per Square Foot:
Unit Number Square Feet Beds Baths List Date Original List Price List Price List Price per Square Foot
12/31/2022
1280 W. Peachtree St
Atlanta, GA 30309
4002 2,297 3 2 12/6/2022 $1,100,000 $1,125,000 $489.77 1806 1,028 2 2 10/14/2022 $325,000 $315,000 $306.42 1812 772 1 1 10/20/2022 $229,000 $228,000 $295.34 1102 625 1 1 8/10/2022 $230,000 $227,000 $363.20 1208 645 1 1 8/21/2022 $230,000 $205,000 $317.83 ACTIVE
Average
$333.97
2006 1,028 2 2 11/1/2022 $335,000 $325,000 $316.15 2109 1,028 2 2 10/18/2022 $375,000 $290,000 $282.10 1710 645 1 1 9/16/2022 $235,000 $215,000 $333.33 PENDING as of
3101 457 $165,000 8/19/2022 $160,000 96.97% 9 $350.11 1614 457 $159,900 8/22/2022 $148,000 92.56% 31 $323.85
$154,000 94.76% 20 $336.98
3711 645 $249,900 9/26/2022 $246,500 98.64% 46 $382.17 2607 813 $255,000 10/28/2022 $243,000 95.29% 25 $298.89 3208 813 $249,900 7/1/2022 $240,000 96.04% 8 $295.20
3812 647 $235,000 7/29/2022 $238,800 101.62% 2 $369.09 3108 813 $230,000 10/27/2022 $235,000 102.17% 0 $289.05 3302 625 $240,000 10/21/2022 $231,000 96.25% 32 $369.60 2512 772 $220,000 9/9/2022 $230,000 104.55% 30 $297.93 912 772 $230,000 8/25/2022 $226,000 98.26% 11 $292.75 2711 645 $224,900 8/24/2022 $225,000 100.04% 5 $348.84 2404 646 $223,000 9/2/2022 $225,000 100.90% 13 $348.30 2713 625 $245,000 12/5/2022 $224,000 91.43% 50 $358.40 2510 645 $224,500 8/16/2022 $217,000 96.66% 28 $336.43 811 645 $211,000 7/26/2022 $211,000 100.00% 13 $327.13 1110 645 $230,000 12/12/2022 $205,000 89.13% 77 $317.83 1210 646 $230,000 8/16/2022 $235,000 102.17 7 $363.78
$228,820 98.21% 23 $333.03
12 Unit Number Square Feet Original List Price Close Date Sold Price Sold Price/ Original List Price Total Days on Market Sold Price per Square Foot
July - December 2022 AVERAGE
January - June 2022 AVERAGE
CLOSED - STUDIO July - December 2022 Unit Number Square Feet Original List Price Close Date Sold Price Sold Price/ Original List Price Total Days on Market Sold Price per Square Foot
$161,633 100.02% 10 $353.68
July - December 2022 AVERAGE
January - June 2022 AVERAGE
CLOSED - 1 BEDROOM July - December 2022
$213,750 101.53% 14 $318.77
13 Unit Number Square Feet Original List Price Close Date Sold Price Sold Price/ Original List Price Total Days on Market Sold Price per Square Foot
$350,000 12/22/2022 $355,000
$395,000 7/25/2022 $340,000
July - December 2022 AVERAGE $347,500
33
January - June 2022 AVERAGE $345,900
52
CLOSED - 2 BEDROOM July - December 2022
1609 1,028
101.43% 8 $345.33 1509 1,028
86.08% 58 $330.74
93.75%
$338.04
100.32%
$284.60

14 805 PEACHTREE 805 Peachtree St NE Atlanta, GA 30308 Unit Number Square Feet Beds Baths List Date Original List Price List Price List Price per Square Foot 515 1,190 1 1 11/22/2022 $320,000 $320,000 $268.91 PENDING as of 12/31/2022 Average Sold Price Per Square Foot: $306.27 Unit Number Square Feet Original List Price Close Date Sold Price Sold Price/ Original List Price Total Days on Market Sold Price per Square Foot L02 1,162 $379,900 11/7/2022 $370,000 97.39% 2 $318.42 July - December 2022 AVERAGE $370,000 97.39% 2 $318.42 January - June 2022 AVERAGE $329,125 105.99% 2 $312.77 CLOSED - 1 BEDROOM July - December 2022 Unit Number Square Feet Beds Baths List Date Original List Price List Price List Price per Square Foot 320 1,600 2 2 10/24/2022 $599,000 $599,000 $374.38 409 1,010 1 1 12/6/2022 $310,000 $310,000 $306.93 514 1,100 1 1 12/7/2022 $299,900 $299,000 $271.82 ACTIVE as of 12/31/2022
15 Unit Number Square Feet Original List Price Close Date Sold Price Sold Price/ Original List Price Total Days on Market Sold Price per Square Foot 216 1,445 $445,000 11/10/2022 $425,000 95.51% 157 $294.12 July - December 2022 AVERAGE $425,000 95.51% 157 $294.12 January - June 2022 AVERAGE $470,000 98.89% 16 $321.18 CLOSED - 2 BEDROOM July - December 2022

16 Unit Number Square Feet Beds Baths List Date Original List Price List Price List Price per Square Foot 303 1,432 2 2 10/11/2022 $949,900 $949,900 $663.34 805 1,889 3 2 10/3/2022 $799,999 $780,000 $412.92 ACTIVE as of 12/31/2022 905 JUNIPER 905 Juniper St NE Atlanta, GA 30309 Unit Number Square Feet Original List Price Close Date Sold Price Sold Price/ Original List Price Total Days on Market Sold Price per Square Foot 506 730 $349,000 10/27/2022 $335,000 95.99% 14 $458.90 July - December 2022 AVERAGE $335,000 95.99% 14 $458.90 January - June 2022 AVERAGE $381,340 100.00% 12 $475.27 CLOSED - 1 BEDROOM July - December 2022 Average Sold Price Per Square Foot: $458.90 NO PENDINGS as of 12/31/2022

17 Unit Number Square Feet Beds Baths List Date Original List Price List Price List Price per Square Foot
3
ACTIVE as of 12/31/2022 40 WEST 12TH 40 W 12th St NE Atlanta, GA 30309 Average Sold Price Per Square Foot: $780.74 Unit Number Square Feet Beds Baths List Date Original List Price List Price List Price per Square Foot 903 1,970 2 2 7/22/2022 $1,459,000 $1,390,900 $706.04 PENDING as of 12/31/2022 *NEW CONSTRUCTION BUILDING
1906 2,537 4
8/24/2022 $2,638,797 $2,638,797 $1,040.12 1605 2,547 3 3 8/24/2022 $2,138,707 $2,138,707 $839.70 1205 2,547 3 3 7/1/2022 $2,020,764 $2,020,764 $793.39 1006 2,537 4 3 7/1/2022 $1,982,904 $1,982,904 $781.59 1804 2,352 3 3 12/1/2022 $1,902,821 $1,902,821 $809.02 1002 1,652 2 2 9/16/2022 $1,350,000 $1,350,000 $817.19 1602 1,652 2 2 9/27/2022 $1,330,361 $1,330,361 $805.30 1102 1,652 2 2 12/1/2022 $1,228,556 $1,228,556 $743.68 803 936 1 1 9/16/2022 $715,000 $695,000 $742.52
18 Unit Number Square Feet Original List Price Close Date Sold Price Sold Price/ Original List Price Total Days on Market Sold Price per Square Foot 1702 1,652 $1,355,736 11/4/2022 $1,355,736
90
July - December 2022 AVERAGE $1,355,736
90
January - June 2022 AVERAGE $1,405,979
113.50
CLOSED - 2 BEDROOM July - December 2022 Unit Number Square Feet Original List Price Close Date Sold Price Sold Price/ Original List Price Total Days on Market Sold Price per Square Foot 1604 2,352 $1,853,796 9/26/2022 $1,853,796 100.00% 0 $788.18 1203 2,071 $1,584,009 9/1/2022 $1,584,009
22
1103 2,071 $1,551,732 8/18/2022 $1,551,732
0
July - December 2022 AVERAGE $1,663,179
7
January - June 2022 AVERAGE $2,043,808
8
CLOSED - 3 BEDROOM July - December 2022 *New construction buildings may have more sales than reported in FMLS
100.00%
$820.66
100.00%
$820.66
104.51%
$768.02
100.00%
$764.85
100.00%
$749.27
100.00%
$767.43
101.08%
$871.59

19 ABOVE THE FOUR SEASONS 75 14th St NW Atlanta, GA 30309 Unit Number Square Feet Beds Baths List Date Original List Price List Price List Price per Square Foot 3520 1,642 1 1 8/26/2022 $850,000 $850,000 $517.66 ACTIVE as of 12/31/2022 Unit Number Square Feet Beds Baths List Date Original List Price List Price List Price per Square Foot 3720 1,642 2 2 9/7/2022 $950,000 $950,000 $578.56 4420 2,090 3 3 10/27/2022 $1,150,000 $1,150,000 $550.24 PENDING as of 12/31/2022 NO CLOSED SALES as of July - December 2022 Average Sold Price Per Square Foot: N/A

20 ANSLEY ABOVE THE PARK 1130 Piedmont Ave NE Atlanta, GA 30309 Average Sold Price Per Square Foot: $404.50 Unit Number Square Feet Beds Baths List Date Original List Price List Price List Price per Square Foot 613 1,550 2 2 11/2/2022 $695,000 $695,000 $448.39 ACTIVE as of 12/31/2022 Unit Number Square Feet Beds Baths List Date Original List Price List Price List Price per Square Foot 405 790 1 1 9/30/2022 $337,000 $329,000 $416.46 PENDING as of 12/31/2022 Unit Number Square Feet Original List Price Close Date Sold Price Sold Price/ Original List Price Total Days on Market Sold Price per Square Foot 1509 1,110 $499,000 7/22/2022 $475,000 95.19% 53 $427.93 806 1,190 $459,900 8/26/2022 $459,000 99.80% 11 $385.71 1008 1,015 $415,000 7/25/2022 $427,000 102.89% 3 $420.69 508 1,015 $400,000 8/24/2022 $400,000 100.00% 5 $394.09 408 1,015 $399,000 8/12/2022 $400,000 100.25% 18 $394.09 July - December 2022 AVERAGE $432,200 99.63% 18 $404.50 January - June 2022 AVERAGE $538,292 94.22% 51 $392.02 CLOSED - 2 BEDROOM July - December 2022

21 ANSLEY TERRACE 175 15th St NE Atlanta, GA 30309 Unit Number Square Feet Original List Price Close Date Sold Price Sold Price/ Original List Price Total Days on Market Sold Price per Square Foot 119 1,225 $479,900 11/22/2022 $383,000 79.81% 60 $312.65 403 1,170 $579,900 10/18/2022 $500,000 86.22% 97 $427.35 208 1,205 $449,900 8/30/2022 $452,500 100.58% 3 $375.52 July - December 2022 AVERAGE $445,167 88.87% 53 $371.84 January - June 2022 AVERAGE $424,750 96.71% 19 $374.38 CLOSED - 2 BEDROOM July - December 2022 Unit Number Square Feet Beds Baths List Date Original List Price List Price List Price per Square Foot 213 1,170 2 2 11/25/2022 $539,900 $539,900 $461.45 ACTIVE as of 12/31/2022 Average Sold Price Per Square Foot: $371.84 NO PENDINGS as of 12/31/2022

22 AQUA 20 10th St NE Atlanta, GA 30309 NO PENDINGS as of 12/31/2022 Average Sold Price Per Square Foot: $330.62 Unit Number Square Feet Original List Price Close Date Sold Price Sold Price/ Original List Price Total Days on Market Sold Price per Square Foot 902 1,068 $360,000 9/30/2022 $350,000 97.22% 30 $327.72 July - December 2022 AVERAGE $350,000 97.22% 30 $327.72 January - June 2022 AVERAGE $352,500 97.28% 107 $332.55 CLOSED - 1 BEDROOM July - December 2022 Unit Number Square Feet Beds Baths List Date Original List Price List Price List Price per Square Foot 1501 1,478 2 2 12/21/2022 $599,000 $599,000 $405.28 ACTIVE as of 12/31/2022 Unit Number Square Feet Original List Price Close Date Sold Price Sold Price/ Original List Price Total Days on Market Sold Price per Square Foot 1104 1,805 $615,000 10/7/2022 $602,000 97.89% 56 $333.52 July - December 2022 AVERAGE $602,000 97.89% 56 $333.52 January - June 2022 AVERAGE $528,083 95.76% 104 $339.66 CLOSED - 2 BEDROOM July - December 2022

23 THE BELVEDERE 560 Dutch Valley Road NE Atlanta, GA 30324 NO ACTIVES OR PENDINGS as of 12/31/2022 Average Sold Price Per Square Foot: $325.15 Unit Number Square Feet Original List Price Close Date Sold Price Sold Price/ Original List Price Total Days on Market Sold Price per Square Foot 201 1,630 $525,000 10/25/2022 $530,000 100.95% 3 $325.15 July - December 2022 AVERAGE $530,000 100.95% 3 $325.15 January - June 2022 AVERAGE $445,000 102.32% 2 $341.78 CLOSED - 2 BEDROOM July - December 2022

24 THE BELVEDERE - LOFTS AT THE BELVEDERE 560 Dutch Valley Rd NE Atlanta, GA 30324 Unit Number Square Feet Original List Price Close Date Sold Price Sold Price/ Original List Price Total Days on Market Sold Price per Square Foot 2212 960 $349,900 9/12/2022 $345,500 98.74% 10 $359.90 July - December 2022 AVERAGE $345,500 98.74% 10 $359.90 January - June 2022 AVERAGE $316,667 103.31% 34 $329.86 CLOSED - 1 BEDROOM July - December 2022 NO ACTIVES OR PENDINGS as of 12/31/2022 Average Sold Price Per Square Foot: $359.90

25 COLONY PARK CITIHOMES 209 14th St NE & 244 13th St NE Atlanta, GA 30309 Average Sold Price Per Square Foot: $372.43 Unit Number Square Feet Original List Price Close Date Sold Price Sold Price/ Original List Price Total Days on Market Sold Price per Square Foot 301 1,168 $439,000 10/12/2022 $435,000 99.09% 18 $372.43 July - December 2022 AVERAGE $435,000 99.09% 18 $372.43 January - June 2022 AVERAGE $376,250 103.08% 8 $322.13 CLOSED - 2 BEDROOM July - December 2022 Unit Number Square Feet Beds Baths List Date Original List Price List Price List Price per Square Foot 219 912 1 1 10/26/2022 $389,900 $324,900 $356.25 ACTIVE as of 12/31/2022 NO PENDINGS as of 12/31/2022
26 COLONY SQUARE - COLONY HOUSE 145 15th St NE Atlanta, GA 30309 Unit Number Square Feet Beds Baths List Date Original List Price List Price List Price per Square Foot 1033 4,648 *Shell *Shell 7/6/2022 $1,350,000 $1,350,000 $290.45 1237 1,641 2 2 8/24/2022 $649,000 $599,999 $365.63 1012 1,724 3 2 10/12/2022 $539,900 $539,900 $313.17 ACTIVE as of 12/31/2022 Average Sold Price Per Square Foot: $332.09 Unit Number Square Feet Original List Price Close Date Sold Price Sold Price/ Original List Price Total Days on Market Sold Price per Square Foot 207 862 $310,000 12/15/2022 $310,000 100.00% 5 $359.63 424 862 $270,000 7/8/2022 $262,500 97.22% 4 $304.52 July - December 2022 AVERAGE $286,250 98.61% 5 $332.08 January - June 2022 AVERAGE $256,683 98.01% 24 $299.53 CLOSED - 1 BEDROOM July - December 2022 Unit Number Square Feet Beds Baths List Date Original List Price List Price List Price per Square Foot 1404 2,124 2 2 10/21/2022 $725,000 $725,000 $341.34 1402 704 1 1 10/20/2022 $265,000 $265,000 $376.42 PENDING as of 12/31/2022 *Being sold as a shell. It is being combined with 4 additional units
27 Unit Number Square Feet Original List Price Close Date Sold Price Sold Price/ Original List Price Total Days on Market Sold Price per Square Foot 819 1,641 $669,900 8/23/2022 $545,000 81.36% 95 $332.11 July - December 2022 AVERAGE $545,000 81.36% 95 $332.11 January - June 2022 AVERAGE $453,300 97.02% 456 $284.62 CLOSED - 2 BEDROOM July - December 2022

28 COLONY SQUARE - HANOVER HOUSE 147 15th St NE Atlanta, GA 30309 Unit Number Square Feet Beds Baths List Date Original List Price List Price List Price per Square Foot 16D 1,980 2 2 12/30/2022 $795,000 $795,000 $401.52 ACTIVE as of 12/31/2022 Unit Number Square Feet Beds Baths List Date Original List Price List Price List Price per Square Foot 5D 1,946 2 2 10/24/2022 $800,000 $775,000 $398.25 PENDING as of 12/31/2022 NO CLOSED SALES as of July - December 2022 Average Sold Price Per Square Foot: N/A

29 CORNERSTONE - NEEL REID BUILDING 800 Peachtree St NE Atlanta, GA 30308 Average Sold Price Per Square Foot: N/A NO ACTIVES OR PENDINGS as of 12/31/2022 NO CLOSED SALES - July - December 2022

30 CORNERSTONE - LOFTS BUILDING 800 Peachtree St NE Atlanta, GA 30309 Unit Number Square Feet Beds Baths List Date Original List Price List Price List Price per Square Foot 8417 1,187 2 2 12/29/2022 $399,900 $399,900 $336.90 8408 699 1 1 11/22/2022 $230,000 $230,000 $329.04 ACTIVE as of 12/31/2022 Unit Number Square Feet Beds Baths List Date Original List Price List Price List Price per Square Foot 8604 1,072 2 2 11/10/2022 $325,000 $325,000 $303.17 PENDING as of 12/31/2022 Average Sold Price Per Square Foot: $296.46 Unit Number Square Feet Original List Price Close Date Sold Price Sold Price/ Original List Price Total Days on Market Sold Price per Square Foot 8529 1,004 $289,000 12/8/2022 $289,000 100.00% 6 $287.85 8429 1,004 $275,000 9/30/2022 $270,000 98.18% 63 $268.92 July - December 2022 AVERAGE $279,500 99.09% 35 $278.39 January - June 2022 AVERAGE $279,380 102.93% 8 $322.37 CLOSED - 1 BEDROOM July - December 2022
31 Unit Number Square Feet Original List Price Close Date Sold Price Sold Price/ Original List Price Total Days on Market Sold Price per Square Foot
- December 2022 AVERAGE
2022 AVERAGE
CLOSED - 2 BEDROOM July - December 2022
8531 1,399 $405,000 10/31/2022 $405,000 100.00% 5 $289.49 8517 1,187 $399,900 11/2/2022 $385,000 96.27% 54 $324.35 8427 1,187 $391,900 11/30/2022 $370,000 94.41% 61 $311.71 July
$386,667 96.90% 40 $308.52 January - June
$359,800 101.99% 54 $311.67

32 CORNERSTONENEWER BUILDING 800 Peachtree St NE Atlanta, GA 30308 Unit Number Square Feet Beds Baths List Date Original List Price List Price List Price per Square Foot 2305 775 1 1 12/19/2022 $263,000 $263,000 $339.35 1126 775 1 1 12/21/2022 $250,000 $250,000 $322.58 1314 775 1 1 11/2/2022 $245,000 $245,000 $316.13 ACTIVE as of 12/31/2022 Average Sold Price Per Square Foot: $331.15 Unit Number Square Feet Original List Price Close Date Sold Price Sold Price/ Original List Price Total Days on Market Sold Price per Square Foot 1205 775 $269,000 7/18/2022 $280,000 104.09% 4 $361.29 1514 775 $270,000 7/8/2022 $273,500 101.30% 3 $352.90 1312 775 $275,000 9/22/2022 $270,000 98.18% 17 $348.39 1517 775 $264,900 11/17/2022 $255,000 96.26% 42 $329.03 1422 775 $275,000 11/18/2022 $250,000 90.91% 78 $322.58 July - December 2022 AVERAGE $265,700 98.15% 29 $342.84 January - June 2022 AVERAGE $253,400 102.73% 16 $326.97 CLOSED - 1 BEDROOM July - December 2022 Unit Number Square Feet Beds Baths List Date Original List Price List Price List Price per Square Foot 1224 775 1 1 11/3/2022 $259,000 $259,000 $334.19 PENDING as of 12/31/2022
33 Unit Number Square Feet Original List Price Close Date Sold Price Sold Price/ Original List Price Total Days on Market Sold Price per Square Foot 1416 1,181 $369,900 8/10/2022 $365,000 98.68% 15 $309.06 1107 1,094 $330,000 9/2/2022 $322,500 97.73% 62 $294.79 July - December 2022 AVERAGE $343,750 98.20% 39 $301.92 January - June 2022 AVERAGE $325,000 102.20% 3 $297.07 CLOSED - 2 BEDROOM July - December 2022

34 COTTING COURT 77 Peachtree Pl NE Atlanta, GA 30309 Unit Number Square Feet Beds Baths List Date Original List Price List Price List Price per Square Foot 419 1,248 2 2 12/31/2022 $515,000 $515,000 $412.66 ACTIVE as of 12/31/2022 NO PENDINGS as of 12/31/2022 Average Sold Price Per Square Foot: $439.38 Unit Number Square Feet Original List Price Close Date Sold Price Sold Price/ Original List Price Total Days on Market Sold Price per Square Foot 317 911 $399,000 7/27/2022 $420,000 105.26% 21 $461.03 July - December 2022 AVERAGE $420,000 105.26% 21 $461.03 January - June 2022 AVERAGE N/A N/A N/A N/A CLOSED - 1 BEDROOM July - December 2022 Unit Number Square Feet Original List Price Close Date Sold Price Sold Price/ Original List Price Total Days on Market Sold Price per Square Foot 508 1,580 $675,000 9/23/2022 $660,000 97.78% 33 $417.72 July - December 2022 AVERAGE $660,000 97.78% 33 $417.72 January - June 2022 AVERAGE $508,333 97.64% 47 $390.95 CLOSED - 2 BEDROOM July - December 2022

35 THE DAKOTA CONDO FLATS 850 Piedmont Avenue NE Atlanta, GA 30308 NO ACTIVES OR PENDINGS as of 12/31/2022 Unit Number Square Feet Original List Price Close Date Sold Price Sold Price/ Original List Price Total Days on Market Sold Price per Square Foot 1609 970 $449,900 12/2/2022 $440,000 97.80% 18 $453.61 July - December 2022 AVERAGE $440,000 97.80% 18 $453.61 January - June 2022 AVERAGE N/A N/A N/A N/A CLOSED - 1 BEDROOM July - December 2022 Average Sold Price Per Square Foot: $423.84 Unit Number Square Feet Original List Price Close Date Sold Price Sold Price/ Original List Price Total Days on Market Sold Price per Square Foot 1405 1,586 $625,000 12/21/2022 $625,000 100.00% 22 $394.07 July - December 2022 AVERAGE $625,000 100.00% 22 $394.07 January - June 2022 AVERAGE $600,625 100.66% 11 $392.09 CLOSED - 2 BEDROOM July - December 2022

36 THE DAKOTA TOWNHOMES 850 Piedmont Avenue NE Atlanta, GA 30308 Unit Number Square Feet Original List Price Close Date Sold Price Sold Price/ Original List Price Total Days on Market Sold Price per Square Foot 3312 2,442 $764,000 11/18/2022 $764,000 100.00% 8 $312.86 3318 2,442 $739,900 7/15/2022 $739,900 100.00% 5 $302.99 3311 2,442 $724,900 11/23/2022 $649,900 89.65% 74 $266.13 3107 1,652 $650,000 7/20/2022 $625,000 96.15% 13 $378.33 3315 1,704 $635,000 11/29/2022 $584,500 92.05% 55 $343.02 July - December 2022 AVERAGE $672,660 95.57% 31 $320.67 January - June 2022 AVERAGE $595,167 97.57% 23 $340.82 CLOSED - 2 BEDROOM July - December 2022 Average Sold Price Per Square Foot: $320.67 NO ACTIVES OR PENDINGSas of 12/31/2022
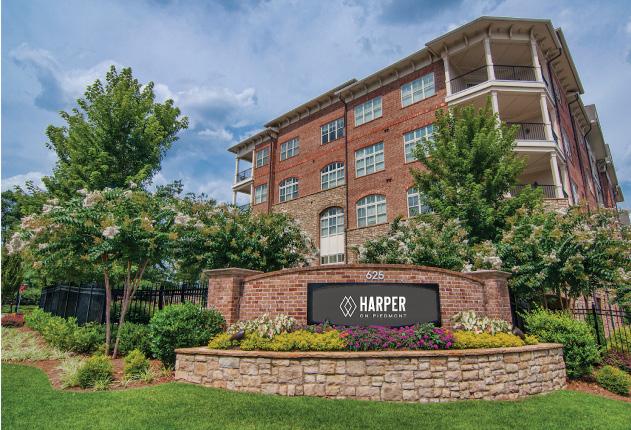
37 HARPER ON PIEDMONT 625 Piedmont Ave NE Atlanta, GA 30308 Unit Number Square Feet Original List Price Close Date Sold Price Sold Price/ Original List Price Total Days on Market Sold Price per Square Foot 1029 916 $399,000 11/7/2022 $395,000 99.00% 7 $431.22 July - December 2022 AVERAGE $395,000 99.00% 7 $431.22 January - June 2022 AVERAGE $315,000 100.00% 217 $439.94 CLOSED - 1 BEDROOM July - December 2022 NO PENDINGS as of 12/31/2022 Average Sold Price Per Square Foot: $431.22 Unit Number Square Feet Beds Baths List Date Original List Price List Price List Price per Square Foot 1026 916 1 1 11/9/2022 $399,000 $389,000 $424.67 ACTIVE as of 12/31/2022

38 Unit Number Square Feet Beds Baths List Date Original List Price List Price List Price per Square Foot
ACTIVE as of 12/31/2022 J-5 775 Juniper St NE Atlanta, GA 30308 NO PENDINGS as of 12/31/2022 Average Sold Price Per Square Foot: $526.49
602 1,389 2 2 7/27/2022 $815,000 $805,000 $579.55 617 1,424 2 2 12/5/2022 $804,900 $804,900 $565.24 307 1,422 2 2 11/21/2022 $722,400 $722,400 $508.02 406 1,387 2 2 7/15/2022 $719,900 $719,900 $519.03 610 1,329 2 2 10/24/2022 $714,900 $714,900 $537.92 615 1,282 2 2 12/13/2022 $679,900 $679,900 $530.34 611 1,282 2 2 10/24/2022 $674,900 $674,900 $526.44 220 1,224 2 2 7/18/2022 $599,900 $599,900 $490.11 334 703 1 1 9/30/2022 $374,900 $374,900 $533.29 234 800 1 1 6/23/2022 $399,900 $359,000 $448.75
39 Unit Number Square Feet Original List Price Close Date Sold Price Sold Price/ Original List Price Total Days on Market Sold Price per Square Foot 521 1,388 $734,900 7/18/2022 $734,900 100.00% 0 $529.47 520 1,388 $719,900 7/7/2022 $719,000 99.87% 0 $518.01 322 1,386 $700,543 9/6/2022 $700,543 100.00% 0 $505.44 July - December 2022 AVERAGE $718,148 99.96% 0 $517.64 January - June 2022 AVERAGE $696,481 99.91% 28 $509.01 CLOSED - 2 BEDROOM July - December 2022 Unit Number Square Feet Original List Price Close Date Sold Price Sold Price/ Original List Price Total Days on Market Sold Price per Square Foot 501 1,181 $675,000 9/1/2022 $675,000 100.00% 2 $571.55 119 925 $464,900 9/14/2022 $469,900 101.08% 285 $508.00 July - December 2022 AVERAGE $572,450 100.54% 144 $539.77 January - June 2022 AVERAGE $502,960 99.74% 1 $504.19 CLOSED - 1 BEDROOM July - December 2022

40 LOFTS AT THE PARK I 206 11th St NE Atlanta, GA 30309 Unit Number Square Feet Original List Price Close Date Sold Price Sold Price/ Original List Price Total Days on Market Sold Price per Square Foot 303 1,287 $477,000 7/1/2022 $480,000 100.63% 4 $372.96 July - December 2022 AVERAGE $480,000 100.63% 4 $372.96 January - June 2022 AVERAGE $494,000 99.67% 10 $419.50 CLOSED - 1 BEDROOM July - December 2022 NO ACTIVES OR PENDINGS as of 12/31/2022 Average Sold Price Per Square Foot: $372.96

41 LOFTS AT THE PARK II 1058 Piedmont Ave NE Atlanta, GA 30309 Unit Number Square Feet Original List Price Close Date Sold Price Sold Price/ Original List Price Total Days on Market Sold Price per Square Foot 302 1,032 $425,000 7/21/2022 $420,000 98.82% 0 $406.98 July - December 2022 AVERAGE $420,000 98.82% 0 $406.98 January - June 2022 AVERAGE N/A N/A N/A N/A CLOSED - 1 BEDROOM July - December 2022 NO ACTIVES OR PENDINGS as of 12/31/2022 Average Sold Price Per Square Foot: $406.98

42 LUXE 222 12th St NE Atlanta, GA 30309 Unit Number Square Feet Original List Price Close Date Sold Price Sold Price/ Original List Price Total Days on Market Sold Price per Square Foot 1005 1,005 $449,000 8/22/2022 $445,000 99.11% 41 $442.79 July - December 2022 AVERAGE $445,000 99.11% 41 $442.79 January - June 2022 AVERAGE $348,000 100.87% 1 $351.87 CLOSED - 1 BEDROOM July - December 2022 Average Sold Price Per Square Foot: $483.78 Unit Number Square Feet Beds Baths List Date Original List Price List Price List Price per Square Foot 902 1,598 2 2 11/10/2022 $740,000 $740,000 $463.08 ACTIVE as of 12/31/2022 NO PENDINGS as of 12/31/2022
806 1,820 $1,125,000 10/28/2022 $1,085,000 96.44% 4 $596.15 1207 1,727 $825,000 12/12/2022 $790,000 95.76% 53 $457.44 907 1,727 $809,900 10/21/2022 $748,500 92.42% 28 $433.41 1908 1,329 $679,000 8/4/2022 $650,000 95.73% 52 $489.09 July -
43 Unit Number Square Feet Original List Price Close Date Sold Price Sold Price/ Original List Price Total Days on Market Sold Price per Square Foot
CLOSED - 2 BEDROOM July - December 2022
December 2022 AVERAGE $818,375 95.09% 34 $494.02 January - June 2022 AVERAGE $830,000 97.66% 9 $480.60

44 MAYFAIR RENAISSANCE 195 14th St Atlanta, GA 30309 NO ACTIVES OR PENDINGS as of 12/31/2022 Average Sold Price Per Square Foot: $433.08 Unit Number Square Feet Original List Price Close Date Sold Price Sold Price/ Original List Price Total Days on Market Sold Price per Square Foot 501 627 $245,900 7/6/2022 $257,500 104.72% 4 $410.69 July - December 2022 AVERAGE $257,500 104.72% 4 $410.69 January - June 2022 AVERAGE $272,000 108.80% 3 $392.50 CLOSED - 1 BEDROOM July - December 2022 Unit Number Square Feet Original List Price Close Date Sold Price Sold Price/ Original List Price Total Days on Market Sold Price per Square Foot PH206 1,738 $768,000 12/28/2022 $750,000 97.66% 107 $431.53 1804 1,401 $515,000 11/21/2022 $500,000 97.09% 90 $356.89 2305 1,122 $449,900 7/20/2022 $450,000 100.02% 16 $401.07 July - December 2022 AVERAGE $566,667 98.26% 71 $396.50 January - June 2022 AVERAGE $544,071 97.71% 16 $380.06 CLOSED - 2 BEDROOM July - December 2022
45 Unit Number Square Feet Original List Price Close Date Sold Price Sold Price/ Original List Price Total Days on Market Sold Price per Square Foot TS7 2,300 $1,499,000 10/11/2022 $1,300,000 86.72% 179 $565.22 July - December 2022 AVERAGE $1,300,000 86.72% 179 $565.22 January - June 2022 AVERAGE N/A N/A N/A N/A CLOSED - 3 BEDROOM July - December 2022

46 MAYFAIR TOWER 199 14th St NE Atlanta, GA 30309 Unit Number Square Feet Beds Baths List Date Original List Price List Price List Price per Square Foot 902 1,215 2 2 10/15/2022 $455,000 $455,000 $374.49 PENDING as of 12/31/2022 Average Sold Price Per Square Foot: $377.39 Unit Number Square Feet Beds Baths List Date Original List Price List Price List Price per Square Foot 1412 533 1 1 12/21/2022 $280,000 $280,000 $525.33 ACTIVE as of 12/31/2022 Unit Number Square Feet Original List Price Close Date Sold Price Sold Price/ Original List Price Total Days on Market Sold Price per Square Foot 2703 1,237 $500,000 7/18/2022 $450,000 90.00% 59 $363.78 1504 750 $299,000 9/23/2022 $295,000 98.66% 5 $393.33 2004 750 $299,900 9/27/2022 $294,000 98.03% 6 $392.00 1606 750 $289,000 11/21/2022 $285,000 98.62% 8 $380.00 July - December 2022 AVERAGE $331,000 96.33% 20 $382.28 January - June 2022 AVERAGE $270,833 98.99% 12 $378.03 CLOSED - 1 BEDROOM July - December 2022
47 Unit Number Square Feet Original List Price Close Date Sold Price Sold Price/ Original List Price Total Days on Market Sold Price per Square Foot
July - December 2022 AVERAGE
January - June 2022 AVERAGE
CLOSED - 2 BEDROOM July - December 2022
908 1,007 $375,000 10/20/2022 $375,000 100.00% 11 $372.39 1410 919 $399,999 9/14/2022 $375,000 93.75% 8 $408.05 808 1,007 $375,000 12/15/2022 $368,000 98.13% 28 $365.44 1808 1,007 $359,900 9/27/2022 $365,000 101.42% 6 $362.46 210 919 $353,000 8/26/2022 $330,000 93.48% 25 $359.09
$362,600 97.36% 16 $373.49
$367,667 100.25% 5 $354.02

48 METROPOLIS 923 & 943 Peachtree St NE Atlanta, GA 30309 Unit Number Square Feet Beds Baths List Date Original List Price List Price List Price per Square Foot 1126 1,260 2 2 9/28/2022 $499,000 $489,000 $388.10 ACTIVE as of 12/31/2022 Unit Number Square Feet Beds Baths List Date Original List Price List Price List Price per Square Foot 1807 696 1 1 10/19/2022 $300,000 $300,000 $431.03 PENDING as of 12/31/2022 Average Sold Price Per Square Foot: $410.71
1703 696 $300,000 12/30/2022 $303,000 101.00% 33 $435.34
1901 926 $369,900 8/26/2022 $370,000 100.03% 4 $399.57 1704 768 $379,000 7/29/2022 $361,000 95.25% 22 $470.05
1507 696 $400,000 10/4/2022 $339,000 84.75% 102 $487.07 1815 851 $360,000 12/8/2022 $335,000 93.06% 27 $393.65 807 696 $320,000 12/12/2022 $306,500 95.78% 50 $440.37 903 696 $300,000 7/29/2022 $300,000 100.00% 9 $431.03 1404 768 $328,900 12/14/2022 $290,000 88.17% 65 $377.60
1423 696 $289,000 7/21/2022 $289,000 100.00% 7 $415.23 1207 696 $285,000 7/18/2022 $285,000 100.00% 5 $409.48 1109 668 $275,000 9/30/2022 $275,000 100.00% 37 $411.68 1829 668 $279,900 9/30/2022 $274,900 98.21% 39 $411.53 1725 754 $299,900 9/28/2022 $270,000 90.03% 66 $358.09 1129 668 $270,000 9/13/2022 $265,000 98.15% 38 $396.71 736 665 $269,000 11/30/2022 $255,000 94.80% 81 $383.46
$301,227 95.95% 39 $414.72
49
Number Square Feet Original List Price Close Date Sold Price Sold Price/ Original List Price Total Days on Market Sold Price per Square Foot
Unit
- December 2022 AVERAGE
January - June 2022 AVERAGE
CLOSED - 1 BEDROOM July - December 2022 Unit Number Square Feet Original List Price Close Date Sold Price Sold Price/ Original List Price Total Days on Market Sold Price per Square Foot
July - December 2022 AVERAGE
January - June 2022 AVERAGE
CLOSED - 2 BEDROOM July - December 2022
July
$315,925 101.37% 11 $417.43
1506 1,260 $509,000 9/29/2022 $509,000 100.00% 13 $403.97 1106 1,260 $510,000 10/3/2022 $500,000 98.04% 37 $396.83 926 1,260 $485,000 12/12/2022 $467,500 96.39% 47 $371.03
$492,167 98.14% 32 $390.61
$466,214 99.90% 41 $430.07

50 MIDCITY LOFTS 845 Spring St NW Atlanta, GA 30308 Unit Number Square Feet Beds Baths List Date Original List Price List Price List Price per Square Foot PH 8 2,080 2 2 10/20/2022 $725,000 $689,900 $331.68 515 1,190 1 1 11/4/2022 $465,000 $465,000 $390.76 108 800 1 1 11/10/2022 $324,000 $324,000 $405.00 ACTIVE as of 12/31/2022 Unit Number Square Feet Beds Baths List Date Original List Price List Price List Price per Square Foot 414 1,225 2 2 8/1/2022 $475,000 $475,000 $387.76 PENDING as of 12/31/2022 Average Sold Price Per Square Foot: $423.03 Unit Number Square Feet Original List Price Close Date Sold Price Sold Price/ Original List Price Total Days on Market Sold Price per Square Foot 217 760 $320,000 12/20/2022 $321,500 100.47% 5 $423.03 July - December 2022 AVERAGE $321,500 100.47% 5 $423.03 January - June 2022 AVERAGE $386,384 101.51% 203 $355.41 CLOSED - 1 BEDROOM July - December 2022

51 ONE MUSEUM PLACE 1301 Peachtree St NE Atlanta, GA 30309 Unit Number Square Feet Beds Baths List Date Original List Price List Price List Price per Square Foot 5L 4,840 3 3 7/20/2022 $5,000,000 $4,500,000 $929.75 2-B 4,536 3 3 8/11/2022 $3,500,000 $3,500,000 $771.60 1-B 2,171 2 2 10/14/2022 $1,590,000 $1,590,000 $732.38 ACTIVE as of 12/31/2022 Average Sold Price Per Square Foot: $727.27 Unit Number Square Feet Original List Price Close Date Sold Price Sold Price/ Original List Price Total Days on Market Sold Price per Square Foot 4H 3,300 $2,575,000 8/18/2022 $2,400,000 93.20% 333 $727.27 July - December 2022 AVERAGE $2,400,000 93.20% 333 $727.27 January - June 2022 AVERAGE N/A N/A N/A N/A CLOSED - 3 BEDROOM July - December 2022 NO PENDINGS as of 12/31/2022

52 PARC VUE 275 13th St NE Atlanta, GA 30309 Unit Number Square Feet Beds Baths List Date Original List Price List Price List Price per Square Foot 805 780 1 1 9/10/2022 $340,000 $330,000 $423.08 706 765 1 1 11/10/2022 $285,000 $282,000 $368.63 ACTIVE as of 12/31/2022 NO PENDINGS as of 12/31/2022 Unit Number Square Feet Original List Price Close Date Sold Price Sold Price/ Original List Price Total Days on Market Sold Price per Square Foot 1104 765 $319,900 8/19/2022 $325,000 101.59% 12 $424.84 July - December 2022 AVERAGE $325,000 101.59% 12 $424.84 January - June 2022 AVERAGE $304,500 102.32% 5 $382.59 CLOSED - 1 BEDROOM July - December 2022 Average Sold Price Per Square Foot: $383.06
53 Unit Number Square Feet Original List Price Close Date Sold Price Sold Price/ Original List Price Total Days on Market Sold Price per Square Foot 101 1,125 $429,000 7/15/2022 $445,000
3
1112 1,225 $435,000 8/8/2022 $442,000
6
912 1,225 $435,000 12/12/2022 $430,000
8
July - December 2022 AVERAGE $439,000
6
January - June 2022 AVERAGE $412,500
CLOSED - 2 BEDROOM July - December 2022
103.73%
$395.56
101.61%
$360.82
98.85%
$351.02
101.40%
$369.13
103.75% 9 $371.01

54 PARK CENTRAL 1101 Juniper St NE Atlanta, GA 30309 NO ACTIVES as of 12/31/2022 Unit Number Square Feet Beds Baths List Date Original List Price List Price List Price per Square Foot 304 1,161 2 2 12/16/2022 $425,000 $425,000 $366.06 610 868 1 1 11/11/2022 $309,900 $309,900 $357.03 PENDING as of 12/31/2022 Average Sold Price Per Square Foot: $363.13 Unit Number Square Feet Original List Price Close Date Sold Price Sold Price/ Original List Price Total Days on Market Sold Price per Square Foot 202 1,008 $369,000 8/5/2022 $369,900 100.24% 15 $366.96 1210 868 $320,000 10/31/2022 $320,000 100.00% 15 $368.66 822 764 $300,000 9/7/2022 $320,000 106.67% 7 $418.85 920 764 $305,000 12/14/2022 $290,000 95.08% 61 $379.58 622 764 $269,900 8/29/2022 $280,000 103.74% 4 $366.49 529 764 $285,000 9/8/2022 $279,900 98.21% 26 $366.36 206 764 $285,000 10/7/2022 $275,000 96.49% 36 $359.95 July - December 2022 AVERAGE $304,971 100.06% 23 $375.27 January - June 2022 AVERAGE $299,273 104.14% 13 $372.31 CLOSED - 1 BEDROOM July - December 2022
911 1,169 $400,000 8/3/2022 $405,000 101.25% 4 $346.45 519 1,169 $400,000 9/21/2022 $400,000 100.00% 11 $342.17 211 1,158 $389,900 9/26/2022 $395,000 101.31% 52 $341.11 623 1,169 $405,000 7/15/2022 $395,000 97.53% 33 $337.90
55 Unit Number Square Feet Original List Price Close Date Sold Price Sold Price/ Original List Price Total Days on Market Sold Price per Square Foot
2022 AVERAGE
AVERAGE
CLOSED - 2 BEDROOM July - December 2022
July - December
$398,750 100.02% 25 $341.91 January - June 2022
$380,071 104.62% 21 $329.43

56 PEACHTREE LOFTS 878 Peachtree St NE Atlanta, GA 30309 Unit Number Square Feet Beds Baths List Date Original List Price List Price List Price per Square Foot 406 1,120 1 1 11/15/2022 $389,900 $389,900 $348.13 826 515 1 1 10/5/2022 $219,900 $209,000 $405.83 ACTIVE as of 12/31/2022 PENDING as of 12/31/2022 Average Sold Price Per Square Foot: $352.83 Unit Number Square Feet Beds Baths List Date Original List Price List Price List Price per Square Foot 523 515 1 1 12/19/2022 $235,000 $235,000 $456.31
57 Unit Number Square Feet Original List Price Close Date Sold Price Sold Price/ Original List Price Total Days on Market Sold Price per Square Foot
July - December
-
CLOSED - 2 BEDROOM July - December 2022 Unit Number Square Feet Original List Price Close Date Sold Price Sold Price/ Original List Price Total Days on Market Sold Price per Square Foot
- December
- June 2022
CLOSED - 1 BEDROOM July - December 2022
512 1,070 $354,000 12/30/2022 $345,000 97.46% 5 $322.43 513 954 $339,000 12/27/2022 $333,500 98.38% 32 $349.58
2022 AVERAGE $339,250 97.92% 19 $336.01 January
June 2022 AVERAGE $325,000 100.00% 63 $340.67
604 1,265 $399,900 10/14/2022 $388,000 97.02% 7 $306.72 628 1,138 $379,000 7/7/2022 $379,000 100.00% 4 $333.04 632 956 $375,000 9/29/2022 $375,000 100.00% 4 $392.26 533 956 $355,000 11/9/2022 $355,000 100.00% 29 $371.34 832 956 $329,900 8/15/2022 $327,000 99.12% 7 $342.05 501 954 $279,900 10/28/2022 $270,000 96.46% 13 $283.02 519 954 $270,000 11/4/2022 $270,000 100.00% 2 $283.02 626 515 $235,000 11/17/2022 $225,000 95.74% 9 $436.89 423 515 $219,000 9/16/2022 $219,000 100.00% 11 $425.24 723 515 $200,000 7/20/2022 $200,000 100.00% 9 $388.35 July
2022 AVERAGE $300,800 98.84% 10 $356.19 January
AVERAGE $297,300 98.89% 36 $338.36

58 PEACHTREE WALK 1074 & 1075 Peachtree Walk NE Atlanta, GA 30309 NO PENDINGS as of 12/31/2022 Unit Number Square Feet Original List Price Close Date Sold Price Sold Price/ Original List Price Total Days on Market Sold Price per Square Foot B105 730 $249,000 8/5/2022 $240,000 96.39% 14 $328.77 A102 730 $240,000 11/3/2022 $230,000 95.83% 5 $315.07 July - December 2022 AVERAGE $235,000 96.11% 10 $321.92 January - June 2022 AVERAGE $251,080 102.11% 12 $337.05 CLOSED - 1 BEDROOM July - December 2022 Average Sold Price Per Square Foot: $321.25 Unit Number Square Feet Beds Baths List Date Original List Price List Price List Price per Square Foot B206 1,119 2 2 8/27/2022 $398,900 $389,000 $347.63 B504 1,000 2 2 7/19/2022 $374,900 $369,900 $369.90 A310 1,119 2 2 10/19/2022 $362,500 $362,500 $323.95 A411 730 1 1 12/1/2022 $265,000 $265,000 $363.01 A402 730 1 1 10/30/2022 $260,000 $260,000 $356.16 ACTIVE as of 12/31/2022
59 Unit Number Square Feet Original List Price Close Date Sold Price Sold Price/ Original List Price Total Days on Market Sold Price per Square Foot B106 1,119 $358,000 10/25/2022 $358,000 100.00% 10 $319.93 July - December 2022 AVERAGE $358,000 100.00% 10 $319.93 January - June 2022 AVERAGE $345,878 102.46% 7 $318.28 CLOSED - 2 BEDROOM July - December 2022

60 PIEDMONT CREST 1055 Piedmont Ave NE Atlanta, GA 30309 NO CLOSED SALES July - December 2022 Average Sold Price Per Square Foot: N/A NO ACTIVES OR PENDINGS as of 12/31/2022

61 PLAZA MIDTOWN 44 Peachtree Pl NW & 950 W Peachtree St NW Atlanta, GA 30309 Unit Number Square Feet Beds Baths List Date Original List Price List Price List Price per Square Foot 2009 1,512 2 2 12/14/2022 $620,000 $620,000 $410.05 1203 1,260 2 2 11/4/2022 $550,000 $550,000 $436.51 1812 1,260 2 2 12/1/2022 $539,000 $539,000 $427.78 1728 768 1 1 9/28/2022 $345,000 $330,000 $429.69 ACTIVE as of 12/31/2022 Unit Number Square Feet Beds Baths List Date Original List Price List Price List Price per Square Foot 2012 1,260 2 2 11/9/2022 $570,000 $570,000 $452.38 2023 1,260 2 2 11/28/2022 $539,000 $539,000 $427.78 PENDING as of 12/31/2022 Average Sold Price Per Square Foot: $404.81
62 Unit Number Square Feet Original List Price Close Date Sold Price Sold Price/ Original List Price Total Days on Market Sold Price per Square Foot
July - December 2022 AVERAGE
January - June 2022 AVERAGE
CLOSED - 1 BEDROOM July - December 2022 Unit Number Square Feet Original List Price Close Date Sold Price Sold Price/ Original List Price Total Days on Market Sold Price per Square Foot 1709 1,512 $579,000 8/10/2022 $579,000
712 1,260 $524,900 8/29/2022
1834 1,196 $450,000
1,512 $539,000
July - December 2022 AVERAGE
January - June 2022 AVERAGE
CLOSED - 2 BEDROOM July - December 2022
1125 866 $375,000 10/31/2022 $353,500 94.27% 30 $408.20 2026 774 $367,000 9/16/2022 $350,000 95.37% 104 $452.20 1026 774 $336,900 7/26/2022 $342,000 101.51% 6 $441.86 1429 774 $339,900 7/1/2022 $339,900 100.00% 1 $439.15 1622 812 $339,900 11/7/2022 $330,000 97.09% 6 $406.40 1930 866 $339,900 9/23/2022 $329,500 96.94% 32 $380.48 1927 768 $300,000 7/11/2022 $305,000 101.67% 1 $397.14
$335,700 98.12% 26 $417.92
$338,673 99.59% 15 $399.89
100.00% 10 $382.94
$520,000 99.07% 3 $412.70
7/8/2022 $460,000 102.22% 3 $384.62 609
9/1/2022 $525,000 97.40% 37 $347.22
$521,000 99.67% 13 $381.87
$475,340 100.66% 20 $393.09

63 REID HOUSE 1325 & 1327 Peachtree St NE Atlanta, GA 30309 NO PENDINGS as of 12/31/2022 Unit Number Square Feet Original List Price Close Date Sold Price Sold Price/ Original List Price Total Days on Market Sold Price per Square Foot 301 1,610 $749,000 7/22/2022 $720,000 96.13% 11 $447.20 204 1,485 $579,000 9/14/2022 $585,000 101.04% 3 $393.94 C4 1,682 $549,900 9/16/2022 $480,000 87.29% 79 $285.37 July - December 2022 AVERAGE $595,000 94.82% 31 $375.51 January - June 2022 AVERAGE $410,742 96.65% 505 $263.13 CLOSED - 2 BEDROOM July - December 2022 Average Sold Price Per Square Foot: $375.51 Unit Number Square Feet Beds Baths List Date Original List Price List Price List Price per Square Foot 304 1,485 2 2 12/9/2022 $599,000 $599,000 $403.37 ACTIVE as of 12/31/2022

64 SEVENTH MIDTOWN 867 Peachtree St Atlanta, GA 30308 Average Sold Price Per Square Foot: N/A NO CLOSED SALES July - December 2022 NO ACTIVES OR PENDINGS as of 12/31/2022

65 SIENA AT RENAISSANCE 220 & 240 Renaissance Pkwy NE Atlanta, GA 30308 Unit Number Square Feet Original List Price Close Date Sold Price Sold Price/ Original List Price Total Days on Market Sold Price per Square Foot 108 873 $250,000 10/7/2022 $255,900 102.36% 6 $293.13 2103 881 $229,000 8/15/2022 $229,000 100.00% 21 $259.93 July - December 2022 AVERAGE $242,450 101.18% 14 $276.53 January - June 2022 AVERAGE $216,000 102.97% 7 $246.38 CLOSED - 1 BEDROOM July - December 2022 NO ACTIVES OR PENDINGS as of 12/31/2022 Average Sold Price Per Square Foot: $263.13 Unit Number Square Feet Original List Price Close Date Sold Price Sold Price/ Original List Price Total Days on Market Sold Price per Square Foot 1305 1,582 $425,000 8/10/2022 $415,000 97.65% 119 $262.33 315 1,436 $399,900 12/21/2022 $380,000 95.02% 138 $264.62 1107 1,277 $350,000 11/3/2022 $325,000 92.86% 72 $254.50 302 1,269 $310,000 9/9/2022 $310,000 100.00% 8 $244.29 July - December 2022 AVERAGE $357,500 96.38% 84 $256.43 January - June 2022 AVERAGE $376,250 100.83% 27 $274.16 CLOSED - 2 BEDROOM July - December 2022

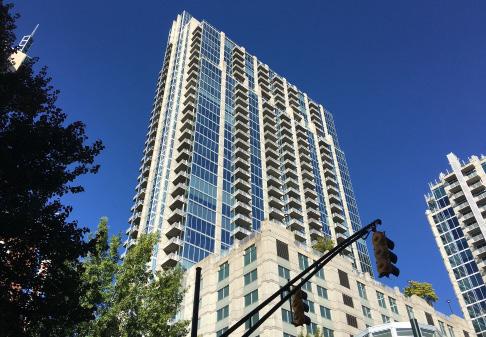
66 SPIRE 860 Peachtree St NE Atlanta, GA 30308 Unit Number Square Feet Beds Baths List Date Original List Price List Price List Price per Square Foot 1301 2,033 3 3 11/21/2022 $900,000 $900,000 $442.70 1610 796 1 1 9/19/2022 $394,900 $375,000 $471.11 ACTIVE as of 12/31/2022 Unit Number Square Feet Beds Baths List Date Original List Price List Price List Price per Square Foot 1917 1,193 2 2 6/9/2022 $512,500 $493,500 $413.66 1513 678 1 1 8/4/2022 $289,900 $282,000 $415.93 PENDING as of 12/31/2022 Average Sold Price Per Square Foot: $445.02
713 1,060 $449,000 10/31/2022 $435,000 96.88% 8 $410.38 707 792 $395,000 8/1/2022 $395,000 100.00% 4 $498.74 1204 877 $389,900 9/9/2022 $384,000 98.49% 6 $437.86 2812 808 $390,000 10/11/2022 $375,000 96.15% 100 $464.11 1507 792 $334,900 7/14/2022 $339,900 101.49% 1 $429.17 2316 606 $335,000 10/11/2022 $333,000 99.40% 10 $549.50 809 761 $329,900 12/16/2022 $320,000 97.00% 25 $420.50 2803 707 $339,000 8/19/2022 $320,000 94.40% 29 $452.62 2606 744 $350,000 7/29/2022 $320,000 91.43% 45 $430.11 1608 738 $320,000 10/31/2022 $310,000 96.88% 18 $420.05 906 744 $320,000 8/9/2022 $307,500 96.09%
67 Unit Number Square Feet Original List Price Close Date Sold Price Sold Price/ Original List Price Total Days on Market Sold Price per Square Foot
July - December 2022 AVERAGE
January - June 2022 AVERAGE $311,302
32
CLOSED - 1 BEDROOM July - December 2022 Unit Number Square Feet Original List Price Close Date Sold Price Sold Price/ Original List Price Total Days on Market Sold Price per Square Foot 2802 2,025 $1,149,000 7/13/2022 $1,100,000 95.74% 356 $543.21 1602 1,356 $549,000 7/18/2022 $545,000 99.27% 16 $401.92 2302 1,356 $539,000 10/14/2022 $539,000 100.00% 79 $397.49 1417 1,193 $549,000 7/5/2022 $529,000
54 $443.42 2014 1,211 $689,900 9/8/2022 $525,000
143 $433.53 1101 1,168 $515,000 8/16/2022 $490,000
73 $419.52 July - December 2022 AVERAGE $621,333 93.77% 120 $439.85 January - June 2022 AVERAGE $499,200 99.22% 34 $386.77 CLOSED - 2 BEDROOM July - December 2022
20 $413.31
$349,036 97.11% 24 $447.85
98.59%
$416.87
96.36%
76.10%
95.15%

68 TUSCANY 955 Juniper St NE Atlanta, GA 30309 Unit Number Square Feet Beds Baths List Date Original List Price List Price List Price per Square Foot 4316 1,027 2 1 10/27/2022 $350,000 $330,000 $321.32 4122 814 1 1 9/20/2022 $310,000 $299,000 $367.32 3222 814 1 1 6/13/2022 $337,500 $299,000 $367.32 2217 693 1 1 11/9/2022 $245,000 $245,000 $353.54 ACTIVE as of 12/31/2022 Unit Number Square Feet Original List Price Close Date Sold Price Sold Price/ Original List Price Total Days on Market Sold Price per Square Foot 2113 874 $325,000 12/27/2022 $325,000 100.00% 5 $371.85 1116 789 $319,000 12/22/2022 $307,000 96.24% 5 $389.10 4132 814 $290,000 9/9/2022 $290,000 100.00% 2 $356.27 2231 814 $299,000 9/28/2022 $285,000 95.32% 34 $350.12 2317 693 $285,000 10/17/2022 $275,000 96.49% 20 $396.83 1313 657 $250,000 11/9/2022 $250,000 100.00% 3 $380.52 July - December 2022 AVERAGE $288,667 98.01% 12 $374.11 January - June 2022 AVERAGE $261,050 100.17% 23 $350.02 CLOSED - 1 BEDROOM July - December 2022 Average Sold Price Per Square Foot: $358.15 NO PENDINGS as of 12/31/2022
69 Unit Number Square Feet Original List Price Close Date Sold Price Sold Price/ Original List Price Total Days on Market Sold Price per Square Foot 2314
$395,000 12/21/2022 $387,500
12
2214
10/11/2022 $380,000
3212
$377,000
July - December 2022 AVERAGE
January - June 2022 AVERAGE
CLOSED - 2 BEDROOM July - December 2022
1,134
98.10%
$341.71
1,196 $384,900
98.73% 4 $317.73
1,181 $364,900 7/1/2022
103.32% 5 $319.22
$381,500 100.05% 7 $326.22
$356,483 101.35% 11 $308.72

70 TWELVE CENTENNIAL PARK 400 W Peachtree St NW Atlanta, GA 30308 Unit Number Square Feet Beds Baths List Date Original List Price List Price List Price per Square Foot 1915 729 1 1 10/15/2022 $290,000 $284,900 $390.81 1008 743 1 1 12/13/2022 $279,900 $279,900 $376.72 PENDING as of 12/31/2022 Average Sold Price Per Square Foot: $385.87 Unit Number Square Feet Beds Baths List Date Original List Price List Price List Price per Square Foot 3802 2,547 4 4 11/15/2022 $875,000 $799,000 $313.70 2004 1,127 2 2 11/7/2022 $459,000 $459,000 $407.28 2406 1,075 2 2 12/5/2022 $443,000 $443,000 $412.09 1511 1,075 2 2 12/28/2022 $440,000 $440,000 $409.30 913 1,127 2 2 9/16/2022 $397,000 $397,000 $352.26 ACTIVE as of 12/31/2022
71 Unit Number Square Feet Original List Price Close Date Sold Price Sold Price/ Original List Price Total Days on Market Sold Price per Square Foot 3614 745 $299,900 7/18/2022 $295,000 98.37% 15 $395.97 2114 743 $289,891 11/10/2022 $285,000 98.31% 23 $383.58 3009 763 $290,000 9/9/2022 $285,000 98.28% 3 $373.53 July - December 2022 AVERAGE $288,333 98.32% 14 $384.36 January - June 2022 AVERAGE $276,115 99.03% 22 $370.13 CLOSED - 1 BEDROOM July - December 2022 Unit Number Square Feet Original List Price Close Date Sold Price Sold Price/ Original List Price Total Days on Market Sold Price per Square Foot 2304 1,127 $445,000 10/26/2022 $440,000 98.88% 75 $390.42 July - December 2022 AVERAGE $440,000 98.88% 75 $390.42 January - June 2022 AVERAGE $429,855 102.46% 18 $378.17 CLOSED - 2 BEDROOM July - December 2022
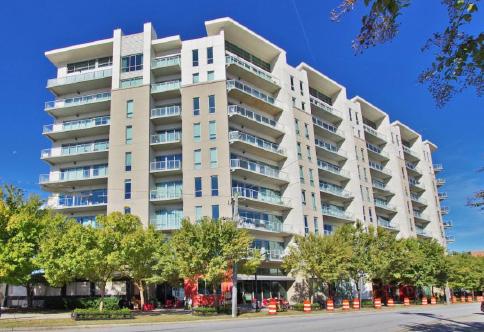
72 VIEWPOINT 855 Peachtree St Atlanta, GA 30308 Unit Number Square Feet Beds Baths List Date Original List Price List Price List Price per Square Foot 3305 986 2 2 12/5/2022 $500,000 $500,000 $507.10 602 1,267 2 2 6/28/2022 $540,000 $495,000 $390.69 1710 861 2 1 11/16/2022 $410,000 $408,000 $473.87 501 885 1 1 8/22/2022 $375,000 $354,900 $401.02 ACTIVE as of 12/31/2022 Unit Number Square Feet Beds Baths List Date Original List Price List Price List Price per Square Foot 1512 748 1 1 6/30/2022 $350,000 $325,000 $434.49 PENDING as of 12/31/2022 Average Sold Price Per Square Foot: $451.78
Price
3211 1,299 $649,900 10/31/2022 $641,900 98.77% 9 $494.15 3009 1,320 $595,000 7/20/2022 $600,000 100.84% 25 $454.55 3003 1,148 $550,000 7/15/2022 $550,000 100.00% 2 $479.09 2503 1,148 $556,000 11/10/2022 $529,900 95.31% 124 $461.59 3403 1,121 $549,900 7/29/2022 $525,000 95.47% 52 $468.33 1907 1,184 $519,988 12/2/2022 $518,000 99.62% 3 $437.50 402 1,173 $510,000 8/30/2022 $505,000 99.02% 24 $430.52 1314 1,000 $499,000 11/18/2022 $491,300 98.46% 64 $491.30 1507 1,184 $535,000 9/12/2022 $478,000 89.35% 63 $403.72 1611 838 $409,900 11/1/2022 $368,000 89.78% 53 $439.14 2010 885 $376,000 9/13/2022 $355,000 94.41% 12 $401.13
73
Number Square Feet Original List Price Close Date Sold Price Sold
Original List Price
on
July - December 2022 AVERAGE
January - June 2022 AVERAGE
CLOSED - 2 BEDROOM July - December 2022 Unit Number Square Feet Original List Price Close Date Sold Price Sold Price/ Original List Price Total Days on Market Sold Price per Square Foot
July - December 2022 AVERAGE
January - June 2022 AVERAGE
CLOSED - 1 BEDROOM July - December 2022
Unit
Price/
Total Days
Market Sold
per Square Foot
$505,645 96.46% 39 $451.00
$525,942 99.04% 49 $464.73
3209 928 $470,000 9/27/2022 $465,000 98.94% 7 $501.08 1701 802 $369,000 7/22/2022 $380,000 102.98% 5 $473.82 1301 802 $369,900 12/23/2022 $345,000 93.27% 57 $430.17 1306 783 $350,000 12/29/2022 $335,000 95.71% 152 $427.84 1412 748 $329,998 12/22/2022 $325,000 98.49% 38 $434.49
$370,000 97.88% 52 $453.48
$332,933 96.70% 44 $422.18

74 VIRGINIA HILL 587 Virginia Ave NE Atlanta, GA 30306 Unit Number Square Feet Original List Price Close Date Sold Price Sold Price/ Original List Price Total Days on Market Sold Price per Square Foot 314 1,250 $309,000 12/1/2022 $325,000 105.18% 102 $260.00 July - December 2022 AVERAGE $325,000 105.18% 102 $260.00 January - June 2022 AVERAGE N/A N/A N/A N/A CLOSED - 2 BEDROOM July - December 2022 NO ACTIVES as of 12/31/2022 Average Sold Price Per Square Foot: $260.00 Unit Number Square Feet Beds Baths List Date Original List Price List Price List Price per Square Foot 802 800 2 2 10/13/2022 $335,000 $310,000 $387.50 PENDING as of 12/31/2022

75 Unit Number Square Feet Original List Price Close Date Sold Price Sold Price/ Original List Price Total Days on Market Sold Price per Square Foot 2703 4,014 $2,350,000 7/1/2022 $2,100,000 89.36% 49 $523.17 July - December 2022 AVERAGE $2,100,000 89.36% 49 $523.17 January - June 2022 AVERAGE N/A N/A N/A N/A CLOSED - 3 BEDROOM July - December 2022 NO PENDINGS as of 12/31/2022 W RESIDENCES 45 Ivan Allen Jr Boulevard NW Atlanta, GA 30308 Average Sold Price Per Square Foot: $523.17 Unit Number Square Feet Beds Baths List Date Original List Price List Price List Price per Square Foot 2704 4,154 3 3 7/27/2022 $2,650,000 $2,650,000 $637.94 2706 3,289 3 3 11/28/2022 $2,250,000 $2,250,000 $684.10 2602 1,823 1 1 9/9/2022 $1,000,000 $950,000 $521.12 2301 1,774 2 2 12/9/2022 $799,999
2403 1,839 2 2 9/23/2022 $659,000
2207 1,587 2 2
$550,000
1908 1,587 2 2
$540,000 $540,000
ACTIVE as of 12/31/2022
$799,999 $450.96
$659,000 $358.35
8/25/2022
$550,000 $346.57
10/6/2022
$340.26

76 WILBURN HOUSE - NEW 273 12th St NE & 250 11th St NE Atlanta, GA 30309 NO ACTIVES OR PENDINGS as of 12/31/2022 Average Sold Price Per Square Foot: $399.48 Unit Number Square Feet Original List Price Close Date Sold Price Sold Price/ Original List Price Total Days on Market Sold Price per Square Foot 416 1,527 $599,900 7/8/2022 $610,000 101.68% 1 $399.48 July - December 2022 AVERAGE $610,000 101.68% 1 $399.48 January - June 2022 AVERAGE $570,000 98.28% 12 $469.14 CLOSED - 2 BEDROOM July - December 2022

77 WILBURN HOUSEHISTORIC 266 11th St NE Atlanta, GA 30309 Average Sold Price Per Square Foot: $516.47 NO PENDINGS as of 12/31/2022 Unit Number Square Feet Original List Price Close Date Sold Price Sold Price/ Original List Price Total Days on Market Sold Price per Square Foot 309 758 $395,000 10/28/2022 $395,000 100.00% 4 $521.11 208 752 $384,900 7/25/2022 $384,900 100.00% 3 $511.84 July - December 2022 AVERAGE $389,950 100.00% 4 $516.47 January - June 2022 AVERAGE N/A N/A N/A N/A CLOSED - 1 BEDROOM July - December 2022 Unit Number Square Feet Beds Baths List Date Original List Price List Price List Price per Square Foot 203 833 1 1 11/10/2022 $380,000 $380,000 $456.18 ACTIVE as of 12/31/2022

78 WINDSOR OVER PEACHTREE 620 Peachtree St NE Atlanta, GA 30308 Unit Number Square Feet Beds Baths List Date Original List Price List Price List Price per Square Foot 411 992 2 1 10/13/2022 $319,999 $299,000 $301.41 701 655 1 1 12/29/2022 $170,000 $170,000 $259.54 ACTIVE as of 12/31/2022 Unit Number Square Feet Beds Baths List Date Original List Price List Price List Price per Square Foot 515 786 1 1 11/9/2022 $199,900 $199,900 $254.33 PENDING as of 12/31/2022 Average Sold Price Per Square Foot: $253.68 Unit Number Square Feet Original List Price Close Date Sold Price Sold Price/ Original List Price Total Days on Market Sold Price per Square Foot 616 655 $179,900 8/12/2022 $160,000 88.94% 16 $244.27 July - December 2022 AVERAGE $160,000 88.94% 16 $244.27 January - June 2022 AVERAGE N/A N/A N/A N/A CLOSED - Studio July - December 2022
79 Unit Number Square Feet Original List Price Close Date Sold Price Sold Price/ Original List Price Total Days on Market Sold Price per Square Foot 413 1,288 $345,000 9/15/2022 $345,000
5
704 1,344 $325,000 7/11/2022 $315,000
17
July - December 2022 AVERAGE $330,000
11
January - June 2022 AVERAGE $267,000
56
CLOSED - 2 BEDROOM July - December 2022 Unit Number Square Feet Original List Price Close Date Sold Price Sold Price/ Original List Price Total Days on Market Sold Price per Square Foot 1610 786 $210,000 9/9/2022 $213,000
13
1107 786 $210,000
$210,000
20
507 786
99
609 786
1114
1207 786
July - December 2022 AVERAGE
27
January - June 2022 AVERAGE
39
CLOSED - 1 BEDROOM July - December 2022
100.00%
$267.86
96.92%
$234.38
98.46%
$251.12
96.67%
$214.56
101.43%
$270.99
7/12/2022
100.00%
$267.18
$224,999 10/21/2022 $203,000 90.22%
$258.27
$199,000 11/18/2022 $200,000 100.50% 4 $254.45
740 $189,000 11/30/2022 $190,000 100.53% 2 $256.76
$180,000 7/19/2022 $180,000 100.00% 25 $229.01
$199,333 98.78%
$256.11
$204,125 102.85%
$265.74
Condo Overview
2021 2022
Building
Art Foundry 347 2005 $0.38 29 $224,003 97.97% 58 23 $245,357 101.94% 14
The Atlantic 401 2009 $0.40 54 $587,669 98.16% 129 49 $767,753 98.44% 54
ATLofts 53 2006 $0.25 7 $306,300 95.87% 126 3 $298,750 92.06% 71
District Lofts 60 2005 $0.32 30 $421,892 99.81% 67 10 $499,730 99.24% 60
Element 322 2007 $0.51 49 $259,596 97.79% 50 48 $275,100 99.59% 24
Twelve Atlantic Station 404 2005 $0.52 34 $276,847 97.60% 71 22 $310,950 96.95% 41
White Provisions 94 2009 $0.50 18 $402,936 95.00% 73 7 $468,843 98.80% 14
82
Station/White Provisions
Atlantic
Total Units Year Built HOA/ Square Foot Total Closings Average Sales Price Avg SP/ OLP Total Days on Market Total Closings Average Sales Price Average SP/OLP Total Days on Market

83 ART FOUNDRY 400 17th St NW Atlanta, GA 30363 NO PENDINGS as of 12/31/2022 Average Sold Price Per Square Foot: $291.87 Unit Number Square Feet Beds Baths List Date Original List Price List Price List Price per Square Foot 2233 1,080 2 1 11/4/2022 $275,000 $269,500 $249.54 2318 750 1 1 11/22/2022 $217,900 $217,900 $290.53 ACTIVE as of 12/31/2022
84 Unit Number Square Feet Original List Price Close Date Sold Price Sold Price/ Original List Price Total Days on Market Sold Price per Square Foot 2219 1,275 $315,000 7/8/2022 $314,200 99.75% 31 $246.43 July - December 2022 AVERAGE $314,200 99.75% 31 $246.43 January - June 2022 AVERAGE $263,000 104.68% 10 $237.35 CLOSED - 2 BEDROOM July - December 2022 Unit Number Square Feet Original List Price Close Date Sold Price Sold Price/ Original List Price Total Days on Market Sold Price per Square Foot 1223 1,450 $350,000 7/29/2022 $350,000 100.00% 32 $241.38 July - December 2022 AVERAGE $350,000 100.00% 32 $241.38 January - June 2022 AVERAGE N/A N/A N/A N/A CLOSED - 3 BEDROOM July - December 2022 Unit Number Square Feet Original List Price Close Date Sold Price Sold Price/ Original List Price Total Days on Market Sold Price per Square Foot 1313 980 $250,000 8/16/2022 $250,000
10 $255.10 1243 750 $229,000 8/24/2022
3
1407 750 $225,000 7/18/2022 $241,000
7
1234 750
750
750
July - December 2022 AVERAGE
January - June 2022 AVERAGE
CLOSED - 1 BEDROOM July - December 2022
100.00%
$241,000 105.24%
$321.33
107.11%
$321.33
$232,000 7/29/2022 $235,000 101.29% 6 $313.33 2105
$230,000 8/5/2022 $230,000 100.00% 5 $306.67 1353 750 $235,000 11/3/2022 $225,000 95.74% 34 $300.00 2335 750 $229,000 7/1/2022 $223,000 97.38% 6 $297.33 2418 750 $220,000 7/1/2022 $220,000 100.00% 9 $293.33 2314 700 $213,000 12/23/2022 $205,000 96.24% 50 $292.86 2220
$220,000 8/19/2022 $235,000 106.82% 4 $313.33
$230,500 100.98% 13 $301.46
$226,500 101.94% 13 $285.62

85 THE ATLANTIC
Unit Number Square Feet Beds Baths List Date Original List Price List Price List Price per Square Foot
ACTIVE as of 12/31/2022
Sold Price Per Square Foot:
Unit Number Square Feet Beds Baths List Date Original List Price List Price List Price per Square Foot 3905
3 3
$874,900 $874,900 $430.35
3 3
PENDING as of 12/31/2022
270 17th St NW Atlanta, GA 30363
4504 2,252 2 2 10/16/2022 $999,999 $999,999 $444.05 3908 2,091 3 3 8/29/2022 $835,000 $899,900 $430.37 3906 2,094 3 3 10/16/2022 $884,900 $884,900 $422.59 3705 1,912 3 3 10/17/2022 $864,900 $864,900 $452.35 3108 2,135 3 3 9/1/2022 $799,900 $749,900 $351.24 2109 1,801 2 2 7/28/2022 $699,900 $699,900 $388.62 1104 1,744 2 2 9/15/2022 $650,000 $625,000 $358.37 602 1,369 2 2 11/18/2022 $574,900 $574,900 $419.94 3106 1,385 1 1 12/29/2022 $499,900 $499,900 $360.94 2106 1,049 1 1 11/1/2022 $399,000 $399,000 $380.36 608 1,132 1 1 9/27/2022 $395,000 $395,000 $348.94
Average
$397.89
2,033
10/17/2022
3308 2,135
9/1/2022 $809,900 $749,900 $351.24
1608 1,132 $475,000 7/19/2022 $441,000 92.84% 32 $389.58 1708 1,132 $409,000 7/25/2022 $400,000 97.80% 53 $353.36
$420,500 95.32% 43 $371.47
$385,000 97.47% 4 $339.81
3803 1,814 $804,900 7/21/2022 $804,900 100.00% 4 $443.72
2807 1,801 $699,900 8/4/2022 $699,900 100.00% 7 $388.62 3101 1,535 $725,000 11/22/2022 $692,000 95.45% 104 $450.81
1403 1,828 $750,000 9/1/2022 $675,000 90.00% 43 $369.26
2110 1,728 $650,000 7/13/2022 $635,000 97.69% 7 $367.48 803 1,828 $645,000 10/25/2022 $630,000 97.67% 11 $344.64 913 1,536 $575,000 8/31/2022 $540,000 93.91% 13 $351.56 July
97.69% 81 $396.25
96.39% 27 $388.01 January
86 Unit Number Square Feet Original List Price Close Date Sold Price Sold Price/ Original List Price Total Days on Market Sold Price per Square Foot
July - December
AVERAGE
- June
AVERAGE
CLOSED - 1 BEDROOM July - December 2022
Number Square Feet Original List Price Close Date Sold Price Sold Price/ Original List Price Total Days on Market Sold Price per Square Foot
2022
January
2022
Unit
CLOSED - 2 BEDROOM July - December 2022
- December 2022 AVERAGE $668,114
- June 2022 AVERAGE $746,500
4002 2,092 $929,900 12/8/2022 $929,900 100.00% 0 $444.50
3902 2,092 $919,900 9/21/2022 $919,900 100.00% 0 $439.72
4106 2,094 $899,900 7/29/2022 $889,900 98.89% 107 $424.98
3907 1,992 $899,900 10/20/2022 $884,000 98.23% 92 $443.78
4008 2,091 $865,500 8/15/2022 $865,500 100.00% 0 $413.92
3806 2,094 $874,900 12/7/2022 $865,000 98.87% 10 $413.09
3706 2,094 $859,900 7/15/2022 $864,900 100.58% 28 $413.04
3404 2,152 $829,900 8/19/2022 $829,900 100.00% 215 $385.64
3408 2,135 $819,900 10/24/2022 $792,900 96.71% 2 $371.38 3208 2,135 $749,000 8/24/2022 $749,000 100.00% 2 $350.82 July - December 2022 AVERAGE
$859,090 99.33% 46 $410.09
January - June 2022 AVERAGE $845,013 99.98% 50 $413.35
87
Number Square Feet Original List Price Close Date Sold Price Sold Price/ Original List Price Total Days on Market Sold Price per Square Foot
Unit
CLOSED - 3 BEDROOM July - December 2022

88 THE LOFTS AT ATLANTIC STATION 231 & 265 18th St NW 232 & 264 19th St NW Atlanta, GA 30363 NO ACTIVES OR PENDINGS as of 12/31/2022 NO CLOSED SALES July - December 2022 Average Sold Price Per Square Foot: N/A

89 DISTRICT LOFTS 260 18th St NW Atlanta, GA 30363 NO ACTIVES as of 12/31/2022 Unit Number Square Feet Beds Baths List Date Original List Price List Price List Price per Square Foot 10226 2,088 3 3 10/25/2022 $674,900 $664,900 $318.44 PENDING as of 12/31/2022 Average Sold Price Per Square Foot: $350.39 Unit Number Square Feet Original List Price Close Date Sold Price Sold Price/ Original List Price Total Days on Market Sold Price per Square Foot 10215 1,270 $460,000 9/2/2022 $445,000 96.74% 75 $350.39 July - December 2022 AVERAGE $445,000 96.74% 75 $350.39 January - June 2022 AVERAGE $440,383 99.28% 11 $313.33 CLOSED - 2 BEDROOM July - December 2022

90 ELEMENT
Unit Number Square Feet Beds Baths List Date Original List Price List Price List Price per Square Foot
2 2
ACTIVE as of 12/31/2022 Unit Number Square Feet Beds Baths List Date Original List Price List Price List Price per Square Foot 2066 1,263 2 2 6/22/2022 $375,000 $325,000 $257.32 6019 1,166 2 2 7/18/2022 $385,000 $309,900 $265.78 PENDING as of 12/31/2022 Average Sold Price Per Square Foot: $278.88
390 17th St NW Atlanta, GA 30363
6007 1,232
10/25/2022 $345,000 $329,000 $267.05 2011 1,166 2 2 3/24/2022 $325,000 $325,000 $278.73 3036 1,166 2 2 8/29/2022 $324,990 $322,990 $277.01 4019 1,166 2 2 6/9/2022 $343,000 $310,000 $265.87 6060 990 2 1 12/19/2022 $269,900 $269,900 $272.63
5019 1,166 $355,000 8/15/2022 $340,000 95.77% 26 $291.60 2035 1,166 $325,000 11/21/2022 $325,000 100.00% 12 $278.73 3042 1,117 $324,900 9/23/2022 $325,000 100.03% 11 $290.96 3061 1,117 $319,900 7/22/2022 $319,900 100.00% 9 $286.39 6042 1,117 $299,900 8/9/2022 $310,000 103.37% 0 $277.53 4050 1,166 $300,000 9/14/2022 $300,000 100.00% 2 $257.29 2013 1,166 $310,000 9/9/2022 $300,000 96.77% 73 $257.29 2048 1,117 $315,000 7/5/2022 $300,000 95.24% 47 $268.58
91 Unit Number Square Feet Original List Price Close Date Sold Price Sold Price/ Original List Price Total Days on Market Sold Price per Square Foot
July - December 2022 AVERAGE
January - June 2022 AVERAGE
CLOSED - 2 BEDROOM July - December 2022 Unit Number Square Feet Original List Price Close Date Sold Price Sold Price/ Original List Price Total Days on Market Sold Price per Square Foot
4016 770
July - December 2022 AVERAGE $235,000
22
January - June 2022 AVERAGE $225,920
11
CLOSED - 1 BEDROOM July - December 2022 Unit Number Square Feet Original List Price Close Date Sold Price Sold Price/ Original List Price Total Days on Market Sold Price per Square Foot 5039 1,423 $350,000 10/25/2022 $350,000 100.00% 11 $245.96 July - December 2022 AVERAGE $350,000 100.00% 11 $245.96 January - June 2022 AVERAGE N/A N/A N/A N/A CLOSED - 3 BEDROOM July - December 2022
$314,988 98.90% 23 $276.05
$307,056 98.89% 37 $261.21
4045 770 $230,000 9/16/2022 $250,000 108.70% 7 $324.68 5004 832 $265,000 7/1/2022 $250,000 94.34% 7 $300.48 4052 915 $245,000 7/17/2022 $245,000 100.00% 8 $267.76 4031 770 $230,000 7/25/2022 $240,000 104.35% 3 $311.69 4002 832 $230,000 12/29/2022 $225,000 97.83% 57 $270.43 2041 868 $259,000 12/9/2022 $220,000 84.94% 63 $253.46
$230,000 8/12/2022 $215,000 93.48% 8 $279.22
97.66%
$286.82
101.83%
$284.61

92 TWELVE ATLANTIC STATION
Unit Number Square Feet Beds Baths List Date Original List Price List Price List Price per Square Foot 1524 1,067 2 2
$419,900
1201
2 2
2122
2 2
2013
1 1
2420
1 1
1019 830 1 1
$299,000
ACTIVE as of 12/31/2022 NO PENDINGS as of 12/31/2022 Average Sold Price Per Square Foot: $363.22 Unit Number Square Feet Original List Price Close Date Sold Price Sold Price/ Original List Price Total Days on Market Sold Price per Square Foot 2206 811 $305,000 9/15/2022 $295,000 96.72% 12 $363.75 2106 811 $309,900 7/22/2022 $295,000 95.19% 35 $363.75 2406 811 $299,000 10/26/2022 $288,000 96.32% 138 $355.12 805 695 $269,000 7/22/2022 $242,500 90.15% 27 $348.92 July - December 2022 AVERAGE $280,125 94.60% 53 $357.88 January - June 2022 AVERAGE $274,185 98.77% 36 $345.83 CLOSED - 1 BEDROOM July - December 2022
361 17th St NW Atlanta, GA 30363
12/26/2022
$419,900 $393.53
1,067
12/13/2022 $435,000 $415,000 $388.94
1045
9/15/2022 $425,000 $415,000 $397.13
832
9/28/2022 $299,900 $294,900 $354.45
796
10/2/2022 $290,000 $285,000 $358.04
11/29/2022
$284,000 $342.17
2003 1,743 $548,000 8/10/2022 $520,000 94.89% 25 $298.34
2424 1,067 $449,000 7/25/2022 $418,500 93.21% 63 $392.22 1601 1,067 $450,000 12/14/2022 $415,000 92.22% 31 $388.94 1622 1,045 $425,000 11/22/2022 $412,500 97.06% 36 $394.74 July - December 2022
93 Unit Number Square Feet Original List Price Close Date Sold Price Sold Price/ Original List Price Total Days on Market Sold Price per Square Foot
CLOSED - 2 BEDROOM July - December 2022
AVERAGE $441,500 94.34% 39 $368.56 January - June 2022 AVERAGE $390,000 93.08% 77 $365.51
94 WHITE PROVISIONS 1100 Howell Mill Rd NW Atlanta, GA 30318 NO PENDINGS as of 12/31/2022 Average Sold Price Per Square Foot: $353.76 Unit Number Square Feet Beds Baths List Date Original List Price List Price List Price per Square Foot 910 2,498 3 3 10/3/2022 $1,115,000 $975,000 $390.31 ACTIVE as of 12/31/2022 Unit Number Square Feet Original List Price Close Date Sold Price Sold Price/ Original List Price Total Days on Market Sold Price per Square Foot 401 1,661 $625,000 9/8/2022 $615,000 98.40% 11 $370.26 609 1,390 $499,000 10/4/2022 $487,500 97.70% 6 $350.72 413 1,218 $440,000 11/30/2022 $432,500 98.30% 12 $355.09 508 1,245 $450,000 9/8/2022 $422,000 93.78% 36 $338.96 July - December 2022 AVERAGE $489,250 97.04% 16 $353.76 January - June 2022 AVERAGE $441,633 101.14% 11 $371.35 CLOSED - 2 BEDROOM July - December 2022
Data and most photos are from the First Multiple Listing Service. Information is deemed to be accurate but is not warranted. Please note that in many “new construction” condominium projects or buildings being converted to condominiums, not all sales are reported in FMLS. We are only reporting sales included in FMLS. This research is on 57 buildings in and around Midtown, but is not exhaustive.
If you are interested in receiving more information on additional properties or need help pricing your home, please contact your Atlanta Intown Agent, call 404.881.1810 or email brokers@atlantaintown.com .


95


/AtlantaIntownRE @AtlantaIntownRE @AtlantaIntown @AtlantaIntown RealEstateServices ©2022 Atlanta Intown Real Estate Services. All rights reserved. Atlanta Intown Real Estate Services is an Equal Opportunity Employer and support the Fair Housing Act. All information and photography was procured through FMLS® Information is deemed to be accurate but is not warranted. MAIN OFFICE: 181 10th St NE | Atlanta GA 30309 | 404.881.1810 atlantaintown.com KIRKWOOD OFFICE: 1963 Hosea Williams Dr SE | Atlanta GA 30317 | 404.370.3101